| (Mark One) | ||||||||
| ý | ANNUAL REPORT PURSUANT TO SECTION 13 OR 15(d) OF THE SECURITIES EXCHANGE ACT OF 1934 | |||||||
| For the fiscal year ended September 30, | ||||||||
| or | ||||||||
| o | TRANSITION REPORT PURSUANT TO SECTION 13 OR 15(d) OF THE SECURITIES EXCHANGE ACT OF 1934 | |||||||
| For the transition period from to | ||||||||
Commission file number: 814-00794
GOLUB CAPITAL BDC, INC.
(Exact Name of Registrant as Specified in its Charter)
| Delaware | 27-2326940 | |||||||
(State or Other Jurisdiction of Incorporation or Organization) | (I.R.S. Employer Identification No.) | |||||||
| (Address of Principal Executive Offices) | (Zip Code) | |||||||
(212) 750-6060
(Registrant’s Telephone Number, Including Area Code)
Securities registered pursuant to Section 12(b) of the Act:
| Title of | Trading Symbol | Name of | ||||||
| Common Stock, par value $0.001 per share | GBDC | The | ||||||
Securities registered pursuant to Section 12(g) of the Act: None
Indicate by check mark if the registrant is a well-known seasoned issuer, as defined in Rule 405 of the Securities Act. Yes o No ý
Indicate by check mark if the registrant is not required to file reports pursuant to Section 13 or 15(d) of the Act. Yes o No ý
Indicate by check mark whether the registrant: (1) has filed all reports required to be filed by Section 13 or 15(d) of the Securities Exchange Act of 1934 during the preceding 12 months (or for such shorter period that the registrant was required to file such reports), and (2) has been subject to such filing requirements for the past 90 days.
Yes ý No o
Indicate by check mark whether the registrant has submitted electronically every Interactive Data File required to be submitted pursuant to Rule 405 of Regulation S-T (§232.405 of this chapter) during the preceding 12 months (or for such shorter period that the registrant was required to submit such files).
Yes o No ý
Indicate by check mark whether the registrant is a large accelerated filer, an accelerated filer, a non-accelerated filer or a smaller reporting company. See definitions of “large accelerated filer”, “accelerated filer” and “smaller reporting company” in Rule 12b-2 of
1
the Exchange Act. (Check one):
Large accelerated filer þ | Accelerated filer o | ||||
Non-accelerated filer o | Smaller reporting company o | ||||
Emerging growth company o | |||||
If an emerging growth company, indicate by check mark if the registrant has elected not to use the extended transition period for complying with any new or revised financial accounting standards provided pursuant to Section 13(a) of the Exchange Act. o
Indicate by check mark whether the registrant has filed a report on and attestation to its management's assessment of the effectiveness of its internal control over financial reporting under Section 404(b) of the Sarbanes-Oxley Act (15 U.S.C. 7262(b)) by the registered public accounting firm that prepared or issued its audit report. Yes þ No o
Indicate by check mark whether the registrant is a shell company (as defined in Rule 12b-2 of the Securities Exchange Act of 1934).Yes o No ý
The aggregate market value of common stock held by non-affiliates of the registrant on March 31, 2018 based on the closing price on that date of $17.89 on the Nasdaq Global Select Market2021 was approximately $1,071.0$2,290.9 million. For the purposes of calculating this amount only, all directors and executive officers of the registrant have been treated as affiliates. There were 60,165,454170,028,584 shares of the registrant’s common stock outstanding as of November 28, 2018.29, 2021.
DOCUMENTS INCORPORATED BY REFERENCE
Portions of the registrant’s proxy statement to be filed with the Securities and Exchange Commission pursuant to Regulation 14A in connection with the registrant’s 20192022 Annual Meeting of Stockholders, which will be filed subsequent to the date hereof, are incorporated by reference into Part III of this Form 10-K. Such proxy statement will be filed with the Securities and Exchange Commission not later than 120 days following the end of the registrant’s fiscal year ended September 30, 2018.2021.
2
| Part I. | ||||||||
| Part II. | ||||||||
| Reserved | ||||||||
| Part III. | ||||||||
| Part IV. | ||||||||
3
PART I
In this annual report on Form 10-K, except as otherwise indicated, the terms:
•“we,” “us,” “our” and “Golub Capital BDC” refer to Golub Capital BDC, Inc., a Delaware corporation, and its consolidated subsidiaries;
•“Holdings” refers to Golub Capital BDC 2010-1 Holdings LLC, a Delaware limited liability company, or LLC, our direct subsidiary;
•“2010 Issuer”GCIC Holdings” refers to Golub Capital BDC 2010-1GCIC Holdings LLC, a Delaware LLC, our indirectdirect subsidiary;
•“2014 Issuer” refers to Golub Capital BDC CLO 2014 LLC, a Delaware LLC, our direct subsidiary;
•“GCIC 2018 Issuer" refers to GCIC CLO II LLC, a Delaware LLC, our indirect subsidiary;
•“2020 Issuer” refers to Golub Capital BDC CLO 4 LLC, a Delaware LLC, our indirect subsidiary;
•“2018 CLO Depositor” refers to Golub Capital BDC CLO III Depositor LLC, a Delaware LLC, our direct subsidiary.subsidiary;
•“GCIC CLO Depositor” refers to GCIC CLO II Depositor LLC, a Delaware LLC, our direct subsidiary;
•“2020 CLO Depositor” refers to Golub Capital BDC CLO 4 Depositor LLC, a Delaware LLC, our direct subsidiary;
•“Controlling Class” refers to the most senior class of notes then outstanding of the 2014 Issuer, 2018 Issuer, GCIC 2018 Issuer or the 20182020 Issuer, as applicable;
•“GCIC Funding” refers to GCIC Funding LLC, a Delaware LLC, our direct subsidiary;
•“GCIC Funding II” refers to GCIC Funding II LLC, a Delaware LLC, our direct subsidiary;
•“Funding Subsidiaries” refers, collectively, to Funding II, prior to its termination on February 12, 2021, GCIC Funding, prior to its termination on October 9, 2020, GCIC Funding II, and each, a “Funding Subsidiary”;
•“Merger Sub” refers to Fifth Ave Subsidiary Inc., our wholly owned subsidiary;
•“2024 Notes” refers to the $350.0$400.0 million term debt securitization that we completed on July 16, 2010, amendedin aggregate principal amount of unsecured notes issued by Golub Capital BDC on October 20, 2016 and redeemed on July 20, 2018, in which the 2010 Issuer issued an aggregate of $350.0 million of notes, or the “20102, 2020. The 2024 Notes” including $205.0 million of Class A-Refi 2010 Notes, which bore bear interest at a rate of three-month London Interbank Offered Rate, or LIBOR, plus 1.90%, $10.03.375% per year payable semiannually in arrears on April 15 and October 15 of each year. The 2024 Notes mature on April 15, 2024. On October 15, 2021, Golub Capital BDC issued an additional $100.0 million in aggregate principal amount of Class B-Refi 2010unsecured notes, which have the same terms as the original issuance;
•“2026 Notes” refers to the $400.0 million in aggregate principal amount of unsecured notes issued by Golub Capital BDC on February 24, 2021. The 2026 Notes which borebear interest at a rate of three-month LIBOR plus 2.40%2.500% per year payable semiannually in arrears on February 24 and $135.0August 24 of each year. The 2026 Notes mature on August 24, 2026. On October 13, 2021, Golub Capital BDC issued an additional $200.0 million facein aggregate principal amount of Subordinated 2010unsecured notes, which have the same terms as the original issuance;
•“2027 Notes” refers to the $350.0 million in aggregate principal amount of unsecured notes issued by Golub Capital BDC on August 3, 2021. The 2027 Notes bear interest at a rate of 2.050% per year payable semiannually in arrears on February 15 and August 15 of each year. The 2027 Notes mature on February 15, 2027;
•“Unsecured Notes” refers, collectively, to the 2024 Notes, 2026 Notes and 2027 Notes;
•“GCIC” refers to Golub Capital Investment Corporation, a Maryland corporation that did not bear interest;we acquired on September 16, 2019 pursuant to an agreement and plan of merger by and among us, GCIC, GC Advisors, and for certain limited purposes our Administrator, or, as amended, the Merger Agreement; prior to such acquisition, which we refer to as the Merger, GCIC was an externally managed, closed-end, non-diversified management investment company that elected to be regulated as a business development
1
company under the Investment Company Act of 1940, as amended, or the 1940 Act, and whose investment adviser was GC Advisors;
•“2014 Debt Securitization” refers to the $402.6 million term debt securitization that we completed on June 5, 2014, as most recently amended on March 23, 2018 and redeemed on August 26, 2020, in which the 2014 Issuer issued an aggregate of $402.6 million of notes, or the “2014 Notes,” including $191.0 million of Class A-1-R 2014 Notes, which bearbore interest at a rate of three-month LIBOR, plus 0.95%, $20.0 million of Class A-2-R 2014 Notes, which bearbore interest at a rate of three-month LIBOR plus 0.95%, $35.0 million of Class B-R 2014 Notes, which bearbore interest at a rate of three-month LIBOR plus 1.40%, $37.5 million of Class C-R 2014 Notes, which bearbore interest at a rate of three-month LIBOR plus 1.55%, and $119.1 million of membership interests that dodid not bear interest;
•“Funding” refers to Golub Capital BDC Funding, LLC, a Delaware LLC, our direct subsidiary;
•“Debt Securitizations” refers collectively to the Credit Facility2014 Debt Securitization, the 2018 Debt Securitization, the GCIC 2018 Debt Securitization and the MS Credit Facility,2020 Debt Securitization and each, a "Revolving Credit Facility";“Debt Securitization;”
•“SLF” refers to Senior Loan Fund LLC, a Delaware LLC, which became our direct subsidiary as of January 1, 2020. Prior to January 1, 2020, SLF was an unconsolidated Delaware LLC,subsidiary, in which we co-invest co-invested
2
with RGA Reinsurance Company, or RGA, primarily in senior secured loans. SLF iswas capitalized as transactions arewere completed and all portfolio and investment decisions in respect of SLF must bewere approved by representatives of each of the members (with unanimous approval required from either (i) one representative of each of us and RGA or (ii) both representatives of each of us and RGA). As of September 30, 2018,Prior to January 1, 2020, we owned 87.5% of the LLC equity interests of SLF. AsSLF;
•“GCIC SLF” refers to GCIC Senior Loan Fund LLC, a Delaware LLC, which became our direct subsidiary as of January 1, 2020. Prior to January 1, 2020, GCIC SLF was an unconsolidated subsidiary, that we acquired as part of the Merger, in which we co-invested with Aurora National Life Assurance Company, a wholly owned subsidiary of RGA, or Aurora, primarily in senior secured loans of middle-market companies. GCIC SLF was capitalized as transactions were completed and all portfolio and investment decisions in respect of GCIC SLF were approved by the GCIC SLF investment committee, which consisted of two representatives of each of the members (with unanimous approval required from either (i) one representative of each of us and Aurora or (ii) both representatives of each of us and Aurora). Prior to January 1, 2020, we owned 87.5% of the LLC equity interests of GCIC SLF;
•“Senior Loan Funds” refers collectively to SLF and GCIC SLF, and each a "Senior Loan Fund";
•“WF Credit Facility” refers to the senior secured revolving credit facility that GCIC Funding originally entered into on October 10, 2014 and terminated on February 12, 2021, with Wells Fargo Securities, LLC as administrative agent, and Wells Fargo Bank, N.A., as lender, that, as of the date of its termination, allowed for borrowing up to $300.0 million, bore interest at a rate of one-month LIBOR plus 2.00% per annum and would have matured on March 21, 2024;
•“DB Credit Facility” refers to the senior secured revolving credit facility that GCIC Funding II entered into on December 31, 2018 and terminated on October 9, 2020, with GCIC, as equityholder and as servicer, Deutsche Bank AG, New York Branch, as facility agent, the other agents parties thereto, each of the entities from time to time party thereto as securitization subsidiaries and Wells Fargo Bank, National Association, as collateral agent and as collateral custodian, that as of the date of its termination, allowed for borrowing up to $250.0 million and bore interest at a rate of the applicable base rate plus 1.90% per annum through the reinvestment period, which would have continued through December 31, 2021. The base rate under the DB Credit Facility was (i) the three-month Canadian Dollar Offered Rate with respect to any advances denominated in Canadian dollars, (ii) the three-month EURIBOR with respect to any advances denominated in euros, (iii) the three-month Bank Bill Swap Rate with respect to any advances denominated in Australian dollars and (iv) the three-month LIBOR with respect to any other advances. The DB Credit Facility would have matured on December 31, 2024;
•“JPM Credit Facility” refers to the senior secured revolving credit facility that we entered into on February 11, 2021 with JPMorgan Chase Bank, N.A. as administrative agent and collateral agent, and the bank participants acting as lenders that allows for borrowing in an initial aggregate amount of up to $475.0 million as of September 30, 2021 in U.S. dollars and certain agreed upon foreign currencies. The interest rate on the borrowings under the facility ranges from one-month LIBOR plus 1.75% to one-month LIBOR plus 1.875%, through the maturity date of February 11, 2026;
•“MS Credit Facility II” refers to our senior secured revolving credit facility that Golub Capital BDC Funding II, LLC, a Delaware LLC and our direct subsidiary, entered into on February 1, 2019, with Morgan Stanley Senior Funding, Inc., as the administrative agent, each of the lenders from time to time party thereto, each of the securitization subsidiaries from time to time party thereto, and Wells Fargo Bank, N.A., as collateral agent, account bank and collateral custodian, as most recently amended on July 30, 2021, that allowed for borrowing up to $75.0 million as of September 30, 2021 and bears interest at the applicable base rate plus 2.45% per annum through the revolving period, which ends April 21, 2024, and bears interest at the applicable base rate plus 2.95% following the revolving period through the stated maturity date of April 12, 2026;
•“Revolving Credit Facilities” refers collectively to, prior to its termination on February 12, 2021, the WF Credit Facility; prior to its termination on October 9, 2020, the DB Credit Facility; the JPM Credit Facility and the MS Credit Facility II, and each a “Revolving Credit Facility”;
•“Initial Merger” refers to the merger, on September 16, 2019, of Merger Sub with and into GCIC, with GCIC as the surviving company;
3
•“Subsequent Merger” refers to the merger that occurred immediately after the Initial Merger on September 16, 2019 of GCIC, as the surviving company of the Initial Merger, with and into, with Golub Capital BDC, Inc., as the surviving company;
•“Merger” refers to the Initial Merger, together with, unless the context otherwise requires, the Subsequent Merger;
•“Merger Agreement” refers to the Agreement and Plan of Merger, dated November 27, 2018, SLF had LLC equity interest subscriptions from its members totaling $200.0by and among us, Merger Sub, GCIC, GC Advisors, and, for certain limited purposes, the Administrator, as amended by the First Amendment to the Agreement and Plan of Merger, dated December 21, 2018, by and among us, Merger Sub, GCIC, GC Advisors, and the Administrator and the Second Amendment to the Agreement and Plan of Merger, dated July 11, 2019, by and among us, Merger Sub, GCIC, GC Advisors, and the Administrator;
•“Adviser Revolver” refers to the line of credit with GC Advisors, which was most recently amended on October 28, 2019, and which allowed for borrowing up to $100.0 million as of which we have committedSeptember 30, 2021;
•“SBIC Funds” refers collectively to fund $175.0 million;our consolidated subsidiaries, GC SBIC IV, L.P.,GC SBIC V, L.P. and GC SBIC VI, L.P.;
•“GC Advisors” refers to GC Advisors LLC, a Delaware LLC, our investment adviser;
•“Administrator” refers to Golub Capital LLC, a Delaware LLC, an affiliate of GC Advisors and our administrator;
•“Investment Advisory Agreement” refers to the Third Amended and Restated Investment Advisory Agreement by and between us and GC Advisors, dated as of September 16, 2019;
•“Prior Investment Advisory Agreement” refers to the Second Amended and Restated Investment Advisory Agreement by and between us and GC Advisors, dated as of August 4, 2014; and
•“Golub Capital” refers, collectively, to the activities and operations of Golub Capital LLC (formerly Golub Capital Management LLC), which entity employs all of Golub Capital’s investment professionals, GC Advisors and associated investment funds and their respective affiliates.
4
Item 1. Business
GENERAL
We are an externally managed, closed-end, non-diversified management investment company that has elected to be regulated as a business development company under the Investment Company Act of 1940, as amended, or the 1940 Act. In addition, for U.S. federal income tax purposes, we have elected to be treated as a regulated investment company, or RIC, under Subchapter M of the Internal Revenue Code of 1986, as amended, or the Code. We were formed in November 2009 to continue and expand the business of our predecessor, Golub Capital Master Funding LLC, which commenced operations in July 2007. We make investments primarily in one stop (a loan that combines characteristics of traditional first lien senior secured loans and second lien or subordinated loans and that are often referred to by other middle market lenders as unitranche loans) and other senior secured loans of U.S. middle-market companies that are, in most cases, sponsored by private equity firms. GC Advisors structures ourthese one stop loans as senior secured loans, and we obtain security interests in the assets of the portfolio company that serve as collateral in support of the repayment of these loans. This collateral may takeoften takes the form of first-priority liens on the assets of the portfolio company. In many cases, we are the sole lender or we, together with our affiliates, are the sole lenders of one stop loans, which can afford us additional influence over the borrower in terms of monitoring and, if necessary, remediation in the event ofremediating any underperformance.
In this annual report on Form 10-K, the term “middle-market” generally refers to companies having earnings before interest, taxes, depreciation and amortization, or EBITDA, of less than $100.0 million annually.
Our investment objective is to generate current income and capital appreciation by investing primarily in senior secured and one stop and other senior secured loans of U.S. middle-market companies. We may also selectively invest in second lien and subordinated (a loan that ranks senior only to a borrower's equity securities and ranks junior to all of such borrower's other indebtedness in priority of payment) loans of, and warrants and minority equity securities in, U.S. middle-market companies. We intend to achieve our investment objective by (1) accessing the established loan origination channels developed by Golub Capital, a leading lender to middle-market companies withthat had over $25.0$40.0 billion inof capital under management as of September 30, 2018,2021, (2) selecting investments within our core middle-market company focus, (3) partnering with experienced private equity firms, or sponsors, in many cases with whom Golub Capital has invested alongside in the past, (4) implementing the disciplined underwriting standards of Golub Capital and (5) drawing upon the aggregate experience and resources of Golub Capital.
We seek to create a portfolio that includes primarily senior secured and one stop and other senior secured loans by primarily investing approximately $5.0$10.0 million to $30.0$75.0 million of capital, on average, in the securities of U.S. middle-market companies. We may alsoexpect to selectively invest more than $30.0$75.0 million in some of our portfolio companies and generally expect that the size of our individual investments will vary proportionately with the size of our capital base.
We generally invest in securities that have been rated below investment grade by independent rating agencies or that would be rated below investment grade if they were rated. These securities, which may beare often referred to as “junk,” have predominantly speculative characteristics with respect to the issuer’s capacity to pay interest and repay principal. In addition, many of our debt investments have floating interest rates that reset on a periodic basis and typically do not fully pay down principal prior to maturity, which maycould increase our risk of losing part or all of our investment.
GCIC Acquisition
On September 16, 2019, we completed our acquisition of GCIC, pursuant to the Merger Agreement. As a result of, and as of the effective time of, the Merger, GCIC’s separate existence ceased.
In accordance with the terms of the Merger Agreement, at the effective time of the Merger, each outstanding share of GCIC’s common stock was converted into the right to receive 0.865 shares of our common stock (with GCIC’s stockholders receiving cash in lieu of fractional shares of our common stock). As a result of the Merger, we issued an aggregate of 71,779,964 shares of our common stock to former stockholders of GCIC. Upon the consummation of the Merger, we entered into the Investment Advisory Agreement, with GC Advisors, which replaced the Prior Investment Advisory Agreement.
Rights Offering
On May 15, 2020, we completed a transferable rights offering and issued a total of 33,451,902 shares of our
5
common stock. We issued to stockholders of record on April 8, 2020 one transferable right for each four shares of our common stock held on the record date. Each holder of rights was entitled to subscribe for one share of common stock for every right held at a subscription price of $9.17 per share. Net proceeds after deducting the dealer manager fees and other offering expenses were approximately $300.4 million. 3,191,448 shares of common stock were purchased in the rights offering by affiliates of GC Advisors.
Information Available
Our address is 666 Fifth200 Park Avenue, 18th25th Floor, New York, NY 10103.10166. Our phone number is (212) 750-6060, and our internet address is www.golubcapitalbdc.com. We make available, free of charge, on our website our proxy statement, annual report on Form 10-K, quarterly reports on Form 10-Q, current reports on Form 8-K and amendments to those reports as soon as reasonably practicable after we electronically file such material with, or furnish it to, the U.S. Securities and Exchange Commission, or SEC. Information contained on our website is not incorporated by reference into this annual report on Form 10-K and you should not consider information contained on our website to be part of this annual report on Form 10-K or any other report we file with the SEC.
The SEC also maintains a website that contains reports, proxy and information statements and other information we file with the SEC at www.sec.gov. Copies of these reports, proxy and information statements and other information may also be obtained, after paying a duplicating fee, by electronic request at publicinfo@sec.gov, or by writing the SEC’s Public Reference Section, 100 F Street, N.E., Washington, D.C. 20549-0102. You may also read and copy such reports, proxy and information statements at the SEC’s Public Reference Room. Information on the operation of the Public Reference Room may be obtained by calling the SEC at 1-202-551-8090.publicinfo@sec.gov.
Our Adviser
Our investment activities are managed by our investment adviser, GC Advisors. GC Advisors is responsible for sourcing potential investments, conducting research and due diligence on prospective investments and equity sponsors, analyzing investment opportunities, structuring our investments and monitoring our investments and portfolio companies on an ongoing basis. GC Advisors was organized in September 2008 and is a registered investment adviser under the Investment Advisers Act of 1940, as amended, or the Advisers Act. Under our amended and restated investment advisory agreement, or the Investment Advisory Agreement, with GC Advisors, we pay GC Advisors a base management fee and an incentive fee for its services. See “Business — Management Agreements — Management Fee” for a discussion of the base management fee and incentive fee, including the cumulative income incentive fee and the income and capital gains incentive fee, payable by us to GC Advisors. Unlike most closed-end funds whose fees are based on assets net of leverage, our base management fee is based on our average-adjusted gross assets (including leverage but adjusted to exclude cash and cash equivalents so that investors do not pay the base management fee on such assets) and, therefore, GC Advisors benefits when we incur debt or use leverage. For purposes of the Investment Advisory Agreement, cash equivalents means U.S. government securities and commercial paper instruments maturing within 270 days of purchase. Additionally, under the incentive fee structure, GC Advisors benefits when capital gains are recognized and, because it determines when a holding is sold, GC Advisors controls the timing of the recognition of capital gains. Our board of directors is charged with protecting our interests by monitoring how GC Advisors addresses these and other conflicts of interest associated with its management services and compensation. While not expected to review or approve each borrowing, our independent directors periodically review GC Advisors’ services and fees as well as its portfolio management decisions and portfolio performance. In connection with these reviews, our independent directors consider whether our fees and expenses (including those related to leverage) remain appropriate. See “Business — Management Agreements — Board Approval of the Investment Advisory Agreement.”
GC Advisors is an affiliate of Golub Capital and pursuant to a staffing agreement, or the Staffing Agreement, Golub Capital LLC makes experienced investment professionals available to GC Advisors and provides access to the senior investment personnel of Golub Capital LLC and its affiliates. The Staffing Agreement provides GC Advisors with access to investment opportunities, which we refer to in the aggregate as deal flow generated by Golub Capital LLC and its affiliates in the ordinary course of their businesses and commits the members of GC Advisors’ investment committee to serve in that capacity. As our investment adviser, GC Advisors is obligated to allocate investment opportunities among us and its other clients fairly and equitably over time in accordance with its allocation policy. See “Management’s Discussion and Analysis of Financial Condition and Results of Operations — Related Party Transactions.” However, there can be no assurance that such opportunities will be allocated to us fairly or equitably in the short-term or over time. GC Advisors seeks to capitalize on the significant deal origination, credit underwriting, due diligence, investment structuring, execution, portfolio management and monitoring experience of Golub Capital LLC’s investment professionals.
6
Golub Capital LLC, our Administrator and an affiliate of GC Advisors, the Administrator, provides the administrative services necessary for us to operate. See “Business — Management Agreements — Administration Agreement” for a discussion of the fees and expenses (subject to the review and approval of our independent directors) we are required to reimburse to the Administrator.
About Golub Capital
Golub Capital, founded in 1994, is a leading lender to middle-market companies, with a long track record of investing in senior secured, one stop, second lien and subordinated loans. As of September 30, 2018,2021, Golub Capital had over $25.0$40.0 billion of capital under management. Since its inception, Golub Capital has closed deals with over 250340 middle-market sponsors and repeat transactions with over 160230 sponsors.
Golub Capital’s middle-market lending group is managed by a four-memberan eight-member senior management team consisting of Lawrence E. Golub, David B. Golub, Andrew H. Steuerman, and Gregory W. Cashman.Cashman, Spyro G. Alexopoulos, Marc C. Robinson, Robert G. Tuchscherer and Jason J. Van Dussen. As of September 30, 2018,2021, Golub Capital’sCapital had more than 100150 investment professionals had an average of over 12 years of investment experience and were supported by more than 250440 administrative and back office personnel that focus on operations, finance, legal and compliance, accounting and reporting, marketing, information technology and office management.
Market Trends
We have identified the following trends that may affect our business:
Target Market. We believe that small and middle market companies in the United States with annual revenues between $10 million and $2.5 billion represent a significant growth segment of the U.S. economy and often require substantial capital investments to grow. Middle market companies have generated a significant number of investment opportunities for investment funds managed or advised by Golub Capital, and we believe that this market segment will continue to produce significant investment opportunities for us. We continue to focus our portfolio on borrowers in what we believe are recession resistant industries that are insulated from the effects of COVID-19.
Specialized Lending Requirements. We believe that several factors render many U.S. financial institutions ill-suited to lend to U.S. middle market companies. For example, based on the experience of our management team, lending to U.S. middle market companies (1) is generally more labor intensive than lending to larger companies due to the smaller size of each investment and the fragmented nature of information for such companies, (2) requires due diligence and underwriting practices consistent with the demands and economic limitations of the middle market and (3) also requires more extensive ongoing monitoring by the lender.
Demand for Debt Capital. We believe there is a large pool of committed but uninvested private equity capital for middle market companies. We expect private equity firms will seek to leverage their investments by combining equity capital with senior secured loans and subordinated debt from other sources, such as us.
Competition from Bank Lenders. We believe that many traditional bank lenders to middle market businesses have either exited or de-emphasized their service and product offerings in the middle market. These traditional lenders have instead focused on lending and providing other services to large corporate clients. We believe this has resulted in fewer key players and the reduced availability of debt capital to the companies we target.
Market Environment: We believe middle market investments are likely to excel in uncertain market environments such as the current market environment following the COVID-19 outbreak that began in December 2019, and that these investments have historically generated premium yields with more desirable structures for lenders as compared to large corporate loans.(1) In addition, we believe the recent credit market dislocation will accelerate the market share shift toward well-positioned larger platforms. On the other hand, we believe that there has been increased competition for direct lending to middle market businesses, which would be expected to result in less favorable pricing terms for our potential investments. If we match our competitors’ pricing, terms and structure, we would expect to experience decreased net interest income, lower yields and increased risk of credit loss. However, we believe that Golub Capital’s scale, product suite, entrenched relationships and strong market position will continue to allow us to find investment opportunities with attractive risk-adjusted returns.
(1) Standard & Poor’s “LCD Middle Market Review Q2 2020” – New-issue first-lien yield-to-maturity. Middle Market loans have, on average, generated higher yields in comparison to large corporate loans based on data starting in January 2000.
7
Competitive Strengths
Deep, Experienced Management Team. We are managed by GC Advisors, which has access through the Staffing Agreement to the resources and expertise of Golub Capital’s more than 570 employees, led by our chairman, Lawrence E. Golub, and our chief executive officer, David B. Golub. As of September 30, 2021, Golub Capital’s more than 150 investment professionals had an average of over 13 years of investment experience and were supported by more than 420 administrative and back office personnel that focus on operations, finance, legal and compliance, accounting and reporting, marketing, information technology and office management. GC Advisors also manages Golub Capital BDC 3, Inc., a Maryland corporation, or GBDC 3, and Golub Capital Direct Lending Corporation, a Maryland corporation, or GDLC, each of which has elected to be regulated as a business development company and, in the case of GBDC, whose shares of common stock are publicly traded on the Nasdaq Global Select Market. Golub Capital seeks to hire and retain high-quality investment professionals and reward those personnel based on investor returns.
Leading U.S. Debt Platform Provides Access to Proprietary Relationship-Based Deal Flow. GC Advisors gives us access to the deal flow of Golub Capital, one of the leading middle-market lenders in the United States. Golub Capital has been a top 3 Traditional Middle Market Bookrunner each year from 2008 through Q2 2021 for senior secured loans of up to $500.0 million for leveraged buyouts based on number of deals completed according to Thomson Reuters LPC and internal data. We believe this market position makes Golub Capital the first choice lender to many sponsors.Since its inception, Golub Capital has closed deals with over 340 middle-market sponsors and repeat transactions with over 230 sponsors. We believe that Golub Capital receives relationship-based “early looks” and “last looks” at many investment opportunities in the U.S. middle-market market, allowing it to be highly selective in the transactions it pursues.
Disciplined Investment and Underwriting Process. GC Advisors utilizes the established investment process of Golub Capital for reviewing lending opportunities, structuring transactions and monitoring investments. Using its disciplined approach to lending, GC Advisors seeks to minimize credit losses through effective underwriting, comprehensive due diligence investigations, structuring and the implementation of restrictive debt covenants.We expect that GC Advisors will continue to select borrowers whose businesses will retain significant value, even in a depressed market or a distressed sale.GC Advisors intends to reduce risk further by focusing on repeat transactions with proven, successful sponsors.While emphasizing thorough credit analysis, GC Advisors intends to maintain strong relationships with sponsors by offering rapid initial feedback from senior investment professionals on each investment opportunity.
Regimented Credit Monitoring. Following each investment, GC Advisors implements a regimented credit monitoring system. This careful approach, which involves ongoing review and analysis by teams of professionals,has enabled GC Advisors to identify problems early and to assist borrowers before they face difficult liquidity constraints. If necessary, GC Advisors can assume the role of deal sponsor in a work-out situation and has extensive restructuring experience, both in and out of bankruptcy.GC Advisors believes in the need to prepare for possible negative contingencies in order to address them promptly should they arise.
Concentrated Middle-Market Focus. Because of our focus on the middle-market, we understand the following general characteristics of middle-market lending:
•middle-market companies are generally less leveraged than large companies and, we believe, offer more attractive investment returns in the form of upfront fees, prepayment penalties and higher interest rates;
•middle-market issuers are more likely to have simple capital structures;
•carefully structured covenant packages enable middle-market lenders to take early action to remediate poor financial performance; and
•middle-market lenders can undertake thorough due diligence investigations prior to investment.
8
Investment Criteria/Guidelines
Our investment objective is to generate current income and capital appreciation by investing primarily in senior secured and one stop and other senior secured loans ofto U.S. middle market companies.companies in industries we believe are resistant to recessions. We seek to generate strong risk-adjusted net returns by assembling a portfolio of investments across a broad range of industries and private equity investors.
We primarily target U.S. middle-market companies controlled by private equity investors that require capital for growth, acquisitions, recapitalizations, refinancings and leveraged buyouts. We mayseek to have a portfolio of first-lien, senior secured loans to borrowers believed to be insulated from the effects of the novel coronavirus, or COVID-19, pandemic in recession-resistant industries. We also make opportunistic loans to independently owned and publicly held middle-market companies. We seek to partner with strong management teams executing long-term growth strategies. Target businesses will typically exhibit some or all of the following characteristics:
•annual EBITDA of less than $100.0 million annually;million;
•sustainable leading positions in their respective markets;
•scalable revenues and operating cash flow;
•experienced management teams with successful track records;
•insulation from the effects of the COVID-19 pandemic;
•stable, predictable cash flows with low technology and market risks;
•a substantial equity cushion in the form of capital ranking junior to our investment;investment provided by a middle market private equity sponsor;
•low capital expenditures requirements;
•a North American base of operations;
•strong customer relationships;
•products, services or distribution channels having distinctive competitive advantages;
•defensible niche strategy or other barriers to entry; and
•demonstrated growth strategies.
While we believe that the criteria listed above are important in identifying and investing in prospective portfolio companies, not all of these criteria will be met by each prospective portfolio company.
Investment Process Overview
We view our investment process as consisting of four distinct phases described below:
Origination. GC Advisors sources investment opportunities through access to a network of over 10,000 individual contacts developed in the financial services and related industries by Golub Capital and managed through a proprietary customer relationship database. Among these contacts is an extensive network of private equity firms and relationships with leading middle-market senior lenders. The senior deal professionals of Golub Capital supplement these leads through personal visits and marketing campaigns. It is their responsibility to identify specific opportunities, to refine opportunities through candid exploration of the underlying facts and circumstances and to apply creative and flexible thinking to solve clients’ financing needs. The investment professionals of Golub Capital have a long and successful track record investing in companies across many industry sectors.Collectively, these investment professionals have completed investments in over 1,900 companies at Golub Capital.Golub Capital’s origination personnel are locatedinvestments have been made in the following industries, among others: healthcare, restaurant and retail, software, digital and technology services, specialty manufacturing, business services, consumer products and services, food and beverages, aerospace and defense and value-added distribution.
Golub Capital has principal lending offices in Chicago, New York, London and San Francisco. Each originatorof Golub Capital's originators maintains long-standing customer relationships and is responsible for covering a specified target market. We believe those originators’ strength and breadth of relationships across a wide range of markets generate numerous financing opportunities, which we believe enables GC Advisors to be highly selective in recommending investments to us.
Underwriting. We utilize the systematic, consistent approach to underwriting developed by Golub Capital, with a particular focus on determining the value of a business in a downside scenario.The key criteria that we consider include (1) strong and resilient underlying business fundamentals, (2) a substantial equity cushion in the form of
9
capital ranking junior in right of payment to our investment and (3) a conclusion that overall “downside” risk is manageable.While the size of ourthis equity cushion will vary over time and across industries, the equity cushion generally sought by GC Advisors today is between 35% and 50%45% of total portfolio capitalization.We generally focus on the criteria developed by Golub Capital for evaluating prospective portfolio companies, which uses a combination of analyses, including (1) fundamental analysis of a business’s financial statements, health, management, competitive advantages, competitors and markets; (2) analysis of opportunities in a given market based upon fluctuations due to seasonal, financial and economic factors; (3) quantitative analysis of the relative risk-return characteristics of investments and a comparison of yields between asset classes and other indicators; and (4) analysis of proprietary and secondary models.In evaluating a particular company, we put more emphasis on credit considerations (such as (1) loan-to-value ratio (which is the amount of our loan divided by the enterprise value of the company in which we are investing), (2) the ability of the company to maintain a liquidity cushion through economic cycles and in downside scenarios, (3) the ability of the company to service its fixed
charge obligations under a variety of scenarios and (4) its anticipated strategic value in a downturn) than on profit potential and loan pricing. OurBased upon a combination of bottom-up analysis of the individual investment and GC Advisors’ expectations of future market conditions, GC Advisors seeks to assess the relative risk and reward for each investment.GC Advisors seeks to mitigate the risks of a single company or single industry through portfolio diversification.GC Advisors also considers environmental, social and governance considerations in the investment decision-making process, in accordance with its ESG policy, including analysis of the likelihood of material ESG-related risk based on the industry and industry subsector of the potential portfolio company, with further diligence and analysis based on this categorization as well as other factors identified during diligence. Golub Capital’s due diligence process for middle-marketmiddle market credits will typically entail:
•a thorough review of historical and pro forma financial information;
•on-site visits;
•interviews with management and employees;
•a review of loan documents and material contracts;
•third-party “quality of earnings” accounting due diligence;
•when appropriate, background checks on key managers and research relating to the company’s business, industry, markets, customers, suppliers, products and services and competitors; and
•the commission of third-party market studies when appropriate.
The following chart illustrates the stages of Golub Capital’s evaluation and underwriting process:
ILLUSTRATIVE DEAL EVALUATION PROCESS
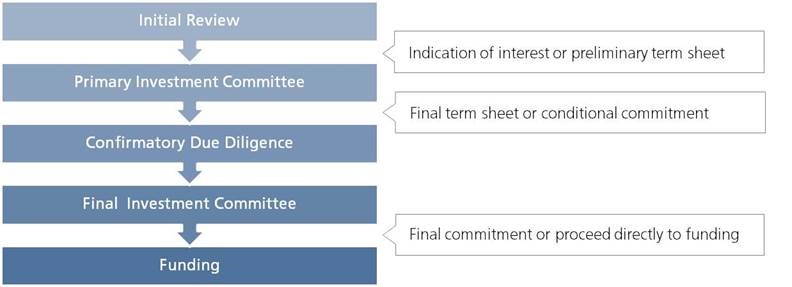
Execution. In executing transactions for us, GC Advisors utilizes the due diligence process developed by Golub Capital. Through a consistent approach to underwriting and careful attention to the details of execution, itGolub Capital seeks to close deals as fast or faster than competitive financing providers while maintainingmaintain discipline with respect to credit, pricing, and structure to ensure the ultimate success of the financing. Upon completion of due diligence, the investment team working on an investment delivers a final memorandum to GC Advisors’ investment committee. Once an investment has been approved by the investment committee, it moves through a series of steps towards negotiationgenerally, including initial documentation using standard document
10
templates, final documentation, including resolution of final documentation.business points and the execution of original documents held in escrow. Upon completion of final documentation, a loan is funded upon the execution of an investment committee memorandum by members of GC Advisors’ investment committee.
Monitoring. We view active portfolio monitoring as a vital part of our investment process. We consider board observation rights, where appropriate, regular dialogue with company management and sponsors and detailed, internally generated monitoring reports to be critical to our performance. Golub Capital has developed a monitoring template that is designed to reasonably ensure compliance with these standards. This template is used by GC Advisors as a tool to assess investment performance relative to our investment plan. In addition, our portfolio companies often rely on GC Advisors to provide them with financial and capital markets expertise.
As part of the monitoring process, GC Advisors regularly assesses the risk profile of each of our investments and rates each of them based on an internal system developed by Golub Capital and its affiliates. This system is not generally accepted in our industry or used by our competitors. It is based on the following categories, which we refer to as GC Advisors’ internal performance rating:
ratings:
| Internal Performance Ratings | ||||||||
| Rating | Definition | |||||||
| 5 | Involves the least amount of risk in our portfolio. The borrower is performing above expectations, and the trends and risk factors are generally favorable. | |||||||
| 4 | Involves an acceptable level of risk that is similar to the risk at the time of origination. The borrower is generally performing as expected, and the risk factors are neutral to favorable. | |||||||
| 3 | Involves a borrower performing below expectations and indicates that the loan’s risk has increased somewhat since origination. The borrower | |||||||
| 2 | Involves a borrower performing materially below expectations and indicates that the loan’s risk has increased materially since origination. In addition to the borrower being generally out of compliance with debt covenants, loan payments | |||||||
| 1 | Involves a borrower performing substantially below expectations and indicates that the loan’s risk has substantially increased since origination. Most or all of the debt covenants are out of compliance and payments are substantially delinquent. Loans rated 1 are not anticipated to be repaid in full and we will reduce the fair market value of the loan to the amount we anticipate will be recovered. | |||||||
Our internal performance ratings do not constitute any rating of investments by a nationally recognized statistical rating organization or represent or reflect any third-party assessment of any of our investments.
For any investment rated 1, 2 or 3, GC Advisors will increaseincreases its monitoring intensity and prepareprepares regular updates for the investment committee, summarizing current operating results and material impending events and suggesting recommended actions.
GC Advisors monitors and, when appropriate, changes the internal performance ratings assigned to each investment in our portfolio. In connection with our valuation process, GC Advisors and our board of directors review these internal performance ratings on a quarterly basis.
The following table shows the distribution of our investments on the 1 to 5 internal performance rating scale at fair value as of September 30, 20182021 and 2017:
| September 30, 2018 | September 30, 2017 | |||||||||||||
Internal Performance Rating | Investments at Fair Value (In thousands) | Percentage of Total Investments | Investments at Fair Value (In thousands) | Percentage of Total Investments | ||||||||||
| 5 | $ | 113,873 | 6.4 | % | $ | 91,525 | 5.5 | % | ||||||
| 4 | 1,455,754 | 81.6 | 1,378,316 | 81.8 | ||||||||||
| 3 | 195,414 | 11.0 | 212,629 | 12.6 | ||||||||||
| 2 | 17,250 | 1.0 | 249 | 0.0* | ||||||||||
| 1 | 550 | 0.0* | 2,296 | 0.1 | ||||||||||
| Total | $ | 1,782,841 | 100.0 | % | $ | 1,685,015 | 100.0 | % | ||||||
2020:
| September 30, 2021 | September 30, 2020 | |||||||||||||||||||||||||
| Internal Performance Rating | Investments at Fair Value (In thousands) | Percentage of Total Investments | Investments at Fair Value (In thousands) | Percentage of Total Investments | ||||||||||||||||||||||
| 5 | $ | 499,241 | 10.2 | $ | 257,409 | 6.1 | ||||||||||||||||||||
| 4 | 3,951,870 | 80.7 | 3,085,610 | 72.8 | ||||||||||||||||||||||
| 3 | 395,208 | 8.1 | 836,560 | 19.7 | ||||||||||||||||||||||
| 2 | 47,836 | 1.0 | 57,754 | 1.4 | ||||||||||||||||||||||
| 1 | 731 | 0.0* | 877 | 0.0* | ||||||||||||||||||||||
| Total | $ | 4,894,886 | 100.0 | $ | 4,238,210 | 100.0 | ||||||||||||||||||||
| * | Represents an amount less than 0.1%. | ||||
11
Investment Committee
The purpose of GC Advisors’ investment committee, which is comprised of officers of GC Advisors, evaluatesis to evaluate and approvesapprove all of our investments, subject to the oversight of our board of directors. The investment committee process is intended to bring the diverse experience and perspectives of the committee’s members to the analysis and consideration of each investment. The investment committee currently consists of Lawrence E. Golub, David B. Golub, Andrew H. Steuerman, and Gregory W. Cashman.Cashman, Spyro G. Alexopoulos, Marc C. Robinson, Robert G. Tuchscherer and Jason J. Van Dussen. The investment committee serves to provide investment consistency and adherence to our core investment philosophy and policies. The investment committee also determines appropriate investment sizing and suggests ongoing monitoring requirements.
In addition to reviewing investments, investment committee meetings serve as a forum to discuss credit views and outlooks. Potential transactions and deal flow are reviewed on a regular basis. Members of the investment team
are encouraged to share information and credit views with the investment committee early in their analysis. We believe this process improves the quality of the analysis and assists the deal team members to work more efficiently.
Each transaction is presented to the investment committee in a formal written report. All of our new investments must be approved by a consensusEach investment opportunity generally receives the unanimous approval of the investment committee. Each member of the investment committee performs a similar role for other investment funds, accounts or other investment vehicles, collectively referred to as accounts, sponsored or managed by Golub Capital and its affiliates.
Investment Structure
Once we have determinedGC Advisors determines that a prospective portfolio company is suitable for investment, we workGC Advisors typically works with the private equity sponsor, if applicable, the management of that company and its other capital providers to structure anour investment. We negotiate amongGC Advisors negotiates with these parties to agree on how our investment is expected to performshould be structured relative to the other capital in the portfolio company’s capital structure.
Senior Secured Loans. When we structureGC Advisors structures investments in senior secured loans, where we obtain security interests in the assets of the portfolio company that serve as collateral in support of the repayment of such loans. This collateral may takeoften takes the form of first-priority liens on the assets of the portfolio company borrower.company. Our senior secured loans often provide for moderate loan amortization in the early years of the loan, with the majority of the amortization deferred until loan maturity. Our senior secured loans may include a payment in kind, or PIK, feature.
One Stop Loans. We structureGC Advisors structures our one stop loans as senior secured loans. A one stop loan is a single loan that blends the characteristics of traditional senior debt and traditional junior debt. The structure generally combines the stronger lender protections associated with first lien senior secured debt with the superior economics of junior capital. We obtain security interests in the assets of the portfolio company that serve as collateral in support of the repayment of these loans. This collateral may takeoften takes the form of first-priority liens on the assets of the portfolio company. In some cases, one stop loans are provided to borrowers experiencing high revenue growth supported by a high level of discretionary expenditures. As part of the underwriting of such loans and consistent with industry practice, we adjust our characterization of the earnings of such borrowers for a reduction or elimination of such discretionary expenses if appropriate. One stop loans typically provide for moderate loan amortization in the initial years of the facility, with the majority of the amortization deferred until loan maturity. Our one stop loans may include a PIK feature. One stop loans generally allow the borrower to make a large lump sum payment of principal at the end of the loan term and there is a risk of loss if the borrower is unable to pay the lump sum or refinance the amount owed at maturity. In many cases, we are the sole lender or we, together with our affiliates, are the sole lenders of a one stop loans,loan, which can afford us additional influence over the borrower in terms of monitoring and, if necessary, remediation in the event ofremediating any underperformance.
One stop loans include loans to technology companies undergoing strong growth due to new services, increased adoption and/or entry into new markets. We refer to loans to these companies as late stage lending loans. Other targeted characteristics of late stage lending businesses include strong customer revenue retention rates, a diversified customer base and backing from growth equity or venture capital firms. In some cases, the borrower’s high revenue growth is supported by a high level of discretionary spending. As part of the underwriting of such loans and consistent with industry practice, we may adjust our characterization of the earnings of such borrowers for a reduction or elimination of such discretionary expenses, if appropriate.
12
Second Lien Loans. We structureGC Advisors structures these investments as junior,subordinated, secured loans.loans for which our claims on the related collateral are subordinated. We obtain security interests in the assets of the portfolio company that serve as collateral in support of the repayment of such loans. This collateral may taketypically takes the form of second priority liens on the assets of a portfolio company. Second lien loans typically provide for minimal loan amortization in the initial years of the facility, with the majority of the amortization deferred until loan maturity.
Subordinated Loans. We structureGC Advisors structures these investments as unsecured, subordinated loans that provide for relatively high, fixed interest rates thatand provide us with significant current interest income. Subordinated loans rank senior only to a borrower’s equity securities and rank junior to all of such borrower’s other indebtedness in priority of payment. These loans typically have interest-only payments (often representing a combination of cash pay and payment-in-kind, or PIK interest) in the early years.years, with all or the majority of amortization of principal deferred until loan maturity. Subordinated loans generally allow the borrower to make a large lump sum payment of principal at the end of the loan investmentsterm, and there is a risk of loss if the borrower is unable to pay the lump sum or refinance the amount owed at maturity.
Second lien loans and subordinated loans are generally more volatile than first lien, senior secured loans and may involve a greater risk of loss of principal. In addition, the PIK feature of many subordinated loans, which effectively operates as negative amortization of loan principal, increases credit risk exposure over the life of the loan. Subordinated loans are more likely to include a PIK feature.
•selecting investments that we believe have a very low probability of loss;
•requiring a total return on our investments that we believe will compensate us appropriately for credit risk; and
•negotiating covenants in connection with our investments that afford our portfolio companies as much flexibility in managing their businesses as possible, consistent with the preservation of our capital. Such restrictions maycould include affirmative and negative covenants, default penalties, lien protection, change of control provisions and board rights.
We expect to hold most of our investments to maturity or repayment, but we may sell some of our investments earlier if a liquidity event occurs, such as a sale, recapitalization or worsening of the credit quality of the portfolio company.
13
Investments
We seek to create a portfolio that includes primarily one stop and other senior secured loans by investing approximately $5.0$10.0 million to $30.0$75.0 million of capital, on average, in the securities of middle-market companies. Set forth below is a list of our ten largest portfolio company investments as of September 30, 2018,2021, as well as the top ten industries in which we were invested as of September 30, 2018, in each case excluding SLF,2021, calculated as a percentage of our total investments at fair value as of such date.
| Portfolio Company | Investments at Fair Value (In thousands) | Percentage of Total Investments | |||||||||
| Diligent Corporation | $ | 114,466 | 2.3 | % | |||||||
| GS Acquisitionco, Inc. | 104,078 | 2.1 | |||||||||
| Bullhorn, Inc. | 85,083 | 1.8 | |||||||||
| Datix Bidco Limited | 79,597 | 1.6 | |||||||||
| ES Acquisition, LLC | 77,563 | 1.6 | |||||||||
| Imperial Optical Midco Inc. | 69,007 | 1.4 | |||||||||
| Transaction Data Systems, Inc. | 67,135 | 1.4 | |||||||||
| Whitcraft LLC | 64,168 | 1.3 | |||||||||
| InhabitIQ Inc | 60,155 | 1.2 | |||||||||
| Veterinary Specialists of North America, LLC | 58,064 | 1.2 | |||||||||
| $ | 779,316 | 15.9 | % | ||||||||
| Industry | Investments at Fair Value (In thousands) | Percentage of Total Investments | |||||||||
| Software | $ | 1,084,864 | 22.2 | % | |||||||
| Healthcare Providers and Services | 532,463 | 10.9 | |||||||||
| IT Services | 302,487 | 6.2 | |||||||||
| Specialty Retail | 292,446 | 6.0 | |||||||||
| Insurance | 234,529 | 4.8 | |||||||||
| Hotels, Restaurants and Leisure | 172,285 | 3.5 | |||||||||
| Healthcare Equipment and Supplies | 157,959 | 3.2 | |||||||||
| Health Care Technology | 150,565 | 3.1 | |||||||||
| Automobiles | 140,499 | 2.9 | |||||||||
| Diversified Consumer Services | 134,232 | 2.7 | |||||||||
| $ | 3,202,329 | 65.5 | % | ||||||||
| Portfolio Company | Investments at Fair Value (In thousands) | Percentage of Total Investments | ||||
| Transaction Data Systems, Inc. | $ | 39,066 | 2.2 | % | ||
| Diligent Corporation | 38,848 | 2.2 | ||||
| MRI Software LLC | 38,474 | 2.2 | ||||
| Massage Envy, LLC | 36,735 | 2.1 | ||||
| Appriss Holdings, Inc. | 36,005 | 2.0 | ||||
| DCA Investment Holding, LLC | 35,783 | 2.0 | ||||
| Captive Resources Midco, LLC | 34,706 | 1.9 | ||||
| Integration Appliance, Inc. | 34,406 | 1.9 | ||||
| eSolutions, Inc. | 31,483 | 1.8 | ||||
| Vendavo, Inc. | 30,268 | 1.7 | ||||
| $ | 355,774 | 20.0 | % | |||
| Industry | Investments at Fair Value (In thousands) | Percentage of Total Investments | ||||
| Diversified/Conglomerate Service | $ | 466,037 | 26.1 | % | ||
| Healthcare, Education and Childcare | 333,736 | 18.7 | ||||
| Electronics | 130,472 | 7.3 | ||||
| Retail Stores | 112,738 | 6.3 | ||||
| Beverage, Food and Tobacco | 99,608 | 5.6 | ||||
| Diversified/Conglomerate Manufacturing | 96,663 | 5.4 | ||||
| Leisure, Amusement, Motion Pictures, Entertainment | 81,907 | 4.6 | ||||
| Personal and Non Durable Consumer Products (Mfg. Only) | 69,912 | 3.9 | ||||
| Buildings and Real Estate | 65,255 | 3.7 | ||||
| Aerospace and Defense | 47,891 | 2.7 | ||||
| $ | 1,504,219 | 84.3 | % | |||
Managerial Assistance
As a business development company, we offer, and must provide upon request, managerial assistance to our portfolio companies. This assistance wouldcould involve an arrangement to provide significant guidancemonitoring the operations of our portfolio companies, participating in board and counsel concerning the management operations or business objectivesmeetings, consulting with and policiesadvising officers of the portfolio company.companies and providing other organizational and financial guidance. The Administrator or an affiliate of the Administrator provides such managerial assistance on our behalf to portfolio companies that request this assistance. We maycould receive fees for these services and reimburse the Administrator or an affiliate of the Administrator, as applicable, for its allocated costs in providing such assistance, subject to the review and approval by our board of directors, including our independent directors.
Competition
14
Our primary competitors in providing financing to middle-market companies include public and private funds, other business development companies, commercial and investment banks, commercial financing companies and, to the extent they provide an alternative form of financing, private equity and hedge funds. Many of our competitors are substantially larger and have considerably greater financial, technical and marketing resources than we do. For example, we believe some competitors may have access to funding sources that are not available to us. In addition, some of our competitors may have higher risk tolerances or different risk assessments, which could allow them to consider a wider variety of investments and establish more relationships than us. Furthermore, many of our competitors are not subject to the regulatory restrictions that the 1940 Act imposes on us as a business development company or to the source-of-income, asset diversification and distribution requirements we must satisfy to maintain our qualification as a RIC.
We use the expertise of the investment professionals of Golub Capital and its affiliates to which we have access to assess investment risks and determine appropriate pricing for our investments in portfolio companies. In addition, the relationships of the senior members of Golub Capital and its affiliates enable us to learn about, and compete effectively for, financing opportunities with attractive middle-market companies in the industries in which we invest. See “Risk Factors — Risks Relating to our Business and Structure — We operate in a highly competitive market for investment opportunities, which could reduce returns and result in losses.”
Administration
We do not have any direct employees, and our day-to-day investment operations are managed by GC Advisors. Our business and affairs are managed under the direction of our board of directors. We have a chief executive officer, chief financial officer, chief compliance officer, managing director and director of corporate strategy, and to the extent necessary, our board of directors maycan elect to hireappoint additional personnelofficers going forward. Our officers are officers and/or employees of Golub Capital LLC, an affiliate of GC Advisors, and our allocable portion of the cost of our chief financial officer and chief compliance officer and their respective staffs is paid by us pursuant to the administration agreement, or the Administration Agreement, with the Administrator. See “Business - Management Agreements - Administration Agreement.”
15
SUMMARY RISK FACTORS
The risk factors described below are a summary of the principal risk factors associated with an investment in us. These are not the only risks we face. You should carefully consider these risk factors, together with the risk factors set forth in Item 1A. of this Annual Report on Form 10-K and the other reports and documents filed by us with the SEC.
We are subject to risks relating to our business and structure
•We are subject to risks associated with the current interest rate environment and to the extent we use debt to finance our investments, changes in interest rates will affect our cost of capital and net investment income.
•We operate in a highly competitive market for investment opportunities, which could reduce returns and result in losses.
•Rising interest rates could make it more difficult for portfolio companies to make periodic payments on
their loans.
•We are subject to risks associated with the discontinuation of LIBOR, which will affect our cost of capital and net investment income.
•We are dependent upon GC Advisors for our success and upon its access to the investment professionals and partners of Golub Capital and its affiliates.
•Our business model depends to a significant extent upon strong referral relationships with sponsors and
investing in companies backed by private equity sponsors. Any inability of GC Advisors to maintain or
develop these relationships, or the failure of these relationships to generate investment opportunities, could
adversely affect our business.
•There are significant potential conflicts of interest that could affect our investment returns, including conflicts related to the obligations of GC Advisors’ investment committee, GC or its affiliates have to other clients and conflicts related to fees and expenses of such other clients, incentives created by our base management and incentive fee structure, the valuation process for certain of our portfolio holdings and other arrangements with GC Advisors or its affiliates.
•GC Advisors could make certain investment decisions for the purpose of receiving transaction fees.
•GC Advisors could prioritize its relationship with a borrower or private equity sponsor instead of seeking
the most advantageous terms for a company investment.
•GC Advisors operates in multiple business lines and could pursue additional business lines, which could
create a conflict of interest in the allocation of its time and focus.
•Golub Capital could pursue strategic transactions, which could create a conflict of interest in the allocation
of GC Advisors time and focus.
•We and GC Advisors could be the target of litigation or regulatory investigations.
•We are subject to certain risks related to our ability to qualify as a RIC and to related to regulations governing our operation as a business development company.
•We finance our investments with borrowed money, which could accelerate and increase the potential for gain or loss on amounts invested and could increase the risk of investing in us.
•We are subject to risks associated with the Unsecured Notes, the Debt Securitizations and the Revolving Credit Facilities.
•The majority of our portfolio investments will be recorded at fair value as determined in good faith by our board of directors and, as a result, there could be uncertainty as to the value of our portfolio investments.
•Our board of directors could change our investment objective, operating policies and strategies without prior notice or stockholder approval.
•Each of GC Advisors and the Administrator can resign on 60 days’ notice, and we can provide no assurance that we could find a suitable replacement within that time, resulting in a disruption in our operations that could adversely affect our financial condition, business and results of operations.
We are subject to risks relating to our investments
•Economic recessions or downturns could impair our portfolio companies and defaults by our portfolio companies will harm our operating results.
•Our investments in debt, leveraged portfolio companies, private and middle-market portfolio companies are risky and we could lose all or part of our investment.
16
•The lack of liquidity in our investments could adversely affect our business.
•Price declines and illiquidity in the corporate debt markets could adversely affect the fair value of our portfolio investments, reducing our net asset value through increased net unrealized depreciation.
•Our portfolio companies could prepay loans, which could reduce our yields if capital returned cannot be invested in transactions with equal or greater expected yields.
•We are subject to credit and default risk and portfolio companies could be unable to repay or refinance outstanding principal on their loans at or prior to maturity.
•Our portfolio could be concentrated in a limited number of portfolio companies and industries, which will subject us to a risk of significant loss if any of these companies defaults on its obligations under any of its debt instruments or if there is a downturn in a particular industry.
•We could hold the debt securities of leveraged companies that could, due to the significant volatility of such companies, enter into bankruptcy proceedings.
•Our failure to make follow-on investments in our portfolio companies could impair the value of our portfolio.
•Because we generally do not hold controlling equity interests in our portfolio companies, we generally will not be able to exercise control over our portfolio companies or to prevent decisions by management of our portfolio companies that could decrease the value of our investments.
•Our portfolio companies could incur debt that ranks equally with, or senior to, our investments in such companies and such portfolio companies could fail to generate sufficient cash flow to service their debt obligations to us.
•The disposition of our investments could result in contingent liabilities.
•GC Advisors’ liability is limited, and we have agreed to indemnify GC Advisors against certain liabilities, which could lead GC Advisors to act in a riskier manner on our behalf than it would when acting for its own account.
•We could be subject to risks if we engage in hedging transactions and could become subject to risks if we invest in foreign securities.
•We could suffer losses from our equity investments.
•We could be subject to lender liability claims with respect to our portfolio company investments.
Investors are subject to risks relating to an investment in our securities
•Investing in our securities could involve an above average degree of risk and the market price of our securities could fluctuate significantly.
•Shares of closed-end investment companies, including business development companies, often trade at a discount to their net asset value.
•There is a risk that investors in our equity securities will not receive distributions or that our distributions do not grow over time and a portion of our distributions could be a return of capital.
•The Unsecured Notes are unsecured and therefore are effectively subordinated to any secured indebtedness and are structurally subordinated to the indebtedness and other liabilities of our subsidiaries.
•If we default on our obligations to pay our other indebtedness, we may not be able to make payments on the Unsecured Notes.
17
MANAGEMENT AGREEMENTS
GC Advisors is located at 666 Fifth200 Park Avenue, 18th25th Floor, New York, NY 10103.10166. GC Advisors is registered as an investment adviser under the Advisers Act. The beneficial interests in GC Advisors are majority owned, indirectly, by two affiliated trusts. The trustees of those trusts are Stephen A. Kepniss and David L. Finegold. Subject to the overall supervision of our board of directors and in accordance with the 1940 Act, GC Advisors manages our day-to-day operations and provides investment advisory services to us. Under the terms of the Investment Advisory Agreement, GC Advisors:
•determines the composition of our portfolio, the nature and timing of the changes to our portfolio and the manner of implementing such changes;
•identifies, evaluates and negotiates the structure of the investments we make;
•executes, closes, services and monitors the investments we make;
•determines the securities and other assets that we purchase, retain or sell;
•performs due diligence on prospective portfolio companies; and
•provides us with such other investment advisory, research and related services as we, may, from time to time, reasonably require for the investment of our funds.
GC Advisors’ services under the Investment Advisory Agreement are not exclusive. Subject to the requirements of the 1940 Act, GC Advisors maycan enter into one or more sub-advisory agreements under which GC Advisors maywould obtain assistance in fulfilling its responsibilities under the Investment Advisory Agreement.
Management Fee
Pursuant to the Investment Advisory Agreement, we pay GC Advisors a fee for investment advisory and management services consisting of two components — a base management fee and an incentive fee. The cost of both the base management fee and the incentive fee is ultimately borne by our stockholders.
Incentive Fee
We pay GC Advisors an incentive fee. Incentive fees are calculated as described below and payable quarterly in arrears or at the end of each calendar year (or, upon termination of the Investment Advisory Agreement, as of the termination date).
Cap on Fees. We have structured the calculation of the incentive fee to include a fee limitation such that, under the Investment Advisory Agreement, an incentive fee for any quarter can only be paid to GC Advisors if, after such payment, the cumulative incentive fees paid to GC Advisors, calculated on a per share basis as described below, since April 13, 2010, the effective date of our election to become a business development company, would be less than or equal to 20.0% of our Cumulative Pre-Incentive Fee Net Income (as defined below).
18
We accomplish this limitation by subjecting each quarterly incentive fee payable under the Income and Capital Gains Incentive Fee Calculation (as defined below) to a cap, or the Incentive Fee Cap. The Incentive Fee Cap in any quarter is equal to the difference between (a) 20.0% of Cumulative Pre-Incentive Fee Net Income Per Share (as defined below) and (b) cumulative incentive fees of any kind paid to GC Advisors by us since April 13, 2010.Cumulative Incentive Fees Paid Per Share (as defined below). To the extent the Incentive Fee Cap is zero or a negative value in any quarter, no incentive fee would be payable in that quarter. “Cumulative Pre-Incentive Fee Net Income”Income Per Share” under the Investment Advisory Agreement is equal to the sum of Pre-Incentive Fee Net Income Per Share (as defined below) for each quarter since April 13, 2010. “Pre-Incentive Fee Net Income Per Share” for any quarter is equal to (a) the sum of (i) Pre-Incentive Fee Net Investment Income (as defined below) and (ii) Adjusted Capital Returns (as defined below) for each period since April 13, 2010 andthe quarter divided by (b) cumulativethe weighted average number of shares of our common stock outstanding during such quarter. “Adjusted Capital Returns” for any quarter shall be the sum of the realized aggregate realized capital gains, cumulativerealized aggregate realized
capital losses, cumulative aggregate unrealized capital depreciation and cumulative aggregate unrealized capital appreciation for such quarter; provided that the calculation of realized aggregate capital gains, realized aggregate capital losses, aggregate unrealized capital depreciation and aggregate unrealized capital appreciation shall not include any realized capital gains, realized capital losses or unrealized capital appreciation or depreciation resulting solely from the purchase accounting for any premium or discount paid for the acquisition of assets in a merger. “Cumulative Incentive Fees Paid Per Share” is equal to the sum of Incentive Fees Paid Per Share for each quarter (or portion thereof) since April 13, 2010. “Incentive Fees Paid Per Share” for any quarter is equal to the incentive fees accrued and/or payable by us for such period divided by the weighted average number of shares of our common stock outstanding during such period.
“Pre-Incentive Fee Net Investment Income” means interest income, dividend income and any other income (including any other fees such as commitment, origination, structuring, diligence and consulting fees or other fees that we receive from portfolio companies but excluding fees for providing managerial assistance) accrued during the calendar quarter,period, minus operating expenses for the calendar quarter (including the base management fee, taxes, any expenses payable under the Investment Advisory Agreement and the Administration Agreement, any expenses of securitizations and any interest expense and dividends paid on any outstanding preferred stock, but excluding the applicable incentive fee)fees). Pre-Incentive Fee Net Investment Income includes, in the case of investments with a deferred interest feature such as market discount, debt instruments with PIK interest, preferred stock with PIK dividends, and zero coupon securities, accrued income that we have not yet received in cash. GC Advisors does not return to us amounts paid to it on accrued income that we have not yet received in cash if such income is not ultimately received by us in cash. If we do not ultimately receive income, a loss would be recognized, reducing future fees.
The Investment Advisory Agreement, as compared to the Prior Investment Advisory Agreement, excludes the impact of purchase accounting resulting from a merger, including the Merger, from the calculation of income subject to the income incentive fee payable and the calculation of the Incentive fees are calculated as described below and payable quarterly in arrears (or, upon termination ofFee Cap. As a result, under the Investment Advisory Agreement, Pre-Incentive Fee Net Investment Income does not include any realized capital gains, realized capital losses or unrealized capital appreciation or depreciation or any amortization or accretion of any purchase premium or purchase discount to interest income resulting solely from the purchase accounting for any premium or discount paid for the acquisition of assets in a merger, such as the premium to net asset value paid for the shares of GCIC common stock in the Merger.
The Investment Advisory Agreement, as compared to the Prior Investment Advisory Agreement, converts the cumulative incentive fee cap from an aggregate basis calculation to a per share calculation. Under the Prior Investment Advisory Agreement, the Incentive Fee would not be paid at any time if, after such payment, the cumulative Incentive Fees paid to date would be greater than 20.0% of our Cumulative Pre-Incentive Fee Net Income, which was defined under the Prior Investment Advisory Agreement to equal the sum of Pre-Incentive Fee Net Investment Income for each period since April 13, 2010. Under the Investment Advisory Agreement, the Incentive Fee will not be paid at any time if, after such payment, the Cumulative Incentive Fees Paid Per Share to date would be greater than 20.0% of Cumulative Pre-Incentive Fee Net Income Per Share.
If, for any relevant period, the Incentive Fee Cap calculation results in our paying less than the amount of the termination date).Incentive Fee calculated above, then the difference between (a) the Incentive Fees accrued and/or payable by us for such relevant period and (b) the Incentive Fee Cap multiplied by the weighted average number of shares of our common stock outstanding during such relevant period will not be paid by us, and will not be received by GC Advisors, as an incentive fee, either at the end of such relevant period or at the end of any future relevant period.
19
Income and Capital Gains Incentive Fee Calculation
The income and capital gains incentive fee calculation, or the Income and Capital Gains Incentive Fee Calculation, has two parts: the income component and the capital gains component. The income component is calculated quarterly in arrears based on our Pre-Incentive Fee Net Investment Income for the immediately preceding calendar quarter.
Pre-Incentive Fee Net Investment Income, expressed as a rate of return on the value of our net assets (defined as total assets less indebtedness and before taking into account any incentive fees payable during the period) at the end of the immediately preceding calendar quarter, is compared to a fixed “hurdle rate” of 2.0% quarterly. If market interest rates rise, we may be ablecould have the ability to invest our funds in debt instruments that provide for a higher return, which would increase our Pre-Incentive Fee Net Investment Income and make it easier for GC Advisors to surpass the fixed hurdle rate and receive an incentive fee based on such net investment income. Our Pre-Incentive Fee Net Investment Income used to calculate this part of the incentive fee is also included in the amount of our total assets (excluding cash and cash equivalents but including assets purchased with borrowed funds and securitization-related assets)assets and cash collateral on deposit with custodian) used to calculate the 1.375% base management fee, which fee is payable on all of our assets managed by GC Advisors.
We calculate the income component of the Income and Capital Gains Incentive Fee Calculation with respect to our Pre-Incentive Fee Net Investment Income quarterly, in arrears, as follows:
•zero in any calendar quarter in which the Pre-Incentive Fee Net Investment Income does not exceed the hurdle rate;
•100.0% of our Pre-Incentive Fee Net Investment Income with respect to that portion of such Pre-Incentive Fee Net Investment Income, if any, that exceeds the hurdle rate but is less than 2.5% in any calendar quarter. We refer to this portion of our Pre-Incentive Fee Net Investment Income (which exceeds the hurdle rate but is less than 2.5%) as the “catch-up” provision. The catch-up is meant to provide GC Advisors with 20.0% of the Pre-Incentive Fee Net Investment Income as if a hurdle rate did not apply if this net investment income exceeds 2.5% in any calendar quarter; and
•20.0% of the amount of our Pre-Incentive Fee Net Investment Income, if any, that exceeds 2.5% in any calendar quarter.
The sum of these calculations yields the “Income Incentive Fee”. This amount is appropriately adjusted for any share issuances or repurchases during the quarter.
The following is a graphical representation of the Income Incentive Fee calculation:
Quarterly Income Component of Income and Capital Gains Incentive Fee Calculation Based on Net Income
Pre-Incentive Fee Net Investment Income
(Expressed as a Percentage of the Value of Net Assets)
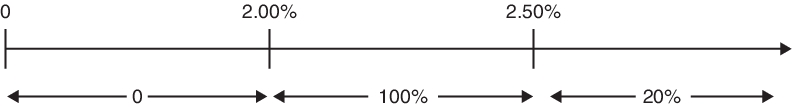
Percentage of Pre-Incentive Fee Net Investment Income Allocated to Income Component of Income and Capital Gains Incentive Fee Calculation
The second part of the Income and Capital Gains Incentive Fee Calculation, or the Capital Gain Incentive Fee, equals (a) 20.0% of our Capital Gain Incentive Fee Base (as defined below), if any, calculated in arrears as of the end of each calendar year (or upon termination of the Investment Advisory Agreement, as of the termination date), commencing with the calendar year ending December 31, 2010, less (b) the aggregate amount of any previously paid Capital Gain Incentive Fees. The Capital Gain Incentive Fee is calculated in the same manner under the Investment Advisory Agreement as under the Prior Investment Advisory Agreement. Our “Capital Gain Incentive
20
Fee Base” equals (1) the sum of (i) our realized capital gains, if any, on a cumulative positive basis from April 13, 2010 through the end of each calendar year, (ii) all realized capital losses on a cumulative basis and (iii) all unrealized capital depreciation on a cumulative basis less (2) all unamortized deferred financing costs, if and to the extent such costs exceed all unrealized capital appreciation on a cumulative basis.
•The cumulative aggregate realized capital losses are calculated as the sum of the amounts by which (a) the net sales price of each investment in our portfolio when sold is less than (b) the accreted or amortized cost basis of such investment.
•The cumulative aggregate realized capital gains are calculated as the sum of the differences, if positive, between (a) the net sales price of each investment in our portfolio when sold and (b) the accreted or amortized cost basis of such investment.
•The aggregate unrealized capital depreciation is calculated as the sum of the differences, if negative, between (a) the valuation of each investment in our portfolio as of the applicable Capital Gain Incentive Fee calculation date and (b) the accreted or amortized cost basis of such investment.
The sum of the Income Incentive Fee and the Capital Gain Incentive Fee is the “Incentive Fee”.
Examples of Quarterly Incentive Fee Calculation
Example 1 — Income Related Portion of Incentive Fee(1):
Assumptions
Hurdle rate(2) = 2.00%
Management fee(3) = 0.344%0.688%
Other expenses (legal, accounting, custodian, transfer agent, etc.)(4) = 0.35%
(1)The hypothetical amount of Pre-Incentive Fee Net Investment Income shown is based on a percentage of total net assets. In addition, the example assumes that during the most recent four full calendar quarter period ending on or prior to the date the payment set forth in the example is to be made, the sum of (a) our aggregate distributions to our stockholders and (b) our change in net assets (defined as total assets less indebtedness and before taking into account any incentive fees payable during the period) is at least 8.0% of our net assets at the beginning of such period (as adjusted for any share issuances or repurchases).
(2)Represents a quarter of the 8.0% annualized hurdle rate.
(3)Represents a quarter of the 1.375% annualized management fee on gross assets, assuming 1.0x debt-to-equity.
(4)Excludes offering expenses.
21
Alternative 1
Additional Assumptions
Investment income (including interest, dividends, fees, etc.) = 1.25%
Pre-Incentive Fee Net Investment Income (investment income adjusted to exclude amortization of purchase premium – (management fee + other expenses)) = 0.556%0.212%
Pre-Incentive Fee Net Investment Income does not exceed the hurdle rate, therefore there is no Incentive Fee.
Alternative 2
Additional Assumptions
Investment income (including interest, dividends, fees, etc.) = 2.80%3.25%
Pre-Incentive Fee Net Investment Income (investment income adjusted to exclude amortization of purchase premium – (management fee + other expenses)) = 2.106%2.212%
Pre-Incentive Fee Net Investment Income exceeds hurdle rate, therefore there is an Incentive Fee.
| Incentive Fee | = | 100% × “catch-up” + the greater of 0% AND (20% × (Pre-Incentive Fee Net Investment Income – 2.50%)) | ||||||
| = | (100% × | |||||||
| = | 100% × | |||||||
| = | ||||||||
Alternative 3
Additional Assumptions
Investment income (including interest, dividends, fees, etc.) = 3.50%4.00%
Pre-Incentive Fee Net Investment Income (investment income – (management fee + other expenses)) = 2.806%2.962%
Pre-Incentive Fee Net Investment Income exceeds hurdle rate, therefore there is an Incentive Fee.
| Incentive Fee | = | 100% × “catch-up” + the greater of 0% AND (20% × (Pre-Incentive Fee Net Investment Income – 2.50%)) | ||||||
| = | (100% × (2.50% – 2.00%)) + (20% × | |||||||
| = | 0.50% + (20% × | |||||||
| = | 0.50% + | |||||||
| = | ||||||||
Example 2 — Capital Gain Incentive Fee:
Alternative 1
Assumptions
| Year 1: | $20 million investment made in Company A (“Investment A”) and | |||||||
| Year 2: | Investment A is sold for $15 million and fair market value (“FMV”) of Investment B determined to be $29 million | |||||||
| Year 3: | FMV of Investment B determined to be $27 million | |||||||
| Year 4: | Investment B sold for $25 million | |||||||
22
The Capital Gain Incentive Fee, if any, would be:
| Year 1: | None (No sales transactions) | |||||||
| Year 2: | None (Sales transaction resulted in a realized capital loss on Investment A) | |||||||
| Year 3: | None (No sales transactions) | |||||||
| Year 4: | None (Sales transaction resulted in a realized capital loss on Investment B) | |||||||
Each quarterly incentive fee payable on the Income and Capital Gains Incentive Fee Calculation is subject to the Incentive Fee Cap. Below are the necessary adjustments to the Incentive Fee payable to adhere to the Incentive Fee Cap.
Additional Assumptions
| Year 1: | Investment B has a FMV of $30.0 million at the time of the closing of the merger, resulting in a cost basis for purposes of calculating the Incentive Fee Cap of $30 million (excluding the $1.5 million purchase premium paid for the acquisition of Investment B in a merger and corresponding $1.5 million unrealized loss); we have 10,000,000 shares of common stock issued and outstanding | |||||||
| Year 2: | We have 10,000,000 shares of common stock issued and outstanding | |||||||
| Year 3: | We issued 1,000,000 shares of common stock and has 11,000,000 shares of common stock issued and outstanding | |||||||
| Year 4: | We have 11,000,000 shares of common stock issued and outstanding | |||||||
| Year 1: | No adjustment; no realized capital losses or unrealized capital depreciation | |||||||
| Year 2: | Investment A sold at a $5 million loss. Investment B has unrealized capital depreciation of $1 | |||||||
| Year 3: | Investment B has unrealized capital depreciation of $2 | |||||||
| Year 4: | Investment B sold | |||||||
Alternative 2
| Year 1: | $20 million investment made in Company A (“Investment A”), | |||||||
| Year 2: | FMV of Investment A determined to be $18 million, FMV of Investment B determined to be $25 million and FMV of Investment C determined to be $25 million | |||||||
| Year 3: | Investment A sold for $18 million. FMV of Investment B determined to be $24 million and FMV of Investment C determined to be $25 million. | |||||||
| Year 4: | FMV of Investment B determined to be $22 million. Investment C sold for $24 million. | |||||||
| Year 5: | Investment B sold for $20 million | |||||||
23
The Capital Gain Incentive Fee, if any, would be:
| Year 1: | None (No sales transactions) | |||||||
| Year 2: | None (No sales transactions) | |||||||
| Year 3: | None (Sales transaction resulted in a realized capital loss on Investment A) | |||||||
| Year 4: | None (Sales transaction resulted in a realized capital loss on Investment C) | |||||||
| Year 5: | None (Sales transaction resulted in a realized capital loss on Investment B) | |||||||
Each quarterly Incentive Fee payable on the Income and Capital Gains Incentive Fee Calculation is subject to the Incentive Fee Cap. Below are the necessary adjustments to the Incentive Fee payable to adhere to the Incentive Fee Cap.
Additional Assumptions
| Year 1: | Investment B has an FMV of $30.0 million at the time of the closing of the merger, resulting in a cost basis for purposes of calculating the Incentive Fee Cap of $30 million (excluding the $1.5 million purchase premium paid for the acquisition of Investment B in a merger and corresponding $1.5 million unrealized loss); we have 10,000,000 shares of common stock issued and outstanding | |||||||
| Year 2: | We have 10,000,000 shares of common stock issued and outstanding | |||||||
| Year 3: | We issue 1,000,000 shares of common stock and have 11,000,000 shares of common stock issued and outstanding | |||||||
| Year 4: | We have 11,000,000 shares of common stock issued and outstanding | |||||||
| Year 5: | We have 11,000,000 shares of common stock issued and outstanding | |||||||
| Year 1: | No adjustment; no realized capital losses or unrealized capital depreciation. | |||||||
| Year 2: | Investment A has unrealized capital depreciation of $2 million. Investment B has unrealized capital depreciation of $5 | |||||||
| Year 3: | Investment A sold at a $2 million loss. Investment A was previously marked down by $2 million; therefore, we would realize a $2 million loss on Investment A and reverse the previous $2 million in unrealized capital depreciation. Investment B has additional unrealized capital depreciation of$1 million for purposes of | |||||||
| Year 4: | Investment B has additional unrealized capital depreciation of $2 | |||||||
| Year 5: | Investment B sold | |||||||
24
Alternative 3
Assumptions
| Year 1: | $25 million investment made in Company A (“Investment A”) and | |||||||
| Year 2: | Investment A is sold for $30 million, FMV of Investment B determined to be | |||||||
| Year 3: | FMV of Investment B determined to be | |||||||
| Year 4: | Investment B sold for | |||||||
The Capital Gain Incentive Fee, if any, would be:
| Year 1: | None (No sales transactions) | |||||||
| Year 2: | $ | |||||||
| Year 3: | $ | |||||||
| Year 4: | $600,000 (20% multiplied by $8 million realized capital gains on sale of Investment A and Investment B less Capital Gain Incentive Fee paid in years 2 and 3). | |||||||
Each quarterly Incentive Fee payable on the Income and Capital Gains Incentive Fee Calculation is subject to the Incentive Fee Cap. Below are the necessary adjustments to the Incentive Fee payable to adhere to the Incentive Fee Cap.Cap
Additional Assumptions
| Year 1: | Investment B has a FMV of $30.0 million at the time of the closing of the merger, resulting in a cost basis for purposes of calculating the Incentive Fee Cap of $30 million (excluding the $1.5 million purchase premium paid for the acquisition of Investment B in a merger and corresponding $1.5 million unrealized loss); we have 10,000,000 shares of common stock issued and outstanding | |||||||
| Year 2: | We have 10,000,000 shares of common stock issued and outstanding | |||||||
| Year 3: | We issue 1,000,000 shares of common stock and have 11,000,000 shares of common stock issued and outstanding | |||||||
| Year 4: | We have 11,000,000 shares of common stock issued and outstanding | |||||||
| Year 1: | No adjustment necessary | |||||||
| Year 2: | No adjustment necessary. GC Advisors would not be paid on the $1 million unrealized gain on Investment B. | |||||||
| Year 3: | No adjustment necessary. GC Advisors would not be paid on the $3 million unrealized gain on Investment B. | |||||||
| Year 4: | No adjustment necessary | |||||||
Payment of Our Expenses
All investment professionals of GC Advisors and/or its affiliates, when and to the extent engaged in providing investment advisory and management services to us, and the compensation and routine overhead expenses of personnel allocable to these services to us, are provided and paid for by GC Advisors and/or its affiliates and not by us. We bear all other out-of-pocket costs and expenses of our operations and transactions. See “Management’s Discussion and Analysis of Financial Condition and Results of Operations — Overview — Expenses.”
Duration and Termination
Unless terminated earlier as described below, the Investment Advisory Agreement will continue in effect for an initial two-year term and thereafter shall continue in effect from year to year if approved annually by our board of directors or by the affirmative vote of the holders of a majority of our outstanding voting securities, and, in either case, if also approved by a majority of our directors who are not “interested persons,” as that term is defined in the 1940 Act, of us or GC Advisors. The Investment Advisory Agreement automatically terminates in the event of its assignment, as defined in the 1940 Act, by GC Advisors and maycould be terminated by either party without penalty
25
upon not less than 60 days’ written notice to the other. The holders of a majority of our outstanding voting securities, by vote, maycan also terminate the Investment Advisory Agreement without penalty. See “Risk Factors — Risks Relating to our Business and Structure — We are dependent upon GC Advisors for our future success and upon their access to the investment professionals and partners of Golub Capital and its affiliates.”
Indemnification
The Investment Advisory Agreement provides that, absent willful misfeasance, bad faith or gross negligence in the performance of its duties or by reason of the reckless disregard of its duties and obligations, GC Advisors and its officers, managers, partners, agents, employees, controlling persons, members and any other person or entity affiliated with it are entitled to indemnification from us for any damages, liabilities, costs and expenses (including reasonable attorneys’ fees and amounts reasonably paid in settlement) arising from the rendering of GC Advisors’ services under the Investment Advisory Agreement or otherwise as our investment adviser.
At a meeting of our board of directors held in Mayon November 27, 2018, our board of directors voted unanimously to reapprove the Investment Advisory Agreement. In reaching a decision to approve the Investment Advisory Agreement, the board of directors reviewed a significant amount of information and considered, among other things:
In reaching a decision to approve the Investment Advisory Agreement, our board of directors reviewed a significant amount of information and considered, among other things:
•the nature, extent and quality of services provided to us by GC Advisors;
•the relative investment performance of us since inception;
•the effect of the Merger on the calculation of incentive fees and the incentive fee cap;
•the effect of purchase accounting for the premium paid for the shares of GCIC’s common stock in the Merger on our financial statements after the Merger and the resulting effects on the calculation of incentive fees payable and the incentive fee cap;
•the fees paid by other comparable business development companies; and
•various other matters.
Our board of directors noted that the terms of the Investment Advisory Agreement did not change the calculation of the Capital Gain Incentive Fee, or the management or incentive fee rates and that the changes, as compared to the Prior Investment Advisory Agreement, consisted of revisions to (i) exclude the impact of purchase accounting resulting from a merger, including the Merger, from the calculation of income subject to the income incentive fee payable and the calculation of the cumulative incentive fee cap under the Investment Advisory Agreement and (ii) convert the cumulative incentive fee cap into a per share calculation.
At a meeting of our stockholders held on September 4, 2019, our stockholders voted to approve the Investment Advisory Agreement, which was entered into effective as of the closing of the Merger. Our board of directors most recently reapproved the Investment Advisory Agreement in May 2021.
Administration Agreement
Pursuant to the Administration Agreement, the Administrator furnishes us with office facilities and equipment and provides clerical, bookkeeping, recordkeeping and other administrative services at such facilities. Under the Administration Agreement, the Administrator performs, or oversees the performance of, our required administrative
26
services, which include being responsible for the financial records that we are required to maintain and preparing reports to our stockholders and reports filed with the SEC. In addition, the Administrator assists us in determining and publishing our net asset value, oversees the preparation and filing of our tax returns and the printing and dissemination of reports to our stockholders, and generally oversees the payment of our expenses and the performance of administrative and professional services rendered to us by others. The Administrator maycan retain third parties to assist in providing administrative services to us. To the extent that the Administrator outsources any of its functions, we pay the fees associated with such functions on a direct basis without profit to the Administrator. We reimburse the Administrator for the allocable portion (subject to review and approval of our board of directors) of the Administrator’s overhead and other expenses incurred by it in performing its obligations under the Administration Agreement, including rent, the fees and expenses associated with performing compliance functions and our allocable portion of the cost of our chief financial officer and chief compliance officer and their respective staffs. Our board of directors reviews the expenses reimbursed to the Administrator, including any allocation of expenses among us and other entities for which the Administrator provides similar services, to determine that these expenses are reasonable and comparable to administrative services charged by unaffiliated third-party asset managers. In addition, if requested to provide managerial assistance to our portfolio companies, the Administrator is paid an additional amount based on the cost of the services provided, which shall not exceed the amount we receive from such portfolio companies for providing this assistance. In May 2018,2021, the Administration Agreement was renewed for a one-year term with the unanimous approval of our board of directors. The Administration Agreement maycould be terminated by either party without penalty upon 60 days’ written notice to the other party.
Indemnification
The Administration Agreement provides that, absent willful misfeasance, bad faith or negligence in the performance of its duties or by reason of the reckless disregard of its duties and obligations, the Administrator and its officers, managers, partners, agents, employees, controlling persons, members and any other person or entity affiliated with it are entitled to indemnification from us for any damages, liabilities, costs and expenses (including reasonable attorneys’ fees and amounts reasonably paid in settlement) arising from the rendering of the Administrator’s services under the Administration Agreement or otherwise as our administrator.
License Agreement
We have entered into a license agreement with Golub Capital LLC under which Golub Capital LLC has granted us a non-exclusive, royalty-free license to use the name “Golub Capital”. Under this agreement, we will have a right to use the “Golub Capital” name and the agreement will remain in effect for so long as GC Advisors or one of its affiliates remains our investment adviser. Other than with respect to this limited license, we will have no legal right to the “Golub Capital” name.
Staffing Agreement
We do not have any internal management capacity or employees. We depend on the diligence, skill and network of business contacts of the senior investment professionals of GC Advisors to achieve our investment objective. GC Advisors is an affiliate of Golub Capital LLC and depends upon access to the investment professionals and other resources of Golub Capital LLC and its affiliates to fulfill its obligations to us under the Investment Advisory Agreement. GC Advisors also depends upon Golub Capital LLC to obtain access to deal flow generated by the professionals of Golub Capital LLC and its affiliates. Under the Staffing Agreement, Golub Capital LLC provides GC Advisors with the resources necessary to fulfill these obligations. The Staffing Agreement provides that Golub Capital LLC will make available to GC Advisors experienced investment professionals and access to the senior investment personnel of Golub Capital LLC for purposes of evaluating, negotiating, structuring, closing and monitoring our investments. The Staffing Agreement also includes a commitment that the members of GC Advisors’ investment committee serve in such capacity. The Staffing Agreement remains in effect until terminated and maycould be terminated by either party without penalty upon 60 days’ written notice to the other party. Services under the Staffing Agreement are provided to GC Advisors on a direct cost reimbursement basis, and such fees are not our obligation.
27
REGULATION
General
We are a business development company under the 1940 Act and have elected to be treated as a RIC under the Code. The 1940 Act contains prohibitions and restrictions relating to transactions between business development companies and their affiliates (including any investment advisers), principal underwriters and affiliates of those affiliates or underwriters and requires that a majority of the directors of a business development company be persons other than “interested persons,” as that term is defined in the 1940 Act. In addition, the 1940 Act provides that we may notcannot change the nature of our business so as to cease to be, or withdraw our election as, a business development company without the approval of a majority of our outstanding voting securities.
We maycan invest up to 100% of our assets in securities acquired directly from issuers in privately negotiated transactions. With respect to such securities, we may,could, for the purpose of public resale, be deemed an “underwriter,” as that term is defined in the Securities Act of 1933, as amended, or the Securities Act. Our intention is to not write (sell) or buy put or call options to manage risks associated with the publicly traded securities of our portfolio companies, except that we maycould enter into hedging transactions to manage the risks associated with interest rate or foreign currency fluctuations. However, we maycould purchase or otherwise receive warrants to purchase the common stock of our portfolio companies in connection with acquisition financing or other investments. Similarly, in connection with an acquisition, we may acquire rights to require the issuers of acquired securities or their affiliates to repurchase them under certain circumstances. We also do not intend to acquire securities issued by any investment company in excess of the limits imposed by the 1940 Act. With regard to that portion of our portfolio invested in securities issued by investment companies, it should be noted that such investments mightmay subject our stockholders to additional expenses. None of these policies, or any of our other policies, is fundamental and each maycould be changed without stockholder approval. To the extent we adopt any fundamental policies; no person from whom we borrow will have, in his or her capacity as lender or debt holder, either a veto power or a vote in approving or changing any of our fundamental policies.
Qualifying Assets
Under the 1940 Act, a business development company may not acquireis restricted from acquiring any asset other than assets of the type listed in Section 55(a) of the 1940 Act, which are referred to as “qualifying assets,” unless, at the time the acquisition is made, qualifying assets represent at least 70% of the company’s total assets. The principal categories of qualifying assets relevant to our business are the following:
(1)Securities purchased in transactions not involving any public offering from the issuer of such securities, which issuer (subject to certain limited exceptions) is an eligible portfolio company, or from any person who is, or has been during the preceding 13 months, an affiliated person of an eligible portfolio company, or from any other person, subject to such rules as could be prescribed by the SEC. An eligible portfolio company is defined in the 1940 Act as any issuer that:
ais organized under the laws of, and has its principal place of business in, the United States;
bis not an investment company (other than a small business investment company, or SBIC, wholly owned by the business development company) or a company that would be an investment company but for certain exclusions under the 1940 Act; and
csatisfies either of the following:
idoes not have any class of securities listed on a national securities exchange or has any class of securities listed on a national securities exchange subject to a $250.0 million market capitalization maximum; or
iiis controlled by a business development company or a group of companies including a business development company, the business development company actually exercises a controlling influence over the management or policies of the eligible portfolio company, and, as a result, the business development company has an affiliated person who is a director of the eligible portfolio company.
(2)Securities of any eligible portfolio company which we control.
28
(3)Securities purchased in a private transaction from a U.S. issuer that is not an investment company or from an affiliated person of the issuer, or in transactions incident to such a private transaction, if the issuer is in bankruptcy and subject to reorganization or if the issuer, immediately prior to the purchase of its securities, was unable to meet its obligations as they came due without material assistance other than conventional lending or financing arrangements.
(4)Securities of an eligible portfolio company purchased from any person in a private transaction if there is no ready market for such securities and we already own 60% of the outstanding equity of the eligible portfolio company.
(5)Securities received in exchange for or distributed on or with respect to securities described above, or pursuant to the exercise of warrants or rights relating to such securities.
(6)Cash, cash equivalents, U.S. government securities or high-quality debt securities that mature in one year or less from the date of investment.
The regulations defining and interpreting qualifying assets maycan change over time. We maycould adjust our investment focus as needed to comply with and/or take advantage of any regulatory, legislative, administrative or judicial actions in this area.
We look through our consolidated subsidiaries to the underlying holdings (considered together with portfolio assets held outside of our consolidated subsidiaries) for purposes of determining compliance with the 70% qualifying assets requirement of the 1940 Act. At least 70% of our assets will be eligible assets.
Managerial Assistance to Portfolio Companies
A business development company must have been organized and have its principal place of business in the United States and must be operated for the purpose of making investments in the types of securities described in (1), (2) or (3) above. However, in order to count portfolio securities as qualifying assets for the purpose of the 70% test, the business development company must either control the issuer of the securities or must offer to make available to the issuer of the securities significant managerial assistance; except that, when the business development company purchases such securities in conjunction with one or more other persons acting together, one of the other persons in the group maycould make available such managerial assistance. Making available significant managerial assistance means any arrangement whereby the business development company, through its directors, officers or employees, offers to provide, and, if accepted, does so provide, significant guidance and counsel concerning the management, operations or business objectives and policies of a portfolio company. The Administrator or an affiliate of the Administrator provides such managerial assistance on our behalf to portfolio companies that request this assistance.
Temporary Investments
Pending investment in other types of qualifying assets, as described above, our investments maycould consist of cash, cash equivalents, U.S. government securities, repurchase agreements and high-quality debt investments that mature in one year or less from the date of investment, which we refer to, collectively, as temporary investments, so that 70% of our assets are qualifying assets or temporary investments. Typically, we will invest in U.S. Treasury bills or in repurchase agreements, so long as the agreements are fully collateralized by cash or securities issued by the U.S. government or its agencies. A repurchase agreement involves the purchase by an investor, such as us, of a specified security and the simultaneous agreement by the seller to repurchase it at an agreed-upon future date and at a price that is greater than the purchase price by an amount that reflects an agreed-upon interest rate. There is no percentage restriction on the proportion of our assets that maycould be invested in such repurchase agreements. However, if more than 25% of our total assets constitute repurchase agreements from a single counterparty, we would generally not meet the diversification tests described in section 851(b)(3) of the Code in order to qualify as a RIC for U.S. federal income tax purposes. Accordingly, we do not intend to enter into repurchase agreements with a single counterparty in excess of this limit. GC Advisors will monitor the creditworthiness of the counterparties with which we enter into repurchase agreement transactions.
Senior Securities
We are permitted, under specified conditions, to issue multiple classes of indebtedness and one class of stock senior to our common stock if our asset coverage, as that term is defined in the 1940 Act, is at least equal to 200% (or 150% upon receipt of certain approvals and subject to the requirement that we make an offer to repurchase the shares of our stockholders) immediately after each such issuance. Theissuance (or such other percentage as could be prescribed by
29
law from time to time). Prior to the enactment of the Small Business Credit Availability Act, or SBCAA, which was signed into law onin March 23, 2018, among other things, amended Section 61(a) of the 1940 Act to add a new Section 61(a)(2) that reduces the asset coverage requirement applicable to business development companies fromwas 200%. The SBCAA permits a business development company to be subject to an asset coverage requirement of 150% so long as the business development companyit meets certain disclosure requirements and obtains certain approvals. The reduced asset coverage requirement would permitpermits a business development company to have a ratio of total consolidated assets to outstanding indebtedness of 2:1 as compared to a maximum of 1:1 under the 200% asset coverage requirement. EffectivenessOn February 5, 2019, our stockholders voted to approve the application of the reduced asset coverage requirement to a business development company requires approval by either (1) a “required majority,” as definedrequirements in Section 57(o)61(a)(2) to us effective as of February 6, 2019. As a result of the stockholder approval, effective February 6, 2019, the asset coverage ratio under the 1940 Act of such business development company’s board of directors with effectiveness one year after the date of such approval or (2) a majority of votes cast at a special or annual meeting of such business development company’s stockholders at which a quorum is present, which is effective the day after such stockholder approval. On November 27, 2018, our board of directors recommended that we seek stockholder approvalapplicable to reduce our asset coverage requirementus decreased to 150% at our annual stockholder meeting scheduledfrom 200%. In other words, under the 1940 Act, we are now able to borrow $2 for February 5, 2019. To the extent stockholder approval is received, we currently intendinvestment purposes for every $1 of investor equity, as opposed to target a GAAP debt-to-equity ratioborrowing $1 for investment purposes for every $1 of about 1.0x.investor equity. In addition, while any senior securities remain outstanding, we must make provisions to prohibit any distribution to our stockholders or the repurchase of such securities or shares unless we meet the applicable asset coverage ratios at the time of the distribution or repurchase. We maycan also borrow amounts up to 5% of the value of our total assets for temporary or emergency purposes without regard to asset coverage, provided that any such borrowings in excess of 5% of the value of our total assets would be subject to the asset coverage ratio requirements of the 1940 Act, even if for temporary or emergency purposes. We consolidate our financial results with all of our wholly-owned subsidiaries, including the 2014 Issuer, BDC Holdings, GCIC Holdings, the 2018 Issuer, the GCIC 2018 Issuer, the 2020 Issuer, the 2018 CLO Depositor, the GCIC CLO Depositor, the 2020 CLO Depositor, Funding, Funding II, GCIC Funding, GCIC Funding II, the 2010 IssuerSenior Loan Funds and the 2014 Issuer,SBIC Funds for financial reporting purposes and measure our compliance with the leverage test applicable to business development companies under the 1940 Act on a consolidated basis. On September 13, 2011, we received exemptive relief from the SEC to permit us to exclude the debt of our SBIC subsidiaries from our 200% asset coverage test under the 1940 Act. As such, our ratio of total consolidated assets to outstanding indebtedness may be less than 200% even if we do not received stockholder approval to the modified asset coverage requirement permitted by Section 61(a)(2) of the 1940 Act. This provides us with increased investment flexibility but also increases our risks related to leverage.
For a discussion of the risks associated with leverage, see “Risk Factors — Risks Relating to our Business and Structure — Regulations governing our operation as a business development company affect our ability to, and the way in which we, raise additional capital. As a business development company, the necessity of raising additional capital exposes us to risks, including the typical risks associated with leverage.”
Codes of Ethics
We and GC Advisors have each adopted a code of ethics pursuant to Rule 17j-1 under the 1940 Act that establishes procedures for personal investments and restricts certain personal securities transactions. Personnel subject to each code maycan invest in securities for their personal investment accounts, including securities that maycan be purchased or held by us, so long as such investments are made in accordance with the code’s requirements. You maycan read and copy the code of ethics from our website at www.golubcapitalbdc.com, or from the SEC’s website at www.sec.gov, or at the SEC’s Public Reference Room in Washington, D.C.. See “Business — General — Information Available.” In addition, each code of ethics is attached as an exhibit to this annual report on Form 10-K.
Proxy Voting Policies and Procedures
We have delegated our proxy voting responsibility to GC Advisors. The proxy voting policies and procedures of GC Advisors are set out below. The guidelines are reviewed periodically by GC Advisors and our directors who are not “interested persons” and, accordingly, are subject to change.
Introduction
As an investment adviser registered under the Advisers Act, GC Advisors has a fiduciary duty to act solely in our best interests. As part of this duty, GC Advisors recognizes that it must vote our securities in a timely manner free of conflicts of interest and in our best interests.
GC Advisors’ policies and procedures for voting proxies for its investment advisory clients are intended to comply with Section 206 of, and Rule 206(4)-6 under, the Advisers Act.
Proxy Policies
GC Advisors votes proxies relating to our portfolio securities in what it perceives to be the best interest of our stockholders. GC Advisors reviews on a case-by-case basis each proposal submitted to a stockholder vote to determine its effect on the portfolio securities we hold. In most cases GC Advisors will vote in favor of proposals that GC Advisors believes are likely to increase the value of the portfolio securities we hold. Although GC Advisors will generally vote against proposals that maycould have a negative effect on our portfolio securities, GC Advisors maycould vote for such a proposal if there exist compelling long-term reasons to do so.
30
Our proxy voting decisions are made by GC Advisors’ chief executive officer and president. To ensure that GC Advisors’ vote is not the product of a conflict of interest, GC Advisors requires that (1) anyone involved in the decision-making process disclose to its chief compliance officer any potential conflict that he or she is aware of and any contact that he or she has had with any interested party regarding a proxy vote and (2) employees involved in the decision-making process or vote administration are prohibited from revealing how GC Advisors intends to vote on a proposal in order to reduce any attempted influence from interested parties. Where conflicts of interest may be present, GC Advisors will disclose such conflicts to us, including our independent directors, and maycould request guidance from us on how to vote such proxies.
Proxy Voting Records
You maycan obtain information without charge about how GC Advisors voted proxies during the most recent 12-month period ended September 30, 20182021 by making a written request for proxy voting information to: Golub Capital BDC, Inc., Attention: Investor Relations, 666 Fifth200 Park Avenue, 18th25th Floor, New York, NY 10103,10166, or by calling Golub Capital BDC, Inc. collect at (212) 750-6060.
Privacy Principles
We are committed to maintaining the privacy of our stockholders and to safeguarding their nonpublic personal information. The following information is provided to help you understand what personal information we collect, how we protect that information and why, in certain cases, we may share information with select other parties.
We restrict access to nonpublic personal information about our stockholders to employees of GC Advisors and its affiliates with a legitimate business need for the information. We will maintain physical, electronic and procedural safeguards designed to protect the nonpublic personal information of our stockholders.
Other
Under the 1940 Act, we are required to provide and maintain a bond issued by a reputable fidelity insurance company to protect us against larceny and embezzlement. Furthermore, as a business development company, we are prohibited from protecting any director or officer against any liability to us or our stockholders arising from willful misfeasance, bad faith, gross negligence or reckless disregard of the duties involved in the conduct of such person’s office.
We and GC Advisors are required to adopt and implement written policies and procedures reasonably designed to prevent violation of relevant federal securities laws, review these policies and procedures annually for their adequacy and the effectiveness of their implementation, and designate a chief compliance officer to be responsible for administering these policies and procedures.
We maycould also be prohibited under the 1940 Act from knowingly participating in certain transactions with our affiliates without the prior approval of our board of directors who are not interested persons and, in some cases, prior approval by the SEC. The SEC has interpreted the business development company prohibition on transactions with affiliates to prohibit “joint transactions” among entities that share a common investment adviser. The staff of the SEC has granted no-action relief pursuant to which purchases by us and other accounts sponsored or managed by GC Advisors or its affiliates of a single class of privately placed securities are permitted provided that the adviser negotiates no term other than price and certain other conditions are met. Any co-investment would be made subject to compliance with existing regulatory guidance, applicable regulations and our allocation procedures. If opportunities arise that would otherwise be appropriate for us and for another account sponsored or managed by GC Advisors to make different investments in the same issuer, GC Advisors will need to decide which account will proceed with the investment. Moreover, in certain circumstances, we maycould be unable to invest in an issuer in which another account sponsored or managed by GC Advisors has previously invested.
On February 27, 2017, GC Advisors and certain other funds and accounts sponsored or managed by GC Advisors and its affiliates, received exemptive relief from the SEC that permits us greater flexibility to negotiate the terms of co-investments if our board of directors determines that it would be advantageous for us to co-invest with other accounts sponsored or managed by GC Advisors or its affiliates in a manner consistent with our investment objectives, positions, policies, strategies and restrictions as well as regulatory requirements and other pertinent factors. We believe that co-investment by us and accounts sponsored or managed by the GC Advisors and its affiliates maycould afford us additional investment opportunities and the ability to achieve greater diversification. Under the terms of this exemptive relief, a “required majority” (as defined in Section 57(o) of the 1940 Act) of our independent directors is required to make certain conclusions in connection with a co-investment transaction, including that (1) the terms of the proposed transaction are reasonable and fair to us and our stockholders and do not involve
31
overreaching of us or our stockholders on the part of any person concerned and (2) the transaction is consistent with the interests of our stockholders and is consistent with our investment strategies and policies.
Sarbanes-Oxley Act
The Sarbanes-Oxley Act of 2002, as amended, or the Sarbanes-Oxley Act, imposes a variety of regulatory requirements on companies with a class of securities registered under the Securities Exchange Act of 1934, as amended, or the Exchange Act, and their insiders. Many of these requirements affect us. For example:
•pursuant to Rule 13a-14 under the Exchange Act our principal executive officer and principal financial officer must certify the accuracy of the financial statements contained in our periodic reports;
•pursuant to Item 307 under Regulation S-K under the Securities Act our periodic reports must disclose our conclusions about the effectiveness of our disclosure controls and procedures;
•pursuant to Rule 13a-15 under the Exchange Act, our management must prepare an annual report regarding its assessment of our internal control over financial reporting, which must be audited by our independent registered public accounting firm; and
•pursuant to Item 308 of Regulation S-K under the Securities Act and Rule 13a-15 under the Exchange Act, our periodic reports must disclose whether there were significant changes in our internal controls over financial reporting or in other factors that could significantly affect these controls subsequent to the date of their evaluation, including any corrective actions with regard to significant deficiencies and material weaknesses.
The Sarbanes-Oxley Act requires us to review our current policies and procedures to determine whether we comply with the Sarbanes-Oxley Act and the regulations promulgated under such act. We will continue to monitor
our compliance with all regulations that are adopted under the Sarbanes-Oxley Act and will take actions necessary to ensure that we comply with that act.
Small Business Investment Company Regulations
The SBIC Funds each havehad investment objectives substantially similar to ours and makemade similar types of investments in accordance with SBIC regulations.
32
$19.5 million and havehad average annual net income after U.S. federal income taxes not exceeding $6.5 million (average net income to be computed without benefit of any carryover loss) for the two most recent fiscal years. In addition, anthe SBIC mustFunds were required to devote 25% of itstheir respective investment activity to “smaller” concerns, as defined by the SBA. A smaller concern generally includesincluded businesses that have a tangible net worth not exceeding $6.0 million and have average annual net income after U.S. federal income taxes not exceeding $2.0 million (average net income to be computed without benefit of any net carryover loss) for the two most recent fiscal years. SBIC regulations also provideprovided alternative size standard criteria to determine eligibility for designation as an eligible small business or smaller concern, which criteria depend on the primary industry in which the business is engaged and are based on such factors as the number of employees and gross revenue. However, once an SBIC has invested in
Material U.S. Federal Income Tax Considerations
The following discussion is a company, it may continue to make follow on investments in the company, regardlessgeneral summary of the sizematerial U.S. federal income tax considerations applicable to us and to an investment in our shares of common stock. This summary does not purport to be a complete description of the company at the time of the follow on investment, upincome tax considerations applicable to the time of the company’s initial public offering, if any.
•a citizen or individual resident of the SBA norUnited States;
•a corporation, or other entity treated as a corporation for U.S. federal income tax purposes, created or organized in or under the U.S. governmentlaws of the United States or any state thereof or the District of Columbia;
•an estate, the income of which is subject to U.S. federal income taxation regardless of its agenciessource; or officers
•a trust if either a U.S. court can exercise primary supervision over its administration and one or more U.S. persons have the authority to control all of its substantial decisions or the trust was in existence on August 20, 1996, was treated as a U.S. person prior to that date, and has approved any ownership interestmade a valid election to be issued by us or any obligation that we or anytreated as a U.S. person.
A “Non-U.S. stockholder” is a beneficial owner of shares of our subsidiaries may incur.common stock that is not a U.S. stockholder.
If a partnership (including an entity treated as a partnership for U.S. federal income tax purposes) holds shares of our common stock, the tax treatment of a partner in the partnership will generally depend upon the status of the partner and the activities of the partnership. A prospective investor that is a partner in a partnership that will hold shares of our common stock should consult its tax advisors with respect to the purchase, ownership and disposition of shares of our common stock.
Tax matters are very complicated and the tax consequences to an investor of an investment in our shares of common stock will depend on the facts of his, her or its particular situation. We encourage investors to consult their own tax advisors regarding the specific consequences of such an investment, including tax reporting requirements, the applicability of U.S. federal, state, local and foreign tax laws, eligibility for the benefits of any applicable tax treaty, and the effect of any possible changes in the tax laws.
33
Election to Be Taxed as a RIC
As a business development company, we have elected to be treated as a RIC under Subchapter M of the Code. As a RIC, we generally will not be subject to corporate-level U.S. federal income taxes on any net ordinary income or capital gains that we timely distribute as dividends for U.S. federal income tax purposes to our stockholders. To qualify as a RIC, we must, among other things, meet certain source-of-income and asset diversification requirements (as described below). In addition, we must distribute to our stockholders, for each taxable year, dividends for U.S. federal income tax purposes of an amount at least equal to 90% of our “investment company taxable income,” which is generally our net ordinary income plus the excess of realized net short-term capital gains over realized net long-term capital losses and determined without regard to any deduction for dividends paid, or the Annual Distribution Requirement. Although not required for us to maintain our RIC tax status, in order to preclude the imposition of a 4% nondeductible federal excise tax imposed on RICs, we must distribute dividends for U.S. federal income tax purposes to our stockholders in respect of each calendar year of an amount at least equal to the sum of (1) 98% of our net ordinary income (taking into account certain deferrals and elections) for the calendar year, (2) 98.2% of the excess (if any) of our realized capital gains over our realized capital losses, or capital gain net income (adjusted for certain ordinary losses), generally for the one-year period ending on October 31 of the calendar year and (3) the sum of any net ordinary income plus capital gains net income for preceding years that were not distributed during such years and on which we did not incur any liability to pay federal income tax, or the Excise Tax Avoidance Requirement.
Taxation as a RIC
If we:
•qualify as a RIC; and
•satisfy the Annual Distribution Requirement;
then we will not be subject to U.S. federal income tax on the portion of our investment company taxable income and net capital gain, defined as net long-term capital gains in excess of net short-term capital losses, we distribute as dividends for U.S. federal income tax purposes to our stockholders. We will be subject to U.S. federal income tax at regular corporate rates on any net income or net capital gain not distributed as dividends to our stockholders.
In order to qualify as a RIC for U.S. federal income tax purposes, we must, among other things:
•qualify to be treated as a business development company under the 1940 Act at all times during each taxable year;
•derive in each taxable year at least 90% of our gross income from dividends, interest, payments with respect to certain securities loans, gains from the sale of stock or other securities, or other income derived with respect to our business of investing in such stock or securities, and net income derived from interests in “qualified publicly traded partnerships” (partnerships that are traded on an established securities market or tradable on a secondary market, other than partnerships that derive 90% of their income from interest, dividends and other permitted RIC income), or the 90% Income Test; and
•diversify our holdings, or the Diversification Tests, so that at the end of each quarter of the taxable year:
◦at least 50% of the value of our assets consists of cash, cash equivalents, U.S. government securities, securities of other RICs, and other securities if such other securities of any one issuer do not represent more than 5% of the value of our assets or more than 10% of the outstanding voting securities of the issuer; and
◦no more than 25% of the value of our assets is invested in the securities, other than U.S. government securities or securities of other RICs, of one issuer or of two or more issuers that are controlled, as determined under applicable tax rules, by us and that are engaged in the same or similar or related trades or businesses or in the securities of one or more qualified publicly traded partnerships.partnerships (the “Diversification Tests”).
We maycan invest in partnerships, including qualified publicly traded partnerships, which maycould result in our being subject to state, local or foreign income, franchise or other tax liabilities.
34
In addition, we are subject to ordinary income and capital gain distribution requirements under U.S. federal excise tax rules for each calendar year. If we do not meet the required distributions we will be subject to a 4% nondeductible federal excise tax on the undistributed amount. The failure to meet U.S. federal excise tax distribution requirements will not cause us to lose our RIC status. The failure to meet U.S. federal excise tax distribution requirements will not cause us to lose our RIC status, and we could choose to retain taxable income or capital gains in excess of current year distributions into the next tax year in an amount less than what would trigger payments of federal income tax under Subchapter M of the Code. We could then be required to pay a 4% excise tax on such income or capital gains.
A RIC is limited in its ability to deduct expenses in excess of its investment company taxable income. If our deductible expenses in a given taxable year exceed our investment company taxable income, we may incur a net operating loss for that taxable year. However, a RIC is not permitted to carry forward net operating losses to subsequent taxable years and such net operating losses do not pass through to its stockholders. In addition, deductible expenses can be used only to offset investment company taxable income, not net capital gain. A RIC may notcannot use any net capital losses (that is, the excess of realized capital losses over realized capital gains) to offset its investment company taxable income, but may carry forward such net capital losses, and use them to offset future capital gains, indefinitely. Due to these limits on deductibility of expenses and net capital losses, we maycould for tax purposes have aggregate taxable income for several taxable years that we are required to distribute and that is taxable to our stockholders even if such taxable income is greater than the net income we actually earn during those taxable years. Furthermore, a portfolio company in which we hold equity or debt instruments may face financial difficulty that requires us to work out, modify, or otherwise restructure such equity or debt instruments. Any such restructuring could, depending upon the terms of the restructuring, cause us to incur unusable or nondeductible losses or recognize future non-cash taxable income. Any underwriting fees paid by us are not deductible in computing our investment company taxable income.deductible. We maycould be required to recognize taxable income in circumstances in which we do not receive cash. For example, if we hold debt instrumentsobligations that are treated under applicable tax rules as having original issue discount (such as debt instruments with PIK interest or, in certain cases, with increasing interest rates or issued with warrants), we must include in income each year a portion of the original issue discount that accrues over the life of the obligation, regardless of whether cash representing such income is received by us in the same taxable year. Because any original issue discount accrued will be included in our investment company taxable income for the taxable year of accrual, we maycould be required to make a distribution to our stockholders in order to satisfy the Annual Distribution Requirement, even though we will not have received any corresponding cash amount. Furthermore, a portfolio company in which we hold equity or debt instruments could face financial difficulty that requires us to work out, modify, or otherwise restructure such equity or debt instruments. Any such restructuring could, depending upon the terms of the restructuring, cause us to incur unusable or nondeductible losses or recognize future non-cash taxable income.
Certain of our investment practices maycould be subject to special and complex U.S. federal income tax provisions that may,could, among other things, (1) treat dividends that would otherwise constitute qualified dividend income as non-qualified dividend income, (2) treat dividends that would otherwise be eligible for the corporate dividends received deduction as ineligible for such treatment, (3) disallow, suspend or otherwise limit the allowance of certain losses or deductions, (4) convert lower-taxed long-term capital gain into higher-taxed short-term capital gain or ordinary income, (5) convert an ordinary loss or a deduction into a capital loss (the deductibility of which is more limited), (6) cause us to recognize income or gain without a corresponding receipt of cash, (7) adversely affect the time as to when a purchase or sale of stock or securities is deemed to occur, (8) adversely alter the characterization of certain complex financial transactions and (9) produce income that will not be qualifying income for purposes of the 90% Income Test. We intend to monitor our transactions and maycould make certain tax elections to mitigate the effect of these provisions and prevent our ability to be subject to tax as a RIC.
We can invest a portion of our net assets in below investment grade instruments. Investments in these types of instruments can present special tax issues for us. U.S. federal income tax rules are not entirely clear about issues such as when we can cease to accrue interest, original issue discount or market discount, when and to what extent deductions can be taken for bad debts or worthless instruments, how payments received on obligations in default should be allocated between principal and income and whether exchanges of debt obligations in a bankruptcy or workout context are taxable. We intend to address these and other issues to the extent necessary in order to seek to ensure that we distribute sufficient income to avoid any material U.S. federal income or the 4% nondeductible U.S. federal excise tax.
Gain or loss realized by us from warrants acquired by us as well as any loss attributable to the lapse of such warrants generally will be treated as capital gain or loss. Such gain or loss generally will be long term or short term, depending on how long we held a particular warrant.
35
Our investment in non-U.S. securities could be subject to non-U.S. income, withholding and other taxes. In that case, our yield on those securities would be decreased. U.S. stockholders generally will not be entitled to claim a U.S. foreign tax credit or deduction with respect to non-U.S. taxes paid by us.
If we acquire shares in a passive foreign investment company (“PFIC”), we could be subject to U.S. federal income tax on a portion of any “excess distribution” received on, or any gain from the disposition of, such shares even if we distribute such income as a taxable dividend to stockholders. Additional charges in the nature of interest generally will be imposed on us in respect of deferred taxes arising from any such excess distribution or gain. If we invest in the shares of a PFIC and elect to treat the PFIC as a “qualified electing fund” under the Code (a “QEF”), in lieu of the foregoing requirements, we will be required to include in income each year our proportionate share of the ordinary earnings and net capital gain of the QEF, even if such income is not distributed by the QEF. Alternatively, we could elect to mark our shares in a PFIC at the end of each taxable year to market; in this case, we will recognize as ordinary income any increase in the value of such shares, and as ordinary loss any decrease in such value to the extent that any such decrease does not exceed prior increases in such value included in our income. Our ability to make either election will depend on factors beyond our control, and is subject to restrictions which could limit the availability of the benefit of these elections. Under either election, we could be required to recognize in a taxable year income in excess of any distributions we receive from PFICs and any proceeds from dispositions of PFIC stock during that taxable year, and such income will nevertheless be subject to the Annual Distribution Requirement and will be taken into account for purposes of determining whether we satisfy the distribution requirements under U.S. federal excise tax rules.
Under Section 988 of the Code, gains or losses attributable to fluctuations in exchange rates between the time we accrue income, expenses or other liabilities denominated in a foreign currency and the time we actually collect such income or pay such expenses or liabilities are generally treated as ordinary income or loss. Similarly, gains or losses on foreign currency-denominated forward, futures and option contracts, as well as certain other financial instruments, and the disposition of debt obligations denominated in a foreign currency, to the extent attributable to fluctuations in exchange rates between the acquisition and disposition dates, are also treated as ordinary income or loss.
Although we do not presently expect to do so, we are authorized to borrow funds and to sell assets in order to satisfy distribution requirements. However, under the 1940 Act, we are not permitted to make distributions to our
stockholders while our debt obligations and other senior securities are outstanding unless certain “asset coverage” tests are met. See “Business — Regulation — Senior Securities.” Moreover, our ability to dispose of assets to meet our distribution requirements may be limited by (1) the illiquid nature of our portfolio and/or (2) other requirements relating to our qualification as a RIC, including the Diversification Tests. If we dispose of assets in order to meet the Annual Distribution Requirement or the Excise Tax Avoidance Requirement, we may make such dispositions at times that, from an investment standpoint, are not advantageous.
Some of the income and fees that we may recognize, such as fees for providing managerial assistance, certain fees earned with respect to our investments, income recognized for in a work-out or restructuring of a portfolio investment, or income recognized from an equity investment in an operating partnership, will not satisfy the 90% Income Test. In order to manage the risk that such income and fees might disqualify us as a RIC for a failure to satisfy the 90% Income Test, we may be required to recognize such income and fees indirectly through one or more entities treated as corporations for U.S. federal income tax purposes. Such corporations will be subject to U.S. corporate income tax as well as state and local tax on their earnings, which ultimately will reduce our return on such income and fees.
Failure to Qualify as a RIC
If we were unable to qualify for treatment as a RIC and are unable to cure the failure, for example, by disposing of certain investments quickly or raising additional capital to prevent the loss of RIC status, we generally would be subject to tax on all of our taxable income at regular corporate rates. The Code provides some relief from RIC disqualification due to failures to comply with the 90% Income Test and the Diversification Tests, although there maycould be additional taxes due in such cases. We cannot assure you that we would qualify for any such relief should we fail the 90% Income Test or the Diversification Tests.
Should failure occur, not only would all our taxable income be subject to tax at regular corporate rates, we would not be able to deduct dividend distributions to stockholders, nor would they be required to be made. Distributions, including distributions of net long-term capital gain, would generally be taxable to our stockholders as ordinary
36
dividend income to the extent of our current and accumulated earnings and profits. Subject to certain limitations under the Code, certain corporate stockholders would be eligible to claim dividends received deduction with respect to such dividends and non-corporate stockholders would generally be able to treat such dividends as “qualified dividend income,” which is subject to reduced rates of U.S. federal income tax. Distributions in excess of our current and accumulated earnings and profits would be treated first as a return of capital to the extent of the stockholder’s tax basis, and any remaining distributions would be treated as a capital gain. If we fail to qualify as a RIC, we maycould be subject to regular corporate tax on any net built-in gains with respect to certain of our assets (i.e., the excess of the aggregate gains, including items of income, over aggregate losses that would have been realized with respect to such assets if we had been liquidated) that we elect to recognize on requalification or when recognized over the next five taxable years.
The remainder of this discussion assumes that we qualify as a RIC and have satisfied the Annual Distribution Requirement.
Taxation of U.S. Stockholders
Distributions by us generally are taxable to U.S. stockholders as ordinary income or capital gains. Distributions of our “investment company taxable income” (which is, generally, our net ordinary income plus net short-term capital gains in excess of net long-term capital losses) will be taxable as ordinary income to U.S. stockholders to the extent of our current or accumulated earnings and profits, whether paid in cash or reinvested in additional shares of our common stock. To the extent such distributions paid by us to non-corporate stockholders (including individuals) are attributable to dividends from U.S. corporations and certain qualified foreign corporations and if certain holding period requirements are met, such distributions generally will be treated as qualified dividend income and generally eligible for a maximum U.S. federal tax rate of either 15% or 20%, depending on whether the individual shareholder’s income exceeds certain threshold amounts, and if other applicable requirements are met, such distributions generally will be eligible for the corporate dividends received deduction to the extent such dividends have been paid by a U.S. corporation. In this regard, it is anticipated that distributions paid by us will generally not be attributable to dividends and, therefore, generally will not qualify for the preferential maximum U.S. federal tax rate applicable to non-corporate stockholders as well as will not be eligible for the corporate dividends received deduction.
Distributions of our net capital gains (which is generally our realized net long-term capital gains in excess of realized net short-term capital losses) properly designated by us as “capital gain dividends” will be taxable to a U.S. stockholder as long-term capital gains (currently generally at a maximum rate of either 15% or 20%, depending on whether the individual shareholder’s income exceeds certain threshold amounts) in the case of individuals, trusts or estates, regardless of the U.S. stockholder’s holding period for his, her or its common stock and regardless of whether paid in cash or reinvested in additional common stock. Distributions in excess of our earnings and profits first will reduce a U.S. stockholder’s adjusted tax basis in such stockholder’s common stock and, after the adjusted basis is reduced to zero, will constitute capital gains to such U.S. stockholder. Stockholders receiving dividends or distributions in the form of additional shares of our common stock purchased in the market should be treated for U.S. federal income tax purposes as receiving a distribution in an amount equal to the amount of money that the stockholders receiving cash dividends or distributions will receive, and should have a cost basis in the shares received equal to such amount. Stockholders receiving dividends in newly issued shares of our common stock will be treated as receiving a distribution equal to the value of the shares received, and should have a cost basis of such amount.
Although we currently intend to distribute any net capital gains at least annually, we can in the future decide to retain some or all of our net capital gains but designate the retained amount as a “deemed distribution.” In that case, among other consequences, we will pay tax on the retained amount, each U.S. stockholder will be required to include their share of the deemed distribution in income as if it had been distributed to the U.S. stockholder, and the U.S. stockholder will be entitled to claim a credit equal their allocable share of the tax paid on the deemed distribution by us. The amount of the deemed distribution net of such tax will be added to the U.S. stockholder’s tax basis for their common stock. Since we expect to pay tax on any retained net capital gains at our regular corporate tax rate, and since that rate is in excess of the maximum rate currently payable by individuals on long-term capital gains, the amount of tax that individual stockholders will be treated as having paid and for which they will receive a credit will exceed the tax they owe on the retained net capital gain. Such excess generally could be claimed as a credit against the U.S. stockholder’s other U.S. federal income tax obligations or could be refunded to the extent it exceeds a stockholder’s liability for U.S. federal income tax. A stockholder that is not subject to U.S. federal income
37
tax or otherwise required to file a U.S. federal income tax return would be required to file a U.S. federal income tax return on the appropriate form in order to claim a refund for the taxes we paid. In order to utilize the deemed distribution approach, we must provide written notice to our stockholders prior to the expiration of 60 days after the close of the relevant taxable year. We cannot treat any of our investment company taxable income as a “deemed distribution.”
For purposes of determining (1) whether the Annual Distribution Requirement is satisfied for any tax year and (2) the amount of capital gain dividends paid for that tax year, we could, under certain circumstances, elect to treat a dividend that is paid during the following tax year as if it had been paid during the tax year in question. If we make such an election, the U.S. stockholder will still be treated as receiving the dividend in the tax year in which the distribution is made. However, any dividend declared by us in October, November or December of any calendar year, payable to stockholders of record on a specified date in such a month and actually paid during January of the following calendar year, will be treated as if it had been received by our U.S. stockholders on December 31 of the calendar year in which the dividend was declared.
If an investor purchases shares of our common stock shortly before the record date of a distribution, the price of the shares of our common stock will include the value of the distribution and the investor will be subject to tax on the distribution even though it represents a return of their investment.
A stockholder generally will recognize taxable gain or loss if the stockholder sells or otherwise disposes of their shares of our common stock. Any gain arising from such sale or disposition generally will be treated as long-term capital gain or loss if the stockholder has held their shares of common stock for more than one year. Otherwise, it would be classified as short-term capital gain or loss. However, any capital loss arising from the sale or disposition of shares of our common stock held for six months or less will be treated as long-term capital loss to the extent of the amount of capital gain dividends received, or undistributed capital gain deemed received, with respect to such shares. In addition, all or a portion of any loss recognized upon a disposition of shares of our common stock could be disallowed if other shares of our common stock are purchased (whether through reinvestment of distributions or otherwise) within 30 days before or after the disposition. In such a case, the basis of the common stock acquired will be increased to reflect the disallowed loss.
In general, individual U.S. stockholders are subject to a maximum U.S. federal income tax rate of either 15% or 20% (depending on whether the individual U.S. stockholder’s income exceeds certain threshold amounts) on their net capital gain, i.e., the excess of realized net long-term capital gain over realized net short-term capital loss for a taxable year, including a long-term capital gain derived from an investment in our shares of common stock. Such rate is lower than the maximum federal income tax rate on ordinary taxable income currently payable by individuals. Corporate U.S. stockholders currently are subject to U.S. federal income tax on net capital gain at the maximum 21% rate also applied to ordinary income. Non-corporate stockholders incurring net capital losses for a tax year (i.e., net capital losses in excess of net capital gains) generally can deduct up to $3,000 of such losses against their ordinary income each tax year; any net capital losses of a non-corporate stockholder in excess of $3,000 generally could be carried forward and used in subsequent tax years as provided in the Code. Corporate stockholders generally cannot deduct any net capital losses for a tax year, but can carry back such losses for three tax years or carry forward such losses for five tax years.
We will send to each of our U.S. stockholders, as promptly as possible after the end of each calendar year, a notice detailing, on a per share and per distribution basis, the amounts includible in such U.S. stockholder’s taxable income for such year as ordinary income and as long-term capital gain. In addition, the U.S. federal tax status of each calendar year’s distributions generally will be reported to the IRS. Distributions can also be subject to additional state, local and foreign taxes depending on a U.S. stockholder’s particular situation. Dividends distributed by us generally will not be eligible for the dividends-received deduction or the lower tax rates applicable to certain qualified dividends.
Until and unless we are treated as a “publicly offered regulated investment company” (within the meaning of Section 67 of the Code) as a result of either (i) shares of our common stock and our preferred stock collectively being held by at least 500 persons at all times during a taxable year or (ii) shares of our common stock being treated as regularly traded on an established securities market for any taxable year, for purposes of computing the taxable income of U.S. stockholders that are individuals, trusts or estates, (i) our earnings will be computed without taking into account such U.S. stockholders’ allocable shares of the management and incentive fees paid to our investment adviser and certain of our other expenses, (ii) each such U.S. stockholder will be treated as having received or accrued a dividend from us in the amount of such U.S. stockholder’s allocable share of these fees and expenses for
38
such taxable year, (iii) each such U.S. stockholder will be treated as having paid or incurred such U.S. stockholder’s allocable share of these fees and expenses for the calendar year and (iv) each such U.S. stockholder’s allocable share of these fees and expenses will be treated as miscellaneous itemized deductions by such U.S. stockholder. For taxable years beginning before 2026, miscellaneous itemized deductions generally are not deductible by a U.S. stockholder that is an individual, trust or estate. For taxable years beginning in 2026 or later, miscellaneous itemized deductions are deductible only to the extent that the aggregate of such U.S. stockholder’s miscellaneous itemized deductions exceeds 2% of such U.S. stockholder’s adjusted gross income for U.S. federal income tax purposes, are not deductible for purposes of determining a U.S. stockholder’s liability for the U.S. federal alternative minimum tax and are subject to the overall limitation on itemized deductions under Section 68 of the Code.
Backup withholding, currently at a rate of 24%, could be applicable to all taxable distributions to any non-corporate U.S. stockholder (1) who fails to furnish us with a correct taxpayer identification number or a certificate that such stockholder is exempt from backup withholding or (2) with respect to whom the IRS notifies us that such stockholder has failed to properly report certain interest and dividend income to the IRS and to respond to notices to that effect. An individual’s taxpayer identification number is his or her social security number. Any amount withheld under backup withholding is not an additional tax and is generally allowed as a credit against the U.S. stockholder’s U.S. federal income tax liability and could entitle such stockholder to a refund, provided that proper information is timely provided to the IRS.
If a U.S. stockholder recognizes a loss with respect to shares of our common stock of $2 million or more for an individual stockholder or $10 million or more for a corporate stockholder, the stockholder must file with the IRS a disclosure statement on Form 8886. Direct stockholders of portfolio securities are in many cases exempted from this reporting requirement, but under current guidance, stockholders of a RIC are not exempted. The fact that a loss is reportable under these regulations does not affect the legal determination of whether the taxpayer’s treatment of the loss is proper. U.S. stockholders should consult their tax advisors to determine the applicability of these regulations in light of their specific circumstances.
An additional 3.8% Medicare tax is imposed on certain net investment income (including ordinary dividends and capital gain distributions received from us and net gains from redemptions or other taxable dispositions of our shares) of U.S. individuals, estates and trusts to the extent that such person’s “modified adjusted gross income” (in the case of an individual) or “adjusted gross income” (in the case of an estate or trust) exceed certain threshold amounts.
Taxation of Non-U.S. Stockholders
Whether an investment in the shares of our common stock is appropriate for a Non-U.S. stockholder will depend upon that person’s particular circumstances. An investment in the shares of our common stock by a Non-U.S. stockholder could have adverse tax consequences. Non-U.S. stockholders should consult their tax advisors before investing in our common stock.
Subject to the discussion below, distributions of our “investment company taxable income” to Non-U.S. stockholders (including interest income, net short-term capital gain or foreign-source dividend and interest income, which generally would be free of withholding if paid to Non-U.S. stockholders directly) will be subject to withholding of U.S. federal tax at a 30% rate (or lower rate provided by an applicable treaty) to the extent of our current and accumulated earnings and profits unless the distributions are effectively connected with a U.S. trade or business of the Non-U.S. stockholder, in which case the distributions will generally be subject to U.S. federal income tax at the rates applicable to U.S. persons. In that case, we will not be required to withhold U.S. federal tax if the Non-U.S. stockholder complies with applicable certification and disclosure requirements. Special certification requirements apply to a Non-U.S. stockholder that is a foreign partnership or a foreign trust, and such entities are urged to consult their own tax advisors.
Certain properly-designated dividends received by a Non-U.S. stockholder generally are exempt from U.S. federal withholding tax when they (1) are paid in respect of our “qualified net interest income” (generally, our U.S. source interest income, other than certain contingent interest and interest from obligations of a corporation or partnership in which we or the non-U.S. stockholder are at least a 10% stockholder, reduced by expenses that are allocable to such income), or (2) are paid in connection with our “qualified short-term capital gains” (generally, the excess of our net short-term capital gain over our long-term capital loss for a tax year) as well as if certain other requirements are satisfied. Nevertheless, it should be noted that in the case of shares of our stock held through an intermediary, the intermediary could have withheld U.S. federal income tax even if we designated the payment as an interest-related
39
dividend or short-term capital gain dividend. Moreover, depending on the circumstances, we could designate all, some or none of our potentially eligible dividends as derived from such qualified net interest income or as qualified short-term capital gains, or treat such dividends, in whole or in part, as ineligible for this exemption from withholding.
Actual or deemed distributions of our net capital gains to a Non-U.S. stockholder, and gains realized by a Non-U.S. stockholder upon the sale of our common stock, will not be subject to federal withholding tax and generally will not be subject to U.S. federal income tax unless the distributions or gains, as the case could be, are effectively connected with a U.S. trade or business of the Non-U.S. stockholder and, if an income tax treaty applies, are attributable to a permanent establishment maintained by the Non-U.S. stockholder in the United States or, in the case of an individual Non-U.S. stockholder, the stockholder is present in the United States for 183 days or more during the year of the sale or capital gain dividend and certain other conditions are met.
If we distribute our net capital gains in the form of deemed rather than actual distributions (which we could do in the future), a Non-U.S. stockholder will be entitled to a U.S. federal income tax credit or tax refund equal to the stockholder’s allocable share of the tax we pay on the capital gains deemed to have been distributed. In order to obtain the refund, the Non-U.S. stockholder must obtain a U.S. taxpayer identification number and file a U.S. federal income tax return even if the Non-U.S. stockholder would not otherwise be required to obtain a U.S. taxpayer identification number or file a U.S. federal income tax return. For a corporate Non-U.S. stockholder, distributions (both actual and deemed), and gains realized upon the sale of our common stock that are effectively connected with a U.S. trade or business could, under certain circumstances, be subject to an additional “branch profits tax” at a 30% rate (or at a lower rate if provided for by an applicable treaty).
A Non-U.S. stockholder who is a non-resident alien individual, and who is otherwise subject to withholding of U.S. federal income tax, could be subject to information reporting and backup withholding of U.S. federal income tax on dividends unless the Non-U.S. stockholder provides us or the dividend paying agent with a U.S. nonresident withholding tax certification (e.g., an IRS Form W-8BEN, IRS Form W-8BEN-E, or an acceptable substitute form) or otherwise meets documentary evidence requirements for establishing that it is a Non-U.S. stockholder or otherwise establishes an exemption from backup withholding.
Pursuant to the Foreign Account Tax Compliance Act, or FATCA, the applicable withholding agent is generally required to withhold U.S. tax (at a 30% rate) with respect to payments of dividends made to certain non-U.S. entities that fail to comply (or be deemed compliant) with extensive reporting and withholding requirements designed to inform the U.S. Department of the Treasury of U.S.-owned foreign investment accounts. The information required to be reported include the identity and taxpayer identification number of each account holder and transaction activity within the holder’s account. Stockholders could be requested to provide additional information to enable the applicable withholding agent to determine whether withholding is required.
An investment in shares by a non-U.S. person could also be subject to U.S. federal estate tax. Non-U.S. persons should consult their own tax advisors with respect to the U.S. federal income tax, U.S. federal estate tax, withholding tax, and state, local and foreign tax consequences of acquiring, owning or disposing of our common stock.
40
Item 1A. Risk Factors
You should carefully consider these risk factors, together with all of the other information included in this annual report on Form 10-K and the other reports and documents filed by us with the SEC. The risks set out below are not the only risks we face. Additional risks and uncertainties not presently known to us or not presently deemed material by us maycould also impair our operations and performance. If any of the following events occur, our business, financial condition, results of operations and cash flows could be materially and adversely affected. In such case, our net asset value and the trading price of our common stock could decline, and you maycould lose all or part of your investment. The risk factors described below are the principal risk factors associated with an investment in us as well as those factors generally associated with an investment company with investment objectives, investment policies, capital structure or trading markets similar to ours.
Risks Relating to Our Business and Structure
We are subject to risks associated with the current interest rate environment and to the extent we use debt to finance our investments, changes in interest rates will affect our cost of capital and net investment income.
To the extent we borrow money or issue debt securities or preferred stock to make investments, our net investment income will depend, in part, upon the difference between the rate at which we borrow funds or pay interest or dividends on such debt securities or preferred stock and the rate at which we invest these funds. In addition, many of our debt investments and borrowings have floating interest rates that reset on a periodic basis, and many of our investments are subject to interest rate floors. As a result, a change in market interest rates could have a material adverse effect on our net investment income, in particular with respect to increases from current levels to the level of the interest rate floors on certain investments. In periods of rising interest rates, our cost of funds will increase because the interest rates on the majority of amounts we have borrowed under our credit facilities or other financing arrangements are typically floating, which could reduce our net investment income to the extent any debt investments have fixed interest rates, and the interest rate on investments with an interest rate floor above current levels will not increase until interest rates exceed the applicable floor.
We maycan use interest rate risk management techniques in an effort to limit our exposure to interest rate fluctuations. Such techniques maycould include various interest rate hedging activities to the extent permitted by the 1940 Act and applicable commodities laws. These activities maycould limit our ability to participate in the benefits of lower interest rates with respect to the hedged borrowings. Adverse developments resulting from changes in interest rates or hedging transactions could have a material adverse effect on our business, financial condition and results of operations.
You should also be aware that a rise in the general level of interest rates typically will lead to higher interest rates applicable to our debt investments, which maycould result in an increase of the amount of incentive fees payable to GC Advisors. In addition, a decline in the prices of the debt we own could adversely affect our net asset value. Also, an increase in interest rates available to investors could make an investment in our common stock less attractive if we are not able to increase our distribution rate, which could reduce the value of our common stock.
We operate in a highly competitive market for investment opportunities, which could reduce returns and result in losses.
A number of entities compete with us to make the types of investments that we plan to make and we believe that recent market trends, including sustained periods of low interest rates, have increased the number of competitors seeking to invest in loans to private, middle market companies in the United States. We compete with public and private funds, commercial and investment banks, commercial financing companies and, to the extent they provide an alternative form of financing, private equity and hedge funds. Many of our competitors are substantially larger and have considerably greater financial, technical and marketing resources than we do. For example, we believe some of our competitors could have access to funding sources that are not available to us. In July 2017,addition, some of our competitors could have higher risk tolerances or different risk assessments, which could allow them to consider a wider variety of investments and establish more relationships than us. Furthermore, many of our competitors are not subject to the headregulatory restrictions that the 1940 Act imposes on us as a business development company or the source of income, asset diversification and distribution requirements we must satisfy to maintain our qualification as a RIC. The competitive pressures we face could have a material adverse effect on our business, financial condition, results of operations and cash flows. As a result of this competition, we can provide no assurance that we will be
41
able to take advantage of attractive investment opportunities that arise from time to time, and we can provide no assurance that we will be able to identify and make investments that are consistent with our investment objective.
The amount of capital in the private debt markets and overall competition for loans could result in short term returns for us that are lower than our long-term targets. In addition, one of the United Kingdom Financial Conduct Authority announcedeffects of the desire to phase outCOVID-19 pandemic has been a decrease in the usenumber of LIBOR bynew investment opportunities in U.S. middle market companies during 2020, and we can offer no assurance about when, or if, the endnumber of 2021. There is currently no definitive information regarding the future utilization of LIBORU.S. middle market company investing opportunities will equal or of any particular replacement rate. As such, the potential effect of any such event on our cost of capital and net investment income cannot yet be determined. In addition, any further changes or reformsexceed those available prior to the determination or supervisionCOVID-19 pandemic. In the event these conditions continue for an extended amount of LIBOR may result in a sudden or prolonged increase or decrease in reported LIBOR, which could have an adverse impact on the market value for or value of any LIBOR-linked securities, loans, and other financial obligations or extensions of credit held by or due to us andtime, they could have a material adverse effect on our business, financial condition and results of operations.
The loan origination market is very competitive, which can result in loan terms that are more favorable to borrowers, and conversely less favorable to lenders, such as lower interest rates and fees, weaker borrower financial and other covenants, borrower rights to cure defaults, and other terms more favorable to borrowers than current or historical norms. Increased competition could cause us to make more loans that are “cov-lite” in nature and, in a distressed scenario, there can be no assurance that these loans will retain the same value as loans with a full package of covenants. As a result of these conditions, the market for leveraged loans could become less advantageous than expected for us, and this could increase default rates, decrease recovery rates or otherwise harm our returns. The risk of prepayment is also higher in the current competitive environment if borrowers are offered more favorable terms by other lenders. The financial markets have experienced substantial fluctuations in prices and liquidity for leveraged loans. Any further disruption in the credit and other financial markets could enter a period of severe disruption and instability. These conditions have historically affected and could again materially and adversely affect debt and equity capital markets in the United States and around the world and our business.
With respect to the investments we make, we do not seek to compete based primarily on the interest rates we offer, and we believe that some of our competitors could make loans with interest rates that will be lower than the rates we offer. In the secondary market for acquiring existing loans, we compete generally on the basis of pricing terms. With respect to all investments, we could lose some investment opportunities if we do not match our competitors’ pricing, terms and structure. However, if we match our competitors’ pricing, terms and structure, we could experience decreased net interest income, lower yields and increased risk of credit loss. We will also compete for investment opportunities with accounts managed or sponsored by GC Advisors or its affiliates. Although GC Advisors allocates opportunities in accordance with its allocation policy, allocations to such other accounts will reduce the availabilityamount and frequency of debtopportunities available to us and equity capital for the market as a whole and to financial firms, in particular. At various times, such disruptions have resulted in, and maythus not necessarily be in the future result, a lackbest interests of liquidity in partsus and our securityholders. Moreover, the performance of investments will not be known at the debt capital markets, significant write-offs in the financial services sector and the repricingtime of credit risk. Such conditions may occurallocation.
Rising interest rates could make it more difficult for a prolonged period of time again and may materially worsen in the future, including as a result of U.S. government shutdowns or further downgradesportfolio companies to make periodic payments on their loans.
Interest rate risk refers to the U.S. government’s sovereign credit rating or the perceived credit worthinessrisk of the United States or other large global economies. Unfavorable economic conditions, including future recessions, also could increase our funding costs, limit our access to the capital markets or resultmarket changes in a decision by lenders not to extend credit to us. We may in the future have difficulty accessing debt and equity capital on attractive terms, or at all, and a severe disruption and instability in the global financial markets or deteriorations in credit and financing conditions may cause us to reduce the volume of loans we originate and/or fund, adverselyinterest rates. Interest rate changes affect the value of ourdebt. In general, rising interest rates will negatively impact the price of fixed rate debt, and falling interest rates will have a positive effect on price. Adjustable rate debt also reacts to interest rate changes in a similar manner, although generally to a lesser degree. Interest rate sensitivity is generally larger and less predictable in debt with uncertain payment or prepayment schedules. Further, rising interest rates make it more difficult for borrowers to repay debt, which could increase the risk of payment defaults. Any failure of one or more portfolio investmentscompanies to repay or otherwiserefinance its debt at or prior to maturity or the inability of one or more portfolio companies to make ongoing payments following an increase in contractual interest rates could have a material adverse effect on our business, financial condition, results of operations and cash flows.
42
We are subject to risks associated with the discontinuation of LIBOR, which will affect our cost of capital and net investment income.
In July 2017, the Financial Conduct Authority, or the FCA, announced its intention to cease sustaining LIBOR by the end of 2021. The FCA’s intention is that, after 2021, it will no longer be necessary for the FCA to persuade or compel banks to submit to LIBOR due to the development of alternative benchmark rates, which the FCA suggested should be based on transactions and not on reference rates that do not have active underlying markets to support them. In April 2018, the New York Federal Reserve Bank began publishing its alternative rate, the Secured Overnight Financing Rate or SOFR. The Bank of England followed suit in April 2018 by publishing its proposed alternative rate, the Sterling Overnight Index Average, or SONIA.Each of SOFR and SONIA significantly differ from LIBOR, both in the actual rate and how it is calculated, and therefore it is unclear whether and when markets will adopt either of these rates as a widely accepted replacement for LIBOR.
On November 30, 2020, LIBOR’s administrator, the ICE Benchmark Administration Limited, or the IBA, announced a consultation beginning in early December 2020 on its intention to cease the publication of the one-week and two-month U.S. dollar LIBOR settings immediately following the LIBOR publication on December 31, 2021, and the remaining U.S. dollar LIBOR settings, including one-month LIBOR, immediately following the LIBOR publication on June 30, 2023. On March 5, 2021, the FCA released an announcement confirming that such LIBOR settings would cease to be provided by any administrator or no longer be representative as of the dates specified in the IBA proposal, and confirmed that the FCA does not expect any LIBOR settings will become unrepresentative before such dates.The IBA closed the consultation for feedback at the end of January 2021. Concurrent with the IBA’s proposal, the Federal Reserve Board, the Office of the Comptroller of the Currency, and the Federal Deposit Insurance Corporation released a statement that (i) encouraged banks to cease entering into new contracts that use U.S. dollar LIBOR as a reference rate as soon as practicable and in any event by December 31, 2021, (ii) indicated that new contracts entered into before December 31, 2021 should either utilize a reference rate other than U.S. dollar LIBOR or have robust fallback language that includes a clearly defined alternative reference rate after U.S. dollar LIBOR’s discontinuation and (iii) explained that extending the publication of certain U.S. dollar LIBOR tenors until June 30, 2023 would allow most legacy U.S. dollar LIBOR contracts to mature before LIBOR experiences disruptions. On March 8, 2021, the Alternative Reference Rates Committee confirmed that in its opinion the March 5, 2021 announcements by the IBA and the FCA on the future cessation and loss of the representativeness of the LIBOR benchmark rates constitutes a “benchmark transition event” with respect to all U.S. dollar LIBOR settings. A “benchmark transition event” may cause, or allow for, certain contracts to replace LIBOR with an alternative reference rate and such replacement could have a material and adverse impact on the CLO market, the leveraged loan market and/or us.
On July 29, 2021, the Alternative Reference Rates Committee formally announced that it recommends the Chicago Mercantile Exchange’s forward-looking SOFR term rates for use in business loans, including securities backed by such assets.However, forward-looking SOFR term rates will not be representative of three-month LIBOR, and there is no requirement that the Chicago Mercantile Exchange continue to publish forward-looking SOFR term rates, in which case we, our lenders, and our portfolio company borrowers may be required to use other measurements of SOFR, as applicable.
As such, if LIBOR in its current form does not survive and a replacement rate is not widely agreed upon or if a replacement rate is significantly different from LIBOR, it could cause a disruption in the credit markets generally. Such a disruption could also negatively impact the market value and/or transferability of our portfolio company investments. Furthermore, disruptions related to loans and/or other debt financing securitizations (CLOs) in the marketplace could have a material adverse effect on the ability of GC Advisors or its affiliates to enter into loans in the future in accordance with our investment strategy and have a material adverse effect on us. We could also be materially and adversely impacted to the extent GC Advisors or its affiliates are unable to successfully implement an acceptable replacement rate in leverage utilized by us or if there is a prolonged period of mismatch on the interest rates on the interest rates payable on our leverage and our portfolio investments as a result of the continued publication of LIBOR. Further, if LIBOR does not survive and a replacement rate is not widely agreed upon, the mismatch on the interest rates payable by any leverage incurred by us and the interest rate payable on the portfolio company investments could result in a decrease in our net investment income and distributions we are able to pay to our stockholders.
43
We are dependent upon GC Advisors for our success and upon theirits access to the investment professionals and partners of Golub Capital and its affiliates.
We do not have any internal management capacity or employees. We rely on GC Advisors to manage and conduct our affairs and make all investment decisions. Subject to the oversight of our board of directors, GC Advisors has sole discretion in originating, structuring, negotiating, purchasing, financing and eventually divesting our investments, and our investors will not be able to evaluate for themselves the merits of particular investments prior to us making such investments. We depend on the diligence, skill and network of business contacts of the senior investment professionals of GC Advisors to achieve our investment objective. GC Advisors’ investment committee, which consists of two members of our board of directors and two additional employees of Golub Capital LLC, provides oversight over our investment activities. We also cannot assure you that we will replicate the historical results achieved for other Golub Capital funds by members of the investment committee, and we caution you that our investment returns could be substantially lower than the returns achieved by them in prior periods. We expect that GC Advisors will evaluate, negotiate, structure, close and monitor our investments in accordance with the terms of the Investment Advisory Agreement. We can offer no assurance, however, that the senior investment professionals of GC Advisors will continue to provide investment advice to us. If these individuals do not maintain their existing relationships with Golub Capital LLC and its affiliates and do not develop new relationships with other sources of investment opportunities, we may notcan provide no assurance that GC Advisors or its affiliates will be able to identify appropriate replacements or grow our investment portfolio. The loss of any member of GC Advisors’ investment committee or of other senior investment professionals of GC Advisors and its affiliates would limit our ability to achieve our investment objective and operate as we anticipate. This could have a material adverse effect on our financial condition, results of operations and cash flows.
The Staffing Agreement provides that Golub Capital LLC makes available to GC Advisors experienced investment professionals and provides access to the senior investment personnel of Golub Capital LLC for purposes of evaluating, negotiating, structuring, closing and monitoring our investments. We are not a party to the Staffing Agreement and cannot assure you that Golub Capital LLC will fulfill its obligations under the agreement. If Golub Capital LLC fails to perform, we cannot assure you that GC Advisors will enforce the Staffing Agreement, that such agreement will not be terminated by either party or that we will continue to have access to the investment professionals of Golub Capital LLC and its affiliates or their information and deal flow.
Our business model depends to a significant extent upon strong referral relationships with sponsors and investing in companies backed by private equity sponsors. Any inability of GC Advisors to maintain or develop these relationships, or the failure of these relationships to generate investment opportunities, could adversely affect our business.
From time to time, we expect to have direct or indirect exposure to companies controlled by private equity sponsors in which the sponsors have completed one or more dividend recapitalizations, thereby allowing the private equity sponsor to substantially reduce or eliminate its net investment in an underlying portfolio company. These investments generally present different investment characteristics to us than investments where a private equity sponsor retains a significant net contributed capital position in the company. These investments could experience a higher rate of default. Even when a default does not occur, private equity sponsors could be less willing to provide ongoing financial, managerial or operating support to a significant extent upon these relationshipsportfolio company after it has received one or more capital distributions on its investment.
We believe that purchase price multiples of companies (as measured by the price paid by a private equity sponsor to purchase a company divided by the company’s trailing twelve-month earnings) to which we have direct or indirect exposure are close to all-time highs. When considering the appropriate amount of financing to provide a prospective borrower, GC Advisors considers the value cushion as measured by the difference between the enterprise value of the company and the total amount of financing. If market purchase price multiples decline or if a portfolio company
44
experiences financial distress, the value cushion supporting our investment could deteriorate and the investment could become impaired, resulting in losses for us. The risk of such losses for us with potential investment opportunities. If Golub Capital LLC failsare greater during periods when purchase price multiples are close to maintain such relationships, or to develop new relationships with other sponsors or sources of investment opportunities,all-time highs.
We can provide no assurance that we will not be able to growreplicate the historical results achieved by other entities managed or sponsored by members of GC Advisors’ investment committee, or by GC Advisors or its affiliates.
Potential investors are cautioned that past investment performance of similar portfolios and other investment vehicles managed by GC Advisors or its affiliates is not indicative of how we will perform. Our investments could differ from some existing accounts and funds that are or have been sponsored or managed by members of GC Advisors’ investment committee, GC Advisors or affiliates of GC Advisors. Investors in our investment portfolio. In addition, individuals with whom the
Our financial condition, results of operations and cash flows depend on our ability to manage our business effectively.
Our ability to achieve our investment objective depends on our ability to manage our business and to grow. This depends, in turn, on GC Advisors’ ability to identify, invest in and monitor companies that meet our investment criteria. The achievement of our investment objectives on a cost-effective basis depends upon GC Advisors’ execution of our investment process, its ability to provide competent, attentive and efficient services to us and, to a lesser extent, our access to financing on acceptable terms. GC Advisors has substantial responsibilities under the Investment Advisory Agreement, as well as responsibilities in connection with the management of other accounts sponsored or managed by GC Advisors, members of GC Advisors’ investment committee or Golub Capital LLC and its affiliates. The personnel of the Administrator and its affiliates maycould be called upon to provide managerial assistance to our portfolio companies. These activities maycould distract them or slow our rate of investment. Any failure to manage our business and our future growth effectively could have a material adverse effect on our business, financial condition, results of operations and cash flows.
There are significant potential conflicts of interest that could affect our investment returns.
As a result of our arrangements with GC Advisors and its affiliates and GC Advisors’ investment committee, there maywill be times when GC Advisors or such persons have interests that differ from those of our securityholders,security holders, giving rise to a conflict of interest, many of which are described in the following risk factors. GC Advisors attempts to identify, monitor and mitigate conflicts of interest. Further, GC Advisors has implemented policies and procedures reasonably designed to ensure its clients are treated fairly and equitably over time. GC Advisors believes that these factors, together with Golub Capital’s commitment to put investors first, effectively mitigate the risks associated with such conflicts of interest. However, it can be difficult to ensure that conflicts of interest do not adversely affect us.
The members of GC Advisors’ investment committee serve or may serve as officers, directors or principals of entities that operate in the same or a related line of business as we do or of accounts sponsored or managed by GC Advisors or its affiliates. Currently, our officersdirectors and directorscertain of our officers also serve as directors and officers and directors of Golub Capital Investment Corporation, or GCIC, and Golub Capital BDC 3, Inc., or GBDC 3 and GDLC, each a closed-end, non-diversified management investment company that has also elected to be regulated as a business development company under the 1940 Act. Similarly, GC Advisors orand its affiliates currently manage and may have other clients with similar or competing investment objectives.
GC Advisors' management team will share its time and attention between us and other investment vehicles and accounts. Neither we nor any investor in us unaffiliated with GC Advisors will have any rights in or to independent
45
ventures of GC Advisors or its affiliates or in the income or profits derived therefrom. GC Advisors does not expect to have any dedicated personnel who spend all or substantially all of their time managing our investing activities.
In serving in these multiple capacities, they mayGC Advisors and its personnel have obligations to other clients or investors in those entities, the fulfillment of which may not be incould conflict with the best interests of us or our stockholders. For example, Lawrence E. Golubthe economic disruption and David B. Golub have management responsibilities foruncertainty precipitated by the COVID-19 pandemic has required GC Advisors and its affiliates to devote additional time and focus to existing portfolio companies in which other funds and accounts managed or sponsored by GC Advisors orand its affiliates including GCIChold investments. The allocation of time and GBDC 3. focus by personnel of GC Advisors and its affiliates to these existing portfolio company investments held by other funds and accounts could reduce the time that such individuals have to spend on our investing activities.
Our investment objective may overlapoverlaps with the investment objectives of suchother affiliated accounts. For example, GC Advisors and its affiliates currently manages GCIC,manage GBDC 3, GDLC and severalmultiple private funds and separate accounts that pursue an investment strategy similar to ours, some of which maywill seek additional capital from time to time, that are pursuing an investment strategy similar to ours, and we maytime. We compete with these and other accounts sponsored or managed by GC Advisors and its affiliates for capital and investment opportunities. As a result, those individuals mayGC Advisors and its affiliates face conflicts in the allocation of investment opportunities among us and other accounts advised by or affiliated with GC Advisors.Advisors and, in certain circumstances, in the timing of the sale of an investment. Certain of these accounts may provide for higher management or incentive fees, allow GC Advisors to recover greater expense reimbursements or overhead allocations, and/or permit GC Advisors and its affiliates to receive higher origination and other transaction fees, all of which maycould contribute to this conflict of interest and create an incentive for GC Advisors to favor such other accounts. For example, the 1940 Act restricts GC Advisors from receiving more than a 1% fee in connection with loans that we acquire, or originate, a limitation that does not exist for certain other accounts. GC Advisors seeks to allocate investment opportunities among eligible accounts in a manner that is fair and equitable over time and consistent with its allocation policy. However, we can offer no assurance that such opportunities will be allocated to us fairly or equitably in the short-term or over time, and there can be no assurance that we will be able to participate in all investment opportunities that are suitable to us. Furthermore, because allocations under GC Advisors’ allocation policy are based on total capital of the relevant investing funds, including us, we expect to receive smaller allocations relative to larger accounts, which could have a material adverse effect on our business, financial condition, results of operations and cash flows during such ramp-up period. With respect to the sale of investments, the sale of an investment by one account advised by GC Advisors or its affiliates could potentially adversely affect the market value of the interests in such investment that continue to be held by other accounts, including us.
GC Advisors’ investment committee, GC Advisors or its affiliates may,could, from time to time, possess material non-public information, limiting our investment discretion.
Principals of GC Advisors and its affiliates and members of GC Advisors’ investment committee maycould serve as directors of, or in a similar capacity with, companies in which we invest, the securities of which are purchased or sold on our behalf. In the event that material nonpublicnon-public information is obtained with respect to such companies, or we become subject to trading restrictions under the internal trading policies of those companies or as a result of
applicable law or regulations, we could be prohibited for a period of time from purchasing or selling the securities of such companies, and this prohibition maycould have an adverse effect on us.
Our management and incentive fee structure may createcreates incentives for GC Advisors that are not fully aligned with the interests of our stockholders and maycould induce GC Advisors to make certain investments, including speculative investments.
In the course of our investing activities, we pay management and incentive fees to GC Advisors. The management fee is based on our average adjusted gross assets and the incentive fee is computed and paid on income and capital gains, both of which include leverage. As a result, investors in our common stock will invest on a “gross” basis and receive distributions on a “net” basis after expenses, resulting in a lower rate of return than one mightcould achieve through direct investments. Because these fees are based on the fair value of our average adjusted gross assets, GC Advisors benefits when we incur debt or use leverage. Under certain circumstances, theThe use of leverage may increaseincreases the likelihood of default on our debt or other leverage, which would negatively impactdisfavor our securityholders.
Additionally, the incentive fee payable by us to GC Advisors maycould create an incentive for GC Advisors to cause us to realize capital gains or losses that mayare not be in the best interests of us or our stockholders. Under the incentive fee structure, GC Advisors benefits when we recognize capital gains and, because GC Advisors determines when an investment is sold, GC Advisors controls the timing of the recognition of such capital gains. Our board of directors
46
is charged with protecting our stockholders’ interests by monitoring how GC Advisors addresses these and other conflicts of interest associated with its management services and compensation.
The part of the management and incentive fees payable to GC Advisors that relates to our net investment income is computed and paid on income that may includeincludes interest income that has been accrued but not yet received in cash, such as market discount, debt instruments with PIK interest, preferred stock with PIK dividends, zero coupon securities, and other deferred interest instruments and may createinstruments. This compensation arrangement creates an incentive for GC Advisors to make investments on our behalf that are riskier or more speculative, than would be the case in the absence of such compensation arrangement. This fee structure may be considered to give rise to a conflict of interest for GC Advisors to the extent that it may encourage GC Advisors to favorincluding debt financings that provide for deferred interest, rather than current cash payments of interest. Under these investments, we accrue the interest over the life of the investment but do not receive the cash income from the investment until the end of the term. Our net investment income used to calculate the income portion of our investment fee, however, includes accrued interest. GC Advisors may havehas an incentive to invest in deferred interest securities in circumstances where it would not have done so but for the opportunity to continue to earn the fees even when the issuers of the deferred interest securities would not be able to make actual cash payments to us on such securities. This risk could be increased because GC Advisors is not obligated to reimburse us for any fees received even if we subsequently incur losses or never receive in cash the deferred income that was previously accrued.
Our securities may be purchased by GC Advisors or its affiliates.
Affiliates of GC Advisors have purchased, and GC Advisors and its affiliates in the future expect to purchase, certain of our securities. The purchase of our securities, including shares of our common stock, by GC Advisors and its affiliates could create certain risks. For example, GC Advisors and its affiliates may have an interest in disposing of our securities at a date that differs from that of our other investors so as to recover their investment in such securities.
The valuation process for certain of our portfolio holdings creates a conflict of interest.
The majority of our portfolio investments are expected to be made in the form of securities that are not publicly traded. As a result, our board of directors will determine the fair value of these securities in good faith. Valuations of private investments and private companies require judgment, are inherently uncertain, often fluctuate and are frequently based on estimates. It is possible that determinations of fair value will differ materially from the values that would have been used if an active market for these investments existed. If determinations regarding the fair value of investments were materially higher than the values that were ultimately realized upon the sale of such investments, the returns to our investors would be adversely affected.
In connection with that determination, investment professionals from GC Advisors maywill provide our board of directors with portfolio company valuations based upon the most recent portfolio company financial statements available and projected financial results of each portfolio company. In addition, Lawrence E. Golub and David B. Golub have an indirect pecuniary interest in GC Advisors. The participation of GC Advisors’ investment professionals in our valuation process, and the indirect pecuniary interest in GC Advisors by Lawrence E. Golub and David B. Golub, could resultresults in a conflict of interest as GC Advisors’ management fee is based, in part, on our average adjusted gross assets and our capital gain and subordinated liquidation incentive fees will beare based, in part, on unrealized gains and losses.
Conflicts related to other arrangements with GC Advisors or its affiliates.
We have entered into a license agreement with Golub Capital LLC under which Golub Capital LLC has granted us a non-exclusive, royalty-free license to use the name “Golub Capital”.Capital.” See “Management Agreements — License Agreement.” In addition, we pay to the Administrator our allocable portion of overhead and other expenses incurred by the Administrator in performing its obligations under the Administration Agreement, such as rent and our allocable portion of the cost of our chief financial officer and chief compliance officer and their respective staffs. These arrangements create conflicts of interest, including in the allocation of expenses and the enforcement of the respective agreements, that our board of directors must monitor.
Our ability to enter into transactions with our affiliates will be restricted, which maycould limit the scope of investments available to us.
We are prohibited under the 1940 Act from participating in certain transactions with our affiliates without the prior approval of our independent directors and, in some cases, the SEC. Any person that owns, directly or indirectly, five percent or more of our outstanding voting securities is our affiliate for purposes of the 1940 Act, and we are generally prohibited from buying or selling any security from or to such affiliate, absent the prior approval of our independent directors. We consider GC Advisors and its affiliates to beare considered our affiliates for such purposes. The 1940 Act also prohibits certain “joint” transactions with certain of our affiliates, which could include investments in the same
47
portfolio company, without prior approval of our independent directors and, in some cases, the SEC. We are prohibited from buying or selling any security from or to, among others, any person who owns more than 25% of our voting securities or certain of that person’s affiliates, or entering into prohibited joint transactions with such persons, absent the prior approval of the SEC.
We may,can, however, invest alongside GC Advisors’ and its affiliates’ other clients in certain circumstances where doing so is consistent with applicable law, and SEC staff, interpretations.or Staff, interpretations, and the co-investment exemptive relief order from the SEC. For example, we maycan invest alongside such accounts consistent with guidance promulgated by the SEC staffStaff permitting us and such other accounts to purchase interests in a single class of privately placed securities so long as certain conditions are met, including that GC Advisors, acting on our behalf and on behalf of its other clients, negotiates no term other than price. We maycan also invest alongside GC Advisors’ other clients as otherwise permissible under regulatory guidance, applicable regulations and GC Advisors’ allocation policy. Under this allocation policy, if anGC Advisors will determine the amount of any proposed investment opportunity is appropriate forto be made by us and another similar eligible account,accounts. We expect that these determinations will be made similarly for other accounts sponsored or managed by GC Advisors and its affiliates. If sufficient securities or loan amounts are available to satisfy our and each such account’s proposed investment, the opportunity will be allocated in accordance with GC Advisors’ pre-transaction determination. Where there is an insufficient amount of an investment opportunity to fully satisfy us and other accounts sponsored or managed by GC Advisors or its affiliates, the allocation policy further provides that allocations among us and other accounts will generally be made pro rata based on the relative capital available for investment of each of us and such other eligible accounts, subject to minimum and maximum investment size limits. In situations in which co-investment with other entities sponsored or managed by GC Advisors or its affiliates is not permitted or appropriate, GC Advisors will need to decide whether we or such other entity or entities will proceed with the investment. GC Advisors will make these determinations based on its policies and procedures, which generally require that such opportunities be offered to eligible accounts on a basis that will be fair and equitable over time, including, for example, through random or rotational methods. However, we can offer no assurance that investment opportunities will be allocated to us fairly or equitably in the short-term or over time.
On occasion, an investment opportunity will be too large to satisfy our desired position size and that of other investment funds and accounts managed by GC Advisors and its affiliates. GC Advisors can provide no assurance that it will be able to identify counterparties to participate in such investment opportunities, and could be required to decline to make investments where it does not believe that it can successfully sell some of the investment opportunity to another market participant.
In situations in which co-investment with other accounts sponsored or managed by GC Advisors or its affiliates is not permitted or appropriate, such as when, in the absence of the exemptive relief described below, we and such other entities mayaccounts cannot make investments in the same issuer or where the different investments could be expected to result in a conflict between our interestsinterest and those of other GC Advisors clients,accounts, GC Advisors needs to decide whether we or such other entity or entitiesaccounts will proceed with such investments. GC Advisors makes these determinations based on its policies and procedures, which generally require that such investment opportunities be offered to eligible accounts on a basis that is fair and equitable over time, including, for example, through random or rotational methods. Moreover, in certain circumstances, we maygenerally will be unable to invest in an issuer in which an account sponsored or managed by GC Advisors or its affiliates has previously invested. Similar restrictions limit our ability to transact business with our officers or directors or their affiliates. These restrictions may limit the scope of investment opportunities that would otherwise be available to us.
On February 27, 2017, GC Advisors and certain other funds and accounts sponsored or managed by GC Advisors and its affiliates, received exemptive relief from the SEC that permits usto permit greater flexibility to negotiate the terms of co-investments if our Boardboard of directors determines that it would be advantageous for us to co-invest with other accounts sponsored or managed by GC Advisors or its affiliates in a manner consistent with our investment objectives, positions, policies, strategies and restrictions as well as regulatory requirements and other pertinent factors. Under the terms of this exemptive relief, a “required majority” (as defined in Section 57(o) of the 1940 Act) of our independent directors is required to make certain conclusions in connection with a co-investment transaction, including that (1) the terms of the proposed transaction are reasonable and fair to us and our stockholders and do not involve overreaching of us or our stockholders on the part of any person concerned and (2) the transaction is consistent with the interests of our stockholders and is consistent with our investment strategies and policies. We believe that co-investment by us and accounts sponsored or managed by GC Advisors and its affiliates will afford us additional investment opportunities and the ability to achieve greater diversification. There could be many follow-on
48
opportunities available to other entities advised by GC Advisors and its affiliates that are unavailable to us due to the limitations of the exemptive relief granted to GC Advisors and its affiliates.
We have entered into the Adviser Revolver resulting in a conflict of interest between GC Advisors’ obligation to act in its own best interest and in our best interest.
We have entered into the Adviser Revolver, an unsecured revolving loan agreement with GC Advisors. GC Advisors has a conflict of interest between its obligation to act in our best interest and its own best interest. Any such loans or advances made to us under the Adviser Revolver will be consistent with applicable law, GC Advisors’ fiduciary obligations to act in our best interests, our investment objectives, and the asset coverage ratio requirements under the 1940 Act. The terms associated with any such loans from GC Advisors or its affiliates, including the interest charged, shall, in the aggregate, be no more favorable to GC Advisors or its affiliates than could be obtained in an arm’s length transaction but will not necessarily be on the same terms or at the same interest rate charged by GC Advisors to other funds that it manages. Neither GC Advisors nor any of its affiliates is obligated to extend any such loans to us and such loans will not necessarily be made available to us in the same amounts or on the same economic terms as are made available to other funds advised by GC Advisors or its affiliates, or at all. In the event that we are required to find third party financing in place of or in addition to loans from GC Advisors and mayits affiliates, such third party financing could be at less favorable economic terms than the loans from GC Advisors and its affiliates, which could reduce our returns.
GC Advisors could make certain investment decisions for the purpose of receiving transaction fees.
In connection with investments made by us, GC Advisors and its affiliates often receive origination, commitment, documentation, structuring, facility, monitoring, amendment, refinancing, administrative agent and/or other fees from portfolio investments in which we invest or propose to invest. The potential for GC Advisors and its affiliates to receive such economic benefits creates conflicts of interest as GC Advisors and its affiliates have an incentive to invest in portfolio investments that provide such benefits. Similarly, GC Advisors and its affiliates could be incentivized to waive certain fees in connection with a refinancing in order to receive certain fees in the new transaction, including when we and/or other accounts advised by GC Advisors and its affiliates can participate in the original or refinanced investment, or both.
Reductions, waivers or absorptions of fees and costs can temporarily result in higher returns to investors than they would otherwise receive if full fees and costs were charged.
GC Advisors and its affiliates are permitted to reduce, waive or absorb some of the fees or costs otherwise due by us. While this activity can be seen as friendly to investors, reductions, waivers and absorptions of fees and costs result in higher returns to investors than such investors would receive if full fees and costs were charged. There is no guarantee that such reductions, waivers or absorptions will occur in the future, and any reductions, waivers and absorptions are entirely at the discretion of GC Advisors or the Administrator, as applicable.
GC Advisors could prioritize its relationship with a borrower or private equity sponsor instead of seeking the most advantageous terms for our investments.
GC Advisors will not make any investment on behalf of us that it does not believe to be in our best interest. However, conflicts can arise in any particular transaction between obtaining the most advantageous terms for an investment, which benefits us and other clients of GC Advisors participating in that investment, and maintaining GC
49
Advisors’ relationship with a borrower or private equity sponsor, which likely serves the long-term best interests of GC Advisors’ clients overall, including us. For example, affiliates of GC Advisors hold relatively small, minority investments in unaffiliated private equity funds, which arguably creates an incentive for GC Advisors to cause us to invest in portfolio companies owned by such private equity funds and to treat such portfolio companies more favorably in a workout situation. As another example of the conflicts that could arise, GC Advisors is permitted to reduce or waive transaction or prepayment fees, offer loan terms that are more favorable to the borrower (and conversely, less favorable to us), accept a below target position size, agree to amend certain terms or waive existing terms or defaults or make other similar concessions to maintain or improve a relationship with a private equity sponsor or borrower, which GC Advisors believes will increase the likelihood of repeat business that will benefit us and GC Advisors’ other clients.
GC Advisors operates in multiple business lines and could pursue additional business lines, which could create a conflict of interest in the allocation of its time and focus.
While Golub Capital maintains two major business lines, it has explored and will continue to explore opportunities outside these business lines. Such activity could adversely affect us. These risks include reputational damage, loss of management attention and time due to multiple constraints, regulatory sanctions, adverse impact to business relationships, increased competition of capital allocations, and expansion of potential risks to GC Advisors’ business as a whole outside those previously disclosed. New business lines could also exacerbate existing conflicts of interest and raise new conflicts.
Investors should be aware that other lines of business at Golub Capital could indirectly affect their investment in us, even if we are not directly exposed to those lines of business. While GC Advisors and its affiliates keep each investment client as a legally distinct entity or account, there are risks that a separate business line suffering a material adverse condition could affect other business lines to which we have direct exposure, and consequently, our performance. These risks could materially affect GC Advisors’ business as a whole, and include loss of reputation, loss of management time and focus, regulatory sanctions, and adverse impact to business relationships.
Golub Capital could pursue strategic transactions, which could create a conflict of interest in the allocation of
GC Advisors’ time and focus.
Golub Capital could engage in any number of strategic transactions, including acquisitions, divestitures, joint ventures, new business formations, restructurings, launches of new investment fund strategies and structures or even a fund that pursues a strategy that is different than what Golub Capital has historically focused on, such as a private equity fund of funds. Additionally, Golub Capital could sell stakes in itself or in its affiliates or acquire stakes in other asset managers, service providers or investment vehicles, including to or from investors in the Company. In August 2018, Golub Capital sold a passive, non-voting minority stake in its management companies. While Golub Capital has not subsequently engaged in any material strategic transactions, it could do so in the future.
Strategic transactions are subject to many risks, such as the risk that the transaction might not be successful in meeting its strategic goals, or the risk that the transaction might divert the attention of the Investment Manager from the core investment activities of the Fund, or the risk that the management team will not be successful in developing and operating the underlying business involved in the strategic transaction.
We and GC Advisors could be the target of litigation or regulatory investigations.
We as well as GC Advisors and its affiliates participate in a highly regulated industry and are each subject to regulatory examinations in the ordinary course of business. There can be no assurance that we and GC Advisors and/or any of its affiliates will avoid regulatory investigation and possible enforcement actions stemming therefrom. GC Advisors is a registered investment adviser and, as such, is subject to the provisions of the Investment Advisers Act. We and GC Advisors are each, from time to time, subject to formal and informal examinations, investigations, inquiries, audits and reviews from numerous regulatory authorities both in response to issues and questions raised in such examinations or investigations and in connection with the changing priorities of the applicable regulatory authorities across the market in general.
There is also a material risk that applicable governmental authorities and regulators in the United States and other jurisdictions will continue to adopt new laws or regulations (such as tax, privacy and anti-money laundering laws or regulations), or change existing laws or regulations, or enhance the interpretation or enforcement of existing laws and regulations, in each case in a manner that is burdensome for GC Advisors and for us. Any such events or changes could occur during the term of the Company and could adversely affect us or GC Advisors and GC
50
Advisors’ ability to operate and/or pursue its management strategies on behalf of us. Further, any such events or changes could adversely affect obligors’ ability to make payments on loans to which we are directly or indirectly exposed or otherwise adversely affect the value of such investments. Such risks are often difficult or impossible to predict, avoid or mitigate in advance. As a result, there can be no assurance that any of the foregoing will not have an adverse impact on the business of GC Advisors and/or any of its affiliates or our performance. From time to time, GC Advisors and its affiliates could take certain actions that they determine are necessary, appropriate or in the best interests of us and our securityholders. Moreover,stockholders, taken as a whole, to mitigate the performanceapplication or impact of investments will notcertain laws or regulations.
GC Advisors, its affiliates and/or any of their respective principals and employees could also be known atnamed as defendants in, or otherwise become involved in, litigation. Litigation and regulatory actions can be time-consuming and expensive and can lead to unexpected losses, which expenses and losses are often subject to indemnification by us. Legal proceedings could continue without resolution for long periods of time and their outcomes, which could materially and adversely affect the timevalue of allocation.us or the ability of GC Advisors to manage us, are often impossible to anticipate. GC Advisors would likely be required to expend significant resources responding to any litigation or regulatory action related to it, and these actions could be a distraction to the activities of GC Advisors.
Our investment activities are subject to the normal risks of becoming involved in litigation by third parties. This risk would be somewhat greater if we were to exercise control or significant influence over a portfolio company’s direction. The expense of defending against claims by third parties and paying any amounts pursuant to settlements or judgments would, absent willful misfeasance, bad faith, gross negligence, or reckless disregard of the duties involved by GC Advisors, the Administrator, or any of our officers, be borne by us and would reduce our net assets. GC Advisors and others are indemnified by us in connection with such litigation, subject to certain conditions.
We will be subject to corporate-level income tax if we are unable to qualify as a RIC.
In order to be subject to taxqualify as a RIC under the Code, we must meet certain source-of-income, asset diversification and distribution requirements. The distribution requirement for a RIC is satisfied if we distribute to our stockholders dividends for U.S. federal income tax purposes of an amount generally at least equal to 90% of our investment company taxable income, which is generally our net ordinary income plus the excess of our net short-term capital gains in excess of our net long-term capital losses, determined without regard to any deduction for dividends paid, to our stockholders on an annual basis.each taxable year. We are subject, to the extent we use debt financing, to certain asset coverage ratio requirements under the 1940 Act and financial covenants under loan and credit agreements that could, under certain circumstances, restrict us from making distributions necessary to qualify as a RIC. If we are unable to obtain cash from other sources, we maycould fail to be subject to taxqualify as a RIC and, thus, maycould be subject to corporate-level income tax.tax irrespective of the level of distributions paid to our stockholders. To qualify as a RIC, we must also meet certain asset diversification requirements at the end of each quarter of our taxable year. Failure to meet these requirements maycould result in our having to dispose of certain investments quickly in order to prevent the loss of our qualification as a RIC. Because most of our investments are in private or thinly traded public companies, any such dispositions could be made at disadvantageous prices and maycould result in substantial losses. If we fail to qualify as a RIC for any reason and become subject to corporate-level income tax, the resulting corporate taxes could substantially reduce our net assets, the amount of income available for distributions to stockholders and the amount of our distributions and the amount of funds available for new investments. Such a failure would have a material adverse effect on us and our securityholders. See “Business — Taxation as a RIC.”
We maycould need to raise additional capital to grow because we must distribute most of our income.
We maycould need additional capital to fund new investments and grow our portfolio of investments. We intend to access the capital markets periodically to issue debt or equity securities or borrow from financial institutions in order
to obtain such additional capital. Unfavorable economic conditions could increase our funding costs, limit our access to the capital markets or result in a decision by lenders not to extend credit to us. A reduction in the availability of new capital could limit our ability to grow. In addition, in order to qualify as a RIC, we are required to distribute each taxable year an amount generally at least equal to 90% of the sum our net ordinary income and net short-term capital gains in excess of net long-term capital losses, or investment company taxable income, determined without regard to any deduction for dividends paid as dividends for U.S. federal income tax purposes, to our stockholders to maintain our ability to be subject to tax as a RIC.stockholders. As a result, these earnings are not available to fund new investments. An inability to access the capital markets successfully could limit our ability to grow our business and execute our business strategy fully and could decrease our earnings, if any, which maycould have an adverse effect on the value of our securities. Furthermore, to the extent we are not able to raise capital and are at or near our targeted leverage ratios, we maycould receive smaller allocations, if
51
any, on new investment opportunities under GC Advisors’ allocation policy and have, in the past, received such smaller allocations under similar circumstances.
We maycould have difficulty paying our required distributions if we recognize income before, or without, receiving cash representing such income.
For U.S. federal income tax purposes, we include in income certain amounts that we have not yet received in cash, such as the accretion of original issue discount. This maycould arise if we receive warrants in connection with the making of a loan and in other circumstances, or through contracted PIK interest, which represents contractual interest added to the loan balance and due at the end of the loan term. Such original issue discount, which could be significant relative to our overall investment activities, or increases in loan balances as a result of contractedcontractual PIK arrangements, is included in income before we receive any corresponding cash payments. We also maycould be required to include in income certain other amounts that we do not receive in cash.
That part of the incentive fee payable by us that relates to our net investment income is computed and paid on income that may includeincludes interest that has been accrued but not yet received in cash, such as market discount, debt instruments with PIK interest, preferred stock with PIK dividends and zero coupon securities. If a portfolio company defaults on a loan that is structured to provide accrued interest, it is possible that accrued interest previously used in the calculation of the incentive fee will become uncollectible, and GC Advisors will havehas no obligation to refund any fees it received in respect of such accrued income.
Since in certain cases we maycould recognize income before or without receiving cash representing such income, we maycould have difficulty meeting the Annual Distribution Requirement.requirement to distribute dividends for U.S. federal income tax purposes of an amount generally at least equal to 90% of our investment company taxable income, determined without regard to any deduction for dividends paid, to our stockholders in order to maintain our qualification as a RIC. In such a case, we maycould have to sell some of our investments at times we would not consider advantageous, raise additional debt or equity capital or reduce new investment originations to meet these distribution requirements. If we are not able to obtain such cash from other sources, we maycould fail to qualify as a RIC and thus be subject to corporate-level income tax. See “Business — Taxation as a RIC.”
Stockholders could receive shares of our common stock as distributions, which could result in adverse tax consequences to them.
Although we currently do not intend to do so, we are permitted to declare a large portion of a dividend in shares of common stock at the election of each stockholder. Revenue Procedures issued by the IRS allow a publicly offered regulated investment company (as defined above) to distribute its own stock as a dividend for the purpose of fulfilling its distribution requirements if certain conditions are satisfied. Among other things, the aggregate amount of cash available to be distributed to all stockholders is currently required to be at least 20% of the aggregate declared distribution. The Internal Revenue Service has also issued private letter rulings on cash/stock dividends paid by regulated investment companies and real estate investment trusts where the cash component is limited to 20% of the total distribution if certain requirements are satisfied. Stockholders receiving such dividends will be required to include the full amount of the dividend (including the portion payable in stock) as ordinary income (or, in certain circumstances, long-term capital gain) to the extent of our current and accumulated earnings and profits for federal income tax purposes. As a result, stockholders could be required to pay income taxes with respect to such dividends in excess of the cash dividends received. It is unclear to what extent we will be able to pay taxable dividends in cash and common stock (whether pursuant to IRS Revenue Procedures, a private letter ruling or otherwise).
The tax treatment of a non-U.S. stockholder in its jurisdiction of tax residence will depend entirely on the laws of such jurisdiction and could vary considerably from jurisdiction to jurisdiction.
Depending on (1) the laws of such non-U.S. stockholder’s jurisdiction of tax residence, (2) how we are treated in such jurisdiction, and (3) our activities, an investment in us could result in such non-U.S. stockholder recognizing adverse tax consequences in its jurisdiction of tax residence, including with respect to any generally required or additional tax filings and/or additional disclosure required in such filings in relation to the treatment for tax purposes in the relevant jurisdiction of an interest in us and/or of distributions from us and any uncertainties arising in that respect (the Company not being established under the laws of the relevant jurisdiction), the possibility of taxable income significantly in excess of cash distributed to a non-U.S. stockholder, and possibly in excess of our actual economic income, the possibilities of losing deductions or the ability to utilize tax basis and of sums invested being returned in the form of taxable income or gains, and the possibility of being subject to tax at unfavorable tax rates. A
52
non-U.S. stockholder could also be subject to restrictions on the use of its share of our deductions and losses in its jurisdiction of tax residence. Each stockholder is urged to consult its own tax advisers with respect to the tax and tax filing consequences, if any, in its jurisdiction of tax residence of an investment in us, as well as any other jurisdiction in which such prospective investor is subject to taxation.
Regulations governing our operation as a business development company affect our ability to, and the way in which we, raise additional capital. As a business development company, the necessity of raising additional capital exposes us to risks, including the typical risks associated with leverage.
We maycould issue debt securities or preferred stock and/or borrow money from banks or other financial institutions, which we refer to collectively as “senior securities,” up to the maximum amount permitted by the 1940 Act. Under the current provisions of the 1940 Act, we are permitted as a business development company to issue senior securities in amounts such that our asset coverage, as defined in the 1940 Act, equals at least 200% (or 150% upon receipt of certain approvals and subject to certain disclosure requirements)the percentage of gross assets (other than the SBA debentures of an SBIC subsidiary, as permitted by exemptive relief we have been granted by the SEC) less all liabilities and indebtedness not represented by senior securities after each issuance of senior securities (other thanthat is applicable to us under Section 61 of the SBA debentures1940 Act. Following the approval of an SBIC subsidiary,our stockholders of the reduced asset coverage requirements in Section 61(a)(2) of the 1940 Act and subject to our compliance with certain disclosure requirements, effective as of February 6, 2019, under the provisions of the 1940 Act, we are permitted as a business development company to issue senior securities in amounts such that its asset coverage, as defined in the 1940 Act, equals at least 150% of gross assets less all liabilities and indebtedness not represented by exemptive reliefsenior securities, after each issuance of senior securities. Under the reduced 150% asset coverage requirement, we are permitted under the 1940 Act to have been granted bya ratio of total consolidated assets to outstanding indebtedness of 2:1 as compared to a maximum of 1:1 under the SEC).200% asset coverage requirement that would otherwise apply to a business development company. If the value of our assets declines, we maycould be unable to satisfy this ratio. If that happens, we maycould be required to sell a portion of our investments and, depending on the nature of our leverage, repay a portion of our indebtedness at a time when such sales mayactivities could be disadvantageous. This could have a material adverse effect on our operations and we may not be able to make distributions in an amount sufficient to be subject to tax as a RIC, or at all. Also, any amounts that we use to service our indebtedness would not be available for distributions to our common stockholders. If we issue senior securities, we will be exposed to typical risks associated with leverage, including an increased risk of loss. As of September 30, 2018,2021, we had $845.7 million$2.6 billion of outstanding borrowings, including $197.5$408.2 million and $546.5 million outstanding under the 20142018 Debt Securitization.Securitization and the GCIC 2018 Debt Securitization, respectively.
In the absence of an event of default, no person or entity from which we borrow money has a veto right or voting power over our ability to set policy, make investment decisions or adopt investment strategies. If we issue
preferred stock, which is another form of leverage, the preferred stock would rank “senior” to common stock in our capital structure, preferred stockholders would have separate voting rights on certain matters and mightcould have other rights, preferences or privileges more favorable than those of our common stockholders, and the issuance of preferred stock could have the effect of delaying, deferring or preventing a transaction or a change of control that mightcould involve a premium price for holders of our common stock or otherwise be in the best interest of our common stockholders. Holders of our common stock will directly or indirectly bear all of the costs associated with offering and servicing any preferred stock that we issue. In addition, any interests of preferred stockholders maywould not necessarily align with the interests of holders of our common stock and the rights of holders of shares of preferred stock to receive distributions would be senior to those of holders of shares of our common stock. We do not, however, anticipate issuing preferred stock in the next 12 months.
We are not generally able to issue and sell our common stock at a price below net asset value per share. We may,could, however, sell our common stock, or warrants, options or rights to acquire our common stock, at a price below the then-current net asset value per share of our common stock if our board of directors determines that such sale is in the best interests of us and our stockholders, and if our stockholders approve such sale. In any such case, the price at which our securities are to be issued and sold may notcannot be less than a price that, in the determination of our board of directors, closely approximates the market value of such securities (less any distributing commission or discount). If we raise additional funds by issuing common stock or senior securities convertible into, or exchangeable for, our common stock, then the percentage ownership of our stockholders at that time willwould decrease, and holders of our common stock mightcould experience dilution.
We intend to finance our investments with borrowed money, which will magnifyaccelerate and increase the potential for gain or loss on amounts invested and maycould increase the risk of investing in us.
The use of leverage magnifiesaccelerates and increases the potential for gain or loss on amounts invested. The use of leverage is generally considered a speculative investment technique and increases the risks associated with investing in our
53
securities. The amount of leverage that we employ will depend on GC Advisors’ and our board of directors’ assessment of market and other factors at the time of any proposed borrowing. While we intend to target a leverage ratio of 0.85x to 1.25x debt-to-equity, this limitation will not prevent us from incurring additional leverage or otherwise exceeding such leverage ratio to the full extent permissible under the 1940 Act, including during periods when we are experiencing unusual market volatility or other unexpected conditions.
We cannot assure you that we will be able to obtain credit at all or on terms acceptable to us. While leverage presents opportunities for increasing our total return, it also has the potential to increase losses. Accordingly, any event that adversely affects the value of an investment would be magnified to the extent we use leverage. Such events could result in a substantial loss to us, which would be greater than if leverage had not been used. In addition, our investment objectives are dependent on the continued availability of leverage at attractive relative interest rates.
We maycould issue senior debt securities to banks, insurance companies and other lenders. Lenders of these senior securities will have fixed dollar claims on our assets that are superior to the claims of our common stockholders, and we would expect such lenders to seek recovery against our assets in the event of a default. We mayhave the ability to pledge up to 100% of our assets and maycan grant a security interest in all of our assets under the terms of any debt instruments we maycould enter into with lenders. The terms of our existing indebtedness require us to comply with certain financial and operational covenants, and we expect similar covenants in future debt instruments. Failure to comply with such covenants could result in a default under the applicable credit facility or debt instrument if we are unable to obtain a waiver from the applicable lender or holder, and such lender or holder could accelerate repayment under such indebtedness and negatively affect our business, financial condition, results of operations and cash flows. In addition, under the terms of any credit facility or other debt instrument we enter into, we are likely to be required by its terms to use the net proceeds of any investments that we sell to repay a portion of the amount borrowed under such facility or instrument before applying such net proceeds to any other uses. If the value of our assets decreases, leveraging would cause our net asset value to decline more sharply than it otherwise would have had we not leveraged,used leverage, thereby magnifying losses or eliminating our equity stake in a leveraged investment. Similarly, any decrease in our net investment income will cause our net income to decline more sharply than it would have had we not borrowed. Such a decline would also negatively affect our ability to make distributions on our common stock or any outstanding preferred stock. Our ability to service our debt depends largely on our financial performance and is subject to prevailing economic conditions and competitive pressures. Our common stockholders bear the burden of any increase in our expenses as a result of our use of leverage, including interest expenses and any increase in the base management fee payable to GC Advisors.
The following table illustrates the effect of leverage on returns from an investment in our common stock as of September 30, 2018,2021, assuming various annual returns, net of expenses. The calculations in the table below are hypothetical and actual returns maycould be higher or lower than those appearing in the table below.
| Assumed Return on Our Portfolio (Net of Expenses) | |||||||||
| -10% | -5% | 0% | 5% | 10% | |||||
Corresponding return to common stockholder(1) | -22.24% | -12.77% | -3.30% | 6.17% | 15.65% | ||||
| Assumed Return on Our Portfolio (Net of Expenses) | |||||||||||||||||||||||||||||
| -10% | -5% | 0% | 5% | 10% | |||||||||||||||||||||||||
Corresponding return to common stockholder(1) | -22.99% | -12.99% | -2.99% | 7.00% | 17.00% | ||||||||||||||||||||||||
(1)Assumes $5.2 billion in total assets, $2.6 billion in debt and secured borrowings outstanding and $2.6 billion in net assets as of September 30, 2021 and an effective annual interest rate of 3.01% as of September 30, 2021. |
Based on our outstanding indebtedness of $845.7 million$2.6 billion as of September 30, 20182021 and the effective annual interest rate, which includes amortization of 3.78%debt financing costs, amortization of discounts on notes issued and non-usage facility fees, of 3.01% as of that date, our investment portfolio would have been required to experience an annual return of at least 1.70%1.50% to cover annual interest payments on the outstanding debt.
54
commercial lenders or other financing providers, which could result in us being dependent on the 200% asset coverage requirement. Effectivenesscontinued availability of the reduced asset coverage requirement tocapital from such financing providers. Consequently, available financing could be more expensive or on terms that are less desirable than in an environment with a business development company requires approval by either (1) a “required majority,” as defined in Section 57(o)larger number of the 1940 Act, of such business development company’s board of directors with effectiveness one year after the date of such approval or (2) a majority of votes cast at a special or annual meeting of such business development company’s stockholders at which a quorum is present, which is effective the date after such stockholder approval. On November 27, 2018, our board of directors recommended that we seek shareholder approval to reduce our asset coverage requirement to 150.0% at our annual meeting of stockholders currently scheduled for February 5, 2019. To the extent stockholder approval is received, we currently intend to target a GAAP debt-to-equity ratio of about 1.0x. If we were to receive either the requisite stockholder or board approval and comply with the applicable disclosure requirements, we would be able to incur additional indebtedness, which may increase our risks related to leverage. In addition, our management fee is based on our average adjusted gross assets, which includes leverage and, as a result, if we were to incur additional leverage, management fees paid to GC Advisors would increase.providers.
We are subject to risks associated with the 2014 Debt Securitization and 2018 Debt Securitization.Securitizations.
As a result of the 20142018 Debt Securitization and the GCIC 2018 Debt Securitization, (each a “Debt Securitization” and, collectively, the “Debt Securitizations”), we are subject to a variety of risks, including those set forth below. We use the term “debt securitization” in this annual report on Form 10-K to describe a form of secured borrowing under which an operating company (sometimes referred to as an “originator” or “sponsor”) acquires or originates mortgages, receivables, loans or other assets that earn income, whether on a one-time or recurring basis (collectively, “income producing assets”), and borrows money on a non-recourse basis against a legally separate pool of loans or other income producing assets. In a typical debt securitization, the originator transfers the loans or income producing assets to a single-purpose, bankruptcy-remote subsidiary (also referred to as a “special purpose entity”), which is established solely for the purpose of holding loans and income producing assets and issuing debt secured by these income producing assets. The special purpose entity completes the borrowing through the issuance of notes secured by the loans or other assets. The special purpose entity may issue the notes in the capital markets to a variety of investors, including banks, non-bank financial institutions and other investors. The special purpose entities that issued the notes in the 2018 Debt Securitization and the GCIC 2018 Debt Securitization were the 2018 Issuer and the GCIC 2018 Issuer, respectively (each such special purpose entity, a “Securitization Issuer”). The 2018 Issuer and the GCIC 2018 Issuer are wholly-owned subsidiaries of 2018 CLO Depositor and GCIC CLO Depositor, respectively, each a wholly-owned subsidiary of the Company (each a “CLO Depositor”). In each of the 2014 Debt Securitization and 2018 Debt Securitization,Securitizations, institutional investors purchased thecertain notes issued by the 2014applicable Securitization Issuer and 2018 Issuer, respectively, in private placements.
We are subject to certain risks as a result of our direct interests in the junior notes and membership interests of the 2014 Issuer and ouror indirect interests in the junior notes and membership interests of the 2018 Debt Securitization.each Securitization Issuer.
Under the terms of the respective loan sale agreement or loan sale agreements governing the 2014each Debt Securitization, we sold and/or contributed to the 2014applicable Securitization Issuer all of our ownership interest in our portfolio loans and participations for the purchase price and
other consideration set forth in such loan sale agreement. Following this transfer, the 2014applicable Securitization Issuer held all of the ownership interest in such portfolio loans and participations. As a result of the 2014 Debt Securitization and as of September 30, 2018, we held the Class C-R 2014 Notes as well as all of the membership interests of the 2014 Issuer. As a result, we consolidate the financial statements of the 2014 Issuer, as well as our other subsidiaries, in our consolidated financial statements.
As a result of the 2018 Debt Securitization,September 30, 2021, we held indirectly through the applicable CLO Depositor, as of November 16, 2018, the Class C-2 2018 Notes, the Class D 2018 Notes, and the Subordinated 2018 Notes, as well as membership interests, which compriseand 100% of the equitymembership interests in the 2018 Issuer, the Class C GCIC 2018 Notes, the Class D GCIC 2018 Notes, the Subordinated GCIC 2018 Notes and 100% of the membership interests in the GCIC 2018 Issuer. As a result, we consolidate the financial statements of the 2018 Issuer and the GCIC 2018 Issuer, as well as our other subsidiaries, in our consolidated financial statements.
55
Because each of the 2014 Issuer, theSecuritization Issuers and CLO Depositor and the 2018 IssuerDepositors is disregarded as an entity separate from its owner for U.S. federal income tax purposes, the sale or contribution by us or a CLO Depositor to the 2014a Securitization Issuer and the sale and contributionor by us to thea CLO Depositor and the CLO Depositor to the 2018 Issuer did not constitute a taxable event for U.S. federal income tax purposes. If the U.S. Internal Revenue Service were to take a contrary position, there could be a material adverse effect on our business, financial condition, results of operations or cash flows. We may,could, from time to time, hold asset-backed securities, or the economic equivalent thereof, issued by a securitization vehicle sponsored by another business development company to the extent permitted under the 1940 Act.
The Class C-R 2014 Notesnotes and membership interests that we hold that are issued by the Securitization Issuers are subordinated obligations of the 2014 Issuer and the Class C-2 Notes, the Class D Notes, Subordinated Notes, and membership interests are subordinated obligations of the 2018applicable Securitization Issuer and we may not receivecould be prevented from receiving cash from the 2014 Issuer or the 2018such Securitization Issuer.
The Class C-R 2014 Notesnotes issued by the Securitization Issuers and retained by us are the most junior class of notes issued by the 2014applicable Securitization Issuer, are subordinated in priority of payment to the Class A-R 2014 Notes and the Class B-R 2014 Notesother notes issued by such Securitization Issuer and are subject to certain payment restrictions set forth in the indenture governing the 2014 Notes.notes issued by such Securitization Issuer. Therefore, we only receive cash distributions on the Class C-R 2014such Notes if the 2014applicable Securitization Issuer has made all cash interest payments to all other notes it has issued. Consequently, to the extent that the value of the 2014 Issuer’s portfolio of loan investments held by a Securitization Issuer has been reduced as a result of conditions in the credit markets, or as a result of defaulted loans or individual fund assets, the value of the Class C-R 2014 Notesany notes that we have retained at their redemption could be reduced. If the 2014a Securitization Issuer does not meet the asset coverage tests or the interest coverage test set forth in the documents governing the 2014applicable Debt Securitization, cash would be diverted from the Class C-R 2014 Notesnotes that we hold to first pay the Class A-R 2014 Notes and Class B-R 2014 Notesmore senior notes issued by such Securitization Issuer in amounts sufficient to cause such tests to be satisfied.
The interests of holders of the senior classes of securities issued by the 2014 Issuer and 2018 Issuer maySecuritization Issuers could not be aligned with our interests.
The Class A-R 2014 Notesnotes issued by each Securitization Issuer that are theheld by third parties (the “Senior Securitization Notes”) are debt obligations ranking senior in right of payment to other securities issued by the 2014respective Securitization Issuer in the 2014applicable Debt Securitization. As such, there are circumstances in which the interests of holders of the Class A-R 2014Senior Securitization Notes may not be aligned with the interests of holders of the other classes of notes issued by, and membership interests of, the 2014 Issuer. For example, under the terms of the Class A-R 2014 Notes,
If an event of default has occurred and acceleration occurs in accordance with the terms of the indenture for either the 2014 Debt Securitization or the 2018a Debt Securitization, the Controlling Class of such debt securitization, as the most senior class of notes or loans then outstanding in such debt securitization will be paid in full before any further payment or distribution on the more
56
junior classes of notes and membership interests. In addition, if an event of default under the 2014a Debt Securitization, or the 2018 Debt Securitization, as applicable occurs, holders of a majority of the Controlling Class of the applicable debt securitization maycould be entitled to determine the remedies to be exercised under the applicable indenture, subject to the terms of such indenture. For example, upon the occurrence of an event of default with respect to the notes issued by the 20142018 Issuer, the trustee or holders of a majority of the Controlling Class maycould declare the principal, together with any accrued interest, of all the notes of such class and any junior classes to be immediately due and payable. This would have the effect of accelerating the principal on such notes, triggering a repayment obligation on the part of the 20142018 Issuer. If at such time the portfolio loans were not performing well, the 2014Securitization Issuer maycould not have sufficient proceeds available to enable the trustee under the indenture to repay the obligations of holders of the Class C-R 2014 Notes,notes we hold, or to pay a dividend to holders of the membership interests.
Remedies pursued by the Controlling Class could be adverse to the interests of the holders of the notes that are subordinated to the Controlling Class (which would include the Class C-R 2014 Notes to the extent the Class A-R 2014 Notes or Class B-R 2014 Notes constitute the Controlling Class and the Class C‑2 2018 Notes, Class D 2018 Notes and Subordinated 2018 Notes to the extent the Class A 2018 Notes, Class B 2018 Notes, Class C-1 2018 Notes and Class C-2 2018 Notes, or Class D 2018 Notes constitute the Controlling Class),Class, the Class B‑2 GCIC 2018 Notes, Class C GCIC 2018 Notes, Class D GCIC 2018 Notes and Subordinated GCIC 2018 Notes to the extent the Class A-1 GCIC 2018 Notes, Class A-2 GCIC 2018 Notes, Class B GCIC 2018 Notes, Class C GCIC 2018 Notes or Class D GCIC 2018 Notes constitute the Controlling Class and the Controlling Class will have no obligation to consider any possible adverse effect on such other interests. Thus, we cannot assure you that any remedies pursued by the Controlling Class will be in the best interests of the applicable CLO Depositor or us or that the applicable CLO Depositor or we will receive any payments or distributions upon an acceleration of the notes. In a liquidation under any of the 2014 Debt Securitization,Securitizations, the Class C-R 2014 Notesnotes that we have directly or indirectly retained will be subordinated to payment of the Class A-R 2014 Notesother classes notes issued by the applicable Securitization Issuer and Class B-R 2014 Notes and maycould not be paid in full to the extent funds remaining after payment of the Class A-R 2014 Notes and Class B-R 2014 Notesmore senior notes not held by us are insufficient. In addition, under the 2014 Debt Securitization, after the Class A-R 2014 Notes and Class B-R 2014 Notescertain senior classes of notes are paid in full, the holder of the Class C-R 2014 Notes will be the only remaining noteholder and may amend the applicable indenture to, among other things, direct the assignment of any remaining assets to other wholly-owned subsidiaries for a price less than the fair market value of such assets with the difference in price to be considered an equity contribution to such subsidiaries. In a liquidation under the 2018 Debt Securitization, the Class C-2 2018 Notes, Class D 2018 Notes and Subordinated 2018 Notes will be subordinated to payment of the Class A 2018 Notes, Class B 2018 Notes and, in the case of the Class D 2018 Notes and Subordinated 2018 Notes only, the Class C-1 2018 Notes, and may not be paid in full to the extent funds remaining after payment of the Class A 2018 Notes, Class B 2018 Notes and, in the case of the Class D 2018 Notes and Subordinated 2018 Notes only, the Class C-1 2018 Notes are insufficient. In addition, under the 2018 Debt Securitization, after the Class A 2018 Notes, Class B 2018 Notes and Class C-1 2018
Under the documents governing the 2014each Debt Securitization, there are two asset coverage tests applicable to the Class A-R 2014 Notes, the Class B-R 2014 Notes and the Class C-R 2014 Notes, and the documents governing the 2018 Debt Securitization provide for the same two asset coverage tests applicable to the Class A 2018 Notes, the Class B 2018 Notes, the Class C-1 2018 Notes, the Class C-2 2018 Notes and the Class D 2018 Notes.Notes, with respect to the 2018 Issuer; and the Class A GCIC 2018 Notes, Class B GCIC 2018 Notes, Class C GCIC 2018 Notes and Class D GCIC 2018, with respect to the GCIC 2018 Issuer.
The first such test compares the amount of interest received on the portfolio loans held by the 2014applicable Securitization Issuer or the 2018 Issuer, as applicable, to the amount of interest payable in respect of the Class A-R 2014 Notes, the Class B-R 2014 Notes and the Class C-R 2014 Notes, with respect to the 2014 Issuer, and the Class A 2018 Notes, the Class B 2018 Notes, the Class C-1 2018 Notes, the Class C-2 2018 Notes and the Class D 2018 Notes, with respect to the 2018 Issuer.applicable class of notes. To meet this first test, in the case of the 2014 Debt Securitization, interest received on the portfolio loans must equal at least 120% of the interest payable in respect of the Class A-R 2014 Notes and Class B-R 2014 Notes, taken together, and at least 110% of the interest payable in respect of the Class C-R 2014 Notes, and, in the case of the 2018 Debt Securitization, interest received on the portfolio loans must equal at least 120% of the interest payable in respect of the Class A 2018 Notes and Class B 2018 Notes, taken together, at least 110% of the interest payable in respect of the Class C-1 2018 Notes and the Class C-2 2018 Notes, taken together, and at least 105% of the interest payable in respect of the Class D 2018 Notes; and, in the case of the GCIC 2018 Debt Securitization, interest received on the portfolio loans must equal at least 120% of the interest payable in respect of the Class A GCIC 2018 Notes and Class B GCIC 2018 Notes, taken together, and at least 110% of the interest payable in respect of the Class C GCIC 2018 Notes and at least 105% of the interest payable in respect of the Class D GCIC 2018 Notes.
The second such test compares the principal amount of the portfolio loans of the applicable debt securitizationDebt Securitization to the aggregate outstanding principal amount of the Class A-R 2014 Notes, the Class B-R 2014 Notes and the Class C-R 2014 Notes, with respect to the 2014 Debt Securitization, and the Class A 2018 Notes, the Class B 2018 Notes, the Class C-1 2018 Notes, the Class C-2 2018 Notes and the Class D 2018 Notes, with respect to the 2018 Debt Securitization. To meet this second test at any time in the caseapplicable class of the 2014 Debt Securitization, the aggregate principal amount of the portfolio loans must equal at least 153.6% of the Class A-R 2014 Notes and the Class B-R 2014 Notes, taken together, and 136.1% of the Class C-R 2014 Notes.notes. To meet this second test at any time in the case of the 2018 Debt Securitization, the aggregate principal amount of the portfolio loans must equal at least 145.6% of the Class A 2018 Notes and Class B 2018 Notes, taken together, at least 126.7% of the Class C-1 2018 Notes and Class C-2 2018 Notes, taken together, and at least 116.7% of the Class D 2018 Notes. To meet this second test at any time in the case of the GCIC 2018 Debt Securitization, the aggregate principal amount of the portfolio loans must equal at least 147.9% of the Class A GCIC 2018 Notes and Class B GCIC 2018 Notes, taken together, at least 127.1% of the Class C GCIC 2018 Notes and at least 117.5% of the Class D GCIC 2018 Notes.
57
If any asset coverage test with respect to the Class A-R 2014 Notes, the Class B-R 2014 Notes or Class C-R 2014 Notesa class of notes is not met, proceeds from the portfolio of loan investments that otherwise would have been distributed to the holders of the Class C-R 2014 Notesnotes and the 2014 Issuermembership interests that we hold will instead be used to redeem first the Class A-R 2014 Notesmost senior class of notes in such Debt Securitization and then the Class B-R 2014 Notes, to the extent necessary to satisfy the applicable asset coverage tests on a pro forma basis after giving effect to all payments made in respecteach next most senior class of the notes, which we refer to as a mandatory redemption, or to obtain the necessary ratings confirmation. If any asset coverage test with respect to the Class A 2018 Notes, the Class B 2018 Notes, Class C-1 2018 Notes, Class C-2 2018 Notes or Class D 2018 Notes is not met, proceeds from the portfolio of loan investments that otherwise would have been distributed to the holders of the Class C-1 2018 Notes, Class C-2 2018 Notes, Class D 2018 Notes or Subordinated 2018 Notes and the 2018 Issuer will instead be used to redeem first the Class A 2018 Notes, then the Class B 2018 Notes and then the Class C-1 2018 Notes and Class C-2 2018 Notes, to the extent necessary to satisfy the applicable asset coverage tests on a pro forma basis after giving effect to all payments made in respect of the notes, which we refer to as a mandatory redemption, or to obtain the necessary ratings confirmation.
The value of the Class B-R 2014 Notes, Class C-2 2018 Notes, Class D 2018 Notes, Subordinated 2018 Notes, Class B-2 GCIC 2018 Notes, Class C GCIC 2018 Notes, Class D GCIC 2018 Notes or the Subordinated GCIC 2018 Notes could be adversely affected by a mandatory redemption because such redemption could result in the applicable notes being redeemed at par at a time when they are trading in the secondary market at a premium to their stated principal amount and when other investments bearing the same rate of interest maycould be difficult or expensive to acquire. A mandatory redemption could also result in a shorter investment duration than a holder of such notes maycould have wanted or anticipated, which could, in turn, result in such a holder incurring breakage costs on related hedging transactions. In addition, the reinvestment period under the 2018 Debt Securitization mayand the 2018 GCIC Debt Securitization could extend
through as late as January 15, 2023 and January 20, 2023, respectively. During the respective reinvestment period, market conditions and restrictions on investment under the indenture governing the applicable Debt Securitization could result in periods of time in which the applicable Securitization Issuer is not able to fully invest its available collateral or during which collateral available is not of comparable quality or yield, which could affect the value of the collateral securing the Class C-2 2018 Notes, Class D 2018 Notes, or Subordinated 2018 Notes.notes issued by such Securitization Issuer that we hold.
We maycould be required to assume liabilities of the 2014 Issuer and 2018a Securitization Issuer and are indirectly liable for certain representations and warranties in connection with the 2014 Debt Securitization and 2018each Debt Securitization.
The structure of the 2014 Debt Securitization is intended to prevent, in the event of our bankruptcy, the consolidation of the 2014 Issuer with our operations. The structure of the 2018each Debt Securitization is intended to prevent, in the event of our bankruptcy or the bankruptcy of thea CLO Depositor, if applicable, the consolidation of the 2018applicable Securitization Issuer with our operations or those ofwith the applicable CLO Depositor. If the true sale of the assets in the 2014each Debt Securitization and the 2018 Debt Securitization, as applicable, were not respected in the event of our insolvency, a trustee or debtor-in-possession might reclaim the assets of the 2014 Issuer and 2018applicable Securitization Issuer for our estate. However, in doing so, we would become directly liable for all of the indebtedness then outstanding under the 2014 Debt Securitization and 2018applicable Debt Securitization, which would equal the full amount of debt of the 2014 Issuer and 2018applicable Securitization Issuer reflected on our consolidated balance sheet. In addition, we cannot assure you that the recovery in the event we were consolidated with the 2014 Issuer or the 2018a Securitization Issuer for purposes of any bankruptcy proceeding would exceed the amount to which we would otherwise be entitled as the holder of the Class C-R 2014 Notes,notes issued by such Securitization Issuer and the indirect holder of the Class C-2 2018 Notes and Class D 2018 Notesretained by us had we not been consolidated with the 2014 Issuer and 2018applicable Securitization Issuer.
In addition, in connection with each of the 2014 Debt Securitization and 2018 Debt Securitization,Securitizations, we indirectly gave the lenders certain customary representations with respect to the legal structure of the 2014respective Securitization Issuer, and 2018 Issuer, respectively, and the quality of the assets transferred to each entity. We remain indirectly liable for any breach of such representations for the life of the 2014applicable Debt Securitization.
Certain Securitization and 2018 Debt Securitization, respectively.
Under the terms of the documents governing the 2018 Debt Securitization documents,and the GCIC 2018 Debt Securitization, the applicable Securitization Issuer could issue additional Subordinated 2018 Notesnotes and use the net proceeds of such issuance to purchase additional portfolio loans. Any such additional issuance, however, would require the consent of the collateral manager to the applicable Debt Securitization and, in the case of each of the 2018 Debt Securitization and the GCIC 2018 Debt Securitization, the applicable CLO Depositor and a supermajority of the Subordinated 2018 Notes.Notes or Subordinated GCIC 2018 Notes , as applicable. Among the other conditions that must be satisfied in connection with an additional issuance of Subordinated 2018 Notes,notes, the aggregate principal amount of all additional issuances of Subordinated 2018 Notesnotes may not exceed 100% of the respective original outstanding principal amount of such class of notes; the Subordinated 2018 Notes; the 2018applicable Securitization Issuer must notify each rating agency of such issuance prior to the issuance date; and the terms of the Subordinated 2018 Notesnotes to be issued must be identical to the terms of previously issued Subordinated 2018 Notesnotes of the same class (except that the interestall monies due on such additional Subordinated 2018 Notesnotes will accrue from the issue date of such notes and that the interest ratespread over LIBOR and priceprices of such Subordinated 2018 Notes maynotes do not have to be lower (but not higher) thanidentical to those of the initial Subordinated 2018 Notes)notes, provided that the interest rate on such additional notes must not exceed the interest rate applicable to the initial class of such notes). We do not expect to cause the 2018 Issuer or the GCIC 2018 Issuer to issue any additional Subordinated 2018 Notesnotes at this time. We maycould amend the 2018documents governing each Debt Securitization documents from time to time, and without amendment, the 2018 Debt Securitization documents do not provide for additional issuances of Class A 2018 Notes. The total purchase price for any
58
additional Subordinated 2018 Notesnotes that maycould be issued may not always equal 100% of the par value of such 2018 Notes,notes, depending on several factors, including fees and closing expenses.
We are subject to risks associated with theany Revolving Credit Facilities.
We own directly or indirectly 100% of the equity interests in each of our Funding and 2010 Issuer.Subsidiaries. We consolidate the financial statements of our Funding and 2010 IssuerSubsidiaries in our consolidated financial statements and treat the indebtedness under the Revolving Credit Facilities as our leverage. Our interests in our Funding and 2010 IssuerSubsidiaries are subordinated in priority of payment to every other obligation of such Funding and 2010 IssuerSubsidiary and are subject to certain payment restrictions set forth in each Revolving Credit Facility. We receive cash distributions on our equity interests in our Funding and 2010 IssuerSubsidiaries only if such Funding and 2010 Issuer haveSubsidiary has made all required cash interest payments to the respective lenders and no default exists under the respective Revolving Credit Facility. We cannot assure you that
distributions on the assets held by our Funding or 2010 IssuerSubsidiaries will be sufficient to make any distributions to us or that such distributions will meet our expectations.
We receive cash from a Funding or 2010 IssuerSubsidiary only to the extent that we receive distributions on our equity interests in such Funding and 2010 Issuer.Subsidiary. Each Funding and 2010 Issuer each maySubsidiary could make distributions on theirits equity interests only to the extent permitted by the payment priority provisions of the applicable Revolving Credit Facility. Each of the Revolving Credit Facilities generally provides that payments on the respective interests maycould not be made on any payment date unless all amounts owing to the lenders and other secured parties are paid in full. In addition, if a Funding or 2010 doSubsidiary does not meet the asset coverage tests or the interest coverage test set forth in the documents of the applicable Revolving Credit Facility, a default would occur. In the event of a default under eithera Revolving Credit Facility document, cash would be diverted from us to pay the applicable lender and other secured parties in amounts sufficient to cause such tests to be satisfied. In the event that we fail to receive cash from our Funding and/or 2010 Issuer,Subsidiaries, we could be unable to make distributions to our stockholders in amounts sufficient to maintain our status as a RIC, or at all. We also could be forced to sell investments in portfolio companies at less than their fair value in order to continue making such distributions.
Our equity interests in each Funding and 2010 IssuerSubsidiary rank behind all of the secured and unsecured creditors, known or unknown, of such Funding and 2010 Issuer, as applicable,Subsidiary, including the lenders in the respective Revolving Credit Facility. Consequently, to the extent that the value of Funding’s or 2010 Issuer'sa Funding Subsidiary's portfolio of loan investments has been reduced as a result of conditions in the credit markets, defaulted loans, capital gains and losses on the underlying assets, prepayment or changes in interest rates, the returns on our investments in such Funding or 2010 IssuerSubsidiary could be reduced. Accordingly, our investments in each of our Funding and 2010 Issuer maySubsidiaries could be subject to up to 100% loss.
The ability to sell investments held by our Funding and 2010 IssuerSubsidiaries is limited.
Each of the Revolving Credit Facilities place significant restrictions on our ability, as servicer, to sell investments. As a result, there maycould be times or circumstances during which we are unable to sell investments or take other actions that might be in our best interests.
Our ability to invest in public companies may beis limited in certain circumstances.
To maintain our status as a business development company, we are not permitted to acquire any assets other than “qualifying assets” specified in the 1940 Act unless, at the time the acquisition is made, at least 70% of our total assets are qualifying assets (with certain limited exceptions). Subject to certain exceptions for follow-on investments and investments in distressed companies, an investment in an issuer that has outstanding securities listed on a national securities exchange maycould be treated as qualifying assets only if such issuer has a common equity market capitalization that is less than $250.0 million at the time of such investment.
We maycan enter into reverse repurchase agreements, which are another form of leverage.
We may entercan, and have in the past, entered into reverse repurchase agreements as part of our management of our temporary investment portfolio. Under a reverse repurchase agreement, we will effectively pledge our assets as collateral to secure a short-term loan.loan where the counterparty acquires securities we hold as collateral subject to our obligation to repurchase and its obligation to resell the securities at an agreed upon time and price. Generally, the other party to the agreement makes the loan in an amount equal to a percentage of the fair value of the pledged collateral. At the maturity of the reverse repurchase agreement, we will be required to repay the loan and correspondingly receive back our collateral. While used as collateral, the assets continue to pay principal and interest which are for the benefit of us.our benefit.
59
Our use of reverse repurchase agreements, if any, involves many of the same risks involved in our use of leverage, as the proceeds from reverse repurchase agreements generally will be invested in additional securities. There is a risk that the market value of the securities acquired in the reverse repurchase agreement maycould decline below the price of the securities that we have sold but remain obligated to purchase. In addition, there is a risk that the market value of the securities retained by us maycould decline. If a buyer of securities under a reverse repurchase agreement were to file for bankruptcy or experience insolvency, we maycould be adversely affected. Also, in entering into reverse repurchase agreements, we would bear the risk of loss to the extent that the proceeds of such agreements at settlement are less than the fair value of the underlying securities being pledged. In addition, due to the interest costs associated with reverse repurchase agreements, our net asset value would decline, and, in some cases, we maycould be worse off than if we had not used such agreements.
Adverse developments in the credit markets maycan impair our ability to enter into new debt financing arrangements.
During the economic downturn in the United States that began in mid-2007, many commercial banks and other
financial institutions stopped lending or significantly curtailed their lending activity. In addition, in an effort to stem
losses and reduce their exposure to segments of the economy deemed to be high risk, some financial institutions
limited routine refinancing and loan modification transactions and even reviewed the terms of existing facilities to
identify bases for accelerating the maturity of existing lending facilities. To the extent these circumstances arise
again in the future, it maycan be difficult for us to finance the growth of our investments on acceptable economic terms,
or at all and one or more of our leverage facilities could be accelerated by the lenders.
If we do not invest a sufficient portion of our assets in qualifying assets, we could fail to qualify as a business development company or be precluded from investing according to our current business strategy.
As a business development company, we may not acquireare restricted from acquiring any assets other than “qualifying assets” unless, at the time of and after giving effect to such acquisition, at least 70% of our total assets are qualifying assets. See “Business — Regulation — Qualifying Assets.”
In the future, we believe that most of our investments will constitute qualifying assets. However, we maycould be precluded from investing in what we believe are attractive investments if such investments are not qualifying assets for purposes of the 1940 Act. If we do not invest a sufficient portion of our assets in qualifying assets, we could violate the 1940 Act provisions applicable to business development companies. As a result of such violation, specific rules under the 1940 Act could prevent us, for example, from making follow-on investments in existing portfolio companies (which could result in the dilution of our position) or could require us to dispose of investments at inappropriate times in order to come into compliance with the 1940 Act. If we need to dispose of such investments quickly, it could be difficult to dispose of such investments on favorable terms. We may notcan provide no assurance that we will be able to find a buyer for such investments and, even if we do find a buyer, we may havecould be forced to sell the investments at a substantial loss. Any
such outcomes would have a material adverse effect on our business, financial condition, results of operations and cash flows.
If we do not maintain our status as a business development company, we would be subject to regulation as a registered closed-end investment company under the 1940 Act. As a registered closed-end investment company, we would be subject to substantially more regulatory restrictions under the 1940 Act which would significantly decrease our operating flexibility.
The majority of our portfolio investments are recorded at fair value as determined in good faith by our board of directors and, as a result, there maycould be uncertainty as to the value of our portfolio investments.
Under the 1940 Act, we are required to carry our portfolio investments at market value or, if there is no readily available market value, at fair value as determined pursuant to policies adopted by, and subject to the oversight of, our board of directors. The majority of our portfolio investments take the form of securities that are not publicly traded. The fair value of securities and other investments that are not publicly traded mayis often not be readily determinable, and we value these securities at fair value as determined in good faith by our board of directors, including to reflect significant events affecting the value of our securities. As discussed in more detail under “Management’s Discussion and Analysis of Financial Condition and Results of Operations - Critical Accounting Policies,” most, if not all, of our investments (other than cash and cash equivalents) are classified as Level 3 under Accounting Standards Codification, or ASC, Topic 820, Fair Value Measurement and Disclosure, as amended, or ASC Topic 820. This means that our portfolio valuations are based on unobservable inputs and our own assumptions about how market participants would price the asset or liability in question. Inputs into the determination of fair value of our portfolio investments require significant management judgment or estimation.estimation, the level of which could increase or decrease during periods of volatility or uncertainty. See “—Risks Relating to Our Business and Structure – We are currently in a period of capital markets disruption and economic uncertainty.” Even if observable market
60
data are available, such information may be the result of consensus pricing information or broker quotes, which may include a disclaimer that the broker would not be held to such a price in an actual transaction. The non-binding nature of consensus pricing and/or quotes accompanied by disclaimers materially reduces the reliability of such information.
We have retained the services of several independent service providers to review the valuation of these securities. At least once annually, the valuation for each portfolio investment for which a market quote is not readily available is reviewed by an independent valuation firm. The types of factors that the board of directors maycould take into account in determining the fair value of our investments generally include, as appropriate, comparison to publicly traded securities, including such factors as yield, maturity and measures of credit quality, the enterprise value of a portfolio company, the nature and realizable value of any collateral, the portfolio company’s ability to make payments and its earnings and discounted cash flow, the markets in which the portfolio company does business and other relevant factors. Because such valuations, and particularly valuations of private securities and private companies, are inherently uncertain, maycould fluctuate over short periods of time and maycould be based on estimates, our determinations of fair value maycould differ materially from the values that would have been used if a ready market for these securities existed. Our net asset value could be adversely affected if our determinations regarding the fair value of our investments were materially higher than the values that we ultimately realize upon the disposal of such securities.
We adjust quarterly the valuation of our portfolio to reflect our board of directors’ determination of the fair value of each investment in our portfolio. Any changes in fair value are recorded in our consolidated statement of operations as net change in unrealized appreciation or depreciation.
On the other hand, recent governmental intervention could mean that the willingness of governmental bodies to take additional extraordinary action is diminished. As a result, in the event of near-term major market disruptions, like those caused by the COVID-19 pandemic, there might be only limited additional government intervention, resulting in correspondingly greater market dislocation and tariffs. These developments, or the perception that any of them could occur, may have a material adverse effect on global economic conditions and the stability of global financial markets, and may significantly reduce global trade and, in particular, trade between the impacted nations and the United States. Any of these factors could depress economic activity and restrict our portfolio companies' access to suppliers or customers and have a material adverse effect on their business, financial condition and results of operations, which in turn would negatively impact us.materially greater market risk.
Our board of directors maycould change our investment objective, operating policies and strategies without prior notice or stockholder approval.
Our board of directors has the authority, except as otherwise provided in the 1940 Act, to modify or waive our investment objective and certain of our operating policies and strategies without prior notice and without stockholder approval. However, absent stockholder approval, we may notcannot change the nature of our business so as to cease to be, or withdraw our election as, a business development company. Under Delaware law, we also cannot be dissolved without prior stockholder approval. We cannot predict the effect any changes to our current investment objective, operating policies and strategies would have on our business, operating results and the price of our
common stock. Nevertheless, any such changes could adversely affect our business and impair our ability to make distributions.
61
Provisions of the General Corporation Law of the State of Delaware and our certificate of incorporation and bylaws couldare intended to deter takeover attempts, andwhich could have an adverse effect on the price of our common stock.
The General Corporation Law of the State of Delaware, or the DGCL, contains provisions that mayare intended to discourage, delay or make more difficult a change in control of us or the removal of our directors. Our certificate of incorporation and bylaws contain provisions that limit liability and provide for indemnification of our directors and officers. These provisions and others also maycould have the effect of deterring hostile takeovers or delaying changes in control or management. We are subject to Section 203 of the DGCL, the application of which is subject to any applicable requirements of the 1940 Act. This section generally prohibits us from engaging in mergers and other business combinations with stockholders that beneficially own 15% or more of our voting stock, or with their affiliates, unless our directors or stockholders approve the business combination in the prescribed manner. If our board of directors does not approve a business combination, Section 203 of the DGCL maycould discourage third parties from trying to acquire control of us and increase the difficulty of consummating such an offer.
We have also adopted measures that maycould make it difficult for a third party to obtain control of us, including provisions of our certificate of incorporation classifying our board of directors in three classes serving staggered three-year terms, and provisions of our certificate of incorporation authorizing our board of directors to classify or reclassify shares of our preferred stock in one or more classes or series, to cause the issuance of additional shares of our stock, and to amend our certificate of incorporation, without stockholder approval, in certain instances. These provisions, as well as other provisions of our certificate of incorporation and bylaws, maycould delay, defer or prevent a transaction or a change in control that might otherwise be in the best interests of our securityholders.
GC Advisors can resign on 60 days’ notice, and we may notcan provide no assurance that we would be able to find a suitable replacement within that time, resulting in a disruption in our operations that could adversely affect our financial condition, business and results of operations.
GC Advisors has the right to resign under the Investment Advisory Agreement at any time upon not less than 60 days’ written notice, whether we have found a replacement or not. If GC Advisors resigns, we may notcan provide no assurance that we would be able to find a new investment adviser or hire internal management with similar expertise and ability to provide the same or equivalent services on acceptable terms within 60 days, or at all. If we are unable to do so quickly, our operations are likely to experience a disruption, our business, financial condition and results of operations and cash flows as well as our ability to pay distributions are likely to be adversely affected and the market price of our shares maycommon stock could decline. In addition, the coordination of our internal management and investment activities is likely to suffer if we are unable to identify and reach an agreement with a single institution or group of executives having the expertise possessed by GC Advisors and its affiliates. Even if we are able to retain comparable management, whether internal or external, the integration of such management and their lack of familiarity with our investment objective mayand portfolio could result in additional costs and time delays that maycould adversely affect our business, financial condition, results of operations and cash flows.
The Administrator can resign on 60 days’ notice, and we may notcan provide no assurance that we would be able to find a suitable replacement, resulting in a disruption in our operations that could adversely affect our financial condition, business and results of operations.
The Administrator has the right to resign under the Administration Agreement at any time upon not less than 60 days’ written notice, whether we have found a replacement or not. If the Administrator resigns, we may notcan provide no assurance that we would be able to find a new administrator or hire internal management with similar expertise and ability to provide the same or equivalent services on acceptable terms, or at all. If we are unable to do so quickly, our operations are likely to experience a disruption, our financial condition, business and results of operations as well as our ability to pay distributions are likely to be adversely affected and the market price of our shares maycommon stock could decline. In addition, the coordination of our internal management and administrative activities is likely to suffer if we are unable to identify and reach an agreement with a service provider or individuals with the expertise possessed by the Administrator. Even if we are able to retain a comparable service provider or individuals to perform such services, whether internal or external, their integration into our business and lack of familiarity with our investment objective mayand portfolio could result in additional costs and time delays that maycould adversely affect our business, financial condition, results of operations and cash flows.
62
Risks Relating to Our Investments
Economic recessions or downturns could impair our portfolio companies and defaults by our portfolio companies will harm our operating results.
Many of our portfolio companies are susceptible to economic slowdowns or recessions and maycould be unable to repay our loans during these periods. Therefore, our non-performing assets are likely to increase and the value of our portfolio is likely to decrease during these periods. Adverse economic conditions maycould decrease the value of collateral securing someany of our loans and the value of ourany equity investments. A severe recession may further decrease the value of such collateral and result in losses of value in our portfolio and a decrease in our revenues, net income, assets and net worth. Economic slowdowns or recessions could lead to financial losses in our portfolio and a decrease in revenues, net income and assets. Unfavorable economic conditions also could increase our funding costs, limit our access to the capital markets or result in a
decision by lenders not to extend credit to us. These events could prevent us from increasing our investments and harm our operating results.
Our debt investments may beare risky and we could lose all or part of our investments.
The debt that we invest in is typically not initially rated by any rating agency, but we believe that if such investments were rated, they would be below investment grade (rated lower than “Baa3” by Moody’s Investors Service, lower than “BBB-” by Fitch Ratings or lower than “BBB-” by Standard & Poor’s Ratings Services), which under the guidelines established by these entities is an indication of having predominantly speculative characteristics with respect to the issuer’s capacity to pay interest and repay principal. Bonds that are rated below investment grade are sometimes referred to as “high yield bonds” or “junk bonds.” Therefore, our investments maycould result in an above average amount of risk and volatility or loss of principal.
Our investments in leveraged portfolio companies may beare risky, and youwe could lose all or part of yourour investment.
Investment in leveraged companies involves a number of significant risks. Leveraged companies in which we invest maycould have limited financial resources and maycould be unable to meet their obligations under their debt securities that we hold. These companies could be subject to restrictive financial and operating covenants and their leverage could impair their ability to finance their future operations and capital needs.As a result, these companies’ flexibility to respond to changing business and economic conditions and to take advantage of business opportunities could be limited. Such developments maycould be accompanied by a deterioration in the value of any collateral and a reduction in the likelihood of our realizing any guarantees that we maycould have obtained in connection with our investment. Smaller leveraged companies also maycould have less predictable operating results and maycould require substantial additional capital to support their operations, finance their expansion or maintain their competitive position.
Our investments in leveraged portfolio companies and private and middle-market portfolio companies are risky, and youwe could lose all or part of yourour investment.
Investment in private and middle-market companies involves a number of significant risks. Generally, little public information exists about these companies, and we rely on the ability of GC Advisors’ investment professionals to obtain adequate information to evaluate the potential returns from investing in these companies. If GC Advisors is unable to uncover all material information about these companies, it maywould not be able to make a fully informed investment decision and we maycould lose money on our investments. Middle-marketCompared to larger companies, generallymiddle market companies typically have shorter operating histories, more limited financial resources, newer technologies and/or products, smaller market shares, less experienced management teams and less predictable operating results, and mayoften participate in quickly evolving markets, and are more reliant on a small number of products, managers or clients. Middle market companies could also require substantial additional capital to support their operations, finance expansion or maintain their competitive position. Middle-market companies may have limited financial resources, mayposition and could have difficulty accessing the capital markets to meet future capital needs, which could limit their ability to grow or to repay their outstanding indebtedness upon
63
maturity. In addition, the middle market companies in which we invest could be subject to governmental and maynon-governmental regulations, including by federal and state regulators and various self-regulatory organizations and the costs of complying with these laws and regulations could be unablemore material to meet their obligations under their debt securities thatthe company as compared to a larger company. If a company in which we hold,directly or indirectly invest fails to comply with an applicable regulatory regime, it could be subject to fines, injunctions, operating restrictions or criminal prosecution, any of which may be accompanied by a deterioration incould materially and adversely affect the value of any collateral andour investment. We will not control a reductionportfolio company’s management or the manner in which a company’s management addresses the company’s risks except in the likelihoodevent that a portfolio company defaults on its loan from us and we seek to enforce our security interest. In addition, middle market companies often require additional financing to expand or maintain their competitive position, and they could have a more difficult time obtaining additional capital than larger companies.
An important concern in making investments is the possibility of material misrepresentation or omission on the part of the portfolio company. Such inaccuracy or incompleteness can adversely affect, among other things, the valuation of collateral, other debt obligations, our ability to perfect or effectuate a lien on the collateral securing a loan or other debt obligation, the financial condition of the issuer, or the business prospects of the issuer. We will rely upon the accuracy and completeness of representations made by portfolio companies to the extent reasonable. However, there can be no guarantee that such representations are accurate or complete.
If the issuer of securities purchased by us does not perform to GC Advisors’ expectations, the value of its equity and debt securities would likely decline and the issuer could default on its obligations. Poor performance can be caused by a number of factors, including failures of management, competitive pressures, pressure by customers and suppliers, labor unrest, or force majeure events, such as the current COVID-19 pandemic. While GC Advisors intends to invest in portfolio companies in industries that it believes are insulated from the effects of the COVID-19 pandemic, there can be no assurance that such portfolio companies will not be adversely affected by the COVID-19 pandemic or other market or economic conditions.
The value of our realizinginvestments in loans will likely be detrimentally affected to the extent a borrower defaults on its obligations, there is insufficient collateral, and/or there are extensive legal and other costs incurred in collecting on a defaulted loan. GC Advisors will attempt to minimize this risk, for example, by maintaining low loan-to-liquidation values with each loan and the collateral underlying the loan. However, there can be no assurance that the liquidation value assigned by GC Advisors would be realized by the portfolio company upon liquidation, nor can there be any guarantees we may have obtained in connection with our investment.assurance that such collateral will retain its value. In addition, certain of our loans will be supported, in whole or in part, by personal guarantees made by the borrower or an affiliate of the borrower. If such companies typically have shorter operating histories, narrower product linesguarantee is called and smaller market shares than larger businesses, which tendthe guarantor fails to render them more vulnerablemeet its obligations under the guarantee, the amount realizable with respect to competitors’ actions and market conditions,a loan will generally be detrimentally affected. There could be a monetary as well as general economic downturns. Additionally, middle-marketa time cost involved in collecting on defaulted loans and, if applicable, taking possession of various types of collateral. In addition, any activity deemed to be active lending/origination by us could subject it to additional regulation.
An investment strategy focused primarily on privately held companies arepresents certain challenges, including, but not limited to, the lack of available information about these companies.
We invest primarily in privately held companies.Because private companies have reduced access to the capital markets, such companies may have diminished capital resources and ability to withstand financial distress.Often, the depth and breadth of experience of management in private companies tends to be less than that at public companies, which makes such companies more likely to depend on the management talents and efforts of a smallsmaller group of persons. persons and/or persons with less depth and breadth of experience.Therefore, the death, disability, resignation decisions made by such management teams and/or terminationthe departure of one or more of these persons could have a material adverse impact on ourthe portfolio company and, in turn, on us. Middle-market companies also mayas a result our investments.
We would be parties to litigation and may be engaged in rapidly changing businesses with products subject to a substantial riskrisks if we are required to assume operation of obsolescence. In addition, our executive officers, directors andportfolio companies upon default.
We, together with other funds managed by GC Advisors may,and its affiliates, would be expected to take over a portfolio company if the company defaults on its loans. Depending on factors including the health of the economy, the credit cycle, and the portfolio companies’ various industries, it is reasonable to assume that portfolio companies will default over time, and this risk is significantly increased by the COVID-19 pandemic. In such circumstances, we and the other funds would likely seek to enforce our rights under the applicable credit documentation and could opt to take over such portfolio companies. When a portfolio company is taken over, we and the other funds and their investors are subject to different risks than we are as holders of interests in loans to such portfolio company. Operating a portfolio company, even for a limited period of time pending the ordinary coursesale of business,collateral, can distract senior personnel of GC Advisors and its affiliates from their normal business. Additionally, defaulting portfolio companies
64
often require additional capital to be named as defendants in litigation arising fromeffectively turned around. There is no guarantee that any defaulting portfolio company can be turned around or that our investments in thesuch portfolio companies.company will be successful. Finally, operating a portfolio company could subject us to potential liabilities, including management, employment, and/or environmental liabilities
The lack of liquidity in our investments maycould adversely affect our business.
Price declines and illiquidity in the corporate debt markets maycould adversely affect the fair value of our portfolio investments, reducing our net asset value through increased net unrealized depreciation.
As a business development company, we are required to carry our investments at market value or, if no market value is ascertainable, at fair value as determined in good faith by our board of directors. The fair value methodology utilized is in accordance with the fair value principles established by the Accounting Standards Codification Topic 820. Our board of directors uses the services of one or more independent service providers to review the valuation of our illiquid investments. Valuations reflect significant events that affect the value of the instruments. As part of the valuation process, we maycould take into account the following types of factors, if relevant, in determining the fair value of our investments:
•a comparison of the portfolio company’s securities to publicly traded securities;
•the enterprise value of the portfolio company;
•the nature and realizable value of any collateral;
•the portfolio company’s ability to make payments and its earnings and discounted cash flow;
•the markets in which the portfolio company does business; and
•changes in the interest rate environment and the credit markets generally that maycould affect the price at which similar investments maycould be made in the future and other relevant factors.
The fair value measurement seeks to approximate the price that would be received for an investment on a current sale and assumes that the transaction to sell an asset occurs in the principal market for such asset or, in the absence of a principal market, the most advantageous market for such asset, which could be a hypothetical market, and excludes transaction costs. When an external event such as a purchase transaction, public offering or subsequent equity sale occurs, we use the pricing indicated by the external event to corroborate our valuation. We record decreases in the market values or fair values of our investments as unrealized depreciation. Declines in prices and liquidity in the corporate debt markets maycould result in significant net unrealized depreciation in our portfolio. The effect of all of these factors on our portfolio maycould reduce our net asset value by increasing net unrealized depreciation in our portfolio. Depending on market conditions, we could incur substantial realized losses and maycould suffer additional unrealized losses in future periods, which could have a material adverse effect on our business, financial condition, results of operations and cash flows. Because orderly markets currently do not exist for some investments, and because valuations, and particularly valuations of private investments and private companies, require judgment, are inherently uncertain, could fluctuate over short periods and are often based on estimates, our determinations of the fair value of investments could differ materially from the values that would have been used had a ready market existed for such investments.
65
Portfolio companies maycould prepay loans, which maycould reduce our yields if capital returned cannot beis not invested in transactions with equal or greater expected yields.
The loans in our investment portfolio maycould be prepaid at any time, generally with little advance notice. Whether a loan is prepaid will depend both on the continued positive performance of the portfolio company and the existence of favorable financing market conditions that allow such company the ability to replace existing financing with less expensive capital. As market conditions change, we do not know when, and if, prepayment maycould be possible for each portfolio company. In some cases,Certain fixed-income securities are subject to the risk of unanticipated prepayment. Prepayment risk is the risk that, when interest rates fall, the issuer will redeem the security prior to the security’s expected maturity. It is possible that we will reinvest the proceeds from such a redemption at a lower interest rate, resulting in less income to us. Securities subject to prepayment risk generally offer less potential for gains when prevailing interest rates fall. If we buy those securities at a premium, accelerated prepayments on those securities could cause us to lose a portion of its principal investment. The impact of prepayments on the price of a loan may reducesecurity can be difficult to predict and could increase the security’s price volatility.
We are subject to credit and default risk and our achievable yield if the capital returned cannot be invested in transactions with equal or greater expected yields, which could have a material adverse effect on our business, financial condition and results of operations.
Credit risk refers to the likelihood that a borrower will default in the payment of principal and/or interest. Financial strength and rising interests rates may make it more difficultsolvency of a borrower are the primary factors influencing credit risk. Lack or inadequacy of collateral or credit enhancement for portfolio companies to make periodic payments on their loans.
A significant downturn in the economy or a particular economic sector could result inhave a default under their loan documents with us. Rising interest rates could also causesignificant impact on the business prospects of the portfolio companies to shift cash from other productive uses towhich we are exposed, whether directly or indirectly. Such developments could adversely affect the paymentability of interest, which may have a material adverse effect on their business and operations and could, over time, lead to increased defaults. Any failure of one or more portfoliosuch companies to repaycomply with their loan repayment obligations. It is possible that the issuer of a note or refinanceother instrument in which we invest could default on its debt atdebts, in which case we could lose most or priorall of its investment in that instrument, subjecting us to maturity orsignificant loss. The risk and magnitude of losses associated with defaults could be increased where the inability of one or more portfolio companies to make ongoing payments following an increase in contractual interest rates could have a material adverse effect on our business, financial condition, results of operations and cash flows.instrument is leveraged.
We have not yet identified the portfolio company investments we will acquire.
acquire and we could have difficulty sourcing investment opportunities.
While we currently hold a portfolio of investments, we have not yet identified additional potential investments for our portfolio that we will acquire with the proceeds of any offering of securities or repayments of investments currently in our portfolio. Privately negotiated investments in loans and illiquid securities or private middle-market companies require substantial due diligence and structuring, and we cannot assure youprovide any assurance that we will achieve our anticipated investment pace. As a result, youinvestors will not be unableable to evaluate any future portfolio company investments prior to purchasing our shares of common stock.securities. Additionally, GC Advisors selects all of our investments, and our stockholders will have no input with respect to such investment decisions. These factors increase the uncertainty, and thus the risk, of investing in our securities. We anticipate that we will use substantially all of the net proceeds of any offeringsale of our securities within approximately six months following the completion of any offeringsale of our securities, depending on the availability of appropriate investment opportunities consistent with our investment objectives and market conditions. Until such appropriate investment opportunities can be found, we maycould also invest the net proceeds in cash, cash equivalents, U.S. government securities and high-quality debt investments that mature in one year or less from the date of investment. We expect these temporary investments to earn yields substantially lower than the income that we expect to receive in respect of our targeted investment types. As a result, any distributions we make during this period maycould be substantially smaller than the distributions that we expect to pay when our portfolio is fully invested.
66
We are a non-diversified investment company within the meaning of the 1940 Act, and therefore we are not limited with respect to the proportion of our assets that maycould be invested in securities of a single issuer.
We are classified as a non-diversified investment company within the meaning of the 1940 Act, which means that we are not limited by the 1940 Act with respect to the proportion of our assets that we maycould invest in securities of a single issuer. To the extent that we assume large positions in the securities of a small number of issuers, our net asset value maycould fluctuate to a greater extent than that of a diversified investment company as a result of changes in the financial condition or the market’s assessment of the issuer. We maycould also be more susceptible to any single economic or regulatory occurrence than a diversified investment company. Beyond our asset diversification requirements as a RIC under the Code, we do not have fixed guidelines for diversification, and our investments could be concentrated in relatively few portfolio companies. Although we are classified as a non-diversified investment company within the meaning of the 1940 Act, we maintain the flexibility to operate as a diversified investment company and have done so for an extended period of time. To the extent that we operate as a non-diversified investment company in the future, we may be subject to greater risk.
Our portfolio maycould be concentrated in a limited number of portfolio companies and industries, which will subject us to a risk of significant loss if any of these companies defaults on its obligations under any of its debt instruments or if there is a downturn in a particular industry.
We maycould hold the debt securities of leveraged companies that may,could, due to the significant volatility of such companies, enter into bankruptcy proceedings.
Leveraged companies maycould experience bankruptcy or similar financial distress.distress, and the risk of these events has been significantly increased by the COVID-19 pandemic. The bankruptcy process has a number of significant inherent risks. Many events in a bankruptcy proceeding are the productproducts of contested matters and adversaryadversarial proceedings and are beyond the control of the creditors. A bankruptcy filing by an issuer may adverselycould have adverse and permanently affectpermanent effects on the issuer. If the proceeding is converted to a liquidation, the value of the issuer maywill not necessarily equal the liquidation value that was believed to exist at the time of the investment. A bankruptcy or other workout, often raises conflicts of interests (including, for example, conflicts over proposed waivers and amendments to debt covenants), including between investors who hold different types of interests in the applicable company. The duration of a bankruptcy proceeding is also difficult to predict, and a creditor’s return on investment can be adversely affected by delays until the plan of reorganization or liquidation ultimately becomes effective. The administrative costs of a bankruptcy proceeding are frequently high and would beare paid out of the debtor’s estate prior to any return to creditors. Because the standards for classification of claims under bankruptcy law are vague, our influence with respect to the class of securities or other obligations we own mayit owns could be lostreduced by increases in the number and amountmonetary value of
claims in the same class or by different classification and treatment. In the early stages of the bankruptcy process, it is often difficult to estimate the extent of, or even to identify, any contingent claims that might be made. In addition, certain claims that have priority by law (for example, claims for taxes) maycan be substantial.
Depending on the facts and circumstances of our investments and the extent of our involvement in the management of a portfolio company, upon the bankruptcy of a portfolio company, a bankruptcy court maycould recharacterize our debt investments as equity interests and subordinate all or a portion of our claim to that of other creditors. This could occur even though we may have structured our investment as senior debt.
Our failure to make follow-on investments in our portfolio companies could impair the value of our portfolio.
Following an initial investment in a portfolio company, we maycould make additional investments in that portfolio company as “follow-on” investments, in seeking to:
•increase or maintain in whole or in part our position as a creditor or equity ownership percentage in a portfolio company;
67
•exercise warrants, options or convertible securities that were acquired in the original or subsequent financing; or
•preserve or enhance the value of our investment.
We have discretion to make follow-on investments, subject to the availability of capital resources. Failure on our part to make follow-on investments may,could, in some circumstances, jeopardize the continued viability of a portfolio company and our initial investment, or maycould result in a missed opportunity for us to increase our participation in a successful portfolio company. Even if we have sufficient capital to make a desired follow-on investment, we maycould elect not to make a follow-on investment because we maydo not want to increase our level of risk, because we prefer other opportunities or because of regulatory or other considerations. Our ability to make follow-on investments maycould also be limited by GC Advisors’ allocation policy.
Because we generally do not hold controlling equity interests in our portfolio companies, we maygenerally will not be able to exercise control over our portfolio companies or to prevent decisions by management of our portfolio companies that could decrease the value of our investments.
To the extent we do not hold controlling equity positions in our portfolio companies, we are subject to the risk that a portfolio company may makemakes business decisions with which we disagree, and that the management and/or stockholders of a portfolio company maycould take risks or otherwise act in ways that are adverse to our interests. Due to the lack of liquidity of the debt and equity investments that we typically hold in our portfolio companies, we may notcan provide no assurance that we will be able to dispose of our investments in the event we disagree with the actions of a portfolio company and maycould therefore suffer a decrease in the value of our investments.
Our portfolio companies maycould incur debt that ranks equally with, or senior to, our investments in such companies and such portfolio companies may notcould fail to generate sufficient cash flow to service their debt obligations to us.
We have invested and intend to invest a portion of our capital in second lien and subordinated loans issued by our portfolio companies, and intendwe could have exposure to continue to do so in the future. Our portfolio companies may have, or be permitted to incur, othera variety of debt that ranks equally with,captures particular layers of a borrower’s credit structure, such as “last out” or senior to,“second lien” debt, or other subordinated investments that rank below other obligations of the debt securitiesborrower in which we invest. Such subordinatedright of payment. Subordinated investments are subject to greater risk of defaultloss than senior obligations as a result ofwhere there are adverse changes into the financial condition of the obligorborrower or a decline in general economic conditions. If we make a subordinated investmentSubordinated investments could expose us to particular risks in a portfolio company,distress scenario, such as the portfolio company may be highly leveraged, and its relatively high debt-to-equity ratio may create increased risksrisk that its operations mightcreditors are not generate sufficient cash flowaligned. Holders of subordinated investments generally have less ability to service all of its debt obligations. By their terms, such debt instruments may provide thataffect the holders are entitled to receive payment of interest or principal on or before the dates on which we are entitled to receive payments in respect of the securities in which we invest. These debt instruments would usually prohibit the portfolio companies from paying interest on or repaying our investments in the event of and during the continuanceresults of a default under such debt. Also, in the event of insolvency, liquidation, dissolution, reorganization or bankruptcy of a portfolio company,distressed scenario than holders of securities rankingmore senior investments. Additionally, lenders to our investmentcompanies operating in workout modes are, in certain circumstances, subject to potential liabilities that portfolio company would typically be entitled to receive payment in full before we receive any distribution in respect of our investment. After repaying senior creditors,could exceed the portfolio company may not have any remaining assets to use for repaying its obligation to us where we are junior creditor. In the case of debt ranking equally with debt securities in which we invest, we would have to share any distributions on an equal and ratable basis with other creditors holding such debt in the event of an insolvency, liquidation, dissolution, reorganization or bankruptcy of the relevant portfolio company.
We have made in the past, and maycould make in the future, unsecured loans to portfolio companies, meaning that such loans will not benefit from any interest in collateral of such companies. Liens on a portfolio company’s collateral, if any, will secure the portfolio company’s obligations under its outstanding secured debt and maycould secure certain future debt that is permitted to be incurred by the portfolio company under its secured loan agreements. The holders of obligations secured by such liens will generally control the liquidation of, and be entitled to receive proceeds from, any realization of such collateral to repay their obligations in full before us. In addition, the value of such collateral in the event of liquidation will depend on market and economic conditions, the availability of buyers and other factors. There can be no assurance that the proceeds, if any, from sales of such collateral would be sufficient to satisfy our unsecured loan obligations after payment in full of all loans secured by collateral. If such proceeds were not sufficient to repay the outstanding secured loan obligations, then our unsecured claims would rank equally with the unpaid portion of such secured creditors’ claims against the portfolio company’s remaining assets, if any.
The rights we maycould have with respect to the collateral securing any junior priority loans we make to our portfolio companies maycould also be limited pursuant to the terms of one or more intercreditor agreements that we enter into with the holders of senior debt. Under a typical intercreditor agreement, at any time that obligations that have the benefit of the first priority liens are outstanding, any of the following actions that maycould be taken in respect of the collateral will be at the direction of the holders of the obligations secured by the first priority liens:
•the ability to cause the commencement of enforcement proceedings against the collateral;
•the ability to control the conduct of such proceedings;
68
•the approval of amendments to collateral documents;
•releases of liens on the collateral; and
•waivers of past defaults under collateral documents.
We maywill not always have the ability to control or direct such actions, even if our rights as junior lenders are adversely affected.
The disposition of our investments maycould result in contingent liabilities.
A significant portion of our investments involve private securities. In connection with the disposition of an investment in private securities, we maycould be required to make representations about the business and financial affairs of the portfolio company typical of those made in connection with the sale of a business. We maycould also be required to indemnify the purchasers of such investment to the extent that any such representations turn out to be inaccurate or with respect to potential liabilities. These arrangements maycould result in contingent liabilities that ultimately result in funding obligations that we must satisfy through our return of distributionspayments previously made toreceived by us.
GC Advisors’ liability is limited, and we have agreed to indemnify GC Advisors against certain liabilities, which maycould lead GC Advisors to act in a riskier manner on our behalf than it would when acting for its own account.
Under the Investment Advisory Agreement, the Prior Investment Advisory Agreement, and the collateral management agreements for each of the 2014 Debt Securitization and(prior to the 2014 Notes redemption), 2018 Debt Securitization, GCIC 2018 Debt Securitization and 2020 Debt Securitization (prior to the 2020 Notes redemption), GC Advisors does not assume any responsibility to us other than to render the services called for under those agreements, and it is not responsible for any action of our board of directors in following or declining to follow GC Advisors’ advice or recommendations. Under the terms of the
Investment Advisory Agreement, the Prior Investment Advisory Agreement, and each of the collateral management agreements GC Advisors, its officers, members, personnel, and any person controlling or controlled by GC Advisors are not liable to us, any subsidiary of ours, our directors, our stockholders or any subsidiary’s stockholders or partners for acts or omissions performed in accordance with and pursuant to the Investment Advisory Agreement, the Prior Investment Advisory Agreement, and the collateral management agreements, except those resulting from acts constituting gross negligence, willful misconduct, bad faith or reckless disregard of GC Advisors’Advisors�� duties under the Investment Advisory Agreement, the Prior Investment Advisory Agreement, and the collateral management agreements. In addition, we have agreed to indemnify GC Advisors and each of its officers, directors, members, managers and employees from and against any claims or liabilities, including reasonable legal fees and other expenses reasonably incurred, arising out of or in connection with our business and operations or any action taken or omitted on our behalf pursuant to authority granted by the Investment Advisory Agreement, the Prior Investment Advisory Agreement, and the collateral management agreements, except where attributable to gross negligence, willful misconduct, bad faith or reckless disregard of such person’s duties under the Investment Advisory Agreement, the Prior Investment Advisory Agreement, and the collateral management agreements. These protections maycould lead GC Advisors to act in a riskier manner when acting on our behalf than it would when acting for its own account.
We have invested and continue to the risks inherent in U.S. investments.
69
Securities issued by non-U.S. companies are not “qualifying assets” under the 1940 Act, and we maycould invest in non-U.S. companies, including emerging markets issuers, to the limited extent such investments are permitted under the 1940 Act.
We could be subject to risks if we engage in hedging transactions and could become subject to risks if we invest in foreign securities.
Under the 1940 Act, a business development company is restricted from acquiring any asset other than assets of the type listed in the 1940 Act, which are referred to as “qualifying assets,” unless, at the time the acquisition is made, qualifying assets represent at least 70% of the company’s total assets. In order for our investments to be classified as “qualifying assets,” among other requirements, such investments must be in issuers organized under the laws of, and which have their principal place of business in, any state of the United States, the District of Columbia, Puerto Rico, the Virgin Islands or any other possession of the United States.
We can invest in non-U.S. companies, including emerging market issuers, to the limited extent such investments are permitted under the 1940 Act.
We may expose ourselvesexpect that these investments would focus on the same types of investments that we make in U.S. middle market companies and accordingly would be complementary to our overall strategy and enhance the diversity of our holdings. Investing in securities of emerging market issuers involves many risks if we engageincluding economic, social, political, financial, tax and security conditions in hedging transactions.the emerging market, potential inflationary economic environments, regulation by foreign governments, different accounting standards and political uncertainties. Economic, social, political, financial, tax and security conditions also could negatively affect the value of emerging market companies. These factors could include changes in the emerging market government’s economic and fiscal policies, the possible imposition of, or changes in, currency exchange laws or other laws or restrictions applicable to the emerging market companies or investments in their securities and the possibility of fluctuations in the rate of exchange between currencies. Any of our portfolio company investments that are denominated in foreign currencies will be subject to the risks associated with fluctuations in currency exchange rates, which fluctuations could adversely affect our performance.
We have and maycould in the future enter into hedging transactions which may expose us to the limited extent such transactions are permitted under the 1940 Act and applicable commodities laws. Engaging in hedging transactions or investing in foreign securities would entail additional risks associated with such transactions.to our stockholders. We may utilizecould, for example, use instruments such as forward contracts, currency options and interest rate swaps, caps, collars and floors and, if we were to seekinvest in foreign securities, we could use instruments such as forward contracts or currency options in currencies selected to hedge against fluctuations in the relative values of our portfolio positions from changes in currency exchange rates and market interest rates. We could also, for example, borrow under a credit facility in currencies selected to minimize our foreign currency exposure. Use of these hedging instruments maycould include counter-partycounterparty credit risk. HedgingIn each such case, we generally would seek to hedge against a decline influctuations of the relative values of our portfolio positions doesfrom changes in market interest rates or currency exchange rates. While hedging transactions can reduce such risks, they generally will not eliminatebe designed to prevent all loss from our position. There also could be barriers that prevent us from entering into certain hedging transactions. These barriers will not necessarily impact other investment funds managed by GC Advisors or its affiliates. Hedging transactions could result in a lower overall performance for us than if it had not entered into hedging transactions and generally introduces new risks, such as counterparty risk and greater illiquidity. In addition, we are permitted to borrow funds in one or more foreign currencies as a form of protection against currency risk. The use of such financing could create new risks not traditionally associated with credit facilities or other forms of leverage. Conversely, to the possibility ofextent that we do not enter into hedging transactions, borrower defaults and fluctuations in the values of such positionscurrency exchange rates or prevent lossesinterest rates could result in poorer overall performance for us than if the values of such positions decline. However,it had entered into such hedging can establish other positions designed to gain from those same developments, thereby offsetting the decline in the value of such portfolio positions. Such hedging transactions may also limit the opportunity for gain if the values of the underlying portfolio positions should increase. Moreover, it may not be possible to hedge against an exchange rate or interest rate fluctuation that is so generally anticipated that we are not able to enter into a hedging transaction at an acceptable price.
transactions.
The success of ourany hedging transactions that we enter into will depend on our ability to correctly predict movements in currenciescurrency and interest rates. Therefore, while we maycould enter into suchhedging transactions to seek to reduce currency exchange rate and interest rate risks, unanticipated changes in currency exchange rates or interest rates maycould result in poorer overall investment performance than if we had not engaged in any such hedging transactions. In addition, the degree of correlation between price movements of the instruments used in a hedging strategy and price movements in the portfolio positions being hedged maycould vary. Moreover, for a variety of reasons, we maywould not necessarily seek to (or be able to) establish a perfect correlation between suchthe hedging instruments and the portfolio holdings being hedged. Any such imperfect correlation maycould prevent us from achieving the intended hedge and expose us to risk of loss. In addition, it mayis often not be possible to hedge fully or perfectly against currency fluctuations affecting the value of securities
denominated in non-U.S. currencies because the value of those securities iswould likely to fluctuate as a result of factors not related to currency fluctuations. Our ability to engage in hedging transactions maycould also be limited under the Code as well as adversely affected by rules adopted by the CFTC.
70
We may not realize gainscould suffer losses from our equity investments.
We could be subject to lender liability claims with respect to our portfolio company investments.
A number of judicial decisions have upheld judgments for borrowers against lending institutions on the dispositionbasis of any equity interests may notvarious legal theories, collectively termed “lender liability.” Generally, lender liability is founded on the premise that a lender has violated a duty (whether implied or contractual) of good faith, commercial reasonableness and fair dealing or a similar duty owed to the borrower, or has assumed an excessive degree of control over the borrower resulting in the creation of a fiduciary duty owed to the borrower or its other creditors or stockholders. We could be sufficientrequired to offset anydefend allegations of lender liability from time to time.
Loans to companies operating in workout modes or under Chapter 11 of the U.S. Bankruptcy Code are, in certain circumstances, subject to certain potential liabilities that could exceed the amount of such loan purchased by us. Under common law principles that in some cases form the basis for lender liability claims, if a lender or bondholder (i) intentionally takes an action that results in the undercapitalization of a borrower to the detriment of other losses we experience.creditors of such borrower, (ii) engages in other inequitable conduct to the detriment of such other creditors, (iii) engages in fraud with respect to, or makes misrepresentations to, such other creditors or (iv) uses its influence as a stockholder to dominate or control a borrower to the detriment of other creditors of such borrower, a court could elect to subordinate the claim of the offending lender or bondholder to the claims of the disadvantaged creditor or creditors, a remedy called “equitable subordination.” Because of the nature of the loans, the loans could be subject to claims of subordination.
Risks Relating to Investors in Our Common StockSecurities
Investing in our common stock maysecurities could involve an above average degree of risk.
The investments we make in accordance with our investment objective maycould result in a higher amount of risk than alternative investment options and a higher risk of volatility or loss of principal. Our investments in portfolio companies involve higher levels of risk, and therefore, an investment in our sharessecurities may not be suitable for someone with lower risk tolerance.
Shares of closed-end investment companies, including business development companies, often trade at a discount to their net asset value.
Shares of closed-end investment companies, including business development companies, maycould trade at a discount from net asset value. This characteristic of closed-end investment companies and business development companies is separate and distinct from the risk that our net asset value per share maycould decline. We cannot predict whether our common stock will trade at, above or below net asset value.
There is a risk that investors in our equity securities maywill not receive distributions or that our distributions maydo not grow over time and a portion of our distributions maycould be a return of capital.
We intend to make distributions on a quarterly basis to our stockholders out of assets legally available for distribution. We cannot assure you that we will achieve investment results that will allow us to make a specified level of cash distributions or year-to-year increases in cash distributions. Our ability to pay distributions mightcould be adversely affected by the impact of one or more of the risk factors described in this annual report on Form 10-K. Due to the asset coverage test applicable to us under the 1940 Act as a business development company, we maycould be
71
limited in our ability to make distributions. In addition, all distributions are and will be paid at the discretion of our board of directors and will depend on our earnings, financial condition, maintenance of our RIC status, compliance with applicable business development company regulations and such other factors as our board of directors may deem relevant from time to time. If we declare a distribution and if more stockholders opt to receive cash distributions rather than participate in our dividend reinvestment plan, we maycould be forced to sell some of our investments in order to make cash distribution payments. In the event that we encounter delays in locating suitable investment opportunities, we could also pay all or a substantial portion of our distributions from the proceeds of private placements of our common stock or from borrowings in anticipation of future cash flow, which may constitute a return of stockholders’ capital. To the extent we make distributions to stockholders that include a return of capital, such portion of the distribution essentially constitutes a return of the stockholder’s investment. Although such return of capital mayis generally not becurrently taxable, such distributions would generally decrease a stockholder’s basis in our common stock and maycould therefore increase such stockholder’s tax liability for capital gains upon the future sale of such stock.stock or other disposition. A return of capital distribution maycould cause a stockholder to recognize a capital gain from the sale of our common stock even if the stockholder sells its shares for less than the original purchase price.
We have not established any limit on the amount of funds we can use from available sources, such as borrowings, if any, or proceeds from private placements of our common stock, to fund distributions (which could reduce the amount of capital we ultimately invest in assets).
Any distributions made from sources other than cash flow from operations or relying on fee or expense reimbursement waivers, if any, from GC Advisors or the Administrator are not based on our investment performance, and can only be sustained if we achieve positive investment performance in future periods and/or GC Advisors or the Administrator continues to make such expense reimbursements, if any.The extent to which we pay distributions from sources other than cash flow from operations will depend on various factors, including the level of participation in our DRIP, how quickly we invest the proceeds from any offerings of our securities and the performance of our investments.There can be no assurance that we will achieve such performance in order to sustain any level of distributions, or be able to pay distributions at all.GC Advisors and the Administrator have no obligation to waive fees or receipt of expense reimbursements, if any.
The market price of our common stock maysecurities could fluctuate significantly.
The market price and liquidity of the market for our securities maycould be significantly affected by numerous factors, some of which are beyond our control and may not be directly related to our operating performance. These factors include:
•significant volatility in the market price and trading volume of securities of business development companies or other companies in our sector, which are not necessarily related to the operating performance of the companies;
•changes in regulatory policies, accounting pronouncements or tax guidelines, particularly with respect to RICs and business development companies;
•loss of our qualification as a RIC or business development company;
•changes in market interest rates and decline in the prices of debt,
•changes in earnings or variations in operating results;
•changes in the value of our portfolio investments;
•changes in accounting guidelines governing valuation of our investments;
•any shortfall in revenue or net income or any increase in losses from levels expected by investors or securities analysts;
•departure of GC Advisors’ or any of its affiliates’ key personnel;
•operating performance of companies comparable to us;
•general economic trends and other external factors; and
•loss of a major funding source.
72
The Unsecured Notes are unsecured and therefore are effectively subordinated to any secured indebtedness we have incurred or may incur in the future.
The Unsecured Notes are not secured by any of our assets or any of the assets of our subsidiaries. As a result, the Unsecured Notes are effectively subordinated, or junior, to any secured indebtedness or other obligations we or our subsidiaries have outstanding as of the date of issuance of the Unsecured Notes or that we or our subsidiaries may incur in the future (or any indebtedness that is initially unsecured in respect of which we subsequently grant security) to the extent of the value of the assets securing such indebtedness. A substantial portion of our assets are currently pledged as collateral under the Debt Securitizations and Revolving Credit Facilities. In any liquidation, dissolution, bankruptcy or other similar proceeding, the holders of any of our existing or future secured indebtedness and the secured indebtedness of our subsidiaries may assert rights against the assets pledged to secure that indebtedness in order to receive full payment of their indebtedness before the assets may be used to pay other creditors, including the holders of the Unsecured Notes. As of September 30, 2021, we had an aggregate of approximately $1.4 billion of outstanding borrowings under the Debt Securitizations and the Revolving Credit Facilities, all of which are secured and thus effectively senior to the Unsecured Notes.
The Unsecured Notes are structurally subordinated to the indebtedness and other liabilities of our
subsidiaries.
The Unsecured Notes are obligations exclusively of Golub Capital BDC, Inc. and not of any of our subsidiaries. None of our subsidiaries is a guarantor of the Unsecured Notes and the Unsecured Notes are not required to be guaranteed by any subsidiaries we may acquire or create in the future. The assets of such subsidiaries are not directly available to satisfy the claims of our creditors, including holders of the Unsecured Notes.
Except to the extent we are a creditor with recognized claims against our subsidiaries, all claims of creditors (including trade creditors) and holders of preferred stock, if any, of our subsidiaries will have priority over our equity interests in such subsidiaries (and therefore the claims of our creditors, including holders of the Unsecured Notes) with respect to the assets of such subsidiaries. Even if we are recognized as a creditor of one or more of our subsidiaries, our claims would still be effectively subordinated to any security interests in the assets of any such subsidiary and to any indebtedness or other liabilities of any such subsidiary senior to our claims. Consequently, the Unsecured Notes are structurally subordinated, or junior, to the Debt Securitizations, the Revolving Credit Facilities and other liabilities (including trade payables) incurred by any of our existing or future subsidiaries, financing vehicles or similar facilities. All of the existing indebtedness of our subsidiaries is structurally senior to the Unsecured Notes.
In addition, our subsidiaries and any additional subsidiaries that we may form may incur substantial additional
indebtedness in the future, all of which would be structurally senior to the Unsecured Notes.
The indenture governing the Unsecured Notes contains limited protection for holders of the
Unsecured Notes.
The indenture governing the Unsecured Notes offers limited protection to holders of the Unsecured
Notes. The terms of the indenture and the Unsecured Notes do not restrict our or any of our subsidiaries’ ability to engage in, or otherwise be a party to, a variety of corporate transactions, circumstances or events that could have a material adverse impact on an investment in the Unsecured Notes. In particular, the terms of the indenture and the Unsecured Notes do not place any restrictions on our or our subsidiaries’ ability to:
•issue securities or otherwise incur additional indebtedness or other obligations, including (1) any indebtedness or other obligations that would be pari passu, or equal, in right of payment to the Unsecured Notes, (2) any indebtedness or other obligations that would be secured and therefore rank effectively senior in right of payment to the Unsecured Notes to the extent of the value of the assets securing such indebtedness, (3) indebtedness or other obligations of ours that are guaranteed by one or more of our subsidiaries and which therefore are structurally senior to the Unsecured Notes and (4) securities, indebtedness or other obligations issued or incurred by our subsidiaries that would be senior to our equity interests in our subsidiaries and therefore rank structurally senior to the Unsecured Notes with respect to the assets of our subsidiaries, in each case other than an incurrence of indebtedness or other obligations that would cause a violation of Section 18(a)(1)(A) of the 1940 Act as modified by Section 61(a)(1) and (2) of the 1940 Act or any successor provisions, as such obligations may be amended or superseded, giving effect to any exemptive relief granted to us by the SEC. Currently, these provisions generally prohibit us from
73
incurring additional borrowings, including through the issuance of additional debt securities, unless our asset coverage, as defined in the 1940 Act, equals at least 150% after such borrowings;
•pay dividends on, or purchase or redeem or make any payments in respect of, capital stock or other securities ranking junior in right of payment to the Unsecured Notes;
•sell assets (other than certain limited restrictions on our ability to consolidate, merge or sell all or substantially all of our assets);
•enter into transactions with affiliates;
•create liens (including liens on the shares of our subsidiaries) or enter into sale and leaseback transactions;
•make investments; or
•create restrictions on the payment of dividends or other amounts to us from our subsidiaries.
Furthermore, the terms of the indenture and the Unsecured Notes do not protect holders of the Unsecured Notes in the event that we experience changes (including significant adverse changes) in our financial condition, results of operations or credit ratings, as they do not require that we or our subsidiaries adhere to any financial tests or ratios or specified levels of net worth, revenues, income, cash flow or liquidity other than certain events of default under the indenture governing the Unsecured Notes.
Our ability to recapitalize, incur additional debt and take a number of other actions are not limited by the terms of the Unsecured Notes and may have important consequences for holders of the Unsecured Notes, including making it more difficult for us to satisfy our obligations with respect to the Unsecured Notes or negatively affecting the trading value of the Unsecured Notes.
Certain of our current debt instruments include more protections for their holders than the indenture and the
Unsecured Notes. In addition, other debt we issue or incur in the future could contain more protections for its
holders than the indenture and the Unsecured Notes, including additional covenants and events of default. The
issuance or incurrence of any such debt with incremental protections could affect the market for and trading levels
and prices of the Unsecured Notes.
If an active trading market for the Unsecured Notes does not develop, holders may not be able to resell them.
The Unsecured Notes are new issuances of debt securities and currently may or may not have an active trading market. We do not intend to apply for listing of the Unsecured Notes on any securities exchange or for quotation of the Unsecured Notes on any automated dealer quotation system. If no active trading market develops, holder may not be able to resell the Unsecured Notes at their fair market value or at all. If the Unsecured Notes are traded after their initial issuance, they may trade at a discount from their initial offering price depending on prevailing interest rates, the market for similar securities, our credit ratings, general economic conditions, our financial condition, performance and prospects and other factors. Any market-making activity will be subject to limits imposed by law. Accordingly, we cannot assure you that a liquid trading market will develop for the Unsecured Notes, that holders will be able to sell the Unsecured Notes at a particular time or that the price received when sold will be favorable. To the extent an active trading market does not develop, the liquidity and trading price for the Unsecured Notes may be harmed. Accordingly, holders may be required to bear the financial risk of an investment in the Unsecured Notes for an indefinite period of time.
If we default on our obligations to pay our other indebtedness, we may not be able to make payments on the Unsecured Notes.
Any default under the agreements governing our indebtedness, including the Debt Securitizations, the Revolving Credit Facilities or other indebtedness to which we may be a party that is not waived by the required lenders or holders, and the remedies sought by the holders of such indebtedness could make us unable to pay principal, premium, if any, and interest on the Unsecured Notes and substantially decrease the market value of the Unsecured Notes.
If we are unable to generate sufficient cash flow and are otherwise unable to obtain funds necessary to meet required
payments of principal, premium, if any, and interest on our indebtedness, or if we otherwise fail to comply with the various covenants, including financial and operating covenants, in the instruments governing our indebtedness, we could be in default under the terms of the agreements governing such indebtedness. In the event of such default, the holders of such indebtedness could elect to declare all the funds borrowed thereunder to be due and payable,
74
together with accrued and unpaid interest, the lenders under the Revolving Credit Facilities or other debt we may incur in the future could elect to terminate their commitments, cease making further loans and institute foreclosure proceedings against our assets, and we could be forced into bankruptcy or liquidation.
If our operating performance declines, we may in the future need to seek to obtain waivers from the required lenders under the Revolving Credit Facilities or the required holders of the Debt Securitizations or other debt that we may incur in the future, to avoid being in default. If we breach our covenants under the Debt Securitizations, the Revolving Credit Facilities or other debt and seek a waiver, we may not be able to obtain a waiver from the required lenders or holders. If this occurs, we would be in default and our lenders or debt holders could exercise their rights as described above, and we could be forced into bankruptcy or liquidation.
If we are unable to repay debt, lenders or holders having secured obligations, including the lenders and holders under the Debt Securitizations and the Revolving Credit Facilities could proceed against the collateral securing the debt. Because the Revolving Credit Facilities have, and any future credit facilities will likely have, customary cross-default provisions, if the indebtedness thereunder or under any future credit facility is accelerated, we may be unable to repay or finance the amounts due. In the event holders of any debt securities we have outstanding exercise their rights to accelerate following a cross-default, those holders would be entitled to receive the principal amount of their investment, subject to any subordination arrangements that may be in place. We cannot assure you that we will have sufficient liquidity to be able to repay such amounts, in which case we would be in default under the accelerated debt and holders would have the ability to sue us to recover amounts then owing.
A downgrade, suspension or withdrawal of the credit rating assigned by a rating agency to us or the Unsecured Notes, if any, or change in the debt markets, could cause the liquidity or market value of the Unsecured Notes to decline significantly.
Our credit ratings are an assessment by rating agencies of our ability to pay our debts when due. Consequently, real or anticipated changes in our credit ratings will generally affect the market value of the Unsecured Notes or other debt securities we may issue. These credit ratings may not reflect the potential impact of risks relating to the structure or marketing of the Unsecured Notes. Credit ratings are not a recommendation to buy, sell or hold any security, and may be revised or withdrawn at any time by the issuing organization in its sole discretion. Neither we nor any underwriter undertakes any obligation to maintain our credit ratings or to advise holders of the Unsecured Notes of any changes in our credit ratings.
An increase in market interest rates could result in a decrease in the market value of the Unsecured Notes.
The condition of the financial markets and prevailing interest rates have fluctuated in the past and are likely to fluctuate in the future, which could have an adverse effect on the market prices of the Unsecured Notes. In general, as market interest rates rise, debt securities bearing interest at fixed rates of interest decline in value. Consequently, if market interest rates increase, the market values of the Unsecured Notes with fixed interest rates may decline. We cannot predict the future level of market interest rates.
The optional redemption provision may materially adversely affect the return on the Unsecured Notes.
The Unsecured Notes are redeemable in whole or in part upon certain conditions at any time or from time to time at our option. We may choose to redeem the Unsecured Notes at times when prevailing interest rates are lower than the interest rate paid on the Unsecured Notes. In this circumstance, holders may not be able to reinvest the redemption proceeds in a comparable security at an effective interest rate as high as the Unsecured Notes being redeemed.
We may not be able to repurchase the Unsecured Notes upon a Change of Control Repurchase Event.
We may not be able to repurchase the Unsecured Notes upon a Change of Control Repurchase Event (as defined in the indenture governing the Unsecured Notes) because we may not have sufficient funds. Upon a Change of Control Repurchase Event, holders of the Unsecured Notes may require us to repurchase for cash some or all of the Unsecured Notes at a repurchase price equal to 100% of the aggregate principal amount of the Unsecured Notes being repurchased, plus accrued and unpaid interest to, but not including, the repurchase date. Our failure to purchase such tendered Unsecured Notes upon the occurrence of such Change of Control Repurchase Event would cause an event of default under the indenture governing the Unsecured Notes and a cross-default under the agreements governing certain of our other indebtedness, which may result in the acceleration of such indebtedness requiring us to repay that indebtedness immediately.
If we issue preferred stock, debt securities or convertible debt securities, the net asset value and market value of
our common stock may become more volatile.
75
We cannot assure you that the issuance of preferred stock and/or debt securities would result in a higher yield or return to the holders of our common stock. The issuance of preferred stock, debt securities or convertible debt would likely cause the net asset value and market value of our common stock to become more volatile. If the dividend rate on the preferred stock, or the interest rate on the debt securities, were to approach the net rate of return on our investment portfolio, the benefit of leverage to the holders of our common stock would be reduced. If the dividend rate on the preferred stock, or the interest rate on the debt securities, were to exceed the net rate of return on our portfolio, the use of leverage would result in a lower rate of return to the holders of our common stock than if we had not issued the preferred stock or debt securities. Any decline in the net asset value of our investment would be borne entirely by the holders of our common stock. Therefore, if the market value of our portfolio were to decline, the leverage would result in a greater decrease in net asset value to the holders of our common stock than if we were not leveraged through the issuance of preferred stock. This decline in net asset value would also tend to cause a greater decline in the market price for our common stock.
There is also a risk that, in the event of a sharp decline in the value of our net assets, we would be in danger of failing to maintain required asset coverage ratios which may be required by the preferred stock, debt securities, convertible debt or units or of a downgrade in the ratings of the preferred stock, debt securities, convertible debt or units or our current investment income might not be sufficient to meet the dividend requirements on the preferred stock or the interest payments on the debt securities. In order to counteract such an event, we might need to liquidate investments in order to fund redemption of some or all of the preferred stock, debt securities or convertible debt. In addition, we would pay (and the holders of our common stock would bear) all costs and expenses relating to the issuance and ongoing maintenance of the preferred stock, debt securities, convertible debt or any combination of these securities. Holders of preferred stock, debt securities or convertible debt may have different interests than holders of common stock and may at times have disproportionate influence over our affairs.
We are a holding company and depend on payments from our subsidiaries in order to make payments on any debt securities that we may issue as well as to pay distributions on our common stock. Any debt securities that we issue will be structurally subordinated to the obligations of our subsidiaries.
We are a holding company and fund a majority of our investments through wholly-owned subsidiaries, and a majority of the assets that we hold directly are the equity interests in such subsidiaries, including any subordinated notes issued as part of our debt securitization transactions, which notes represent the residual claimant on distributions by the applicable securitization subsidiary. We depend upon the cash flow from our subsidiaries and the receipt of funds from them in the form of payments on any subordinated notes, dividends, and other distributions, any of which may be subject to restriction or limitations based on the organizational documents of the subsidiaries and the agreements governing the debt of any such subsidiary. In addition, because we are a holding company, any debt securities that we issue will be structurally subordinated to the obligations of our subsidiaries. In the event that one of our subsidiaries becomes insolvent, liquidates, reorganizes, dissolves or otherwise winds up, its assets will be used first to satisfy the claims of its creditors. Consequently, any claim by us or our creditors, including holders of any debt securities that we may issue, against any subsidiary will be structurally subordinated to all of the claims of the creditors of such subsidiary. We cannot assure security holders that they will receive any payments required to be made under the terms of any debt securities that we may issue, dividends or other distributions.
Holders of any preferred stock that we may issue will have the right to elect members of the board of directors and have class voting rights on certain matters.
The 1940 Act requires that holders of shares of preferred stock must be entitled as a class to elect two directors at all times and to elect a majority of the directors if dividends on such preferred stock are in arrears by two years or more, until such arrearage is eliminated. In addition, certain matters under the 1940 Act require the separate vote of the holders of any issued and outstanding preferred stock, including changes in fundamental investment restrictions and conversion to open-end status and, accordingly, preferred stockholders could veto any such changes. Restrictions imposed on the declarations and payment of dividends or other distributions to the holders of our common stock and preferred stock, both by the 1940 Act and by requirements imposed by rating agencies, might impair our ability to maintain our qualification as a RIC for U.S. federal income tax purposes.
Our common stockholders’ interest in us may be diluted if they do not fully exercise subscription rights in any rights offering. In addition, if the subscription price is less than our net asset value per share, then common stockholders will experience an immediate dilution of the aggregate net asset value of your shares.
76
In the event we issue subscription rights, stockholders who do not fully exercise their subscription rights should expect that they will, at the completion of a rights offering , own a smaller proportional interest in us than would otherwise be the case if they fully exercised their rights. We cannot state precisely the amount of any such dilution in share ownership because we do not know at this time what proportion of the shares would be purchased as a result of such rights offering.
In addition, if the subscription price is less than the net asset value per share of our common stock, then our common stockholders would experience an immediate dilution of the aggregate net asset value of their shares as a result of the offering. The amount of any decrease in net asset value is not predictable because it is not known at this time what the subscription price and net asset value per share will be on the expiration date of a rights offering or what proportion of the shares will be purchased as a result of such rights offering. Such dilution could be substantial.
These dilutive effects may be exacerbated if we were to conduct multiple subscription rights offerings, particularly if such offerings were to occur over a short period of time. In addition, subscription rights offerings and the prospect of future subscription rights offerings may create downward pressure on the secondary market price of our common stock due to the potential for the issuance of shares at a price below our net asset value, without a corresponding change to our net asset value.
Our stockholders will experience dilution in their ownership percentage if they do not participate in our dividend reinvestment plan.
All distributions declared in cash payable to stockholders that are participants in our dividend reinvestment plan are automatically reinvested in shares of our common stock. As a result, our stockholders that do not participate in our dividend reinvestment plan will experience dilution in their ownership percentage of our common stock over time.
Our stockholders maycould receive shares of our common stock as dividends, which could result in adverse tax consequences to them.
Sales of substantial amounts of our common stock in the public market maycould have an adverse effect on the market price of our common stock.
Sales of substantial amounts of our common stock, or the availability of such common stock for sale, could adversely affect the prevailing market prices for our common stock. If this occurs and continues, it could impair our ability to raise additional capital through the sale of securities should we desire to do so.
The trading market or market value of our publicly issued debt securities may fluctuate.
Any publicly issued debt securities we issue may or may not have an established trading market. We cannot assure you that a trading market for our publicly issued debt securities will ever develop or be maintained if developed. In addition to our creditworthiness, many factors may materially adversely affect the trading market for, and market value of, our publicly issued debt securities. These factors include, but are not limited to, the following:
•the time remaining to the maturity of these debt securities;
•the outstanding principal amount of debt securities with terms identical to these debt securities;
77
•the ratings assigned by national statistical ratings agencies;
•the general economic environment;
•the supply of debt securities trading in the secondary market, if any;
•the redemption or repayment features, if any, of these debt securities;
•the level, direction and volatility of market interest rates generally; and
•market rates of interest higher or lower than rates borne by the debt securities.
Investors should also be aware that there may be a limited number of buyers when they decide to sell our debt securities. This too may materially adversely affect the market value of the debt securities or the trading market for the debt securities.
Terms relating to redemption may materially adversely affect the return on any debt securities that we may issue.
If we issue debt securities that are redeemable at our option, we may choose to redeem such debt securities at times when prevailing interest rates are lower than the interest rate paid on the debt securities. In addition, if our debt securities are subject to mandatory redemption, we may be required to redeem such debt securities also at times when prevailing interest rates are lower than the interest rate paid on the debt securities. In this circumstance, investors in our debt securities may not be able to reinvest the redemption proceeds in a comparable security at an effective interest rate as high as the debt securities being redeemed.
General Risk Factors
We are currently in a period of capital markets disruption and economic uncertainty.
The success of our activities is affected by general economic and market conditions, including, among others, interest rates, availability of credit, inflation rates, economic uncertainty, changes in laws, and trade barriers. These factors could affect the level and volatility of securities prices and the liquidity of our investments. Volatility or illiquidity could impair our profitability or result in losses. These factors also could adversely affect the availability or cost of our leverage, which would result in lower returns.
In 2020, the U.S. capital markets experienced extreme volatility and disruption following the global outbreak of COVID-19. Some economists and major investment banks have expressed concern that the continued spread of the virus globally could lead to a prolonged period of world-wide economic downturn. These disruptions in the capital markets have increased the spread between the yields realized on risk-free and higher risk securities, resulting in illiquidity in parts of the capital markets. Such disruptions could adversely affect our business, financial condition, results of operations and cash flows, and future market disruptions and/or illiquidity could negatively impact us. These unfavorable economic conditions could increase our funding costs and limit our access to the capital markets, and could result in a decision by lenders not to extend credit to us in the future. These events could limit our investments, our ability to grow and could negatively impact our operating results and the fair values of our debt and equity investments.
Events outside of our control, including public health crises, could negatively affect our portfolio companies, our investment adviser and the results of our operations.
Periods of market volatility could continue to occur in response to pandemics or other events outside of our control. We, GC Advisors, and the portfolio companies in which we invest in could be affected by force majeure events (i.e., events beyond the control of the party claiming that the event has occurred, such as acts of God, fire, flood, earthquakes, outbreaks of an infectious disease, pandemic or any other serious public health concern, war, terrorism, labor strikes, major plant breakdowns, pipeline or electricity line ruptures, failure of technology, defective design and construction, accidents, demographic changes, government macroeconomic policies, social instability, etc.). Some force majeure events could adversely affect the ability of a party (including us, GC Advisors, a portfolio company or a counterparty to us, GC Advisors, or a portfolio company) to perform its obligations until it is able to remedy the force majeure event. In addition, force majeure events, such as the cessation of the operation of equipment for repair or upgrade, could similarly lead to the unavailability of essential equipment and technologies. These risks could, among other effects, adversely impact the cash flows available from a portfolio company, cause personal injury or loss of life, including to a senior manager of GC Advisors or its affiliates, damage property, or instigate disruptions of service. In addition, the cost to a portfolio company or us of repairing or replacing damaged
78
assets resulting from such force majeure event could be considerable. It will not be possible to insure against all such events, and insurance proceeds received, if any, could be inadequate to completely or even partially cover any loss of revenues or investments, any increases in operating and maintenance expenses, or any replacements or rehabilitation of property. Certain events causing catastrophic loss could be either uninsurable, or insurable at such high rates as to adversely impact us, GC Advisors, or portfolio companies, as applicable. Force majeure events that are incapable of or are too costly to cure could have permanent adverse effects. Certain force majeure events (such as war or an outbreak of an infectious disease) could have a broader negative impact on the world economy and international business activity generally, or in any of the countries in which we invest or our portfolio companies operate specifically. Such force majeure events could result in or coincide with: increased volatility in the global securities, derivatives and currency markets; a decrease in the reliability of market prices and difficulty in valuing assets; greater fluctuations in currency exchange rates; increased risk of default (by both government and private issuers); further social, economic, and political instability; nationalization of private enterprise; greater governmental involvement in the economy or in social factors that impact the economy; less governmental regulation and supervision of the securities markets and market participants and decreased monitoring of the markets by governments or self-regulatory organizations and reduced enforcement of regulations; limited, or limitations on, the activities of investors in such markets; controls or restrictions on foreign investment, capital controls and limitations on repatriation of invested capital; inability to purchase and sell investments or otherwise settle security or derivative transactions (i.e., a market freeze); unavailability of currency hedging techniques; substantial, and in some periods extremely high, rates of inflation, which can last many years and have substantial negative effects on credit and securities markets as well as the economy as a whole; recessions; and difficulties in obtaining and/or enforcing legal judgments.
Additionally, a major governmental intervention into industry, including the nationalization of an industry or the assertion of control over one or more portfolio companies or its assets, could result in a loss to us, including if the investment in such portfolio companies is canceled, unwound or acquired (which could result in inadequate compensation).Any of the foregoing could therefore adversely affect the performance of us and our investments.
In December 2019, a novel strain of coronavirus, COVID-19, was identified in Wuhan, China, and spread to additional countries. On January 30, 2020, the World Health Organization declared a global emergency. At various times during the course of the pandemic, orders have been issued and lifted restricting movement within a number of large metropolitan areas, including in some instances, orders to shelter in place. The outbreak of COVID-19 and its related negative public health developments have adversely affected workforces, customers, suppliers, economies and financial markets globally. The length of any resulting economic downturn and any additional waves of the disease that could exacerbate or further prolong any downturn are impossible to predict and could affect operations of GC Advisors’ business, including by harming GC Advisors’ ability to manage our investments. In addition, portfolio companies and our investments in such companies could be adversely impacted by the COVID-19 pandemic or any other pandemic, including by supply disruptions, decreases in consumer demand, loss of personnel either to sickness or movement restrictions, and the resulting global market and economic disruptions. These adverse effects could cause losses in value of our investments, adversely affecting investors. The COVID-19 pandemic has also led to significant interest rate reductions by the Federal Reserve, including dropping certain rates to near zero, and market uncertainty, which could also have a materially adverse effect on us.
Given the ongoing and dynamic nature of the circumstances, the extent of the impact of COVID-19 on GC Advisors and us will depend on future developments, which are highly uncertain and cannot be predicted. For example, the COVID-19 pandemic has caused governments, including in the United States, to adopt massive stimulus programs and additional stimulus programs are likely to be adopted in the future. Even as the pandemic abates, the United States and other countries could have had record levels of unemployment, and, as a result, the countries could face severe economic depressions. The effects that any of these events would have on the economy, the markets, and our investments or returns are uncertain. These potential impacts, while uncertain, could adversely affect our and our portfolio companies’ operating results.
We could experience fluctuations in our quarterly operating results.
We could experience fluctuations in our quarterly operating results due to a number of factors, including the interest rate payable on any borrowings and the interest rate payable on the debt securities we acquire, the default rate on such securities, the number and size of investments we originate or acquire, the level of our expenses, variations in and the timing of the recognition of realized and unrealized gains or losses, the degree to which we encounter
79
competition in our markets and general economic conditions. In light of these factors, results for any period should not be relied upon as being indicative of our performance in future periods.
Political uncertainty could adversely affect our business
U.S. and non-U.S. markets could experience political uncertainty and/or change that subjects investments to heightened risks, including, for instance, the risks related to the elections in the U.S. or the effect on world leaders and governments of the COVID-19 pandemic. These heightened risks could also include: increased risk of default (by both government and private issuers); greater social, trade, economic and political instability (including the risk of war or terrorist activity); greater governmental involvement in the economy; greater governmental supervision and regulation of the securities markets and market participants resulting in increased expenses related to compliance; greater fluctuations in currency exchange rates; controls or restrictions on foreign investment and/or trade, capital controls and limitations on repatriation of invested capital and on the ability to exchange currencies; inability to purchase and sell investments or otherwise settle security or derivative transactions (i.e., a market freeze); unavailability of currency hedging techniques; and slower clearance. During times of political uncertainty and/or change, global markets often become more volatile. There could also be a lower level of monitoring and regulation of markets while a country is experiencing political uncertainty and/or change, and the activities of investors in such markets and enforcement of existing regulations could become more limited. Markets experiencing political uncertainty and/or change could have substantial, and in some periods extremely high, rates of inflation for many years. Inflation and rapid fluctuations in inflation rates typically have negative effects on such countries’ economies and markets. Tax laws could change materially, and any changes in tax laws could have an unpredictable effect on us, our investments and our investors. There can be no assurance that political changes will not cause us or our investors to suffer losses.
The impact of Brexit on our investments is uncertain and could adversely affect our business.
On January 31, 2020, the United Kingdom, or the UK, ended its membership in the European Union, or the EU, referred to as Brexit. Following the termination of a transition period, the UK and the EU entered into a trade and cooperation agreement to govern the future relationship between the parties, which was provisionally applied as of January 1, 2021 and entered into force on May 1, 2021 following ratification by the EU. With respect to financial services, the agreement leaves decisions on equivalence and adequacy to be determined by each of the U.K. and E.U. unilaterally in due course. As a result, certain UK licensed entities are unable to provide regulated services in a number of EU jurisdictions from the end of December 2020, absent regulatory relief or other measures implemented by individual countries. Such agreement is untested and may lead to ongoing political and economic uncertainty and periods of exacerbated volatility in both the United Kingdom and in wider European and global markets for some time. The longer term economic, legal, political and social implications of Brexit are unclear at this stage. Brexit has led to ongoing political and economic uncertainty and periods of increased volatility in both the UK and in wider European markets for some time. Brexit could lead to calls for similar referendums in other European jurisdictions, which could cause increased economic volatility in the European and global markets. This mid- to long-term uncertainty could have adverse effects on the economy generally and on our ability to earn attractive returns. In particular, currency volatility could mean that our returns are adversely affected by market movements and could make it more difficult, or more expensive, for us to execute prudent currency hedging policies. Potential decline in the value of the British Pound and/or the Euro against other currencies, along with the potential further downgrading of the UK’s sovereign credit rating, could also have an impact on the performance of certain investments made in the UK or Europe.
New or modified laws or regulations governing our operations could adversely affect our business.
We and our portfolio companies are subject to regulation by laws at the U.S. federal, state and local levels. These laws and regulations, as well as their interpretation, could change from time to time, including as the result of interpretive guidance or other directives from the U.S. President and others in the executive branch, and new laws, regulations and interpretations could also come into effect. For example, the current U.S. presidential administration could support an enhanced regulatory agenda that imposes greater costs on all sectors and on financial services companies in particular. Any such new or changed laws or regulations could have a material adverse effect on our business, and political uncertainty could increase regulatory uncertainty in the near term.
The effects of legislative and regulatory proposals directed at the financial services industry or affecting taxation, could negatively impact the operations, cash flows or financial condition of us or our portfolio companies, impose additional costs on us or our portfolio companies, intensify the regulatory supervision of us or our portfolio companies or otherwise adversely affect our business or the business of our portfolio companies. In addition, if we
80
do not comply with applicable laws and regulations, we could lose any licenses that we then hold for the conduct of our business and could be subject to civil fines and criminal penalties.
We invest in securities of issuers that are subject to governmental and non-governmental regulations, including by federal and state regulators and various self-regulatory organizations. Companies participating in regulated activities could incur significant costs to comply with these laws and regulations. If a company in which we invest fails to comply with an applicable regulatory regime, it could be subject to fines, injunctions, operating restrictions or criminal prosecution, any of which could materially and adversely affect the value of our investment.
Additionally, changes to the laws and regulations governing our operations, including those associated with RICs, could cause us to alter our investment strategy in order to avail ourselves of new or different opportunities or result in the imposition of corporate-level taxes on us. Such changes could result in material differences to our strategies and plans and could shift our investment focus from the areas of expertise of GC Advisors to other types of investments in which GC Advisors could have little or no expertise or experience. Any such changes, if they occur, could have a material adverse effect on our results of operations and the value of your investment. If we invest in commodity interests in the future, GC Advisors could determine not to use investment strategies that trigger additional regulation from the Commodity Futures Trading Commission, or the CFTC, or determine to operate subject to CFTC regulation, if applicable. If we or GC Advisors were to operate subject to CFTC regulation, we could incur additional expenses and would be subject to additional regulation.
On October 21, 2014, U.S. risk retention rules adopted pursuant to Section 941 of Dodd-Frank, or the U.S. Risk Retention Rules, were issued and became effective with respect to collateralized loan obligation, or CLOs, on December 24, 2016. The U.S. Risk Retention Rules require the sponsor (directly or through a majority-owned affiliate) of a debt securitization subject to such rules, such as CLOs, in the absence of an exemption, to retain an economic interest, or the Retention Interest, in the credit risk of the assets being securitized in the form of an eligible horizontal residual interest, an eligible vertical interest, or a combination thereof, in accordance with the requirements of the U.S. Risk Retention Rules.Due to the interplay of the 1940 Act restrictions on principal and joint transactions and the U.S. Risk Retention Rules, we sought no-action relief to ensure that we could engage in CLO financing under the 1940 Act and the risk retention rules mandated by Section 941 of Dodd-Frank. On September 7, 2018 we received a no-action letter from the staff, or the Staff, of the Division of Investment Management of the SEC that states that the Staff would not recommend that the SEC take any enforcement action under Section 57(a) of the1940 Act, or Rule 17d-1 under the 1940 Act against us or GC Advisors if we were to acquire CLO equity as a Retention Interest in the manner described in a letter submitted to the Staff on behalf of us.
However, the no-action relief we received did not address whether or not the CLO transactions described therein would satisfy the requirements of the U.S. Risk Retention Rules. As a general matter, available interpretive authority to date addressing the U.S. Risk Retention Rules applicable to CLOs is limited, and there is limited judicial decisional authority or applicable agency interpretation that has directly addressed any of the risk retention approaches taken with respect to CLOs. Accordingly, there can be no assurance that the applicable federal agencies will agree that any CLO transaction we undertake, or the manner in which we hold any retention interests, complies with the U.S. Risk Retention Rules. If we ever determined that undertaking CLO transactions would subject us or any of our affiliates to unacceptable regulatory risk, our ability to execute CLOs could be limited or otherwise curtailed. Given the more attractive financing costs associated with these types of debt securitization as opposed to other types of financing available (such as traditional senior secured facilities), this would, in turn, increase our financing costs. Any associated increase in financing costs would ultimately be borne by our common stockholders.
Over the last several years, there also has been an increase in regulatory attention to the extension of credit outside of the traditional banking sector, raising the possibility that some portion of the non-bank financial sector will be subject to new regulation. While it cannot be known at this time whether any regulation will be implemented or what form it will take, increased regulation of non-bank credit extension could negatively impact our operations, cash flows or financial condition, impose additional costs on us, intensify the regulatory supervision of us or otherwise adversely affect our business, financial condition and results of operations.
We incur significant costs as a result of being a publicly traded company.
As a publicly traded company, we incur legal, accounting and other expenses, including costs associated with the periodic reporting requirements applicable to a company whose securities are registered under the Exchange Act, as well as additional corporate governance requirements, including requirements under the Sarbanes-Oxley Act and other rules implemented by the SEC.
81
Our compliance with Section 404 of the Sarbanes-Oxley Act involves significant expenditures, and non-compliance with Section 404 of the Sarbanes-Oxley Act would adversely affect us and the market price of our common stock.
We are required to report on our internal control over financial reporting pursuant to Section 404 of the Sarbanes-Oxley Act and related rules and regulations of the SEC. As a result, we incur expenses that could negatively impact our financial performance and our ability to make distributions. This process also results in a diversion of management’s time and attention. We cannot ensure that our evaluation, testing and remediation process is effective or that our internal control over financial reporting will be effective. In the event that we are unable to maintain compliance with Section 404 of the Sarbanes-Oxley Act and related rules, we and the market price of our securities would be adversely affected.
Technological innovations and industry disruptions may negatively impact us.
Technological innovations have disrupted traditional approaches in multiple industries and can permit younger companies to achieve success and in the process disrupt markets and market practices.We can provide no assurance that new businesses and approaches will not be created that would compete with us and/or our portfolio companies or alter the market practices in which GC Advisors and its affiliates and us have been designed to function within and on which we depend on for our investment return.New approaches could damage our investments, disrupt the market in which we operate and subject us to increased competition, which could materially and adversely affect our business, financial condition and results of investments.
We are highly dependent on information systems and systems failures could significantly disrupt our business, which could, in turn, negatively affect the market price of our common stock and our ability to pay distributions.
Our business depends on the communications and information systems of GC Advisors and its affiliates. GC Advisors and the Administrator are heavily reliant on the information technology infrastructure, processes and procedures of Golub Capital, which has devoted significant resources to developing effective and reliable information technology systems. Information technology changes rapidly, however, and Golub Capital could fail to stay ahead of such advances. Moreover, Golub Capital could find itself a target of cyberattacks, including cyber espionage, malware, ransomware, and other types of hacking. If any of the Golub Capital information technology systems do not operate properly or are disabled, whether as a result of tampering or a breach of network security systems or otherwise, we and Golub Capital could suffer, among other consequences, financial loss, disruption of businesses and reputational damage and, in the case of Golub Capital, liability to clients. While steps have been taken to mitigate the risk and impact of such attacks, no system is fully attack-proof, and a cyberattack could have an adverse impact on us.
In addition, Golub Capital’s operations rely on the secure processing, storage and transmission of confidential and other information in its computer systems and networks. Although Golub Capital takes protective measures, its computer systems, software and networks could be vulnerable to unauthorized access, theft, misuse, computer viruses or other malicious code and other events that could have an impact on security. We, GC Advisors and the Administrator rely on third-party service providers for certain aspects of their business. Any interruption or deterioration in the performance of these third parties or failures of their information systems and technology could impair the quality of the operations and could affect their reputation, which could have an adverse effect on us.
A data breach could negatively impact our business and result in significant penalties.
GC Advisors is subject to numerous laws in various jurisdictions relating to privacy and the storage, sharing, use, processing, disclosure and protection of information that we and our affiliates hold. The EU's General Data Protection Regulation, the Cayman Islands Data Protection Law, 2017, and the California Consumer Privacy Act of 2018 are recent examples of such laws, and GC Advisors anticipates new privacy and data protection laws will be passed in other jurisdictions in the future. In general, these laws introduce many new obligations on GC Advisors and its affiliates and service providers and create new rights for parties who have given us their personal information, such as investors and others.
Breach of these laws could result in significant financial penalties for GC Advisors and/or us. As interpretation of these laws evolves and new laws are passed, GC Advisors could be required to make changes to its business practices, which could result in additional risks, costs and liabilities to us and adversely affect investment returns. While GC Advisors intends to comply with its privacy and data protection obligations under the privacy and data protection laws that are applicable to it, it is possible that GC Advisors will not be able to accurately anticipate the
82
ways in which regulators and courts will apply or interpret these laws. A violation of applicable privacy and data protection law could result in negative publicity and/or subject GC Advisors or us, to significant costs associated with litigation, settlements, regulatory action, judgments, liabilities and/or penalties.
Our business and operations could be negatively affected if we become subject to stockholder activism, which could cause us to incur significant expense, hinder the execution of our investment strategy or impact our stock price.
Stockholder activism, which could take many forms, including making public demands that we consider certain strategic alternatives, engaging in public campaigns to attempt to influence our corporate governance and/or our management, and commencing proxy contests to attempt to elect the activists’ representatives or others to our board of directors, or arise in a variety of situations, has been increasing in the business development company space recently. While we are currently not subject to any stockholder activism, due to the potential volatility of our stock price and for a variety of other reasons, we could in the future become the target of stockholder activism. Stockholder activism could result in substantial costs and divert management’s and our board of directors’ attention and resources from our business. Additionally, such stockholder activism could give rise to perceived uncertainties as to our future and adversely affect our relationships with service providers and our portfolio companies. Also, we could be required to incur significant legal and other expenses related to any activist stockholder matters. Further, our stock price could be subject to significant fluctuation or otherwise be adversely affected by the events, risks and uncertainties of any stockholder activism.
83
Item 1B. Unresolved Staff Comments
None.
Item 2. Properties
Properties
We do not own any real estate or other physical properties materially important to our operation. Our headquarters are located at 666 Fifth200 Park Avenue, 18th25th Floor, New York, NY 1010310166 and are provided by Golub Capital LLC pursuant to the Administration Agreement. We believe that our office facilities are suitable and adequate to our business.
Item 3. Legal Proceedings
We, GC Advisors and Golub Capital LLC may,could, from time to time, be involved in legal and regulatory proceedings arising out of their respective operations in the normal course of business or otherwise. While there can be no assurance of the ultimate disposition of any such proceedings, each of us, GC Advisors and Golub Capital LLC do not believe it is currently subject to any material legal proceedings.
Item 4. Mine Safety DisclosuresDisclosure
84
PART II
Item 5. Market for Registrant’s Common Equity, Related Stockholder Matters and Issuer Purchases of Equity Securities
Price Range of Common Stock
Our common stock began trading on April 15, 2010 and is currently traded on The Nasdaq Global Select Market under the symbol “GBDC”. The following table lists the high and low closing sale price for our common stock, the closing sale price as a percentage of net asset value, or NAV, and quarterly distributions per share.
| Period | NAV(1) | Closing Sales Price | Premium of High Sales Price to NAV(2) | Premium (Discount) of Low Sales Price to NAV(2) | Distributions Declared | ||||||||||||||||||
| High | Low | ||||||||||||||||||||||
| Fiscal year ended September 30, 2018 | |||||||||||||||||||||||
| Fourth quarter | $ | 16.10 | $ | 19.14 | $ | 18.40 | 18.9 | % | 14.3 | % | $ | 0.32 | |||||||||||
| Third quarter | 16.15 | 18.67 | 17.83 | 15.6 | 10.4 | 0.32 | |||||||||||||||||
| Second Quarter | 16.11 | 18.44 | 17.62 | 14.5 | 9.4 | 0.32 | |||||||||||||||||
| First Quarter | 16.04 | 19.41 | 18.20 | 21.0 | 13.5 | 0.40 | (3) | ||||||||||||||||
| Fiscal year ended September 30, 2017 | |||||||||||||||||||||||
| Fourth quarter | $ | 16.08 | $ | 19.71 | $ | 18.24 | 22.6 | % | 13.4 | % | $ | 0.32 | |||||||||||
| Third quarter | 16.01 | 20.44 | 19.10 | 27.7 | 19.3 | 0.32 | |||||||||||||||||
| Second Quarter | 15.88 | 19.88 | 18.38 | 25.2 | 15.7 | 0.32 | |||||||||||||||||
First Quarter (40 | 15.74 | 18.76 | 17.55 | 19.2 | 11.5 | 0.57 | (4) | ||||||||||||||||
| Period | NAV(1) | Closing Sales Price(2) | Premium (Discount) of High Sales Price to NAV(3) | Premium (Discount) of Low Sales Price to NAV(3) | Distributions Declared | ||||||||||||||||||||||||||||||||||||
| High | Low | ||||||||||||||||||||||||||||||||||||||||
| Fiscal year ended September 30, 2021 | |||||||||||||||||||||||||||||||||||||||||
| Fourth quarter | $ | 15.19 | $ | 16.01 | $ | 15.17 | 5.4 | % | (0.1) | % | $ | 0.29 | |||||||||||||||||||||||||||||
| Third quarter | 15.06 | 16.10 | 14.72 | 6.9 | (2.3) | 0.29 | |||||||||||||||||||||||||||||||||||
| Second quarter | 14.86 | 15.36 | 14.08 | 3.4 | (5.2) | 0.29 | |||||||||||||||||||||||||||||||||||
| First quarter | 14.60 | 14.15 | 12.66 | (3.1) | (13.3) | 0.29 | |||||||||||||||||||||||||||||||||||
| Fiscal year ended September 30, 2020 | |||||||||||||||||||||||||||||||||||||||||
| Fourth quarter | $ | 14.33 | $ | 13.44 | $ | 11.31 | (6.2) | % | (21.1) | % | $ | 0.29 | |||||||||||||||||||||||||||||
| Third quarter | 14.05 | 12.65 | 9.58 | (10.0) | (31.8) | 0.29 | |||||||||||||||||||||||||||||||||||
| Second quarter | 14.62 | 18.14 | 9.55 | 24.1 | (34.7) | 0.33 | |||||||||||||||||||||||||||||||||||
| First quarter | 16.66 | 18.56 | 17.70 | 11.4 | 6.2 | 0.46 | (4) | ||||||||||||||||||||||||||||||||||
(1)NAV per share is determined as of the last day in the relevant quarter and therefore may not reflect the NAV per share on the date of the high and low closing sales prices. The NAVs shown are based on outstanding shares at the end of the each period. (2)On May 15, 2020, we completed a transferable rights offering. The Closing Sales Prices shown have not been adjusted to account for the bonus element associated with the rights issued detailed in Note 11 of the consolidated notes to the financial statements. (3)Calculated as of the respective high or low closing sales price divided by the quarter-end NAV. (4) Includes a special distribution of $0.13 per share. |
The last reported price for our common stock on November 27, 201824, 2021 was $18.55$15.12 per share. As of November 27, 2018,24, 2021, we had 382742 stockholders of record.
Distributions
Our distributions, if any, are determined by the board of directors. We elected to be treated as a RIC under Subchapter M of the Code. In order to be subject to tax as a RIC, we must distribute to our stockholders dividends for U.S. federal income tax purposes each tax year of an amount at least equal to 90% of our net ordinary income and net short-term capital gains in excess of our net long-term capital losses, or investment company taxable income, determined without regard to any deduction for dividends paid. In addition, we are subject to ordinary income and capital gain distribution requirements under U.S. federal excise tax rules for each calendar year. If we do not meet the required distributions we will be subject to a 4% nondeductible federal excise tax on the undistributed amount.
85
The following table reflects the cash distributions, including dividends and returns of capital per share that we have declared on our common stock.
| Record Dates | Payment Date | Distributions Declared | ||||||||||||
| Fiscal year ended September 30, 2021 | ||||||||||||||
| September 8, 2021 | September 29, 2021 | $ | 0.29 | |||||||||||
| June 11, 2021 | June 29, 2021 | 0.29 | ||||||||||||
| March 5, 2021 | March 30, 2021 | 0.29 | ||||||||||||
| December 11, 2020 | December 30, 2020 | 0.29 | ||||||||||||
| Total | $ | 1.16 | ||||||||||||
| Record Dates | Payment Date | Distributions Declared | ||||
| Fiscal year ended September 30, 2018 | ||||||
| September 6, 2018 | September 28, 2018 | $ | 0.32 | |||
| June 8, 2018 | June 28, 2018 | 0.32 | ||||
| March 8, 2018 | March 30, 2018 | 0.32 | ||||
December 12, 2017 (1) | December 28, 2017 | 0.40 | ||||
| Total | $ | 1.36 | ||||
| Fiscal year ended September 30, 2017 | ||||||
| September 6, 2017 | September 29, 2017 | $ | 0.32 | |||
| June 6, 2017 | June 29, 2017 | 0.32 | ||||
| March 7, 2017 | March 30, 2017 | 0.32 | ||||
December 12, 2016 (2) | December 29, 2016 | 0.57 | ||||
| Total | $ | 1.53 | ||||
| Fiscal year ended September 30, 2020 | |||||||||||||||||
| September 8, 2020 | September 29, 2020 | $ | 0.29 | ||||||||||||||
| June 9, 2020 | June 29, 2020 | 0.29 | |||||||||||||||
| March 6, 2020 | March 27, 2020 | 0.33 | |||||||||||||||
December 12, 2019 (1) | December 30, 2019 | 0.46 | |||||||||||||||
| Total | $ | 1.37 | |||||||||||||||
(1) Includes a special distribution of $0.08$0.13 per share.
On November 27, 2018,19, 2021, our board of directors declared a quarterly distribution of $0.32$0.30 per share, and a special distribution of $0.12 per share both of which areis payable on December 28, 201830, 2021 to holders of record as of December 12, 2018.10, 2021.
We have adopted a dividend reinvestment plan that provides for reinvestment of our dividends and other distributions on behalf of our stockholders. As a result, if our board of directors authorizes, and we declare, a cash dividend or other distribution, then our stockholders who participate in our dividend reinvestment plan will have their cash distribution reinvested in additional shares of our common stock, rather than receiving the cash distribution.
86
Stock Performance Graph
This graph compares the stockholder return on our common stock from September 30, 20122015 to September 30, 20182021 with that of the NASDAQ Financial 100 Stock Index and the Standard & Poor’s 500 Stock Index. This graph assumes that on September 30, 2012,2015, $100 was invested in our common stock, the NASDAQ Financial 100 Stock Index, and the Standard & Poor’s 500 Stock Index. The graph also assumes the reinvestment of all cash distributions prior to any tax effect. The graph and other information furnished under this Part II Item 5 of this annual report on Form 10-K shall not be deemed to be “soliciting material” or to be “filed” with the SEC or subject to Regulation 14A or 14C under, or to the liabilities of Section 18 of, the Exchange Act. The stock price performance included in the below graph is not necessarily indicative of future stock performance.
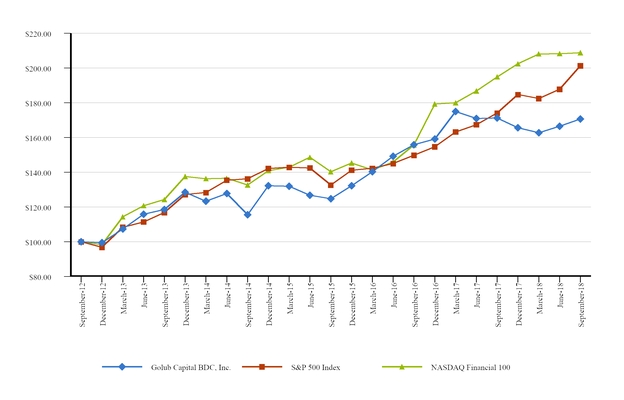
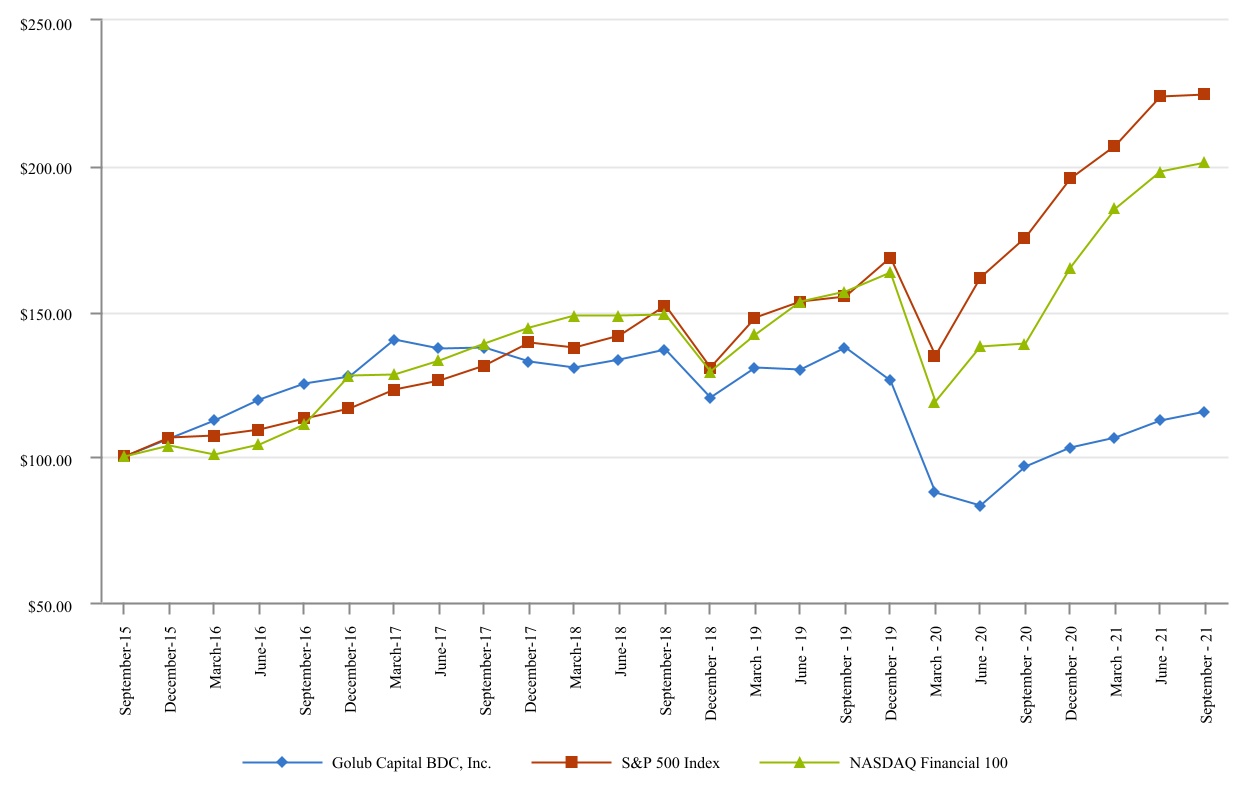
87
Item 6. Selected Consolidated Financial Data
88
| Golub Capital BDC, Inc. | |||||||||||||||||||
| As of and for the years ended September 30, | |||||||||||||||||||
| 2018 | 2017 | 2016 | 2015 | 2014 | |||||||||||||||
| (In thousands, except per share data) | |||||||||||||||||||
| Statement of Operations Data: | |||||||||||||||||||
| Total investment income | $ | 152,171 | $ | 137,764 | $ | 127,871 | $ | 119,968 | $ | 109,526 | |||||||||
| Base management fee | 24,214 | 23,815 | 22,020 | 20,330 | 17,053 | ||||||||||||||
| Incentive fee | 13,110 | 7,560 | 7,266 | 10,226 | 10,128 | ||||||||||||||
| Interest and other debt financing expenses | 33,174 | 31,534 | 27,724 | 24,510 | 20,227 | ||||||||||||||
| All other expenses | 5,652 | 5,309 | 5,881 | 5,905 | 5,583 | ||||||||||||||
Net investment income(1) | 76,021 | 69,546 | 64,980 | 58,997 | 56,535 | ||||||||||||||
| Net realized gain (loss) on investments, secured borrowings, and foreign currency transactions | 17,536 | 9,402 | 6,254 | 9,354 | 5,384 | ||||||||||||||
| Net change in unrealized appreciation (depreciation) on investments, secured borrowings and foreign currency translation | (11,587 | ) | 3,340 | (2,030 | ) | 2,440 | 3,469 | ||||||||||||
Net increase/(decrease) in net assets resulting from operations | 81,970 | 82,288 | 69,204 | 70,791 | 65,388 | ||||||||||||||
| Per share data: | |||||||||||||||||||
| Net asset value | $ | 16.10 | $ | 16.08 | $ | 15.96 | $ | 15.80 | $ | 15.55 | |||||||||
Net investment income(1) | 1.27 | 1.23 | 1.25 | 1.20 | 1.26 | ||||||||||||||
| Net realized gain (loss) on investments, secured borrowings and foreign currency transactions | 0.29 | 0.16 | 0.12 | 0.19 | 0.11 | ||||||||||||||
| Net change in unrealized appreciation (depreciation) on investments, secured borrowings, and foreign currency translation | (0.19 | ) | 0.06 | (0.04 | ) | 0.05 | 0.07 | ||||||||||||
| Net increase in net assets resulting from operations | 1.37 | 1.45 | 1.33 | 1.44 | 1.44 | ||||||||||||||
| Per share distributions declared | 1.36 | 1.53 | 1.28 | 1.28 | 1.28 | ||||||||||||||
| From net investment income | 1.31 | 1.51 | 1.04 | 1.18 | 1.28 | ||||||||||||||
| From capital gains | 0.05 | 0.02 | 0.24 | 0.10 | — | ||||||||||||||
| From return of capital | — | — | — | — | — | ||||||||||||||
| Dollar amount of distributions declared | 81,307 | 86,443 | 66,879 | 62,969 | 57,823 | ||||||||||||||
| From net investment income | 78,328 | 85,304 | 54,461 | 58,152 | 57,823 | ||||||||||||||
| From capital gains | 2,979 | 1,139 | 12,418 | 4,817 | — | ||||||||||||||
| From return of capital | — | — | — | — | — | ||||||||||||||
| Golub Capital BDC, Inc. | |||||||||||||||||||
| As of and for the years ended September 30, | |||||||||||||||||||
| 2018 | 2017 | 2016 | 2015 | 2014 | |||||||||||||||
| (In thousands, except per share data) | |||||||||||||||||||
| Balance Sheet data at period end: | |||||||||||||||||||
| Investments, at fair value | $ | 1,782,841 | $ | 1,685,015 | $ | 1,660,612 | $ | 1,529,784 | $ | 1,347,612 | |||||||||
| Cash, cash equivalents, foreign currencies and restricted cash and cash equivalents | 45,705 | 62,558 | 89,540 | 97,484 | 79,943 | ||||||||||||||
Interest receivable and other assets(2) | 7,006 | 6,603 | 6,357 | 6,158 | 6,318 | ||||||||||||||
Total assets(2) | 1,835,552 | 1,754,176 | 1,756,509 | 1,633,426 | 1,433,873 | ||||||||||||||
| Total debt | 845,683 | 781,100 | 865,175 | 813,605 | 697,539 | ||||||||||||||
Total liabilities(2) | 866,698 | 796,230 | 877,684 | 822,556 | 701,134 | ||||||||||||||
| Total net assets | 968,854 | 957,946 | 878,825 | 810,870 | 732,739 | ||||||||||||||
| Other data: | |||||||||||||||||||
Weighted average yield on income producing investments at fair value(3) | 8.3% | 7.8% | 7.6% | 7.8% | 8.3% | ||||||||||||||
| Number of portfolio companies at period end | 199 | 185 | 183 | 164 | 145 | ||||||||||||||
Item 7. Management’s Discussion and Analysis of Financial Condition and Results of Operations
The information contained in this section should be read in conjunction with our consolidated financial statements and related notes thereto appearing elsewhere in this annual report on Form 10-K. In this report, “we,” “us,” “our” and “Golub Capital BDC” refer to Golub Capital BDC, Inc. and its consolidated subsidiaries.
Forward-Looking Statements
Some of the statements in this annual report on Form 10-K constitute forward-looking statements, which relate to future events or our future performance or financial condition. The forward-looking statements contained in this annual report on Form 10-K involve risks and uncertainties, including statements as to:
•our future operating results;
•our business prospects and the prospects of our portfolio companies;companies, including our and their ability to achieve our respective objectives as a result of the COVID-19 pandemic;
•the effect of investments that we expect to make and the competition for those investments;
•our contractual arrangements and relationships with third parties;
•actual and potential conflicts of interest with GC Advisors LLC, or GC Advisors, and other affiliates of Golub Capital LLC, collectively, Golub Capital;
•the dependence of our future success on the general economy and its effect on the industries in which we invest;
•the ability of our portfolio companies to achieve their objectives;
•the use of borrowed money to finance a portion of our investments and the effect of the COVID-19 pandemic on the availability of equity and debt capital and our use of borrowed funds to finance a portion of our investments;
•the adequacy of our financing sources and working capital;
•the timing of cash flows, if any, from the operations of our portfolio companies;
•general economic and political trends and other external factors;factors, including the COVID-19 pandemic;
•changes in political, economic or industry conditions, the interest rate environment or conditions affecting the financial and capital markets that could result in changes to the value of our assets, including changes from the impact of the COVID-19 pandemic;
•the ability of GC Advisors to locate suitable investments for us and to monitor and administer our investments;
•the ability of GC Advisors or its affiliates to attract and retain highly talented professionals;
•the ability of GC Advisors to continue to effectively manage our business due to the disruptions caused by the COVID-19 pandemic;
•our ability to qualify and maintain our qualification as a regulated investment company, or RIC
and as a business development company;
•general price and volume fluctuations in the stock markets;
•the impact on our business of the Dodd-Frank Wall Street Reform and Consumer Protection Act and the rules and regulations issued thereunder and any actions toward repeal thereof; and
•the effect of changes to tax legislation and our tax position.
Such forward-looking statements may include statements preceded by, followed by or that otherwise include the words “may,” “might,” “will,” “intend,” “should,” “could,” “can,” “would,” “expect,” “believe,” “estimate,” “anticipate,” “predict,” “potential,” “plan” or similar words. The forward looking statements contained in this annual report on Form 10-K involve risks and uncertainties. Our actual results could differ materially from those implied or expressed in the forward-looking statements for any reason, including the factors set forth as “Risk Factors” in this our annual report on Form 10-K.
We have based the forward-looking statements included in this report on information available to us on the date of this report. Actual results could differ materially from those anticipated in our forward-looking statements and future results could differ materially from historical performance. You are advised to consult any additional disclosures
89
TABLE OF CONTENTS
that we may make directly to you or through reports that we have filed or in the future may file with the Securities and Exchange Commission, or the SEC including annual reports on Form 10-K, registration statements on Form N-2, quarterly reports on Form 10-Q and current reports on Form 8-K. This annual report on Form 10-K contains statistics and other data that have been obtained from or compiled from information made available by third-party service providers. We have not independently verified such statistics or data.
TABLE OF CONTENTS
Overview
We are an externally managed, closed-end, non-diversified management investment company that has elected to be regulated as a business development company under the 1940 Act. In addition, for U.S. federal income tax purposes, we have elected to be treated as a RIC under Subchapter M of the Code. As a business development
company and a RIC, we are also subject to certain constraints, including limitations imposed by the 1940 Act and the Code.
Our shares are currently listed on The Nasdaq Global Select Market under the symbol “GBDC”.
Our investment objective is to generate current income and capital appreciation by investing primarily in one stop (a loan that combines characteristics of traditional first lien senior secured loans and second lien or subordinated loans and that are often referred to by other middle-market lenders as unitranche loans) and other senior secured loans of U.S. middle-market companies. We may also selectively invest in second lien and subordinated loans of, and warrants and minority equity securities in U.S. middle-market companies. We intend to achieve our investment objective by (1) accessing the established loan origination channels developed by Golub Capital, a leading lender to U.S. middle-market companies with over $25.0$40.0 billion in capital under management as of September 30, 2018,2021, (2) selecting investments within our core middle-market company focus, (3) partnering with experienced private equity firms, or sponsors, in many cases with whom Golub Capital has invested alongside in the past, (4) implementing the disciplined underwriting standards of Golub Capital and (5) drawing upon the aggregate experience and resources of Golub Capital.
Our investment activities are managed by GC Advisors and supervised by our board of directors of which a majority of the members are independent of us, GC Advisors and its affiliates.
Under the Investment Advisory Agreement, which was most recently reapproved by our board of directors in May 2018, we have agreed to pay GC Advisors an annual base management fee based on our average adjusted gross assets as well as an incentive fee based on our investment performance. The Investment Advisory Agreement was approved by our board of directors in May 2021. Under the Administration Agreement, we are provided with certain administrative services by an administrator, or the Administrator, which is currently Golub Capital LLC. Under the Administration Agreement, we have agreed to reimburse the Administrator for our allocable portion (subject to the review and approval of our independent directors) of overhead and other expenses incurred by the Administrator in performing its obligations under the Administration Agreement.
We seek to create a portfolio that includes primarily one stop and other senior secured loans by primarily investing approximately $5.0$10.0 million to $30.0$75.0 million of capital, on average, in the securities of U.S. middle-market companies. We may also selectively invest more than $30.0$75.0 million in some of our portfolio companies and generally expect that the size of our individual investments will vary proportionately with the size of our capital base.
We generally invest in securities that have been rated below investment grade by independent rating agencies or that would be rated below investment grade if they were rated. These securities, which may beare often referred to as “junk,” have predominantly speculative characteristics with respect to the issuer’s capacity to pay interest and repay principal. In addition, many of our debt investments have floating interest rates that reset on a periodic basis and typically do not fully pay down principal prior to maturity, which may increase our risk of losing part or all of our investment.
91
TABLE OF CONTENTS
As of September 30, 20182021 and 2017,2020, our portfolio at fair value was comprised of the following:
| As of September 30, 2021 | As of September 30, 2020 | |||||||||||||||||||||||||
| Investment Type | Investments at Fair Value (In thousands) | Percentage of Total Investments | Investments at Fair Value (In thousands) | Percentage of Total Investments | ||||||||||||||||||||||
| Senior secured | $ | 784,805 | 16.0 | % | $ | 640,213 | 15.1 | % | ||||||||||||||||||
| One stop | 3,882,314 | 79.3 | 3,485,585 | 82.2 | ||||||||||||||||||||||
| Second lien | 41,857 | 0.9 | 19,640 | 0.5 | ||||||||||||||||||||||
| Subordinated debt | 172 | 0.0 | * | 575 | 0.0 | * | ||||||||||||||||||||
| Equity | 185,738 | 3.8 | 92,197 | 2.2 | ||||||||||||||||||||||
| Total | $ | 4,894,886 | 100.0 | % | $ | 4,238,210 | 100.0 | % | ||||||||||||||||||
| As of September 30, 2018 | As of September 30, 2017 | |||||||||||||
| Investment Type | Investments at Fair Value (In thousands) | Percentage of Total Investments | Investments at Fair Value (In thousands) | Percentage of Total Investments | ||||||||||
| Senior secured | $ | 231,169 | 13.0 | % | $ | 195,029 | 11.6 | % | ||||||
| One stop | 1,430,196 | 80.2 | 1,334,084 | 79.2 | ||||||||||
| Second lien | 9,435 | 0.5 | 9,434 | 0.6 | ||||||||||
| Subordinated debt | 251 | 0.0 | * | 59 | 0.0 | * | ||||||||
LLC equity interests in SLF(1) | 71,084 | 4.0 | 95,015 | 5.6 | ||||||||||
| Equity | 40,706 | 2.3 | 51,394 | 3.0 | ||||||||||
| Total | $ | 1,782,841 | 100.0 | % | $ | 1,685,015 | 100.0 | % | ||||||
| * | Represents an amount less than 0.1%. | ||||
One stop loans include loans to technology companies undergoing strong growth due to new services, increased adoption and/or entry into new markets. We refer to loans to these companies as late stage lending loans or recurring revenue loans. Other targeted characteristics of late stage lending businesses include strong customer revenue retention rates, a diversified customer base and backing from growth equity or venture capital firms. In some cases, the borrower’s high revenue growth is supported by a high level of discretionary spending. As part of the underwriting of such loans and consistent with industry practice, we may adjust our characterization of the earnings of such borrowers for a reduction or elimination of such discretionary expenses, if appropriate. As of September 30, 20182021 and 2017,2020, one stop loans included $169.4$527.8 million and $138.6$430.2 million, respectively, of late stage lending loans at fair value.
As of September 30, 2018, 20172021 and 2016,2020, we had debt and equity investments in 199, 185296 and 183254 portfolio companies, respectively, and an investment in SLF.respectively.
The following table shows the weighted average income yield and weighted average investment income yield of our earning portfolio company investments, which represented nearly 100% of our debt investments, as well as the total return based on our average net asset value, and the total return based on the change in the quoted market price of our stock and assuming distributions were reinvested in accordance with our dividend reinvestment plan, or DRIP, in each case for the years ended September 30, 2018, 20172021 and 2016 was as follows:
| For the years ended September 30, | |||||
| 2018 | 2017 | 2016 | |||
Weighted average income yield(1)(2) | 8.3% | 7.8% | 7.6% | ||
Weighted average investment income yield(1)(3) | 8.9% | 8.4% | 8.2% | ||
Total return based on average net asset value(4) | 8.5% | 9.1% | 8.4% | ||
Total return based on market value(5) | 7.7% | 10.2% | 25.4% | ||
2020:
| Year ended | |||||||||||||||||||||||
| September 30, 2021 | September 30, 2020 | ||||||||||||||||||||||
Weighted average income yield (1) | 7.4% | 7.6% | |||||||||||||||||||||
Weighted average investment income yield (2) | 7.9% | 8.0% | |||||||||||||||||||||
Total return based on average net asset value (3) | 13.7% | 2.5% | |||||||||||||||||||||
Total return based on market value (4) | 28.9% | (22.8)% | |||||||||||||||||||||
(1)Represents income from interest and fees, excluding amortization of capitalized fees, discounts and purchase premium (as described in Note 2 of the consolidated financial statements), divided by the average fair value of earning portfolio company investments, and does not represent a return to any investor in us. (2)Represents income from interest, fees and amortization of capitalized fees and discounts, excluding amortization of purchase premium (as described in Note 2 of the consolidated financial statements), divided by the average fair value of earning portfolio investments, and does not represent a return to any investor in us. (3)Total return based on average net asset value is calculated as (a) the net increase/(decrease) in net assets resulting from operations divided by (b) the daily average of total net assets. Total return does not include sales load. (4)Total return based on market value assumes distributions are reinvested in accordance with the DRIP. Total return does not include sales load. |
Revenues: We generate revenue in the form of interest and fee income on debt investments and capital gains and distributions, if any, on portfolio company investments that we originate or acquire. Our debt investments, whether in the form of senior secured, one stop, second lien or subordinated loans, typically have a term of three to seven years and bear interest at a fixed or floating rate. In some instances, we receive payments on our debt investments based on scheduled amortization of the outstanding balances. In addition, we receive repayments of some of our debt investments prior to their scheduled maturity date. The frequency or volume of these repayments fluctuates
92
TABLE OF CONTENTS
significantly from period to period. Our portfolio activity also reflects the proceeds of sales of securities. In some cases, our investments provide for deferred interest payments or PIK interest. The principal amount of loans and any accrued but unpaid interest generally become due at the maturity date. In addition, we may generate revenue in the form of commitment, origination, amendment, structuring or due diligence fees, fees for providing managerial assistance and consulting fees. Loan origination fees, original issue discount and market discount or premium are
capitalized, and we accrete or amortize such amounts as interest income. We record prepayment premiums on loans as fee income. For additional details on revenues, see “Critical Accounting Policies—Revenue Recognition.”
We recognize realized gains or losses on investments based on the difference between the net proceeds from the disposition and the amortized cost basis of the investment or derivative instrument, without regard to unrealized gains or losses previously recognized. We record current period changes in fair value of investments and derivative instruments that are measured at fair value as a component of the net change in unrealized appreciation (depreciation) on investmentsinvestment transactions in the Consolidated Statements of Operations.
Expenses: Our primary operating expenses include the payment of fees to GC Advisors under the Investment Advisory Agreement and interest expense on our outstanding debt. We bear all other out-of-pocket costs and expenses of our operations and transactions, including:
•calculating our NAV (including the cost and expenses of any independent valuation firm);
•fees and expenses incurred by GC Advisors payable to third parties, including agents, consultants or other advisors, in monitoring financial and legal affairs for us and in monitoring our investments and performing due diligence on our prospective portfolio companies or otherwise relating to, or associated with, evaluating and makinginvestments, which fees and expenses may include, among other items, due diligence reports, appraisal reports, any studies that may be commissioned by GC Advisors and travel and lodging expenses;
•expenses related to unsuccessful portfolio acquisition efforts;
•offerings of our common stock and other securities;
•administration fees and expenses, if any, payable under the Administration Agreement (including payments based upon our allocable portion of the Administrator’s overhead in performing its obligations under the Administration Agreement, including rent and the allocable portion of the cost of our chief compliance officer, chief financial officer and their respective staffs);
•fees payable to third parties, including agents, consultants or other advisors, relating to, or associated with, evaluating and making investments in portfolio companies, including costs associated with meeting financial sponsors;
•transfer agent, dividend agent and custodial fees and expenses;
•U.S. federal and state registration and franchise fees;
•all costs of registration and listing our shares on any securities exchange;
•U.S. federal, state and local taxes;
•independent directors’ fees and expenses;
•costs of preparing and filing reports or other documents required by the SEC or other regulators;
•costs of any reports, proxy statements or other notices to stockholders, including printing costs;
•costs associated with individual or group stockholders;
•costs associated with compliance under the Sarbanes-Oxley Act;
•our allocable portion of any fidelity bond, directors and officers/errors and omissions liability insurance, and any other insurance premiums;
•direct costs and expenses of administration, including printing, mailing, long distance telephone, copying, secretarial and other staff, independent auditors and outside legal costs;
•proxy voting expenses; and
•all other expenses incurred by us or the Administrator in connection with administering our business.
We expect our general and administrative expenses to be relatively stable or decline as a percentage of total assets during periods of asset growth and to increase during periods of asset declines.
93
TABLE OF CONTENTS
Prior to the redemption of the 20102014 Notes and termination of the documents governing the 20102014 Debt Securitization on July 20, 2018,August 26, 2020, GC Advisors served as collateral manager for the 2010 Issuer, under a collateral management agreement, or the 2010 Collateral Management Agreement, and was entitled to receive an annual fee in an amount equal to 0.35% of the principal balance of the portfolio loans held by the 2010 Issuer at the beginning of the collection period relating to each payment date, which was payable in arrears on each payment date. Under the 2010 Collateral Management Agreement, the term ‘‘collection period’’ referred to a quarterly period running from the day after the end of the prior collection period to the fifth business day of the calendar month in which a payment date occurs. Following the redemption of the 2010 Notes on July 20, 2018, the 2010 Collateral Management Agreement was terminated.
GC Advisors, as collateral manager for the 2018 Issuer under the 2018 Collateral Management Agreement, is entitled to receive an annual fee in an amount equal to 0.25% of the principal balance of the portfolio loans held by the 2018 Issuer at the beginning of the collection period relating to each payment date, which is payable in arrears on each payment date. Under the 2018 Collateral Management Agreement, the term "collection period" refers to the period commencing on the third business day prior to the preceding payment date and ending on (but excluding) the third business day prior to such payment date.
GC Advisors, as collateral manager for the GCIC 2018 Issuer under the GCIC 2018 Collateral Management Agreement is entitled to receive an annual fee in an amount equal to 0.35% of the principal balance of the portfolio loans held by the GCIC 2018 Issuer at the beginning of the collection period relating to each payment date, which is payable in arrears on each payment date. Under the 2018 GCIC Collateral Management Agreement, the term “collection period” generally refers to a quarterly period commencing on the day after the end of the prior collection period to the tenth business day prior to the payment date.
Prior to the redemption of the 2020 Notes and the termination of the documents governing the 2020 Debt Securitization on August 26, 2021, GC Advisors served as collateral manager for the 2020 Issuer under the 2020 Collateral Management Agreement and was entitled to receive an annual fee in an amount equal to 0.35% of the principal balance of the portfolio loans held by the 2020 Issuer at the beginning of the collection period relating to each payment date, which is payable in arrears on each payment date. Under the 2020 Collateral Management Agreement, the term “collection period” generally referred to a quarterly period commencing on the day after the end of the prior collection period to the tenth business day prior to the payment date.
Collateral management fees were paid directly by the 20102014 Issuer and 2020 Issuer and are paid directly by the 20142018 Issuer and GCIC 2018 Issuer to GC Advisors and are offset against the management fees payable under the Investment Advisory Agreement. In addition, the 2010 Issuer and 2014 Issuer paid Wells Fargo Securities, LLC structuring and placement fees for its services in connection with the initial structuring and subsequent amendments to the 2010initial structuring of the 2014 Debt SecuritizationSecuritization. The 2018 Issuer paid Morgan Stanley & Co. LLC structuring and placement fees for its services in connection with the structuring of the 2018 Debt Securitization. Before we acquired the GCIC 2018 Issuer as part of our acquisition of GCIC (as defined in the “GCIC Acquisition” section below), the GCIC 2018 Issuer paid Wells Fargo Securities, LLC structuring and placement fees for its services in connection with the initial structuring of the 2014GCIC 2018 Debt Securitization. The 2020 Issuer paid Wells Fargo Securities, LLC structuring and placement fees for its services in connection with the structuring of the 2020 Debt Securitization. Term debt securitizations are also known as collateralized loan obligationsCLOs and are a form of secured financing incurred by us, which isare consolidated by us and subject to our overall asset coverage requirement. The 20102018 Issuer the 2014 Issuer and GCIC 2018 Issuer also agreed to pay ongoing administrative expenses to the trustee, collateral manager, independent accountants, legal counsel, rating agencies and independent managers in connection with developing and maintaining reports, and providing required services in connection with the administration of the 20102018 Debt Securitization the 2014 Debt Securitization, and GCIC 2018 Debt Securitization and collectively the Debt Securitizations, as applicable.
We believe that these administrative expenses approximate the amount of ongoing fees and expenses that we would be required to pay in connection with a traditional secured credit facility. Our common stockholders indirectly bear all of these expenses.
On September 16, 2019, we completed our acquisition of GCIC pursuant to the Merger Agreement. Pursuant to the Merger Agreement, Merger Sub was first merged with and into GCIC, with GCIC as the surviving company, and, immediately following the Initial Merger, GCIC was then merged with and into us, with us as the surviving company.
94
TABLE OF CONTENTS
In accordance with the terms of the Merger Agreement, at the effective time of the Merger, each outstanding share of GCIC’s common stock was converted into the right to receive 0.865 shares of our common stock (with GCIC’s stockholders receiving cash in lieu of fractional shares of our common stock). As a result of the Merger, we issued an aggregate of 71,779,964 shares of our common stock to former stockholders of GCIC.
Rights Offering
On May 15, 2020, we completed a transferable rights offering, or the Rights Offering. We issued to stockholders of record on April 8, 2020 one transferable right for each four shares of our common stock held on the record date. Each holder of rights was entitled to subscribe for one share of common stock for every right held at a subscription price of $9.17 per share. On May 15, 2020, we issued a total of 33,451,902 shares. Net proceeds after deducting the dealer manager fees and other offering expenses were approximately $300.4 million. 3,191,448 shares were purchased in the rights offering by affiliates of GC Advisors.
COVID-19 Pandemic
The rapid spread of COVID-19, which was identified as a global pandemic by the World Health Organization in 2020, resulted in governmental authorities imposing restrictions on travel and the temporary closure of many corporate offices, retail stores, restaurants, healthcare facilities, fitness clubs and manufacturing facilities and factories in affected jurisdictions. While several countries, as well as certain states in the United States, have lifted or reduced certain travel restrictions, business closures and other quarantine measures and recurring COVID-19 outbreaks have led to the re-introduction of such restrictions in certain states in the United States and globally and could continue to lead to the re-introduction of such restrictions elsewhere. In early 2021, COVID-19 vaccines started to be administered to high-risk adults and essential workers across the United States and eligibility to receive the vaccine has since expanded to all adults and children of certain ages. Although we believe the number of vaccinated adults and children in the United States is promising for continued reductions of travel restrictions and other quarantine measures, we are unable to predict the duration of business and supply chain disruptions, the extent to which COVID-19 will continue to affect our portfolio companies’ operating results or the impact COVID-19 may have on our results of operations and financial condition.
We continue to experience reversal of the unrealized depreciation recognized during the three months ended March 31, 2020 as portfolio companies generally performed better than expected, especially those in COVID-impacted sub-sectors, and private equity sponsors have generally stepped up to support their portfolio companies. We and GC Advisors continue to monitor the rapidly evolving situation relating to the COVID-19 pandemic and guidance from U.S. and international authorities, including federal, state and local public health authorities and future recommendations from such authorities may further impact our business operations and financial results. Due to the resurgence of COVID-19 and the threat of new variants of COVID-19, we remain cautious and concerned about the on-going impacts to the U.S. economy from COVID-19, but the positive trends identified above contributed to strong financial results for the year ended September 30, 2021.
Recent Developments
On November 1, 2018, the 2018 Issuer entered into a purchase agreement,October 13, 2021, we issued an additional $200.0 million aggregate principal amount of our 2026 Notes (as defined in Note 7 of our consolidated financial statements), or the Purchase Agreement, with Golub Capital BDC CLO III Depositor LLC, as depositor, and Morgan Stanley & Co. LLC, as the initial purchaser, or the Initial Purchaser, pursuant to which the 2018 Issuer agreed to sell the 2018 Notes to the Initial Purchaser as partNew 2026 Notes. Upon issuance of the 2018 Debt Securitization. Term debt securitizations are also known as CLOs and are a formNew 2026 Notes, the outstanding aggregate principal amount of secured financing incurred by the Company, which are consolidated by the Company and subject to its overall asset coverage requirement.2026 Notes is $600.0 million.
On November 1, 2018,October 14, 2021, we entered into an amendmentagreement with Signature Bank, Wells Fargo Bank, National Association and Regions Bank, pursuant to which, through the documents governingaccordion feature in the MS Credit Facility. The MSJPM Credit Facility amendment increased(as defined in Note 7 of our consolidated financial statements), the borrowing capacityaggregate commitments under the MSJPM Credit Facility increased from $300.0$475.0 million to $450.0$687.5 million. The other material terms
On October 15, 2021, we issued an additional $100.0 million aggregate principal amount of our 2024 Notes (as defined in Note 7 of our consolidated financial statements), or the New 2024 Notes. Upon issuance of the MS Credit Facility were unchanged.New 2024 Notes, the outstanding aggregate principal amount of the 2024 Notes is $500.0 million.
95
TABLE OF CONTENTS
On November 16, 2018, we completed the 2018 Debt Securitization. The 2018 Notes were issued by the 2018 Issuer and are backed by a diversified portfolio of senior secured and second lien loans. The transaction was executed through a private placement of approximately $327.0 million of AAA/AAA Class A 2018 Notes, which bear interest at the three-month LIBOR plus 1.48%; $61.2 million of AA Class B 2018 Notes, which bear interest at the three-month LIBOR plus 2.10%; $20.0 million of A Class C-1 2018 Notes, which bear interest at the three-month LIBOR plus 2.80%; $38.8 million of A Class C-2 2018 Notes, which bear interest at the three-month LIBOR plus 2.65%; $42.0 million of BBB- Class D 2018 Notes, which bear interest at the three-month LIBOR plus 2.95%; and $113.4 million of Subordinated 2018 Notes which do not bear interest. We indirectly retained all of the Class C-2, Class D and Subordinated 2018 Notes. The 2018 Notes are scheduled to mature on January 20, 2031.
On November 19, 2021, we entered into an amendment, or the JPM Credit Facility Amendment, to the JPM Credit Facility to amend the JPM Credit Facility to, among other things, (x) increase the accordion feature, which allows the Company, under certain circumstances, to increase the total size of the facility, to a total facility size of $1.5 billion from $712.5 million, and middle-market companies(y) replace the LIBOR benchmark and interest rate for loans denominated in Pounds Sterling and Swiss Francs. Upon effectiveness of the JPM Credit Facility Amendment on November 19, 2021, borrowings under the JPM Credit Facility remain subject to compliance with a borrowing base test. In connection with the JPM Credit Facility Amendment, interest under the JPM Credit Facility for loans denominated in Pounds Sterling or Swiss Francs, (A) if the value of the gross borrowing base is equal to or greater than 1.60 times the aggregate amount of certain outstanding indebtedness of the Company, or the Combined Debt Amount, is payable at a rate equal to one month SONIA plus 1.7826% per annum or one month Swiss Average Overnight Rate, or SARON, plus 1.6929% per annum, respectively and, (B) if the value of the gross borrowing base is less than 1.60 times the Combined Debt Amount, is payable at a rate equal to one month SONIA plus 1.9076% per annum or one month SARON plus 1.8179% per annum, respectively.
On November 23, 2021, we entered into an agreement with First National Bank of Pennsylvania, JPMorgan Chase Bank, N.A., MUFG Union Bank, N.A., CIBC Bank USA, and Sumitomo Mitsui Banking Corporation, pursuant to which, through the accordion feature in the United States with annual revenues between $10.0JPM Credit Facility, the aggregate commitments under the JPM Credit Facility increased from $687.5 million and $2.5 billion represent a significant growth segment of the U.S. economy and often require substantial capital investments to grow. Middle-market companies have generated a significant number of investment opportunities for investment funds managed or advised by Golub Capital, and we believe that this market segment will continue to produce significant investment opportunities for us.$1.0 billion.
Consolidated Results of Operations
The comparison of the fiscal years ended September 30, 2020 and 2019 can be found in our Form 10-K for the fiscal year ended September 30, 2020 located within Item 7. Management's Discussion and Analysis of Financial Condition and Results of Operations.
Consolidated operating results for the years ended September 30, 2018, 20172021 and 20162020 are as follows:
| For the years ended September 30, | Variances | ||||||||||||||||||
| 2018 | 2017 | 2016 | 2018 vs. 2017 | 2017 vs. 2016 | |||||||||||||||
| (In thousands) | |||||||||||||||||||
| Interest income | $ | 131,274 | $ | 119,313 | $ | 106,184 | $ | 11,961 | $ | 13,129 | |||||||||
| Income from accretion of discounts and origination fees | 9,660 | 9,497 | 8,662 | 163 | 835 | ||||||||||||||
Interest and dividend income from investments in SLF(1) | 8,099 | 6,568 | 11,038 | 1,531 | (4,470 | ) | |||||||||||||
| Dividend income | 624 | 629 | 539 | (5 | ) | 90 | |||||||||||||
| Fee income | 2,514 | 1,757 | 1,448 | 757 | 309 | ||||||||||||||
| Total investment income | 152,171 | 137,764 | 127,871 | 14,407 | 9,893 | ||||||||||||||
| Total expenses | 76,150 | 68,201 | 62,558 | 7,949 | 5,643 | ||||||||||||||
| Net investment income - before excise tax | 76,021 | 69,563 | 65,313 | 6,458 | 4,250 | ||||||||||||||
| Excise tax | — | 17 | 333 | (17 | ) | (316 | ) | ||||||||||||
| Net investment income - after excise tax | 76,021 | 69,546 | 64,980 | 6,475 | 4,566 | ||||||||||||||
| Net realized gain (loss) on investments and foreign currency transactions | 17,536 | 9,402 | 6,254 | 8,134 | 3,148 | ||||||||||||||
| Net change in unrealized appreciation (depreciation) on investments, foreign currency translation and secured borrowings | (11,587 | ) | 3,340 | (2,030 | ) | (14,927 | ) | 5,370 | |||||||||||
Net increase in net assets resulting from operations | $ | 81,970 | $ | 82,288 | $ | 69,204 | $ | (318 | ) | $ | 13,084 | ||||||||
Average earning debt investments, at fair value(2) | $ | 1,602,119 | $ | 1,554,527 | $ | 1,417,547 | $ | 47,592 | $ | 136,980 | |||||||||
| Average investments in subordinated notes of SLF, at fair value | — | 19,267 | 82,703 | (19,267 | ) | (63,436 | ) | ||||||||||||
Average earning portfolio company investments, at fair value(2) | $ | 1,602,119 | $ | 1,573,794 | $ | 1,500,250 | $ | 28,325 | $ | 73,544 | |||||||||
| Year ended | Variances | ||||||||||||||||||||||||||||||||||||||||||||||
| September 30, 2021 | September 30, 2020 | 2021 vs. 2020 | |||||||||||||||||||||||||||||||||||||||||||||
| (In thousands) | |||||||||||||||||||||||||||||||||||||||||||||||
| Interest income | $ | 309,832 | $ | 318,480 | $ | (8,648) | |||||||||||||||||||||||||||||||||||||||||
| Accretion of discounts and amortization of premiums | 21,399 | 16,437 | 4,962 | ||||||||||||||||||||||||||||||||||||||||||||
| GCIC acquisition purchase premium amortization | (30,793) | (39,920) | 9,127 | ||||||||||||||||||||||||||||||||||||||||||||
Dividend income from LLC equity interests in SLF and GCIC SLF(1) | — | 1,905 | (1,905) | ||||||||||||||||||||||||||||||||||||||||||||
| Dividend income | 1,720 | 291 | 1,429 | ||||||||||||||||||||||||||||||||||||||||||||
| Fee income | 4,967 | 1,760 | 3,207 | ||||||||||||||||||||||||||||||||||||||||||||
| Total investment income | 307,125 | 298,953 | 8,172 | ||||||||||||||||||||||||||||||||||||||||||||
| Total net expenses | 139,453 | 159,894 | (20,441) | ||||||||||||||||||||||||||||||||||||||||||||
| Net investment income | 167,672 | 139,059 | 28,613 | ||||||||||||||||||||||||||||||||||||||||||||
| Net realized gain (loss) on investment transactions | 8,297 | (16,277) | 24,574 | ||||||||||||||||||||||||||||||||||||||||||||
| Net realized gain (loss) on investment transactions due to purchase premium | (392) | (2,383) | 1,991 | ||||||||||||||||||||||||||||||||||||||||||||
| Net change in unrealized appreciation (depreciation) on investment transactions excluding purchase premium | 134,061 | (107,830) | 241,891 | ||||||||||||||||||||||||||||||||||||||||||||
| Net change in unrealized appreciation on investment transactions due to purchase premium | 31,185 | 42,303 | (11,118) | ||||||||||||||||||||||||||||||||||||||||||||
| Net gain (loss) on investment transactions | 173,151 | (84,187) | 257,338 | ||||||||||||||||||||||||||||||||||||||||||||
| Provision for taxes on unrealized appreciation on investments | (543) | — | (543) | ||||||||||||||||||||||||||||||||||||||||||||
| Net increase in net assets resulting from operations | $ | 340,280 | $ | 54,872 | $ | 285,408 | |||||||||||||||||||||||||||||||||||||||||
Average earning debt investments, at fair value(2) | $ | 4,236,042 | $ | 4,209,837 | $ | 26,205 | |||||||||||||||||||||||||||||||||||||||||
96 TABLE OF CONTENTS (1)For periods ending on or after January 1, 2020, the assets and liabilities of SLF and GCIC SLF are consolidated into our financial statements and notes thereto. (2)Does not include our investments in LLC equity interests in SLF and GCIC SLF. |
Net income can vary substantially from period to period for various reasons, including the recognition of realized gains and losses and unrealized appreciation and depreciation. As a result, annualyear-to-date comparisons of net income may not be meaningful.
On September 16, 2019, we completed our acquisition of GCIC. The acquisition was accounted for under the asset acquisition method of accounting in accordance with ASC 805-50, Business Combinations — Related Issues. Under asset acquisition accounting, where the consideration paid to GCIC’s stockholders exceeded the relative fair values of the assets acquired and liabilities assumed, the premium paid by us was allocated to the cost of the GCIC assets acquired by us pro-rata based on their relative fair value. Immediately following the acquisition of GCIC, we recorded its assets at their respective fair values and, as a result, the purchase premium allocated to the cost basis of the GCIC assets acquired was immediately recognized as unrealized depreciation on our Consolidated Statement of Operations. The purchase premium allocated to investments in loan securities will amortize over the life of the loans through interest income with a corresponding reversal of the unrealized depreciation on such loans acquired through their ultimate disposition. The purchase premium allocated to investments in equity securities will not amortize over the life of the equity securities through interest income and, assuming no subsequent change to the fair value of the equity securities acquired from GCIC and disposition of such equity securities at fair value, we will recognize a realized loss with a corresponding reversal of the unrealized depreciation upon disposition of the equity securities acquired.
As a supplement to our GAAP financial measures, we have provided the following non-GAAP financial measures that we believe are useful for the reasons described below:
•“Adjusted Net Investment Income” - excludes the amortization of the purchase price premium and the accrual for the capital gain incentive fee (including the portion of such accrual that is not payable under the Investment Advisory Agreement) from net investment income calculated in accordance with GAAP;
•“Adjusted Net Realized and Unrealized Gain/(Loss)” - excludes the unrealized loss resulting from the purchase premium write-down and the corresponding reversal of the unrealized loss resulting from the amortization of the premium on loans or from the sale of equity investments from the determination of realized and unrealized gain/(loss) determined in accordance with GAAP; and
•“Adjusted Net Income/(Loss)” – calculates net income and earnings per share based on Adjusted Net Investment Income and Adjusted Net Realized and Unrealized Gain/(Loss).
| Year ended September 30, | ||||||||||||||||||||||||||||||||
| 2021 | 2020 | |||||||||||||||||||||||||||||||
| (In thousands) | ||||||||||||||||||||||||||||||||
| Net investment income | $ | 167,672 | $ | 139,059 | ||||||||||||||||||||||||||||
| Add: GCIC acquisition purchase premium amortization | 30,793 | 39,920 | ||||||||||||||||||||||||||||||
| Adjusted net investment income | $ | 198,465 | $ | 178,979 | ||||||||||||||||||||||||||||
| Net gain (loss) on investment transactions | $ | 173,151 | $ | (84,187) | ||||||||||||||||||||||||||||
| Add: Realized (gain) loss on investment transactions due to purchase premium | 392 | 2,383 | ||||||||||||||||||||||||||||||
| Less: Net change in unrealized appreciation on investment transactions due to purchase premium | (31,185) | (42,303) | ||||||||||||||||||||||||||||||
| Adjusted net realized and unrealized gain/(loss) | $ | 142,358 | $ | (124,107) | ||||||||||||||||||||||||||||
| Net increase in net assets resulting from operations | $ | 340,280 | $ | 54,872 | ||||||||||||||||||||||||||||
| Add: GCIC acquisition purchase premium amortization | 30,793 | 39,920 | ||||||||||||||||||||||||||||||
| Add: Realized (gain) loss on investment transactions due to purchase premium | 392 | 2,383 | ||||||||||||||||||||||||||||||
| Less: Net change in unrealized appreciation on investment transactions due to purchase premium | (31,185) | (42,303) | ||||||||||||||||||||||||||||||
| Adjusted net income | $ | 340,280 | $ | 54,872 | ||||||||||||||||||||||||||||
We believe that excluding the financial impact of the purchase premium in the above non-GAAP financial measures is useful for investors as this is a non-cash expense/loss and is one method we use to measure our results of operations.
97
TABLE OF CONTENTS
Although these non-GAAP financial measures are intended to enhance investors’ understanding of our business and performance, these non-GAAP financial measures should not be considered an alternative to GAAP.
Investment Income
Investment income increased from the year ended September 30, 20172020 to the year ended September 30, 20182021 by $14.4$8.2 million, primarily asdue to a result ofreduction in GCIC acquisition purchase price premium amortization, an increase in the average earning debt investments balance, which is the average balancefee income of accruing loans in our investment portfolio, of $47.6$3.2 million primarily driven by an increase in LIBORprepayment fees and an increase in accretion income of $5.0 million resulting from our investments in SLF attributable to increase in income from our investments in SLF. Investment income increased from the year ended September 30, 2016 to the year ended September 30, 2017 by $9.9 million primarily as a resultpayoffs of an increase in the average earning investment balance, which is the annual average balance of accruing loans in our investment portfolio of $137.0 million.company investments. These increases were partially offset by a declinedecrease in interest income from our investments in SLF of $4.5 million that was attributabledriven primarily by a lower average LIBOR rate for the year ended September 30, 2021 as compared to a decline in the credit performance of SLF's portfolio.average LIBOR rate for the year ended September 30, 2020 and interest rate compression on new one stop and senior secured loans during the year ended September 30, 2021.
The income yield by debt security type for the years ended September 30, 2018, 20172021 and 20162020 was as follows:
| Year ended September 30, | |||||||||||||||||||||||||||||
| 2021 | 2020 | ||||||||||||||||||||||||||||
| Senior secured | 6.1% | 6.5% | |||||||||||||||||||||||||||
| One stop | 7.7% | 7.8% | |||||||||||||||||||||||||||
| Second lien | 11.5% | 10.2% | |||||||||||||||||||||||||||
| Subordinated debt | 12.0% | 11.2% | |||||||||||||||||||||||||||
| For the years ended September 30, | |||||
| 2018 | 2017 | 2016 | |||
| Senior secured | 7.1% | 6.4% | 6.3% | ||
| One stop | 8.5% | 7.9% | 7.7% | ||
| Second lien | 10.1% | 10.3% | 9.9% | ||
| Subordinated debt | 15.0% | 8.8% | 5.2% | ||
Subordinated notes in SLF(1) | N/A | 8.5% | 8.4% | ||
Income yields on one stop and senior secured loans increaseddecreased for the year ended September 30, 20182021 as compared to the year ended September 30, 2020 primarily due to a decrease in the riseaverage LIBOR for the year ended September 30, 2021 compared to the year ended September 30, 2020. Our loan portfolio is insulated from a drop in LIBOR.LIBOR below approximately 1.0% as over 90.0% of the loan portfolio at fair value as of September 30, 2021 is subject to a LIBOR floor. As of September 30, 2018,2021, the weighted average LIBOR floor of our loans at fair value was 0.99%.
Income yields on one stop and senior secured loans also decreased for the year ended September 30, 2021 as compared to the year ended September 30, 2020 primarily due to a general trend of interest rate compression on new investments.
As of September 30, 2021, we have onesix second lien investmentinvestments and two subordinated debt investments as shown in the Consolidated Schedule of Investments. Due to the limited number of second lien and subordinated debt investments, annual income yields on second lien and subordinated debt investments can be significantly impacted by the addition, subtraction or refinancing of one investment.
For additional details on investment yields and asset mix, refer to the “Liquidity and Capital Resources - Portfolio Composition, Investment Activity and Yield” section below.
98
TABLE OF CONTENTS
Expenses
The following table summarizes our expenses for the years ended September 30, 2018, 20172021 and 2016:2020:
| Year ended September 30, | Variances | |||||||||||||||||||||||||||||||||||||||||||||||||
| 2021 | 2020 | 2021 vs. 2020 | ||||||||||||||||||||||||||||||||||||||||||||||||
| (In thousands) | ||||||||||||||||||||||||||||||||||||||||||||||||||
| Interest and other debt financing expenses | $ | 55,536 | $ | 71,324 | $ | (15,788) | ||||||||||||||||||||||||||||||||||||||||||||
| Amortization of debt issuance costs | 10,203 | 3,534 | 6,669 | |||||||||||||||||||||||||||||||||||||||||||||||
| Base management fee, net of waiver | 57,858 | 59,243 | (1,385) | |||||||||||||||||||||||||||||||||||||||||||||||
| Income incentive fee | 3,214 | 13,831 | (10,617) | |||||||||||||||||||||||||||||||||||||||||||||||
| Capital gain incentive fee | — | — | — | |||||||||||||||||||||||||||||||||||||||||||||||
| Professional fees | 3,992 | 4,727 | (735) | |||||||||||||||||||||||||||||||||||||||||||||||
| Administrative service fee | 7,227 | 6,037 | 1,190 | |||||||||||||||||||||||||||||||||||||||||||||||
| General and administrative expenses | 1,423 | 1,198 | 225 | |||||||||||||||||||||||||||||||||||||||||||||||
| Net expenses | $ | 139,453 | $ | 159,894 | $ | (20,441) | ||||||||||||||||||||||||||||||||||||||||||||
| Average debt outstanding | $ | 2,184,010 | $ | 2,200,950 | $ | (16,940) | ||||||||||||||||||||||||||||||||||||||||||||
| For the years ended September 30, | Variances | ||||||||||||||||||
| 2018 | 2017 | 2016 | 2018 vs. 2017 | 2017 vs. 2016 | |||||||||||||||
| (In thousands) | |||||||||||||||||||
| Interest and other debt financing expenses | $ | 29,859 | $ | 28,245 | $ | 23,540 | $ | 1,614 | $ | 4,705 | |||||||||
| Amortization of debt issuance costs | 3,315 | 3,289 | 4,184 | 26 | (895 | ) | |||||||||||||
| Base management fee | 24,214 | 23,815 | 22,020 | 399 | 1,795 | ||||||||||||||
| Income incentive fee | 11,652 | 4,741 | 6,022 | 6,911 | (1,281 | ) | |||||||||||||
| Capital gain incentive fee | 1,458 | 2,819 | 1,244 | (1,361 | ) | 1,575 | |||||||||||||
| Professional fees | 2,721 | 2,396 | 2,814 | 325 | (418 | ) | |||||||||||||
| Administrative service fee | 2,456 | 2,340 | 2,209 | 116 | 131 | ||||||||||||||
| General and administrative expenses | 475 | 556 | 525 | (81 | ) | 31 | |||||||||||||
| Total expenses | $ | 76,150 | $ | 68,201 | $ | 62,558 | $ | 7,949 | $ | 5,643 | |||||||||
Average debt outstanding(1) | $ | 822,823 | $ | 872,980 | $ | 826,366 | $ | (50,157 | ) | $ | 46,614 | ||||||||
Interest Expense
Interest and other debt financing expenses, increasedincluding amortization of debt issuance costs, decreased for the year ended September 30, 2021 compared to the year ended September 30, 2020 by $1.6$9.1 million, primarily due to a decrease in LIBOR on our floating rate facilities and a decrease in average debt outstanding, partially offset by the acceleration of amortization of deferred issuance costs for terminated facilities during the year ended September 30, 2021. For more information about our outstanding borrowings for the years ended September 30, 2021 and 2020, including the terms thereof, see Note 7. Borrowings in the notes to our consolidated financial statements and the “Liquidity and Capital Resources” section below.
For the years ended September 30, 2021 and 2020, the effective average interest rate, which includes amortization of debt financing costs, amortization of discounts on notes issued and non-usage facility fees, on our total debt was 3.0% and 3.4%, respectively. The decrease in the effective average interest rate for the year ended September 30, 2021 compared to the year ended September 30, 2020 was primarily due to a lower average LIBOR on our borrowings, the issuance of the 2026 Unsecured Notes (as defined in Note 7 of our consolidated financial statements) that bear interest at a fixed rate of 2.500% and the issuance of the 2027 Unsecured Notes (as defined in Note 7 of our consolidated financial statements) that bear interest at a fixed rate of 2.050%, partially offset by the issuance of the 2024 Unsecured Notes (as defined in Note 7 of our consolidated financial statements) that bear interest at a fixed rate of 3.375%.
Management Fee
The base management fee, net of waiver, decreased from the year ended September 30, 20172020 to the year ended September 30, 20182021, primarily due to $4.0 million of base management fees irrevocably waived by GC Advisors to offset the one-time costs associated with the accelerated amortization of debt issuance costs on the early redemption of the 2020 Debt Securitization and debentures outstanding at SBIC VI during the fiscal year 2021 fourth quarter. The irrevocable waiver partially offset an increase in LIBOR which was partially offset by a decrease in the weighted average of outstanding borrowings from $873.0 million for the year ended September 30, 2017 to $822.8 million for the year ended September 30, 2018. The decrease in our debt was primarily driven by a decrease in the weighted average of outstanding borrowings on the Credit Facility from $138.8 million as of September 30, 2017 to $103.0 million as of September 30, 2018. The effective average interest rate on our outstanding debt
Incentive Fees
The incentive fee payable under the Investment Advisory Agreement consists of two parts: (1) the Income Incentive Fee and (2) the Capital Gain Incentive Fee. The Income Incentive Fee increaseddecreased by $6.9$10.6 million from the year ended September 30, 20172020 to the year ended September 30, 2018,2021 primarily asdue to a resultlower rate of return on the value of our net assets driven by modest net funds growth through the third quarter of fiscal year 2021 and general interest rate compression on new investments, which was partially offset by an increase in Pre-Incentive Fee Net Investment Income (as defined in Note 3 of our consolidated financial statements). As we remain in the “catch-up” provision of the increase in net investment income. As the Company remains in the "catch-up" provisioncalculation of the Income Incentive Fee, calculation, thean increase in net investment income causes a corresponding increase in the Income Incentive Feefee until the Company iswe are fully through the "catch-up" provision. The Income Incentive Fee decreased by $1.3 million from the year ended September 30, 2016 to the year ended September 30, 2017 as the interest rate compression on new investments and the decline of second lien and subordinated debt investments in our portfolio caused a decline in our Pre-Incentive Fee Net Investment Income, expressed as a rate of return on the value of our net assets.catch up. For the year ended September 30, 2018,2021, while still not fully through the "catch-up"“catch-up” provision in any quarter of the Income Incentive Fee calculation, the Income Incentive Fee as a
99
TABLE OF CONTENTS
percentage of Pre-Incentive Fee Net Investment Income increaseddecreased to 18.7% compared to 6.1%1.9% from 9.0% for the year ended September 30, 2017 and 8.3% for2020.
For each of the yearyears ended September 30, 2016.
2018.
For additional details on unrealized appreciation and depreciation of investments, refer to the “Net Realized and Unrealized Gains and Losses” section below.
Professional Fees, Administrative Service Fee, and General and Administrative Expenses
In total, professional fees, the administrative service fee, and general and administrative expenses increased by $0.4$0.7 million from the year ended September 30, 20172020 to the year ended September 30, 20182021. This increase was primarily due to an increase in the administrative service fee due to investments in information technology and decreasedhuman capital that was partially offset by $0.2 millionreduced professional fees driven by operational synergies resulting from the year ended September 30, 2016 to the year ended September 30, 2017.Merger. In general, we expect certain of our operating expenses, including professional fees, the administrative service fee, and other general and administrative expenses to decline as a percentage of our total assets during periods of growth and increase as a percentage of our total assets during periods of asset declines.
The Administrator pays for certain expenses incurred by us. These expenses are subsequently reimbursed in cash. Total expenses reimbursed by us to the Administrator forduring the years ended September 30, 2018, 20172021 and 20162020 were $2.4 million, $2.3$7.0 million and $2.4$6.4 million, respectively.
As of September 30, 20182021 and 2017,2020, included in accounts payable and accrued expensesother liabilities were $0.4$2.5 million and $0.8$1.6 million, respectively, for accrued expenses paid on behalf of us by the Administrator.
Net Realized and Unrealized Gains and Losses
The following table summarizes our net realized and unrealized gains (losses) for the years ended September 30, 2018, 2017 and 2016:
| For the years ended September 30, | Variances | ||||||||||||||||||
| 2018 | 2017 | 2016 | 2018 vs. 2017 | 2017 vs. 2016 | |||||||||||||||
| (In thousands) | |||||||||||||||||||
| Net realized gain (loss) on investments | $ | 17,454 | $ | 9,402 | $ | 6,254 | $ | 8,052 | $ | 3,148 | |||||||||
| Foreign currency transactions | 82 | — | — | 82 | — | ||||||||||||||
| Net realized gain (loss) on investments and foreign currency transactions | $ | 17,536 | $ | 9,402 | $ | 6,254 | $ | 8,134 | $ | 3,148 | |||||||||
| Unrealized appreciation on investments | 25,126 | 28,008 | 32,943 | (2,882 | ) | (4,935 | ) | ||||||||||||
| Unrealized (depreciation) on investments | (34,832 | ) | (26,640 | ) | (31,411 | ) | (8,192 | ) | 4,771 | ||||||||||
Unrealized appreciation on investments in SLF(1) | — | 1,969 | — | (1,969 | ) | 1,969 | |||||||||||||
Unrealized (depreciation) on investments in SLF(1) | (1,881 | ) | — | (3,562 | ) | (1,881 | ) | 3,562 | |||||||||||
| Unrealized appreciation on secured borrowings | — | 3 | — | (3 | ) | 3 | |||||||||||||
| Net change in unrealized appreciation (depreciation) on investments, investments in SLF, secured borrowings and foreign currency | $ | (11,587 | ) | $ | 3,340 | $ | (2,030 | ) | $ | (14,927 | ) | $ | 5,370 | ||||||
periods presented:
| Year ended September 30, | Variances | ||||||||||||||||||||||||||||||||||||||||||||||
| 2021 | 2020 | 2021 vs. 2020 | |||||||||||||||||||||||||||||||||||||||||||||
| (In thousands) | |||||||||||||||||||||||||||||||||||||||||||||||
| Net realized gain (loss) on investments | $ | 13,324 | $ | (18,680) | $ | 32,004 | |||||||||||||||||||||||||||||||||||||||||
| Foreign currency transactions | (5,419) | 20 | (5,439) | ||||||||||||||||||||||||||||||||||||||||||||
| Net realized gain (loss) on investment transactions | $ | 7,905 | $ | (18,660) | $ | 26,565 | |||||||||||||||||||||||||||||||||||||||||
| Unrealized appreciation on investments | 183,514 | 53,225 | 130,289 | ||||||||||||||||||||||||||||||||||||||||||||
| Unrealized (depreciation) on investments | (23,339) | (118,918) | 95,579 | ||||||||||||||||||||||||||||||||||||||||||||
Unrealized appreciation (depreciation) on investments in SLF and GCIC SLF(1) | — | 3,843 | (3,843) | ||||||||||||||||||||||||||||||||||||||||||||
| Unrealized appreciation (depreciation) on translation of assets and liabilities in foreign currencies | 3,917 | (2,728) | 6,645 | ||||||||||||||||||||||||||||||||||||||||||||
| Unrealized appreciation (depreciation) on forward currency contracts | 1,154 | (949) | 2,103 | ||||||||||||||||||||||||||||||||||||||||||||
| Net change in unrealized appreciation (depreciation) on investment transactions | $ | 165,246 | $ | (65,527) | $ | 230,773 | |||||||||||||||||||||||||||||||||||||||||
| Provision for taxes on unrealized appreciation on investments | $ | (543) | $ | — | $ | (543) | |||||||||||||||||||||||||||||||||||||||||
During the year ended September 30, 2018,2021, we had a net realized gain on investments and foreign currency transactions of $17.5$7.9 million, primarily dueattributable to net realized gains onfrom the sale of equity securitiesinvestments in more than 20multiple portfolio company investments,companies, that was partially offset by therecognized realized losslosses on the restructure, sale, or dispositionwrite-off on multiple portfolio companies and net realized losses recognized on the repayment of three under-performing debt investments.non-U.S. dollar dominated debt.
100
TABLE OF CONTENTS
For the year ended September 30, 2018,2020, we had $25.1a net realized loss of $18.7 million primarily attributable to recognized realized losses on the restructure, sale, or write-off on multiple portfolio companies and $4.0 million in realized loss that resulted from the consolidation of SLF and GCIC SLF, partially offset by net realized gains from the sale of equity investments in multiple portfolio companies.
For the year ended September 30, 2021, we had $183.5 million in unrealized appreciation on 158272 portfolio company investments, which was offset by $34.8$23.3 million in unrealized depreciation on 16979 portfolio company investments. Unrealized appreciation duringfor the year ended September 30, 20182021 primarily resulted from an increase in fair value primarilybetter than expected performance of our portfolio companies and continued reversal of depreciation recognized during the three months ended March 31, 2020 due to the rise in market prices of portfolio company investments.COVID-19 pandemic. Unrealized depreciation primarily resulted from the reversal of the net unrealized appreciation associated with the sales of portfolio company investments, the amortization of discounts, and negative credit related adjustments that caused a reduction in fair value.
For the year ended September 30, 2017,2020, we had $2.0$53.2 million in unrealized appreciation on 140 portfolio company investments, which was offset by $118.9 million in unrealized depreciation on 136 portfolio company investments. Unrealized appreciation for the year ended September 30, 2020 primarily resulted from better than expected performance of our investmentportfolio companies and credit market conditions beginning to recover. Unrealized depreciation for the year ended September 30, 2020 primarily resulted from decreases in the fair value in the majority of our portfolio company investments due to the immediate adverse economic effects of the COVID-19 pandemic, the uncertainty surrounding its long-term impact and increases in the spread between the yields realized on risk-free and higher risk securities. The unrealized appreciation on our investments in SLF LLC equity interests. Unrealized appreciation onand GCIC SLF of $3.8 million was
due to the reversal of unrealized depreciation as a result of the consolidation of SLF LLC equity interests was primarily driven by increased net investment income atand GCIC SLF.
For the year ended September 30, 2016,2021, we had $32.9$0.5 million inof income tax expense related to unrealized appreciation on 143 portfolio company investments which was partially offset by $31.4 millionheld in unrealized depreciation on 142 portfolio company investments. Unrealized appreciation during the year ended September 30, 2016 resulted from an increase in fair value primarily dueconsolidated subsidiaries that are subject to the rise in market prices of portfolio company investmentsU.S. federal and the reversal of prior period unrealized depreciation associated with the non-accrual portfolio company investments that were sold and written-off. Unrealized depreciation primarily resulted from the amortization of discounts, negative credit related adjustments that caused a reduction in fair value and the reversal of the net unrealized appreciation associated with the sales of portfolio company investments.state corporate-level income taxes.
Liquidity and Capital Resources
For the year ended September 30, 2018,2021, we experienced a net decreaseincrease in cash and cash equivalents, foreign currencies, and restricted cash and cash equivalents and restricted foreign currencies of $16.9$60.8 million. During the period, cash used in operating activities was $8.6$306.0 million, primarily as a result ofdriven by fundings of portfolio investments of $646.6$2,082.1 million, partially offset by the proceeds from principal payments and sales of portfolio investments of $558.7$1,593.5 million and net investment income of $76.0$167.7 million. Lastly, cash used inprovided by financing activities was $8.3$366.9 million, primarily driven by borrowings on debt of $760.5$3,358.8 million, that were partially offset by repayments of debt of $695.9$2,816.1 million, and distributions paid of $71.1$139.1 million, and purchases of common stock under the DRIP of $14.7 million.
For the year ended September 30, 2017,2020, we experienced a net decreaseincrease in cash, cash equivalents, foreign currencies, and restricted cash and cash equivalents and restricted foreign currencies of $27.0$99.9 million. During the period, cash provided by operating activities was $62.2$187.7 million, primarily as a result of fundings of portfolio investments of $588.2 million, partially offset by the proceeds from principal payments and sales of portfolio investments of $588.2$706.0 million and net investment income of $69.5$139.1 million, partially offset by fundings of portfolio investments of $643.2 million. Lastly, cash used in financing activities was $89.2$87.8 million, primarily driven by repayments of debt of $1,255.1 million, distributions paid of $136.4 million, and purchases of common stock under the DRIP of $45.5 million, partially offset by borrowings on debt of $545.0$1,053.6 million and net proceeds$300.4 million of an aggregate of $74.0 million from two equity offerings that were offset by repayments of debt of $628.6 million and distributions paid of $76.8 million.
As of September 30, 20182021 and 2017,2020, we had cash and cash equivalents of $5.9$175.6 million and $4.0$24.6 million, respectively. In addition, we had foreign currencies of $0.2$5.5 million and $0.6 million as of September 30, 20182021 and 2020, respectively, restricted cash and cash equivalents of $39.7$61.8 million and $58.6$157.6 million as of September 30, 20182021 and 2017,2020, respectively, and restricted foreign currencies of $1.4 million and $1.7 million as of September 30, 2021 and 2020, respectively. Cash and cash equivalents and foreign currencies are available to fund new investments, pay operating expenses and pay distributions. As of September 30, 2018, $14.7 million of our restrictedRestricted cash and cash equivalents willand restricted foreign currencies can be used for the payment ofto pay principal and interest expense on the notes issued in the 2014 Debt Securitization, which is described in further detail in Note 6 to our consolidated financial statements. As of September 30, 2018, $5.8 million of our restricted cashborrowings and cash equivalents could be used to fund new investments that meet the guidelines under our debt securitizations or credit facilities, as applicable.
This “Liquidity and Capital Resources” section should be read in conjunction with the “COVID-19 Developments" section above.
101
TABLE OF CONTENTS
Revolving Debt Facilities
MS Credit Facility as well as for the payment of interest expense and revolving debt of the Credit Facility.II - As of September 30, 2018, $8.12021 and 2020, we had $0.0 million of our restricted cash and cash equivalents could be used to fund investments that meet the guidelines$313.3 million outstanding under the MS Credit Facility as well as for the payment of interest expense and revolving debt of the MS Credit Facility.II, respectively. As of September 30, 2018, $11.1 million of our restricted cash and cash equivalents could be used to fund new
WF Credit Facility - On February 12, 2021, we repaid all outstanding borrowings under the WF Credit Facility, following which the WF Credit Facility was terminated. As of September 30, 2018,2020, we had outstanding debt under the MSWF Credit Facility of $199.6 million. Prior to termination, the WF Credit Facility allowed 2010 IssuerGCIC Funding, to borrow up to $300.0 million at any one time outstanding, subject to leverage and borrowing base restrictions.
DB Credit Facility - On October 9, 2020, all outstanding borrowings under the DB Credit Facility were repaid following which the DB Credit Facility was terminated. As of September 30, 2018,2020, we had $234.7 million outstanding debt under the MSDB Credit Facility.Facility of $153.5 million. As of September 30, 2018,2020, subject to leverage and borrowing base restrictions, we had approximately $65.3$96.5 million of remaining commitments and $6.7$82.7 million of availability on the MSDB Credit Facility.
JPM Credit Facility - On February 11, 2021, we entered into the JPM Credit Facility, which allowed us to borrow up to $475.0 million at any one time outstanding, subject to leverage and borrowing base restrictions. As of September 30, 2021, we had outstanding debt under the JPM Credit Facility of $472.1 million. As of September 30, 2021, subject to leverage and borrowing base restrictions, we had $2.9 million of remaining commitments and $2.9 million of availability on the JPM Credit Facility. Effective October 14, 2021 and November 23, 2021, we increased commitments on the JPM Credit Facility to $687.5 million and $1,037.5 million, respectively.
Adviser Revolver- On June 22, 2016, we entered into an unsecured revolving credit facility with GC Advisors, or the Adviser Revolver, which, permitsas amended, permitted us to borrow up to $20.0$100.0 million at any one time outstanding.outstanding as of September 30, 2021. We entered into the Adviser Revolver in order to have the ability to borrow funds on a short-term basis and have in the past repaid, and generally intend in the future to repay, borrowings under the Adviser Revolver within the same quarter in30 to 45 days from which they are drawn. As of each of September 30, 20182021 and 2017,2020, we had no amounts outstanding on the Adviser Revolver.
Debt Securitizations
2018 Debt Securitization - On JulyNovember 16, 2010,2018, we completed the 20102018 Debt Securitization, which was subsequently increased to $350.0 million. On October 20, 2016, we further amended the 2010 Debt Securitization to, among other things, (a) refinance the issuedSecuritization. The Class A, 2010 Notes, by redeeming in full the $203.0 million Class A 2010 Notes and issuing new Class A-Refi 2010 Notes in an aggregate principal amount of $205.0 million that bear interest at a rate of three-month LIBOR plus 1.90%, (b) refinance the Class B 2010 Notes by redeeming in full the $12.0 millionand Class B 2010 Notes and issuing new Class B-Refi 2010 Notes in an aggregate principal amount of $10.0 million that bear interest at a rate of three-month LIBOR plus 2.40%, and (c) extend the reinvestment period applicable to the 2010 Issuer to July 20, 2018. Following the refinancing, Golub Capital BDC 2010-1 Holdings LLC, our wholly-owned subsidiary, or Holdings, retained the Class B-Refi 2010 Notes.
GCIC 2018 Debt Securitization - Effective September 16, 2019, we assumed as a result of the Merger, the GCIC 2018 Debt Securitization. The Class A-1, Class A-2 (Class A-2-R GCIC 2018 Notes after refinancing on December 21, 2020) and Class B-1 GCIC 2018 Notes are included in the September 30, 2021 and 2020 Consolidated Statements of Financial Condition as our debt. As of September 30, 2021 and 2020 the Class B-2, Class C and Class D GCIC 2018 Notes and the Subordinated GCIC 2018 Notes were eliminated in consolidation. As of September 30, 2021 and 2020, we had outstanding debt under the GCIC 2018 Debt Securitization of $544.2 million and $542.4 million, respectively.
2020 Debt Securitization - On July 20, 2018,August 26, 2021, the 20102020 Notes were redeemed and following such redemption, the agreements governing the 20102020 Debt Securitization were terminated.
Due to the interplay of the 1940 Act restrictions on principal and Class B 2014 Notes are included in the September 30, 2017 Consolidated Statements of Financial Condition as our debtjoint transactions and the Class C 2014 NotesU.S. risk retention rules adopted pursuant to Section 941 of Dodd-Frank, as a business development company, we sought and LLC equity interestsreceived no
102
TABLE OF CONTENTS
action relief from the SEC to ensure we could engage in the 2014 Issuer were eliminatedCLO financings in consolidation. As of September 30, 2017, we had outstanding debt under the 2014 Debt Securitization of $246.0 million.which assets are transferred through GC Advisors.
SBA Debentures
Under present SBIC regulations, the maximum amount of SBA-guaranteed debentures that may beguaranteed by the SBA, issued by multiple licensees under common management is $350.0 million and the maximum amount thatissued by a single SBIC licensee may issue is $175.0 million. As of September 30, 2018,2021, each of SBIC IV, SBIC V and SBIC VI, had $115.0 million, $150.0 million and $12.5 million, respectively, ofno outstanding SBA-guaranteed debentures that mature between September 2021 and March 2028, leaving incremental debenture commitments of $0.0 million, $0.0 million and $37.5 million for SBIC IV, SBIC V and SBIC VI, respectively, under present SBIC regulations.debentures. As of September 30, 2017,2020, SBIC IV, SBIC V and SBIC VI, had $125.0 million, $133.0$0.0, $151.8 million and $9.0$66.0 million, respectively, of outstanding SBA-guaranteed debentures that maturewould have matured between September 2021March 2024 and September 2027 leaving incremental debenture commitmentsMarch 2030. The original amount of $0.0 million, $17.0 million and $41.0 million fordebentures committed to SBIC IV, SBIC V, and SBIC VI respectively, under present SBIC regulations. The original amount committed to SBIC IV by the SBA waswere $150.0 million. In March 2018million, $175.0 million, and $175.0 million respectively. Through September 30, 2021, SBIC IV, SBIC V, SBIC VI have repaid $150.0 million, $175.0 million, and $110.0 million of outstanding debentures, respectively, and these commitments have effectively been terminated. Upon approval by the SBA, we surrendered and terminated our licenses to operate SBIC IV, SBIC V, and SBIC VI on November 4, 2020, May 4, 2021, and September 2017, SBIC IV repaid $10.021, 2021, respectively, as SBICs.
2024 Notes
On October 2, 2020, we issued $400.0 million and $25.0 million, respectively, of thein aggregate principal amount of the SBA-guaranteed debentures2024 Unsecured Notes, all of which remained outstanding as our debt as of September 30, 2021. On October 15, 2021, we issued an additional $100.0 million in aggregate principal of the 2024 Notes. Upon issuance of the New 2024 Notes, the outstanding aggregate principal amount of the 2024 Notes is $500.0 million.
2026 Notes
On February 24, 2021, we issued $400.0 million in aggregate principal amount of the 2026 Unsecured Notes, all of which remained outstanding as our debt as of September 30, 2021. On October 13, 2021, we issued an additional $200.0 million in aggregate principal of the 2026 Notes. Upon issuance of the New 2026 Notes, the outstanding aggregate principal amount of the 2026 Notes is $600.0 million.
2027 Notes
On July 27, 2021, we issued $350.0 million in aggregate principal amount of the 2027 Unsecured Notes, all of which remained outstanding as our debt as of September 30, 2021.
Equity Distribution Agreement
On May 28, 2021, we entered into an equity distribution agreement in connection with the launch of an at the timemarket program to sell up to $250.0 million of shares of our common stock. An at the market offering is a registered offering by a publicly traded issuer of its listed equity securities that allows the issuer to sell shares directly into the market at market prices.
Asset Coverage, Contractual Obligations, Off-Balance Sheet Arrangements and $10.0 million and $25.0 million, respectively,Other Liquidity Considerations
As of debenture commitmentsSeptember 30, 2021, in accordance with the 1940 Act, with certain limited exceptions, we were terminated.allowed to borrow amounts such that our asset coverage, as defined in the 1940 Act, is at least 150% after such borrowing. Prior to February 6, 2019, in accordance with the 1940 Act, with certain limited exceptions, we were allowed to borrow amounts such that our asset coverage, as defined in the 1940 Act, was at least 200% after such borrowing. We currently intend to continue to target a GAAP debt-to-equity ratio between 0.85x to 1.25x. As of September 30, 2021, our asset coverage for borrowed amounts was 200.0%.
In August 2018,2021, our board of directors reapproved a share repurchase program, or the Program, which allows us
to repurchase up to $75.0$150.0 million of our outstanding common stock on the open market at prices below the NAV per share as reported in our then most recently published consolidated financial statements. The Program may beis implemented at the discretion of management. Themanagement with shares mayto be purchased from time to time at prevailing market
prices, through open market transactions, including block transactions. We did not make any repurchases of our common stock during the years ended September 30, 2018, 20172021 and 2016.
TABLE OF CONTENTS
As of September 30, 20182021 and 2017,2020, we had outstanding commitments to fund investments excluding our investments in SLF, totaling $57.7$340.7 million and $60.5$141.8 million, respectively. TheseAs of September 30, 2021, total commitments of $340.7 million included $42.2 million of unfunded commitments on revolvers. There is no guarantee that these amounts may or may notwill be funded to the borrowing party now or in the future. The unfunded commitments relate to loans with various maturity dates, but the entire amount was eligible for funding to the borrowers, subject to the terms of each loan’s respective credit agreement. A summary of maturity requirements for our principal borrowings as of September 30, 2021 is included in Note 7 of our consolidated financial statements. We did not have any other material contractual payment obligations as of September 30, 2021. As of September 30, 2018,2021, we believe that we had sufficient assets and liquidity to adequately cover future obligations under our unfunded commitments based on historical rates of drawings upon unfunded commitments, cash and restricted cash balances that we maintain, availability under ourthe Adviser Revolver, JPM Credit Facility and MS Credit Facility and Adviser Revolver, andII, as well as ongoing principal repayments on debt investments. In addition, we generally hold some syndicated loans in larger portfolio companies that are saleable over a relatively short period to generate cash.
Although we expect to fund the growth of our investment portfolio through the net proceeds from future securities offerings and through our DRIP as well as future borrowings, to the extent permitted by the 1940 Act, we cannot assure you that our efforts to raise capital will be successful. In addition, we may, from time to time, we can amend or refinance our leverage facilities and securitization financings, to the extent permitted by applicable law. In addition to capital not being available, it also may not be available on favorable terms. To the extent we are not able to raise capital on what we believe are favorable terms, we will focus on optimizing returns by investing capital generated from repayments into new investments we believe are attractive from a risk/reward perspective. Furthermore, to the extent we are not able to raise capital and are at or near our targeted leverage ratios, we mayexpect to receive smaller allocations, if any, on new investment opportunities under GC Advisors’ allocation policy and have, in the past, received such smaller allocations under similar circumstances.
Portfolio Composition, Investment Activity and Yield
As of September 30, 20182021 and 2017,2020, we had investments in 199296 and 185254 portfolio companies, respectively, with a total fair value of $1,711.8 million$4.9 billion and $1,590.0 million, respectively, and had investments in SLF with a total fair value of $71.1 million and $95.0 million,$4.2 billion, respectively.
The following table shows the asset mix of our new investment commitments for the years ended September 30, 2018, 20172021 and 2016:2020:
| Years ended September 30, | ||||||||||||||||||||
| 2018 | 2017 | 2016 | ||||||||||||||||||
| (In thousands) | Percentage of Commitments | (In thousands) | Percentage of Commitments | (In thousands) | Percentage of Commitments | |||||||||||||||
| Senior secured | $ | 114,840 | 17.2 | % | $ | 129,134 | 21.5 | % | $ | 124,392 | 19.0 | % | ||||||||
| One stop | 534,906 | 80.1 | 447,691 | 74.7 | 505,058 | 76.9 | ||||||||||||||
| Subordinated debt | 184 | 0.0 | * | 12 | 0.0 | * | 42 | 0.0 | * | |||||||||||
Subordinated notes in SLF(1) | — | — | 5,457 | 0.9 | 9,620 | 1.5 | ||||||||||||||
LLC equity interests in SLF(1) | 12,162 | 1.8 | 12,542 | 2.1 | 10,820 | 1.6 | ||||||||||||||
| Equity | 5,824 | 0.9 | 4,677 | 0.8 | 6,528 | 1.0 | ||||||||||||||
| Total new investment commitments | $ | 667,916 | 100.0 | % | $ | 599,513 | 100.0 | % | $ | 656,460 | 100.0 | % | ||||||||
| Years ended September 30, | ||||||||||||||||||||||||||||||||||||||||||||||||||||||||||||||||||||
| 2021 | 2020 | |||||||||||||||||||||||||||||||||||||||||||||||||||||||||||||||||||
| (In thousands) | Percentage | (In thousands) | Percentage | |||||||||||||||||||||||||||||||||||||||||||||||||||||||||||||||||
| Senior secured | $ | 398,734 | 17.0 | % | $ | 106,268 | 17.9 | % | ||||||||||||||||||||||||||||||||||||||||||||||||||||||||||||
| One stop | 1,850,769 | 78.8 | 481,662 | 80.9 | ||||||||||||||||||||||||||||||||||||||||||||||||||||||||||||||||
| Second lien | 29,899 | 1.3 | — | — | ||||||||||||||||||||||||||||||||||||||||||||||||||||||||||||||||
| Subordinated debt | 377 | 0.0 | * | 138 | 0.0 | * | ||||||||||||||||||||||||||||||||||||||||||||||||||||||||||||||
| Equity | 67,901 | 2.9 | 7,010 | 1.2 | ||||||||||||||||||||||||||||||||||||||||||||||||||||||||||||||||
| Total new investment commitments | $ | 2,347,680 | 100.0 | % | $ | 595,078 | 100.0 | % | ||||||||||||||||||||||||||||||||||||||||||||||||||||||||||||
* Represents an amount less than 0.1%.
Due to a significant increase in merger and acquisition activity as a result of improvements in market conditions from |
For the year ended September 30, 2021, we had approximately $495.5$1,593.5 million $449.8 million and $366.2 million, excluding $78.7 million of proceeds from the repayment in full and termination of our investment in subordinated notes of SLF during the year ended 2017, respectively, in proceeds from principal payments and return of capital distributionssales of portfolio companies. investments.
104
TABLE OF CONTENTS
For the yearsyear ended September 30, 2018, 2017 and 2016,2020, we had approximately $706.0 million in proceeds from principal payments and sales of investments in 21, 72 and 44 portfolio companies, respectively, aggregating approximately $37.6 million, $138.4 million and $172.2 million, respectively, in net proceeds.investments.
| As of and for the years ended September 30, | |||||||||||
| 2018 | 2017 | 2016 | |||||||||
| (Dollars in thousands) | |||||||||||
| Investments, at fair value | $ | 1,711,757 | $ | 1,590,000 | $ | 1,556,384 | |||||
Number of portfolio companies (at period end)(1) | 199 | 185 | 183 | ||||||||
Investment in SLF, at fair value(2) | $ | 71,084 | $ | 95,015 | $ | 104,228 | |||||
| New investment fundings | $ | 646,595 | $ | 588,169 | $ | 654,763 | |||||
| Principal payments and sales of portfolio investments | $ | 558,664 | $ | 588,173 | $ | 538,609 | |||||
The following table shows the principal, amortized cost and fair value of our portfolio of investments by asset class:
As of September 30, 2018(1) | As of September 30, 2017(1) | ||||||||||||||||||||||
| Principal | Amortized Cost | Fair Value | Principal | Amortized Cost | Fair Value | ||||||||||||||||||
| (In thousands) | |||||||||||||||||||||||
| Senior secured: | |||||||||||||||||||||||
| Performing | $ | 230,230 | $ | 228,028 | $ | 229,886 | $ | 196,296 | $ | 194,357 | $ | 195,089 | |||||||||||
Non-accrual(2)(3) | 2,834 | 2,818 | 1,283 | 1,438 | 1,433 | (60 | ) | ||||||||||||||||
| One stop: | |||||||||||||||||||||||
| Performing | 1,435,004 | 1,417,730 | 1,425,854 | 1,339,755 | 1,322,220 | 1,331,069 | |||||||||||||||||
Non-accrual(2) | 8,976 | 8,910 | 4,342 | 8,870 | 8,788 | 3,015 | |||||||||||||||||
| Second lien: | |||||||||||||||||||||||
| Performing | 9,435 | 9,338 | 9,435 | 9,434 | 9,306 | 9,434 | |||||||||||||||||
Non-accrual(2) | — | — | — | — | — | — | |||||||||||||||||
| Subordinated debt: | |||||||||||||||||||||||
| Performing | 251 | 251 | 251 | 59 | 59 | 59 | |||||||||||||||||
Non-accrual(2) | — | — | — | — | — | — | |||||||||||||||||
LLC equity interests in SLF(4) | N/A | 75,407 | 71,084 | N/A | 97,457 | 95,015 | |||||||||||||||||
| Equity | N/A | 38,170 | 40,706 | N/A | 37,619 | 51,394 | |||||||||||||||||
| Total | $ | 1,686,730 | $ | 1,780,652 | $ | 1,782,841 | $ | 1,555,852 | $ | 1,671,239 | $ | 1,685,015 | |||||||||||
As of September 30, 2021(1) | As of September 30, 2020(2) | |||||||||||||||||||||||||||||||||||||
| Principal | Amortized Cost | Fair Value | Principal | Amortized Cost | Fair Value | |||||||||||||||||||||||||||||||||
| (In thousands) | (In thousands) | |||||||||||||||||||||||||||||||||||||
| Senior secured: | ||||||||||||||||||||||||||||||||||||||
| Performing | $ | 796,269 | $ | 793,707 | $ | 781,962 | $ | 645,886 | $ | 649,259 | $ | 627,471 | ||||||||||||||||||||||||||
Non-accrual(3) | 20,047 | 9,813 | 2,843 | 37,849 | 27,026 | 12,742 | ||||||||||||||||||||||||||||||||
| One stop: | ||||||||||||||||||||||||||||||||||||||
| Performing | 3,876,907 | 3,860,525 | 3,839,053 | 3,518,814 | 3,540,446 | 3,429,012 | ||||||||||||||||||||||||||||||||
Non-accrual(3) | 59,699 | 52,806 | 43,261 | 81,897 | 75,239 | 56,573 | ||||||||||||||||||||||||||||||||
| Second lien: | ||||||||||||||||||||||||||||||||||||||
| Performing | 42,571 | 41,946 | 41,857 | 19,640 | 19,886 | 19,640 | ||||||||||||||||||||||||||||||||
Non-accrual(3) | — | — | — | — | — | — | ||||||||||||||||||||||||||||||||
| Subordinated debt: | ||||||||||||||||||||||||||||||||||||||
| Performing | 172 | 171 | 172 | 537 | 541 | 575 | ||||||||||||||||||||||||||||||||
Non-accrual(3) | — | — | — | — | — | — | ||||||||||||||||||||||||||||||||
| Equity | N/A | 136,429 | 185,738 | N/A | 86,503 | 92,197 | ||||||||||||||||||||||||||||||||
| Total | $ | 4,795,665 | $ | 4,895,397 | $ | 4,894,886 | $ | 4,304,623 | $ | 4,398,900 | $ | 4,238,210 | ||||||||||||||||||||||||||
(1)As of September 30, 2021, $502.1 million and $476.1 million of our loans at amortized cost and fair value, respectively, included a feature permitting a portion of the interest due on such loan to be PIK interest. (2)As of September 30, 2020, $488.1 million and $454.9 million of our loans at amortized cost and fair value, respectively, included a feature permitting a portion of the interest due on such loan to be PIK interest. (3)We refer to a loan as non-accrual when we cease recognizing interest income on the loan because we have stopped pursuing repayment of the loan or, in certain circumstances, it is past due 90 days or more on principal and interest or our management has reasonable doubt that principal or interest will be collected. See “— Critical Accounting Policies — Revenue Recognition.” |
As of September 30, 20182021, we had threeloans in six portfolio companies on non-accrual status, and non-accrual
investments as a percentage of total debt investments at cost and fair value were 1.3% and 1.0%, respectively.
As of September 30, 2020, we had loans in nine portfolio companies on non-accrual status, and non-accrual investments as a percentage of total investments at cost and fair value were 0.7%2.4% and 0.3%1.7%, respectively. As of September 30, 2017, we had three debt investments on non-accrual status2021 and non-accrual investments as a percentage of total investments at cost and fair value were 0.6% and 0.2%, respectively. As of September 30, 2018 and September 30, 2017,2020, the fair value of our debt investments as a percentage of the outstanding principal value was 99.1%98.2% and 98.9%96.3%, respectively.
The following table shows the weighted average rate, spread over LIBOR of floating rate and fees of investments originated and the weighted average rate of sales and payoffs of portfolio companies during the years ended September 30, 2018, 20172021 and 2016:
| For the years ended September 30, | |||||
| 2018 | 2017 | 2016 | |||
Weighted average rate of new investment fundings(1) | 8.0% | 7.1% | 7.2% | ||
Weighted average spread over LIBOR of new floating rate investment fundings(1) | 6.0% | 5.9% | 6.2% | ||
| Weighted average rate of new fixed rate investment fundings | 9.6% | 8.0% | 10.7% | ||
| Weighted average fees of new investment fundings | 1.3% | 1.5% | 1.9% | ||
Weighted average rate of sales and payoffs of portfolio investments(1)(2) | 8.3% | 7.3% | 7.0% | ||
Weighted average income yield(3)(4) | 8.3% | 7.8% | 7.6% | ||
2020:
| Year ended September 30, | ||||||||||||||||||||||||||||||||||||||||||||||||||
| 2021 | 2020 | |||||||||||||||||||||||||||||||||||||||||||||||||
| Weighted average rate of new investment fundings | 6.7% | 7.4% | ||||||||||||||||||||||||||||||||||||||||||||||||
| Weighted average spread over LIBOR of new floating rate investment fundings | 5.8% | 5.7% | ||||||||||||||||||||||||||||||||||||||||||||||||
| Weighted average fees of new investment fundings | 1.2% | 1.4% | ||||||||||||||||||||||||||||||||||||||||||||||||
| Weighted average rate of sales and payoffs of portfolio investments | 6.9% | 7.2% | ||||||||||||||||||||||||||||||||||||||||||||||||
As of September 30, 2018, 98.6%2021, 92.4% and 98.6%92.4% of our debt portfolio at fair value and at amortized cost, respectively, had interest rate floors that limit the minimum applicable interest rates on such loans. As of September 30, 2017, 99.6%2020, 91.2% and 99.6%91.3% of our debt portfolio at fair value and at amortized cost, respectively, had interest rate floors that limit the minimum applicable interest rates on such loans.
105
TABLE OF CONTENTS
As of September 30, 20182021 and 2017,2020, the portfolio median earnings before interest, taxes, depreciation and amortization, or EBITDA, for our portfolio companies (excluding SLF) was $26.2$41.1 million and $25.2$31.4 million, respectively. The portfolio median EBITDA is based on the most recently reported trailing twelve-month EBITDA received from the portfolio company.
As part of the monitoring process, GC Advisors regularly assesses the risk profile of each of our investments and rates each of them based on an internal system developed by Golub Capital and its affiliates. This system is not generally accepted in our industry or used by our competitors. It is based on the following categories, which we refer to as GC Advisors’ internal performance ratings:
| Internal Performance Ratings | ||||||||
| Rating | Definition | |||||||
| 5 | Involves the least amount of risk in our portfolio. The borrower is performing above expectations, and the trends and risk factors are generally favorable. | |||||||
| 4 | Involves an acceptable level of risk that is similar to the risk at the time of origination. The borrower is generally performing as expected, and the risk factors are neutral to favorable. | |||||||
| 3 | Involves a borrower performing below expectations and indicates that the loan’s risk has increased somewhat since origination. The borrower | |||||||
| 2 | Involves a borrower performing materially below expectations and indicates that the loan’s risk has increased materially since origination. In addition to the borrower being generally out of compliance with debt covenants, loan payments | |||||||
| 1 | Involves a borrower performing substantially below expectations and indicates that the loan’s risk has substantially increased since origination. Most or all of the debt covenants are out of compliance and payments are substantially delinquent. Loans rated 1 are not anticipated to be repaid in full and we will reduce the fair market value of the loan to the amount we anticipate will be recovered. | |||||||
Our internal performance ratings do not constitute any rating of investments by a nationally recognized statistical rating organization or represent or reflect any third-party assessment of any of our investments.
For any investment rated 1, 2 or 3, GC Advisors will increase its monitoring intensity and prepare regular updates for the investment committee, summarizing current operating results and material impending events and suggesting recommended actions.
GC Advisors monitors and, when appropriate, changes the internal performance ratings assigned to each investment in our portfolio. In connection with our valuation process, GC Advisors and our board of directors review these internal performance ratings on a quarterly basis.
TABLE OF CONTENTS
The following table shows the distribution of our investments on the 1 to 5 internal performance rating scale at fair value as of September 30, 20182021 and 2017:
| As of September 30, 2018 | As of September 30, 2017 | |||||||||||||
Internal Performance Rating | Investments at Fair Value (In thousands) | Percentage of Total Investments | Investments at Fair Value (In thousands) | Percentage of Total Investments | ||||||||||
| 5 | $ | 113,873 | 6.4 | % | $ | 91,525 | 5.5 | % | ||||||
| 4 | 1,455,754 | 81.6 | 1,378,316 | 81.8 | ||||||||||
| 3 | 195,414 | 11.0 | 212,629 | 12.6 | ||||||||||
| 2 | 17,250 | 1.0 | 249 | 0.0* | ||||||||||
| 1 | 550 | 0.0* | 2,296 | 0.1 | ||||||||||
| Total | $ | 1,782,841 | 100.0 | % | $ | 1,685,015 | 100.0 | % | ||||||
| As of September 30, 2021 | As of September 30, 2020 | |||||||||||||||||||||||||
| Internal Performance Rating | Investments at Fair Value (In thousands) | Percentage of Total Investments | Investments at Fair Value (In thousands) | Percentage of Total Investments | ||||||||||||||||||||||
| 5 | $ | 499,241 | 10.2% | $ | 257,409 | 6.1% | ||||||||||||||||||||
| 4 | 3,951,870 | 80.7 | 3,085,610 | 72.8 | ||||||||||||||||||||||
| 3 | 395,208 | 8.1 | 836,560 | 19.7 | ||||||||||||||||||||||
| 2 | 47,836 | 1.0 | 57,754 | 1.4 | ||||||||||||||||||||||
| 1 | 731 | 0.0* | 877 | 0.0* | ||||||||||||||||||||||
| Total | $ | 4,894,886 | 100.0% | $ | 4,238,210 | 100.0% | ||||||||||||||||||||
| * | Represents an amount less than 0.1%. | ||||
| As of September 30, 2018 | As of September 30, 2017 | ||||||||||||||
| Committed | Funded(1) | Committed | Funded(1) | ||||||||||||
| (In thousands) | |||||||||||||||
LLC equity commitments | $ | 200,000 | $ | 86,180 | $ | 200,000 | $ | 111,380 | |||||||
| Total | $ | 200,000 | $ | 86,180 | $ | 200,000 | $ | 111,380 | |||||||
| As of September 30, 2018 | As of September 30, 2017 | ||||||
| (Dollars in thousands) | |||||||
Senior secured loans(1) | $ | 183,668 | $ | 301,583 | |||
Weighted average current interest rate on senior secured loans(2) | 7.5 | % | 6.4 | % | |||
| Number of borrowers in SLF | 32 | 50 | |||||
Largest portfolio company investment(1) | $ | 13,716 | $ | 13,820 | |||
Total of five largest portfolio company investments(1) | $ | 57,330 | $ | 61,187 | |||
| SLF Investment Portfolio as of September 30, 2018 | ||||||||||||||||||
| Portfolio Company | Business Description | Investment Type | Maturity Date | Current Interest Rate(1) | Principal ($) / Shares(2) | Fair Value(3) | ||||||||||||
| (In thousands) | ||||||||||||||||||
| 1A Smart Start LLC | Home and Office Furnishings, Housewares, and Durable Consumer | Senior Loan | 02/2022 | 7.0 | % | $ | 2,073 | $ | 2,084 | |||||||||
1A Smart Start LLC(4) | Home and Office Furnishings, Housewares, and Durable Consumer | Senior Loan | 02/2022 | 6.7 | 922 | 924 | ||||||||||||
Advanced Pain Management Holdings, Inc. (5) | Healthcare, Education and Childcare | Senior Loan | 11/2018 | 7.2 | 6,561 | 3,609 | ||||||||||||
Advanced Pain Management Holdings, Inc.(5) | Healthcare, Education and Childcare | Senior Loan | 11/2018 | 7.2 | 449 | 247 | ||||||||||||
| Boot Barn, Inc. | Retail Stores | Senior Loan | 06/2021 | 6.9 | 9,533 | 9,533 | ||||||||||||
| Brandmuscle, Inc. | Printing and Publishing | Senior Loan | 12/2021 | 7.1 | 4,678 | 4,674 | ||||||||||||
Captain D's, LLC(4) | Personal, Food and Miscellaneous Services | Senior Loan | 12/2023 | 7.9 | 13 | 13 | ||||||||||||
Captain D's, LLC(4) | Personal, Food and Miscellaneous Services | Senior Loan | 12/2023 | 6.7 | 2,499 | 2,499 | ||||||||||||
| CLP Healthcare Services, Inc. | Healthcare, Education and Childcare | Senior Loan | 12/2020 | 7.9 | 8,502 | 8,332 | ||||||||||||
| CLP Healthcare Services, Inc. | Healthcare, Education and Childcare | Senior Loan | 12/2020 | 7.9 | 4,284 | 4,198 | ||||||||||||
| Community Veterinary Partners, LLC | Personal, Food and Miscellaneous Services | Senior Loan | 10/2021 | 7.9 | 2,417 | 2,417 | ||||||||||||
| Community Veterinary Partners, LLC | Personal, Food and Miscellaneous Services | Senior Loan | 10/2021 | 7.9 | 1,215 | 1,215 | ||||||||||||
| Community Veterinary Partners, LLC | Personal, Food and Miscellaneous Services | Senior Loan | 10/2021 | 7.9 | 40 | 40 | ||||||||||||
| Community Veterinary Partners, LLC | Personal, Food and Miscellaneous Services | Senior Loan | 10/2021 | 7.9 | 58 | 58 | ||||||||||||
DISA Holdings Acquisition Subsidiary Corp.(4) | Diversified/Conglomerate Service | Senior Loan | 06/2022 | 6.1 | 71 | 71 | ||||||||||||
DISA Holdings Acquisition Subsidiary Corp.(4) | Diversified/Conglomerate Service | Senior Loan | 06/2022 | 6.1 | 4,821 | 4,821 | ||||||||||||
| Encore GC Acquisition, LLC | Healthcare, Education and Childcare | Senior Loan | 01/2020 | 7.5 | 4,540 | 4,540 | ||||||||||||
Flexan, LLC(4) | Chemicals, Plastics and Rubber | Senior Loan | 02/2020 | 9.8 | 304 | 304 | ||||||||||||
| Flexan, LLC | Chemicals, Plastics and Rubber | Senior Loan | 02/2020 | 8.1 | 5,967 | 5,967 | ||||||||||||
| Flexan, LLC | Chemicals, Plastics and Rubber | Senior Loan | 02/2020 | 8.1 | 1,657 | 1,657 | ||||||||||||
Gamma Technologies, LLC(4) | Electronics | Senior Loan | 06/2024 | 7.7 | 10,186 | 10,186 | ||||||||||||
| III US Holdings, LLC | Diversified/Conglomerate Service | Senior Loan | 09/2022 | 9.0 | 4,927 | 4,927 | ||||||||||||
| Mediaocean LLC | Senior loan | Senior Loan | 08/2020 | N/A (8) | — | — | ||||||||||||
| Jensen Hughes, Inc. | Buildings and Real Estate | Senior Loan | 03/2024 | 6.7 | 2,293 | 2,293 | ||||||||||||
| Jensen Hughes, Inc. | Buildings and Real Estate | Senior Loan | 03/2024 | 6.7 | 119 | 119 | ||||||||||||
| Jensen Hughes, Inc. | Buildings and Real Estate | Senior Loan | 03/2024 | 6.7 | 64 | 64 | ||||||||||||
Joerns Healthcare, LLC(4) | Healthcare, Education and Childcare | Senior Loan | 05/2020 | 8.3 | 8,745 | 8,133 | ||||||||||||
| Paradigm DKD Group, LLC | Buildings and Real Estate | Senior Loan | 05/2020 | 8.5 | 702 | 524 | ||||||||||||
| Paradigm DKD Group, LLC | Buildings and Real Estate | Senior Loan | 05/2020 | 8.5 | 1,957 | 1,369 | ||||||||||||
Pasternack Enterprises, Inc. and Fairview Microwave, Inc(4) | Diversified/Conglomerate Manufacturing | Senior Loan | 07/2025 | 6.2 | 5,318 | 5,291 | ||||||||||||
| Payless ShoeSource, Inc. | Retail Stores | Senior Loan | 08/2022 | 11.3 | 762 | 528 | ||||||||||||
| Polk Acquisition Corp. | Automobile | Senior Loan | 06/2022 | 7.5 | 93 | 93 | ||||||||||||
| Polk Acquisition Corp. | Automobile | Senior Loan | 06/2022 | 7.2 | 4,513 | 4,513 | ||||||||||||
| Polk Acquisition Corp. | Automobile | Senior Loan | 06/2022 | 7.2 | 53 | 53 | ||||||||||||
| Pyramid Healthcare, Inc. | Healthcare, Education and Childcare | Senior Loan | 08/2019 | 8.8 | 411 | 411 | ||||||||||||
| Pyramid Healthcare, Inc. | Healthcare, Education and Childcare | Senior Loan | 08/2019 | 8.8 | 10,152 | 10,152 | ||||||||||||
| Pyramid Healthcare, Inc. | Healthcare, Education and Childcare | Senior Loan | 08/2019 | 8.8 | 45 | 45 | ||||||||||||
| Pyramid Healthcare, Inc. | Healthcare, Education and Childcare | Senior Loan | 08/2019 | 8.8 | 148 | 148 | ||||||||||||
| SLF Investment Portfolio as of September 30, 2018 - (continued) | ||||||||||||||||||
| Portfolio Company | Business Description | Investment Type | Maturity Date | Current Interest Rate(1) | Principal ($) / Shares(2) | Fair Value(3) | ||||||||||||
| (In thousands) | ||||||||||||||||||
RSC Acquisition, Inc.(4) | Insurance | Senior Loan | 11/2021 | 6.8 | % | $ | 17 | $ | 17 | |||||||||
RSC Acquisition, Inc.(4) | Insurance | Senior Loan | 11/2022 | 6.7 | 3,824 | 3,815 | ||||||||||||
Rubio's Restaurants, Inc.(4) | Beverage, Food and Tobacco | Senior Loan | 10/2019 | 7.6 | 4,941 | 4,941 | ||||||||||||
| Rug Doctor LLC | Personal and Non Durable Consumer Products (Mfg. Only) | Senior Loan | 04/2019 | 7.6 | 991 | 991 | ||||||||||||
| Rug Doctor LLC | Personal and Non Durable Consumer Products (Mfg. Only) | Senior Loan | 04/2019 | 7.6 | 5,061 | 5,061 | ||||||||||||
| Sage Dental Management, LLC | Healthcare, Education and Childcare | Senior Loan | 12/2020 | 8.4 | 70 | 64 | ||||||||||||
| Sage Dental Management, LLC | Healthcare, Education and Childcare | Senior Loan | 12/2020 | 8.4 | 4,345 | 3,997 | ||||||||||||
| Sage Dental Management, LLC | Healthcare, Education and Childcare | Senior Loan | 12/2020 | 8.4 | 45 | 42 | ||||||||||||
| Sage Dental Management, LLC | Healthcare, Education and Childcare | Senior Loan | 12/2020 | 8.4 | 64 | 59 | ||||||||||||
Saldon Holdings, Inc. (4) | Diversified/Conglomerate Service | Senior Loan | 09/2022 | 6.4 | 2,354 | 2,342 | ||||||||||||
SEI, Inc.(4) | Electronics | Senior Loan | 07/2023 | 7.5 | 13,716 | 13,716 | ||||||||||||
Self Esteem Brands, LLC(4) | Leisure, Amusement, Motion Pictures, Entertainment | Senior Loan | 02/2020 | 7.0 | 10,142 | 10,142 | ||||||||||||
| Teasdale Quality Foods, Inc. | Grocery | Senior Loan | 10/2020 | 6.9 | 4,507 | 4,416 | ||||||||||||
| Teasdale Quality Foods, Inc. | Grocery | Senior Loan | 10/2020 | 6.9 | 486 | 476 | ||||||||||||
| Teasdale Quality Foods, Inc. | Grocery | Senior Loan | 10/2020 | 7.1 | 650 | 637 | ||||||||||||
| Teasdale Quality Foods, Inc. | Grocery | Senior Loan | 10/2020 | 7.1 | 239 | 235 | ||||||||||||
| Teasdale Quality Foods, Inc. | Grocery | Senior Loan | 10/2020 | 6.9 | 3,532 | 3,460 | ||||||||||||
| Upstream Intermediate, LLC | Healthcare, Education and Childcare | Senior Loan | 01/2024 | 6.6 | 2,830 | 2,830 | ||||||||||||
| W3 Co. | Oil and Gas | Senior Loan | 03/2022 | 8.2 | 1,253 | 1,251 | ||||||||||||
WHCG Management, LLC(4) | Healthcare, Education and Childcare | Senior Loan | 03/2023 | 7.4 | 7,900 | 7,900 | ||||||||||||
WIRB-Copernicus Group, Inc.(4) | Healthcare, Education and Childcare | Senior Loan | 08/2022 | 6.5 | 5,609 | 5,609 | ||||||||||||
| Total senior loan investments | $ | 183,668 | $ | 178,053 | ||||||||||||||
Payless ShoeSource, Inc. (6)(7) | Retail Stores | LLC interest | N/A | N/A | 35 | $ | 54 | |||||||||||
W3 Co. (6)(7) | Oil and Gas | LLC units | N/A | N/A | 3 | 1,073 | ||||||||||||
| Total equity investments | $ | 1,127 | ||||||||||||||||
| Total investments | $ | 183,668 | $ | 179,180 | ||||||||||||||
| SLF Investment Portfolio as of September 30, 2017 | ||||||||||||||||||
| Portfolio Company | Business Description | Investment Type | Maturity Date | Current Interest Rate(1) | Principal ($) / Shares(2) | Fair Value(3) | ||||||||||||
| (In thousands) | ||||||||||||||||||
| 1A Smart Start LLC | Home and Office Furnishings, Housewares, and Durable Consumer | Senior loan | 02/2022 | 6.1 | % | $ | 2,094 | $ | 2,105 | |||||||||
| 1A Smart Start LLC | Home and Office Furnishings, Housewares, and Durable Consumer | Senior loan | 02/2022 | 5.8 | 928 | 928 | ||||||||||||
| Advanced Pain Management Holdings, Inc. | Healthcare, Education and Childcare | Senior loan | 02/2018 | 6.3 | 6,805 | 5,784 | ||||||||||||
| Advanced Pain Management Holdings, Inc. | Healthcare, Education and Childcare | Senior loan | 02/2018 | 6.3 | 466 | 396 | ||||||||||||
| Argon Medical Devices, Inc. | Healthcare, Education and Childcare | Senior loan | 12/2021 | 6.0 | 3,184 | 3,184 | ||||||||||||
Arise Virtual Solutions, Inc. (4) | Telecommunications | Senior loan | 12/2018 | 7.3 | 9,856 | 9,856 | ||||||||||||
| Boot Barn, Inc. | Retail Stores | Senior loan | 06/2021 | 5.8 | 10,073 | 10,073 | ||||||||||||
| Brandmuscle, Inc. | Printing and Publishing | Senior loan | 12/2021 | 6.1 | 4,851 | 4,845 | ||||||||||||
| CLP Healthcare Services, Inc. | Healthcare, Education and Childcare | Senior loan | 12/2020 | 6.6 | 8,590 | 8,418 | ||||||||||||
| CLP Healthcare Services, Inc. | Healthcare, Education and Childcare | Senior loan | 12/2020 | 6.6 | 4,328 | 4,242 | ||||||||||||
| Community Veterinary Partners, LLC | Personal, Food and Miscellaneous Services | Senior loan | 10/2021 | 6.8 | 2,442 | 2,442 | ||||||||||||
| Community Veterinary Partners, LLC | Personal, Food and Miscellaneous Services | Senior loan | 10/2021 | 6.8 | 1,227 | 1,227 | ||||||||||||
| Community Veterinary Partners, LLC | Personal, Food and Miscellaneous Services | Senior loan | 10/2021 | 6.8 | 59 | 59 | ||||||||||||
| Community Veterinary Partners, LLC | Personal, Food and Miscellaneous Services | Senior loan | 10/2021 | 6.8 | 41 | 41 | ||||||||||||
Curo Health Services LLC (4) | Healthcare, Education and Childcare | Senior loan | 02/2022 | 5.3 | 5,850 | 5,867 | ||||||||||||
| DISA Holdings Acquisition Subsidiary Corp. | Diversified/Conglomerate Service | Senior loan | 12/2020 | 5.5 | 4,401 | 4,401 | ||||||||||||
| DISA Holdings Acquisition Subsidiary Corp. | Diversified/Conglomerate Service | Senior loan | 12/2020 | 5.6 | 428 | 428 | ||||||||||||
| EAG, INC. | Diversified/Conglomerate Service | Senior loan | 07/2018 | 5.5 | 1,964 | 1,964 | ||||||||||||
| Encore GC Acquisition, LLC | Healthcare, Education and Childcare | Senior loan | 01/2020 | 6.8 | 4,725 | 4,725 | ||||||||||||
| Flexan, LLC | Chemicals, Plastics and Rubber | Senior loan | 02/2020 | 7.1 | 6,029 | 6,029 | ||||||||||||
| Flexan, LLC | Chemicals, Plastics and Rubber | Senior loan | 02/2020 | 7.1 | 1,686 | 1,686 | ||||||||||||
Flexan, LLC (4) | Chemicals, Plastics and Rubber | Senior loan | 02/2020 | 8.8 | 47 | 47 | ||||||||||||
Gamma Technologies, LLC (4) | Electronics | Senior loan | 06/2021 | 6.0 | 10,264 | 10,264 | ||||||||||||
| Harvey Tool Company, LLC | Diversified/Conglomerate Manufacturing | Senior loan | 03/2020 | 6.1 | 3,064 | 3,064 | ||||||||||||
| III US Holdings, LLC | Diversified/Conglomerate Service | Senior loan | 09/2022 | 7.9 | 5,044 | 5,044 | ||||||||||||
| Mediaocean LLC | Senior loan | Senior Loan | 08/2020 | N/A(10) | — | — | ||||||||||||
| Jensen Hughes, Inc. | Buildings and Real Estate | Senior loan | 12/2021 | 6.3 | 2,293 | 2,293 | ||||||||||||
| Jensen Hughes, Inc. | Buildings and Real Estate | Senior loan | 12/2021 | 6.4 | 102 | 102 | ||||||||||||
| Jensen Hughes, Inc. | Buildings and Real Estate | Senior loan | 12/2021 | 6.4 | 64 | 64 | ||||||||||||
Joerns Healthcare, LLC (4) | Healthcare, Education and Childcare | Senior loan | 05/2020 | 7.8 | 8,745 | 8,202 | ||||||||||||
| Julio & Sons Company | Beverage, Food and Tobacco | Senior loan | 12/2018 | 6.7 | 6,762 | 6,762 | ||||||||||||
| Julio & Sons Company | Beverage, Food and Tobacco | Senior loan | 12/2018 | 6.7 | 2,226 | 2,226 | ||||||||||||
| Julio & Sons Company | Beverage, Food and Tobacco | Senior loan | 12/2018 | 6.7 | 822 | 822 | ||||||||||||
| Loar Group Inc. | Aerospace and Defense | Senior loan | 01/2022 | 6.0 | 2,164 | 2,164 | ||||||||||||
| Loar Group Inc. | Aerospace and Defense | Senior loan | 01/2022 | 6.0 | 1,492 | 1,492 | ||||||||||||
| Paradigm DKD Group, LLC | Buildings and Real Estate | Senior loan | 11/2018 | 6.2 | 1,977 | 1,977 | ||||||||||||
| Paradigm DKD Group, LLC | Buildings and Real Estate | Senior loan | 11/2018 | 6.2 | 596 | 596 | ||||||||||||
Park Place Technologies LLC (4) | Electronics | Senior loan | 06/2022 | 6.3 | 5,341 | 5,287 | ||||||||||||
| SLF Investment Portfolio as of September 30, 2017 - (continued) | ||||||||||||||||||
| Portfolio Company | Business Description | Investment Type | Maturity Date | Current Interest Rate(1) | Principal ($) / Shares(2) | Fair Value(3) | ||||||||||||
| (In thousands) | ||||||||||||||||||
| Pasternack Enterprises, Inc. and Fairview Microwave, Inc. | Diversified/Conglomerate Manufacturing | Senior loan | 05/2022 | 6.2 | % | $ | 5,372 | $ | 5,372 | |||||||||
| Payless ShoeSource, Inc. | Retail Stores | Senior loan | 08/2022 | 10.3 | 768 | 757 | ||||||||||||
| Polk Acquisition Corp. | Automobile | Senior loan | 06/2022 | 6.2 | 4,560 | 4,469 | ||||||||||||
| Polk Acquisition Corp. | Automobile | Senior loan | 06/2022 | 6.7 | 83 | 81 | ||||||||||||
| Polk Acquisition Corp. | Automobile | Senior loan | 06/2022 | 6.2 | 53 | 52 | ||||||||||||
PowerPlan Holdings, Inc. (4) | Utilities | Senior loan | 02/2022 | 6.5 | 11,365 | 11,365 | ||||||||||||
Premise Health Holding Corp. (4) | Healthcare, Education and Childcare | Senior loan | 06/2020 | 5.8 | 11,772 | 11,772 | ||||||||||||
| Pyramid Healthcare, Inc. | Healthcare, Education and Childcare | Senior loan | 08/2019 | 7.7 | 9,738 | 9,738 | ||||||||||||
| Pyramid Healthcare, Inc. | Healthcare, Education and Childcare | Senior loan | 08/2019 | 7.9 | 597 | 597 | ||||||||||||
| R.G. Barry Corporation | Personal, Food and Miscellaneous Services | Senior loan | 09/2019 | 6.2 | 5,217 | 5,217 | ||||||||||||
Radiology Partners, Inc. (4) | Healthcare, Education and Childcare | Senior loan | 09/2020 | 7.1 | 7,793 | 7,793 | ||||||||||||
Radiology Partners, Inc. (4) | Healthcare, Education and Childcare | Senior loan | 09/2020 | 7.1 | 595 | 595 | ||||||||||||
Radiology Partners, Inc. (4) | Healthcare, Education and Childcare | Senior loan | 09/2020 | 7.1 | 505 | 505 | ||||||||||||
Reliant Pro ReHab, LLC (4) | Healthcare, Education and Childcare | Senior loan | 12/2017 | 6.3 | 3,240 | 3,240 | ||||||||||||
RSC Acquisition, Inc. (4) | Insurance | Senior loan | 11/2022 | 6.6 | 3,864 | 3,864 | ||||||||||||
| RSC Acquisition, Inc. | Insurance | Senior loan | 11/2020 | 6.1 | 15 | 15 | ||||||||||||
Rubio's Restaurants, Inc. (4) | Beverage, Food and Tobacco | Senior loan | 11/2018 | 6.1 | 4,992 | 4,992 | ||||||||||||
| Rug Doctor LLC | Personal and Non Durable Consumer Products (Mfg. Only) | Senior loan | 06/2018 | 6.6 | 5,792 | 5,792 | ||||||||||||
| Sage Dental Management, LLC | Healthcare, Education and Childcare | Senior loan | 10/2019 | 7.0 | 4,782 | 4,686 | ||||||||||||
| Sage Dental Management, LLC | Healthcare, Education and Childcare | Senior loan | 10/2019 | 7.8 | 70 | 69 | ||||||||||||
| Sage Dental Management, LLC | Healthcare, Education and Childcare | Senior loan | 10/2019 | 7.0 | 50 | 49 | ||||||||||||
| Sage Dental Management, LLC | Healthcare, Education and Childcare | Senior loan | 10/2019 | 8.8 | 34 | 33 | ||||||||||||
Saldon Holdings, Inc. (4) | Diversified/Conglomerate Service | Senior loan | 09/2022 | 5.8 | 2,521 | 2,490 | ||||||||||||
| Sarnova HC, LLC | Healthcare, Education and Childcare | Senior loan | 01/2022 | 6.0 | 3,684 | 3,684 | ||||||||||||
| SEI, Inc. | Electronics | Senior loan | 07/2021 | 6.0 | 13,820 | 13,820 | ||||||||||||
Self Esteem Brands, LLC (4) | Leisure, Amusement, Motion Pictures, Entertainment | Senior loan | 02/2020 | 6.0 | 11,313 | 11,313 | ||||||||||||
Severin Acquisition, LLC (4) | Diversified/Conglomerate Service | Senior loan | 07/2021 | 6.1 | 4,832 | 4,830 | ||||||||||||
| Severin Acquisition, LLC | Diversified/Conglomerate Service | Senior loan | 07/2021 | 6.0 | 5,290 | 5,265 | ||||||||||||
| Severin Acquisition, LLC | Diversified/Conglomerate Service | Senior loan | 07/2021 | 6.2 | 668 | 670 | ||||||||||||
Severin Acquisition, LLC (5) | Diversified/Conglomerate Service | Senior loan | 07/2021 | N/A | (6) | — | (1 | ) | ||||||||||
| Smashburger Finance LLC | Beverage, Food and Tobacco | Senior loan | 05/2018 | 6.8 | 867 | 754 | ||||||||||||
| Smashburger Finance LLC | Beverage, Food and Tobacco | Senior loan | 05/2018 | 6.8 | 68 | 60 | ||||||||||||
| Smashburger Finance LLC | Beverage, Food and Tobacco | Senior loan | 05/2018 | 6.8 | 68 | 59 | ||||||||||||
| Smashburger Finance LLC | Beverage, Food and Tobacco | Senior loan | 05/2018 | 6.8 | 68 | 59 | ||||||||||||
| Smashburger Finance LLC | Beverage, Food and Tobacco | Senior loan | 05/2018 | 6.8 | 68 | 59 | ||||||||||||
Smashburger Finance LLC (5) | Beverage, Food and Tobacco | Senior loan | 05/2018 | N/A | (6) | — | (15 | ) | ||||||||||
Stomatcare DSO, LLC (7) | Healthcare, Education and Childcare | Senior loan | 05/2022 | 6.2% PIK | 625 | 329 | ||||||||||||
Tate's Bake Shop, Inc. (4) | Beverage, Food and Tobacco | Senior loan | 08/2019 | 6.3 | 2,926 | 2,926 | ||||||||||||
| Teasdale Quality Foods, Inc. | Grocery | Senior loan | 10/2020 | 5.5 | 4,553 | 4,553 | ||||||||||||
| SLF Investment Portfolio as of September 30, 2017 - (continued) | ||||||||||||||||||
| Portfolio Company | Business Description | Investment Type | Maturity Date | Current Interest Rate(1) | Principal ($) / Shares(2) | Fair Value(3) | ||||||||||||
| (In thousands) | ||||||||||||||||||
| Teasdale Quality Foods, Inc. | Grocery | Senior loan | 10/2020 | 6.1 | % | $ | 3,567 | $ | 3,567 | |||||||||
| Teasdale Quality Foods, Inc. | Grocery | Senior loan | 10/2020 | 6.1 | 687 | 687 | ||||||||||||
| Teasdale Quality Foods, Inc. | Grocery | Senior loan | 10/2020 | 6.0 | 514 | 514 | ||||||||||||
| Teasdale Quality Foods, Inc. | Grocery | Senior loan | 10/2020 | 6.1 | 252 | 252 | ||||||||||||
| Transaction Data Systems, Inc. | Diversified/Conglomerate Service | Senior loan | 06/2021 | 6.6 | 7,393 | 7,393 | ||||||||||||
| Transaction Data Systems, Inc. | Diversified/Conglomerate Service | Senior loan | 06/2020 | 5.8 | 22 | 21 | ||||||||||||
| W3 Co. | Oil and Gas | Senior loan | 03/2022 | 7.3 | 1,266 | 1,269 | ||||||||||||
WHCG Management, LLC (4) | Healthcare, Education and Childcare | Senior loan | 03/2023 | 6.1 | 7,980 | 7,980 | ||||||||||||
| WIRB-Copernicus Group, Inc. | Healthcare, Education and Childcare | Senior loan | 08/2022 | 6.3 | 5,666 | 5,666 | ||||||||||||
Young Innovations, Inc. (4) | Healthcare, Education and Childcare | Senior loan | 01/2019 | 6.3 | 10,369 | 10,369 | ||||||||||||
Young Innovations, Inc. (4) | Healthcare, Education and Childcare | Senior loan | 01/2019 | 6.3 | 209 | 209 | ||||||||||||
| Total senior loan investments | $ | 301,583 | $ | 298,941 | ||||||||||||||
Payless ShoeSource, Inc. (8)(9) | Retail Stores | LLC interest | N/A | N/A | 35 | $ | 843 | |||||||||||
W3 Co. (8)(9) | Oil and Gas | LLC units | N/A | N/A | 3 | 1,146 | ||||||||||||
| Total equity investments | $ | 1,989 | ||||||||||||||||
| Total investments | $ | 301,583 | $ | 300,930 | ||||||||||||||
| September 30, 2018 | September 30, 2017 | ||||||
| (In thousands) | |||||||
| Selected Balance Sheet Information, at fair value | |||||||
| Investments, at fair value | $ | 179,180 | $ | 300,930 | |||
| Cash and other assets | 7,127 | 5,305 | |||||
| Other assets | 19 | — | |||||
| Total assets | $ | 186,326 | $ | 306,235 | |||
| Senior credit facility | $ | 104,622 | $ | 197,700 | |||
| Unamortized debt issuance costs | (18 | ) | (712 | ) | |||
| Other liabilities | 484 | 658 | |||||
| Total liabilities | 105,088 | 197,646 | |||||
| Members’ equity | 81,238 | 108,589 | |||||
| Total liabilities and members' equity | $ | 186,326 | $ | 306,235 | |||
| Years ended September 30, | |||||||
| 2018 | 2017 | ||||||
| (In thousands) | |||||||
| Selected Statement of Operations Information: | |||||||
| Interest income | $ | 18,285 | $ | 21,455 | |||
| Fee income | 202 | 5 | |||||
| Total investment income | 18,487 | 21,460 | |||||
| Interest and other debt financing expenses | 6,687 | 10,236 | |||||
| Administrative service fee | 404 | 477 | |||||
| Other expenses | 93 | 131 | |||||
| Total expenses | 7,184 | 10,844 | |||||
| Net investment income | 11,303 | 10,616 | |||||
| Net realized gains (losses) on investments | — | (7,379 | ) | ||||
| Net change in unrealized appreciation (depreciation) on investments | (4,197 | ) | 4,647 | ||||
| Net increase (decrease) in members' equity | $ | 7,106 | $ | 7,884 | |||
| Payments Due by Period (In millions) | |||||||||||||||||||
| Total | Less Than 1 Year | 1 – 3 Years | 3 – 5 Years | More Than 5 Years | |||||||||||||||
| 2014 Debt Securitization | $ | 197.5 | $ | — | $ | — | $ | — | $ | 197.5 | |||||||||
| SBA debentures | 277.6 | — | 35.3 | 103.0 | 139.3 | ||||||||||||||
| Credit Facility | 136.0 | — | — | 136.0 | — | ||||||||||||||
| MS Credit Facility | 234.7 | 234.7 | — | — | — | ||||||||||||||
Unfunded commitments(1) | 57.7 | 57.7 | — | — | — | ||||||||||||||
| Total contractual obligations | $ | 903.5 | $ | 292.4 | $ | 35.3 | $ | 239.0 | $ | 336.8 | |||||||||
Distributions
We intend to make quarterly distributions to our stockholders as determined by our board of directors. For additional details on distributions, see “Dividends and distributions”“Income taxes” in Note 2 to our consolidated financial statements.
We may not be able to achieve operating results that will allow us to make distributions at a specific level or to increase the amount of our distributions from time to time. In addition, we may be limited in our ability to make distributions due to the asset coverage requirements applicable to us as a business development company under the 1940 Act.Act could limit our ability to make distributions. If we do not distribute a certain percentage of our income annually, we will suffer adverse U.S. federal income tax consequences, including the possible loss of our ability to be subject to tax as a RIC. We cannot assure stockholders that they will receive any distributions.
Because federal income tax regulations differ from GAAP, distributions in accordance with tax regulations maycan differ from net investment income and realized gains recognized for financial reporting purposes. Differences may beare permanent or temporary. Permanent differences are reclassified within capital accounts in the financial statements to reflect their tax character. For example, permanent differences in classification may result from the treatment of distributions paid from short-term gains as ordinary income dividends for tax purposes. Temporary differences arise when certain items of income, expense, gain or loss are recognized at some time in the future.
To the extent our taxable earnings fall below the total amount of our distributions for any tax year, a portion of those distributions maycould be deemed a return of capital to our stockholders for U.S. federal income tax purposes. Thus, the source of a distribution to our stockholders maycould be the original capital invested by the stockholder rather than our income or gains. Stockholders should read any written disclosure accompanying a distribution payment carefully and should not assume that the source of any distribution is our ordinary income or gains.
We have adopted an “opt out” dividend reinvestment plan for our common stockholders. As a result, if we declare a distribution, our stockholders’ cash distributions will be automatically reinvested in additional shares of our common stock unless a stockholder specifically “opts out” of our dividend reinvestment plan. If a stockholder opts out, that stockholder will receive cash distributions. Although distributions paid in the form of additional shares of our common stock will generally be subject to U.S. federal, state and local taxes in the same manner as cash distributions, stockholders participating in our dividend reinvestment plan will not receive any corresponding cash distributions with which to pay any such applicable taxes.
TABLE OF CONTENTS
Related Party Transactions
We have entered into a number of business relationships with affiliated or related parties, including the following:
•We entered into the Investment Advisory Agreement with GC Advisors. Mr. Lawrence Golub, our chairman, is a manager of GC Advisors, and Mr. David Golub, our chief executive officer, is a manager of GC Advisors, and each of Messrs. Lawrence Golub and David Golub owns an indirect pecuniary interest in GC Advisors.
•Golub Capital LLC provides, and other affiliates of Golub Capital have historically provided, us with the office facilities and administrative services necessary to conduct day-to-day operations pursuant to our Administration Agreement.
•We have entered into a license agreement with Golub Capital LLC, pursuant to which Golub Capital LLC has granted us a non-exclusive, royalty-free license to use the name “Golub Capital.”
•Under the Staffing Agreement, Golub Capital LLC has agreed to provide GC Advisors with the resources necessary to fulfill its obligations under the Investment Advisory Agreement. The Staffing Agreement provides that Golub Capital LLC will make available to GC Advisors experienced investment professionals and provide access to the senior investment personnel of Golub Capital LLC for purposes of evaluating, negotiating, structuring, closing and monitoring our investments. The Staffing Agreement also includes a commitment that the members of GC Advisors’ investment committee will serve in such capacity. Services under the Staffing Agreement are provided on a direct cost reimbursement basis. We are not a party to the Staffing Agreement.
•GC Advisors servesserved as collateral manager to the 2014 Issuer and the 2018 Issuer under the 2014 Collateral Management Agreement and the 2020 Issuer under the 2020 Collateral Management Agreement and serves as collateral manager to the 2018 Issuer and the GCIC 2018 Issuer under the 2018 Collateral Management Agreement respectively, and prior to the redemption of the 2010 Notes on July 20,GCIC 2018 served as the collateral manager to the 2010 Issuer under the 2010 Collateral Management Agreement.Agreement, respectively. Fees payable to GC Advisors for providing these services offset against the base management fee payable by us under the Investment Advisory Agreement.
•We have entered into the Adviser Revolver with GC Advisors in order to have the ability to borrow funds on a short-term basis.
•On September 16, 2019, we completed our acquisition of GCIC pursuant to the Merger Agreement.
•On January 1, 2020, we purchased the equity interests held by RGA and Aurora in the Senior Loans Funds pursuant to the Purchase Agreement.
•In the transferable rights offering completed on May 15, 2020, 3,191,448 shares of our common stock were purchased by affiliates of GC Advisors.
•On October 2, 2020, an affiliate of GC Advisors purchased $40.0 million of the 2024 Unsecured Notes. On October 8, 2020, the affiliate sold $15.0 million of the 2024 Unsecured Notes to an unaffiliated party. On May 21, 2021, the affiliate sold $25.0 million of the 2024 Unsecured Notes to an unaffiliated party which closed its position.
GC Advisors also sponsors or manages, and mayexpects in the future to sponsor or manage, other investment funds, accounts or investment vehicles (together referred to as “accounts”) that have investment mandates that are similar, in whole and in part, with ours. For example, GC Advisors presently serves as the investment adviser to Golub Capital Investment CorporationBDC 3, Inc. and Golub Capital BDC 3, Inc., each anDirect Lending Corporation, both unlisted business development company companies
108
TABLE OF CONTENTS
that primarily focusesfocus on investing in one stop and other senior secured loans. In addition, our officers and directors serve in similar capacitiescapacity for Golub Capital Investment Corporation and Golub Capital BDC 3, Inc. and Golub Capital Direct Lending Corporation. If GC Advisors and its affiliates may determine that an investment is appropriate for us, Golub Capital BDC 3, Inc., Golub Capital Direct Lending Corporation and for one or more of those other accounts. In such event,accounts, depending on the availability of such investment and other appropriate factors, and pursuant to GC Advisors’ allocation policy, GC Advisors or its affiliates maycould determine that we should invest side-by-side with one or more other accounts. We do not intend to make any investments if they are not permitted by applicable law and interpretive positions of the SEC and its staff, or if they are inconsistent with GC Advisors’ allocation procedures.
In addition, we have adopted a formal code of ethics that governs the conduct of our and GC Advisors’ officers, directors and employees. Our officers and directors also remain subject to the duties imposed by both the 1940 Act and the General Corporation Law of the State of Delaware.
Critical Accounting Policies
The preparation of financial statements and related disclosures in conformity with GAAP requires management to make estimates and assumptions that affect the reported amounts of assets and liabilities, disclosure of contingent assets and liabilities at the date of the financial statements and revenues and expenses during the periods reported. Actual results could materially differ from those estimates. We have identified the following items as critical accounting policies.
Fair Value Measurements
We value investments for which market quotations are readily available at their market quotations. However, a readily available market value is not expected to exist for many of the investments in our portfolio, and we value these portfolio investments at fair value as determined in good faith by our board of directors under our valuation policy and process.
Valuation methods may include comparisons of the portfolio companies to peer companies that are public, determination of the enterprise value of a portfolio company, discounted cash flow analysis and a market interest rate approach. The factors that are taken into account in fair value pricing investments include: available current market data, including relevant and applicable market trading and transaction comparables; applicable market yields and multiples; security covenants; call protection provisions; information rights; the nature and realizable value of any collateral; the portfolio company’s ability to make payments, its earnings and discounted cash flows and the markets in which it does business; comparisons of financial ratios of peer companies that are public; comparable merger and acquisition transactions; and the principal market and enterprise values. When an external event such as a purchase transaction, public offering or subsequent equity sale occurs, we will consider the pricing indicated by the external event to corroborate the private equity valuation. Due to the inherent uncertainty of determining the fair value of investments that do not have a readily available market value, the fair value of the investments maycan differ significantly from the values that would have been used had a readily available market value existed for such investments and may differ materially from values that mayare ultimately be received or settled.
Our board of directors is ultimately and solely responsible for determining, in good faith, the fair value of investments that are not publicly traded, whose market prices are not readily available on a quarterly basis or any other situation where portfolio investments require a fair value determination.
With respect to investments for which market quotations are not readily available, our board of directors undertakes a multi-step valuation process each quarter, as described below:
Our quarterly valuation process begins with each portfolio company investment being initially valued by the investment professionals of GC Advisors responsible for credit monitoring. Preliminary valuation conclusions are then documented and discussed with our senior management and GC Advisors. The audit committee of our board of directors reviews these preliminary valuations. At least once annually the valuation for each portfolio investment, subject to a de minimis threshold, is reviewed by an independent valuation firm. The board of directors discusses valuations and determines the fair value of each investment in our portfolio in good faith.
109
TABLE OF CONTENTS
Determination of fair values involves subjective judgments and estimates. Under current accounting standards, the notes to our consolidated financial statements refer to the uncertainty with respect to the possible effect of such valuations, and any change in such valuations, on our consolidated financial statements.
We follow ASC Topic 820 for measuring fair value. Fair value is the price that would be received in the sale of an asset or paid to transfer a liability in an orderly transaction between market participants at the measurement date. Where available, fair value is based on observable market prices or parameters, or derived from such prices or parameters. Where observable prices or inputs are not available, valuation models are applied. These valuation models involve some level of management estimation and judgment, the degree of which is dependent on the price transparency for the assets or liabilities or market and the assets’ or liabilities’ complexity. Our fair value analysis includes an analysis of the value of any unfunded loan commitments. Assets and liabilities are categorized for disclosure purposes based upon the level of judgment associated with the inputs used to measure their value. The valuation hierarchical levels are based upon the transparency of the inputs to the valuation of the asset or liability as of the measurement date. The three levels are defined as follows:
Level 1: Inputs are unadjusted, quoted prices in active markets for identical assets or liabilities at the measurement date.
Level 2: Inputs include quoted prices for similar assets or liabilities in active markets and inputs that are observable for the assets or liabilities, either directly or indirectly, for substantially the full term of the assets or liabilities.
Level 3: Inputs include significant unobservable inputs for the assets or liabilities and include situations where there is little, if any, market activity for the assets or liabilities. The inputs into the determination of fair value are based upon the best information available and may require significant management judgment or estimation.
In certain cases, the inputs used to measure fair value may fall into different levels of the fair value hierarchy. In such cases, an asset’s or a liability’s categorization within the fair value hierarchy is based on the lowest level of input that is significant to the fair value measurement. Our assessment of the significance of a particular input to the fair value measurement in its entirety requires judgment, and we consider factors specific to the asset or liability. We assess the levels of assets and liabilities at each measurement date, and transfers between levels are recognized on the actual date of the event or change in circumstances that caused the transfers. There were no transfers among Level 1, 2 and 3 of the fair value hierarchy for assets and liabilities during the years ended September 30, 2018, 20172021, 2020 and 2016.2019. The following section describes the valuation techniques used by us to measure different assets and liabilities at fair value and includes the level within the fair value hierarchy in which the assets and liabilities are categorized.
Valuation of Investments
Level 1 investments are valued using quoted market prices. Level 2 investments are valued using market consensus prices that are corroborated by observable market data and quoted market prices for similar assets and liabilities. Level 3 investments are valued at fair value as determined in good faith by our board of directors, based on input of management, the audit committee and independent valuation firms that have been engaged at the direction of our board of directors to assist in the valuation of each portfolio investment without a readily available market quotation at least once during a trailing twelve-month period under a valuation policy and a consistently applied valuation process. This valuation process is conducted at the end of each fiscal quarter, with approximately 25% (based on the number of portfolio companies) of our valuations of debt and equity investments without readily available market quotations subject to review by an independent valuation firm. AsAll investments as of September 30, 2018 and
When determining fair value of Level 3 debt and equity investments, we may take into account the following factors, where relevant: the enterprise value of a portfolio company, the nature and realizable value of any collateral, the portfolio company’s ability to make payments and its earnings and discounted cash flows, the markets in which the portfolio company does business, comparisons to publicly traded securities, and changes in the interest rate environment and the credit markets generally that may affect the price at which similar investments may be made and other relevant factors. The primary method for determining enterprise value uses a multiple analysis whereby
110
TABLE OF CONTENTS
appropriate multiples are applied to the portfolio company’s EBITDA. A portfolio company’s EBITDA may include pro-forma adjustments for items such as acquisitions, divestitures, or expense reductions. The enterprise value analysis is performed to determine the value of equity investments and to determine if debt investments are credit impaired. If debt investments are credit impaired, we will use the enterprise value analysis or a liquidation basis analysis to determine fair value. For debt investments that are not determined to be credit impaired, we use a market interest rate yield analysis to determine fair value.
In addition, for certain debt investments, we may base our valuation on indicative bid and ask prices provided by an independent third party pricing service. Bid prices reflect the highest price that we and others may be willing to pay. Ask prices represent the lowest price that we and others may be willing to accept. We generally use the midpoint of the bid/ask range as our best estimate of fair value of such investment.
Due to the inherent uncertainty of determining the fair value of Level 3 investments that do not have a readily available market value, the fair value of the investments may differ significantly from the values that would have been used had a market existed for such investments and may differ materially from the values that may ultimately be received or settled. Further, such investments are generally subject to legal and other restrictions or otherwise are less liquid than publicly traded instruments. If we were required to liquidate a portfolio investment in a forced or liquidation sale, we may realize significantly less than the value at which such investment had previously been recorded.
Our investments are subject to market risk. Market risk is the potential for changes in the value due to market changes. Market risk is directly impacted by the volatility and liquidity in the markets in which the investments are traded.
Valuation of Other Financial Assets and Liabilities
Revenue Recognition:
Our revenue recognition policies are as follows:
Investments and Related Investment Income: Interest income is accrued based upon the outstanding principal amount and contractual interest terms of debt investments. Premiums, discounts, and origination fees are amortized or accreted into interest income over the life of the respective debt investment. For investments with contractual PIK interest, which represents contractual interest accrued and added to the principal balance that generally becomes due at maturity, we do not accrue PIK interest if the portfolio company valuation indicates that the PIK interest is not likely to be collectible. In addition, we may generate revenue in the form of amendment, structuring or due diligence fees, fees for providing managerial assistance, consulting fees and prepayment premiums on loans and record these fees as fee income when earned.received. Loan origination fees, original issue discount and market discount or premium are capitalized, and we accrete or amortize such amounts as interest income. We record prepayment premiums on loans as fee income. Dividend income on preferred equity securities is recorded as dividend income on an accrual basis to the extent that such amounts are payable by the portfolio company and are expected to be collected. Dividend income on common equity securities is recorded on the record date for private portfolio companies or on the ex-dividend date for publicly traded portfolio companies. Distributions received from LLC and limited partnership, or LP, investments are evaluated to determine if the distribution should be recorded as dividend income or a return of
capital. Generally, we will not record distributions from equity investments in LLCs and LPs as dividend income unless there are sufficient accumulated tax-basis earnings and profits in the LLC or LP prior to the distribution. Distributions that are classified as a return of capital are recorded as a reduction in the cost basis of the investment.
We account for investment transactions on a trade-date basis. Realized gains or losses on investments are measured by the difference between the net proceeds from the disposition and the cost basis of investment, without regard to unrealized gains or losses previously recognized. We report changes in fair value of investments from the prior period that is measured at fair value as a component of the net change in unrealized appreciation (depreciation) on investments in our Consolidated Statements of Operations.
111
TABLE OF CONTENTS
Non-accrual: Loans may be left on accrual status during the period we are pursuing repayment of the loan. Management reviews all loans that become past due 90 days or more on principal and interest or when there is reasonable doubt that principal or interest will be collected for possible placement on non-accrual status. We generally reverse accrued interest when a loan is placed on non-accrual. Additionally, any original issue discount and market discount are no longer accreted to interest income as of the date the loan is placed on non-accrual status. Interest payments received on non-accrual loans may be recognized as income or applied to principal depending upon management’s judgment. We restore non-accrual loans to accrual status when past due principal and interest is paid and, in our management’s judgment, are likely to remain current. The total fair value of our non-accrual loans was $5.6$46.1 million and $69.3 million as of September 30, 20182021 and $3.0 million as of September 30, 2017.2020, respectively.
Income taxes: See “Consolidated ResultsWehave elected to be treated as a RIC under Subchapter M of Operations - Expenses - Excise Tax Expense.”the Code and operate in a manner so as to qualify for the tax treatment applicable to RICs. In order to be subject to tax as a RIC, we are required to meet certain source of income and asset diversification requirements, as well as timely distribute to our stockholders dividends for U.S. federal income tax purposes of an amount generally at least equal to 90% of investment company taxable income, as defined by the Code and determined without regard to any deduction for dividends paid, for each tax year. We have made and intend to continue to make the requisite distributions to our stockholders, which will generally relieve us from U.S. federal income taxes.
Depending on the level of taxable income earned in a tax year, we may choose to retain taxable income in excess of current year dividend distributions and would distribute such taxable income in the next tax year. We may then be required to incur a 4% excise tax on such income. To the extent that we determine that our estimated current year annual taxable income, determined on a calendar year basis, could exceed estimated current calendar year dividend distributions, we accrue excise tax, if any, on estimated excess taxable income as taxable income is earned. For each of the years ended September 30, 2021, 2020 and 2019, we did not incur any U.S federal excise tax.
We have consolidated subsidiaries that are subject to U.S. federal and state corporate-level income taxes. For the year ended September 30, 2021, we recorded a net tax expense of $0.5 million for taxable subsidiaries. For the years ended September 30, 2020 and 2019, we did not record a net tax expense for taxable subsidiaries. As of September 30, 2021, we recorded a net deferred tax liability on the Consolidated Statement of Financial Condition of $0.5 million for taxable subsidiaries, primarily due to unrealized appreciation on the investments held at the taxable subsidiaries. As of September 30, 2020, there was no deferred tax asset or liability recorded on the Consolidated Statement of Financial Condition.
Because federal income tax regulations differ from GAAP, distributions in accordance with tax regulations may differ from net investment income and realized gains recognized for financial reporting purposes. Differences may be permanent or temporary. Permanent differences are reclassified within capital accounts in the financial statements to reflect their tax character. For example, permanent differences in classification may result from the treatment of distributions paid from short-term gains as ordinary income dividends for tax purposes. Temporary differences arise when certain items of income, expense, gain or loss are recognized at some time in the future.
TABLE OF CONTENTS
Item 7A. Quantitative and Qualitative Disclosures about Market Risk
We are subject to financial market risks, including changes in interest rates. Many of the loans in our portfolio have floating interest rates, and we expect that our loans in the future may also have floating interest rates. These loans are usually based on a floating LIBOR and typically have interest rate reset provisions that adjust applicable interest rates under such loans to current market rates on a quarterly basis. The loans that are subject to the floating LIBOR are also typically subject to a minimum base rate, or floor, that we charge on our loans if the current market rates are below the respective floors. As of September 30, 20182021 and 2017,2020, the weighted average LIBOR floor on the loans subject to floating interest rates was 1.01%0.99% and 1.04%1.01%, respectively. Prior to their redemption on October 20, 2016, theThe Class A, 2010 Notes issued as part of the 2010 Debt Securitization had floating interest rate provisions based on three-month LIBOR that reset quarterly as did the Class A-Refi 2010B and C-1 2018 Notes issued in connection with the refinancing of the 20102018 Debt Securitization prior to their redemption on July 20, 2018. Prior to their redemption on March 23, 2018, the Class A-1, A-2 and B 2014 Notes issued as part of the 2014 Debt Securitization hadhave floating rate interest rate provisions based on three-month LIBOR that reset quarterly, as do the Class A-1-R, A-2-RA-1 and B-R 2014B-1 GCIC 2018 Notes as issued in connection with the refinancingas part of the 2014GCIC 2018 Debt Securitization. In addition, the Credit Facility has and prior to its termination on November 16, 2018, theThe MS Credit Facility hadII has a floating interest rate provisionsprovision primarily based on one-month LIBOR plus 2.45%. Finally, the JPM Credit Facility has a floating interest rate provision primarily based on one-month LIBOR plus a spread that reset daily.ranges from 1.75% to 1.875%. We expect that other credit facilities into which we enter in the future may have floating interest rate provisions.
In connection with the COVID-19 pandemic, the U.S. Federal Reserve and other central banks have reduced certain interest rates and LIBOR has decreased. A prolonged reduction in interest rates will reduce our gross investment income and could result in a decrease in our net investment income if such decreases in LIBOR are not offset by a corresponding increase in the spread over LIBOR that we earn on any portfolio investments, a decrease in our operating expenses, including with respect to our income incentive fee, or a decrease in the interest rate of our floating interest rate liabilities tied to LIBOR.
Assuming that the Consolidated Statement of Financial Condition as of September 30, 20182021 were to remain constant and that we took no actions to alter interest rate sensitivity as of such date, the following table shows the annualized impact of hypothetical base rate changes in interest rates.
| Change in interest rates | Increase (decrease) in interest income | Increase (decrease) in interest expense | Net increase (decrease) in investment income | |||||||||||||||||
| (In thousands) | ||||||||||||||||||||
| Down 25 basis points | $ | (907) | $ | (3,465) | $ | 2,558 | ||||||||||||||
| Up 50 basis points | 1,819 | 6,930 | (5,111) | |||||||||||||||||
| Up 100 basis points | 9,854 | 13,860 | (4,006) | |||||||||||||||||
| Up 150 basis points | 32,321 | 20,790 | 11,531 | |||||||||||||||||
| Up 200 basis points | 54,870 | 27,719 | 27,151 | |||||||||||||||||
| Change in interest rates | Increase (decrease) in interest income | Increase (decrease) in interest expense | Net increase (decrease) in investment income | |||||||||
| (In thousands) | ||||||||||||
| Down 25 basis points | $ | (4,164 | ) | $ | (1,420 | ) | $ | (2,744 | ) | |||
| Up 50 basis points | 8,327 | 2,841 | 5,486 | |||||||||
| Up 100 basis points | 16,654 | 5,682 | 10,972 | |||||||||
| Up 150 basis points | 24,981 | 8,523 | 16,458 | |||||||||
| Up 200 basis points | 33,308 | 11,364 | 21,944 | |||||||||
Although we believe that this analysis is indicative of our sensitivity to interest rate changes as of September 30, 2018,2021, it does not adjust for changes in the credit market, credit quality, the size and composition of the assets in our portfolio and other business developments, including borrowings under the 2018 Debt Securitization, the 2014 Debt Securitization, the Credit Facility and the termination ofSecuritizations, the MS Credit Facility II, the JPM Credit Facility, Adviser Revolver, or other borrowings, that could affect net increase in net assets resulting from operations, or net income. Accordingly, we can offer no assurances that actual results would not differ materially from the analysis above.
We may in the future hedge against interest rate fluctuations by using standard hedging instruments such as interest rate swaps, futures, options and forward contracts to the limited extent permitted under the 1940 Act and applicable commodities laws. While hedging activities may insulate us against adverse changes in interest rates, they may also limit our ability to participate in the benefits of lower interest rates with respect to the investments in our portfolio with fixed interest rates.
113
Item 8. Consolidated Financial Statements and Supplementary Data
Index to Consolidated Financial Statements
Management’s Report on Internal Control over Financial Reporting
The management of Golub Capital BDC, Inc. (“GBDC,” and collectively with its subsidiaries, the “Company,” “we,” “us,” “our” and “Golub Capital BDC”) is responsible for establishing and maintaining adequate internal control over financial reporting. Our internal control system is a process designed to provide reasonable assurance to our management and board of directors regarding the preparation and fair presentation of published financial statements.
Golub Capital BDC’s internal control over financial reporting includes policies and procedures that pertain to the maintenance of records that, in reasonable detail, accurately and fairly reflect transactions recorded necessary to permit the preparation of financial statements in accordance with U.S. generally accepted accounting principles. Our policies and procedures also provide reasonable assurance that receipts and expenditures are being made only in accordance with authorizations of management and the directors of Golub Capital BDC, and provide reasonable assurance regarding prevention or timely detection of unauthorized acquisition, use or disposition of our assets that could have a material effect on our financial statements.
All internal control systems, no matter how well designed, have inherent limitations. Therefore, even those systems determined to be effective can provide only reasonable assurance with respect to financial statement preparation and presentation. Also, projections of any evaluation of effectiveness as to future periods are subject to the risk that controls may become inadequate because of changes in conditions, or that the degree of compliance with the policies or procedures may deteriorate.
Management assessed the effectiveness of Golub Capital BDC’s internal control over financial reporting as of September 30, 2018.2021. In making this assessment, we used the criteria set forth by the Committee of Sponsoring Organizations of the Treadway Commission in Internal Control — Integrated Framework issued in 2013. Based on the assessment, management believes that, as of September 30, 2018,2021, our internal control over financial reporting is effective based on those criteria.
Golub Capital BDC’s independent registered public accounting firm that audited the financial statements has issued an audit report on the effectiveness of our internal control over financial reporting as of September 30, 2021. This report appears on page 118. | ||
115
Report of Independent Registered Public Accounting Firm
To the Shareholders and the Board of Directors of Golub Capital BDC, Inc. and Subsidiaries
Opinion on the Financial Statements
We have audited the accompanying consolidated statements of financial condition of Golub Capital BDC, Inc. and Subsidiaries (the Company), including the consolidated schedules of investments, as of September 30, 2021 and 2020, the related consolidated statements of operations, changes in net assets, and cash flows for each of the three years in the period ended September 30, 2021, and the related notes (collectively referred to as the “consolidated financial statements”). In our opinion, the consolidated financial statements present fairly, in all material respects, the financial position of the Company at September 30, 2021 and 2020, and the results of its operations, changes in its net assets, and its cash flows for each of the three years in the period ended September 30, 2021, in conformity with U.S. generally accepted accounting principles.
We also have audited, in accordance with the standards of the Public Company Accounting Oversight Board (United States) (PCAOB), the Company’s internal control over financial reporting as of September 30, 2018. This2021, based on criteria established in Internal Control-Integrated Framework issued by the Committee of Sponsoring Organizations of the Treadway Commission(2013 framework), and our report appearsdated November 29, 2021 expressed an unqualified opinion thereon.
Basis for Opinion
These financial statements are the responsibility of the Company’s management. Our responsibility is to express an opinion on page 99.the Company’s financial statements based on our audits. We are a public accounting firm registered with the PCAOB and are required to be independent with respect to the Company in accordance with the U.S. federal securities laws and the applicable rules and regulations of the Securities and Exchange Commission and the PCAOB.
We conducted our audits in accordance with the standards of the PCAOB. Those standards require that we plan and perform the audit to obtain reasonable assurance about whether the financial statements are free of material misstatement, whether due to error or fraud. Our audits included performing procedures to assess the risks of material misstatement of the financial statements, whether due to error or fraud, and performing procedures that respond to those risks. Such procedures included examining, on a test basis, evidence regarding the amounts and disclosures in the financial statements. Our procedures included confirmation of investments owned as of September 30, 2021 and 2020, by correspondence with the trustees or the underlying investee or broker. Our audits also included evaluating the accounting principles used and significant estimates made by management, as well as evaluating the overall presentation of the financial statements. We believe that our audits provide a reasonable basis for our opinion.
Critical Audit Matter
The critical audit matter communicated below is a matter arising from the current period audit of the financial statements that was communicated or required to be communicated to the audit committee and that: (1) relates to accounts or disclosures that are material to the financial statements and (2) involved our especially challenging, subjective, or complex judgments. The communication of the critical audit matter does not alter in any way our opinion on the consolidated financial statements, taken as a whole, and we are not, by communicating the critical audit matter below, providing a separate opinion on the critical audit matter or on the account or disclosures to which it relates.
| Valuation of investments using significant unobservable inputs and assumptions | |||||
| Description of the Matter | At September 30, 2021, the fair value of the Company’s investments categorized as Level 3 investments within the fair value hierarchy (Level 3 investments) totaled $4,894,378 thousand. Management determines the fair value of the Company’s Level 3 investments by applying the methodologies outlined in Notes 2 and 6 to the consolidated financial statements and using significant unobservable inputs and assumptions. Determining the fair value of the Level 3 investments requires management to make judgments about the valuation methodologies (i.e., market approach or income approach) and significant unobservable inputs and assumptions including, among others, EBITDA multiples, revenue multiples, and market interest rates for similar loans with similar credit profiles, used in determining the fair value measurements. Auditing the fair value of the Company’s Level 3 investments was complex, as the unobservable inputs and assumptions used by the Company are highly judgmental, are sensitive to economic dislocations, and could have a significant effect on the fair value measurements of such investments. | ||||
| How We Addressed the Matter in Our Audit | We obtained an understanding, evaluated the design, and tested the operating effectiveness of controls over the Company’s investment valuation process. This included controls over management’s assessment of the valuation methodologies and significant unobservable inputs and assumptions used in determining the fair value measurements of the Level 3 investments. Our audit procedures included, among others, evaluating the Company’s valuation methodologies, testing the significant unobservable inputs and assumptions used by the Company in determining the fair value of the Company’s Level 3 investments, and testing the mathematical accuracy of the Company’s valuation calculations. For each Level 3 investment, we reviewed the information considered by the Board of Directors relating to the Company’s determination of fair value. For a sample of the Company’s Level 3 investments, with the involvement of our valuation specialists, we independently developed fair value estimates and compared them to the Company’s estimates. We developed our independent fair value estimates by using borrower financial information, which we compared to agreements or underlying source documents provided to the Company by the borrowers, and available market information from third-party sources, such as market spreads, market multiples, and leverage. In developing our independent fair value estimates, we considered the impact of current economic conditions on trends in borrower financial information and the resulting fair value estimates. We also evaluated subsequent events and other available information and considered whether they corroborated or contradicted the Company’s year-end valuations. | ||||
/s/ Ernst & Young LLP
We have served as the Company’s auditor since 2015.
Chicago, Illinois
November 29, 2021
117
Report of Independent Registered Public Accounting Firm
To the Shareholders and the Board of Directors of Golub Capital BDC, Inc. and Subsidiaries
Opinion on Internal Control overOver Financial Reporting
We have audited Golub Capital BDC, Inc. and Subsidiaries’ internal control over financial reporting as of September 30, 2018,2021, based on criteria established in Internal Control-Integrated Framework issued by the Committee of Sponsoring Organizations of the Treadway Commission (2013 framework)(the (the COSO criteria). In our opinion, Golub Capital BDC, Inc. and Subsidiaries (the Company) maintained, in all material respects, effective internal control over financial reporting as of September 30, 2018,2021, based on the COSO criteria.
We also have audited, in accordance with the standards of the Public Company Accounting Oversight Board (United States) (PCAOB), the consolidated statements of financial condition, including the consolidated schedules of investments, of the Company as of September 30, 20182021 and 2017,2020, the related consolidated statements of operations, changes in net assets, and cash flows for each of the three years in the period ended September 30, 2018,2021, and the related notes and our report dated November 28, 201829, 2021 expressed an unqualified opinion thereon.
Basis for Opinion
The Company’s management is responsible for maintaining effective internal control over financial reporting and for its assessment of the effectiveness of internal control over financial reporting included in the accompanying Management’s Report on Internal Control over Financial Reporting. Our responsibility is to express an opinion on the Company’s internal control over financial reporting based on our audit. We are a public accounting firm registered with the PCAOB and are required to be independent with respect to the Company in accordance with the U.S. federal securities laws and the applicable rules and regulations of the Securities and Exchange Commission and the PCAOB.
We conducted our audit in accordance with the standards of the PCAOB. Those standards require that we plan and perform the audit to obtain reasonable assurance about whether effective internal control over financial reporting was maintained in all material respects.
Our audit included obtaining an understanding of internal control over financial reporting, assessing the risk that a material weakness exists, testing and evaluating the design and operating effectiveness of internal control based on the assessed risk, and performing such other procedures as we considered necessary in the circumstances. We believe that our audit provides a reasonable basis for our opinion.
Definition and Limitations of Internal Control Over Financial Reporting
A company’s internal control over financial reporting is a process designed to provide reasonable assurance regarding the reliability of financial reporting and the preparation of financial statements for external purposes in accordance with generally accepted accounting principles. A company’s internal control over financial reporting includes those policies and procedures that (1) pertain to the maintenance of records that, in reasonable detail, accurately and fairly reflect the transactions and dispositions of the assets of the company; (2) provide reasonable assurance that transactions are recorded as necessary to permit preparation of financial statements in accordance with generally accepted accounting principles, and that receipts and expenditures of the company are being made only in accordance with authorizations of management and directors of the company; and (3) provide reasonable assurance regarding prevention or timely detection of unauthorized acquisition, use, or disposition of the company’s assets that could have a material effect on the financial statements.
Because of its inherent limitations, internal control over financial reporting may not prevent or detect misstatements. Also, projections of any evaluation of effectiveness to future periods are subject to the risk that controls may become inadequate because of changes in conditions, or that the degree of compliance with the policies or procedures may deteriorate.
/s/ Ernst & Young LLP
Chicago, Illinois
November 28, 201829, 2021