
UNITED STATES
SECURITIES AND EXCHANGE COMMISSION
Washington, D.C. 20549
FORM 10–K10-K
x ☒ ANNUAL REPORT UNDER SECTION 13 OR 15(d) OF THE SECURITIES EXCHANGE ACT OF 1934
For the fiscal year ended December 31, 20162023
OR
o ☐ TRANSITION REPORT UNDER SECTION 13 OR 15(d) OF THE SECURITIES EXCHANGE ACT OF 1934
For the transition period from_____________ to _____________.
Commission file number 000-54267
|
|
FREEZE TAG, Inc. |
(Exact name of registrant as specified in its charter) |
Delaware |
| 20-4532392 |
(State or other jurisdiction of incorporation or organization) |
| (I.R.S. Employer Identification No.) |
|
|
|
Tustin, California |
|
92780 |
(Address of principal executive offices) |
| (Zip Code) |
Registrant’s telephone number, including area code code: (714) 210-3850
Securities registered pursuant to Section 12(b) of the Act:
Title of each class |
| Trading Symbol | Name of each exchange on which registered | |
None |
| None | None |
Securities registered pursuant to Section 12(g) of the Act:
Common Stock, par value $0.00001
(Title of class)
Indicate by check mark if the registrant is a well-known seasoned issuer, as defined in Rule 405 of the Securities Act. Yes ¨ ☐ No x☒
Indicate by check mark if the registrant is not required to file reports pursuant to Section 13 or 15(d) of the Act. Yes ¨ ☐ No x☒
Indicate by check mark whether the registrant (1) has filed all reports required to be filed by Section 13 or 15(d) of the Securities Exchange Act of 1934 during the preceding 12 months (or for such shorter period that the registrant was required to file such reports), and (2) has been subject to such filing requirements for the past 90 days. Yes x ☒ No ¨☐
Indicate by check mark whether the registrant has submitted electronically and posted on its corporate Website, if any, every Interactive Data File required to be submitted and posted pursuant to Rule 405 of Regulation S-T (§232.405 of this chapter) during the preceding 12 months (or for such shorter period that the registrant was required to and postsubmit such files). Yes x ☒ No ¨
Indicate by check mark if disclosure of delinquent filers pursuant to Item 405 of Regulation S‑K is not contained herein, and will not be contained, to the best of registrant's knowledge, in definitive proxy or information statements incorporated by reference in Part III of this Form 10‑K or any amendment to this Form 10-K. o☐
Indicate by check mark whether the registrant is a large accelerated filer, an accelerated filer, a non-accelerated filer, or a smaller reporting company, or an emerging growth company. See definitions of “large accelerated filer,” “accelerated filer”filer,” “smaller reporting company,” and “smaller reporting“emerging growth company” in Rule 12b-2 of the Exchange Act. (Check one):
Large accelerated filer |
| Accelerated filer |
|
Non-accelerated |
| Smaller reporting company |
|
Emerging growth company | ☐ |
If an emerging growth company, indicate by check mark if the registrant has elected not to use the extended transition period for complying with any new or revised financial accounting standards provided pursuant to Section 13(a) of the Exchange Act. ☐
Indicate by check mark whether the registrant has filed a report on and attestation to its management’s assessment of the effectiveness of its internal control over financial reporting under Section 404(b) of the Sarbanes-Oxley Act (15 U.S.C.7262(b)) by the registered public accounting firm that prepared or issued its audit report. ☐
If securities are registered pursuant to Section 12(b) of the Act, indicate by check mark whether the financial statements of the registrant included in the filing reflect the correction of an error to previously issued financial statements. ☐
Indicate by check mark whether any of those error corrections are restatements that required a recovery analysis of incentive-based compensation received by any of the registrant’s executive officers during the relevant recovery period pursuant to §240.10D-1(b). ☐
Indicate by check mark whether the registrant is a shell company (as defined in Rule 12b-2 of the Act). Yes ¨ ☐ No x☒
Aggregate market value of the voting stock held by non-affiliates as of June 30, 2016: $167,7422023: $443,144 based on the closing price of $0.001$0.014 on June 30, 20162023 of our common stock. The voting stock held by non-affiliates on that date consisted of 167,742,49231,653,123 shares of common stock.
Applicable Only to Registrants Involved in Bankruptcy Proceedings During the Preceding Five Years:
Indicate by check mark whether the registrant has filed all documents and reports required to be filed by Sections 12, 13 or 15(d) of the Exchange Act of 1934 subsequent to the distribution of securities under a plan confirmed by a court. Yes ¨ ☐ No ¨☐
Indicate the number of shares outstanding of each of the registrant’s classes of common stock, as of the latest practicable date. As of March 29, 2017,April 1, 2024, there were 783,211,79875,056,123 shares of common stock, par value $0.00001, issued and outstanding.
Documents Incorporated by Reference
List hereunder the following documents if incorporated by reference and the Part of the Form 10-K (e.g., Part I, Part II, etc.) into which the document is incorporated: (1) Any annual report to security holders; (2) Any proxy or information statement; and (3) Any prospectus filed pursuant to rule 424(b) or (c) of the Securities Act of 1933. The listed documents should be clearly described for identification purposes (e.g., annual report to security holders for fiscal year ended December 24, 1980). None.
Freeze Tag, Inc.
TABLE OF CONTENTS
52
53
| 2 |
| Table of Contents |
PART I
Explanatory Note
This Annual Report includes forward-lookingforward‑looking statements within the meaning of the Securities Exchange Act of 1934 (the “Exchange Act”). These statements are based on management’s beliefs and assumptions, and on information currently available to management. Forward-lookingForward‑looking statements include the information concerning possible or assumed future results of operations of the Company set forth under the heading “Management's“Management’s Discussion and Analysis of Financial Condition or Plan of Operation.” Forward-lookingForward‑looking statements also include statements in which words such as “expect,” “anticipate,” “intend,” “plan,” “believe,” “estimate,” “consider” or similar expressions are used.
Forward-lookingForward‑looking statements are not guarantees of future performance. They involve risks, uncertainties and assumptions. The Company'sCompany’s future results and shareholder values may differ materially from those expressed in these forward-lookingforward‑looking statements. Readers are cautioned not to put undue reliance on any forward-lookingforward‑looking statements.
Corporate History
We were incorporated as Freeze Tag, Inc. in February 2006 in the State of Delaware. In March 2006, Freeze Tag, LLC, our predecessor which was formed in October 2005, was merged with and into Freeze Tag, Inc. In October of 2017, we completed a merger transaction with Munzee Inc. in a transaction in which Freeze Tag, Inc. became the surviving entity and both companies merged their operations together (the “Merger”). Under U.S. generally accepted accounting principles, the Merger is treated as a “reverse merger” under the purchase method of accounting, with Munzee as the accounting acquirer. Accordingly, Munzee’s historical financial results of operations replace Freeze Tag’s historical financial results of operations for all periods prior to the Merger and, for all periods following the Merger, our financial statements include the financial results of operations of the combined company. The consolidated entity maintains office addresses in Tustin, California and McKinney, Texas. Other corporate actions that occurred as a result of the merger are that Robert Vardeman, Jr., former CEO of Munzee Inc. became President of Freeze Tag, Inc. and both Robert Vardeman, Jr. and Robert D. Vardeman were added to the Freeze Tag, Inc. Board of Directors. Our Board of Directors currently consists of Craig Holland, Mick Donahoo, Robert Vardeman, Jr., and Robert D. Vardeman. In the quarter ended March 31, 2020, our wholly-owned subsidiary, Space Coast Geo Store, LLC, a Florida limited liability company, began selling merchandise to the geocaching industry, and its financial results are consolidated in our financial statements.
Business Overview
Freeze Tag, Inc. is a creator of location-based, mobile social games that are fun and engaging for all ages.consumers and businesses. Based on a free-to-play business model that has propelled games built and marketed by some of our competitors to worldwide success, we employ state-of-the-art data analytics and proprietary technology to dynamically optimize the gaming experience for revenue generation. Players can download and enjoy our games for free, and, if they so choose, they can purchase virtual items and additional features within the game to increase the fun factor. Our games encourage players to compete and engage with their friends on major social networks such as Facebook and Twitter.
Founded by gaming industry veterans, Freeze Tag has launched several successful mobile games includingover the number one hit series Victorian Mysteries®course of its history. Our current portfolio includes hits such as Munzee®, a social platform with over 10 million locations worldwide and Unsolved Mystery Club®hundreds of thousands of players that blends gamification and geolocation into an experience that rewards players for going places in the physical world, WallaBee®, an addictive collecting game with over 2,000 beautifully drawn digital cards, as well as digital entertainment like Etch A Sketch®. Freeze Tagmany social mobile games have been downloaded millionsthat provide endless hours of times on the Apple, Amazonfamily-friendly fun. We also offer our technology and Google app stores.services to third party businesses that want to leverage mobile gaming in their marketing and branding programs. For example, our Eventzee® solution allows businesses to create private scavenger hunts in physical places such as malls, tradeshows, company events or campuses to create immersive brand experiences.
Our mission is to design, develop and deliver innovative digital entertainment that surprises and delights. Our products bring families together by providing fun to kids of all ages. We also strive to create a workplace environment where creativity and fun can thrive in a demanding industry.
Change
| 3 |
| Table of Contents |
Throughout 2023, we made progress on several objectives including continued development of our Munzee product offering, the expansion of our Eventzee custom scavenger hunt platform, and the ongoing development of a new location-based application.
Munzee Development and Live Operations
Munzee continues to be our flagship product. In 2023, several new features were added to our Munzee app including:
· | NEW Capture Radius Booster that allows players to double their hand-capping and blasting radius. | |
· | Introduced separate Greeting Card layer on the map in order to allow more room for players to deploy at Munzee Events, etc. | |
· | NEW purchasable Stamps credit which allows players to deploy past collected greeting cards. | |
· | Integrated CuppaZee companion app into the Munzee infrastructure. In May of 2023, we announced that CuppaZee became a part of the Munzee family of apps. CuppaZee is a Munzee companion app and website that allows Munzee players to track their daily activity and ZeeOps progress, as well as keep track of items in their inventory and the locations of their bouncers. We continue to develop CuppaZee and have integrated extra gameplay stats and functionality that were in the Munzee website over to the CuppaZee app and website. For more information, see our release here: https://munzeeblog.com/welcome-cuppazee/ and visit CuppaZee at: https://cuppazee.app/ | |
· | Revamped online web map to make it easier for players to deploy using the website. | |
· | Expanded QRates system to provide more repeatable gameplay by allowing players to deploy the Cubimals they’ve collected. |
Munzee Backend Development
We also continued working on the server-side technology behind the Munzee mobile app. When the game was originally built, the technology options were much different than those available today. The original technology choices that were originally made did not allow for an environment that was flexible enough to expand as the game continued to grow in popularity. Consequently, we embarked on a project in starting at the end of 2021, but engaged in more heavily in 2022 to migrate the old technology to a new platform that was concluded in 2023 that included the following changes to the Munzee backend technology:
· | Removed large amounts of hard-coded coded variables in the game and moved them to a database system that allows more flexibility in launching new items and updating existing items. | |
· | Converted hundreds of thousands of lines of code to a new code structure that is more efficient in debugging and executing, a structure that will continue to allow us to grow the game. We will continue refactoring this code to make it more and more efficient. | |
· | Created new tools that allowed our team to make use of the database driven system for items to enhance gameplay. | |
· | Began developing new software tests and checks that help our development team make less errors in the development process and allow for a shorter development time. This effort will continue in 2024. |
As a result of these server-side changes, the Munzee platform is much more flexible and our development cycle has improved greatly. We also made great strides in our testing environment, building out a robust staging environment that allows us to test and tweak new features before they go live.
We are already starting to see the fruits of these changes in early 2024. We will release more information in the coming months.
| 4 |
| Table of Contents |
Eventzee Development and Expanded Customer Base
During 2023, we continued the design and development process on a whole new admin interface for our Eventzee clients. When completed, several new features and capabilities will become available including:
· | A stream-lined user and intuitive interface that will speed the learning curve for new clients | |
· | The ability to create their own events and experience Eventzee in a trial mode | |
· | Access to a library of pre-made challenges | |
· | A new challenge type, which will bring the total to 8 challenge options, the most of any scavenger hunt app on the market | |
· | Two levels of administrative authorization | |
· | And many more features requested by clients |
We plan on launching the new admin tool in Q2 of 2024.
The Eventzee team also continued to add and service high profile clients such as the Hoka, the popular shoe brand, Hyatt Vacation Club, and Games Workshop, to name a few. Please see this link for additional references: https://eventzeeapp.com/blog/.
New App for Painted Rocks Hobbyists
For enthusiasts who paint and hide rocks for others to find, it is difficult to track the activity of your rock. Painted rock creators want to know who found their rocks, how they reacted when they found it, and whether they kept the rock or re-hid it for others to find. Our new Painted Rocks App (PRA) manages all these functions and more. The Painted Rocks App also offers a Rock Locator Map that players can use to find painted rocks hidden in the wild.
We beta launched the Painted Rocks App in 2022 to build an organic audience and receive feedback on the app’s features and benefits. During 2023, we continued to grow the Painted Rocks App player base through organic growth.
In 2024, we plan on making some improvements to the PRA based on what we’ve learned from customer feedback. In the latter half of 2024, we plan on introducing these new features and expanding the customer base.
Our Goals for 2024 and Beyond
As we look ahead to 2024, we plan to expand our topline revenue and move again to profitability.
We plan to introduce some exciting new features to our Munzee game that will expand our player demographic. We will introduce many new features, including the following:
· | Free daily game play that can be accessed by new players wherever there are in the world | |
· | New themes, graphics and artwork that will introduce new layers of gameplay | |
· | Music and sound effects that bring new energy excitement to the Munzee experience |
In addition, our Eventzee app has shown continued year over year revenue growth. During 2024, we plan to add resources, both in terms of people and promotion, to the Eventzee platform to continue and accelerate the upward growth trajectory.
Business Strategy
In recent years, we have shifted our business strategy to focus our efforts on creating free-to-play (FTP) social games for the mobile market. We’ve made this change because we believe that games that are social and mobile will provide the greatest revenue opportunities now and in the foreseeable future. This change in direction has not been an easy one as we’ve had to deploy resources differently, learn new techniques, and experiment with new game designs and marketing processes. The expensesAs we realize success with profitable free-to-play games like Munzee and losses on our financial statements reflectWallaBee, we are realizing dividends from the investmentmany hours invested in this new direction, but we have yet to realize the fruits of our labors on the revenue side of the equation. However, we do believe this strategy will reap the highest returns for the companylearning, experimenting and its shareholders going forward.
We have also announced our intention to grow through acquisition. During 2023, we continued to focus a great deal of effort on building a successful multi-state and worldwide team, developing communications, reporting, and working relationships to integrate all of the Freeze Tag employees and contractors into a cohesive, thriving worldwide team, and we believe that we are seeing the benefits of those efforts.
We still feel that the time is right to build an alliance of mobile game developers who can become stronger and more successful by working together to build a company that can leverage market intelligence, development expertise and cross-promotional opportunities to achieve great results for our customers and shareholders. As noted in detail below,
During 2024 and beyond, we currently do not have any business opportunities or ventures under contemplationwill continue to look for acquisition or merger. candidates and propose transactions in cases where it makes sense for both parties and will enhance the value of the company.
In the event we do enter into any such transactions in the future, such transactions will likely be accomplished through the issuance of shares of our stock and/or in connection with a strategic financial investor, and not with cash directly from us unless and until our cash position improves.
| 5 |
|
| Table of Contents |
According to Digi Capital’s AR/VR report (Digi Capital AR/VR report http://www.digi-capital.com/news/2017/01/after-mixed-year-mobile-ar-to-drive-108-billion-vrar-market-by-2021/#more-1617), Nintendo/The Pokémon Company/Niantic had a breakout success that even they didn’t anticipate with their augmented reality and geolocation games. Pokémon Go delivered $600 million mobile AR revenue in its first three months alone, making more money through the year than the entire virtual reality (VR) games software market in 2016. While this came from a very specific set of circumstances, many mobile game companies are developing strategies to build on the AR and geolocation games market that Pokemon Go has fostered among consumers.
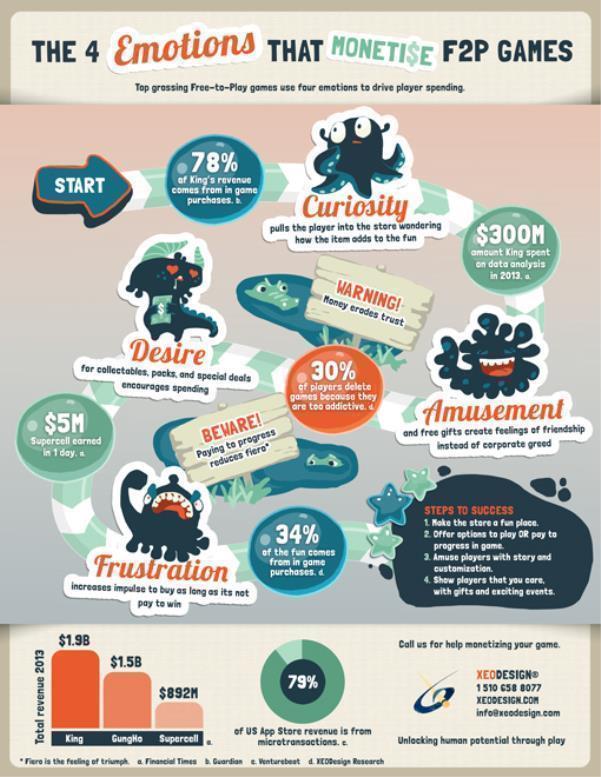
Free-to-play Business Model
The free-to-play business model for games was pioneered on the PC platform and has exploded globally on the mobile platform. The free-to-play model allows users to download and play an enjoyable, but limited, portion of a game for free. If the user wants to access premium features or special virtual items to increase the fun factor, then the user is required to pay, usually $0.99 per feature or item or $0.99 for a bundle of virtual items. For example, if a player has run out of “lives” or “moves” in a game, the player is given two options: 1) Wait for the lives to re-charge which involves waiting but no expense of money or virtual currency; 2) Spend money or virtual currency to buy additional “lives” and keep playing immediately.
With the exception of the Eventzee platform, we adhere to the “free-to-play” business model in our currently live Freeze Tag games. In Munzee, players can purchase blast caps to capture virtual munzees deployed near them. WallaBee also offers players a chance to “forage” for honeycombs for free or they may be purchased as in-game items. In all cases, Munzee, WallaBee and some of our other games are games that players can and do play for free, yet by spending money on additional items, the gameplay experience is enhanced.
In a just a fewOver the last several years, the free-to-play business model has proven to be a very successful model for mobile games. The revenue potential of a game largely depends on the fun-factor and popularity of the game and the game creator’s proprietary techniques for encouraging the player to make a purchase decision – without overly offending the player. The potential for rapidly spreading the game through social networks and small in-game purchases can add up to a very sizeable business opportunity. Oneopportunity, as evidenced by many mobile games generating millions and even billions of the top grossing games since it was launched in 2012, owned and marketed by King Digital, onedollars based solely on an accumulation of our competitors, is called Candy Crush Saga, a seemingly simple game where a user combines 3 or more color candies on a puzzle board to get points. Think Gaming, a service that analyzes and consults to mobile “freemium” game makers, publishers and investors, estimates that Candy Crush Saga grossed over $425,000 per day in 2015, or over $150 million per year, with a lifetime user revenue of merely $3.00 from in-gameplayers making many individual item purchases.

Candy Crush Saga Estimated Revenue
(Source: ThinkGaming.com)
While the success of Candy Crush Saga illustrates the potential market of so called “free-to-play” games, we have no relationship with King Digital or any of its games, and cannot expect and cannot predict that any of our launched games or games in development can have anywhere close to the success of games of our competitors. We have historically been unable to break even, much less ever enjoyed success of a game that generates multi-millions of dollars in revenues. Nevertheless, our business model is to attempt to develop and launch successful games. However, there is no expectation or assurance that we ever can do so.
In the future,Going forward, we plan on the majority of Freeze Tag’s mobile games to be based on the free-to-play model. In addition, we believe that games are more fun with friends, so we connect our players with major social networks such as Facebook and Twitter to enhance the games’ addictiveness, enjoyment and world-of-mouth referrals. We also offer ways for players to communicate directly with each other in Munzee and WallaBee to enhance the feeling of community and comradery. In both Munzee and WallaBee mobile apps, there are certain aspects of gameplay that are more enjoyable when the experience is shared with other players.
Since mobile app development technology is constantly changing and evolving, we review and research platforms, tools, techniques, and third-party SDK’s on a routine basis to ensure we are in synch with the market. In executing our business model, we have previously employed aderived the most benefit from employing proprietary game engineengine(s) built on commonly used technologies (like Cordova, HTML5, and real-time data analyticsothers) because using our own tools and techniques allows us to dynamically optimize the gaming experience for revenue generation. be nimble and anticipate market changes.
In the future, we plan to continue to employ our game engine, but in an effort to more quickly develop games by using outside studios and outside talent, we have made a shift to developing games using the Unity Development platform. Unity (www.unity3d.com) has become the development platform of choice for many game studios, andengine(s). This approach allows us to quickly access additional talent in game development. We will also utilize other technologies in their native development environment (such as HTML5) as circumstances dictate. This shift will allow us to find the best development teams, engineering teams, and partners to help us quickly deploy our games.
Explosive Growth for Mobile Games
According to a 2016 report from Newzoo (a global market research firm with a primary focus on games), the global market for mobile games revenue will increase from $29.7 billion in 2015 to $58.1 billion in 2020, translating into a compound annual growth rate (CAGR) of 14.3%.
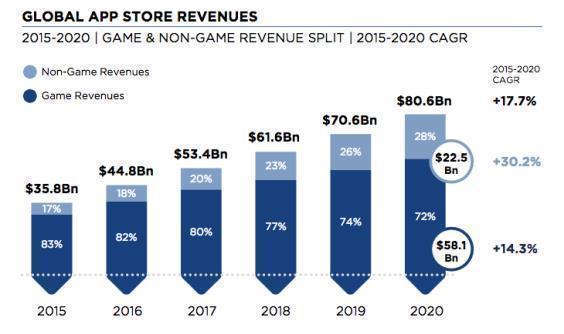
Source: Newzoo 2016 Mobile Games Report
A Truly Global Market
The market for mobile applications grows as the installed based of smartphones and tablets increases. As of 2016, smartphone penetration reached 2.3 billion users or about 31% of the total global population. However, there is much room for growth. The majority of the global users are found in the Asian Pacific region with other areas of the world such as Latin America and the Middle East/Africa set to record impressive growth, according to the Newzoo Mobile Games Report.
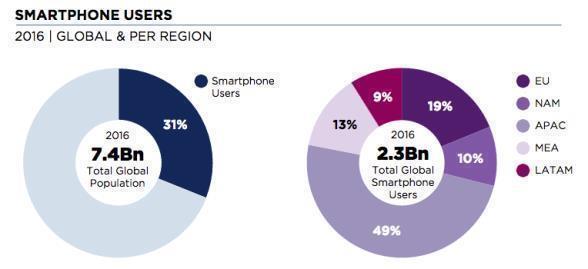
Source: Newzoo 2016 Mobile Games Report
Popular Smartphone Devices
One of the key elements of the growth of mobile game applications is the growth and introduction of new smartphone devices. As evidenced by the chart below, in the USA, Apple and Samsung products dominate the market. It is important for app developers to be aware of the most popular devices to ensure that their applications are optimized for use in order to reach the majority of the consumers who own those devices.
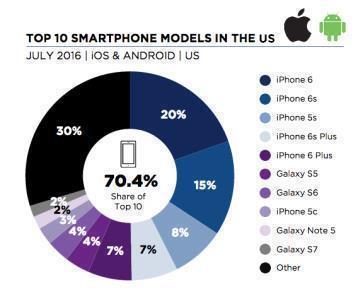
Source: Newzoo 2016 Mobile Games Report
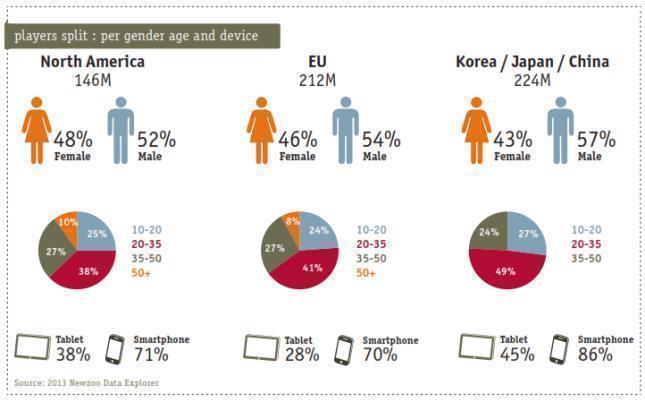
The Female Player
The explosive growth of the mobile games market can be partly attributed to a relative increase in the number of female players. Gaming is historically a male dominated market with action-based games. But the modern female with disposable income, a smartphone and time on her hands has changed everything. This market development has opened the door wide for a previously niche category of games referred to as “casual” games. Candy Crush Saga is an example of a casual game, and clearly, this is no longer a niche category.
The Freeze Tag Strategy
In targeting the global market for mobile games, we are highly focused on developing mobile social games that are casual, fun and engaging for all ages and gender.genders. The free-to-play business model combined with the use of best-in-class development environments (be it the Freeze Tag Game Engine, Unity3D, or Native HTML5 or other technology) and Analytics and Deployment tools, allows us to systematically launch, optimize and monetize our games. We design our games to be never ending entertainment that our users will enjoy playing and be willing to pay us $0.99 or more from time-to-time for special features and virtual items to keep having fun. We believe that the free-to-play model should not be run as a sprint but rather as a marathon. Over the span of several months, or even years, each game is continuously subject to this optimization process to increase user enjoyment and financial return to the company.
Distribution and Marketing
We market, sell and distribute our games primarily through direct-to-consumer digital storefronts, such as Apple’s App Store, and the Google Play StoreStore. We also sell to our players directly through our own web site http://www.freezetag.com and Amazon’s App Store.https://store.freezetag.com. We work with payment vendors like Shopify, Square and PayPal to process our online payments. In addition to publishing our smartphone games on direct-to-consumer digital storefronts, we also publish some of our titles on other platforms, such as the Facebook App Store, the Mac App Store and PC Download portals such as Big Fish Games and Gamehouse.others. Our focus for growth is with the direct-to-consumer digital storefronts, and revenues for the other platforms (Facebook app store, Mac App Store, and PC Download portals) have diminished in recent years, as we have not focused on them.
| 6 |
| Table of Contents |
User Acquisition
In the free-to-play business model, a constant stream of new players is necessary to be successful. So, we have partnered with advertising networks and lead generation companies such as Supersonic, Badge Media, Tapjoy, Ad ColonyFacebook and Facebook (to name a few).Google to help us reach the appropriate audience for our products. We also employ data analytics to determine which creative messages and which lead referral sources are bringing in the most players who spend money in our games.
To help reduce the cost of acquiring downloads, we have embeddeduse social networking mechanisms intoin our games to enable our best customers to do the marketing for us. Every time a satisfied player invites her friend to play one of our games, we have been introduced to a new potential customer without incurring a cost to entice that player to download the game. We will continue to design methods to encourage our players to invite their friends and spread the word about our games. Each time a user downloads one of our games from a friend referral without a direct expense from us, our user acquisition cost is lower, and therefore our profitability is potentially higher.
Technology and Tools
Free-to-play Revenue Model
The game industry, like many other forms of entertainment (music, TV, books, etc.) is undergoinghas undergone a major shift. The free-to-play business model has increased in appeal to game players of every genre and platform. Nowhere has this been felt more deeply than the mobile market. Free is a very powerful marketing approach that is irresistible to game players. The top grossing charts on popular mobile app stores like Apple, Google, and Amazon continually show that “free” games earn the most revenue for their developers. So, with all this “free-ness,” how does a game creator make any money?
Optimizing Customer Lifetime Value
The key business metric of any free-to-play game is the Customer Lifetime Value (CLV). A free-to-play gamer starts out as a zero revenuezero-revenue customer, but he or she may become a paying customer throughout the customer’s life of playing the game. The game creator’s business is an ongoing engagement with the game players to get them to buy things in the game, without ruining the fun. Optimizing this delicate balance is where the most revenue can be extracted.
The following graphic, developed by XEODesign identifies the approach to creating free-to-play games that are fun and engaging to consumers.
There are many techniques for generating free-to-play revenue. They range from a simple static “pay to access more levels” model to a more dynamic model where player behaviors are systematically analyzed to strategically introduce purchase options to help the user enjoy more of the game. Freeze Tag dynamically optimizes a game’s CLV by integrating two important elements: (1) Data Analytics and (2) a Dynamic Game Engine (whether it be the Freeze Tag Game Engine, Unity3D, or other native development environment).
This combination allows us to optimize the features of our games to refresh and update the content so that players are happily engaged and invite their friends to play with them. When players invite their friends, they lower our user acquisition costs. The longer and more often players come back to play, the more likely they are to spend money on virtual goods (through in-game purchases). The net result is a customer with a greater lifetime value. The happier customers are, the more they share with their friends and the more often they come back to spend money. Everything we do is geared to our players having more fun because ultimately customer fun translates into revenue.
Data Analytics
By using commercial and proprietary data analytics tools, we analyze various aspects of the game across the entire pool of players to determine what modifications can be made to the game, which allows us to: (1) make it more fun, and (2) induce a purchase.
| 7 |
| Table of Contents |
Some of the analysis we perform regularly are:
| · | Analyze the number of users that complete the tutorial process |
| · | Identify the Day 1, Day 7, and Day 30 retention metrics of how many players are returning to play |
| · | Quantify the ARPDAU (average revenue per daily active user) to determine the monetization effectiveness of each game |
| · | Determine the percentage of overall users that are converting to spenders |
| · | Quantify the ARPPDAU (average revenue per paying daily active user) |
| · | Determine what parts of the game users are playing most |
| · | Identify where in the game users are dropping out, and find out why |
| · | Average play time per day and per session |
| · | Importance of social networks, like Facebook and Twitter, to the game and how many players login to social networks |
| · | |
Identify what events most correlate with purchase events | ||
| · | Identify how many invites a user is sending out, how long it takes them to send the first invite out, and how many of those players are coming in. |
Dynamic Game Engine(s)
Over the years, we have developed a proprietary dynamic game engineengine(s) (Freeze Tag Engine)Game Engine(s)) that allows us to make changes to game play and game economies on-the-fly, in most cases, without requiring the download of another update. We also integrate several business analytics packages, and other key game management tools into our games that provide us with real time data to measure detailed player behavior, and respond directly to that behavior. Starting in 2014We continue to develop and continuing forward, we began using the Unity3D Development Engine (www.unity3d.com). We have optimized and are continuing to optimize this engine in many of the same ways thatenhance our own engine was optimized. Using Unity3D has allowed usGame Engine(s) which use web-friendly technology that can be easily ported to shift from focusthe most popular mobile platforms, iOS and Android. As our games have become more sophisticated with the need for constant data connection and several points of data required to be associated with physical locations on developing our own enginea map, we have developed server-side tools to acquiring and allocating our resources mainly on game development.
Platform Portability - Dynamic Game Engine(s)handle these requirements.
Over the years, the Freeze Tag Game Engine hasEngine(s) have allowed us to the ability to port across multiple platforms using a single codebase. We continue to look to contract with outside teams and outside contractors, allowing us to maintain a smaller internal team. In 2015, we also made the decision to switch a larger portion of our development efforts to a different engine (Unity3D was our choice), one that was widely used, and one that we could draw from a larger pool of talent to quickly develop games. Unity3D also offers platform portability, with the ability to build games that can quickly be ported to iOS, Android, Mac, PC, and HTML5 (still limited). Throughout all of 2017 and into the foreseeable future, all of our products were and will be created using the Unity game engine.
As we continue our development efforts, in 2017, our approach is to review the technical requirements of the game we want to develop, then make a decision as to which Game Engine is the most appropriate to implement for that development effort. Currently, we are using Unity3D for most ofeffort, whether that be our efforts, and for the foreseeable future, we will continue to use Unity.own proprietary game engine based on web technologies or third-party platforms such as Unity 3D.
As we make decisions about which Game Engine to employ, here are a few of the things that we look to have:
| · | A single codebase that can be easily ported to other platforms |
| · | Ability to “bolt on” other technologies and codes to easily integrate with other SDK’s, platforms and special needs |
| · | Interface easily with scalable backend databases and architecture |
| · | Easily localized into new languages |
| · | Updates can be pushed to the game allowing us to change things like: |
|
| adding new characters |
|
| changing the values in the economy |
|
| updating text |
|
| messaging users (in game) about new features |
|
| instigating a social |
| 8 |
| Table of Contents |
Integrated Feedback Mechanisms
In addition, we aim to integrate feedback mechanisms into our games to provide incentive for our players to communicate their favorite features and any technical difficulties they may be experiencing. By combining dynamic gaming technology and data analytics into one integrated business process, we can optimize the “fun” factor for our players and maximize our revenue potential.
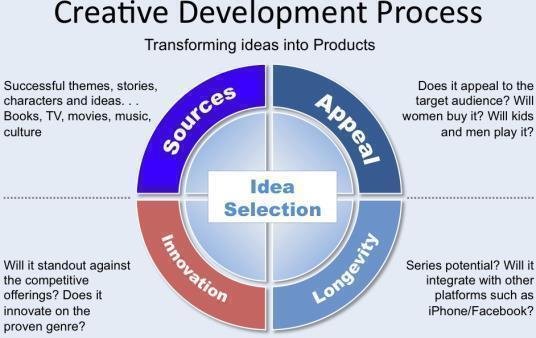
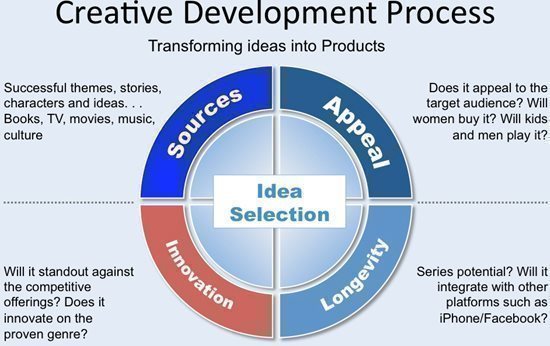
Product Development
We have learned that establishing and following a fairly rigid process is essential to producing commercially successful products, regardless of the platform. The process all begins with the creative development process. The chart below describes the approach we use to filter ideas and make final decisions on which games we will actually produce. After choosing the game that we will focus on, we write a detailed design document. A thorough design document ensures that all of those involved in the creation of the game have a common reference source throughout the production process. Also, critical to producing high quality games, a test plan accompanies every design document. Not only do we test for bugs, but also we test the game for usability. Since most casual gamers do not want to read instructions, it is critical that the finished game be easy to play by just tapping at objects on the screen.
As a developer of mobile social games, we have developed expertise in three core aspects of game production. These core competencies help to give us a competitive advantage in the industry. They are listed below, with the resulting benefit also identified.
1. | Create High Quality Products (including art and sound assets). Benefit: Provides high value to distribution partners and consumers, resulting in increased downloads and purchases. |
| 9 | |
| Table of Contents |
2. | Maintain Flexible Engineering Tools and Processes. Benefit: Decreases time-to-market delivery of products. |
|
|
3. | Minimize Risk by doing the following: 1) selecting proven genres, 2) keeping development costs low, and 3) modifying designs “on the fly” based on consumer feedback. Benefit: Increases the number of games released per year and decreases reliance on any one title’s success, ultimately improving return on investment for each game. |
How Long Does it Take to Develop a Mobile Game?
In Q3 of 2016, we began increasing the production of our mobile games by using some existing game frameworks and hiring outside developers and art resources to help with the initial development stages of building a mobile game. As a result, we launched 8 mobile games or content updates between August and December 2016:
Word Quest – August 23, 2016
Word Witch – September 27, 2016
Rank It Trivia – October 12, 2016
Zoom Trivia: Animals Edition – October 26, 2016
Toy Box Balloon Blast – November 4, 2016
Winter Words – November 15, 2016
Kitty Pawp Featuring Garfield (update) – December 4, 2016
Garfield Trivia – December 20, 2016
Shifting our strategy from traditional game development to the free-to-play model has had a dramatic impact on the way we view the development cycle. In the past, we would look at a game as having four distinct steps: design, production, test, and launch. In the free-to-play environment, the production of a game never stops. Instead of launching a finished and polished game, we introduce a beta version into test markets, capture live data, make adjustments and release updates on a regular basis. In the free-to-play business model, the players must stay engaged over long periods of time for the developer to earn revenue. The majority of players who use free-to-play games do not make any purchases, but they are an important part of the ecosystem because they do invite their friends to play, many of whom may pay for in-app purchases to further their progress or “win” against their friends. To keep these players engaged over time, we must constantly update the game, adding new features and content, providing many reasons for the faithful players to keep coming back over and over again to spend time playing our game. The more time spent, the more likely those players are to buy virtual goods, which is one of the main methods a free-to-play game earns revenue. The other method is through showing advertisements during game play which earn money for the developer based on the cost per impression or cost per install measurement technique.
From a technology standpoint, we use a development methodology referred to as “agile development,” which focuses on short development and feedback cycles, leading to shortened development times. Because of this, our costs are reduced, and the availability of an almost unlimited number of engineers and programmers makes our development time shorter than most development studios. We use technologies (such as our own Freeze Tag Game Engine and Unity3D) that allow us to build games that will run on multiple platforms, including Apple iOS, Android, Facebook, PC and other opportunities.
Augmented Reality and Geolocation Games Development
In 2016, Freeze Tag’s development team began working on a series of augmented reality/geolocation products designed to address this growing market. We signed a licensing agreement with the experienced geolocation application company Munzee (http://frzt.us/2mkXT95). Munzee has hundreds of thousands of users across the globe with over 4 million Munzees deployed and counting. Freeze Tag and Munzee are working together to develop new geolocation apps that we plan to release in 2017 and beyond.
Competition
The business of mobile games is very competitive. New products are introduced frequently and the platforms and devices change rapidly. To be successful in this crowded marketplace, we have to entice consumers to play our games based on the quality and “fun” of the experience. Players evaluate our games based on the game play, graphics quality, the music and sound effects and the efficiency and clarity of our software engineering and user interface design.
We compete with a continually increasing number of successful location-based mobile game companies, including Glu (GLUU)Niantic (makers of Pokemon Go), King.com (now a division of Activision ATVI), Kabam, Big Fish Games, DeNA, Gameloft, GREE, GungHo Online Entertainment, Nexon, Zynga (ZYNG), Rovio, Storm 8/Team Lava, SupercellGeocaching, and many others. We also compete with traditional game companies who have mobile game divisions such as Activision, Electronic Arts, Square Enix, Take Two Interactive, Ubisoft, and more.
In addition, given the open nature of the development and distribution for mobile devices, we also compete or will compete with a vast number of small companies and individuals who are able to create and launch games and other content for these devices using relatively limited resources and with relatively limited start-up time or expertise. As evidenced by the recent Flappy Bird phenomenon, it is possible for a one-man development team to build and launch a game that is able to achieve millions of downloads.
Some of our competitors and our potential competitors have one or more advantages over us, either globally or in particular geographic markets, which include:
| · | significantly greater financial resources; |
| · | greater experience with the free-to-play games and games-as-a-service (GAAS) business models and more effective game monetization; |
| · | stronger brand and consumer recognition regionally or worldwide; |
| · | greater experience and effectiveness integrating community features into their games and increasing the revenues derived from their users; |
| · | larger installed customer bases from their existing mobile games; |
| · | the capacity to leverage their marketing expenditures across a broader portfolio of mobile and non-mobile products; |
| · | larger installed customer bases from related platforms, such as console gaming or social networking websites, to which they can market and sell mobile games; |
| · | more substantial intellectual property of their own from which they can develop games without having to pay royalties; |
| · | better overall economies of scale; |
| · | greater platform-specific focus, experience and expertise; and |
| · | broader global distribution and presence. |
Intellectual Property
Our intellectual property is an essential element of our business. We use a combination of trademark, patent, copyright, trade secret and other intellectual property laws, confidentiality agreements and license agreements to protect our intellectual property. We have also registered a number of domain names, which we believe will be important to the branding and success of our games. Our employees and independent contractors are required to sign agreements acknowledging that all inventions, trade secrets, works of authorship, developments and other processes generated by them on our behalf are our property, and assigning to us any ownership that they may claim in those works. Despite our precautions, it may be possible for third parties to obtain and use without consent intellectual property that we own or license. Unauthorized use of our intellectual property by third parties, and the expenses incurred in protecting our intellectual property rights, may adversely affect our business.
| 10 |
| Table of Contents |
We intend to register ownership of software copyrights in the United States as well as seek registration of various trademarks associated with the Company’s name and mobile social games that we will develop.
Wherever possible, we own registered trademark protection for properties we develop. As the digital markets evolve, there are and will continue to be many competitors who will imitate successful game properties. We are investing in trademark protection to create game brands and protect them. For example, we have received approval from the United States Patent and Trademark officeOffice to register Party Animals®, Unsolved Mystery®, Unsolved Mystery Club®, Ancient Astronauts®, Victorian Mysteries®, Grimm Reaper® and Rocket Weasel® for all gaming platforms. Munzee Inc. has previously received approval for the trademarks Munzee®, Eventzee®, and WallaBee®. These marks will assist us in defending against copycats who may try to incorporate these terms into their game titles.
From time to time, we may encounter disputes over rights and obligations concerning intellectual property. While we believe that our product and service offerings do not infringe the intellectual property rights of any third party, we cannot be assured that we will prevail in any intellectual property dispute. If we do not prevail in such disputes, we may lose some or all of our intellectual property protection, be enjoined from further sales of the applications determined to infringe the rights of others, and/or be forced to pay substantial royalties to a third party.
Garfield Licensing Relationship
In October of 2016, we entered into a licensing agreement with one of the most well-known comic character brands in the world, Garfield the cat. Paws Inc. is the licensing company that administers and represents the intellectual property rights of Garfield, Odie, Jon, and all of the characters in the Garfield comics universe. Our non-exclusive agreement (http://frzt.us/2nmY31o) gives us the ability to include the Garfield characters in our games in exchange for a share of the revenue we generate in those specific games. By the end of 2016, we had launched two games that featured Garfield, Kitty Pawp Featuring Garfield and Garfield Trivia. We have additional titles under development and plan to announce these games during the first half of 2017.
Partner Publishing
Another initiative we began in 2015 and will continue to pursue in 2017 is to partner with developers who have completed the production of a game. Occasionally, developers complete production of a free-to-play game but lack the experience in fine-tuning the game or lack the funds to promote the game to build a user base. We believe that we can offer significant value to game developers through our experience in tuning free-to-play games to increase key performance indicators such as retention, monetization and engagement. We see partnering with game developers who lack the expertise or funds for user acquisition as an opportunity to increase our revenue and the revenue of our partners.
Business Acquisitions
In addition to our current operations, we propose to seek, investigate and, if warranted, acquire an interest in one or more businesses. However, asThe merger with Munzee Inc. is evidence of the date hereof, we have no business opportunities or ventures under contemplation for acquisition or merger.our pursuit of this strategy. We propose to investigate potential opportunities, particularly focusing upon existing privately held businesses whose owners are willing to consider merging their businesses into our company in order to establish a public trading market for their common stock, and whose managements are willing to operate the acquired businesses as divisions or subsidiaries of our company. The businesses we acquire may or may not need an injection of cash to facilitate their future operations. Presently, if we acquire any businesses, we envision such acquisition being completed either with our shares of our stock or with the assistance of a strategic funding partner. We currently do not have substantial funds, or a revenue stream, to make acquisitions utilizing our cash.
We are primarily interested in other technology opportunities, but we currently do not intend to restrict our search for investment opportunities to any particular industry or geographical location and may, therefore, engage in essentially any business. Our executive officers will review material furnished to them by the proposed merger or acquisition candidates and will ultimately decide if a merger or acquisition is in our best interests and the interests of our shareholders. We intend to source business opportunities through our officers and directors and their contacts. Those contacts include professional advisors such as attorneys and accountants, securities broker dealers, venture capitalists, members of the financial community, other businesses and others who may present solicited and unsolicited proposals. Management believes that business opportunities and ventures may become available to it due to a number of factors, including, among others: (1) management’s willingness to consider a wide variety of businesses; (2) management’s contacts and acquaintances; and (3) our flexibility with respect to the manner in which we may be able to structure, finance, merge with or acquire any business opportunity.
The analysis of new business opportunities will be undertaken by or under the supervision of our executive officers and directors. Inasmuch as we will have limited funds available to search for business opportunities and ventures, we will not be able to expend significant funds on a complete and exhaustive investigation of such business or opportunity. We will, however, investigate, to the extent believed reasonable by our management, such potential business opportunities or ventures by conducting a so-called “due diligence investigation”.
| Table of Contents |
In a so-called “due diligence investigation”,investigation,” we intend to obtain and review materials regarding the business opportunity. Typically, such materials will include information regarding a target business’ products, services, contracts, management, ownership, and financial information. In addition, we intend to cause our officers or agents to meet personally with management and key personnel of target businesses, ask questions regarding our prospects, tour facilities, and conduct other reasonable investigation of the target business to the extent of our limited financial resources and management and technical expertise.
Government Regulation
Because of our recent partnership with Paws Inc. (Garfield license), and our development of Augmented Reality / Reality/Geolocation games, and the types of data that we collect in those games, we must be more mindful of government regulations regarding the Children'sChildren’s Online Privacy Protection Act or COPPA. To protect minors on the Internet (and now mobile devices), U.S. officials passed The Children'sChildren’s Online Privacy Protection Act (COPPA). Essentially, COPPA governs online data collection of people aged 13 and younger. The COPPA rules define privacy policy requirements, data collection parameters, and the process of acquiring verifiable parental consent. In the past, we have disclosed the information that we collect in Privacy Policies, but now need to focus on getting parental approval for certain types of applications as they relate to children under the age of 13.
Our Employees
We have 1012 employees, and/with the majority of them based in either the Tustin, California area, or the McKinney, Texas area, with several in other remote locations throughout the world. Four of these are managers, one is administrative staff, and the remaining seven are artists, engineers, production staff, etc. We also work with several other independent contractors 2 of which are our officers, 7 of which are engaged in art production, publishingincluding artists, engineers, and development, and 1 of which is engaged in administrative functions. Wedesigners, on an as-needed basis.
Human Capital Resources
As noted above, we only have a teamsmall number of over 40 engineers, artists,employees. The remainder of our workforce is consultants due to the nature of our business. As it relates to our employees and developers available to us on an independent contract basis around the world.consultants that work with us:
Description of PropertyOversight and Management
Our executive officesofficers are locatedtasked with leading our organization in managing employment-related matters, including recruiting and hiring, onboarding and training, compensation planning, talent management and development. We are committed to providing team members with the training and resources necessary to continually strengthen their skills. Our executive team is responsible for periodically reviewing team member programs and initiatives, including healthcare and other benefits, as well as our management development and succession planning practices. Management periodically reports to the Board regarding our human capital measures and results that guide how we attract, retain and develop a workforce to enable our business strategies.
Diversity, Equity and Inclusion
We believe that a diverse workforce is critical to our success, and we continue to monitor and improve the application of our hiring, retention, compensation and advancement processes for women and underrepresented populations across our workforce, including persons of color, veterans and LGBTQ to enhance our inclusive and diverse culture. We continue to invest in recruiting diverse talent.
| 12 |
| Table of Contents |
Workplace Safety and Health
A vital part of our business is providing our workforce with a safe, healthy and sustainable working environment. We focus on implementing change through workforce observation and feedback channels to recognize risk and continuously improve our processes.
Description of Property
We maintain an executive office address in Tustin, California, at 18062 Irvine Blvd, Suite 103,360 E 1st Street, #450, Tustin, CA 92780, and are leased on a month-to-month basis at a costrate of $875$120 per month.year. We also maintain an office mailing address in McKinney, Texas.
Available Information
We are a fully reporting issuer, subject to the Securities Exchange Act of 1934. Our Quarterly Reports, Annual Reports, and other filings can be obtained from the SEC’s Public Reference Room at 100 F Street, NE.,NE, Washington, DC 20549, on official business days during the hours of 10 a.m. to 3 p.m. You may also obtain information on the operation of the Public Reference Room by calling the Commission at 1-800-SEC-0330. The Commission maintains an Internet site that contains reports, proxy and information statements, and other information regarding issuers that file electronically with the Commission at http://www.sec.gov.
Our Internet website address is http://www.freezetag.com/.
| Table of Contents |
As a smaller reporting company, we are not required to provide a statement of risk factors. However, we believe this information may be valuable to our shareholders for this filing.shareholders. We reserve the right to not provide risk factors in our future filings. We face risks in developing our games and products and eventually bringing them to market. The following risks are material risks that we face. If any of these risks occur, our business, our ability to achieve revenues, our operating results and our financial condition could be seriously harmed. Our primary risk factors and other considerations include:
Risk Factors Related to the Business of the Company
We have incurred losses in every year of ourfrom operations, and we may never generate substantial revenue or become profitable.
We have incurred losses in every yearcreated a net loss of our operations, including net losses of $2,129,419 and $1,870,677$205,198 for the yearsyear ended December 31, 2016 and 2015, respectively.2023. As of December 31, 2016, our accumulated2023, we had a working capital deficit was $11,113,929.of $607,650 and a total stockholders’ deficit of $232,336. We received convertible debt financing during 2016 and 2015, which in effect, saved our company, but will likely cause us to issue substantial sharesreported net cash used by operating activities of our common stock to satisfy our obligations under the notes. We expect to incur increasing operating losses$165,400 for the foreseeable future as weyear ended December 31, 2023. Management believes that by implementing cost reductions and continuing to grow our games and user base, operating cash flows will be sufficient to support our business plan. We will also continue to incur costs for development, marketingdevelop and hosting of our games. Our abilitylaunch new games to generate revenue and achieve profitability depends upon our ability, alone or with others, to complete the development and commercialization of our games. These activities are costly and require significant investment.maximize revenues. There can be no assurance that we will be successful in these efforts.
Our ability to generate revenues from any of our games will depend on a number of factors, including our ability to satisfy consumer demand, identify appropriate commercialization strategies, and successfully market and sell our games. Our ultimate success will depend on many factors, including factors outside of our control. We may never successfully commercialize or achieve and sustain market acceptance of any of our games, our game operations may not generate sufficient revenue to support our business, and we may never reach the level of sales and revenues necessary to achieve and sustain profitability.
If we are unable to meet our future capital needs, we may be required to reduce or curtail operations.
To dateSince 2017, we have relied on cash flow from operations funding from our founders, and debt financing to fund operations. We have limited cash liquidity and capital resources. Our cash on hand as of December 31, 2016,2023, was $19,934,$383,362, and our projected monthly cash flow burnexpenditures rate is approximately $55,000.$195,000. For the year ended December 31, 2016,2023, our revenues were $138,720.$2,115,547.
Our future capital requirements will depend on many factors, including our ability to market our products successfully, cash flow from operations, and competing market developments. Based on our current financial situation we may have difficulty continuing our operations at their current level, or at all, if we do not receive additional financing in the near future. Consequently, although we currently have no specific plans or arrangements for financing, we intend to raise funds through private placements, public offerings or other financings.financing. Any equity financingsfinancing would result in dilution to our then-existing stockholders. Sources of debt financing may result in higher interest expense. Any financing, if available, may be on unfavorable terms. If adequate funds are not obtained, we may be required to reduce or curtail operations. We anticipate that our existing capital resources will not be adequate to satisfy our operating expenses and capital requirements for any length of time. However, this estimate of expenses and capital requirements may prove to be inaccurate.
Debt financing is difficult to obtain.
Debt financing is difficult to obtain in the current credit markets. This difficulty may make future acquisitions either unlikely, or too difficult and expensive. This could materially adversely affect our company and the trading price of our common stock.
Raising capital by borrowing could be risky.
If we were to raise capital by borrowing to fund our operations or acquisitions, it could be risky. Borrowing through non-convertible instruments typically results in less dilution than in connection with equity financings, but it also would increase our risk, in that cash is required to service the debt, ongoing covenants are typically employed which can restrict the way in which we operate our business, and if the debt comes due either upon maturity or an event of default, we may lack the resources at that time to either pay off or refinance the debt, or if we are able to refinance, the refinancing may be on terms that are less favorable than those originally in place, and may require additional equity or quasi equity accommodations. These risks could materially adversely affect our company and the trading price of our common stock.
Our financing decisions may be made without stockholder approval.
Our financing decisions and related decisions regarding levels of debt, capitalization, distributions, acquisitions and other key operating parameters, are determined by our board of directors in its discretion, in many cases without any notice to or vote by our stockholders. This could materially adversely affect our company and the trading price of our common stock.
| 14 |
| Table of Contents |
Our independent registered public accounting firm has expressed doubts about our ability to continue as a going concern.
As a result of our financial condition, we have received a report from our independent registered public accounting firm for our financial statements for the year ended December 31, 20162023 that includes an explanatory paragraph describing the uncertainty as to our ability to continue as a going concern. In order to continue as a going concern, we must effectively balance many factors and increase our revenues to a point where we can better fund our operations from our sales and revenues. If we are not able to do this, we may not be able to continue as an operating company.
Because we face intense competition, we may not be able to operate profitably in our markets.
The market for casual games is highly competitive and is becoming more so, which could hinder our ability to successfully market our products. We may not have the resources, expertise or other competitive factors to compete successfully in the future. We expect to face additional competition from existing competitors and new market entrants in the future. Many of our competitors have greater name recognition and more established relationships in the industry than we do. As a result, these competitors may be able to:
| · | develop and expand their product offerings more rapidly; |
| · | adapt to new or emerging changes in customer requirements more quickly; |
| · | take advantage of acquisition and other opportunities more readily; and |
| · | devote greater resources to the marketing and sale of their products and adopt more aggressive pricing policies than we can. |
If we are unable to maintain brand image or product quality, our business may suffer.
Our success depends on our ability to maintain and build brand image for our existing products, new products and brand extensions. We have no assurance that our advertising, marketing and promotional programs will have the desired impact on our products’ brand image and on consumer preferences.
If we are unable to attract and retain key personnel, we may not be able to compete effectively in our market.
Our success will depend, in part, on our ability to attract and retain key management, including primarily Robert Vardeman, Jr., Craig Holland and Mick Donahoo, technical experts, and sales and marketing personnel. We attempt to enhance our management and technical expertise by recruiting qualified individuals who possess desired skills and experience in certain targeted areas. Our inability to retain employees and attract and retain sufficient additional employees, and information technology, engineering and technical support resources, could have a material adverse effect on our business, financial condition, results of operations and cash flows. The loss of key personnel could limit our ability to develop and market our products.
Because our officers and directors control our common stock vote,, they have the ability to influence matters affecting our shareholders.
As of December 31, 2016,2023 and 2022, there were 648,436,78575,056,123 outstanding shares of Common Stock, and no outstanding shares of Series A Preferred Stock (“Series A Preferred”), 2,480,482 shares of Series B Preferred Stock (“Series B Preferred”), and 4,355,000 shares of Series C Preferred Stock (“Series C Preferred”). Our officers and directors own a significant portion of the common stockour outstanding voting rights on any matters that may be brought before our shareholders for a vote. As a result, they have the ability to influence matters affecting our shareholders, including the election of our directors, the acquisition or disposition of our assets, and the future issuance of our shares. Because they control such shares, investors may find it difficult to replace our management if they disagree with the way our business is being operated. Because the influence by these insiders could result in management making decisions that are in the best interest of those insiders and not in the best interest of the investors, you may lose some or all of the value of your investment in our common stock.
| 15 |
| Table of Contents |
Our business may be negatively impacted by a slowing economy or by unfavorable economic conditions or developments in the United States and/or in other countries in which we operate.
A general slowdown in the economy in the United States or unfavorable economic conditions or other developments may result in decreased consumer demand, business disruption, foreign currency devaluation, inflation or deflation. A slowdown in the economy or unstable economic conditions in the United States or in the countries in which we operate could have an adverse impact on our business results or financial condition.
We may not be able to effectively manage our growth and operations, which could materially and adversely affect our business.
We may experience rapid growth and development in a relatively short period of time by aggressively marketing our casual games. The management of this growth will require, among other things, continued development of our financial and management controls and management information systems, stringent control of costs, increased marketing activities, the ability to attract and retain qualified management personnel and the training of new personnel. We intend to hire additional personnel in order to manage our expected growth and expansion. Failure to successfully manage our possible growth and development could have a material adverse effect on our business and the value of our common stock.
Failure to renew our existing licenses or to obtain additionalrequired licenses could harm our business.
Some of our game products are or willmay be based on or incorporate intellectual properties that we license from third parties. Our current licensesIf we are unable to use these properties do not extend beyond terms of two to three years. We may be unable toobtain or renew these licenses on terms favorable to us, or at all, and we may be unable to secure alternatives in a timely manner. We expect that licenses we obtain in the future may impose development, distribution and marketing obligations on us. If we breach our obligations, our licensors may have the right to terminate the license or change an exclusive license to a non-exclusive license.
Competition for licenses may also increase the advances, guarantees and royalties that we must pay to the licensor, which could significantly increase our costs. Failure to maintain our existing licenses or obtain additional licenses with significant commercial value could impair our ability to introduce new applications or continue our current game products and applications, which could materially harm our business.
| Table of Contents |
If we fail to develop and introduce new casual games and other applications that achieve market acceptance, our sales could suffer.
Our business depends on providing casual games and applications that consumers initially want to download to their devices and then make subsequent in-game purchases. We must invest significant resources in research and development to enhance our offering of casual games and other applications and introduce new games and other applications. Our operating results would suffer if our games and other applications are not responsive to the preferences of our customers or are not effectively brought to market.
The planned timing or introduction of new casual games is subject to risks and uncertainties. Unexpected technical, operational, deployment, distribution or other problems could delay or prevent the introduction of new casual games, which could result in a loss of, or delay in, revenues or damage to our reputation and brand. If any of our applications is introduced with defects, errors or failures, we could experience decreased sales, loss of customers and damage to our reputation and brand. In addition, new applications may not achieve sufficient market acceptance to offset the costs of development. Our success depends, in part, on unpredictable and volatile factors beyond our control, including customer preferences, competing applications and the availability of other entertainment activities. A shift in Internet or mobile device usage or the entertainment preferences of our customers could cause a decline in our applications'applications’ popularity that could materially reduce our revenues and harm our business.
We intend to continuously develop and introduce new games and new game mechanics and features in our existing games, and other applications for use on next-generation Internet and mobile devices. We must make product development decisions and commit significant resources well in advance of the anticipated introduction of new mobile devices. New mobile devices for which we will develop applications may be delayed, may not be commercially successful, may have a shorter life cycle than anticipated or may not be adequately promoted by wireless carriers or the manufacturer. If the mobile devices for which we are developing games and other applications are not released when expected or do not achieve broad market penetration, our potential revenues will be limited and our business will suffer.
If our independent, third-party developers cease development of new applications for us and we are unable to find comparable replacements, our competitive position may be adversely impacted.
We rely on independent third-party developers to develop some of our game products which subjects us to the following risks:
| · | key developers who work for us may choose to work for or be acquired by our competitors; |
| · | developers currently under contract may try to renegotiate our agreements with them on terms less favorable to us; and |
| · | our developers may be unable or unwilling to allocate sufficient resources to complete our applications on a timely or satisfactory basis or at all. |
If our developers terminate their relationships with us or negotiate agreements with terms less favorable to us, we may have to increase our internal development staff, which would be a time consuming and potentially costly process. If we are unable to increase our internal development staff in a cost-effective manner or if our current internal development staff fails to create successful applications, our earnings could be materially diminished.
In addition, although we require our third-party developers to sign agreements acknowledging that all inventions, trade secrets, works of authorship, development and other processes generated by them are our property and to assign to us any ownership they may have in those works, it may still be possible for third parties to obtain and use our intellectual properties without our consent.
| Table of Contents |
Our industry is experiencing consolidation that may cause us to lose key relationships and intensify competition.
The Internet and media distribution industries are undergoing substantial change, which has resulted in increasing consolidation and formation of strategic relationships. We expect this consolidation and strategic partnering to continue. Acquisitions or other consolidating transactions could harm us in a number of ways, including:
| · | we could lose strategic relationships if our strategic partners are acquired by or enter into relationships with a competitor (which could cause us to lose access to distribution, content, technology and other resources); |
| · | we could lose customers if competitors or users of competing technologies consolidate with our current or potential customers; and |
| · | our current competitors could become stronger, or new competitors could form, from consolidations. |
Any of these events could put us at a competitive disadvantage, which could cause us to lose customers, revenue and market share. Consolidation could also force us to expend greater resources to meet new or additional competitive threats, which could also harm our operating results.
We rely on the continued reliable operation of third parties’ systems and networks and, if these systems and networks fail to operate or operate poorly, our business and operating results will be harmed.
Our operations are in part dependent upon the continued reliable operation of the information systems and networks of third parties. If these third parties do not provide reliable operation, our ability to service our customers will be impaired and our business, reputation and operating results could be harmed.
The Internet and our network are subject to security risks that could harm our business and reputation and expose us to litigation or liability.
Online commerce and communications depend on the ability to transmit confidential information and licensed intellectual property securely over private and public networks. Any compromise of our ability to transmit and store such information and data securely, and any costs associated with preventing or eliminating such problems, could damage our business, hurt our ability to distribute products and services and collect revenue, threaten the proprietary or confidential nature of our technology, harm our reputation, and expose us to litigation or liability. We also may be required to expend significant capital or other resources to protect against the threat of security breaches or hacker attacks or to alleviate problems caused by such breaches or attacks. Any successful attack or breach of our security could hurt consumer demand for our products and services, expose us to consumer class action lawsuits and harm our business.
We may be unable to adequately protect our proprietary rights.
Our ability to compete partly depends on the superiority, uniqueness and value of our intellectual property and technology, including both internally developed technology and technology licensed from third parties. To the extent we are able to do so, in order to protect our proprietary rights, we will rely on a combination of trademark, copyright and trade secret laws, confidentiality agreements with our employees and third parties, and protective contractual provisions and licensing agreement. Despite these efforts, any of the following occurrences may reduce the value of our intellectual property:
| · | Our applications for trademarks and copyrights relating to our business may not be granted and, if granted, may be challenged or invalidated; |
| · | Issued trademarks and registered copyrights may not provide us with any competitive advantages; |
| · | Our efforts to protect our intellectual property rights may not be effective in preventing misappropriation of our technology; |
| · | Our efforts may not prevent the development and design by others of products or technologies similar to or competitive with, or superior to those we develop; |
| · | Another party may obtain a blocking patent and we would need to either obtain a license or design around the patent in order to continue to offer the contested feature or service in our products; or |
| · | We may not be able to afford to pay the costs associated with protecting our intellectual property rights. |
We may be forced to litigate to defend our intellectual property rights, or to defend against claims by third parties against us relating to intellectual property rights.
We may be forced to litigate to enforce or defend our intellectual property rights, to protect our trade secrets or to determine the validity and scope of other parties’ proprietary rights. Any such litigation could be very costly and could distract our management from focusing on operating our business. The existence and/or outcome of any such litigation could harm our business.
Interpretation of existing laws that did not originally contemplate the Internet could harm our business and operating results.
The application of existing laws governing issues such as property ownership, copyright and other intellectual property issues to the Internet is not clear. Many of these laws were adopted before the advent of the Internet and do not address the unique issues associated with the Internet and related technologies. In many cases, the relationship of these laws to the Internet has not yet been interpreted. New interpretations of existing laws may increase our costs, require us to change business practices or otherwise harm our business.
It is not yet clear how laws designed to protect children that use the Internet may be interpreted, and such laws may apply to our business in ways that may harm our business.
The Child Online Protection Act and the Child Online Privacy Protection Act impose civil and criminal penalties on persons distributing material harmful to minors (e.g., obscene material) over the Internet to persons under the age of 17, or collecting personal information from children under the age of 13. We do not knowingly distribute harmful materials to minors or collect personal information from children under the age of 13. The mannerCOPPA rules define privacy policy requirements, data collection parameters, and the process of acquiring verifiable parental consent. In the past, we have disclosed the information that we collect in which these Acts mayPrivacy Policies, but now need to focus on getting parental approval for certain types of applications as they relate to children under the age of 13. Although we have verification procedures in place to ensure we do not violate COPPA, in the event those safeguards fail, we could be interpretedsubject to fines and/or lawsuits, and enforced cannot be fully determined, and future legislation similar to these Acts could subject us to potential liability if we were deemed to be non-compliant with such rules and regulations, which in turn could harm our business.business in other ways.
We may be subject to market risk and legal liability in connection with the data collection capabilities of our products and services.
Many of our products are interactive Internet applications that by their very nature require communication between a client and server to operate. To provide better consumer experiences and to operate effectively, our products send information to our servers. Many of the services we provide also require that a user provide certain information to us. We post an extensive privacy policy concerning the collection, use and disclosure of user data involved in interactions between our client and server products.
Our planned venture into augmented reality and geolocation games could subject us to greater liability risks from our users and third parties.
As noted herein, we are currently planning to develop a number of augmented reality and geolocation games. Such games place characters on a user’s mobile device in real world surroundings and have the user interacting with the game while on the move in real life. Augmented reality games developed by some of our competitors have led users into situations that may not be ideal for the user, such as near roads, bodies of water and/or possibly on private property. Although we will use our best efforts to develop our games to minimize locations that could be dangerous for our users, there is a chance that they could wander into a dangerous situation or onto a third parties’ private property, potentially harming themselves or others. Although we will have appropriate disclaimers and disclosures on our games, any such harmful events could expose us to potential lawsuits and/or liability.
| Table of Contents |
We are governed by the Children’s Online Privacy Protection Act (COPPA) and if we fail to comply with the COPPA requirements we could be subject to fines and /or lawsuits.
The Children’s Online Privacy Protection Act (COPPA) was enacted to ensure young children are protected from the potential risks of certain forms of online entertainment, including mobile app games. Under COPPA any child under the age of 13 must have a consenting adult in order to access and play online games and other online activities. Although we have verification procedures in place to ensure we do not violate COPPA, in the event those safeguards fail, we could be subject to fines and/or lawsuits.
Risk Factors Relating to Future Acquisitions
We may not be able to identify, negotiate, finance or close future acquisitions.
A significant component of our growth strategy focuses on acquiring additional companies or assets. We may not, however, be able to identify, audit, or acquire companies or assets on acceptable terms, if at all. Additionally, we may need to finance all or a portion of the purchase price for an acquisition by incurring indebtedness. There can be no assurance that we will be able to obtain financing on terms that are favorable, if at all, which will limit our ability to acquire additional companies or assets in the future. Failure to acquire additional companies or assets on acceptable terms, if at all, would have a material adverse effect on our ability to increase assets, revenues and net income and on the trading price of our common Stock.
We may acquire businesses without any apparent synergies with our casual games related operations.
In an effort to diversify our sources of revenue and profits, we may decide to acquire businesses without any apparent synergies with our casual games related operations. For example, we believe that the acquisition of technologies unrelated to games and leisure may be an important way for us to enhance our stockholder value. Notwithstanding the critical importance of diversification, some members of the investment community and research analysts would prefer that micro-cap or small-cap companies restrict the scope of their activity to a single line of business, and may not be willing to make an investment in, or recommend an investment in, a micro-cap or small-cap company that undertakes multiple lines of business. This situation could materially adversely impact our company and the trading price of our stock.
We may not be able to properly manage multiple businesses.
We may not be able to properly manage multiple businesses. Managing multiple businesses would be more complicated than managing a single line of business, and would require that we hire and manage executives with experience and expertise in different fields. We can provide no assurance that we will be able to do so successfully. A failure to properly manage multiple businesses could materially adversely affect our company and the trading price of our stock.
We may not be able to successfully integrate new acquisitions.
Even if we are able to acquire additional companies or assets, we may not be able to successfully integrate those companies or assets. For example, we may need to integrate widely dispersed operations with different corporate cultures, operating margins, competitive environments, computer systems, compensation schemes, business plans and growth potential requiring significant management time and attention. In addition, the successful integration of any companies we acquire will depend in large part on the retention of personnel critical to our combined business operations due to, for example, unique technical skills or management expertise. We may be unable to retain existing management, finance, engineering, sales, customer support, and operations personnel that are critical to the success of the integrated company, resulting in disruption of operations, loss of key information, expertise or know-how, unanticipated additional recruitment and training costs, and otherwise diminishing anticipated benefits of these acquisitions, including loss of revenue and profitability. Failure to successfully integrate acquired businesses could have a material adverse effect on our company and the trading price of our stock.
| Table of Contents |
Our acquisitions of businesses may be extremely risky and we could lose all of our investments.
We may invest in software companies, other technology businesses, or other risky industries. An investment in these companies may be extremely risky because, among other things, the companies we are likely to focus on: (1) typically have limited operating histories, narrower product lines and smaller market shares than larger businesses, which tend to render them more vulnerable to competitors’ actions and market conditions, as well as general economic downturns; (2) tend to be privately-owned and generally have little publicly available information and, as a result, we may not learn all of the material information we need to know regarding these businesses; (3) are more likely to depend on the management talents and efforts of a small group of people; and, as a result, the death, disability, resignation or termination of one or more of these people could have an adverse impact on the operations of any business that we may acquire; (4) may have less predicablepredictable operating results; (5) may from time to time be parties to litigation; (6) may be engaged in rapidly changing businesses with products subject to a substantial risk of obsolescence; and (7) may require substantial additional capital to support their operations, finance expansion or maintain their competitive position. Our failure to make acquisitions efficiently and profitably could have a material adverse effect on our business, results of operations, financial condition and the trading price of our stock.
Future acquisitions may fail to perform as expected.
Future acquisitions may fail to perform as expected. We may overestimate cash flow, underestimate costs, or fail to understand risks. This could materially adversely affect our company and the trading price of our Stock.
Competition may result in overpaying for acquisitions.
Other investors with significant capital may compete with us for attractive investment opportunities. These competitors may include publicly traded companies, private equity firms, privately held buyers, individual investors, and other types of investors. Such competition may increase the price of acquisitions, or otherwise adversely affect the terms and conditions of acquisitions. This could materially adversely affect our company and the trading price of our stock.
We may have insufficient resources to cover our operating expenses and the expenses of raising money and consummating acquisitions.
We have limited cash to cover our operating expenses and to cover the expenses incurred in connection with money raising and a business combination. It is possible that we could incur substantial costs in connection with money raising or a business combination. If we do not have sufficient proceeds available to cover our expenses, we may be forced to obtain additional financing, either from our management or third parties. We may not be able to obtain additional financing on acceptable terms, if at all, and neither our management nor any third party is obligated to provide any financing. This could have a negative impact on our company and our stock price.
The nature of our proposed future operations is speculative and will depend to a great extent on the businesses which we acquire.
While management typically intends to seek a merger or acquisition of privately held entities with established operating histories, there can be no assurance that we will be successful in locating an acquisition candidate meeting such criteria. In the event we complete a merger or acquisition transaction, of which there can be no assurance, our success if any will be dependent upon the operations, financial condition and management of the acquired company, and upon numerous other factors beyond our control. If the operations, financial condition or management of the acquired company were to be disrupted or otherwise negatively impacted following an acquisition, our company and our stock price would be negatively impacted.
| Table of Contents |
We may make actions that will not require our stockholders’ approval.
The terms and conditions of any acquisition could require us to take actions that would not require stockholder approval. In order to acquire certain companies or assets, we may issue additional shares of common or preferred stock, borrow money or issue debt instruments including debt convertible into capital stock. Not all of these actions would require our stockholders’ approval even if these actions dilute our shareholders’ economic or voting interest.
Our investigation of potential acquisitions will be limited.
Our analysis of new business opportunities will be undertaken by or under the supervision of our executive officers and directors. Inasmuch as we will have limited funds available to search for business opportunities and ventures, we will not be able to expend significant funds on a complete and exhaustive investigation of such business or opportunity. We will, however, investigate, to the extent believed reasonable by our management, such potential business opportunities or ventures by conducting a so-called “due diligence investigation”.investigation.” In a so-called “due diligence investigation”,investigation,” we intend to obtain and review materials regarding the business opportunity. Typically, such materials will include information regarding a target business’ products, services, contracts, management, ownership, and financial information. In addition, we intend to cause our officers or agents to meet personally with management and key personnel of target businesses, ask questions regarding the company’s prospects, tour facilities, and conduct other reasonable investigation of the target business to the extent of our limited financial resources and management and technical expertise. Any failure of our typical “due diligence investigation” to uncover issues and problems relating to potential acquisition candidates could materially adversely affect our company and the trading price of our stock.
We will have only a limited ability to evaluate the directors and management of potential acquisitions.
We may make a determination that our current directors and officers should not remain, or should reduce their roles, following money raising or a business combination, based on an assessment of the experience and skill sets of new directors and officers and the management of target businesses. We cannot assure you that our assessment of these individuals will prove to be correct. This could have a negative impact on our company and our stock price.
We will be dependent on outside advisors to assist us.
In order to supplement the business experience of management, we may employ accountants, technical experts, appraisers, attorneys or other consultants or advisors. The selection of any such advisors will be made by management and without any control from shareholders. Additionally, it is anticipated that such persons may be engaged by us on an independent basis without a continuing fiduciary or other obligation to us.
We may be unable to protect or enforce the intellectual property rights of any target business that we acquire or the target business may become subject to claims of intellectual property infringement.
After completing a business combination, theprocurementtheprocurement and protection of trademarks, copyrights, patents, domain names, and trade secrets may be critical to our success.Wesuccess.We will likely rely on a combination of copyright, trademark, trade secret laws and contractual restrictions to protect any proprietary technology and rights that we may acquire. Despite our efforts to protect those proprietary technology and rights, we may not be able to prevent misappropriation of those proprietary rights or deter independent development of technologies that compete with the business we acquire. Litigation may be necessary in the future to enforce our intellectual property rights, to protect our trade secrets, or to determine the validity and scope of the proprietary rights of others. It is also possible that third parties may claim we have infringed their patent, trademark, copyright or other proprietary rights. Claims or litigation, with or without merit, could result in substantial costs and diversions of resources, either of which could have an adverse effect on our competitive position and business. Further, depending on the target business or businesses that we acquire, it is likely that we will have to protect trademarks, patents, and domain names in an increasing number of jurisdictions, a process that is expensive and may not be successful in every location. These factors could negatively impact our company and the trading price of our stock.
| Table of Contents |
Integrating acquired businesses may divert our management’s attention away from our day-to-day operations and harm our business.
Acquisitions generally involve significant risks, including the risk of overvaluation of potential acquisitions and risks in regard to the assimilation of personnel, operations, products, services, technologies, and corporate culture of acquired companies. Dealing with these risks may place a significant burden on our management and other internal resources. This could materially adversely affect our business and the trading price of our stock.
We may fail to manage our growth effectively.
Future growth through acquisitions and organic expansion would place a significant strain on our managerial, operational, technical, training, systems and financial resources. We can give you no assurance that we will be able to manage our expanding operations properly or cost effectively. A failure to properly and cost-effectively manage our expansion could materially adversely affect our company and the trading price of our stock.
The management of companies we acquire may lose their enthusiasm or entrepreneurship after the sale of their businesses.
We can give no assurance that the management of future companies we acquire will have the same level of enthusiasm for the operation of their businesses following their acquisition by us, or if they cease performing services for the acquired businesses that we will be able to install replacement management with the same skill sets and determination. There also is always a risk that management will attempt to reenter the market and possibly seek to recruit some of the former employees of the business, who may continue to be key employees of ours. This could materially adversely affect our business and the trading price of our Stock.stock.
If we are deemed to be an investment company, we may be required to institute burdensome compliance requirements and our activities may be restricted, which may make it difficult for us to complete a business combination.
We believe we will not be subject to regulation undertheunderthe Investment Company Act insofar as we will not be engaged in the business of investing or trading in securities. However, in the event that we engage in businesscombinationsbusinesscombinations which result in us holding passive investment interests in a number of entities, we may become subject to regulation under the Investment Company Act. In such event, we may be required to register as an investment company and may incur significant registration and compliance costs. We have obtained no formal determination from the government as to our status under the Investment Company Act, and consequently, any violation of such Act might subject us to material adverse consequences.
Risks Related To Our Common Stock
There is a limited public trading market for our common stock, which may impede our shareholders’ ability to sell our shares.
Currently, there is a limited trading market for our common stock, and there can be no assurance that a more robust market will be achieved in the future. There can be no assurance that an investor will be able to liquidate his or her investment without considerable delay, if at all. If the trading market for our common stock does increase, the price may be highly volatile. Factors discussed herein may have a significant impact on the market price of our shares. Moreover, due to the relatively low price of our securities, many brokerage firms may not effectaffect transactions in our common stock if a market is established. Rules enacted by the SEC increase the likelihood that most brokerage firms will not participate in a potential future market for our common stock. Those rules require, as a condition to brokers effecting transactions in certain defined securities (unless such transaction is subject to one or more exemptions), that the broker obtain from its customer or client a written representation concerning the customer’s financial situation, investment experience and investment objectives. Compliance with these procedures tends to discourage most brokerage firms from participating in the market for certain low-priced securities.
| 23 |
| Table of Contents |
If we are unable to pay the costs associated with being a public, reporting company, we may not be able to continue trading on the OTC Markets and/or we may be forced to discontinue operations.
We have significant costs associated with being a public, reporting company, which adds to the substantial doubt about our ability to continue trading on the OTC Markets and/or continue as a going concern. These costs include compliance with the Sarbanes-Oxley Act of 2002, which will beare difficult given the limited size of our management, and we will have to rely on outside consultants. Accounting controls, in particular, are difficult and can be expensive to comply with.
Our ability to continue trading on the OTC Markets and/or continue as a going concern will depend on positive cash flow, if any, from future operations and on our ability to raise additional funds through equity or debt financing. If we are unable to achieve the necessary product sales or raise or obtain needed funding to cover the costs of operating as a public, reporting company, our common stock may be deleted from the OTC Markets and/or we may be forced to discontinue operations.
We do not intend to pay dividends in the foreseeable future.
We do not intend to pay any dividends in the foreseeable future. We do not plan on making any cash distributions in the manner of a dividend or otherwise. Our Board presently intends to follow a policy of retaining earnings, if any.
We have the right to issue additional shares of common stock and preferred stock without consent of stockholders. This would have the effect of diluting investors’ ownership and could decrease the value of their investment.
We have additional authorized, but unissued shares of our common stock that may be issued by us for any purpose without the consent or vote of our stockholders that would dilute stockholders’ percentage ownership of our company.
In addition, our certificate of incorporation authorizes the issuance of shares of preferred stock, the rights, preferences, designations and limitations of which may be set by the Board of Directors. Our certificate of incorporation has authorized issuance of up to 10,000,000 shares of preferred stock in the discretion of our Board. The shares of authorized but undesignated preferred stock may be issued upon filing of an amended certificate of incorporation and the payment of required fees; no further stockholder action is required. In addition, other shares of preferred stock could be designated and, if issued, the rights, preferences, designations and limitations of such preferred stock would be set by our Board and could operate to the disadvantage of the outstanding common stock. Such terms could include, among others, preferences as to dividends, voting, and distributions on liquidation.
As of the end of the period covered by this report, we have current2,480,482 shares of our Series B Preferred Stock outstanding, non-affiliate debt obligations totaling approximately $1,952,734, which are convertible into an aggregate of 124,024,100 shares of our common stock. In the event the holder(s) convert such shares of such instruments convert amounts owed to thempreferred stock into common stock and/or we default on the convertible instruments, significant dilution could occur to the other holders of our common stock and could significantly decrease the value of our common stock.
As of the end of the period covered by this report, we have outstanding non-affiliate debt obligations totaling approximately $1,952,734, net2,480,482 shares of discount of $239,402,our Series B preferred stock outstanding, which are convertible into an aggregate of 124,024,100 shares of our common stock. Although under the terms of the agreement,agreements with the holders of our Series B preferred stock, the number of shares of common stock issuable upon the conversion of any portiontheir shares of the notes,preferred stock cannot exceed an amount that would cause the beneficial ownership of the debt holder and its affiliates to own more than 4.99% of our outstanding shares of Common Stock,common stock, the issuance of almost 5% of our outstanding common stock in a short period time, possibly happening multiple times, would cause substantial dilution to our shareholders. In the event the holder(s) of such instrumentspreferred stock convert amounts owed to themshares of their preferred stock into common stock and/or we default on the convertible instruments, significant dilution could occur to the other holders of our common stock and could significantly decrease the value of our common stock. We evaluated the convertible notes and determined that thealso have 4,355,000 shares issuable pursuant to the conversion option were determinate due to the Fixed Conversion Price and, as such, do not constitute a derivative liability as we have obtained authorization from a majority of our shareholders such that should conversion occur at the Fixed Conversion Price the appropriate numberSeries C Preferred Stock outstanding which is convertible into 217,750,000 shares of shares will be made available or issuable for settlement to occur.our common stock.
| 24 |
| Table of Contents |
Sales of our stock could cause the trading price of our stock to fall.
Sellers of our stock might include convertible debt securities as discussed above, our existing stockholders who have held our stock for years, persons and entities who acquire our stock as consideration for services they provide to our company, or our directors, officers or employees who might receive and then exercise stock options and simultaneously sell our stock. Since the trading volume of our stock is typically very low, any sales or attempts to sell our stock, or the perception that sales or attempts to sell our stock could occur, could adversely affect the trading price of our stock.
Our common stock is governed under The Securities Enforcement and Penny Stock Reform Act of 1990.
The Securities Enforcement and Penny Stock Reform Act of 1990 requires additional disclosure relating to the market for penny stocks in connection with trades in any stock defined as a penny stock. The Commission has adopted regulations that generally define a penny stock to be any equity security that has a market price of less than $5.00 per share, subject to certain exceptions. Such exceptions include any equity security listed on NASDAQ and any equity security issued by an issuer that has (i) net tangible assets of at least $2,000,000, if such issuer has been in continuous operation for three years, (ii) net tangible assets of at least $5,000,000, if such issuer has been in continuous operation for less than three years, or (iii) average annual revenue of at least $6,000,000, if such issuer has been in continuous operation for less than three years. Unless an exception is available, the regulations require the delivery, prior to any transaction involving a penny stock, of a disclosure schedule explaining the penny stock market and the risks associated therewith.
ITEM 1B –- UNRESOLVED STAFF COMMENTS
This Item is not applicable to us as we are not an accelerated filer, a large accelerated filer, or a well-seasoned issuer; however, we have not received written comments from the Commission staff regarding our periodic or current reports under the Securities Exchange Act of 1934 within the last 180 days before the end of our last fiscal year.
ITEM 1C – CYBERSECURITY
We have certain processes for assessing, identifying, and managing cybersecurity risks, which are built into our overall information technology function and are designed to help protect our information assets and operations from internal and external cyber threats, protect information from unauthorized access or attack, as well as secure our network and systems. Such processes include physical, procedural, and technical safeguards, tests on our systems, and routine review of our policies and procedures to identify risks and improve our practices. We engage certain external parties, including a third party company, Mission Cloud, to enhance our cybersecurity oversight.
Our Board of Directors provides direct oversight over cybersecurity risk and provides periodic updates to management regarding such oversight. The Board of Directors receives periodic updates from management regarding cybersecurity matters and is notified between such updates regarding significant new cybersecurity threats or incidents.
Mission Cloud assists us in the operational oversight of company-wide cybersecurity strategy, policy, standards, and processes related to our Amazon Web Services infrastructure, and we leverage that information to assess and help prepare us and our employees to address cybersecurity risks.
We are working to continue to improve our overall cybersecurity approach and plan to take any necessary steps to protect our information assets and operations from internal and external cyber threats in the event any such steps are recommended by Mission Cloud or other 3rd parties that we may engage to assist.
We do not believe that there are currently any known risks from cybersecurity threats that are reasonably likely to materially affect us or our business strategy, results of operations, or financial condition.
ITEM 2 - PROPERTIES
We maintain an executive offices are locatedoffice address in Tustin, California, at 18062 Irvine Blvd, Suite 103,360 E 1st Street, #450, Tustin, CA 92780.92780, at a rate of $120 per year. We currently lease approximately 900 sq. ft. ofalso maintain an office space on a month-to-month basis for $0.97 sq/ft.mailing address in McKinney, Texas.
We are not a party to or otherwise involved in any legal proceedings.
In the ordinary course of business, we are from time to time involved in various pending or threatened legal actions. The litigation process is inherently uncertain and it is possible that the resolution of such matters might have a material adverse effect upon our financial condition and/or results of operations. However, in the opinion of our management, other than as set forth herein, matters currently pending or threatened against us are not expected to have a material adverse effect on our financial position or results of operations.
ITEM 4 –- MINE SAFETY DISCLOSURES
There is no information required to be disclosed by this Item.
| Table of Contents |
Market Information
Our common stock is quoted for trading on the OTC Markets / OTC Pink tier. Our current trading symbol is “FRZT.” Since our stock has been quoted, there has been limited volume.
The following table sets forth the high and low bid information for each quarter within the fiscal years ended December 31, 20162023 and 2015, as provided by the Nasdaq Stock Markets, Inc. The information reflects prices between dealers, and does not include retail markup, markdown, or commission, and may not represent actual transactions.2022.
Fiscal Year Ended |
|
| Bid Prices |
| ||||||
December 31, |
| Period |
| High |
|
| Low |
| ||
|
|
|
|
|
|
|
|
| ||
2023 |
| First Quarter |
| $ | 0.08 |
|
| $ | 0.01 |
|
|
| Second Quarter |
| $ | 0.07 |
|
| $ | 0.01 |
|
|
| Third Quarter |
| $ | 0.02 |
| $ | 0.01 |
| |
|
| Fourth Quarter |
| $ | 0.04 |
|
| $ | 0.01 |
|
|
|
|
|
|
|
|
|
|
|
|
2022 |
| First Quarter |
| $ | 0.04 |
|
| $ | 0.02 |
|
|
| Second Quarter |
| $ | 0.04 |
|
| $ | 0.02 |
|
|
| Third Quarter |
| $ | 0.02 |
|
| $ | 0.01 |
|
|
| Fourth Quarter |
| $ | 0.03 |
|
| $ | 0.02 |
|
Bid Prices Fiscal Year Ended December 31, Period High Low 2015 First Quarter Second Quarter Third Quarter Fourth Quarter 2016 First Quarter Second Quarter Third Quarter Fourth Quarter $ 0.0150 $ 0.0018 $ 0.0100 $ 0.0017 $ 0.0045 $ 0.0010 $ 0.0016 $ 0.0007 $ 0.0021 $ 0.0007 $ 0.0018 $ 0.0006 $ 0.0012 $ 0.0001 $ 0.0006 $ 0.0001
The Securities Enforcement and Penny Stock Reform Act of 1990 requires additional disclosure relating to the market for penny stocks in connection with trades in any stock defined as a penny stock. The Commission has adopted regulations that generally define a penny stock to be any equity security that has a market price of less than $5.00 per share, subject to a few exceptions which we do not meet. Unless an exception is available, the regulations require the delivery, prior to any transaction involving a penny stock, of a disclosure schedule explaining the penny stock market and the risks associated therewith.
Holders
As of December 31, 2016,2023, there were 648,436,78575,056,123 shares of our common stock outstanding held by approximately 123128 holders of record of our common stock.stock (not including those held by Cede & Co – The Depository Trust Company). Aggregate market value of the voting stock held by non-affiliates as of June 30, 2016: $167,7422023: $443,144 based on the closing price of $0.001$0.014 of our common stock on June 30, 20162023 of our common stock. The voting stock held by non-affiliates on that date consisted of 167,742,49231,653,123 shares of common stock.
| Table of Contents |
Dividends
We have not declared or paid a cash dividend on our capital stock in our last two fiscal years and we do not expect to pay cash dividends on our common stock in the foreseeable future. We currently intend to retain our earnings, if any, for use in our business. Any dividends declared in the future will be at the discretion of our Board of Directors and subject to any restrictions that may be imposed by our lenders.
Securities Authorized for Issuance Under Equity Compensation Plans
There are currently 560,000 options outstanding, to purchase 7,762,821 shares of our common stock.
Non-Qualified Stock Option Plan
On December 4, 2017, our Board of Directors approved the Freeze Tag, Inc. 2017 Non-Qualified Stock Option Plan (the “Plan”). Under the Plan, our Board of Directors may issue options to purchase up to an aggregate of 10,000,000 shares of common stock to individuals, including, but not limited to, our Board of Directors and/or our executive management. On December 5, 2017, our Board of Directors granted options to purchase a total of 1,512,821 shares of our common stock. On December 18, 2019, our Board of Directors granted additional options to purchase 6,250,000 shares of our common stock. 3,750,000 options to purchase stock were issued to Mick Donahoo, our CFO, at an exercise price of $.02 with a ten-year expiration. The remaining 2,500,000 shares were issued to employees or independent consultants at an exercise price of $0.2 with a ten-year expiration. The issuances were exempt from registration pursuant to Section 4(a)(2) of the Securities Act of 1933, since the recipients are our executive management team, employees, or independent consultants, and they are either accredited or sophisticated investors, and familiar with our operations.
On March 20, 2006, our Board of Directors and shareholders approved the Freeze Tag, Inc. 2006 Stock Plan (the “2006 Plan”). The 2006 Plan terminated during the year ended December 31, 2016. As of December 31, 2016,2023, there were 560,000no options outstanding to purchase shares of common stock, and no shares of common stock had been issued pursuant to stock purchase rights under the 2006 Plan.
As of December 31, 2016,2023, we had the following options outstanding:
Plan Category |
| Number of Securities to be issued upon exercise of outstanding options, warrants and rights |
|
| Weighted-average exercise price of outstanding options, warrants and rights |
|
| Number of securities remaining available for future issuance under equity compensation plans (excluding securities reflected in column (a)) |
|
| Number of Securities to be issued upon exercise of outstanding options, warrants and rights |
| Weighted-average exercise price of outstanding options, warrants and rights |
| Number of securities remaining available for future issuance under equity compensation plans (excluding securities reflected in column (a)) |
| ||||||||
|
| (a) |
| (b) |
| (c) |
|
| (a) |
| (b) |
| (c) |
| ||||||||||
Equity compensation plans approved by security holders |
| 560,000 |
| $ | 0.10 |
| - |
| ||||||||||||||||
Equity compensation plans approved by security holders (2006 plan) |
| - |
| - |
| - |
| |||||||||||||||||
Equity compensation plans approved by security holders (2017 plan) |
| 7,762,821 |
| $ | 0.024 |
| 2,237,179 |
| ||||||||||||||||
Equity compensation plans not approved by security holders |
| - |
| - |
| - |
|
| - |
| - |
| - |
| ||||||||||
Total |
| 560,000 |
| $ | 0.10 |
| - |
|
| 7,762,821 |
| $ | 0.024 |
| 2,237,179 |
| ||||||||
| Table of Contents |
Recent Issuance of Unregistered Securities
Unless otherwise noted,We issued no unregistered securities during the use of proceeds for the following sales of equity securities was to sustain our business operations. During the quarterthree months ended December 31, 2016, we issued a total of 179,040,145 common shares to an institutional investor for conversion of $10,028 convertible debt principal, $2,389 accrued interest payable and $33,839 derivative liabilities.2023
All of the issuances of securities described above were restricted share issuances and deemed to be exempt from registration in reliance on Rule 506 of Regulation D and/or Section 4(a)(2) of the Securities Act as transactions by an issuer not involving a public offering. Many investors represented that they were accredited investors, as defined in Rule 501 of Regulation D and, there was no general solicitation or general advertising used to market the securities. In most cases, we made available to each investor with disclosure of all aspects of our business, including providing the investor with press releases, access to our auditors, and other financial, business, and corporate information. All securities issued were restricted with an appropriate restrictive legend on certificates issued stating that the securities have not been registered under the Securities Act and cannot be sold or otherwise transferred without an effective registration or an exemption therefrom.
If our stock is listed on an exchange we will be subject to the Securities Enforcement and Penny Stock Reform Act of 1990 requires additional disclosure relating to the market for penny stocks in connection with trades in any stock defined as a penny stock. The Commission has adopted regulations that generally define a penny stock to be any equity security that has a market price of less than $5.00 per share, subject to a few exceptions which we do not meet. Unless an exception is available, the regulations require the delivery, prior to any transaction involving a penny stock, of a disclosure schedule explaining the penny stock market and the risks associated therewith.
ITEM 6 – SELECTED FINANCIAL DATA
As a smaller reporting company, we are not required to provide the information required by this Item.
ITEM 7 –- MANAGEMENT’S DISCUSSION AND ANALYSIS OF FINANCIAL CONDITION AND RESULTS OF OPERATIONOPERATIONS
Forward-Looking Statements
This Annual Report on Form 10-K of Freeze Tag, Inc. (“Freeze Tag” or the “Company”) for the year ended December 31, 20162023 contains forward-looking statements, principally in this Section and “Business.” Generally, you can identify these statements because they use words like “anticipates,anticipates,” “believes,”believes,” “expects,”expects,” “future,”future,” “intends,”intends,” “plans,”plans,” and similar terms. These statements reflect only our current expectations. Although we do not make forward-looking statements unless we believe we have a reasonable basis for doing so, we cannot guarantee their accuracy and actual results may differ materially from those we anticipated due to a number of uncertainties, many of which are unforeseen, including, among others, the risks we face as described in this filing. You should not place undue reliance on these forward-looking statements, which apply only as of the date of this annual report. To the extent that such statements are not recitations of historical fact, such statements constitute forward-looking statements that, by definition, involve risks and uncertainties. In any forward-looking statement where we express an expectation or belief as to future results or events, such expectation or belief is expressed in good faith and believed to have a reasonable basis, but there can be no assurance that the statement of expectation of belief will be accomplished.
We believe it is important to communicate our expectations to our investors. There may be events in the future; however, that we are unable to predict accurately or over which we have no control. The risk factors listed in this filing, as well as any cautionary language in this annual report, provide examples of risks, uncertainties and events that may cause our actual results to differ materially from the expectations we describe in our forward-looking statements. Factors that could cause actual results or events to differ materially from those anticipated, include, but are not limited to: distributors not accepting our games; price reductions; unforeseen delays in game production; changes in product strategies; general economic, financial and business conditions; changes in and compliance with governmental regulations; changes in various tax laws; and the availability of key management and other personnel.
Summary Overview
Freeze Tag, Inc. is a leading creator of location-based, mobile social games that are fun and engaging for all ages.consumers and businesses. Based on a free-to-play business model that has propelled games built and marketed by some of our competitors to worldwide to worldwide success, we employ state-of-the-art data analytics and proprietary technology to dynamically optimize the gaming experience for revenue generation. Players can download and enjoy our games for free, orand, if they so choose, they can purchase virtual items and additional features within the game to increase the fun factor. Our
| 28 |
| Table of Contents |
In October 2017, Rob Vardeman, former President of Munzee Inc. joined gaming industry veterans, Craig Holland and Mick Donahoo, to form a stronger and well-rounded Freeze Tag team through a merger. In addition to successful games encourage players to compete and engage with their friends on major social networksFreeze Tag has launched previously, the current portfolio of games includes hits such as FacebookMunzee, a real-world gaming adventure and Twitter.social platform with over 8 million locations worldwide and hundreds of thousands of players, WallaBee, an addictive collecting game with over 2,000 beautifully drawn digital cards.
During We also offer our most recent fiscal year ended December 31, 2016,technology and services to businesses that want to leverage our expertise in location-based mobile gaming in their marketing and branding programs. For example, our Eventzee solution allows businesses to create private scavenger hunts in physical places such as malls, tradeshows, company events or campuses to create immersive brand experiences.
We are closely monitoring the coronavirus pandemic and the directives from federal and local authorities regarding not only our workforce, but how it impacts both the companies we generated revenues of $138,720 fromwork with for the salesdevelopment of our games or in-app purchasesand apps, and our users. We believe these social distancing and “stay-at-home” regulations may negatively impact our users and their ability to play our geolocation games for the foreseeable future. The extent and duration of this impact is difficult to predict at this time.
Central to Freeze Tag’s core strategy is capitalizing on fast-growing trends in the mobile applications world, including geofencing and location-based advertising. We plan to leverage the combined company’s proprietary technology and expertise to create more exciting location-based experiences in our games comparedgames. Throughout 2023, we plan to $43,968 for the year ended December 31, 2015. Going forward, withcontinue to explore opportunities to incorporate geofencing into our shift to free-to-play games, we anticipate the vast majority of our revenue in future years will be derived from consumers making in-game purchases in one of our free-to-play gamesapplications, and that revenue from consumers paying to download a game will be minimal.
Our business strategy is now focused on free-to-play games that require constant updates and new content to keep players engaged. Therefore, we no longer measure our success based upon the quantity of titles we launch, but rather on the metrics we receive as we monitor and try to improve upon our games in the market.
In Q3 of 2016, we began increasing the production of our mobile games by using some existing game frameworks and hiring outside developers and art resources to help with the initial development stages of building a mobile game. As a result, we launched 8 mobile games or content updates between August and December 2016:
We have also announced our intention to grow the company through acquisition. We feel thatthen, when the time is right, to build an alliance of mobile game developers who can become stronger and more successful by working together to build a company that can leverage market intelligence, development expertise and cross-promotionalwe will examine opportunities to achieve great results for our customersintroduce advertising opportunities to Freeze Tag clients and shareholders.customers.
DuringIn the yearquarter ended DecemberMarch 31, 2016, we generated2020, our wholly-owned subsidiary, Space Coast Geo Store, LLC, a net loss of $2,129,419, primarily attributableFlorida limited liability company, began selling merchandise to increases in cost of sales and loss on change in derivative liabilities, as described below.the geocaching industry.
Going Concern UncertaintyCritical Accounting Policies
As shown in the accompanyingThe preparation of our financial statements requires us to make estimates and assumptions that affect the reported amounts of assets, liabilities, revenues, costs, expenses and related disclosures. These estimates and assumptions are often based on historical experience and judgments that we incurred net losses of $2,129,419believe to be reasonable under the circumstances at the time made. However, all such estimates and $1,870,677 for the years ended December 31, 2016assumptions are inherently uncertain and 2015, respectively. As of December 31, 2016,unpredictable and actual results may differ. For further information on our accumulated deficit was $11,113,929. During the years ended December 3l, 2016 and 2015, we experienced negative cash flows from operations largely duesignificant accounting policies see Note 2 to continued investment spending for product development of game titles for smartphones and tablets that are expected to benefit future periods. Those facts, along with our lack of access to a significant bank credit facility, create an uncertainty about our ability to continue as a going concern. Accordingly, we are currently evaluating alternatives to secure financing sufficient to support the operating requirements of its current business plan, as well as continuing to execute its business strategy of distributing game titles to digital distribution outlets, including mobile gaming app stores, online PC and Mac gaming portals, and opportunities for new devices such as tablet (mobile internet device) applications, mobile gaming platforms and international licensing opportunities.financial statements included in this filing.
Our ability to continue asThe following is a going concern is dependent uponsummary of our success in securing sufficient financingcritical accounting policies that involve estimates and in successfully executing our plans to return to positive cash flows during fiscal 2016. Our financial statements do not include any adjustments that might be necessary if we were unable to continue as a going concern.management’s judgment.
Critical Accounting Estimates
Revenue Recognition
OurThe Company’s revenues are derived primarily by licensing software products in the form of online and downloadablemobile games for PC, Macsmartphone and smartphonetablet platforms. We distributeRevenue is recognized when control of the promised goods or services is transferred to our products primarily through online games portals and smartphone device manufacturers (“distribution partners”), which marketcustomers, in an amount that reflects the gamesconsideration we expect to end-users. The nature of our business is such that we sell games basically through four distribution outlets – web portals, brick and mortar retail distributors, mobile distributors and publishers, and our own web portal, www.freezetag.com. However, going forward, the majority of our revenue will be derived from mobile distribution partners such as Apple, Google and Amazon.
Product Sales (web and mobile revenues)entitled to in exchange for those goods or services.
We recognizedetermine revenue fromrecognition through the sale of our products upon the transfer of title and risk of loss to our customers, and once any performance obligations have been completed. Revenue from product sales is recognized after deducting the estimated allowance for returns and price protection.following steps:
Licensing Revenues (retail revenues- royalties)
· | identification of the contract, or contracts, with a customer; | |
· | identification of the performance obligations in the contract; | |
· | determination of the transaction price; | |
· | allocation of the transaction price to the performance obligations in the contract; and | |
· | recognition of revenue when, or as, we satisfy a performance obligation. |
Third-party licensees distribute games under license agreements with us. We receive royalties from the licensees as a result. We recognize these royalties as revenues upon receipt of the monthly or quarterly (varies per distribution partner) revenue reports provided by the partner. Revenue from licensing/royalties is recognized after deducting the estimated allowance for returns and price protection.
Some license agreements require a royalty advance from the licensee/distributor in which case the original advance is recognized as a liability and royalty revenue is deducted from the advance as earned.
Other Revenues
Other revenues primarily include Ad game revenue and work-for-hire game related revenue. We derive our advertising game revenue from certain of our partners that offer our games free of charge to consumers in exchange for the consumers being exposed to advertising embedded in our games. In this way, we do not receive revenue for the sale of our games, but rather a percentage of the “advertising” revenue generated by these player views. This method of generating revenue is essentially the same as traditional radio or television advertising where consumers are allowed to enjoy content for “free” but are forced to watch (or listen) to advertising before, in between and at the end of the programming content.
Additionally, we derive some revenue from “work-for-hire” projects. Some of our partners occasionally ask us to render “work-for-hire” services for them such as preparing packaging materials. For example, a retail game and DVD publisher hired us to create several designs for printed packages that were used for games published by the publisher but not developed by us. For this work, we charge a one-time, fixed fee for each package design.
| Table of Contents |
Allowances for Sales Returns and Doubtful Accounts
We recognize this revenue once all performance obligations have been completed. In addition, persuasive evidenceThe allowance for sales returns is based on the Company’s estimates of an arrangement must existpotential future product returns and collectionother allowances related to current period product revenue. The Company analyzes historical returns, current economic trends and changes in customer demand and acceptance of the related receivable must be probable.
We recognize revenue in accordance with current accounting standards when an arrangement exists, delivery has occurred, the price is fixed and determinable, and collectability is probable.
Cash and Cash Equivalents
For purposes of the Statement of Cash Flows, we consider liquid investments with an original maturity of three months or less to be cash equivalents. We place our cash and cash equivalents with large commercial banks.Company’s products. The Federal Deposit Insurance Corporation (“FDIC”) insures these balances, up to $250,000. All of our cash balances at December 31, 2016 and December 31, 2015 were insured. At December 31, 2016 and 2015, there were no cash equivalents.
Allowances for Returns, Price Protection, and Doubtful Accounts
Because the majority of our business is derived through online portals (such as Big Fish Games) and wireless online app stores (such as Apple), there is no physical product, other than the downloadable bits of our games that is involved in the customer purchase. In the digital environment, the customer cannot ‘return’ a digital download product. Therefore, there are no returns. The customer can ask for a refund of a digital product, and if there are any, then they are reconciled or netted out by our distribution partners before we receive the corresponding payments and royalty statements. As such, we do not allow for returns, bad debts or price protection of digital download products.
However, we derive a small portion of our revenues from sales of physical packaged software for personal computers through distribution partners who sell through traditional retail channels. Product revenue is recognized net of allowances for price protection and returns and various customer discounts. Our distribution partners who sell to retailers may allow returns for our packaged personal computer products; these partners may decide to provide price protection or allow returns for personal computer products after they analyze: (1) inventory remaining in the retail channel, (2) the rate of inventory sell-through in the retail channel, and (3) the remaining inventory on hand of our games. To allow for these returns, price protection and various customer discounts, some of our distribution partners who sell to retailers will hold back a percentage of our revenue. These “hold-back” amounts, typically a percentage of revenue, are then reconciled on a quarterly basis and detailed on the statements we receive from our distribution partners. As of December 31, 2016 and 2015, the allowance for doubtful accounts was $0is based on the Company’s assessment of the collectability of customer accounts and $5,600, respectively.the aging of the related invoices, and represents the Company’s best estimate of probable credit losses in its existing trade accounts receivable. The Company regularly reviews the allowance by considering factors such as historical experience, credit quality, the age of the accounts receivable balances, and current economic conditions that may affect a customer’s ability to pay. We determined that no allowances for sales returns and doubtful accounts were required at December 31, 2023 and 2022.
Property and EquipmentIntangible Assets
PropertyIntangible assets consist primarily of intellectual property, customer base and equipmentnon-compete agreements acquired in 2017, which are recorded at cost and are depreciated using theamortized on a straight-line methodbasis over thetheir estimated useful lives of the related assets. All5 years. Intangible assets are currently depreciated over 3 years. Maintenance and repairs are charged to expense as incurred. Renewals and improvementsreviewed for impairment annually, or more frequently whenever events or changes in circumstances indicate the carrying value of a major nature are capitalized. Atgoodwill may not be recoverable. If the time of retirement or other disposition of property and equipment, the cost and accumulated depreciation are removed from the accounts, and any resulting gains or losses are reflected in the statement of operations.
Concentrations of Credit Risk, Major Customers and Major Vendors
Our customers are the end-consumers that purchase its games from the websites where we have our games listed for sale. Therefore, we do not have any individual customers that represent any more than a fraction of its revenue. However, we do have primary distribution partners, which are the ownerscarrying amount of the websites where it sells its games. Under our distribution agreements we are not obligatedasset exceeds the expected undiscounted cash flows of the asset, an impairment charge is recognized equal to make, distribute or sell any games. However, for any games we do make and wish to distribute we can list them on one or morethe amount by which the carrying amount exceeds fair value. The testing of these websitesintangibles under a revenue sharing arrangement where we shares the revenue from anyestablished guidelines for impairment requires significant use of our games that sell. The sharing arrangement varies greatly depending on the distributor with the Company generally keeping between 35%judgment and 70% of the revenue and the distributor keeping the remainder of the revenue generated by each sale. At times we enter into “exclusivity options” whereby if a distributor wishes to have an exclusive period carrying our games (normally 30-90 days) we will agree to thatassumptions. Changes in exchange for the distributor marketing the game in their newsletterforecasted operations and other marketing programs. Dueassumptions could materially affect the estimated fair values. Changes in business conditions could potentially require adjustments to the fact we have a number of distribution partners and a variety of different websites where we can sell our games, we are not substantially dependent on any of our distribution partners or agreements. In addition to the distribution agreements, we currently have a licensing agreement with Paws, Inc., which allow us to develop and distribute games around third party intellectual property in exchange for paying royalty payments. We are not substantially dependent on that licensing agreement.
For the year ended December 31, 2016, the Company’s primary distributors that represented 10% or more of its revenues were: Apple – 28.78%, Square Enix Ltd. 28.25% and G5 Holdings Limited – 18.02%. For the year ended December 31, 2015, the Company’s primary distributors that represented 10% or more of its revenues were: Big Fish Games – 23.67%, Wired Media – 22.74%, Apple – 18.08% and S.A.D. – 13.51%.
these asset valuations. At December 31, 2016,2023 and 2022, the Company’s primary distributorsCompany reviewed the intangible assets and partnersdetermined that represented 10% or more of its accounts receivable were: Exent – 52.38% and Apple – 13.48%. At December 31, 2015, the Company’s primary distributors and partners that represented 10% or more of its accounts receivable were: Apple – 16.93%, Big Fish Games – 10.00% and Exent – 48.81%.no impairment was required.
Income Taxes
We account for income taxes using ASC Topic 740, Income Taxes. Under ASC Topic 740, income taxes are accounted for under the asset and liability method. Deferred tax assets and liabilities are recognized for the future tax consequences attributable to differences between the financial statement carrying amounts of existing assets and liabilities and their respective tax bases and operating loss and tax credit carry forwards. Deferred tax assets and liabilities are measured using enacted tax rates expected to apply to taxable income in the years in which those temporary differences are expected to be recovered or settled. The effect on deferred tax assets and liabilities of a change in tax rates is recognized in income in the period that includes the enactment date.
ASC Topic 740 includes accounting guidance which clarifies the accounting for the uncertainty in recognizing income taxes in an organization by providing detailed guidance for financial statement recognition, measurement and disclosure involving uncertain tax positions. This guidance requires an uncertain tax position to meet a more-likely-than-not recognition threshold at the effective date to be recognized both upon the adoption of the related guidance and in subsequent periods.
We have no uncertain tax positions at any of the dates presented.
Foreign Currency Translation
We derive a portion of our revenue from foreign countries, which report to us in foreign currency, but pay in U.S. Dollars. Because of the fluctuations between the reporting time and the payment period (up to 60 days), it is necessary to make adjustments to our accounting records. These adjustments are recorded under a Foreign Currency Translation expense account, and shown in the Statement of Operations as a General & Administrative expense.
Accounting for Stock-Based Compensation
We accountThe Company accounts for stock-based compensation in accordance with ASC Topic 718-10, Compensation-Stock Compensation and ASC Subtopic 505-50, Equity-Based Payments to Non-Employees ("ASC stock-based compensation guidance").Non-Employees. Stock-based compensation expense recognized during the requisite services period is based on the value of share-based payment awards after reduction for estimated forfeitures. Forfeitures are estimated at the time of grant and are revised, if necessary, in subsequent periods if actual forfeitures differ from those estimates.
We did not have any stock-based compensation expense recognizedSoftware Development Costs
Software development costs include direct costs incurred for internally developed products and payments made to independent software developers and/or contract engineers and artists. The Company accounts for software development costs in its statements of operationsaccordance with the FASB guidance for the years ended December 31, 2016costs of computer software to be sold, leased, or otherwise marketed as found in ASC Subtopic 985-20. On a case-by-case basis, certain software development costs are capitalized once the technological feasibility of a product is established and 2015.such costs are determined to be recoverable. Technological feasibility of a product encompasses both technical design documentation and game design documentation, or the completed and tested product design and working model. Software development costs are capitalized once technological feasibility of a product is established and such costs are determined to be recoverable against future revenues. For products where proven game engine technology exists, this may occur early in the development cycle.
Impairment of Long-Lived Assets
We have adopted Accounting Standards Codification subtopic 360-10, Property, PlantSignificant management judgments and Equipment ("ASC 360-10"). ASC 360-10 requires that long-lived assets and certain identifiable intangibles held and used by us be reviewed for impairment whenever events or changes in circumstances indicate that the carrying amount of an asset may not be recoverable. We evaluate our long-lived assets for impairment annually or more often if events and circumstances warrant. Events relating to recoverability may include significant unfavorable changes in business conditions, recurring losses or a forecasted inability to achieve break-even operating results over an extended period. We evaluate the recoverability of long-lived assets based upon forecasted undiscounted cash flows. Should impairment in value be indicated, the carrying value of long-lived assets will be adjusted, based on estimates of future discounted cash flows resulting from the use and ultimate disposition of the asset. ASC 360-10 also requires assets to be disposed of be reported at the lower of the carrying amount or the fair value less costs to sell.
Fair Value of Financial Instruments
Effective January 1, 2009, we adopted Accounting Standards Codification subtopic 820-10, Fair Value Measurements and Disclosures (“ASC 820-10”) and Accounting Standards Codification subtopic 825-10, Financial Instruments (“ASC 825-10”), which permits entities to choose to measure many financial instruments and certain other items at fair value. Neither of these statements had an impact on our financial position, results of operations or cash flows. The carrying value of cash and cash equivalents, accounts payable, accrued expenses and notes payable, as reflectedare utilized in the balance sheets, approximate fair value becauseassessment of the short-term maturity of these instruments.
Inputs used in the valuation to derive fair value are classified basedwhen technological feasibility is established. For most products, technological feasibility is established when a detailed game design document containing sufficient technical specifications written for a proven game engine or framework technology had been created and approved by management. However, technological feasibility is evaluated on a fair value hierarchy which distinguishes between assumptions based on market data (observable inputs) and an entity’s own assumptions (unobservable inputs). The hierarchy consists of three levels:
Determining the category in which an asset or liability falls within the hierarchy requires significant judgment. The Company evaluates its hierarchy disclosures each period.
The following tables provide a summary of the fair values of assets and liabilities measured on a non-recurring basis at December 31, 2016 and 2015:
| 2016 |
|
|
|
|
|
|
|
|
|
|
|
|
|
| Losses |
| |||||
|
|
|
|
|
|
|
|
|
|
|
|
|
|
|
|
| |||||
Derivative liabilities |
|
| $ | 1,934,617 |
|
| $ | - |
|
| $ | - |
|
| $ | 1,934,617 |
|
| $ | 616,286 |
|
| 2015 |
|
|
|
|
|
|
|
|
|
|
|
|
|
| Losses |
| |||||
|
|
|
|
|
|
|
|
|
|
|
|
|
|
|
|
| |||||
Derivative liabilities |
|
| $ | 841,677 |
|
| $ | - |
|
| $ | - |
|
| $ | 841,677 |
|
| $ | 106,543 |
|
Use of Estimates
The preparation of financial statements and related disclosures in conformity with U.S. generally accepted accounting principles (“U.S. GAAP”) requires our management to make judgments, assumptions and estimates that affect the amounts reported in its consolidated financial statements and accompanying notes. Management bases its estimates on historical experience and on various other assumptions it believes to be reasonable under the circumstances, the results of which form the basis for making judgments about the carrying values of assets and liabilities. Actual results may differ from these estimates and these differences may be material.
Research and Development Costs
We charge costsproduct-by-product basis. Amounts related to researchsoftware development that are not capitalized are charged immediately to the appropriate expense account. Amounts that were considered ‘research and development of productsdevelopment’ that are not capitalized are immediately charged to general and administrative expense as incurred. The types of costs included in research and development expenses include research materials, salaries, contractor fees, and support materials.expense.
| 30 |
|
| Table of Contents |
Intellectual property license costs represent license fees paidPrior to intellectual property rights holders for usea product’s release, the Company expenses, as part of their trademarks or copyrights in the development of the Company's products. Intellectual property license costs represent license fees paid to intellectual property rights holders for use of their trademarks, copyrights, software, technology, music or other intellectual property or proprietary rights in the development of our products. Depending upon the agreement with the rights holder, we may obtain the rights to use acquired intellectual property in multiple products over multiple years, or alternatively, for a single product. Minimum guaranteed royalty payments for intellectual property licenses are initially recorded as an asset (prepaid royalties or prepaid licensing fees), and a current liability, (accrued royalties payable) at the contractual amount upon execution of the contract when no significant performance remains with the licensor. Commencing upon the related product's release date, intellectual property licenses costs are amortized to “Cost of Sales – Licensing” based uponSales—Product Development,” capitalized costs when the percentage of revenue outlined in the contract with each specific licensor. Generally, our intellectual property licensing contracts call for licensors to be paid a percentage of revenue actually received by us, with allowances for minimum guarantees. Sometimes, the terms of the specific licensing contracts allow for us to re-capture expenses before licensing out royaltiesCompany believes such amounts are calculated.
not recoverable. Capitalized intellectual property costs for those products that are cancelled or abandoned are charged to product development expense in the period of cancellation. Commencing upon product release, capitalized software development costs are amortized to “Cost of Sales—Product Development” based on the straight-line method.
As The Company evaluates the future recoverability of December 31, 2016capitalized software development costs and 2015, prepaid royalties (or prepaid licensing fees) were $4,430intellectual property licenses on an annual basis. For products that have been released in prior years, the primary evaluation criterion is actual title performance. For products that are scheduled to be released in future years, recoverability is evaluated based on the expected performance of the specific products to which the costs relate or in which the licensed trademark or copyright is to be used. Criteria used to evaluate expected product performance include: historical performance of comparable products developed with comparable technology; orders for the product prior to its release; and, $4,507, respectively.
Recent Accounting PronouncementsFair Value of Financial Instruments
In January 2017, the FASB issued Accounting Standards Update (“ASU”) No. 2017-4, “Intangibles – Goodwill and Other (Topic 350): “Simplifying the Test for Goodwill Impairment.” This update simplifies how an entity is required to test goodwill for impairment by eliminating Step 2 from the goodwill impairment test. Step 2 measures a goodwill impairment loss by comparing the implied fair value of a reporting unit’s goodwill with the carrying amount of that goodwill. Instead, under the amendments in this update, an entity should perform its annual, or interim, goodwill impairment test by comparing the fair value of a reporting unit with its carrying amount. An entity should recognize an impairment charge for the amount by which the carrying amount exceeds the reporting unit’s fair value. An entity should apply the amendments in this update on a prospective basis. An entity is required to disclose the nature of and reason for the change in accounting principle upon transition. That disclosure should be provided in the first annual period and in the interim period within the first annual period when the entity initially adopts the amendments in this update. A public business entity that is an SEC filer should adopt the amendments in this Update for its annual or any interim goodwill impairment tests in fiscal years beginning after December 15, 2019. The Company is currently unable to determine the impact on its financial statements of the adoption of this new accounting pronouncement.
In January 2017, the FASB issued ASU No. 2017-1, “Business Combinations (Topic 805): Clarifying the Definition of a Business.” The amendments in this update clarify the definition of a business with the objective of adding guidance to assist entities with evaluating whether transactions should be accounted for as acquisitions (or disposals) of assets or businesses. The definition of a business affects many areas of accounting including acquisitions, disposals, goodwill, and consolidation. The amendments of this ASU are effective for public business entities for annual periods beginning after December 15, 2018, and interim periods within annual periods beginning after December 15, 2019. The amendments in this Update are to be applied prospectively on or after the effective date. The Company is currently unable to determine the impact on its financial statements of the adoption of this new accounting pronouncement.
In August 2016, the FASB issued ASU No. 2016-15, “Statement of Cash Flows (Topic 230): Classification of Certain Cash Receipts and Cash Payments.” This ASU addresses eight specific cash flow issues with the objective of reducing the existing diversity in practice. The amendments in this ASU are effective for public business entities for fiscal years beginning after December 15, 2017, and interim periods within those fiscal years. Early adoption is permitted. The Company is currently unable to determine the impact on its financial statements of the adoption of this new accounting pronouncement.
Although there are several other new accounting pronouncements issued or proposed by the FASB, which the Company has adopted or will adopt, as applicable, the Company does not believe any of these accounting pronouncements has had or will have a material impact on its financial position or results of operations.
Results of Operations for the Year Ended December 31, 2016 Compared to the Year Ended December 31, 2015
Revenues
Our revenues increased $94,752 to $138,720 for the year ended December 31, 2016 from $43,968 for the year ended December 31, 2015. Of this increase, $67,832 resulted from a decrease in our unearned royalties, with other increases due mainly to increased in-game purchases from the players of our Kitty Pawp title. Our revenues also increased due to positive results of our focused efforts on building games in the free-to-play game genre. Previously, the majority of our released game titles were "pay-per-download", where the consumer paid to download the game onto their device, leading to revenue per download. Now our games are free to download and play, but have built-in features that require the consumer to pay if they want to access the feature, which means our revenue is tied to when the consumer pays to access the features, if they do. Our revenue can typically fluctuate based on when we release our games and the popularity of the games we release.
Operating Costs and Expenses
Our cost of sales decreased $133,893 to $235,153 for the year ended December 31, 2016 from $369,046 for the year ended December 31, 2015 due to fewer new titles that we have in development. Our cost of sales includes royalties, subcontractors and internal costs of programming, analytics, and design.
Our current year selling, general and administrative expenses were relatively constant compared to the prior year. Our selling, general and administrative expenses increased $3,564 to $554,773 for year ended December 31, 2016 from $551,209 for the year ended December 31, 2015.
Other Income (Expense)
Our interest expense decreased $27,802 to $859,645 for the year ended December 31, 2016 from $887,447 for the year ended December 31, 2015. During the year ended December 31, 2016, we continued to increase our convertible debt and the related debt discount that is amortized to interest expense. However, the increased interest expense attributable to the new debt was offset by decreased interest expense attributable to prior years' debt resulting from debt discount being fully amortized in prior periods.
Our estimate of the fair value of the derivative liabilities for the conversion feature of our convertible notes payable is based on multiple inputs, including the market price of our stock, interest rates, our stock price volatility, and variable conversion prices based on market prices as defined in the respective loan agreements. These inputs are subject to significant changes from period to period; therefore, the estimated fair value of the derivative liability will fluctuate from period to period and the fluctuation may be material. Our derivative liabilities also increased with the increase in our convertible debt discussed above. We reported a loss on change in derivative liabilities of $616,286 and $106,543 for the years ended December 31, 2016 and 2015, respectively.
Provision for Income Taxes
Currently our provision for income taxes is not material to our operations, and is comprised of minimum state income taxes.
Net Loss
As a result of the above, our net loss increased to $2,129,419 for the year ended December 31, 2016 from $1,870,677 for the year ended December 31, 20154.
Liquidity and Capital Resources
Introduction
As of December 31, 2016, we had current assets of $32,960 and current liabilities of $6,863,913, resulting in a working capital deficit and total stockholders’ deficit of $6,830,953. In addition, we had an accumulated deficit of $11,113,929 at December 31, 2016. Our current liabilities and working capital deficit are negatively impacted by our derivative liabilities, which had a balance of $1,934,617. We do not believe, however, that our derivative liabilities will require cash to be extinguished.
During the year ended December 31, 2016, because of our operating losses, we did not generate positive operating cash flows. Our cash balance as of December 31, 2016 was $19,934, and our monthly cash flow burn rate is currently approximately $55,000. As a result, we have significant short-term cash needs. These needs are currently being satisfied primarily from the proceeds from short-term convertible debt. We intend to raise additional capital through the issuance of debt from third parties and other related parties until such time as our cash flows from operations will satisfy our cash flow needs. There can be no assurance that we will be successful in these efforts.
Sources and Uses of Cash
We used net cash of $719,214 in operating activities for the year ended December 31, 2016 as a result of our net loss of $2,129,419, increases in accounts receivable, net of $3,241 and prepaid expenses and other current assets of $32 and a decrease in unearned royalties of $67,832, partially offset by non-cash expenses totaling $1,109,950 and increases in accounts payable of $8,920, accrued expenses of $3,461, accrued interest payable – related party of $144,704 and accrued interest payable of $214,275.
By comparison, we used net cash of $865,636 in operating activities for the year ended December 31, 2015 as a result of our net loss of $1,870,677, decrease in accrued expenses of $3,303 and a decrease in unearned royalties of $7,466, partially offset by non-cash expenses totaling $725,378, decreases in accounts receivable, net of $11,693 and prepaid expenses and other current assets of $2,996, and increases in accounts payable of $8,013, accrued interest payable – related party of $145,412 and accrued interest payable of $122,318.
We had no net cash provided by or used in investing activities for the years ended December 31, 2016 and 2015.
We had net cash provided by financing activities of $697,096 for the year ended December 31, 2016, comprised of proceeds from note payable of $58,096 and proceeds from convertible notes payable of $639,000. For the year ended December 31, 2015, we had net cash provided by financing activities of $893,000, comprised of proceeds from convertible notes payable.
Notes Payable
On February 1, 2016, we entered into a Game Marketing Agreement with an investor whereby the investor agreed, at its option, to loan us up to $250,000 (the “Marketing Fund”) to exclusively fund user acquisition efforts for the game Kitty Pawp (the “Game”). The investor will receive 50% of Net Receipts (as defined in the agreement) from the Game until the Marketing Fund is fully recouped. Once the Marketing Fund is recouped, the investor will receive 50% of Net Receipts from the Game until the investor receives a 50% return on the Marketing Funds advanced.
We recorded Marketing Fund advances as notes payable in the accompanying condensed balance sheets. Upon receiving a Marketing Fund advance, we accrue the 50% return as interest expense and includes the obligation in accrued interest payable in the accompanying condensed balance sheets. As of December 31, 2016, total advances recorded as notes payable were $58,096 and accrued interest payable included a total of $22,046 of the 50% guaranteed return, net of repayments.
Convertible Note Payable
On February 8, 2017, we entered into a convertible promissory note (the "Note") with an accredited investor (the "Accredited Investor") under which the Accredited Investor agreed to loan us up to $500,000. The Note bears interest at 10% per annum and matures on February 8, 2018. Under the terms of the Note, the Accredited Investor agreed to loan us $55,000 upon execution of the Note and can loan us the additional amounts up to $500,000 at any time in their sole discretion. The Accredited Investor has the right, at any time after February 8, 2017, at its election, to convert all or part of the amounts due to it under the Note into shares of our common stock. The conversion price shall be the lesser of (a) $0.0003 per share of our common stock or (b) Fifty Percent (50%) of the average of the three (3) lowest trade prices on three (3) separate trading days of our common stock recorded after February 8, 2017, or (c) the lowest effective price per share granted to any person or entity after February 8, 2017 to acquire our common stock or adjust, whether by operation of purchase price adjustment, settlement agreements, exchange agreements, reset provision, floating conversion or otherwise, any outstanding warrant, option or other right to acquire our common stock or outstanding our common stock equivalents, excluding any lower price per share offered to any of our officers and directors. However, the Accredited Investor may not convert the amounts due under the Note into shares of our common stock if such conversion would cause it to own more than 4.99% of our then-outstanding common stock. The Note also contains piggyback registration rights. In the event we default under the terms of the Note, we immediately owe 150% of the principal amount then due under the Note.
Debt Instruments, Guarantees, and Related Covenants
We have no disclosures required by this item.
ITEM 7A – QUANTITATIVE AND QUALITATIVE DISCLOSURES ABOUT MARKET RISK
As a smaller reporting company we are not required to provide the information required by this Item.
ITEM 8 – FINANCIAL STATEMENTS AND SUPPLEMENTARY DATA
REPORT OF INDEPENDENT REGISTERED PUBLIC ACCOUNTING FIRM
To the Board of Directors and
Shareholders of Freeze Tag, Inc.
We have audited the accompanying balance sheets of Freeze Tag, Inc. (“the “Company”) as of December 31, 2016 and 2015 and the related statements of operations, cash flows and shareholders’ equity for the years then ended. These financial statements are the responsibility of the Company’s management. Our responsibility is to express an opinion on these financial statements based on our audits.
We conducted our audits in accordance with standards of the Public Company Accounting Oversight Board (United States). Those standards require that we plan and perform the audit to obtain reasonable assurance about whether the financial statements are free of material misstatement. The Company is not required to have, nor were we engaged to perform, an audit of its internal control over financial reporting. Our audits included consideration of internal control over financial reporting as a basis for designing audit procedures that are appropriate in the circumstances, but not for the purpose of expressing an opinion on the effectiveness of the Company’s internal control over financial reporting. Accordingly, we express no such opinion. An audit includes examining, on a test basis, evidence supporting the amounts and disclosures in the financial statements, assessing the accounting principles used and significant estimates made by management, as well as evaluating the overall financial statement presentation. We believe that our audits provide a reasonable basis for our opinion.
In our opinion, the financial statements referred to above present fairly, in all material respects, the financial position of Freeze Tag, Inc. as of December 31, 2016 and 2015, and the results of its operations and its cash flows for the years then ended in conformity with U.S. generally accepted accounting principles.
The accompanying financial statements have been prepared assuming that the Company will continue as a going concern. As discussed in Note 3 to the financial statements, the Company has insufficient working capital and reoccurring losses from operations, all of which raises substantial doubt about its ability to continue as a going concern. Management's plans regarding those matters also are described in Note 3. The financial statements do not include any adjustments that might result from the outcome of this uncertainty.
| |
| |
| |
|
(A DELAWARE CORPORATION)
BALANCE SHEETS
December 31, 2016 2015 ASSETS Current assets: Cash Accounts receivable, net of allowance of $0 and $5,600, respectively Prepaid expenses and other current assets Total current assets Total assets LIABILITIES AND STOCKHOLDERS’ DEFICIT Current liabilities: Accounts payable Accrued expenses Accrued interest payable – related party Accrued interest payable Unearned royalties Notes payable Convertible notes payable – related party Convertible notes payable, net of discount of $239,402 Derivative liabilities Total current liabilities Total liabilities Commitments and contingencies Stockholders’ deficit: Preferred stock; $0.001 par value, 10,000,000 shares authorized, no shares issued and outstanding Common stock; $0.00001 par value, 2,000,000,000 shares authorized, 648,436,785 and 280,442,125 shares issued and outstanding, respectively Additional paid-in capital Common stock payable Accumulated deficit Total stockholders’ deficit Total liabilities and stockholders’ deficit $ 19,934 $ 42,052 7,745 4,504 5,281 5,249 32,960 51,805 $ 32,960 $ 51,805 $ 133,083 $ 124,163 495,473 492,012 354,165 209,461 361,503 154,925 127,201 195,033 58,096 - 1,447,041 1,447,041
and $180,208, respectively1,952,734 1,405,361 1,934,617 841,677 6,863,913 4,869,673 6,863,913 4,869,673 - - 6,484 2,804 4,259,692 4,147,038 16,800 16,800 (11,113,929 ) (8,984,510 ) (6,830,953 ) (4,817,868 ) $ 32,960 $ 51,805
The accompanying notes are an integral part of the financial statements
(A DELAWARE CORPORATION)
STATEMENTS OF OPERATIONS
Years Ended December 31, 2016 2015 Revenues Operating costs and expenses: Cost of sales Selling, general and administrative expenses Total operating costs and expenses Loss from operations Other expense: Interest expense, net Loss on change in derivative liabilities Total other expense Loss before income taxes Provision for income taxes Net loss Weighted average number of common shares outstanding – basic and diluted Loss per common share – basic and diluted $ 138,720 $ 43,968 235,153 369,046 554,773 551,209 789,926 920,255 (651,206 ) (876,287 ) (859,645 ) (887,447 ) (616,286 ) (106,543 ) (1,475,931 ) (993,990 ) (2,127,137 ) (1,870,277 ) (2,282 ) (400 ) $ (2,129,419 ) $ (1,870,677 ) 381,194,007 238,762,747 $ (0.01 ) $ (0.01 )
The accompanying notes are an integral part of the financial statements
(A DELAWARE CORPORATION)
STATEMENTS OF STOCKHOLDERS’ DEFICIT
Years Ended December 31, 2016 and 2015
Additional Common Accumulated Shares Amount Shares Amount Capital Payable Deficit Total Balance, December 31, 2014 Issuance of common stock for conversion of debt - - - - Issuance of common stock for conversion of related party debt Net loss Balance, December 31, 2015 Issuance of common stock for Net loss Balance, December 31, 2016
Preferred Stock
Common Stock
Paid-in
Stock- $ - 184,518,250 $ 1,845 $ 3,903,394 $ 16,800 $ (7,113,833 ) $ (3,191,794 ) 70,648,155 706 230,627 231,333
-
-25,275,720 253 13,017
-
-13,270 - - - - - - (1,870,677 ) (1,870,677 ) - - 280,442,125 2,804 4,147,038 16,800 (8,984,510 ) (4,817,868 )
conversion of debt
-
-367,994,660 3,680 112,654
-
-116,334 - - - - - - (2,129,419 ) (2,129,419 ) - $ - 648,436,785 $ 6,484 $ 4,259,692 $ 16,800 $ (11,113,929 ) $ (6,830,953 )
The accompanying notes are an integral part of the financial statements
(A DELAWARE CORPORATION)
STATEMENTS OF CASH FLOWS
Years Ended December 31, 2016 2015 Cash flows from operating activities: Net loss Adjustments to reconcile net loss to net cash used by operating activities: Amortization of debt discount to interest expense Loss on change in derivative liabilities Non-cash interest expense Changes in operating assets and liabilities: Accounts receivable, net Prepaid expenses and other current assets Accounts payable Accrued expenses Accrued interest payable – related party Accrued interest payable Unearned royalties Net cash used by operating activities Cash flows from investing activities Net cash provided by investing activities Cash flows from financing activities: Proceeds from note payable Proceeds from convertible notes payable Net cash provided by financing activities Net increase (decrease) in cash Cash at the beginning of the year Cash at the end of the year Non-cash transactions: Conversion of related party debt and accrued interest to common shares $ - $ 13,270 Conversion of debt and accrued interest to common shares $ 116,334 $ 72,952 Debt discount due to derivative liabilities $ 520,919 $ 455,141 $ (2,129,419 ) $ (1,870,677 ) 461,725 618,835 616,286 106,543 31,939 - (3,241 ) 11,693 (32 ) 2,996 8,920 8,013 3,461 (3,303 ) 144,704 145,412 214,275 122,318 (67,832 ) (7,466 ) (719,214 ) (865,636 ) - - - - 58,096 - 639,000 639,000 697,096 893,000 (22,118 ) 27,364 42,052 14,688 $ 19,934 $ 42,052
The accompanying notes are an integral part of the financial statements
(A DELAWARE CORPORATION)
NOTES TO FINANCIAL STATEMENTS
Year Ended December 31, 2016
NOTE 1 – THE COMPANY AND NATURE OF BUSINESS
Freeze Tag, Inc. (the “Company”) is a leading creator of mobile social games that are fun and engaging for all ages. Based on a free-to-play business model that has propelled games like Candy Crush Saga to worldwide success, the Company employs state-of-the-art data analytics and proprietary technology to dynamically optimize the gaming experience for revenue generation. Players can download and enjoy the Company’s games for free, or they can purchase virtual items and additional features within the game to increase the fun factor. Our games encourage players to compete and engage with their friends on major social networks such as Facebook and Twitter.
NOTE 2 – SUMMARY OF SIGNIFICANT ACCOUNTING POLICIES
Revenue Recognition
The Company’s revenues are derived primarily by licensing software products in the form of online and downloadable games for PC, Mac and smartphone platforms. The Company distributes its products primarily through online games portals and smartphone device manufacturers (“distribution partners”), which market the games to end-users. The nature of our business is such that we sell games basically through four distribution outlets – web portals, brick and mortar retail distributors, mobile distributors and publishers, and our own web portal, www.freezetag.com.
Product Sales (web and mobile revenues)
The Company recognizes revenue from the sale of our products upon the transfer of title and risk of loss to its customers, and once any performance obligations have been completed. Revenue from product sales is recognized after deducting the estimated allowance for returns and price protection.
Licensing Revenues (retail revenues- royalties)
Third-party licensees distribute games under license agreements with the Company. We receive royalties from the licensees as a result. We recognize these royalties as revenues upon receipt of the monthly or quarterly (varies per distribution partner) revenue reports provided by the partner. Revenue from licensing/royalties is recognized after deducting the estimated allowance for returns and price protection.
Some license agreements require a royalty advance from the licensee/distributor in which case the original advance is recognized as a liability and royalty revenue is deducted from the advance as earned.
Other Revenues
Other revenues primarily include Ad game revenue and work-for-hire game related revenue. We derive our advertising game revenue from certain of our partners that offer our games free of charge to consumers in exchange for the consumers being exposed to advertising embedded in our games. In this way, we do not receive revenue for the sale of our games, but rather a percentage of the “advertising” revenue generated by these player views. This method of generating revenue is essentially the same as traditional radio or television advertising where consumers are allowed to enjoy content for “free” but are forced to watch (or listen) to advertising before, in between and at the end of the programming content.
Additionally, we derive some revenue from “work-for-hire” projects. Some of our partners occasionally ask us to render “work-for-hire” services for them such as preparing packaging materials. For example, a retail game and DVD publisher hired us to create several designs for printed packages that were used for games published by the publisher but not developed by us. For this work, we charge a one-time, fixed fee for each package design.
The Company recognizes this revenue once all performance obligations have been completed. In addition, persuasive evidence of an arrangement must exist and collection of the related receivable must be probable.
The Company recognizes revenue in accordance with current accounting standards, when an arrangement exists, delivery has occurred,certain assets and liabilities must be measured at fair value. ASC 820 defines fair value as the price is fixedthat would be received to sell an asset or paid to transfer a liability in an orderly transaction between market participants at the measurement date (an exit price). The standard outlines a valuation framework and determinable,creates a fair value hierarchy in order to increase the consistency and collectability is probable.
Cashcomparability of fair value measurements and Cash Equivalents
For purposes of the Statement of Cash Flows,related disclosures. ASC 820 requires that certain assets and liabilities must be measured at fair value, and the standard details the disclosures that are required for items measured at fair value. The Company considers liquid investments with an original maturity of three months or lesshad no assets and liabilities required to be cash equivalents. The Company places its cash and cash equivalents with large commercial banks. The Federal Deposit Insurance Corporation (“FDIC”) insures these balances, up to $250,000. All of the Company’s cash balancesmeasured on a recurring basis at December 31, 20162023 and December 31, 2015 were insured. At December 31, 2016 and December 31, 2015 there were no cash equivalents.
Allowances for Returns, Price Protection, and Doubtful Accounts
Because the majority of the Company’s business is derived through online portals (such as Big Fish Games) and wireless online app stores (such as Apple), there is no physical product, other than the downloadable bits of our games that is involved in the customer purchase. In the digital environment, the customer cannot ‘return’ a digital download product. Therefore, there are no returns. The customer can ask for a refund of a digital product, and if there are any, then they are reconciled or netted out by our distribution partners before we receive the corresponding payments and royalty statements. As such, we do not allow for returns, bad debts or price protection of digital download products.
However, the Company derives a small portion of our revenues from sales of physical packaged software for personal computers through distribution partners who sell through traditional retail channels. Product revenue is recognized net of allowances for price protection and returns and various customer discounts. Our distribution partners who sell to retailers may allow returns for our packaged personal computer products; these partners may decide to provide price protection or allow returns for personal computer products after they analyze: (1) inventory remaining in the retail channel, (2) the rate of inventory sell-through in the retail channel, and (3) the remaining inventory on hand of our games. To allow for these returns, price protection and various customer discounts, some of our distribution partners who sell to retailers will hold back a percentage of our revenue. These “hold-back” amounts, typically a percentage of revenue, are then reconciled on a quarterly basis and detailed on the statements we receive from our distribution partners. As of December 31, 2016 and December 31, 2015, the allowance for doubtful accounts was $0 and $5,600, respectively.
Concentrations of Credit Risk, Major Customers and Major Vendors2022.
The Company’s customers are the end-consumers that purchase its games from the websites where the Company has its games listed for sale. Therefore, the Company does not have any individual customers that represent any more than a fraction of its revenue. However, the Company does have primary distribution partners, which are the owners of the websites where it sells its games. Undercurrent assets and current liabilities reported on the Company’s distribution agreements it is not obligatedconsolidated balance sheets are estimated by management to make, distribute or sell any games. However, for any games the Company does make and wishesapproximate fair market value due to distribute it can list them on one or more of these websites under a revenue sharing arrangement where it shares the revenue from any of its games that sell. The sharing arrangement varies greatly depending on the distributor with the Company generally keeping between 35% and 70% of the revenue and the distributor keeping the remainder of the revenue generated by each sale. At times the Company enters into “exclusivity options” whereby if a distributor wishes to have an exclusive period carrying the Company’s games (normally 30-90 days) it will agree to that in exchange for the distributor marketing the game in their newsletter and other marketing programs. Due to the fact the Company has a number of distribution partners and a variety of different websites where it can sell its games, the Company is not substantially dependent on any of its distribution partners or agreements. In addition to the distribution agreements, the Company currently has licensing agreements with Ohio Art Company and CMG Worldwide, which allow it to develop and distribute games around third party intellectual property in exchange for paying royalty payments. The Company is not substantially dependent on either of those licensing agreements.short-term nature.
For the year ended December 31, 2016, the Company’s primary distributors that represented 10% or more of its revenues were: Apple – 28.78%, Square Enix Ltd. 28.25% and G5 Holdings Limited – 18.02%. For the year ended December 31, 2015, the Company’s primary distributors that represented 10% or more of its revenues were: Big Fish Games – 23.67%, Wired Media – 22.74%, Apple – 18.08% and S.A.D. – 13.51%.
At December 31, 2016, the Company’s primary distributors and partners that represented 10% or more of its accounts receivable were: Exent – 52.38% and Apple – 13.48%. At December 31, 2015, the Company’s primary distributors and partners that represented 10% or more of its accounts receivable were: Apple – 16.93%, Big Fish Games – 10.00% and Exent – 48.81%.
Income Taxes
We account for income taxes using ASC Topic 740, Income Taxes. Under ASC Topic 740, income taxes are accounted for under the asset and liability method. Deferred tax assets and liabilities are recognized for the future tax consequences attributable to differences between the financial statement carrying amounts of existing assets and liabilities and their respective tax bases and operating loss and tax credit carry forwards. Deferred tax assets and liabilities are measured using enacted tax rates expected to apply to taxable income in the years in which those temporary differences are expected to be recovered or settled. The effect on deferred tax assets and liabilities of a change in tax rates is recognized in income in the period that includes the enactment date.
ASC Topic 740 includes accounting guidance which clarifies the accounting for the uncertainty in recognizing income taxes in an organization by providing detailed guidance for financial statement recognition, measurement and disclosure involving uncertain tax positions. This guidance requires an uncertain tax position to meet a more-likely-than-not recognition threshold at the effective date to be recognized both upon the adoption of the related guidance and in subsequent periods.
The Company has no uncertain tax positions at any of the dates presented.
| 31 |
| Table of Contents |
Foreign Currency Translation
Earnings per Share
The Company derives a portioncomputation of its revenue from foreign countries, which report to the Company in foreign currency, but pay in U.S. Dollars. Because of the fluctuations between the reporting time and the payment period (up to 60 days), it is necessary to make adjustments to the Company’s accounting records. These adjustments are recorded under a Foreign Currency Translation expense account, and shown in the Statement of Operations as a General& Administrative expense.
Accounting for Stock-Based Compensation
The Company accounts for stock-based compensation in accordance with ASC Topic 718-10, Compensation-Stock Compensation and ASC Subtopic 505-50, Equity-Based Payments to Non-Employees ("ASC stock-based compensation guidance"). Stock-based compensation expense recognized during the requisite services periodbasic earnings per common share is based on the valueweighted average number of share-based payment awards after reductionshares outstanding during the period. The computation of diluted earnings per common share is based on the weighted average number of shares outstanding during the period plus the weighted average common stock equivalents which would arise from the exercise of stock options, warrants, convertible preferred stock and other rights during the period.
For the years ended December 31, 2023 and 2022, the diluted weighted average number of shares includes 13,303,000 common shares issuable upon conversion of Series B preferred stock and 217,750,000 common shares issuable upon conversion of Series C preferred stock.
Recent Accounting Pronouncements
Although there were new accounting pronouncements issued or proposed by the FASB during the year ended December 31, 2023 and through the date of filing of this report, the Company does not believe any of these accounting pronouncements, other than the item listed above, has had or will have a material impact on its financial position or results of operations.
Results of Operations for estimated forfeitures. Forfeituresthe Year Ended December 31, 2023 Compared to the Year Ended December 31, 2022
Revenues
Our revenue can typically fluctuate based on when we release our games and the popularity of the games we release. Currently, our games are estimated atfree to download and play, but have built-in features that require the timeconsumer to pay if they want to access the feature, which means our revenue is tied to when the consumer pays to access the features. The exception to this business model is Eventzee, which generates revenue by way of granta licensing fee paid by clients based on the number of participants who use our software.
Revenues increased $16,492 to $2,115,547 for the year ended December 31, 2023 from $2,099,055 for the year ended December 31, 2022. The increase was mainly due to a 65% increase in revenues of our Eventzee app (compared to 2022) partially offset by slightly lower revenues from other games. Our Eventzee app saw the increase in revenues due to increased marketing efforts and are revised, if necessary,the newly re-designed app.
Cost of Sales
Cost of sales increased $62,032 to $428,656 for the year ended December 31, 2023 from $366,624 for the year ended December 31, 2022. The increase was a result of $30,688 of capitalized software amortization, increased costs in subsequent periods if actual forfeitures differserver and backend technology as our Munzee and Eventzee games increased in the numbers of players using the games, as well as additional server technology needed to develop out a more robust staging and testing environment for Munzee. We have since been able to begin scaling back those increases in server and technology costs, and should see those reduce in 2024, but will continue to amortize the capitalized production costs in the coming years.
Selling, General and Administrative Expenses
Selling, general and administrative expenses increased $185,591 to $1,844,861 for the year ended December 31, 2023 from those estimates.$1,659,270 for the year ended December 31, 2022. The increase was primarily a result of an increase in payroll expenses (including contract engineering resources hired to help us finish the re-development of our updated Munzee backend and infrastructure), health insurance and other insurance, offset by a decrease in marketing expense, some of our general office expenses, and rent expense.
| 32 |
| Table of Contents |
Other Income (Expense)
Total other income (expense) of ($45,396) for the year ended December 31, 2023 was down $174,491 from $129,095 for the year ended December 31, 2022. The change was primarily driven by the recognition of revenue from the forgiveness of our second PPP loan of $176,441 in 2022. The remaining amounts relate to interest expense comprised primarily of imputed interest accrued for the entire year on the related party debt. For the year ended December 31, 2023, interest expense of ($45,396) was relatively consistent with prior year amounts. This imputed interest does not represent an obligation payable in cash, but is recorded as a contribution to capital.
Provision for Income Taxes
The Company had no stock-based compensation expense recognized in its statements of operationsprovision for income taxes was $1,832 and $1,555 for the years ended December 31, 20162023 and 2015.2022, respectively.
Net Income (Loss)
As a result of the above, we reported net loss of ($205,198) and net income of $200,701 for the years ended December 31, 2023 and 2022, respectively. The net income in 2023 was overall due to comparable revenues between 2023 and 2022 and much higher costs in 2023. The net income in 2023 and 2022 both include non-cash expenses such as imputed interest.
Liquidity and Capital Resources
Introduction
As of December 31, 2023, we had current assets of $423,768, including cash of $383,362, and current liabilities of $1,031,418, resulting in a working capital deficit of $607,650. In addition, we had a total stockholders’ deficit of $232,336 on December 31, 2023.
From a financial perspective, one of our focuses in 2023 was to improve the backend technology related to our Munzee game, which took a portion of our cash. Properly managing cash allows the company to move forward in development and growth without borrowing funds from investors or third parties. Freeze Tag management made a concentrated effort on managing cash flow during 2023 while contracting additional engineering resources to facilitate the improvement of the Munzee game backend technology. In 2024, we have reduced this spend, and will continue to focus on cash management.
During the years ended December 31, 2023 and 2022, operating activities used ($165,400) in 2023, while providing $165,332 in net cash for 2022, respectively. Management believes that by continuing cost reductions and realizing cost efficiencies, operating cash flows will be sufficient to support our business plan. We will also continue to update and launch new components of our games to maximize revenues. As a result, we may have short-term cash needs. Therefore, management is currently evaluating alternative financing sources to fund our current business plan should cash provided by operations be insufficient. There can be no assurance that we will be successful in these efforts.
Sources and Uses of Cash
Net cash used by operating activities was $165,400 for the year ended December 31, 2023 mainly as a result of our net loss of $205,198, increases in accounts receivable and prepaids of $10,069 and decreases in accounts payable and accrued expenses of $30,334. These are partially offset by non-cash expenses totaling $77,994 and increased liabilities of $2,207.
By comparison, net cash provided by operating activities was 165,332 for the year ended December 31, 2022 mainly as a result of our net income of $200,701, non-cash expenses totaling $116,680 and increases in accounts payable and accrued expenses of $31,274. These are partially offset by forgiveness of our PPP loan of $176,441, increases in accounts receivable of $3,705 and other assets of $3,450, and a decrease in other liabilities of $5,640.
| Table of Contents |
Net cash used by investing activities was $182,133 for the year ended December 31, 2023 and $167,015 for the year ended December 31, 2022 as a result of capitalized software.
Net cash used by financing activities for the years ended December 31, 2023 and 2022 of $10,268 and $9,980, respectively, were a result of loan payments on our vehicle.
Notes Payable – Related Party
As of December 31, 2023, our related party debt was comprised of notes payable totaling $379,825 to Craig Holland, our Chief Executive Officer and Mick Donahoo, our Chief Financial Officer. These notes are non-interest bearing and mature on December 31, 2024. Of this related party indebtedness, there are two convertible notes payable of $186,450 to each of Messrs. Holland and Donahoo, who have the right, at any time, at their election, to convert all or part of the amount due into shares of fully paid and non-assessable shares of common stock of the Company. The Company has imputed interest on these notes payable using an annual rate of 10%. This imputed interest does not represent on obligation payable in cash, but is recorded as a contribution to capital. The fixed conversion price is $0.02 per share.
Debt Instruments, Guarantees, and Related Covenants
We have no disclosures required by this item.
ITEM 7A – QUANTITATIVE AND QUALITATIVE DISCLOSURES ABOUT MARKET RISK
As a smaller reporting company, we are not required to provide the information required by this Item.
| 34 |
| Table of Contents |
ITEM 8 – FINANCIAL STATEMENTS AND SUPPLEMENTARY DATA
Fair ValueFREEZE TAG, INC.
INDEX TO FINANCIAL STATEMENTS
| 35 |
| Table of Contents |
REPORT OF INDEPENDENT REGISTERED PUBLIC ACCOUNTING FIRM
To the Board of Directors and Stockholders of Freeze Tag, Inc.
Opinion on the Financial InstrumentsStatements
We have audited the accompanying consolidated balance sheets of Freeze Tag, Inc. (the Company) as of December 31, 2023 and 2022, and the related statements of operations, stockholders’ deficit, and consolidated cash flows for the two-year period then ended, and the related notes (collectively referred to as the "financial statements"). In our opinion, the financial statements present fairly, in all material respects, the financial position of the Company as of December 31, 2023 and 2022, and the results of its operations and its cash flows for the years then ended in conformity with accounting principles generally accepted in the United States of America.
Going Concern
The accompanying financial statements have been prepared assuming that the Company adopted FASB ASC 820 on October 1, 2008. Underwill continue as a going concern. As discussed in Note 3 to the financial statements, the Company has suffered net losses from operations and has a net capital deficiency, which raises substantial doubt about its ability to continue as a going concern. Management’s plans regarding those matters are discussed in Note 3. The financial statements do not include any adjustments that might result from the outcome of this FASB, fair value is defined as the price that would be received to sell an asset or paid to transfer a liability in an orderly transaction between market participants at the measurement date (an exit price). The standard outlines a valuation framework and creates a fair value hierarchy in order to increase the consistency and comparability of fair value measurements and the related disclosures. Under GAAP, certain assets and liabilities must be measured at fair value, and FASB ASC 820-10-50 details the disclosures that are required for items measured at fair value.uncertainty.
TheBasis for Opinion
These financial statements are the responsibility of the Company’s management. Our responsibility is to express an opinion on the Company’s financial statements based on our audits. We are a public accounting firm registered with the Public Company has various financial instruments that must be measured under the new fair value standard including cashAccounting Oversight Board (United States) (PCAOB) and debt. The Company currently does not have non-financial assets or non-financial liabilities that are required to be measured at fair valueindependent with respect to the Company in accordance with the U.S. federal securities laws and the applicable rules and regulations of the Securities and Exchange Commission and the PCAOB .
We conducted our audits in accordance with the standards of the PCAOB. Those standards require that we plan and perform the audits to obtain reasonable assurance about whether the financial statements are free of material misstatement, whether due to error or fraud. The Company is not required to have, nor were we engaged to perform, an audit of its internal control over financial reporting. As part of our audits, we are required to obtain an understanding of internal control over financial reporting, but not for the purpose of expressing an opinion on the effectiveness of the Company’s internal control over financial reporting. Accordingly, we express no such opinion.
Our audits included performing procedures to assess the risks of material misstatement of the financial statements, whether due to error or fraud, and performing procedures that respond to those risks. Such procedures included examining, on a recurring basis. test basis, evidence regarding the amounts and disclosures in the financial statements. Our audits also included evaluating the accounting principles used and the significant estimates made by management, as well as evaluating the overall presentation of the financial statements. We believe our audits provide a reasonable basis for our opinion.
Critical Audit Matters
The Company’s financial assets and liabilities are measured using inputscritical audit matter communicated below is a matter arising from the three levelscurrent period audit of the financial statements that were communicated or required to be communicated to the audit committee and that: (1) relate to accounts or disclosures that are material to the financial statements and (2) involved our especially challenging, subjective, or complex judgments. The communication of critical audit matters does not alter in any way our opinion on the financial statements, taken as a whole, and we are not, by communicating the critical audit matter below, providing separate opinion on the critical audit matter or on the accounts or disclosures to which they relate.
Other Assets
As discussed in Note 2 to the financial statements, the Company has capitalized software development costs in accordance with ASC 985-20.
Auditing management’s calculation of the fair value hierarchy. The three levels are as follows:
Level 1 - Inputs are unadjusted quoted prices in active markets for identical assets or liabilitiesof capitalized software can be a significant judgment given the fact that the Company hasuses management estimates on various inputs to the ability to access at the measurement date. The fair value of the Company’s cash is based on quoted prices and therefore classified as Level 1.calculation.
Level 2 - Inputs include quoted prices for similar assets and liabilities in active markets, quoted prices for identical or similar assets or liabilities in markets that are not active, inputs other than quoted prices that are observable forTo evaluate the asset or liability (e.g., interest rates, yield curves, etc.), and inputs that are derived principally from or corroborated by observable market data by correlation or other means (market corroborated inputs).
Level 3 - Unobservable inputs that reflect our assumptions about the assumptions that market participants would use in pricing the asset or liability.
Cash, accounts receivable, capitalized production costs, prepaid royalties, prepaid expenses, accounts payable, accrued compensation, accrued royalties, accrued interest, accrued expenses, unearned royalties, notes payable – related party and technology payables reported on the balance sheet are estimated by management to approximate fair market value due to their short term nature.
The following tables provide a summaryappropriateness of the fair values of assetsvalue determined by management, we examined and liabilities measured on a non-recurring basis at December 31, 2016 and 2015:
Gains (Losses) Derivative liabilities 2016
Total
Level 1
Level 2
Level 3$ 1,934,617 $ - $ - $ 1,934,617 $ (616,286 )
Losses (Gains) Derivative liabilities 2015
Total
Level 1
Level 2
Level 3$ 841,677 $ - $ - $ 841,677 $ (106,543 )
The Company believes thatevaluated the market rate of interest as of December 31, 2016 and 2015 was not materially different to the rate of interest at which the convertible notes payable were issued. Accordingly, the Company believes thatinputs management used in calculating the fair value of the convertible notes payable approximated their carrying value at December 31, 2016 and 2015.capitalized software.
/s/ M&K CPAS, PLLC
M&K CPAS, PLLC
We have served as the Company’s auditor since 2008.
The Woodlands, TX
April 1, 2024
| Table of Contents |
FREEZE TAG, INC.
(A DELAWARE CORPORATION)
CONSOLIDATED BALANCE SHEETS
|
| December 31, |
| |||||
|
| 2023 |
|
| 2022 |
| ||
|
|
|
|
| ||||
ASSETS |
| |||||||
|
|
|
|
|
|
| ||
Current assets: |
|
|
|
|
|
| ||
Cash |
| $ | 383,362 |
|
| $ | 741,163 |
|
Accounts receivable |
|
| 20,298 |
|
|
| 16,875 |
|
Prepaid expenses and other current assets |
|
| 20,108 |
|
|
| 13,462 |
|
Total current assets |
|
| 423,768 |
|
|
| 771,500 |
|
|
|
|
|
|
|
|
|
|
Property and equipment, net |
|
| 10,875 |
|
|
| 20,197 |
|
Intangible assets, net |
|
| - |
|
|
| - |
|
Capitalized software, net |
|
| 522,084 |
|
|
| 370,639 |
|
Other assets |
|
| 853 |
|
|
| 853 |
|
|
|
|
|
|
|
|
|
|
Total assets |
| $ | 957,580 |
|
| $ | 1,163,189 |
|
|
|
|
|
|
|
|
|
|
LIABILITIES AND STOCKHOLDERS’ DEFICIT | ||||||||
|
|
|
|
|
|
|
|
|
Current liabilities: |
|
|
|
|
|
|
|
|
Accounts payable |
| $ | 143,842 |
|
| $ | 164,541 |
|
Accrued expenses |
|
| 489,639 |
|
|
| 493,962 |
|
Unearned royalties |
|
| 7,543 |
|
|
| 7,543 |
|
Notes payable – related party, current portion |
|
| 379,825 |
|
|
| 379,825 |
|
Notes payable, current portion |
|
| 10,569 |
|
|
| 10,268 |
|
Total current liabilities |
|
| 1,031,418 |
|
|
| 1,056,139 |
|
|
|
|
|
|
|
|
|
|
Notes payable – related party, net of current portion |
|
| - |
|
|
| - |
|
Notes payable – net of current portion |
|
| 152,686 |
|
|
| 163,255 |
|
Other long-term liabilities |
|
| 5,812 |
|
|
| 8,917 |
|
|
|
|
|
|
|
|
|
|
Total liabilities |
|
| 1,189,916 |
|
|
| 1,228,311 |
|
|
|
|
|
|
|
|
|
|
Commitments and contingencies |
|
|
|
|
|
|
|
|
|
|
|
|
|
|
|
|
|
Stockholders’ deficit: |
|
|
|
|
|
|
|
|
Preferred stock; $0.00001 par value, 25,000,000 shares authorized: |
|
|
|
|
|
|
|
|
Series B; 2,480,482 issued and outstanding at December 31, 2023 and 2022 |
|
| 25 |
|
|
| 25 |
|
Series C; 4,355,000 shares issued and outstanding at December 31, 2023 and 2022 |
|
| 44 |
|
|
| 44 |
|
Common stock; $0.00001 par value, 800,000,000 shares authorized, 75,056,123 shares issued and outstanding at December 31, 2023 and 2022 |
|
| 751 |
|
|
| 751 |
|
Additional paid-in capital |
|
| 9,328,813 |
|
|
| 9,290,829 |
|
Common stock payable |
|
| 16,800 |
|
|
| 16,800 |
|
Accumulated deficit |
|
| (9,578,769 | ) |
|
| (9,373,571 | ) |
Total stockholders’ deficit |
|
| (232,336 | ) |
|
| (65,122 | ) |
|
|
|
|
|
|
|
|
|
Total liabilities and stockholders’ deficit |
| $ | 957,580 |
|
| $ | 1,163,189 |
|
The accompanying notes are an integral part of the consolidated financial statements
| F-2 |
| Table of Contents |
FREEZE TAG, INC.
(A DELAWARE CORPORATION)
CONSOLIDATED STATEMENTS OF OPERATIONS
|
| Years Ended December 31, |
| |||||
|
| 2023 |
|
| 2022 |
| ||
|
|
|
|
|
|
| ||
Revenues |
| $ | 2,115,547 |
|
| $ | 2,099,055 |
|
|
|
|
|
|
|
|
|
|
Operating costs and expenses: |
|
|
|
|
|
|
|
|
Cost of sales |
|
| 428,656 |
|
|
| 366,624 |
|
Selling, general and administrative expenses |
|
| 1,844,861 |
|
|
| 1,659,270 |
|
|
|
|
|
|
|
|
|
|
Total operating costs and expenses |
|
| 2,273,517 |
|
|
| 2,025,894 |
|
|
|
|
|
|
|
|
|
|
Income (loss) from operations |
|
| (157,970 | ) |
|
| 73,161 |
|
|
|
|
|
|
|
|
|
|
Other income (expense): |
|
|
|
|
|
|
|
|
Gain on extinguishment of debt |
|
|
|
|
|
| 176,441 |
|
Interest expense |
|
| (45,396 | ) |
|
| (47,346 | ) |
|
|
|
|
|
|
|
|
|
Total other income (expense), net |
|
| (45,396 | ) |
|
| 129,095 |
|
|
|
|
|
|
|
|
|
|
Income (loss) before income taxes |
|
| (203,366 | ) |
|
| 202,256 |
|
|
|
|
|
|
|
|
|
|
Provision for income taxes |
|
| 1,832 |
|
|
| 1,555 |
|
|
|
|
|
|
|
|
|
|
Net income (loss) |
| $ | (205,198 | ) |
| $ | 200,701 |
|
|
|
|
|
|
|
|
|
|
Weighted average number of common shares outstanding – basic |
|
| 75,056,123 |
|
|
| 75,056,123 |
|
Weighted average number of common shares outstanding – diluted |
|
| 75,056,123 |
|
|
| 306,109,123 |
|
|
|
|
|
|
|
|
|
|
Net loss per common share – basic and diluted |
| $ | 0.00 |
|
| $ | 0.00 |
|
The accompanying notes are an integral part of the consolidated financial statements
| F-3 |
| Table of Contents |
FREEZE TAG, INC.
(A DELAWARE CORPORATION)
CONSOLIDATED STATEMENTS OF STOCKHOLDERS’ DEFICIT
Years Ended December 31, 2023 and 2022
|
| Series B Preferred Stock |
|
| Series C Preferred Stock |
|
| Common Stock |
|
| Additional Paid-in |
|
| Common Stock |
|
| Retained Earnings |
|
| Total Stockholders’ |
| |||||||||||||||||||
|
| Shares |
|
| Amount |
|
| Shares |
|
| Amount |
|
| Shares |
|
| Amount |
|
| Capital |
|
| Payable |
|
| (Deficit) |
|
| Equity |
| ||||||||||
|
|
|
|
|
|
|
|
|
|
|
|
|
|
|
|
|
|
|
|
|
|
|
|
|
|
|
|
|
|
| ||||||||||
Balance, December 31, 2021 |
|
| 2,480,482 |
|
| $ | 25 |
|
|
| 4,355,000 |
|
| $ | 44 |
|
|
| 75,056,123 |
|
| $ | 751 |
|
| $ | 9,252,845 |
|
| $ | 16,800 |
|
| $ | (9,574,272 | ) |
| $ | (303,807 | ) |
|
|
|
|
|
|
|
|
|
|
|
|
|
|
|
|
|
|
|
|
|
|
|
|
|
|
|
|
|
|
|
|
|
|
|
|
|
|
|
|
|
Imputed interest on related party debt |
|
| - |
|
|
| - |
|
|
| - |
|
|
| - |
|
|
| - |
|
|
| - |
|
|
| 37,984 |
|
|
| - |
|
|
| - |
|
|
| 37,984 |
|
Net income |
|
| - |
|
|
| - |
|
|
| - |
|
|
| - |
|
|
| - |
|
|
| - |
|
|
| - |
|
|
| - |
|
|
| 200,701 |
|
|
| 200,701 |
|
|
|
|
|
|
|
|
|
|
|
|
|
|
|
|
|
|
|
|
|
|
|
|
|
|
|
|
|
|
|
|
|
|
|
|
|
|
|
|
|
|
Balance, December 31, 2022 |
|
| 2,480,482 |
|
| $ | 25 |
|
|
| 4,355,000 |
|
| $ | 44 |
|
|
| 75,056,123 |
|
| $ | 751 |
|
| $ | 9,290,829 |
|
| $ | 16,800 |
|
| $ | (9,373,571 | ) |
| $ | (65,122 | ) |
|
|
|
|
|
|
|
|
|
|
|
|
|
|
|
|
|
|
|
|
|
|
|
|
|
|
|
|
|
|
|
|
|
|
|
|
|
|
|
|
|
Imputed interest on related party debt |
|
| - |
|
|
| - |
|
|
| - |
|
|
| - |
|
|
| - |
|
|
| - |
|
|
| 37,984 |
|
|
| - |
|
|
| - |
|
|
| 37,984 |
|
Net loss |
|
| - |
|
|
| - |
|
|
| - |
|
|
| - |
|
|
| - |
|
|
| - |
|
|
| - |
|
|
| - |
|
|
| (205,198 | ) |
|
| (205,198 | ) |
|
|
|
|
|
|
|
|
|
|
|
|
|
|
|
|
|
|
|
|
|
|
|
|
|
|
|
|
|
|
|
|
|
|
|
|
|
|
|
|
|
Balance, December 31, 2023 |
|
| 2,480,482 |
|
| $ | 25 |
|
|
| 4,355,000 |
|
| $ | 44 |
|
|
| 75,056,123 |
|
| $ | 751 |
|
| $ | 9,328,813 |
|
| $ | 16,800 |
|
| $ | (9,578,769 | ) |
| $ | (232,336 | ) |
The accompanying notes are an integral part of the consolidated financial statements
| F-4 |
| Table of Contents |
FREEZE TAG, INC.
(A DELAWARE CORPORATION)
CONSOLIDATED STATEMENTS OF CASH FLOWS
|
| Years Ended December 31, |
| |||||
|
| 2023 |
|
| 2022 |
| ||
Cash flows from operating activities: |
|
|
|
|
|
| ||
Net income (loss) |
| $ | (205,198 | ) |
| $ | 200,701 |
|
Adjustments to reconcile net income (loss) to net cash provided (used) by operating activities: |
|
|
|
|
|
|
|
|
Depreciation and amortization expense |
|
| 40,010 |
|
|
| 78,696 |
|
Imputed interest on related party debt |
|
| 37,984 |
|
|
| 37,984 |
|
Forgiveness of debt |
|
|
|
|
|
| (176,441 | ) |
Changes in operating assets and liabilities: |
|
|
|
|
|
|
|
|
Accounts receivable |
|
| (3,423 | ) |
|
| (3,705 | ) |
Prepaid expenses and other current assets |
|
| (6,646 | ) |
|
| (987 | ) |
Other assets |
|
|
|
|
|
| 3,450 |
|
Accounts payable |
|
| (20,699 | ) |
|
| 24,227 |
|
Accrued expenses |
|
| (9,635 | ) |
|
| 7,047 |
|
Other current and noncurrent liabilities |
|
| 2,207 |
|
|
| (5,640 | ) |
|
|
|
|
|
|
|
|
|
Net cash provided (used) by operating activities |
|
| (165,400 | ) |
|
| 165,332 |
|
|
|
|
|
|
|
|
|
|
Cash flows from investing activities: |
|
|
|
|
|
|
|
|
Capitalized software costs |
|
| (182,133 | ) |
|
| (167,015 | ) |
|
|
|
|
|
|
|
|
|
Net cash used by investing activities |
|
| (182,133 | ) |
|
| (167,015 | ) |
|
|
|
|
|
|
|
|
|
Cash flows from financing activities: |
|
|
|
|
|
|
|
|
Payments on notes payable |
|
| (10,268 | ) |
|
| (9,980 | ) |
|
|
|
|
|
|
|
|
|
Net cash used by financing activities |
|
| (10,268 | ) |
|
| (9,980 | ) |
|
|
|
|
|
|
|
|
|
Net change in cash |
|
| (357,801 | ) |
|
| (11,663 | ) |
Cash at the beginning of the year |
|
| 741,163 |
|
|
| 752,826 |
|
|
|
|
|
|
|
|
|
|
Cash at the end of the year |
| $ | 383,362 |
|
| $ | 741,163 |
|
Supplemental disclosure: |
|
|
|
|
|
|
|
|
Cash paid for income taxes |
| $ | 2,300 |
|
| $ | 7,555 |
|
Cash paid for interest |
| $ | 6,171 |
|
| $ | 840 |
|
The accompanying notes are an integral part of the consolidated financial statements
| F-5 |
| Table of Contents |
FREEZE TAG, INC.
(A DELAWARE CORPORATION)
NOTES TO CONSOLIDATED FINANCIAL STATEMENTS
Years Ended December 31, 2023 and 2022
NOTE 1 – THE COMPANY AND NATURE OF BUSINESS
Nature of Operations
Freeze Tag, Inc. (“Freeze Tag” or the “Company”) is a leading creator of mobile location-based games for consumers and businesses. The Company also offers gaming technology and services to businesses that want to leverage mobile gaming in their marketing and branding programs.
Beginning in the quarter ended March 31, 2020, our wholly-owned subsidiary, Space Coast Geo Store, LLC, a Florida limited liability company, sells merchandise to the geocaching industry. The LLC was filed with the State of Florida on September 3, 2019.
NOTE 2 – SUMMARY OF SIGNIFICANT ACCOUNTING POLICIES
Use of Estimates
The preparation of financial statements and related disclosures in conformity with U.S. generally accepted accounting principles (“U.S. GAAP”) requires the Company’s management to make judgments, assumptions and estimates that affect the amounts reported in its financial statements and accompanying notes. Management bases its estimates on historical experience and on various other assumptions it believes to be reasonable under the circumstances, the results of which form the basis for making judgments about the carrying values of assets and liabilities. Actual results may differ from these estimates and these differences may be material.
ResearchRevenue Recognition
The Company’s revenues are derived primarily by licensing software products in the form of mobile games for smartphone and Development Coststablet platforms. Revenue is recognized when control of the promised goods or services is transferred to our customers, in an amount that reflects the consideration the Company expects to be entitled to in exchange for those goods or services.
The Company charges costsdetermines revenue recognition through the following steps:
· | identification of the contract, or contracts, with a customer; | |
· | identification of the performance obligations in the contract; | |
· | determination of the transaction price; | |
· | allocation of the transaction price to the performance obligations in the contract; and | |
· | recognition of revenue when, or as, the Company satisfies a performance obligation. |
Cash and Cash Equivalents
For purposes of the Consolidated Statement of Cash Flows, the Company considers liquid investments with an original maturity of three months or less to be cash equivalents. The Company places its cash and cash equivalents with large commercial banks. The Federal Deposit Insurance Corporation (“FDIC”) insures these balances, up to $250,000. At December 31, 2023 and 2022 there were no cash equivalents.
| F-6 |
| Table of Contents |
Allowances for Sales Returns and Doubtful Accounts
The allowance for sales returns is based on the Company’s estimates of potential future product returns and other allowances related to research & development of products to generalcurrent period product revenue. The Company analyzes historical returns, current economic trends and administrative expense as incurred. The types of costs includedchanges in researchcustomer demand and development expenses include research materials, salaries, contractor fees, and support materials.
Intellectual Property Licenses (Prepaid Royalties)
Intellectual property license costs represent license fees paid to intellectual property rights holders for use of their trademarks or copyrights in the developmentacceptance of the Company’s products. Intellectual property license costs represent license fees paid to intellectual property rights holdersThe allowance for use of their trademarks, copyrights, software, technology, music or other intellectual property or proprietary rights indoubtful accounts is based on the developmentCompany’s assessment of the Company’s products. Depending uponcollectability of customer accounts and the agreement with the rights holder, the Company may obtain the rights to use acquired intellectual property in multiple products over multiple years, or alternatively, for a single product. Minimum guaranteed royalty payments for intellectual property licenses are initially recorded as an asset (prepaid royalties or prepaid licensing fees), and a current liability, (accrued royalties payable) at the contractual amount upon executionaging of the contract whenrelated invoices, and represents the Company’s best estimate of probable credit losses in its existing trade accounts receivable. The Company regularly reviews the allowance by considering factors such as historical experience, credit quality, the age of the accounts receivable balances, and current economic conditions that may affect a customer’s ability to pay. The Company determined that no significant performance remains withallowances for sales returns and doubtful accounts were required at December 31, 2023 and 2022.
Property and Equipment
Property and equipment is stated at cost and is depreciated or amortized using the licensor. Commencing uponstraight-line method over the estimated useful life of the related product’s release date, intellectual property licenses costs are amortized to “Cost of Sales – Licensing” based upon the percentage of revenue outlined in the contract with each specific licensor. Generally, the Company’s intellectual property licensing contracts call for licensors to be paid a percentage of revenue actually received by the Company, with allowances for minimum guarantees. Sometimes, the terms of the specific licensing contracts allow for the Company to re-capture expenses before licensing out royalties are calculated.asset as follows:
Vehicles | 5 years |
Computer equipment | 5 years |
Office furniture and equipment | 7 years |
Capitalized intellectual property costs for those products that are cancelled or abandoned
Maintenance and repairs are charged to product development expense as incurred. Significant renewals and betterments will be capitalized. At the time of retirement or other disposition of equipment, the cost and accumulated depreciation will be removed from the accounts and the resulting gain or loss, if any, will be reflected in operations.
The Company will assess the recoverability of property and equipment by determining whether the depreciation and amortization of these assets over their remaining life can be recovered through projected undiscounted future cash flows. The amount of equipment impairment, if any, will be measured based on fair value and is charged to operations in the period of cancellation.in which such impairment is determined by management.
As of December 31, 2016 and 2015, prepaid royalties (or prepaid licensing fees) were $4,430 and $4,507, respectively.Intangible Assets
Recent Accounting Pronouncements
In JanuaryIntangible assets consist primarily of intellectual property, customer base and non-compete agreements acquired in 2017, the FASB issued Accounting Standards Update (“ASU”) No. 2017-4, “Intangibles – Goodwill and Other (Topic 350): “Simplifying the Test for Goodwill Impairment.” This update simplifies how an entity is required to test goodwillwhich are amortized on a straight-line basis over their estimated useful lives of 5 years. Intangible assets are reviewed for impairment by eliminating Step 2 fromannually or more frequently whenever events or changes in circumstances indicate the goodwill impairment test. Step 2 measures a goodwill impairment loss by comparing the implied faircarrying value of a reporting unit’s goodwill withmay not be recoverable. If the carrying amount of that goodwill. Instead, under the amendments in this update, an entity should perform its annual, or interim, goodwill impairment test by comparingasset exceeds the fair valueexpected undiscounted cash flows of a reporting unit with its carrying amount. An entity should recognizethe asset, an impairment charge foris recognized equal to the amount by which the carrying amount exceeds the reporting unit’s fair value. An entity should applyThe testing of these intangibles under established guidelines for impairment requires significant use of judgment and assumptions. Changes in forecasted operations and other assumptions could materially affect the amendmentsestimated fair values. Changes in this update on a prospective basis. An entity is requiredbusiness conditions could potentially require adjustments to disclosethese asset valuations. At December 31, 2023 and 2022, the nature ofCompany reviewed the intangible assets and reason for the change in accounting principle upon transition. That disclosure should be provided in the first annual period and in the interim period within the first annual period when the entity initially adopts the amendments in this update. A public business entitydetermined that is an SEC filer should adopt the amendments in this Update for its annual or any interim goodwillno impairment tests in fiscal years beginning after December 15, 2019. The Company is currently unable to determine the impact on its financial statements of the adoption of this new accounting pronouncement.was required.
In January 2017,The Company’s adoption of ASU 2016-02, Leases (Topic 842), and subsequent ASUs related to Topic 842, requires it to recognize substantially all leases on the FASB issued ASU No. 2017-1, “Business Combinations (Topic 805): Clarifying the Definition ofbalance sheet as an ROU asset and a Business.”corresponding lease liability. The amendments innew guidance also requires additional disclosures as detailed below. The Company adopted this update clarify the definition of a business with the objective of adding guidance to assist entities with evaluating whether transactions should be accounted for as acquisitions (or disposals) of assets or businesses. The definition of a business affects many areas of accounting including acquisitions, disposals, goodwill, and consolidation. The amendments of this ASU are effective for public business entities for annual periods beginning after December 15, 2018, and interim periods within annual periods beginning after December 15, 2019. The amendments in this Update are to be applied prospectivelystandard on or after the effective date.date of January 1, 2019 and used this effective date as the date of initial application. Under this application method, the Company was not required to restate prior period financial information or provide Topic 842 disclosures for prior periods. The Company elected the ‘package of practical expedients,’ which permitted it to not reassess prior conclusions related to lease identification, lease classification, and initial direct costs, and the Company did not elect the use of hindsight.
The Company determines if a contract is currently unable to determinea lease at the impact on its financial statementsinception of the adoption of this new accounting pronouncement.
In August 2016, the FASB issued ASU No. 2016-15, “Statement of Cash Flows (Topic 230): Classification of Certain Cash Receipts and Cash Payments.” This ASU addresses eight specific cash flow issues with the objective of reducing the existing diversity in practice. The amendments in this ASU are effective for public business entities for fiscal years beginning after December 15, 2017, and interim periods within those fiscal years. Early adoption is permitted.arrangement. The Company is currently unablereviews all options to determineextend, terminate, or purchase the impact on its financial statementsROU assets, and when reasonably certain to exercise, it includes the option in the determination of the adoption of this new accounting pronouncement.
Although there are several other new accounting pronouncements issued or proposed by the FASB,lease term and lease liability. The Company had one operating lease related to it's office space in Texas which theended in December 2021. The Company has adopted or will adopt, as applicable, the Company does not believe any of these accounting pronouncements has had or will have a material impact on its financial position or results of operations.
NOTE 3 – GOING CONCERN
As shownrecognized $0 in the accompanying financial statements, the Company incurred net losses of $2,129,419 and $1,870,677operating lease costs for the years ended December 31, 20162023 and 2015, respectively. As2022.
Lease ROU assets and liabilities are recognized at commencement date of December 31, 2016, the Company’s accumulated deficit was $11,113,929. Duringlease, based on the years ended December 3l, 2016present value of lease payments over the lease term. The lease ROU asset also includes any lease payments made and 2015,excludes any lease incentives. When readily determinable, the Company experienced negative cash flows from operations largely due to its continued investment spending for product developmentuses the implicit rate in determining the present value of game titles for smartphones and tablets that are expected to benefit future periods. Those facts, along with our lack of access to a significant bank credit facility, createlease payments. When leases do not provide an uncertainty about the Company’s ability to continue as a going concern. Accordingly,implicit rate, the Company is currently evaluatingwill use its alternatives to secure financing sufficient to supportincremental borrowing rate based on the operating requirementsinformation available at the lease commencement date, including the lease term.
Concentrations of its current business plan, as well as continuing to execute its business strategy of distributing game titles to digital distribution outlets, including mobile gaming app stores,Credit Risk, Major Customers and opportunities for new devices such as tablet (mobile internet device) applications, mobile gaming platforms and international licensing opportunities.Major Vendors
The Company’s ability to continue ascustomers are the end-consumers that purchase its games from the websites where the Company has its games listed for sale. Therefore, the Company does not have any individual customers that represent any more than a going concern is dependent uponfraction of its success in securing sufficient financing and in successfully executing its plans to return to positive cash flows during fiscal year 2017. The Company’s financial statements do not include any adjustments that might be necessary if it were unable to continue as a going concern.revenue.
Income Taxes
The Company accounts for income taxes using ASC Topic 740, Income Taxes. Under ASC Topic 740, income taxes are accounted for under the asset and liability method. Deferred tax assets and liabilities are recognized for the future tax consequences attributable to differences between the financial statement carrying amounts of existing assets and liabilities and their respective tax bases and operating loss and tax credit carry forwards. Deferred tax assets and liabilities are measured using enacted tax rates expected to apply to taxable income in the years in which those temporary differences are expected to be recovered or settled. The effect on deferred tax assets and liabilities of a change in tax rates is recognized in income in the period that includes the enactment date.
| Table of Contents |
NOTE 4 – ACCRUED EXPENSES
Accrued expenses consistedASC Topic 740 includes accounting guidance which clarifies the accounting for the uncertainty in recognizing income taxes in an organization by providing detailed guidance for financial statement recognition, measurement and disclosure involving uncertain tax positions. This guidance requires an uncertain tax position to meet a more-likely-than-not recognition threshold at the effective date to be recognized both upon the adoption of the following at December 31:
2016 2015 Accrued vacation Accrued royalties Technology payable Other $ 66,194 $ 64,461 410,533 408,134 18,000 18,000 746 1,417 $ 495,473 $ 492,012
Accrued royalties consist of amounts owed to other parties with whom the Company has revenue-sharing agreements or from whom it licenses certain trademarks or copyrights.
Unearned royalties consist of royalties received from licensees, which have not yet been earned. Unearned royalties were $127,201related guidance and $195,033 at December 31, 2016 and 2015, respectively.
As of December 31, 2016 and 2015, the Company had technology payable of $18,000 resulting from a technology transfer agreement with an unrelated party entered into in June 2011, payable in 24 installments of $1,500 without interest.
NOTE 5 – DEBT
Notes Payable
On February 1, 2016, the Company entered into a Game Marketing Agreement with an investor whereby the investor agreed, at its option, to loan up to $250,000 (the “Marketing Fund”) to the Company to exclusively fund user acquisition efforts for the game Kitty Pawp (the “Game”). The investor will receive 50% of Net Receipts (as defined in the agreement) from the Game until the Marketing Fund is fully recouped. Once the Marketing Fund is recouped, the investor will receive 50% of Net Receipts from the Game until the investor receives a 50% return on the Marketing Funds advanced.subsequent periods.
The Company has recorded Marketing Fund advances as notes payable in the accompanying condensed balance sheets. Upon receiving a Marketing Fund advance, the Company accrues the 50% return as interest expense and includes the obligation in accrued interest payable in the accompanying condensed balance sheets. As of December 31, 2016, total advances recorded as notes payable were $58,096 and accrued interest payable included a total of $22,046no uncertain tax positions at any of the 50% guaranteed return, net of repayments.dates presented.
Convertible Notes Payable – Related Party
Convertible notes payable, related party consisted of the following at December 31:
2016 2015 Convertible note payable to the Holland Family Trust, maturing on December 31, 2017, with interest at 10% Convertible note payable to Craig Holland, maturing on December 31, 2017, with interest at 10% Convertible note payable to Craig Holland, maturing on December 31, 2017, with interest at 10% Convertible note payable to Mick Donahoo, maturing on December 31, 2017, with interest at 10% Convertible note payable to Craig Holland, maturing on December 31, 2017, with interest at 10% Convertible note payable to Mick Donahoo, maturing on December 31, 2017, with interest at 10% Total $ 222,572 $ 222,572 813,602 813,602 186,450 186,450 186,450 186,450 6,925 6,925 31,042 31,042 $ 1,447,041 $ 1,447,041
The “Holland Family Trust Convertible Note” is convertible into Company common stock at the greater of (i) the Variable Conversion Price and (ii) the Fixed Conversion Price. The “Variable Conversion Price” shall mean 50% multiplied by the Market Price (representing a discount rate of 50%). “Market Price” means the average of the three lowest trading prices for the Company’s common stock during the twenty-five (25) trading-day period ending on the latest complete trading day prior to the date of conversion. “Fixed Conversion Price” shall mean $0.00005.Foreign Currency Translation
The Company evaluatedderives a portion of its revenue from foreign countries, but customers pay in U.S. Dollars. Therefore, no adjustments are required in the Holland Family Trust Convertible Note and determined that the shares issuable pursuant to the conversion option were determinate due to the Fixed Conversion Price and, as such, does not constitute a derivative liability as the Company has obtained authorization from a majority of shareholders such that should conversion occur at the Fixed Conversion Price the appropriate number of shares will be available or issuableaccompanying consolidated financial statements for settlement to occur. The note payable is convertible into common stock at the discretion of the Holland Family Trust. Furthermore, at any time, the Company may pay the balance of the unconverted note payable in cash.foreign currency transactions.
As of September 30, 2014, $72,107 of accrued interest was added to the note principal and $813,602 of the note was transferred to Craig Holland. A new convertible note for $222,572 was issued to the Holland Family Trust with the same terms as the previous note, with the exception of the maturity date, which was extended to December 31, 2017. As of December 31, 2016 and 2015, accrued interest related to the Holland Family Trust Convertible Note was $50,124 and $27,867, respectively.
On September 30, 2014, $813,602 principal balance (including interest) of the Holland Family Trust Convertible Note was transferred to Craig Holland (the “Holland Transferred Convertible Note”). The Holland Transferred Convertible Note retains the same terms as the original Holland Family Trust Convertible Note with the exception of the maturity date, which was extended to December 31, 2017. As of December 31, 2016 and 2015, accrued interest related to the Holland Transferred Convertible Note was $183,228 and $101,867, respectively.
On December 31, 2013, the Company converted $186,450 of accrued salaries due to Craig Holland into a convertible note (the “Holland Accrued Salary Note”) and converted $186,450 of accrued salaries due to Mick Donahoo into a convertible note (the “Donahoo Accrued Salary Note”). The Holland Accrued Salary Note and the Donahoo Accrued Salary Note are convertible into Company common stock at the greater of (i) the Variable Conversion Price and (ii) the Fixed Conversion Price. The “Variable Conversion Price” shall mean 50% multiplied by the Market Price (representing a discount rate of 50%). “Market Price” means the average of the three lowest trading prices for the Company’s common stock during the twenty-five (25) trading-day period ending on the latest complete trading day prior to the Conversion Date. “Fixed Conversion Price” shall mean $0.00005. The maturity date of the note has been extended to December 31, 2017.Stock-Based Compensation
The Company evaluatedaccounts for stock-based compensation in accordance with ASC Topic 718-10, Compensation-Stock Compensation and ASC Subtopic 505-50, Equity-Based Payments to Non-Employees. Stock-based compensation expense recognized during the Holland Accrued Salary Note andrequisite services period is based on the Donahoo Accrued Salary Note and determined that the shares issuable pursuant to the conversion option were determinate due to the Fixed Conversion Price and, as such, the conversion feature does not constitute a derivative liability as the Company has obtained authorization from a majorityvalue of shareholders such that should conversion occurshare-based payment awards after reduction for estimated forfeitures. Forfeitures are estimated at the Fixed Conversion Price the appropriate numbertime of shares will be available or issuable for settlement to occur. As of December 31, 2016grant and December 31, 2015, there was accrued interest related to each of these notes of $55,935 and $37,290, respectively.
On December 31, 2013, the Company converted a note payable to Mick Donahoo of $55,250 and accrued interest of $15,399 into a new convertible related party noteare revised, if necessary, in the amount of $70,649 (the “Mick Donahoo Convertible Note”).
On December 31, 2013, the Company converted a note payable to Craig Holland of $35,100 and accrued interest of $11,432 into a new convertible related party note in the amount of $46,532 (the “Craig Holland Convertible Note”).
The Mick Donahoo Convertible Note and the Craig Holland Convertible Note are convertible into Company common stock at the greater of (i) the Variable Conversion Price and (ii) the Fixed Conversion Price. The “Variable Conversion Price” shall mean 50% multiplied by the Market Price (representing a discount rate of 50%). “Market Price” means the average of the three lowest trading prices for the Company’s common stock during the twenty-five (25) trading-day period ending on the latest complete trading day prior to the Conversion Date. “Fixed Conversion Price” shall mean $0.00005. The maturity date of the notes have been extended to December 31, 2017.subsequent periods if actual forfeitures differ from those estimates.
The Company evaluated the Mick Donahoo Convertible Note and the Craig Holland Convertible Note and determined that the shares issuable pursuant to the conversion option were determinate due to the Fixed Conversion Price and, as such, does not constitute a derivative liability as the Company has obtained authorization from a majorityhad stock-based compensation expense recognized in its consolidated statements of shareholders such that should conversion occur at the Fixed Conversion Price the appropriate numberoperations of shares will be available or issuable for settlement to occur. The agreements modified the debt to make it convertible into common stock of the Company. As of December 31, 2016 and December 31, 2015, there was accrued interest payable related to these notes totaling of $8,943 and $5,146, respectively.
On October 23, 2014, Craig Holland converted $35,000 principal and $2,836 accrued interest into 39,829,849 shares of the Company’s common stock.
On October 23, 2014, Mick Donahoo converted $35,000 principal and $2,836 accrued interest into 39,829,849 shares of the Company’s common stock.
On October 8, 2015, Craig Holland converted $4,607 principal and $2,028 accrued interest into 12,637,860 shares of the Company’s common stock.
On October 8, 2015, Mick Donahoo converted $4,607 principal and $2,028 accrued interest into 12,637,860 shares of the Company’s common stock.
Effective October 15, 2015, we entered into an Amendment to Convertible Promissory Note with each of Craig Holland and Mick Donahoo with respect to the Craig Holland Convertible Note and the Mick Donahoo Convertible Note. The parties agreed to modify the terms of the notes such that in the event the lender issues a valid conversion notice and the conversion notice results in a conversion price less than the then-par value of the Company’s common stock, the conversion will be effected at par value with additional principal amounts added to the note equal to the value of the common shares that were not able to be issued due to the conversion price being less than the par value of the Company’s common stock. As the amendment did not alter the shares received by converting the notes, no additional value was recorded by the Company as a result of these amendments.
Total accrued interest payable for the related party convertible notes was $354,165 and $209,461 as of December 31, 2016 and 2015, respectively.
Convertible Notes Payable – Non-Related Party
Convertible notes payable – non-related party consisted of the following at December 31:
2016 2015 Convertible note payable to Robert Cowdell, maturing on December 31, 2017, with interest at 10% Tranche #2 from 12/20/2013 $500,000 convertible note payable to an accredited investor, payable on demand, but due no later than December 20, 2018, with interest at 10% Tranche #3 from 12/20/2013 $500,000 convertible note payable to an accredited investor, payable on demand, but due no later than December 20, 2018, with interest at 10% Tranche #4 from 12/20/2013 $500,000 convertible note payable to an accredited investor, payable on demand, but due no later than December 20, 2018, with interest at 10% Tranche #5 from 12/20/2013 $500,000 convertible note payable to an accredited investor, payable on demand, but due no later than December 20, 2018, with interest at 10% Tranche #6 from 12/20/2013 $500,000 convertible note payable to an accredited investor, payable on demand, but due no later than December 20, 2018, with interest at 10% $ 61,443 $ 61,443 14,966 31,126 50,000 50,000 50,000 50,000 50,000 50,000 50,000 50,000
Tranche #1 from 6/25/14 $500,000 convertible note payable to an accredited investor, maturing on June 25, 2017, with interest at 10% Tranche #2 from 6/25/14 $500,000 convertible note payable to an accredited investor, maturing on June 25, 2017, with interest at 10% Tranche #3 from 6/25/14 $500,000 convertible note payable to an accredited investor, maturing on June 25, 2017, with interest at 10% Tranche #4 from 6/25/14 $500,000 convertible note payable to an accredited investor, maturing on June 25, 2017, with interest at 10% Tranche #5 from 6/25/14 $500,000 convertible note payable to an accredited investor, maturing on June 25, 2017, with interest at 10% Tranche #6 from 6/25/14 $500,000 convertible note payable to an accredited investor, maturing on June 25, 2017, with interest at 10% Tranche #7 from 6/25/14 $500,000 convertible note payable to an accredited investor, maturing on June 25, 2017, with interest at 10% Tranche #8 from 6/25/14 $500,000 convertible note payable to an accredited investor, maturing on June 25, 2017, with interest at 10% Tranche #9 from 6/25/14 $500,000 convertible note payable to an accredited investor, maturing on June 25, 2017, with interest at 10% Tranche #1 from 2/11/15 $500,000 convertible note payable to an accredited investor, payable on demand, but due no later than February 11, 2020, with interest at 10% Tranche #2 from 2/11/15 $500,000 convertible note payable to an accredited investor, payable on demand, but due no later than February 11, 2020, with interest at 10% Tranche #3 from 2/11/15 $500,000 convertible note payable to an accredited investor, payable on demand, but due no later than February 11, 2020, with interest at 10% Tranche #4 from 2/11/15 $500,000 convertible note payable to an accredited investor, payable on demand, but due no later than February 11, 2020, with interest at 10% Tranche #5 from 2/11/15 $500,000 convertible note payable to an accredited investor, payable on demand, but due no later than February 11, 2020, with interest at 10% Tranche #6 from 2/11/15 $500,000 convertible note payable to an accredited investor, payable on demand, but due no later than February 11, 2020, with interest at 10% Tranche #1 from 7/28/15 $500,000 convertible note payable to an accredited investor, payable on demand, but due no later than July 28, 2020, with interest at 10% Tranche #2 from 7/28/15 $500,000 convertible note payable to an accredited investor, payable on demand, but due no later than July 28, 2020, with interest at 10% 33,727 50,000 50,000 50,000 50,000 50,000 50,000 50,000 50,000 50,000 100,000 100,000 50,000 50,000 70,000 70,000 30,000 30,000 30,000 30,000 40,000 40,000 110,000 110,000 88,000 88,000 90,000 90,000 90,000 90,000 65,000 65,000 65,000 65,000
Tranche #3 from 7/28/15 $500,000 convertible note payable to an accredited investor, payable on demand, but due no later than July 28, 2020, with interest at 10% Tranche #4 from 7/28/15 $500,000 convertible note payable to an accredited investor, payable on demand, but due no later than July 28, 2020, with interest at 10% Tranche #5 from 7/28/15 $500,000 convertible note payable to an accredited investor, payable on demand, but due no later than July 28, 2020, with interest at 10% Tranche #6 from 7/28/15 $500,000 convertible note payable to an accredited investor, payable on demand, but due no later than July 28, 2020, with interest at 10% Tranche #7 from 7/28/15 $500,000 convertible note payable to an accredited investor, payable on demand, but due no later than July 28, 2020, with interest at 10% Tranche #8 from 7/28/15 $500,000 convertible note payable to an accredited investor, payable on demand, but due no later than July 28, 2020, with interest at 10% Tranche #9 from 7/28/15 $500,000 convertible note payable to an accredited investor, payable on demand, but due no later than July 28, 2020, with interest at 10% Tranche #1 from 4/7/16 $600,000 convertible note payable to an accredited investor, payable on demand, but due no later than April 7, 2021, with interest at 10% Tranche #2 from 4/7/16 $600,000 convertible note payable to an accredited investor, payable on demand, but due no later than April 7, 2021, with interest at 10% Tranche #3 from 4/7/16 $600,000 convertible note payable to an accredited investor, payable on demand, but due no later than April 7, 2021, with interest at 10% Tranche #4 from 4/7/16 $600,000 convertible note payable to an accredited investor, payable on demand, but due no later than April 7, 2021, with interest at 10% Tranche #5 from 4/7/16 $600,000 convertible note payable to an accredited investor, payable on demand, but due no later than April 7, 2021, with interest at 10% Tranche #6 from 4/7/16 $600,000 convertible note payable to an accredited investor, payable on demand, but due no later than April 7, 2021, with interest at 10% Tranche #7 from 4/7/16 $600,000 convertible note payable to an accredited investor, payable on demand, but due no later than April 7, 2021, with interest at 10% Tranche #8 from 4/7/16 $600,000 convertible note payable to an accredited investor, payable on demand, but due no later than April 7, 2021, with interest at 10% 60,000 60,000 50,000 50,000 50,000 50,000 55,000 55,000 25,000 - 55,000 - 50,000 - 60,000 - 45,000 - 55,000 - 27,000 - 10,000 - 48,000 - 24,000 - 50,000 -
Tranche #9 from 4/7/16 $600,000 convertible note payable to an accredited investor, payable on demand, but due no later than April 7, 2021, with interest at 10% Tranche #10 from 4/7/16 $600,000 convertible note payable to an accredited investor, payable on demand, but due no later than April 7, 2021, with interest at 10% Tranche #11 from 4/7/16 $600,000 convertible note payable to an accredited investor, payable on demand, but due no later than April 7, 2021, with interest at 10% Tranche #12 from 4/7/16 $600,000 convertible note payable to an accredited investor, payable on demand, but due no later than April 7, 2021, with interest at 10% Net Less current portion Long-term portion 50,000 - 50,000 - 45,000 - 45,000 -
Total2,192,136 1,585,569
Less discount(239,402 ) (180,208 ) 1,952,734 1,405,361 1,952,734 718,923 $ - $ 686,438
On December 31, 2013, the Company converted $55,429 of convertible debt and $6,014 in accrued interest due to Robert Cowdell (the “Convertible Cowdell Note”) into a convertible note. The Convertible Cowdell Note is convertible into Company common stock at the greater of (i) the Variable Conversion Price and (ii) the Fixed Conversion Price. The “Variable Conversion Price” shall mean 50% multiplied by the Market Price (representing a discount rate of 50%). “Market Price” means the average of the three lowest trading prices for the Company’s common stock during the twenty-five (25) trading-day period ending on the latest complete trading day prior to the Conversion Date. “Fixed Conversion Price” shall mean $0.00005. The maturity date of the note has been extended to December 31, 2017. The Convertible Cowdell Note had accrued interest of $18,433 and $12,289 as of December 31, 2016 and December 31, 2015, respectively.
The Company evaluated the Convertible Cowdell Note and determined that the shares issuable pursuant to the conversion option were determinate due to the Fixed Conversion Price and, as such, does not constitute a derivative liability as the Company has obtained authorization from a majority of shareholders such that should conversion occur at the Fixed Conversion Price the appropriate number of shares will be available or issuable for settlement to occur. The agreement modified the debt to make it convertible into common stock of the Company.
The $500,000 principal amount convertible note dated December 20, 2013 to an accredited investor (“Accredited Investor #1”) with an outstanding balance of $214,966 at December 31, 2016 was funded in $50,000 tranches in January, February, March, April and May 2014. The note is convertible into Company common stock at the greater of (i) the Variable Conversion Price and (ii) the Fixed Conversion Price. The “Variable Conversion Price” shall mean 50% multiplied by the Market Price (representing a discount rate of 50%). “Market Price” means the average of the three lowest trading prices for the Company’s common stock during the twenty-five (25) trading-day period ending on the latest complete trading day prior to the Conversion Date. “Fixed Conversion Price” shall mean $0.00005. The note also includes conversion price reset features that are triggered when the Company issues certain new equity instruments; as a result, this feature caused the Company to consider this feature a derivative liability. The maturity date of the note initially was one year from the date of funding, but was subsequently extended and changed to be such that the note amount is payable upon demand (with ten days written notice) by the accredited investor, but in no event later than sixty months from the effective date, which means the current maturity date is December 20, 2018.
The $500,000 principal amount convertible note dated June 25, 2014 to an accredited investor (“Accredited Investor #2”) with an outstanding balance of $483,727 at December 31, 2016 was funded in $50,000 tranches in June, July, August, September, October, and December 2014, and tranches of $100,000 in November 2014, $70,000 in January 2015, and $30,000 in February 2015. The note is convertible into Company common stock at the greater of (i) the Variable Conversion Price and (ii) the Fixed Conversion Price. The “Variable Conversion Price” shall mean 50% multiplied by the Market Price (representing a discount rate of 50%). “Market Price” means the average of the three lowest trading prices for the Company’s common stock during the twenty-five (25) trading-day period ending on the latest complete trading day prior to the Conversion Date. “Fixed Conversion Price” shall mean $0.00005. The note also includes conversion price reset features that are triggered when the Company issues certain new equity instruments; as a result, this feature caused the Company to consider this feature a derivative liability. The maturity date of the note initially was one year from the date of funding, with the maturity date subsequently extended to June 25, 2017.
The $500,000 principal amount convertible note dated February 11, 2015 to Accredited Investor #2 with an outstanding balance of $448,000 at December 31, 2016 was funded by tranches of $30,000 in February 2015, $40,000 in February 2015, $110,000 in March 2015, $88,000 in April 2015, $90,000 in May and June 2015. The note is convertible into Company common stock at the lesser of (i) the Variable Conversion Price and (ii) the Fixed Conversion Price. The “Variable Conversion Price” shall mean 50% multiplied by the Market Price (representing a discount rate of 50%). “Market Price” means the average of the three (3) lowest trade prices on three (3) separate trading days of Common Stock recorded after the original Effective Date of the note. “Fixed Conversion Price” shall mean $0.003. The note also includes conversion price reset features that are triggered when the Company issues certain new equity instruments; as a result, this feature caused the Company to consider this feature a derivative liability. The maturity date of the note initially was nine months from the date of funding, but was subsequently extended and changed to be such that the note amount is payable upon demand (with ten days written notice) by the accredited investor, but in no event later than sixty months from the effective date, which means the current maturity date is February 11, 2020.
The $500,000 principal amount convertible note dated July 28, 2015 to Accredited Investor #2 with an outstanding balance of $475,000 at December 31, 2016 was funded by tranches of $65,000 in July and August 2015, $60,000 in September 2015, $50,000 in October and November 2015, $55,000 in December 2015, $25,000 in January 2016, $55,000 in February 2016, and $50,000 in March 2016. The note is convertible into Company common stock at the lesser of (i) the Variable Conversion Price and (ii) the Fixed Conversion Price. The “Variable Conversion Price” shall mean 50% multiplied by the Market Price (representing a discount rate of 50%). “Market Price” means the average of the three (3) lowest trade prices on three (3) separate trading days of Common Stock recorded after the original Effective Date of the note. “Fixed Conversion Price” shall mean $0.003. The note also includes conversion price reset features that are triggered when the Company issues certain new equity instruments; as a result, this feature caused the Company to consider this feature a derivative liability. The maturity date of the note initially was nine months from the date of funding, but was subsequently extended and changed to be such that the note amount is payable upon demand (with ten days written notice) by the accredited investor, but in no event later than sixty months from the effective date, which means the current maturity date is July 28, 2020.
The $600,000 principal amount convertible note, dated April 7, 2016 and amended on January 18, 2017, to Accredited Investor #2 with an outstanding balance of $509 at December 31, 2016 was funded by tranches of $60,000 in April 2016, $45,000 in May 2016, $55,000, $27,000 and $10,000 in June 2016, $48,000 and $24,000 in July 2016, $50,000 in August 2016, $50,000 in September 2016, $50,000 in October 2016 and $45,000 in November and December 2016. The note is convertible into Company common stock at the lesser of (i) the Variable Conversion Price and (ii) the Fixed Conversion Price. The “Variable Conversion Price” shall mean 50% multiplied by the Market Price (representing a discount rate of 50%). “Market Price” means the average of the three (3) lowest trade prices on three (3) separate trading days of Common Stock recorded after the original Effective Date of the note. “Fixed Conversion Price” shall mean $0.003. The note also includes conversion price reset features that are triggered when the Company issues certain new equity instruments; as a result, this feature caused the Company to consider this feature a derivative liability. The maturity date of the note was extended and changed to be such that the note amount is payable upon demand (with ten days written notice) by the accredited investor, but in no event later than sixty months from the effective date, which means the current maturity date is April 7, 2021.
The January 2014 derivative was valued as of January 6, 2014 at $44,493, of which all was recorded as a debt discount. The debt discount was fully amortized to interest expense at December 31, 2016. The January 2014 note had accrued interest of $4,025 and $5,814 as of December 31, 2016 and 2015, respectively.
The February 2014 derivative was valued as of February 18, 2014 at $44,556, which was recorded as a debt discount. The debt discount was fully amortized to interest expense at December 31, 2016. The February 2014 note had accrued interest of $14,329 and $9,329 as of December 31, 2016 and 2015, respectively.
The March 2014 derivative was valued as of March 26, 2014 at $77,884, of which $50,000 was recorded as a debt discount with the remaining amount that exceeded the face value of the note expensed. The debt discount was fully amortized to interest expense at December 31, 2016. The March 2014 note had accrued interest of $13,836 and $8,836 as of December 31, 2016 and 2015, respectively.
The April 2014 derivative was valued as of April 25, 2014 at $90,605, of which $50,000 was recorded as a debt discount with the remaining amount that exceeded the face value of the note expensed. The debt discount was fully amortized to interest expense at December 31, 2016. The April 2014 note had accrued interest of $13,425 and $8,425 as of December 31, 2016 and 2015, respectively.
The May 2014 derivative was valued as of May 21, 2014 at $95,029, of which $50,000 was recorded as a debt discount with the remaining amount that exceeded the face value of the note expensed. The debt discount was fully amortized to interest expense at December 31, 2016. The May 2014 note had accrued interest of $13,068 and $8,068 as of December 31, 2016 and 2015, respectively.
The June 2014 derivative was valued as of June 25, 2014 at $83,184, of which $50,000 was recorded as a debt discount with the remaining amount that exceeded the face value of the note expensed. The debt discount was fully amortized to interest expense at December 31, 2016. The June 2014 note had accrued interest of $8,470 and $7,575 as of December 31, 2016 and 2015, respectively.
The July 2014 derivative was valued as of July 15, 2014 at $73,999, of which $50,000 was recorded as a debt discount with the remaining amount that exceeded the face value of the note expensed. The debt discount was fully amortized to interest expense at December 31, 2016. The July 2014 note had accrued interest of $12,301 and $7,301 as of December 31, 2016 and 2015, respectively.
The August 2014 derivative was valued as of August 19, 2014 at $64,104, of which $50,000 was recorded as a debt discount with the remaining amount that exceeded the face value of the note expensed. The debt discount was fully amortized to interest expense at December 31, 2016. The August 2014 note had accrued interest of $11,836 and $6,836 as of December 31, 2016 and 2015, respectively.
The September 2014 derivative was valued as of September 17, 2014 at $62,915, of which $50,000 was recorded as a debt discount with the remaining amount that exceeded the face value of the note expensed. The debt discount was fully amortized to interest expense at December 31, 2016. The September 2014 note had accrued interest of $11,438 and $6,438 as of December 31, 2016 and 2015, respectively.
The October 2014 derivative was valued as of October 13, 2014 at $63,347, of which $50,000 was recorded as a debt discount with the remaining amount that exceeded the face value of the note expensed. The debt discount was fully amortized to interest expense at December 31, 2016. The October 2014 note had accrued interest of $11,068 and $6,069 as of December 31, 2016 and 2015, respectively.
The November 2014 derivative was valued as of November 7, 2014 at $99,757, which was recorded as a debt discount. The debt discount was fully amortized to interest expense at December 31, 2016. The November 2014 note had accrued interest of $21,644 and $11,644 as of December 31, 2016 and 2015, respectively.
The December 2014 derivative was valued as of December 17, 2014 at $58,456, of which $50,000 was recorded as a debt discount with the remaining amount that exceeded the face value of the note expensed. The debt discount was fully amortized to interest expense at December 31, 2016. The December 2014 note had accrued interest of $10,178 and $5,178 as of December 31, 2016 and 2015, respectively.
The January 2015 derivative was valued as of January 14, 2015 at $29,360, which was recorded as a debt discount. During the year ended December 31, 2016, $1,126 was amortized from the debt discount. The debt discount was fully amortized to interest expense at December 31, 2016. The January 2015 note had accrued interest of $13,751 and $6,751 as of December 31, 2016 and 2015, respectively.
The first February 2015 derivative was valued as of February 10, 2015 at $23,984, which was recorded as a debt discount. During the year ended December 31, 2016, $2,694 was amortized from the debt discount. The debt discount was fully amortized to interest expense at December 31, 2016. The first February 2015 note had accrued interest of $5,671 and $2,671 as of December 31, 2016 and 2015, respectively.
The second February 2015 derivative was valued as of February 11, 2015 at $18,003, which was recorded as a debt discount. The debt discount was fully amortized to interest expense at December 31, 2016. The second February 2015 note had accrued interest of $5,669 and $2,663 as of December 31, 2016 and 2015, respectively.
The third February 2015 derivative was valued as of February 25, 2015 at $19,494, which was recorded as a debt discount. The debt discount was fully amortized to interest expense at December 31, 2016. The third February 2015 note had accrued interest of $11,096 and $5,096 as of December 31, 2016 and 2015, respectively.
The March 2015 derivative was valued as of March 10, 2015 at $31,885, which was recorded as a debt discount. The debt discount was fully amortized to interest expense at December 31, 2016. The March 2015 note had accrued interest of $19,951 and $8,951 as of December 31, 2016 and 2015, respectively.
The April 2015 derivative was valued as of April 17, 2015 at $31,397, which was recorded as a debt discount. During the year ended December 31, 2016, $1,941 was amortized from the debt discount. The debt discount was fully amortized to interest expense at December 31, 2016. The April 2015 note had accrued interest of $15,044 and $6,244 as of December 31, 2016 and 2015, respectively.
The May 2015 derivative was valued as of May 22, 2015 at $36,550, which was recorded as a debt discount. During the year ended December 31, 2016, $7,019 was amortized from the debt discount. The debt discount was fully amortized to interest expense at December 31, 2016. The May 2015 note had accrued interest of $14,523 and $5,523 as of December 31, 2016 and 2015, respectively.
The June 2015 derivative was valued as of June 23, 2015 at $41,878, which was recorded as a debt discount. During the year ended December 31, 2016, $12,686 was amortized from the debt discount. The debt discount was fully amortized to interest expense at December 31, 2016. The June 2015 note had accrued interest of $13,734 and $4,734 as of December 31, 2016 and 2015, respectively.
The July 2015 derivative was valued as of July 28, 2015 at $38,600, which was recorded as a debt discount. During the year ended December 31, 2016, $16,703 was amortized from the debt discount. The debt discount was fully amortized to interest expense at December 31, 2016. The July 2015 note had accrued interest of $9,296 and $2,796 as of December 31, 2016 and 2015, respectively.
The August 2015 derivative was valued as of August 21, 2015 at $37,269, which was recorded as a debt discount. During the year ended December 31, 2016, $19,315 was amortized from the debt discount. The debt discount was fully amortized to interest expense at December 31, 2016. The August 2015 note had accrued interest of $8,869 and $2,369 as of December 31, 2016 and 2015, respectively.
The September 2015 derivative was valued as of September 24, 2015 at $37,820, which was recorded as a debt discount. During the year ended December 31, 2016, $24,293 was amortized from the debt discount. The debt discount was fully amortized to interest expense at December 31, 2016. The September 2015 note had accrued interest of $8,263 and $1,763 as of December 31, 2016 and 2015, respectively.
The October 2015 derivative was valued as of October 23, 2015 at $35,290, which was recorded as a debt discount. During the year ended December 31, 2016, $26,403 was amortized from the debt discount. The debt discount was fully amortized to interest expense at December 31, 2016. The October 2015 note had accrued interest of $5,959 and $959 as of December 31, 2016 and 2015, respectively.
The November 2015 derivative was valued as of November 30, 2015 at $36,448, which was recorded as a debt discount. During the year ended December 31, 2016, $32,216 was amortized from the debt discount. The debt discount was fully amortized to interest expense at December 31, 2016. The November 2015 note had accrued interest of $5,438 and $438 as of December 31, 2016 and 2015, respectively.
The December 2015 derivative was valued as of December 21, 2015 at $37,163, which was recorded as a debt discount. During the year ended December 31, 2016, $35,812 was amortized from the debt discount. The debt discount was fully amortized to interest expense at December 31, 2016. The December 2015 note had accrued interest of $5,666 and $166 as of December 31, 2016 and 2015, respectively.
The January 2016 derivative was valued as of January 22, 2016 at $30,855, of which $25,000 was recorded as a debt discount with the remaining amount that exceeded the face value of the note expensed. During the year ended December 31, 2016, $25,000 was amortized from the debt discount. The debt discount was fully amortized to interest expense at December 31, 2016. The January 2016 note had accrued interest of $2,357 as of December 31, 2016.
The February 2016 derivative was valued as of February 8, 2016 at $37,835, which was recorded as a debt discount. During the year ended December 31, 2016, $37,835 was amortized from the debt discount. The debt discount was fully amortized to interest expense at December 31, 2016. The February 2016 note had accrued interest of $4,914 as of December 31, 2016.
The March 2016 derivative was valued as of March 7, 2016 at $37,402, which was recorded as a debt discount. During the year ended December 31, 2016, $37,402 was amortized from the debt discount. The debt discount was fully amortized to interest expense at December 31, 2016. The March 2016 note had accrued interest of $4,085 as of December 31, 2016.
The April 2016 derivative was valued as of April 7, 2016 at $53,978, which was recorded as a debt discount. During the year ended December 31, 2016, $39,633 was amortized from the debt discount. The debt discount had a balance at December 31, 2016 of $14,345. The April 2016 note had accrued interest of $4,393 as of December 31, 2016.
The May 2016 derivative was valued as of May 10, 2016 at $47,249, of which $45,000 was recorded as a debt discount with the remaining amount that exceeded the face value of the note expensed. During the year ended December 31, 2016, $28,973 was amortized from the debt discount. The debt discount had a balance at December 31, 2016 of $16,027. The May 2016 note had accrued interest of $2,902 as of December 31, 2016.
The first June 2016 derivative was valued as of June 6, 2016 at $48,678, which was recorded as a debt discount. During the year ended December 31, 2016, $27,740 was amortized from the debt discount. The debt discount had a balance at December 31, 2016 of $20,938. The first June 2016 note had accrued interest of $3,142 as of December 31, 2016.
The second June 2016 derivative was valued as of June 9, 2016 at $35,935, of which $27,000 was recorded as a debt discount with the remaining amount that exceeded the face value of the note expensed. During the year ended December 31, 2016, $15,164 was amortized from the debt discount. The debt discount had a balance at December 31, 2016 of $11,836. The second June 2016 note had accrued interest of $1,512 as of December 31, 2016.
The third June 2016 derivative was valued as of June 30, 2016 at $14,630, of which $10,000 was recorded as a debt discount with the remaining amount that exceeded the face value of the note expensed. During the year ended December 31, 2016, $5,041 was amortized from the debt discount. The debt discount had a balance at December 31, 2016 of $4,959. The third June 2016 note had accrued interest of $506 as of December 31, 2016.
The first July 2016 derivative was valued as of July 13, 2016 at $46,259, which was recorded as a debt discount. During the year ended December 31, 2016, $21,672 was amortized from the debt discount. The debt discount had a balance at December 31, 2016 of $24,587. The first July 2016 note had accrued interest of $2,256 as of December 31, 2016.
The second July 2016 derivative was valued as of July 21, 2016 at $32,140, of which $24,000 was recorded as a debt discount with the remaining amount that exceeded the face value of the note expensed. During the year ended December 31, 2016, $10,718 was amortized from the debt discount. The debt discount had a balance at December 31, 2016 of $13,282. The second July 2016 note had accrued interest of $1,075 as of December 31, 2016.
The August 2016 derivative was valued as of August 15, 2016 at $20,723, which was recorded as a debt discount. During the year ended December 31, 2016, $7,835 was amortized from the debt discount. The debt discount had a balance at December 31, 2016 of $12,888. The August 2016 note had accrued interest of $1,899 as of December 31, 2016.
The September 2016 derivative was valued as of September 13, 2016 at $21,612, which was recorded as a debt discount. During the year ended December 31, 2016, $6,454 was amortized from the debt discount. The debt discount had a balance at December 31, 2016 of $15,158. The September 2016 note had accrued interest of $1,503 as of December 31, 2016.
The October 2016 derivative was valued as of October 11, 2016 at $52,130, of which $50,000 was recorded as a debt discount with the remaining amount that exceeded the face value of the note expensed. During the year ended December 31, 2016, $11,096 was amortized from the debt discount. The debt discount had a balance at December 31, 2016 of $38,907. The October 2016 note had accrued interest of $1,120 as of December 31, 2016.
The November 2016 derivative was valued as of November 15, 2016 at $43,444, which was recorded as a debt discount. During the year ended December 31, 2016, $5,475 was amortized from the debt discount. The debt discount had a balance at December 31, 2016 of $37,969. The November 2016 note had accrued interest of $578 as of December 31, 2016.
The December 2016 derivative was valued as of December 13, 2016 at $29,988, which was recorded as a debt discount. During the year ended December 31, 2016, $1,479 was amortized from the debt discount. The debt discount had a balance at December 31, 2016 of $28,509. The December 2016 note had accrued interest of $234 as of December 31, 2016.
Total accrued interest payable for the non-related party convertible notes was $361,503 and $154,925 as of December 31, 2016 and 2015, respectively.
The Company recorded total interest expense, including debt discount and beneficial conversion feature amortization, for all debt of $859,645 and $887,447$0 for the years ended December 31, 20162023 and 2015,2022 respectively.
NOTE 6 – DERIVATIVE FINANCIAL INSTRUMENTS
As discussed in Note 5, the Company issued convertible notes payable to non-related parties that contain anti-dilutive, or down round, price protection. Pursuant to ASC 815-15 Embedded Derivatives and ASC 815-40 Contracts in Entity’s Own Equity, the Company recorded a derivative liability for the price protection provisions issued within the convertible debt transactions.
The fair values of the Company’s derivative liabilities are estimated at the issuance date and are revalued at each subsequent reporting date using a multinomial lattice model simulation discussed below. At December 31, 2016 and 2015, the Company recorded current derivative liabilities of $1,934,617 and $841,677, respectively. The net change in fair value of the derivative liabilities resulted in losses of $616,286 and $106,543 for the years ended December 31, 2016 and 2015, respectively, which are reported as other expense in the statements of operations.
The following table presents details of the Company’s derivative liabilities for the years ended December 31, 2016 and 2015:
Balance, December 31, 2014 Increases in derivative value due to new issuances of notes Derivative adjustment due to debt conversion Change in fair value of derivative liabilities Balance, December 31, 2015 Increases in derivative value due to new issuances of notes Derivative adjustment due to debt conversion Change in fair value of derivative liabilities Balance, December 31, 2016 $ 438,374 455,141 (158,381 ) 106,543 841,677 552,858 (76,204 ) 616,286 $ 1,934,617
The Company calculated the fair value of the compound embedded derivatives using a multinomial lattice model simulation. The model is based on a probability weighted discounted cash flow model using projections of the various potential outcomes.
Key inputs and assumptions used in valuing the Company’s derivative liabilities are as follows for issuances of notes:
|
| |
|
| |
|
| |
|
|
NOTE 7 – STOCKHOLDERS’ DEFICIT
The Company is authorized to issue up to 2,000,000,000 shares of its $0.00001 par value common stock, and up to 10,000,000 shares of its $.001 par value preferred stock.
As of December 31, 2016 and 2015, the Company had common stock payable of $16,800 resulting from a technology transfer agreement with an unrelated party that obligated the Company to issue a total of 96,000 shares of its common stock, payable in 8 quarterly installments of 12,000 shares.
During the year ended December 31, 2016, the Company issued a total of 367,994,660 shares of its common stock to accredited investors in conversion of $32,433 principal and $7,697 accrued interest payable at conversion prices ranging from $0.00005 to $0.00045Earnings per share and settled $76,204 of derivative liabilities. As a result of the debt conversions and derivative settlement, common stock was increased by $3,680 and additional paid-in capital was increased by $112,654.
During the year ended December 31, 2015, the Company issued a total of 70,648,155 shares of its common stock to an accredited investor in conversion of $64,174 principal and $8,778 accrued interest payable at conversion prices ranging from $0.00088 to $0.00135 per share, and settled $158,381 of derivative liabilities. As a result of the debt conversions and derivative settlement, common stock was increased by $706 and additional paid-in capital was increased by $230,627.
On October 8, 2015, Craig Holland converted $4,607 principal and $2,028 accrued interest into 12,637,860 shares of the Company’s common stock.
On October 8, 2015, Mick Donahoo converted $4,607 principal and $2,028 accrued interest into 12,637,860 shares of the Company’s common stock.
As a result of the related party debt conversions, common stock was increased by $253 and additional paid-in capital was increased by $13,017.
2006 Stock Option Plan
The Company’s 2006 Stock Option Plan adopted by our Board of Directors in March of 2006 terminated in the year ended December 31, 2016. As of December 31, 2016, there were 560,000 stock options outstanding under the 2006 Stock Option Plan.
The Company did not grant any stock options or warrants during the years ended December 31, 2016 and 2015. The Company did not record any stock-based compensation expense during the years ended December 31, 2016 and 2015.
A summary of the status of the options and warrants issued by the Company as of December 31, 2016, and changes during the years ended December 31, 2016 and 2015 is presented below:
Weighted Average Shares Exercise Price Outstanding, December 31, 2014 Granted Canceled / Expired Exercised Outstanding, December 31, 2015 Granted Canceled / Expired Exercised Outstanding, December 31, 2016 560,000 $ 0.10 - - - - - - 560,000 $ 0.10 - - - - - - 560,000 $ 0.10
The outstanding options expire on various dates beginning May 2020 through August 2020.
NOTE 8 – LOSS PER COMMON SHAREShare
The computation of basic earnings per common share is based on the weighted average number of shares outstanding during the period. The computation of diluted earnings per common share is based on the weighted average number of shares outstanding during the period plus the weighted average common stock equivalents which would arise from the exercise of stock options, warrants, convertible preferred stock and other rights outstanding using the treasury stock method and the average market price per share during the period.
For the years ended December 31, 2016 and 2015,2022, the diluted weighted average number of shares is the sameincludes 13,303,000 common shares issuable upon conversion of Series B preferred stock and 217,750,000 common shares issuable upon conversion of Series C preferred stock.
Fair Value of Financial Instruments
In accordance with current accounting standards, certain assets and liabilities must be measured at fair value. ASC 820 defines fair value as the basic weighted average number of shares as the conversion of debt, options and warrantsprice that would be anti-dilutive.received to sell an asset or paid to transfer a liability in an orderly transaction between market participants at the measurement date (an exit price). The standard outlines a valuation framework and creates a fair value hierarchy in order to increase the consistency and comparability of fair value measurements and the related disclosures. ASC 820 requires that certain assets and liabilities must be measured at fair value, and the standard details the disclosures that are required for items measured at fair value. The Company had no assets and liabilities required to be measured on a recurring basis at December 31, 2023 and 2022.
| Table of Contents |
The current assets and current liabilities reported on the Company’s consolidated balance sheets are estimated by management to approximate fair market value due to their short-term nature.
Software Development Costs
Software development costs include direct costs incurred for internally developed products and payments made to independent software developers and/or contract engineers and artists. The Company accounts for software development costs in accordance with the FASB guidance for the costs of computer software to be sold, leased, or otherwise marketed as found in ASC Subtopic 985-20. On a case-by-case basis, certain software development costs are capitalized once the technological feasibility of a product is established and such costs are determined to be recoverable. Technological feasibility of a product encompasses both technical design documentation and game design documentation, or the completed and tested product design and working model. Software development costs are capitalized once technological feasibility of a product is established and such costs are determined to be recoverable against future revenues. For products where proven game engine technology exists, this may occur early in the development cycle.
Significant management judgments and estimates are utilized in the assessment of when technological feasibility is established. For most products, technological feasibility is established when a detailed game design document containing sufficient technical specifications written for a proven game engine or framework technology had been created and approved by management. However, technological feasibility is evaluated on a product-by-product basis. Amounts related to software development that are not capitalized are charged immediately to the appropriate expense account. Amounts that were considered ‘research and development’ that are not capitalized are immediately charged to general and administrative expense.
Prior to a product’s release, the Company expenses, as part of “Cost of Sales—Product Development,” capitalized costs when the Company believes such amounts are not recoverable. Capitalized costs for those products that are cancelled or abandoned are charged to product development expense in the period of cancellation. Commencing upon product release, capitalized software development costs are amortized to “Cost of Sales—Product Development” based on the straight-line method.
The Company evaluates the future recoverability of capitalized software development costs and intellectual property licenses on an annual basis. For products that have been released in prior years, the primary evaluation criterion is actual title performance. For products that are scheduled to be released in future years, recoverability is evaluated based on the expected performance of the specific products to which the costs relate or in which the licensed trademark or copyright is to be used. Criteria used to evaluate expected product performance include: historical performance of comparable products developed with comparable technology; orders for the product prior to its release; and, for any sequel product, estimated performance based on the performance of the product on which the sequel was based.
The Company had no impairment expense, related to capitalized software development costs, recognized in the Company’s statements of operations for years ended December 31, 2023 or 2022.
Based on the previous trends in the Company’s business, management has determined the expected shelf life of the majority of a game’s revenue will be realized over a five-year period and will expense capitalized production costs from the date of the initial release, or first sale of the product for a specific technology platform. It is possible that the same game developed on different technology platforms (such as PC and Mac, or iOS and Android) would be launched on different release dates because product development cycles may differ and distribution partner release policies may differ.
| F-9 |
| Table of Contents |
At December 31, 2023 and 2022, the Company had $522,084 and $370,639 respectively, of net capitalized software development costs in other assets on the balance sheet. The Company recognized amortization expense of $30,688 and $0 in the years ended December 31, 2023 and 2022.
Recent Accounting Pronouncements
Although there were new accounting pronouncements issued or proposed by the FASB during the year ended December 31, 2023 and through the date of filing of this report, the Company does not believe any of these accounting pronouncements has had or will have a material impact on its financial position or results of operations.
NOTE 3 – GOING CONCERN
The accompanying consolidated financial statements have been prepared on a going concern basis, which assumes continuity of operations and realization of assets and liabilities in the ordinary course of business. As shown in the accompanying consolidated financial statements, the Company had a net loss of $205,198 for the year ended December 31, 2023. As of December 31, 2023, the Company had a working capital deficit of $607,650 and a total stockholders’ deficit of $232,336. These factors, among others, raise substantial doubt about the Company’s ability to continue as a going concern.
Management believes that by continuing to implement cost reductions, and by increasing revenue from updated product lines, operating cash flows will be sufficient to support the Company’s business plan. However, management is currently evaluating alternative financing sources to fund the Company’s current business plan should cash provided by operations be insufficient.
The Company’s ability to continue as a going concern is dependent upon successfully executing its plans to attain a successful level of operations. The Company’s consolidated financial statements do not include any adjustments that might be necessary if it were unable to continue as a going concern.
NOTE 4 – PROPERTY AND EQUIPMENT
Property and equipment consisted of the following at December 31:
|
| 2023 |
|
| 2022 |
| ||
|
|
|
|
|
|
| ||
Vehicle |
| $ | 46,609 |
|
| $ | 46,609 |
|
Computer equipment |
|
| 7,170 |
|
|
| 7,170 |
|
Office furniture and equipment |
|
| 8,613 |
|
|
| 8,613 |
|
Total |
|
| 62,392 |
|
|
| 62,392 |
|
Less accumulated depreciation and amortization |
|
| (51,517 | ) |
|
| (42,195 | ) |
|
|
|
|
|
|
|
|
|
Net |
| $ | 10,875 |
|
| $ | 20,197 |
|
Depreciation expense was $9,322 and $11,976 for the years ended December 31, 2023 and 2022, respectively.
| F-10 |
| Table of Contents |
NOTE 5 – INTANGIBLE ASSETS
Intangible assets consisted of the following at December 31:
|
| 2023 |
|
| 2022 |
| ||
|
|
|
|
|
|
| ||
Intellectual property |
| $ | 307,100 |
|
| $ | 307,100 |
|
Customer base |
|
| 142,000 |
|
|
| 142,000 |
|
Non-compete agreements |
|
| 8,300 |
|
|
| 8,300 |
|
Less accumulated amortization |
|
| (457,400 | ) |
|
| (457,400 | ) |
|
|
|
|
|
|
|
|
|
Net |
| $ | - |
|
| $ | - |
|
Amortization expense was $0 and $66,720 for the years ended December 31, 2023 and 2022. The intangible assets were amortized on a straight-line basis over an estimated useful life of 5 years.
NOTE 6 – CAPITALIZED SOFTWARE COSTS
Our capitalized software costs are summarized as follows:
|
| December 31, 2023 |
|
| December 31, 2022 |
| ||
Gross carrying amount |
| $ | 552,772 |
|
| $ | 370,639 |
|
Accumulated amortization |
|
| (30,688 | ) |
|
| - |
|
Net capitalized software costs |
| $ | 522,084 |
|
| $ | 370,639 |
|
Amortization expense related to capitalized software costs was $30,688 and $0 for the years ended December 31, 2023 and 2022, respectively, and is recorded as cost of revenue in the consolidated statements of operations.
The following table presents the remaining estimated amortization of capitalized software costs as of December 31, 2023:
FY24 |
| $ | 96,684 |
|
FY25 |
| $ | 110,555 |
|
FY26 |
| $ | 110,555 |
|
FY27 |
| $ | 110,555 |
|
FY28 |
| $ | 79,868 |
|
Thereafter |
| $ | 13,869 |
|
|
|
|
|
|
|
| $ | 522,084 |
|
| F-11 |
| Table of Contents |
NOTE 7 – NOTES PAYABLE
Notes payable consisted of the following at December 31:
|
| 2023 |
|
| 2022 |
| ||
Related Party: |
|
|
|
|
|
| ||
Note payable to Craig Holland, non-interest bearing, maturing on December 31, 2024 |
| $ | 6,925 |
|
| $ | 6,925 |
|
Convertible note payable to Craig Holland, non-interest bearing, maturing on December 31, 2024 |
|
| 186,450 |
|
|
| 186,450 |
|
Convertible note payable to Mick Donahoo, non-Interest bearing, maturing on December 31, 2024 |
|
| 186,450 |
|
|
| 186,450 |
|
|
|
|
|
|
|
|
|
|
Other: |
|
|
|
|
|
|
|
|
Note payable to financial institution, secured by vehicle, interest at 2.9%, monthly payments of $901, due in 2025 |
|
| 13,255 |
|
|
| 23,523 |
|
Small Business Loan, payable to financial institution, 3.75% interest, monthly payments of $731 starting in November 2022, due in 2050 |
|
| 150,000 |
|
|
| 150,000 |
|
|
|
|
|
|
|
|
|
|
Total notes payable |
| $ | 543,080 |
|
| $ | 553,348 |
|
Less current portion |
|
| 390,394 |
|
|
| 390,093 |
|
|
|
|
|
|
|
|
|
|
Notes payable, net of current portion |
| $ | 152,686 |
|
| $ | 163,255 |
|
On January 25, 2021, the Company received a U.S. Small Business Administration Loan under the Paycheck Protection Program (PPP Loan) primarily for payroll costs related to the COVID-19 crisis in the amount of $174,421. Under the Paycheck Protection Program, the PPP Loan has a fixed interest rate of 1%, a maturity date five years from the date of the funding of the loan and no payments are due for six months. Pursuant to the terms of the PPP Loan, the Company may apply for forgiveness of the amount due on the PPP Loan in an amount equal to the sum of the following costs incurred by the Company during the 8-week period (or any other period that may be authorized by the U.S. Small Business Association) beginning on the date of first disbursement of the loan: payroll costs, any payment of interest on a covered mortgage obligation, payment on a covered rent obligation, and any covered utility payment. The amount of PPP Loan forgiveness shall be calculated in accordance with the requirements of the Paycheck Protection Program, including the provisions of Section 1106 of the Coronavirus Aid, Relief, and Economic Security Act (CARES Act), although no more than 25% of the amount forgiven can be attributable to non-payroll costs. The Company applied for and received loan forgiveness in 2022.
On May 18, 2020, the Company received an additional U.S. Small Business Administration Loan (SBA Loan) in the amount of $150,000 to alleviate continued economic injury caused the COVID-19 crisis. The SBA Loan has a fixed interest rate of 3.75% and matures in thirty years from the date of the loan. Payments were scheduled to begin twelve months from the effective date in a fixed amount of $731 per month. All payments will be applied to interest first. This loan is secured by the general assets of the Company. The SBA Loan has since indicated that the first payments are not required to begin until 30 months from the date of the note.
The Company had a note payable to Craig Holland, its Chief Executive Officer, with a balance of $6,925 at December 31, 2023 and 2022. The Company also had convertible notes payable to Mr. Holland and Mick Donahoo, its Chief Financial Officer, with a total balance of $372,900 as of December 31, 2023 and 2022. Messrs. Holland and Donahoo have the right, at any time, at their election, to convert all or part of the amount due into shares of fully paid and non-assessable shares of common stock of the Company. The fixed conversion price is $0.02 per share.
| F-12 |
| Table of Contents |
The Company has imputed interest expense on the notes payable – related party using an annual rate of 10%. This imputed interest does not represent an obligation payable in cash, but is recorded as a contribution in capital. Imputed interest expense on notes payable – related party was $37,984 for the years ended December 31, 2023 and 2022.
Future maturities of notes payable as of December 31, 2023 are as follows:
2024 |
| $ | 390,394 |
|
2025 |
|
| 2,686 |
|
2026 |
|
| - |
|
2027 |
|
| 2,704 |
|
2028 |
|
| 3,305 |
|
Thereafter |
|
| 143,991 |
|
Notes Payable |
| $ | 543,080 |
|
NOTE 8 – STOCKHOLDERS’ DEFICIT
Common Stock
The Company is authorized to issue up to 800,000,000 shares of its $0.00001 par value common stock and had 75,056,123 common shares issued and outstanding as of December 31, 2023 and 2022. There was no common stock activity during years ended December 31, 2023 and 2022.
As of December 31, 2023 and 2022, the Company had common stock payable of $16,800 resulting from a technology transfer agreement with an unrelated party that obligated the Company to issue a total of 960 shares of its common stock, payable in 8 quarterly installments of 120 shares.
Preferred Stock
The Company is authorized to issue up to 25,000,000 shares of its $0.00001 par value preferred stock. The shares of preferred stock may be issued from time to time in one or more series. As of December 31, 2023 and 2022, there were 2,480,482 shares of Series B preferred stock and 4,355,000 shares of Series C preferred stock issued and outstanding.
Series A Preferred Stock
The Company’s Series A Preferred Stock has 1,000 shares authorized and the following rights: (i) no dividend rights; (ii) no liquidation preference over the Company’s common stock; (iii) no conversion rights; (iv) the shares are automatically redeemed by the Company in the event: (a) Mr. Holland is no longer an officer, director or consultant with the Company, or (b) the Company’s common stock is listed on a national exchange, if the listing rules require the shares to be eliminated; (v) no call rights by the Company; (vi) non-transferable; and (vii) the aggregate 1,000 shares have votes equal to 51% of the then-outstanding voting rights of the Company (including all common stock and any other series of preferred stock) on any matter properly brought before the Company’s stockholders for a vote. There was no Series A Preferred Stock activity during years ended December 31, 2023 and 2022.
| F-13 |
| Table of Contents |
Series B Preferred Stock
The Company’s Series B preferred stock has 2,700,000 shares authorized and the following rights: (i) dividend rights equal to the Company’s common stock; (ii) no liquidation preference over the Company’s common stock; (iii) each share is convertible into 50 shares of the Company’s common stock; (iv) no redemption rights; (v) no call rights by the Company; and (vi) no voting rights. The holders of the Series B preferred stock cannot convert their shares of Series B preferred stock if such conversion would cause the holder to beneficially own more than 4.99% of our then-outstanding common stock. There was no Series B Preferred Stock activity during years ended December 31, 2023 and 2022.
Series C Preferred Stock
The Company’s Series C Preferred Stock has 4,500,000 shares authorized and the following rights: (i) dividend rights equal to the Company’s common stock; (ii) no liquidation preference over the Company’s common stock; (iii) each share is convertible into 50 shares of the Company’s common stock; (iv) no redemption rights; (v) no call rights by the Company; and (vi) each shares votes on an “as converted” basis, such that each share currently has 50 votes on all matters brought before the Company’s common stockholders for a vote. There was no Series C Preferred Stock activity during years ended December 31, 2023 and 2022.
Stock Options
2006 Stock Option Plan
The Company’s 2006 Stock Option Plan adopted by our Board of Directors in March of 2006 terminated in the year ended December 31, 2016. As of December 31, 2023 and 2022, there were no stock options outstanding under the 2006 Stock Option Plan.
2017 Non-Qualified Stock Option Plan
On December 4, 2017, our Board of Directors approved the Freeze Tag, Inc. 2017 Non-Qualified Stock Option Plan (the “Plan”). Under the Plan, our Board of Directors may issue options to purchase up to an aggregate of 10,000,000 shares of common stock to individuals, including, but not limited to, our Board of Directors and/or our executive management. As of December 31, 2023 and 2022, there were 7,762,821 stock options outstanding under the 2017 Stock Option Plan.
| F-14 |
| Table of Contents |
The Company accounts for stock-based compensation in accordance with ASC Topic 718, Compensation – Stock Compensation. Under the fair value recognition provisions of this standard, stock-based compensation cost is measured at the grant date based on the estimated value of the award granted, using the Black-Scholes option pricing model, and recognized over the period in which the award vests in general and administrative expenses.
The Company recorded no stock-based compensation expense during the years ended December 31, 2023 and 2022. As of December 31, 2023, there is no future compensation cost related to non-vested stock options not yet recognized in the Consolidated Statements of Operations.
A summary of the status of the stock options issued by the Company under both plans as of December 31, 2023, and changes during the years ended December 31, 2023 and 2022 is presented below:
|
|
|
| Weighted Average |
| |||
|
| Shares |
|
| Exercise Price |
| ||
|
|
|
|
|
|
| ||
Outstanding, December 31, 2021 |
|
| 7,768,421 |
|
| $ | 0.024 |
|
|
|
|
|
|
|
|
|
|
Granted |
|
| - |
|
|
| - |
|
Canceled / Expired |
|
| - |
|
| - |
| |
Exercised |
|
| - |
|
|
| - |
|
|
|
|
|
|
|
|
|
|
Outstanding, December 31, 2022 |
|
| 7,762,821 |
|
| $ | 0.024 |
|
|
|
|
|
|
|
|
|
|
Granted |
|
| - |
|
|
| - |
|
Canceled / Expired |
|
| - |
|
|
| - |
|
Exercised |
|
| - |
|
|
| - |
|
|
|
|
|
|
|
|
|
|
Outstanding, December 31, 2023 |
|
| 7,762,821 |
|
| $ | 0.024 |
|
The outstanding options expire on various dates beginning in 2027 through 2029.
NOTE 9 – RELATED PARTY TRANSACTIONS
The Company had a note payable to Craig Holland, its Chief Executive Officer, with a balance of $6,925 at December 31, 2023 and 2022. The Company also had convertible notes payable to related parties totaling $1,447,041Mr. Holland and Mick Donahoo, its Chief Financial Officer, with a total balance of $372,900 as of December 31, 20162023 and 2015.2022. See Note 57 for detailed disclosure of this related party debt, including interest rates, terms of conversion and other repayment terms. Accrued interest payable to related parties was $354,165 and $209,461 as of December 31, 2016 and 2015, respectively.
On October 8, 2015, Craig Holland converted $4,607 principal and $2,028 accrued interest into 12,637,860 shares of the Company’s common stock at a conversion price of $0.000525 per share.
On October 8, 2015, Mick Donahoo converted $4,607 principal and $2,028 accrued interest into 12,637,860 shares of the Company’s common stock at a conversion price of $0.000525 per share.
NOTE 10 – COMMITMENTS AND CONTINGENCIES
Leases
WeIn November of 2022, the lease ourCompany closed its physical office facilitiesspace, and now maintain an executive office address in Tustin, California, at 360 E 1st Street, #450, Tustin, CA 92780, at a rate of $120 per year. During 2022, the Company leased a production office in Texas located at 201 ½ E. Virginia, Suite 8, McKinney, TX 75069. The Company was on a one-year lease at a monthly lease payment of $600. This lease ended December 2022. Effective, January 15, 2023, the Company closed that facility. As a result, the Company began outsourcing its physical production, and now pays a month-to-month lease with either party having the optionrental fee of $500 per month to terminate with 30 days’ notice. The Company or Company employees or contractors own all of the computer andstore production materials. However, it still maintains an office equipment that is usedmailing address in the course of business. We do not have any lease agreements for any office equipment.McKinney, Texas.
Total rent expense under all operating leases was $6,600 and $23,900 for the years ended December 31, 2023 and 2022, respectively.
| F-15 |
| Table of Contents |
NOTE 11 – INCOME TAXES
The Company accounts for income taxes in accordance with standards of disclosure propounded by the FASB, and any related interpretations of those standards sanctioned by the FASB. Accordingly, deferred tax assets and liabilities are determined based on differences between the consolidated financial statement and tax bases of assets and liabilities, as well as a consideration of net operating loss and credit carry forwards, using enacted tax rates in effect for the period in which the differences are expected to impact taxable income. A valuation allowance is established, when necessary, to reduce deferred tax assets to the amount that is more likely than not to be realized. Due to the uncertainty as to the utilization of net operating loss carry forwards, a valuation allowance has been made to the extent of any tax benefit that net operating losses may generate.
The provision for income taxes consists primarily of state minimum franchise taxeswas $1,832 and totaled $2,282 and $400$1,555 for the years ended December 31, 20162023 and 2015,2022, respectively.
For Federal and California income tax purposes, the Company has net operating loss carry forwards that expire through 2030.2037. The net operating loss as of December 31, 20162023 and 2022 was $3,895,338$3,611,438 and $2,845,460,$4,442,685, respectively. No tax benefit has beenThe Company experienced a Section 382 change of ownership in connection with the Merger in 2017, thereby subjecting net operating loss carryovers generated previously to limitations on utilization. To-date, these limitations have not had an impact on the Company’s reported in the financial statements because after evaluating our own potential tax uncertainties, the Company has determined that there are no material uncertain tax positions that have a greater than 50% likelihood of reversal if the Company were to be audited.income tax.
The deferred tax asset and the valuation allowance consist of the following at December 31:
|
| 2023 |
|
| 2022 |
| ||
|
|
|
|
|
|
| ||
Deferred tax asset |
| $ | 1,705,443 |
|
| $ | 1,546,841 |
|
Valuation allowance |
|
| (1,705,443 | ) |
|
| (1,546,841 | ) |
|
|
|
|
|
|
|
|
|
Net |
| $ | - |
|
| $ | - |
|
2016 2015 Deferred tax asset Valuation allowance Net $ 1,324,918 $ 967,456 (1,324,918 ) (967,456 ) $ - $ -
The ultimate realization of our deferred tax asset is dependent, in part, upon the tax laws in effect, our future earnings, and other events. As of December 31, 2023 and 2022, we recorded a 100% allowance against our deferred tax asset since we were unable to conclude that it is more likely than not that our deferred tax asset will be realized.
NOTE 12 – SUBSEQUENT EVENTS
On January 11, 2017, we receivedManagement has evaluated subsequent events according to the requirements of ASC TOPIC 855, and believes there are no additional proceeds of $45,000 from the April 7, 2016 convertible promissory note.subsequent events to report.
On January 18, 2017, we entered into Amendment #1 to the April 7, 2016 convertible promissory note, increasing the total principal amount to $600,000.
On February 8, 2017, we entered into a convertible promissory note (the "Note") with an accredited investor (the "Accredited Investor") under which the Accredited Investor agreed to loan us up to $500,000. The Note bears interest at 10% per annum and matures on February 8, 2018. Under the terms of the Note, the Accredited Investor agreed to loan us $55,000 upon execution of the Note and can loan us the additional amounts up to $500,000 at any time in their sole discretion. The Accredited Investor has the right, at any time after February 8, 2017, at its election, to convert all or part of the amounts due to it under the Note into shares of our common stock. The conversion price shall be the lesser of (a) $0.0003 per share of our common stock or (b) Fifty Percent (50%) of the average of the three (3) lowest trade prices on three (3) separate trading days of our common stock recorded after February 8, 2017, or (c) the lowest effective price per share granted to any person or entity after February 8, 2017 to acquire our common stock or adjust, whether by operation of purchase price adjustment, settlement agreements, exchange agreements, reset provision, floating conversion or otherwise, any outstanding warrant, option or other right to acquire our common stock or outstanding our common stock equivalents, excluding any lower price per share offered to any of our officers and directors. However, the Accredited Investor may not convert the amounts due under the Note into shares of our common stock if such conversion would cause it to own more than 4.99% of our then-outstanding common stock. The Note also contains piggyback registration rights. In the event we default under the terms of the Note, we immediately owe 150% of the principal amount then due under the Note.
On March 9, 2017, we received additional proceeds of $60,000 from the February 8, 2017 convertible promissory note.
Subsequent to December 31, 2016, we issued a total of 134,775,113 shares of our common stock in the conversion of convertible notes payable principal totaling $5,320 and accrued interest payable totaling $1,419.
| Table of Contents |
ITEM 9 –‑ CHANGES IN AND DISAGREEMENTS WITH ACCOUNTANTS ON ACCOUNTING AND FINANCIAL DISCLOSURE
There are no items required to be reported under this Item.
ITEM 9A –- CONTROLS AND PROCEDURES
We carried out an evaluation, under the supervision and with the participation of our management, including our Chief Executive Officer (Principal Executive Officer) and Chief Financial Officer (Principal Financial Officer and Principal Accounting Officer), of the effectiveness of our disclosure controls and procedures (as defined) in Exchange Act Rules 13a – 15(c) and 15d – 15(e)). Based upon that evaluation, our Chief Executive Officer and Chief Financial Officer, who are our principal executive officer and principal financial officers, respectively, concluded that, as of the end of the period ended December 31, 2016,2023, our disclosure controls and procedures were not effective (1) to ensure that information required to be disclosed by us in reports that we file or submit under the Exchange Act is recorded, processed, summarized and reported, within the time periods specified in the SEC’s rules and forms and (2) to ensure that information required to be disclosed by us in the reports that we file or submit under the Exchange Act is accumulated and communicated to us, including our chief executive and chief financial officers, as appropriate to allow timely decisions regarding required disclosure.
Our Chief Executive Officer and Chief Financial Officer do not expect that our disclosure controls or internal controls will prevent all error and all fraud. No matter how well conceived and operated, our disclosure controls and procedures can provide only a reasonable level of assurance regarding the reliability of financial reporting and the preparation of financial statements for external purposes in accordance with generally accepted accounting principles. Further, the design of a control system must reflect the fact that there are resource constraints, and the benefits of controls must be considered relative to their costs. Because of the inherent limitations in all control systems, no evaluation of controls can provide absolute assurance that all control issues and instances of fraud, if any, within the Company have been detected. These inherent limitations include the realities that judgments in decision-making can be faulty, and that breakdowns can occur because of a simple error or mistake. Additionally, controls can be circumvented if there exists in an individual a desire to do so. There can be no assurance that any design will succeed in achieving its stated goals under all potential future conditions.
Furthermore, smaller reporting companies face additional limitations. Smaller reporting companies employ fewer individuals and find it difficult to properly segregate duties. Often, one or two individuals control every aspect of the company'scompany’s operation and are in a position to override any system of internal control. Additionally, smaller reporting companies tend to utilize general accounting software packages that lack a rigorous set of software controls.
(b) Management’s Annual Report on Internal Control Over Financial Reporting
Our management is responsible for establishing and maintaining adequate internal control over financial reporting. Internal control over financial reporting is defined in Rules 13a-15(f) and 15d-15(f) promulgated under the Exchange Act, as amended, as a process designed by, or under the supervision of, our Chief Executive Officer and Chief Financial Officer, and effected by our board of directors, management and other personnel, to provide reasonable assurance regarding the reliability of financial reporting and the preparation of financial statements for external purposes in accordance with generally accepted accounting principles in the United States and includes those policies and procedures that:
| · | Pertain to the maintenance of records that in reasonable detail accurately and fairly reflect our transactions and any disposition of our assets; |
|
|
|
| · | Provide reasonable assurance that transactions are recorded as necessary to permit preparation of financial statements in accordance with generally accepted accounting principles, and that our receipts and expenditures are being made only in accordance with authorizations of our management and directors; and |
| ||
· | Provide reasonable assurance regarding prevention or timely detection of unauthorized acquisition, use or disposition of our assets that could have a material effect on the financial statements. |
A material weakness is a deficiency, or a combination of deficiencies, in internal control over financial reporting, such that there is a reasonable possibility that a material misstatement of our annual or interim financial statements will not be prevented or detected on a timely basis. Under the supervision of our chief executive officer and our chief financial officer, we conducted an evaluation of the effectiveness of our internal control over financial reporting as of December 31, 20162023 using the criteria established in the 2013 Internal Control—Integrated Framework (2013 Framework) issued by the Committee of Sponsoring Organizations of the Treadway Commission (COSO). This evaluation included review of the documentation of controls, evaluation of the design effectiveness of controls, testing of the operating effectiveness of controls and a conclusion on this evaluation. Based on this evaluation, our management concluded our internal control over financial reporting was not effective as at December 31, 2016.2023.
| 36 |
| Table of Contents |
This annual reportAnnual Report does not include an attestation report of our registered public accounting firm regarding internal control over financial reporting. Management’s report is not subject to attestation by our registered, public accounting firm pursuant to the rules of the Securities and Exchange Commission that permit us to provide only management’s report in this annual report.Annual Report.
A material weakness is a deficiency, or combination of deficiencies, in internal control over financial reporting, such that there is a reasonable possibility that a material misstatement of our company’s annual or interim financial statements will not be prevented or detected on a timely basis. In its assessment of the effectiveness of our internal control over financial reporting as of December 31, 2023, we determined that there was a control deficiency that constituted a material weakness:
(1) | Due to the Company not having formal Control | |
(2) | Management did not maintain effective internal controls relating to the quarter end closing and financial reporting process; | |
(3) | The Company did not maintain effective internal controls to assure proper segregation of duties as the same employee was responsible for initiating and recording of transactions, thereby creating a segregation of duties weakness. |
This control deficiency resulted in a reasonable possibility that a material misstatement of the annual or interim financial statements could not have been prevented or detected on a timely basis. As a result of the material weakness described above, we concluded that we did not maintain effective internal control over financial reporting as of December 31, 2023, based on criteria established in Internal Control—2013 Integrated Framework issued by COSO. Our management continues to evaluate remediation plans for the above deficiency. We plan to take steps to enhance and improve the design of our internal control over financial reporting.
(c) Changes in Internal Control over Financial Reporting
There are no changes to report during our fiscal quarter ended December 31, 2016.2023.
There are no events required to be disclosed by the Item.None
| Table of Contents |
PART III
ITEM 10 – DIRECTORS, EXECUTIVE OFFICERS AND CORPORATE GOVERNANCE
Directors and Executive Officers
The following table sets forth the names, ages, and biographical information of each of our current directors and executive officers, and the positions with the Company held by each person, and the date such person became a director or executive officer of the Company. Our executive officers are elected annually by the Board of Directors. The directors serve one-year terms until their successors are elected. The executive officers serve terms of one year or until their death, resignation or removal by the Board of Directors. Family relationships among any of the directors and officers are described below.
Name |
| Age |
| Position |
| ||||
Craig Holland |
|
|
|
|
Robert D. Vardeman, Jr. | 48 | President and Director | ||
| ||||
Mick Donahoo |
|
|
| Chief Operating Officer, Secretary, Chief Financial Officer, Treasurer, and Director |
Robert D. Vardeman | 70 | Director |
Craig Holland co-founded Freeze Tag in October 2005. Prior to founding Freeze Tag, Craig founded Thumbworks, a publisher of mobile gaming applications, in January 2002 and served as the CEO of Thumbworks from its formation until its acquisition by In-Fusio, a mobile game publisher and mobile entertainment platform provider in January 2005. As CEO of Thumbworks, Mr. Holland drove the organization'sorganization’s strategic direction, overseeing carrier relations, business development and licensing initiatives which led to partnerships with some of the world'sworld’s leading brands such as Etch A Sketch®, Nickelodeon, Suzuki, Paramount Pictures, and Honda. Prior to founding Thumbworks, Mr. Holland founded Nine Dots, an interactive marketing firm in North America whose clients included a number of high profilehigh-profile consumer brands such as Nestle, Quaker Oats, Qualcomm and General Motors, in 1992. Mr. Holland served as the CEO of Nine Dots from its formation until its sale to CyberSight, a Canadian-based interactive marketing company, in September 2000. Mr. Holland holds an MBA with an emphasis in Marketing from the University of Southern California (USC) and a Bachelor of Arts in English Literature from the University of California at Los Angeles (UCLA).
Robert Vardeman, Jr., is our President and a member of our Board of Directors, appointed to both positions on October 18, 2017 when Munzee merged with and into our corporation. From 2013-2017 (prior to the merger), Mr. Vardeman was the President of Munzee, Inc., providing the strategic direction of the company, ensuring that the general day-to-day operations were adequately executed. Mr. Vardeman was the visionary for Munzee’s suite of applications. He was also responsible for pushing the Munzee brand and spearheading its sales efforts. Before starting Munzee, Mr. Vardeman taught at Allen I.S.D. for 15 years, teaching mathematics for grades four through eight. Mr. Vardeman has a Bachelors in Elementary Education from Dallas Baptist University and a Masters in Administration and Supervision from the University of Phoenix.
Mick Donahoo co-founded Freeze Tag in October 2005 and in his role as COO, Mr. Donahoo oversees product planning, design, and software development of all games and technology. With over 1925 years of technology experience, Mr. Donahoo has produced over 25 mobile games distributed via 20 worldwide wireless carriers. Prior to founding Freeze Tag, Mr. Donahoo led North American development for Thumbworks and following its acquisition, by In-Fusio, oversaw overseas engineering teams located in Taiwan, Thailand, India, Russia, and Korea. Prior to In-Fusio, Mick was a consulting executive at Ernst & Young, LLP in the Financial Services and Aerospace and Defense industries architecting and developing large-scale, three-tiered client/server applications. Mick holds a Bachelor of Science degree in Business and Management Information Systems from Brigham Young University.
Family RelationshipsDon Vardeman, is a member of our Board of Directors, appointed on October 18, 2017 when Munzee merged with and into our corporation. From 2013-2017, Mr. Vardeman was an advisor of Munzee, Inc., until Munzee merged with and into Freeze Tag, Inc. As a shareholder of Munzee, Mr. Vardeman provided guidance and insight to senior management. From 1999 - 2016, Mr. Vardeman worked for Anadarko Petroleum, eventually retiring as vice president of worldwide project management. In his positions with Anadarko Petroleum, Mr. Vardeman had execution responsibility for Anadarko’s major projects in Algeria, Ghana, Mozambique, and the Gulf of Mexico. Mr. Vardeman began his career with Amoco in operations, drilling and facilities. He later joined Sun Exploration and Production Company, predecessor of Oryx Energy Company, where he held positions in facilities and project management. Kerr-McGee merged with Oryx in 1999 and he later became vice president of marine facilities engineering. Vardeman and his group led the execution of the company’s deepwater developments including eight spar projects and other floating systems for the Gulf of Mexico and international locations. Mr. Vardeman graduated magna cum laude from Texas A&M University in 1975 with a degree in Electrical Engineering.
There are no family relationships among any of our officers, directors, or shareholders.
| Table of Contents |
Family Relationships
Don Vardeman (Director) is the father of Rob Vardeman (President and Director). There are no other family relationships among our officers or directors.
Historical Compensation of Directors
Other than as set forth herein no compensation has been given to any of the directors, although they may be reimbursed for any pre-approved out-of-pocket expenses.
Compliance with Section 16(a) of the Securities Exchange Act of 1934
Section 16(a) of the Securities Exchange Act of 1934 requires the Company’s directors and executive officers and persons who own more than ten percent of a registered class of the Company’s equity securities to file with the SEC initial reports of ownership and reports of changes in ownership of common stock and other equity securities of the Company. Officers, directors and greater than ten percent shareholders are required by SEC regulations to furnish the Company with copies of all Section 16(a) forms they file.
During the most recent fiscal year, to the Company’s knowledge, there were no failures to timely file Section 16(a) formsforms.
Board Meetings and Committees
During the 20162023 fiscal year, the Board of Directors met on a regular basis and took written action on numerous other occasions. All the members of the Board attended the meetings. The written actions were by unanimous consent.
Code of Ethics
We have not adopted a written code of ethics, because we believe and understand that our officers and directors adhere to and follow ethical standards without the necessity of a written policy.
Audit Committee
We do not currently have an audit committee.
Compensation Committee
We do not currently have a compensation committee.
| 39 |
| Table of Contents |
ITEM 11 –‑ EXECUTIVE COMPENSATION
Executive Officers and Directors
We do not currently have written employment agreements with our executives, Craig Holland, Robert D. Vardeman, Jr. (Rob), and Mick Donahoo. BothAll are at-will employees whose compensation is set forth in the Summary Compensation Table below.
Summary Compensation Table
The following table sets forth information with respect to compensation earned by our Chief Executive Officer, President, and Chief Financial Officer for the fiscal years ended December 31, 2016, 20152023, 2022, and 2014.2021.
Name and Principal Position |
| Year |
| Salary ($) |
| Bonus ($) |
| Stock Awards ($) |
| Option Awards ($) |
| Non-Equity Incentive Plan Compensation ($) |
| Nonqualified Deferred Compensation ($) |
| All Other Compensation ($) |
| Total ($) |
|
| Year |
| Salary ($) |
|
| Bonus ($) |
|
| Stock Awards ($) |
|
| Option Awards ($)* |
|
| Non-Equity Incentive Plan Compensation ($) |
|
| Nonqualified Deferred Compensation ($) |
|
| All Other Compensation ($) |
|
| Total ($) |
| |||||||||||||||||||||||
|
|
|
|
|
|
|
|
|
|
|
|
|
|
|
|
|
|
|
|
|
|
|
|
|
|
|
|
|
|
|
|
|
|
|
|
|
|
| ||||||||||||||||||||||||||||||
Craig Holland |
| 2016 |
| 159,600 |
| - |
| - |
| - |
| - |
| - |
| - |
| 159,600 |
|
| 2023 |
| 171,600 |
| - |
| - |
| - |
| - |
| - |
| - |
| 171,600 |
| ||||||||||||||||||||||||||||||
President, CEO |
| 2015 |
| 159,600 |
| - |
| - |
| - |
| - |
| - |
| - |
| 159,600 |
| |||||||||||||||||||||||||||||||||||||||||||||||||
CEO |
| 2022 |
| 171,600 |
| 250 |
| - |
| - |
| - |
| - |
| - |
| 171,850 |
| |||||||||||||||||||||||||||||||||||||||||||||||||
|
| 2021 |
| 159,600 |
| 500 |
| - |
| - |
| - |
| - |
| - |
| 160,100 |
| |||||||||||||||||||||||||||||||||||||||||||||||||
|
|
|
|
|
|
|
|
|
|
|
|
|
|
|
|
|
|
|
| |||||||||||||||||||||||||||||||||||||||||||||||||
Robert D. Vardeman, Jr. |
| 2023 |
| 171,600 |
| - |
| - |
| - |
| - |
| - |
| - |
| 171,600 |
| |||||||||||||||||||||||||||||||||||||||||||||||||
President |
| 2022 |
| 171,600 |
| 250 |
| - |
| - |
| - |
| - |
| - |
| 171,850 |
| |||||||||||||||||||||||||||||||||||||||||||||||||
|
| 2014 |
| 159,600 |
| - |
| - |
| - |
| - |
| - |
| - |
| 159,600 |
|
| 2021 |
| 120,000 |
| 500 |
| - |
| - |
| - |
| - |
| - |
| 120,500 |
| ||||||||||||||||||||||||||||||
|
|
|
|
|
|
|
|
|
|
|
|
|
|
|
|
|
|
|
|
|
|
|
|
|
|
|
|
|
|
|
|
|
|
|
|
|
|
| ||||||||||||||||||||||||||||||
Mick Donahoo |
| 2016 |
| 159,600 |
| - |
| - |
| - |
| - |
| - |
| - |
| 159,600 |
|
| 2023 |
| 171,600 |
| - |
| - |
| - |
| - |
| - |
| - |
| 171,600 |
| ||||||||||||||||||||||||||||||
COO, VP |
| 2015 |
| 159,600 |
| - |
| - |
| - |
| - |
| - |
| - |
| 159,600 |
| |||||||||||||||||||||||||||||||||||||||||||||||||
CFO |
| 2022 |
| 171,600 |
| 250 |
| - |
| - |
| - |
| - |
| - |
| 171,850 |
| |||||||||||||||||||||||||||||||||||||||||||||||||
|
| 2014 |
| 159,600 |
| - |
| - |
| - |
| - |
| - |
| - |
| 159,600 |
|
| 2021 |
| 159,600 |
| 500 |
| - |
| - |
| - |
| - |
| - |
| 160,100 |
| ||||||||||||||||||||||||||||||
Director Compensation
The following table sets forth director compensation as of for the fiscal year ended December 31, 2016:2023:
Name |
| Fees Earned or Paid in Cash ($) |
|
| Stock Awards ($) |
|
| Option Awards ($) |
|
| Non-Equity Incentive Plan Compensation ($) |
|
| Nonqualified Deferred Compensation Earnings ($) |
|
| All Other Compensation ($) |
|
| Total ($) |
| |||||||
|
|
|
|
|
|
|
|
|
|
|
|
|
|
|
|
|
|
|
|
|
| |||||||
Craig Holland |
|
| - |
|
|
| - |
|
|
| - |
|
|
| - |
|
|
| - |
|
|
| - |
|
|
| - |
|
|
|
|
|
|
|
|
|
|
|
|
|
|
|
|
|
|
|
|
|
|
|
|
|
|
|
|
|
|
Mick Donahoo |
|
| - |
|
|
| - |
|
|
| - |
|
|
| - |
|
|
| - |
|
|
| - |
|
|
| - |
|
Robert D. Vardeman, Jr. | - | - | - | - | - | - | - | |||||||||||||||||||||
Robert D. Vardeman | - | - | - | - | - | - | - | |||||||||||||||||||||
| 40 |
| Table of Contents |
Outstanding Equity Awards at Fiscal Year-End
On December 4, 2017, our Board of Directors approved the Freeze Tag, Inc. 2017 Non-Qualified Stock Option Plan (the “Plan”). Under the Plan, our Board of Directors may issue options to purchase up to an aggregate of 10,000,000 shares of common stock to individuals, including, but not limited to, our Board of Directors and/or our executive management.
On March 20, 2006, our Board of Directors and shareholders approved the Freeze Tag, Inc. 2006 Stock Plan. During the year ended December 31, 2016, the 2006 Stock Plan was terminated.
The following table sets forth certain information concerning outstanding stock awards held by the Named Executive Officers as of December 31, 2016:2023:
|
| Option Awards |
| Stock Awards |
|
| Option Awards |
| Stock Awards |
| ||||||||||||||||||||||||||||||||||||||||||||||||||||||||||||
Name |
| Number of Securities Underlying Unexercised Options (#) Exercisable |
|
| Number of Securities Underlying Unexercised Options (#) Unexercisable |
|
| Equity Incentive Plan Awards: Number of Securities Underlying Unexercised Unearned Options (#) |
|
| Option Exercise Price ($) |
|
| Option Expiration Date |
|
| Number of Shares or Units of Stock That Have Not Vested (#) |
|
| Market Value of Shares or Units of Stock That Have Not Vested ($) |
|
| Equity Incentive Plan Awards: Number of Unearned Shares, Units or Other Rights That Have Not Vested (#) |
|
| Equity Incentive Plan Awards: Market or Payout Value of Unearned Shares, Units or Other Rights That Have Not Vested ($) |
|
| Number of Securities Underlying Unexercised Options (#) Exercisable |
|
| Number of Securities Underlying Unexercised Options (#) Unexercisable |
|
| Equity Incentive Plan Awards: Number of Securities Underlying Unexercised Unearned Options (#) |
|
| Option Exercise Price ($) |
|
| Option Expiration Date |
| Number of Shares or Units of Stock That Have Not Vested (#) |
|
| Market Value of Shares or Units of Stock That Have Not Vested ($) |
|
| Equity Incentive Plan Awards: Number of Unearned Shares, Units or Other Rights That Have Not Vested (#) |
|
| Equity Incentive Plan Awards: Market or Payout Value of Unearned Shares, Units or Other Rights That Have Not Vested ($) |
| |||||||||||||||||
|
|
|
|
|
|
|
|
|
|
|
|
|
|
|
|
|
|
|
|
|
|
|
|
|
|
|
|
|
|
|
|
|
|
|
|
|
|
| ||||||||||||||||||||||||||||||||
Craig Holland |
| 115,000 |
| - |
| - |
| 0.11 |
| 8/02/20 |
|
| - |
| - |
| - |
| - |
| ||||||||||||||||||||||||||||||||||||||||||||||||||
|
|
|
|
|
|
|
|
|
|
|
|
|
|
|
|
|
|
|
| |||||||||||||||||||||||||||||||||||||||||||||||||||
Mick Donahoo |
| - |
| - |
| - |
| - |
| - |
| - |
| - |
| - |
| - |
|
| 1,025,641 |
| - |
| - |
| 0.039 |
| 12/05/27 |
| - |
| - |
| - |
| - |
| ||||||||||||||||||||||||||||||||
Mick Donahoo |
| 3,750,000 |
| - |
| - |
| 0.020 |
| 12/18/29 |
| - |
| - |
| - |
| - |
| |||||||||||||||||||||||||||||||||||||||||||||||||||
| 41 |
| Table of Contents |
The following table sets forth, as of March 9, 2017,31, 2024, certain information with respect to our equity securities owned of record or beneficially by (i) each of our Officers and Directors; (ii) each person who owns beneficially more than 5% of each class of our outstanding equity securities; and (iii) all Directors and Executive Officers as a group.
Common Stock | |||||||||
Title of Class |
| Name and Address of Beneficial Owner (3) |
| Amount and Nature of Beneficial Ownership |
|
| Percent of Class (1) | ||
Common Stock |
| Craig Holland (2) |
|
| 77,020,440 | (4) |
| 10.32% | (4) |
Common Stock |
| Mick Donahoo (2) |
|
| 64,295,734 | (5) |
| 8.62% | (5) |
|
|
|
|
|
|
|
|
| |
Common Stock |
| All Directors and Officers As a Group (2 persons) |
|
| 141,316,174 | (4)(5) |
| 18.94% | (4)(5) |
____________Common Stock(1)
Name and Address of Beneficial Owner(2) |
| Nature of Beneficial Ownership |
| No. of Shares |
|
| Percent of Class |
|
| Percent of Total Voting Rights(6) |
| |||
|
|
|
|
|
|
|
|
|
|
|
| |||
Craig Holland (2)(3) |
| CEO, CCO and Director |
|
| 50,876,692 | (4) |
|
| 60.1 | % |
|
| 14.1 | % |
|
|
|
|
|
|
|
|
|
|
|
|
|
|
|
Rob Vardeman (2)(3) |
| President and Director |
| -0- |
|
|
| 0 | % |
|
| 0 | % | |
|
|
|
|
|
|
|
|
|
|
|
|
|
|
|
Mick Donahoo (2)(3) |
| CFO, Secretary and Director |
|
| 16,303,198 | (5) |
|
| 18.3 | % |
|
| .8 | % |
|
|
|
|
|
|
|
|
|
|
|
|
|
|
|
Don Vardeman (2)(3) |
| Director |
| -0- |
|
|
| 0 | % |
|
| 0 | % | |
|
|
|
|
|
|
|
|
|
|
|
|
|
|
|
All Officers and Directors as a Group (4 persons) |
|
|
|
| 67,179,890 | (4)-(5) |
|
| 78.4 | % |
|
| 14.9 | % |
(1) | As of March 31, 2024, there were 75,056,123 shares of common stock |
(2) | Indicates an officer and/or director of the Company. |
(3) | Unless indicated otherwise, the address of the shareholder is Freeze Tag, Inc., |
(4) | Includes 41,207,942 shares of common stock, and 9,668,750 shares of common stock underlying convertible promissory notes. |
(5) | Includes 2,195,057 shares of common stock, 9,332,500 shares of common stock underlying a convertible promissory note, 1,025,641 shares of common stock underlying vested stock options, which has an exercise price of $0.039 per share, and 3,750,000 shares of common stock underlying vested stock options, which has an exercise price of $0.02 per share. |
(6) | Calculated based on the |
| Table of Contents |
Series C Preferred Stock(1)
Name and Address of Beneficial Owner |
| Nature of Beneficial Ownership |
| No. of Shares |
|
| Percent of Class |
|
| Percent of Total Voting Rights(4) |
| |||
|
|
|
|
|
|
|
|
|
|
|
| |||
Craig Holland (2)(3) |
| CEO, CCO and Director |
| -0- |
|
|
| 0 | % |
|
| 0 | % | |
|
|
|
|
|
|
|
|
|
|
|
|
|
| |
Rob Vardeman (2)(3) |
| President and Director |
|
| 2,659,128 |
|
|
| 61.1 | % |
|
| 45.4 | % |
|
|
|
|
|
|
|
|
|
|
|
|
|
|
|
Mick Donahoo (2)(3) |
| CFO, Secretary and Director |
| -0- |
|
|
| 0 | % |
|
| 0 | % | |
|
|
|
|
|
|
|
|
|
|
|
|
|
|
|
Don Vardeman (2)(3) |
| Director |
|
| 339,174 |
|
|
| 7.9 | % |
|
| 5.7 | % |
|
|
|
|
|
|
|
|
|
|
|
|
|
|
|
Scott Foster 360 E 1st Street, #450 Tustin, CA 92780 |
| 5% Shareholder |
|
| 868,287 |
|
|
| 20.0 | % |
|
| 14.82 | % |
|
|
|
|
|
|
|
|
|
|
|
|
|
|
|
Chris Pick 360 E 1st Street, #450 Tustin, CA 92780 |
| 5% Shareholder |
|
| 325,607 |
|
|
| 7.50 | % |
|
| 5.5 | % |
|
|
|
|
|
|
|
|
|
|
|
|
|
|
|
All Officers and Directors as a Group (4 persons) |
|
|
|
| 2,998,272 |
|
|
| 68.8 | % |
|
| 51.1 | % |
(1) | As of March 31, 2024, there were 4,355,000 shares of our Series C Preferred Stock outstanding. Each share of our Series C Preferred Stock is convertible and votes at 50 to 1. Shares of Series C Preferred Stock subject to options or warrants currently exercisable, or exercisable within 60 days, are deemed outstanding for purposes of computing the percentage of the person holding such options or warrants, but are not deemed outstanding for the purposes of computing the percentage of any other person. |
(2) | Indicates an officer and/or director of the Company. |
(3) | Unless indicated otherwise, the address of the shareholder is Freeze Tag, Inc., 360 E 1st Street, #450, Tustin, California 92780. |
(4) | Calculated based on a total of 292,806,123 votes outstanding, consisting of 75,056,123 votes from common stockholders and 217,750,000 votes from Series C Preferred Stock holders. |
We are not aware of any person who owns of record, or is known to own beneficially, five percent or more of the outstanding securities of any class of the issuer, other than as set forth above. We are not aware of any person who controls the issuer as specified in Section 2(a)(1) of the 1940 Act. There are no classes of stock other than common stock issued or outstanding. We do not have an investment advisor.
There are no current arrangements which will result in a change in control.
| 43 |
| Table of Contents |
ITEM 13 –‑ CERTAIN RELATIONSHIPS AND RELATED TRANSACTIONS, AND DIRECTOR INDEPENDENCE
Convertible Notes Payable – Related Party
On July 25, 2017, we entered into an Amendment No. 1 to a Promissory Note with Craig Holland, our Chief Executive Officer, under which we agreed to amend the terms of that certain Convertible Promissory Note dated December 31, 2013, as extended by agreement and entered into by and between the parties (the “Holland Salary Note”) in order to (i) make the Holland Salary Note non-interest bearing, (ii) change the conversion price from a variable price to $0.02 per share, and (iii) waive all interest due and owing under the Holland Salary Note. The description of the Holland Salary Note set forth in this report is qualified in its entirety by reference to the full text of the “form of” document, which is incorporated herein by reference.
On July 25, 2017, we entered into an Amendment No. 1 to a Promissory Note with Mick Donahoo, our Chief Financial Officer, under which we agreed to amend the terms of that certain Convertible Promissory Note dated December 31, 2013, as extended by agreement and entered into by and between the parties (the “Donahoo Salary Note”) in order to (i) make the Donahoo Salary Note non-interest bearing, (ii) change the conversion price from a variable price to $0.02 per share, and (iii) waive all interest due and owing under the Donahoo Salary Note. The description of the Donahoo Salary Note set forth in this report is qualified in its entirety by reference to the full text of the “form of” document, which is incorporated herein by reference.
On July 25, 2017, we entered into an Amendment No. 1 to a Promissory Note with Craig Holland, our Chief Executive Officer, under which we agreed to amend the terms of that certain Convertible Promissory Note dated December 31, 2013, as extended by agreement and entered into by and between the parties (the “Holland Note”) in order to make the Holland Note non-interest bearing, (ii) make the Holland Note non-convertible, and (iii) waive all interest due and owing under the Holland Note. The description of the Holland Note set forth in this report is qualified in its entirety by reference to the full text of the “form of” document, which is incorporated herein by reference.
As of December 31, 20162023, and 2015,2022, we hadowed a convertible notetotal of $372,900 to Craig Holland, our Chief Executive Officer and Mick Donahoo, our Chief Financial Officer under these related party notes payable.
Imputed interest expense on the related party notes payable, calculated at 10% per annum, totaled $37,984 for the years ended December 31, 2023 and 2022. This imputed interest does not represent an obligation payable in cash, but is recorded as a contribution to capital.
Securities Exchange Agreements
On July 25, 2017, we entered into a Securities Exchange and Common Stock Purchase Agreement with Craig Holland, our Chief Executive Officer (the “Holland Securities Exchange Agreement”). Under the Holland Family Trust (the “Holland Family Trust Convertible Note”) with a balance of $222,572. TheSecurities Exchange Agreement, Mr. Holland Family Trust Convertible Note is convertible into Company common stock at the greater of (i) the Variable Conversion Priceagreed to exchange promissory notes issued by us dated December 31, 2013 and (ii) the Fixed Conversion Price. The “Variable Conversion Price” shall mean 50% multiplied by the Market Price (representing a discount rate of 50%). “Market Price” means the average of the three lowest trading prices for the Company’s common stock during the twenty-five (25) trading-day period ending on the latest complete trading day prior to the date of conversion. “Fixed Conversion Price” shall mean $0.00005. The promissory note contains a limiter that disallows conversion if such conversions would cause the holder to own more than 4.99% of our outstanding common stock after the conversion. Furthermore, at any time, the Company may pay the balance of the unconverted note payable in cash.
As of September 30, 2014 $72,107(the “Holland Notes”), and the $756,984 in principal owing under the Holland Notes, into 37,849,200 shares of accrued interestour common stock (the “Holland Common Stock”), on a post-reverse basis (based on a prospective 1-for-100 reverse stock split we had planned for on or about September 1, 2017). At the time, the closing under the Holland Securities Exchange Agreement for the exchange of the Holland Notes for the Holland Common Stock was addedset to occur automatically upon the effectiveness of the referenced reverse stock split. The description of the Holland Securities Exchange Agreement set forth in this report is qualified in its entirety by reference to the note principal and $813,602full text of the note was transferred to Craig Holland. A new convertible note for $222,572 was issued to the Holland Family Trust with the same terms as the previous note, with the exception of the maturity date,“form of” document, which was extended to September 30, 2015 and has since been extended to December 31, 2017. As of December 31, 2016 and 2015, accrued interest related to the Holland Family Trust Convertible Note was $50,124 and $27,867, respectively.is incorporated herein by reference.
On July 25, 2017, we entered into a Securities Exchange and Common Stock Purchase Agreement with Mick Donahoo, our Chief Financial Officer (the “Donahoo Securities Exchange Agreement”). Under the Donahoo Securities Exchange Agreement, Mr. Donahoo agreed to exchange a promissory note issued by us dated December 31, 2013 (“Donahoo Note”), and the $31,042 in principal owing under the Donahoo Notes, into 1,552,100 shares of our common stock (the “Donahoo Common Stock”), on a post-reverse basis (based on a prospective 1-for-100 reverse stock split planned for on or about September 30, 2014, $813,602 principal balance (including interest)1, 2017). At the time, the closing under the Donahoo Securities Exchange Agreement for the exchange of the Holland Family Trust Convertible Note was transferredDonahoo Notes for the Donahoo Common Stock will occur automatically upon the effectiveness of the referenced reverse stock split. The description of the Donahoo Securities Exchange Agreement set forth in this report is qualified in its entirety by reference to the full text of the “form of” document, which is incorporated herein by reference.
On October 5, 2017, FINRA took our reverse stock split effective at the open of market. As a result, on October 5, 2017, we issued 37,849,200 shares of common stock to Craig Holland (the “Holland Transferred Convertible Note”). The Holland Transferred Convertible Note retains the same terms as the original Holland Family Trust Convertible Note with the exception of the maturity date, which was extended to September 30, 2015 and has since been extended to December 31, 2017. As of December 31, 2016 and 2015, accrued interest related tounder the Holland Transferred ConvertibleSecurities Exchange Agreement and 1,552,100 shares of common stock to Mick Donahoo under the Donahoo Securities Exchange Agreement. At the closing, the $ 285,764 in interest due under the Holland Notes was waived and the $9,841 in interest due under the Donahoo Note was $183,228 and $101,867, respectively.waived.
| 44 |
| Table of Contents |
Stock Options
On December 31, 2013, the Company converted $186,450 of accrued salaries due to Craig Holland into a convertible note (the “Holland Accrued Salary Note”) and converted $186,450 of accrued salaries due to5, 2017, we granted Mick Donahoo, into a convertible note (the “Donahoo Accrued Salary Note”). The Holland Accrued Salary Note and the Donahoo Accrued Salary Note are convertible into Company common stock at the greater of (i) the Variable Conversion Price and (ii) the Fixed Conversion Price. The “Variable Conversion Price” shall mean 50% multiplied by the Market Price (representing a discount rate of 50%). “Market Price” means the average of the three lowest trading prices for the Company’s common stock during the twenty-five (25) trading-day period ending on the latest complete trading day prior to the Conversion Date. “Fixed Conversion Price” shall mean $0.00005. The promissory notes contain a limiter that disallows conversion if such conversions would cause the holder to own more than 4.99% of our outstanding common stock after the conversion. The maturity date of the note has been extended to December 31, 2017. As of December 31, 2016 and December 31, 2015, there was accrued interest related to each of these notes of $55,935 and $37,290, respectively.
On December 31, 2013, the Company converted a note payable to Mick Donahoo of $55,250 and accrued interest of $15,399 into a new convertible related party note in the amount of $70,649 (the “Mick Donahoo Convertible Note”).
On December 31, 2013, the Company converted a note payable to Craig Holland of $35,100 and accrued interest of $11,432 into a new convertible related party note in the amount of $46,532 (the “Craig Holland Convertible Note”).
The Mick Donahoo Convertible Note and the Craig Holland Convertible Note are convertible into Company common stock at the greater of (i) the Variable Conversion Price and (ii) the Fixed Conversion Price. The “Variable Conversion Price” shall mean 50% multiplied by the Market Price (representing a discount rate of 50%). “Market Price” means the average of the three lowest trading prices for the Company’s common stock during the twenty-five (25) trading-day period ending on the latest complete trading day prior to the Conversion Date. “Fixed Conversion Price” shall mean $0.00005. Both promissory notes contain a limiter that disallows conversion if such conversions would cause the holder to own more than 4.99% of our outstanding common stock after the conversion. The maturity date of the notes has been extended to December 31, 2017. As of December 31, 2016 and December 31, 2015, there was accrued interest payable related to these notes totaling of $8,943 and $5,146, respectively.
On October 23, 2014, Craig Holland converted $35,000 principal and $2,836 accrued interest into 39,829,849 shares of our common stock.
On October 23, 2014, Mick Donahoo converted $35,000 principal and $2,836 accrued interest into 39,829,849 shares of our common stock.
On October 8, 2015, Craig Holland converted $4,607 principal and $2,028 accrued interest into 12,637,860 shares of the Company’s common stock.
On October 8, 2015, Mick Donahoo converted $4,607 principal and $2,028 accrued interest into 12,637,860 shares of the Company’s common stock.
Total accrued interest payable for the related party convertible notes was $354,165 and $209,461 as of December 31, 2016 and 2015, respectively.
Stock Options
On August 2, 2010, we granted Craig Holland, our President, Chief ExecutiveFinancial Officer, and a Director, options to purchase up to 115,0001,025,641 shares of our common stock at an exercise price of $0.11$0.039 per share. The options were granted under the Freeze Tag, Inc. 20062017 Non-Qualified Stock Option Plan which was terminatedand were issued in 2016.lieu of $40,000 of accrued vacation time. The options expire in August 2020.December 2027.
ITEM 14 – PRINCIPAL ACCOUNTING FEES AND SERVICES
Audit and Related Fees
During the years ended December 31, 20162023 and 2015,2022, M&K CPAS, PLLC charged us $27,700$49,250 and $27,200,$47,000, respectively, in fees for professional services for the audit of our financial statements included in our annual report and for reviews of our quarterly reports.
Tax Fees
During the years ended December 31, 20162023 and 2015,2022, M&K CPAS, PLLC did not charge us for professional services for tax preparation.
All Other Fees
During the years ended December 31, 20162023 and 2015,2022, M&K CPAS, PLLC did not charge us for any other fees.
Of the fees described above for the years ended December 31, 20162023 and 2015,2022, 100% was approved by the entire Board of Directors.
| Table of Contents |
PART IV
ITEM 15 –‑ EXHIBITS, FINANCIAL STATEMENT SCHEDULES
(a)(1) Financial Statements
The following financial statements are filed as part of this report:
(a)(2) Financial Statement Schedules
We do not have any financial statement schedules required to be supplied under this Item.
(a)(3) Exhibits
Refer to (b) below.
| Table of Contents |
(b) Exhibits
(b) Exhibits
| ||
| ||
| ||
| ||
| ||
| ||
| Articles of Amendment to Certificate of Incorporation February 4, 2014 | |
| ||
| Articles of Amendment to Certificate of Incorporation filed on February 18, 2016 | |
| ||
|
|
|
| 10% Convertible Promissory Note dated July 1, 2010 with The Holland Family Trust | |
| ||
|
| |
|
| |
|
| |
|
| |
|
| |
|
| |
|
| |
|
|
|
| |
|
| |
|
| |
|
|
|
| |
|
| |
|
| |
|
| |
|
| |
|
| |
|
| |
|
| |
|
| |
| Convertible Promissory Note (10%) dated December 20, 2013 – Accredited Investor | |
| ||
|
| Convertible Promissory Note (10%) dated December 31, 2013 – Holland Family Trust |
| ||
|
| Convertible Promissory Note (10%) dated December 31, 2013 – Craig Holland Debt |
| 47 | ||
| Table of Contents |
| 48 |
| Table of |
| ||
| ||
|
101.INS** |
| Inline XBRL Instance Document (the instance document does not appear in the Interactive Data File because its XBRL tags are embedded within the Inline XBRL document) |
| ||
101.SCH** |
| Inline XBRL Taxonomy Extension Schema Document |
| ||
101.CAL** |
| Inline XBRL Taxonomy Extension Calculation Linkbase Document |
| ||
101.DEF** |
| Inline XBRL Taxonomy Extension Definition Linkbase Document |
| ||
101.LAB** |
| Inline XBRL Taxonomy Extension Label Linkbase Document |
| ||
101.PRE** |
| Inline XBRL Taxonomy Extension Presentation Linkbase Document |
|
| |
104 | Cover Page Interactive Data File (embedded within the inline XBRL document). |
* | Filed herewith. |
** | Pursuant to Rule 406T of Regulation S-T, these interactive data files are deemed not filed or part of a registration statement or prospectus for purposes of Sections 11 or 12 of the Securities Act of 1933 or Section 18 of the Securities Act of 1934 and otherwise are not subject to liability. |
(1) | |
| Incorporated by reference from our Registration Statement on Form S-1, filed with the Commission on August 16, 2010. | |
|
|
(2) | |
| Incorporated by reference from Current Report on Form 8-K filed with the Commission on | |
|
|
(3) | |
| Incorporated by reference from Definitive Information Statement on Schedule 14-C filed with the Commission on December 31, 2013. | |
|
|
(4) | Incorporated by reference from our Quarterly Report on Form 10-Q filed with the Commission on November 14, 2014. |
|
|
(5) | Incorporated by reference from our Quarterly Report on Form 10-Q filed with the Commission on May 15, 2015. |
|
|
(6) | Incorporated by reference from our Quarterly Report on Form 10-Q filed with the Commission on November 16, 2015. |
|
|
(7) | Incorporated by reference from Annual Report on Form 10-K filed with the Commission on March 30, 2016. |
|
|
(8) | Incorporated by reference from our Quarterly Report on Form 10-Q filed with the Commission on August 14, 2016. |
|
|
(9) | Incorporated by reference from our Quarterly Report on Form 10-Q filed with the Commission on November 14, 2016. |
(10) | Incorporated by reference from Annual Report on Form 10-K filed with the Commission on March 31, 2017. |
(11) | Incorporated by reference from Current Report on Form 8-K filed with the Commission on July 31, 2017. |
(12) | Incorporated by reference from Current Report on Form 8-K filed with the Commission on April 11, 2018 |
(13) | Incorporated by reference from Quarterly Report on Form 10-Q filed with the Commission on May 15, 2020 |
ITEM 16 – FORM 10-K SUMMARY
Not applicable.
| Table of Contents |
SIGNATURES
In accordance with Section 13 or 15(d) of the Exchange Act, the registrant caused this report to be signed on its behalf by the undersigned, thereunto duly authorized.
| Freeze Tag, Inc. | ||
| |||
|
| ||
Dated: |
| /s/ Craig Holland |
|
| By: | Craig Holland |
|
| Its: |
|
|
| |||
Dated: |
| /s/ Mick Donahoo |
|
|
| Mick Donahoo |
|
| Its: | Chief Financial Officer, Chief Accounting Officer |
|
In accordance with the Exchange Act, this report has been signed below by the following persons on behalf of the registrant and in the capacities and on the dates indicated.
Dated: |
| /s/ Craig Holland |
|
|
| Craig Holland |
|
| Its: | Director |
|
|
| ||
Dated: |
| /s/ Mick Donahoo |
|
|
| Mick Donahoo |
|
| Its: | Director, Chief Financial Officer, Chief Accounting Officer |
|
Dated: April 1, 2024 | /s/ Rob Vardeman | ||
By: | Rob Vardeman | ||
Its: | Director and President | ||
Dated: April 1, 2024 | /s/ Don Vardeman | ||
By: | Don Vardeman | ||
Its: | Director |
| 50 |
|