SECURITIES AND EXCHANGE COMMISSION
Washington, D.C. 20549
FORM 10-K
☒ | |
ANNUAL REPORT PURSUANT TO SECTION 13 OR 15(d) OF THE SECURITIES EXCHANGE ACT OF 1934 |
For the Fiscal Year Ended September 30, 20132016
OR
☐ | |
TRANSITION REPORT PURSUANT TO SECTION 13 OR 15(d) OF THE SECURITIES EXCHANGE ACT OF 1934 For the transition period from __________ to ___________ |

Commission File No. | Name of Registrant, State of Incorporation, Address of Principal Offices, and Telephone No. | IRS Employer Identification No. | ||
001-34757 | ||||
Spectrum Brands Holdings, Inc. ( | ||||
| a Delaware corporation) 3001 Deming Way Middleton, (608) 275-3340 www.spectrumbrands.com | 27-2166630 | |||
333-192634-03 | SB/RH Holdings, LLC ( 3001 Deming Way Middleton, WI 53562 (608) 275-3340 | 27-2812840 | ||
Securities registered pursuant to Section 12(b) of the Act:
Registrant | ||||
Title of each class | Name of each exchange on which registered | |||
Spectrum Brands Holdings, Inc. | Common Stock, Par Value $0.01 | New York Stock Exchange | ||
SB/RH Holdings, LLC | None | None |
Securities registered pursuant to Section 12(g) of the Act:
None
1
Indicate by check mark if the registrant is aregistrants are well-known seasoned issuer,issuers, as defined in Rule 405 of the Securities Act. Yes
Spectrum Brands Holdings, Inc. | Yes | ☒ | No | ☐ | ||
SB/RH Holdings, LLC | Yes | ☐ | No | ☒ |
Indicate by check mark if the registrant isregistrants are not required to file reports pursuant to Section 13 or Section 15(d) of the Act. Yes
Spectrum Brands Holdings, Inc. | Yes | ☐ | No | ☒ | ||
SB/RH Holdings, LLC | Yes | ☐ | No | ☒ |
Indicate by check mark whether the registrantregistrants (1) hashave filed all reports required to be filed by Section 13 or 15(d) of the Securities Exchange Act of 1934 during the preceding 12 months (or for such shorter period that the registrant was required to file such reports), and (2) has been subject to such filing requirements for the past 90 days. Yes
Spectrum Brands Holdings, Inc. | Yes | ☒ | No | ☐ | ||
SB/RH Holdings, LLC | Yes | ☒ | No | ☐ |
Indicate by check mark whether the registrant hasregistrants have submitted electronically and posted on itstheir corporate Web site, if any, every Interactive Data File required to be submitted and posted pursuant to Rule 405 of Regulation S-T (§232.405 of this chapter) during the preceding 12 months (or for such shorter period that the registrant was required to submit and post such files). Yes
Spectrum Brands Holdings, Inc. | Yes | ☒ | No | ☐ | ||
SB/RH Holdings, LLC | Yes | ☒ | No | ☐ |
Indicate by check mark if disclosure of delinquent filers pursuant to Item 405 of Regulation S-K is not contained herein, and will not be contained, to the best of registrant’s knowledge, in definitive proxy or information statements incorporated by reference in Part III of this Form 10-K or any amendment to this Form 10-K.
Spectrum Brands Holdings, Inc. | ☐ | |||||
SB/RH Holdings, LLC | ☐ |
Indicate by check mark whether the registrant is a large accelerated filer, an accelerated filer, a non-accelerated filer, or a smaller reporting company. See the definitions of “large accelerated filer,” “accelerated filer” and “smaller reporting company” in Rule 12b-2 of the Exchange Act. (Check one):
Registrant | Large Accelerated Filer | |||||||
Accelerated filer | ||||||||
Non-accelerated filer | Smaller reporting company | |||||||
Spectrum Brands Holdings, Inc. | X | |||||||
SB/RH Holdings, LLC | X | |||||||
Indicate by check mark whether the registrant is a shell company (as defined in Rule 12b-2 of the Exchange Act). Yes
Spectrum Brands Holdings, Inc. | Yes | ☐ | No | ☒ | ||
SB/RH Holdings, LLC | Yes | ☐ | No | ☒ |
The aggregate market value of the voting stock held by non-affiliates of the registrantSpectrum Brands Holdings, Inc. was approximately $1,228,779,585$2,677,495,424 based upon the closing price on the last business day of the registrant's most recently completed second fiscal quarter (March 31, 2013)(April 3, 2016).* As of November 25, 201314, 2016, there were outstanding 52,423,49259,410,438 shares of the registrant'sSpectrum Brands Holdings, Inc.’s Common Stock, par value $0.01 per share.
SB/RH Holdings, LLC meets the conditions set forth in General Instruction I(1)(a) and (b) of Form 10-K and has therefore omitted the information otherwise called for by Items 10 to 13 of Form 10-K as allowed under General Instruction I(2)(c).
DOCUMENTS INCORPORATED BY REFERENCE
Portions of the registrant’sSpectrum Brands Holdings, Inc.’s definitive proxy statement to be filed within 120 days of September 30, 20132016 are incorporated by reference in this Annual Report on Form 10-K in response to Part III, Items 10, 11, 12, 13 and 14.
2
SPECTRUM BRANDS HOLDINGS, INC.
SB/RH HOLDINGS, LLC
Page | |||||
PART I | |||||
| 17 | |||||
| ITEM 1B. | 35 | ||||
| 35 | |||||
| 37 | |||||
| ITEM 4. | 37 | ||||
PART II | |||||
| 38 | |||||
| 40 | |||||
MANAGEMENT’S DISCUSSION AND ANALYSIS OF FINANCIAL CONDITION AND RESULTS OF OPERATIONS | 41 | ||||
| 58 | |||||
| 59 | |||||
CHANGES IN AND DISAGREEMENTS WITH ACCOUNTANTS ON ACCOUNTING AND FINANCIAL DISCLOSURE | 59 | ||||
| 59 | |||||
| 60 | |||||
PART III | |||||
| 61 | |||||
| 61 | |||||
| ITEM 12. | SECURITY OWNERSHIP OF CERTAIN BENEFICIAL OWNERS AND MANAGEMENT AND RELATED STOCKHOLDER MATTERS | 61 | |||
CERTAIN RELATIONSHIPS AND RELATED TRANSACTIONS AND DIRECTOR INDEPENDENCE | 62 | ||||
| 62 | |||||
PART IV | |||||
| 63 | |||||
INDEX TO CONSOLIDATED FINANCIAL STATEMENTS AND FINANCIAL STATEMENT SCHEDULE | 64 | ||||
| 122 | |||||
| EXHIBIT INDEX | 124 | ||||
3
Forward-Looking Statements
We have made or implied certain forward-looking statements in this Annual Report on Form 10-K.report. All statements, other than statements of historical facts included in this Annual Report,report, including the statements under Item 7. Management’s“Management’s Discussion and Analysis of Financial Condition and Results of OperationsOperations” regarding our business strategy, future operations, financial condition, estimated revenues, projected costs, projected synergies, prospects, plans and objectives of management, as well as information concerning expected actions of third parties, are forward-looking statements. When used in this Annual Report,report, the words “anticipate,” “intend,” “plan,” “estimate,” “believe,” “expect,” “project,” “could,” “will,” “should,” “may”anticipate, intend, plan, estimate, believe, expect, project, could, will, should, may and similar expressions are also intended to identify forward-looking statements, although not all forward-looking statements contain such identifying words.
Since these forward-looking statements are based upon our current expectations of future events and projections and are subject to a number of risks and uncertainties, many of which are beyond our control and some of which may change rapidly, actual results or outcomes may differ materially from those expressed or implied herein, and youundue reliance should not place undue reliancebe placed on these statements. Important factors that could cause our actual results to differ materially from those expressed or implied herein include, without limitation:
· | the impact of our indebtedness on our business, financial condition and results of operations; |
· | the impact of restrictions in our debt instruments on our ability to operate our business, finance our capital needs or pursue or expand business strategies; |
· | any failure to comply with financial covenants and other provisions and restrictions of our debt instruments; |
· | the impact of actions taken by significant stockholders; |
· | the impact of expenses resulting from the implementation of new business strategies, divestitures or current and proposed restructuring activities; |
· | our inability to successfully integrate and operate new acquisitions at the level of financial performance anticipated; |
· | the unanticipated loss of key members of senior management; |
· | the impact of fluctuations in commodity prices, costs or availability of raw materials or terms and conditions available from suppliers, including suppliers’ willingness to advance credit; |
· | interest rate and exchange rate fluctuations; |
· | our ability to utilize our net operating loss carry-forwards to offset tax liabilities from future taxable income; |
· | the loss of, significant reduction in, or dependence upon, sales to any significant retail customer(s); |
· | competitive promotional activity or spending by competitors, or price reductions by competitors; |
· | the introduction of new product features or technological developments by competitors and/or the development of new competitors or competitive brands; |
· | the effects of general economic conditions, including inflation, recession or fears of a recession, depression or fears of a depression, labor costs and stock market volatility or changes in trade, monetary or fiscal policies in the countries where we do business; |
· | changes in consumer spending preferences and demand for our products; |
· | our ability to develop and successfully introduce new products, protect our intellectual property and avoid infringing the intellectual property of third parties; |
· | our ability to successfully implement, achieve and sustain manufacturing and distribution cost efficiencies and improvements, and fully realize anticipated cost savings; |
· | the cost and effect of unanticipated legal, tax or regulatory proceedings or new laws or regulations (including environmental, public health and consumer protection regulations); |
· | public perception regarding the safety of products that we manufacture and sell, including the potential for environmental liabilities, product liability claims, litigation and other claims related to products manufactured by us and third parties; |
· | the impact of pending or threatened litigation; |
· | the impact of cybersecurity breaches or our actual or perceived failure to protect company and personal data; |
· | changes in accounting policies applicable to our business; |
· | government regulations; |
· | the seasonal nature of sales of certain of our products; |
· | the effects of climate change and unusual weather activity; and |
· | the effects of political or economic conditions, terrorist attacks, acts of war or other unrest in international markets. |
Some of the above-mentioned factors are described in further detail in the sectionsections entitled “Risk Factors” set forth below.in our annual and quarterly reports (including this report), as applicable. You should assume the information appearing in this Annual Report on Form 10-Kreport is accurate only as of
4
PART I
This combined Form 10-K is being filed separately by Spectrum Brands Holdings, Inc., a Delaware corporation (“SB Holdings” orSBH”) and SB/RH Holdings, LLC (“SB/RH”) (collectively, the “Company”). SB/RH is a wholly-owned subsidiary of SBH and represents a majority of its assets, liabilities, revenues, expenses and operations. Thus, all information contained in this report relates to, and is filed by, SBH. Information that is specifically identified in this report as relating solely to SBH, such as its financial statements and its common stock, does not relate to and is not filed by SB/RH. SB/RH makes no representation as to that information. The terms “the Company,” “we,” and “our” as used in this report, refer to both SBH and its consolidated subsidiaries and SB/RH and its consolidated subsidiaries, unless otherwise indicated. The terms “SBH” and “SB/RH” refer to Spectrum Brands Holdings, Inc. and SB/RH Holdings, LLC, respectively.
Our Annual Reports on Form 10-K, Quarterly Reports on Form 10-Q, Current Reports on Form 8-K and amendments to reports filed pursuant to Sections 13(a) and 15(d) of the Securities Exchange Act of 1934, as amended (the “Exchange Act”), isare made available free of charge on or through our website at www.spectrumbrands.com as soon as reasonably practicable after such reports are filed with, or furnished to the SEC. You may read and copy any materials we file with the SEC at the SEC’s Public Reference Room at 100 F Street, NE, Washington, DC 20549. You may obtain information on the operation of the Public Reference Room by calling the SEC at 1-800-SEC-0330. The SEC also maintains an Internet site that contains our reports, proxy statements and other information at www.sec.gov. In addition, copies of our (i) Corporate Governance Guidelines, (ii) charters for the Audit Committee, Compensation Committee and Nominating and Corporate Governance Committee, (iii) Code of Business Conduct and Ethics and (iv) Code of Ethics for the Principal Executive Officer and Senior Financial Officers are available at our Internet site at www.spectrumbrands.com under “Investor Relations—Corporate Governance.” Copies will also be provided to any stockholder upon written request to the Vice President, Investor Relations & Corporate Communications, Spectrum Brands, Inc. at 3001 Deming Way, Middleton, Wisconsin 53562 or via electronic mail at investorrelations@spectrumbrands.com, or by contacting the Vice President, Investor Relations & Corporate Communications by telephone at (608) 275-3340.
General
We are a diversified global branded consumer products company. Spectrum Brands, Inc. (“Spectrum Brands”), is a wholly owned subsidiary of SB Holdings. SB Holdings' common stock trades on the New York Stock Exchange (the “NYSE”) under the symbol “SPB.”
Our operating performance is influenced by a number of factors including: general economic conditions; foreign exchange fluctuations; trends in consumer markets; consumer confidence and preferences; our overall product line mix, including pricing and gross margin, which vary by product line and geographic market; pricing of certain raw materials and commodities; energy and fuel prices; and our general competitive position, especially as impacted by our competitors’ advertising and promotional activities and pricing strategies. See Management’s Discussion and Analysis of Financial Condition and Results of Operations, included elsewhere in this Annual Report on Form 10-K, for further discussion of the consolidated operating results.
5
Our Products
Our mission is to achieve superior shareholder returns through above-market organic growth, with a focus on building sustainable free cash flow and further acquisitions. Our vision is to be the preferred strategic partner to our customers with an expanding portfolio of innovative and superior-value consumer batteries; small appliances; pet supplies; electric shaving and grooming; electric personal care; home and garden controls; and hardware and home improvement. Our broad line of products include:
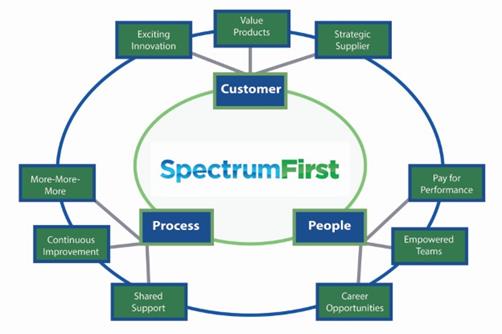
The Spectrum First growth accelerators; Customer, Process, and herbicides;People; provide the roadmap for how we intend to execute this strategy. Each growth accelerator has three drivers. These accelerators and their respective drivers are collectively known as the “Spectrum First 3x3.”
· | Customer – Our first growth accelerator focuses on strengthening strategic partnerships with customers. Our objective is for our retail partners to think of Spectrum Brands first when identifying how best to compete for consumers’ attention to bring them into their stores and online platforms with exciting product innovation, converting interest to sales through value products, and being a strategic supplier through total-cost reduction initiatives. |
· | Process – Our process growth accelerator is intended to drive continuous improvements in our products, costs and processes to generate healthy margins through sales growth with our “more-more-more” strategy to achieve above-market sales growth, which means entering into more countries, serving more channels and launching more categories. We also seek to drive continuous improvement over performance, quality and costs, and provide superior and efficient services through our shared services and “Centers of Excellence” model. |
· | People – Employees represent the third Spectrum First growth accelerator. We are working to be a preferred employer by empowering our teams and providing long-term career opportunities and pay-for-performance through focusing on retention and collaboration; driving empowered teams with trust, competence and speed; supporting alignment and providing more paths for employees to embrace new challenges and advance their careers across the global organization. |
6
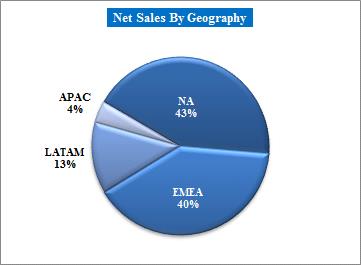
Global Batteries and home improvement products, including residential locksets, builders hardware and plumbing products.
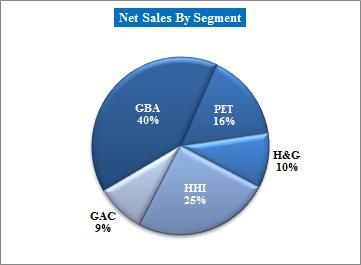
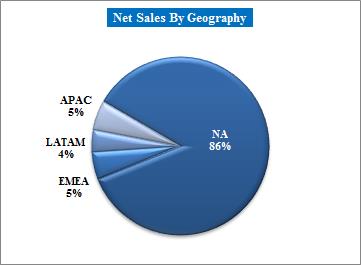
The following is an overview of the GBA segment net sales of eachby product category and geographic region sold (based upon destination) as a percentage of net sales of our consolidated operations, is set forth below.
Percentage of Total Company Net Sales for the Fiscal Year Ended September 30, | |||||||||
| 2013 | 2012 | 2011 | |||||||
| Consumer batteries | 23 | % | 29 | % | 30 | % | |||
| Hardware and home improvement products | 21 | % | — | % | — | % | |||
| Small appliances | 18 | % | 24 | % | 24 | % | |||
| Pet supplies | 15 | % | 19 | % | 18 | % | |||
| Home and garden control products | 10 | % | 12 | % | 11 | % | |||
| Electric shaving and grooming products | 7 | % | 8 | % | 9 | % | |||
| Electric personal care products | 6 | % | 8 | % | 8 | % | |||
| 100 | % | 100 | % | 100 | % | ||||
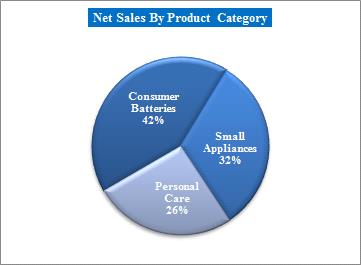
The consumer batteries product category consists of alkaline batteries, (AA, AAA, C, Dzinc carbon batteries, nickel metal hydride (NiMH) rechargeable batteries and 9-volt sizes) to both retail and industrial customers. Our alkaline batteries are marketed and soldbattery chargers primarily under the RayovacRayovac® and VARTAVARTA® brands. We alsoAdditionally, we manufacture alkaline batteries for third parties who sell the batteries under their own private labels. Our zinc carbon batteries are also marketed and sold primarily under the Rayovac and VARTA brands and are designed for low and medium drain battery powered devices.
The small appliances product category consists of small kitchen appliances under the Black & Decker®, Russell Hobbs®, George Foreman®, Juiceman® and Breadman® brands, including toaster ovens, toasters, sandwich makers, coffeemakers, coffee grinders, can openers, electric knives, grills, deep fryers, food choppers, food processors, slow cookers, hand mixers, blenders, juicers, bread makers, kettles, rice cookers and steamers. We also sell small home product appliances, including hand-held irons, vacuum cleaners, air purifiers, clothes shavers and heaters, primarily under the Black & Decker® and Russell Hobbs® brands.
The personal care product category includes a broad line of electric shaving and grooming products under the Remington® brand name, including men’s rotary and foil shavers, beard and mustache trimmers, body, nose and ear trimmers, women’s shavers, haircut kits and intense pulsed light hair removal systems. Other personal care products include hand-held dryers, curling irons, straightening irons, brush irons, hair setters, facial brushes, skin appliances, electric toothbrushes and hair accessories.
We manage our GBA sales teams by geographic region and product category. We sell primarily to large retailers, online retailers, wholesalers, distributors, warehouse clubs, food and drug chains and specialty trade or retail outlets such as consumer electronics stores, department stores, discounters and other specialty stores. We maintain separate sales teams to service (i) our retail sales and distribution channels; (ii) our hearing aid professionals channel; and (iii) our industrial distributors and OEM sales and distribution channel. International distribution varies by region and is often executed on a country-by-country basis. We utilize a network of independent brokers to service participants in selected distribution channels.
See Management’s Discussion and Analysis of Financial Condition and Results of Operations, included elsewhere in this Annual Report on Form 10-K, for further discussion of the segment’s operating results.
7
Hardware and Home Improvement Products
The following is an overview of the hardware and home improvementHHI segment net sales by product category we market and sellgeographic region sold (based upon destination) as a percentage of net sales for the segment for the year ended September 30, 2016:
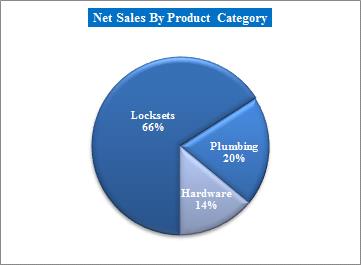

The lockset product category includes a broad range of residential locksets and door hardware including knobs, levers, deadbolts, handlesetshandle sets and electronics. We offer our security hardwareelectronics under three main brands, Kwikset, Weiser and Baldwin. On a global basis we are one of the largest producers of tubular residential locksets. Kwikset includes opening to mid-price pointbrands: (i) Kwikset®, residential door hardware sold primarily in the U.S. retail and wholesale channels. Products are offered under the three brands Safe Lock, Kwikset and Kwikset Signature Series. Weiser offers opening to mid-price point; (ii) Weiser®, residential door hardware sold primarily in the Canadian retailCanada; and wholesale channels. Baldwin offers high price point(iii) Baldwin®, luxury hardware sold globally through the showroom and lumber yard channels.
The plumbing product line is largely harmonized between the brands, the dual branding approach has been utilized to protect legacy business with key customers and avoid channel conflict.
The hardware product category we marketincludes hinges, security hardware, screen and storm door products, garage door hardware, window hardware and floor protection under the National Hardware® and Stanley® brand names throughout the U.S. and Canada. The product line is largely harmonized between these brands and the dual-branding approach has been utilized to protect legacy business with key customers and avoid channel conflict.
On October 1, 2014, the Company acquired privately owned Tell Manufacturing, Inc. (“Tell”), a U.S. manufacturer and distributor of commercial doors, locks and hardware. Tell provides the HHI segment with an established commercial security sales position through a well-recognized brand, along with a platform to expand our patented SmartKey® and Kevo® residential lock technologies into commercial channels. The Tell acquisition also added doors and hollow metal door manufacturing capabilities, a strategically important adjacent category.
The sales force of the HHI business is aligned by customer and geographic region. We sell a variety of leading branded pet supplies for fish, dogs, cats, birdsprimarily to large retailers, home improvement centers, hardware stores, non-retail distributors, home builders, commercial contractors, and other small domestic animals. We haveretailers.
See Management’s Discussion and Analysis of Financial Condition and Results of Operations, included elsewhere in this Annual Report on Form 10-K, for further discussion of the segment’s operating results.
8
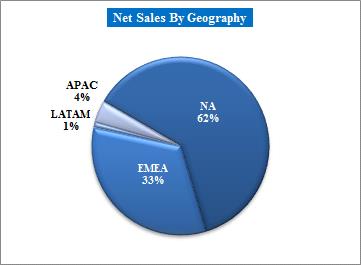
Global Pet Supplies (PET)
The following is an overview of the PET segment net sales by product category and geographic region sold (based upon destination) as a percentage of net sales for the segment for the year ended September 30, 2016:
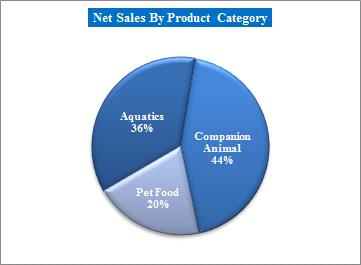
The aquatics product category includes a broad line of consumer and commercial aquatics products, including integrated aquarium kits, stand-alone tanks and stands, aquatics equipment such as filtration systems, heaters, and pumps, and other equipment,aquatics consumables such as fish food, water treatments and water treatment products.conditioners. Our largest aquatics brands are Tetra, Marineland, Whisper, JungleTetra®, Marineland®, Whisper®, Jungle® and Instant Ocean. We also sellOcean®.
The companion animal product category includes a variety of specialty pet products including rawhide chews, dog and cat treats, small animal food and treats, clean upclean-up and training aid products, health and grooming aids, bedding products, and consumable accessories including privacy tents, litter carpets, crystal litter cartridges, charcoal filters, corn-based litter and replaceable waste receptacles. Our largest specialty pet brands include FURminator, 8-in-1, Dingo,FURminator®, 8-in-1®, Dingo®, Nature’s Miracle,Miracle®, Wild HarvestHarvest® and Littermaid.Littermaid®.
The pet food product category includes wet and dry pet food for dogs and cats under the IAMS®, Eukanuba® and 8-in-1® brand names in European markets. On December 31, 2014, we completed the acquisition of Procter & Gamble’s European pet food business, consisting of the IAMS® and Eukanuba® brands for dogs and cats. Eukanuba® is a popular brand with breeders and veterinarians in Europe; and IAMS® is a premium brand with broad customer appeal primarily in the United Kingdom with opportunities to grow further across Europe and is positioned for consumers who treat their pets as family members and view the food they feed their pets as a way to make them happy.
Additionally, on January 16, 2015, we acquired Salix Animal Health, a vertically integrated producer and distributor of natural rawhide dog chews, treats and snacks, offering a comprehensive line of chews made from beef hides, pork, chicken, beef and other various proteins. Its two flagship brands are Healthy-Hide® that is marketed across the Good’n’Fun®, Good’n’Fit®, and Good’n’Tasty® family of brands; and Digest-eeze®. Salix will provide the segment with increased optionality for low-cost global rawhide production and supply, and expand our Dingo® dog treats business with complementary product offerings.
Our PET sales force is aligned by customer type, geographic region and product category. We sell primarily to mass merchandisers, grocery stores and drug chains, pet superstores, independent pet stores, warehouse clubs and other specialty retailers. International distribution varies by region and is often executed on a country-by-country basis.
See Management’s Discussion and Analysis of Financial Condition and Results of Operations, included elsewhere in this Annual Report on Form 10-K, for further discussion of the segment’s operating results.
9
Home and Garden Control Products
The following is an overview of the home, lawnH&G segment net sales by product category and garden products geographic region sold (based upon destination) as a percentage of net sales for the segment for the year ended September 30, 2016:
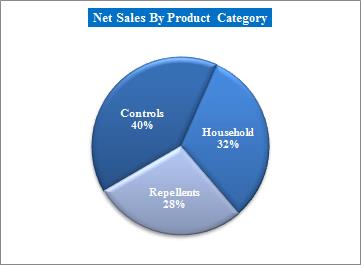

The controls product category we currently sell and marketincludes a variety of leadingoutdoor insect and weed control solutions, and animal repellents under the brand names Spectracide®, Black Flag®, Garden Safe®, EcoLogic® and Liquid Fence®. Our line of outdoor control solutions are designed to assist consumers in controlling insects, weeds and animals when tackling lawn and landscaping projects themselves. From selective and non-selective herbicides to pest-specific solutions, our outdoor products including are available as aerosols, granules, ready-to-use or hose-end ready-to-sprays designed to fulfill a variety of consumer needs.
The household insecticides, insect repellents, and lawn insect and weed control solutions. We offer product category includes a broad array of household pest control solutions, such as spider and scorpion killers; roach and ant killers; flying insect killers; insect foggers; wasp and hornet killers; bedbug, flea and tick control products; and roach and ant baits. We also offer powerful rodent traps and rodenticides with discreet designs that are easy to refill and reuse. Our largest brands in the household insect control and rodenticide category are Hot ShotShot® and Black Flag.
The repellents product category includes personal use pesticides for protection from various outdoor nuisance pests, especially mosquitoes. These products include both personal repellents available in a variety of formulas (suchsuch as aerosols, lotions, pump sprays and wipes)wipes to match consumers’ dynamic needs,needs; as well as area repellents (suchsuch as yard sprays, citronella candles and patio lanterns) that letlanterns to allow consumers to enjoy the outdoors without bothersome pests. Our brands in the insect repellents category are CutterCutter® and Repel.
Repel®.
The Home and Garden business sales force is geographically aligned with our key customers. We sell primarily to home improvement centers, mass merchandisers, dollar stores, hardware stores, home and garden distributors, and food and drug retailers, primarily in the U.S.
See Management’s Discussion and Analysis of Financial Condition and Results of Operations, included elsewhere in this Annual Report on Form 10-K, for further discussion of the segment’s operating results.
10
Global Auto Care (GAC)
The following is an overview of the GAC segment net sales by product category and geographic region sold (based upon destination) as a percentage of net sales for the segment for the year ended September 30, 2016:
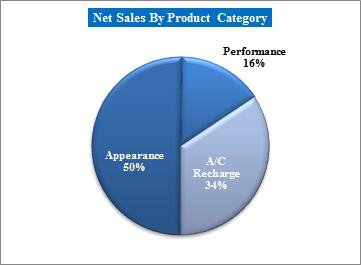
We entered the GAC segment through our lineacquisition of outdoor insectArmored Auto Group (“AAG”) on May 21, 2015, which consists of products within the automotive aftermarket appearance, performance chemicals, and weed control solutions allows consumers to conquer bugsdo-it-yourself automotive air conditioner recharge product categories.
The appearance product category includes protectants, wipes, tire and weeds,wheel care products, glass cleaners, leather care products, air fresheners and tackle their biggest lawn and landscaping projects themselves. From selective and non-selective herbicides to pest-specific solutions, our outdoor products are available in easy-to-use formulations (such as aerosols, granules, ready-to-use or hose-end ready-to-sprays)washes designed to fulfillclean, shine, refresh and protect interior and exterior automobile surfaces under the brand name Armor All®. Armor All® is a variety of consumer needs. Our outdoor insecticideleader in the automotive aftermarket appearance products category based upon its recognized brand name, convenient application methods and herbicide brands include Spectracideproduct innovation.
The performance product category includes STP® branded fuel and Garden Safe.
The A/C recharge product category includes do-it-yourself automotive air conditioner recharge products under the RemingtonA/C PRO® brand name, including men’s rotaryalong with other refrigerant and foil shavers, beardoil recharge kits, sealants and mustache trimmers, body, noseaccessories.
The GAC business sales force is geographically aligned with key customers and ear trimmers, women’s shavers, haircut kitssupply chains. We sell primarily to big-box auto, auto specialty retail, mass retailers, food and intense pulsed light hair removal systems.
See Management’s Discussion and Analysis of productsFinancial Condition and Results of Operations, included elsewhere in this Annual Report on Form 10-K, for further discussion of the branded small household appliances category under the George Foreman, Black & Decker, Russell Hobbs, Farberware, Juiceman, Breadmansegment’s operating results.
11
Other Information
Sales, Distribution and Toastmaster brands, including grills, bread makers, sandwich makers, kettles, toaster ovens, toasters, blenders, juicers, can openers, coffee grinders, coffeemakers, electric knives, deep fryers, food choppers, food processors, hand mixers, rice cookers and steamers. We also market small home product appliances, including hand-held irons, vacuum cleaners, air purifiers, clothes shavers and heaters, primarily under the Black & Decker and Russell Hobbs brands.
We sell our products through a variety of trade channels, including retailers, wholesalers and distributors, hearing aid professionals, industrial distributorsconstruction companies and OEMs. Our sales generally are made through the use of individual purchase orders, consistent with industry practice. Retail sales of the consumer products we market have been increasingly consolidated on a worldwide basis into a small number of regional and national mass merchandisers. This trend towards consolidation is occurring on a worldwide basis. As a result of this consolidation, amerchandisers and e-commerce companies that generally have strong negotiating power with their suppliers. A significant percentage of our sales are attributable to a very limited group of retailer customers, including Wal-Mart,(in alphabetical order), Amazon, Argos, Autozone, Dollar General, Lowe’s, PetCo, PetSmart, Target, The Home Depot, Lowe’s, Carrefour, Target, PetSmart, Canadian Tire, PetCo and Gigante.Wal-Mart. Our sales to our largest customer, Wal-Mart, represented approximately 1518%% of our consolidated net sales for the fiscal year ended September 30, 2013.2016. No other customer accounted for more than 10% of our consolidated net sales in the fiscal year ended September 30, 20132016..
Factors influencing product sales include brand name recognition, perceived quality, price, performance, product packaging, design innovation, and total assetsconsumer confidence and preferences as well as information concerning our revenues and long-lived assets by geographic location for the last three fiscal years is set forth in Item 7. Management’s Discussion and Analysis of Financial Condition and Results of Operations and Note 11, "Segment Information", in Notes to Consolidated Financial Statements included in this Annual Report on Form 10-K.
· | Strong Diversified Global Brand Portfolio. We have a global portfolio of well-recognized consumer product brands. We believe that the strength of our brands positions us to extend our product lines and provide our retail customers with strong sell-through to consumers. |
· | Strong Global Retail Relationships. We have well-established business relationships with many of the top global retailers, distributors and wholesalers, which have assisted us in our efforts to expand our overall market penetration and promote sales. |
· | Expansive Distribution Network. We distribute our products in approximately 160 countries through a variety of trade channels, including retailers, wholesalers and distributors, hearing aid professionals, construction companies and OEMs. |
· | Innovative New Products, Packaging and Technologies. We have a long history of product and packaging innovations in each of our product categories and continually seek to introduce new products both as extensions of existing product lines and as new product categories. |
· | Experienced Management Team. Our management team has substantial consumer products experience. On average, each senior management team member has more than 20 years of experience at Spectrum Brands, VARTA, Remington, Russell Hobbs or other branded consumer product companies such as Newell Brands and Honeywell. |
Within our GBA segment, primary competitors for consumer batteries include Energizer Holdings, Inc. (Energizer); Berkshire Hathaway (Duracell); Matsushita (Panasonic) and private label brands of major geographic territories, Northretailers. Primary competitors for small appliances include Newell Brands (Oster, Sunbeam, Mr. Coffee, Crockpot, Rival, Breville), General Electric (GE), De’Longhi America Latin America(DeLonghi, Kenwood, Braun), SharkNinja f/k/a Euro-Pro (Shark, Ninja), NACCO Industries (Hamilton Beach, Proctor Silex), SEB S.A.(T-fal, Krups, Rowenta), Whirlpool Corporation (Kitchen Aid, Waring), Conair Corporate (Cuisinart), Koninklijke Philips N.V. (Philips), Glen Dimplex (Morphy Richards) and Europeprivate label brands for major retailers. Primary competitors in personal care include are Koninklijke Philips Electronics N.V. (Norelco), The Procter & Gamble Company (Braun), Conair Corporation, Wahl Clipper Corporation and Helen of Troy Limited.
Within our HHI segment, primary competitors in residential locksets include Allegion (Schlage) and private label import brands such as Defiant. Primary competitors for hardware include The Hillman Group, Hampton Hardware, Crown Bolt and private label competitors. Primary competitors for plumbing include Kohler, Masco, Fortune Brands (Moen), American Standard, Glacier Bay, AquaSource, and the restprivate label brands of the world (“Europe/ROW”). Within each major geographic territory, we have additional subdivisions designed to meetretailers.
Primary competitors in our customers’ needs.
Primary competitors in our H&G segment are The Scotts Miracle-Gro Company (Scotts, Ortho, Roundup, Miracle-Gro, Tomcat); Central Garden & Pet (AMDRO, Sevin) and Bayer A.G. (Bayer Advanced), S.C. Johnson & Son, Inc. (Raid, OFF!); and Henkel AG & Co. KGaA (Combat).
Primary competitors in our GAC segment include Valvoline, Prestone, Turtle Wax, Black Magic, Energizer, Newell Brands and private label brands. We manage our sales force in North Americaalso encounter competition from similar and alternative products, many of which are produced and marketed by distribution channel. We maintain separate sales groups to service (i) our retail salesmajor multinational or national companies, including Mothers, Meguiars, Lucas, and distribution channel, (ii) our hearing aid professionals channel and (iii) our industrial distributors and OEM sales and distribution channel. In addition, we utilize a network of independent brokers to service participants in selected distribution channels.
12
Seasonality
On a consolidated basis our financial results are approximately equally weighted across our quarters, however, sales force servingof certain product categories tend to be seasonal. Sales from our GBA segment, primarily from consumer battery and electric personal care product categories tend to increase during the December holiday season (the Company’s first fiscal quarter), while small appliances sales increase from July through December primarily due to the increased demand by customers in Europe/ROW is supplemented by an international networkthe late summer for “back-to-school” sales (the Company’s fourth fiscal quarter) and in December for the holiday season. Sales from our HHI segment primarily increase during the spring and summer construction period (the Company’s third and fourth fiscal quarters). Sales from our PET segment remain fairly consistent throughout the year with little variation. Sales from our H&G segment and GAC segment typically peak during the first six months of distributorsthe calendar year (the Company’s second and third fiscal quarters) due to promote the salecustomer seasonal purchasing patterns and timing of our products.promotional activities. Our sales operations throughout Europe/ROW are organized by geographic territoryquarter as a percentage of annual net sales during the years ended September 30, 2016, 2015 and the following sales channels: (i) food/retail, which includes mass merchandisers, discounters and drug and food stores; (ii) specialty trade, which includes clubs, consumer electronics stores, department stores, photography stores and wholesalers/distributors; and (iii) industrial, government, hearing aid professionals and OEMs.
|
|
|
|
|
|
|
|
|
|
|
| 2016 |
| 2015 |
| 2014 | |||
First Quarter |
|
| 24% |
|
| 23% |
|
| 25% |
Second Quarter |
|
| 24% |
|
| 23% |
|
| 23% |
Third Quarter |
|
| 27% |
|
| 26% |
|
| 25% |
Fourth Quarter |
|
| 25% |
|
| 28% |
|
| 27% |
Manufacturing, Raw Materials and Suppliers
The principal raw materials used in manufacturing our products—include zinc, electrolytic manganese dioxide used in our consumer batteries products; brass and steel—steel used in our HHI products; and refrigerant R-134a used in our GAC A/C recharge products; that are sourced either on a global or regional basis. The prices of these raw materials are susceptible to price fluctuations due to supply and demand trends, energy costs, transportation costs, government regulations and tariffs, changes in currency exchange rates, price controls, general economic conditions and other unforeseen circumstances. We have regularly engaged in forward purchase and hedging derivative transactions in an attempt to effectively manage thecertain raw material costs we expect to incur over the next 12 to 24 months.
Substantially all of our rechargeable batteries and chargers, portable lighting products, hair care and other personal care products and our electric shaving and grooming products and small appliances are manufactured by third party suppliers that are primarily located in the Asia/PacificAsia-Pacific region. We maintain ownership of most of the tooling and molds used by our suppliers.
We continually evaluate our manufacturing facilities’ capacity and related utilization. As a result of such analyses, we have closed a number of manufacturing facilities during the past five years. In general, we believe our existing facilities are adequate for our present and foreseeable needs.
Patents and Development
We use and development strategy is focused on new product development and performance enhancementsmaintain a number of our existing products. We plan to continue to use our strongpatents, trademarks, brand names established customer relationships and trade names that are, in the aggregate, important to our businesses. We seek trademark protection in the U.S. and in foreign countries. The Company’s most significant research and development efforts to introduce innovative products that offer enhanced value to consumers through new designs and improved functionality.registered trademarks are:
Segment | Trademarks | |
GBA | Rayovac®, VARTA®, Remington®, Black & Decker®, George Foreman®, Russell Hobbs®, Farberware®, Toastmaster®, Breadman®, Juiceman® | |
HHI | Kwikset®, Weiser®, Baldwin®, National Hardware®, Stanley®, Fanal®, Pfister®, Tell® | |
PET | Tetra®, 8-in-1®, Dingo®, Nature’s Miracle®, Wild Harvest®, Marineland®, Furminator®, Littermaid®, Birdola®, Healthy Hide®, Digest-eeze®, Iams®, Eukanuba® | |
H&G | Spectracide®, Cutter®, Hot Shot®, Real Kill®, Ultra Kill®, Black Flag®, Liquid Fence®, Rid-a-bug®, TAT®, Garden Safe®, Repel® | |
GAC | Armor All®, STP®, A/C PRO® |
We own or license from third parties a significant number of patents and patent applications throughout the world relating to products we sell and manufacturing equipment we use. We hold a license that expires in March 2022 for certain alkaline battery designs, technology and manufacturing equipment from Matsushita Electrical Industrial Co., Ltd. (“Matsushita”), to whom we pay a royalty.
patented SmartKey® technology, which enables customers to easily rekey their locks without hiring a locksmith.
13
We acquired the October 2002 sale by VARTA AG of substantially all of its consumer battery business to us and VARTA AG’s subsequent sale of its automotive battery business to Johnson Controls, Inc. (“Johnson Controls”), we acquired rights to the VARTAVARTA® trademark in the consumer battery category and Johnson Controls Inc. acquired rights to the trademark in the automotive battery category.category from VARTA AG. VARTA AG continues to have rights to use the trademark with travel guides and industrial batteries and VARTA Microbattery GmbH has the right to use the trade marktrademark with micro batteries. We are party to a Trademark and Domain Names Protection and Delimitation Agreement that governs ownership and usage rights and obligations of the parties relative to the VARTA ® trademark.
We license the Black & DeckerDecker® brand in North America, Latin America (excluding Brazil) and the Caribbean for four core categories of household appliances: beverage products, food preparation products, garment care products and cooking products. Russell Hobbs has licensed the Black & Decker brand since 1998 for use in marketing various household small appliances. In July 2011, Russell Hobbs andproducts through a trademark license agreement with The Black &and Decker Corporation (“BDC”) extended the trademark license agreement for a fourth time through December 2015.2018. Under the agreement, as extended, Russell HobbsSpectrum agreed to pay BDC royalties based on a percentage of sales, with minimum annual royalty payments of $15.0 million from calendar year 2011 through calendar year 2015.2018. The agreement also requires us to comply with maximum annual return rates for products.
We own the patented SmartKey technology,rights to use the Remington® trademark for electric shavers, shaver accessories, grooming products and personal care products; and Remington Arms Company, Inc. (“Remington Arms”) owns the rights to use the trademark for firearms, sporting goods and products for industrial use, including industrial hand tools. The terms of a 1986 agreement between Remington Products, LLC and Remington Arms provides for the shared rights to use the trademark on products which enables customers to easily rekey their locks without hiring a locksmith.
We license the Stanley® and Black & Decker® marks and logos in the HHI segment for limited shelf spacesuch products as residential locksets, builder’s hardware, padlocks, and consumer acceptance. Factors influencing product sales include brand name recognition, perceived quality, price, performance, product packaging, design innovation,door hardware through a transitional trademark license agreement with Stanley Black & Decker Corporation. Under the agreement and consumer confidence and preferences as well as creative marketing, promotion and distribution strategies.
Research and gardenDevelopment
Our research and development strategy is focused on new product category face competition from The Scotts Miracle-Gro Company (“Scotts Company”), which markets lawndevelopment and garden products under the Scotts, Ortho, Roundup, Miracle-Gro, and Tomcat brand names; Central Garden & Pet, which markets garden products under the AMDRO and Sevin brand names; and Bayer A.G., which markets home and garden products under the Bayer Advanced brand name.
Governmental Regulations and Environmental Matters
Due to the nature of our operations, our facilities are subject to a broad range of federal, state, local and foreign legal and regulatory provisions relating to the environment, including those regulating the discharge of materials into the environment, the handling and disposal of solid and hazardous substances and wastes and the remediation of contamination associated with the releases of hazardous substances at our facilities. We believe that compliance with the federal, state, local and foreign laws and regulations to which we are subject will not have a material effect upon our capital expenditures, financial condition, earnings or competitive position.
From time to time, we have been required to address the effect of historic activities on the environmental condition of our properties. We have not conducted invasive testing at all facilities to identify all potential environmental liability risks. Given the age of our facilities and the nature of our operations, it is possible that material liabilities may arise in the future in connection with our current or former facilities. If previously unknown contamination of property underlying or in the vicinity of our manufacturing facilities is discovered, we could incur material unforeseen expenses, which could have a material adverse effect on our financial condition, capital expenditures, earnings and competitive position. Although we are currently engaged in investigative or remedial projects at some of our facilities, we do not expect that such projects, taking into account established accruals, will cause us to incur expenditures that are material to our business, financial condition or results of operations; however, it is possible that our future liability could be material.
14
We have been, and in the future may be, subject to proceedings related to our disposal of industrial and hazardous material at off-site disposal locations or similar disposals made by other parties for which we are held responsible as a result of our relationships with such other parties. In the U.S., these proceedings are under the Federal Comprehensive Environmental Response, Compensation and Liability Act of 1980 (“CERCLA”) or similar state laws that hold persons who “arranged for” the disposal or treatment of such substances strictly liable for costs incurred in responding to the release or threatened release of hazardous substances from such sites, regardless of fault or the lawfulness of the original disposal. Liability under CERCLA is typically joint and several, meaning that a liable party may be responsible for all costs incurred in investigating and remediating contamination at a site. As a practical matter, liability at CERCLA sites is shared by all of the viable responsible parties. We occasionally are identified by federal or state governmental agencies as being a potentially responsible party for response actions contemplated at an off-site facility. At the existing sites where we have been notified of our status as a potentially responsible party, it is either premature to determine whether our potential liability, if any, will be material or we do not believe that our liability, if any, will be material. We may be named as a potentially responsible party under CERCLA or similar state laws for other sites not currently known to us, and the costs and liabilities associated with these sites may be material.
It is difficult to quantify with certainty the potential financial impact of actions regarding expenditures for environmental matters, particularly remediation, and future capital expenditures for environmental control equipment. Nevertheless, based upon the information currently available, we believe that our ultimate liability arising from such environmental matters, taking into accountconsidering established accruals of
Electronic and electrical products that we sell in Europe, particularly products sold under the RemingtonRemington® brand name, VARTAVARTA® battery chargers, certain portable lighting and all of our batteries, are subject to regulation in European Union (“EU”) markets under three key EU directives. The first directive is the Restriction of the Use of Hazardous Substances in Electrical and Electronic Equipment (“RoHS”) which took effect in EU member states beginning July 1, 2006. RoHS prohibits companies from selling products which contain certain specified hazardous materials in EU member states. We believe that compliance with RoHS willdoes not have a material effect on our capital expenditures, financial condition, earnings or competitive position. The second directive is entitled the Waste of Electrical and Electronic Equipment (“WEEE”). WEEE makes producers or importers of particular classes of electrical goods financially responsible for specified collection, recycling, treatment and disposal of past and future covered products. WEEE assigns levels of responsibility to companies doing business in EU markets based on their relative market share. WEEE calls on each EU member state to enact enabling legislation to implement the directive. To comply with WEEE requirements, we have partnered with other companies to create a comprehensive collection, treatment, disposal and recycling program. As EU member states pass enabling legislation we currently expect our compliance system to be sufficient to meet such requirements. Our current estimated costs associated with compliance with WEEE are not significant based on our current market share. However, we continue to evaluate the impact of the WEEE legislation as EU member states implement guidance and as our market share changes and, as a result, actual costs to our company could differ from our current estimates and may be material to our business, financial condition or results of operations. The third directive is the Directive on Batteries and Accumulators and Waste Batteries, which was adopted in September 2006 and went into effect in September 2008 (the “Battery Directive”). The Battery Directive bans heavy metals in batteries by establishing maximum quantities of those heavy metals in batteries and mandates waste management of batteries, including collection, recycling and disposal systems. The Battery Directive places the costs of such waste management systems on producers and importers of batteries. The Battery Directive calls on each EU member state to enact enabling legislation to implement the directive. We currently believe
Certain of our products and facilities in each of our business segments are regulated by the United States Environmental Protection Agency (the “EPA”) and the United States Food and Drug Administration (the “FDA”) or other federal consumer protection and product safety agencies and are subject to the regulations such agencies enforce, as well as by similar state, foreign and multinational agencies and regulations. For example, in the U.S., all products containing pesticides must be registered with the EPA and, in many cases, similar state and foreign agencies before they can be manufactured or sold. Our inability to obtain or the cancellation of any registration could have an adverse effect on our business, financial condition and results of operations. The severity of the effect would depend on which products were involved, whether another product could be substituted and whether our competitors were similarly affected. We attempt to anticipate regulatory developments and maintain registrations of, and access to, substitute chemicals and other ingredients. We may not always be able to avoid or minimize these risks.
The Food Quality Protection Act (“FQPA”) established a standard for food-use pesticides, which is that a reasonable certainty of no harm will result from the cumulative effect of pesticide exposures. Under the FQPA, the EPA is evaluating the cumulative effects from dietary and non-dietary exposures to pesticides. The pesticides in certain of our products continue to be evaluated by the EPA as part of this program. It is possible that the EPA or a third party active ingredient registrant may decide that a pesticide we use in our products will be limited or made unavailable to us. We cannot predict the outcome or the severity of the effect of the EPA’s continuing evaluations of active ingredients used in our products.
15
Certain of our products and packaging materials are subject to regulations administered by the FDA. Among other things, the FDA enforces statutory prohibitions against misbranded and adulterated products, establishes ingredients and manufacturing procedures for certain products, establishes standards of identity for certain products, determines the safety of products and establishes labeling standards and requirements. In addition, various states regulate these products by enforcing federal and state standards of identity for selected products, grading products, inspecting production facilities and imposing their own labeling requirements.
Certain A/C products containing R-134a are subject to regulation in the U.S. markets under the EPA’s Significant New Alternative Policy ("SNAP Program"), which implements international agreements restricting the use of certain refrigerants. The EPA has identified use of R-134a in new automotive air conditioning systems as an approved use up to the 2020 automotive model year. The EPA has not yet approved a replacement refrigerant under the SNAP program for sale in small cans for automotive use for automobiles produced beginning with the 2021 model year, and future rulemakings from the agency are anticipated. We hadcurrently believe that compliance with current and future SNAP regulations will not have a material effect on our capital expenditures, financial condition, earnings or competitive position. However, until such time as future regulations are issued and future alternate refrigerants are approved for sale in small cans, a full evaluation of these costs cannot be completed. We will continue to evaluate the impact of the SNAP Program as the EPA issues additional guidance.
Employees
We have approximately
16
ITEM 1A.www.spectrumbrands.com as soon as reasonably practicable after such reports are filed with, or furnished to, the United States Securities and Exchange Commission (the “SEC”). You may read and copy any materials we file with the SEC at the SEC’s Public Reference Room at 100 F Street, NE, Washington, DC 20549. You may obtain information on the operation of the Public Reference Room by calling the SEC at 1-800-SEC-0330. The SEC also maintains an Internet site that contains our reports, proxy statements and other information at www.sec.gov . In addition, copies of our (i) Corporate Governance Guidelines, (ii) charters for the Audit Committee, Compensation Committee and Nominating and Corporate Governance Committee, (iii) Code of Business Conduct and Ethics and (iv) Code of Ethics for the Principal Executive Officer and Senior Financial Officers are available at our Internet site at www.spectrumbrands.com under “Investor Relations—Corporate Governance.” Copies will also be provided to any stockholder upon written request to the Vice President, Investor Relations & Corporate Communications, Spectrum Brands, Inc. at 3001 Deming Way, Middleton, Wisconsin 53562 or via electronic mail at investorrelations@spectrumbrands.com, or by contacting the Vice President, Investor Relations & Corporate Communications by telephone at (608) 275-3340.
Any of the following factors could materially and adversely affect our business, financial condition and results of operations and theoperations. The risks described below are not the only risks that we may face. Additional risks and uncertainties not
Our substantial indebtedness may limit our financial and operating flexibility, and we may incur additional debt, which could increase the risks associated with our substantial indebtedness.
We have, and we expect to continue to have, a significant amount of indebtedness. As of
September 30,· | require us to dedicate a large portion of our cash flow to pay principal and interest on our indebtedness, which will reduce the availability of our cash flow to fund working capital, capital expenditures, research and development expenditures and other business activities; |
· | increase our vulnerability to general adverse economic and industry conditions; |
· | limit our flexibility in planning for, or reacting to, changes in our business and the industry in which we operate; |
· | restrict our ability to make strategic acquisitions, dispositions or to exploit business opportunities; |
· | place us at a competitive disadvantage compared to our competitors that have less debt; and |
· | limit our ability to borrow additional funds (even when necessary to maintain adequate liquidity) or dispose of assets. |
Under the Senior Secured Facilitiessenior secured facilities and the indentures governing the Notesnotes (together, the “Indentures”), we may incur additional indebtedness. If new debt is added to our existing debt levels, the related risks that we now face would increase.
Furthermore, a substantial portion of our debt bears interest at variable rates. If market interest rates increase, the interest rate on our variable rate debt will increase and will create higher debt service requirements, which would adversely affect our cash flow and could adversely impact our results of operations. While we may enter into agreements limiting our exposure to higher debt service requirements, any such agreements may not offer complete protection from this risk.
Restrictive covenants in the Senior Secured Facilitiessenior secured facilities and the Indentures may restrict our ability to pursue our business strategies.
The Senior Secured Facilitiessenior secured facilities and the Indentures each restrict, among other things, asset dispositions, mergers and acquisitions, dividends, stock repurchases and redemptions, other restricted payments, indebtedness and preferred stock, loans and investments, liens and affiliate transactions. The Senior Secured Facilitiessenior secured facilities and the Indentures also contain customary events of default. These covenants could, among other things, limit our ability to fund future working capital and capital expenditures, engage in future acquisitions or development activities, or otherwise realize the value of our assets and opportunities fully because offully. In addition, the needsenior secured facilities and the Indentures require us to dedicate a portion of cash flow from operations to payments on debt. In addition,debt and also contain borrowing restrictions based on, among other things, our fixed charge coverage ratio. Furthermore, the Senior Secured Facilities containcredit agreement governing our senior secured facilities contains a financial covenantscovenant relating to maximum leverageleverage. Such requirements and minimum interest coverage. Such covenants could limit the flexibility of our restricted entities in planning for, or reacting to, changes in the industries in which they operate. Our ability to comply with these covenants is subject to certain events outside of our control. If we are unable to comply with these covenants, the lenders under our Senior Secured Facilitiessenior secured facilities could terminate their commitments and the lenders under our Senior Secured Facilitiessenior secured facilities or the holders of the Notesnotes could accelerate repayment of our outstanding borrowings and, in either case, we may be unable to obtain adequate refinancing of outstanding borrowings on favorable terms or at all. If we are unable to repay outstanding borrowings when due, the lenders under the Senior Secured Facilitiessenior secured facilities will also have the right to proceed against the collateral granted to them to secure the indebtedness owed to them. If our obligations under the Senior Secured Facilitiessenior secured facilities are accelerated, we cannot assure you that our assets would be sufficient to repay in full such indebtedness.
17
The sale or other disposition by HarbingerHRG Group, Inc. (“HRG”), the holder of a majority of the outstanding shares of our common stock, to non-affiliates of a sufficient amount of the common stock of SB Holdingsthe Company would constitute a change of control under the agreements governing Spectrum Brands’the Company’s debt.
Harbinger Group Inc. (“HRG”)HRG owns a majority of the outstanding shares of the common stock of SB Holdings.the Company. The sale or other disposition by HRG to non-affiliates of a sufficient amount of the common stock of SB Holdingsthe Company could constitute a change of control under certain of the agreements governing Spectrum Brands'the Company's debt, including any foreclosure on or sale of SB Holdings'the Company's common stock pledged as collateral by HRG pursuant to the indenture governing HRG's 7.875% Senior Secured Notes due 2019. Under the Term Loan and the ABL Revolving Credit Facility,senior secured facilities, a change of control is an event of default and, if a change of control were to occur, Spectrum Brandsthe Company would be required to get an amendment toamend these agreementsfacilities to avoid a default. If Spectrum Brandsthe Company was unable to get such an amendment,amend these facilities, the lenders could accelerate the maturity of each of the Spectrum Brands Term Loan and the ABL Revolving Credit Facility.any outstanding debt under these facilities. In addition, under the indentures governing the Notes,Indentures, upon a change of control of SB Holdings, Spectrum Brandsthe Company, the Company is required to offer to repurchase such notes from the holders at a price equal to 101% of the principal amount of the notes plus accrued interest or obtain a waiver of default from the holders of such notes. If Spectrum Brands wasthe Company were unable to make the change of control offer, or to obtain a waiver of default, it would be an event of default under the indentures that could allow holders of such notes to accelerate the maturity of the notes. See “Risks Related to SB Holdings' Common Stock-The Harbinger Partiesthe risk factor entitled “HRG and HRGits significant stockholders exercise significant influence over us and their interests in our business may be different from the interests of our stockholdersstockholders”” in this Form 10-K.
We face risks related to the current economic environment.
The current economic environment and related turmoil in the global financial system hasin recent years had and may continue to have an impact on our business and financial condition.
Global economic conditions have significantly impacted economic markets within certain sectors, with financial services and retail businesses being particularly impacted. Our ability to generate revenue depends significantly on discretionary consumer spending. It is difficult to predict new general economic conditions that could impact consumer and customer demand for our products or our ability to manage normal commercial relationships with our customers, suppliers and creditors. The recent continuation of aA number of negative economic factors, including constraints on the supply of credit to households, uncertainty and weakness in the labor market and general consumer fears of a continuingnew economic downturn could have a negative impact on discretionary consumer spending. If the economy continues to deterioratedeteriorates or fails to further improve, our business could be negatively impacted, including as a result of reduced demand for our products or supplier or customer disruptions. Any weakness in discretionary consumer spending could have a material adverse effect on our revenues, results of operations and financial condition. In addition, our ability to access the capital markets may be restricted at a time when it could be necessary or beneficial to do so, which could have an impact on our flexibility to react to changing economic and business conditions.
In the last few years, concern over continuing high unemployment, stagnant economic performance and government debt levels in many European Union countries has caused significant fluctuations of the Euro relative to other currencies, such as the U.S. Dollar. Criticism of excessive national debt among certain European Union countries has led to credit downgrades of the sovereign debt of several countries in the region, and uncertainty about the future status of the Euro. DestabilizationContinued weakness of the European economy could lead to a decrease in consumer confidence, which could cause reductions in discretionary spending and demand for our products. Furthermore, sovereign debt issues could also lead to further significant, and potentially longer-term, economic issues such as reduced economic growth and devaluation of the Euro against the U.S. Dollar, any of which could adversely affect our business, financial conditions and operating results.
We depend on key personnel and may not be able to retain those employees or recruit additional qualified personnel.
We are highly dependent on the continuing efforts of our senior management team and other key personnel. Our business, financial condition and results of operations could be materially adversely affected if we lose any of these persons and are unable to attract and retain qualified replacements.
18
We participate in very competitive markets and we may not be able to compete successfully, causing us to lose market share and sales.
We compete with our competitors for consumer acceptance and limited shelf space based upon brand name recognition, perceived product quality, price, performance, product features and enhancements, product packaging and design innovation, as well as creative marketing, promotion and distribution strategies, and new product introductions. Our ability to compete in these consumer product markets may be adversely affected by a number of factors, including, but not limited to, the following:
· | We compete against many well-established companies that may have substantially greater financial and other resources, including personnel and research and development, and greater overall market share than us. |
· | In some key product lines, our competitors may have lower production costs and higher profit margins than us, which may enable them to compete more aggressively in offering retail discounts, rebates and other promotional incentives. |
· | Technological advancements, product improvements or effective advertising campaigns by competitors may weaken consumer demand for our products. |
· | Consumer purchasing behavior may shift to distribution channels, including to online retailers, where we and our customers do not have a strong presence. |
· | Consumer preferences may change to lower margin products or products other than those we market. |
· | We may not be successful in the introduction, marketing and manufacture of any new products or product innovations or be able to develop and introduce, in a timely manner, innovations to our existing products that satisfy customer needs or achieve market acceptance. |
In the consumer battery product category, our primary competitors are Duracell (a brand of Berkshire Hathaway), Energizer and Panasonic (a brand of Matsushita). In the personal care product category, our primary competitors are Braun (a licensed brand of Procter & Gamble), Norelco (a brand of Philips), and Conair, Wahl, and Helen of Troy. In our PET business, our primary competitors are Central Garden & Pet, Mars and Hartz. In the H&G business, our principal national competitors are Scotts, Central Garden & Pet and S.C. Johnson. Our principal national competitors within our small appliances product category include Newell Brands, DeLonghi America, SharkNinja (f/k/a Euro-Pro Operating LLC), NACCO Industries, Inc. and SEB S.A. In the HHI business, our principal competitors are Fortune Brands, Allegion, Masco, Kohler and American Standard. In the GAC business, our primary competitors are Valvoline, Prestone, Turtle Wax, Black Magic, Energizer and store brands.
In addition, in a number of our product lines, we compete with our retail customers, who use their own private label brands, and with distributors and foreign manufacturers of unbranded products. Significant new competitors or increased competition from existing competitors may have lower production costsadversely affect our business, financial condition and higher profit margins than us, which may enable them to compete more aggressively in offering retail discounts, rebates and other promotional incentives.
Some competitors may be willing to reduce prices and accept lower profit margins to compete with us. As a result of this competition, we could lose market share and sales, or be forced to reduce our prices to meet competition. If our product offerings are unable to compete successfully, our sales, results of operations and financial condition could be materially and adversely affected.
We face risks relating to the United Kingdom’s 2016 referendum, which called for its exit from the European Union.
The announcement of products. The acquisition of a business or the rights to market specific products or use specific product names may involve a financial commitment by us, eitherreferendum regarding the United Kingdom’s (“UK”) membership in the formEuropean Union (“EU”) on June 23, 2016 (referred to as “Brexit”), advising for the exit of the UK from the EU, has adversely impacted global markets and foreign currencies. In particular, the value of the Pound Sterling has sharply declined as compared to the US Dollar and other currencies. This volatility in foreign currencies is expected to continue as the UK negotiates and executes its exit from the EU, but there is uncertainty over what time period this will occur. A significantly weaker Pound Sterling compared to the US Dollar could have a significant negative effect on the Company’s business, financial condition and results of operations. The decrease in value to the Pound Sterling and impacts across global markets and foreign currencies may influence trends in consumer confidence and discretionary spending habits, but given the lack of precedent and uncertainty, it is unclear how the implications will affect us.
The UK is expected to remain a member of the EU for some period of time and there is generally not expected to be any immediate change in either EU or UK law as a consequence of the “leave” vote. However, we can provide no assurances that such consequences will not occur. Negotiations will commence to determine the future terms of the UK relationship with the EU, including, among other things, the terms of trade between the UK and the EU. The effects of Brexit will depend on many factors, including any agreements that the UK makes to retain access to EU markets either during a transitional period or more permanently. Brexit could lead to legal uncertainty and potentially divergent national laws and regulations as the UK determines which EU laws to replace or replicate. Any of these effects of Brexit and others we cannot anticipate, could materially and adversely affect our business, business opportunities, results of operations, financial condition, liquidity and cash or equity consideration. In the caseflows.
19
Sales of certain of our products are seasonal and may cause our operating results and working capital requirements to fluctuate.
On a consolidated basis our financial results are approximately equally weighted betweenacross our quarters, however, sales of certain product categories tend to be seasonal. Sales in thefrom our GBA segment, primarily from consumer battery electric shaving and grooming and electric personal care product categories particularly in North America, tend to be concentrated inincrease during the December holiday season (Spectrum’s(the Company’s first fiscal quarter). Demand for hardware and home improvement products increases during the spring and summer construction period (Spectrum's third and fourth fiscal quarters) and demand for pet supplies products remains fairly constant throughout the year. Demand for home and garden control products typically peaks during the first six months of the calendar year (Spectrum’s second and third fiscal quarters). Small Appliances peaks, while small appliances sales increase from July through December primarily due to the increased demand by customers in the late summer for “back-to-school” sales (the Company’s fourth fiscal quarter) and in the fallDecember for the holiday season. Sales from our HHI segment primarily increase during the spring and summer construction period (the Company’s third and fourth fiscal quarters). Sales from our PET segment remain fairly consistent throughout the year with little variation. Sales from our H&G segment and GAC segment typically peak during the first six months of the calendar year (the Company’s second and third fiscal quarters) due to customer seasonal purchasing patterns and timing of promotional activities. As a result of this seasonality, our inventory and working capital needs fluctuate significantly throughout the year. In addition, orders from retailers are often made late in the period preceding the applicable peak season, making forecasting of production schedules and inventory purchases difficult. If we are unable to accurately forecast and prepare for customer orders or our working capital needs, or there is a general downturn in business or economic conditions during these periods, our business, financial condition and results of operations could be materially and adversely affected.
Adverse weather conditions during our peak selling seasonseasons for our home and garden control and auto care products could have a material adverse effect on our Homehome and Garden Business.
Weather conditions in the U.S. have a significant impact on the timing and volume of sales of certain of our lawn and garden and household insecticide and repellent products. For example, periods of dry, hot weather can decrease insecticide sales, while periods of cold and wet weather can slow sales of herbicides. Adverse weather conditions during the first six months of the calendar year (the Company’s second and third fiscal quarters), when demand for home and garden control products typically peaks, could have a material adverse effect on our home and garden business and our financial results during such period. Weather can also influence customer behavior for our auto care products, especially with appearance and A/C recharge products, which sell best during warm, dry weather. There could be a material adverse effect on the auto care segment if the weather is cold or wet, during the spring and summer seasons when demand typically peaks.
We are subject to significant international business risks that could hurt our business and cause our results of operations to fluctuate.
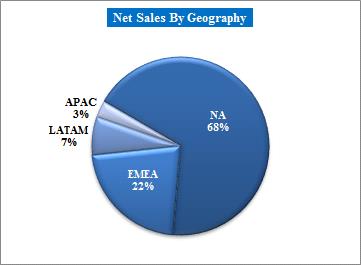
Approximately 36% of our net sales for the fiscal year ended September 30, 2016 were to customers outside of the U.S. Our pursuit of international growth opportunities may require significant investments for an extended period before returns on these investments, if any, are realized. Our international operations are subject to risks including, among others:
· | currency fluctuations, including, without limitation, fluctuations in the foreign exchange rate of the Euro, British Pound, Brazilian Real, Canadian Dollar, Australian Dollar, Japanese Yen and the Mexican Peso; |
· | changes in the economic conditions or consumer preferences or demand for our products in these markets; |
· | the risk that because our brand names may not be locally recognized, we must spend significant amounts of time and money to build brand recognition without certainty that we will be successful; |
· | labor unrest; |
· | political and economic instability, as a result of war, terrorist attacks, pandemics, natural disasters or otherwise; |
· | lack of developed infrastructure; |
· | longer payment cycles and greater difficulty in collecting accounts; |
· | restrictions on transfers of funds; |
· | import and export duties and quotas, as well as general transportation costs; |
· | changes in domestic and international customs and tariffs; |
· | changes in foreign labor laws and regulations affecting our ability to hire and retain employees; |
· | inadequate protection of intellectual property in foreign countries; |
· | unexpected changes in regulatory environments; |
· | difficulty in complying with foreign law; and |
· | adverse tax consequences. |
The foregoing factors may have a material adverse effect on our ability to increase or maintain our supply of products, financial condition or results of operations.
20
Our products utilize certain key raw materials; any significant increase in the price of, or change in supply and demand for, these raw materials could have a material and adverse effect on our business, financial condition and profits.
The principal raw materials used to produce our products—including zinc powder, brass, electrolytic manganese dioxide powder, petroleum-based plastic materials, steel, aluminum, copper and corrugated materials (for packaging)—are sourced either on a global or regional basis by us or our suppliers, and the prices of those raw materials are susceptible to price fluctuations due to supply and demand trends, energy costs, transportation costs, government regulations, duties and tariffs, changes in currency exchange rates, price controls, general economic conditions and other unforeseen circumstances. In particular, during 2011,the years 2012 and 2013, we experienced extraordinary price increases for raw materials, particularly as a result of strong demand from China. Although we may increase the prices of certain of our goods to our customers, we may not be able to pass all of these cost increases on to our customers. As a result, our margins may be adversely impacted by such cost increases. We cannot provide any assurance that our sources of supply will not be interrupted due to changes in worldwide supply of or demand for raw materials or other events that interrupt material flow, which may have an adverse effect on our profitability and results of operations.
We regularly engage in forward purchase and hedging derivative transactions in an attempt to effectively manage and stabilize some of the raw material costs we expect to incur over the next 12 to 24 months. However, our hedging positions may not be effective, or may not anticipate beneficial trends, in a particular raw material market or may, as a result of changes in our business, no longer be useful for us. In addition, for certain of the principal raw materials we use to produce our products, such as electrolytic manganese dioxide powder, there are no available effective hedging markets. If these efforts are not effective or expose us to above average costs for an extended period of time, and we are unable to pass our raw materials costs on to our customers, our future profitability may be materially and adversely affected. Furthermore, with respect to transportation costs, certain modes of delivery are subject to fuel surcharges which are determined based upon the current cost of diesel fuel in relation to pre-established agreed upon costs. We may be unable to pass these fuel surcharges on to our customers, which may have an adverse effect on our profitability and results of operations.
In addition, we have exclusivity arrangements and minimum purchase requirements with certain of our suppliers for the Homehome and Garden Business,garden business, which increase our dependence upon and exposure to those suppliers. Some of those agreements include caps on the price we pay for our supplies and in certain instances, these caps have allowed us to purchase materials at below market prices. When we attempt to renew those contracts, the other parties to the contracts may not be willing to include or may limit the effect of those caps and could even attempt to impose above market prices in an effort to make up for any below market prices paid by us prior to the renewal of the agreement. Any failure to timely obtain suitable supplies at competitive prices could materially adversely affect our business, financial condition and results of operations.
We may not be able to fully utilize our U.S. net operating loss carryforwards.
As of
September 30,As a consequence of earlier business combinations and mostissuances of common stock, the U.S. deferred tax asset, including Spectrum Brands’ net operating loss carryforwards. In addition, Spectrum Brands hasCompany and its subsidiaries have had various changes of ownership, as defined under Section 382 of the Internal Revenue Code (the “IRC”) of 1986, as amended, (the “IRC”), that continue to subject a significant amount of Spectrum Brands’the Company’s U.S. net operating lossesNOLs and other tax attributes to certain limitations.
As of September 30, 2016, we estimate that approximately $460 million of the mergertotal U.S. federal NOLs with a federal tax benefit of Salton, Inc.$161 million and Applica Incorporated in December 2007 (which created Russell Hobbs), as well as earlier business combinations and issuances of common stock consummated by both companies, use of the tax benefits of Russell Hobbs’ U.S. loss carryforwards is also subject$17 million related to limitations imposed by Section 382 of the IRC. We expect that a significant portion of these carryforwards will not be available to offset future taxable income, if any. In addition, use of Russell Hobbs’ net operating loss and tax credit carryforwards is dependent upon both Russell Hobbs and us achieving profitable results in the future. The Russell Hobbs’ U.S. net operating loss carryforwards were subject to a full valuation allowance at
If we are unable to fully utilize our net operating losses, other than those restricted under Section 382 of the IRC, as discussed above,NOLs to offset taxable income generated in the future, our results of operationsfuture cash taxes could be materially and negatively impacted.
21
Consolidation of retailers and our dependence on a small number of key customers for a significant percentage of our sales may negatively affect our business, financial condition and results of operations.
As a result of consolidation of retailers and consumer trends toward national mass merchandisers, a significant percentage of our sales are attributable to a very limited group of customers. Our largest customer, Wal Mart, accounted for approximately
Although we have long-established relationships with many of our customers, we do not have long-term agreements with them and purchases are generally made through the use of individual purchase orders. Any significant reduction in purchases, failure to obtain anticipated orders or delays or cancellations of orders by any of these major customers, or significant pressure to reduce prices from any of these major customers, could have a material adverse effect on our business, financial condition and results of operations. Additionally, a significant deterioration in the financial condition of the retail industry in general, the bankruptcy of any of our customers or any of our customers ceasing operations could have a material adverse effect on our sales and profitability.
As a result of retailers maintaining tighter inventory control, we face risks related to meeting demand and storing inventory.
As a result of the desire of retailers to more closely manage inventory levels, there is a growing trend among them to purchase products on a “just-in-time” basis. Due to a number of factors, including (i) manufacturing lead-times, (ii) seasonal purchasing patterns and (iii) the potential for material price increases, we may be required to shorten our lead-time for production and more closely anticipate our retailers’ and customers’ demands, which could in the future require us to carry additional inventories and increase our working capital and related financing requirements. This may increase the cost of warehousing inventory or result in excess inventory becoming difficult to manage, unusable or obsolete. In addition, if our retailers significantly change their inventory management strategies, we may encounter difficulties in filling customer orders or in liquidating excess inventories, or may find that customers are cancelling orders or returning products, which may have a material adverse effect on our business.
Furthermore, we primarily sell branded products and a move by one or more of our large customers to sell significant quantities of private label products, which we do not produce on their behalf and which directly compete with our products, could have a material adverse effect on our business, financial condition and results of operations.
As a result of our international operations, we face a number of risks related to exchange rates and foreign currencies.
Our international sales and certain of our expenses are transacted in foreign currencies. During the fiscal year ended
September 30,We source many products from China and other Asian countries. To the extent the Chinese Renminbi (“RMB”) or other currencies appreciate with respect to the U.S. dollar, we may experience fluctuations in our results of operations. Since 2005, the RMB has no longer been pegged to the U.S. dollar at a constant exchange rate and instead fluctuates versus a basket of currencies. Although the People’s Bank of China regularly interveneshas historically intervened in the foreign exchange market to prevent significant short-term fluctuations in the exchange rate, the RMB may appreciate or depreciate within a flexible peg range against the U.S. dollar in the medium to long term. Moreover, it is possible that in the future Chinese authorities may lift restrictions on fluctuations in the RMB exchange rate and lessen intervention in the foreign exchange market.
While we may enter into hedging transactions in the future, the availability and effectiveness of these transactions may be limited, and we may not be able to successfully hedge our exposure to currency fluctuations. Further, we may not be successful in implementing customer pricing or other actions in an effort to mitigate the impact of currency fluctuations and, thus, our results of operations may be adversely impacted.
22
Our international operations may expose us to risks related to compliance with the laws and regulations of foreign countries.
We are subject to three EU Directives that may have a material impact on our business: Restriction of the Use of Hazardous Substances in Electrical and Electronic Equipment;Equipment (“RUHSEEE”), Waste of Electrical and Electronic Equipment (“WEEE”) and the Directive on Batteries and Accumulators and Waste Batteries (“DBAWB”), discussed below. Restriction of the Use of Hazardous Substances in Electrical and Electronic EquipmentRUHSEEE requires us to eliminate specified hazardous materials from products we sell in EU member states. Waste of Electrical and Electronic EquipmentWEEE requires us to collect and treat, dispose of or recycle certain products we manufacture or import into the EU at our own expense. The EU Directive on Batteries and Accumulators and Waste BatteriesDBAWB bans heavy metals in batteries by establishing maximum quantities of heavy metals in batteries and mandates waste management of these batteries, including collection, recycling and disposal systems, with the costs imposed upon producers and importers such as us. The costs associated with maintaining compliance or failing to comply with the EU Directives may harm our business. For example:
· | Although contracts with our suppliers address related compliance issues, we may be unable to procure appropriate RUHSEEE-compliant material in sufficient quantity and quality and/or be able to incorporate it into our product procurement processes without compromising quality and/or harming our cost structure. |
· | We may face excess and obsolete inventory risk related to non-compliant inventory that we may hold for which there is reduced demand, and we may need to write down the carrying value of such inventories. |
· | We may be unable to sell certain existing inventories of our batteries in Europe and other countries that have adopted similar regulations. |
Many of the developing countries in which we operate do not have significant governmental regulation relating to environmental safety, occupational safety, employment practices or other business matters routinely regulated in the U.S. and EU or may not rigorously enforce such regulation. As these countries and their economies develop, it is possible that new regulations or increased enforcement of existing regulations may increase the expense of doing business in these countries. In addition, social legislation in many countries in which we operate may result in significantly higher expenses associated with labor costs, terminating employees or distributors and closing manufacturing facilities. Increases in our costs as a result of increased regulation, legislation or enforcement could materially and adversely affect our business, results of operations and financial condition.
We may not be able to adequately establish and protect our intellectual property rights, and the infringement or loss of our intellectual property rights could harm our business.
To establish and protect our intellectual property rights, we rely upon a combination of national, foreign and multi-national patent, trademark and trade secret laws, together with licenses, confidentiality agreements and other contractual arrangements. The measures that we take to protect our intellectual property rights may prove inadequate to prevent third parties from infringing or misappropriating our intellectual property. We may need to resort to litigation to enforce or defend our intellectual property rights. If a competitor or collaborator files a patent application claiming technology also claimed by us, or a trademark application claiming a trademark, service mark or trade dress also used by us, in order to protect our rights, we may have to participate in expensive and time consuming opposition or interference proceedings before the U.S. Patent and Trademark Office or a similar foreign agency. Similarly, our intellectual property rights may be challenged by third parties or invalidated through administrative process or litigation. The costs associated with protecting intellectual property rights, including litigation costs, may be material. Furthermore, even if our intellectual property rights are not directly challenged, disputes among third parties could lead to the weakening or invalidation of our intellectual property rights, or our competitors may independently develop technologies that are substantially equivalent or superior to our technology. Obtaining, protecting and defending intellectual property rights can be time consuming and expensive, and may require us to incur substantial costs, including the diversion of the time and resources of management and technical personnel.
Moreover, the laws of certain foreign countries in which we operate or may operate in the future do not protect, and the governments of certain foreign countries do not enforce, intellectual property rights to the same extent as do the laws and government of the U.S., which may negate our competitive or technological advantages in such markets. Also, some of the technology underlying our products is the subject of nonexclusive licenses from third parties. As a result, this technology could be made available to our competitors at any time. If we are unable to establish and then adequately protect our intellectual property rights, our business, financial condition and results of operations could be materially and adversely affected.
We license various trademarks, trade names and patents from third parties for certain of our products. These licenses generally place marketing obligations on us and require us to pay fees and royalties based on net sales or profits. Typically, these licenses may be terminated if we fail to satisfy certain minimum sales obligations or if we breach the terms of the license. The termination of these licensing arrangements could adversely affect our business, financial condition and results of operations.
23
In our Global Batteries & AppliancesGBA segment, we license the use of the Black & Deckerand Decker® brand for marketing in certain small household appliances in North America, South America (excluding Brazil) and the Caribbean. In July 2011,2014, The Black &and Decker Corporation ("BDC"(“BDC”) extended the license agreement through December 2015.2018. The failure to renew the license agreement with BDC or to enter into a new agreement on acceptable terms for the period following December 2018 could have a material adverse effect on our financial condition, liquidity and results of operations.
Claims by third parties that we are infringing their intellectual property and other litigation could adversely affect our business.
From time to time in the past we have been subject to claims that we are infringing the intellectual property of others. We currently are the subject of such claims and it is possible that third parties will assert infringement claims against us in the future. An adverse finding against us in these or similar trademark or other intellectual property litigations may have a material adverse effect on our business, financial condition and results of operations. Any such claims, with or without merit, could be time consuming and expensive, and may require us to incur substantial costs, including the diversion of the resources of management and technical personnel, cause product delays or require us to enter into licensing or other agreements in order to secure continued access to necessary or desirable intellectual property. If we are deemed to be infringing a third party’s intellectual property and are unable to continue using that intellectual property as we had been, our business and results of operations could be harmed if we are unable to successfully develop non-infringing alternative intellectual property on a timely basis or license non-infringing alternatives or substitutes, if any exist, on commercially reasonable terms. In addition, an
Our dependence on a few suppliers and one of our U.S. facilities for certain of our products makes us vulnerable to a disruption in the supply of our products.
Although we have long-standing relationships with many of our suppliers, we generally do not have long-term contracts with them. An adverse change in any of the following could have a material adverse effect on our business, financial condition and results of operations:
· | our ability to identify and develop relationships with qualified suppliers; |
· | the terms and conditions upon which we purchase products from our suppliers, including applicable exchange rates, transport and other costs, our suppliers’ willingness to extend credit to us to finance our inventory purchases and other factors beyond our control; |
· | the financial condition of our suppliers; |
· | political and economic instability in the countries in which our suppliers are located, as a result of war, terrorist attacks, pandemics, natural disasters or otherwise; |
· | our ability to import outsourced products; |
· | our suppliers’ noncompliance with applicable laws, trade restrictions and tariffs; or |
· | our suppliers’ ability to manufacture and deliver outsourced products according to our standards of quality on a timely and efficient basis. |
If our relationship with one of our key suppliers is adversely affected, we may not be able to quickly or effectively replace such supplier and may not be able to retrieve tooling, molds or other specialized production equipment or processes used by such supplier in the manufacture of our products.
We manufacture the majority of our foil cutting systems for our shaving product lines, using specially designed machines and proprietary cutting technology, at our Portage, Wisconsin facility. In addition, we also manufacture the majority of our residential door locks at our Subic Bay, Philippines facility. Our home and garden products are mainly manufactured from our St. Louis, Missouri, facility. Damage to this facility,these facilities, or prolonged interruption in the operations of this facilitythese facilities whether for repairs, as a result of labor difficulties or for other reasons, could have a material adverse effect on our ability to manufacture and sell our foil shaving, residential door locks and home and garden products which could in turn harm our business, financial condition and results of operations.
24
We face risks related to our sales of products obtained from third-party suppliers.
We sell a significant number of products that are manufactured by third party suppliers over which we have no direct control. While we have implemented processes and procedures to try to ensure that the suppliers we use are complying with all applicable regulations, there can be no assurances that such suppliers in all instances will comply with such processes and procedures or otherwise with applicable regulations. Noncompliance could result in our marketing and distribution of contaminated, defective or dangerous products which could subject us to liabilities and could result in the imposition by governmental authorities of procedures or penalties that could restrict or eliminate our ability to purchase products from non-compliant suppliers.products. Any or all of these effects could adversely affect our business, financial condition and results of operations.
In addition, the Dodd-Frank Wall Street Reform and Consumer Protection Act includes provisions regarding certain minerals and metals, known as conflict minerals, mined from the Democratic Republic of Congo and adjoining countries. These provisions require companies to undertake due diligence procedures and report on the use of conflict minerals in its products, including products manufactured by third parties. Compliance with these provisions will cause us to incur costs to certify that our supply chain is conflict free and we may face difficulties if our suppliers are unwilling or unable to verify the source of their materials. Our ability to source these minerals and metals may also be adversely impacted. In addition, our customers may require that we provide them with a certification and our inability to do so may disqualify us as a supplier.
Class action and derivative action lawsuits and other investigations, regardless of their merits, could have an adverse effect on our business, financial condition and results of operations.
We and certain of our officers and directors have been named in the past, and, may be named in the future, as defendants of class action and derivative action lawsuits. In the past, we have also received requests for information from government authorities. Regardless of their subject matter or merits, class action lawsuits and other government investigations may result in significant cost to us, which may not be covered by insurance, may divert the attention of management or may otherwise have an adverse effect on our business, financial condition and results of operations.
We may be exposed to significant product liability claims which our insurance may not cover and which could harm our reputation.
In the ordinary course of our business, we may be named as a defendant in lawsuits involving product liability claims. In any such proceeding, plaintiffs may seek to recover large and sometimes unspecified amounts of damages, and the matters may remain unresolved for several years. Any such matters could have a material adverse effect on our business, results of operations and financial condition if we are unable to successfully defend against or settle these matters or if our insurance coverage is insufficient to satisfy any judgments against us or settlements relating to these matters. Although we have product liability insurance coverage and an excess umbrella policy, our insurance policies may not provide coverage for certain, or any,
25
We may incur material capital and other costs due to environmental liabilities.
We are subject to a broad range of federal, state, local, foreign and multi-national laws and regulations relating to the environment. These include laws and regulations that govern:
· | discharges to the air, water and land; |
· | the handling and disposal of solid and hazardous substances and wastes; and |
· | remediation of contamination associated with release of hazardous substances at our facilities and at off-site disposal locations. |
Risk of environmental liability is inherent in our business. As a result, material environmental costs may arise in the future. In particular, we may incur capital and other costs to comply with increasingly stringent environmental laws and enforcement policies, such as the EU Directives: Restriction of the Use of Hazardous Substances in Electrical and Electronic Equipment, Waste of Electrical and Electronic Equipment and the Directive on Batteries and Accumulators and Waste Batteries, discussed above. Our international operations may expose us to risks related to compliance with the laws and regulations of foreign countries
Moreover, there are adopted and proposed international accords and treaties, as well as federal, state and local laws and regulations, that would attempt to control or limit the causes of climate change, including the effect of greenhouse gas emissions on the environment. In the event that the U.S. government or foreign governments enact new climate change laws or regulations or make changes to existing laws or regulations, compliance with applicable laws or regulations may result in increased manufacturing costs for our products, such as by requiring investment in new pollution control equipment or changing the ways in which certain of our products are made. We may incur some of these costs directly and others may be passed on to us from our third-party suppliers. Although we believe that we are substantially in compliance with applicable environmental laws and regulations at our facilities, we may not always be in compliance with such laws and regulations or any new laws and regulations in the future, which could have a material adverse effect on our business, financial condition and results of operations.
From time to time, we have been required to address the effect of historic activities on the environmental condition of our properties or former properties. We have not conducted invasive testing at all of our facilities to identify all potential environmental liability risks. Given the age of our facilities and the nature of our operations, material liabilities may arise in the future in connection with our current or former facilities. If previously unknown contamination of property underlying or in the vicinity of our manufacturing facilities is discovered, we could be required to incur material unforeseen expenses. If this occurs, it may have a material adverse effect on our business, financial condition and results of operations. We are currently engaged in investigative or remedial projects at a few of our facilities and any liabilities arising from such investigative or remedial projects at such facilities may have a material effect on our business, financial condition and results of operations.
In addition, in connection with certain business acquisitions, we have assumed, and in connection with future acquisitions may assume in the future, certain potential environmental liabilities. To the extent we have not identified such environmental liabilities or to the extent the indemnifications obtained from our counterparties are insufficient to cover such environmental liabilities, these environmental liabilities could have a material adverse effect on our business.
We are also subject to proceedings related to our disposal of industrial and hazardous material at off-site disposal locations or similar disposals made by other parties for which we are responsible as a result of our relationship with such other parties. These proceedings are under the Comprehensive Environmental Response, Compensation, and Liability Act ("CERCLA"(“CERCLA”) or similar state or foreign jurisdiction laws that hold persons who “arranged for” the disposal or treatment of such substances strictly liable for costs incurred in responding to the release or threatened release of hazardous substances from such sites, regardless of fault or the lawfulness of the original disposal. Liability under CERCLA is typically joint and several, meaning that a liable party may be responsible for all of the costs incurred in investigating and remediating contamination at a site. We occasionally are identified by federal or state governmental agencies as being a potentially responsible party for response actions contemplated at an off-site facility. At the existing sites where we have been notified of our status as a potentially responsible party, it is either premature to determine if our potential liability, if any, will be material or we do not believe that our liability, if any, will be material. We may be named as a potentially responsible party under CERCLA or similar state or foreign jurisdiction laws in the future for other sites not currently known to us, and the costs and liabilities associated with these sites may have a material adverse effect on our business, financial condition and results of operations.
26
Compliance with various public health, consumer protection and other regulations applicable to our products and facilities could increase our cost of doing business and expose us to additional requirements with which we may be unable to comply.
Certain of our products sold through, and facilities operated under, each of our business segments are regulated by the Environmental Protection Agency ("EPA"(“EPA”), the Food and Drug Administration ("FDA"(“FDA”) or other federal consumer protection and product safety agencies and are subject to the regulations such agencies enforce, as well as by similar state, foreign and multinational agencies and regulations. For example, in the U.S., all products containing pesticides must be registered with the EPA and, in many cases, similar state and foreign agencies before they can be manufactured or sold. Our inability to obtain, or the cancellation of, any registration could have an adverse effect on our business, financial condition and results of operations. The severity of the effect would depend on which products were involved, whether another product could be substituted and whether our competitors were similarly affected. We attempt to anticipate regulatory developments and maintain registrations of, and access to, substitute chemicals and other ingredients, but we may not always be able to avoid or minimize these risks.
As a distributor of consumer products in the U.S., certain of our products are also subject to the Consumer Product Safety Act, which empowers the U.S. Consumer Product Safety Commission (the “Consumer Commission”) to exclude from the market products that are found to be unsafe or hazardous. Under certain circumstances, the Consumer Commission could require us to repair, replace or refund the purchase price of one or more of our products, or we may voluntarily do so. Any additional repurchases or recalls of our products could be costly to us and could damage the reputation or the value of our brands. If we are required to remove, or we voluntarily remove our products from the market, our reputation or brands could be tarnished and we may have large quantities of finished products that could not be sold. Furthermore, failure to timely notify the Consumer Commission of a potential safety hazard can result in significant fines being assessed against us. Additionally, laws regulating certain consumer products exist in some states, as well as in other countries in which we sell our products, and more restrictive laws and regulations may be adopted in the future.
The Food Quality Protection Act ("FQPA"(“FQPA”) established a standard for food-use pesticides, which is that a reasonable certainty of no harm will result from the cumulative effect of pesticide exposures. Under the FQPA, the EPA is evaluating the cumulative effects from dietary and non-dietary exposures to pesticides. The pesticides in certain of our products that are sold through the Home and Garden Business continue to be evaluated by the EPA as part of this program. It is possible that the EPA or a third party active ingredient registrant may decide that a pesticide we use in our products will be limited or made unavailable to us. We cannot predict the outcome or the severity of the effect of the EPA’s continuing evaluations of active ingredients used in our products.
In addition, the use of certain pesticide products that are sold through our Home and Garden Business may, among other things, be regulated by various local, state, federal and foreign environmental and public health agencies. These regulations may require that only certified or professional users apply the product, that users post notices on properties where products have been or will be applied or that certain ingredients may not be used. Compliance with such public health regulations could increase our cost of doing business and expose us to additional requirements with which we may be unable to comply.
Any failure to comply with these laws or regulations, or the terms of applicable environmental permits, could result in us incurring substantial costs, including fines, penalties and other civil and criminal sanctions or the prohibition of sales of our pest control products. Environmental law requirements, and the enforcement thereof, change frequently, have tended to become more stringent over time and could require us to incur significant expenses.
Most federal, state and local authorities require certification by Underwriters Laboratory, Inc. (“UL”), an independent, not-for-profit corporation engaged in the testing of products for compliance with certain public safety standards, or other safety regulation certification prior to marketing electrical appliances. Foreign jurisdictions also have regulatory authorities overseeing the safety of consumer products. Our products may not meet the specifications required by these authorities. A determination that any of our products are not in compliance with these rules and regulations could result in the imposition of fines or an award of damages to private litigants.
27
A cybersecurity breach or failure of one or more key information technology systems could have a material adverse impact on our business or reputation.
We rely extensively on information technology (IT) systems, networks and services, including internet sites, data hosting and processing facilities and tools and other hardware, software and technical applications and platforms, some of which are managed, hosted, provided and/or used by third-parties or their vendors, to assist in conducting our business.
Our IT systems have been, and will likely continue to be, subject to computer viruses or other malicious codes, unauthorized access attempts, phishing and other cyber-attacks. We continue to assess potential threats and make investments seeking to address these threats, including monitoring of networks and systems and upgrading skills, employee training and security policies for the Company and its third-party providers. However, because the techniques used in these attacks change frequently and may be difficult to detect for periods of time, we may face difficulties in anticipating and implementing adequate preventative measures. To date, we have seen no material impact on our business or operations from these attacks; however, we cannot guarantee that our security efforts will prevent breaches or breakdowns to our or our third-party providers’ databases or systems. If the IT systems, networks or service providers we rely upon fail to function properly, or if we or one of our third-party providers suffer a loss, significant unavailability of or disclosure of our business or stakeholder information, and our business continuity plans do not effectively address these failures on a timely basis, we may be exposed to reputational, competitive and business harm as well as litigation and regulatory action. The costs and operational consequences of responding to breaches and implementing remediation measures could be significant.
Our actual or perceived failure to adequately protect personal data could adversely affect our business, financial condition and results of operations.
A variety of state, national, foreign, and international laws and regulations apply to the collection, use, retention, protection, disclosure, transfer, and other processing of personal data. These privacy and data protection-related laws and regulations are evolving, with new or modified laws and regulations proposed and implemented frequently and existing laws and regulations subject to new or different interpretations. Compliance with these laws and regulations can be costly and can delay or impede the development of new products.
We historically have relied upon adherence to the U.S. Department of Commerce’s Safe Harbor Privacy Principles and compliance with the U.S.-EU Safe Harbor Framework under Directive 95/46/EC (commonly referred to as the “Data Protection Directive”) agreed to by the U.S. Department of Commerce and the EU. The U.S.-EU Safe Harbor Framework, which established means for legitimizing the transfer of personal data by U.S. companies from the European Economic Area, or EEA, to the U.S., recently was invalidated by a decision of the European Court of Justice (or the “ECJ”).
On July 12, 2016, the European Commission adopted the EU-U.S. Privacy Shield, which provides a framework for the transfer of personal data of EU data subjects, and on May 4, 2016, the EU General Data Protection Regulation (“GDPR”), which will replace Directive 95/46/EC, was formally published. The GDPR will go into effect on May 25, 2018 and as a regulation as opposed to a directive will be directly applicable in EU member states. Among other things, the GDPR applies to data controllers and processors outside of the EU whose processing activities relate to the offering of goods or services to, or monitoring the behavior within the EU of, EU data subjects.
In light of these developments, we are reviewing our business practices and may find it necessary or desirable to make changes to our personal data handling to cause our transfer and receipt of EEA residents’ personal data to be legitimized under applicable European law. The regulation of data privacy in the EU continues to evolve, and it is not possible to predict the ultimate content, and therefore the effect, of data protection regulation over time.
Our actual or alleged failure to comply with applicable laws and regulations, or to protect personal data, could result in enforcement actions and significant penalties against us, which could result in negative publicity, increase our operating costs, subject us to claims or other remedies and have a material adverse effect on our business, financial condition, and results of operations.
Public perceptions that some of the products we produce and market are not safe could adversely affect us.
On occasion, customers and some current or former employees have alleged that some products failed to perform up to expectations or have caused damage or injury to individuals or property. Public perception that any of our products are not safe, whether justified or not, could impair our reputation, damage our brand names and have a material adverse effect on our business, financial condition and results of operations. In addition, we rely on certain third party trademarks, brand names and logos of which we do not have exclusive use of. Public perception that any such third party trademarks, bandbrand names and logos used by us are not safe, whether justified or not, could have a material adverse effect on our business, financial condition and results of operationsoperations.
28
If we are unable to negotiate satisfactory terms to continue existing or enter into additional collective bargaining agreements, we may experience an increased risk of labor disruptions and our results of operations and financial condition may suffer.
Approximately 16%14% of our total labor force is covered by collective bargaining agreements. There are four5 collective bargaining agreements that will expire during our fiscal year ending September 30, 2014,2016, which cover approximately 57%38% of the labor force under collective bargaining agreements, or approximately 9%5% of our total labor force. While we currently expect to negotiate continuations to the terms of these agreements, there can be no assurances that we will be able to obtain terms that are satisfactory to us or otherwise to reach agreement at all with the applicable parties. In addition, in the course of our business, we may also become subject to additional collective bargaining agreements. These agreements may be on terms that are less favorable than those under our current collective bargaining agreements. Increased exposure to collective bargaining agreements, whether on terms more or less favorable than our existing collective bargaining agreements, could adversely affect the operation of our business, including through increased labor expenses. While we intend to comply with all collective bargaining agreements to which we are subject, there can be no assurances that we will be able to do so and any noncompliance could subject us to disruptions in our operations and materially and adversely affect our results of operations and financial condition.
Significant changes in actual investment return on pension assets, discount rates and other factors could affect our results of operations, equity and pension contributions in future periods.
Our results of operations may be positively or negatively affected by the amount of income or expense we record for our defined benefit pension plans. U.S. Generally Accepted Accounting Principles (“GAAP”) requires that we calculate income or expense for the plans using actuarial valuations. These valuations reflect assumptions about financial markets and other economic conditions, which may change based on changes in key economic indicators. The most significant assumptions we use to estimate pension income or expense are the discount rate and the expected long-term rate of return on plan assets. In addition, we are required to make an annual measurement of plan assets and liabilities, which may result in a significant change to equity. Although pension expense and pension funding contributions are not directly related, key economic factors that affect pension expense would also likely affect the amount of cash we would contribute to pension plans as required under the Employee Retirement Income Security Act of 1974, as amended.
If our goodwill, indefinite-lived intangible assets or other long-term assets become impaired, we will be required to record additional impairment charges, which may be significant.
A significant portion of our long-term assets consist of goodwill, other indefinite-lived intangible assets and finite-lived intangible assets recorded as a result of past acquisitions as well as through fresh start reporting. We do not amortize goodwill and indefinite-lived intangible assets, but rather review them for impairment on a periodic basis or whenever events or changes in circumstances indicate that their carrying value may not be recoverable. We consider whether circumstances or conditions exist which suggest that the carrying value of our goodwill and other long-lived intangible assets might be impaired. If such circumstances or conditions exist, further steps are required in order to determine whether the carrying value of each of the individual assets exceeds its fair value. If analysis indicates that an individual asset’s carrying value does exceed its fair value, the next step is to record a loss equal to the excess of the individual asset’s carrying value over its fair value.
The steps required by GAAP entail significant amounts of judgment and subjectivity. Events and changes in circumstances that may indicate that there may be an impairment and which may indicate that interim impairment testing is necessary include, but are not limited to: strategic decisions to exit a business or dispose of an asset made in response to changes in economic, political and competitive conditions; the impact of the economic environment on the customer base and on broad market conditions that drive valuation considerations by market participants; our internal expectations with regard to future revenue growth and the assumptions we make when performing impairment reviews; a significant decrease in the market price of our assets; a significant adverse change in the extent or manner in which our assets are used; a significant adverse change in legal factors or the business climate that could affect our assets; an accumulation of costs significantly in excess of the amount originally expected for the acquisition of an asset; and significant changes in the cash flows associated with an asset. As a result of such circumstances, we may be required to record a significant charge to earnings in our financial statements during the period in which any impairment of our goodwill, indefinite-lived intangible assets or other long-term assets is determined. Any such impairment charges could have a material adverse effect on our business, financial condition and operating results.
29
If we are unable to protect the confidentiality of our proprietary information and know-how, the value of our technology, products and services could be harmed significantly.
We rely on trade secrets, know-how and other proprietary information in operating our business. If this information is not adequately protected, then it may be disclosed or used in an unauthorized manner. To the extent that consultants, key employees or other third parties apply technological information independently developed by them or by others to our proposed products, disputes may arise as to the proprietary rights to such information, which may not be resolved in our favor. The risk that other parties may breach confidentiality agreements or that our trade secrets become known or independently discovered by
Disruption or failures of our information technology systems could have a material adverse effect on our business.
Our information technology systems are susceptible to security breaches, operational data loss, general disruptions in functionality, and may not be compatible with new technology. We depend on our information technology systems for the effectiveness of our operations and to interface with our customers, as well as to maintain financial records and accuracy. Disruption or failures of our information technology systems could impair our ability to effectively and timely provide our services and products and maintain our financial records, which could damage our reputation and have a material adverse effect on our business.
Our acquisition and expansion strategy may not be successful.
Our growth strategy is based in part on growth through acquisitions, which poses a number of risks. We may not be successful in identifying appropriate acquisition candidates, consummating acquisitions on satisfactory terms or integrating any newly acquired or expanded business with our current operations. We may issue additional equity, incur long-term or short-term indebtedness, spend cash or use a combination of these for all or part of the consideration paid in future acquisitions or expansion of our operations. The execution of our acquisition and expansion strategy could entail repositioning or similar actions that in turn require us to the Hardware Acquisition
Significant costs have been incurred in connection with the consummation of the Hardware Acquisition and are expected to be incurred in connection with the consummation of recent and future business acquisitions and the integration of such acquired businesses with Spectrum and the HHI Business into a combined company, including legal, accounting, financial advisory and other costs.
We expect to incur one-time costs in connection with integrating theour operations, products and personnel and those of Spectrum and the HHI Business and TLM Taiwan acquired from Stanley Black & Deckerbusinesses we acquire into a combined company, in addition to costs related directly to completing the Hardware Acquisition described below.such acquisitions. We would expect similar costs to be incurred with any future acquisition. These costs may include costsexpenditures for:
· | employee redeployment, relocation or severance; |
· | integration of operations and information systems; |
· | combination of research and development teams and processes; and |
· | reorganization or closures of facilities. |
In addition, we expect to incur a number of non-recurring costs associated with combining our operations with those of the HHI Business.acquired businesses. Additional unanticipated costs may yet be incurred as we integrate our business with the HHI Business.acquired businesses. Although we expect that the elimination of duplicative costs, as well as the realization of other efficiencies related to the integration of our operations with those of the HHI Business,acquired businesses, may offset incremental transaction and transaction-related costs over time, this net benefit may not be achieved in the near term. Additionally, while we expect to benefit from leveraging distribution channels and brand names across both companies,among the Company and the businesses we acquire, we cannot assure you that we will achieve such benefits.
30
We may not realize the anticipated benefits of, the Hardware Acquisitionand synergies from, our business acquisitions and may become responsible for certain liabilities.
Business acquisitions involve the integration of two companiesnew businesses that have previously operated independently.independently from us. The integration of our operations with those of the HHI Businessacquired businesses is frequently expected to result in financial and operational benefits, including increased top line growth, margins, revenues and cost savings and be accretive to earnings per share, earnings before interest, taxes, depreciation and amortization and free cash flow before synergies. There can be no assurance, however, regarding when or the extent to which we will be able to realize these increased top line growth, margins, revenues, cost savings or accretions to earnings per share, earnings before interest, taxes, depreciation and amortization or free cash flow or other benefits. Integration may also be difficult, unpredictable, and subject to delay because of possible company culture conflicts and different opinions on technical decisions and product roadmaps. We mustwill often be required to integrate or, in some cases, replace, numerous systems, including those involving management information, purchasing, accounting and finance, sales, billing, employee benefits, payroll and regulatory compliance, many of which aremay be dissimilar. In some instances, we and the HHI Businesscertain acquired businesses have served the same customers, and some customers may decide that it is desirable to have additional or different suppliers. Difficulties associated with the integration of acquired businesses could have a material adverse effect on our business.
We may also acquire partial or full ownership in businesses or may acquire rights to market and distribute particular products or lines of products. The acquisition of a business or the rights to market specific products or use specific product names may involve a financial commitment by us, either in the form of cash or equity consideration. In the case of a new license, such commitments are usually in the form of prepaid royalties and future minimum royalty payments. There is no guarantee that we will acquire businesses or product distribution rights that will contribute positively to our earnings. Anticipated synergies may not materialize, cost savings may be less than expected, sales of products may not meet expectations and acquired businesses may carry unexpected liabilities.
In addition, in connection with the Hardware Acquisition,business acquisitions, we have assumed, and may assume in connection with future acquisitions, certain potential liabilities relating to the HHI Business.liabilities. To the extent we havesuch liabilities are not identified such liabilitiesby us or to the extent the indemnifications obtained from Stanley Black & Deckerthird parties are insufficient to cover knownsuch liabilities, these liabilities could have a material adverse effect on our business.
Integrating our business and the HHI Businesswith acquired businesses may divert our management’s attention away from operations.
Successful integration of our and the HHI Business’acquired businesses’ operations, products and personnel with us may place a significant burden on
As a result of the Hardware Acquisition,business acquisitions, we may not be able to retain key personnel or recruit additional qualified personnel, which could materially affect our business and require us to incur substantial additional costs to recruit replacement personnel.
We are highly dependent on the continuing efforts of our senior management team and other key personnel. As a result of the Hardware Acquisition,business acquisitions, our current and prospective employees could experience uncertainty about their future roles. This uncertainty may adversely affect our ability to attract and retain key management, sales, marketing and technical personnel. Any failure to attract and retain key personnel could have a material adverse effect on our business after consummation of the Hardware Acquisition.business. In addition, we currently do not maintain “key person” insurance covering any member of our management team.
If any of our key personnel or those of our acquired businesses were to join a competitor or form a competing company, existing and potential customers or suppliers could choose to form business relationships with that competitor instead of us. There can be no assurance that confidentiality, non-solicitation, non-competition or similar agreements signed by former directors, officers, employees or stockholders of us, our acquired businesses or our transactional counterparties will be effective in preventing a loss of business.
General customer uncertainty related to the Hardware Acquisitionour business acquisitions could harm us.
Our customers may, in response to the announcement or consummation of the Hardware Acquisition,a business acquisition, delay or defer purchasing decisions. If our customers delay or defer purchasing decisions, our revenues could materially decline or any anticipated increases in revenue could be lower than expected.
31
A change in governmental regulations regarding the use of refrigerant gas R-134a or its potential future substitutes could have the righta material adverse effect on GAC’s ability to use certain Stanley Black & Decker trademarks, brand names and logos for a limited period of time. If we fail to establish in a timely manner a new, independently recognized brand name with a strong reputation, our revenue and profitability could decline.
The refrigerant R-134a is critical component of the HHI Business, we received a limited right to use certain Stanley Black & Decker trademarks, brand names and logos in marketing ourCompany’s aftermarket A/C products and services for only five years. Pursuant to a transitional trademark license agreement, Stanley Black & Decker granted us the right to use the “Stanley” and “Black & Decker” marks and logos, and certain other marks and logos, for up to five years after the completionis used in products which comprised approximately 34% of GAC’s net sales, or approximately 3% of the Hardware AcquisitionCompany’s net sales, in connectionthe year ended September 30, 2016. Older generation refrigerants such as R-12 (Freon) have been regulated for some time in the United States and elsewhere, due to concerns about their potential to contribute to ozone depletion. In recent years, refrigerants such as R-134a, which is an approved substitute for R-12, have also become the subject of regulatory focus due to their potential to contribute to global warming.
The European Union has passed regulations that require the phase out of R-134a in automotive cooling systems in new vehicles by 2017. In the United States, the Company has reported that it cannot predict what future action, if any, the EPA will take on the regulation of R-134a. But based on currently available information, it believes that it would take some time for suitable alternatives to R-134a to come into full scale commercial production and therefore such alternatives would not be readily available for wide spread use in new car models. If the future use of R-134a is phased out or is limited or prohibited in jurisdictions in which we do business, the future market for GAC’s products containing R-134a may be limited, which could have a material adverse impact on its results of operations, financial condition, and cash flows.
In addition, regulations may be enacted governing the packaging, use and disposal of the Company’s products containing refrigerants. For example, regulations are currently in effect in California that govern the sale and distribution of products containing R-134a. While the Company has reported that it is not aware of any noncompliance with certainsuch regulations, its failure to comply with these or possible future regulations in California, or elsewhere, could result in material fines or costs or the inability to sell its products in those markets, which could have a material adverse impact on the results of operations, financial condition and services. When our rightcash flows. If substitutes for R-134a become widely used in A/C systems and their use for DIY and retrofit purposes are not approved by the EPA, it could have a material adverse effect on GAC’s results of operations, financial condition, and cash flows. In addition, the cost of HFO-1234yf, the leading long-term alternative to R-134a being proposed in the United States and the European Union for use in the Stanley Black & Decker trademarks, brand namesA/C systems of new vehicles, will likely be higher than that of R-134a. If HFO-1234yf becomes widely used and logos expires, wethe Company is able to develop products using HFO-1234yf, but is unable to price its products to reflect the increased cost of HFO-1234yf, it could have a material adverse effect on its results of operations, financial condition and cash flow.
All of GAC’s refrigerant products are produced at one facility, and a significant disruption or disaster at such a facility could have a material adverse effect on its results of operations.
GAC’s manufacturing facility consists of one site which is located in Garland, Texas and thus GAC is dependent upon the continued safe operation of this facility. Its facility is subject to various hazards associated with the manufacturing, handling, storage, and transportation of chemical materials and products, including human error, leaks and ruptures, explosions, floods, fires, inclement weather and natural disasters, power loss or other infrastructure failures, mechanical failure, unscheduled downtime, regulatory requirements, the loss of certifications, technical difficulties, labor disputes, inability to obtain material, equipment or transportation, environmental hazards such as remediation, chemical spills, discharges or releases of toxic or hazardous substances or gases, and other risks. Many of these hazards could cause personal injury and loss of life, severe damage to, or destruction of, property and equipment and environmental contamination. In addition, the occurrence of material operation problems at GAC’s facility due to any of these hazards could cause a disruption in the production of its products. GAC may also encounter difficulties or interruption as a result of the application of enhanced manufacturing technologies or changes to production lines to improve GAC’s throughput or to upgrade or repair its production lines. The Company’s insurance policies have coverage in case of significant damage to its manufacturing facility but may not fully compensate GAC for the cost of replacement for any such damage and any loss from business interruption. As a result, GAC may not be ableadequately insured to maintaincover losses resulting from significant damage to its manufacturing facility. Any damage to its facility or enjoy comparable name recognitioninterruption in manufacturing could result in production delays and delays in meeting contractual obligations which could have a material adverse effect on GAC’s relationship with its customers and on its results of operations, financial condition or status under our new brand. If we are unable to successfully manage the transitioncash flows in any given period.
32
HRG and the Harbinger Partiesits significant stockholders exercise significant influence over us and their interests in our business may be different from the interests of our stockholders.
HRG, as our majority stockholder, and Harbinger Capital Partners Fund I, Ltd., Harbinger Capital Partners Special Situations Fund, L.P. and Global Opportunities Breakaway Ltd. (together the “Harbinger Parties”), asits significant stockholders, of HRG, have the ability to influence the outcome of any corporate action by us that requires stockholder approval, including, but not limited to, the election of directors, approval of merger transactions and the sale of all or substantially all of our assets. In addition, we are a party to a stockholder agreement with HRG and the Harbinger Parties.
This influence and actual control may have the effect of discouraging offers to acquire SB Holdingsthe Company because any such consummation would likely require the consent of HRG and perhaps HRG and the Harbinger Parties. HRG and the Harbinger
In addition, because HRG owns more than 50% of the voting power of SB Holdings, SB Holdingsthe Company, the Company is considered a controlled company under the NYSE listing standards. As such, the NYSE corporate governance rules requiring that a majority of SB Holdings'the Company’s board of directors and SB Holdings'the Company’s entire compensation committee or the nominating and corporate governance committee be independent do not apply. As a result, the ability of SB Holdings'the Company’s independent directors to influence its business policies and affairs may be reduced.
If HRG were to sell substantial amounts of SB Holdings'the Company’s common stock in the public market, or investors perceive that these sales could occur, the market price of SB Holdings'the Company's common stock could be adversely affected. SB HoldingsThe Company has entered into a registration rights agreement (the “Registration Rights Agreement”) with HRG, the Harbinger Partiescertain of HRG’s stockholders and certain other of our stockholders. If requested properly under the terms of the Registration Rights Agreement, these stockholders have the right to require SB Holdingsthe Company to register all or some of such shares for sale under the Securities Act in certain circumstances, and also have the right to include those shares in a registration initiated by SB Holdings.the Company. If SB Holdingsthe Company is required to include the shares of its common stock held by these stockholders pursuant to these registration rights in a registration initiated by SB Holdings,the Company, sales made by such stockholders may adversely affect the price of SB Holdings'the Company's common stock and SB Holdings' ability to raise needed capital. In addition, if these stockholders exercise their demand registration rights and cause a large number of shares to be registered and sold in the public market or demand that SB Holdingsthe Company register theirits shares on a shelf registration statement, such sales or shelf registration may have an adverse effect on the market price of SB Holdings'the Company’s common stock.
We are one of several companies in which HRG owns a controlling interest. The interests of HRG and these other companies may, from time to time, diverge from the interests of other SB Holdingsof the Company’s stockholders and from each other, particularly with regard to new investment opportunities. Neither HRG nor the Harbinger Parties areis not restricted from investing in other businesses involving or related to the marketing or distribution of household products, pet and pest products and personal care products. Both HRG and the Harbinger Parties may also engage in other businesses that compete or may in the future compete with SB Holdings.the Company.
Our Restated Bylaws provide that the Court of Chancery of the State of Delaware will be the exclusive forum for substantially all disputes between us and our stockholders, which could limit our stockholders’ ability to obtain a favorable judicial forum for disputes with us or our directors, officers or employees.
Our restated bylaws provide that the Court of Chancery of the State of Delaware is the exclusive forum for any derivative action or proceeding brought on our behalf, any action asserting a breach of fiduciary duty, any action asserting a claim against us arising pursuant to the Delaware General Corporation Law, our amended and restated certificate of incorporation or our restated bylaws, any action to interpret, apply, enforce, or determine the validity of our amended and restated certificate of incorporation or bylaws, or any action asserting a claim against us that is governed by the internal affairs doctrine. The choice of forum provision may limit a stockholder’s ability to bring a claim in a judicial forum that it finds favorable for disputes with us or our directors, officers or other employees, which may discourage such lawsuits against us and our directors, officers and other employees. Alternatively, if a court were to find the choice of forum provision contained in our restated bylaws to be inapplicable or unenforceable in an action, we may incur additional costs associated with resolving such action in other jurisdictions, which could adversely affect our business and financial condition.
33
Even though SB Holdings'the Company’s common stock is currently traded on the NYSE, it has less liquidity than many other stocks quoted on a national securities exchange.
The trading volume in SB Holdings'the Company’s common stock on the NYSE has been relatively low when compared with larger companies listed on the NYSE or other stock exchanges. Because of this, it may be more difficult for stockholders to sell a substantial number of shares for the same price at which stockholders could sell a smaller number of shares. We cannot predict the effect, if any, that future sales of SB Holdings'the Company’s common stock in the market, or the availability of shares of its common stock for sale in the market, will have on the market price of SB Holdings'the Company’s common stock. We can give no assurance that sales of substantial amounts of SB Holdings'the Company’s common stock in the market, or the potential for large amounts of sales in the market, would not cause the price of SB Holdings'the Company’s common stock to decline or impair SB Holdings'the Company’s future ability to raise capital through sales of its common stock. Furthermore, because of the limited market and generally low volume of trading in SB Holdings'the Company’s common stock that could occur, the share price of its common stock could be more likely to be affected by broad market fluctuations, general market conditions, fluctuations in our operating results, changes in the market's perception of our business, and announcements made by SB Holdings,the Company, its competitors or parties with whom SB Holdingsthe Company has business relationships. The lack of liquidity in SB Holdings'the Company’s common stock may also make it difficult for us to issue additional securities for financing or other purposes, or to otherwise arrange for any financing we may need in the future. In addition, we may experience other adverse effects, including, without limitation, the loss of confidence in us by current and prospective suppliers, customers, employees and others with whom we have or may seek to initiate business relationships.
The market price of SB Holdings'the Company’s common stock is likely to be highly volatile and could fluctuate widely in price in response to various factors, many of which are beyond our control.
Factors that may influence the price of the common stock include, without limitation, the following:
· | loss of any of our key customers or suppliers; |
· | additions or departures of key personnel; |
· | sales of common stock; |
· | our ability to execute our business plan; |
· | announcements and consummations of business acquisitions; |
�� | operating results that fall below expectations; |
· | additional issuances of |
· | low volume of sales due to concentrated ownership of common stock; |
· | intellectual property disputes; |
· | industry developments; |
· | economic and other external factors; |
· | period-to-period fluctuations in our financial results; and |
· | market concerns with respect to the potential indirect impact of matters not directly involving the Company but impacting HRG or its affiliates. |
In addition, the securities markets have from time to time experienced significant price and volume fluctuations that are unrelated to the operating performance of particular companies. These market fluctuations may also materially and adversely affect the market price of SB Holdings'the Company’s common stock. You should also be aware that price volatility might be worse if the trading volume of shares of the common stock is low.
Additional issuances of SB Holdings'the Company’s common stock may result in dilution to its existing stockholders.
Under our equity incentive plans under which shares of SB Holdings could be issued,plan approved by the 2009 Spectrum Brands Inc. Incentive Plan (the “2009 Plan”) and the Spectrum Brands Holdings, Inc. 2007 Omnibus Equity Award Plan (the “RH Plan”). On October 21, 2010, SB Holdings' Board of Directors adoptedshareholders on March 1, 2011, called the Spectrum Brands Holdings, Inc. 2011 Omnibus Equity Award Plan (the “2011 Equity Plan”), which was approved at the Annual Meeting of Stockholders on March 1, 2011. As a result of shareholder approval of the 2011 Plan, no further awards will be granted under the 2009 Plan and the RH Plan. Up to 4,625,676 shares of common stock of SB Holdings,the Company, net of cancellations, maywere authorized to be issued. At the 2014 annual shareholders meeting, the 2011 Equity Plan was amended to increase the shares issuable by 1,000,000; therefore, a total of 5,625,676 shares, net of cancellations, are authorized to be issued under such plan. Increases to the number of shares issuable under the 2011 Plan.Equity Plan are subject to approval by the Board of Directors and shareholders. As of
34
In addition, SB Holdings'the Company’s board of directors has the authority to issue additional shares of capital stock to provide additional financing or for other purposes in the future. The issuance of any such shares or exercise of any such options may result in a reduction of the book value or market price of the outstanding shares of common stock. If we do issue any such additional shares or any such options are exercised, such issuance or exercise also will cause a reduction in the proportionate ownership and voting power of all other stockholders. As a result of such dilution, the proportionate ownership interest and voting power of a holder of shares of common stock could be decreased. Further, any such issuance or exercise could result in a change of control. Under our certificate of incorporation, holders of 5% or more of the outstanding common stock or capital stock into which any shares of common stock may be converted have certain rights to purchase their pro rata share of certain future issuances of securities.
None.
The following table lists our principal owned or leased administrative, manufacturing, packaging and distribution facilities at September 30, 2013:
Corporate & Administrative
Location | Function / Use | Owned / Leased | ||
U.S. Locations | ||||
Middleton, Wisconsin | World Headquarters & | Leased | ||
Danbury, Connecticut | GAC Headquarters | Leased | ||
Earth City, Missouri | Pet, Home & Garden Headquarters | Leased | ||
Lake Forest, California | HHI Headquarters | Leased | ||
Miami Lakes, Florida | Latin America Headquarters | Leased | ||
Non-U.S. Locations | ||||
Manchester, England | UK Headquarters | Owned | ||
Mentone, Australia | APAC Headquarters | Leased | ||
Sulzbach, Germany | Europe Headquarters | Leased | ||
Mississauga, Canada | Canada Headquarters | Leased |
Global Batteries and Appliances (GBA)
Location | Function / Use | Owned / Leased | ||
U.S. Locations | ||||
Fennimore, Wisconsin | Battery Manufacturing | Owned | ||
Portage, Wisconsin | Battery Manufacturing | Owned | ||
DeForest, Wisconsin | Distribution | Leased | ||
Dixon, Illinois | Distribution | Leased | ||
Redlands, California | Distribution | Leased | ||
Non-U.S. Locations | ||||
Dischingen, Germany | Battery Manufacturing | Leased | ||
Guatemala City, | Battery Manufacturing | Owned | ||
Jaboatao, | Battery Manufacturing | Owned | ||
Washington, UK | Battery | Leased | ||
Ellwangen-Neunheim, | Distribution | Leased | ||
Guatemala City, Guatemala | Distribution | Owned | ||
Mentone, Australia | Distribution | Leased | ||
Santo Domingo, Dominican Republic | Distribution | Owned | ||
Wolverhampton, | ||||
Distribution | ||||
Owned | ||||
35
Home & Hardware Improvement (HHI)
Location | Function / Use | Owned / Leased | ||
U.S. Locations | ||||
Charlotte, North Carolina | Manufacturing & Distribution | Leased | ||
Houston, Texas | Manufacturing & Distribution | Leased | ||
Lititz, Pennsylvania | Manufacturing & Distribution | Leased | ||
Denison, Texas | Manufacturing | Leased | ||
Birmingham, Alabama | Distribution | Leased | ||
Dallas, Texas | Distribution | Leased | ||
Denison, Texas | Distribution | Owned | ||
Elkhart, Indiana | Distribution | Leased | ||
Mira Loma, California | Distribution | Leased | ||
Non-U.S. Locations | ||||
Mexicali, Mexico | Manufacturing & Distribution | Leased | ||
Chia-Yi, Taiwan | Manufacturing | Leased | ||
Nogales, Mexico | Manufacturing | Owned | ||
Subic Bay, Philippines | Manufacturing | Owned | ||
Xiamen, China | Manufacturing | Leased | ||
Xiaolan, China | Manufacturing | Leased | ||
Brockville, Canada | Distribution | Leased | ||
Shenzhen, China | Distribution | Leased |
Global Pet Supplies (PET)
Location | Function / Use | Owned / Leased | ||
U.S. Locations | ||||
Blacksburg, Virginia | Manufacturing | Owned | ||
Bridgeton, Missouri | Manufacturing | Leased | ||
Noblesville, Indiana | Manufacturing | Owned | ||
St. Louis, Missouri | Manufacturing | Leased | ||
Edwardsville, Illinois | Distribution | Leased | ||
Non-U.S. Locations | ||||
Bogota, Colombia | Manufacturing & Distribution | Leased | ||
Ambato, Ecuador | Manufacturing | Leased | ||
Coevorden, Netherlands | Manufacturing | Owned | ||
Leon, Mexico | Manufacturing | Leased | ||
Melle, Germany | Manufacturing | Owned | ||
Phnom Penh, Cambodia | Manufacturing | Leased | ||
Melle, Germany | Distribution | Leased |
Home & Garden (H&G)
Location | Function / Use | Owned / Leased | ||
U.S. Locations | ||||
St. Louis, Missouri | Manufacturing | Leased | ||
Edwardsville, Illinois | Distribution | Leased |
Global Auto Care (GAC)
Location | Function / Use | Owned / Leased | ||
U.S. Locations | ||||
Garland, Texas | Manufacturing & Distribution | Leased | ||
Mentor, Ohio | Manufacturing & Distribution | Leased | ||
Painesville, Ohio | Manufacturing & Distribution | Owned | ||
Non-U.S. Locations | ||||
Ebbw Vale, Gwent, Wales | Manufacturing & Distribution | Leased |
36
We also own, operate or contract with third parties to operate distribution centers, sales offices and other administrative offices throughout the world in support of our business. We lease our administrative headquarters and primary research and development facility located in Middleton, Wisconsin and the Hardware & Home Improvement administrative headquarters in Lake Forest, California.
Litigation
We are a defendant in various other matters of litigation generally arising out of the ordinary course of business.
We do not believe that any other matters or proceedings presently pending will have a material adverse effect on our results of operations, financial condition, liquidity or cash flows.
Environmental
We have provided for the estimated costs associated with environmental remediation activities at some of our current and former manufacturing sites. We believe that any additional liability that may result from the resolution of these matters in excess of the amounts provided of approximately $5.1$4.4 million will not have a material adverse effect on our financial condition, results of operations or cash flows.
We are subject to various federal, state and local environmental laws and regulations. We believe we are in substantial compliance with all such environmental laws that are applicable to our operations. See also the discussion captioned “Governmental Regulations and Environmental Matters” under Item 1 above.
Not applicable.
37
PART II
SBH’s common stock (the “SBH Common Stock”) is tradedtrades on the NYSENew York Stock Exchange (the “NYSE”) under the symbol “SPB.”
|
|
|
|
|
|
|
|
|
|
|
|
|
|
|
| High |
| Low | ||
Year Ended September 30, 2016 |
|
|
|
|
|
|
Quarter ended September 30, 2016 |
| $ | 138.95 |
| $ | 114.63 |
Quarter ended July 3, 2016 |
| $ | 122.52 |
| $ | 106.91 |
Quarter ended April 3, 2016 |
| $ | 110.39 |
| $ | 87.65 |
Quarter ended January 3, 2016 |
| $ | 103.57 |
| $ | 89.88 |
Year Ended September 30, 2015 |
|
|
|
|
|
|
Quarter ended September 30, 2015 |
| $ | 106.55 |
| $ | 88.28 |
Quarter ended June 28, 2015 |
| $ | 105.07 |
| $ | 86.02 |
Quarter ended March 29, 2015 |
| $ | 98.83 |
| $ | 89.14 |
Quarter ended December 28, 2014 |
| $ | 98.36 |
| $ | 81.03 |
| High | Low | |
| Fiscal 2013 | ||
| Quarter ended September 30, 2013 | $67.64 | $56.16 |
| Quarter ended June 30, 2013 | $62.10 | $53.36 |
| Quarter ended March 31, 2013 | $56.59 | $44.93 |
| Quarter ended December 30, 2012 | $47.83 | $40.24 |
| Fiscal 2012 | ||
| Quarter ended September 30, 2012 | $42.12 | $32.85 |
| Quarter ended July 1, 2012 | $35.73 | $32.11 |
| Quarter ended April 1, 2012 | $34.96 | $27.91 |
| Quarter ended January 1, 2012 | $28.02 | $22.17 |
SB/RH is a wholly-owned subsidiary of SBH and accordingly, there is no established public trading market for its equity compensation planssecurities. As of November 17, 2016, there is set forth in Item 12. Security Ownershiponly one record holder of its equity securities. During the years ended September 30, 2016 and 2015, SB/RH paid cash dividends of $97.2 million and $72.1 million, respectively, to SBH. Certain Beneficial Ownersrestrictive covenants within the Company’s debt facilities impose limitations on payment of dividends by SB/RH’s subsidiaries to SB/RH and Management and Related Stockholder Matters-Equity Compensation Plan Information.
Purchases of Equity Securities by the Issuer and Affiliated Purchasers
On August 6, 2013,July 28, 2015, the Board of Directors of SBH approved a $200$300 million common stock repurchase program. The authorization is effective for 2436 months. The following table reflects all shares repurchased, inclusive of shares purchased under the program:
|
|
|
|
|
|
|
|
|
|
|
|
| Total Number |
| Average |
| Total Number |
| Approximate Dollar Value | ||
|
| of Shares |
| Price Paid |
| of Shares Purchased |
| of Shares that may | ||
|
| Purchased |
| Per Share |
| as Part of Plan |
| Yet Be Purchased | ||
As of September 30, 2015 |
| 130,000 |
| $ | 98.18 |
| 130,000 |
| $ | 287,236,600 |
Quarter ended January 3, 2016 |
| 428,700 |
|
| 93.88 |
| 428,700 |
|
| 246,989,425 |
Quarter ended April 3, 2016 |
| — |
|
| — |
| — |
|
| 246,989,425 |
Quarter ended July 3, 2016 |
| — |
|
| — |
| — |
|
| 246,989,425 |
Quarter ended September 30, 2016 |
| 21,387 |
|
| 132.33 |
| 21,387 |
|
| 244,159,304 |
As of September 30, 2016 |
| 580,087 |
| $ | 96.26 |
| 580,087 |
| $ | 244,159,304 |
38
Stock Performance Graph
The following graph compares the cumulative total stockholder return on our Common Stock to the cumulative total return of (i) the Russell 1000 Financial Index, (ii) Russell 2000 Financial Index and (iii) our peer group selected in good faith, which is composed of the following companies (alphabetical order): Central Garden and Pet Company, Church & Dwight Co., Inc., The Clorox Company, Edgewell Personal Care Company, Energizer Holdings, Inc., Fortune Brands Home & Security, Inc., Hanesbrands, Inc., Hasbro, Inc., Helen of Troy Limited, Mattel, Inc., Newell Brands, Inc., Nu Skin Enterprises, Inc., The Scotts Miracle-Gro Company, Stanley Black & Decker, Inc., and Tupperware Brands Corporation. For 2016, the peer group has been revised to delete Jarden Corporation because it was acquired by Newell Brands Inc. during 2016 and is no longer a public company. In connection with this transaction, Newell Brands Inc. succeeded to the business of Newell Rubbermaid Inc., and therefore Newell Brands Inc. has replaced Newell Rubbermaid Inc. in the peer group. Additionally, for 2016, the peer group has been revised to add Helen of Troy Limited because of its personal care products industry focus, comparable annual revenues and market capitalization to the Company. In addition for 2016, in accordance with Regulation S-K Item 201(e)(4), the graph now displays a comparison to the Russell 1000 index in addition to the Russell 2000, because during the index’s annual 2016 reconstitution process the Company was moved into the Russell 1000 from the Russell 2000.
The comparison below assumes that $100 was invested in (i) the common stock repurchase program discussed above.
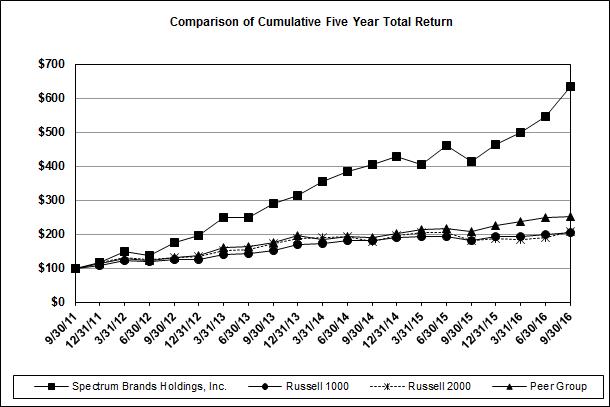
Period | Total Number of Shares Purchased | Average Price Paid Per Share | Total Number of Shares Purchased as Part of Publicly Announced Plans or Programs | Maximum Number of Shares that may Yet Be Purchased Under the Plans or Programs | |||||
| Quarter Ended September 30, 2013 | |||||||||
| July 1, 2013 - July 28, 2013 | — | — | — | — | |||||
| July 29, 2013 - August 25, 2013 | — | — | — | — | |||||
| August 26, 2013 - September 30, 2013 | 50,000 | $ | 60.13 | 50,000 | — | ||||
| Total | 50,000 | $ | 60.13 | 50,000 | — | ||||
39
Spectrum Brands Holdings, Inc.
The following selected historical financial data is derived from ourSBH’s audited consolidated financial statements. Only our Consolidated Statements of Financial Position as of September 30, 2013 and 2012 and our Consolidated Statements of Operations, Consolidated Statements of Comprehensive Income (Loss), Consolidated Statements of Shareholders’ Equity and Consolidated Statements of Cash Flows for the years ended September 30, 2013, 2012 and 2011 are included elsewhere in this Annual Report on Form 10-K. The information presented belowstatements as of and for the fiscal yearyears ended September 30, 2013 also includes the results of the HHI Business operations since December 17, 2012,30. The summary has been derived in part from, and the results of TLM Taiwan since April 8, 2013.
|
|
|
|
|
|
|
|
|
|
|
|
|
|
|
|
|
|
|
|
|
|
|
|
|
|
|
|
|
|
|
|
|
|
(in millions, except per share data) |
| 2016(1) |
| 2015(2) |
| 2014(3) |
| 2013(4) |
| 2012(5) |
| |||||
Statement of Operations Data |
|
|
|
|
|
|
|
|
|
|
|
|
|
|
|
|
Net sales |
| $ | 5,039.7 |
| $ | 4,690.4 |
| $ | 4,429.1 |
| $ | 4,085.6 |
| $ | 3,252.4 |
|
Gross profit |
|
| 1,919.9 |
|
| 1,670.3 |
|
| 1,568.9 |
|
| 1,390.3 |
|
| 1,115.7 |
|
Operating income |
|
| 656.2 |
|
| 474.1 |
|
| 481.9 |
|
| 351.2 |
|
| 301.7 |
|
Interest expense |
|
| 250.0 |
|
| 271.9 |
|
| 202.1 |
|
| 375.6 |
|
| 191.9 |
|
Income (loss) from operations before income taxes |
|
| 397.6 |
|
| 193.3 |
|
| 273.5 |
|
| (27.9) |
|
| 109.0 |
|
Income tax expense |
|
| 40.0 |
|
| 43.9 |
|
| 59.0 |
|
| 27.4 |
|
| 60.4 |
|
Net income (loss) |
|
| 357.6 |
|
| 149.4 |
|
| 214.5 |
|
| (55.3) |
|
| 48.6 |
|
Net income (loss) attributable to controlling interest |
|
| 357.1 |
|
| 148.9 |
|
| 214.1 |
|
| (55.2) |
|
| 48.6 |
|
Restructuring and Related Charges |
|
|
|
|
|
|
|
|
|
|
|
|
|
|
|
|
Cost of goods sold |
| $ | 0.5 |
| $ | 2.1 |
| $ | 3.7 |
| $ | 10.0 |
| $ | 9.8 |
|
Operating expenses |
|
| 14.7 |
|
| 26.6 |
|
| 19.2 |
|
| 24.0 |
|
| 9.7 |
|
Earnings (Loss) Per Share of Common Stock |
|
|
|
|
|
|
|
|
|
|
|
|
|
|
|
|
Basic |
| $ | 6.02 |
| $ | 2.68 |
| $ | 4.07 |
| $ | (1.06) |
| $ | 0.94 |
|
Diluted |
|
| 5.99 |
|
| 2.66 |
|
| 4.02 |
|
| (1.06) |
|
| 0.91 |
|
Dividends per share |
|
| 1.47 |
|
| 1.27 |
|
| 1.15 |
|
| 0.75 |
|
| 1.00 |
|
Weighted Average Shares Outstanding |
|
|
|
|
|
|
|
|
|
|
|
|
|
|
|
|
Basic |
|
| 59.3 |
|
| 55.6 |
|
| 52.6 |
|
| 52.0 |
|
| 51.6 |
|
Diluted |
|
| 59.6 |
|
| 55.9 |
|
| 53.3 |
|
| 52.0 |
|
| 53.3 |
|
Cash Flow and Related Data |
|
|
|
|
|
|
|
|
|
|
|
|
|
|
|
|
Net cash provided by operating activities |
| $ | 615.0 |
| $ | 444.3 |
| $ | 432.7 |
| $ | 256.5 |
| $ | 258.8 |
|
Purchase of property, plant and equipment |
|
| 95.2 |
|
| 89.1 |
|
| 73.3 |
|
| 82.0 |
|
| 46.8 |
|
Depreciation and amortization |
|
| 183.0 |
|
| 170.0 |
|
| 157.6 |
|
| 139.9 |
|
| 104.6 |
|
Statement of Financial Position Data (at September 30) |
|
|
|
|
|
|
|
|
|
|
|
|
|
|
|
|
Cash and cash equivalents |
| $ | 275.3 |
| $ | 247.9 |
| $ | 194.6 |
| $ | 207.3 |
| $ | 158.0 |
|
Working capital (6)(7) |
|
| 537.3 |
|
| 660.6 |
|
| 485.0 |
|
| 497.5 |
|
| 422.7 |
|
Total assets (7)(8) |
|
| 7,069.1 |
|
| 7,193.8 |
|
| 5,429.6 |
|
| 5,543.2 |
|
| 3,695.9 |
|
Total debt (8) |
|
| 3,620.2 |
|
| 3,905.9 |
|
| 2,939.7 |
|
| 3,153.6 |
|
| 1,630.0 |
|
Total equity |
|
| 1,844.0 |
|
| 1,606.8 |
|
| 1,086.8 |
|
| 940.1 |
|
| 989.1 |
|
Successor Company | Predecessor Company | |||||||||||||||||||||||
| 2013 | 2012 | 2011 | 2010 | Period from August 31, 2009 through September 30, 2009 | Period from October 1, 2008 through August 30, 2009 | |||||||||||||||||||
| Statement of Operations Data: | ||||||||||||||||||||||||
| Net sales | $ | 4,085.6 | $ | 3,252.4 | $ | 3,186.9 | $ | 2,567.0 | $ | 219.9 | $ | 2,010.6 | ||||||||||||
| Gross profit | 1,390.3 | 1,115.7 | 1,128.9 | 921.4 | 64.4 | 751.8 | ||||||||||||||||||
| Operating income (1) | 351.2 | 301.7 | 227.9 | 168.8 | 0.1 | 156.8 | ||||||||||||||||||
| Interest expense (12) | 375.6 | 191.9 | 208.3 | 277.0 | 17.0 | 172.9 | ||||||||||||||||||
| Other expense (income), net | 3.5 | 0.9 | 2.5 | 12.3 | (0.8 | ) | 3.3 | |||||||||||||||||
| Reorganization items expense (income), net | — | — | — | 3.6 | 4.0 | (1,142.8 | ) | |||||||||||||||||
| Income (loss) from continuing operations before income taxes | (28.0 | ) | 109.0 | 17.1 | (124.2 | ) | (20.0 | ) | 1,123.4 | |||||||||||||||
| Income tax expense | 27.4 | 60.4 | 92.3 | 63.2 | 51.2 | 22.6 | ||||||||||||||||||
| (Loss) income from discontinued operations, net of tax(2) | — | — | — | (2.7 | ) | 0.4 | (86.8 | ) | ||||||||||||||||
| Net income (loss)(3)(4)(5)(6)(7) | (55.3 | ) | 48.6 | (75.2 | ) | (190.1 | ) | (70.8 | ) | 1,013.9 | ||||||||||||||
| Less: Net income (loss) attributable to noncontrolling interest | (0.1 | ) | — | — | — | — | — | |||||||||||||||||
| Net income (loss) attributable to controlling interest | (55.2 | ) | 48.6 | (75.2 | ) | (190.1 | ) | (70.8 | ) | 1,013.9 | ||||||||||||||
| Restructuring and related charges—cost of goods sold(8) | 10.0 | 9.8 | 7.8 | 7.2 | 0.2 | 13.2 | ||||||||||||||||||
| Restructuring and related charges—operating expenses(8) | 24.0 | 9.7 | 20.8 | 17.0 | 1.6 | 30.9 | ||||||||||||||||||
| Per Share Data: | ||||||||||||||||||||||||
| Net (loss) income per common share | ||||||||||||||||||||||||
| Basic | $ | (1.06 | ) | $ | 0.94 | $ | (1.47 | ) | $ | (5.28 | ) | $ | (2.36 | ) | $ | 19.76 | ||||||||
| Diluted | (1.06 | ) | 0.91 | (1.47 | ) | (5.28 | ) | (2.36 | ) | 19.76 | ||||||||||||||
| Average shares outstanding | ||||||||||||||||||||||||
| Basic | 52.0 | 51.6 | 51.1 | 36.0 | 30.0 | 51.3 | ||||||||||||||||||
| Diluted (9) | 52.0 | 53.3 | 51.1 | 36.0 | 30.0 | 51.3 | ||||||||||||||||||
| Cash Flow and Related Data: | ||||||||||||||||||||||||
| Net cash provided by operating activities | $ | 256.5 | $ | 254.8 | $ | 227.4 | $ | 57.3 | $ | 75.0 | $ | 1.6 | ||||||||||||
| Capital expenditures(10) | 82.0 | 46.8 | 36.2 | 40.3 | 2.7 | 8.1 | ||||||||||||||||||
| Depreciation and amortization (excluding amortization of debt issuance costs)(10) | 183.8 | 133.8 | 135.1 | 117.4 | 8.6 | 58.5 | ||||||||||||||||||
| Statement of Financial Position Data (at period end): | ||||||||||||||||||||||||
| Cash and cash equivalents | $ | 207.3 | $ | 158.0 | $ | 142.4 | $ | 170.6 | $ | 97.8 | ||||||||||||||
| Working capital(11) | 530.5 | 450.8 | 441.4 | 536.9 | 323.7 | |||||||||||||||||||
| Total assets | 5,626.7 | 3,751.6 | 3,626.7 | 3,873.7 | 3,020.7 | |||||||||||||||||||
| Total long-term debt, net of current maturities | 3,115.9 | 1,652.9 | 1,535.5 | 1,723.1 | 1,530.0 | |||||||||||||||||||
| Total debt | 3,218.9 | 1,669.3 | 1,551.6 | 1,743.8 | 1,583.5 | |||||||||||||||||||
| Total shareholders’ equity | 940.1 | 989.1 | 1,018.5 | 1,046.4 | 660.9 | |||||||||||||||||||
(1) | For the |
(2) | For the year ended September 30, 2015, the operating results include the Armored AutoGroup operations since the acquisition date of May 21, 2015; Salix operations since the acquisition date of January 16, 2015; European IAMS and Eukanuba operations since the acquisition date of December 31, 2014; and Tell operations since the acquisition date of October 1, 2014. Interest expense of $58.8 million was incurred related to the financing of the acquisition of AAG and the refinancing of the then-existing senior credit facility and asset based revolving loan facility. Income tax expense includes a non-cash benefit of $20.2 million from a decrease in the valuation allowance against net deferred tax assets, and a $22.8 million benefit due to the reversal of valuation allowance in conjunction with the acquisition of the AAG business. |
(3) | For the year ended September 30, 2014, the operating results include the Liquid Fence operations since the acquisition date of January 2, 2014. Interest expense includes a non-cash charge of $9.2 million as a result of the write-off of unamortized debt issuance costs and unamortized discounts in connection with the amendment of the Company's then existing term loans. Income tax expense includes a non-cash benefit of approximately |
(4) | For the year ended September 30, 2013, the operating results include the HHI Business operations since the acquisition date of December 17, 2012, and the |
(5) | For the year ended September 30, 2012, |
40 |
the write-off of unamortized debt issuance costs and unamortized premiums in connection with the extinguishment and refinancing of the Company’s 12% Notes. |
(6) | Working capital is defined as current assets less current liabilities per the consolidated statements of financial position. |
(7) | During the year ended September 30, 2016, the Company retrospectively adopted ASU No. 2015-17, Income Taxes (Topic 740) – Balance Sheet Classification of Deferred Taxes, resulting in a reclassification of current deferred tax assets of $44.7 million, $36.7 million, $33.0 million and $28.1 million for the years ended September 30, 2015, 2014, 2013 and 2012, respectively; and current deferred tax liabilities of $4.6 million and $2.8 million for the years ended September 30, 2015 and 2014, respectively. The adoption of the |
(8) | During the year ended September 30, 2016, the Company retrospectively adopted ASU No. 2015-03, Interest-Imputation of Interest (Subtopic 835-30): Simplifying the Presentation of Debt |
SB/RH Holdings, LLC
Omitted pursuant to General instruction I of Form 10-K.
ITEM 7.MANAGEMENT’S DISCUSSION AND ANALYSIS OF FINANCIAL CONDITION AND RESULTS OF OPERATIONS
The following is management’s discussion of the financial results, liquidity and other key items related to our performance and should be read in conjunction with Item 6. Selected Financial Data and our Consolidated Financial Statements and related notes included elsewhere in this Annual Report on Form 10-K. Certain prior year amounts have been reclassified to conform to the current year presentation. All references to Fiscal 2013, Fiscal 2012 and Fiscal 2011 refer to fiscal year periods ended September 30, 2013, 2012 and 2011, respectively.
Business Overview
Refer to Item 1 “Business” included elsewhere within this Annual Report for an overview of our business.
Acquisitions
The application of acquisition accounting as a result of business combinations can significantly affect certain assets, liabilities and expenses. During the residential hardwareyears ended September 30, 2015 and home improvement business (the “HHI Business”) from Stanley Black & Decker, Inc. (“Stanley Black & Decker”), which includes (i)2014, the equity interestsCompany has completed a number of certain subsidiaries of Stanley Black & Decker engagedacquisitions as outlined below. There were no acquisitions during the year ended September 30, 2016. See Note 3, “Acquisitions” in the business and (ii) certain assets of Stanley Black & Decker used or heldNotes to the Consolidated Financial Statements, included elsewhere within this Annual Report, for use in connection withfurther additional detail regarding acquisition activity.
Armored AutoGroup - On May 21, 2015, the business (the “Hardware Acquisition”). On April 8, 2013, weCompany completed the acquisition of certain assetsAAG, a consumer products company consisting primarily of Tong Lung Metal Industry Co. Ltd.Armor All® branded appearance products, STP® branded performance chemicals, and A/C PRO® branded do-it-yourself automotive air conditioner recharge products. The results of AAG’s operations are included in the Company’s Consolidated Statements of Income, since May 21, 2015 and reported as a separate segment, GAC.
Salix - On January 16, 2015, the Company completed the acquisition of Salix, a vertically integrated producer and distributor of natural rawhide dog chews, treats and snacks. The results of Salix’s operations are included in the Company’s Consolidated Statements of Income, and as part of the PET segment, since January 16, 2015.
European IAMS and Eukanuba - On December 31, 2014, the Company completed the acquisition of Procter & Gamble’s European IAMS and Eukanuba pet food business (“European IAMS and Eukanuba”), including its brands for dogs and cats. The results of the European IAMS and Eukanuba’s operations are included in the Company’s Consolidated Statements of Income, and as part of the PET segment, since December 31, 2014.
Tell Manufacturing - On October 1, 2014, the Company completed the acquisition of Tell Manufacturing, Inc. (“Tell”), a Taiwan Corporation ("TLM Taiwan”), which is involvedmanufacturer and distributor of commercial doors, locks and hardware. The results of Tell’s operations are included in the productionCompany’s Consolidated Statements of residential locksets. For information pertaining to the Hardware Acquisition, see Note 15, “Acquisitions” of Notes to Consolidated Financial Statements, included in this Annual Report on Form 10-K.
Liquid Fence - On January 2, 2014, the Company completed the acquisition of the Liquid Fence Company (“Liquid Fence”), a producer of animal repellents. The results of Liquid Fence’s operations are a leading U.S. provider of residential locksets and builders' hardware and a leading provider of faucets. The HHI Business has a broad portfolio of recognized brand names, including Kwikset, Weiser, Baldwin, National Hardware, Stanley, FANAL and Pfister, as well as patented technologies such as Smartkey, a rekeyable lockset technology, and Smart Code Home Connect. HHI Business customers include retailers, non-retailers and homebuilders. The HHI Business has sales offices, manufacturing facilities and distribution centersincluded in the U.S., Canada, MexicoCompany’s Consolidated Statements of Income, and Asia.
H&G segment, since January 2, 2014.
41
Restructuring Activity
We continually seek to improve our operational efficiency, match our manufacturing capacity and product costs to market demand and better utilize our manufacturing resources. We have undertaken various initiatives to reduce manufacturing and operating costs.
Fiscal 2013GAC Business Rationalization Initiatives – . ToDuring the third quarter of the fiscal year ended September 30, 2016, the Company implemented a series of initiatives through the GAC segment to consolidate certain operations and reduce operating costs. These initiatives included headcount reductions and the exit of certain facilities. Total costs associated with these initiatives are expected to be approximately $20 million and are anticipated to be incurred through September 30, 2017, of which $5.3 million has been incurred to date.
HHI Business Rationalization Initiatives - During the fourth quarter of the fiscal year ended September 30, 2014, the Company implemented a series of initiatives throughout the HHI business segment to reduce operating costs and exit low margin business outside of the U.S. These initiatives included headcount reductions, the exit of certain facilities and the sale of a portion of the global HHI operations. Costs associated with these initiatives of $16.6 million were incurred to date and completed as of September 30, 2016.
Global Expense Rationalization Initiatives - During the third quarter of the year ended September 30, 2013, the Company which consistimplemented a series of initiatives to reduce operating costs. These initiatives consisted of headcount reductions in the Global Batteries & Appliances segmentGBA and CorporatePET segments and in Corporate. Costs associated with these initiatives of $47.0 million were incurred to date and completed as of September 30, 2016.
Other Restructuring Activities – The Company is entering or may enter into small, less significant initiatives and restructuring activities to reduce costs and improve margins throughout the organization. Individually these activities are not substantial, and occur over a shorter time period (less than 12 months). Total costs associated with these initiatives are expected to be approximately $6 million, of which $2.9 million has been incurred to date.
Refinancing Activity
The following recent financing activity has a significant impact on the comparability of financial results on the condensed consolidated financial statements. See Note 10, “Debt” in the Notes to the Consolidated Financial Statements, included elsewhere within this Annual Report, for additional detail regarding debt.
During the year ended September 30, 2016, we refinanced a portion of our debt to extend maturities and reduce borrowing costs. On September 20, 2016, we issued €425 million aggregate principal amount of 4.00% unsecured notes due 2026 (the “Global Expense Rationalization Initiatives”“4.00% Notes”).
During the year ended September 30, 2015, we refinanced a portion of our segmentsdebt to improve liquidity, extend maturities and to exit certain facilities in the U.S. related to the Global Pet Supplies segment, we implemented a number of cost reduction initiatives (the “Global Cost Reduction Initiatives”). These initiatives also included consultation, legal and accounting fees related to the evaluation of our capital structure.
Fiscal Year Ended September 30, | |||||||||
| Fiscal Quarter Ended | 2013 | 2012 | 2011 | ||||||
| December | 21 | % | 26 | % | 27 | % | |||
| March | 24 | % | 23 | % | 22 | % | |||
| June | 27 | % | 25 | % | 25 | % | |||
| September | 28 | % | 26 | % | 26 | % | |||
| Net Sales | |||
| Fiscal 2012 Net Sales | $ | 3,252 | |
| Addition of hardware and home improvement products | 870 | ||
| Increase in pet supplies | 12 | ||
| Increase in electric personal care products | 5 | ||
| Increase in home and garden control products | 3 | ||
| Decrease in electric shaving and grooming products | (1 | ) | |
| Decrease in consumer batteries | (9 | ) | |
| Decrease in small appliances | (27 | ) | |
| Foreign currency impact, net | (19 | ) | |
| Fiscal 2013 Net Sales | $ | 4,086 | |
| Fiscal Year | ||||||||
| 2013 | 2012 | |||||||
| Product line net sales | ||||||||
| Consumer batteries | $ | 932 | $ | 949 | ||||
| Hardware and home improvement products | 870 | — | ||||||
| Small appliances | 740 | 772 | ||||||
| Pet supplies | 622 | 615 | ||||||
| Home and garden control products | 390 | 387 | ||||||
| Electric shaving and grooming products | 277 | 279 | ||||||
| Electric personal care products | 255 | 250 | ||||||
| Total net sales to external customers | $ | 4,086 | $ | 3,252 | ||||
During the year ended September 30, 2014, the Company amended its then-existing senior term credit facility, issuing two tranches maturing September 4, 2019 which offset improvementsprovide for borrowings in the principal amounts of $215.0 million and €225.0 million. The proceeds from the amendment were used to refinance a portion of the then-existing senior term credit facility which was scheduled to mature December 17, 2019, in an amount outstanding of $513.3 million prior to refinancing. The $215.0 million U.S. dollar denominated portion was combined with the then-existing Tranche C maturing September 4, 2019. These loans were refinanced during the year ended September 30, 2015 as described above.
42
Consolidated Results of Operations
The following is summarized consolidated results of operations for SBH for the years ended September 30, 2016, 2015 and 2014 respectively:
|
|
|
|
|
|
|
|
|
|
|
|
|
|
|
|
|
|
|
|
|
|
|
(in millions, except %) |
| 2016 |
| 2015 |
| Variance |
| 2015 |
| 2014 |
| Variance | ||||||||||
Net sales |
| $ | 5,039.7 |
| $ | 4,690.4 |
| $ | 349.3 |
| 7.4% |
| $ | 4,690.4 |
| $ | 4,429.1 |
| $ | 261.3 |
| 5.9% |
Gross Profit |
|
| 1,919.9 |
|
| 1,670.3 |
|
| 249.6 |
| 14.9% |
|
| 1,670.3 |
|
| 1,568.9 |
|
| 101.4 |
| 6.5% |
Operating expenses |
|
| 1,263.7 |
|
| 1,196.2 |
|
| 67.5 |
| 5.6% |
|
| 1,196.2 |
|
| 1,087.0 |
|
| 109.2 |
| 10.0% |
Interest expense |
|
| 250.0 |
|
| 271.9 |
|
| (21.9) |
| (8.1%) |
|
| 271.9 |
|
| 202.1 |
|
| 69.8 |
| 34.5% |
Income tax expense |
|
| 40.0 |
|
| 43.9 |
|
| (3.9) |
| (8.9%) |
|
| 43.9 |
|
| 59.0 |
|
| (15.1) |
| (25.6%) |
Net income |
|
| 357.6 |
|
| 149.4 |
|
| 208.2 |
| 139.4% |
|
| 149.4 |
|
| 214.5 |
|
| (65.1) |
| (30.3%) |
Net Sales. Net sales for the year ended September 30, 2016 increased $349.3 million, or 7.4%, compared to the year ended September 30, 2015. Organic net sales for the year ended September 30, 2016 increased $123.7 million, or 2.6%, compared to the year ended September 30, 2015. Net sales for the year ended September 30, 2015 increased $261.3 million, or 5.9%, compared to the year ended September 30, 2014. Organic net sales for the year ended September 30, 2015 increased $91.1 million, or 2.1%, compared to the year ended September 30, 2014. Organic net sales excludes the impact of foreign currency translation and acquisitions, and is considered a non-GAAP measurement. See “Non-GAAP Measurements” section included elsewhere in this Annual Report for a reconciliation of Net Sales to organic net sales. The following sets forth net sales by segment for the years ended September 30, 2016, 2015 and 2014:
|
|
|
|
|
|
|
|
|
|
|
|
|
|
|
|
|
|
|
|
|
|
|
(in millions, except %) |
| 2016 |
| 2015 |
| Variance |
| 2015 |
| 2014 |
| Variance | ||||||||||
Consumer batteries |
| $ | 840.7 |
| $ | 829.5 |
| $ | 11.2 |
| 1.4% |
| $ | 829.5 |
| $ | 957.8 |
| $ | (128.3) |
| (13.4%) |
Small appliances |
|
| 656.0 |
|
| 734.6 |
|
| (78.6) |
| (10.7%) |
|
| 734.6 |
|
| 730.8 |
|
| 3.8 |
| 0.5% |
Personal care |
|
| 513.6 |
|
| 528.1 |
|
| (14.5) |
| (2.7%) |
|
| 528.1 |
|
| 542.1 |
|
| (14.0) |
| (2.6%) |
Global Batteries & Appliances |
|
| 2,010.3 |
|
| 2,092.2 |
|
| (81.9) |
| (3.9%) |
|
| 2,092.2 |
|
| 2,230.7 |
|
| (138.5) |
| (6.2%) |
Hardware & Home Improvement |
|
| 1,241.0 |
|
| 1,205.5 |
|
| 35.5 |
| 2.9% |
|
| 1,205.5 |
|
| 1,166.0 |
|
| 39.5 |
| 3.4% |
Global Pet Supplies |
|
| 825.7 |
|
| 758.2 |
|
| 67.5 |
| 8.9% |
|
| 758.2 |
|
| 600.5 |
|
| 157.7 |
| 26.3% |
Home & Garden |
|
| 509.0 |
|
| 474.0 |
|
| 35.0 |
| 7.4% |
|
| 474.0 |
|
| 431.9 |
|
| 42.1 |
| 9.7% |
Global Auto Care |
|
| 453.7 |
|
| 160.5 |
|
| 293.2 |
| 182.7% |
|
| 160.5 |
|
| — |
|
| 160.5 |
| — |
Net Sales |
| $ | 5,039.7 |
| $ | 4,690.4 |
|
| 349.3 |
| 7.4% |
| $ | 4,690.4 |
| $ | 4,429.1 |
|
| 261.3 |
| 5.9% |
The following sets forth the principal components of change in net sales from the year ended September 30, 2016 to the year ended September 30, 2015, and from the year ended September 30, 2015 to the year ended September 30, 2014:
|
|
|
|
|
|
|
(in millions) |
| 2016 |
| 2015 | ||
Net Sales for the years ended September 30, 2015 and 2014, respectively |
| $ | 4,690.4 |
| $ | 4,429.1 |
Acquisition of AAG |
|
| 277.3 |
|
| 160.5 |
Acquisition of European IAMS and Eukanuba |
|
| 44.2 |
|
| 128.7 |
Acquisition of Salix |
|
| 30.3 |
|
| 71.4 |
Acquisition of Tell |
|
| — |
|
| 39.4 |
Increase (decrease) in consumer batteries |
|
| 51.2 |
|
| (42.8) |
Increase in personal care |
|
| 12.9 |
|
| 35.5 |
(Decrease) increase in small appliances |
|
| (43.5) |
|
| 51.3 |
Increase in hardware & home improvement |
|
| 50.2 |
|
| 20.7 |
Increase (decrease) in global pet supplies |
|
| 1.2 |
|
| (15.8) |
Increase in home & garden |
|
| 35.1 |
|
| 42.2 |
Increase in global auto care |
|
| 16.6 |
|
| — |
Foreign currency impact, net |
|
| (126.2) |
|
| (229.8) |
Net Sales for the years ended September 30, 2016 and 2015, respectively |
| $ | 5,039.7 |
| $ | 4,690.4 |
Gross Profit. Gross profit for the year ended September 30, 2016 increased $249.6 million compared to the year ended September 30, 2015 primarily attributable to the increase in net sales and increase in gross profit resultingmargin. Gross profit margin increased from 35.6% to 38.1% contributed to by the exitAAG acquisition, and a shift towards higher margin product sales and continuing cost improvements across segments. Gross profit for the year ended September 30, 2015 increased $101.4 million compared to the year ended September 30, 2014 attributable to our increase in net sales. Gross profit margin increased from 35.4% to 35.6% primarily attributable to a shift towards higher margin product sales and cost improvement initiatives.
43
Operating Expenses. Operating expenses for Fiscal 2013 totaled $1,039the year ended September 30, 2016 increased $67.5 million or 5.6% compared to $814 million for Fiscal 2012. The $225 million increase in operating expenses during Fiscal 2013 isthe year ended September 30, 2015 primarily attributable to the acquisition of the HHI Business which accounted for $190 million in operating expenses and led to a $17 millionan increase in Acquisitionselling and general and administrative expenses of $89.4 million due to increased net sales, prior year acquisitions and increased share based compensation of $16.8 million; offset by decreased acquisition & integration related charges. Furthermore, we incurred a $14charges of $22.1 million increase in Restructuringand decreased restructuring and related charges of $11.9 million. Operating expenses for the year ended September 30, 2015 increased $109.2 million or 10.0% primarily attributable to an increase of $59.7 million in selling and general and administrative expenses as a result of acquisition activity and increased net sales, increased acquisition and integration costs of $38.7 million and increased restructuring and related charges of $7.4 million for new and continuing restructuring initiatives.
See Note 3 to the Consolidated Financial Statements, “Acquisitions”, included elsewhere within this Annual Report, for additional detail on acquisition and integration costs. See Note 4 to the Consolidated Financial Statements, “Restructuring and Related Charges”, included elsewhere within this Annual Report, for additional detail on restructuring activity and related costs.
Interest Expense. Interest expense for the year ended September 30, 2016 decreased $21.9 million or 8.1% from the year ended September 30, 2015, attributable to the refinancing activity during the year ended September 30, 2015 previously discussed, coupled with payments on Term Loans; partially offset by $21.4 million of non-recurring costs due to refinancing activity during the year ended September 30, 2016, including (i) $15.6 million tendedr premium upon the repayment of 6.375% senior unsecured notes; and (iii) $5.8 million non-cash expense for the write-off of debt issuance costs associated with the repayment of 6.375% senior unsecured notes. Interest expense for the year ended September 30, 2015 increased $69.8 million or 34.5% from the year ended September 30, 2014, attributable to refinancing activity previously discussed, resulting in $58.8 million of non-recurring costs, including (i) $14.1 million for bridge financing commitments associated with the AAG acquisition, (ii) $4.5 million interest on assumed AAG senior notes from the date of the acquisition through payoff in June 2015, (iii) $16.9 million call premium upon the repayment of 6.75% senior unsecured notes; (iv) $4.1 million non-cash expense for the write-off of debt issuance costs associated with the repayment of 6.75% senior unsecured notes; (v) $10.4 million in fees associated with refinancing the then-existing senior term credit facility; and (vi) $8.8 million non-cash expense for the write-off of unamortized deferred financing fees and discounts on the then-existing senior credit facility and ABL revolving loan facility. See Note 10 to the Condensed Consolidated Financial Statements, “Debt”, included elsewhere within this Annual Report, for additional information regarding our outstanding debt.
Income Taxes. Our effective tax rate was 10.1% for the year ended September 30, 2016 compared to 22.7% for the year ended September 30, 2015. Our estimated annual effective tax rate applied to these periods differs from the U.S. federal statutory rate of 35% primarily due to the release of valuation allowances on U.S. net operating losses deferred tax assets and income earned outside the U.S. that is subject to statutory rates lower than 35% offsetting tax expense on U.S. pretax income. Our effective tax rate for the year ended September 30, 2016 includes a $25.5 million expense to record a tax contingency reserve for a tax exposure in Germany. During the year, a local court ruled against our characterization of certain assets as amortizable under Germany tax law. We have appealed this ruling to the German Federal Court. While we continue to believe that our tax treatment was correct under the applicable German law, we have concluded that sufficient uncertainty on the ruling from the German Federal Court exists to record a full tax contingency for this exposure. Also included are $25.1 million of tax benefits, resulting from the adoption of ASU 2016-09. See Note 2 to the Condensed Consolidated Financial Statements, “Significant Accounting Policies and Practices”, included elsewhere in this Annual Report, for additional discussion and detail over the adoption of ASU 2016-09. In December 2015, the Company received a ruling from the Internal Revenue Service which resulted in $87.8 million of U.S. net operating losses being restored. The ruling created additional U.S. deferred tax assets and valuation allowance.
The Company released $111.1 million of domestic valuation allowance during the year ended September 30, 2016. Approximately $25.1 million of the domestic valuation allowance release results from additional deferred tax assets created by the adoption of ASU No. 2016-09, effective as of October 1, 2015. In December 2015, the Company received a ruling from the Internal Revenue Service (“IRS”) which resulted in $87.8 million of U.S. net operating losses being restored and a release of $16.2 million of domestic valuation allowance from additional deferred tax assets created by the IRS ruling. The Company recorded tax expense of $3.1 million rlated to additional foreign valuation allowance during the year ended September 30, 2016.
Our effective tax rate was 22.7% for the year ended September 30, 2015 compared to 21.6% for the year ended September 30, 2014. Our estimated annual effective tax rate applied to these periods differs from the U.S. federal statutory rate of 35% primarily due to income earned outside the U.S. that is subject to statutory rates lower than 35% and the release of valuation allowances on U.S. net operating losses deferred tax assets offsetting tax expense on U.S. pretax income. During the year ended September 30, 2015, we also recorded U.S. deferred income tax expense related to the Global Expense Rationalization initiatives announcedchange in Fiscal 2013 andbook versus tax basis of indefinite-lived intangibles, which are amortized for tax purposes but not for book purposes. Additionally for the year ended September 30, 2015, we recorded a $15tax benefit of $22.8 million increasefor the reversal of a portion of the U.S. valuation allowance on deferred tax assets as a result of the AAG acquisition. For the year ended September 30, 2015, the Company also recognized $23.3 million of deferred tax assets related to its investment in stock compensation expense. These increases were tempered by $7 millionone of its foreign subsidiaries, because that timing difference was expected to reverse in savings across all segments from our cost reduction initiatives and positive foreign exchange impacts of $4 million.
See Note 2, "Significant Accounting Policies—Acquisition and Integration Related Charges",14, “Income Taxes,” of Notes to Consolidated Financial Statements included elsewhere in this Annual Report on Form 10-K for additional information regarding our Acquisition and integration charges.income taxes.
44
Segment Financial Statements included in this Annual Report on Form 10-K for additional information regarding our Restructuring and related charges.
Global Batteries & Appliances; (ii) Global Pet Supplies; (iii) our HomeAppliances (GBA)
|
|
|
|
|
|
|
|
|
|
|
|
|
|
|
|
|
|
|
|
|
|
|
(in millions, except %) |
| 2016 |
| 2015 |
| Variance |
| 2015 |
| 2014 |
| Variance | ||||||||||
Net Sales |
| $ | 2,010.3 |
| $ | 2,092.2 |
| $ | (81.9) |
| (3.9%) |
| $ | 2,092.2 |
| $ | 2,230.7 |
| $ | (138.5) |
| (6.2%) |
Adjusted EBITDA |
|
| 311.4 |
|
| 306.9 |
|
| 4.5 |
| 1.5% |
|
| 306.9 |
|
| 326.6 |
|
| (19.7) |
| (6.0%) |
Adjusted EBITDA Margin |
|
| 15.5% |
|
| 14.7% |
|
| 80 | bps |
|
|
| 14.7% |
|
| 14.6% |
|
| 10 | bps |
|
Net sales decreased $81.9 million, or 3.9%, during the year ended September 30, 2016 compared to the year ended September 30, 2015. Organic net sales increased $20.6 million, or 1.0%. Net sales decreased $138.5 million, or 6.2%, during the year ended September 30, 2015 compared to the year ended September 30, 2014. Organic net sales increased $44.0 million, or 2.0%.
Consumer battery organic net sales increased $51.2 million, or 6.2%, for the year ended September 30, 2016 compared to the year ended September 30, 2015; primarily attributable to increases in North America of $6.9 million due to an increase in alkaline battery volumes from branded and Garden Business;private label product, increases in Europe of $33.8 million primarily from an increase in alkaline battery sales of $17.5 million driven by promotional sales volumes, increased e-commerce and (iv) new private label customers; an increase in hearing aid and specialty batteries of $14.9 million from increased hearing aid battery volumes with new and existing customers coupled with increases in portable power sales; and increases in Latin America of $9.7 million primarily from hearing aid and specialty batteries. Consumer battery organic net sales decreased $42.8 million, or 4.5%, for the year ended September 30, 2015 compared to the year ended September 30, 2014; primarily attributable to decreases in North America sales of $75.8 million due to lower alkaline batteries sales of $54.6 million from continued competitor discounting coupled with a retail customer bankruptcy, and a decrease in specialty batteries and lights from distribution loss to a competitor at a major retailer and timing of holiday sales; partially offset by an increase in Europe sales of $29.4 million from increased alkaline batteries sales of $24.4 million from increased volumes with new and existing retailers and private label customers, increased volumes in specialty and hearing aid batteries, plus increased lights from new products and promotional activity.
Small appliances organic net sales decreased $43.5 million, or 5.9%, for the year ended September 30, 2016 compared to the year ended September 30, 2015; primarily attributable to decreases of organic net sales in North America of $43.8 million due to softer point of sale within the category, reduction in retail inventory, shifting of holiday sales, and competitive pricing. Small appliances organic net sales increased $51.3 million, or 7.0% for the year ended September 30, 2015 compared to the year ended September 30, 2014; driven by increased sales in North America of $25.1 million attributable to the success of new product launches; increase in Europe sales of $24.9 million from promotional activity; and Latin America sales of $2.0 million from new product introductions and volume increases in certain product lines.
Personal care organic net sales increased $12.9 million, or 2.4%, for the year ended September 30, 2016 compared to the year ended September 30, 2015; primarily attributable to an increase in Europe of $13.0 million and Latin America of $9.5 million from higher volume due to promotional sales and market expansion; offset by decrease in North America of $13.9 million for softer point of sales in the category, reduction in retail inventory, shifting of holiday sales and competitive pricing. Personal care organic net sales increased $35.5 million, or 6.5%, for the year ended September 30, 2015 compared to the year ended September 30, 2014; driven by increased sales in North America of $11.6 million as a result of display location changes at a major customer, promotional activity and continued growth in e-commerce; increased Europe sales of $16.6 million due to new product sales and expansion in Eastern European markets; and increased Latin America sales of $5.3 million from growth in Mexico, new customers and effective promotional sales within the region.
Adjusted EBITDA in the year ended September 30, 2016 increased $4.5 million and the Adjusted EBITDA margin improved 80 bps compared to the year ended September 30, 2015. Adjusted EBITDA increased primarily due to the increase in net sales discussed above, cost improvement and better product mix, offset by negative foreign currency impact of $76.5 million. The increase in Adjusted EBITDA margin is due to improved product mix and cost improvements. Adjusted EBITDA in the year ended September 30, 2015 decreased $19.7 million and the Adjusted EBITDA margin improved by 10 bps compared to the year ended September 30, 2014. Adjusted EBITDA decreased primarily due to decreased sales discussed above, which was partially offset by cost improvements and favorable product mix. Adjusted EBITDA margin increased due to cost improvements and product mix. See Non-GAAP Measurements for reconciliation of Net Income to Adjusted EBITDA by segment.
45
Hardware & Home Improvement.Improvement (HHI)
|
|
|
|
|
|
|
|
|
|
|
|
|
|
|
|
|
|
|
|
|
|
|
(in millions, except %) |
| 2016 |
| 2015 |
| Variance |
| 2015 |
| 2014 |
| Variance | ||||||||||
Net Sales |
| $ | 1,241.0 |
| $ | 1,205.5 |
| $ | 35.5 |
| 2.9% |
| $ | 1,205.5 |
| $ | 1,166.0 |
| $ | 39.5 |
| 3.4% |
Adjusted EBITDA |
|
| 241.6 |
|
| 225.5 |
|
| 16.1 |
| 7.1% |
|
| 225.5 |
|
| 210.3 |
|
| 15.2 |
| 7.2% |
Adjusted EBITDA Margin |
|
| 19.5% |
|
| 18.7% |
|
| 80 | bps |
|
|
| 18.7% |
|
| 18.0% |
|
| 70 | bps |
|
Net sales increased $35.5 million, or 2.9%, for the year ended September 30, 2016 compared to the year ended September 30, 2015. Organic net sales increased $50.2 million, or 4.2%, attributable to increases in the security product category of $40.0 million from an increase in point of sale, new product listings with key retail customers, increases in e-commerce volumes, and market growth with non-retail customers, partially offset by a $5.5 million decrease in sales with private label customers due to the transition in production of higher-margin branded product; an increase in plumbing products of $14.7 million from the introduction of new products and promotional volumes with key retail customers; partially offset by a $3.7 million decrease in hardware products driven by a $22.8 million decrease for the expiration of a customer tolling agreement and planned exit of unprofitable businesses, mitigated by volume growth at existing retail and market expansion with non-retail customers in North America. Net sales for the year ended September 30, 2015 increased $39.5 million, or 3.4%, compared to the year ended September 30, 2014. Organic net sales increased $20.7 million, or 1.8%, due to an increase in North America sales as a result of higher domestic security and plumbing sales from retailers due to customer gains and from non-retailers through pricing and market growth, offset by a decrease in sales in APAC of $14.2 million driven by the exit of low margin products and the expiration of a customer tolling agreement.
Adjusted EBITDA in the year ended September 30, 2016 increased $16.1 million while Adjusted EBITDA margin increased by 80 bps from the year ended September, 2015. Adjusted EBITDA increased primarily due to the increase in net sales discussed above and cost improvements. Adjusted EBITDA margin increased due to cost improvements, partially offset by increased investment towards growth in emerging markets for electronics and e-commerce. Adjusted EBITDA in the year ended September 30, 2015 increased $15.2 million while the Adjusted EBITDA margin improved by 70 bps compared to the year ended September 30, 2014. Adjusted EBITDA increased due to the increase in net sales discussed above. Adjusted EBITDA margin increased due to cost improvements.
Global Pet Supplies (PET)
|
|
|
|
|
|
|
|
|
|
|
|
|
|
|
|
|
|
|
|
|
|
|
(in millions, except %) |
| 2016 |
| 2015 |
| Variance |
| 2015 |
| 2014 |
| Variance | ||||||||||
Net Sales |
| $ | 825.7 |
| $ | 758.2 |
| $ | 67.5 |
| 8.9% |
| $ | 758.2 |
| $ | 600.5 |
| $ | 157.7 |
| 26.3% |
Adjusted EBITDA |
|
| 140.1 |
|
| 124.5 |
|
| 15.6 |
| 12.5% |
|
| 124.5 |
|
| 113.2 |
|
| 11.3 |
| 10.0% |
Adjusted EBITDA Margin |
|
| 17.0% |
|
| 16.4% |
|
| 60 | bps |
|
|
| 16.4% |
|
| 18.9% |
|
| (250) | bps |
|
Net sales increased $67.5 million, or 8.9%, for the year ended September 30, 2016 compared to the year ended September 30, 2015. Organic net sales increased $1.2 million, 0.2%, primarily due to increases in aquatic sales of $1.1 million from timing of prior year holiday shipments, partially offset with the exit of lower margin business; while companion animal and pet food sales were consistent to prior year due to increased competition at key retailers, offset by growth with independent pet retailers, timing of promotional activity, and exiting of certain private label business. Net sales increased $157.7 million, or 26.3%, for the year ended September 30, 2015, compared to the year ended September 30, 2014, including $200.1 million of acquisition sales. Organic net sales decreased $15.8 million, or 2.6%, primarily due to decreases in aquatic sales of $12.8 million.
Adjusted EBITDA in the year ended September 30, 2016 increased $15.6 million, while Adjusted EBITDA margin increased by 60 bps compared to the year ended September 30, 2015. Adjusted EBITDA increased primarily due to acquisitions sales previously discussed and cost improvements. Adjusted EBITDA margin increased due to cost improvements and contributing margins from prior year acquisitions. Adjusted EBITDA in the year ended September 30, 2015 increased $11.3 million and the Adjusted EBITDA margin declined by 250 bps from the year ended September 30, 2014. The operating segment profits do not include restructuringincrease in Adjusted EBITDA was due to increase in net sales previously discussed. The decrease in Adjusted EBITDA margin is due to increased product costs due to product mix.
46
Home & Garden (H&G)
|
|
|
|
|
|
|
|
|
|
|
|
|
|
|
|
|
|
|
|
|
|
|
(in millions, except %) |
| 2016 |
| 2015 |
| Variance |
| 2015 |
| 2014 |
| Variance | ||||||||||
Net Sales |
| $ | 509.0 |
| $ | 474.0 |
| $ | 35.0 |
| 7.4% |
| $ | 474.0 |
| $ | 431.9 |
| $ | 42.1 |
| 9.7% |
Adjusted EBITDA |
|
| 138.3 |
|
| 124.5 |
|
| 13.8 |
| 11.1% |
|
| 124.5 |
|
| 101.8 |
|
| 22.7 |
| 22.3% |
Adjusted EBITDA Margin |
|
| 27.2% |
|
| 26.3% |
|
| 90 | bps |
|
|
| 26.3% |
|
| 23.6% |
|
| 270 | bps |
|
Net sales for the year ended September 30, 2016 increased $35.0 million, or 7.4%, compared to the year ended September 30, 2015. The increase is attributable to repellent products growth of $15.7 million due to volume growth with key retailers and related charges,increased demand in response to the Zika virus; an increase in lawn and garden control products of $9.0 million from an extended outdoor season due to warmer weather and early season retail shipments; and an increase in household insect control products of $10.3 million from volume growth with key retailers. Net sales for the year ended September 30, 2015 increased $42.1 million, or 9.7%, compared to the year ended September 30, 2014. The increase is attributable to increases in repellent products of $16.2 million, lawn and garden control products of $13.1 million and household insect control products of $12.8 million. The sales increase for all categories within home and garden was a result of distribution gains, strong point of sale activity driving replenishment orders at existing customer and market share gains on certain brands.
Adjusted EBITDA in the year ended September 30, 2016 increased $13.8 million with an increase in Adjusted EBITDA margin of 90 bps compared to the year ended September 30, 2015. Adjusted EBITDA increased primarily due to the increase in net sales discussed above and cost improvements. The increase in Adjusted EBITDA margin was due to cost improvements. Adjusted EBITDA in the year ended September 30, 2015 increased $22.7 million with an improvement in Adjusted EBITDA margin of 270 bps as compared to the year ended September 30, 2014. The increase in Adjusted EBITDA is primarily due to increases in net sales discussed above and cost improvements. The adjusted EBITDA margin increase is due to improved product mix, and cost improvements.
Global Auto Care (GAC)
|
|
|
|
|
|
|
|
|
|
|
|
|
|
|
|
|
|
|
|
|
|
|
(in millions, except %) |
| 2016 |
| 2015 |
| Variance |
| 2015 |
| 2014 |
| Variance | ||||||||||
Net Sales |
| $ | 453.7 |
| $ | 160.5 |
| $ | 293.2 |
| 182.7% |
| $ | 160.5 |
| $ | — |
| $ | — |
| — |
Adjusted EBITDA |
|
| 153.4 |
|
| 47.3 |
|
| 106.1 |
| 224.3% |
|
| 47.3 |
|
| — |
|
| — |
| — |
Adjusted EBITDA Margin |
|
| 33.8% |
|
| 29.5% |
|
| 430 | bps |
|
|
| 29.5% |
|
| — |
|
| — |
|
|
Net sales for the year ended September 30, 2016 increased $293.2 million, including acquisition sales of $277.3 million, compared to the year ended September 30, 2015. For the period of May 21, 2016 through September 30, 2016, organic net sales increased $16.6 million, or 10.3%, compared to the period of May 21, 2015 through September 30, 2015, primarily driven by increased sales from A/C recharge and integration related charges, interest expense, interest incomerefrigerant products and income tax expense. Corporate expensesthe introduction of private label products with a key customer. Net sales for the year ended September 30, 2015 relate to the acquired AAG business subsequent to the acquisition date of May 21, 2015.
Adjusted EBITDA for the year ended September 30, 2016 increased $106.1 million compared to the year ended September 30, 2015. For the period of May 21, 2016 through September 30, 2016, Adjusted EBITDA increased $10.5 million, or 22%, compared to the period of May 21, 2015 through September 30, 2015, primarily include general and administrativedue to increases in net sales discussed above. Adjusted EBITDA margin increased 430bps due to reduced operating expenses and global long-term incentive compensation plans whichcost improvements from post integration synergies.
Non-GAAP Measurements
While management believes that non-GAAP measurements are evaluated on a consolidated basis and not allocated to our operating segments. All depreciation and amortization included in income from operations is related to operating segments or corporate expense. Costs are allocated to operating segments or corporate expense according to the function of each cost center.
Adjusted EBITDA. Our consolidated and segment reporting.
47
recognized in natureearnings subsequent to an acquisition; (5) non-cash asset impairments or not comparable from period to period. While we believe that Adjusted EBITDAwrite-offs realized; (6) and other adjustments. During the year ended September 30, 2016, other adjustments consisted of costs associated with the onboarding a key executive and the involuntary transfer of inventory. During the year ended September 30, 2015, other consisted of costs associated with the exiting of a key executive, coupled with onboarding a key executive, plus the Company recognized a non-recurring adjustment for the devaluation of cash and cash equivalents denominated in Venezuelan currency. During the year ended September 30, 2014, other consisted of costs associated with the existing of a key executive.
The following is useful supplemental information, such adjusted results are not intended to replace our Generally Accepted Accounting Principles’ (“GAAP”) financial results and should be read in conjunction with those GAAP results.
|
|
|
|
|
|
|
|
|
|
|
|
|
|
|
|
|
|
|
|
|
|
|
|
|
|
|
|
|
|
|
|
|
|
|
|
|
|
|
|
|
|
|
|
SBH (in millions) |
| GBA |
| HHI |
| PET |
| H&G |
| GAC |
| Corporate |
| Consolidated | |||||||
For the Year Ended September 30, 2016 |
|
|
|
|
|
|
|
|
|
|
|
|
|
|
|
|
|
|
|
|
|
Net income (loss) |
| $ | 232.9 |
| $ | 190.6 |
| $ | 84.2 |
| $ | 121.2 |
| $ | 116.6 |
| $ | (387.9) |
| $ | 357.6 |
Income tax expense |
|
| — |
|
| — |
|
| — |
|
| — |
|
| — |
|
| 40.0 |
|
| 40.0 |
Interest expense |
|
| — |
|
| — |
|
| — |
|
| — |
|
| — |
|
| 250.0 |
|
| 250.0 |
Depreciation and amortization |
|
| 72.2 |
|
| 35.4 |
|
| 42.7 |
|
| 15.2 |
|
| 17.5 |
|
| — |
|
| 183.0 |
EBITDA |
|
| 305.1 |
|
| 226.0 |
|
| 126.9 |
|
| 136.4 |
|
| 134.1 |
|
| (97.9) |
|
| 830.6 |
Share based compensation |
|
| — |
|
| — |
|
| — |
|
| — |
|
| — |
|
| 64.4 |
|
| 64.4 |
Acquisition and integration related charges |
|
| 2.6 |
|
| 13.3 |
|
| 5.5 |
|
| 0.5 |
|
| 14.0 |
|
| 0.8 |
|
| 36.7 |
Restructuring and related charges |
|
| 1.2 |
|
| 2.3 |
|
| 6.0 |
|
| 0.4 |
|
| 5.3 |
|
| — |
|
| 15.2 |
Write-off from impairment of intangible assets |
|
| 2.0 |
|
| — |
|
| 1.7 |
|
| 1.0 |
|
| — |
|
| — |
|
| 4.7 |
Other |
|
| 0.5 |
|
| — |
|
| — |
|
| — |
|
| — |
|
| 0.7 |
|
| 1.2 |
Adjusted EBITDA |
| $ | 311.4 |
| $ | 241.6 |
| $ | 140.1 |
| $ | 138.3 |
| $ | 153.4 |
| $ | (32.0) |
| $ | 952.8 |
For the Year Ended September 30, 2015 |
|
|
|
|
|
|
|
|
|
|
|
|
|
| |||||||
Net income (loss) |
| $ | 219.6 |
| $ | 166.5 |
| $ | 60.0 |
| $ | 108.3 |
| $ | 18.2 |
| $ | (423.2) |
| $ | 149.4 |
Income tax expense |
|
| — |
|
| — |
|
| — |
|
| — |
|
| — |
|
| 43.9 |
|
| 43.9 |
Interest expense |
|
| — |
|
| — |
|
| — |
|
| — |
|
| — |
|
| 271.9 |
|
| 271.9 |
Depreciation and amortization |
|
| 71.0 |
|
| 39.4 |
|
| 39.7 |
|
| 13.3 |
|
| 6.6 |
|
| — |
|
| 170.0 |
EBITDA |
|
| 290.6 |
|
| 205.9 |
|
| 99.7 |
|
| 121.6 |
|
| 24.8 |
|
| (107.4) |
|
| 635.2 |
Share based compensation |
|
| — |
|
| — |
|
| — |
|
| — |
|
| — |
|
| 47.6 |
|
| 47.6 |
Acquisition and integration related charges |
|
| 4.6 |
|
| 9.1 |
|
| 13.7 |
|
| 2.3 |
|
| 3.8 |
|
| 25.3 |
|
| 58.8 |
Restructuring and related charges |
|
| 9.2 |
|
| 9.7 |
|
| 8.9 |
|
| 0.6 |
|
| — |
|
| 0.3 |
|
| 28.7 |
Purchase accounting inventory adjustment |
|
| — |
|
| 0.8 |
|
| 2.2 |
|
| — |
|
| 18.7 |
|
| — |
|
| 21.7 |
Venezuela Devaluation |
|
| 2.5 |
|
| — |
|
| — |
|
| — |
|
| — |
|
| — |
|
| 2.5 |
Other |
|
| — |
|
| — |
|
| — |
|
| — |
|
| — |
|
| 6.1 |
|
| 6.1 |
Adjusted EBITDA |
| $ | 306.9 |
| $ | 225.5 |
| $ | 124.5 |
| $ | 124.5 |
| $ | 47.3 |
| $ | (28.1) |
| $ | 800.6 |
For the Year Ended September 30, 2014 |
|
|
|
|
|
|
|
|
|
|
|
|
|
| |||||||
Net income (loss) |
| $ | 234.6 |
| $ | 157.2 |
| $ | 78.7 |
| $ | 88.1 |
| $ | — |
| $ | (344.1) |
| $ | 214.5 |
Income tax expense |
|
| — |
|
| — |
|
| — |
|
| — |
|
| — |
|
| 59.0 |
|
| 59.0 |
Interest expense |
|
| — |
|
| — |
|
| — |
|
| — |
|
| — |
|
| 202.1 |
|
| 202.1 |
Depreciation and amortization |
|
| 73.1 |
|
| 40.4 |
|
| 31.5 |
|
| 12.6 |
|
| — |
|
| — |
|
| 157.6 |
EBITDA |
|
| 307.7 |
|
| 197.6 |
|
| 110.2 |
|
| 100.7 |
|
| — |
|
| (83.0) |
|
| 633.2 |
Share based compensation |
|
| — |
|
| — |
|
| — |
|
| — |
|
| — |
|
| 46.8 |
|
| 46.8 |
Acquisition and integration related charges |
|
| 7.8 |
|
| 4.4 |
|
| — |
|
| 1.1 |
|
| — |
|
| 6.8 |
|
| 20.1 |
Restructuring and related charges |
|
| 11.1 |
|
| 8.3 |
|
| 3.0 |
|
| — |
|
| — |
|
| 0.5 |
|
| 22.9 |
Other |
|
| — |
|
| — |
|
| — |
|
| — |
|
| — |
|
| 1.3 |
|
| 1.3 |
Adjusted EBITDA |
| $ | 326.6 |
| $ | 210.3 |
| $ | 113.2 |
| $ | 101.8 |
| $ | — |
| $ | (27.6) |
| $ | 724.3 |
48
The following is a reconciliation of net income to Adjusted EBITDA for the years ended September 30, 2016, 2015 and 2014 for SB/RH:
|
|
|
|
|
|
|
|
|
|
|
|
|
|
|
|
|
|
|
|
|
|
SB/RH (in millions) |
| GBA |
| HHI |
| PET |
| H&G |
| GAC |
| Corporate |
| Consolidated | |||||||
For the Year Ended September 30, 2016 |
|
|
|
|
|
|
|
|
|
|
|
|
|
|
|
|
|
|
|
|
|
Net income (loss) |
| $ | 232.9 |
| $ | 190.6 |
| $ | 84.2 |
| $ | 121.2 |
| $ | 116.6 |
| $ | (393.2) |
| $ | 352.3 |
Income tax expense |
|
| — |
|
| — |
|
| — |
|
| — |
|
| — |
|
| 51.0 |
|
| 51.0 |
Interest expense |
|
| — |
|
| — |
|
| — |
|
| — |
|
| — |
|
| 250.0 |
|
| 250.0 |
Depreciation and amortization |
|
| 72.2 |
|
| 35.4 |
|
| 42.7 |
|
| 15.2 |
|
| 17.5 |
|
| — |
|
| 183.0 |
EBITDA |
|
| 305.1 |
|
| 226.0 |
|
| 126.9 |
|
| 136.4 |
|
| 134.1 |
|
| (92.2) |
|
| 836.3 |
Share based compensation |
|
| — |
|
| — |
|
| — |
|
| — |
|
| — |
|
| 59.3 |
|
| 59.3 |
Acquisition and integration related charges |
|
| 2.6 |
|
| 13.3 |
|
| 5.5 |
|
| 0.5 |
|
| 14.0 |
|
| 0.8 |
|
| 36.7 |
Restructuring and related charges |
|
| 1.2 |
|
| 2.3 |
|
| 6.0 |
|
| 0.4 |
|
| 5.3 |
|
| — |
|
| 15.2 |
Write-off from impairment of intangible assets |
|
| 2.0 |
|
| — |
|
| 1.7 |
|
| 1.0 |
|
| — |
|
| — |
|
| 4.7 |
Other |
|
| 0.5 |
|
| — |
|
| — |
|
| — |
|
| — |
|
| 0.7 |
|
| 1.2 |
Adjusted EBITDA |
| $ | 311.4 |
| $ | 241.6 |
| $ | 140.1 |
| $ | 138.3 |
| $ | 153.4 |
| $ | (31.4) |
| $ | 953.4 |
For the Year Ended September 30, 2015 |
|
|
|
|
|
|
|
|
|
|
|
|
|
| |||||||
Net income (loss) |
| $ | 219.6 |
| $ | 166.5 |
| $ | 60.0 |
| $ | 108.3 |
| $ | 18.2 |
| $ | (416.8) |
| $ | 155.8 |
Income tax expense |
|
| — |
|
| — |
|
| — |
|
| — |
|
| — |
|
| 43.9 |
|
| 43.9 |
Interest expense |
|
| — |
|
| — |
|
| — |
|
| — |
|
| — |
|
| 271.9 |
|
| 271.9 |
Depreciation and amortization |
|
| 71.0 |
|
| 39.4 |
|
| 39.7 |
|
| 13.3 |
|
| 6.6 |
|
| — |
|
| 170.0 |
EBITDA |
|
| 290.6 |
|
| 205.9 |
|
| 99.7 |
|
| 121.6 |
|
| 24.8 |
|
| (101.0) |
|
| 641.6 |
Share based compensation |
|
| — |
|
| — |
|
| — |
|
| — |
|
| — |
|
| 41.8 |
|
| 41.8 |
Acquisition and integration related charges |
|
| 4.6 |
|
| 9.1 |
|
| 13.7 |
|
| 2.3 |
|
| 3.8 |
|
| 25.3 |
|
| 58.8 |
Restructuring and related charges |
|
| 9.2 |
|
| 9.7 |
|
| 8.9 |
|
| 0.6 |
|
| — |
|
| 0.3 |
|
| 28.7 |
Purchase accounting inventory adjustment |
|
| — |
|
| 0.8 |
|
| 2.2 |
|
| — |
|
| 18.7 |
|
| — |
|
| 21.7 |
Venezuela devaluation |
|
| 2.5 |
|
| — |
|
| — |
|
| — |
|
| — |
|
| — |
|
| 2.5 |
Other |
|
| — |
|
| — |
|
| — |
|
| — |
|
| — |
|
| 6.1 |
|
| 6.1 |
Adjusted EBITDA |
| $ | 306.9 |
| $ | 225.5 |
| $ | 124.5 |
| $ | 124.5 |
| $ | 47.3 |
| $ | (27.5) |
| $ | 801.2 |
For the Year Ended September 30, 2014 |
|
|
|
|
|
|
|
|
|
|
|
|
|
| |||||||
Net income (loss) |
| $ | 234.6 |
| $ | 157.2 |
| $ | 78.7 |
| $ | 88.1 |
|
| — |
| $ | (341.5) |
| $ | 217.1 |
Income tax expense |
|
| — |
|
| — |
|
| — |
|
| — |
|
| — |
|
| 59.0 |
|
| 59.0 |
Interest expense |
|
| — |
|
| — |
|
| — |
|
| — |
|
| — |
|
| 202.1 |
|
| 202.1 |
Depreciation and amortization |
|
| 73.1 |
|
| 40.4 |
|
| 31.5 |
|
| 12.6 |
|
| — |
|
| — |
|
| 157.6 |
EBITDA |
|
| 307.7 |
|
| 197.6 |
|
| 110.2 |
|
| 100.7 |
|
| — |
|
| (80.4) |
|
| 635.8 |
Share based compensation |
|
| — |
|
| — |
|
| — |
|
| — |
|
| — |
|
| 44.9 |
|
| 44.9 |
Acquisition and integration related charges |
|
| 7.8 |
|
| 4.4 |
|
| — |
|
| 1.1 |
|
| — |
|
| 6.8 |
|
| 20.1 |
Restructuring and related charges |
|
| 11.1 |
|
| 8.3 |
|
| 3.0 |
|
| — |
|
| — |
|
| 0.5 |
|
| 22.9 |
Other |
|
| — |
|
| — |
|
| — |
|
| — |
|
| — |
|
| 1.3 |
|
| 1.3 |
Adjusted EBITDA |
| $ | 326.6 |
| $ | 210.3 |
| $ | 113.2 |
| $ | 101.8 |
| $ | — |
| $ | (26.9) |
| $ | 725.0 |
| Fiscal 2013 | Global Batteries & Appliances | Global Pet Supplies | Home and Garden Business | Hardware & Home Improvement | Corporate / Unallocated Items(a) | Consolidated SB Holdings | |||||||||||||||||
| (in millions) | |||||||||||||||||||||||
Net income (loss), as adjusted (a) | $ | 214 | $ | 77 | $ | 78 | $ | 75 | $ | (499 | ) | $ | (55 | ) | |||||||||
Pre-acquisition earnings of HHI (b) | — | — | — | 30 | — | 30 | |||||||||||||||||
| Income tax expense | — | — | — | — | 27 | 27 | |||||||||||||||||
| Interest expense | — | — | — | — | 376 | 376 | |||||||||||||||||
| Acquisition and integration related charges | 6 | 2 | — | 7 | 33 | 48 | |||||||||||||||||
| Restructuring and related charges | 15 | 11 | 1 | 6 | 1 | 34 | |||||||||||||||||
| HHI Business inventory fair value adjustment | — | — | — | 31 | — | 31 | |||||||||||||||||
| Venezuela devaluation | 2 | — | — | — | — | 2 | |||||||||||||||||
| Adjusted EBIT | $ | 237 | $ | 90 | $ | 79 | $ | 149 | $ | (62 | ) | $ | 493 | ||||||||||
Depreciation and amortization (c) | 67 | 30 | 11 | 32 | 44 | 184 | |||||||||||||||||
| Adjusted EBITDA | $ | 304 | $ | 120 | $ | 90 | $ | 181 | $ | (18 | ) | $ | 677 | ||||||||||
| Fiscal 2012 | Global Batteries & Appliances | Global Pet Supplies | Home and Garden Business | Hardware & Home Improvement | Corporate / Unallocated Items(a) | Consolidated SB Holdings | |||||||||||||||||
| (in millions) | |||||||||||||||||||||||
Net income (loss), as adjusted (a) | $ | 221 | $ | 70 | $ | 71 | $ | — | $ | (313 | ) | $ | 49 | ||||||||||
Pre-acquisition earnings of HHI (b) | — | — | — | 183 | — | 183 | |||||||||||||||||
| Income tax expense | — | — | — | — | 60 | 60 | |||||||||||||||||
| Interest expense | — | — | — | — | 192 | 192 | |||||||||||||||||
| Acquisition and integration related charges | 15 | 5 | 2 | — | 9 | 31 | |||||||||||||||||
| Restructuring and related charges | 7 | 10 | 1 | — | 1 | 19 | |||||||||||||||||
| Adjusted EBIT | $ | 243 | $ | 85 | $ | 74 | $ | 183 | $ | (51 | ) | $ | 534 | ||||||||||
Depreciation and amortization (c) | 64 | 28 | 13 | — | 29 | 134 | |||||||||||||||||
| Adjusted EBITDA | $ | 307 | $ | 113 | $ | 87 | $ | 183 | $ | (22 | ) | $ | 668 | ||||||||||
______________________________49
| Fiscal Year | ||||||||
| 2013 | 2012 | |||||||
| Net sales to external customers | $ | 2,204 | $ | 2,250 | ||||
| Segment profit | $ | 238 | $ | 244 | ||||
| Segment profit as a % of net sales | 10.8 | % | 10.9 | % | ||||
| Segment Adjusted EBITDA | $ | 304 | $ | 307 | ||||
| Assets as of September 30 | $ | 2,361 | $ | 2,243 | ||||
SegmentOrganic Net Sales. Our consolidated and segment results contain financial information regarding organic net sales, which we define as net sales excluding the effect of changes in foreign currency exchange rates and impact from acquisitions. We believe this non-GAAP measure provides useful information to investors because it reflects regional and operating segment performance from our activities without the effect of changes in currency exchange rate and/or acquisitions. We use organic net sales as one measure to monitor and evaluate our regional and segment performance. Organic growth is calculated by comparing organic net sales to external customersnet sales in Fiscal 2013 decreased $46 millionthe prior year. The effect of changes in currency exchange rates is determined by translating the period’s net sales using the currency exchange rates that were in effect during the prior comparative period. Net sales are attributed to $2,204 millionthe geographic regions based on the country of destination. We exclude net sales from $2,250 million during Fiscal 2012,acquired businesses in the current year for which there are no comparable sales in the prior period. The following is a 2% decrease, driven by a $27 million decrease in small appliancereconciliation of reported net sales $14 million of negative foreign exchange impacts, a $9 million decrease in global consumer battery sales and a $1 million decrease in electric shaving and grooming sales. These declines were partially offset by an increase of $5 million in electric personal care sales. The decline in small appliance sales was predominately driven by North American sales declines of $45 million, partially offset by European sales gains of $17 million. The decrease in North American sales was driven by management initiatives to exit low margin products, driving an overall increase in profitability as a percentage oforganic net sales for the product category. Gains in European small applianceyear ended September 30, 2016 compared to net sales were driven by increased market share infor the United Kingdom, regional expansion in Eastern and Western Europe and successful new product lines. The declines in global consumer battery sales of $9 million resulted from the non-recurrence of promotions, inventory management at key vendorsyear ended September 30, 2015, and the timingreported net sales to organic net sales for the year ended September 30, 2015 compared to the year ended September 30, 2014 respectively:
|
|
|
|
|
|
|
|
|
|
|
|
|
|
|
|
|
|
|
|
|
|
|
|
|
| September 30, 2016 |
|
|
|
|
|
|
|
| |||||||||||||
|
| Net Sales |
| Effect of Changes in Currency |
| Net Sales Excluding Effect of Changes in Currency |
| Effect of Acquisitions |
| Organic |
|
|
| Variance | |||||||||
Consumer batteries |
| $ | 840.7 |
| $ | 40.0 |
| $ | 880.7 |
| $ | — |
| $ | 880.7 |
| $ | 829.5 |
| $ | 51.2 |
| 6.2% |
Small appliances |
|
| 656.0 |
|
| 35.1 |
|
| 691.1 |
|
| — |
|
| 691.1 |
|
| 734.6 |
|
| (43.5) |
| (5.9%) |
Personal care |
|
| 513.6 |
|
| 27.4 |
|
| 541.0 |
|
| — |
|
| 541.0 |
|
| 528.1 |
|
| 12.9 |
| 2.4% |
Global Batteries & Appliances |
|
| 2,010.3 |
|
| 102.5 |
|
| 2,112.8 |
|
| — |
|
| 2,112.8 |
|
| 2,092.2 |
|
| 20.6 |
| 1.0% |
Hardware & Home Improvement |
|
| 1,241.0 |
|
| 14.7 |
|
| 1,255.7 |
|
| — |
|
| 1,255.7 |
|
| 1,205.5 |
|
| 50.2 |
| 4.2% |
Global Pet Supplies |
|
| 825.7 |
|
| 8.2 |
|
| 833.9 |
|
| (74.5) |
|
| 759.4 |
|
| 758.2 |
|
| 1.2 |
| 0.2% |
Home and Garden |
|
| 509.0 |
|
| 0.1 |
|
| 509.1 |
|
| — |
|
| 509.1 |
|
| 474.0 |
|
| 35.1 |
| 7.4% |
Global Auto Care |
|
| 453.7 |
|
| 0.7 |
|
| 454.4 |
|
| (277.3) |
|
| 177.1 |
|
| 160.5 |
|
| 16.6 |
| 10.3% |
Total |
| $ | 5,039.7 |
| $ | 126.2 |
| $ | 5,165.9 |
| $ | (351.8) |
| $ | 4,814.1 |
| $ | 4,690.4 |
|
| 123.7 |
| 2.6% |
|
|
|
|
|
|
|
|
|
|
|
|
|
|
|
|
|
|
|
|
|
|
|
|
|
| September 30, 2015 |
|
|
|
|
|
|
|
| |||||||||||||
Year Ended |
| Net Sales |
| Effect of Changes in Currency |
| Net Sales Excluding Effect of Changes in Currency |
| Effect of Acquisitions |
| Organic |
| Net Sales |
| Variance | |||||||||
Consumer batteries |
| $ | 829.5 |
| $ | 85.5 |
| $ | 915.0 |
| $ | — |
| $ | 915.0 |
| $ | 957.8 |
| $ | (42.8) |
| (4.5%) |
Small appliances |
|
| 734.6 |
|
| 47.5 |
|
| 782.1 |
|
| — |
|
| 782.1 |
|
| 730.8 |
|
| 51.3 |
| 7.0% |
Personal care |
|
| 528.1 |
|
| 49.5 |
|
| 577.6 |
|
| — |
|
| 577.6 |
|
| 542.1 |
|
| 35.5 |
| 6.5% |
Global Batteries & Appliances |
|
| 2,092.2 |
|
| 182.5 |
|
| 2,274.7 |
|
| — |
|
| 2,274.7 |
|
| 2,230.7 |
|
| 44.0 |
| 2.0% |
Hardware & Home Improvement |
|
| 1,205.5 |
|
| 20.6 |
|
| 1,226.1 |
|
| (39.4) |
|
| 1,186.7 |
|
| 1,166.0 |
|
| 20.7 |
| 1.8% |
Global Pet Supplies |
|
| 758.2 |
|
| 26.6 |
|
| 784.8 |
|
| (200.1) |
|
| 584.7 |
|
| 600.5 |
|
| (15.8) |
| -2.6% |
Home and Garden |
|
| 474.0 |
|
| 0.1 |
|
| 474.1 |
|
| — |
|
| 474.1 |
|
| 431.9 |
|
| 42.2 |
| 9.8% |
Global Auto Care |
|
| 160.5 |
|
| — |
|
| 160.5 |
|
| (160.5) |
|
| — |
|
| — |
|
| — |
| 100.0% |
Total |
| $ | 4,690.4 |
| $ | 229.8 |
| $ | 4,920.2 |
| $ | (400.0) |
| $ | 4,520.2 |
| $ | 4,429.1 |
|
| 91.1 |
| 2.1% |
50
Liquidity and Capital Resources
The following is a summary of the Company’s cash flows for the years ended September 30, 2016, 2015 and 2014:
|
|
|
|
|
|
|
|
|
|
|
|
|
|
|
|
|
|
|
|
| SBH |
| SB/RH | ||||||||||||||
(in millions) |
| 2016 |
| 2015 |
| 2014 |
| 2016 |
| 2015 |
| 2014 | ||||||
Net cash provided by operating activities |
| $ | 615.0 |
| $ | 444.3 |
| $ | 432.7 |
| $ | 601.6 |
| $ | 441.8 |
| $ | 434.7 |
Net cash used by investing activities |
| $ | (98.4) |
| $ | (1,279.7) |
| $ | (93.5) |
| $ | (98.4) |
| $ | (1,279.7) |
| $ | (93.5) |
Net cash (used) provided by financing activities |
| $ | (487.8) |
| $ | 918.4 |
| $ | (343.5) |
| $ | (478.9) |
| $ | 922.6 |
| $ | (338.2) |
Effect of exchange rate changes on cash and cash equivalents |
| $ | (1.4) |
| $ | (29.7) |
| $ | (8.3) |
| $ | (1.4) |
| $ | (29.7) |
| $ | (8.3) |
Spectrum Brands Holdings, Inc.
Net cash provided by new customer listings and expansion into new channels. operating activities
The slight decrease in electric shaving and grooming sales was due to an $11$170.7 million decrease in North American sales, tempered by a $10 million increase in European sales. The decline in North American shaving and grooming product salescash provided by operating activities for the year ended September 30, 2016 was attributable to labor disruptions at U.S. ports(i) incremental cash generated from the segment operations of entry during the peak holiday period, coupled with decreased retail space available$166.7 million due to growth in net sales, acquisitions and cost management initiatives; including cash contributed through working capital primarily from decreases of receivables and inventory through working capital management initiatives; (ii) decrease in cash paid for interest of $12.0 million, excluding a non-recurring tender premium of $15.6 million for the product category at a major customerredemption of 6.375% Note, from decrease in annualized interest costs; and retailer inventory management. Gains(iii) decrease in the electric shaving and grooming product category in Europe were driven by successful new product launches and promotions, market growth, increased distributions and customer gains. Electric personal care product sales increased $5 million in Fiscal 2013 compared to Fiscal 2012, due to an increase of $8 million in Europe driven by innovative new product launches coupled with distribution and customer gains,cash paid for income taxes; which was partially offset by a sales decline(i) increase in cash paid towards restructuring and acquisition and integration related activities of $3$7.1 million towards integration of previously acquired businesses; and (ii) increased payments towards corporate expenditures of $3.9 million for increased compensation costs and investment in Latin America. Latin American sales declines wereshared services.
The $11.6 million increase in cash provided by operating activities for the year ended September 30, 2015, was attributable to the non-recurrence(i) cash generated from segment operations of Fiscal 2012 promotions$45.9 million due to increased net sales, continued cost management initiatives, offset by an incremental use of cash from working capital driven by higher inventory and lower sales to customers who export to Venezuela,other working capital items partially offset by distribution gainslower accounts receivable and higher accounts payable; (ii) decrease in Brazilcash paid for taxes of $26.3 million; and Central America.
Net cash used by investing activities
The $1,181.3 million decrease in sales discussed above. Segment profitability as a percentage of net sales decreased slightly to
| Fiscal Year | ||||||||
| 2013 | 2012 | |||||||
| Net sales to external customers | $ | 622 | $ | 615 | ||||
| Segment profit | $ | 91 | $ | 86 | ||||
| Segment profit as a % of net sales | 14.6 | % | 14.0 | % | ||||
| Segment Adjusted EBITDA | $ | 120 | $ | 113 | ||||
| Assets as of September 30 | $ | 949 | $ | 956 | ||||
| Fiscal Year | ||||||||
| 2013 | 2012 | |||||||
| Net sales to external customers | $ | 390 | $ | 387 | ||||
| Segment profit | $ | 78 | $ | 74 | ||||
| Segment profit as a % of net sales | 20.1 | % | 19.0 | % | ||||
| Segment Adjusted EBITDA | $ | 90 | $ | 87 | ||||
| Assets as of September 30 | $ | 501 | $ | 508 | ||||
| Fiscal Year | ||||
| 2013 | ||||
| Net sales to external customers | $ | 870 | ||
| Segment profit | $ | 89 | ||
| Segment profit as a % of net sales | 10.2 | % | ||
| Segment Adjusted EBITDA | $ | 181 | ||
| Assets as of September 30 | $ | 1,736 | ||
| Net Sales | |||
| Fiscal 2011 Net Sales | $ | 3,187 | |
| Increase in pet supplies | 45 | ||
| Increase in home and garden control products | 33 | ||
| Increase in consumer batteries | 31 | ||
| Increase in electric shaving and grooming products | 12 | ||
| Increase in electric personal care products | 9 | ||
| Increase in small appliances | 8 | ||
| Foreign currency impact, net | (73 | ) | |
| Fiscal 2012 Net Sales | $ | 3,252 | |
| Fiscal Year | ||||||||
| 2012 | 2011 | |||||||
| Product line net sales | ||||||||
| Consumer batteries | $ | 949 | $ | 954 | ||||
| Small appliances | 772 | 778 | ||||||
| Pet supplies | 615 | 579 | ||||||
| Home and garden control products | 387 | 354 | ||||||
| Electric shaving and grooming products | 279 | 274 | ||||||
| Electric personal care products | 250 | 248 | ||||||
| Total net sales to external customers | $ | 3,252 | $ | 3,187 | ||||
| Fiscal 2012 | ||||||||||||||||||||
Global Batteries & Appliances | Global Pet Supplies | Home and Garden Business | Corporate / Unallocated Items(a) | Consolidated SB Holdings | ||||||||||||||||
| (in millions) | ||||||||||||||||||||
| Net income (loss), as adjusted (a) | $ | 221 | $ | 70 | $ | 71 | $ | (313 | ) | $ | 49 | |||||||||
| Income tax expense | — | — | — | 60 | 60 | |||||||||||||||
| Interest expense | — | — | — | 192 | 192 | |||||||||||||||
| Acquisition and integration related charges | 15 | 5 | 2 | 9 | 31 | |||||||||||||||
| Restructuring and related charges | 7 | 10 | 1 | 1 | 19 | |||||||||||||||
| Adjusted EBIT | $ | 243 | $ | 85 | $ | 74 | $ | (51 | ) | $ | 351 | |||||||||
| Depreciation and amortization (d) | 64 | 28 | 13 | 29 | 134 | |||||||||||||||
| Adjusted EBITDA | $ | 307 | $ | 113 | $ | 87 | $ | (22 | ) | $ | 485 | |||||||||
| Fiscal 2011 | ||||||||||||||||||||
Global Batteries & Appliances | Global Pet Supplies | Home and Garden Business | Corporate / Unallocated Items(a) | Consolidated SB Holdings | ||||||||||||||||
| (in millions) | ||||||||||||||||||||
| Net income (loss), as adjusted (a) | $ | 180 | $ | 50 | $ | 62 | $ | (367 | ) | $ | (75 | ) | ||||||||
| Income tax expense | — | — | — | 92 | 92 | |||||||||||||||
| Interest expense | — | — | — | 184 | 184 | |||||||||||||||
| Write-off unamortized discounts and financing fees (b) | — | — | — | 24 | 24 | |||||||||||||||
| Restructuring and related charges | 6 | 17 | 2 | 4 | 29 | |||||||||||||||
| Acquisition and integration related charges | 31 | — | — | 6 | 37 | |||||||||||||||
| Intangible asset impairment | 23 | 8 | 1 | — | 32 | |||||||||||||||
| Accelerated depreciation and amortization (c) | (1 | ) | — | — | — | (1 | ) | |||||||||||||
| Adjusted EBIT | $ | 239 | $ | 75 | $ | 65 | $ | (57 | ) | $ | 322 | |||||||||
| Depreciation and amortization (d) | 68 | 24 | 12 | 31 | 135 | |||||||||||||||
| Adjusted EBITDA | $ | 307 | $ | 99 | $ | 77 | $ | (26 | ) | $ | 457 | |||||||||
| 2012 | 2011 | |||||||
| (in millions) | ||||||||
| Net sales to external customers | $ | 2,250 | $ | 2,254 | ||||
| Segment profit | $ | 244 | $ | 239 | ||||
| Segment profit as a % of net sales | 10.8 | % | 10.6 | % | ||||
| Segment Adjusted EBITDA | $ | 307 | $ | 307 | ||||
| Assets as of September 30, | $ | 2,243 | $ | 2,275 | ||||
| 2012 | 2011 | |||||||
| (in millions) | ||||||||
| Net sales to external customers | $ | 616 | $ | 579 | ||||
| Segment profit | $ | 86 | $ | 75 | ||||
| Segment profit as a % of net sales | 14.0 | % | 13.0 | % | ||||
| Segment Adjusted EBITDA | $ | 113 | $ | 99 | ||||
| Assets as of September 30, | $ | 956 | $ | 828 | ||||
| 2012 | 2011 | |||||||
| (in millions) | ||||||||
| Net sales to external customers | $ | 387 | $ | 354 | ||||
| Segment profit | $ | 74 | $ | 65 | ||||
| Segment profit as a % of net sales | 19.1 | % | 18.4 | % | ||||
| Segment Adjusted EBITDA | $ | 87 | $ | 77 | ||||
| Assets as of September 30, | $ | 508 | $ | 476 | ||||
The release was attributable to $15 million of net deferred tax liabilities recorded on the FURminator opening balance sheet that offset other U.S. net deferred tax assets. During Fiscal 2011, we also determined that a valuation allowance is required against deferred tax assets related to net operating losses in Brazil and thus recorded a $26 million charge.
Net cash (used) provided by financing activities
Net cash used by financing activities of $487.8 million for the year ended September 30, 2016 consist of (i) $485.0 million net proceeds from debt including $477.6 million from the 4.00% Notes and $7.4 million from other debt financing; (ii) $819.5 million of payments on debt, including partial redemption of $390.3 million of 6.375% Notes, payments on term loans of $415.5 million, $4.4 million payment on other debt financing and $9.3 million payments on capital leases; (iv) payment of debt issuance costs of $9.3 million; (v) cash dividends of $87.2 million; (vi) treasury stock purchases of $42.8 million (vii) payment of contingent consideration associated with previous acquisitions of $3.2 million; and (viii) a use of cash to pay share-based tax withholdings of employees for vested stock awards of $10.8 million, net of proceeds upon vesting.
Net cash provided by financing activities of $918.4 million for the year ended September 30, 2015 consist of (i) refinancing of the then-existing senior term facilities resulting in $2,036.5 million proceeds for the issuance of the new Term Loans and $1,589.6 million payment on the then-existing senior term facilities; (ii) $1,000.0 million proceeds from the issuance of the 5.75% Notes (iii) $540.0 million repayment of AAG debt assumed as part of the AAG acquisition (iv) $250.0 million proceeds from the issuance of the 6.125% Notes; (v) $300.0 million repayment of the 6.75% Notes; (vi) $363.6 million of payments on debt (vii) payment of debt issuance costs of $38.1 million; (vi) $562.7 million of proceeds from the issuance of common stock, net issuance costs; (vii) cash dividends of $70.7 million; and (viii) treasury stock purchases of $21.2 million.
51$1,217 million, which
Net cash used by financing activities of $343.5 for the year ended September 30, 2014 consisted of (i) proceeds related to the
SB/RH Holdings, LLC
Net cash acquired, ofprovided by operating activities
The $159.8 million and $7.1 million increases in cash provided by operating activities from SB/RH for the HHI Business,year ended September 30, 2016 and the
Net cash used by investing activities
The $1,181.3 million
Net cash (used) provided by financing activities
Net cash used by financing activities of $478.9 million for the year ended September 30, 2016 consist of (i) $498.9 million net proceeds from debt including $477.6 million from the addition4.00% Notes, $13.9 million from intercompany note with parent and $7.4 million from other debt financing; (ii) $868.1 million of payments on debt, including partial redemption of $390.3 million of 6.375% Notes, payments on term loans of $415.5 million, $48.6 million payment on intercompany note with parent, $4.4 million payment on other debt financing and $9.3 million payments on capital leases; (iv) payment of debt issuance costs of $9.3 million; (v) cash dividends to parent of $97.2 million; and (vi) payment on contingent consideration associated with previous acquisitions of $3.2 million.
Net cash provided by financing activities of $922.6 million for the year ended September 30, 2015 consist of (i) refinancing of the HHI Business.
Net cash used by financing activities of $338.2 million for the year ended September 30, 2014 consist of (i) proceeds related to the issuance of debt under our former senior term loans of $523.7 million; (ii) repayment of $764.9 million under the former senior credit facilities and $6.0 million of other debt; (iii) dividend payments to SBH of $77.0 million; (iv) payment of share-based tax withholdings of employees for vested stock awards of $25.0 million; and (v) payment of debt issuance costs of $5.4 million.
Capital Expenditures
Capital expenditures for the Company totaled $95.2 million, $89.1 million and $73.3 million for the years ended September 30, 2016, 2015, and 2014, respectively. We expect to make investments in capital projects similar to historical levels, as well as incremental investments slightly above historical levels related to acquisitions and in high return cost reduction projects slightly above historical levels.
Depreciation and Amortization
Depreciation and amortization for the Company totaled $183.0 million, $170.0 million and $157.6 million for the years ended September 30, 2016, 2015, and 2014, respectively. The increase in depreciation and amortization for the years ended September 30, 2016 and 2015 is due to the recognition of property, plant and equipment and definite lived intangible assets from the acquisitions of AAG, European IAMS and Eukanuba, and Salix during the fiscal year ended September 30, 2015, as previously discussed.
52
Indebtedness
Refer to a senior credit agreement (the “Senior Credit Agreement”); (ii) 6.75% unsecured notes (the “6.75% Notes”); (iii) 6.375% unsecured notes (the “6.375% Notes”); (iv) 6.625% unsecured notes (the “6.625% Notes”); and (v) a $400 million asset based lending revolving credit facility (the “ABL Facility,” and, together with the Term Loan, (the “Senior Credit Facilities”).
In addition to the outstanding principal payments on our debt obligations, mentioned above, we have annual interest payment obligations of approximately $155$170.1 million in the aggregate. This includes interest under our 6.375%our: (i) 4.00% Notes of approximately $19.1 million; (ii) 6.625% $33Notes of approximately $37.8 million, interest under our 6.625% (iii) 6.125% Notes of approximately $38 million and interest under our 6.75%$15.3 million; (iv) 5.75% Notes of approximately $20$57.5 million and based on principal amounts currently outstanding under these facilities, and using market interest rates and foreign exchange rates in effect at September 30, 2013, this also includes interest under our(iv) Term Loans and ABL Facility of approximately $64 million. Interest on our debt is payable in cash.$40.4 million. Interest on the 6.375%4.00% Notes, the 6.625% Notes and the 6.75% Notes is payable semi-annually in arrears and interest under the Term Loan and the ABLRevolver Facility is payable on various interest payment dates as provided in the Senior Credit Agreement and the ABL Credit Agreement. We are required to pay certain fees in connection with our outstanding debt obligations. Such fees includeobligations including a quarterly commitment fee of up to 0.375%0.50% on the unused portion of the ABLRevolver Facility and certain additional fees with respect to the letter of credit sub-facility under the ABLRevolver Facility.
At September 30, 2016, we were in compliance with all covenants under the Senior Credit Agreement and the indentures governing our senior notes. See “Risk Factors”, for further discussion of the risks associated with our ability to service all of our existing indebtedness and maintain compliance with financial and other covenants related to such indebtedness.
Credit Ratings
The Company’s access to the capital markets and financing costs in those markets may depend on the credit ratings of the Company when it is accessing the capital markets. None of the Company’s current borrowings are subject to default or acceleration as a result of a downgrading of credit ratings, although a downgrade of the Company’s credit ratings could increase fees and interest charges on future borrowings.
Equity Financing Activities
During
During the year ended September 30, 2015, SBH issued 6.2 million shares of common stock in connection with the AAG acquisition, resulting in $562.7 million in proceeds, net of equity issuance costs.
From time to time we may repurchase our outstanding shares of Common StockSBH common stock in the open market or otherwise.
Liquidity Outlook
The Company’s ability to make principal and interest payments on borrowings under its U.S. and foreign credit facilities and its ability to fund planned capital expenditures will depend on its ability to generate cash in the future, which, to a certain extent, is subject to general economic, financial, competitive, regulatory and other conditions. Based on its current level of operations, the Company believes that its existing cash balances and expected cash flows from operations will be sufficient to meet its operating requirements for at least the next 12 months. However, the Company may request borrowings under its credit facilities and seek alternative forms of financing or additional investments to achieve its longer-term strategic plans.
Off-Balance Sheet Arrangements
We do not have any off-balance sheet arrangements that have or are reasonably likely to have a current or future effect on our financial condition, changes in financial condition, revenues or expenses, results of operations, liquidity, capital expenditures or capital resources that are material to investors.
53
Contractual Obligations & Other Commercial Commitments
The following table summarizes our contractual obligations as of
September 30, |
|
|
|
|
|
|
|
|
|
|
|
|
|
|
|
|
| Contractual Payments Due by Period | |||||||||||||
(in millions) |
|
| Total |
|
| Less than 1 year |
|
| 1 to 3 years |
|
| 3 to 5 years |
|
| Thereafter |
Debt, excluding capital lease obligations(1) |
| $ | 3,566.9 |
| $ | 154.0 |
| $ | 26.7 |
| $ | 22.7 |
| $ | 3,363.5 |
Interest payments excluding capital lease obligations(2) |
|
| 1,286.4 |
|
| 175.3 |
|
| 339.4 |
|
| 337.3 |
|
| 434.4 |
Capital lease obligations(3) |
|
| 162.7 |
|
| 16.4 |
|
| 29.4 |
|
| 27.7 |
|
| 89.2 |
Operating lease obligations(4) |
|
| 147.1 |
|
| 42.3 |
|
| 56.1 |
|
| 30.3 |
|
| 18.4 |
Employee benefit obligations(5) |
|
| 112.3 |
|
| 9.1 |
|
| 19.9 |
|
| 22.1 |
|
| 61.2 |
Total Contractual Obligations(6) |
| $ | 5,275.4 |
| $ | 397.1 |
| $ | 471.5 |
| $ | 440.1 |
| $ | 3,966.7 |
| Contractual Obligations | ||||||||||||||||||||||||||||
| Payments due by Fiscal Year | ||||||||||||||||||||||||||||
| 2014 | 2015 | 2016 | 2017 | 2018 | Thereafter | Total | ||||||||||||||||||||||
| Debt, excluding capital lease obligations | $ | 99 | $ | 74 | $ | 73 | $ | 668 | $ | 9 | $ | 2,240 | $ | 3,163 | ||||||||||||||
| Interest payments excluding capital lease obligations | 160 | 155 | 153 | 151 | 127 | 317 | 1,063 | |||||||||||||||||||||
| Capital lease obligations(1) | 8 | 9 | 8 | 7 | 6 | 71 | 109 | |||||||||||||||||||||
| Operating lease obligations | 40 | 33 | 28 | 23 | 15 | 34 | 173 | |||||||||||||||||||||
| Employee benefit obligations(2) | 9 | 9 | 10 | 10 | 11 | 63 | 112 | |||||||||||||||||||||
| Total Contractual Obligations(3) | $ | 316 | $ | 280 | $ | 272 | $ | 859 | $ | 168 | $ | 2,725 | $ | 4,620 | ||||||||||||||
(1) | See Note 10 “Debt”, included elsewhere in the Annual Report. |
(2) | Interest payments on debt subject to variable interest rates are based upon annualized interest rates as of September 30, 2016. See Note 10, “Debt”, included elsewhere in the Annual Report. |
(3) | Capital lease payments due by fiscal year include executory costs and imputed interest not reflected in the Consolidated Statements of Financial |
(4) | Operating lease payments due by fiscal year not reflected in the Consolidated Statements of Financial Position. See Note 11 “Leases”, included elsewhere in the Annual Report. |
(5) | Employee benefit obligations represent the sum of our estimated future minimum required funding for our qualified defined benefit plans based on actuarially determined estimates and projected future benefit payments from our unfunded postretirement plans. |
(6) | At September 30, |
The following table summarizes our other commercial commitments as of
September 30, |
|
|
|
|
|
|
|
|
|
|
|
|
|
|
|
|
| Contractual Payments Due by Period | |||||||||||||
(in millions) |
|
| Total |
|
| Less than 1 year |
|
| 1 to 3 years |
|
| 3 to 5 years |
|
| Thereafter |
Letters of credit |
| $ | 24.6 |
| $ | 24.6 |
| $ | — |
| $ | — |
| $ | — |
| Other Commercial Commitments | ||||||||||||||||||||||||||||
| Amount of Commitment Expiration by Fiscal Year | ||||||||||||||||||||||||||||
| 2014 | 2015 | 2016 | 2017 | 2018 | Thereafter | Total | ||||||||||||||||||||||
| Letters of credit | $ | 32 | $ | 5 | $ | — | $ | — | $ | — | $ | — | $ | 37 | ||||||||||||||
| Total Other Commercial Commitments | $ | 32 | $ | 5 | $ | — | $ | — | $ | — | $ | — | $ | 37 | ||||||||||||||
Critical Accounting Policies
Our Consolidated Financial Statements included in this Annual Report on Form 10-K have been prepared in accordance with U.S. GAAP and fairly present our financial position and results of operations. We believeThe preparation of the consolidated financial statements requires management to make estimates and assumptions that affect the reported amounts of assets and liabilities at the date of the financial statements and the reported amounts of revenues and expenses during the reporting period. The Company bases its accounting estimates on historical experience and on various other assumptions that are believed to be reasonable under the circumstances, and evaluates its estimates on an ongoing basis. The following accounting policies are considered by management to be the most critical to an understanding the judgments that are involved in the preparation of our consolidated financial statements.statements and the uncertainties that could impact our results of operations, financial position and cash flows. The application of these accounting policies requires management’s
judgment and use of assumptions as to future events and outcomes that are uncertain and, as a result, actual results could differ from these estimates. Refer to Note 2 “Significant Accounting Policies and Practices” of Notes to the Consolidated Financial Statements for all relevant accounting policies.
Goodwill, Intangible Assets and Other Long-Lived Assets
The Company’s goodwill, intangible assets and tangible fixed assets are stated at historical cost, net of depreciation and amortization, less any provision for impairment. Intangible and tangible assets with determinable lives are amortized or depreciated on a straight line basis over estimated useful lives. Refer to Note 2 “Significant Accounting Policies and Practices” of Notes to Consolidated Financial Statements for more information about useful lives.
54
On an annual basis, or more frequently if triggering events occur, the Company compares the estimated fair value of its reporting units to the carrying value to determine if potential goodwill impairment exists. Our reporting units are consistent with our operating segments. See Note 19, “Segment Information” for further discussion of operating and reporting segments. If the fair value of a reporting unit is less than its carrying value, an impairment loss is recorded for the difference between the implied fair value of the reporting unit goodwill and its carrying value. The estimated fair value represents the amount at which a reporting unit could be bought or sold in a current transaction between willing parties on an arms-length basis. In estimating the fair value of the reporting unit, we used a discounted cash flows methodology, which requires us to estimate future revenues, expenses, and capital expenditures and make assumptions about our weighted average cost of capital and perpetuity growth rate, among other variables. We test the aggregate estimated fair value of our reporting units by comparison to our total market capitalization, including both equity and debt capital. The fair value of GBA, HHI, PET, H&G, and GAC reporting units exceeded their carrying value by 157%, 110%, 58%, 326%, and 12%, respectively.
In addition to goodwill, the Company has indefinite-lived intangible assets that consist of acquired tradenames. On an annual basis, or more frequently if triggering events occur, the Company compares the estimated fair value of the identified trade names to the carrying value to determine if potential impairment exists. If the fair value is less than its carrying value, an impairment loss is recorded for the excess. The fair value of indefinite-lived intangible assets is determined using an income approach, the relief-from-royalty methodology, which requires us to make estimates and assumptions about future revenues, royalty rates, and the discount rate, among others. During the year ended September 30, 2016, the Company recognized $4.7 million impairment on indefinite life intangible assets due to the reduction in areas that are inherently uncertain.
The Company also reviews other definite-lived intangible assets and tangible fixed assets for impairment based onwhen events or changes in business circumstances indicate that the expected future cash flows or earnings projections associated with such assets. Impairment reviews are conducted atcarrying amount of the judgment of management when it believes that a change in circumstances in the business or external factors warrants a review.assets may not be fully recoverable. Circumstances such as the discontinuation of a product or product line, a sudden or consistent decline in the sales forecast for a product, changes in technology or in the way an asset is being used, a history of operating or cash flow losses or an adverse change in legal factors or in the business climate, among others, may trigger an impairment review. An asset’sIf such indicators are present, the Company performs undiscounted cash flow analyses to determine if impairment exists. The asset value iswould be deemed impaired if the discountedundiscounted cash flows or earnings projectionsexpected to be generated doby the asset did not supportexceed the carrying value of the asset. The estimation of such amounts requires management’s judgment with respectIf impairment is determined to revenue and expense growth rates, changes in working capital and selection of an appropriate discount rate, as applicable. The use of different assumptions would increase or decrease discounted future operating cash flows or earnings projections and could, therefore, changeexist, any related impairment determinations.
A considerable amount of judgment and
Pensions
The Company recognizes amounts on the future based on period specific facts and circumstances.
The Company’s discount rate assumptions are based on the interest rate of plan assets,high-quality corporate bonds, with appropriate consideration of our plans’ participants’ demographics and benefit payment terms. For the year ended September 30, 2016, we used discount rates of
The Company’s expected return on plan assets assumptions are based on our expectation of long-term average rates of return on assets in the pension funds, which reflect both the current and projected asset mix of the funds and consider the historical returns earned on the fund. If the actual rates of return are lower than we assume, our future pension expense and required funding contributions may increase. Actual returns above the assumed level could decrease future pension expense and lower the amount of required funding contributions. For the year ended September 30, 2016, we used an expected return on plan assets of 7.00%. If plan assets decline due to poor market performance, our pension liability will increase along with increasing pension expense and required funding contributions may increase.
55
The Company reviews its actuarial assumptions on an annual basis and makes modifications based on current rates and trends when appropriate. Based on the information provided by independent actuaries and other relevant sources, the Company believes that the assumptions used are reasonable; however, changes in these assumptions could impact our financial position, results of operations or cash flows in the future. See Note 10, "Employee13, “Employee Benefit Plans,"” of Notes to Consolidated Financial Statements included elsewhere in this Annual Report on Form 10-K for a more completefurther discussion of our employee benefit plans.
Restructuring and Related Charges
Restructuring charges are recognized and measured according to the provisions of ASC Topic 420:
Liabilities from restructuring and related charges are recorded for estimated costs of facility closures, significant organizational adjustments and measures undertaken by managementus to exit certain activities. Costs for such activities are estimated by managementus after evaluating detailed analyses of the costs to be incurred. Such liabilities could include amounts for items such as severance costs and related benefits (including settlements of pension plans), impairment of property and equipment and other current or long term assets, lease termination payments and any other items directly related to the exit activities. While the actions are carried out as expeditiously as possible, restructuring and related charges are estimates. Changes in estimates resulting in an increase to or a reversal of a previously recorded liability may be required as management executes a restructuring plan.
Restructuring and related charges associated with manufacturing and related initiatives are reported in cost of goods sold. Restructuring and related charges reflected in cost of goods sold include, but are not limited to, termination and related costs associated with manufacturing employees, asset impairments relating to manufacturing initiatives and other costs directly related to the restructuring initiatives implemented.
While the actions are carried out as expeditiously as possible, restructuring and related charges are estimates. Changes in estimates resulting in an increase to or a reversal of a previously recorded liability may be required as we execute a restructuring plan. See Note 14, "Restructuring4, “Restructuring and Related Charges,"Charges” of Notes to Consolidated Financial Statements included elsewhere in this Annual Report on Form 10-K for a more complete discussion of our restructuring initiatives and related costs.
Income Taxes
The Company is subject to income taxes in the U.S. and Integration Related Charges
The costsCompany assesses its income tax positions and records tax liabilities for all years subject to examination based upon management’s evaluation of plans to (i) exit an activitythe facts and circumstances and information available for reporting. For those income tax positions where it is not more-likely-than-not that a tax benefit will not be sustained upon conclusion of an acquired company, (ii) involuntarily terminate employeesexamination, the Company has recorded a reserve based upon the largest amount of an acquired company or (iii) relocate employeestax benefit having a cumulatively greater than 50% likelihood of an acquired company are measured and recorded in accordancebeing realized upon ultimate settlement with the provisionsapplicable taxing authority assuming that it has full knowledge of all relevant information. For those income tax positions where it is more-likely-than-not that a tax benefit will be sustained, the ASC 805. Under ASC 805,Company did not recognize a reserve. As of September 30, 2016, the total amount of unrecognized tax benefits, including interest and penalties, that if certain conditions are met, such costs arenot recognized, as a liability assumed as ofwould affect the consummation date of the purchase business combination and includedeffective tax rate in the allocation of the acquisition cost. Costs related to terminated activities or employees of the acquired company that do not meet the conditions prescribed in ASC 805 are treated as acquisition and integration related charges and expensed as incurred.
The Company recognizes deferred tax assets and liabilities for future tax consequences attributable to differences between financial statement carrying amounts of existing assets and liabilities and their respective tax bases, net operating losses, tax credit, and other carryforwards. Deferred tax assets and liabilities are presentedmeasured using enacted tax rates expected to apply to taxable income in the years in which those temporary differences are expected to be recovered or settled. The Company regularly reviews its deferred tax assets for recoverability and establishes a valuation allowance based on historical losses, projected future taxable income, expected timing of the reversals of existing temporary differences, and ongoing prudent and feasible tax planning strategies. We base these estimates on projections of future income, including tax planning strategies, in certain jurisdictions. Changes in industry conditions and other economic conditions may impact our ability to project future income. Should we determine that we would not be able to realize all or part of our net deferred tax asset in the future, an adjustment to the deferred tax asset would be charged to income in the period we make that determination.
56
As of September 30, 2016, we have U.S. federal net operating loss carryforwards (“NOLs”) of $758.9 million, with a federal tax benefit of $265.6 million and future tax benefits related to state NOLs of $60.6 million and capital loss carryforwards of $19.8 million with a federal and state tax benefit of $7.6 million. Our total valuation allowance for the tax benefit of deferred tax assets that may not be realized is $245.7 million at September 30, 2016. Of this amount, $203.7 million relates to U.S. net deferred tax assets and $42.0 million relates to foreign net deferred tax assets. We estimate that $197.8 million of valuation allowance related to domestic deferred tax assets cannot be released regardless of the amount of domestic operating income generated due to both prior period ownership changes that limit the amount of NOLs we can use and legal limitations on the balance sheetuse of capital losses and foreign tax credits.
As of September 30, 2016, we have provided $32.8 million of residual US taxes on earnings not yet taxed in the U.S. As of September 30, 2016, we project $3.4 million of additional tax expense from non-U.S. withholding and other liabilities.
See Note 9, "Income Taxes" 14, “Income Taxes” of Notes to Consolidated Financial Statements elsewhere included in this Annual Report on Form 10-K.
New Accounting Pronouncements
In May 2014, the Financial Accounting Standards Board (“FASB”) issued Accounting Standards Update (“ASU”) No. 2014-09, Revenue from Contracts with Customers (Topic 606), which supersedes the revenue recognition requirements in ASC 605, Revenue Recognition. This ASU requires revenue recognition to depict the transfer of goods and services to customers in an amount that reflects the consideration to which the entity expects to be entitled in exchange for those goods or services. The new revenue recognition model requires identifying the contract and performance obligations, determining the transaction price, allocating the transaction price to performance obligations and recognizing the revenue upon satisfaction of performance obligations. This ASU also requires additional disclosure about the nature, amount, timing and uncertainty of revenue and cash flows arising from customer contracts, including significant judgments and changes in judgments, and assets recognized from costs incurred to obtain or fulfill a loss has been incurred andcontract. This ASU can be applied either retrospectively to each prior reporting period presented or retrospectively with the amountcumulative effect of initially applying the updates recognized at the date of the lossinitial application along with additional disclosures. In August 2015, the FASB issued ASU No. 2015-14, Revenue from Contracts with Customers (Topic 606) Deferral of the Effective Date, which amends the previously issued ASU to provide for a one year deferral from the original effective date. As a result, the ASU will become effective for us beginning in the first quarter of our fiscal year ending September 30, 2019, with early application only being available to us beginning in the first quarter of our fiscal year ending September 30, 2018. We are assessing the impact this pronouncement will have on the consolidated financial statements of the Company and have not determined the materiality or method of adoption.
In February 2016, the Financial Accounting Standards Board (“FASB”) issued Accounting Standards Update (“ASU”) No. 2016-02, Leases (Topic 842), which supersedes the lease requirements in ASC 840, Leases. This ASU requires lessees to recognize lease assets and liabilities on the balance sheet, as well as to disclose key information about leasing arrangements. Although the new ASU requires both operating and finance leases to be disclosed on the balance sheet, a distinction between the two types still exists as the economics of leases can vary. The ASU can be reasonably estimated. The outcomeapplied using a modified retrospective approach, with a number of existing litigation,optional practical expedients relating to the identification and classification of leases that commenced before the effective date, along with the ability to use hindsight in the evaluation of lease decisions, that entities may elect to apply. As a result, the ASU will become effective for us beginning in the first quarter of our fiscal year ending September 30, 2020, with early adoption applicable. We are assessing the impact this pronouncement will have on the consolidated financial statements of environmental mattersthe Company and pendinghave not determined the materiality or potential examinations by various taxing authorities are examplesmethod of situations evaluated as loss contingencies. Estimating the probability and magnitudeadoption.
57
Market Risk Factors
We have market risk exposure from changes in interest rates, foreign currency exchange rates and commodity prices. We, whenWhen appropriate, we use derivative financial instruments to mitigate the risk from such exposures.
Interest Rate Risk
A substantial portion of our debt bears interest at variable rates. If market interest rates increase, the interest rate on our variable rate debt will increase and will create higher debt service requirements, which would adversely affect our cash flow and could adversely impact our results of operations. We also have bank lines of credit at variable interest rates. The general levellevels of U.S., Canadian and CanadianEuropean Union interest rates, LIBOR, CDOR and Euro LIBOREURIBOR affect interest expense. We periodically use interest rate swaps to manage such risk. The net amounts to be paid or received under interest rate swap agreements are accrued as interest rates change, and are recognized over the life of the swap agreements as an adjustment to interest expense from the underlying debt to which the swap is designated. The related amounts payable to, or receivable from, the contract counter-partiescounterparties are included in accrued liabilities or accounts receivable.
At September 30, 2013, there were no2016 we had $1,140.3 million or 31% of our total debt subject to variable interest rates, the majority related to our term loan of $1,123.4 million subject to a 0.75% floor. After inclusion of a weighted average of $155.3 million of interest rate swaps expiring in April 2017 fixing a portion of the variable rate debt, $985.0 million or 27% of our debt is subject to variable rates. Assuming an increase to market rates of 1% as of September 30, 2016, we would incur an increase to interest expense of $9.4 million.
At September 30, 2016, the potential change in fair value of our outstanding interest rate derivative instruments.
Foreign Exchange Risk
We are subject to risk from sales and loans to and from our subsidiaries as well as sales to, purchases from and bank lines of credit with third-party customers, suppliers and creditors denominated in foreign currencies. Foreign currency sales and purchases are made primarily in Euro, Pounds Sterling, Mexican Pesos, Canadian Dollars, Australian Dollars and Brazilian Reals. We manage our foreign exchange exposure from anticipatedsuch sales, accounts receivable, intercompany loans, firm purchase commitments, accounts payable and credit obligations through the use of naturally occurring offsetting positions (borrowing in local currency), forward foreign exchange contracts, foreign exchange rate swaps and foreign exchange options. The related amounts payable to, or receivable from, the contract counter-parties are included in accounts payable or accounts
At September 30, 2016, the potential change in fair value of outstanding foreign exchange derivative instruments, assuming a 10% unfavorable change in the underlying exchange rates, would be a loss of $35.7 million. The net impact on reported earnings, after also including the effect of the change in the underlying foreign currency-denominated exposures, would be a net gain of $19.3 million.
Commodity Price Risk
We are exposed to fluctuations in market prices for purchases of zinc and brass used in our manufacturing processes. We use commodity swaps and calls to manage such risk. The maturity of, and the quantities covered by, the contracts are closely correlated to our anticipated purchases of the commodity. The cost of calls is amortized over the life of the contracts and recorded in cost of goods sold, along with the effects of the swap and call contracts. The related amounts payable to, or receivable from, the counter-parties are included in accounts payable or accounts receivable.
At September 30, 2013, assuming a 1 percent unfavorable shift in interest rates of our variable rate Term Loan, there would be no financial impact as the underlying interest rates are currently greater than 1 percent below the floor of our variable rate Term Loan. At September 30, 2013, there were no outstanding interest rate derivative instruments.
58
ITEM 8.gainFINANCIAL STATEMENTS AND SUPPLEMENTARY DATA of $1 million.
The information required for this Item is included in this Annual Report on Form 10-K within Item 15, Exhibits, Financial Statements and Schedules, inclusive and is incorporated herein by reference.
None.
ITEM 9A.CONTROLS AND PROCEDURES
Spectrum Brands Holdings, Inc.
Evaluation of Disclosure Controls and Procedures. Our management, with the participation of our principal executive officer and principal financial officer, has evaluated the effectiveness of ourSBH’s disclosure controls and procedures (as such term is defined in Rules 13a-15(e) and 15d-15(e) under the Exchange Act) pursuant to Rule 13a-15(b) under the Exchange Act as of the end of the period covered by this Annual Report on Form 10-K. Based on this evaluation, our Chief Executive Officer and Chief Financial Officer have concluded that, as of such date, ourSBH’s disclosure controls and procedures are effective to ensure that information required to be disclosed by usSBH in reports that we file or submit under the Exchange Act is recorded, processed, summarized and reported within the time periods specified in applicable SEC rules and forms, and is accumulated and communicated to the Company’sSBH’s management, including the Company’sour Chief Executive Officer and Chief Financial Officer, as appropriate to allow timely decisions regarding required disclosure.
Management’s Annual Report on Internal Control over Financial Reporting. The Company’sSBH’s management is responsible for establishing and maintaining adequate internal control over financial reporting (as defined in Rules 13a-15(f) and 15d-15(f) under the Exchange Act). The Company’sSBH’s management assessed the effectiveness of its internal control over financial reporting as of September 30, 2013.2016. In making this assessment, the Company’sSBH’s management used the criteria set forth by the Committee of Sponsoring Organizations of the Treadway Commission (“COSO”) in the Internal Control-Control Integrated Framework (1992)(2013). The Company’sSBH’s management has concluded that, as of September 30, 2013,2016, its internal control over financial reporting is effective based on these criteria. The Company's management excludedUnder guidelines established by the residential hardware and home improvement business (the HHI Business)SEC, companies are allowed to exclude acquisitions from itstheir first assessment of the effectiveness of internal control over financial reporting as the
Changes in Internal Control Over Financial Reporting. There was no change in ourSBH’s internal control over financial reporting (as defined in Rules 13a-15(f) and 15d-15(f) under the Securities Exchange Act of 1934, as amended) that occurred during our fourth fiscal quarter that has materially affected, or is reasonably likely to materially affect, ourSBH’s internal control over financial reporting.
Limitations on the Effectiveness of Controls. The Company’sSBH’s management, including our Chief Executive Officer and Chief Financial Officer, does not expect that the Company’sSBH’s disclosure controls and procedures or the Company’sSBH’s internal controlscontrol over financial reporting will prevent all errors and all fraud. A control system, no matter how well conceived and operated, can provide only reasonable, not absolute, assurance that the objectives of the control system are met. Further, the design of a control system must reflect the fact that there are resource constraints, and the benefits of controls must be considered relative to their costs. Because of the inherent limitations in all control systems, no evaluation of controls can provide absolute assurance that all control issues and instances of fraud, if any, within the Companywith respect to SBH have been detected.
59
SB/RH Holdings, LLC
Evaluation of Disclosure Controls and Procedures. Our management, with the participation of our principal executive officer and principal financial officer, has evaluated the effectiveness of SB/RH’s disclosure controls and procedures (as such term is defined in Rules 13a-15(e) and 15d-15(e) under the Exchange Act) pursuant to Rule 13a-15(b) under the Exchange Act as of the end of the period covered by this Annual Report on Form 10-K. Based on this evaluation, our Chief Executive Officer and Chief Financial Officer have concluded that, as of such date, SB/RH’s disclosure controls and procedures are effective to ensure that information required to be disclosed by SB/RH in reports that we file or submit under the Exchange Act is recorded, processed, summarized and reported within the time periods specified in applicable SEC rules and forms, and is accumulated and communicated to SB/RH’s management, including our Chief Executive Officer and Chief Financial Officer, as appropriate to allow timely decisions regarding required disclosure.
Management’s Annual Report on Internal Control over Financial Reporting. SB/RH’s management is responsible for establishing and maintaining adequate internal control over financial reporting (as defined in Rules 13a-15(f) and 15d-15(f) under the Exchange Act). SB/RH’s management assessed the effectiveness of its internal control over financial reporting as of September 30, 2016. In making this assessment, SB/RH’s management used the criteria set forth by the Committee of Sponsoring Organizations of the Treadway Commission (“COSO”) in the Internal Control Integrated Framework (2013). SB/RH’s management has concluded that, as of September 30, 2016, its internal control over financial reporting is effective based on these criteria. Under guidelines established by the SEC, companies are allowed to exclude acquisitions from their first assessment of internal control over financial reporting following the date of the acquisition.
Changes in Internal Control Over Financial Reporting. There was no change in SB/RH’s internal control over financial reporting (as defined in Rules 13a-15(f) and 15d-15(f) under the Securities Exchange Act of 1934, as amended) that occurred during our fourth fiscal quarter that has materially affected, or is reasonably likely to materially affect, SB/RH’s internal control over financial reporting.
Limitations on the Effectiveness of Controls. SB/RH’s management, including our Chief Executive Officer and Chief Financial Officer, does not expect that SB/RH’s disclosure controls and procedures or SB/RH’s internal control over financial reporting will prevent all errors and all fraud. A control system, no matter how well conceived and operated, can provide only reasonable, not absolute, assurance that the objectives of the control system are met. Further, the design of a control system must reflect the fact that there are resource constraints, and the benefits of controls must be considered relative to their costs. Because of the inherent limitations in all control systems, no evaluation of controls can provide absolute assurance that all control issues and instances of fraud, if any, with respect to SB/RH have been detected.
None.
60
PART III
ITEM 10.DIRECTORS, EXECUTIVE OFFICERS AND CORPORATE GOVERNANCE
The information required by Item 401 of Regulation S-K concerning the directors and executive officers of Spectrum Brands Holdings, Inc. (“SB Holdings”)SBH and the nominees for re-election as directors of SB HoldingsSBH at the SBH Annual Meeting of Shareholders to be held on January 28, 201424, 2017 (the “2014“2017 Annual Meeting”) is incorporated herein by reference fromto the disclosures under the captions “Board of Directors” and “Executive Officers Who Are Note Directors” which will be included underin the captions “BOARD OF DIRECTORS,” “PROPOSAL 1-ELECTION OF DIRECTORS,” and “EXECUTIVE OFFICERS WHO ARE NOT DIRECTORS” in SB Holdings'SBH’s definitive Proxy Statement relating to the 20142017 Annual Meeting (the “SB Holdings Definitive“Definitive Proxy Statement”), which will be filed not later than 120 days after the end of SB Holdings'the SBH’s fiscal year ended September 30, 2013.
Audit Committee and Audit Committee Financial Expert
The information required by Items 407(d)(4) and 407(d)(5) of Regulation S-K is incorporated herein by reference from the disclosure which will be included under the caption “BOARD ACTIONS; BOARD MEMBER INDEPENDENCE; COMMITTEES OF THE BOARD OF DIRECTORS - Committees“Committees Established by Our Board of Directors - Audit Committee”Directors” in the SB Holdings Definitive Proxy Statement.
Section 16(a) Beneficial Ownership Reporting Compliance
The information required by Item 405 of Regulation S-K is incorporated herein by reference from the disclosure which will be included under the caption “SECTION“Section 16(a) BENEFICIAL OWNERSHIP REPORTING COMPLIANCE”Beneficial Ownership Reporting Compliance” in the SB Holdings Definitive Proxy Statement.
Code of Ethics
We have adopted the Code of Ethics for the Principal Executive Officer and Senior Financial Officers a code of ethics that applies to our Chief Executive Officer, Chief Financial Officer and other senior finance organization employees. The Code of Ethics for the Principal Executive Officer and Senior Financial Officers is publicly available on our website at www.spectrumbrands.com under “Investor Relations—Corporate Governance.” We intend to disclose amendments to, and, if applicable, waivers of, this code of ethics on that section of our website.
We have also adopted the Spectrum Brands Code of Business Conduct and Ethics, a code of ethics that applies to all of
The information required by Item 407(e)(4) of Regulation S-K is incorporated herein by reference from the disclosure which will be included under the caption “EXECUTIVE COMPENSATION-Compensation“Compensation Committee Interlocks and Insider Participation” in the SB Holdings Definitive Proxy Statement.
Report of the Compensation Committee of the Board of Directors
The information required by Item 407(e)(4)(5) of Regulation S-K is incorporated herein by reference from the disclosure which will be included under the caption “EXECUTIVE COMPENSATION-Compensation“Report of the Compensation Committee Interlocks and Insider Participation”of the Board of Directors” in the SB Holdings Definitive Proxy Statement.
Executive Compensation
The information required by Item 402 of Regulation S-K is incorporated herein by reference from the disclosures which will be included under the caption “EXECUTIVE COMPENSATION”“Executive Compensation” in the SB Holdings Definitive Proxy Statement.
ITEM 12.SECURITY OWNERSHIP OF CERTAIN BENEFICIAL OWNERS AND MANAGEMENT AND RELATED STOCKHOLDER MATTERS
Ownership of Common Shares of Spectrum Brands Holdings, Inc.
The information required by Item 403 of Regulation S-K is incorporated herein by reference from the disclosure which will be included under the caption “SECURITY OWNERSHIP OF CERTAIN BENEFICIAL OWNERS AND MANAGEMENT AND RELATED STOCKHOLDER MATTERS”“Security Ownership of Certain Beneficial Owners and Management and Related Stockholder Matters” in the SB Holdings Definitive Proxy Statement.
61
Securities Authorized for Issuance under Equity Compensation Plans
The information required by Item 201(d) of Regulation S-K is incorporated herein by reference from the disclosure which will be included under the caption “EQUITY COMPENSATION PLAN INFORMATION”“Equity Compensation Plan Information” in the SB Holdings Definitive Proxy Statement.
ITEM 13.CERTAIN RELATIONSHIPS AND RELATED TRANSACTIONS AND DIRECTOR INDEPENDENCE
Certain Relationships and Related Person Transactions
The information required by Item 404 of Regulation S-K is incorporated herein by reference from the disclosures which will be included under the caption “CERTAIN RELATIONSHIPS AND RELATED TRANSACTIONS AND DIRECTOR INDEPENDENCE”“Certain Relationships and Related Transactions and Director Independence” in the SB Holdings Definitive Proxy Statement.
Director Independence
The information required by Item 407(a) of Regulation S-K is incorporated herein by reference from the disclosures which will be included under the captions “CERTAIN RELATIONSHIPS AND RELATED TRANSACTIONS AND DIRECTORS INDEPENDENCE -“Certain Relationships and Related Transactions and Director Independence” and “BOARD ACTIONS; BOARD MEMBER INDEPENDENCE; COMMITTEES OF THE BOARD OF DIRECTORS”“Board Actions; Board Member Independence; Committees of the Board of Directors” in the SB Holdings Definitive Proxy Statement.
ITEM 14.PRINCIPAL ACCOUNTING FEES AND SERVICES
Spectrum Brands Holdings, Inc.
The information required by this Item 14 is incorporated herein by reference from the disclosures which will be included under the captions “PROPOSAL 2: RATIFICATION OF APPOINTMENT OF INDEPENDENT REGISTERED PUBLIC ACCOUNTING FIRM FOR FISCAL 2014 - Independent Auditor Fees” and “Pre-Approvalcaption “Ratification of Appointment of Independent AuditorRegistered Public Accounting Firm for Fiscal 2017” in the Definitive Proxy Statement.
SB/RH Holdings, LLC
The following table summarizes the fees KPMG LLP, our independent registered public accounting firm, billed to SB/RH for services to SB/RH and its consolidated subsidiaries, for each of the last two fiscal years:
|
|
|
|
|
|
|
|
|
|
|
|
|
|
|
|
(in millions) |
| 2016 |
| 2015 |
| ||
Audit Fees |
| $ | 5.5 |
| $ | 5.2 |
|
Audit-Related Fees |
|
| — |
|
| — |
|
Tax Fees |
| 0.3 |
|
| 0.6 |
| |
All Other Fees |
| — |
|
| — |
| |
Total | $ | 5.8 |
| $ | 5.8 |
| |
In the above table, in accordance with the SEC’s definition and rules, “Audit Fees” are fees paid to KPMG LLP for professional services for the audit of SB/RH and our consolidated financial statements included in our Form 10-K and the review of our financial statements included in Form 10-Q, or services that are normally provided by the accountant in connection with statutory and regulatory filings or engagements, such as issuance of comfort letters and statutory audits required for certain of our foreign subsidiaries. “Audit-Related Fees” are fees for assurance and related services that are reasonably related to the performance of the audit or review of our financial statements, including the due diligence activities relating to mergers and acquisitions. “Tax Fees” are fees for tax compliance, tax advice, and tax planning. Such fees were attributable to services for tax-compliance assistance and tax advice. “All Other Fees” are fees, if any, for any services not included in the first three categories.
Pre-Approval of Independent Auditors Services and Fees”Fees
The Audit Committee pre-approved the audit services engagement performed by KPMG LLP for the year ended September 30, 2016. In accordance with the Audit Committee’s Pre-Approval Policy, the Audit Committee has pre-approved other specified audit, or audit related services, provided that the fees incurred by KPMG LLP in connection with any individual engagement do not exceed $200,000 in any 12-month period. The Audit Committee must approve on an engagement by engagement basis any individual non-audit or tax engagement in any 12-month period. The Audit Committee has delegated to its Chairman the SB Holdings Definitive Proxy Statement.
62
PART IV
ITEM 15.EXHIBITS, FINANCIAL STATEMENTS AND SCHEDULES
(a) |
The following documents are filed as part of or are included in this Annual Report on Form 10-K: |
1. | The financial statements of Spectrum Brands Holdings, Inc. and SB/RH Holdings, LLC listed in the Index to Consolidated Financial Statements and Financial Statement Schedule, filed as part of this Annual Report on Form 10-K. |
2. | The financial statement schedule of Spectrum Brands Holdings, Inc. and SB/RH Holdings, LLC listed in the |
3. | The exhibits listed in the Exhibit Index filed as part of this Annual Report on Form 10-K. |
63
This report is a combined report of Spectrum Brands Holdings, Inc. (“SBH”) and SB/RH Holdings, LLC (“SB/RH”). The notes to the consolidated financial statements include consolidated SBH footnotes and certain footnotes related to SB/RH.
Page | |
| 65 | |
Spectrum Brands Holdings, Inc. Consolidated Financial Statements | |
| 68 | |
| 69 | |
| 69 | |
| 70 | |
| 71 | |
SB/RH Holdings, LLC Consolidated Financial Statements | |
| 72 | |
| 73 | |
| 73 | |
| 74 | |
| 75 | |
Spectrum Brands Holdings, Inc. and SB/RH Holdings, LLC Combined | |
| 76 |
64
The Board of Directors and Stockholders
Spectrum Brands Holdings, Inc.:
We have audited the accompanying consolidated statements of financial position of Spectrum Brands Holdings, Inc. and subsidiaries (the Company) as of September 30, 20132016 and 2012,2015, and the related consolidated statements of operations,income, comprehensive income, (loss), shareholders’ equity, and cash flows for each of the years in the three-year period ended September 30, 2013. In connection with our audits of the consolidated financial statements, we have also audited the financial statement schedule II.2016. These consolidated financial statements and financial statement schedule are the responsibility of the Company’s management. Our responsibility is to express an opinion on these consolidated financial statements and financial statement schedule based on our audits.
We conducted our audits in accordance with the standards of the Public Company Accounting Oversight Board (United States). Those standards require that we plan and perform the audit to obtain reasonable assurance about whether the financial statements are free of material misstatement. An audit includes examining, on a test basis, evidence supporting the amounts and disclosures in the financial statements. An audit also includes assessing the accounting principles used and significant estimates made by management, as well as evaluating the overall financial statement presentation. We believe that our audits provide a reasonable basis for our opinion.
In our opinion, the consolidated financial statements referred to above present fairly, in all material respects, the financial position of Spectrum Brands Holdings, Inc. and subsidiaries as of September 30, 20132016 and 2012,2015, and the results of their operations and their cash flows for each of the years in the three-year period ended September 30, 2013,2016, in conformity with U.S. generally accepted accounting principles. Also in our opinion, the related financial statement schedule, when considered in relation to the basic consolidated financial statements taken as a whole, presents fairly, in all material respects, the information set forth therein.
We also have audited, in accordance with the standards of the Public Company Accounting Oversight Board (United States), the Company’s internal control over financial reporting as of September 30, 2013,2016, based on criteria established in Internal Control-IntegratedControl—Integrated Framework (1992)(2013) issued by the Committee of Sponsoring Organizations of the Treadway Commission (COSO), and our report dated November 27, 201317, 2016 expressed an unqualified opinion on the effectiveness of the Company’s internal control over financial reporting.
/s/ KPMG LLP
Milwaukee, Wisconsin
November 27, 2013
65
Report of Independent Registered Public Accounting Firm
The Board of Directors and Stockholders
Spectrum Brands Holdings, Inc.:
We have audited Spectrum Brands Holdings, Inc. and subsidiaries (the Company) internal control over financial reporting as of September 30, 2013,2016, based on criteria established inInternal Control – Integrated Framework (2013) Internal Control-Integrated Framework (1992) issued by the Committee of Sponsoring Organizations of the Treadway Commission (COSO). The Company’s management is responsible for maintaining effective internal control over financial reporting and for its assessment of the effectiveness of internal control over financial reporting, included in the accompanying Management’s Annual Report on Internal Control Over Financial Reporting. Our responsibility is to express an opinion on the Company’s internal control over financial reporting based on our audit.
We conducted our audit in accordance with the standards of the Public Company Accounting Oversight Board (United States). Those standards require that we plan and perform the audit to obtain reasonable assurance about whether effective internal control over financial reporting was maintained in all material respects. Our audit included obtaining an understanding of internal control over financial reporting, assessing the risk that a material weakness exists, and testing and evaluating the design and operating effectiveness of internal control based on the assessed risk. Our audit also included performing such other procedures as we considered necessary in the circumstances. We believe that our audit provides a reasonable basis for our opinion.
A company’s internal control over financial reporting is a process designed to provide reasonable assurance regarding the reliability of financial reporting and the preparation of financial statements for external purposes in accordance with generally accepted accounting principles. A company’s internal control over financial reporting includes those policies and procedures that (1) pertain to the maintenance of records that, in reasonable detail, accurately and fairly reflect the transactions and dispositions of the assets of the company; (2) provide reasonable assurance that transactions are recorded as necessary to permit preparation of financial statements in accordance with generally accepted accounting principles, and that receipts and expenditures of the company are being made only in accordance with authorizations of management and directors of the company; and (3) provide reasonable assurance regarding prevention or timely detection of unauthorized acquisition, use, or disposition of the company’s assets that could have a material effect on the financial statements.
Because of its inherent limitations, internal control over financial reporting may not prevent or detect misstatements. Also, projections of any evaluation of effectiveness to future periods are subject to the risk that controls may become inadequate because of changes in conditions, or that the degree of compliance with the policies or procedures may deteriorate.
In our opinion, Spectrum Brands Holdings, Inc. and subsidiaries maintained, in all material respects, effective internal control over financial reporting as of September 30, 2013,2016, based on criteria established in Internal Control-IntegratedControl – Integrated Framework (1992)(2013) issued by the Committee of Sponsoring Organizations of the Treadway Commission.Commission (COSO).
We also excluded an evaluation of the internal control over financial reporting of the HHI Business.
/s/ KPMG LLP
Milwaukee, Wisconsin
November 17, 2016
66
Report of Independent Registered Public Accounting Firm
The Board of Directors and Shareholder
SB/RH Holdings, LLC:
We have audited the accompanying consolidated statements of financial position of SB/RH Holdings, LLC and subsidiaries (the Company) as of September 30, 2016 and 2015, and the related consolidated statements of income, comprehensive income, shareholder’s equity, and cash flows for each of the years in the three-year period ended September 30, 2016. These consolidated financial statements are the responsibility of the Company’s management. Our responsibility is to express an opinion on these consolidated financial statements based on our audits.
We conducted our audits in accordance with the standards of the Public Company Accounting Oversight Board (United States). Those standards require that we plan and perform the audit to obtain reasonable assurance about whether the financial statements are free of material misstatement. An audit includes examining, on a test basis, evidence supporting the amounts and disclosures in the financial statements. An audit also includes assessing the accounting principles used and significant estimates made by management, as well as evaluating the overall financial statement schedule. Our report onpresentation. We believe that our audits provide a reasonable basis for our opinion.
In our opinion, the consolidated financial statements refersreferred to a changeabove present fairly, in accounting principle related toall material respects, the presentationfinancial position of tax withholdings on share-based paymentsSB/RH Holdings, LLC and subsidiaries as of September 30, 2016 and 2015, and the results of their operations and their cash flows for each of the years in the consolidated statements of cash flows.
/s/ KPMG LLP
Milwaukee, Wisconsin
November 27, 2013
67
Consolidated Statements of Financial Position
September 30, 2013
(Amounts in thousands,millions, except per share figures)
|
|
|
|
|
|
|
|
|
|
|
|
|
|
|
| 2016 |
| 2015 | ||
Assets |
|
|
|
|
|
|
Current assets: |
|
|
|
|
|
|
Cash and cash equivalents |
| $ | 275.3 |
| $ | 247.9 |
Trade receivables, net |
|
| 482.6 |
|
| 498.8 |
Other receivables |
|
| 55.6 |
|
| 87.9 |
Inventories |
|
| 740.6 |
|
| 780.8 |
Prepaid expenses and other current assets |
|
| 78.8 |
|
| 72.1 |
Total current assets |
|
| 1,632.9 |
|
| 1,687.5 |
Property, plant and equipment, net |
|
| 542.1 |
|
| 507.1 |
Deferred charges and other |
|
| 43.2 |
|
| 42.2 |
Goodwill |
|
| 2,478.4 |
|
| 2,476.7 |
Intangible assets, net |
|
| 2,372.5 |
|
| 2,480.3 |
Total assets |
| $ | 7,069.1 |
| $ | 7,193.8 |
Liabilities and Shareholders' Equity |
|
|
|
|
|
|
Current liabilities: |
|
|
|
|
|
|
Current portion of long-term debt |
| $ | 164.0 |
| $ | 33.8 |
Accounts payable |
|
| 580.1 |
|
| 620.6 |
Accrued wages and salaries |
|
| 122.9 |
|
| 96.5 |
Accrued interest |
|
| 39.3 |
|
| 63.3 |
Other current liabilities |
|
| 189.3 |
|
| 212.7 |
Total current liabilities |
|
| 1,095.6 |
|
| 1,026.9 |
Long-term debt, net of current portion |
|
| 3,456.2 |
|
| 3,872.1 |
Deferred income taxes |
|
| 532.7 |
|
| 572.5 |
Other long-term liabilities |
|
| 140.6 |
|
| 115.5 |
Total liabilities |
|
| 5,225.1 |
|
| 5,587.0 |
Commitments and contingencies (Note 18) |
|
|
|
|
|
|
Shareholders' equity: |
|
|
|
|
|
|
Common Stock, $0.01 par value: Authorized - 200.0 shares; Issued - 61.5 and 61.1 shares respectively; Outstanding - 59.4 and 59.4 shares, respectively. |
|
| 0.6 |
|
| 0.6 |
Additional paid-in capital |
|
| 2,073.6 |
|
| 2,033.6 |
Accumulated earnings (deficit) |
|
| 63.6 |
|
| (205.5) |
Accumulated other comprehensive loss, net of tax |
|
| (229.4) |
|
| (200.1) |
Treasury stock, at cost |
|
| (108.3) |
|
| (65.5) |
Total shareholders' equity |
|
| 1,800.1 |
|
| 1,563.1 |
Noncontrolling interest |
|
| 43.9 |
|
| 43.7 |
Total equity |
|
| 1,844.0 |
|
| 1,606.8 |
Total liabilities and equity |
| $ | 7,069.1 |
| $ | 7,193.8 |
| September 30, 2013 | September 30, 2012 | ||||||
| Assets | |||||||
| Current assets: | |||||||
| Cash and cash equivalents | $ | 207,257 | $ | 157,961 | |||
| Receivables: | |||||||
| Trade accounts receivable, net of allowances of $37,376 and $21,870, respectively | 481,313 | 335,301 | |||||
| Other | 65,620 | 38,116 | |||||
| Inventories | 632,923 | 452,633 | |||||
| Deferred income taxes, net | 32,959 | 28,143 | |||||
| Prepaid expenses and other | 62,833 | 49,273 | |||||
| Total current assets | 1,482,905 | 1,061,427 | |||||
| Property, plant and equipment, net | 412,551 | 214,017 | |||||
| Deferred charges and other | 26,050 | 27,711 | |||||
| Goodwill | 1,476,672 | 694,245 | |||||
| Intangible assets, net | 2,163,166 | 1,714,929 | |||||
| Debt issuance costs | 65,329 | 39,320 | |||||
| Total assets | $ | 5,626,673 | $ | 3,751,649 | |||
| Liabilities and Shareholders’ Equity | |||||||
| Current liabilities: | |||||||
| Current maturities of long-term debt | $ | 102,921 | $ | 16,414 | |||
| Accounts payable | 525,519 | 325,023 | |||||
| Accrued liabilities: | |||||||
| Wages and benefits | 82,056 | 82,119 | |||||
| Income taxes payable | 32,613 | 30,272 | |||||
| Accrued interest | 36,731 | 30,473 | |||||
| Other | 172,530 | 126,330 | |||||
| Total current liabilities | 952,370 | 610,631 | |||||
| Long-term debt, net of current maturities | 3,115,942 | 1,652,886 | |||||
| Employee benefit obligations, net of current portion | 96,612 | 89,994 | |||||
| Deferred income taxes, net | 492,774 | 377,465 | |||||
| Other | 28,879 | 31,578 | |||||
| Total liabilities | 4,686,577 | 2,762,554 | |||||
| Commitments and contingencies | |||||||
| Shareholders’ equity: | |||||||
| Common stock, $.01 par value, authorized 200,000 shares; issued 53,579 and 52,799 shares, respectively; outstanding 52,210 and 51,483 shares | 535 | 528 | |||||
| Additional paid-in capital | 1,410,738 | 1,399,261 | |||||
| Accumulated deficit | (435,911 | ) | (340,647 | ) | |||
| Accumulated other comprehensive loss | (38,521 | ) | (33,435 | ) | |||
| 936,841 | 1,025,707 | ||||||
| Less treasury stock, at cost, 1,369 and 1,316 shares, respectively | (39,820 | ) | (36,612 | ) | |||
| Total shareholders' equity | 897,021 | 989,095 | |||||
| Noncontrolling interest | 43,075 | — | |||||
| Total equity | 940,096 | 989,095 | |||||
| Total liabilities and equity | $ | 5,626,673 | $ | 3,751,649 | |||
See accompanying notes which are an integral part of theseto the consolidated financial statements.
68
SPECTRUM BRANDS HOLDINGS, INC.
Years ended September 30, 2013, 20122016, 2015 and 2011
(Amounts in thousands,millions, except per share figures)
|
|
|
|
|
|
|
|
|
|
|
| 2016 |
| 2015 |
| 2014 | |||
Net sales |
| $ | 5,039.7 |
| $ | 4,690.4 |
| $ | 4,429.1 |
Cost of goods sold |
|
| 3,119.3 |
|
| 3,018.0 |
|
| 2,856.5 |
Restructuring and related charges |
|
| 0.5 |
|
| 2.1 |
|
| 3.7 |
Gross profit |
|
| 1,919.9 |
|
| 1,670.3 |
|
| 1,568.9 |
Selling |
|
| 776.6 |
|
| 720.7 |
|
| 678.2 |
General and administrative |
|
| 372.3 |
|
| 338.8 |
|
| 321.6 |
Research and development |
|
| 58.7 |
|
| 51.3 |
|
| 47.9 |
Acquisition and integration related charges |
|
| 36.7 |
|
| 58.8 |
|
| 20.1 |
Restructuring and related charges |
|
| 14.7 |
|
| 26.6 |
|
| 19.2 |
Write-off from impairment of intangible assets |
|
| 4.7 |
|
| — |
|
| — |
Total operating expenses |
|
| 1,263.7 |
|
| 1,196.2 |
|
| 1,087.0 |
Operating income |
|
| 656.2 |
|
| 474.1 |
|
| 481.9 |
Interest expense |
|
| 250.0 |
|
| 271.9 |
|
| 202.1 |
Other non-operating expense, net |
|
| 8.6 |
|
| 8.9 |
|
| 6.3 |
Income from operations before income taxes |
|
| 397.6 |
|
| 193.3 |
|
| 273.5 |
Income tax expense |
|
| 40.0 |
|
| 43.9 |
|
| 59.0 |
Net income |
|
| 357.6 |
|
| 149.4 |
|
| 214.5 |
Net income attributable to non-controlling interest |
|
| 0.5 |
|
| 0.5 |
|
| 0.4 |
Net income attributable to controlling interest |
| $ | 357.1 |
| $ | 148.9 |
| $ | 214.1 |
Earnings Per Share |
|
|
|
|
|
|
|
|
|
Basic earnings per share |
| $ | 6.02 |
| $ | 2.68 |
| $ | 4.07 |
Diluted earnings per share |
|
| 5.99 |
|
| 2.66 |
|
| 4.02 |
Dividends per share |
|
| 1.47 |
|
| 1.27 |
|
| 1.15 |
Weighted Average Shares Outstanding |
|
|
|
|
|
|
|
|
|
Basic |
|
| 59.3 |
|
| 55.6 |
|
| 52.6 |
Diluted |
|
| 59.6 |
|
| 55.9 |
|
| 53.3 |
| 2013 | 2012 | 2011 | |||||||||
| Net sales | $ | 4,085,581 | $ | 3,252,435 | $ | 3,186,916 | |||||
| Cost of goods sold | 2,685,285 | 2,126,922 | 2,050,208 | ||||||||
| Restructuring and related charges | 9,984 | 9,835 | 7,841 | ||||||||
| Gross profit | 1,390,312 | 1,115,678 | 1,128,867 | ||||||||
| Selling | 636,958 | 521,191 | 536,535 | ||||||||
| General and administrative | 286,370 | 218,832 | 241,631 | ||||||||
| Research and development | 43,334 | 33,087 | 32,901 | ||||||||
| Acquisition and integration related charges | 48,445 | 31,066 | 36,603 | ||||||||
| Restructuring and related charges | 24,028 | 9,756 | 20,803 | ||||||||
| Intangible asset impairment | — | — | 32,450 | ||||||||
| Total operating expenses | 1,039,135 | 813,932 | 900,923 | ||||||||
| Operating income | 351,177 | 301,746 | 227,944 | ||||||||
| Interest expense | 375,625 | 191,911 | 208,329 | ||||||||
| Other expense, net | 3,506 | 878 | 2,491 | ||||||||
| (Loss) income from continuing operations before income taxes | (27,954 | ) | 108,957 | 17,124 | |||||||
| Income tax expense | 27,359 | 60,385 | 92,295 | ||||||||
| Net (loss) income | (55,313 | ) | 48,572 | (75,171 | ) | ||||||
| Less: Net loss attributable to noncontrolling interest, net of tax | (67 | ) | — | — | |||||||
| Net (loss) income attributable to controlling interest | $ | (55,246 | ) | $ | 48,572 | $ | (75,171 | ) | |||
| Basic earnings per share: | |||||||||||
| Weighted average shares of common stock outstanding | 52,034 | 51,608 | 51,092 | ||||||||
| Net (loss) income per share attributable to controlling interest | $ | (1.06 | ) | $ | 0.94 | $ | (1.47 | ) | |||
| Diluted earnings per share: | |||||||||||
| Weighted average shares of common stock outstanding | 52,034 | 53,309 | 51,092 | ||||||||
| Net (loss) income per share attributable to controlling interest | $ | (1.06 | ) | $ | 0.91 | $ | (1.47 | ) | |||
| Cash dividends declared per common share | $ | 0.75 | $ | 1.00 | $ | — | |||||
See accompanying notes which are an integral part of theseto the consolidated financial statements.
SPECTRUM BRANDS HOLDINGS, INC.
Years ended September 30, 2013, 20122016, 2015 and 2011
(Amounts in thousands)millions)
|
|
|
|
|
|
|
|
|
|
|
|
|
|
|
|
|
|
|
|
|
| 2016 |
| 2015 |
| 2014 | |||
Net income |
| $ | 357.6 |
| $ | 149.4 |
| $ | 214.5 |
Other comprehensive (loss) income, net of tax: |
|
|
|
|
|
|
|
|
|
Foreign currency translation loss, net tax of $2.3, $0.0 and $0.0, respectively |
|
| (8.5) |
|
| (113.0) |
|
| (32.6) |
Unrealized gain (loss) on hedging activity, net tax of $2.9, $3.0, and $4.2, respectively |
|
| 7.1 |
|
| (13.2) |
|
| 11.5 |
Defined benefit pension loss, net tax of $(10.8), $0.5 and $(1.6), respectively |
|
| (28.2) |
|
| (11.0) |
|
| (3.6) |
Other comprehensive loss, net of tax |
|
| (29.6) |
|
| (137.2) |
|
| (24.7) |
Comprehensive income |
|
| 328.0 |
|
| 12.2 |
|
| 189.8 |
Comprehensive (loss) income attributable to non-controlling interest |
|
| (0.3) |
|
| (0.2) |
|
| 0.4 |
Comprehensive income attributable to controlling interest |
| $ | 328.3 |
| $ | 12.4 |
| $ | 189.4 |
| 2013 | 2012 | 2011 | |||||||||
| Net (loss) income | $ | (55,313 | ) | $ | 48,572 | $ | (75,171 | ) | |||
| Other comprehensive (loss) income, net of tax: | |||||||||||
| Foreign currency translation | (6,622 | ) | (8,602 | ) | (10,607 | ) | |||||
| Unrealized (loss) gain on cash flow hedges | (2,509 | ) | 1,545 | 4,428 | |||||||
| Defined benefit pension gain (loss) | 4,248 | (11,932 | ) | (770 | ) | ||||||
| Other comprehensive loss, net of tax | (4,883 | ) | (18,989 | ) | (6,949 | ) | |||||
| Comprehensive (loss) income | (60,196 | ) | 29,583 | (82,120 | ) | ||||||
| Less: Comprehensive income attributable to noncontrolling interest | 136 | — | — | ||||||||
| Comprehensive (loss) income attributable to controlling interest | $ | (60,332 | ) | $ | 29,583 | $ | (82,120 | ) | |||
See accompanying notes which are an integral part of theseto the consolidated financial statements.
69
SPECTRUM BRANDS HOLDINGS, INC. AND SUBSIDIARIES
Years ended September 30, 2013, 20122016, 2015 and 20112014
(in millions)
|
|
|
|
|
|
|
|
|
|
|
|
|
|
|
|
|
|
|
|
|
|
|
|
|
|
|
|
|
|
|
|
|
|
|
|
|
|
|
|
|
|
|
|
|
|
|
|
|
|
|
|
|
|
|
|
|
|
|
|
|
|
|
|
|
|
| Accumulated |
|
|
|
|
|
|
|
|
|
|
|
| |
|
|
|
|
|
|
| Additional |
| Accumulated |
| Other |
|
|
| Total |
| Non- |
|
| |||||||
|
| Common Stock |
| Paid-in |
| Earnings |
| Comprehensive |
| Treasury |
| Shareholders' |
| controlling |
| Total | ||||||||||
|
| Shares |
| Amount |
| Capital |
| (Deficit) |
| Loss |
| Stock |
| Equity |
| Interest |
| Equity | ||||||||
Balances as of September 30, 2013 |
| 52.2 |
| $ | 0.5 |
| $ | 1,410.7 |
| $ | (435.9) |
| $ | (38.5) |
| $ | (39.8) |
| $ | 897.0 |
| $ | 43.1 |
| $ | 940.1 |
Net income |
| — |
|
| — |
|
| — |
|
| 214.1 |
|
| — |
|
| — |
|
| 214.1 |
|
| 0.4 |
|
| 214.5 |
Other comprehensive loss, net of tax |
| — |
|
| — |
|
| — |
|
| — |
|
| (24.6) |
|
| — |
|
| (24.6) |
|
| (0.1) |
|
| (24.7) |
Restricted stock issued and related tax withholdings |
| 0.6 |
|
| — |
|
| (25.0) |
|
| — |
|
| — |
|
| — |
|
| (25.0) |
|
| — |
|
| (25.0) |
Share based compensation |
| — |
|
| — |
|
| 47.7 |
|
| — |
|
| — |
|
| — |
|
| 47.7 |
|
| — |
|
| 47.7 |
Treasury stock purchases |
| (0.1) |
|
| — |
|
| — |
|
| — |
|
| — |
|
| (4.5) |
|
| (4.5) |
|
| — |
|
| (4.5) |
Dividend declared |
| — |
|
| — |
|
| — |
|
| (61.3) |
|
| — |
|
| — |
|
| (61.3) |
|
| — |
|
| (61.3) |
Balances at September 30, 2014 |
| 52.7 |
|
| 0.5 |
|
| 1,433.4 |
|
| (283.1) |
|
| (63.1) |
|
| (44.3) |
|
| 1,043.4 |
|
| 43.4 |
|
| 1,086.8 |
Net income |
| — |
|
| — |
|
| — |
|
| 148.9 |
|
| — |
|
| — |
|
| 148.9 |
|
| 0.5 |
|
| 149.4 |
Other comprehensive loss, net of tax |
| — |
|
| — |
|
| — |
|
| — |
|
| (137.0) |
|
| — |
|
| (137.0) |
|
| (0.2) |
|
| (137.2) |
Common stock issuance |
| 6.5 |
|
| 0.1 |
|
| 585.9 |
|
| — |
|
| — |
|
| — |
|
| 586.0 |
|
| — |
|
| 586.0 |
Restricted stock issued and related tax withholdings |
| 0.4 |
|
| — |
|
| (15.4) |
|
| — |
|
| — |
|
| — |
|
| (15.4) |
|
| — |
|
| (15.4) |
Share based compensation |
| — |
|
| — |
|
| 29.7 |
|
| — |
|
| — |
|
| — |
|
| 29.7 |
|
| — |
|
| 29.7 |
Treasury stock purchases |
| (0.2) |
|
| — |
|
| — |
|
| — |
|
| — |
|
| (21.2) |
|
| (21.2) |
|
| — |
|
| (21.2) |
Dividend declared |
| — |
|
| — |
|
| — |
|
| (71.3) |
|
| — |
|
| — |
|
| (71.3) |
|
| — |
|
| (71.3) |
Balances at September 30, 2015 |
| 59.4 |
|
| 0.6 |
|
| 2,033.6 |
|
| (205.5) |
|
| (200.1) |
|
| (65.5) |
|
| 1,563.1 |
|
| 43.7 |
|
| 1,606.8 |
Net income |
| — |
|
| — |
|
| — |
|
| 357.1 |
|
| — |
|
| — |
|
| 357.1 |
|
| 0.5 |
|
| 357.6 |
Other comprehensive loss, net of tax |
| — |
|
| — |
|
| — |
|
| — |
|
| (29.3) |
|
| — |
|
| (29.3) |
|
| (0.3) |
|
| (29.6) |
Restricted stock issued and related tax withholdings |
| 0.4 |
|
| — |
|
| 0.4 |
|
| — |
|
| — |
|
| — |
|
| 0.4 |
|
| — |
|
| 0.4 |
Share based compensation |
| — |
|
| — |
|
| 39.6 |
|
| — |
|
| — |
|
| — |
|
| 39.6 |
|
| — |
|
| 39.6 |
Treasury stock purchases |
| (0.4) |
|
| — |
|
| — |
|
| — |
|
| — |
|
| (42.8) |
|
| (42.8) |
|
| — |
|
| (42.8) |
Dividend declared |
| — |
|
| — |
|
| — |
|
| (88.0) |
|
| — |
|
| — |
|
| (88.0) |
|
| — |
|
| (88.0) |
Balances at September 30, 2016 |
| 59.4 |
| $ | 0.6 |
| $ | 2,073.6 |
| $ | 63.6 |
| $ | (229.4) |
| $ | (108.3) |
| $ | 1,800.1 |
| $ | 43.9 |
| $ | 1,844.0 |
| Common Stock | Additional Paid-In Capital | Accumulated Deficit | Accumulated Other Comprehensive Income (Loss), net of tax | Treasury Stock | Total Shareholders’ Equity | Non-controlling Interest | Total Equity (Deficit) | ||||||||||||||||||||||||||||
| Shares | Amount | ||||||||||||||||||||||||||||||||||
| Balances at September 30, 2010 | 51,020 | $ | 514 | $ | 1,316,461 | $ | (260,892 | ) | $ | (7,497 | ) | $ | (2,207 | ) | $ | 1,046,379 | $ | — | $ | 1,046,379 | |||||||||||||||
| Net loss | — | — | — | (75,171 | ) | — | — | (75,171 | ) | — | (75,171 | ) | |||||||||||||||||||||||
| Other comprehensive loss | — | — | — | — | (6,949 | ) | — | (6,949 | ) | — | (6,949 | ) | |||||||||||||||||||||||
| Issuance of common stock | 1,150 | 11 | 29,840 | — | — | — | 29,851 | — | 29,851 | ||||||||||||||||||||||||||
| Vesting of restricted stock units | 180 | — | — | — | — | — | — | — | — | ||||||||||||||||||||||||||
| Treasury stock purchases | (124 | ) | — | — | — | — | (3,409 | ) | (3,409 | ) | — | (3,409 | ) | ||||||||||||||||||||||
| Amortization of unearned compensation | — | — | 30,389 | — | — | — | 30,389 | — | 30,389 | ||||||||||||||||||||||||||
| Restricted stock units surrendered | — | — | (2,593 | ) | — | — | — | (2,593 | ) | — | (2,593 | ) | |||||||||||||||||||||||
| Balances at September 30, 2011 | 52,226 | $ | 525 | $ | 1,374,097 | $ | (336,063 | ) | $ | (14,446 | ) | $ | (5,616 | ) | $ | 1,018,497 | $ | — | $ | 1,018,497 | |||||||||||||||
| Net loss | — | — | — | 48,572 | — | — | 48,572 | — | 48,572 | ||||||||||||||||||||||||||
| Other comprehensive loss | — | — | — | — | (18,989 | ) | — | (18,989 | ) | — | (18,989 | ) | |||||||||||||||||||||||
| Vesting of restricted stock units | 368 | 3 | (3 | ) | — | — | — | — | — | — | |||||||||||||||||||||||||
| Treasury stock purchases | (1,111 | ) | — | — | — | — | (30,996 | ) | (30,996 | ) | — | (30,996 | ) | ||||||||||||||||||||||
| Amortization of unearned compensation | — | — | 29,164 | — | — | �� | 29,164 | — | 29,164 | ||||||||||||||||||||||||||
| Restricted stock units surrendered | — | — | (3,997 | ) | — | — | — | (3,997 | ) | — | (3,997 | ) | |||||||||||||||||||||||
| Dividend declared | — | — | — | (53,156 | ) | — | — | (53,156 | ) | — | (53,156 | ) | |||||||||||||||||||||||
| Balances at September 30, 2012 | 51,483 | $ | 528 | $ | 1,399,261 | $ | (340,647 | ) | $ | (33,435 | ) | $ | (36,612 | ) | $ | 989,095 | $ | — | $ | 989,095 | |||||||||||||||
| Net income | — | — | — | (55,246 | ) | — | — | (55,246 | ) | (67 | ) | (55,313 | ) | ||||||||||||||||||||||
| Other comprehensive (loss) income | — | — | $ | — | — | (5,086 | ) | — | (5,086 | ) | 203 | (4,883 | ) | ||||||||||||||||||||||
| Vesting of restricted stock units | 780 | 7 | (7 | ) | — | — | — | — | — | — | |||||||||||||||||||||||||
| Treasury stock purchases | (53 | ) | — | — | — | — | (3,208 | ) | (3,208 | ) | — | (3,208 | ) | ||||||||||||||||||||||
| Amortization of unearned compensation | — | — | 31,534 | — | — | — | 31,534 | — | 31,534 | ||||||||||||||||||||||||||
| Restricted stock units surrendered | — | — | (20,050 | ) | — | — | — | (20,050 | ) | — | (20,050 | ) | |||||||||||||||||||||||
| Dividend declared | — | — | — | (40,018 | ) | — | — | (40,018 | ) | — | (40,018 | ) | |||||||||||||||||||||||
| Noncontrolling interest | — | — | — | — | — | — | — | 42,939 | 42,939 | ||||||||||||||||||||||||||
| Balances at September 30, 2013 | 52,210 | $ | 535 | $ | 1,410,738 | $ | (435,911 | ) | $ | (38,521 | ) | $ | (39,820 | ) | $ | 897,021 | 43,075 | $ | 940,096 | ||||||||||||||||
See accompanying notes which are an integral part of theseto the consolidated financial statements.
70
SPECTRUM BRANDS HOLDINGS, INC.
Years ended September 30, 2013, 20122016, 2015 and 2011
(Amounts in thousands)millions)
|
|
|
|
|
|
|
|
|
|
|
|
|
|
|
|
|
|
|
|
|
| 2016 |
| 2015 |
| 2014 | |||
Cash flows from operating activities |
|
|
|
|
|
|
|
|
|
Net income |
| $ | 357.6 |
| $ | 149.4 |
| $ | 214.5 |
Adjustments to reconcile net income to net cash provided by operating activities: |
|
|
|
|
|
|
|
|
|
Amortization of intangible assets |
|
| 93.9 |
|
| 87.8 |
|
| 81.7 |
Depreciation |
|
| 89.1 |
|
| 82.2 |
|
| 75.9 |
Share based compensation |
|
| 64.4 |
|
| 47.6 |
|
| 46.8 |
Non-cash inventory adjustment from acquisitions |
|
| — |
|
| 21.7 |
|
| — |
Non-cash restructuring and related charges |
|
| 5.6 |
|
| 19.1 |
|
| 9.2 |
Write off for impairment of intangible assets |
|
| 4.7 |
|
| — |
|
| — |
Amortization of debt issuance costs |
|
| 11.6 |
|
| 12.6 |
|
| 12.8 |
Write-off of debt issuance costs on retired debt |
|
| 5.8 |
|
| 11.2 |
|
| 6.4 |
Non-cash debt accretion |
|
| 2.3 |
|
| 3.0 |
|
| 3.1 |
Write-off of unamortized discount on retired debt |
|
| — |
|
| 1.7 |
|
| 2.8 |
Deferred tax (benefit) expense |
|
| (25.5) |
|
| (4.6) |
|
| 1.9 |
Net changes in operating assets and liabilities, net of effects of acquisitions |
|
|
|
|
|
|
|
|
|
Receivables |
|
| 48.5 |
|
| 93.4 |
|
| 32.5 |
Inventories |
|
| 40.2 |
|
| (54.5) |
|
| 10.6 |
Prepaid expenses and other current assets |
|
| (7.5) |
|
| (3.1) |
|
| (0.6) |
Accounts payable and accrued liabilities |
|
| (40.5) |
|
| 48.7 |
|
| (36.5) |
Other |
|
| (35.2) |
|
| (71.9) |
|
| (28.4) |
Net cash provided by operating activities |
|
| 615.0 |
|
| 444.3 |
|
| 432.7 |
Cash flows from investing activities |
|
|
|
|
|
|
|
|
|
Purchases of property, plant and equipment |
|
| (95.2) |
|
| (89.1) |
|
| (73.3) |
Business acquisitions, net of cash acquired |
|
| — |
|
| (1,191.1) |
|
| (27.6) |
Proceeds from sales of property, plant and equipment |
|
| 1.0 |
|
| 1.4 |
|
| 9.2 |
Other investing activities |
|
| (4.2) |
|
| (0.9) |
|
| (1.8) |
Net cash used by investing activities |
|
| (98.4) |
|
| (1,279.7) |
|
| (93.5) |
Cash flows from financing activities |
|
|
|
|
|
|
|
|
|
Proceeds from issuance of debt |
|
| 485.0 |
|
| 3,281.4 |
|
| 524.2 |
Payment of debt |
|
| (819.5) |
|
| (2,793.1) |
|
| (770.9) |
Payment of debt issuance costs |
|
| (9.3) |
|
| (38.1) |
|
| (5.4) |
Payment of cash dividends |
|
| (87.2) |
|
| (70.7) |
|
| (61.9) |
Treasury stock purchases |
|
| (42.8) |
|
| (21.2) |
|
| (4.5) |
Payment of contingent consideration |
|
| (3.2) |
|
| — |
|
| — |
Share based tax withholding payments, net of proceeds upon vesting |
|
| (10.8) |
|
| (2.6) |
|
| (25.0) |
Net proceeds from issuance of common stock |
|
| — |
|
| 562.7 |
|
| — |
Net cash (used) provided by financing activities |
|
| (487.8) |
|
| 918.4 |
|
| (343.5) |
Effect of exchange rate changes on cash and cash equivalents due to Venezuela devaluation |
|
| — |
|
| (2.5) |
|
| — |
Effect of exchange rate changes on cash and cash equivalents |
|
| (1.4) |
|
| (27.2) |
|
| (8.3) |
Net increase (decrease) in cash and cash equivalents |
|
| 27.4 |
|
| 53.3 |
|
| (12.6) |
Cash and cash equivalents, beginning of period |
|
| 247.9 |
|
| 194.6 |
|
| 207.2 |
Cash and cash equivalents, end of period |
| $ | 275.3 |
| $ | 247.9 |
| $ | 194.6 |
Supplemental disclosure of cash flow information |
|
|
|
|
|
|
|
|
|
Cash paid for interest |
| $ | 253.9 |
| $ | 250.3 |
| $ | 178.7 |
Cash paid for taxes |
| $ | 35.4 |
| $ | 54.4 |
| $ | 80.7 |
Non cash investing activities |
|
|
|
|
|
|
|
|
|
Acquisition of property, plant and equipment through capital leases |
| $ | 37.6 |
| $ | 4.1 |
| $ | 34.4 |
Non cash financing activities |
|
|
|
|
|
|
|
|
|
Issuance of shares through stock compensation plan |
| $ | 47.9 |
| $ | 49.8 |
| $ | 40.0 |
Assumption of AAG debt |
| $ | — |
| $ | 540.0 |
| $ | — |
| 2013 | 2012 | 2011 | |||||||||
| Cash flows from operating activities: | |||||||||||
| Net (loss) income | $ | (55,313 | ) | $ | 48,572 | $ | (75,171 | ) | |||
| Adjustments to reconcile net (loss) income to net cash used by operating activities: | |||||||||||
| Depreciation | 62,114 | 40,950 | 47,065 | ||||||||
| Amortization of intangibles | 77,779 | 63,666 | 57,695 | ||||||||
| Amortization of unearned restricted stock compensation | 43,861 | 29,164 | 30,389 | ||||||||
| Amortization of debt issuance costs | 13,241 | 9,922 | 13,198 | ||||||||
| Non-cash increase to cost of goods sold from sale of HHI Business acquisition inventory | 31,000 | — | — | ||||||||
| Intangible asset impairment | — | — | 32,450 | ||||||||
| Write-off of unamortized (premium) / discount on retired debt | (5,178 | ) | (466 | ) | 8,950 | ||||||
| Write-off of debt issuance costs | 21,574 | 2,946 | 15,420 | ||||||||
| Non-cash restructuring and related charges | 23,245 | 5,195 | 15,143 | ||||||||
| Non-cash debt accretion | 2,482 | 722 | 4,773 | ||||||||
| Note retirement tender, call premium and related costs | 111,307 | 25,400 | — | ||||||||
| Changes in assets and liabilities, net of effects of acquisitions: | |||||||||||
| Accounts receivable | (62,316 | ) | 22,892 | 12,969 | |||||||
| Inventories | (2,707 | ) | (11,642 | ) | 96,406 | ||||||
| Prepaid expenses and other current assets | (4,269 | ) | 561 | 815 | |||||||
| Accounts payable and accrued liabilities | (818 | ) | 5,360 | (58,023 | ) | ||||||
| Deferred taxes | (21,655 | ) | 22,633 | 57,314 | |||||||
| Other changes in assets and liabilities | 22,162 | (7,124 | ) | (29,522 | ) | ||||||
| Net cash provided by operating activities | 256,509 | 258,751 | 229,871 | ||||||||
| Cash flows from investing activities: | |||||||||||
| Purchases of property, plant and equipment | (81,976 | ) | (46,809 | ) | (36,160 | ) | |||||
| Acquisition of Shaser, net of cash acquired | (48,766 | ) | — | — | |||||||
| Acquisition of the HHI Business, net of cash acquired | (1,351,008 | ) | — | — | |||||||
| Acquisition of Black Flag | — | (43,750 | ) | — | |||||||
| Acquisition of FURminator, net of cash acquired | — | (139,390 | ) | — | |||||||
| Acquisition of Seed Resources, net of cash acquired | — | — | (11,053 | ) | |||||||
| Proceeds from sale of assets held for sale | — | — | 6,997 | ||||||||
| Other investing activities | (1,178 | ) | (1,545 | ) | (5,480 | ) | |||||
| Net cash used by investing activities | (1,482,928 | ) | (231,494 | ) | (45,696 | ) | |||||
| Cash flows from financing activities: | |||||||||||
| Proceeds from issuance of Term Loan, net of discount | 1,936,250 | — | — | ||||||||
| Proceeds from issuance of 6.375% Notes | 520,000 | — | — | ||||||||
| Proceeds from issuance of 6.625% Notes | 570,000 | — | — | ||||||||
| Payment of 9.5% Notes, including tender and call premium | (1,061,307 | ) | — | — | |||||||
| Proceeds from issuance of 6.75% Notes | — | 300,000 | — | ||||||||
| Payment of 12% Notes, including tender and call premium | — | (270,431 | ) | — | |||||||
| Proceeds from issuance of 9.5% Notes, including premium | — | 217,000 | — | ||||||||
| Payment of Senior Credit Facilities, excluding ABL revolving credit facility | (571,093 | ) | (155,061 | ) | (224,763 | ) | |||||
| Prepayment penalty of term loan facility | — | — | (5,653 | ) | |||||||
| Debt issuance costs | (60,850 | ) | (11,231 | ) | (12,616 | ) | |||||
| Other debt financing, net | 11,941 | 392 | 5,788 | ||||||||
| Reduction of other debt | (1,251 | ) | (4,112 | ) | — | ||||||
| Cash dividends paid | (40,108 | ) | (51,450 | ) | — | ||||||
| Treasury stock purchases | (3,208 | ) | (30,996 | ) | (3,409 | ) | |||||
| Net proceeds from equity offering | — | — | 29,851 | ||||||||
| Share based award tax withholding payments | (20,141 | ) | (3,936 | ) | (2,482 | ) | |||||
| Other financing activities | — | (953 | ) | — | |||||||
| Net cash provided (used) by financing activities | 1,280,233 | (10,778 | ) | (213,284 | ) | ||||||
| Effect on cash and cash equivalents due to Venezuela devaluation | (1,871 | ) | — | — | |||||||
| Effect of exchange rate changes on cash and cash equivalents - other | (2,647 | ) | (932 | ) | 909 | ||||||
| Net increase (decrease) in cash and cash equivalents | 49,296 | 15,547 | (28,200 | ) | |||||||
| Cash and cash equivalents, beginning of year | 157,961 | 142,414 | 170,614 | ||||||||
| Cash and cash equivalents, end of year | $ | 207,257 | $ | 157,961 | $ | 142,414 | |||||
| Supplemental disclosure of cash flow information: | |||||||||||
| Cash paid for interest | $ | 336,798 | $ | 185,384 | $ | 171,577 | |||||
| Cash paid for taxes | $ | 49,638 | $ | 39,173 | $ | 37,171 | |||||
See accompanyingaccompany notes which are an integral part of theseto the consolidated financial statements.
71
Consolidated Statements of Financial Position
September 30, 2016 and 2015
(in millions)
|
|
|
|
|
|
|
|
|
|
|
|
|
|
|
| 2016 |
| 2015 | ||
Assets |
|
|
|
|
|
|
Current assets: |
|
|
|
|
|
|
Cash and cash equivalents |
| $ | 270.8 |
| $ | 247.9 |
Trade receivables, net |
|
| 482.6 |
|
| 498.8 |
Other receivables |
|
| 55.6 |
|
| 87.9 |
Inventories |
|
| 740.6 |
|
| 780.8 |
Prepaid expenses and other current assets |
|
| 78.8 |
|
| 72.1 |
Total current assets |
|
| 1,628.4 |
|
| 1,687.5 |
Property, plant and equipment, net |
|
| 542.1 |
|
| 507.1 |
Deferred charges and other |
|
| 32.1 |
|
| 42.1 |
Goodwill |
|
| 2,478.4 |
|
| 2,476.7 |
Intangible assets, net |
|
| 2,372.5 |
|
| 2,480.3 |
Total assets |
| $ | 7,053.5 |
| $ | 7,193.7 |
Liabilities and Shareholder's Equity |
|
|
|
|
|
|
Current liabilities: |
|
|
|
|
|
|
Current portion of long-term debt |
| $ | 164.0 |
| $ | 68.5 |
Accounts payable |
|
| 580.1 |
|
| 620.6 |
Accrued wages and salaries |
|
| 122.9 |
|
| 96.5 |
Accrued interest |
|
| 39.3 |
|
| 63.3 |
Other current liabilities |
|
| 188.3 |
|
| 211.9 |
Total current liabilities |
|
| 1,094.6 |
|
| 1,060.8 |
Long-term debt, net of current portion |
|
| 3,456.2 |
|
| 3,872.1 |
Deferred income taxes |
|
| 532.7 |
|
| 572.5 |
Other long-term liabilities |
|
| 140.6 |
|
| 115.5 |
Total liabilities |
|
| 5,224.1 |
|
| 5,620.9 |
Commitments and contingencies (Note 18) |
|
|
|
|
|
|
Shareholder's equity: |
|
|
|
|
|
|
Other capital |
|
| 2,000.9 |
|
| 1,969.9 |
Accumulated earnings (deficit) |
|
| 8.1 |
|
| (246.7) |
Accumulated other comprehensive loss, net of tax |
|
| (229.4) |
|
| (200.1) |
Total shareholder's equity |
|
| 1,779.6 |
|
| 1,523.1 |
Noncontrolling interest |
|
| 49.8 |
|
| 49.7 |
Total equity |
|
| 1,829.4 |
|
| 1,572.8 |
Total liabilities and equity |
| $ | 7,053.5 |
| $ | 7,193.7 |
See accompanying notes to the consolidated financial statements
72
Consolidated Statements of Income
Years ended September 30, 2016, 2015 and 2014
(in millions)
|
|
|
|
|
|
|
|
|
|
|
|
|
|
|
|
|
|
|
|
|
| 2016 |
| 2015 |
| 2014 | |||
Net sales |
| $ | 5,039.7 |
| $ | 4,690.4 |
| $ | 4,429.1 |
Cost of goods sold |
|
| 3,119.3 |
|
| 3,018.0 |
|
| 2,856.5 |
Restructuring and related charges |
|
| 0.5 |
|
| 2.1 |
|
| 3.7 |
Gross profit |
|
| 1,919.9 |
|
| 1,670.3 |
|
| 1,568.9 |
Selling |
|
| 776.6 |
|
| 720.7 |
|
| 678.2 |
General and administrative |
|
| 366.6 |
|
| 332.4 |
|
| 319.0 |
Research and development |
|
| 58.7 |
|
| 51.3 |
|
| 47.9 |
Acquisition and integration related charges |
|
| 36.7 |
|
| 58.8 |
|
| 20.1 |
Restructuring and related charges |
|
| 14.7 |
|
| 26.6 |
|
| 19.2 |
Write-off from impairment of intangible assets |
|
| 4.7 |
|
| — |
|
| — |
Total operating expenses |
|
| 1,258.0 |
|
| 1,189.8 |
|
| 1,084.4 |
Operating income |
|
| 661.9 |
|
| 480.5 |
|
| 484.5 |
Interest expense |
|
| 250.0 |
|
| 271.9 |
|
| 202.1 |
Other non-operating expense, net |
|
| 8.6 |
|
| 8.9 |
|
| 6.3 |
Income from operations before income taxes |
|
| 403.3 |
|
| 199.7 |
|
| 276.1 |
Income tax expense |
|
| 51.0 |
|
| 43.9 |
|
| 59.0 |
Net income |
|
| 352.3 |
|
| 155.8 |
|
| 217.1 |
Net income attributable to non-controlling interest |
|
| 0.4 |
|
| 0.4 |
|
| 0.3 |
Net income attributable to controlling interest |
| $ | 351.9 |
| $ | 155.4 |
| $ | 216.8 |
See accompanying notes to the consolidated financial statements
SB/RH Holdings, LLC
Consolidated Statements of Comprehensive Income
Years ended September 30, 2016, 2015 and 2014
(in millions)
|
|
|
|
|
|
|
|
|
|
|
|
|
|
|
|
|
|
|
|
|
| 2016 |
| 2015 |
| 2014 | |||
Net income |
| $ | 352.3 |
| $ | 155.8 |
| $ | 217.1 |
Other comprehensive (loss) income, net of tax: |
|
|
|
|
|
|
|
|
|
Foreign currency translation loss, net tax of $2.3, $0.0, and $0.0 respectively |
|
| (8.5) |
|
| (113.0) |
|
| (32.5) |
Unrealized gain (loss) on hedging activity, net tax of $2.9, $3.0, and $4.2, respectively |
|
| 7.1 |
|
| (13.2) |
|
| 11.5 |
Defined benefit pension loss, net tax of $(10.8), $0.5 and $(1.6), respectively |
|
| (28.2) |
|
| (11.0) |
|
| (3.6) |
Other comprehensive loss, net of tax |
|
| (29.6) |
|
| (137.2) |
|
| (24.6) |
Comprehensive income |
|
| 322.7 |
|
| 18.6 |
|
| 192.5 |
Comprehensive (loss) income attributable to non-controlling interest |
|
| (0.3) |
|
| (0.2) |
|
| 0.4 |
Comprehensive income attributable to controlling interest |
| $ | 323.0 |
| $ | 18.8 |
| $ | 192.1 |
See accompanying notes to the consolidated financial statements
73
Consolidated Statements of Shareholder’s Equity
Years ended September 30, 2016, 2015 and 2014
(in millions)
|
|
|
|
|
|
|
|
|
|
|
|
|
|
|
|
|
|
|
|
|
|
|
|
|
|
| Accumulated |
|
|
|
|
|
|
|
|
| |
|
|
|
| Accumulated |
| Other |
| Total |
| Non- |
|
|
| |||||
|
| Other |
| Earnings |
| Comprehensive |
| Shareholder's |
| controlling |
|
| ||||||
|
| Capital |
| (Deficit) |
| (Loss) |
| Equity |
| Interest |
| Total Equity | ||||||
Balances at September 30, 2013 |
| $ | 1,393.1 |
| $ | (469.9) |
| $ | (38.5) |
| $ | 884.7 |
| $ | 49.2 |
| $ | 933.9 |
Net income |
|
| — |
|
| 216.8 |
|
| — |
|
| 216.8 |
|
| 0.3 |
|
| 217.1 |
Other comprehensive loss, net of tax |
|
| — |
|
| — |
|
| (24.6) |
|
| (24.6) |
|
| — |
|
| (24.6) |
Restricted stock issued and related tax withholdings |
|
| (25.0) |
|
| — |
|
| — |
|
| (25.0) |
|
| — |
|
| (25.0) |
Share based compensation |
|
| 45.7 |
|
| — |
|
| — |
|
| 45.7 |
|
| — |
|
| 45.7 |
Dividends declared |
|
| — |
|
| (76.9) |
|
| — |
|
| (76.9) |
|
| — |
|
| (76.9) |
Balances at September 30, 2014 |
|
| 1,413.8 |
|
| (330.0) |
|
| (63.1) |
|
| 1,020.7 |
|
| 49.5 |
|
| 1,070.2 |
Net income |
|
| — |
|
| 155.4 |
|
| — |
|
| 155.4 |
|
| 0.4 |
|
| 155.8 |
Other comprehensive loss, net of tax |
|
| — |
|
| — |
|
| (137.0) |
|
| (137.0) |
|
| (0.2) |
|
| (137.2) |
Contribution from parent |
|
| 570.6 |
|
| — |
|
| — |
|
| 570.6 |
|
| — |
|
| 570.6 |
Restricted stock issued and related tax withholdings |
|
| (38.4) |
|
| — |
|
| — |
|
| (38.4) |
|
| — |
|
| (38.4) |
Share based compensation |
|
| 23.9 |
|
| — |
|
| — |
|
| 23.9 |
|
| — |
|
| 23.9 |
Dividends declared |
|
| — |
|
| (72.1) |
|
| — |
|
| (72.1) |
|
| — |
|
| (72.1) |
Balances at September 30, 2015 |
|
| 1,969.9 |
|
| (246.7) |
|
| (200.1) |
|
| 1,523.1 |
|
| 49.7 |
|
| 1,572.8 |
Net income |
|
| — |
|
| 351.9 |
|
| — |
|
| 351.9 |
|
| 0.4 |
|
| 352.3 |
Other comprehensive loss, net of tax |
|
| — |
|
| — |
|
| (29.3) |
|
| (29.3) |
|
| (0.3) |
|
| (29.6) |
Contribution from parent |
|
| 5.6 |
|
| — |
|
| — |
|
| 5.6 |
|
| — |
|
| 5.6 |
Restricted stock issued and related tax withholdings |
|
| (9.1) |
|
| — |
|
| — |
|
| (9.1) |
|
| — |
|
| (9.1) |
Share based compensation |
|
| 34.5 |
|
| — |
|
| — |
|
| 34.5 |
|
| — |
|
| 34.5 |
Dividends declared |
|
| — |
|
| (97.1) |
|
| — |
|
| (97.1) |
|
| — |
|
| (97.1) |
Balances at September 30, 2016 |
| $ | 2,000.9 |
| $ | 8.1 |
| $ | (229.4) |
| $ | 1,779.6 |
| $ | 49.8 |
| $ | 1,829.4 |
See accompanying notes to the consolidated financial statements.
74
Consolidated Statements of Cash Flows
Years ended September 30, 2016, 2015 and 2014
(in millions)
|
|
|
|
|
|
|
|
|
|
|
|
|
|
|
|
|
|
|
|
|
| 2016 |
| 2015 |
| 2014 | |||
Cash flows from operating activities |
|
|
|
|
|
|
|
|
|
Net income |
| $ | 352.3 |
| $ | 155.8 |
| $ | 217.1 |
Adjustments to reconcile net income to net cash provided by operating activities: |
|
|
|
|
|
|
|
|
|
Amortization of intangible assets |
|
| 93.9 |
|
| 87.8 |
|
| 81.7 |
Depreciation |
|
| 89.1 |
|
| 82.2 |
|
| 75.9 |
Share based compensation |
|
| 59.3 |
|
| 41.8 |
|
| 44.9 |
Non-cash inventory adjustment from acquisitions |
|
| — |
|
| 21.7 |
|
| — |
Non-cash restructuring and related charges |
|
| 5.6 |
|
| 19.1 |
|
| 9.2 |
Write off for impairment of intangible assets |
|
| 4.7 |
|
| — |
|
| — |
Amortization of debt issuance costs |
|
| 11.6 |
|
| 12.6 |
|
| 12.8 |
Write-off of debt issuance costs on retired debt |
|
| 5.8 |
|
| 11.2 |
|
| 6.4 |
Non-cash debt accretion |
|
| 2.3 |
|
| 3.0 |
|
| 3.1 |
Write-off of unamortized discount on retired debt |
|
| — |
|
| 1.7 |
|
| 2.8 |
Deferred tax (benefit) expense |
|
| (14.5) |
|
| (4.6) |
|
| 1.9 |
Net changes in operating assets and liabilities, net of effects of acquisitions |
|
|
|
|
|
|
|
|
|
Receivables |
|
| 48.5 |
|
| 93.4 |
|
| 32.5 |
Inventories |
|
| 40.2 |
|
| (54.5) |
|
| 10.6 |
Prepaid expenses and other |
|
| (7.5) |
|
| (3.1) |
|
| 0.7 |
Accounts payable and accrued liabilities |
|
| (40.5) |
|
| 48.7 |
|
| (35.9) |
Other |
|
| (49.2) |
|
| (75.0) |
|
| (29.0) |
Net cash provided by operating activities |
|
| 601.6 |
|
| 441.8 |
|
| 434.7 |
Cash flows from investing activities |
|
|
|
|
|
|
|
|
|
Purchases of property, plant and equipment |
|
| (95.2) |
|
| (89.1) |
|
| (73.3) |
Business acquisitions, net of cash acquired |
|
| — |
|
| (1,191.1) |
|
| (27.6) |
Proceeds from sales of property, plant and equipment |
|
| 1.0 |
|
| 1.4 |
|
| 9.2 |
Other investing activities |
|
| (4.2) |
|
| (0.9) |
|
| (1.8) |
Net cash used by investing activities |
|
| (98.4) |
|
| (1,279.7) |
|
| (93.5) |
Cash flows from financing activities |
|
|
|
|
|
|
|
|
|
Proceeds from issuance of debt |
|
| 498.9 |
|
| 3,320.3 |
|
| 540.1 |
Payment of debt |
|
| (868.1) |
|
| (2,813.2) |
|
| (770.9) |
Payment of debt issuance costs |
|
| (9.3) |
|
| (38.1) |
|
| (5.4) |
Payment of cash dividends to parent |
|
| (97.2) |
|
| (72.1) |
|
| (77.0) |
Payment of contingent consideration |
|
| (3.2) |
|
| — |
|
| — |
Share based tax withholding payments, net of proceeds upon vesting |
|
| — |
|
| (2.6) |
|
| (25.0) |
Capital contribution from parent |
|
| — |
|
| 528.3 |
|
| — |
Net cash (used) provided by financing activities |
|
| (478.9) |
|
| 922.6 |
|
| (338.2) |
Effect of exchange rate changes on cash and cash equivalents due to Venezuela devaluation |
|
| — |
|
| (2.5) |
|
| — |
Effect of exchange rate changes on cash and cash equivalents |
|
| (1.4) |
|
| (27.2) |
|
| (8.3) |
Net increase (decrease) in cash and cash equivalents |
|
| 22.9 |
|
| 55.0 |
|
| (5.3) |
Cash and cash equivalents, beginning of period |
|
| 247.9 |
|
| 192.9 |
|
| 198.2 |
Cash and cash equivalents, end of period |
| $ | 270.8 |
| $ | 247.9 |
| $ | 192.9 |
Supplemental disclosure of cash flow information |
|
|
|
|
|
|
|
|
|
Cash paid for interest |
| $ | 253.9 |
| $ | 250.3 |
| $ | 178.7 |
Cash paid for taxes |
| $ | 35.4 |
| $ | 54.4 |
| $ | 80.7 |
Non cash investing activities |
|
|
|
|
|
|
|
|
|
Acquisition of property, plant and equipment through capital leases |
| $ | 37.6 |
| $ | 49.8 |
| $ | 40.0 |
Assumption of AAG debt |
| $ | — |
| $ | 540.0 |
| $ | — |
See accompanying notes to the consolidated financialstatements.
75
SPECTRUM BRANDS HOLDINGS, INC.
SB/RH HOLDINGS, LLC
NOTES TO THE CONSOLIDATED FINANCIAL STATEMENTS
This report is a combined report of Spectrum Brands Holdings, Inc. (“SBH”) and SB/RH Holdings, LLC (“SB/RH”) (collectively, the “Company”). The notes to the consolidated financial statements that follow include both consolidated SBH and SB/RH Notes, unless otherwise indicated below.
NOTE 1 - DESCRIPTION OF BUSINESS
Spectrum Brands Holdings, Inc., a Delaware corporation, (“SB Holdings” or the “Company”), is a diversified global branded consumer products company. Spectrum Brands, Inc. (“Spectrum Brands”), is a wholly owned subsidiary of SB Holdings. SB Holdings'SBH’s common stock trades on the New York Stock Exchange (the “NYSE”) under the symbol “SPB.”
Segment | Products | Brands | Regions | |||
GBA | Consumer batteries: Alkaline, zinc carbon, and NiMH rechargeable batteries; hearing aid and other specialty battery products; battery powered portable lighting products. | Consumer batteries: Rayovac® , VARTA®. | NA | |||
HHI | Hardware: Hinges, security hardware, screen and storm door products, garage door hardware, window hardware and floor protection. | Hardware: National Hardware®, Stanley® and FANAL®. | NA | |||
PET | Companion Animal: Dog, cat and small animal food and treats; clean-up and training aid products and accessories; pet health and grooming products. | Companion Animal: 8-in-1®, Dingo®, Nature's Miracle®, Wild Harvest®, Littermaid®, Jungle®, Excel®, FURminator®, IAMS®, Eukanuba®, Healthy-Hide®, ProSense®, Perfect Coat®, eCOTRITION®, Birdola® and Digest-eeze®. | NA | |||
H&G | Controls: Outdoor insect and weed control solutions, animal repellents. | Controls: Spectracide®, Garden Safe®, Liquid Fence®, and EcoLogic®. | NA | |||
GAC | Appearance: Protectants, wipes, tire and wheel care products, glass cleaners, leather care products, air fresheners and washes. | Appearance: Armor All®. | NA |
76
SPECTRUM BRANDS HOLDINGS, INC.
SB/RH HOLDINGS, LLC
NOTES TO THE CONSOLIDATED FINANCIAL STATEMENTS
NOTE 2 - Significant Accounting Policies and Practices
Principles of Consolidation and Fiscal Year End
The consolidated financial statements include the financial statements of SB Holdingsthe Company and its majority owned subsidiaries and have been prepared in accordance with U.S.Accounting Principles Generally Accepted Accounting Principlesin the United States (“GAAP”). All intercompany transactions have been eliminated.
The Company’s fiscal year ends on September 30. References herein to Fiscal 2013, Fiscal 2012Throughout the year, the Company reports its results using fiscal quarters whereby each three month quarterly reporting period is approximately thirteen weeks in length and Fiscal 2011 refer toends on a Sunday. The exceptions are the first quarter, which begins on October 1, and the fourth quarter, which ends on September 30. For the year ended September 30, 2016, the fiscal yearsquarters were comprised of the three months ended January 3, 2016, April 3, 2016, July 3, 2016 and September 30, 2013, 2012 and 2011, respectively.
| Fiscal 2012 | Fiscal 2011 | ||||||
| Net cash used by operating activities - Accounts payable and accrued liabilities: | |||||||
| As previously reported | $ | 1,424 | $ | (60,505 | ) | ||
| Reclassification of share based award tax withholding payments | 3,936 | 2,482 | |||||
| As reclassified | $ | 5,360 | $ | (58,023 | ) | ||
| Net cash used by financing activities - Share based award tax withholding payments: | |||||||
| As previously reported | $ | — | $ | — | |||
| Reclassification of share based award tax withholding payments | (3,936 | ) | (2,482 | ) | |||
| As reclassified | $ | (3,936 | ) | $ | (2,482 | ) | |
Use of Estimates
The preparation of financial statements in conformity with GAAP requires management to make estimates and assumptions that affect the reported amounts of assets and liabilities and disclosure of contingent assets and liabilities at the date of the financial
Cash and Cash Equivalents
The Company considers all highly liquid debttemporary instruments purchased with original maturities of three months or less from date of purchase to be cash equivalents.
Receivables
Trade accounts receivable are carried at net realizable value. The Company extends credit to its customers based upon an evaluation of the customer’s financial condition and credit history, but generally does not require collateral. The Company monitors its customers’ credit and financial condition based on changing economic conditions and will make adjustments to credit policies as required. Provisions for losses on uncollectible trade receivables are determined based on ongoing evaluations of the Company’s receivables, principally on the basis of historical collection experience and evaluations of the risks of nonpayment or return for a given customer.
Inventories
The Company has a broad range of customers including many large retail outlet chains, one of which accounts for a significant percentage of its sales volume. This major customer represented approximately 18%Company’s, 23% and 24% of the Company’s Net sales during Fiscal 2013, Fiscal 2012 and Fiscal 2011, respectively. This major customer also represented approximately 11% and 13% of the Company’s Trade accounts receivable, net as of September 30, 2013 and September 30, 2012, respectively.
Property, Plant and Equipment
Property, plant and equipment are recorded at cost or at fair value if acquired in a purchase business combination.cost. Depreciation on plant and equipment is calculated on the straight-line methodbasis over the estimated useful lives of the assets. Depreciable lives by major classification are as follows:
| Building and improvements | 20 | - | 40 | years | ||
| Machinery, equipment and other | 2 | - | 15 | years | ||
Asset Type | Range | |||
Buildings and improvements | 20 - 40 years | |||
Machinery and equipment | 2 - 15 years |
Expenditures which substantially increase value or extend useful lives are capitalized. Expenditures for maintenance and repairs are charged to operations as incurred. The Company records gains and losses on the disposition or retirement of property, plant and equipment based on the net book value and any proceeds received.
77
SPECTRUM BRANDS HOLDINGS, INC.
SB/RH HOLDINGS, LLC
NOTES TO THE CONSOLIDATED FINANCIAL STATEMENTS
Long-lived fixed assets held and used are reviewed for impairment wheneverwhen events or changes in business circumstances indicate that the carrying amount of an assetthe assets may not be fully recoverable. The Company evaluates recoverability of assets to be held and used by comparing the carrying amount of an asset to future net cash flows expected to be generated by the asset. If such assets are considered to be impaired, the impairment to be recognized is measured by the amount by which the carrying amount of the assets exceeds the fair value of the assets. Assets to be disposed of are reported at the lower of the carrying amount or fair value less costs to sell.
See Note 8, “Property, plant and equipment” for further detail.
Goodwill
Goodwill reflects the excess of acquisition cost over the aggregate fair value assigned to identifiable net assets acquired. Goodwill is not amortized, but instead is assessed for impairment at least annually and as triggering events or indicators of potential impairment are identified. Goodwill has been assigned to reporting units for purposes of impairment testing based upon the relative fair value of the asset to each reporting unit; our reporting units are consistent with our segments. See Note 19, “Segment Information” for further discussion. The Company performs its annual impairment test in the fourth quarter of its fiscal year.
Impairment of goodwill is evaluated using a two-step approach. In the first step, the fair value of each reporting unit is compared to its carrying value, including goodwill. In estimating the fair value of our reporting units, we use a discounted cash flow methodology, which requires us to estimate future revenues, expenses, and capital expenditures and make assumptions about our weighted average cost of capital and perpetuity growth rate, among other variables. We test the aggregate estimated fair value of our reporting units by comparison to our total market capitalization, including both equity and debt capital. If the fair value of a reporting unit is less than its carrying value, step two is performed. For step two, the implied fair value of goodwill is calculated by deducting the fair value of all tangible and intangible net assets, including unrecognized intangible assets, of the reporting unit from the fair value of the reporting unit. If the implied fair value of goodwill is less than its carrying value, an impairment loss would be recognized equal to that excess. The fair values of the GBA, HHI, PET, H&G and GAC reporting units exceeded their carrying values by 157%, 110%, 58%, 326%, and 12%, respectively. As a result, a step two analysis was not required and there were no reporting units that were deemed at risk of impairment.
See Note 9 “Goodwill and Intangible Assets” for further detail.
Intangible Assets
Intangible assets are recorded at cost or at estimated fair value if acquired in a business combination. Customer lists, proprietary technology and certain trade name intangibles are amortized, using the straight-line method, over their estimated useful lives. The range and weighted average useful lives for definite-lived intangibles assets are as follows:
Asset Type | Range | Weighted Average | ||
Customer relationships | 2 - 20 years | 18.5 years | ||
Technology assets | 5 - 18 years | 11.2 years | ||
Tradenames | 5 - 13 years | 11.4 years |
Definite-lived intangible assets held and used are reviewed for impairment when events or changes in business circumstances indicate that the carrying amount of the assets may not be recoverable. If indicators of potential impairment are identified, the Company performs undiscounted cash flow analysis to determine if impairment exists. The asset value would be deemed impaired if the undiscounted cash flows expected to be generated by the asset did not exceed its carrying value. If impairment is determined to exist, any related impairment loss is calculated based on fair value. There were no triggering events identified during the years ended September 30, 2016, 2015 and 2014 that necessitated an impairment test of definite-lived intangible assets.
78
SPECTRUM BRANDS HOLDINGS, INC.
SB/RH HOLDINGS, LLC
NOTES TO THE CONSOLIDATED FINANCIAL STATEMENTS
Certain trade name intangible assets have an indefinite life and are not amortized; but instead are assessed for impairment at least annually and as triggering events or indicators of potential impairment are identified. The Company performs its annual impairment test in the fourth quarter of its fiscal year. Impairment of indefinite lived intangible assets is assessed by comparing the estimated fair value of the identified trade names to their carrying value to determine if potential impairment exists. If the fair value is less than the carrying value, an impairment loss is recorded for the excess. The fair value of indefinite-lived intangible assets is determined using an income approach, the relief-from-royalty methodology, which requires us to make estimates and assumptions about future revenues, royalty rates, and the discount rate, among others. During the year ended September 30, 2016, the Company recognized $4.7 million impairment on indefinite life intangible asset due to the reduction in value of certain tradenames in response to changes in management’s strategy. There was no impairment loss on indefinite-lived intangible assets for the years ended September 30, 2015 or 2014.
See Note 9, “Goodwill and Intangible Assets” for further detail.
Debt Issuance Costs
Debt issuance costs are capitalizeddeferred and amortized to interest expense using the effective interest method over the lives of the related debt agreements.
Financial Instruments
Derivative financial instruments are book overdrafts,used by the Company principally in the management of its interest rate, foreign currency exchange rate and raw material price exposures. The Company does not hold or issue derivative financial instruments for trading or speculative purposes. Derivative assets and liabilities are reported at fair value in the Consolidated Statements of Financial Position. When hedge accounting is elected at inception, the Company formally designates the financial instrument as a hedge of a specific underlying exposure and documents both the risk management objectives and strategies for undertaking the hedge. Depending on the nature of derivatives designated as hedging instruments, changes in fair value are either offset against the change in fair value of the hedged assets or liability through earnings, or recognized in equity through other comprehensive income until the hedged item is recognized. Any ineffective portion of a financial instrument’s change in fair value is recognized in earnings. For derivatives that do not qualify for hedge accounting treatment, the change in the fair value is recognized in earnings. See Note 12, “Derivatives��� for further detail.
Treasury Stock
Treasury stock purchases are stated at cost and presented as a separate reduction of equity.
Revenue Recognition
The Company recognizes revenue from product sales generally upon delivery to the customer, or at the shipping point in situations where the customer picks up the product or where delivery terms so stipulate. This represents the point at which title and risks and rewards of ownership of the product are passed, provided that there are no uncertainties regarding customer acceptance, there is persuasive evidence that an arrangement exists, the price to the buyer is fixed or determinable and ability to collect is deemed reasonably assured. The provision for customer returns is based on historical sales and returns and other relevant information. The Company estimates and accrues the cost of returns, which are treated as a reduction of Net Sales.
The Company enters into promotional arrangements, primarily with retail customers, that entitle such retailers to earn rebates from the Company. These arrangements require the Company to estimate and accrue the costs of these programs, which are treated as a reduction of Net Sales.
The Company enters into promotional arrangements that target the ultimate consumer. The costs associated with such arrangements are treated as either a reduction in Net Sales or an increase in Cost of Goods Sold, based on the type of promotional program. The Company monitors its commitments under all promotion arrangements and uses various measures, including past experience, to estimate the earned, but unpaid, promotional costs. The terms of the Company’s customer-related promotional arrangements and programs are tailored to each customer and documented through written contracts, correspondence or other communications with the individual customers.
79
SPECTRUM BRANDS HOLDINGS, INC.
SB/RH HOLDINGS, LLC
NOTES TO THE CONSOLIDATED FINANCIAL STATEMENTS
The Company also enters into various arrangements, primarily with retail customers, which require the Company to make upfront cash payments in order to secure the right to distribute through such customers. The Company capitalizes these payments provided the payments are supported by a time or volume based arrangement with the retailer, and amortizes the associated payment over the appropriate time or volume-based term of the arrangement. Capitalized payments are reported in the Consolidated Statements of Financial Position as Deferred Charges and Other Assets and related amortization is treated as a reduction in Net Sales.
Shipping and Handling Costs
Shipping and handling costs include costs incurred with third-party carriers to transport products to customers and salaries and overhead costs related to activities to prepare the Company’s products for shipment at the Company’s distribution facilities. Shipping and handling costs was $294.7 million, $272.9 million and $260.3 million during the years ended September 30, 2016, 2015 and 2014, respectively. Shipping and handling costs are included in Selling Expenses in the Consolidated Statements of Income.
Advertising Costs
Advertising costs include agency fees and other costs to create advertisements, as well as costs paid to third parties to print or broadcast the Company’s advertisements and are expensed as incurred. The Company incurred advertising costs of $39.8 million, $35.0 million and $21.4 million during the years ended September 30, 2016, 2015 and 2014, respectively. Advertising costs are included in Selling Expenses in the Company’s Consolidated Statements of Income.
Research and Development Costs
Research and development costs are charged to expense in the period they are incurred.
Environmental Expenditures
Environmental expenditures that relate to current operations or to conditions caused by past operations are expensed or capitalized as appropriate. The Company determines its liability for environmental matters on a site-by-site basis and records a liability at the time when it is probable that a liability has been incurred and such liability can be reasonably estimated. The estimated liability is not reduced for possible recoveries from insurance carriers. Estimated environmental remediation expenditures are included in the determination of the net realizable value recorded for assets held for sale.
Restructuring and Related Charges
Restructuring charges include, but are not limited to, the costs of deposits on hand, on disbursement accounts thatone-time termination benefits such as severance costs and retention bonuses, and contract termination costs consisting primarily of lease termination costs. Related charges, as defined by the Company, include, but are replenished when checksnot limited to, other costs directly associated with exit and relocation activities, including impairment of property and other assets, departmental costs of full-time incremental employees, and any other items related to the exit or relocation activities. Costs for such activities are presentedestimated by management after evaluating detailed analyses of the costs to be incurred.
Liabilities from restructuring and related charges are recorded for payment.estimated costs of facility closures, significant organizational adjustments and measures undertaken by management to exit certain activities. Costs for such activities are estimated by management after evaluating detailed analyses of the costs to be incurred. Such liabilities could include amounts for items such as severance costs and related benefits, impairment of property and equipment and other current or long term assets, lease termination payments and any other items directly related to the exit activities.
Restructuring and related charges associated with manufacturing and related initiatives are recorded in Cost of Goods Sold. Restructuring and related charges reflected in Cost of Goods Sold include, but are not limited to, termination and related costs associated with manufacturing employees, asset impairments relating to manufacturing initiatives and other costs directly related to the manufacturing component of a restructuring initiative. Restructuring and related charges associated with administrative functions are recorded in operating expenses, such as initiatives impacting sales, marketing, distribution or other non-manufacturing related functions. Restructuring and related charges reflected in operating expenses include, but are not limited to, termination and related costs, any asset impairments relating to the administrative functions and other costs directly related to the administrative components of the restructuring initiatives implemented. See Note 4, “Restructuring and Related Charges” for further detail.
80
SPECTRUM BRANDS HOLDINGS, INC.
SB/RH HOLDINGS, LLC
NOTES TO THE CONSOLIDATED FINANCIAL STATEMENTS
Acquisition and Integration Related Charges
Acquisition and integration related charges include, but are not limited to, transaction costs such as banking, legal, accounting and other professional fees directly related to both consummated acquisitions and acquisition targets, termination and related costs for transitional and certain other employees, integration related professional fees and other post business combination expenses associated with integration activity. See Note 3, “Acquisitions” for further detail.
Income Taxes
Income taxes are accounted for under the asset and liability method. Deferred tax assets and liabilities are recognized for the future tax consequences attributable to differences between the financial statement carrying amounts of existing assets and liabilities and their respective tax bases and operating loss and tax credit carryforwards. Deferred tax assets and liabilities are measured using enacted tax rates expected to apply to taxable income in the years in which those temporary differences are expected to be recovered or settled. The effect on deferred tax assets and liabilities of a change in tax rates is recognized in income in the period that includes the enactment date.
The Company recognizes the effect of income tax positions only if those positions are more likely than not of being sustained. Recognized income tax positions are measured at the largest amount that is greater than 50% likely of being realized. Changes in recognition or measurement are reflected in income tax expense in the period in which the change in judgment occurs. Accrued interest expense and penalties related to uncertain tax positions are recorded in Income tax expense.
See Note 14, “Income Taxes” for further detail.
Foreign Currency Translation
Local currencies are considered the functional currencies for most of the Company’s operations outside the United States. Assets and liabilities of the Company’s foreign subsidiaries are translated at the rate of exchange existing at year-end, with revenues, expenses and cash flows translated at the average of the monthly exchange rates. Adjustments resulting from translation of the financial statements are recorded as a component of equity in Accumulated other comprehensive income (loss)Other Comprehensive Income (“AOCI”). Also included in AOCI are, including the effects of exchange rate changes on intercompany balances of a long-term investment nature.
Foreign currency transaction gains and losses related to assets and liabilities that arefor transactions denominated in a currency other than the functional currency are reported in Other Non-Operating Expense, Net in the Consolidated Statements of OperationsIncome in the period they occur. Exchange losses on foreign currency transactions aggregating were $$9,38810.2 ,million, $9.6 million, and $6.8 million for the years ended September 30, 2016, 2015 and 2014, respectively.
Newly Adopted Accounting Standards
In March 2016, the Financial Accounting Standards Board (“FASB”) issued Accounting Standards Update (“ASU”) No. 2016-09, $1,654Compensation-Stock Compensation (Topic 718): Improvements to Employee Share-Based Payment Accounting. The ASU provides for changes to the accounting for share-based payment awards issued to employees; primarily income taxes upon award vest or settlement, cash flow presentations of excess tax benefits and $3,370employee withheld taxes paid, as well as an entity forfeiture policy election. The ASU is effective for Fiscal 2013, Fiscal 2012annual periods beginning after December 15, 2016, and interim period within those annual periods. Early adoption is permitted for any interim or annual period. The Company has elected to early adopt, effective as if adopted the first day of the fiscal year, October 1, 2015.Fiscal 2011, respectively, are included in Other expense, net,
Under the new guidance, all excess tax benefits (“windfalls”) and deficiencies (“shortfalls”) related to employee stock compensation will be recognized within income tax expense. Under prior guidance, windfalls were recognized to additional paid-in capital and shortfalls were only recognized in the accompanying Consolidated Statementsextent they exceed the pool of Operations.
81
SPECTRUM BRANDS HOLDINGS, INC.
SB/RH HOLDINGS, LLC
NOTES TO THE CONSOLIDATED FINANCIAL STATEMENTS
In April 2015, the FASB issued ASU No. 2015-03, $246,090, $198,152Interest – Imputation of Interest (Subtopic 835-30): Simplifying the Presentation of Debt Issuance Costs. and $201,480 during Fiscal 2013, Fiscal 2012 and Fiscal 2011, respectively. Shipping and handling costs, which are included in Selling expenses in the accompanying Consolidated Statements of Operations, include costs incurred with third-party carriers to transport products to customers and salaries and overheadThis ASU requires debt issuance costs related to activitiesa recognized debt liability to preparebe presented on a balance sheet as a direct deduction from the Company’s products for shipment atdebt liability, similar to the Company’s distribution facilities.
In November 2015, the FASB issued ASU No. 2015-17, Income Taxes (Topic 740) – Balance Sheet Classification of Deferred Taxes. The ASU simplifies the presentation of deferred tax assets and liabilities to be classified as noncurrent on a balance sheet. Current guidance requires an entity to separate deferred income tax assets and liabilities into current and noncurrent amounts. The new guidance requires all deferred tax assets and liabilities to be presented as noncurrent as the separate current classification results in little to no benefit to users of the financial statements because the classification does not generally align with the time period in which the recognized deferred tax amounts are expected to be recovered or broadcastsettled. During the Company’s advertisements.
The following is a summary of the reclassifications from the retrospective adoption of ASU 2015-03 and development costsASU 2015-17 discussed above, as of September 30, 2015 for SBH and SB/RH, respectively:
|
|
|
|
|
|
|
|
|
|
|
|
|
|
|
|
|
|
|
|
| SBH |
| SB/RH | ||||||||||||||
Statement of Financial Position (in millions) |
| As Reported |
| Reclassification |
| As Reclassified |
| As Reported |
| Reclassification |
| As Reclassified | ||||||
Prepaid expenses and other current assets |
| $ | 116.8 |
| $ | (44.7) |
| $ | 72.1 |
| $ | 116.8 |
| $ | (44.7) |
| $ | 72.1 |
Deferred charges and other |
|
| 101.7 |
|
| (59.5) |
|
| 42.2 |
|
| 101.6 |
|
| (59.5) |
|
| 42.1 |
Other current liabilities |
|
| (217.3) |
|
| 4.6 |
|
| (212.7) |
|
| (216.5) |
|
| 4.6 |
|
| (211.9) |
Long-term debt, net of current portion |
|
| (3,937.2) |
|
| 65.1 |
|
| (3,872.1) |
|
| (3,937.2) |
|
| 65.1 |
|
| (3,872.1) |
Deferred taxes (noncurrent liability) |
|
| (607.0) |
|
| 34.5 |
|
| (572.5) |
|
| (607.0) |
|
| 34.5 |
|
| (572.5) |
In September 2015, the FASB issued ASU No. 2015-16, Business Combinations (Topic 805): Simplifying the Accounting for Measurement-Period Adjustments. The ASU simplifies the presentation of provisional amounts recognized in a business combination during the measurement period (one year from the date of acquisition). Current guidance requires retrospective adjustment of prior periods; the new guidance eliminates this requirement. The Company applied the adoption of this ASU effective the first day of the year ending September 30, 2016 and all subsequent measurement period adjustments are charged to expenserecorded in the period they are incurred.
Recently Issued Accounting Standards
In May 2014, the Financial Accounting Standards Board (“FASB”) issued Accounting Standards Update (“ASU”) No. 2014-09, Revenue from Contracts with Customers (Topic 606), which supersedes the revenue recognition requirements in ASC 605, Revenue Recognition. This ASU requires revenue recognition to depict the transfer of goods and services to customers in an amount that reflects the consideration to which the entity expects to be entitled in exchange for those goods or services. The new revenue recognition model requires identifying the contract and performance obligations, determining the transaction price, allocating the transaction price to performance obligations and recognizing the revenue upon satisfaction of performance obligations. This ASU also requires additional disclosure about the nature, amount, timing and uncertainty of revenue and cash flows arising from customer contracts, including significant judgments and changes in judgments, and assets recognized from costs incurred to obtain or fulfill a contract. This ASU can be applied either retrospectively to each prior reporting period presented or retrospectively with the cumulative effect of initially applying the updates recognized at the date of the initial application along with additional disclosures. In August 2015, the FASB issued ASU No. 2015-14, Revenue from Contracts with Customers (Topic 606) Deferral of the Effective Date, which amends the previously issued ASU to provide for a one year deferral from the original effective date. As a result, the ASU will become effective for us beginning in the first quarter of our fiscal year ending September 30, 2019, with early application only being available to common shareholders by the weighted-average number of common shares outstanding for the period. Basic net (loss) income per common share does not consider the effect of dilutive common stock equivalents. As long as their effect is not antidilutive, diluted net (loss) income per common share reflects the dilution that would occur if employee stock units and restricted stock awards were exercised or converted into common shares or resultedus beginning in the issuancefirst quarter of common shares that then shared inour fiscal year ending September 30, 2018. We are assessing the net (loss) incomeimpact this pronouncement will have on the consolidated financial statements of the entity. The computationCompany and have not determined the materiality or method of diluted net (loss) income per common share uses the “treasury stock” method to reflect dilution. The difference between the number of shares used in the calculations of basic and diluted net (loss) income per share is due to the effects of restricted stock and assumed conversion of employee stock unit awards.
| Fiscal 2013 | Fiscal 2012 | Fiscal 2011 | ||||||
| Basic | 52,034 | 51,608 | 51,092 | |||||
| Effect of restricted stock | — | 1,701 | — | |||||
| Diluted | 52,034 | 53,309 | 51,092 | |||||
82
SPECTRUM BRANDS HOLDINGS, INC.
SB/RH HOLDINGS, LLC
NOTES TO THE CONSOLIDATED FINANCIAL STATEMENTS
In February 2016, the Financial Accounting Standards Board (“FASB”) issued Accounting Standards Update (“ASU”) No. 2016-02, Leases (Topic 842), which supersedes the lease requirements in ASC 840, Leases. This ASU requires lessees to recognize lease assets and liabilities on the balance sheet, as well as disclosing key information about leasing arrangements. Although the new ASU requires both operating and finance leases to be disclosed on the balance sheet, a distinction between the two types still exists as the economics of leases can vary. The ASU can be applied using a modified retrospective approach, with a number of optional practical expedients relating to the identification and classification of leases that commenced before the effective date, along with the ability to use hindsight in the evaluation of lease decisions, that entities may elect to apply. As a result, the ASU will become effective for us beginning in the first quarter of our fiscal year ending September 30, 2020, with early adoption applicable. We are assessing the impact this pronouncement will have on the consolidated financial statements of the Company and have not determined the materiality or method of adoption.
NOTE 3 - (CONTINUED)
The Company determines its liabilityaccounts for environmental matters onacquisitions by applying the acquisition method of accounting. The acquisition method of accounting requires, among other things, that the assets acquired and liabilities assumed in a site-by-site basisbusiness combination be measured at their fair values as of the closing date of the acquisition.
Armored AutoGroup
On May 21, 2015, the Company completed the acquisition of AAG, a consumer products company consisting primarily of Armor All® branded automotive aftermarket appearance products, STP® branded performance chemicals and records a liability at the time when it is probable that a liability has been incurred and such liability can be reasonably estimated.A/C PRO® branded do-it-yourself automotive air conditioner recharge products. The estimated liability is not reduced for possible recoveries from insurance carriers. Estimated environmental remediation expendituresresults of AAG’s operations since May 21, 2015 are included in the determinationCompany’s Consolidated Statements of Income, and reported as a separate reporting segment under GAC for the years ended September 30, 2016 and 2015.
The Company has recorded an allocation of the net realizable value recorded for assets held for sale.
| Fiscal 2013 | Fiscal 2012 | Fiscal 2011 | ||||||||||
| Foreign Currency Translation Adjustments: | ||||||||||||
| Beginning balance | $ | (225 | ) | $ | 8,377 | $ | 18,984 | |||||
| Gross change before reclassification adjustment | (6,622 | ) | (8,602 | ) | (12,857 | ) | ||||||
| Gross change after reclassification adjustment | $ | (6,622 | ) | $ | (8,602 | ) | $ | (12,857 | ) | |||
| Deferred tax effect | — | — | 2,742 | |||||||||
| Deferred tax valuation allowance | — | — | (492 | ) | ||||||||
| Other Comprehensive Loss | $ | (6,622 | ) | $ | (8,602 | ) | $ | (10,607 | ) | |||
| Noncontrolling interest | 203 | — | — | |||||||||
| Ending balance | $ | (7,050 | ) | $ | (225 | ) | $ | 8,377 | ||||
| Unrealized Gains (Losses) on Cash Flow Hedges: | ||||||||||||
| Beginning balance | $ | 218 | $ | (1,327 | ) | $ | (5,755 | ) | ||||
| Gross change before reclassification adjustment | (2,013 | ) | (1,824 | ) | (5,992 | ) | ||||||
| Net reclassification adjustment for (gains) losses included in earnings | (920 | ) | 3,097 | 13,422 | ||||||||
| Gross change after reclassification adjustment | $ | (2,933 | ) | $ | 1,273 | $ | 7,430 | |||||
| Deferred tax effect | (234 | ) | (636 | ) | (2,671 | ) | ||||||
| Deferred tax valuation allowance | 658 | 908 | (331 | ) | ||||||||
| Other Comprehensive Income | $ | (2,509 | ) | $ | 1,545 | $ | 4,428 | |||||
| Ending balance | $ | (2,291 | ) | $ | 218 | $ | (1,327 | ) | ||||
| Defined Benefit Pension Plans: | ||||||||||||
| Beginning balance | $ | (33,428 | ) | $ | (21,496 | ) | $ | (20,726 | ) | |||
| Gross change before reclassification adjustment | 8,097 | (15,682 | ) | (6,344 | ) | |||||||
| Net reclassification adjustment for losses (gains) included in Cost of goods sold | 1,571 | 900 | (174 | ) | ||||||||
| Net reclassification adjustment for (gains) losses included in Selling expenses | (584 | ) | — | 69 | ||||||||
| Net reclassification adjustment for losses included in General and administrative expenses | 373 | — | 113 | |||||||||
| Gross change after reclassification adjustment | $ | 9,457 | $ | (14,782 | ) | $ | (6,336 | ) | ||||
| Deferred tax effect | (5,123 | ) | 3,632 | 2,037 | ||||||||
| Deferred tax valuation allowance | (86 | ) | (782 | ) | 3,529 | |||||||
| Other Comprehensive (Loss) Income | $ | 4,248 | $ | (11,932 | ) | $ | (770 | ) | ||||
| Ending balance | $ | (29,180 | ) | $ | (33,428 | ) | $ | (21,496 | ) | |||
| Total Other Comprehensive Loss, net of tax | $ | (4,883 | ) | $ | (18,989 | ) | $ | (6,949 | ) | |||
| Total ending AOCI | $ | (38,521 | ) | $ | (33,435 | ) | $ | (14,446 | ) | |||
(in millions) | Purchase Price | ||
Cash consideration | $ | 929.3 | |
(in millions) | Purchase Price Allocation | ||
Cash and cash equivalents | $ | 30.9 | |
Receivables | 156.5 | ||
Inventories | 82.5 | ||
Prepaid expenses and other current assets | 8.2 | ||
Property, plant and equipment, net | 37.6 | ||
Goodwill | 975.4 | ||
Intangible assets | 418.0 | ||
Deferred charges and other | 16.5 | ||
Accounts payable and accrued liabilities | (119.2) | ||
Long-term debt | (540.0) | ||
Other long term liabilities | (137.1) | ||
Net assets acquired | $ | 929.3 | |
In September 2009, SB Holdings’ board of directors (the “Board”) adopted the 2009 Spectrum Brands Inc. Incentive Plan (the “2009 Plan”). Prior to October 21, 2010, up to 833,333 shares of common stock, net of forfeitures and cancellations, could have been issued under the 2009 Plan. After October 21, 2010, no further awards may be made under the 2009 Plan.
SPECTRUM BRANDS HOLDINGS, INC.
SB/RH HOLDINGS, LLC
NOTES TO THE CONSOLIDATED FINANCIAL STATEMENTS - (CONTINUED)
The purchase price allocation resulted in thousands, except per share figures)
|
|
|
|
|
|
(in millions) |
| Carrying Amount |
| Weighted Average Useful Life (Years) | |
Tradenames |
| $ | 295.0 |
| Indefinite |
Technology |
|
| 41.0 |
| 10 |
Licensing agreements |
|
| 19.0 |
| 10 |
Customer relationships |
|
| 63.0 |
| 15 |
Total intangibles acquired |
| $ | 418.0 |
|
|
The Company performed a valuation of the acquired inventories; property, plant and equipment; tradenames; technologies; licensing agreements; and customer relationships.The following is a summary of significant inputs to the valuation:
· | Inventories – The replacement cost approach was applied to estimate the fair value of the raw materials and unbranded finished goods inventory. Branded finished goods were valued based on the comparative sales method, which estimates the expected sales price of the finished goods inventory, reduced for all costs expected to be incurred in its completion or disposition and a profit on those costs. |
· | Property, plant and equipment – The market approach was used to estimate the fair value of land. The direct cost approach was used to estimate the fair value of property, plant and equipment. |
· | Tradenames – The Company valued indefinite-lived trade names using an income approach, the relief-from-royalty method. Under this method, the asset value was determined by estimating the hypothetical royalties that would have to be paid if the trade names were not owned. Royalty rates were selected based on consideration of several factors, including prior transactions, related trademarks and trade names, other similar trademark licensing and transaction agreements and the relative profitability and perceived contribution of the trade names. |
· | Technology – The Company valued technology using an income approach, the relief-from-royalty method. Under this method, the asset value was determined by estimating the hypothetical royalties that would have to be paid if the technology was not owned. Royalty rates were selected based on consideration of several factors, including prior transactions, related licensing agreements and the importance of the technology and profit levels, among other considerations. The Company anticipates using these technologies through the legal life of the underlying patents; therefore, the expected useful life of these technologies is based on the remaining life of the underlying patents. |
· | Licensing Agreements – The Company valued licensing agreements using the income approach. Under this method, the asset value was determined by estimating the revenue stream over the implied life of the agreements. |
· | Customer relationships – The Company valued customer relationships using an income approach, the multi-period excess earnings method. In determining the fair value of the customer relationships, the multi-period excess earnings approach values the intangible asset at the present value of the incremental after-tax cash flows attributable only to the customer relationship after deducting contributory asset charges. The incremental after-tax cash flows attributable to the subject intangible asset are then discounted to their present value. Only expected sales from current customers were used, which are estimated using annual expected growth rates of 2.0% to 12.1%. The Company assumed a customer retention rate of approximately 95.0%, which is supported by historical retention rates. Income taxes were estimated at 38% and amounts were discounted using a rate of 9.5%. |
The following unaudited pro forma combined financial information presents the Company’s pro forma results for the years ended September 30, 2015 and 2014 had the results of AAG been combined as of October 1, 2013:
|
|
|
|
|
|
|
|
|
|
|
|
|
|
|
| 2015 |
| 2014 | ||
(in millions) |
| (Unaudited) |
| (Unaudited) | ||
Pro forma net sales |
| $ | 4,966.2 |
| $ | 4,872.4 |
Pro forma net income |
| $ | 217.3 |
| $ | 235.5 |
84
SPECTRUM BRANDS HOLDINGS, INC.
SB/RH HOLDINGS, LLC
NOTES TO THE CONSOLIDATED FINANCIAL STATEMENTS
The 2015 unaudited pro forma combined financial results exclude (1) a non-recurring interest expense of $35.7 million related to the extinguishment of AAG debt recognized in connection with the acquisition, (2) $47.3 million of acquisition and integration related charges incurred as a result of the acquisition (3) $18.8 million of non-recurring expense related to the fair value adjustment to acquisition date inventory and (4) $10.4 million of accelerated share based compensation costs incurred as a result of the acquisition.
Salix
On January 16, 2015, the Company completed the acquisition of Salix, a vertically integrated producer and distributor of natural rawhide dog chews, treats and snacks. The results of Salix’s operations are included in General and administrative expenses in the accompanyingCompany’s Consolidated Statements of Operations.
The Company during
(in millions) | Purchase Price | ||
Cash consideration | $ | 146.8 | |
Contingent consideration | 1.5 | ||
Total purchase price | $ | 148.3 | |
(in millions) | Purchase Price Allocation | ||
Cash and cash equivalents | $ | 0.5 | |
Receivables | 10.7 | ||
Inventories | 17.0 | ||
Prepaid expenses and other current assets | 2.5 | ||
Property, plant and equipment, net | 1.2 | ||
Goodwill | 71.5 | ||
Intangible assets | 55.5 | ||
Accounts payable and accrued liabilities | (8.5) | ||
Other long term liabilities | (2.1) | ||
Net assets acquired | $ | 148.3 | |
The purchase price allocation resulted in goodwill of $71.5 million of which $24.7 million is deductible for tax purposes. Goodwill was approximately
|
|
|
|
|
|
(in millions) |
| Carrying Amount |
| Weighted Average Useful Life (Years) | |
Tradenames |
| $ | 17.0 |
| Indefinite |
Definite-lived tradenames |
|
| 1.0 |
| 13 |
Technology |
|
| 2.1 |
| 17 |
Customer relationships |
|
| 35.4 |
| 13 |
Total intangibles acquired |
| $ | 55.5 |
|
|
The Company granted approximately
· | Inventories – The replacement cost approach was applied to estimate the fair value of the raw materials and unbranded finished goods inventory. Branded finished goods were valued based on the comparative sales method, which estimates the expected sales price of the finished goods inventory, reduced for all costs expected to be incurred in its completion or disposition and a profit on those costs. |
· | Property, plant and equipment – The cost approach was utilized to estimate the fair value of approximately 98% of the property, plant and equipment. The sales comparison approach was used to estimate the fair value of the remaining 2% of the property, plant and equipment. |
85
| Restricted Stock Awards | Shares | Weighted Average Grant Date Fair Value | Fair Value at Grant Date | ||||||||
| Restricted stock awards at September 30, 2011 | 123 | $ | 24.20 | $ | 2,977 | ||||||
| Vested | (110 | ) | 23.75 | (2,613 | ) | ||||||
| Restricted stock awards at September 30, 2012 | 13 | $ | 28.00 | $ | 364 | ||||||
| Vested | (13 | ) | 28.00 | (364 | ) | ||||||
| Restricted stock awards at September 30, 2013 | — | $ | — | $ | — | ||||||
| Restricted Stock Units | Shares | Weighted Average Grant Date Fair Value | Fair Value at Grant Date | ||||||||
| Non-vested restricted stock units at September 30, 2011 | 1,645 | $ | 28.97 | $ | 47,656 | ||||||
| Granted | 863 | 28.28 | 24,408 | ||||||||
| Forfeited | (57 | ) | 28.49 | (1,624 | ) | ||||||
| Vested | (520 | ) | 29.83 | (15,509 | ) | ||||||
| Non-vested restricted stock units at September 30, 2012 | 1,931 | $ | 28.45 | $ | 54,931 | ||||||
| Granted | 700 | 45.97 | 32,176 | ||||||||
| Forfeited | (302 | ) | 30.36 | (9,168 | ) | ||||||
| Vested | (1,211 | ) | 28.25 | (34,216 | ) | ||||||
| Non-vested restricted stock units at September 30, 2013 | 1,118 | $ | 39.11 | $ | 43,723 | ||||||
SPECTRUM BRANDS HOLDINGS, INC.
SB/RH HOLDINGS, LLC
NOTES TO THE CONSOLIDATED FINANCIAL STATEMENTS - (CONTINUED)
· | Tradenames – The Company valued indefinite-lived trade names using an income approach, the relief-from-royalty method. Under this method, the asset value was determined by estimating the hypothetical royalties that would have to be paid if the trade names were not owned. Royalty rates were selected based on consideration of several factors, including prior transactions, related trademarks and trade names, other similar trademark licensing and transaction agreements and the relative profitability and perceived contribution of the trade names. |
· | Technology – The Company valued technology using an income approach, the relief-from-royalty method. Under this method, the asset value was determined by estimating the hypothetical royalties that would have to be paid if the technology was not owned. Royalty rates were selected based on consideration of several factors, including prior transactions, related licensing agreements and the importance of the technology and profit levels, among other considerations. The Company anticipates using these technologies through the legal life of the underlying patents; therefore, the expected useful life of these technologies is based on the remaining life of the underlying patents. |
· | Customer relationships – The Company valued customer relationships using an income approach, the multi-period excess earnings method. In determining the fair value of the customer relationships, the multi-period excess earnings approach values the intangible asset at the present value of the incremental after-tax cash flows attributable only to the customer relationship after deducting contributory asset charges. The incremental after-tax cash flows attributable to the subject intangible asset are then discounted to their present value. Only expected sales from current customers were used, which are estimated using annual expected growth rates of 0% to 12.1%. The Company assumed a customer retention rate of approximately 92.5%, which is supported by historical retention rates. Income taxes were estimated at 38% and amounts were discounted using a rate of 12% to 13%. |
· | Non-compete agreement – The Company valued the non-compete agreement using the income approach that compares the prospective cash flows with and without the non-compete agreement in place. The value of the non-compete agreement is the difference between the discounted cash flows of the business under each of these two alternative scenarios, considering both tax expenditure and tax amortization benefits. |
The Salix acquisition was not considered individually significant to the consolidated results of the Company and therefore pro forma results are not presented.
European IAMS and Eukanuba
On December 31, 2014, the Company completed the acquisition of Procter & Gamble’s European IAMS and Eukanuba pet food business, including its brands for dogs and cats. The results of European IAMS and Eukanuba’s operations are included in thousands, except per share figures)
The Company has recorded an allocation of the purchase price to the Company’s tangible and measured in accordanceidentifiable intangible assets acquired and liabilities assumed based on their fair values as of the December 31, 2014 acquisition date. The excess of the purchase price over the fair value of the net tangible assets and identifiable intangible assets was recorded as goodwill, which includes value associated with the provisionsassembled workforce, including an experienced research team. The calculation of ASC Topic 420: the purchase price and purchase price allocation is as follows:
(in millions) | Purchase Price | ||
Cash consideration | $ | 115.7 | |
(in millions) | Purchase Price Allocation | ||
Inventories | $ | 16.3 | |
Prepaid expenses and other current assets | 2.9 | ||
Property, plant and equipment, net | 58.3 | ||
Goodwill | 4.0 | ||
Intangible assets | 39.6 | ||
Accounts payable and accrued liabilities | (2.7) | ||
Other long term liabilities | (2.7) | ||
Net assets acquired | $ | 115.7 | |
86
SPECTRUM BRANDS HOLDINGS, INC.
SB/RH HOLDINGS, LLC
NOTES TO THE CONSOLIDATED FINANCIAL STATEMENTS
The purchase price allocation resulted in goodwill of $4.0 million which is not deductible for tax purposes“Exit or Disposal Cost Obligations,”. Goodwill was allocated to the PET segment. (“ASC 420”). Under ASC 420, restructuring charges include, butThe values allocated to intangible assets and the weighted average useful lives are as follows:
|
|
|
|
|
|
(in millions) |
| Carrying Amount |
| Weighted Average Useful Life (Years) | |
Tradenames |
| $ | 25.5 |
| Indefinite |
Technology |
|
| 3.6 |
| 8 |
Customer relationships |
|
| 10.5 |
| 15 |
Total intangibles acquired |
| $ | 39.6 |
|
|
The Company performed a valuation of the acquired inventories, property, plant and equipment, tradenames, technology and customer relationships. The following is a summary of significant inputs to the valuation:
· | Inventories – The replacement cost approach was applied to estimate the fair value of the raw materials inventory. Work-in-process and finished goods inventory were valued at estimated selling price less the sum of costs of disposal and a reasonable profit on the value added in the completion and disposal effort. |
· | Property, plant and equipment – The market approach was used to estimate the fair value of land. The direct cost approach was used to estimate the fair value of property, plant and equipment. |
· | Tradenames – The Company valued indefinite-lived trade names using an income approach, the relief-from-royalty method. Under this method, the asset value was determined by estimating the hypothetical royalties that would have to be paid if the trade names were not owned. Royalty rates were selected based on consideration of several factors, including prior transactions, related trademarks and trade names, other similar trademark licensing and transaction agreements and the relative profitability and perceived contribution of the trade names. |
· | Technology – The Company valued technology using an income approach, the relief-from-royalty method. Under this method, the asset value was determined by estimating the hypothetical royalties that would have to be paid if the technology was not owned. Royalty rates were selected based on consideration of several factors, including prior transactions, related licensing agreements and the importance of the technology and profit levels, among other considerations. The Company anticipates using these technologies through the legal life of the underlying patents; therefore, the expected useful life of these technologies is based on the remaining life of the underlying patents. |
· | Customer relationships – The Company valued customer relationships using an income approach, the multi-period excess earnings method. In determining the fair value of the customer relationships, the multi-period excess earnings approach values the intangible asset at the present value of the incremental after-tax cash flows attributable only to the customer relationship after deducting contributory asset charges. The incremental after-tax cash flows attributable to the subject intangible asset are then discounted to their present value. Only expected sales from current customers were used, which are estimated using annual expected growth rates of 0% to 5.6%. The Company assumed a customer retention rate of approximately 90% to 100%, which was supported by historical retention rates. Income taxes were estimated at 25% and amounts were discounted using a rate of 12.5%. |
The European IAMS and Eukanuba acquisition was not considered individually significant to the consolidated results of the Company and therefore pro forma results are not limited to, termination and related costs consisting primarily of one-time termination benefits such as severance costs and retention bonuses, and contract termination costs consisting primarily of lease termination costs. Related charges, as defined bypresented.
Tell Manufacturing
On October 1, 2014, the Company include, butcompleted the acquisition of Tell, a manufacturer and distributor of commercial doors, locks, and hardware. The results of Tell’s operations are included in the Company’s Consolidated Statements of Income, and as part of the HHI segment.
87
SPECTRUM BRANDS HOLDINGS, INC.
SB/RH HOLDINGS, LLC
NOTES TO THE CONSOLIDATED FINANCIAL STATEMENTS
The Company has recorded an allocation of the purchase price to the Company’s tangible and identifiable intangible assets acquired and liabilities assumed based on their fair values as of the October 1, 2014 acquisition date. The excess of the purchase price over the fair value of the net tangible assets and identifiable intangible assets was recorded as goodwill, which includes value associated with the assembled workforce, including an experienced research team. The calculation of the purchase price and purchase price allocation is as follows:
(in millions) | Purchase Price | ||
Cash consideration | $ | 30.3 | |
(in millions) | Purchase Price Allocation | ||
Cash and cash equivalents | $ | 1.1 | |
Receivables | 6.0 | ||
Inventories | 7.2 | ||
Prepaid expenses and other current assets | 0.6 | ||
Property, plant and equipment, net | 1.5 | ||
Goodwill | 7.1 | ||
Intangible assets | 12.5 | ||
Accounts payable and accrued liabilities | (5.7) | ||
Net assets acquired | $ | 30.3 | |
The purchase price allocation resulted in goodwill of $7.1 million which is deductible for tax purposes. Goodwill was allocated to the HHI segment. The values allocated to intangible assets and the weighted average useful lives are as follows:
|
|
|
|
|
|
(in millions) |
| Carrying Amount |
| Weighted Average Useful Life (Years) | |
Tradenames |
| $ | 4.0 |
| Indefinite |
Customer relationships |
|
| 8.5 |
| 13 |
Total intangibles acquired |
| $ | 12.5 |
|
|
The Company performed a valuation of the acquired inventories, property, plant and equipment, tradenames and customer relationships. The following is a summary of significant inputs to the valuation:
· | Inventories – The replacement cost approach was applied to estimate the fair value of the raw materials inventory. Finished goods were valued at estimated selling price less the sum of costs of disposal and a reasonable profit on the value added in the completion and disposal effort. |
· | Property, plant and equipment – The cost approach was used to estimate the fair value of approximately 97% of the property, plant and equipment. The sales comparison approach was utilized to estimate the fair value of the remaining 3% of the property, plant and equipment. |
· | Tradenames – The Company valued indefinite-lived trade names using an income approach, the relief-from-royalty method. Under this method, the asset value was determined by estimating the hypothetical royalties that would have to be paid if the trade name was not owned. Royalty rates were selected based on consideration of several factors, including prior transactions of Tell, related trademarks and trade names, other similar trademark licensing and transaction agreements and the relative profitability and perceived contribution of the trade names. |
· | Customer relationships – The Company valued customer relationships using an income approach, the multi-period excess earnings method. In determining the fair value of the customer relationships, the multi-period excess earnings approach values the intangible asset at the present value of the incremental after-tax cash flows attributable only to the customer relationship after deducting contributory asset charges. The incremental after-tax cash flows attributable to the subject intangible asset are then discounted to their present value. Only expected sales from current customers were used, which are estimated using annual expected growth rates of 2.5% to 7.1%. The Company assumed a customer retention rate of approximately 90%, which was supported by historical retention rates. Income taxes were estimated at 38% and amounts were discounted using a rate of 20%. |
The Tell Manufacturing acquisition was not considered individually significant to the consolidated results of the Company and therefore pro forma results are not limited to, other costs directly associated with exit and integration activities, including impairmentpresented.
88
SPECTRUM BRANDS HOLDINGS, INC.
SB/RH HOLDINGS, LLC
NOTES TO THE CONSOLIDATED FINANCIAL STATEMENTS
Acquisition and Integration Related Charges
The following table summarizes acquisition and integration related charges incurred by the Company during the years ended September 30, 2016, 2015 and 2014:
|
|
|
|
|
|
|
|
|
|
(in millions) |
| 2016 |
| 2015 |
| 2014 | |||
Armored AutoGroup |
| $ | 14.6 |
| $ | 21.8 |
| $ | — |
HHI Business |
|
| 13.3 |
|
| 12.0 |
|
| 11.0 |
European IAMS and Eukanuba |
|
| 3.5 |
|
| 9.3 |
|
| — |
Salix |
|
| 2.1 |
|
| 10.7 |
|
| — |
Other |
|
| 3.2 |
|
| 5.0 |
|
| 9.1 |
Total acquisition and integration related charges |
| $ | 36.7 |
| $ | 58.8 |
| $ | 20.1 |
NOTE 4 - RESTRUCTURING AND RELATED CHARGES
GAC Business Rationalization Initiatives – Fiscal 2013, Fiscal 2012 and Fiscal 2011:
| 2013 | 2012 | 2011 | ||||||||||
| Russell Hobbs | ||||||||||||
| Integration costs | $ | 3,452 | $ | 10,168 | $ | 23,084 | ||||||
| Employee termination charges | 217 | 3,900 | 8,105 | |||||||||
| Legal and professional fees | 39 | 1,495 | 4,883 | |||||||||
| Russell Hobbs Acquisition and integration related charges | $ | 3,708 | $ | 15,563 | $ | 36,072 | ||||||
| HHI Business | ||||||||||||
| Legal and professional fees | 27,712 | — | — | |||||||||
| Integration costs | 8,864 | — | — | |||||||||
| Employee termination charges | 356 | — | — | |||||||||
| HHI Business Acquisition and integration related charges | $ | 36,932 | $ | — | $ | — | ||||||
| Shaser | 4,828 | — | — | |||||||||
| FURminator | 2,270 | 7,938 | — | |||||||||
| Black Flag | 154 | 3,379 | — | |||||||||
| Other | 553 | 4,186 | 531 | |||||||||
| Total Acquisition and integration related charges | $ | 48,445 | $ | 31,066 | $ | 36,603 | ||||||
| September 30, | |||||||
| 2013 | 2012 | ||||||
| Raw materials | $ | 97,290 | $ | 58,515 | |||
| Work-in-process | 40,626 | 23,434 | |||||
| Finished goods | 495,007 | 370,684 | |||||
| $ | 632,923 | $ | 452,633 | ||||
| September 30, | ||||||||
| 2013 | 2012 | |||||||
| Land, buildings and improvements | $ | 164,654 | $ | 88,580 | ||||
| Machinery, equipment and other | 405,126 | 247,065 | ||||||
| Construction in progress | 46,668 | 18,366 | ||||||
| $ | 616,448 | $ | 354,011 | |||||
| Less accumulated depreciation | 203,897 | 139,994 | ||||||
| $ | 412,551 | $ | 214,017 | |||||
Global Batteries & Appliances | Hardware & Home Improvement | Global Pet Supplies | Home and Garden Business | Total | |||||||||||||||
| Goodwill: | |||||||||||||||||||
| Balances at September 30, 2011 | $ | 268,148 | $ | — | $ | 170,285 | $ | 171,905 | $ | 610,338 | |||||||||
| Additions | — | — | 70,023 | 15,852 | 85,875 | ||||||||||||||
| Effect of translation | 408 | — | (2,376 | ) | — | (1,968 | ) | ||||||||||||
| Balances at September 30, 2012 | $ | 268,556 | $ | — | $ | 237,932 | $ | 187,757 | $ | 694,245 | |||||||||
| Additions | 67,149 | 717,853 | — | 1,614 | 786,616 | ||||||||||||||
| Effect of translation | (2,205 | ) | (3,129 | ) | 1,145 | — | (4,189 | ) | |||||||||||
| Balances at September 30, 2013 | $ | 333,500 | $ | 714,724 | $ | 239,077 | $ | 189,371 | $ | 1,476,672 | |||||||||
| Intangible Assets: | |||||||||||||||||||
| Trade names Not Subject to Amortization | |||||||||||||||||||
| Balances at September 30, 2011 | $ | 545,804 | $ | — | $ | 205,491 | $ | 75,500 | $ | 826,795 | |||||||||
| Additions | — | — | 14,000 | 8,000 | 22,000 | ||||||||||||||
| Reclassification to intangible assets subject to amortization | (920 | ) | — | (2,530 | ) | — | (3,450 | ) | |||||||||||
| Effect of translation | 542 | — | (4,819 | ) | — | (4,277 | ) | ||||||||||||
| Balances at September 30, 2012 | $ | 545,426 | $ | — | $ | 212,142 | $ | 83,500 | $ | 841,068 | |||||||||
| Additions | — | 331,000 | — | — | 331,000 | ||||||||||||||
| Effect of translation | 1,927 | (229 | ) | 4,284 | — | 5,982 | |||||||||||||
| Balances at September 30, 2013 | $ | 547,353 | $ | 330,771 | $ | 216,426 | $ | 83,500 | $ | 1,178,050 | |||||||||
| Intangible Assets Subject to Amortization | |||||||||||||||||||
| Balance at September 30, 2011, net | $ | 481,473 | $ | — | $ | 219,243 | $ | 156,398 | $ | 857,114 | |||||||||
| Additions | — | — | 65,118 | 17,000 | 82,118 | ||||||||||||||
| Reclassification from intangible assets not subject to amortization | 920 | — | 2,530 | — | 3,450 | ||||||||||||||
| Amortization during period | (32,892 | ) | — | (19,503 | ) | (11,271 | ) | (63,666 | ) | ||||||||||
| Effect of translation | (2,389 | ) | — | (2,766 | ) | — | (5,155 | ) | |||||||||||
| Balance at September 30, 2012, net | $ | 447,112 | $ | — | $ | 264,622 | $ | 162,127 | $ | 873,861 | |||||||||
| Additions | 29,379 | 158,100 | 802 | — | 188,281 | ||||||||||||||
| Amortization during period | (35,553 | ) | (11,372 | ) | (21,379 | ) | (9,475 | ) | (77,779 | ) | |||||||||
| Effect of translation | (162 | ) | (267 | ) | 1,182 | — | 753 | ||||||||||||
| Balance at September 30, 2013, net | $ | 440,776 | $ | 146,461 | $ | 245,227 | $ | 152,652 | $ | 985,116 | |||||||||
| Total Intangible Assets, net at September 30, 2013 | $ | 988,129 | $ | 477,232 | $ | 461,653 | $ | 236,152 | $ | 2,163,166 | |||||||||
HHI Business Rationalization Initiatives–During the fourth quarter of the Company’s intangible assets subjectyear ended September 30, 2014, the Company implemented a series of initiatives throughout the HHI segment to amortization are 9 to 17 years for proprietary technology assetsreduce operating costs and exit low margin business outside the U.S. These initiatives included headcount reductions, the exit of certain facilities and the sale of a portion of the global HHI operations. Total costs associated with the Global Batteries & Appliances segment, these initiatives of $816.6 million has been incurred to date, and completed as of September 30, 2016.
9Global Expense Rationalization Initiatives years for proprietary technology assets related to– During the Hardware & Home Improvement segment, 4 to 9 years for proprietary technology assets related to the Global Pet Supplies segment, 15 to 20 years for customer relationshipsthird quarter of the Global Batteries & Appliances segment, year ended September 30, 2013, the Company implemented a series of initiatives throughout the Company to reduce operating costs. These initiatives consisted of headcount reductions in the GBA and PET, and within Corporate. Total costs associated with these initiatives of $2047.0 years for customer relationshipsmillion has been incurred to date, and completed as of September 30, 2016.
Other Restructuring Activities – The Company has entered or may enter into small, less significant initiatives and restructuring activities to reduce costs and improve margins throughout the Hardware & Home Improvement segment, Homeorganization. Individually these activities are not substantial, and Garden Business and Global Pet Supplies segments,occur over a shorter time period (less than 12 months). 1Total costs associated with these initiatives are expected to be approximately $6 million, of which $2.9 million has been incurred to date.12 years for trade names within the Global Batteries & Appliances segment, 5 to 8 years for trade
The following summarizes restructuring and
| September 30, 2013 | September 30, 2012 | ||||||
| Proprietary Technology Assets Subject to Amortization: | |||||||
| Gross balance | $ | 172,105 | $ | 90,924 | |||
| Accumulated amortization | (39,028 | ) | (22,768 | ) | |||
| Carrying value, net | $ | 133,077 | $ | 68,156 | |||
| Trade Names Subject to Amortization: | |||||||
| Gross balance | $ | 171,572 | $ | 150,829 | |||
| Accumulated amortization | (44,660 | ) | (28,347 | ) | |||
| Carrying value, net | $ | 126,912 | $ | 122,482 | |||
| Customer Relationships Subject to Amortization: | |||||||
| Gross balance | $ | 885,895 | $ | 796,235 | |||
| Accumulated amortization | (160,768 | ) | (113,012 | ) | |||
| Carrying value, net | $ | 725,127 | $ | 683,223 | |||
| Total Intangible Assets, net Subject to Amortization | $ | 985,116 | $ | 873,861 | |||
|
|
|
|
|
|
|
|
|
|
(in millions) |
| 2016 |
| 2015 |
| 2014 | |||
Global expense rationalization initiatives |
| $ | 5.2 |
| $ | 17.1 |
| $ | 13.4 |
HHI business rationalization initiatives |
|
| 1.8 |
|
| 10.3 |
|
| 4.5 |
GAC business rationalization initiatives |
|
| 5.3 |
|
| — |
|
| — |
Other restructuring activities |
|
| 2.9 |
|
| 1.3 |
|
| 5.0 |
Total restructuring and related charges |
| $ | 15.2 |
| $ | 28.7 |
| $ | 22.9 |
Reported as: |
|
|
|
|
|
|
|
|
|
Cost of goods sold |
| $ | 0.5 |
| $ | 2.1 |
| $ | 3.7 |
Operating expense |
|
| 14.7 |
|
| 26.6 |
|
| 19.2 |
The following summarizes restructuring and related charges for the years ended September 30, 2012
|
|
|
|
|
|
|
|
|
|
|
| Termination |
| Other |
|
| |||
(in millions) |
| Benefits |
| Costs |
| Total | |||
For the year ended September 30, 2016 |
|
| 4.3 |
|
| 10.9 |
|
| 15.2 |
For the year ended September 30, 2015 |
|
| 7.0 |
|
| 21.7 |
|
| 28.7 |
For the year ended September 30, 2014 |
|
| 11.2 |
|
| 11.7 |
|
| 22.9 |
Cumulative costs through September 30, 2016 |
|
| 32.4 |
|
| 39.4 |
|
| 71.8 |
89 is as follows:
| 2013 | 2012 | 2011 | |||||||||
| Proprietary technology amortization | $ | 16,260 | $ | 9,133 | $ | 6,817 | |||||
| Trade names amortization | 16,587 | 14,347 | 12,558 | ||||||||
| Customer relationships amortization | 44,932 | 40,186 | 38,320 | ||||||||
| $ | 77,779 | $ | 63,666 | $ | 57,695 | ||||||
SPECTRUM BRANDS HOLDINGS, INC.
SB/RH HOLDINGS, LLC
NOTES TO THE CONSOLIDATED FINANCIAL STATEMENTS - (CONTINUED)
The following is a rollforward of the following:accrual related to all restructuring and related activities, included within Other Current Liabilities, by cost type, for the years ended September 30, 2016, 2015, and 2014:
|
|
|
|
|
|
|
|
|
|
|
| Termination |
| Other |
|
| |||
(in millions) |
| Benefits |
| Costs |
| Total | |||
Accrual balance at September 30, 2014 |
| $ | 9.9 |
| $ | 1.6 |
| $ | 11.5 |
Provisions |
|
| 5.1 |
|
| 3.9 |
|
| 9.0 |
Cash expenditures |
|
| (9.5) |
|
| (1.7) |
|
| (11.2) |
Non Cash Items |
|
| (1.2) |
|
| 0.1 |
|
| (1.1) |
Accrual balance at September 30, 2015 |
|
| 4.3 |
|
| 3.9 |
|
| 8.2 |
Provisions |
|
| 4.3 |
|
| 10.9 |
|
| 15.2 |
Cash expenditures |
|
| (6.9) |
|
| (13.6) |
|
| (20.5) |
Non-cash items |
|
| (0.1) |
|
| (0.2) |
|
| (0.3) |
Accrual balance at September 30, 2016 |
| $ | 1.6�� |
| $ | 1.0 |
| $ | 2.6 |
| September 30, 2013 | September 30, 2012 | ||||||||||||
| Amount | Rate | Amount | Rate | ||||||||||
| Term Loan, due December 17, 2019 | $ | 594,709 | 4.7 | % | $ | — | — | ||||||
| Term Loan, due September 4, 2019 | 300,000 | 3.6 | % | — | — | ||||||||
| Term Loan, due September 4, 2017 | 850,000 | 3.0 | % | — | — | ||||||||
| Former term loan facility | — | — | 370,175 | 5.1 | % | ||||||||
| 9.5% Notes, due June 15, 2018 | — | — | 950,000 | 9.5 | % | ||||||||
| 6.375% Notes, due November 15, 2020 | 520,000 | 6.4 | % | — | — | ||||||||
| 6.625% Notes, due November 15, 2022 | 570,000 | 6.6 | % | — | — | ||||||||
| 6.75% Notes, due March 15, 2020 | 300,000 | 6.8 | % | 300,000 | 6.8 | % | |||||||
| ABL Facility, expiring May 24, 2017 | — | 5.7 | % | — | 4.3 | % | |||||||
| Other notes and obligations | 28,468 | 8.5 | % | 18,059 | 10.9 | % | |||||||
| Capitalized lease obligations | 67,402 | 6.2 | % | 26,683 | 6.2 | % | |||||||
| $ | 3,230,579 | $ | 1,664,917 | ||||||||||
| Original issuance (discounts) premiums on debt | (11,716 | ) | 4,383 | ||||||||||
| Less: current maturities | 102,921 | 16,414 | |||||||||||
| Long-term debt | $ | 3,115,942 | $ | 1,652,886 | |||||||||
The Company’s aggregate scheduled maturities of debtfollowing summarizes restructuring and capital lease obligationsrelated charges by segment for the years ended September 30, 2016, 2015, and 2014, cumulative costs on restructuring initiatives as of
| 2014 | $ | 102,921 | |
| 2015 | 79,252 | ||
| 2016 | 77,717 | ||
| 2017 | 671,668 | ||
| 2018 | 11,906 | ||
| Thereafter | 2,287,115 | ||
| $ | 3,230,579 | ||
|
|
|
|
|
|
|
|
|
|
|
|
|
|
|
|
|
|
|
(in millions) |
| GBA |
| PET |
| HHI |
| GAC |
| Corporate |
| Total | ||||||
For the year ended September 30, 2016 |
| $ | 0.8 |
| $ | 4.6 |
| $ | 4.5 |
|
| 5.3 |
| $ | — |
| $ | 15.2 |
For the year ended September 30, 2015 |
|
| 8.5 |
|
| 9.5 |
|
| 10.3 |
|
| — |
|
| 0.4 |
|
| 28.7 |
For the year ended September 30, 2014 |
|
| 11.2 |
|
| 3.0 |
|
| 8.2 |
|
| — |
|
| 0.5 |
|
| 22.9 |
Cumulative costs through September 30, 2016 |
|
| 30.0 |
|
| 15.1 |
|
| 19.3 |
|
| 5.3 |
|
| 2.1 |
|
| 71.8 |
Future costs to be incurred |
|
| 1.0 |
|
| 1.8 |
|
| 0.1 |
|
| 14.6 |
|
| 0.1 |
|
| 17.6 |
NOTE 5 - FAIR VALUE OF FINANCIAL STATEMENTS - (CONTINUED)
The fair valuevalues of the Company’s outstanding derivative contracts recordedfinancial assets and liabilities are defined as assets in the accompanying Consolidated Statements of Financial Position are as follows:
| Asset Derivatives | September 30, 2013 | September 30, 2012 | |||||||
| Derivatives designated as hedging instruments under ASC 815: | |||||||||
| Commodity contracts | Receivables—Other | $ | 416 | $ | 985 | ||||
| Commodity contracts | Deferred charges and other | 3 | 1,017 | ||||||
| Foreign exchange contracts | Receivables—Other | 1,719 | 1,194 | ||||||
| Total asset derivatives designated as hedging instruments under ASC 815 | 2,138 | 3,196 | |||||||
| Derivatives not designated as hedging instruments under ASC 815: | |||||||||
| Foreign exchange contracts | Receivables—Other | 143 | 41 | ||||||
| Total asset derivatives | $ | 2,281 | $ | 3,237 | |||||
| Liability Derivatives | September 30, 2013 | September 30, 2012 | |||||||
| Derivatives designated as hedging instruments under ASC 815: | |||||||||
| Commodity contracts | Accounts payable | $ | 450 | $ | 9 | ||||
| Foreign exchange contracts | Accounts payable | 4,577 | 3,063 | ||||||
| Foreign exchange contracts | Other long-term liabilities | 65 | — | ||||||
| Total liability derivatives designated as hedging instruments under ASC 815 | $ | 5,092 | $ | 3,072 | |||||
| Derivatives not designated as hedging instruments under ASC 815: | |||||||||
| Commodity contract | Accounts payable | 55 | — | ||||||
| Foreign exchange contracts | Accounts payable | 5,323 | 3,967 | ||||||
| Foreign exchange contracts | Other long-term liabilities | — | 2,926 | ||||||
| Total liability derivatives | $ | 10,470 | $ | 9,965 | |||||
Derivatives in ASC 815 Cash Flow Hedging Relationships | Amount of (Loss) Gain Recognized in AOCI on Derivatives (Effective Portion) | Location of (Loss) Gain Reclassified from AOCI into Income (Effective Portion) | Amount of (Loss) Gain Reclassified from AOCI into Income (Effective Portion) | Location of (Loss) Gain Recognized in Income on Derivatives (Ineffective Portion and Amount Excluded from Effectiveness Testing) | Amount of Loss Recognized in Income on Derivatives (Ineffective Portion and Amount Excluded from Effectiveness Testing) | ||||||||||
| Commodity contracts | $ | (2,615 | ) | Cost of goods sold | $ | (632 | ) | Cost of goods sold | $ | (39 | ) | ||||
| Foreign exchange contracts | 884 | Net sales | 920 | Net sales | — | ||||||||||
| Foreign exchange contracts | (282 | ) | Cost of goods sold | 632 | Cost of goods sold | — | |||||||||
| Total | $ | (2,013 | ) | $ | 920 | $ | (39 | ) | |||||||
Derivatives in ASC 815 Cash Flow Hedging Relationships | Amount of Gain (Loss) Recognized in AOCI on Derivatives (Effective Portion) | Location of Gain (Loss) Reclassified from AOCI into Income (Effective Portion) | Amount of Loss Reclassified from AOCI into Income (Effective Portion) | Location of Loss Recognized in Income on Derivatives (Ineffective Portion and Amount Excluded from Effectiveness Testing) | Amount of Gain Recognized in Income on Derivatives (Ineffective Portion and Amount Excluded from Effectiveness Testing) | ||||||||||
| Commodity contracts | $ | 1,606 | Cost of goods sold | $ | (1,148 | ) | Cost of goods sold | $ | 94 | ||||||
| Interest rate contracts | 15 | Interest expense | (864 | ) | Interest expense | — | |||||||||
| Foreign exchange contracts | 61 | Net sales | (474 | ) | Net sales | — | |||||||||
| Foreign exchange contracts | (3,506 | ) | Cost of goods sold | (611 | ) | Cost of goods sold | — | ||||||||
| Total | $ | (1,824 | ) | $ | (3,097 | ) | $ | 94 | |||||||
Derivatives in ASC 815 Cash Flow Hedging Relationships | Amount of Loss Recognized in AOCI on Derivatives (Effective Portion) | Location of Loss Reclassified from AOCI into Income (Effective Portion) | Amount of Gain (Loss) Reclassified from AOCI into Income (Effective Portion) | Location of Gain (Loss) Recognized in Income on Derivatives (Ineffective Portion and Amount Excluded from Effectiveness Testing) | Amount of Loss Recognized in Income on Derivatives (Ineffective Portion and Amount Excluded from Effectiveness Testing) | |||||||||||
| Commodity contracts | $ | (1,750 | ) | Cost of goods sold | $ | 2,617 | Cost of goods sold | $ | (47 | ) | ||||||
| Interest rate contracts | (88 | ) | Interest expense | (3,319 | ) | Interest expense | (205 | ) | (A) | |||||||
| Foreign exchange contracts | (487 | ) | Net sales | (131 | ) | Net sales | — | |||||||||
| Foreign exchange contracts | (3,667 | ) | Cost of goods sold | (12,384 | ) | Cost of goods sold | — | |||||||||
| Total | $ | (5,992 | ) | $ | (13,217 | ) | $ | (252 | ) | |||||||
Derivatives Not Designated as Hedging Instruments Under ASC 815 | Amount of (Loss) Gain Recognized in Income on Derivatives | Location of (Loss) or Gain Recognized in Income on Derivatives | |||||||||||
| 2013 | 2012 | 2011 | |||||||||||
| Commodity contracts | $ | (55 | ) | $ | — | $ | — | Cost of goods sold | |||||
| Foreign exchange contracts | (3,597 | ) | 5,916 | (5,052 | ) | Other expense, net | |||||||
| Total | $ | (3,652 | ) | $ | 5,916 | $ | (5,052 | ) | |||||
· | Level 1 - Unadjusted quoted prices for identical instruments in active markets. |
· | Level 2 - Quoted prices for similar instruments in active markets; quoted prices for identical or similar instruments in markets that are not active; and model-derived valuations whose inputs are observable or whose significant value drivers are observable. |
· | Level 3 - Significant inputs to the valuation model are unobservable. |
The Company utilizes valuation techniques that attempt to maximize the use of observable inputs and minimize the use of unobservable inputs. The determination of the fair values considers various factors,Company’s derivatives are valued on a recurring basis using internal models, which are based on market observable inputs including closing exchangeinterest rate curves and both forward and spot prices for currencies and commodities, which are generally based on quoted or over-the-counterobserved market pricing quotations, time value and credit quality factors underlying options and contracts.prices (Level 2). The fair value of certain derivative financial instruments is estimated using pricing models based on contracts with similar terms and risks. Modeling techniques assume market correlation and volatility, such as using prices of one delivery point to calculate the price of the contract’s different delivery point. The nominal value of interest rate transactions is discounted using applicable forward interest rate curves. In addition, by applying a credit reserve which is calculated based on credit default swaps or published default probabilities for the actual and potential asset value, the fair value of the Company’s derivative financial instrument assets reflects the risk that the counterparties to these contracts may default on the obligations. Likewise, by assessing the requirements of a reserve for non-performance which is calculated based on the probability of default by the Company, the Company adjusts its derivative contract liabilities to reflect the price at which a potential market participant would be willing to assume the Company’s liabilities. The Company has not changed itsthe valuation techniques used in measuring the fair value of any financial assets and liabilities during the year.
90
SPECTRUM BRANDS HOLDINGS, INC.
SB/RH HOLDINGS, LLC
NOTES TO THE CONSOLIDATED FINANCIAL STATEMENTS - (CONTINUED)
The fair values of thesederivative instruments as of
|
|
|
|
|
|
|
|
|
|
|
|
|
|
| 2016 |
| 2015 | ||||||||
|
| Carrying |
|
|
|
| Carrying |
|
|
| ||
(in millions) |
| Amount |
| Fair Value |
| Amount |
| Fair Value | ||||
Derivative Assets |
| $ | 8.7 |
| $ | 8.7 |
| $ | 6.0 |
| $ | 6.0 |
Derivative Liabilities |
| $ | 3.2 |
| $ | 3.2 |
| $ | 9.8 |
| $ | 9.8 |
| Level 1 | Level 2 | Level 3 | Total | ||||||||||||
| Total Assets, net | $ | — | $ | — | $ | — | $ | — | |||||||
| Liabilities: | |||||||||||||||
| Commodity contracts, net | $ | — | $ | (86 | ) | $ | — | $ | (86 | ) | |||||
| Foreign exchange contracts, net | — | (8,103 | ) | — | (8,103 | ) | |||||||||
| Total Liabilities, net | $ | — | $ | (8,189 | ) | $ | — | $ | (8,189 | ) | |||||
| Level 1 | Level 2 | Level 3 | Total | ||||||||||||
| Assets: | |||||||||||||||
| Commodity contracts, net | $ | — | $ | 1,993 | $ | — | $ | 1,993 | |||||||
| Total Assets, net | $ | — | $ | 1,993 | $ | — | $ | 1,993 | |||||||
| Liabilities: | |||||||||||||||
| Foreign exchange contracts, net | $ | — | $ | (8,721 | ) | $ | — | $ | (8,721 | ) | |||||
| Total Liabilities, net | $ | — | $ | (8,721 | ) | $ | — | $ | (8,721 | ) | |||||
The carrying values of cash and cash equivalents, accounts and notes receivable,receivables, accounts payable and short term debt approximate fair value. The fair values of long-term publicly traded debt arevalue based on unadjusted quoted market prices (Level 1)the short-term nature of these assets and derivative financial instruments are generally based on quoted or observed market prices (Level 2).
The carrying amountsvalues and estimated fair values for debt as of September 30, 2016 and 2015 are as follows:
|
|
|
|
|
|
|
|
|
|
|
|
|
|
|
|
|
|
|
|
|
|
|
|
|
|
|
| 2016 |
| 2015 | ||||||||
|
| Carrying |
|
|
|
| Carrying |
|
|
| ||
(in millions) |
| Amount |
| Fair Value |
| Amount |
| Fair Value | ||||
Total debt - SBH |
| $ | 3,620.2 |
| $ | 3,865.1 |
| $ | 3,905.9 |
| $ | 4,085.8 |
Total debt - SB/RH |
| $ | 3,620.2 |
| $ | 3,865.1 |
| $ | 3,940.6 |
| $ | 4,120.5 |
The fair value measurements of the Company’s financial instrumentsdebt represent non-active market exchange-traded securities which are summarizedvalued at quoted input prices that are directly observable or indirectly observable through corroboration with observable market data (Level 2).
NOTE 6 - RECEIVABLES
The allowance for uncollectible receivables as follows ((liability)/of September 30, 2016 and 2015 was $46.8 million and $44.0 million, respectively. The following is a rollforward of the allowance for the years ended September 30, 2016, 2015 and 2014:
|
|
|
|
|
|
|
|
|
|
|
|
|
|
|
|
|
| Beginning |
| Charged to |
|
|
| Other |
| Ending | |||||
(in millions) |
| Balance |
| Profit & Loss |
| Deductions |
| Adjustments |
| Balance | |||||
September 30, 2016 |
| $ | 44.0 |
| $ | 15.6 |
| $ | (12.0) |
| $ | (0.8) |
| $ | 46.8 |
September 30, 2015 |
| $ | 48.6 |
| $ | 6.0 |
| $ | (6.3) |
| $ | (4.3) |
| $ | 44.0 |
September 30, 2014 |
| $ | 37.4 |
| $ | 7.4 |
| $ | (2.4) |
| $ | 6.2 |
| $ | 48.6 |
The Company has a broad range of customers including many large retail outlet chains, one of which accounts for a significant percentage of its sales volume. This major customer represented 15%, 15% and 16% of the Company’s Net Sales during years ended September 30, 2016, 2015 and 2014, respectively. This major customer also represented 15% and 16% of the Company’s Trade Receivables as of September 30, 2016 and 2015, respectively.
We have entered into various factoring agreements and early pay programs with our customers to sell our trade receivables under non-recourse agreements in exchange for cash proceeds. A loss on sales is recognized for any discount and factoring fees associated with the transfer. We utilize factoring arrangements as an integral part of our financing for working capital. These transactions are treated as a sale and are accounted for as a reduction in trade receivables because the agreements transfer effective control over and risk related to the receivables to buyers. In some instances, we may continue to service the transferred receivable after the factoring has occurred, but in most cases we do not service any factored accounts, and any servicing of the trade receivable does not constitute significant continuing involvement or preclude the recognition of a sale. We do not carry any material servicing assets or liabilities. Cash proceeds from these arrangements are reflected as operating activities. The aggregate gross amount factored under these facilities was $2,055.0 million, $1,938.0 million and $1,575.0 million for the years ended September 30, 2016, 2015 and 2014, respectively. The cost of factoring such trade receivables was $10.1 million, $6.5 million and $9.7 million for the years ended September 30, 2016, 2015 and 2014 and reflected in the Consolidated Statements of Income as General and Administrative Expense.
91
SPECTRUM BRANDS HOLDINGS, INC.
SB/RH HOLDINGS, LLC
NOTES TO THE CONSOLIDATED FINANCIAL STATEMENTS
NOTE 7 - (CONTINUED)
| September 30, 2013 | September 30, 2012 | ||||||||||||||
Carrying Amount | Fair Value | Carrying Amount | Fair Value | ||||||||||||
| Total debt | $ | (3,218,863 | ) | $ | (3,297,411 | ) | $ | (1,669,300 | ) | $ | (1,804,831 | ) | |||
| Commodity swap and option agreements | (86 | ) | (86 | ) | 1,993 | 1,993 | |||||||||
| Foreign exchange forward agreements | (8,103 | ) | (8,103 | ) | (8,721 | ) | (8,721 | ) | |||||||
Inventories as of September 30, 2016 and 2015 consist of the following componentsfollowing:
|
|
|
|
|
|
|
|
|
|
|
|
|
|
(in millions) |
| 2016 |
| 2015 | ||
Raw materials |
| $ | 127.5 |
| $ | 132.4 |
Work-in-process |
|
| 43.6 |
|
| 37.9 |
Finished goods |
|
| 569.5 |
|
| 610.5 |
|
| $ | 740.6 |
| $ | 780.8 |
NOTE 8 - Property, Plant and Equipment
Property, plant and equipment as of (loss) income from continuing operations before income tax:September 30, 2016 and 2015 consist of the following:
|
|
|
|
|
|
|
(in millions) |
| 2016 |
| 2015 | ||
Land, buildings and improvements |
| $ | 195.8 |
| $ | 190.9 |
Machinery, equipment and other |
|
| 550.6 |
|
| 491.9 |
Capitalized leases |
|
| 130.0 |
|
| 97.3 |
Construction in progress |
|
| 57.7 |
|
| 51.8 |
Property, plant and equipment |
| $ | 934.1 |
| $ | 831.9 |
Accumulated depreciation |
|
| (392.0) |
|
| (324.8) |
Property, plant and equipment, net |
| $ | 542.1 |
| $ | 507.1 |
NOTE 9 - GOODWILL AND INTANGIBLE ASSETS
Goodwill, by segment, consists of the following:
|
|
|
|
|
|
|
|
|
|
|
|
|
|
|
|
|
|
|
|
|
|
|
|
|
|
|
|
|
|
|
|
|
|
|
|
|
|
(in millions) |
| GBA |
| HHI |
| PET |
| H&G |
| GAC |
| Total | ||||||
As of September 30, 2014 |
| $ | 327.4 |
| $ | 709.8 |
| $ | 235.9 |
| $ | 196.5 |
| $ | — |
| $ | 1,469.6 |
AAG acquisition |
|
| 38.9 |
|
| — |
|
| — |
|
| — |
|
| 933.2 |
|
| 972.1 |
European IAMS and Eukanuba acquisition |
|
| — |
|
| — |
|
| 4.0 |
|
| — |
|
| — |
|
| 4.0 |
Salix acquisition |
|
| — |
|
| — |
|
| 71.5 |
|
| — |
|
| — |
|
| 71.5 |
Tell Manufacturing acquisition |
|
| — |
|
| 7.1 |
|
| — |
|
| — |
|
| — |
|
| 7.1 |
Foreign currency impact |
|
| (17.8) |
|
| (17.4) |
|
| (11.8) |
|
| — |
|
| (0.6) |
|
| (47.6) |
As of September 30, 2015 |
|
| 348.5 |
|
| 699.5 |
|
| 299.6 |
|
| 196.5 |
|
| 932.6 |
|
| 2,476.7 |
Adjustments |
|
| — |
|
| — |
|
| — |
|
| — |
|
| 3.3 |
|
| 3.3 |
Foreign currency impact |
|
| (3.4) |
|
| 3.3 |
|
| 0.2 |
|
| — |
|
| (1.7) |
|
| (1.6) |
As of September 30, 2016 |
| $ | 345.1 |
| $ | 702.8 |
| $ | 299.8 |
| $ | 196.5 |
| $ | 934.2 |
| $ | 2,478.4 |
| 2013 | 2012 | 2011 | ||||||||||
| Pretax (loss) income: | ||||||||||||
| United States | $ | (212,168 | ) | $ | (66,102 | ) | $ | (119,984 | ) | |||
| Outside the United States | 184,214 | 175,059 | 137,108 | |||||||||
| Total pretax (loss) income | $ | (27,954 | ) | $ | 108,957 | $ | 17,124 | |||||
The components of income tax expensecarrying value and accumulated amortization for intangible assets subject to amortization are as follows:
|
|
|
|
|
|
|
|
|
|
|
|
|
|
|
|
|
|
|
|
|
|
|
|
|
|
|
|
|
|
|
|
|
|
|
|
|
|
|
| 2016 |
| 2015 | ||||||||||||||
(in millions) |
| Gross Carrying Amount |
| Accumulated Amortization |
| Net |
| Gross Carrying Amount |
| Accumulated Amortization |
| Net | ||||||
Customer relationships |
| $ | 984.8 |
| $ | (302.9) |
| $ | 681.9 |
| $ | 985.2 |
| $ | (247.4) |
| $ | 737.8 |
Technology assets |
|
| 237.2 |
|
| (96.7) |
|
| 140.5 |
|
| 238.6 |
|
| (78.1) |
|
| 160.5 |
Tradenames |
|
| 165.7 |
|
| (89.1) |
|
| 76.6 |
|
| 165.4 |
|
| (73.7) |
|
| 91.7 |
Total |
| $ | 1,387.7 |
| $ | (488.7) |
| $ | 899.0 |
| $ | 1,389.2 |
| $ | (399.2) |
| $ | 990.0 |
| 2013 | 2012 | 2011 | ||||||||||
| Current: | ||||||||||||
| Foreign | $ | 47,740 | $ | 38,113 | $ | 32,649 | ||||||
| State | 1,274 | (361 | ) | 2,332 | ||||||||
| Total current | $ | 49,014 | $ | 37,752 | $ | 34,981 | ||||||
| Deferred: | ||||||||||||
| Federal | (23,397 | ) | 20,884 | 20,247 | ||||||||
| Foreign | 2,146 | 5,190 | 28,054 | |||||||||
| State | (404 | ) | (3,441 | ) | 9,013 | |||||||
| Total deferred | $ | (21,655 | ) | $ | 22,633 | $ | 57,314 | |||||
| Income tax expense | $ | 27,359 | $ | 60,385 | $ | 92,295 | ||||||
Certain trade names intangible assets have an indefinite life and are not amortized. The following reconcilesbalance of trade names not subject to amortization was $1,473.5 million and $1,490.3 million as of September 30, 2016 and 2015. During the total income tax expense, basedyear ended September 30, 2016, the Company recognized $4.7 million impairment on indefinite life intangible assets due to the Federal statutory income tax rate of
92
SPECTRUM BRANDS HOLDINGS, INC.
SB/RH HOLDINGS, LLC
NOTES TO THE CONSOLIDATED FINANCIAL STATEMENTS
Amortization expense from intangible assets for the years ended September 30, 2016, 2015 and 2014 was $93.9 million, $87.8 million and $81.7 million, respectively. Excluding the impact of any future acquisitions or changes in foreign currency, the Company anticipates the annual amortization expense of intangible assets for the next five fiscal years will be as follows:
|
|
|
|
(in millions) |
| Amortization | |
2017 |
| $ | 91.9 |
2018 |
|
| 85.7 |
2019 |
|
| 85.4 |
2020 |
|
| 85.2 |
2021 |
|
| 81.9 |
NOTE 10 - (CONTINUED)DEBT
Debt as of September 30, 2016 and 2015 consists of the following:
|
|
|
|
|
|
|
|
|
|
|
|
|
|
|
|
|
|
|
|
|
|
|
|
|
|
| SBH |
| SB/RH | ||||||||||||||||||||
|
| 2016 |
| 2015 |
| 2016 |
| 2015 | ||||||||||||||||
(in millions) |
| Amount |
| Rate |
| Amount |
| Rate |
| Amount |
| Rate |
| Amount |
| Rate | ||||||||
Term Loan, variable rate, due June 23, 2022 |
| $ | 1,005.5 |
| 3.6 | % |
| $ | 1,226.9 |
| 3.9 | % |
| $ | 1,005.5 |
| 3.6 | % |
| $ | 1,226.9 |
| 3.9 | % |
CAD Term Loan, variable rate, due June 23, 2022 |
|
| 54.9 |
| 4.6 | % |
|
| 55.7 |
| 4.4 | % |
|
| 54.9 |
| 4.6 | % |
|
| 55.7 |
| 4.4 | % |
Euro Term Loan, variable rate, due June 23, 2022 |
|
| 63.0 |
| 3.5 | % |
|
| 255.8 |
| 3.5 | % |
|
| 63.0 |
| 3.5 | % |
|
| 255.8 |
| 3.5 | % |
4.00% Notes, due October 1, 2026 |
|
| 477.0 |
| 4.0 | % |
|
| — |
| — | % |
|
| 477.0 |
| 4.0 | % |
|
| — |
| — | % |
5.75% Notes, due July 15, 2025 |
|
| 1,000.0 |
| 5.8 | % |
|
| 1,000.0 |
| 5.8 | % |
|
| 1,000.0 |
| 5.8 | % |
|
| 1,000.0 |
| 5.8 | % |
6.125% Notes, due December 15, 2024 |
|
| 250.0 |
| 6.1 | % |
|
| 250.0 |
| 6.1 | % |
|
| 250.0 |
| 6.1 | % |
|
| 250.0 |
| 6.1 | % |
6.375% Notes, due November 15, 2020 |
|
| 129.7 |
| 6.4 | % |
|
| 520.0 |
| 6.4 | % |
|
| 129.7 |
| 6.4 | % |
|
| 520.0 |
| 6.4 | % |
6.625% Notes, due November 15, 2022 |
|
| 570.0 |
| 6.6 | % |
|
| 570.0 |
| 6.6 | % |
|
| 570.0 |
| 6.6 | % |
|
| 570.0 |
| 6.6 | % |
Revolver Facility, variable rate, expiring June 23, 2020 |
|
| — |
| — | % |
|
| — |
| — | % |
|
| — |
| — | % |
|
| — |
| — | % |
Other notes and obligations |
|
| 16.8 |
| 9.8 | % |
|
| 11.2 |
| 10.2 | % |
|
| 16.8 |
| 9.8 | % |
|
| 45.9 |
| 4.9 | % |
Obligations under capital leases |
|
| 114.7 |
| 5.5 | % |
|
| 88.2 |
| 5.7 | % |
|
| 114.7 |
| 5.5 | % |
|
| 88.2 |
| 5.7 | % |
Total debt |
|
| 3,681.6 |
|
|
|
|
| 3,977.8 |
|
|
|
|
| 3,681.6 |
|
|
|
|
| 4,012.5 |
|
|
|
Unamortized discount on debt |
|
| (4.5) |
|
|
|
|
| (6.8) |
|
|
|
|
| (4.5) |
|
|
|
|
| (6.8) |
|
|
|
Debt issuance costs |
|
| (56.9) |
|
|
|
|
| (65.1) |
|
|
|
|
| (56.9) |
|
|
|
|
| (65.1) |
|
|
|
Less current portion |
|
| (164.0) |
|
|
|
|
| (33.8) |
|
|
|
|
| (164.0) |
|
|
|
|
| (68.5) |
|
|
|
Long-term debt, net of current portion |
| $ | 3,456.2 |
|
|
|
| $ | 3,872.1 |
|
|
|
| $ | 3,456.2 |
|
|
|
| $ | 3,872.1 |
|
|
|
Debt of SB/RH also includes a loan from SBH of $34.7 million as of September 30, 2015. There was no intercompany debt owed by SB/RH as of September 30, 2016.
The Company’s aggregate scheduled maturities of debt and capital lease obligations are as follows:
|
|
|
|
|
|
|
|
|
|
|
|
|
|
|
|
|
|
|
|
| SBH |
| SB/RH | ||||||||||||||
(in millions) |
| Capital Lease Obligations |
| Debt |
| Total |
| Capital Lease Obligations |
| Debt |
| Total | ||||||
2017 |
| $ | 10.0 |
| $ | 154.0 |
| $ | 164.0 |
| $ | 10.0 |
| $ | 154.0 |
| $ | 164.0 |
2018 |
|
| 9.5 |
|
| 15.3 |
|
| 24.8 |
|
| 9.5 |
|
| 15.3 |
|
| 24.8 |
2019 |
|
| 8.8 |
|
| 11.4 |
|
| 20.2 |
|
| 8.8 |
|
| 11.4 |
|
| 20.2 |
2020 |
|
| 8.5 |
|
| 11.4 |
|
| 19.9 |
|
| 8.5 |
|
| 11.4 |
|
| 19.9 |
2021 |
|
| 10.0 |
|
| 11.3 |
|
| 21.3 |
|
| 10.0 |
|
| 11.3 |
|
| 21.3 |
Thereafter |
|
| 67.9 |
|
| 3,363.5 |
|
| 3,431.4 |
|
| 67.9 |
|
| 3,363.5 |
|
| 3,431.4 |
Long-term debt |
| $ | 114.7 |
| $ | 3,566.9 |
| $ | 3,681.6 |
| $ | 114.7 |
| $ | 3,566.9 |
| $ | 3,681.6 |
| 2013 | 2012 | 2011 | ||||||||||
| Statutory federal income tax (benefit) expense | $ | (9,784 | ) | $ | 38,135 | $ | 5,994 | |||||
| Permanent items | 10,104 | 8,595 | 8,654 | |||||||||
| Exempt foreign income | (5,921 | ) | (5,760 | ) | (380 | ) | ||||||
| Foreign statutory rate vs. U.S. statutory rate | (19,182 | ) | (15,211 | ) | (14,132 | ) | ||||||
| State income taxes, net of federal (benefit) expense | (11,686 | ) | (2,164 | ) | 1,242 | |||||||
| Residual tax on foreign earnings | (6,958 | ) | 29,844 | 18,943 | ||||||||
| FURminator purchase accounting benefit | — | (14,511 | ) | — | ||||||||
| HHI purchase accounting benefit | (49,848 | ) | — | — | ||||||||
| Valuation allowance | 115,318 | 26,003 | 68,615 | |||||||||
| Unrecognized tax expense (benefits) | 4,062 | (4,386 | ) | (2,793 | ) | |||||||
| Inflationary adjustments | (245 | ) | (803 | ) | (1,472 | ) | ||||||
| Correction of immaterial prior period error | — | — | 4,873 | |||||||||
| Nondeductible share compensation | 1,669 | 684 | 1,953 | |||||||||
| Other, net | (170 | ) | (41 | ) | 798 | |||||||
| Income tax expense | $ | 27,359 | $ | 60,385 | $ | 92,295 | ||||||
93
SPECTRUM BRANDS HOLDINGS, INC.
SB/RH HOLDINGS, LLC
NOTES TO THE CONSOLIDATED FINANCIAL STATEMENTS - (CONTINUED)
Term Loans and Revolver Facility
On June 23, 2015, SBI entered into term loan facilities pursuant to a Senior Credit Agreement consisting of (i) a $1,450 million USD Term Loan due June 23, 2022, (ii) a $75 million CAD Term Loan due June 23, 2022 and (iii) a €300 million Euro Term Loan due June 23, 2022, (collectively, “Term Loans”) and (iv) entered into a $500 million Revolver Facility due June 23, 2020 (the “Revolver”). The proceeds from the Term Loans and draws on the Revolver were used to repay SBI’s then-existing senior term credit facility, repay SBI’s outstanding 6.75% senior unsecured notes due 2020, repay and replace SBI’s then-existing asset based revolving loan facility, and to pay fees and expenses in thousands, exceptconnection with the refinancing and for general corporate purposes.
The Term Loans and Revolver are subject to variable interest rates, (i) the USD Term Loan is subject to either adjusted LIBOR (International Exchange London Interbank Offered Rate), subject to a 0.75% floor, plus 2.75% to 3.0% per share figures)
Subject to certain mandatory prepayment events, the Term Loans are subject to repayment according to scheduled amortizations, with the final payments of all amounts outstanding, plus accrued and unpaid interest, due at maturity. The Senior Credit Agreement contains customary affirmative and negative covenants, including, but not limited to, restrictions on SBI and its restricted subsidiaries’ ability to incur indebtedness, create liens, make investments, pay dividends or make certain other distributions, and merge or consolidate or sell assets, in each case subject to certain exceptions set forth in the Senior Credit Agreement. Additionally, the Senior Credit Agreement, solely with respect to the Revolver Facility, contains a financial covenant on the maximum net total leverage ratio that give riseis tested on the last day of each fiscal quarter. The Company was in compliance with all covenants as of September 30, 2016.
Pursuant to significanta guarantee agreement, SB/RH and the material wholly-owned domestic subsidiaries of SBI have guaranteed SBI’s obligations under the Senior Credit Agreement and related loan documents. Pursuant to a security agreement, SBI and such subsidiary guarantors have pledged substantially all of their respective assets to secure such obligations and, in addition, SB/RH has pledged the capital stock of SBI to secure such obligations. The Senior Credit Agreement also provides for customary events of default including payment defaults and cross-defaults to other material indebtedness.
The Term Loans were issued net of a $5.1 million discount, which is amortized with a corresponding charge to interest expense over the remaining life of the loans. The Company incurred $18.5 million of debt issuance costs of which $8.1 million was capitalized as debt issuance costs and the remainder of $10.4 million was recognized as interest expense during the year ended September 30, 2015. The Company recognized accelerated amortization of portions of the deferred tax assetsunamortized discount and deferred tax liabilities are as follows:
| September 30, | ||||||||
| 2013 | 2012 | |||||||
| Current deferred tax assets: | ||||||||
| Employee benefits | $ | 11,372 | $ | 16,399 | ||||
| Restructuring | 7,085 | 8,054 | ||||||
| Inventories and receivables | 24,296 | 22,495 | ||||||
| Marketing and promotional accruals | 14,146 | 8,270 | ||||||
| Other | 23,261 | 14,440 | ||||||
| Valuation allowance | (32,342 | ) | (29,808 | ) | ||||
| Total current deferred tax assets | $ | 47,818 | $ | 39,850 | ||||
| Current deferred tax liabilities: | ||||||||
| Inventories and receivables | (2,748 | ) | (2,618 | ) | ||||
| Unrealized gains | (373 | ) | (1,153 | ) | ||||
| Other | (11,738 | ) | (7,936 | ) | ||||
| Total current deferred tax liabilities | $ | (14,859 | ) | $ | (11,707 | ) | ||
| Net current deferred tax assets | $ | 32,959 | $ | 28,143 | ||||
| Noncurrent deferred tax assets: | ||||||||
| Employee benefits | $ | 35,578 | $ | 34,927 | ||||
| Restructuring and purchase accounting | 340 | 371 | ||||||
| Net operating loss and credit carry forwards | 668,679 | 572,857 | ||||||
| Prepaid royalty | 6,956 | 7,006 | ||||||
| Property, plant and equipment | 9,692 | 3,255 | ||||||
| Unrealized losses | 2,136 | 2,521 | ||||||
| Long-term debt | 668 | 3,976 | ||||||
| Intangibles | 3,917 | 4,282 | ||||||
| Other | 5,268 | 7,866 | ||||||
| Valuation allowance | (422,244 | ) | (354,992 | ) | ||||
| Total noncurrent deferred tax assets | $ | 310,990 | $ | 282,069 | ||||
| Noncurrent deferred tax liabilities: | ||||||||
| Property, plant, and equipment | (27,478 | ) | (15,337 | ) | ||||
| Unrealized gains | (13,126 | ) | (15,803 | ) | ||||
| Intangibles | (735,506 | ) | (596,199 | ) | ||||
| Taxes on unremitted foreign earnings | (18,581 | ) | (29,231 | ) | ||||
| Other | (9,073 | ) | (2,964 | ) | ||||
| Total noncurrent deferred tax liabilities | $ | (803,764 | ) | $ | (659,534 | ) | ||
| Net noncurrent deferred tax liabilities | $ | (492,774 | ) | $ | (377,465 | ) | ||
| Net current and noncurrent deferred tax liabilities | $ | (459,815 | ) | $ | (349,322 | ) | ||
In Fiscal 2012,connection with the new Revolver Facility, the Company began recording residual U.S.incurred $5.7 million of fees that were capitalized as debt issuance costs and foreign taxes on foreign earnings as a result of its change in position regarding future repatriation andare being amortized over the requirements of ASC 740. To the extent necessary, the Company intends to utilize earnings of foreign subsidiaries in order to support management's plans to voluntarily accelerate pay down of U.S. debt, fund distributions to shareholders, fund U.S. acquisitions, and satisfy ongoing U.S. operational cash flow requirements. As a result, earningsremaining life of the Company's non-U.S. subsidiaries afterRevolver Facility. The Company recorded accelerated amortization of portions of the unamortized debt issuance costs related to the refinancing of the previous revolver facility totaling $1.1 million as an increase to interest expense during the year ended September 30, 2011 are generally not considered to be permanently reinvested, except in jurisdictions where repatriation is either precluded or restricted by law. The Company annually estimates the available earnings, permanent reinvestment classification, and availability and intent to use alternative
94
SPECTRUM BRANDS HOLDINGS, INC.
SB/RH HOLDINGS, LLC
NOTES TO THE CONSOLIDATED FINANCIAL STATEMENTS
4.00% Notes
On September 20, 2016, SBI issued €425 million aggregate principal amount of 4.00% Notes at par value, due October 1, 2026. The 4.00% Notes are guaranteed by SB/RH as well as by SBI’s existing and future domestic subsidiaries.
SBI may redeem all or a part of the 4.00% Notes, at any time on approximately
The 2026 Indenture contains customary covenants that limit, among other things, the incurrence of additional indebtedness, payment of dividends on or redemption or repurchase of equity interests, the making of certain investments, expansion into unrelated businesses, creation of liens on assets, merger or consolidation with another company, transfer or sale of all or substantially all assets, and transactions with affiliates.
In addition, the 2026 Indenture provides for customary events of default, including failure to make required payments, failure to comply with certain agreements or covenants, failure to make payments when due or on acceleration of certain other indebtedness, and certain events of bankruptcy and insolvency. Events of default under the 2026 Indenture arising from certain events of bankruptcy or insolvency will automatically cause the acceleration of the amounts due under the 4.00% Notes. If any other event of default under the 2026 Indenture occurs and is continuing, the trustee for the 2026 Indenture or the registered holders of at least 25% in the then aggregate outstanding principal amount of the 4.00% Notes, may declare the acceleration of the amounts due under those notes.
The Company recorded $7.7 million of fees in connection with the offering of the 4.00% Notes during the year ended September 30, 2016, which have been capitalized as debt issuance costs and are being amortized over the remaining life of the 4.00% Notes.
5.75% Notes
On May 20, 2015, in connection with the acquisition of the AAG Business, SBI issued $1,000 million aggregate principal amount of 5.75% Notes at par value, due July 15, 2025 (the “5.75% Notes”). The 5.75% Notes are guaranteed by SB/RH as well as by SBI’s existing and future domestic subsidiaries.
SBI may redeem all or a part of the 5.75% Notes, at any time on or after July 15, 2020, at specified redemption prices. In addition, prior to July 15, 2020, SBI may redeem the notes at a redemption price equal to 100% of the principal amount plus a “make-whole” premium. SBI is also entitled to redeem up to 35% of the aggregate principal amount of the notes before July 15, 2018 with an amount of cash equal to the net proceeds that SBI raises in equity offerings at specified redemption prices. Further, the indenture governing the 5.75% Notes (the “2025 Indenture”) requires SBI to make an offer, in cash, to repurchase all or a portion of the applicable outstanding notes for a specified redemption price, including a redemption premium, upon the occurrence of a change of control of SBI, as defined in the 2025 Indenture.
The 2025 Indenture contains customary covenants that limit, among other things, the incurrence of additional indebtedness, payment of dividends on or redemption or repurchase of equity interests, the making of certain investments, expansion into unrelated businesses, creation of liens on assets, merger or consolidation with another company, transfer or sale of all or substantially all assets, and transactions with affiliates.
In addition, the 2025 Indenture provides for customary events of default, including failure to make required payments, failure to comply with certain agreements or covenants, failure to make payments when due or on acceleration of certain other indebtedness, and certain events of bankruptcy and insolvency. Events of default under the 2025 Indenture arising from certain events of bankruptcy or insolvency will automatically cause the acceleration of the amounts due under the 5.75% Notes. If any other event of default under the 2025 Indenture occurs and is continuing, the trustee for the 2025 Indenture or the registered holders of at least 25% in the then aggregate outstanding principal amount of the 5.75% Notes, may declare the acceleration of the amounts due under those notes.
The Company recorded $19.7 million of fees in connection with the offering of the 5.75% Notes during the year ended September 30, 2015, which have been capitalized as debt issuance costs and are being amortized over the remaining life of the 5.75% Notes.
95
SPECTRUM BRANDS HOLDINGS, INC.
SB/RH HOLDINGS, LLC
NOTES TO THE CONSOLIDATED FINANCIAL STATEMENTS
6.125% Notes
On December 4, 2014, SBI issued $250 million aggregate principal amount of 6.125% Notes at par value, due December 15, 2024 (the”6.125% Notes”). The 6.125% Notes are guaranteed SB/RH, as well as by SBI’s existing and future domestic subsidiaries.
SBI may redeem all or a part of the 6.125% Notes, at any time on or after December 15, 2019, at specified redemption prices. Prior to December 15, 2019, SBI may redeem the notes at a redemption price equal to 100% of the principal amount plus a “make-whole” premium. SBI is also entitled to redeem up to 35% of the aggregate principal amount of the notes before December 15, 2017 with an amount of cash equal to the net proceeds that SBI raises in equity offerings at specified redemption prices. Further, the indenture governing the 6.125% Notes (the “2024 Indenture”) requires SBI to make an offer, in cash, to repurchase all or a portion of the applicable outstanding notes for a specified redemption price, including a redemption premium, upon the occurrence of a change of control of SBI, as defined in the 2024 Indenture.
The 2024 Indenture contains customary covenants that limit, among other things, the incurrence of additional indebtedness, payment of dividends on or redemption or repurchase of equity interests, the making of certain investments, expansion into unrelated businesses, creation of liens on assets, merger or consolidation with another company, transfer or sale of all or substantially all assets, and transactions with affiliates.
In addition, the 2024 Indenture provides for customary events of default, including failure to make required payments, failure to comply with certain agreements or covenants, failure to make payments when due or on acceleration of certain other indebtedness, and certain events of bankruptcy and insolvency. Events of default under the 2024 Indenture arising from certain events of bankruptcy or insolvency will automatically cause the acceleration of the amounts due under the 6.125% Notes. If any other event of default under the 2024 Indenture occurs and is continuing, the trustee for the 2024 Indenture or the registered holders of at least 25% in the then aggregate outstanding principal amount of the 6.125% Notes, may declare the acceleration of the amounts due under those notes.
The Company recorded $4.6 million of fees in connection with the offering of the 6.125% Notes, which have been capitalized as debt issuance costs and are being amortized over the remaining life of the 6.125% Notes.
6.375% Notes and 6.625% Notes
On December 17, 2012, in connection with the acquisition of HHI Business, the Company assumed $520 million aggregate principal amount of 6.375% Notes at par value, due November 15, 2020 (the “6.375% Notes”), and $570 million aggregate principal amount of 6.625% Notes at par value, due November 15, 2022 (the “6.625% Notes”). The 6.375% Notes and 6.625% Notes are unsecured and guaranteed by SB/RH, as well as by existing and future domestic restricted subsidiaries.
The Company may redeem all or a part of the 6.375% Notes and the 6.625% Notes, upon not less than 30 or more than 60 days notice, at specified redemption prices. Further, the indenture governing the 6.375% Notes and the 6.625% Notes (the “2020/22 Indenture”) requires the Company to make an offer, in cash, to repurchase all or a portion of the applicable outstanding notes for a specified redemption price, including a redemption premium, upon the occurrence of a change of control of the Company, as defined in such indenture.
The 2020/22 Indenture contains customary covenants that limit, among other things, the incurrence of additional indebtedness, payment of dividends on or redemption or repurchase of equity interests, the making of certain investments, expansion into unrelated businesses, creation of liens on assets, merger or consolidation with another company, transfer or sale of all or substantially all assets, and transactions with affiliates.
In addition, the 2020/22 Indenture provides for customary events of default, including failure to make required payments, failure to comply with certain agreements or covenants, failure to make payments when due or on acceleration of certain other indebtedness, and certain events of bankruptcy and insolvency. Events of default under the 2020/22 Indenture arising from certain events of bankruptcy or insolvency will automatically cause the acceleration of the amounts due under the 6.375% Notes and the 6.625% Notes. If any other event of default under the 2020/22 Indenture occurs and is continuing, the trustee for the 2020/22 Indenture or the registered holders of at least 25% in the then aggregate outstanding principal amount of the 6.375% Notes, or the 6.625% Notes, may declare the acceleration of the amounts due under those notes.
96
SPECTRUM BRANDS HOLDINGS, INC.
SB/RH HOLDINGS, LLC
NOTES TO THE CONSOLIDATED FINANCIAL STATEMENTS
The Company recorded $12.9 million and $14.1 million of fees in connection with the offering of the 6.375% Notes and the 6.625% Notes, which were capitalized as debt issuance costs and amortized over the remaining lives of the 6.375% Notes and 6.625% Notes, respectively. In connection with the issuance of the 4.00% Notes previously discussed, the Company repurchased $390.3 million aggregate principal amount of the 6.375% Notes in a cash tender offer. In connection with the tender, the Company recognized $6.5 million of fees and expenses and a $15.6 million tender premium as interest expense; and wrote off $5.8 million of previously capitalized debt issuance costs as a non-cash charge to interest expense during the year ended September 30, 2016. Pursuant to the 2020/22 Indenture, the remaining outstanding aggregate principal of $129.7 million was subsequently redeemed on October 20, 2016 with a make whole premium of $4.6 million charged to interest expense subsequent to the year ended September 30, 2016.
NOTE 11 - LEASES
The Company has leases primarily pertaining to land, buildings and equipment that expire at various times through December 2031. The Company’s minimum rent payments under operating leases are recognized on a straight-line basis over the term of the leases. Future minimum rental commitments under non-cancelable operating leases are as follows:
|
|
|
|
(in millions) |
| Amount | |
2017 |
| $ | 42.3 |
2018 |
|
| 32.7 |
2019 |
|
| 23.4 |
2020 |
|
| 18.0 |
2021 |
|
| 12.3 |
Thereafter |
|
| 18.4 |
Total minimum lease payments |
| $ | 147.1 |
Rent expense was $46.8 million, $36.3 million and $40.8 million for the years ended September 30, 2016, 2015 and 2014, respectively.
NOTE 12 - DERIVATIVES
Derivative financial instruments are used by the Company principally in the management of its interest rate, foreign currency exchange rate and raw material price exposures. The Company does not hold or issue derivative financial instruments for trading purposes. For derivative instruments that are designated and qualify as cash flow hedges, the gain or loss on the effective portion of the derivative is reported as a component of Accumulated Other Comprehensive Income (“AOCI”) and reclassified into earnings in the same period or periods during which the hedged transaction affects earnings. Gains and losses on derivatives representing either hedge ineffectiveness or hedge components excluded from the assessment of effectiveness are recognized in current earnings.
Cash Flow Hedges
Interest Rate Swaps. Fiscal 2013 increaseThe Company uses interest rate swaps to manage its interest rate risk. The swaps are designated as cash flow hedges with the changes in tax expense, net offair value recorded in AOCI and as a correspondingderivative asset or liability, as applicable. The swaps settle periodically in arrears with the related amounts for the current settlement period payable to, or receivable from, the counter-parties included in accrued liabilities or receivables, respectively, and recognized in earnings as an adjustment to Interest Expense from the Company's domestic valuation allowance, of approximately $109.underlying debt to which the swap is designated. As of September 30, 2012,2016 and 2015, the Company recorded residualhad a series of U.S. and foreign taxesdollar denominated interest rate swaps outstanding which effectively fix the interest on approximately $21,163variable rate debt, exclusive of Fiscal 2012 distributions and $76,475lender spreads, at 1.36% for a notional principal amount of $300.0 million through April 2017. The derivative net losses estimated to be reclassified from AOCI into earnings not yet taxed inover the U.S., resulting in a Fiscal 2012 increase in tax expense,next 12 months is $0.7 million, net of tax. The Company’s interest rate swap derivative financial instruments at September 30, 2016 and 2015 are as follows:
|
|
|
|
|
|
|
|
|
|
|
|
|
|
|
|
|
|
|
|
|
|
|
|
|
|
|
| 2016 |
| 2015 | ||||||||
(in millions) |
| Notional Amount |
| Remaining Years |
| Notional Amount |
| Remaining Years | ||||
Interest rate swaps - fixed |
| $ | 300.0 |
|
| 0.5 |
| $ | 300.0 |
|
| 1.5 |
97
SPECTRUM BRANDS HOLDINGS, INC.
SB/RH HOLDINGS, LLC
NOTES TO THE CONSOLIDATED FINANCIAL STATEMENTS
Commodity Swaps. The Company is exposed to risk from fluctuating prices for raw materials, specifically zinc and brass used in its manufacturing processes. The Company hedges a correspondingportion of the risk associated with the purchase of these materials through the use of commodity swaps. The hedge contracts are designated as cash flow hedges with the fair value changes recorded in AOCI and as a hedge asset or liability, as applicable. The unrecognized changes in fair value of the hedge contracts are reclassified from AOCI into earnings when the hedged purchase of raw materials also affects earnings. The swaps effectively fix the floating price on a specified quantity of raw materials through a specified date. At September 30, 2016, the Company had a series of zinc and brass swap contracts outstanding through December 2017. The derivative net gains estimated to be reclassified from AOCI into earnings over the next 12 months is $1.9 million, net of tax. The Company had the following commodity swap contracts outstanding as of September 30, 2016 and 2015:
|
|
|
|
|
|
|
|
|
|
|
|
|
|
| 2016 |
| 2015 | ||||||||
(in millions, except notional) |
| Notional |
| Contract Value |
| Notional |
| Contract Value | ||||
Zinc swap contracts |
|
| 6.7 Tons |
| $ | 12.8 |
|
| 10.8 Tons |
| $ | 22.2 |
Brass swap contracts |
|
| 1.0 Tons |
| $ | 4.0 |
|
| 1.8 Tons |
| $ | 8.5 |
Foreign exchange contracts. The Company periodically enters into forward foreign exchange contracts to hedge the risk from forecasted foreign currency denominated third party and intercompany sales or payments. These obligations generally require the Company to exchange foreign currencies for U.S. Dollars, Euros, Pounds Sterling, Australian Dollars, Canadian Dollars or Japanese Yen. These foreign exchange contracts are cash flow hedges of fluctuating foreign exchange rates related to sales of product or raw material purchases. Until the sale or purchase is recognized, the fair value of the related hedge is recorded in AOCI and as a hedge asset or liability, as applicable. At the time the sale or purchase is recognized, the fair value of the related hedge is reclassified as an adjustment to Net Sales or purchase price variance in Cost of Goods Sold on the Company's domestic valuation allowance,Condensed Consolidated Statements of approximately Income. At September 30, 2016, the Company had a series of foreign exchange derivative contracts outstanding through December 2017. The derivative net gains estimated to be reclassified from AOCI into earnings over the next 12 months is $3.3 million, net of tax. At September 30, 2016 and 2015, the Company had foreign exchange derivative contracts designated as cash flow hedges with a notional value of $224.8 million and $300.6 million, respectively.$3,278.
Net Investment Hedge
On September 20, 2016, SBI issued €425 million aggregate principal amount of 4.00% Notes. See Note 10, “Debt” for further detail. The 4.00% Notes are denominated in Euros and have been designated as a net investment hedge of the translation of the Company’s net investments in Euro denominated subsidiaries at the time of issuance. As a result, the translation of the Euro denominated debt is recognized as AOCI with any ineffective portion recognized as foreign currency translation gains or losses on the statement of income when the aggregate principal exceeds the net investment in its Euro denominated subsidiaries. Net gains or losses from the net investment hedge are reclassified from AOCI into earnings upon a liquidation event or deconsolidation of Euro denominated subsidiaries. As of September 30, 2011,2016, the hedge was fully effective and no ineffective portion was recognized in earnings.
Derivative Contracts Not Designated As Hedges for Accounting Purposes
Foreign exchange contracts. The Company periodically enters into forward and swap foreign exchange contracts to economically hedge the risk from third party and intercompany payments resulting from existing obligations. These obligations generally require the Company recorded residualto exchange foreign currencies for U.S. andDollars, Canadian Dollars, Euros, Pounds Sterling, Taiwanese Dollars, Hong Kong Dollars or Australian Dollars. These foreign taxes on approximately $39,391 of actual and deemed distributions of foreign earnings resulting in a Fiscal 2011 increase in tax expense, netexchange contracts are economic hedges of a corresponding adjustmentrelated liability or asset recorded in the accompanying Consolidated Statements of Financial Position. The gain or loss on the derivative hedge contracts is recorded in earnings as an offset to the Company's domestic valuation allowance, of approximately $771. Fiscal 2013, 2012 and 2011 distributions were primarily non-cash deemed distributions under U.S. tax law.
98
SPECTRUM BRANDS HOLDINGS, INC.
SB/RH HOLDINGS, LLC
NOTES TO THE CONSOLIDATED FINANCIAL STATEMENTS
Commodity Swaps. The Company periodically enters into commodity swap contracts to economically hedge the risk from fluctuating prices for raw materials, specifically the pass-through of market prices for silver used in 2033. As of September 30, 2013 themanufacturing purchased watch batteries. The Company has foreign loss carryforwards of approximately $111,186 which will expire beginning in the Company's fiscal year ending 2014. Certainhedges a portion of the foreign net operating losses have indefinite carryforward periods. The Company is subject to an annual limitation onrisk associated with these materials through the use of its net operatingcommodity swaps. The swap contracts are designated as economic hedges with the unrealized gain or loss recorded in earnings and as an asset or liability at each period end. The unrecognized changes in fair value of the hedge contracts are adjusted through earnings when the realized gains or losses that arose prior to its emergence from bankruptcy.affect earnings upon settlement of the hedges. The swaps effectively fix the floating price on a specified quantity of silver through a specified date. At September 30, 2016, the Company had a series of commodity swaps outstanding through August 2017. The Company has had multiple changesthe following outstanding commodity swap contracts outstanding as of ownership, as defined under Section 382September 30, 2016 and 2015:
|
|
|
|
|
|
|
|
|
|
|
|
|
|
| 2016 |
| 2015 | ||||||||
(in millions, except notional) |
| Notional |
| Contract Value |
| Notional |
| Contract Value | ||||
Silver |
|
| 31.0 troy oz. |
| $ | 0.6 |
|
| 25.0 troy oz. |
| $ | 0.4 |
Fair Value of the Internal Revenue Code of 1986, as amended, that subject the Company’s U.S. federal and state net operating losses and other tax attributes to certain limitations. Derivative Instruments
The annual limitation is based on a number of factors including thefair value of the Company’s stock (as defined for tax purposes), on the date of the ownership change, its net unrealized built in gain position on that date, the occurrence of realized built in gains in years subsequent to the ownership change, and the effects of subsequent ownership changes (as defined for tax purposes), if any. Due to these limitations, the Company estimates, as of September 30, 2013, that $301,202 of the total U.S. federal and $357,938 of the state net operating loss will expire unused even if the Company generates sufficient income to otherwise use all of its NOLs. In addition, separate return year limitations apply to limit the Company’s utilization of the acquired Russell Hobbs U.S. federal and state net operating losses to future income of the Russell Hobbs subgroup. The Company also projects, as of September 30, 2013, that $102,576 of the total foreign loss carryforwards will expire unused. The Company has provided a full valuation allowance against these deferred tax assets.
|
|
|
|
|
|
|
|
|
|
|
|
|
|
|
|
|
|
(in millions) |
| Line Item |
| 2016 |
| 2015 | ||
Derivative Assets |
|
|
|
|
|
|
|
|
Commodity swaps - designated as hedge |
| Receivables—Other |
| $ | 2.9 |
| $ | — |
Commodity swaps - designated as hedge |
| Deferred charges and other |
|
| — |
|
| — |
Foreign exchange contracts - designated as hedge |
| Receivables—Other |
|
| 5.5 |
| $ | 5.2 |
Foreign exchange contracts - designated as hedge |
| Deferred charges and other |
|
| 0.1 |
|
| 0.4 |
Foreign exchange contracts - not designated as hedge |
| Receivables—Other |
|
| 0.2 |
|
| 0.4 |
Total Derivative Assets |
|
|
| $ | 8.7 |
| $ | 6.0 |
Derivative Liabilities |
|
|
|
|
|
|
|
|
Interest rate swaps - designated as hedge |
| Other current liabilities |
| $ | 0.7 |
| $ | 1.4 |
Interest rate swaps - designated as hedge |
| Accrued interest |
|
| 0.4 |
|
| 0.4 |
Interest rate swaps - designated as hedge |
| Other long-term liabilities |
|
| — |
|
| 0.8 |
Commodity swaps - designated as hedge |
| Accounts payable |
|
| 0.1 |
|
| 4.7 |
Commodity swaps - designated as hedge |
| Other long-term liabilities |
|
| — |
|
| 0.8 |
Commodity swaps - not designated as hedge |
| Accounts payable |
|
| — |
|
| 0.1 |
Foreign exchange contracts - designated as hedge |
| Accounts payable |
|
| 1.7 |
|
| 1.5 |
Foreign exchange contracts - designated as hedge |
| Other long-term liabilities |
|
| 0.1 |
|
| — |
Foreign exchange contracts - not designated as hedge |
| Accounts payable |
|
| 0.2 |
|
| 0.1 |
Total Derivative Liabilities |
|
|
| $ | 3.2 |
| $ | 9.8 |
The Company is exposed to the risk of default by the counterparties with which it transacts and generally does not require collateral or other security to support financial instruments subject to credit risk. The Company monitors counterparty credit risk on an individual basis by periodically assessing each such counterparty’s credit rating exposure. The maximum loss due to credit risk equals the fair value of the gross asset derivatives that are concentrated with certain domestic and foreign financial institution counterparties. The Company considers these exposures when measuring its credit reserve on its derivative assets, which was less than $0.1 million for the years ended September 30, 2013
The Company’s standard contracts do not contain credit risk related contingent features whereby the Company would havebe required to post additional cash collateral as a full valuation allowance.result of a credit event. However, the Company is typically required to post collateral in the normal course of business to offset its liability positions. As of September 30, 2015, there was $3.5 million of posted cash collateral related to such liability positions. As of September 30, 2016, there was no cash collateral outstanding. In addition, as of September 30, 2016 and 2015, the Company had no posted standby letters of credit related to such liability positions. The Company recognizes interest and penaltiescash collateral is included in Other Receivables within the Consolidated Statements of Financial Position.
99
SPECTRUM BRANDS HOLDINGS, INC.
SB/RH HOLDINGS, LLC
NOTES TO THE CONSOLIDATED FINANCIAL STATEMENTS - (CONTINUED)
The following table summarizes the changes toimpact of the amounteffective and ineffective portions of unrecognized tax benefits for
| Unrecognized tax benefits at September 30, 2010 | $ | 12,808 | |
| Gross increase – tax positions in prior period | 1,658 | ||
| Gross decrease – tax positions in prior period | (823 | ) | |
| Gross increase – tax positions in current period | 596 | ||
| Settlements | (1,850 | ) | |
| Lapse of statutes of limitations | (3,376 | ) | |
| Unrecognized tax benefits at September 30, 2011 | $ | 9,013 | |
| Gross increase – tax positions in prior period | 773 | ||
| Gross decrease – tax positions in prior period | (1,308 | ) | |
| Gross increase – tax positions in current period | 776 | ||
| Settlements | (1,737 | ) | |
| Lapse of statutes of limitations | (1,640 | ) | |
| Unrecognized tax benefits at September 30, 2012 | $ | 5,877 | |
| Gross increase – tax positions in prior period | 9,104 | ||
| Gross decrease – tax positions in prior period | (327 | ) | |
| Gross increase – tax positions in current period | 516 | ||
| Settlements | (15 | ) | |
| Lapse of statutes of limitations | (1,348 | ) | |
| Unrecognized tax benefits at September 30, 2013 | $ | 13,807 | |
|
|
|
|
|
|
|
|
|
|
|
|
|
|
|
| Effective Portion |
|
|
|
| |||||||
For the year ended |
| Gain (Loss) |
| Reclassified to Earnings |
| Ineffective portion | |||||||
September 30, 2016 (in millions) |
| in OCI |
| Line Item |
| Gain (Loss) |
| Line Item |
| Gain (Loss) | |||
Interest rate swaps |
| $ | (0.4) |
| Interest expense |
| $ | (1.9) |
| Interest expense |
| $ | — |
Commodity swaps |
|
| 4.5 |
| Cost of goods sold |
|
| (3.7) |
| Cost of goods sold |
|
| — |
Net investment hedge |
|
| 0.6 |
| Other non-operating expense |
|
| — |
| Other non-operating expense |
|
| — |
Foreign exchange contracts |
|
| (0.4) |
| Net sales |
|
| (0.2) |
| Net sales |
|
| — |
Foreign exchange contracts |
|
| 6.8 |
| Cost of goods sold |
|
| 6.9 |
| Cost of goods sold |
|
| — |
Total |
| $ | 11.1 |
|
|
| $ | 1.1 |
|
|
| $ | — |
|
|
|
|
|
|
|
|
|
|
|
|
|
|
|
| Effective Portion |
|
|
|
| |||||||
For the year ended |
| Gain (Loss) |
| Reclassified to Earnings |
| Ineffective portion | |||||||
September 30, 2015 (in millions) |
| in OCI |
| Line Item |
| Gain (Loss) |
| Line Item |
| Gain (Loss) | |||
Interest rate swaps |
| $ | (3.4) |
| Interest expense |
| $ | (1.9) |
| Interest expense |
| $ | — |
Commodity swaps |
|
| (7.2) |
| Cost of goods sold |
|
| (0.7) |
| Cost of goods sold |
|
| — |
Foreign exchange contracts |
|
| 0.1 |
| Net sales |
|
| 0.1 |
| Net sales |
|
| — |
Foreign exchange contracts |
|
| 21.8 |
| Cost of goods sold |
|
| 30.0 |
| Cost of goods sold |
|
| — |
Total |
| $ | 11.3 |
|
|
| $ | 27.5 |
|
|
| $ | — |
|
|
|
|
|
|
|
|
|
|
|
|
|
|
|
| Effective Portion |
|
|
|
| |||||||
For the year ended |
| Gain (Loss) |
| Reclassified to Earnings |
| Ineffective portion | |||||||
September 30, 2014 (in millions) |
| in OCI |
| Line Item |
| Gain (Loss) |
| Line Item |
| Gain (Loss) | |||
Interest rate swaps |
| $ | (1.6) |
| Interest expense |
| $ | (0.9) |
| Interest expense |
| $ | — |
Commodity swaps |
|
| 1.9 |
| Cost of goods sold |
|
| 0.8 |
| Cost of goods sold |
|
| — |
Foreign exchange contracts |
|
| 0.1 |
| Net sales |
|
| 0.2 |
| Net sales |
|
| — |
Foreign exchange contracts |
|
| 12.7 |
| Cost of goods sold |
|
| (2.6) |
| Cost of goods sold |
|
| — |
Total |
| $ | 13.1 |
|
|
| $ | (2.5) |
|
|
| $ | — |
|
|
|
|
|
|
|
|
|
|
|
|
|
|
The unrealized loss on derivative contracts in Accumulated Other Comprehensive Loss expected to ongoing examination bybe recognized during the various taxing authorities. The Company’s major taxing jurisdictions are the U.S., United Kingdom, and Germany. In the U.S., federal tax filings for years prior to and including the Company’s fiscal year ended September 30, 2009 are closed. However,2017 is $5.9 million.
The following table summarizes the federal net operating loss carryforwards fromgain (loss) associated with derivative contracts not designated as hedges in the Company’s fiscalConsolidated Statements of Income for the years ended September 30, 20092016, 2015 and prior are subject to Internal Revenue Service (“IRS”) examination until the year that such net operating loss carryforwards are utilized and those years are closed for audit. The Company’s fiscal years ended September 30, 2010, 2011, 2012 and 2013 remain open to examination by the IRS. Filings in various U.S. state and local jurisdictions are also subject to audit and to date no significant audit matters have arisen.2014.
|
|
|
|
|
|
|
|
|
|
|
|
(in millions) |
| Line Item |
| 2016 |
| 2015 |
| 2014 | |||
Commodity swaps |
| Cost of goods sold |
| $ | — |
| $ | (0.1) |
| $ | (0.1) |
Foreign exchange contracts |
| Other non-operating expenses, net |
|
| 3.1 |
|
| (2.5) |
|
| 3.1 |
Total |
|
|
| $ | 3.1 |
| $ | (2.6) |
| $ | 3.0 |
During Fiscal 2011 we recorded the correction of an immaterial prior period error in our consolidated financial statements related to the effective state income tax rates for certain U.S. subsidiaries. We believe the correction of this error to be both quantitatively and qualitatively immaterial to our annual results for Fiscal 2011 or to the financial statements of any previous period. The impact of the corrections was an increase to income tax expense and an increase to deferred tax liabilities in Fiscal 2011 of approximately 100$4,873.
SPECTRUM BRANDS HOLDINGS, INC.
SB/RH HOLDINGS, LLC
NOTES TO THE CONSOLIDATED FINANCIAL STATEMENTS
NOTE 13 - (CONTINUED)
Pension Benefits
The Company has various defined benefit pension plans covering some of its employees in the United States and certain employees in other countries, primarily the United Kingdom and Germany. Plans generally provide benefits of stated amounts for each year of service. The Company funds its U.S. pension plans in accordance with the requirements of the defined benefit pension plans and, where applicable, in amounts sufficient to satisfy the minimum funding requirements of applicable laws. Additionally, in compliance with the Company’s funding policy, annual contributions to non-U.S. defined benefit plans are equal to the actuarial recommendations or statutory requirements in the respective countries.
The following tables provide additional information on the Company’s pension plans as of September 30, 2016 and other postretirement benefit plans:2015:
|
|
|
|
|
|
|
|
|
|
|
|
|
|
| U.S. Plans |
| Non U.S. Plans | ||||||||
(in millions) |
| 2016 |
| 2015 |
| 2016 |
| 2015 | ||||
Changes in benefit obligation: |
|
|
|
|
|
|
|
|
|
|
|
|
Benefit obligation, beginning of year |
| $ | 73.9 |
| $ | 70.9 |
| $ | 184.4 |
| $ | 196.2 |
Obligations assumed from acquisitions |
|
| — |
|
| — |
|
| — |
|
| 0.6 |
Transfer of obligation |
|
| — |
|
| — |
|
| — |
|
| (1.8) |
Service cost |
|
| 0.2 |
|
| 0.4 |
|
| 2.6 |
|
| 2.6 |
Interest cost |
|
| 3.0 |
|
| 2.9 |
|
| 5.7 |
|
| 6.2 |
Actuarial (gain) loss |
|
| 6.2 |
|
| 3.3 |
|
| 36.0 |
|
| 10.6 |
Curtailments |
|
| — |
|
| — |
|
| — |
|
| (0.9) |
Benefits paid |
|
| (3.8) |
|
| (3.6) |
|
| (6.1) |
|
| (11.8) |
Foreign currency exchange rate changes |
|
| — |
|
| — |
|
| (12.0) |
|
| (17.3) |
Benefit obligation, end of year |
| $ | 79.5 |
| $ | 73.9 |
| $ | 210.6 |
| $ | 184.4 |
Changes in plan assets: |
|
|
|
|
|
|
|
|
|
|
|
|
Fair value of plan assets, beginning of year |
| $ | 58.2 |
| $ | 62.4 |
| $ | 116.9 |
| $ | 126.5 |
Actual return on plan assets |
|
| 5.3 |
|
| (1.2) |
|
| 8.9 |
|
| 3.6 |
Employer contributions |
|
| 4.1 |
|
| 0.6 |
|
| 6.6 |
|
| 7.8 |
Benefits paid |
|
| (3.8) |
|
| (3.6) |
|
| (6.1) |
|
| (11.8) |
Foreign currency exchange rate changes |
|
| — |
|
| — |
|
| (11.3) |
|
| (9.2) |
Fair value of plan assets, end of year |
| $ | 63.8 |
| $ | 58.2 |
| $ | 115.0 |
| $ | 116.9 |
Funded Status |
| $ | (15.7) |
| $ | (15.7) |
| $ | (95.6) |
| $ | (67.5) |
Amounts recognized in statement of financial position |
|
|
|
|
|
|
|
|
|
|
|
|
Other accrued expenses |
| $ | 0.5 |
| $ | 0.6 |
| $ | 2.3 |
| $ | 2.2 |
Other long-term liabilities |
|
| 15.2 |
|
| 15.1 |
|
| 93.3 |
|
| 65.3 |
Accumulated other comprehensive income (loss) |
|
| (20.0) |
|
| (20.4) |
|
| (64.2) |
|
| (23.4) |
Weighted average assumptions |
|
|
|
|
|
|
|
|
|
|
|
|
Discount rate |
|
| 3.50% |
|
| 4.25% |
|
| 1.00 - 13.50% |
|
| 1.75 - 13.81% |
Expected return on plan assets |
|
| 7.00% |
|
| 7.25% |
|
| 1.00 - 3.70% |
|
| 3.50 - 5.26% |
Rate of compensation increase |
|
| N/A |
|
| N/A |
|
| 2.25 - 7.00% |
|
| 2.25 - 5.50% |
101
SPECTRUM BRANDS HOLDINGS, INC.
SB/RH HOLDINGS, LLC
NOTES TO THE CONSOLIDATED FINANCIAL STATEMENTS - (CONTINUED)
Amounts in thousands, except per share figures)
Pension and Deferred Compensation Benefits | Other Benefits | ||||||||||||||||||||||
| 2013 | 2012 | 2013 | 2012 | ||||||||||||||||||||
| Change in benefit obligation | |||||||||||||||||||||||
| Benefit obligation, beginning of year | $ | 240,806 | $ | 209,472 | $ | 566 | $ | 542 | |||||||||||||||
| Liabilities assumed through acquisitions | 14,716 | — | |||||||||||||||||||||
| Service cost | 3,061 | 2,048 | 9 | 12 | |||||||||||||||||||
| Interest cost | 9,886 | 10,593 | 22 | 27 | |||||||||||||||||||
| Actuarial loss (gain) | 1,851 | 29,834 | (58 | ) | (14 | ) | |||||||||||||||||
| Participant contributions | 59 | 182 | — | — | |||||||||||||||||||
| Curtailments | (1,507 | ) | — | (135 | ) | — | |||||||||||||||||
| Benefits paid | (15,925 | ) | (9,354 | ) | (1 | ) | (1 | ) | |||||||||||||||
| Foreign currency exchange rate changes | 3,195 | (1,969 | ) | — | — | ||||||||||||||||||
| Benefit obligation, end of year | $ | 256,142 | $ | 240,806 | $ | 403 | $ | 566 | |||||||||||||||
| Change in plan assets | |||||||||||||||||||||||
| Fair value of plan assets, beginning of year | $ | 153,927 | $ | 130,641 | $ | — | $ | — | |||||||||||||||
| Assets acquired through acquisitions | 6,680 | — | — | — | |||||||||||||||||||
| Actual return on plan assets | 16,759 | 20,112 | — | — | |||||||||||||||||||
| Employer contributions | 12,316 | 12,587 | 1 | 1 | |||||||||||||||||||
| Employee contributions | 59 | 182 | — | — | |||||||||||||||||||
| Benefits paid | (15,925 | ) | (9,354 | ) | (1 | ) | (1 | ) | |||||||||||||||
| Foreign currency exchange rate changes | 1,668 | (241 | ) | — | — | ||||||||||||||||||
| Fair value of plan assets, end of year | $ | 175,484 | $ | 153,927 | $ | — | $ | — | |||||||||||||||
| Accrued Benefit Cost | $ | (80,658 | ) | $ | (86,879 | ) | $ | (403 | ) | $ | (566 | ) | |||||||||||
| Range of assumptions: | |||||||||||||||||||||||
| Discount rate | 1.8 | % | - | 13.0 | % | 4.0 | % | - | 13.5 | % | 4.7 | % | 4.0 | % | |||||||||
| Expected return on plan assets | 3.6 | % | - | 7.8 | % | 4.0 | % | - | 7.8 | % | N/A | N/A | |||||||||||
| Rate of compensation increase | 2.3 | % | - | 5.5 | % | 2.3 | % | - | 5.5 | % | N/A | N/A | |||||||||||
|
|
|
|
|
|
|
|
|
|
(in millions) |
| 2016 |
| 2015 |
| 2014 | |||
Cost of goods sold |
| $ | 1.4 |
| $ | 0.6 |
| $ | 0.6 |
Selling expenses |
|
| 0.3 |
|
| 0.3 |
|
| 0.3 |
General and administrative expenses |
|
| 0.7 |
|
| 0.5 |
|
| 0.5 |
Amounts reclassified from accumulated other comprehensive income |
| $ | 2.4 |
| $ | 1.4 |
| $ | 1.4 |
The net loss in AOCIAccumulated Other Comprehensive Loss expected to be recognized during
The following table contains the Company’s total pension and deferred compensationcomponents of net periodic benefit obligation of
|
|
|
|
|
|
|
|
|
|
|
|
|
|
|
|
|
|
|
|
| U.S. Plans |
| Non U.S. Plans | ||||||||||||||
(in millions) |
| 2016 |
| 2015 |
| 2014 |
| 2016 |
| 2015 |
| 2014 | ||||||
Service cost |
| $ | 0.2 |
| $ | 0.4 |
| $ | 0.2 |
| $ | 2.6 |
| $ | 2.6 |
| $ | 3.0 |
Interest cost |
|
| 3.0 |
|
| 2.9 |
|
| 3.0 |
|
| 5.7 |
|
| 6.2 |
|
| 7.4 |
Expected return on assets |
|
| (4.3) |
|
| (4.5) |
|
| (4.1) |
|
| (4.2) |
|
| (5.2) |
|
| (5.8) |
Curtailment |
|
| — |
|
| — |
|
| — |
|
| 0.1 |
|
| 0.7 |
|
| (0.1) |
Recognized net actuarial loss |
|
| 0.6 |
|
| 0.2 |
|
| 0.1 |
|
| 0.8 |
|
| 1.3 |
|
| 1.4 |
Net periodic benefit cost |
| $ | (0.5) |
| $ | (1.0) |
| $ | (0.8) |
| $ | 5.0 |
| $ | 5.6 |
| $ | 5.9 |
Weighted average assumptions |
|
|
|
|
|
|
|
|
|
|
|
|
|
| �� |
|
|
|
Discount rate |
| 4.25% |
| 4.15% |
| 4.65% |
| 1.75 - 13.81% |
| 2.00 - 13.50% |
| 2.25 - 12.50% | ||||||
Expected return on plan assets |
| 7.25% |
| 7.50% |
| 7.75% |
| 1.75 - 4.53% |
| 2.00 - 5.26% |
| 4.00 - 5.76% | ||||||
Rate of compensation increase |
| N/A |
| N/A |
| N/A |
| 2.25 - 5.50% |
| 2.25 - 5.50% |
| 2.25 - 5.50% | ||||||
Pension and Deferred Compensation Benefits | Other Benefits | |||||||||||||||||||||||
| 2013 | 2012 | 2011 | 2013 | 2012 | 2011 | |||||||||||||||||||
| Components of net periodic benefit cost | ||||||||||||||||||||||||
| Service cost | $ | 3,061 | $ | 2,048 | $ | 2,543 | $ | 9 | $ | 12 | $ | 11 | ||||||||||||
| Interest cost | 9,886 | 10,593 | 10,380 | 22 | 27 | 27 | ||||||||||||||||||
| Expected return on assets | (8,667 | ) | (8,225 | ) | (7,829 | ) | — | — | — | |||||||||||||||
| Amortization of prior service cost | — | 72 | — | — | — | — | ||||||||||||||||||
| Curtailment gain | (752 | ) | — | — | — | — | — | |||||||||||||||||
| Recognized net actuarial (gain) loss | 2,112 | 828 | 8 | 8 | (54 | ) | (52 | ) | ||||||||||||||||
| Net periodic cost (benefit) | $ | 5,640 | $ | 5,316 | $ | 5,102 | $ | 39 | $ | (15 | ) | $ | (14 | ) | ||||||||||
The discount rate is used to calculate the projected benefit obligation. The discount rate used is based on the rate of return on government bonds as well as current market conditions of the respective countries where suchthe plans are established.
Weighted Average Allocation | |||||||||||
| Target | Actual | ||||||||||
| Asset Category | 2013 | 2013 | 2012 | ||||||||
| Equity Securities | 0 | - | 60 | % | 47 | % | 49 | % | |||
| Fixed Income Securities | 0 | - | 40 | % | 21 | % | 20 | % | |||
| Other | 0 | - | 100 | % | 32 | % | 31 | % | |||
| Total | 100% | 100 | % | 100 | % | ||||||
The Company has established formal investment policies for the assets associated with these plans. Policy objectives include maximizing long-term return at acceptable risk levels, diversifying among asset classes, if appropriate, and among investment managers, as well as establishing relevant risk parameters within each asset class. Specific asset class targets are based on the results of periodic asset/liability studies. The investment policies permit variances from the targets within certain parameters. The weighted average expected long-term rate of return is based on a Fiscal 2013 review of such rates. The plan assets currently do not include holdings of SB Holdingsthe Company’s common stock.
Below is a summary allocation of the Company’sall pension plan assets as of September 30, 2013 segregated by level within the fair value hierarchy. See Note 8, "Fair Value of Financial Instruments", for discussion of the fair value hierarchy2016 and fair value principles:2015:
|
|
|
|
|
|
|
|
|
|
|
|
|
|
| US Plans |
| Non U.S. Plans | ||||||||
Asset Type |
| 2016 |
| 2015 |
| 2016 |
| 2015 | ||||
Equity Securities |
| 62 | % |
| 63 | % |
| 0 | % |
| 6 | % |
Fixed Income Securities |
| 35 | % |
| 35 | % |
| 23 | % |
| 25 | % |
Other |
| 3 | % |
| 2 | % |
| 77 | % |
| 69 | % |
Total |
| 100 | % |
| 100 | % |
| 100 | % |
| 100 | % |
| Level 1 | Level 2 | Level 3 | Total | |||||||||||||
| U.S. Defined Benefit Plan Assets: | ||||||||||||||||
| Common collective trust—equity | $ | 32,772 | $ | 9,393 | $ | — | $ | 42,165 | ||||||||
| Common collective trust—fixed income | — | 16,293 | — | 16,293 | ||||||||||||
| Total U.S. Defined Benefit Plan Assets | $ | 32,772 | $ | 25,686 | $ | — | $ | 58,458 | ||||||||
| International Defined Benefit Plan Assets: | ||||||||||||||||
| Common collective trust—equity | $ | — | $ | 46,521 | $ | — | $ | 46,521 | ||||||||
| Common collective trust—fixed income | — | 15,868 | — | 15,868 | ||||||||||||
| Insurance contracts—general fund | — | 37,690 | — | 37,690 | ||||||||||||
| Other | 6,658 | 10,289 | — | 16,947 | ||||||||||||
| Total International Defined Benefit Plan Assets | $ | 6,658 | $ | 110,368 | $ | — | $ | 117,026 | ||||||||
102
SPECTRUM BRANDS HOLDINGS, INC.
SB/RH HOLDINGS, LLC
NOTES TO THE CONSOLIDATED FINANCIAL STATEMENTS - (CONTINUED)
The following table sets forth the fair value of the Company’s pension plan assets by asset category as of September 30, 2012 segregated by2016 and 2015 are as follows:
|
|
|
|
|
|
|
|
|
|
|
|
|
As of September 30, 2016 (in millions) |
| Level 1 |
| Level 2 |
| Level 3 |
| Total | ||||
Equity Securities |
|
|
|
|
|
|
|
|
|
|
|
|
U.S. equity securities |
| $ | 22.2 |
| $ | 6.3 |
| $ | — |
| $ | 28.5 |
Foreign equity securities |
|
| 10.4 |
|
| — |
|
| — |
|
| 10.4 |
Debt Securities |
|
|
|
|
|
|
|
|
|
|
|
|
U.S. bonds |
|
| 19.6 |
|
| 1.7 |
|
| — |
|
| 21.3 |
Foreign bonds |
|
| 1.9 |
|
| 24.1 |
|
| — |
|
| 26.0 |
Real estate |
|
| 1.7 |
|
| 5.8 |
|
| — |
|
| 7.5 |
Life insurance contracts |
|
| — |
|
| 37.0 |
|
| — |
|
| 37.0 |
Other |
|
| — |
|
| 34.4 |
|
| — |
|
| 34.4 |
Foreign cash & cash equivalents |
|
| 13.7 |
|
| — |
|
| — |
|
| 13.7 |
Total plan assets |
| $ | 69.5 |
| $ | 109.3 |
| $ | — |
| $ | 178.8 |
|
|
|
|
|
|
|
|
|
|
|
|
|
As of September 30, 2015 (in millions) |
| Level 1 |
| Level 2 |
| Level 3 |
| Total | ||||
Equity Securities |
|
|
|
|
|
|
|
|
|
|
|
|
U.S. equity securities |
| $ | 18.6 |
| $ | 7.1 |
| $ | — |
| $ | 25.7 |
Foreign equity securities |
|
| 10.5 |
|
| 6.2 |
|
| — |
|
| 16.7 |
Debt Securities |
|
|
|
|
|
|
|
|
|
|
|
|
U.S. bonds |
|
| 18.2 |
|
| 1.3 |
|
| — |
|
| 19.5 |
Foreign bonds |
|
| 3.0 |
|
| 15.1 |
|
| — |
|
| 18.1 |
Foreign government bonds |
|
| — |
|
| 11.2 |
|
| — |
|
| 11.2 |
Real estate |
|
| 1.2 |
|
| 6.0 |
|
| — |
|
| 7.2 |
Life insurance contracts |
|
| — |
|
| 35.5 |
|
| — |
|
| 35.5 |
Other |
|
| — |
|
| 33.1 |
|
| — |
|
| 33.1 |
Foreign cash & cash equivalents |
|
| 8.1 |
|
| — |
|
| — |
|
| 8.1 |
Total plan assets |
| $ | 59.6 |
| $ | 115.5 |
| $ | — |
| $ | 175.1 |
| Level 1 | Level 2 | Level 3 | Total | |||||||||||||
| U.S. Defined Benefit Plan Assets: | ||||||||||||||||
| Common collective trust—equity | $ | 20,520 | $ | 16,667 | $ | — | $ | 37,187 | ||||||||
| Common collective trust—fixed income | — | 14,534 | — | 14,534 | ||||||||||||
| Total U.S. Defined Benefit Plan Assets | $ | 20,520 | $ | 31,201 | $ | — | $ | 51,721 | ||||||||
| International Defined Benefit Plan Assets: | ||||||||||||||||
| Common collective trust—equity | $ | — | $ | 38,507 | $ | — | $ | 38,507 | ||||||||
| Common collective trust—fixed income | — | 15,661 | — | 15,661 | ||||||||||||
| Insurance contracts—general fund | — | 40,651 | — | 40,651 | ||||||||||||
| Other | — | 7,387 | — | 7,387 | ||||||||||||
| Total International Defined Benefit Plan Assets | $ | — | $ | 102,206 | $ | — | $ | 102,206 | ||||||||
The Company’s Fixed Income Securities portfolio is invested primarily in commingled funds and managed for overall return expectations rather than matching duration against plan liabilities; therefore, debt maturities are not significant to the plan performance.
|
|
|
|
|
|
|
(in millions) |
| US Plans |
| Non U.S. Plans | ||
2017 |
| $ | 3.7 |
| $ | 5.4 |
2018 |
|
| 3.8 |
|
| 5.7 |
2019 |
|
| 4.0 |
|
| 6.4 |
2020 |
|
| 4.1 |
|
| 6.8 |
2021 |
|
| 4.2 |
|
| 7.0 |
2022-2026 |
|
| 21.2 |
|
| 40.0 |
| 2014 | $ | 9,241 | |
| 2015 | 8,536 | ||
| 2016 | 10,135 | ||
| 2017 | 10,376 | ||
| 2018 | 10,924 | ||
| 2019-2023 | 62,547 | ||
Defined Contribution Plans
The Company sponsors a defined contribution pension plan for its domestic salaried employees, which allows participants to make contributions by salary reduction pursuant to Section 401(k) of the Internal Revenue Code. The Company also sponsors defined contribution pension plans for employees of certain foreign subsidiaries. Company contributions charged to operations, including discretionary amounts, for Fiscal 2013, Fiscal 2012the years ended September 30, 2016, 2015 and Fiscal 20112014 were $11,095, $1,935$11.8 million, $11.2 million, and $4,999, respectively.$12.3 million.
103
SPECTRUM BRANDS HOLDINGS, INC.
SB/RH HOLDINGS, LLC
NOTES TO THE CONSOLIDATED FINANCIAL STATEMENTS
NOTE 14 - INCOME TAXES
Income tax expense was calculated based upon the following components of income (loss) from operations before income taxes for the years ended September 30, 2016, 2015, and 2014:
|
|
|
|
|
|
|
|
|
|
|
|
|
|
|
|
|
|
|
|
| SBH |
| SB/RH | ||||||||||||||
(in millions) |
| 2016 |
| 2015 |
| 2014 |
| 2016 |
| 2015 |
| 2014 | ||||||
United States |
| $ | 197.8 |
| $ | 3.4 |
| $ | 80.7 |
| $ | 203.5 |
| $ | 9.8 |
| $ | 83.3 |
Outside the United States |
|
| 199.8 |
|
| 189.9 |
|
| 192.8 |
|
| 199.8 |
|
| 189.9 |
|
| 192.8 |
Income (loss) from operations before income taxes |
| $ | 397.6 |
| $ | 193.3 |
| $ | 273.5 |
| $ | 403.3 |
| $ | 199.7 |
| $ | 276.1 |
The components of income tax expense for the years ended September 30, 2016, 2015 and 2014 are as follows:
|
|
|
|
|
|
|
|
|
|
|
|
|
|
|
|
|
|
|
|
| SBH |
| SB/RH | ||||||||||||||
(in millions) |
| 2016 |
| 2015 |
| 2014 |
| 2016 |
| 2015 |
| 2014 | ||||||
Current tax expense: |
|
|
|
|
|
|
|
|
|
|
|
|
|
|
|
|
|
|
U.S. Federal |
| $ | 1.6 |
| $ | 3.6 |
| $ | 6.2 |
| $ | 1.6 |
| $ | 3.6 |
| $ | 6.2 |
Foreign |
|
| 59.7 |
|
| 40.4 |
|
| 46.6 |
|
| 59.7 |
|
| 40.4 |
|
| 46.6 |
State and local |
|
| 4.2 |
|
| 4.5 |
|
| 4.3 |
|
| 4.2 |
|
| 4.5 |
|
| 4.3 |
Total current tax expense |
|
| 65.5 |
|
| 48.5 |
|
| 57.1 |
|
| 65.5 |
|
| 48.5 |
|
| 57.1 |
Deferred tax (benefit) expense: |
|
|
|
|
|
|
|
|
|
|
|
|
|
|
|
|
|
|
U.S. Federal |
|
| (27.2) |
|
| (12.3) |
|
| 19.7 |
|
| (16.7) |
|
| (12.3) |
|
| 19.7 |
Foreign |
|
| (1.1) |
|
| 11.2 |
|
| (8.2) |
|
| (1.1) |
|
| 11.2 |
|
| (8.2) |
State and local |
|
| 2.8 |
|
| (3.5) |
|
| (9.6) |
|
| 3.3 |
|
| (3.5) |
|
| (9.6) |
Total deferred tax expense |
|
| (25.5) |
|
| (4.6) |
|
| 1.9 |
|
| (14.5) |
|
| (4.6) |
|
| 1.9 |
Income tax expense |
| $ | 40.0 |
| $ | 43.9 |
| $ | 59.0 |
| $ | 51.0 |
| $ | 43.9 |
| $ | 59.0 |
The following reconciles the total income tax expense, based on the U.S. Federal statutory income tax rate of 35%, with the Company’s recognized income tax expense:
|
|
|
|
|
|
|
|
|
|
|
|
|
|
|
|
|
|
|
|
| SBH |
| SB/RH | ||||||||||||||
(in millions) |
| 2016 |
| 2015 |
| 2014 |
| 2016 |
| 2015 |
| 2014 | ||||||
U.S. Statutory federal income tax expense |
| $ | 139.2 |
| $ | 67.6 |
| $ | 95.7 |
| $ | 141.2 |
| $ | 69.9 |
| $ | 96.6 |
Permanent items |
|
| 9.1 |
|
| 5.2 |
|
| 4.6 |
|
| 9.1 |
|
| 5.2 |
|
| 4.6 |
Foreign statutory rate vs. U.S. statutory rate |
|
| (38.9) |
|
| (33.8) |
|
| (28.7) |
|
| (38.9) |
|
| (33.8) |
|
| (28.7) |
State income taxes, net of federal effect |
|
| 4.6 |
|
| 1.7 |
|
| 5.4 |
|
| 4.7 |
|
| 1.7 |
|
| 5.4 |
Residual tax on foreign earnings |
|
| 19.7 |
|
| 24.8 |
|
| 90.9 |
|
| 19.7 |
|
| 24.8 |
|
| 90.9 |
Investment in foreign subsidiary |
|
| — |
|
| (23.3) |
|
| — |
|
| — |
|
| (23.3) |
|
| — |
Purchase accounting benefit |
|
| — |
|
| (22.8) |
|
| — |
|
| — |
|
| (22.8) |
|
| — |
Benefit from adjustment to tax basis in assets |
|
| (8.4) |
|
| — |
|
| — |
|
| (8.4) |
|
| — |
|
| — |
Change in valuation allowance |
|
| (91.3) |
|
| 2.6 |
|
| (115.6) |
|
| (82.7) |
|
| 0.5 |
|
| (116.5) |
Unrecognized tax expense (benefit) |
|
| 34.6 |
|
| (1.2) |
|
| 0.5 |
|
| 34.6 |
|
| (1.2) |
|
| 0.5 |
Foreign tax law changes |
|
| (3.7) |
|
| — |
|
| (7.6) |
|
| (3.7) |
|
| — |
|
| (7.6) |
Share based compensation adjustments |
|
| (2.8) |
|
| 2.3 |
|
| 1.4 |
|
| (2.8) |
|
| 2.3 |
|
| 1.4 |
Impact of IRC Section 9100 relief |
|
| (16.4) |
|
| — |
|
| — |
|
| (16.4) |
|
| — |
|
| — |
Adjustment to prior year NOLs |
|
| — |
|
| 14.4 |
|
| — |
|
| — |
|
| 14.4 |
|
| — |
Return to provision adjustments and other, net |
|
| (5.7) |
|
| 6.4 |
|
| 12.4 |
|
| (5.4) |
|
| 6.2 |
|
| 12.4 |
Income tax expense |
| $ | 40.0 |
| $ | 43.9 |
| $ | 59.0 |
| $ | 51.0 |
| $ | 43.9 |
| $ | 59.0 |
104
SPECTRUM BRANDS HOLDINGS, INC.
SB/RH HOLDINGS, LLC
NOTES TO THE CONSOLIDATED FINANCIAL STATEMENTS
The tax effects of temporary differences that give rise to deferred tax assets and deferred tax liabilities as of September 30, 2016 and 2015 are as follows:
|
|
|
|
|
|
|
|
|
|
|
|
|
|
| SBH |
| SB/RH | ||||||||
(in millions) |
| 2016 |
| 2015 |
| 2016 |
| 2015 | ||||
Deferred tax assets |
|
|
|
|
|
|
|
|
|
|
|
|
Employee benefits |
| $ | 86.3 |
| $ | 63.2 |
| $ | 83.5 |
| $ | 60.9 |
Restructuring |
|
| 2.2 |
|
| 4.1 |
|
| 2.2 |
|
| 4.1 |
Inventories and receivables |
|
| 32.6 |
|
| 35.2 |
|
| 32.6 |
|
| 35.2 |
Marketing and promotional accruals |
|
| 17.6 |
|
| 14.4 |
|
| 17.6 |
|
| 14.4 |
Prepaid royalty |
|
| 6.0 |
|
| 6.3 |
|
| 6.0 |
|
| 6.3 |
Property, plant and equipment |
|
| 8.4 |
|
| 11.6 |
|
| 8.4 |
|
| 11.6 |
Unrealized losses |
|
| 4.2 |
|
| 2.7 |
|
| 4.2 |
|
| 2.7 |
Intangibles |
|
| 3.7 |
|
| 6.1 |
|
| 3.7 |
|
| 6.1 |
Investment in non-US subsidiaries |
|
| — |
|
| 23.3 |
|
| — |
|
| 23.3 |
Net operating loss and credit carry forwards |
|
| 402.8 |
|
| 447.7 |
|
| 394.9 |
|
| 441.6 |
Other |
|
| 24.1 |
|
| 32.8 |
|
| 23.8 |
|
| 32.6 |
Total deferred tax assets |
|
| 587.9 |
|
| 647.4 |
|
| 576.9 |
|
| 638.8 |
Deferred tax liabilities |
|
|
|
|
|
|
|
|
|
|
|
|
Property, plant and equipment |
|
| 20.1 |
|
| 27.1 |
|
| 20.1 |
|
| 27.1 |
Unrealized gains |
|
| 5.1 |
|
| 18.6 |
|
| 5.1 |
|
| 18.6 |
Intangibles |
|
| 813.4 |
|
| 840.8 |
|
| 813.4 |
|
| 840.8 |
Taxes on unremitted foreign earnings |
|
| 2.7 |
|
| 2.4 |
|
| 2.7 |
|
| 2.4 |
Other |
|
| 15.3 |
|
| 16.3 |
|
| 15.3 |
|
| 16.3 |
Total deferred tax liabilities |
|
| 856.6 |
|
| 905.2 |
|
| 856.6 |
|
| 905.2 |
Net deferred tax liabilities |
|
| (268.7) |
|
| (257.8) |
|
| (279.7) |
|
| (266.4) |
Valuation allowance |
|
| (245.7) |
|
| (305.4) |
|
| (245.7) |
|
| (296.8) |
Net deferred tax liabilities, net valuation allowance |
| $ | (514.4) |
| $ | (563.2) |
| $ | (525.4) |
| $ | (563.2) |
Reported as: |
|
|
|
|
|
|
|
|
|
|
|
|
Deferred charges and other |
| $ | 18.3 |
| $ | 9.3 |
| $ | 7.3 |
| $ | 9.3 |
Deferred taxes (noncurrent liability) |
|
| (532.7) |
|
| (572.5) |
|
| (532.7) |
|
| (572.5) |
During the fourth quarter of the year ended September 30, 2015, the Company recognized $23.3 million of deferred tax assets related to its investment in one of its foreign subsidiaries because it was expected to reverse in the foreseeable future. The deferred tax asset reversed during the year ended September 30, 2016. The Company managesalso recorded a $14.4 million reduction in its businessnet operating loss deferred tax assets, with a corresponding reduction in four vertically integrated, product-focused reporting segments: (i) Global Batteries & Appliances; (ii) Global Pet Supplies; (iii) Homethe valuation allowance, to reflect losses used as a result of prior year adjustments.
To the extent necessary, the Company intends to utilize earnings of foreign subsidiaries in order to support management's plans to voluntarily accelerate pay down of U.S. debt, fund distributions to shareholders, fund U.S. acquisitions and Garden Business;satisfy ongoing U.S. operational cash flow requirements. As a result, current and (iv) Hardware & Home Improvement.
The Company has provided residual taxes on $102.0 million of distributions from foreign earnings for the year ended September 30, 2016 with $93.6 million of earnings not yet taxed in the U.S. resulting in an increase in income tax expense of $36.7 million. The residual domestic taxes from foreign earnings are recognized as a reduction to net operating loss and credit carryforwards deferred tax assets and taxes on unremitted foreign earnings are recognized as a deferred tax liability. The Company has provided residual taxes on $37.5 million of distributions from foreign earnings for the year ended September 30, 2015 with no earnings not yet taxed in the U.S. resulting in a decrease in income tax expense of $0.3 million. Remaining undistributed earnings of the Company’s foreign operations are $219.4 million at September 30, 2016, and are intended to remain permanently invested. Accordingly, no residual income taxes have been provided on those earnings. If at some future date these earnings cease to be permanently invested, the Company may be subject to U.S. income taxes and foreign withholding and other taxes on such amounts, which cannot be reasonably estimated at this time.
105
SPECTRUM BRANDS HOLDINGS, INC.
SB/RH HOLDINGS, LLC
NOTES TO THE CONSOLIDATED FINANCIAL STATEMENTS
As of September 30, 2016, the Company has U.S. federal net operating loss carryforwards (“NOLs”) of $758.9 million with a federal tax benefit of $265.6 million and tax benefits related to state NOLs of $60.6 million and capital loss carryforwards of $19.8 million with a federal and state tax benefit of $7.6 million. The Company has an additional $4.3 million of federal and state NOLs for which benefits will be recorded to Additional Paid-in Capital when these carryforwards are used. These NOLs expire through years ending in 2036. As of September 30, 2016, the Company has foreign NOLs of $136.3 million and tax benefits of $38.4 million, which will expire beginning in the Company's Consolidated Statementfiscal year ending September 30, 2017. Certain of Operationsthe foreign NOLs have indefinite carryforward periods. The Company is subject to an annual limitation on the use of its NOLs that arose prior to its emergence from bankruptcy in the fiscal year ended September 30, 2009. The Company has had multiple changes of ownership, as defined under Section 382 of the Internal Revenue Code of 1986, as amended, that subject the Company’s U.S. federal and subsequentstate NOLs and other tax attributes to December 17, 2012,certain limitations. The annual limitation is based on a number of factors including the value of the Company’s stock (as defined for tax purposes) on the date of the Hardware Acquisition. The resultsownership change, its net unrealized gain position on that date, the occurrence of TLM Taiwan are includedrealized gains in years subsequent to the Company's Consolidated Statementownership change and the effects of Operationssubsequent ownership changes (as defined for tax purposes), if any. In addition, separate return year limitations apply to limit the Company’s utilization of the acquired Russell Hobbs U.S. federal and state NOLs to future income of the Russell Hobbs subgroup. Due to these limitations, the Company estimates, as of September 30, 2016, that $460.4 million of the total U.S. federal NOLs with a federal tax benefit of $161.1 million and subsequent to its acquisition on April 8, 2013. The financial results$16.7 million of the tax benefit related to state NOLs will expire unused even if the HHI Business are reportedCompany generates sufficient income to otherwise use all of its NOLs. The Company also projects, as a separate business segment, Hardware & Home Improvement.
| 2013 | 2012 | 2011 | ||||||||||
| Consumer batteries | $ | 931,647 | $ | 948,652 | $ | 953,301 | ||||||
| Small appliances | 740,289 | 771,568 | 777,823 | |||||||||
| Electric shaving and grooming | 276,783 | 279,468 | 274,587 | |||||||||
| Electric personal care | 254,858 | 250,251 | 248,442 | |||||||||
| Global Batteries & Appliances | 2,203,577 | 2,249,939 | 2,254,153 | |||||||||
| Global Pet Supplies | 621,834 | 615,508 | 578,905 | |||||||||
| Home and Garden Business | 390,539 | 386,988 | 353,858 | |||||||||
| Hardware & Home Improvement | 869,631 | — | — | |||||||||
| Total segments | $ | 4,085,581 | $ | 3,252,435 | $ | 3,186,916 | ||||||
| �� | 2013 | 2012 | 2011 | |||||||||
| Global Batteries & Appliances | $ | 67,229 | $ | 63,618 | $ | 68,111 | ||||||
| Global Pet Supplies | 29,615 | 27,702 | 24,274 | |||||||||
| Home and Garden Business | 11,685 | 13,296 | 12,375 | |||||||||
| Hardware & Home Improvement | 31,364 | — | — | |||||||||
| Total segments | 139,893 | 104,616 | 104,760 | |||||||||
| Corporate | — | — | — | |||||||||
| Total Depreciation and amortization | $ | 139,893 | $ | 104,616 | $ | 104,760 | ||||||
| 2013 | 2012 | 2011 | ||||||||||
| Global Batteries & Appliances | $ | 237,544 | $ | 244,442 | 238,864 | |||||||
| Global Pet Supplies | 91,080 | 85,866 | 75,564 | |||||||||
| Home and Garden Business | 78,483 | 73,609 | 65,180 | |||||||||
| Hardware & Home Improvement | 88,668 | — | — | |||||||||
| Total segments | 495,775 | 403,917 | 379,608 | |||||||||
| Corporate expenses | 62,141 | 51,514 | 53,967 | |||||||||
| Acquisition and integration related charges | 48,445 | 31,066 | 36,603 | |||||||||
| Restructuring and related charges | 34,012 | 19,591 | 28,644 | |||||||||
| Intangible asset impairment | — | — | 32,450 | |||||||||
| Interest expense | 375,625 | 191,911 | 208,329 | |||||||||
| Other expense, net | 3,506 | 878 | 2,491 | |||||||||
| (Loss) income from continuing operations before income taxes | $ | (27,954 | ) | $ | 108,957 | $ | 17,124 | |||||
| September 30, | ||||||||
| 2013 | 2012 | |||||||
| Global Batteries & Appliances | $ | 2,360,733 | $ | 2,243,472 | ||||
| Global Pet Supplies | 948,832 | 956,043 | ||||||
| Home and Garden Business | 500,559 | 508,083 | ||||||
| Hardware & Home Improvement | 1,735,629 | — | ||||||
| Total segments | 5,545,753 | 3,707,598 | ||||||
| Corporate | 80,920 | 44,051 | ||||||
| Total assets at year end | $ | 5,626,673 | $ | 3,751,649 | ||||
| September 30, | ||||||||
| 2013 | 2012 | |||||||
| Global Batteries & Appliances | $ | 1,545,641 | $ | 1,434,392 | ||||
| Global Pet Supplies | 757,299 | 768,140 | ||||||
| Home and Garden Business | 437,606 | 445,774 | ||||||
| Hardware & Home Improvement | 1,335,390 | — | ||||||
| Total segments | 4,075,936 | 2,648,306 | ||||||
| Corporate | 67,832 | 41,916 | ||||||
| Long-lived assets at year end | $ | 4,143,768 | $ | 2,690,222 | ||||
| 2013 | 2012 | 2011 | ||||||||||
| Global Batteries & Appliances | $ | 47,928 | $ | 36,271 | $ | 25,471 | ||||||
| Global Pet Supplies | 8,268 | 7,447 | 7,059 | |||||||||
| Home and Garden Business | 2,395 | 3,091 | 3,630 | |||||||||
| Hardware & Home Improvement | 23,385 | — | — | |||||||||
| Total segments | 81,976 | 46,809 | 36,160 | |||||||||
| Corporate | — | — | — | |||||||||
| Total Capital expenditures | $ | 81,976 | $ | 46,809 | $ | 36,160 | ||||||
| 2013 | 2012 | 2011 | ||||||||||
| United States | $ | 2,411,409 | $ | 1,772,138 | $ | 1,780,127 | ||||||
| Outside the United States | 1,674,172 | 1,480,297 | 1,406,789 | |||||||||
| Total net sales to external customers | $ | 4,085,581 | $ | 3,252,435 | $ | 3,186,916 | ||||||
| September 30, | ||||||||
| 2013 | 2012 | |||||||
| United States | $ | 3,218,523 | $ | 1,988,632 | ||||
| Outside the United States | 925,245 | 701,590 | ||||||
| Long-lived assets at year end | $ | 4,143,768 | $ | 2,690,222 | ||||
A valuation allowance is recorded when it is more likely than not that some portion or all of the deferred tax assets will not be realized. The ultimate realization of the deferred tax assets depends on the ability of the Company to generate sufficient taxable income of the appropriate character in the future and in the appropriate taxing jurisdictions.
The Company has earned pretax profits in the US each of the last three years. Large, profitable US businesses were acquired in years ended September 30, 2015 and 2013, and the Company’s debt levels and blended interest rates have decreased over time. The combination of US operating results and the changes in the Company’s US operating profile led the Company to conclude during the year ended September 30, 2016 that it is more likely than not its U.S. deferred tax assets will be used to reduce taxable income, except for tax attributes subject to ownership change limitations, capital losses, and certain state operating losses and credits that will expire unused.
The Company released $111.1 million of domestic valuation allowance during the year ended September 30, 2016. Approximately $25.1 million of the domestic valuation allowance release results from additional deferred tax assets created by the adoption of ASU No. 2016-09, effective as of October 1, 2015. In December 2015, the Company received a ruling from the Internal Revenue Service (“IRS”) which resulted in $87.8 million of U.S. net operating losses being restored and a release of $16.2 million of domestic valuation allowance from additional deferred tax assets created by the IRS ruling. The Company recorded tax expense of $3.1 million related to additional foreign valuation allowance during the year ended September 30, 2016.
As of September 30, 2016, the valuation allowance was $245.7 million, of which $203.7 million is related to U.S. net deferred tax assets and $42.0 million is related to foreign net deferred tax assets. As of September 30, 2015, the valuation allowance was $305.4 million, of which $268.7 million is related to U.S. net deferred tax assets and $36.7 million is related to foreign net deferred tax assets. During the year ended September 30, 2016, the Company decreased its valuation allowance for deferred tax assets by $59.7 million, of which $65.0 million is related to a decrease in valuation allowance against U.S. net deferred tax assets and $5.3 million related to an increase in the valuation allowance against foreign net deferred tax assets. During the year ended September 30, 2015, the Company recorded valuation allowances of $17.0 million against the deferred tax assets of various Latin America entities as it is more likely than not that the Company will not obtain tax benefits from these assets. During the year ended September 30, 2015, the Company decreased its valuation allowance for deferred tax assets by $27.7 million, of which $30.4 million related to a decrease in valuation allowance against U.S. net deferred tax assets and $2.7 million related to an increase in the valuation allowance against foreign net deferred tax assets. As a result of the AAG acquisition, the Company reversed $22.8 million of U.S. valuation allowance during the year ended September 30, 2015. The reversal was attributable to $22.8 million of net deferred tax liabilities recorded on the AAG acquisition balance sheet which offset other U.S net deferred tax assets. During the year ended September 30, 2015, the Company recorded valuation allowances of $17.0 million against the deferred tax assets of various Latin America entities as it is more likely than not that the Company will not obtain tax benefits from these assets. During the year ended September 30, 2014, the Company decreased its valuation allowance for deferred tax assets by $121.5 million, of which $122.6 million related to a decrease in the valuation allowance against U.S. net deferred tax assets and $1.1 million related to an increase in the valuation allowance against foreign net deferred tax assets. As a result of the one-time internal restructuring and debt refinancing activities, the Company reversed $62.6 million of U.S. valuation allowance during the year ended September 30, 2014.
106
SPECTRUM BRANDS HOLDINGS, INC.
SB/RH HOLDINGS, LLC
NOTES TO THE CONSOLIDATED FINANCIAL STATEMENTS
The total amount of unrecognized tax benefits at September 30, 2016 and 2015 are $47.4 million and $14.1 million, respectively. If recognized in the future, $47.4 million of the unrecognized tax benefits as of September 30, 2016 will impact the effective tax rate. The Company recognizes interest and penalties related to uncertain tax positions in income tax expense. As of September 30, 2016 and 2015 the Company had $3.2 million and $2.8 million, respectively, of accrued interest and penalties related to uncertain tax positions. The impact on income tax expense related to interest and penalties for the estimated costs associated with environmental remediation activities at someyears ended September 30, 2016, 2015 and 2014 was a net increase of its current$0.4 million, $0.9 million and former manufacturing sites. $1.1 million, respectively. The following table summarizes the changes to the amount of unrecognized tax benefits for the years ended September 30, 2016, 2015 and 2014:
|
|
|
|
|
|
|
|
|
|
(in millions) |
| 2016 |
| 2015 |
| 2014 | |||
Unrecognized tax benefits, beginning of year |
| $ | 14.1 |
| $ | 11.3 |
| $ | 13.8 |
Gross increase – tax positions in prior period |
|
| 29.9 |
|
| 4.1 |
|
| 1.5 |
Gross decrease – tax positions in prior period |
|
| (0.4) |
|
| (1.9) |
|
| (1.4) |
Gross increase – tax positions in current period |
|
| 4.4 |
|
| 1.8 |
|
| 0.7 |
Settlements |
|
| (0.6) |
|
| (0.9) |
|
| (2.5) |
Lapse of statutes of limitations |
|
| — |
|
| (0.3) |
|
| (0.8) |
Unrecognized tax benefits, end of year |
| $ | 47.4 |
| $ | 14.1 |
| $ | 11.3 |
The increase in unrecognized tax benefits for the year ended September 30, 2016 includes a $25.5 million expense to record a tax contingency reserve for a tax exposure in Germany. During the year, a local court ruled against the Company’s characterization of certain assets as amortizable under Germany tax law. We have appealed this ruling to the German Federal Court.
The Company believesfiles income tax returns in the U.S. federal jurisdiction and various state, local and foreign jurisdictions and is subject to ongoing examination by the various taxing authorities. The Company’s major taxing jurisdictions are the U.S., United Kingdom and Germany. In the U.S., federal tax filings for years prior to and including the Company’s fiscal year ended September 30, 2012 are closed. However, the federal NOLs from the Company’s fiscal years ended September 30, 2012 and prior are subject to Internal Revenue Service (“IRS”) examination until the year that any additional liabilitysuch net operating loss carryforwards are utilized and those years are closed for audit. Filings in excessvarious U.S. state and local jurisdictions are also subject to audit and to date no significant audit matters have arisen. As of September 30, 2016, certain of the amounts providedCompany’s legal entities are undergoing income tax audits. The Company cannot predict the ultimate outcome of approximately $5,055,the examinations; however, it is reasonably possible that during the next twelve months some portion of previously unrecognized tax benefits could be recognized.
107
SPECTRUM BRANDS HOLDINGS, INC.
SB/RH HOLDINGS, LLC
NOTES TO THE CONSOLIDATED FINANCIAL STATEMENTS
NOTE 15 - RELATED PARTIES
The Company is subject to a stockholder agreement, dated February 9, 2010 (“Stockholder Agreement”), with its majority shareholder, HRG Group, Inc. (“HRG”), which may result from resolutionprovides certain protective provisions in favor of these matters,minority stockholders and provides certain rights and imposes certain obligations on HRG and its affiliates, including:
· | for so long as the HRG and their affiliates beneficially own 40% or more of the outstanding voting securities of the Company, HRG and the Company will cooperate to ensure, to the greatest extent possible, the continuation of the structure of the Company’s board of directors as described in the Stockholder Agreement; |
· | HRG will not |
· | HRG will be granted certain access and informational rights with respect to the Company and its subsidiaries. |
Certain provisions of the Stockholder Agreement terminate on the financial condition, resultsdate on which the HRG no longer constitutes a Significant Stockholder (as defined in the Stockholder Agreement). The Stockholder Agreement terminates when any person, including HRG, acquires 90% or more of operations or cash flowsthe outstanding voting securities of the Company.
HRG and the Company also entered into a registration rights agreement, dated as of February 9, 2010 (the “Registration Rights Agreement”), pursuant to which HRG and its affiliates have, among other things and subject to the terms and conditions set forth therein, certain demand and so-called “piggy back” registration rights with respect to their shares of the Company’s common stock.
Jefferies LLC (“Jefferies”), a wholly owned subsidiary of Leucadia National Corporation, which through subsidiaries beneficially owns more than 10% of the outstanding common stock of HRG, which in turn owns 58% of the Company’s outstanding common stock. For the year ended September 30, 2016, Jefferies acted as one of the initial purchasers for SBI’s offering of €425 million of its 4.00% Notes due 2026, for which Jefferies received $0.3 million in discounts, commissions and reimbursements of expenses. For the year ended September 30, 2015, Jefferies acted as (i) one of the initial purchasers for SBI’s offering of $1.0 billion of its 5.75% Notes due 2025, for which Jefferies received $2.6 million in discounts, commissions and reimbursements of expenses, (ii) one of the underwriters for the Company’s $575 million offering of common stock in May 2015, for which Jefferies received $1.5 million in discounts, commissions and reimbursements of expenses, and (iii) one of the financing institutions that committed to provide “back stop” bridge facilities in an aggregate amount of $1.5 billion in connection with the financing of the AAG acquisition, for which Jefferies received $2.1 million in fees and reimbursements of expenses.
NOTE 16 –SHARE BASED COMPENSATION
On October 21, 2010, the Board adopted the Spectrum Brands Holdings, Inc. 2011 Omnibus Equity Award Plan (the “Equity Plan”). During the year ended September 30, 2014, the Equity Plan was amended to increase the number of shares issuable under the Equity Plan to 5,626 shares of common stock of the Company, net of cancellations.
The Company measures the compensation expense of its stock-based compensation awards, which consist of restricted stock units (“RSUs”), based on the fair value of the awards at the date of grant, and recognizes these costs on a straight line basis over the requisite service period of the awards. The fair value of the RSUs is determined based on the market price of the Company’s shares of common stock on the grant date.
During the year ended September 30, 2016, the Company granted 0.6 million RSUs, which include 0.4 million units that vested immediately or within 12 months, and 0.2 million units that are performance-based and vest within a two-year period. During the year ended September 30, 2015, the Company granted 0.6 million RSUs, which include 0.1 million units that vested immediately or within 12 months, 0.2 unit million units that vest over a one year period, and 0.3 million units that are performance-based and vest within a two-year period. During the year ended September 30, 2014, the Company granted 0.7 million RSUs, which include 0.3 million units that vested immediately or within 12 months, 0.1 million units that vest over a one year period and 0.3 million units that are performance-based and vest within a twoyear period.
108
SPECTRUM BRANDS HOLDINGS, INC.
SB/RH HOLDINGS, LLC
NOTES TO THE CONSOLIDATED FINANCIAL STATEMENTS
Share based compensation expense recognized by SBH during the years ended September 30, 2016, 2015 and 2014 was $64.4 million, $47.6 million, and $46.8 million,respectively. Share based compensation expense recognized by SB/RH during the years ended September 30, 2016, 2015 and 2014 was $59.3 million, $41.8 million and $44.9 million, respectively. Share based compensation expense is recognized as General and Administrative Expenses on the Consolidated Statements of Income. The remaining unamortized compensation cost related to non-vested RSUs at September 30, 2016 is $18.1 million and $16.7 million for the SBH and SB/RH, respectively. The following is a summary of the RSU activity for the years ended September 30, 2016, 2015 and 2014:
|
|
|
|
|
|
|
|
|
|
|
|
|
|
|
|
|
|
|
|
|
|
|
|
|
|
|
|
|
|
|
|
|
|
|
| SBH |
| SB/RH | ||||||||||||
|
|
|
| Weighted |
| Fair |
|
|
| Weighted |
| Fair | ||||
|
|
|
| Average |
| Value |
|
|
| Average |
| Value | ||||
|
|
|
| Grant Date |
| at Grant |
|
|
| Grant Date |
| at Grant | ||||
(in millions, except per share data) |
| Shares |
| Fair Value |
| Date |
| Shares |
| Fair Value |
| Date | ||||
At September 30, 2013 |
| 1.1 |
| $ | 39.11 |
| $ | 43.7 |
| 1.1 |
| $ | 39.12 |
| $ | 43.1 |
Granted |
| 0.7 |
|
| 75.50 |
|
| 50.5 |
| 0.6 |
|
| 75.82 |
|
| 48.6 |
Forfeited |
| — |
|
| 69.33 |
|
| (0.4) |
| — |
|
| 69.33 |
|
| (0.4) |
Vested |
| (1.0) |
|
| 39.69 |
|
| (37.8) |
| (0.9) |
|
| 39.34 |
|
| (36.7) |
At September 30, 2014 |
| 0.8 |
|
| 67.66 |
| $ | 56.0 |
| 0.8 |
|
| 67.90 |
| $ | 54.6 |
Granted |
| 0.6 |
|
| 92.51 |
|
| 52.9 |
| 0.5 |
|
| 93.12 |
|
| 42.3 |
Forfeited |
| (0.1) |
|
| 85.16 |
|
| (5.3) |
| (0.1) |
|
| 85.16 |
|
| (5.3) |
Vested |
| (0.7) |
|
| 69.00 |
|
| (50.4) |
| (0.7) |
|
| 68.98 |
|
| (49.5) |
At September 30, 2015 |
| 0.6 |
|
| 87.50 |
| $ | 53.2 |
| 0.5 |
|
| 87.71 |
| $ | 42.1 |
Granted |
| 0.6 |
|
| 94.88 |
|
| 56.0 |
| 0.6 |
|
| 95.00 |
|
| 54.1 |
Forfeited |
| (0.1) |
|
| 92.26 |
|
| (6.6) |
| (0.1) |
|
| 92.26 |
|
| (6.6) |
Vested |
| (0.5) |
|
| 86.97 |
|
| (47.8) |
| (0.5) |
|
| 86.78 |
|
| (44.3) |
At September 30, 2016 |
| 0.6 |
|
| 94.97 |
| $ | 54.8 |
| 0.5 |
|
| 96.92 |
| $ | 45.3 |
109
SPECTRUM BRANDS HOLDINGS, INC.
SB/RH HOLDINGS, LLC
NOTES TO THE CONSOLIDATED FINANCIAL STATEMENTS
NOTE 17 - ACCUMULATED OTHER COMPREHENSIVE INCOME
The changes in the components of accumulated other comprehensive income (loss), net of taxes, was as follows:
|
|
|
|
|
|
|
|
|
|
|
|
|
|
|
|
|
|
|
|
|
|
|
|
|
|
|
| Foreign |
|
|
| Employee |
|
| ||||
|
| Currency |
| Hedging |
| Benefit |
|
| ||||
(in millions) |
| Translation |
| Activity |
| Plans |
| Total | ||||
Year Ended September 30, 2014 |
|
|
|
|
|
|
|
|
|
|
|
|
Accumulated other comprehensive loss, as of September 30, 2013 |
| $ | (7.0) |
| $ | (2.3) |
| $ | (29.2) |
| $ | (38.5) |
Other comprehensive (loss) income before reclassification |
|
| (32.6) |
|
| 13.1 |
|
| (6.6) |
|
| (26.1) |
Amounts reclassified from accumulated other comprehensive (loss) income |
|
| — |
|
| 2.6 |
|
| 1.4 |
|
| 4.0 |
Other comprehensive (loss) income |
|
| (32.6) |
|
| 15.7 |
|
| (5.2) |
|
| (22.1) |
Deferred tax effect |
|
| — |
|
| (4.2) |
|
| 2.9 |
|
| (1.3) |
Deferred tax valuation allowance |
|
| — |
|
| — |
|
| (1.3) |
|
| (1.3) |
Other comprehensive (loss) income, net of tax |
|
| (32.6) |
|
| 11.5 |
|
| (3.6) |
|
| (24.7) |
Other comprehensive loss attributable to non-controlling interest |
|
| (0.1) |
|
| — |
|
| — |
|
| (0.1) |
Other comprehensive (loss) income attributable to controlling interest |
|
| (32.5) |
|
| 11.5 |
|
| (3.6) |
|
| (24.6) |
Accumulated other comprehensive (loss) income, as of September 30, 2014 |
|
| (39.5) |
|
| 9.2 |
|
| (32.8) |
|
| (63.1) |
Year Ended September 30, 2015 |
|
|
|
|
|
|
|
|
|
|
|
|
Other comprehensive (loss) income before reclassification |
|
| (113.0) |
|
| 11.3 |
|
| (12.9) |
|
| (114.6) |
Amounts reclassified from accumulated other comprehensive income (loss) |
|
| — |
|
| (27.5) |
|
| 1.4 |
|
| (26.1) |
Other comprehensive loss |
|
| (113.0) |
|
| (16.2) |
|
| (11.5) |
|
| (140.7) |
Deferred tax effect |
|
| — |
|
| 5.2 |
|
| 3.9 |
|
| 9.1 |
Deferred tax valuation allowance |
|
| — |
|
| (2.2) |
|
| (3.4) |
|
| (5.6) |
Other comprehensive loss, net of tax |
|
| (113.0) |
|
| (13.2) |
|
| (11.0) |
|
| (137.2) |
Other comprehensive loss attributable to non-controlling interest |
|
| (0.2) |
|
| — |
|
| — |
|
| (0.2) |
Other comprehensive loss attributable to controlling interest |
|
| (112.8) |
|
| (13.2) |
|
| (11.0) |
|
| (137.0) |
Accumulated other comprehensive loss, as of September 30, 2015 |
|
| (152.3) |
|
| (4.0) |
|
| (43.8) |
|
| (200.1) |
Year Ended September 30, 2016 |
|
|
|
|
|
|
|
|
|
|
|
|
Other comprehensive (loss) income before reclassification |
|
| (6.2) |
|
| 11.1 |
|
| (41.4) |
|
| (36.5) |
Amounts reclassified from accumulated other comprehensive income (loss) |
|
| — |
|
| (1.1) |
|
| 2.4 |
|
| 1.3 |
Other comprehensive (loss) income |
|
| (6.2) |
|
| 10.0 |
|
| (39.0) |
|
| (35.2) |
Deferred tax effect |
|
| (2.3) |
|
| (2.8) |
|
| 10.9 |
|
| 5.8 |
Deferred tax valuation allowance |
|
| — |
|
| (0.1) |
|
| (0.1) |
|
| (0.2) |
Other comprehensive (loss) income, net of tax |
|
| (8.5) |
|
| 7.1 |
|
| (28.2) |
|
| (29.6) |
Other comprehensive loss attributable to non-controlling interest |
|
| (0.3) |
|
| — |
|
| — |
|
| (0.3) |
Other comprehensive (loss) income attributable to controlling interest |
|
| (8.2) |
|
| 7.1 |
|
| (28.2) |
|
| (29.3) |
Accumulated other comprehensive (loss) income, as of September 30, 2016 |
| $ | (160.5) |
| $ | 3.1 |
| $ | (72.0) |
| $ | (229.4) |
See Note 12, “Derivatives” for further detail on the Company’s derivative hedging activity. See Note 13, “Employee Benefit Plans” for further detail over the Company’s defined benefit plans.
NOTE 18 -COMMITMENTS AND CONTINGENCIES
The Company is a defendant in various litigation matters generally arising out of the ordinary course of business. The Company does not believe that any of the matters or proceedings presently pending will have a material adverse effect on its results of operations, financial condition, liquidity or cash flows.
The Company’s minimum rent payments under operating leases are recognized on a straight-line basis overCompany has provided for the termestimated costs of $4.4 million, as of September 30, 2016 and 2015, associated with environmental remediation activities at some of its current and former manufacturing sites. The Company believes that any additional liability in excess of the leases. Future minimum rental commitments under non-cancelable operating leases, principally pertaining to land, buildings and equipment, are as follows:
110
SPECTRUM BRANDS HOLDINGS, INC.
SB/RH HOLDINGS, LLC
NOTES TO THE CONSOLIDATED FINANCIAL STATEMENTS
NOTE 19 - (CONTINUED)
| 2014 | $ | 39,491 | |
| 2015 | 33,376 | ||
| 2016 | 27,906 | ||
| 2017 | 23,471 | ||
| 2018 | 14,578 | ||
| Thereafter | 34,298 | ||
| Total minimum lease payments | $ | 173,120 | |
The Company identifies its segments based upon the internal organization that is used by management for making operating decisions and assessing performance as the source of the leases expire between October 2013 and July 2023. The Company’s total rent expense was $41,829, $34,327 and $40,298 during Fiscal 2013, Fiscal 2012 and Fiscal 2011, respectively.
| 2013 | 2012 | 2011 | |||||||||
| Cost of goods sold: | |||||||||||
| Global Batteries & Appliances | $ | 1,143 | $ | 5,094 | $ | 756 | |||||
| Hardware & Home Improvement | 6,246 | — | — | ||||||||
| Global Pet Supplies | 2,595 | 4,741 | 7,085 | ||||||||
| Total restructuring and related charges in cost of goods sold | $ | 9,984 | $ | 9,835 | $ | 7,841 | |||||
| Operating expenses: | |||||||||||
| Global Batteries & Appliances | $ | 13,627 | $ | 2,487 | $ | 5,338 | |||||
| Global Pet Supplies | 8,556 | 5,395 | 9,567 | ||||||||
| Home and Garden Business | 598 | 912 | 2,704 | ||||||||
| Corporate | 1,247 | 962 | 3,194 | ||||||||
| Total restructuring and related charges in operating expenses | $ | 24,028 | $ | 9,756 | $ | 20,803 | |||||
| Total restructuring and related charges | $ | 34,012 | $ | 19,591 | $ | 28,644 | |||||
| 2013 | 2012 | 2011 | ||||||||||
| Costs included in cost of goods sold: | ||||||||||||
| Global Expense Rationalization initiatives: | ||||||||||||
| Termination benefits | $ | 2 | $ | — | $ | — | ||||||
| Other associated costs | — | — | — | |||||||||
| Global Cost Reduction initiatives: | ||||||||||||
| Termination benefits | 228 | 2,941 | 1,679 | |||||||||
| Other associated costs | 3,330 | 6,894 | 5,889 | |||||||||
| HHI Business and other restructuring initiatives: | ||||||||||||
| Termination benefits | 146 | — | — | |||||||||
| Other associated costs | 6,278 | — | 273 | |||||||||
| Total included in cost of goods sold | $ | 9,984 | $ | 9,835 | $ | 7,841 | ||||||
| Costs included in operating expenses: | ||||||||||||
| Global Expense Rationalization initiatives: | ||||||||||||
| Termination benefits | $ | 10,259 | $ | — | $ | — | ||||||
| Other associated costs | 1,056 | — | — | |||||||||
| Global Cost Reduction initiatives: | ||||||||||||
| Termination benefits | 6,351 | 3,079 | 10,155 | |||||||||
| Other associated costs | 6,443 | 5,776 | 7,761 | |||||||||
| HHI Business and other restructuring initiatives: | ||||||||||||
| Termination benefits | — | — | 956 | |||||||||
| Other associated costs | (81 | ) | 901 | 1,931 | ||||||||
| Total included in operating expenses | $ | 24,028 | $ | 9,756 | $ | 20,803 | ||||||
| Total restructuring and related charges | $ | 34,012 | $ | 19,591 | $ | 28,644 | ||||||
Termination Benefits | Other Costs | Total | |||||||||
| Accrual balance at September 30, 2012 | $ | — | $ | — | $ | — | |||||
| Provisions | 8,997 | (12 | ) | 8,985 | |||||||
| Cash expenditures | (2,060 | ) | (25 | ) | (2,085 | ) | |||||
| Non-cash items | 383 | 2 | 385 | ||||||||
| Accrual balance at September 30, 2013 | $ | 7,320 | $ | (35 | ) | $ | 7,285 | ||||
| Expensed as incurred (A) | $ | 1,264 | $ | 1,068 | $ | 2,332 | |||||
Global Batteries & Appliances | Corporate | Total | |||||||||
| Restructuring and related charges during Fiscal 2013 | $ | 10,070 | $ | 1,247 | $ | 11,317 | |||||
| Restructuring and related charges since initiative inception | $ | 10,070 | $ | 1,247 | $ | 11,317 | |||||
| Total future restructuring and related charges expected | $ | 3,939 | $ | 151 | $ | 4,090 | |||||
Termination Benefits | Other Costs | Total | |||||||||
| Accrual balance at September 30, 2012 | $ | 3,252 | $ | 1,095 | $ | 4,347 | |||||
| Provisions | 5,276 | 525 | 5,801 | ||||||||
| Cash expenditures | (3,576 | ) | (1,235 | ) | (4,811 | ) | |||||
| Non-cash items | (25 | ) | 39 | 14 | |||||||
| Accrual balance at September 30, 2013 | $ | 4,927 | $ | 424 | $ | 5,351 | |||||
Expensed as incurred (A) | $ | 1,303 | $ | 9,248 | $ | 10,551 | |||||
Global Batteries & Appliances | Global Pet Supplies | Home and Garden Business | Corporate | Total | |||||||||||||||
| Restructuring and related charges during Fiscal 2013 | $ | 4,604 | $ | 11,150 | $ | 598 | $ | — | $ | 16,352 | |||||||||
| Restructuring and related charges since initiative inception | $ | 25,413 | $ | 48,149 | $ | 18,219 | $ | 7,591 | $ | 99,372 | |||||||||
| Total future restructuring and related charges expected | $ | 500 | $ | 2,500 | $ | — | $ | — | $ | 3,000 | |||||||||
| Negotiated sales price, excluding TLM Taiwan | $ | 1,300,000 | |
| Working capital and other adjustments at December 17, 2012 close | (10,738 | ) | |
| Final working capital adjustment | (7,669 | ) | |
| Final purchase price, excluding TLM Taiwan | $ | 1,281,593 | |
| Negotiated sales price, TLM Taiwan | 100,000 | ||
| Final TLM Taiwan working capital and other adjustments | (6,500 | ) | |
| Total HHI Business purchase price | $ | 1,375,093 | |
Net sales force and operates manufacturing and distribution facilities in the U.S., Canada, Mexico and Asia.
HHI Business Preliminary Valuation December 30, 2012 | TLM Taiwan Preliminary Valuation June 30, 2013 | Adjustments / reclassifications | Preliminary Valuation September 30, 2013 | |||||||||
| Cash | $ | 17,406 | 843 | $ | 5,836 | $ | 24,085 | |||||
| Accounts receivable | 104,641 | 11 | 4,007 | 108,659 | ||||||||
| Inventory | 207,160 | 1,135 | 62 | 208,357 | ||||||||
| Prepaid expenses and other | 13,311 | 2,148 | (6,176 | ) | 9,283 | |||||||
| Property, plant and equipment | 104,502 | 36,750 | (2,861 | ) | 138,391 | |||||||
| Intangible assets | 470,000 | 17,100 | 2,000 | 489,100 | ||||||||
| Other long-term assets | 3,051 | 124 | 4,339 | 7,514 | ||||||||
| Total assets acquired | $ | 920,071 | $ | 58,111 | $ | 7,207 | $ | 985,389 | ||||
| Accounts payable | 130,140 | — | 7,967 | 138,107 | ||||||||
| Deferred tax liability - current | 7,081 | — | 83 | 7,164 | ||||||||
| Accrued liabilities | 37,530 | 241 | 4,966 | 42,737 | ||||||||
| Deferred tax liability - long-term | 104,708 | 1,930 | 9,791 | 116,429 | ||||||||
| Other long-term liabilities | 11,231 | 8,089 | 453 | 19,773 | ||||||||
| Total liabilities assumed | $ | 290,690 | $ | 10,260 | $ | 23,260 | $ | 324,210 | ||||
| Total identifiable net assets | 629,381 | 47,851 | (16,053 | ) | 661,179 | |||||||
| Noncontrolling interest | (2,235 | ) | — | (1,704 | ) | (3,939 | ) | |||||
| Goodwill | 662,116 | 45,649 | 10,088 | 717,853 | ||||||||
| Total net assets | $ | 1,289,262 | $ | 93,500 | $ | (7,669 | ) | $ | 1,375,093 | |||
| 2013 | 2012 | 2011 | |||||||||
| Net sales: | |||||||||||
| Reported Net sales | $ | 4,085,581 | $ | 3,252,435 | $ | 3,186,916 | |||||
| HHI Business adjustment (1) | 191,777 | 973,648 | 975,096 | ||||||||
| Pro forma Net sales | $ | 4,277,358 | $ | 4,226,083 | $ | 4,162,012 | |||||
| Net (loss) income: | |||||||||||
| Reported Net (loss) income (2) (3) | $ | (55,313 | ) | $ | 48,572 | $ | (75,171 | ) | |||
| HHI Business adjustment (1) | 4,942 | 76,120 | 77,035 | ||||||||
| Pro forma Net (loss) income | $ | (50,371 | ) | $ | 124,692 | $ | 1,864 | ||||
| Basic (loss) income per share: | |||||||||||
| Reported Basic (loss) income per share | $ | (1.06 | ) | $ | 0.94 | $ | (1.47 | ) | |||
| HHI Business adjustment (1) | 0.09 | 1.47 | 1.51 | ||||||||
| Pro forma Basic (loss) income per share | $ | (0.97 | ) | $ | 2.41 | $ | 0.04 | ||||
| Diluted (loss) income per share (4): | |||||||||||
| Reported Diluted (loss) income per share | $ | (1.06 | ) | $ | 0.91 | $ | (1.47 | ) | |||
| HHI Business adjustment (1) | 0.09 | 1.43 | 1.51 | ||||||||
| Pro forma Diluted (loss) income per share | $ | (0.97 | ) | $ | 2.34 | $ | 0.04 | ||||
| Negotiated sales price | $ | 50,000 | |
| Preliminary working capital adjustment | (423 | ) | |
| Final working capital adjustment | 58 | ||
| Final purchase price | $ | 49,635 | |
Preliminary Valuation December 30, 2012 | Adjustments / reclassifications | Final Valuation September 30, 2013 | |||||||
| Cash | $ | 870 | $ | — | $ | 870 | |||
| Intangible asset | 35,500 | (6,200 | ) | 29,300 | |||||
| Other assets | 2,679 | (2,531 | ) | 148 | |||||
| Total assets acquired | $ | 39,049 | $ | (8,731 | ) | $ | 30,318 | ||
| Total liabilities assumed | 14,398 | (5,566 | ) | 8,832 | |||||
| Total identifiable net assets | 24,651 | (3,165 | ) | 21,486 | |||||
| Noncontrolling interest | (38,954 | ) | (46 | ) | (39,000 | ) | |||
| Goodwill | 63,880 | 3,269 | 67,149 | ||||||
| Total identifiable net assets | $ | 49,577 | $ | 58 | $ | 49,635 | |||
| Quarter Ended | ||||||||||||||||
| September 30, 2013 | June 30, 2013 | March 31, 2013 | December 30, 2012 | |||||||||||||
| Net sales | $ | 1,137,732 | $ | 1,089,825 | $ | 987,756 | $ | 870,268 | ||||||||
| Gross profit | 396,493 | 382,759 | 322,904 | 288,156 | ||||||||||||
| Net (loss) income | (36,705 | ) | 36,130 | (41,232 | ) | (13,439 | ) | |||||||||
| Basic net (loss) income per common share | $ | (0.70 | ) | $ | 0.69 | $ | (0.79 | ) | $ | (0.26 | ) | |||||
| Diluted net (loss) income per common share | $ | (0.70 | ) | $ | 0.69 | $ | (0.79 | ) | $ | (0.26 | ) | |||||
| Quarter Ended | ||||||||||||||||
| September 30, 2012 | July 1, 2012 | April 1, 2012 | January 1, 2012 | |||||||||||||
| Net sales | $ | 832,576 | $ | 824,803 | $ | 746,285 | $ | 848,771 | ||||||||
| Gross profit | 279,925 | 291,696 | 260,031 | 284,026 | ||||||||||||
| Net income (loss) | 5,513 | 58,649 | (28,660 | ) | 13,070 | |||||||||||
| Basic net income (loss) per common share | $ | 0.11 | $ | 1.14 | $ | (0.56 | ) | $ | 0.25 | |||||||
| Diluted net income (loss) per common share | $ | 0.10 | $ | 1.13 | $ | (0.56 | ) | $ | 0.25 | |||||||
|
|
|
|
|
|
|
|
|
|
|
|
|
|
|
|
|
|
|
|
| SBH |
| SB/RH | ||||||||||||||
Net sales to external customers (in millions) |
| 2016 |
| 2015 |
| 2014 |
| 2016 |
| 2015 |
| 2014 | ||||||
Consumer batteries |
| $ | 840.7 |
| $ | 829.5 |
| $ | 957.8 |
| $ | 840.7 |
| $ | 829.5 |
| $ | 957.8 |
Small appliances |
|
| 656.0 |
|
| 734.6 |
|
| 730.8 |
|
| 656.0 |
|
| 734.6 |
|
| 730.8 |
Personal care |
|
| 513.6 |
|
| 528.1 |
|
| 542.1 |
|
| 513.6 |
|
| 528.1 |
|
| 542.1 |
Global Batteries & Appliances |
|
| 2,010.3 |
|
| 2,092.2 |
|
| 2,230.7 |
|
| 2,010.3 |
|
| 2,092.2 |
|
| 2,230.7 |
Hardware & Home Improvement |
|
| 1,241.0 |
|
| 1,205.5 |
|
| 1,166.0 |
|
| 1,241.0 |
|
| 1,205.5 |
|
| 1,166.0 |
Global Pet Supplies |
|
| 825.7 |
|
| 758.2 |
|
| 600.5 |
|
| 825.7 |
|
| 758.2 |
|
| 600.5 |
Home and Garden |
|
| 509.0 |
|
| 474.0 |
|
| 431.9 |
|
| 509.0 |
|
| 474.0 |
|
| 431.9 |
Global Auto Care |
|
| 453.7 |
|
| 160.5�� |
|
| — |
|
| 453.7 |
|
| 160.5 |
|
| — |
Net sales |
| $ | 5,039.7 |
| $ | 4,690.4 |
| $ | 4,429.1 |
| $ | 5,039.7 |
| $ | 4,690.4 |
|
| 4,429.1 |
During the year ended September 30, 20122016, the Company changed its performance metric to Adjusted EBITDA to better reflect how the Chief Operating Decision Maker is currently evaluating the business and making operating decisions. All amounts for prior periods have been recast to reflect current presentation. EBITDA is calculated by excluding the Company’s income tax expense, interest expense, depreciation expense and amortization expense (from intangible assets) from net income. Adjusted EBITDA further excludes (i) share based compensation expense as it is a non-cash based compensation cost; (ii) acquisition and integration costs that consist of transaction costs from acquisition transactions during the period, or subsequent integration related project costs directly associated with the acquired business; (iii) restructuring and related costs, which consist of project costs associated with restructuring initiatives across the segments; (iv) non-cash purchase accounting inventory adjustments recognized in earnings subsequent to an acquisition; (v) non-cash asset impairments or write-offs realized; (vi) and other. During the year ended September 30, 2011
| Column A | Column B | Column C Additions | Column D Deductions | Column E | ||||||||||||||||
| Descriptions | Balance at Beginning of Period | Charged to Costs and Expenses | Deductions | Other Adjustments(A) | Balance at End of Period | |||||||||||||||
| September 30, 2013: | ||||||||||||||||||||
| Accounts receivable allowances | $ | 21,870 | $ | 15,506 | $ | — | $ | — | $ | 37,376 | ||||||||||
| September 30, 2012: | ||||||||||||||||||||
| Accounts receivable allowances | $ | 14,128 | $ | 7,742 | $ | — | $ | — | $ | 21,870 | ||||||||||
| September 30, 2011: | ||||||||||||||||||||
| Accounts receivable allowances | $ | 4,351 | $ | 9,777 | $ | — | $ | — | $ | 14,128 | ||||||||||
111
SPECTRUM BRANDS HOLDINGS, INC.
SB/RH HOLDINGS, LLC
NOTES TO THE CONSOLIDATED FINANCIAL STATEMENTS
Segment Adjusted EBITDA in relation to the Company’s reportable segments for the years ended September 30, 2016, 2015 and 2014, is as follows:
|
|
|
|
|
|
|
|
|
|
|
|
|
|
|
|
|
|
|
|
| SBH |
| SB/RH | ||||||||||||||
Segment Adjusted EBITDA (in millions) |
| 2016 |
| 2015 |
| 2014 |
| 2016 |
| 2015 |
| 2014 | ||||||
Global Batteries & Appliances |
| $ | 311.4 |
| $ | 306.9 |
| $ | 326.6 |
| $ | 311.4 |
| $ | 306.9 |
| $ | 326.6 |
Hardware & Home Improvement |
|
| 241.6 |
|
| 225.5 |
|
| 210.3 |
|
| 241.6 |
|
| 225.5 |
|
| 210.3 |
Global Pet Supplies |
|
| 140.1 |
|
| 124.5 |
|
| 113.2 |
|
| 140.1 |
|
| 124.5 |
|
| 113.2 |
Home and Garden |
|
| 138.3 |
|
| 124.5 |
|
| 101.8 |
|
| 138.3 |
|
| 124.5 |
|
| 101.8 |
Global Auto Care |
|
| 153.4 |
|
| 47.3 |
|
| — |
|
| 153.4 |
|
| 47.3 |
|
| — |
Total Segment Adjusted EBITDA |
|
| 984.8 |
|
| 828.7 |
|
| 751.9 |
|
| 984.8 |
|
| 828.7 |
|
| 751.9 |
Depreciation and amortization |
|
| 183.0 |
|
| 170.0 |
|
| 157.6 |
|
| 183.0 |
|
| 170.0 |
|
| 157.6 |
Share-based compensation |
|
| 64.4 |
|
| 47.6 |
|
| 46.8 |
|
| 59.3 |
|
| 41.8 |
|
| 44.9 |
Corporate expenses |
|
| 32.0 |
|
| 28.1 |
|
| 27.6 |
|
| 31.4 |
|
| 27.5 |
|
| 26.9 |
Purchase accounting inventory adjustment |
|
| — |
|
| 21.7 |
|
| — |
|
| — |
|
| 21.7 |
|
| — |
Write-off from impairment of intangible assets |
|
| 4.7 |
|
| — |
|
| — |
|
| 4.7 |
|
| — |
|
| — |
Acquisition and integration related charges |
|
| 36.7 |
|
| 58.8 |
|
| 20.1 |
|
| 36.7 |
|
| 58.8 |
|
| 20.1 |
Restructuring and related charges |
|
| 15.2 |
|
| 28.7 |
|
| 22.9 |
|
| 15.2 |
|
| 28.7 |
|
| 22.9 |
Interest expense |
|
| 250.0 |
|
| 271.9 |
|
| 202.1 |
|
| 250.0 |
|
| 271.9 |
|
| 202.1 |
Other |
|
| 1.2 |
|
| 8.6 |
|
| 1.3 |
|
| 1.2 |
|
| 8.6 |
|
| 1.3 |
Income from operations before income taxes |
| $ | 397.6 |
| $ | 193.3 |
| $ | 273.5 |
| $ | 403.3 |
| $ | 199.7 |
|
| 276.1 |
Other financial information relating to the Company’s segments is as follows for the years ended September 30, 2016, 2015 and 2014 and as of September 30, 2016 and 2015:
|
|
|
|
|
|
|
|
|
|
|
|
|
|
|
|
|
|
|
|
|
|
|
|
|
|
|
|
|
|
|
|
|
|
|
|
|
|
|
| SBH |
| SB/RH | ||||||||||||||
Depreciation and amortization (in millions) |
| 2016 |
| 2015 |
| 2014 |
| 2016 |
| 2015 |
| 2014 | ||||||
Global Batteries & Appliances |
| $ | 72.2 |
| $ | 71.0 |
| $ | 73.1 |
| $ | 72.2 |
| $ | 71.0 |
| $ | 73.1 |
Hardware & Home Improvement |
|
| 35.4 |
|
| 39.4 |
|
| 40.4 |
|
| 35.4 |
|
| 39.4 |
|
| 40.4 |
Global Pet Supplies |
|
| 42.7 |
|
| 39.7 |
|
| 31.5 |
|
| 42.7 |
|
| 39.7 |
|
| 31.5 |
Home and Garden |
|
| 15.2 |
|
| 13.3 |
|
| 12.6 |
|
| 15.2 |
|
| 13.3 |
|
| 12.6 |
Global Auto Care |
|
| 17.5 |
|
| 6.6 |
|
| — |
|
| 17.5 |
|
| 6.6 |
|
| — |
Total segments |
|
| 183.0 |
|
| 170.0 |
|
| 157.6 |
|
| 183.0 |
|
| 170.0 |
|
| 157.6 |
Corporate |
|
| — |
|
| — |
|
| — |
|
| — |
|
| — |
|
| — |
Total depreciation and amortization |
| $ | 183.0 |
| $ | 170.0 |
| $ | 157.6 |
| $ | 183.0 |
| $ | 170.0 |
| $ | 157.6 |
|
|
|
|
|
|
|
|
|
|
|
|
|
|
|
|
|
|
|
|
| SBH |
| SB/RH | ||||||||||||||
Capital expenditures (in millions) |
| 2016 |
| 2015 |
| 2014 |
| 2016 |
| 2015 |
| 2014 | ||||||
Global Batteries & Appliances |
| $ | 49.6 |
| $ | 48.9 |
| $ | 40.3 |
| $ | 49.6 |
| $ | 48.9 |
| $ | 40.3 |
Hardware & Home Improvement |
|
| 22.3 |
|
| 16.3 |
|
| 21.2 |
|
| 22.3 |
|
| 16.3 |
|
| 21.2 |
Global Pet Supplies |
|
| 14.4 |
|
| 10.4 |
|
| 5.3 |
|
| 14.4 |
|
| 10.4 |
|
| 5.3 |
Home and Garden Business |
|
| 6.9 |
|
| 12.3 |
|
| 6.5 |
|
| 6.9 |
|
| 12.3 |
|
| 6.5 |
Global Auto Care |
|
| 2.0 |
|
| 1.2 |
|
| — |
|
| 2.0 |
|
| 1.2 |
|
| — |
Total segment capital expenditures |
|
| 95.2 |
|
| 89.1 |
|
| 73.3 |
|
| 95.2 |
|
| 89.1 |
|
| 73.3 |
Corporate |
|
| — |
|
| — |
|
| — |
|
| — |
|
| — |
|
| — |
Total capital expenditures |
| $ | 95.2 |
| $ | 89.1 |
| $ | 73.3 |
| $ | 95.2 |
| $ | 89.1 |
| $ | 73.3 |
112
SPECTRUM BRANDS HOLDINGS, INC.
SB/RH HOLDINGS, LLC
NOTES TO THE CONSOLIDATED FINANCIAL STATEMENTS
|
|
|
|
|
|
|
|
|
|
|
|
|
|
| SBH |
| SB/RH | ||||||||
Segment total assets (in millions) |
| 2016 |
| 2015 |
| 2016 |
| 2015 | ||||
Global Batteries & Appliances |
| $ | 2,045.0 |
| $ | 2,080.4 |
| $ | 2,045.0 |
| $ | 2,080.4 |
Hardware & Home Improvement |
|
| 1,594.7 |
|
| 1,619.9 |
|
| 1,594.7 |
|
| 1,619.9 |
Global Pet Supplies |
|
| 1,074.1 |
|
| 1,125.2 |
|
| 1,074.1 |
|
| 1,125.2 |
Home and Garden |
|
| 556.8 |
|
| 530.9 |
|
| 556.8 |
|
| 530.9 |
Global Auto Care |
|
| 1,494.3 |
|
| 1,543.1 |
|
| 1,494.3 |
|
| 1,543.1 |
Total segment assets |
|
| 6,764.9 |
|
| 6,899.5 |
|
| 6,764.9 |
|
| 6,899.5 |
Corporate |
|
| 304.2 |
|
| 294.3 |
|
| 288.6 |
|
| 294.2 |
Total assets |
| $ | 7,069.1 |
| $ | 7,193.8 |
| $ | 7,053.5 |
| $ | 7,193.7 |
Net sales for the years ended September 30, 2016, 2015 and 2014 and long-lived asset information as of September 30, 2016 and 2015 by geographic area are as follows:
|
|
|
|
|
|
|
|
|
|
|
|
|
|
|
|
|
|
|
|
| SBH |
| SB/RH | ||||||||||||||
Net sales to external parties - Geographic Disclosure (in millions) |
| 2016 |
| 2015 |
| 2014 |
| 2016 |
| 2015 |
| 2014 | ||||||
United States |
| $ | 3,217.9 |
| $ | 2,907.9 |
| $ | 2,640.7 |
| $ | 3,217.9 |
| $ | 2,907.9 |
| $ | 2,640.7 |
Europe/MEA |
|
| 1,090.7 |
|
| 1,049.8 |
|
| 970.4 |
|
| 1,090.7 |
|
| 1,049.8 |
|
| 970.4 |
Latin America |
|
| 372.7 |
|
| 381.5 |
|
| 414.3 |
|
| 372.7 |
|
| 381.5 |
|
| 414.3 |
North America - Other |
|
| 192.4 |
|
| 164.0 |
|
| 196.0 |
|
| 192.4 |
|
| 164.0 |
|
| 196.0 |
Asia-Pacific |
|
| 166.0 |
|
| 187.2 |
|
| 207.7 |
|
| 166.0 |
|
| 187.2 |
|
| 207.7 |
Net sales |
| $ | 5,039.7 |
| $ | 4,690.4 |
| $ | 4,429.1 |
| $ | 5,039.7 |
| $ | 4,690.4 |
| $ | 4,429.1 |
|
|
|
|
|
|
|
|
|
|
|
|
|
|
| SBH |
| SB/RH | ||||||||
Long-lived assets - Geographic Disclosure (in millions) |
| 2016 |
| 2015 |
| 2016 |
| 2015 | ||||
United States |
| $ | 322.1 |
| $ | 311.1 |
| $ | 322.1 |
| $ | 311.1 |
Europe/MEA |
|
| 141.4 |
|
| 139.2 |
|
| 141.4 |
|
| 139.2 |
Latin America |
|
| 33.6 |
|
| 14.6 |
|
| 33.6 |
|
| 14.6 |
North America - Other |
|
| 3.5 |
|
| 2.4 |
|
| 3.5 |
|
| 2.4 |
Asia-Pacific |
|
| 41.5 |
|
| 39.8 |
|
| 41.5 |
|
| 39.8 |
Total long-lived assets |
| $ | 542.1 |
| $ | 507.1 |
| $ | 542.1 |
| $ | 507.1 |
113
SPECTRUM BRANDS HOLDINGS, INC.
SB/RH HOLDINGS, LLC
NOTES TO THE CONSOLIDATED FINANCIAL STATEMENTS
NOTE 20 - EARNINGS PER SHARE - SBH
Basic earnings per share is computed by dividing net income attributable to controlling interest by the weighted average number of common shares outstanding for the period. Diluted earnings per share reflects the dilution that would occur if restricted stock units were converted into common shares that then shared in the net income of the entity available to common shareholders, as long as their effect is not antidilutive. In computing diluted earnings per share, basic earnings per share is adjusted for the assumed issuance of potentially diluted share-based awards, including restricted stock units. The Company uses the treasury stock method to reflect dilution of restricted stock units.
The reconciliation of the numerator and denominator of the basic and diluted earnings per share calculation and the anti-dilutive shares for the years ended September 30, 2016, 2015 and 2014, are as follows:
|
|
|
|
|
|
|
|
|
|
|
|
|
|
|
|
|
|
|
|
(in millions, except per share amounts) |
| 2016 |
| 2015 |
| 2014 | |||
Numerator |
|
|
|
|
|
|
|
|
|
Net income attributable to controlling interest |
| $ | 357.1 |
| $ | 148.9 |
| $ | 214.1 |
Denominator |
|
|
|
|
|
|
|
|
|
Weighted average shares outstanding - basic |
|
| 59.3 |
|
| 55.6 |
|
| 52.6 |
Dilutive shares |
|
| 0.3 |
|
| 0.3 |
|
| 0.7 |
Weighted average shares outstanding - diluted |
|
| 59.6 |
|
| 55.9 |
|
| 53.3 |
Earnings per share |
|
|
|
|
|
|
|
|
|
Basic earnings per share |
| $ | 6.02 |
| $ | 2.68 |
| $ | 4.07 |
Diluted earnings per share |
| $ | 5.99 |
| $ | 2.66 |
| $ | 4.02 |
Weighted average number of anti-dilutive shares excluded from denominator |
|
|
|
|
|
|
|
|
|
Restricted stock units |
|
| 0.1 |
|
| 0.1 |
|
| 0.1 |
Performance based restricted stock units are considered anti-dilutive if the performance targets upon which the issuance of the shares is contingent have not been achieved and the respective performance period has not been completed as of the end of the current period.
114
SPECTRUM BRANDS HOLDINGS, INC.
SB/RH HOLDINGS, LLC
NOTES TO THE CONSOLIDATED FINANCIAL STATEMENTS
NOTE 21 – GUARANTOR STATEMENTS – SB/RH
SBI (with SB/RH as a parent guarantor) (collectively, the “Parent”), with their domestic subsidiaries as subsidiary guarantors, has issued the 6.375% Notes and the 6.625% Notes under the 2020/22 Indenture, 6.125% Notes under the 2024 Indenture, the 5.75% Notes under the 2025 Indenture and the 4.00% Notes under the 2026 Indenture. See Note 10, “Debt” for further information on the 6.375% Notes, 6.625% Notes, 6.125% Notes, 5.75% Notes and 4.00% Notes.
The following consolidating financial statements illustrate the components of the consolidated financial statements of SB/RH. Investments in subsidiaries are accounted for using the equity method for purposes of illustrating the consolidating presentation. The elimination entries presented herein eliminate investments in subsidiaries and intercompany balances and transactions.
|
|
|
|
|
|
|
|
|
|
|
|
|
|
|
|
|
|
|
|
|
|
|
|
|
|
|
|
|
|
|
|
Statement of Financial Position |
|
|
| Guarantor |
| Nonguarantor |
|
|
|
|
| ||||
As of September 30, 2016 (in millions) |
| Parent |
| Subsidiaries |
| Subsidiaries |
| Eliminations |
| Consolidated | |||||
Assets | |||||||||||||||
Current assets: |
|
|
|
|
|
|
|
|
|
|
|
|
|
|
|
Cash and cash equivalents |
| $ | 98.6 |
| $ | 3.1 |
| $ | 169.1 |
| $ | — |
| $ | 270.8 |
Trade receivables, net |
|
| 179.5 |
|
| 68.7 |
|
| 234.4 |
|
| — |
|
| 482.6 |
Intercompany receivables |
|
| — |
|
| 909.1 |
|
| 233.4 |
|
| (1,142.5) |
|
| — |
Other receivables |
|
| — |
|
| 5.5 |
|
| 56.3 |
|
| (6.2) |
|
| 55.6 |
Inventories |
|
| 372.8 |
|
| 104.3 |
|
| 281.1 |
|
| (17.6) |
|
| 740.6 |
Prepaid expenses and other |
|
| 42.8 |
|
| 4.4 |
|
| 32.1 |
|
| (0.5) |
|
| 78.8 |
Total current assets |
|
| 693.7 |
|
| 1,095.1 |
|
| 1,006.4 |
|
| (1,166.8) |
|
| 1,628.4 |
Property, plant and equipment, net |
|
| 241.1 |
|
| 77.6 |
|
| 223.4 |
|
| — |
|
| 542.1 |
Long-term intercompany receivables |
|
| 365.4 |
|
| 187.3 |
|
| 13.7 |
|
| (566.4) |
|
| — |
Deferred charges and other |
|
| 180.5 |
|
| 0.9 |
|
| 41.5 |
|
| (190.8) |
|
| 32.1 |
Goodwill |
|
| 912.1 |
|
| 1,154.5 |
|
| 411.8 |
|
| — |
|
| 2,478.4 |
Intangible assets, net |
|
| 1,341.5 |
|
| 628.5 |
|
| 402.5 |
|
| — |
|
| 2,372.5 |
Investments in subsidiaries |
|
| 3,497.8 |
|
| 1,258.1 |
|
| (2.9) |
|
| (4,753.0) |
|
| — |
Total assets |
| $ | 7,232.1 |
| $ | 4,402.0 |
| $ | 2,096.4 |
| $ | (6,677.0) |
| $ | 7,053.5 |
Liabilities and Shareholder's Equity |
|
|
|
|
|
|
|
|
|
|
|
|
|
|
|
Current liabilities: |
|
|
|
|
|
|
|
|
|
|
|
|
|
|
|
Current portion of long-term debt |
| $ | 143.6 |
| $ | 1.4 |
| $ | 19.9 |
| $ | (0.9) |
| $ | 164.0 |
Accounts payable |
|
| 257.5 |
|
| 58.4 |
|
| 264.2 |
|
| — |
|
| 580.1 |
Intercompany accounts payable |
|
| 1,157.0 |
|
| — |
|
| — |
|
| (1,157.0) |
|
| — |
Accrued wages and salaries |
|
| 63.9 |
|
| 6.6 |
|
| 52.4 |
|
| — |
|
| 122.9 |
Accrued interest |
|
| 39.3 |
|
| — |
|
| — |
|
| — |
|
| 39.3 |
Other current liabilities |
|
| 88.0 |
|
| 11.0 |
|
| 95.5 |
|
| (6.2) |
|
| 188.3 |
Total current liabilities |
|
| 1,749.3 |
|
| 77.4 |
|
| 432.0 |
|
| (1,164.1) |
|
| 1,094.6 |
Long-term debt, net of current portion |
|
| 3,402.5 |
|
| 20.5 |
|
| 33.2 |
|
| — |
|
| 3,456.2 |
Long-term intercompany debt |
|
| 12.8 |
|
| 346.1 |
|
| 192.6 |
|
| (551.5) |
|
| — |
Deferred income taxes |
|
| 189.0 |
|
| 459.2 |
|
| 80.3 |
|
| (195.8) |
|
| 532.7 |
Other long-term liabilities |
|
| 39.5 |
|
| 1.0 |
|
| 100.1 |
|
| — |
|
| 140.6 |
Total liabilities |
|
| 5,393.1 |
|
| 904.2 |
|
| 838.2 |
|
| (1,911.4) |
|
| 5,224.1 |
Shareholder's equity: |
|
|
|
|
|
|
|
|
|
|
|
|
|
|
|
Other capital |
|
| 2,060.9 |
|
| 152.3 |
|
| (954.0) |
|
| 741.7 |
|
| 2,000.9 |
Accumulated (deficit) earnings |
|
| 8.0 |
|
| 3,551.6 |
|
| 2,362.1 |
|
| (5,913.6) |
|
| 8.1 |
Accumulated other comprehensive (loss) income |
|
| (229.9) |
|
| (206.1) |
|
| (199.7) |
|
| 406.3 |
|
| (229.4) |
Total shareholder's equity |
|
| 1,839.0 |
|
| 3,497.8 |
|
| 1,208.4 |
|
| (4,765.6) |
|
| 1,779.6 |
Non-controlling interest |
|
| — |
|
| — |
|
| 49.8 |
|
| — |
|
| 49.8 |
Total equity |
|
| 1,839.0 |
|
| 3,497.8 |
|
| 1,258.2 |
|
| (4,765.6) |
|
| 1,829.4 |
Total liabilities and equity |
| $ | 7,232.1 |
| $ | 4,402.0 |
| $ | 2,096.4 |
| $ | (6,677.0) |
| $ | 7,053.5 |
115
SPECTRUM BRANDS HOLDINGS, INC.
SB/RH HOLDINGS, LLC
NOTES TO THE CONSOLIDATED FINANCIAL STATEMENTS
|
|
|
|
|
|
|
|
|
|
|
|
|
|
|
|
|
|
|
|
|
|
|
|
|
|
|
|
|
|
|
|
Statement of Financial Position |
|
|
| Guarantor |
| Nonguarantor |
|
|
|
|
| ||||
As of September 30, 2015 (in millions) |
| Parent |
| Subsidiaries |
| Subsidiaries |
| Eliminations |
| Consolidated | |||||
Assets | |||||||||||||||
Current assets: |
|
|
|
|
|
|
|
|
|
|
|
|
|
|
|
Cash and cash equivalents |
| $ | 13.0 |
| $ | 8.6 |
| $ | 226.3 |
| $ | — |
| $ | 247.9 |
Trade receivables, net |
|
| 175.8 |
|
| 94.9 |
|
| 228.1 |
|
| — |
|
| 498.8 |
Intercompany receivables |
|
| 152.0 |
|
| 713.8 |
|
| 225.0 |
|
| (1,090.8) |
|
| — |
Other receivables |
|
| 14.3 |
|
| 11.2 |
|
| 62.4 |
|
| — |
|
| 87.9 |
Inventories |
|
| 410.3 |
|
| 95.7 |
|
| 291.8 |
|
| (17.0) |
|
| 780.8 |
Prepaid expenses and other |
|
| 36.1 |
|
| 2.2 |
|
| 33.0 |
|
| 0.8 |
|
| 72.1 |
Total current assets |
|
| 801.5 |
|
| 926.4 |
|
| 1,066.6 |
|
| (1,107.0) |
|
| 1,687.5 |
Property, plant and equipment, net |
|
| 235.2 |
|
| 60.7 |
|
| 211.2 |
|
| — |
|
| 507.1 |
Long-term intercompany receivables |
|
| 2.8 |
|
| 357.7 |
|
| 15.4 |
|
| (375.9) |
|
| — |
Deferred charges and other |
|
| 154.8 |
|
| 14.1 |
|
| 35.3 |
|
| (162.1) |
|
| 42.1 |
Goodwill |
|
| 910.7 |
|
| 1,154.0 |
|
| 412.0 |
|
| — |
|
| 2,476.7 |
Intangible assets, net |
|
| 1,402.4 |
|
| 646.6 |
|
| 431.3 |
|
| — |
|
| 2,480.3 |
Investments in subsidiaries |
|
| 3,150.1 |
|
| 1,095.9 |
|
| (2.9) |
|
| (4,243.1) |
|
| — |
Total assets |
| $ | 6,657.5 |
| $ | 4,255.4 |
| $ | 2,168.9 |
| $ | (5,888.1) |
| $ | 7,193.7 |
Liabilities and Shareholder's Equity |
|
|
|
|
|
|
|
|
|
|
|
|
|
|
|
Current liabilities: |
|
|
|
|
|
|
|
|
|
|
|
|
|
|
|
Current portion of long-term debt |
| $ | 53.4 |
| $ | — |
| $ | 15.1 |
| $ | — |
| $ | 68.5 |
Accounts payable |
|
| 281.1 |
|
| 45.9 |
|
| 293.6 |
|
| — |
|
| 620.6 |
Intercompany accounts payable |
|
| 449.4 |
|
| — |
|
| 28.5 |
|
| (477.9) |
|
| — |
Accrued wages and salaries |
|
| 40.3 |
|
| 10.0 |
|
| 46.2 |
|
| — |
|
| 96.5 |
Accrued interest |
|
| 63.2 |
|
| — |
|
| 0.1 |
|
| — |
|
| 63.3 |
Other current liabilities |
|
| 84.5 |
|
| 21.5 |
|
| 106.0 |
|
| (0.1) |
|
| 211.9 |
Total current liabilities |
|
| 971.9 |
|
| 77.4 |
|
| 489.5 |
|
| (478.0) |
|
| 1,060.8 |
Long-term debt, net of current portion |
|
| 3,848.8 |
|
| — |
|
| 23.3 |
|
| — |
|
| 3,872.1 |
Long-term intercompany debt |
|
| 16.8 |
|
| 578.7 |
|
| 392.6 |
|
| (988.1) |
|
| — |
Deferred income taxes |
|
| 202.1 |
|
| 440.5 |
|
| 94.2 |
|
| (164.3) |
|
| 572.5 |
Other long-term liabilities |
|
| 33.3 |
|
| 8.8 |
|
| 73.4 |
|
| — |
|
| 115.5 |
Total liabilities |
|
| 5,072.9 |
|
| 1,105.4 |
|
| 1,073.0 |
|
| (1,630.4) |
|
| 5,620.9 |
Shareholder's equity: |
|
|
|
|
|
|
|
|
|
|
|
|
|
|
|
Other capital |
|
| 1,981.7 |
|
| 1,129.2 |
|
| 34.7 |
|
| (1,175.7) |
|
| 1,969.9 |
Accumulated (deficit) earnings |
|
| (246.7) |
|
| 2,139.8 |
|
| 1,176.1 |
|
| (3,315.9) |
|
| (246.7) |
Accumulated other comprehensive (loss) income |
|
| (200.2) |
|
| (175.1) |
|
| (171.0) |
|
| 346.2 |
|
| (200.1) |
Total shareholder's equity |
|
| 1,534.8 |
|
| 3,093.9 |
|
| 1,039.8 |
|
| (4,145.4) |
|
| 1,523.1 |
Non-controlling interest |
|
| 49.8 |
|
| 56.1 |
|
| 56.1 |
|
| (112.3) |
|
| 49.7 |
Total equity |
|
| 1,584.6 |
|
| 3,150.0 |
|
| 1,095.9 |
|
| (4,257.7) |
|
| 1,572.8 |
Total liabilities and equity |
| $ | 6,657.5 |
| $ | 4,255.4 |
| $ | 2,168.9 |
| $ | (5,888.1) |
| $ | 7,193.7 |
116
SPECTRUM BRANDS HOLDINGS, INC.
SB/RH HOLDINGS, LLC
NOTES TO THE CONSOLIDATED FINANCIAL STATEMENTS
|
|
|
|
|
|
|
|
|
|
|
|
|
|
|
|
Statement of Income |
|
|
| Guarantor |
| Nonguarantor |
|
|
|
|
| ||||
Year ended September 30, 2016 (in millions) |
| Parent |
| Subsidiaries |
| Subsidiaries |
| Eliminations |
| Consolidated | |||||
Net sales |
| $ | 2,466.2 |
| $ | 1,461.2 |
| $ | 2,621.0 |
| $ | (1,508.7) |
| $ | 5,039.7 |
Cost of goods sold |
|
| 1,671.2 |
|
| 1,011.6 |
|
| 1,943.1 |
|
| (1,506.6) |
|
| 3,119.3 |
Restructuring and related charges |
|
| — |
|
| — |
|
| 0.5 |
|
| — |
|
| 0.5 |
Gross profit |
|
| 795.0 |
|
| 449.6 |
|
| 677.4 |
|
| (2.1) |
|
| 1,919.9 |
Selling |
|
| 317.9 |
|
| 119.9 |
|
| 340.3 |
|
| (1.5) |
|
| 776.6 |
General and administrative |
|
| 229.8 |
|
| 76.0 |
|
| 60.9 |
|
| (0.1) |
|
| 366.6 |
Research and development |
|
| 37.2 |
|
| 6.4 |
|
| 15.1 |
|
| — |
|
| 58.7 |
Acquisition and integration related charges |
|
| 21.5 |
|
| 3.2 |
|
| 12.0 |
|
| — |
|
| 36.7 |
Restructuring and related charges |
|
| 4.9 |
|
| 5.7 |
|
| 4.1 |
|
| — |
|
| 14.7 |
Write-off from impairment of intangible assets |
|
| 4.7 |
|
| — |
|
| — |
|
| — |
|
| 4.7 |
Total operating expense |
|
| 616.0 |
|
| 211.2 |
|
| 432.4 |
|
| (1.6) |
|
| 1,258.0 |
Operating income (loss) |
|
| 179.0 |
|
| 238.4 |
|
| 245.0 |
|
| (0.5) |
|
| 661.9 |
Interest expense |
|
| 214.0 |
|
| 19.9 |
|
| 16.1 |
|
| — |
|
| 250.0 |
Other non-operating (income) expense, net |
|
| (381.1) |
|
| (196.4) |
|
| 9.0 |
|
| 577.1 |
|
| 8.6 |
Income from operations before income taxes |
|
| 346.1 |
|
| 414.9 |
|
| 219.9 |
|
| (577.6) |
|
| 403.3 |
Income tax expense (benefit) |
|
| (6.2) |
|
| 36.6 |
|
| 23.4 |
|
| (2.8) |
|
| 51.0 |
Net income (loss) |
|
| 352.3 |
|
| 378.3 |
|
| 196.5 |
|
| (574.8) |
|
| 352.3 |
Net income attributable to non-controlling interest |
|
| — |
|
| — |
|
| 0.4 |
|
| — |
|
| 0.4 |
Net income (loss) attributable to controlling interest |
| $ | 352.3 |
| $ | 378.3 |
| $ | 196.1 |
| $ | (574.8) |
| $ | 351.9 |
|
|
|
|
|
|
|
|
|
|
|
|
|
|
|
|
Statement of Income |
|
|
| Guarantor |
| Nonguarantor |
|
|
|
|
| ||||
Year ended September 30, 2015 (in millions) |
| Parent |
| Subsidiaries |
| Subsidiaries |
| Eliminations |
| Consolidated | |||||
Net sales |
| $ | 2,385.1 |
| $ | 759.6 |
| $ | 2,534.0 |
| $ | (988.3) |
| $ | 4,690.4 |
Cost of goods sold |
|
| 1,657.0 |
|
| 492.4 |
|
| 1,845.5 |
|
| (976.9) |
|
| 3,018.0 |
Restructuring and related charges |
|
| — |
|
| — |
|
| 2.1 |
|
| — |
|
| 2.1 |
Gross profit |
|
| 728.1 |
|
| 267.2 |
|
| 686.4 |
|
| (11.4) |
|
| 1,670.3 |
Selling |
|
| 291.4 |
|
| 89.5 |
|
| 340.8 |
|
| (1.0) |
|
| 720.7 |
General and administrative |
|
| 218.8 |
|
| 40.4 |
|
| 73.2 |
|
| — |
|
| 332.4 |
Research and development |
|
| 33.4 |
|
| 3.3 |
|
| 14.6 |
|
| — |
|
| 51.3 |
Acquisition and integration related charges |
|
| 40.8 |
|
| 5.7 |
|
| 12.3 |
|
| — |
|
| 58.8 |
Restructuring and related charges |
|
| 34.0 |
|
| 0.6 |
|
| (8.0) |
|
| — |
|
| 26.6 |
Total operating expense |
|
| 618.4 |
|
| 139.5 |
|
| 432.9 |
|
| (1.0) |
|
| 1,189.8 |
Operating income (loss) |
|
| 109.7 |
|
| 127.7 |
|
| 253.5 |
|
| (10.4) |
|
| 480.5 |
Interest expense |
|
| 235.4 |
|
| 6.9 |
|
| 29.6 |
|
| — |
|
| 271.9 |
Other non-operating (income) expense, net |
|
| (207.1) |
|
| (151.5) |
|
| 4.8 |
|
| 362.7 |
|
| 8.9 |
Income from operations before income taxes |
|
| 81.4 |
|
| 272.3 |
|
| 219.1 |
|
| (373.1) |
|
| 199.7 |
Income tax (benefit) expense |
|
| (74.4) |
|
| 66.3 |
|
| 52.9 |
|
| (0.9) |
|
| 43.9 |
Net income (loss) |
|
| 155.8 |
|
| 206.0 |
|
| 166.2 |
|
| (372.2) |
|
| 155.8 |
Net income (loss) attributable to non-controlling interest |
|
| 0.4 |
|
| 0.9 |
|
| 0.9 |
|
| (1.8) |
|
| 0.4 |
Net income (loss) attributable to controlling interest |
| $ | 155.4 |
| $ | 205.1 |
| $ | 165.3 |
| $ | (370.4) |
| $ | 155.4 |
117
SPECTRUM BRANDS HOLDINGS, INC.
SB/RH HOLDINGS, LLC
NOTES TO THE CONSOLIDATED FINANCIAL STATEMENTS
|
|
|
|
|
|
|
|
|
|
|
|
|
|
|
|
Statement of Income |
|
|
| Guarantor |
| Nonguarantor |
|
|
|
|
| ||||
Year ended September 30, 2014 (in millions) |
| Parent |
| Subsidiaries |
| Subsidiaries |
| Eliminations |
| Consolidated | |||||
Net sales |
| $ | 626.7 |
| $ | 2,141.3 |
| $ | 2,449.4 |
| $ | (788.3) |
| $ | 4,429.1 |
Cost of goods sold |
|
| 447.7 |
|
| 1,434.4 |
|
| 1,762.7 |
|
| (788.3) |
|
| 2,856.5 |
Restructuring and related charges |
|
| — |
|
| 2.6 |
|
| 1.1 |
|
|
|
|
| 3.7 |
Gross profit |
|
| 179.0 |
|
| 704.3 |
|
| 685.6 |
|
| — |
|
| 1,568.9 |
Selling |
|
| 76.6 |
|
| 268.5 |
|
| 333.8 |
|
| (0.7) |
|
| 678.2 |
General and administrative |
|
| 60.5 |
|
| 168.9 |
|
| 89.6 |
|
| — |
|
| 319.0 |
Research and development |
|
| 22.3 |
|
| 12.0 |
|
| 13.6 |
|
| — |
|
| 47.9 |
Acquisition and integration related charges |
|
| 11.7 |
|
| 8.3 |
|
| 0.1 |
|
| — |
|
| 20.1 |
Restructuring and related charges |
|
| 8.4 |
|
| 4.0 |
|
| 6.8 |
|
| — |
|
| 19.2 |
Total operating expense |
|
| 179.5 |
|
| 461.7 |
|
| 443.9 |
|
| (0.7) |
|
| 1,084.4 |
Operating income (loss) |
|
| (0.5) |
|
| 242.6 |
|
| 241.7 |
|
| 0.7 |
|
| 484.5 |
Interest expense |
|
| 172.2 |
|
| (0.1) |
|
| 30.0 |
|
| — |
|
| 202.1 |
Other non-operating (income) expense, net |
|
| (213.8) |
|
| (163.7) |
|
| 3.9 |
|
| 379.9 |
|
| 6.3 |
Income from operations before income taxes |
|
| 41.1 |
|
| 406.4 |
|
| 207.8 |
|
| (379.2) |
|
| 276.1 |
Income tax expense (benefit) |
|
| (176.0) |
|
| 194.6 |
|
| 40.1 |
|
| 0.3 |
|
| 59.0 |
Net income (loss) |
|
| 217.1 |
|
| 211.8 |
|
| 167.7 |
|
| (379.5) |
|
| 217.1 |
Net income (loss) attributable to non-controlling interest |
|
| 0.3 |
|
| 0.3 |
|
| 0.3 |
|
| (0.6) |
|
| 0.3 |
Net income (loss) attributable to controlling interest |
| $ | 216.8 |
| $ | 211.5 |
| $ | 167.4 |
| $ | (378.9) |
| $ | 216.8 |
|
|
|
|
|
|
|
|
|
|
|
|
|
|
|
|
Statement of Comprehensive Income |
|
|
| Guarantor |
| Nonguarantor |
|
|
|
|
| ||||
Year ended September 30, 2016 (in millions) |
| Parent |
| Subsidiaries |
| Subsidiaries |
| Eliminations |
| Consolidated | |||||
Net income (loss) |
| $ | 352.3 |
| $ | 378.3 |
| $ | 196.5 |
| $ | (574.8) |
| $ | 352.3 |
Other comprehensive income (loss), net of tax: |
|
|
|
|
|
|
|
|
|
|
|
|
|
|
|
Foreign currency translation (loss) gain |
|
| (8.5) |
|
| (8.4) |
|
| (6.0) |
|
| 14.4 |
|
| (8.5) |
Unrealized gain (loss) on derivative instruments |
|
| 7.1 |
|
| 3.2 |
|
| 3.2 |
|
| (6.4) |
|
| 7.1 |
Defined benefit pension gain (loss) |
|
| (28.2) |
|
| (25.4) |
|
| (25.3) |
|
| 50.7 |
|
| (28.2) |
Other comprehensive income (loss) |
|
| (29.6) |
|
| (30.6) |
|
| (28.1) |
|
| 58.7 |
|
| (29.6) |
Comprehensive income (loss) |
|
| 322.7 |
|
| 347.7 |
|
| 168.4 |
|
| (516.1) |
|
| 322.7 |
Comprehensive income (loss) attributable to non-controlling interest |
|
| — |
|
| — |
|
| (0.3) |
|
| — |
|
| (0.3) |
Comprehensive income (loss) attributable to controlling interest |
| $ | 322.7 |
| $ | 347.7 |
| $ | 168.7 |
| $ | (516.1) |
| $ | 323.0 |
|
|
|
|
|
|
|
|
|
|
|
|
|
|
|
|
Statement of Comprehensive Income |
|
|
| Guarantor |
| Nonguarantor |
|
|
|
|
| ||||
Year ended September 30, 2015 (in millions) |
| Parent |
| Subsidiaries |
| Subsidiaries |
| Eliminations |
| Consolidated | |||||
Net income (loss) |
| $ | 155.8 |
| $ | 206.0 |
| $ | 166.2 |
| $ | (372.2) |
| $ | 155.8 |
Other comprehensive income (loss), net of tax: |
|
|
|
|
|
|
|
|
|
|
|
|
|
|
|
Foreign currency translation (loss) gain |
|
| (112.8) |
|
| (113.7) |
|
| (113.7) |
|
| 227.2 |
|
| (113.0) |
Unrealized (loss) gain on derivative instruments |
|
| (13.2) |
|
| (7.9) |
|
| (7.9) |
|
| 15.8 |
|
| (13.2) |
Defined benefit pension (loss) gain |
|
| (11.0) |
|
| (2.2) |
|
| (2.2) |
|
| 4.4 |
|
| (11.0) |
Other comprehensive (loss) income |
|
| (137.0) |
|
| (123.8) |
|
| (123.8) |
|
| 247.4 |
|
| (137.2) |
Comprehensive income (loss) |
|
| 18.8 |
|
| 82.2 |
|
| 42.4 |
|
| (124.8) |
|
| 18.6 |
Comprehensive income (loss) attributable to non-controlling interest |
|
| (0.2) |
|
| (0.2) |
|
| (0.2) |
|
| 0.4 |
|
| (0.2) |
Comprehensive income (loss) attributable to controlling interest |
| $ | 19.0 |
| $ | 82.4 |
| $ | 42.6 |
| $ | (125.2) |
| $ | 18.8 |
118
SPECTRUM BRANDS HOLDINGS, INC.
SB/RH HOLDINGS, LLC
NOTES TO THE CONSOLIDATED FINANCIAL STATEMENTS
Statement of Comprehensive Income |
|
|
| Guarantor |
| Nonguarantor |
|
|
|
|
| ||||
Year ended September 30, 2014 (in millions) |
| Parent |
| Subsidiaries |
| Subsidiaries |
| Eliminations |
| Consolidated | |||||
Net income (loss) |
| $ | 217.1 |
| $ | 211.8 |
| $ | 167.7 |
| $ | (379.5) |
| $ | 217.1 |
Other comprehensive income (loss), net of tax: |
|
|
|
|
|
|
|
|
|
|
|
|
|
|
|
Foreign currency translation (loss) gain |
|
| (32.5) |
|
| (32.7) |
|
| (33.6) |
|
| 66.3 |
|
| (32.5) |
Unrealized gain (loss) on derivative instruments |
|
| 11.5 |
|
| 11.4 |
|
| 11.7 |
|
| (23.1) |
|
| 11.5 |
Defined benefit pension (loss) gain |
|
| (3.6) |
|
| (0.1) |
|
| (0.1) |
|
| 0.2 |
|
| (3.6) |
Other comprehensive (loss) income |
|
| (24.6) |
|
| (21.4) |
|
| (22.0) |
|
| 43.4 |
|
| (24.6) |
Comprehensive income (loss) |
|
| 192.5 |
|
| 190.4 |
|
| 145.7 |
|
| (336.1) |
|
| 192.5 |
Comprehensive income (loss) attributable to non-controlling interest |
|
| 0.4 |
|
| 0.3 |
|
| 0.3 |
|
| (0.6) |
|
| 0.4 |
Comprehensive income (loss) attributable to controlling interest |
| $ | 192.1 |
| $ | 190.1 |
| $ | 145.4 |
| $ | (335.5) |
| $ | 192.1 |
|
|
|
|
|
|
|
|
|
|
|
|
|
|
|
|
|
|
|
|
|
|
|
|
|
|
|
|
|
|
|
|
Statement of Cash Flows |
|
|
| Guarantor |
| Nonguarantor |
|
|
|
|
| ||||
Year ended September 30, 2016 (in millions) |
| Parent |
| Subsidiaries |
| Subsidiaries |
| Eliminations |
| Consolidated | |||||
Net cash (used) provided by operating activities |
| $ | (374.4) |
| $ | 408.9 |
| $ | (107.7) |
| $ | 674.8 |
| $ | 601.6 |
Cash flows from investing activities |
|
|
|
|
|
|
|
|
|
|
|
|
|
|
|
Purchases of property, plant and equipment |
|
| (49.7) |
|
| (8.3) |
|
| (37.2) |
|
| — |
|
| (95.2) |
Proceeds from sales of property, plant and equipment |
|
| 0.1 |
|
| — |
|
| 0.9 |
|
| — |
|
| 1.0 |
Other investing activities |
|
| (1.0) |
|
| (3.2) |
|
| — |
|
| — |
|
| (4.2) |
Net cash used by investing activities |
|
| (50.6) |
|
| (11.5) |
|
| (36.3) |
|
| — |
|
| (98.4) |
Cash flows from financing activities |
|
|
|
|
|
|
|
|
|
|
|
|
|
|
|
Proceeds from issuance of debt |
|
| 498.9 |
|
| — |
|
| — |
|
| — |
|
| 498.9 |
Payment of debt |
|
| (863.7) |
|
| — |
|
| (4.4) |
|
| — |
|
| (868.1) |
Payment of debt issuance costs |
|
| (9.3) |
|
| — |
|
| — |
|
| — |
|
| (9.3) |
Payment of cash dividends to parent |
|
| (97.2) |
|
| — |
|
| — |
|
| — |
|
| (97.2) |
Payment of contingent consideration |
|
| (3.2) |
|
| — |
|
| — |
|
| — |
|
| (3.2) |
Advances related to intercompany transactions |
|
| 985.1 |
|
| (402.9) |
|
| 92.6 |
|
| (674.8) |
|
| — |
Net cash provided (used) by financing activities |
|
| 510.6 |
|
| (402.9) |
|
| 88.2 |
|
| (674.8) |
|
| (478.9) |
Effect of exchange rate changes on cash and cash equivalents |
|
| — |
|
| — |
|
| (1.4) |
|
| — |
|
| (1.4) |
Net (decrease) in cash and cash equivalents |
|
| 85.6 |
|
| (5.5) |
|
| (57.2) |
|
| — |
|
| 22.9 |
Cash and cash equivalents, beginning of period |
|
| 13.0 |
|
| 8.6 |
|
| 226.3 |
|
| — |
|
| 247.9 |
Cash and cash equivalents, end of period |
| $ | 98.6 |
| $ | 3.1 |
| $ | 169.1 |
| $ | — |
| $ | 270.8 |
119
SPECTRUM BRANDS HOLDINGS, INC.
SB/RH HOLDINGS, LLC
NOTES TO THE CONSOLIDATED FINANCIAL STATEMENTS
|
|
|
|
|
|
|
|
|
|
|
|
|
|
|
|
|
|
|
|
|
|
|
|
|
|
|
|
|
|
|
|
Statement of Cash Flows |
|
|
| Guarantor |
| Nonguarantor |
|
|
|
|
| ||||
Year ended September 30, 2015 (in millions) |
| Parent |
| Subsidiaries |
| Subsidiaries |
| Eliminations |
| Consolidated | |||||
Net cash (used) provided by operating activities |
| $ | (143.5) |
| $ | (770.8) |
| $ | (1,418.8) |
| $ | 2,774.9 |
| $ | 441.8 |
Cash flows from investing activities |
|
|
|
|
|
|
|
|
|
|
| — |
|
|
|
Purchases of property, plant and equipment |
|
| (45.7) |
|
| (13.5) |
|
| (29.9) |
|
| — |
|
| (89.1) |
Business acquisitions, net of cash acquired |
|
| (1,026.0) |
|
| — |
|
| (165.1) |
|
| — |
|
| (1,191.1) |
Proceeds from sales of property, plant and equipment |
|
| 0.1 |
|
| — |
|
| 1.3 |
|
| — |
|
| 1.4 |
Other investing activities |
|
| — |
|
| — |
|
| (0.9) |
|
| — |
|
| (0.9) |
Net cash used by investing activities |
|
| (1,071.6) |
|
| (13.5) |
|
| (194.6) |
|
| — |
|
| (1,279.7) |
Cash flows from financing activities |
|
|
|
|
|
|
|
|
|
|
|
|
|
|
|
Proceeds from issuance of debt |
|
| 3,320.3 |
|
| — |
|
| — |
|
| — |
|
| 3,320.3 |
Payment of debt |
|
| (2,521.2) |
|
| — |
|
| (292.0) |
|
| — |
|
| (2,813.2) |
Payment of debt issuance costs |
|
| (38.1) |
|
| — |
|
| — |
|
| — |
|
| (38.1) |
Payment of cash dividends to parent |
|
| (72.1) |
|
| — |
|
| — |
|
| — |
|
| (72.1) |
Share based tax withholding payments, net of proceeds upon vesting |
|
| (2.6) |
|
| — |
|
| — |
|
| — |
|
| (2.6) |
Advances related to intercompany transactions |
|
| 8.7 |
|
| 781.7 |
|
| 1,984.5 |
|
| (2,774.9) |
|
| — |
Capital contribution from parent |
|
| 528.3 |
|
| — |
|
| — |
|
| — |
|
| 528.3 |
Net cash provided (used) by financing activities |
|
| 1,223.3 |
|
| 781.7 |
|
| 1,692.5 |
|
| (2,774.9) |
|
| 922.6 |
Effect of exchange rate changes on cash and cash equivalents due to Venezuela devaluation |
|
| — |
|
| — |
|
| (2.5) |
|
| — |
|
| (2.5) |
Effect of exchange rate changes on cash and cash equivalents |
|
| — |
|
| — |
|
| (27.2) |
|
| — |
|
| (27.2) |
Net increase (decrease) in cash and cash equivalents |
|
| 8.2 |
|
| (2.6) |
|
| 49.4 |
|
| — |
|
| 55.0 |
Cash and cash equivalents, beginning of period |
|
| 4.8 |
|
| 11.2 |
|
| 176.9 |
|
| — |
|
| 192.9 |
Cash and cash equivalents, end of period |
| $ | 13.0 |
| $ | 8.6 |
| $ | 226.3 |
| $ | — |
| $ | 247.9 |
|
|
|
|
|
|
|
|
|
|
|
|
|
|
|
|
|
|
|
|
|
|
|
|
|
|
|
|
|
|
|
|
Statement of Cash Flows |
|
|
| Guarantor |
| Nonguarantor |
|
|
|
|
| ||||
Year ended September 30, 2014 (in millions) |
| Parent |
| Subsidiaries |
| Subsidiaries |
| Eliminations |
| Consolidated | |||||
Net cash provided (used) by operating activities |
| $ | 616.6 |
| $ | 114.4 |
| $ | (269.4) |
| $ | (26.9) |
| $ | 434.7 |
Cash flows from investing activities |
|
|
|
|
|
|
|
|
|
|
|
|
|
|
|
Purchases of property, plant and equipment |
|
| (23.2) |
|
| (26.4) |
|
| (23.7) |
|
| — |
|
| (73.3) |
Business acquisitions, net of cash acquired |
|
| — |
|
| (27.6) |
|
| — |
|
| — |
|
| (27.6) |
Proceeds from sales of property, plant and equipment |
|
| 0.1 |
|
| 0.1 |
|
| 9.0 |
|
| — |
|
| 9.2 |
Other investing activities |
|
| — |
|
| (1.8) |
|
| — |
|
| — |
|
| (1.8) |
Net cash used by investing activities |
|
| (23.1) |
|
| (55.7) |
|
| (14.7) |
|
| — |
|
| (93.5) |
Cash flows from financing activities |
|
|
|
|
|
|
|
|
|
|
|
|
|
|
|
Proceeds from issuance of debt |
|
| 230.7 |
|
| — |
|
| 309.4 |
|
| — |
|
| 540.1 |
Payment of debt |
|
| (764.9) |
|
| — |
|
| (6.0) |
|
| — |
|
| (770.9) |
Payment of debt issuance costs |
|
| (0.5) |
|
| — |
|
| (4.9) |
|
| — |
|
| (5.4) |
Payment of cash dividends to parent |
|
| (77.0) |
|
|
|
|
| — |
|
| — |
|
| (77.0) |
Share based tax withholding payments, net of proceeds upon vesting |
|
| (25.0) |
|
| — |
|
| — |
|
| — |
|
| (25.0) |
Advances related to intercompany transactions |
|
| 44.1 |
|
| (52.9) |
|
| (18.1) |
|
| 26.9 |
|
| — |
Net cash (used) provided by financing activities |
|
| (592.6) |
|
| (52.9) |
|
| 280.4 |
|
| 26.9 |
|
| (338.2) |
Effect of exchange rate changes on cash and cash equivalents |
|
| — |
|
| — |
|
| (8.3) |
|
|
|
|
| (8.3) |
Net increase (decrease) in cash and cash equivalents |
|
| 0.9 |
|
| 5.8 |
|
| (12.0) |
|
| — |
|
| (5.3) |
Cash and cash equivalents, beginning of period |
|
| 3.9 |
|
| 5.4 |
|
| 188.9 |
|
|
|
|
| 198.2 |
Cash and cash equivalents, end of period |
| $ | 4.8 |
| $ | 11.2 |
| $ | 176.9 |
| $ | — |
| $ | 192.9 |
120
SPECTRUM BRANDS HOLDINGS, INC.
SB/RH HOLDINGS, LLC
NOTES TO THE CONSOLIDATED FINANCIAL STATEMENTS
NOTE 22 - QUARTERLY RESULTS (UNAUDITED)
|
|
|
|
|
|
|
|
|
|
|
|
|
Spectrum Brands Holdings, Inc. |
| Quarter Ended | ||||||||||
2016 (in millions, except per share) |
| September 30, 2016 |
| July 3, 2016 |
| April 3, 2016 |
| January 3, 2016 | ||||
Net sales |
| $ | 1,249.8 |
| $ | 1,361.5 |
| $ | 1,209.6 |
| $ | 1,218.8 |
Gross profit |
|
| 485.8 |
|
| 530.6 |
|
| 462.8 |
|
| 440.7 |
Net income attributable to controlling interest |
|
| 89.0 |
|
| 101.9 |
|
| 92.6 |
|
| 73.6 |
Basic earnings per share |
| $ | 1.50 |
| $ | 1.72 |
| $ | 1.56 |
| $ | 1.24 |
Diluted earnings per share |
| $ | 1.49 |
| $ | 1.71 |
| $ | 1.55 |
| $ | 1.24 |
|
|
|
|
|
|
|
|
|
|
|
|
|
Spectrum Brands Holdings, Inc. |
| Quarter Ended | ||||||||||
2015 (in millions, except per share) |
| September 30, 2015 |
| June 28, 2015 |
| March 29, 2015 |
| December 28, 2014 | ||||
Net sales |
| $ | 1,308.1 |
| $ | 1,247.5 |
| $ | 1,067.0 |
| $ | 1,067.8 |
Gross profit |
|
| 467.4 |
|
| 458.0 |
|
| 374.7 |
|
| 370.2 |
Net income attributable to controlling interest |
|
| 26.4 |
|
| 44.9 |
|
| 27.8 |
|
| 49.8 |
Basic earnings per share |
| $ | 0.44 |
| $ | 0.79 |
| $ | 0.52 |
| $ | 0.94 |
Diluted earnings per share |
| $ | 0.44 |
| $ | 0.79 |
| $ | 0.52 |
| $ | 0.94 |
|
|
|
|
|
|
|
|
|
|
|
|
|
SB/RH Holdings, LLC |
| Quarter Ended | ||||||||||
2016 (in millions) |
| September 30, 2016 |
| July 3, 2016 |
| April 3, 2016 |
| January 3, 2016 | ||||
Net sales |
| $ | 1,249.8 |
| $ | 1,361.5 |
| $ | 1,209.6 |
| $ | 1,218.8 |
Gross profit |
|
| 485.8 |
|
| 530.6 |
|
| 462.8 |
|
| 440.7 |
Net income attributable to controlling interest |
|
| 88.9 |
|
| 105.1 |
|
| 82.5 |
|
| 75.4 |
|
|
|
|
|
|
|
|
|
|
|
|
|
SB/RH Holdings, LLC |
| Quarter Ended | ||||||||||
2015 (in millions) |
| September 30, 2015 |
| June 28, 2015 |
| March 29, 2015 |
| December 28, 2014 | ||||
Net sales |
| $ | 1,308.1 |
| $ | 1,247.5 |
| $ | 1,067.0 |
| $ | 1,067.8 |
Gross profit |
|
| 467.4 |
|
| 458.0 |
|
| 374.7 |
|
| 370.2 |
Net income attributable to controlling interest |
|
| 28.4 |
|
| 46.6 |
|
| 29.6 |
|
| 50.8 |
As previously discussed in Note 2, “Significant Accounting Policies and Practices”, the Company adopted ASU No. 2016-09. The Company had elected to early adopt the ASU during the quarter ended July 3, 2016 effective as if adopted the first day of the fiscal year, October 1, 2015. The adoption of the new standard impacted our previously reported quarterly results for the recognition of excess tax benefits in our provision for income taxes rather than paid in capital. Due to the valuation allowance on deferred taxes, there was no impact to our quarterly results for the quarter ended January 3, 2016. The following summarizes the impact to the quarter ended April 3, 2016:
|
|
|
|
|
|
|
|
|
|
|
| Quarter Ended April 3, 2016 | |||||||
SBH (in millions, except per share) |
| As Reported |
| Adjustment |
| As Adjusted | |||
Net income attributable to controlling interest |
|
| 75.2 |
|
| 17.4 |
|
| 92.6 |
Basic earnings per share |
| $ | 1.27 |
| $ | 0.29 |
| $ | 1.56 |
Diluted earnings per share |
| $ | 1.26 |
| $ | 0.29 |
| $ | 1.55 |
|
|
|
|
|
|
|
|
|
|
|
| Quarter Ended April 3, 2016 | |||||||
SB/RH (in millions) |
| As Reported |
| Adjustment |
| As Adjusted | |||
Net income attributable to controlling interest |
|
| 72.1 |
|
| 10.4 |
|
| 82.5 |
121
Signatures
Pursuant to the requirements of Section 13 or 15(d) of the Securities Exchange Act of 1934, the registrant has duly caused this report to be signed on its behalf by the undersigned thereunto duly authorized.
SPECTRUM BRANDS HOLDINGS, INC. | ||||
By: | /s/ | |||
Andreas Rouvé | ||||
Chief Executive Officer and Director | ||||
DATE: November 27, 2013
Pursuant to the requirements of the Securities Exchange Act of 1934, this report has been signed below by the following persons on behalf of the registrant and in the capacities indicated and on the above-stated date.
Signature | Title | ||
/s/ Andreas Rouvé | Chief Executive Officer and Director (Principal Executive Officer) | ||
/s/ Douglas L. | Executive Vice President, Chief Financial Officer (Principal Financial Officer and Principal Accounting Officer) | ||
/s/ David M. Maura David M. Maura | Chairman of the Board | ||
/s/ Kenneth C. Ambrecht Kenneth C. Ambrecht | Director | ||
/s/ Eugene I. Davis Eugene I. Davis | Director | ||
/s/ Norman S. Matthews Norman S. Matthews | Director | ||
/s/ Terry L. Polistina Terry L. Polistina | Director | ||
/s/ Hugh R. Rovit Hugh R. Rovit | Director | ||
/s/ Omar Asali Omar Asali | Director | ||
/s/ Joseph S. Steinberg Joseph S. Steinberg | Director | ||
122
Signatures
Pursuant to the requirements of Section 13 or 15(d) of the Securities Exchange Act of 1934, the registrant has duly caused this report to be signed on its behalf by the undersigned thereunto duly authorized.
SB/RH | ||||
By: Spectrum Brands Holdings, Inc., | ||||
By: | /s/ Andreas Rouvé | |||
Andreas Rouvé | ||||
Chief Executive Officer and Director | ||||
DATE: November 17, 2016
Pursuant to the requirements of the Securities Exchange Act of 1934, this report has been signed below by the following persons on behalf of the Sole Member of the registrant and in the capacities indicated and on the above-stated date.
Signature | Title | |
/s/ Andreas Rouvé Andreas Rouvé | Chief Executive Officer and Director (Principal Executive Officer) | |
/s/ Douglas L. Martin Douglas L. Martin | Executive Vice President, Chief Financial Officer | |
/s/ David M. Maura David M. Maura | Chairman of the Board | |
/s/ Kenneth C. Ambrecht Kenneth C. Ambrecht | Director | |
/s/ Eugene I. Davis Eugene I. Davis | Director | |
/s/ Norman S. Matthews Norman S. Matthews | Director | |
/s/ Terry L. Polistina Terry L. Polistina | Director | |
/s/ Hugh R. Rovit Hugh R. Rovit | Director | |
/s/ Omar Asali Omar Asali | Director | |
/s/ Joseph S. Steinberg Joseph S. Steinberg | Director | |
123
Exhibit | Acquisition Agreement, dated October 8, 2012, by and between Spectrum Brands, Inc. and Stanley Black & Decker, Inc. | |
Exhibit 2.2 | Agreement and Plan of Merger, dated as of April 28, 2015 between Spectrum Brands Holdings, Inc., Armored AutoGroup Parent Inc., Ignite Merger Sub, Inc. and Avista Capital Partners II GP, LLC, as representative for the shareholders and optionholders of Armored AutoGroup Parent Inc. (incorporated herein by reference to Exhibit 2.1 to the Current Report on Form 8-K filed with the SEC by Spectrum Brands Holdings, Inc. on April 29, 2015 (File No. 001-34757)). | |
Exhibit 3.1 | Amended and Restated Certificate of Incorporation of Spectrum Brands Holdings, Inc., effective March 7, 2013 (incorporated by reference to Exhibit 3.1 to the Current Report on Form 8-K filed with the SEC by Spectrum Brands Holdings, Inc. on March 7, | |
Exhibit 3.2 | Second Amended and Restated By-Laws of Spectrum Brands Holdings, Inc., effective as of March 7, 2013, as amended by the First Amendment to the Second Amended and Restated Bylaws, effective as of July 28, 2015 (incorporated by reference to Exhibit 3.2 to the | |
Exhibit 3.3 | Certificate of Formation of SB/RH Holdings, LLC (incorporated herein by reference to Exhibit 3.29 to the Registration Statement on Form S-4 filed with the SEC by Spectrum Brands, Inc. on December 3, 2013 (File No. 333-192634)). | |
Exhibit 3.4 | Operating Agreement of SB/RH Holdings, LLC (incorporated herein by reference to Exhibit 3.30 to the Registration Statement on Form S-4 filed with the SEC by Spectrum Brands, Inc. on December 3, 2013 (File No. 333-192634)). | |
Exhibit 4.1 | Specimen certificate for shares of common stock (filed by incorporation by reference to Exhibit 4.1 to the Registration Statement on Form 8-A filed with the SEC on May 27, | |
Exhibit 4.2 | Indenture governing Spectrum Brands, Inc.’s | |
Exhibit 4.3 | ||
Indenture governing Spectrum Brands, Inc. | ||
Exhibit 4.4 | ||
Indenture governing Spectrum Brands, Inc.’s 5.750% Senior Notes due 2025, dated as of | ||
Exhibit 4.5 | Indenture governing Spectrum Brands, Inc.’s 4.000% Senior Notes due 2026, dated as of September 20, 2016, among Spectrum Brands, Inc., the guarantors named therein, U.S. Bank National Association, as trustee, Elavon Financial Services DAC, UK Branch, as paying agent and Elavon Financial Services DAC, as registrar and transfer agent (filed by incorporation by reference to Exhibit 4.1 to the Current Report on Form 8-K filed with the SEC by Spectrum Brands Holdings, Inc. on December 8, 2014 (File No. 001-34757)). | |
Exhibit | Stockholder Agreement, dated as of February 9, 2010, by and among Harbinger Capital Partners Master Fund I, Ltd., Harbinger Capital Partners Special Situations Funds, L.P., Global Opportunities Breakaway Ltd., and SB/RH Holdings, | |
Exhibit 10.2 | ||
Registration Rights Agreement, dated as of February 9, 2010, by and among Spectrum Brands Holdings, Inc., Harbinger Capital Partners Master Fund I, Ltd., Harbinger Capital Partners Special Situations Fund, L.P., Global Opportunities Breakaway Ltd., Avenue International Master, L.P., Avenue Investments, L.P., Avenue Special Situations Fund IV, L.P., Avenue Special Situations Fund V, L.P. and Avenue-CDP Global Opportunities Fund, L.P. (filed by incorporation by reference to Exhibit 4.1 to the Registration Statement on Form S-4 filed with the SEC by Spectrum Brands Holdings, Inc. on March 29, | ||
Exhibit 10.3 | ||
Registration Rights Agreement, dated | ||
124
Exhibit 10.4 | ||
Credit Agreement, dated as of | ||
Exhibit 10.5 | First Amendment dated as of October 6, 2016 (to the Credit Agreement dated as of June 23, 2015), by and among Spectrum Brands, Inc., SB/RH Holdings, LLC, Deutsche Bank AG New York Branch, as administrative agent, and the lenders party thereto (filed by incorporation by reference to Exhibit 10.2 to the Current Report on Form | |
Exhibit 10.6 | ||
Security Agreement, dated as of June | ||
Exhibit 10.7 | ||
Loan | ||
Exhibit 10.8+ | ||
Amended and Restated Employment Agreement, entered into as of August 11, 2010, by and among Spectrum Brands, Inc., Spectrum Brands Holdings, Inc. and David R. Lumley (filed by incorporation by reference to Exhibit 10.1 to the Current Report on Form 8-K filed with the SEC by Spectrum Brands Holdings, Inc. on August 17, | ||
Exhibit 10.9+ | ||
First Amendment, dated as of November 16, 2010, to the Employment Agreement, dated as of August 11, 2010, by and among Spectrum Brands, Inc., Spectrum Brands Holdings, Inc. and David R. Lumley (filed by incorporation by reference to Exhibit 10.1 to the Current Report on Form 8-K filed with the SEC by Spectrum Brands Holdings, Inc. on November 22, | ||
Exhibit 10.10+ | ||
Retention Agreement, entered into as of | ||
Exhibit 10.11+ | ||
Employment Agreement, effective June 9, 2008, by and between Spectrum Brands, Inc. and Anthony L. Genito (filed by incorporation by reference to Exhibit 10.15 to the Quarterly Report on Form 10-Q for the quarterly period ended June 29, 2008, filed with the SEC by Spectrum Brands, Inc. on August 8, | ||
Exhibit 10.12+ | ||
Amendment to the Employment Agreement, effective as of February 24, 2009, by and between Spectrum Brands, Inc. and Anthony L. Genito (filed by incorporation by reference to Exhibit 10.22 to the Annual Report on Form 10-K for the fiscal year ended September 30, 2010, filed with the SEC by Spectrum Brands, Inc. on December 29, | ||
Exhibit 10.13+ | ||
Description of Second Amendment to the Employment Agreement, effective as of August 28, 2009, by and between Spectrum Brands, Inc. and Anthony L. Genito (filed by incorporation by reference to Exhibit 10.23 to the Annual Report on Form 10-K filed with the SEC by Spectrum Brands, Inc. on December 29, | ||
Exhibit 10.14+ | ||
Third Amendment, dated as of November 16, 2010, to the Employment Agreement, dated as of June 9, 2008, by and among Spectrum Brands, Inc. and Anthony L. Genito (filed by incorporation by reference to Exhibit 10.3 to the Current Report on Form 8-K filed with the SEC by Spectrum Brands Holdings, Inc. on November 22, | ||
Exhibit 10.15+ | ||
Employment Agreement dated September 1, 2014 between Spectrum Brands, Inc. and Douglas L. Martin (filed by incorporation by reference to Exhibit 99.1 to the Current Report on Form 8-K/A filed with the SEC by Spectrum Brands Holdings, Inc. on September 2, 2014 (File No. 001-34757)). | ||
Exhibit 10.16+ | ||
Spectrum Brands Holdings, Inc. 2007 Omnibus Equity Award Plan (formerly known as the Russell Hobbs, Inc. 2007 Omnibus Equity Award Plan) (filed by incorporation by reference to Exhibit 10.1 to the Registration Statement on Form S-8 filed with the SEC by Spectrum Brands Holdings, Inc. on June 16, | ||
Exhibit 10.17+ | 2009 Spectrum Brands, Inc. Incentive Plan (filed by incorporation by reference to Exhibit 10.1 to the Current Report on Form 8-K filed with the SEC by Spectrum Brands, Inc. on August 31, 2009 (File No. 001-13615)). | |
Exhibit | Form of Spectrum Brands, Inc. Restricted Stock Award Agreement under the 2009 Incentive Plan (filed by incorporation by reference to Exhibit 10.2 to the Current Report on Form 8-K filed with the SEC by Spectrum Brands, Inc. on October 28, 2009 (File No. 001-13615)). | |
125
Exhibit 10.19+ | Spectrum Brands Holdings, Inc. 2011 Omnibus Equity Award Plan, as amended on January 28, 2014 (filed by incorporation by reference to | |
Exhibit 10.20+ | ||
Severance Agreement, dated as of November 19, 2012, by and between Spectrum Brands, Inc. and Nathan E. Fagre (filed by incorporation by reference to Exhibit 10.47 to the Annual Report on Form 10-K filed with the SEC by Spectrum Brands, Inc. on November 21, | ||
Exhibit 10.21+ | ||
Registered Director’s Agreement, dated | ||
Exhibit 10.22+ | ||
Separation Agreement dated September 16, 2013 between Spectrum Brands, Inc. and Terry Polistina (filed by incorporation by reference to Exhibit 10.1 to the Current Report on Form 8-K filed with the SEC by Spectrum Brands, Inc. on September 20, | ||
Exhibit 10.23+ | Transition Employment Agreement dated January 8, 2015, by and between Spectrum Brands, Inc., Spectrum Brands Holdings, Inc. and David R. Lumley (filed by incorporation by reference to Exhibit 10.3 to the Quarterly Report on Form 10-Q filed with the SEC by Spectrum Brands Holdings, Inc. on February 5, 2015 (File No. 001-34757)). | |
Exhibit 10.24+ | Employment Agreement, dated March 16, 2015, among Spectrum Brands Holdings, Inc., Spectrum Brands, Inc. and Andreas Rouve (filed by incorporation by reference to Exhibit 10.2 to the Quarterly Report on Form 10-Q filed with the SEC by Spectrum Brands Holdings, Inc. on May 1, 2015 (File No. 001-34757)). | |
Exhibit 10.25+ | Employment Agreement dated January 20, 2016 by and among Spectrum Brands, Inc. and David M. Maura (filed by incorporation by reference to Exhibit 10.1 to the Current Report on Form 8-K filed with the SEC by Spectrum Brands Holdings, Inc. on January 21, 2016 (File No. 001-34757)). | |
Exhibit 21.1 | Subsidiaries of Registrant.* | |
Exhibit 23.1 | Consent of Independent Registered Public Accounting Firm.* | |
Exhibit 31.1 | Certification of Chief Executive Officer required by Rule 13a-14(a) or Rule 15d-14(a) of the Securities and Exchange Act of 1934, as adopted pursuant to Section 302 of the Sarbanes-Oxley Act of 2002. Spectrum Brands Holdings, Inc.* | |
Exhibit 31.2 | Certification of Chief Financial Officer required by Rule 13a-14(a) or Rule 15d-14(a) of the Securities and Exchange Act of 1934, as adopted pursuant to Section 302 the Sarbanes-Oxley Act of 2002. Spectrum Brands Holdings, Inc.* | |
Exhibit 31.3 | Certification of Chief Executive Officer required by Rule 13a-14(a) or Rule 15d-14(a) of the Securities and Exchange Act of 1934, as adopted pursuant to Section 302 of the Sarbanes-Oxley Act of 2002. SB/RH Holdings, LLC * | |
Exhibit 31.4 | Certification of Chief Financial Officer required by Rule 13a-14(a) or Rule 15d-14(a) of the Securities and Exchange Act of 1934, as adopted pursuant to Section 302 the Sarbanes-Oxley Act of 2002. SB/RH Holdings, LLC * | |
Exhibit 32.1 | Certification of Chief Executive Officer pursuant to 18 U.S.C. Section 1350, as adopted pursuant to Section 906 of the Sarbanes-Oxley Act of 2002. Spectrum Brands Holdings, Inc.* | |
Exhibit 32.2 | Certification of the Chief Financial Officer pursuant to 18 U.S.C. Section 1350, as adopted pursuant to Section 906 of the Sarbanes-Oxley Act of 2002. Spectrum Brands Holdings, Inc.* | |
Exhibit 32.3 | Certification of Chief Executive Officer pursuant to 18 U.S.C. Section 1350, as adopted pursuant to Section 906 of the Sarbanes-Oxley Act of 2002. SB/RH Holdings, LLC * | |
Exhibit 32.4 | Certification of the Chief Financial Officer pursuant to 18 U.S.C. Section 1350, as adopted pursuant to Section 906 of the Sarbanes-Oxley Act of 2002. SB/RH Holdings, LLC * | |
_____________________________
* Filed herewith
** In accordance with Regulation S-T, the XBRL-related information in Exhibit 101 to this Annual Report on Form 10-K shall be deemed to be furnished and not filed.
*** Filed herewith, with respect to Spectrum Brands Holdings, Inc. SB/RH Holdings, LLC meets the conditions set forth in General Instruction I(1)(a) and (b) of Form 10-K and has therefore omitted the list of subsidiaries exhibit otherwise required by Item 601 of Regulation S-K as allowed under General Instruction I(2)(b).
+ Denotes a management contract or compensatory plan or arrangement.
126