UNITED STATES
SECURITIES AND EXCHANGE COMMISSION
WASHINGTON, D.C. 20549
FORM 10-K
(Mark One)
|
| | | | | | | |
þ☒ | | ANNUAL REPORT PURSUANT TO SECTION 13 OR 15(d) OF THE SECURITIES EXCHANGE ACT OF 1934 |
For the fiscal year ended December 31, 20192022
OR
|
| | | | | | | |
o☐ | | TRANSITION REPORT PURSUANT TO SECTION 13 OR 15(d) OF THE SECURITIES EXCHANGE ACT OF 1934 |
For the transition period from ___________ to ___________.
Commission File Number: 001-34811
Ameresco, Inc.
(Exact name of registrant as specified in its charter)
|
| | | | | | | |
| Delaware | | 04-3512838 |
(State or Other Jurisdiction of
Incorporation or Organization)
| | (I.R.S. Employer
Identification No.)
|
111 Speen Street, Suite 410 Framingham, Massachusetts | | 01701 |
| (Address of Principal Executive Offices) | | (Zip Code) |
(508) 661-2200
(Registrant’s Telephone Number, Including Area Code)
Securities registered pursuant to Section 12(b) of the Act:
|
| | | | | | | |
| Title of each class | Trading Symbol | Name of each exchange on which registered |
Class A Common Stock, par value $0.0001 per share | AMRC | New York Stock Exchange |
Securities registered pursuant to Section 12(g) of the Act: None
Indicate by check mark if the registrant is a well-known seasoned issuer, as defined in Rule 405 of the Securities Act. Yes o☑ No þ☐
Indicate by check mark if the registrant is not required to file reports pursuant to Section 13 or Section 15(d) of the Act. Yes o☐ No þ☑
Indicate by check mark whether the registrant (1) has filed all reports required to be filed by Section 13 or 15(d) of the Securities Exchange Act of 1934 during the preceding 12 months (or for such shorter period that the registrant was required to file such reports) and (2) has been subject to such filing requirements for the past 90 days. Yes þ☑ No o☐
Indicate by check mark whether the registrant has submitted electronically every Interactive Data File required to be submitted pursuant to Rule 405 of Regulation S-T during the preceding 12 months (or for such shorter period that the registrant was required to submit and post such files). Yes þ☑ No o☐
Indicate by check mark if disclosure of delinquent filers pursuant to Item 405 of Regulation S-K is not contained herein, and will not be contained, to the best of registrant’s knowledge, in definitive proxy or information statements incorporated by reference in Part III of this Annual Report on Form 10-K or any amendment to this Annual Report on Form 10-K. o
Indicate by check mark whether the registrant is a large accelerated filer, an accelerated filer, a non-accelerated filer, a smaller reporting company, or an emerging growth company. See definitions of “large accelerated filer,” “accelerated filer,” “smaller reporting company,” and “emerging growth company” in Rule 12b-2 of the Exchange Act.
| | | | | | | | | | | | | | | | | | | | | | | |
| Large Accelerated Filer | ☑ | Accelerated Filer | ☐ | Non-accelerated filer | ☐ | Smaller reporting company | ☐ |
| Emerging growth company | ☐ | | | | | | |
Large Accelerated Filer o
| Accelerated Filer þ
| Non-accelerated filer o
| Smaller reporting company o
|
Emerging growth company o
| | | |
If an emerging growth company, indicate by check mark if the registrant has elected not to use the extended transition period for complying with any new or revised financial accounting standards provided pursuentpursuant to Section 13(a) of the Exchange Act. o | |
Indicate by check mark whether the registrant has filed a report on and attestation to its management’s assessment of the effectiveness of its internal control over financial reporting under Section 404(b) of the Sarbanes-Oxley Act (15 U.S.C. 7262(b)) by the registered public accounting firm that prepared or issued its audit report. ☑
Indicate by check mark whether the registrant is a shell company (as defined in Rule 12b-2 of the Act). Yes o☐ No þ☑
If securities are registered pursuant to Section 12(b) of the Act, indicate by check mark whether the financial statements of the registrant included in the filing reflect the correction of an error to previously issued financial statements. Yes ☐ No ☑
Indicate by check mark whether any of those error corrections are restatements that required a recovery analysis of incentive-based compensation received by any of the registrant’s executive officers during the relevant recovery period pursuant to § 240.10D-1(b). Yes ☐ No ☑
The aggregate market value of the voting and non-voting common equity held by non-affiliates computed by reference to the price at which the common equity was last sold on the New York Stock Exchange on June 28, 2019,30, 2022, the last business day of the registrant’s most recently completed second fiscal quarter, was $322,112,989.$1,447,717,111.
Indicate the number of shares outstanding of each of the registrant’s classes of common stock as of the latest practicable date.
|
| | | | |
| Class | Shares outstanding as of March 2, 2020February 24, 2023 |
| Class A Common Stock, $0.0001 par value per share | 29,380,39533,948,362 |
| Class B Common Stock, $0.0001 par value per share | 18,000,000 |
DOCUMENTS INCORPORATED BY REFERENCE
Portions of the definitive proxy statement for our 20202023 annual meeting of stockholders are incorporated by reference into Part III.
AMERESCO, INC.
TABLE OF CONTENTS
NOTE ABOUT FORWARD LOOKINGFORWARD-LOOKING STATEMENTS
This Annual Report on Form 10-K (”Form 10-K” or “Report”) contains “forward-looking statements” within the meaning of Section 21E of the Securities Exchange Act of 1934, as amended (“the Exchange Act”). All statements, other than statements of historical fact, including statements regarding our strategy, future operations, future financial position, future revenues, projected costs, prospects, plans, objectives of management, expected market growth and other characterizations of future events or circumstances are forward-looking statements. These statements are often, but not exclusively, identified by the use of words such as “may,” “will,” “expect,” “believe,” “anticipate,” “intend,” “could,” “estimate,” “target,” “project,” “predict” or “continue,” and similar expressions or variations. These forward-looking statements include, among other things, statements about:
•our expectations as to the future growth of our business and associated expenses;expenses,
•our expectations as to revenue generation;generation,
•the future availability of borrowings under our revolving credit facility;facility,
•the expected future growth of the market for energy efficiency and renewable energy solutions;solutions,
•our backlog, awarded projects and recurring revenue and the timing of such matters;matters,
•our expectations as to acquisition activity;activity,
•the impact of any restructuring;restructuring,
•the uses of future earnings;earnings,
•our intention to repurchase shares of our Class A common stock;
•the expected energy and cost savings of our projects; andprojects,
•the expected energy production capacity of our renewable energy plants.plants,
•the impact of the ongoing macroeconomic challenges, including supply chain disruptions, and shortage of materials, and
•the impact of the U.S. Department of Commerce’s solar panel import investigation
•the impact of regulation, including the IRA
These forward-looking statements are based on current expectations and assumptions that are subject to risks, uncertainties, and other factors that could cause actual results and the timing of certain events to differ materially and adversely from the future results expressed or implied by such forward-looking statements. Risks, uncertainties, and factors that could cause or contribute to such differences include, but are not limited to, those discussed in the section titled “Risk Factors,” set forth in Item 1A of this Annual Report on Form 10-K and elsewhere in this report.Report. The forward-looking statements in this Annual Report on Form 10-K represent our views as of the date of this Annual Report on Form 10-K.Report. Subsequent events and developments may cause our views to change. However, while we may elect to update these forward-looking statements at some point in the future, we have no current intention of doing so and undertake no obligation to do so except to the extent required by applicable law. You should, therefore, not rely on these forward-looking statements as representing our views as of any date subsequent to the date of this Annual Report on Form 10-K.
ADDITIONAL NOTES
The terms “Ameresco,” “Company,” “we,” “our,” “us,” or “ourselves” included in this Report mean Ameresco, Inc. and its consolidated subsidiaries, collectively.
Rounding adjustments applied to individual numbers and percentages shown in this Report may result in these figures differing immaterially from their absolute values.
PART I
Item 1. Business
Company Overview
Founded in 2000, Ameresco Inc. is a leading independent provider ofclean technology integrator and renewable energy asset developer, owner, and operator. Our comprehensive energy services, includingportfolio includes energy efficiency, infrastructure upgrades, energy security and resilience, asset sustainability, and renewable energy solutions.
Our core offerings include the development, design, arrangement of financing, construction, and installation of solutions for businessesthat deliver measurable cost and organizations throughout North Americaenergy savings while enhancing the operations, energy security, infrastructure, and Europe. Ameresco’s sustainability services include capital and operationalresiliency of a facility. These solutions range from upgrades to a facility’s energy infrastructure andto the development, construction, ownership and operation of renewable energy plants. Ameresco has successfully completedAs a trusted sustainability partner, we are always on a mission to help customers lower their overall carbon footprint and reduce their environmental impact.
Our product independence coupled with our deep technical bench allows us to integrate best-in-class advanced technology solutions for the unique needs of each customer.
Drawing from decades of experience, we develop these tailored energy saving, environmentally responsible projects withfor federal, state, and local governments, educational and healthcare and educational institutions, airports, public housing authorities, commercial/industrial customers, transportation and commercialinfrastructure, and industrial customers. With its corporate headquarters in Framingham, MA, Ameresco has more than 1,100 employeesutilities across more than 70 offices providing local expertise in the United States, Canada, and the United Kingdom.Kingdom, and Europe.
StrategicWe have sourced and raised approximately $4.5 billion in project financing while delivering $13.0 billion in energy solutions since our inception. Our growth is driven by staying ahead of the curve and at the leading edge of innovation taking place in the energy sector, offering new products and services to new and existing customers.
In addition to organic growth, strategic acquisitions of complementary businesses and assets, haveand entering into joint venture arrangements has been, and continues to be an important part ofcomponent to our historical development. Since inception, we have completed numerous acquisitions, which have enabledgrowth strategy. These strategies enable us to broaden our service offerings and expand our geographical reach.
To best serve our expansive customer base, we have approximately 60 regional offices located throughout North America and the United Kingdom and more than 1,300 dedicated energy and business professionals with years of proven experience and a strong commitment to customer satisfaction. We offer our customers the resources needed to successfully plan, finance, execute and operate energy programs to create sustained economic and operating benefits to fulfill their unique requirements.
Our principalServices
Our portfolio of service isand product offerings aim to create value and provide energy efficient and renewable solutions to the organizations we serve in the pursuit of a sustainable future.
Energy Efficiency Measures & Upgrades
•Water management, efficiency and reclamation
•Renewable energy, storage & microgrids
•Heating, ventilation, cooling, building envelope
•Smart metering and controls
•Chillers and boilers
Renewable Energy, Storage & Microgrids
•Solar photovoltaic (“PV”)
•Combined heat and power (“CHP”) and co-generation plants
•Geothermal
•Renewable natural gas (“RNG”)
•Wind power
•Microgrid
•Battery storage
•EV charging infrastructure
•Hydrogen
Energy Infrastructure
•Smart building modernization and retrofits
•Design-build new construction
•Utilize a full range of technologies related to building systems, facility infrastructure, energy- and water-consuming systems
•Integrated project design and implementation
Energy Analytics & Supply
•Enterprise energy management services
•Proprietary asset management software
•Energy procurement services
Operations & Maintenance (“O&M”)
•End-to-end technical guidance
•Skilled technicians to operate and maintain renewable energy systems
Our core services are the development, design, engineering, and installation of projects thatdesigned to reduce the energy and operations and maintenance (“O&M”)&M costs of our customers’ facilities. These projects generally include a variety of measures that incorporate innovative technology and techniques, customized for the facility and designed to improve the efficiency of major building systems, such as heating, ventilation, cooling and lighting systems, while enhancing the comfort and usability of the buildings. Such measures may include a combination of the following: water reclamation, light-emitting diode (“LED”) lighting, smart metering, intelligent micro-grids, battery storage, combined heat and power (“CHP”) or the installation of renewable energy, such as solar photovoltaic (“PV”).
We also offer the ability to incorporate analytical tools thatdesigned to provide improved building energy management capabilities and enable customers to identify opportunities for energy cost savings. We typically commit to customers that our energy efficiency projects will satisfy agreed upon performance standards upon installation or achieve specified increases in energy efficiency. In most cases,Generally, the forecasted lifetime energy and operating cost savings of the energy efficiency measures we install willare designed to defray all or almost all of the cost of such measures. In many cases, we assist customers in obtaining private third-party financing, grants, or rebates for the cost of constructing the facility improvements, resulting in little or no upfront capital expenditure by the customer. After a project is complete, we may operate, maintain and repair the customer’s energy systems under a multi-year O&M contract, which providesdesigned to provide us with recurring revenue and visibility into the customer’s evolving needs.
We alsoIn addition, we serve certain customers by developing and building small-scale renewable energy plants located at or close to a customer’s site. Depending uponon the customer’s preference, we will either retain ownership of the completed plant or build it for the customer. Most of our small-scale renewable energy plants to date consist of solar PV installations and plants constructed adjacent to landfills, that use landfill gas (“LFG”) to generate energy. We have also designeddesign and built, as well asbuild, and own, operate and maintain plants that utilize biogas from wastewater treatment processes. Our largest renewable energy project that we operate for a customer uses biomass as the primary source of energy. In the case of most of the plants that we own, the electricity, thermal energy or processed renewable gas fuel generated by the plant is sold under a long-term supply contract with the customer, which is typically a utility, municipality, industrial facility or other purchaser of large amounts of energy. For information on how we finance the projects that we own and operate, please see the disclosures under Note 2, “Summary of Significant Accounting Policies”, Note 9, “Long-Term Debt”“Debt and Financing Lease Liabilities” and Note 11, “Investment Funds”“Variable Interest Entities and Equity Method Investments” to our Consolidated Financial Statements appearingconsolidated financial statements in Item 8 of this Annual Report on Form 10-K.Report.
As of December 31, 2019, we had backlog of approximately $1,107.6 million in expected future revenues under signed customer contracts for the installation or construction of projects, which we sometimes refer to as fully-contracted backlog. We also had been awarded projects for which we had not yet signed customer contracts, which we sometimes refer to as awarded projects, with estimated total future revenues of an additional $1,160.4 million. As of December 31, 2018, we had backlog of approximately $726.6 million in expected future revenues under signed customer contracts for the installation or construction of projects. We also had been awarded projects for which we had not yet signed customer contracts, with estimated total future revenues of an additional $1,241.4 million. As of December 31, 2017, we had backlog of approximately $572.5 million in expected future revenues under signed customer contracts for the installation or construction of projects. We also had been awarded projects for which we had not yet signed customer contracts with estimated total future revenues of an additional $1,199.0 million. The contracts reflected in our fully-contracted backlog typically have a construction period of 12 to 36 months and we typically expect to recognize revenue for such contracts over the same period. Where we have been awarded a project, but have not yet signed a customer contract for that project, we would not begin recognizing revenue unless and until a
customer contract has been signed and we treat the project as fully-contracted backlog. Recently, awarded projects typically have been taking 12 to 24 months from award to having a signed contract and thus convert to fully-contracted backlog. It may take longer, however, depending upon the size and complexity of the project. Generally, the larger and more complex the project, the longer it takes to take it from award to signed contract. Historically, approximately 90% of our awarded projects ultimately have resulted in a signed contract.
See “We may not recognize all revenues from our backlog or receive all payments anticipated under awarded projects and customer contracts” and “In order to secure contracts for new projects, we typically face a long and variable selling cycle that requires significant resource commitments and requires a long lead time before we realize revenues” in Item 1A, Risk Factors of this Annual Report on Form 10-K.
Revenues generated from backlog, which we refer to as project revenues, were $611.1 million, $545.1 million and $506.6 million for the twelve months ended December 31, 2019, 2018 and 2017, respectively.
We also expect to realize recurring revenues both from long-term O&M contracts and from energy output sales for renewable energy operating assets that we own. In addition, we expect to generate revenues from the sale of photovoltaic solar energy products and systems (“integrated-PV”) and other services, such as consulting services and enterprise energy management services. Information about revenues from these other service and product offerings may be found in Note 20, “Business Segment Information” of our Consolidated Financial Statements included in Item 8 of this Annual Report on Form 10-K, which information is incorporated herein by reference.
Ameresco’sOur Lines of Business
Smart Energy Solutions Projects
Our principal service isSmart Energy Solutions Projects are primarily energy efficiency projects, which entailsentail the design, engineering, and installation of and assisting with the arranging of financing for an ever-increasing array of innovative technologies and techniques designed to improve the energy efficiency and control the operation, of a building’s energy- and water- consumingwater-consuming systems. In certain projects, we also design and construct for a customer a central plant or cogeneration system providing power, heat and/or cooling to a building, or a small-scale plant that produces electricity, gas, heat or cooling from renewable sources of energy.energy for a customer, as well as battery energy storage. Our projects generally range in size and scope from a one-month project to design and retrofit a lighting system to a more complex 30-month36-month project to design and install a central plant or cogeneration system or other small-scale plant. Projects we have constructed or are currently working on include designing, engineering and installing energy conservation and resiliency measures across school buildings; buildings,
large, complex energy conservation, and energy security projects for the federal government;government, and municipal-scale street lighting projects incorporating smart-citysmart city controls.
O&M
After an energy efficiency or renewable energy project is completed, we often provide ongoing O&M services under a multi-year contract.contracts. These services offer end-to-end technical guidance and include operating, maintaining, and repairing facility energy systems, such as boilers, chillers, and building controls, as well as central power and other small-scale plants. For larger projects, we frequently maintain staff on-site to perform these services. In addition to providing O&M services for our own projects, we also provide similar services on projects we did not construct for various customers.
Ameresco-owned Energy Assets
Our service offering also includes the sale of electricity, processed renewable gas fuel, heat or cooling from the portfolio ofAmeresco-owned energy assets are small-scale power plants that we owndevelop, design, construct, finance and operate.own/operate and are included in our consolidated balance sheets. These assets may sell electricity, heat, cooling, processed biogas, or renewable biomethane fuel under short-or long-term contracts. We also offer Energy as a Service (“EaaS”), where we design, construct, finance and own/ operate various energy conservation measures on a customer’s site and sell them the output or availability of these items under a short-or long-term contract.
We have constructed and are currently developing, designing, and constructing a wide range of renewable energy plants using LFG,using:
•biogas (generated from landfills, wastewater treatment biogas, solar, plants, and the agricultural sector)
•advanced biofuels
•biomass and other bio-derived fuels
•solar PV
•wind and hydro sources of energy. energy
•battery storage
Most of our renewable energy projectsassets to date have involved the generation of and sale of:
•electricity from solar PV and LFG or battery storage
•electricity, thermal, renewable fuel, or biomethane using biogas as a feedstock
In the salecase of processed LFG. Weour biogas-fueled projects, we purchase the LFGbiogas that otherwise would be combusted or vented, process it, and either selluse it or use itas a renewable fuel source in our energy plants.plants to produce and sell electricity and/or thermal, or sell it as a renewable fuel source to a third party. We have also designeddesign and built, as well as own,build, and operate and maintain plantsfacilities that takeprocess biogas generated in the anaerobic digesters of wastewater treatment plants and turn it into biomethane (or renewable natural gas that is either used to generate energy on-site orgas) that can be soldtransported, primarily through the nation’s natural gas pipeline grid. Where we owngrid or in some cases through tanker trucks, and operate energy producing assets, we typically enter into a long-term power purchase agreement (“PPA”)sold to third parties. The rights to use the site for the saleplant and the purchase of raw feedstock fuel for the energy.plant are also obtained by us under long-term agreements with terms at least as long as the associated output supply agreement. Our supply agreements typically provide for fixed prices or prices that escalate at a fixed rate or vary based on a market benchmark. See “We may assume responsibility under customer contracts for factors outside our control, including, in connection with some customer projects, the risk that fuel prices will increase” in Item 1A, Risk Factors.
As of December 31, 2019,2022, we owned and operated 99162 small-scale renewable energy plants and solar PV installations. Of the owned plants, 23 are renewable LFG plants, 2 are wastewater biogas plants, and 74 are solar PV installations. The 99 small-
scale renewable energy plants andincluding solar PV installations that we own have the capacity towhich generate electricity or deliver renewable gas fuel producing an aggregatewith a combined capacity of more than 259approximately 389 megawatt equivalents.equivalents (“MWe”) and have energy assets in development and construction with a combined capacity of approximately 530 MWe, which includes 60 MWe attributable to a non-controlling interest.
The table below shows the type and number of plants we owned and operated as of December 31, 2022:
| | | | | |
| Plants Owned and Operated | Quantity |
| Biogas: RNG | 4 |
| Biogas: non-RNG | 22 |
| Solar and battery assets | 132 |
| Other | 4 |
| |
| Total plants owned and operated | 162 |
Other
Our serviceother lines of business include photovoltaic solar energy products and product offerings also include integrated-PV andsystems (“integrated-PV”), consulting, and enterprise energy management services.
Customer Arrangements
Energy Savings Performance Contracts (“ESPCs”)
For our energy efficiency projects, we typically enter into energy savings performance contracts (“ESPCs”),ESPCs, under which we agree to develop, design, engineer and construct a project for a customer and also commit that the project will satisfy agreed upon performance standards that vary from project to project. These performance commitments are typically based on the design, capacity, efficiency, or operation of the specific equipment and systems we install. Our commitments generally fall into three categories:
•Pre-agreed energy reduction commitment: our customer reviews the project design in advance and agrees that, upon or shortly after completion of the installation of the specified equipment comprising the project, the commitment will have been met.
•Equipment-level commitment: we commit to a level of energy use reduction based on the difference in use measured first with the existing equipment and then with the replacement equipment.
•Whole building-level commitment: requires demonstration of energy usage reduction for a whole building, often based on readings of the utility meter where usage is measured. Depending on the project, the measurement and demonstration may be required only once, upon installation, based on an analysis of one or more sample installations, or may be required to be repeated at agreed upon intervals generally over periods of up to 25 years. We often assist these customers in identifying and obtaining financing through rebate programs, grant programs, third-party lenders, and other sources.
Under our contracts, we typically do not take responsibility for a wide variety of factors outside of our control and exclude or adjust for such factors in commitment calculations. These factors include, among others, variations in energy prices and utility rates, weather, facility occupancy schedules, the amount of energy-using equipment in a facility, and the failure of the customer to operate or maintain the project properly. Typically, our performance commitments apply to the aggregate overall performance of a project rather than to individual energy efficiency measures. Therefore, to the extent an individual measure underperforms, it may be offset by other measures that overperform during the same period. In the event that an energy efficiency project does not perform according to the agreed upon specifications, our agreements typically allow us to satisfy our obligation by adjusting or modifying the installed equipment, installing additional measures to provide substitute energy savings or paying the customer for lost energy savings based on the assumed conditions specified in the agreement. Many of our equipment supply, local design, and installation subcontracts contain provisions that enable us to seek recourse against our vendors or subcontractors if there is a deficiency in our energy reduction commitment. See “We may have liability to our customers under our ESPCs if our projects fail to deliver the energy use reductions to which we are committed under the contract” in Item 1A, Risk Factors.
The projects that we perform for governmental agencies are governed by particular qualification and contracting regimes. Certain states require qualification with an appropriate state agency as a precondition to performing work or appearing as a qualified energy service provider for state, county, and local agencies within the state. For example, the Commonwealth of Massachusetts and the states of Colorado and Washington pre-qualify energy service providers and provide contract documents that serve as the starting point for negotiations with potential governmental clients.customers. Most of the work that we perform for the federal government is performed under indefinite delivery, indefinite quantityIndefinite Delivery, Indefinite Quantity (“IDIQ”) and Multiple Award Construction Contract agreements between government agencies and us or our subsidiaries.us. These IDIQ agreements allow us to contract with the relevant agencies to implement energy and infrastructure projects, but no work may be performed unless we and the agency agree on a task order or delivery order governing the provision of a specific project. The government agencies enter into contracts for specific projects on a competitive basis. We and our subsidiaries and affiliates are currently partyparties to an IDIQ agreement with the U.S. Department of Energy (“DOE”) expiring Aprilin 2026. We are also party to agreements with other federal agencies, including the U.S. Army Corps of Engineers, the Naval Facilities Engineering Command (NAVFAC) Mid-Atlantic, and the U.S. General Services Administration.
Payments by the federal government for energy efficiency measures are based on the services provided and the products installed but are limited to the savings derived from such measures, calculated in accordance with federal regulatory guidelines and the specific contract’s terms. The savings are typically determined by comparing energy use and other costs before and after the installation of the energy efficiency measures, adjusted for changes that affect energy use and other costs but are not caused by the energy efficiency measures.
Energy Supply Contracts
For the energy assets that we own and operate, we generally enter into (i) long-term power purchase agreements (“PPAs”) to supply electricity, (ii) long-term energy supply agreements (“ESAs”) to supply medium British Thermal Unit (“BTU”) biogas or thermal energy, (iii) gas purchase agreements (“GPAs”) to supply RNG, or (iv) EaaS contracts where we sell the output or availability of various energy conservation measures to third parties.
The third parties we enter into PPAs, ESAs, or EaaS contracts with include but are not limited to municipalities, the Federal government, commercial and industrial customers, or utilities. The third parties we sell RNG to include, but are not limited to, brokers, traders, utilities, municipalities, industrial facilities, or other large purchasers of energy.
Our Business Segments
Our company is primarily organized by region, where each region may perform our key services under our various lines of business. Our reportable business segments largely follow our regional segmentation. For the year ended December 31, 2022 our reportable business segments were as follows:
•U.S. Regions
•U.S. Federal
•Canada
•Alternative Fuels (formerly Non-Solar Distributed Generation)
•All Other
On January 1, 2022, we changed the structure of our internal organization and our “All Other” segment now includes our U.S.-based enterprise energy management services previously included in our U.S Regions segment and our U.S. Regions segment now includes U.S. project revenue and associated costs previously included in our former Non-Solar DG segment. As a result, previously reported amounts have been reclassified for comparative purposes.
Our U.S. Regions, U.S. Federal and Canada segments offer energy efficiency products and services which may be extended through December 2023.include the design, engineering, and installation of equipment and other measures to improve the efficiency and control the operation of a facility’s energy infrastructure, renewable energy solutions, and services and the development and construction of small-scale plants that we own or develop for customers that produce electricity, gas, heat, or cooling from renewable sources of energy and O&M services.
Our Alternative Fuels segment sells electricity and processed RNG derived from biomethane from small-scale plants that we own and operate, and provides O&M services for customer owned small-scale RNG plants.
The “All Other” category offers enterprise energy management services, consulting services, energy efficiency products and services outside of the U.S. and Canada, and the sale of solar PV energy products and systems which we refer to as integrated-PV.
The table below shows the percentage of revenues by segment for the last three years:
| | | | | | | | | | | | | | | | | |
| 2022 | | 2021 | | 2020 |
% of Revenues by Segment (1) | | | | | |
| U.S. Regions | 61.6 | % | | 45.3 | % | | 41.0 | % |
| U.S. Federal | 21.5 | % | | 32.3 | % | | 36.6 | % |
| Canada | 3.2 | % | | 4.1 | % | | 4.6 | % |
| Alternative Fuels | 6.3 | % | | 9.1 | % | | 8.1 | % |
| All Other | 7.4 | % | | 9.2 | % | | 9.7 | % |
| Total revenues | 100.0 | % | | 100.0 | % | | 100.0 | % |
| | | | | |
| (1) See Note 3 “Revenue from Contracts with Customers” for our disaggregated revenue and Note 20 “Business Segment Information” for additional information. |
Sales and Marketing
Our sales and marketing approach is to offer customers customized and comprehensive energy efficiency solutions tailored to meet their economic, operational, and technical needs. The sales, design and construction process for energy efficiency and renewable energy projects recently has been averaging from 18 to 54 months. We identify project opportunities through referrals, requests for proposals (“RFPs”), conferences and events, website, onlinedigital campaigns, telemarketing, and repeat business from existing customers. Our direct sales force develops and follows up on customer leads. As of December 31, 2019,2022, we had 135180 employees in direct sales.
In preparation for a proposal, our team typically conducts a preliminary audit of the customer’s needs and requirements and identifies areas to enhance efficiencies and reduce costs. We collect and analyze the customer’s utility bill and other data related
to energy use. If the bills are complex or numerous, we often utilize Ameresco’sour proprietary enterprise energy management software tools to scan, compile and analyze the information. Our experienced engineers visit and assess the customer’s current energy systems and infrastructure. Through our knowledge of the federal, state, and local governmental and utility environment,environments, we assess
the availability of energy, utility or environmental-based payments for usage reductions or renewable power generation, which helps us optimize the economic benefits of a proposed project for a customer. Once awarded a project, we perform a more detailed audit of the customer’s facilities, which serves as the basis for the final specifications of the project and final contract terms.
For renewable energy plants that are not built or located on a customer’s site or use sources of energy not within the customer’s control, the sales process also involves the identification of sites with attractive sources of renewable energy and obtaining necessary rights and governmental permits to develop a plant on that site. For example, for LFG projects, we start with gaining control of aan LFG resource located close to the prospective customer. For solar and wind projects, we look for sites where utilities are interested in purchasing renewable energy power at rates that are sufficient to make a project feasible. Where governmental agencies control the site and resource, such as a landfill owned by a municipality, the customer may be required to issue an RFP to use the site or resource. Once we believe we are likely to obtain the rights to the site and the resource, we seek customers for the energy output of the potential project, with whom we can enter into a long-term PPA.
Customers
We strive to be a trusted sustainability partner creating valued, single-sourced, efficient energy solutions delivered with passion, expertise, teamwork, and a relentless focus on customer satisfaction.
Our customers choose to prioritize efficiency and the development of clean, green energy sources and our solutions are customized to serve the specific needs of each customer and meaningfully reduce or offset their carbon footprint. From energy conservation through a variety of measures to the generation of green, renewable power, our customers and their communities reap the benefits of reducing energy consumption, costs, and associated carbon emissions.
In 2019,2022, we served customers throughout the United States, Canada, the United Kingdom (“U.K.”), and Greece. Historically, including for the years ended December 31, 2019, 2018 and 2017, approximately 75%Europe. Approximately 46.0% of our revenues have beenwere derived from federal, state, provincial, or local government entities, including public housing authorities, public universities, and public universities.municipal utilities. Our federal customers include various divisions of the U.S. federal government. The U.S. federal government which is considered a single customer and segment for reporting purposes constituted 33.2%, 31.3% and 32.0% of our consolidated revenues for the years ended December 31,2019, 2018 and 2017, respectively.(see table above under “Our Business Segments”). For the year ended December 31, 2019,2022, our largest 20 customers accounted for approximately 62.7%73.4% of our total revenues. Other than the U.S. federal government, no one customer represented more than 10%39.6% of our revenues during this period.
See “Provisions in our government contracts may harm our business, financial condition and operating results” in Item 1A, Risk Factors for a discussion of special considerations applicable to government contracting.contracting and “The loss of one of our significant customers or our failure to perform on our contract with that customer in accordance with its terms could adversely affect us” in Item 1A, Risk Factors for further discussion.
Competition
While we face significant competition from a large number of companies, we believe that few offer the objective technical expertise and full range of services that we provide.
do.
Our principal competitors for our core business includeinclude:
•Smart Energy Solutions: Constellation NewEnergy (andEnergy Group, Inc. (an Exelon Company)company), Energy Systems Group, Honeywell, Johnson Controls, NORESCO (a unit of Carrier Global Corporation), Schneider Electric, Siemens Building Technologies, and Trane.Trane Technologies (an Ingersoll-Rand company). We compete primarily on the basis of our comprehensive, independent offering of energy efficiency and renewable energy services and the breadth and depth of our expertise.
For•Energy Assets: In the LFG and RNG market our principal competitors primarily include large, national project developers and owners of landfills who self-develop projects using LFG from their own landfills, and other national renewable energy plants, wenatural gas developers/owners such as Archaea Energy, Montauk Renewables, Vanguard Renewables, Opal Fuels, and divisions of large multi-national oil and gas conglomerates. In the Solar PV and Battery Storage market our principal competitors include Borrego Solar Systems, BlueWave Solar, Citizens Energy Group, Nexamp Inc., SunPower Corp., Solect Energy, and Syncarpha Capital. We may also compete primarily with many large independent power producers and utilities, as well as a large number of smaller developers of renewable energy projects. In the LFG market,EaaS, our principal competitors include national project developersEngie, Enel X, Schneider Electric SE, and owners of landfills who self-develop projects using LFG from their landfills. In the solar PV market, our principal competitors are Borrego Solar, BlueWave Solar, Citizens Energy, Clean Energy Collective, Nexamp, SunPower Corp., Solect Energy, and Syncarpha Capital.Redaptive, Inc. We compete for renewable energy projects primarily on the basis of our experience, reputation, and ability to identify and complete high quality and cost-effective projects.
For •O&M services, our principal competitors areServices: EMCOR Group,Energy Services, Comfort Systems USA, Honeywell, Johnson Controls, and Veolia. In this area, we compete primarily on the basis of our expertise and quality of service.
See “We operate in a highly competitive industry, and our current or future competitors may be able to compete more effectively than we do, which could have a material adverse effect on our business, revenues, growth rates, and market share” in Item 1A, Risk Factors for further discussion of competition.
Regulatory
Various regulations affect the conduct of our business. Federal and state legislation and regulations enable us to enter into ESPCs with government agencies in the United States. The applicable regulatory requirements for ESPCs differ in each state and between agencies of the federal government.
We are also subject to local regulations in the international jurisdictions where we operate, including Canada, the United Kingdom, and Greece.
Our projects must conform to all applicable electric reliability, building and safety, and environmental regulations and codes, which vary from place to place and time to time. Various federal, state, provincial, and local permits are required to construct an energy efficiency project or renewable energy plant.
Renewable energy projects are also subject to specific governmental safety and economic regulation. States and the federal government typically do not regulate the transportation or sale of LFG unless it is combined with and distributed with natural gas, but this is not uniform among states and may change from time to time. States regulate the retail sale and distribution of natural gas to end-users, although regulatory exemptions from regulation are available in some states for limited gas delivery activities, such as sales only to a single customer. The sale and distribution of electricity at the retail level is subject to state and provincial regulation, and the sale and transmission of electricity at the wholesale level is subject to federal regulation. While we do not own or operate retail-level electric distribution systems or wholesale-level transmission systems, the prices for the products we offer can be affected by the tariffs, rules and regulations applicable to such systems, as well as the prices that the owners of such systems are able to charge. The construction of power generation projects typically is regulated at the state and provincial levels, and the operation of these projects also may be subject to state and provincial regulation as “utilities.” At the federal level, the ownership and operation of, and sale of power from, generation facilities may be subject to regulation under the Public Utility Holding Company Act of 2005 (“PUHCA”), the Federal Power Act (“FPA”), and Public Utility Regulatory Policies Act of 1978 (“PURPA”). However, because all of the plants that we have constructed and operated to date are small power “qualifying facilities” under PURPA, they are subject to less regulation under the FPA, PUHCA and related state utility laws than traditional utilities.
If we pursue projects employing different technologies or with a single project electrical capacity greater than 20 megawatts, we could become subject to some of the regulatory schemes which do not apply to our current projects. In addition, the state, provincial, and federal regulations that govern qualifying facilities and other power sellers frequently change, and the effect of these changes on our business cannot be predicted.
LFG power generation facilities require an air emissions permit, which may be difficult to obtain in certain jurisdictions. See “Compliance with environmental laws could adversely affect our operating results” in Item 1A, Risk Factors. Renewable energy projects may also be eligible for certain governmental or government-related incentives from time to time, including tax credits, cash payments in lieu of tax credits, and the ability to sell associated environmental attributes, including carbon credits. Government incentives and mandates typically vary by jurisdiction.
Some of the demand reduction services we provide for utilities and institutional clientscustomers are subject to regulatory tariffs imposed under federal and state utility laws. In addition, the operation of, and electrical interconnection for, our renewable energy projects are subject to federal, state, or provincial interconnection and federal reliability standards also set forth in utility tariffs. These tariffs specify rules, business practices, and economic terms to which we are subject. The tariffs are drafted by the utilities and approved by the utilities’ state, provincial, or federal regulatory commissions.
EmployeesSee our section entitled “Risks related to Regulations or Governmental Actions” in Item 1A, Risk Factors.
Human Capital Management
We believe our employees are Ameresco’s greatest resource, as they come together to creatively integrate our advanced technology portfolio and develop innovative, transformative energy solutions for our customers.
The diversity of our team coupled with our deep bench of technical expertise enables us to tackle the most complex energy opportunities. Supporting our employees and the communities in which we serve is paramount to our success.
We focus on team-based employee philanthropy, wellness-focused employee benefits, and donating our time to our local communities through education and training.
As of December 31, 2019,2022, we had a total of 1,1271,363 employees based in offices located in 3946 U.S. states, including the District of Columbia, foursix Canadian provinces, and four office locations throughout the U.K.United Kingdom
Philanthropic Activities
We actively participate in philanthropic activities that support our local communities and provide an opportunity for dynamic team building. During 2022, our employees were encouraged to use paid community service days to donate time and creative energy to the organizations that touch them personally and to give back to the environment and their communities. As a result, we experienced increased participation in both volunteer activities and employee match charitable giving.
Diversity, Equity, Inclusion and Justice
We welcome, support, and celebrate unique ways of thinking. We believe innovation demands diversity of thought, and Ameresco has done well by welcoming and celebrating employees from diverse backgrounds. We are proud to be an equal opportunity workplace and an Affirmative Action employer.
To educate, support, and promote the culture of diversity, equity, inclusion and justice at Ameresco, diversity in the workplace is discussed at all levels in the organization. Annual diversity in the workplace training is rolled out to all Ameresco employees. This comprehensive training is critical to ensuring we are focused on educating our teams and fostering a culture that is all-inclusive.
Recruiting is a key element in our commitment to diversity, equity, inclusion and justice. Our talent team focuses on attracting and recruiting a diverse workforce by partnering with organizations such as the National Society of Women in Construction, Browning The Green Space, New England Women in Energy and the Environment, Hire Heroes USA, and Dolce Center for Advancement of Veterans and Service Members.
During the year ended December 31, 2022, our global workforce is made up of 22% female, 77% male, and 1% not declared. In addition, 33% of our executive management team are female and 21% of our managers are female.
Benefits with a Purpose
The health, safety, and well-being of our employees continues to be a top priority at Ameresco. In addition to competitive salaries, we are committed to regularly evaluating a competitive benefits portfolio, striving to provide resources to our employees that assist with work-life balance.
While employee healthcare costs and access to a wide variety of doctors have always been at the top of our criteria list, we also continued to focus our 2022 benefit offerings on our mental health and well-being offerings. We wanted to ensure our employees have a variety of help and resources available, offered in platforms and services they felt comfortable using, should they need it.
In addition, we offered a comprehensive Employee Assistance Plan to all Ameresco employees and their family members should they need assistance with any life planning matters. And in support of some of the new applications and corporate programs, we rolled out memberships to Care.com, Gympass, and Headspace and Virgin Pulse mobile apps.
Energy Outside the Office
Whether it is through our philanthropic activities, our quest to provide an inclusive culture, or our focus on the well-being of our people, Ameresco benefits from the open communication seen between our employees. We encourage activities outside of our offices to enhance the employee experience.
Career Advancement
Ameresco strives to implement creative ways for our employees to support career advancement. To facilitate our employees’ career development with a focus on retention, we have improved on the frequency of career path discussions, training, and succession planning. To expand on the career training offered in 2021, we offered performance management training to employees and managers during 2022. The career path discussions identified specific training programs, mentorship opportunities, continued degree programs and certification programs – all of which will provide the tools necessary to assist our employees in their career development.
When it comes to the innovative solutions that we deliver to our customers, it is critical for the Ameresco team to be at the forefront. Every month our Corporate Marketing Team hosts a Center of Excellence in Advance Technology training session available to all employees. Each session features a different topic to cover various aspects of Ameresco’s solution portfolio and is presented by our internal subject matter experts. All employees are encouraged to attend live and participate in the Q&A.
In 2022, we continued to further integrate and invest in our Learning Management System (“LMS”) in our Workday Enterprise Management platform to centralize and have the capability to measure development metrics such as training hours per employee.
We provide a tuition reimbursement program to support career development within our organization. In addition, we support employee growth by investing in career advancing certification programs for our employees.
For more information on our initiatives noted above, please see our 2022 Environmental, Social and Governance Report which will be available at www.ameresco.com.
Seasonality
See “Our business is affected by seasonal trends and construction cycles, and these trends and cycles could have an adverse effect on our operating results” in Item 1A, Risk Factors and “Overview — Effects of Seasonality” in Item 7, Management’s Discussion and Analysis of Financial Condition and Results of Operations” for a discussion of seasonality in our business.
Segments and Geographic Information
Financial information about our domestic and international operations and about our segments may be found in Note 16, “Geographic Information” and 20, “Business Segment Information” respectively, of our Consolidated Financial Statementsconsolidated financial statements included in Item 8 of this Annual Report on Form 10-K, which information is incorporated herein by reference.
Additional Information
Ameresco was incorporated in Delaware in 2000 and is headquartered in Framingham, Massachusetts.
Periodic reports, proxy statements, and other information are available to the public, free of charge, on our website, www.ameresco.com, as soon as reasonably practicable after they have been filed with the Securities and Exchange Commission
(“SEC”), and through the SEC’s website, www.sec.gov. We include our website address in this report only as an inactive textual reference and do not intend it to be an active link to our website. None of the material on our website is part of this Annual Report on Form 10-K.Report.
Executive Officers
The following is a list of our executive officers, their ages as of March 1, 2020 and their principal positions.
|
| | | | | |
Name | | Age | | Position (s) |
George P. Sakellaris | | 73 |
| | Chairman of the Board of Directors, President and Chief Executive Officer |
David J. Anderson | | 59 |
| | Executive Vice President and Director |
Michael T. Bakas | | 51 |
| | Executive Vice President, Distributed Energy Systems |
Nicole A. Bulgarino | | 47 |
| | Executive Vice President and General Manager, Federal Solutions |
David J. Corrsin | | 61 |
| | Executive Vice President, General Counsel and Secretary and Director |
Louis P. Maltezos | | 53 |
| | Executive Vice President |
Spencer Doran Hole | | 51 |
| | Senior Vice President and Chief Financial Officer |
Mark A. Chiplock | | 50 |
| | Vice President of Finance and Chief Accounting Officer |
George P. Sakellaris: Mr. Sakellaris has served as chairman of our board of directors and our president and chief executive officer since founding Ameresco in 2000.
David J. Anderson: Mr. Anderson has served as our executive vice president as well as a director, since 2000 and oversees business development, government relations, strategic marketing and communications, as well as several U.S. business units and U.K. operations.
Michael T. Bakas: Mr. Bakas has served as our executive vice president, distributed energy systems, since November 2017. Mr. Bakas previously served as our senior vice president, renewable energy, from March 2010 to September 2017 and our vice president, renewable energy from 2000 to February 2010.
David J. Corrsin: Mr. Corrsin has served as our executive vice president, general counsel and secretary, as well as a director, since 2000.
Nicole A. Bulgarino: Ms. Bulgarino has served as our executive vice president and general manager of federal solutions since May 2017. Ms. Bulgarino previously served as our senior vice president and general manager of federal solutions from May 2015 to May 2017; vice president and general manager of federal solutions from February 2014 to May 2015; vice president, federal group operations from December 2012 to February 2014; director, implementation from May 2010 to December 2012; and senior engineer from June 2004 to May 2010.
Louis P. Maltezos: Mr. Maltezos has served as executive vice president since April 2009 and oversees Central and Northwest Regions and Canada operations. Mr. Maltezos has also served as the chief executive officer of Ameresco Canada since September 2015 and served as the president of Ameresco Canada from September 2014 to September 2015.
Spencer Doran Hole: Mr. Hole has served as our Senior Vice President and Chief Financial Officer since July 2019. Prior to joining Ameresco, Mr. Hole served as Chief Executive Officer, North America and Group Vice President - Strategy at ReneSola Ltd., a manufacturer and supplier of green energy products, since November 2017 and served as the Chief Financial Officer for the US division of ReneSola since December 2016. Prior to joining ReneSola, Mr. Hole was the founder of Coast to Coast Advisors, an independent financial consultancy practice, assisting investor, lender and developer clients with financing and asset sales. Mr. Hole also served as the Chief Financial Officer of Pristine Sun LLC, a small-scale solar developer, from November 2015 through April 2016, and as a Director at Deutsche Bank from April 2007 through October 2015.
Mark A. Chiplock: Mr. Chiplock has served as Vice President of Finance and Chief Accounting Officer since July 2019. Prior to that, Mr. Chiplock served as our Interim Chief Financial Officer and Treasurer from October 2018 through July 2019 and as our Corporate Controller from June 2014 to December 2019. Prior to Ameresco, he served as Vice President, Finance of GlassHouse Technologies, a data center infrastructure consulting firm, from June 2012 to May 2014.
Item 1A. Risk Factors
We face many risks. If any of the events or circumstances described below actually occur, we and our businesses, financial condition or results of operations could suffer, and the trading price of our Class A Common Stock could decline. Our business is subject to numerous risks. We caution you thatcurrent and potential investors should consider the following important factors, among others, could cause our actual results to differ materially from those expressed in forward-looking statements made by us or on our behalf in filings with the SEC, press releases, communications with investors and oral statements. Any or all of our forward-looking statements in this Annual Report on Form 10-K and in any other public statements we make may turn out to be wrong. They can be affected by inaccurate assumptions we might make or by known or unknown risks and uncertainties. Many factors mentioned in the discussion below will be important in determining future results. Consequently, no forward-looking statement can be guaranteed. Actual future results may differ materially from those anticipated in forward-looking statements. We undertake no obligationinformation contained under the heading “Cautionary Note Regarding Forward-Looking Statements” before deciding to update any forward-looking statements, whether as a result of new information, future events or otherwise, except to the extent required by applicable law. You should, however, consult any further disclosure we makeinvest in our reports filed with the SEC.securities.
Risks Related to Our Business
If demand for our energy efficiency and renewable energy solutions does not develop as we expect, our revenues will suffer, and our business will be harmed.
We believe, and our growth plans assume, that the market for energy efficiency and renewable energy solutions will continue to grow, that we will increase our penetration of this market and that our revenues from selling into this market will continue to increase over time. If our expectations as to the size of this market and our ability to sell our products and services in this market are not correct, our revenues will suffer, and our business will be harmed.
In order to secure contracts for new projects, we typically face a long and variable selling cycle that requires significant resource commitments and requires a long lead time before we realize revenues.
The sales design and construction processcycle for energy efficiency and renewable energy projects recently has been takingin general take from 18 to 5442 months, on average, with sales to federal government and housing authority customers tending to require the longest sales processes. Our sales cycle has been further lengthened as a result of macroeconomic conditions and we cannot predict the timeline for our selling cycle in the current conditions. Our existing and potential customers generally follow extended budgetingbudgeting and procurement processes, and sometimes must engage in regulatory approval processes related to our services. Our customers often use outside consultants and advisors, which contributes to a longer sales cycle. Most of our potential customers issue an RFP, as part of their consideration of alternatives for their proposed project. In preparation for responding to an RFP, we typically conduct a preliminary audit of the customer’s needs and the opportunity to reduce its energy costs. For projects involving a renewable energy plant that is not located on a customer’s site or that uses sources of energy not within the customer’s control, the sales process also involves the identification of sites with attractive sources of renewable energy, such as a landfill or a favorable site for solar PV, and it may involve obtaining necessary rights and governmental permits to develop a project on that site. If we are awarded a project, we then perform a more detailed audit of the customer’s facilities, which serves as the basis for the final specifications of the project. We then must negotiate and execute a contract with the customer. In addition, we or the customer typically need to obtain financing for the project.
This extended sales process requires the dedication of significant time by our sales and management personnel and our use of significant financial resources, with no certainty of success or recovery of our related expenses. A potential customer may go through the entire sales process and not accept our proposal. All of these factors can contribute to fluctuations in our quarterly financial performance and increase the likelihood that our operating results in a particular quarter will fall below investor expectations. These factors could also adversely affect our business, financial condition and operating results due to increased spending by us that is not offset by increased revenues.
We may not recognize all revenues from our backlog or receive all payments anticipated under awarded projects and customer contracts.
As of December 31, 20192022 and December 31, 2018,2021, we had backlog of approximately $1,107.6 million$1.0 billion and $726.6 million,$1.5 billion, respectively, in expected future revenues under signed customer contracts for the installation or construction of projects, which we sometimes refer to as fully-contracted backlog; and we also had been awarded projects for which we do not yet have signed customer contracts with estimated total future revenues of an additional $1,160.4 million$1.6 billion and $1,241.4 million, respectively .$1.5 billion, respectively. As of December 31, 2022 and 2021, we had O&M backlog of approximately $1.2 billion and $1.1 billion, respectively. Our O&M backlog represents expected future revenues under signed multi-year customer contracts for the delivery of O&M services, primarily for energy efficiency and renewable energy construction projects completed by us for our customers.
Our customers have the right under some circumstances to terminate contracts or defer the timing of our services and their payments to us. In addition, our government contracts are subject to the risks described below under “Provisions in government contracts may harm our business, financial condition and operating results.” The payment estimates for projects that have been awarded to us but for which we have not yet signed contracts have been prepared by management and are based upon a number
of assumptions, including that the size and scope of the awarded projects will not change prior to the signing of customer contracts, that we or our customers will be able to obtain any necessary third-party financing for the awarded projects, and that we and our customers will reach agreement on and execute contracts for the awarded projects. We are not always able to enter into a contract for an awarded project on the terms proposed. As a result, we may not receive all of the revenues that we include in the awarded projects component of our backlog or that we estimate we will receive under awarded projects. If we do not receive all of the revenue we currently expect to receive, our future operating results will be adversely affected. In addition, a delay in the receipt of
revenues, even if such revenues are eventually received, may cause our operating results for a particular quarter to fall below our expectations.
Our business depends in partIf we are not able to complete, perform or operate our projects on federal, state, provinciala profitable basis or as we have committed to our customers, we could become subject to liquidated damages, and local government support for energy efficiencyour reputation and renewable energy,our results of operations could be adversely impacted.
Development, installation, and a decline in such support could harmconstruction of our business.
We depend in part on legislation and government policies that support energy efficiency and renewable energy projects, that enhance the economic feasibilityand operation of our energy efficiency services and small-scale renewable energy projects. Thisprojects, entails many risks, including:
•failure or delays in receiving components and equipment that meet our requirements,
•failure or delays in obtaining all necessary rights to land access and use,
•failure or delays in receiving quality performance of contractors and other third-party service providers,
•increases (including as a result of inflation) in the cost of labor, equipment, and commodities needed to construct or operate projects,
•failure or delays in obtaining permitting and addressing other regulatory issues, license revocation, and changes in legal requirements,
•failure or delays in obtaining other governmental support includes legislationor approvals, or in overcoming objections from members of the public or adjoining land owners;
•shortages of equipment or skilled labor,
•unforeseen engineering problems,
•failure of a customer to accept or pay for renewable energy that we supply,
•weather interferences, catastrophic events including fires, explosions, earthquakes, droughts, and regulations that authorizeacts of terrorism; and regulateaccidents involving personal injury or the manner in which certain governmental entities do business with us; encourageloss of life,
•environmental, archaeological or subsidize governmental procurementgeological conditions
•health or similar issues, a pandemic, or epidemic, such as COVID-19,
•labor disputes and work stoppages,
•mishandling of hazardous substances and waste, and other events outside of our services; encouragecontrol.
Any of these factors could give rise to construction delays, costs in excess of our expectations or cause us not to meet commitments given to our customers. We have, for example, experienced disruptions in some casesdevelopment, installation and construction as a result of supply chain and logistics challenges, COVID-19 and the related quarantines, facility closures, and we may continue to experience such disruptions. In addition, the impacts of climate change have caused us to experience more frequent and severe weather interferences which has impacted our construction timelines, and this trend may continue. Furthermore, while the passage of the Inflation Reduction Act (“IRA”) may increase the demand for our service and project offerings, it may also increase demand and cost for labor, equipment and commodities needed for our projects. These factors and events could prevent us from completing construction of our projects, cause defaults under our financing agreements or under contracts that require other customerscompletion of project construction by a certain time, give rise to procure power from renewableliquidated damages or low-emission sources,penalties, cause projects to reduce their electricity usebe unprofitable for us, or otherwise to procure our services; and provide us with tax and other incentives that reduce our costs or increase our revenues. Without this support, on which projects frequently rely for economic feasibility, our ability to complete projects for existing customers and obtain project commitments from new customers could be adversely affected.
A substantial portion of our earnings are derived from the sale of renewable energy certificates (“RECs”) and other environmental attributes, and our failure to be able to sell such attributes could materially adversely affectimpair our business, financial condition, and resultsoperating results.
For example, our Turnkey Engineering, Procurement, Construction and Maintenance Agreement and the underlying purchase orders dated as of operation.
AOctober 21, 2021 (the “SCE Agreement”) with SCE obligated us to achieve certain substantial portioncompletion milestone dates for the facilities no later than August 1, 2022, and for at least two years thereafter meet specified availability and capacity guarantees. In 2022, SCE instructed us to adjust the project schedule into 2023. As previously disclosed, we made force majeure claims under the SCE Agreement as battery supply delays resulting from COVID-19 lockdowns in several regions around China, newly implemented Chinese transportation safety policies and related supply chain delays impacted our ability to achieve the August 1, 2022 completion date. We are in ongoing discussions with SCE about the applicability of our earnings are attributableforce majeure relief to our salethe project delays. If we fail to satisfy certain milestone obligations, fail to come to an agreement with SCE of renewable energy certificates (“RECs”) and other environmental attributes generated by our energy assets. These attributes are used as compliance purposes for state-specific or U.S. federal policy.
We own and operate solar PV installations which derive a significant portion of their revenues from the sale of solar renewable energy certificates (“SRECs”), which are produced as a result of generating electricity. The valueappropriate extensions of these SRECs is determined bymilestones and force majeure relief, or fail to meet the supplyavailability and demand of SRECs in the states in which the solar PV installations are installed. Supply is driven by the amount of installations and demand is driven by state-specific laws relating to renewable portfolio standards.
We also own and operate renewable natural gas plants that may deliver biofuels into to the nation’s natural gas pipeline grid. Such biofuel may qualify for certain environmental attribute mechanisms, such as renewable identification numbers (“RINs”) which are used for compliance purposes under the Renewable Fuel Standard (“RFS”) program. The RFS is a U.S. federal policy that requires transportation fuel to contain a minimum volume of renewable fuel. The U.S. Environmental Protection Agency (“EPA”) administers the RFS program and may periodically undertake regulatory action involving the RFS, including annual volume standards for renewable fuel.
We sometimes seek to sell forward a portion of our SRECs and other environmental attributes under contracts to fix the revenues from those attributes for financing purposes or hedge against future declines in prices of such environmental attributes. If our renewable energy facilities do not generate the amount of renewable energy attributes sold under such forward contracts or if for any reason the renewable energy we generate does not produce SRECs or other environmental attributes for a particular state,capacity guarantees, we may be requiredsubject to make upliquidated damages and under certain circumstances SCE may have a right to terminate the shortfallagreement.The requirement to pay liquidated damages or the loss of SRECs or other environmental attributes under such forward contracts through purchases on the open market or make payments of liquidated damages.
RECs are created through state law requirements for utilities to purchase a portion of their energybusiness from renewable energy sources and changes in state laws or regulation relating to RECs may adversely affect the availability of RECs or other environmental attributes and the future prices for RECs or other environmental attributes, whichSCE could have ana material adverse effect on our reputation, business financial condition andor results of operations.
A significant decline in the fiscal health of federal, state, provincial, and local governments could reduce demand for our energy efficiency and renewable energy projects.
Historically, including for the years ended December 31, 20192022 and 2018, more than 75%2021, 46% and 67%, respectively, of our revenues have been derived from sales to federal, state, provincial, or local governmental entities, including public housing authorities, public universities, and public universities.municipal utilities. We expect revenues from this market sector to continue to comprise a significant percentage of our revenues for the foreseeable future. A significant decline in the fiscal health of these existing and potential customers may make it difficult for them to enter into contracts for our services or to obtain financing necessary to fund such contracts, or may
cause them to seek to renegotiate or terminate existing agreements with us. In addition, if there is a partial or full shutdown of any federal, state, provincial or local governing body this may adversely impact our financial performance.
Provisions in our government contracts may harm our business, financial condition and operating results.
A significant majority of our fully-contracted backlog and awarded projects is attributable to customers that are governmental entities. Our contracts with the federal government and its agencies, and with state, provincial, and local governments, customarily contain provisions that give the government substantial rights and remedies, many of which are not typically found in commercial contracts, including provisions that allow the government to:
•terminate existing contracts, in whole or in part, for any reason or no reason;reason,
•reduce or modify contracts or subcontracts;subcontracts,
•decline to award future contracts if actual or apparent organizational conflicts of interest are discovered, or to impose organizational conflict mitigation measures as a condition of eligibility for an award;award,
•suspend or debar the contractor from doing business with the government or a specific government agency;agency, and
•pursue criminal or civil remedies under the False Claims Act, False Statements Act, and similar remedy provisions unique to government contracting.
Under general principles of government contracting law, if the government terminates a contract for convenience, the terminated company may recover only its incurred or committed costs, settlement expenses, and profit on work completed prior to the termination. If the government terminates a contract for default, the defaulting company is entitled to recover costs incurred and associated profits on accepted items only and may be liable for excess costs incurred by the government in procuring undelivered items from another source. In most of our contracts with the federal government, the government has agreed to make a payment to us in the event that it terminates the agreement early. The termination payment is designed to compensate us for the cost of construction plus financing costs and profit on the work completed.
In ESPCs for governmental entities, the methodologies for computing energy savings may be less favorable than for non-governmental customers and may be modified during the contract period. We may be liable for price reductions if the projected savings cannot be substantiated.
In addition to the right of the federal government to terminate its contracts with us, federal government contracts are conditioned upon the continuing approval by Congress of the necessary spending to honor such contracts. Congress often appropriates funds for a program on a September 30 fiscal-year basis even though contract performance may take more than one year. Consequently, at the beginning of many major Governmental programs, contracts often may not be fully funded, and additional monies are then committed to the contract only if, as and when appropriations are made by Congress for future fiscal years. Similar practices are likely to also affect the availability of funding for our contracts with Canadian, as well as state, provincial, and local government entities. If one or more of our government contracts were terminated or reduced, or if appropriations for the funding of one or more of our contracts is delayed or terminated, our business, financial condition and operating results could be adversely affected.
Our senior credit facility, project financing term loans and construction loans contain financial and operating restrictions that may limit our business activities and our access to credit.
Provisions in our senior credit facility, project financing term loans and construction loans impose customary restrictions on our and certain of our subsidiaries’ business activities and uses of cash and other collateral. These agreements also contain other customary covenants, including covenants that require us to meet specified financial ratios and financial tests.
We have a $115 million revolving senior secured credit facility that matures June 2024, subject to the quarter end ratio covenant described below. This facility may not be sufficient to meet our needs as our business grows, and we may be unable to extend or replace it on acceptable terms, or at all. Under the revolving credit facility we are required to maintain a maximum ratio of total funded debt to EBITDA (as defined in the agreement) of less than 3.25 to 1.0. We are also required to maintain a
debt service coverage ratio (as defined in the agreement) of at least 1.5 to 1.0. EBITDA for purposes of the facility excludes the results of certain renewable energy projects that we own and for which financing from others remains outstanding.
In addition, our project financing term loans and construction loans require us to comply with a variety of financial and operational covenants.
Although we do not consider it likely that we will fail to comply with any material covenants for the next twelve months, we cannot assure that we will be able to do so. Our failure to comply with these covenants may result in the declaration of an event of default and cause us to be unable to borrow under our credit facility. In addition to preventing additional borrowings under this facility, an event of default, if not cured or waived, may result in the acceleration of the maturity of indebtedness outstanding under it or the applicable project financing term loan, which would require us to pay all amounts outstanding. If an event of default occurs, we may not be able to cure it within any applicable cure period, if at all. Certain of our debt agreements also contain subjective acceleration clauses based on a lender deeming that a “material adverse change” in our business has occurred. If these clauses are implicated, and the lender declares that an event of default has occurred, the outstanding indebtedness would likely be immediately due and owing. If the maturity of our indebtedness is accelerated, we may not have sufficient funds available for repayment or we may not have the ability to borrow or obtain sufficient funds to replace the accelerated indebtedness on terms acceptable to us or at all.
The LIBOR calculation method may change and LIBOR is expected to be phased out after 2021.
Our senior credit facility and certain of our project financing term loans permit or require interest on the outstanding principal balance to be calculated based on LIBOR. On July 27, 2017, the U.K. Financial Conduct Authority (the "FCA") announced that it will no longer require banks to submit rates for the calculation of LIBOR after 2021. In the meantime, actions by the FCA, other regulators, or law enforcement agencies may result in changes to the method by which LIBOR is calculated. At this time, it is not possible to predict the effect of any such changes or any other reforms to LIBOR that may be enacted in the U.K. or elsewhere.
The projects we undertake for our customers generally require significant capital, which our customers or we may finance through third parties, and such financing may not be available to our customers or to us on favorable terms, if at all.
Our projects for customers are typically financed by third parties. For small-scale renewable energy plants that we own, as well as certain larger projects for customers, such as the battery storage project with SCE, we typically rely on a combination of our working capital and debt to finance construction costs. If we or our customers are unable to raise funds on acceptable terms when needed or if we do not have sufficient working capital or availability under our existing financing arrangements, we may be unable to secure customer contracts, the size of contracts we do obtain may be smaller or we could be required to delay the development and construction of projects, reduce the scope of those projects or otherwise restrict our operations. AnyDelays in customer projects could also subject us to claims by customers. Furthermore, the terms of financing arrangements that we may enter into, including increases in interest rates as compared to historical rates, have in the past and could in the future impact the profitability of our projects. In addition, any inability by us or our customers to raise the funds necessary to finance our projects or construction costs could materially harm our business, financial condition, and operating results.
Project development or construction activities may not be successful, and we mayrequire us to make significant investments without first obtaining project financing or having final customer contracts, which could increase our costs and impair our ability to recover our investments.
The development and construction of small-scale renewable energy plants and other energy infrastructure projects involve numerous risks. We may beare at times required to spend significant sums for preliminary engineering, permitting, legal and other expenses before we can determine whether a projectproject is feasible, economically attractive, or capable of being built. In addition, weWe will often choose to bear the costs of such efforts prior to obtaining project financing, prior to getting final regulatory approval and prior to our final sale to a customer, if any.
Successful completion of a particular project We have for example in the past commenced, and may be adversely affected by numerous factors, including: failures or delays in obtaining desired or necessary land rights, including ownership, leases and/or easements; failures or delays in obtaining necessary permits, licenses or other governmental support or approvals, or in overcoming objections from members of the public or adjoining land owners; uncertainties relating to land costs for projects; unforeseen engineering problems; access to available transmission for electricity generated by our small-scale renewable energy plants; construction delays and contractor performance shortfalls; work stoppages or labor disruptions and compliance with labor regulations; cost over-runs; availability of products and components from suppliers; adverse weather conditions; environmental, archaeological and geological conditions; and availability of construction and permanent financing.
If we are unable to complete thefuture commence, development of a small-scale renewable energy plants or failcertain projects, such as battery and solar projects, prior to meet one or more agreed target construction milestone dates, we may be subject to liquidated damages and/or penalties underhaving entered into final binding contracts with the Engineering Procurement and Construction agreement or other agreements relating to the power plant or project, and we typically will not be able to recover our investment in the project. customer.
We expect to invest a significant amount of capital to develop projects whether
owned by us or by third parties. If we are unable to complete the development of a project or enter into contracts with the customer, we may write-down or write-off some or all of
these capitalized investments, which would have an adverse impact on our net income in the period in which the loss is recognized.recognized and could have an adverse impact our ability to finance our operations.
We are exposed to the credit risk of some of our customers.
Most of our revenues are derived under multi-year or long-term contracts with our customers, and our revenues are therefore dependent to a large extent on the creditworthiness of our customers. During periods of economic downturn, our exposure to credit risks from our customers’ increases, and our efforts to monitor and mitigate the associated risks may not be effective in reducing our credit risks. Our reliance on one or a few customers for a material portion of our revenue further exacerbates this risk. In the event of non-payment by one or more of our customers, our business, financial condition and operating results could be adversely affected.
Our business is affected by seasonal trends and construction cycles, and these trends and cycles could have an adverse effect on our operating results.
We are subject to seasonal fluctuations and construction cycles, particularly in climates that experience colder weather during the winter months, such as the northern United States and Canada, and climates that experience extreme weather events, such as wildfires, storms, or flooding, or at educational institutions, where large projects are typically carried out during summer months when their facilities are unoccupied. In addition, government customers, many of which have fiscal years that do not coincide with ours, typically follow annual procurement cycles and appropriate funds on a fiscal-year basis even though contract performance may take more than one year. Further, government contracting cycles can be affected by the timing of, and delays in, the legislative process related to government programs and incentives that help drive demand for energy efficiency and renewable energy projects. As a result, our revenues and operating income in the third and fourth quarter are typically higher, and our revenues and operating income in the first quarter are typically lower, than in other quarters of the year. As a result of such fluctuations, we may occasionally experience declines in revenue or earnings as compared to the immediately preceding quarter, and comparisons of our operating results on a period-to-period basis may not be meaningful.
We may have exposure to additional tax liabilities and our effective tax rate may increase or fluctuate, which could increase our income tax expense and reduce our net income.
Our provision for income taxes is subject to volatility and could be adversely affected by changes in tax laws or regulations, particularly changes in tax incentives in support of energy efficiency. For example, certain deductions relating to energy efficiency have expiration dates which could significantly alter the existing tax code, including the removal of these credits prior to their scheduled expiration. The 30% investment tax credit (“ITC”) relating to the installation of solar power expired on December 31, 2019, after which it will fall to 26 percent in 2020, 22 percent in 2021, and 10 percent in 2022 and future years. If these or other deductions and credits expire without being extended, or otherwise are reduced or eliminated, our effective tax rate would increase, which could increase our income tax expense and reduce our net income.
Our tax rate has historically been significantly impacted by the IRC Section 179D deduction. This deduction is related to energy efficient improvements we provide under government contracts. Section 179D was extended through December 31, 2020 as part of the Tax Extender and Disaster Relief Act of 2019 which became law on December 20, 2019. There is no assurance that Section 179D will continue to be extended retroactively or otherwise and were the deduction not available it would significantly affect our tax rate.
In addition, like other companies, we may be subject to examination of our income tax returns by the U.S. Internal Revenue Service and other tax authorities; our U.S. federal tax returns for 2015 through 2018 are subject to audit by federal, state and foreign tax authorities. Though we regularly assess the likelihood of adverse outcomes from such examinations and the adequacy of our provision for income taxes, there can be no assurance that such provision is sufficient and that a determination by a tax authority will not have an adverse effect on our net income.
Changes in the laws and regulations governing the public procurement of ESPCs could have a material impact on our business.
We derive a significant amount of our revenue from ESPCs with our government customers. While federal, state and local government rules governing such contracts vary, such rules may, for example, permit the funding of such projects through long-term financing arrangements; permit long-term payback periods from the savings realized through such contracts; allow units of government to exclude debt related to such projects from the calculation of their statutory debt limitation; allow for award of contracts on a “best value” instead of “lowest cost” basis; and allow for the use of sole source providers. To the extent these rules become more restrictive in the future, our business could be harmed.
Failure of third parties to manufacture quality products or provide reliable services in a timely manner or at prices that are acceptable to us could cause delays in the delivery of our services and completion of our projects, which could damage our reputation, have a negative impact on our relationships with our customers and adversely affect our growth.
Our success depends on our ability to provide services and complete projects in a timely manner, which in part depends on the ability of third parties to provide us with timely and reliable products and services.services at acceptable prices. In providing our services and completing
our projects, we rely on products that meet our design specifications and components manufactured and supplied by third parties, as well as on services performed by subcontractors.Wesubcontractors. We also rely on subcontractors to perform substantially all of the construction and installation work related to our projects; and we often need to engage subcontractors with whom we have no experience for our projects. We, our subcontractors and other third parties have been impacted by the global supply chain delays as well as restrictions imposed because of the COVID-19 pandemic. This has resulted in and may continue to result in delays in our ability to provide our services and complete our projects in a timely manner. In addition, some of the third parties we engage for our design, construction and operation projects operate internationally and our reliance on their products and services may be impacted by economic, political, and labor conditions in those regions as well as the uncertainty caused by the evolving relations between the United States and these regions, including China.
If any of our subcontractors are unable to provide services that meet or exceed our customers’ expectations or satisfy our contractual commitments, our reputation, business and operating results could be harmed. In addition, if we are unable to avail ourselves of warranty and other contractual protections with providers of products and services, we may incur liability to our customers or additional costs related to the affected products and components, which could have a material adverse effect on our business, financial condition, and operating results. Moreover, any delays, malfunctions, inefficiencies, or interruptions in these products or services could adversely affect the quality and performance of our solutions and require considerable expense to establish alternate sources for such products and services. This could cause us to experience difficulty retaining current customers and attracting new customers, and could harm our brand, reputation, growth, and growth.operating results.
We may have liability to our customers underunder our ESPCs if our projects fail to deliver the energy use reductions to which we are committed under the contract.
For our energy efficiency projects, we typically enter into ESPCs under which we commit that the projects will satisfy agreed-upon performance standards appropriate to the project. These commitments are typically structured as guarantees of increased energy efficiency that are based on the design, capacity, efficiency, or operation of the specific equipment and systems we install. Our commitments generally fall into three categories: pre-agreed, equipment-level and whole building-level. Under a pre-agreed efficiency commitment, our customer reviews the project design in advance and agrees that, upon or shortly after completion of installation of the specified equipment comprising the project, the pre-agreed increase in energy efficiency will have been met. Under an equipment-level commitment, we commit to a level of increased energy efficiency based on the difference in use measured first with the existing equipment and then with the replacement equipment upon completion of installation. A whole
building-level commitment requires future measurement and verification of increased energy efficiency for a whole building, often based on readings of the utility meter where usage is measured. Depending on the project, the measurement and verification may be required only once, upon installation, based on an analysis of one or more sample installations, or may be required to be repeated at agreed upon intervals generally over periods of up to 25 years.
Under our contracts, we typically do not take responsibility for a wide variety of factors outside our control and exclude or adjust for such factors in commitment calculations. These factors include variations in energy prices and utility rates, weather, facility occupancy schedules, the amount of energy-using equipment in a facility, and failure of the customer to operate or maintain the project properly. We rely in part on warranties from our equipment suppliers and subcontractors to back-stop the warranties we provide to our customers and, where appropriate, pass on the warranties to our customers. However, the warranties we provide to our customers are sometimes broader in scope or longer in duration than the corresponding warranties we receive from our suppliers and subcontractors, and we bear the risk for any differences, as well as the risk of warranty default by our suppliers and subcontractors.
Typically, our performance commitments apply to the aggregate overall performance of a project rather than to individual energy efficiency measures. Therefore, to the extent an individual measure underperforms, it may be offset by other measures that overperform during the same period. In the event that an energy efficiency project does not perform according to the agreed-upon specifications, our agreements typically allow us to satisfy our obligation by adjusting or modifying the installed equipment, installing additional measures to provide substitute energy savings, or paying the customer for lost energy savings based on the assumed conditions specified in the agreement. However, we may incur additional or increased liabilities or expenses under our ESPCs in the future. Such liabilities or expenses could be substantial, and they could materially harm our business, financial condition, or operating results. In addition, any disputes with a customer over the extent to which we bear responsibility to improve performance or make payments to the customer may diminish our prospects for future business from that customer or damage our reputation in the marketplace.
We may assume responsibility under customer contracts for factors outside our control, including, in connection with some customer projects, the risk that fuel prices will increase.
We typically do not take responsibility under our contracts for a wide variety of factors outside our control. We have, however, in a limited number of contracts assumed some level of risk and responsibility for certain factors — sometimes only to the extent that variations exceed specified thresholds — and may also do so under certain contracts in the future, particularly in our contracts for renewable energy projects. For example, under a contract for the construction and operation of a
cogeneration facility at the U.S. Department of Energy Savannah River Site in South Carolina, a subsidiary of ours is exposed to the risk that the price of the biomass that will be used to fuel the cogeneration facility may rise during the 19-year performance period of the contract. Several provisions in that contract mitigate the price risk. In addition, although we typically structure our contracts so that our obligation to supply a customer with LFG,biogas, electricity or steam, for example, does not exceed the quantity produced by the production facility, in some circumstances we may commit to supply a customer with specified minimum quantities based on our projections of the facility’s production capacity. In such circumstances, if we are unable to meet such commitments, we may be required to incur additional costs or face penalties. Despite the steps we have taken to mitigate risks under these and other contracts, such steps may not be sufficient to avoid the need to incur increased costs to satisfy our commitments, and such costs could be material. Increased costs that we are unable to pass through to our customers could have a material adverse effect on our operating results.
Our business depends on experienced and skilled personnel and substantial specialty subcontractor resources, and if we lose key personnel or if we are unable to attract and integrate additional skilled personnel, it will be more difficult for us to manage our business and complete projects.
The success of our business and construction projects dependdepends in large part on the skill of our personnel and on trade labor resources, including with certain specialty subcontractor skills. Competition for personnel, particularly those with expertise in the energy services and renewable energy industries, is high.high and may intensify with the IRA driving more demand for clean energy product and service offerings and as such demand for skilled personnel in the industry. In the event we are unable to attract, hire and retain the requisite personnel and subcontractors, we may experience delays in completingcompleting projects in accordance with project schedules and budgets. Further, any increase in demand for personnel and specialty subcontractors may result in higher costs, causing us to exceed the budget on a project. Either of these circumstances may have an adverse effect on our business, financial condition, and operating results, harm our reputation among and relationships with our customers and cause us to curtail our pursuit of new projects.
Our future success is particularly dependent on the vision, skills, experience, and effort of our senior management team, including our executive officers and our founder, principal stockholder, president, and chief executive officer, George P. Sakellaris. If we were to lose the services of any of our executive officers or key employees, our ability to effectively manage our operations and implement our strategy could be harmed and our business may suffer.
We have been and may continue to be impacted by macroeconomic conditions such as supply chain challenges, a shortfall of certain products needed for our business, and inflationary pressures.
Global trade conditions that originated during the COVID-19 pandemic continue to persist and have been exacerbated by the war in Ukraine. These conditions may also have long-lasting adverse impact on us and our industries independently of the progress of the pandemic. For example, pandemic-related issues have exacerbated port congestion and intermittent supplier shutdowns and delays, resulting in additional expenses to expedite delivery of critical equipment. These conditions, combined with an increased demand for certain products needed for our business, such as lithium-ion battery cells and solar panels has created a shortfall of and increased costs for these products, which has caused challenges and delays in our projects and may impact the profitability of our projects. We cannot predict the duration or direction of current global trends or their sustained impact or how the COVID-19 pandemic may evolve and impact our business. If we experience unfavorable global market conditions, our business, prospects, financial condition, and operating results may be harmed.
For example, we are dependent on the continued supply of lithium-ion battery cells for our energy storage products, and we will require substantially more cells to grow our battery storage business based on our current plans. Currently, we rely on limited number of suppliers for these cells. Any disruption in the supply of battery cells from our suppliers could limit our growth for projects involving battery energy storage. In addition, the cost and mass production of battery cells, depends in part upon the prices and availability of raw materials such as lithium, nickel, cobalt and/or other metals. The prices for these materials fluctuate and their available supply may be unstable, depending on market conditions, regulation and global demand for these materials. As a result of increased global production of energy storage products and electric vehicles, suppliers of these raw materials may be unable to meet our volume or timing needs. Any reduced availability of these materials may adversely impact our access to battery cells and our growth, and any increases in their prices may reduce our profitability if we cannot recoup such costs in our project pricing. Moreover, our inability to meet demand may harm our brand, growth, prospects and operating results.
A failure of our information technology (“IT”) and data security infrastructure or cyber or other security incidents, vulnerabilities or other deficiencies, could adversely impact our business, reputation or results of operation or could cause us to default under our contractual obligations.
We rely upon the capacity, reliability, and security of our IT and data security infrastructure and our ability to expand and continually update this infrastructure in response to the changing needs of our business. Our existing systems or any new ones we implement may not perform as expected face the challenge of supporting our older systems and implementing necessary upgrades. If we experience a problem with the functioning or a security breach of our IT systems, the resulting disruptions could have an adverse effect on our business. We receive and store personal information in connection with our human resources operations and other aspects of our business. Despite our implementation of security measures, our IT systems are vulnerable to damages from computer viruses, natural disasters, unauthorized access, cyber-attacks, and other similar disruptions, and we have experienced such incidents in the past. Any system failure, accident, or security breach could result in disruptions to our operations. A material network breach in the security of our IT systems could include the theft of our intellectual property, trade secrets, customer information, human resources information, or other confidential matter.
We have been subject to and may in the future experience cybersecurity threats, including advanced and persistent cyberattacks, phishing and social engineering schemes, particularly on internet applications. Such cyber and other security threats could compromise the assets we own and operate or data in our systems. In addition, cybersecurity incidents at our vendors, customers and partners may have similar negative impact on our business operations. For example, we engage third-party vendors who receive and store personal and sensitive information in connection with our operations, including our human resources functions such as background checks. We do not have control over or access to the IT infrastructure of these vendors. Our vendors have and may in the future experience network breaches and other cyberattacks. In such instances, we are not be able to fully investigate the incidents and may not be able to implement measures to defend such attacks. Furthermore, third-party vendors may not notify us of such incidents timely or at all, making it more difficult for us to identify and mitigate cybersecurity risks. Although we devote resources to our cybersecurity programs and have implemented security measures to protect our assets, systems and data, there can be no assurance that our efforts will prevent these threats. Because the techniques used to obtain unauthorized access, to disable or degrade systems, and to generate cyber attacks change frequently, have become increasingly more sophisticated, and may be difficult to detect for periods of time, we may not anticipate these acts or respond adequately or timely.
As these threats continue to evolve and increase, we may be required to devote significant additional resources in order to protect against these attacks and to identify and remediate any security vulnerabilities. To the extent that any attacks, disruptions or security breach results in a loss or damage to our data, or an inappropriate disclosure of information, or adversely impact the assets we own or operate , it could cause significant damage to our reputation, affect our relationships with our customers and employees, lead to claims against us and ultimately harm our business and operating results.
If we cannot obtain surety bonds and letters of credit, our ability to operate may be restricted.
Federal and state laws require us to secure the performance of certain long-term obligations through surety bonds and letters of credit. In addition, we are occasionally required to provide bid bonds or performance bonds to secure our performance under energy efficiency contracts. In the future, we may have difficulty procuring or maintaining surety bonds or letters of credit, and obtaining them may become more expensive, require us to post cash collateral or otherwise involve unfavorable terms. Because we are sometimes required to have performance bonds or letters of credit in place before projects can commence or continue, our failure to obtain or maintain those bonds and letters of credit would adversely affect our ability to begin and complete projects, and thus could have a material adverse effect on our business, financial condition and operating results.
We operate in a highly competitive industry, and our current or future competitors may be able to compete more effectively than we do, which could have a material adverse effect on our business, revenues, growth rates, and market share.
Our industry is highly competitive, with many companies of varying size and business models, many of which have their own proprietary technologies, competing for the same business as we do. Many of our competitors have longer operating histories and greater resources than us and could focus their substantial financial resources to develop a competitive advantage.advantage, others may be smaller and able to adapt to the constantly changing demand of the market more quickly. The passage of the IRA and the opportunities it brings could intensify competition in our industry. Our competitors may also offer energy solutions at prices below cost, devote significant sales forces to competing with us or attempt to recruit our key personnel by increasing compensation, any of which could improve their competitive positions. Any of these competitive factors could make it more difficult for us to attract and retain customers, cause us to lower our prices in order to compete, and reduce our market share and revenues, any of which could have a material adverse effect on our financial condition and operating results. We can provide no assurance that we will continue to effectively compete against our current competitors or additional companies that may enter our markets.
In addition, we may also face competition based on technological developments that reduce demand for electricity, increase power supplies through existing infrastructure or that otherwise compete with our products and services. We also encounter competition in the form of potential customers electing to develop solutions or perform services internally rather than engaging an outside provider such as us.
We may be unable to complete or operate our projects on a profitable basis or as we have committed to our customers.
Development, installation and construction of our energy efficiency and renewable energy projects, and operation of our renewable energy projects, entails many risks, including:
failure to receive critical components and equipment that meet our design specifications and can be delivered on schedule;
failure to obtain all necessary rights to land access and use;
failure to receive quality and timely performance of third-party services;
increases in the cost of labor, equipment and commodities needed to construct or operate projects;
permitting and other regulatory issues, license revocation and changes in legal requirements;
shortages of equipment or skilled labor;
unforeseen engineering problems;
failure of a customer to accept or pay for renewable energy that we supply;
weather interferences, catastrophic events including fires, explosions, earthquakes, droughts and acts of terrorism; and accidents involving personal injury or the loss of life;
labor disputes and work stoppages;
mishandling of hazardous substances and waste; and
other events outside of our control.
Any of these factors could give rise to construction delays and construction and other costs in excess of our expectations. This could prevent us from completing construction of our projects, cause defaults under our financing agreements or under contracts that require completion of project construction by a certain time, cause projects to be unprofitable for us, or otherwise impair our business, financial condition and operating results.
Our small-scale renewable energy plants may not generate expected levels of output.
The small-scale renewable energy plants that we construct and own are subject to various operating risks that may cause them to generate less than expected amounts of processed LFG,biogas, electricity, or thermal energy. These risks include a failure or degradation of our, our customers’ or utilities’ equipment; an inability to find suitable replacement equipment or parts; less than expected supply of the plant’s source of renewable energy, downtime to our plants based such as LFGbiogas or biomass;biomass ; or a faster than expected diminishment of such supply. For example, in 2022 we had to undertake some unscheduled maintenance at some of our RNG plants impacting the energy output from such plants. Any extended interruption in the plant’s operation, or failure of the plant for any reason to generate the expected amount of output, could have a material adverse effect on our business and operating results. In addition, we have in the past, and could in the future, incur material asset impairment charges if any of our renewable energy plants incursincur operational issues that indicate that our expected future cash flows from the plant are less than its carrying value. Any such impairment charge could have a material adverse effect on our operating results in the period in which the charge is recorded.
We have not entered into long-term offtake agreements for a portion of the output from our small-scale renewable energy plants and a portion of the related RINsrenewable identification numbers (“RINs”) are not subject to long term contracts.
We have not entered into long-term offtake agreements for a portion of the output from our small-scale renewable energy plants, particularly LFGRNG and non-RNG plants, and we are required tomay sell portions of the processed LFGRNG, medium-BTU gas or electricity produced by the facility at wholesale prices, which are exposed to market fluctuations and risks. Similarly, we have not entered into long-term agreements with respect to the RINs for which the production and sale of such biofuel may qualify. The failure to sell such processed LFG,RNG, medium-BTU gas, electricity, or the related RINs at a favorable price, or at all could have a material adverse effect on our business and operating results.
We may not be able to replace expiring offtake agreements with contracts on similar terms. If we are unable to replace an expired offtake agreement with an acceptable new contract, we may be required to remove the small-scale renewable energy plant from the site or, alternatively, we may sell the assets to the customer.
We may not be able to replace an expiring offtake agreement with a contract on equivalent terms and conditions, including at prices that permit operation of the related facility on a profitable basis. If we are unable to replace an expiring offtake agreement with an acceptable new revenue contract, the affected site may temporarily or permanently cease operations or we may be required to sell the power produced by the facility at wholesale prices which are exposed to market fluctuations and risks. In the case of a solar photovoltaic installation that ceases operations, the offtake agreement terms generally require that we remove the assets, including fixing or reimbursing the site owner for any damages caused by the assets or the removal of such assets. Alternatively, we may agree to sell the assets to the site owner, but the terms and conditions, including price, that we would
receive in any sale, and the sale price may not be sufficient to replace the revenue previously generated by the small-scale renewable energy plant.
Operation of energy assets involves significant risks and hazards customary to the energy industry and may be further impacted by the effects of climate change. We may not have adequate insurance to cover these risks and hazards, or other risks beyond our control.
Hazards such as fire, explosion, structural collapse and machinery failure are inherent risks in our operations. These and other hazards can cause significant personal injury or loss of life, severe damage to and destruction of property, plant and equipment and contamination of, or damage to, the environment. The occurrence of any one of these events may result in curtailment of our operations or liability to third parties for damages, environmental cleanup costs, personal injury, property damage and fines and/or penalties, any of which could be substantial. Strategic targets, such as energy-related facilities, may also be at greater risk of hostile cyber intrusions or other security attacks, including those targeting information systems as well as electronic control systems. Such events could severely disrupt business operations and result in loss of service to customers, as well as create significant expense to repair security breaches or system damage.
Furthermore, certain of our facilities, projects and suppliers are located in or operate operations in locations that are susceptible to natural disasters. The frequency of weather-related natural disasters may be increasing due to climate change. The occurrence of a natural disaster, such as tornados, earthquakes, droughts, floods, wildfires or localized extended outages of critical utilities or transportation systems, or any critical resource shortages, affecting us could cause a significant interruption in our business or damage or destroy our facilities. While we maintain insurance to protect against these and other risks, some of these events may be excluded from insurance coverage or our coverage may not be sufficient against all hazards or liabilities to which we may be subject. Insurance may also not continue to be available at all or at rates or on terms similar to those presently available. Any losses not covered by insurance could have a material adverse effect on our business, financial condition, results of operations and cash flows.
We plan to expand our business in part through future acquisitions and joint ventures, but we may not be able to identify or complete suitable acquisitions.
Historically, acquisitions have been a significant part of our growth strategy. We plan to continue to use acquisitions of companies or assets and co-investments with third parties using joint ventures to expand our project skill-sets and capabilities, expand our geographic markets, add experienced management, increase our product and service offerings and add to our energy producing asset portfolio. However, we may be unable to implement this growth strategy if we cannot identify suitable acquisition or joint venture candidates or partners, reach agreement with acquisition targets on acceptable terms or arrange required financing for acquisitions or joint ventures on acceptable terms. In addition, the time and effort involved in attempting to identifyidentifying acquisition or joint venture candidates and consummate acquisitionstransactions may divert the attention and efforts of members of our management from the operations of our company.
Any future acquisitions that we may make could disrupt our business, cause dilution to our stockholders and harm our business, financial condition or operating results.
If we are successful in consummating acquisitions, those acquisitions could subject us to a number of risks, including:
the purchase price we pay could significantly deplete our cash reserves or result in dilution to our existing stockholders;
we may find that the acquired company or assets do not improve our customer offerings or market position as planned;
we may have difficulty integrating the operations and personnel of the acquired company;
key personnel and customers of the acquired company may terminate their relationships with the acquired company as a result of the acquisition;
we may experience additional financial and accounting challenges and complexities in areas such as tax planning and financial reporting;
we may incur additional costs and expenses related to complying with additional laws, rules or regulations in new jurisdictions;
we may assume or be held liable for risks and liabilities (including for environmental-related costs) as a result of our acquisitions, some of which we may not discover during our due diligence or adequately adjust for in our acquisition arrangements;
our ongoing business and management’s attention may be disrupted or diverted by transition or integration issues and the complexity of managing geographically or culturally diverse enterprises;
we may incur one-time write-offs or restructuring charges in connection with the acquisition;
we may acquire goodwill and other intangible assets that are subject to amortization or impairment tests, which could result in future charges to earnings; and
we may not be able to realize the cost savings or other financial benefits we anticipated.
These factors could have a material adverse effect on our business, financial condition and operating results.
We may be required to write-off or impair capitalized costs or intangible assets in the future, or we may incur restructuring costs or other charges, each of which could harm our earnings.
In accordance with generally accepted accounting principles in the United States, we capitalize certain expenditures and advances relating to our acquisitions, pending acquisitions, project development costs, interest costs related to project financing and certain energy assets. In addition, we have considerable unamortized assets. From time to time in future periods, we may be required to incur a charge against earnings in an amount equal to any unamortized capitalized expenditures and advances, net of any portion thereof that we estimate will be recoverable, through sale or otherwise, relating to: (i) any operation or other asset that is being sold, permanently shut down, impaired or has not generated or is not expected to generate sufficient cash flow; (ii) any pending acquisition that is not consummated; (iii) any project that is not expected to be successfully completed; and (iv) any goodwill or other intangible assets that are determined to be impaired.
In response to such charges and costs and other market factors, we may be required to implement restructuring plans in an effort to reduce the size and cost of our operations and to better match our resources with our market opportunities. As a result of such actions, we would expect to incur restructuring expenses and accounting charges which may be material. Several factors could cause a restructuring to adversely affect our business, financial condition, and results of operations. These include potential disruption of our operations, the development of our small-scale renewable energy projects and other aspects of our business. Employee morale and productivity could also suffer and result in unintended employee attrition. Any restructuring would require substantial management time and attention and may divert management from other important work. Moreover, we could encounter delays in executing any restructuring plans, which could cause further disruption and additional unanticipated expense.
See also Note 2, “Summary of Significant Accounting Policies” and Note 5, “Goodwill and Intangible Assets”Assets, Net”, to our Consolidated Financial Statementsconsolidated financial statements appearing in Item 8 of this Annual ReportReport.
Any future acquisitions that we may make could disrupt our business, cause dilution to our stockholders and harm our business, financial condition or operating results, and our use of joint ventures could expose us to additional risks and liabilities.
If we are successful in consummating acquisitions, those acquisitions could subject us to a number of risks, including:
•the purchase price we pay could significantly deplete our cash reserves or result in dilution to our existing stockholders,
•we may find that the acquired company or assets do not improve our customer offerings or market position as planned,
•we may have difficulty integrating the operations and personnel of the acquired company,
•key personnel and customers of the acquired company may terminate their relationships with the acquired company as a result of the acquisition,
•we may experience additional financial and accounting challenges and complexities in areas such as tax planning and financial reporting,
•we may incur additional costs and expenses related to complying with additional laws, rules or regulations in new jurisdictions,
•we may assume or be held liable for risks and liabilities (including for environmental-related costs) as a result of our acquisitions, some of which we may not discover during our due diligence or adequately adjust for in our acquisition arrangements,
•our ongoing business and management’s attention may be disrupted or diverted by transition or integration issues and the complexity of managing geographically or culturally diverse enterprises,
•we may incur one-time write-offs or restructuring charges in connection with the acquisition,
•we may acquire goodwill and other intangible assets that are subject to amortization or impairment tests, which could result in future charges to earnings, and
•we may not be able to realize the cost savings or other financial benefits we anticipated.
We own, and in the future may acquire or establish, operating or development projects in joint ventures. Joint ventures inherently involve a lesser degree of control over business operations. Our joint venture partners may have economic and business interests that are inconsistent with ours, we may lack sole decision-making authority, and disputes between us and our joint venture partners could subject us to delays, litigation and increased expenses. Some of our joint venture projects may be capital intensive and if our joint venture partner does not contribute capital they are required to, this could result in delays in our development projects and increased our capital expenditures. These factors could have a material adverse effect on Form 10-K.our business, financial condition, and operating results.
International expansion is one of our growth strategies, and international operations will expose us to additional risks that we do not face in the United States, which could have an adverse effect on our operating results.
We generate a portion of our revenues from operations outside of the United States, mainly in Canada and the United Kingdom. International expansion is one of our growth strategies, and we expect our revenues and operations outside of the United States will expand in the future. These operations will be subject to a variety of risks that we do not face in the United States, and that we may face only to a limited degree in Canada and the United Kingdom, including:
•building and managing a highly experienced foreign workforce and overseeing and ensuring the performance of foreign subcontractors,
•increased travel, infrastructure and legal and compliance costs associated with multiple international locations,
•additional withholding taxes or other taxes on our foreign income, and tariffs or other restrictions on foreign trade or investment,
•imposition of, or unexpected adverse changes in, foreign laws or regulatory requirements, many of which differ from those in the United States,
•increased exposure to foreign currency exchange rate risk,
•longer payment cycles for sales in some foreign countries and potential difficulties in enforcing contracts and collecting accounts receivable,
•difficulties in repatriating overseas earnings,
•international and regional economic, political and labor conditions in the countries in which we operate, including the uncertainty caused by the evolving relations between the United States and China, and other geopolitical tensions; and
•political unrest, war, incidents of terrorism, pandemics, or responses to such events, including fluctuations in the severity and duration of the COVID-19 pandemic and resulting restrictions on business activity which may vary significantly by region.
Our overall success in international markets will depend, in part, on our ability to succeed in differing legal, regulatory, economic, social, and political conditions. We may not be successful in developing and implementing policies and strategies that will be effective in managing these risks in each country where we do business. Our failure to manage these risks successfully could harm our international operations, reduce our international sales, and increase our costs, thus adversely affecting our business, financial condition and operating results. Some of our third-party business partners have international operations and are also subject to these risks and if our third-party business partners are unable to appropriately manage these risks, our business may be harmed.
Risks related to Regulations or Governmental Actions
Our business depends in part on federal, state, provincial and local government support for energy efficiency and renewable energy, and a decline in such support or the imposition of additional taxes, tariffs, duties, or other assessments on renewable energy or the equipment necessary to generate or deliver it, could harm our business.
We depend in part on legislation and government policies that support energy efficiency and renewable energy projects that enhance the economic feasibility of our energy efficiency services and small-scale renewable energy projects. This support includes legislation and regulations that authorize and regulate the manner in which certain governmental entities do business with us; encourage or subsidize governmental procurement of our services; encourage or in some cases require other customers to procure power from renewable or low-emission sources, to reduce their electricity use or otherwise to procure our services; and provide us with tax and other incentives that reduce our costs or increase our revenues. In addition, the U.S. government generally has not taken action to materially burden the international supply chain, which has been important to the development of renewable energy facilities at acceptable prices. Any reductions or modifications to, or the elimination of, governmental incentives or policies that support renewable energy or the imposition of additional taxes, tariffs, duties or other assessments on renewable energy or the equipment necessary to generate or deliver it, could result in, among other things, the lack of a satisfactory market for the development and/or financing of renewable energy projects, or adversely impact our ability to complete projects for existing customers and obtain project commitments from new customers. For example, antidumping and countervailing duty rates could be put in place as a result of the U.S. Department of Commerce's investigation into an antidumping and countervailing duties circumvention claim on solar cells and panels supplied from Malaysia, Vietnam, Thailand and Cambodia and the trade restrictions imposed by the US government on Chinese entities determined to be acting contrary to U.S. foreign policy and national security interests, including the Uyghur Forced Labor Prevention Act, which, with limited exception, prohibits the importation of all goods or articles mined or produced in whole or in part in the Xinjiang Uyghur Autonomous Region could increase the overall cost of our product offerings and reduce our ability to offer competitive pricing in certain markets. Although we maintain policies and procedures to maintain compliance with all governmental laws and regulations, these and other similar trade restrictions that may be imposed against Chinese entities in the future may have the effect of restricting the global supply of, and raising prices for supplies needed for our business, such as polysilicon and solar products, batteries, and semiconductors. Due to the uncertainty in the regulatory and legislative processes, we cannot determine the effect any such legislation and regulation may have on our products and operations.
A substantial portion of our earnings are derived from the sale of renewable energy certificates (“RECs”) and other environmental attributes, and our failure to be able to sell such attributes could materially adversely affect our business, financial condition and results of operation.
A substantial portion of our earnings are attributable to our sale of renewable energy certificates (“RECs”) and other environmental attributes generated by our energy assets. These attributes are used as compliance purposes for state-specific or U.S. federal policy. We own and operate solar PV installations which derive a significant portion of their revenues from the sale of solar renewable energy certificates (“SRECs”), which are produced as a result of generating electricity. The value of these SRECs is determined by the supply and demand of SRECs in the states in which the solar PV installations are installed. Supply is driven by the amount of installations and demand is driven by state-specific laws relating to renewable portfolio standards.
We also own and operate renewable natural gas plants that may deliver biofuels into to the nation’s natural gas pipeline grid. Such biofuel may qualify for certain environmental attribute mechanisms, such as RINs which are used for compliance purposes under the Renewable Fuel Standard (“RFS”) program. The RFS is a U.S. federal policy that requires transportation fuel to contain a minimum volume of renewable fuel. The U.S. Environmental Protection Agency (“EPA”) administers the RFS program and may periodically undertake regulatory action involving the RFS, including annual volume standards for renewable fuel. Some of our biofuel may also qualify for various state incentives, such as the Low Carbon Fuel Standard (“LCFS”), the pricing or availability of which may fluctuate.
We sometimes seek to sell forward a portion of our SRECs and other environmental attributes under contracts to fix the revenues from those attributes for financing purposes or hedge against future declines in prices of such environmental attributes. If our renewable energy facilities do not generate the amount of renewable energy attributes sold under such forward contracts or if for any reason the renewable energy we generate does not produce SRECs or other environmental attributes for a particular state, we may be required to make up the shortfall of SRECs or other environmental attributes under such forward contracts through purchases on the open market or make payments of liquidated damages. RECs are created through state law requirements for utilities to purchase a portion of their energy from renewable energy sources and changes in state laws or regulation relating to RECs may adversely affect the availability of RECs or other environmental attributes and the future prices for RECs or other environmental attributes, which could have an adverse effect on our business, financial condition, and results of operations.
We may have exposure to additional tax liabilities and our effective tax rate may increase or fluctuate, which could increase our income tax expense and reduce our net income and we may not be able to utilize the full value of tax credits and incentives
available under the IRA or may become subject to penalties if we fail to meet requirements for these credits and incentives. This may have an adverse effect on our business and operating results.
Our provision for income taxes is subject to volatility and could be adversely affected by changes in tax laws or regulations, particularly changes in tax incentives in support of energy efficiency. The IRA, which is effective for years after January 1, 2023, contains extended and expanded clean energy tax credits such as the Investment Tax Credit (“ITC”), the Production Tax Credit (“PTC”), and created other financial incentives designed to promote the development of certain domestic clean energy projects. In order to receive the full value of such credits and incentives, our projects must satisfy a number of requirements including prevailing wage and apprenticeship requirements. If we fail to comply with these requirements, the value of the credits may be limited, and we may become subject to financial penalties. Furthermore, until the Treasury Department and IRS issues additional guidance on which types of projects are eligible for the tax credits and incentives and how projects can demonstrate compliance with the requirements, we may not receive full value of the tax credits and incentives, which could increase our income tax expense, reduce our net income and impact the profitability of our projects. There is also uncertainly if IRA incentives may be cut back in the future. In addition, the timing of when assets are placed in service has in the past and could in the future impact our tax rate. If we experience unexpected delays in this timing, we may not be able to take advantage of the ITC as expected. If we are not able to utilize the ITC as expected this could have an adverse effect of our financial results.
Our tax rate has historically been significantly impacted by the IRC Section 179D deduction. This deduction is related to energy efficient improvements we provide under government contracts. The Consolidated Appropriations Act, 2021 made permanent the Section 179D Energy Efficient Commercial Building Deduction. That Act, along with the IRA, also made changes to the way the deduction is calculated. If those changes or clarifying guidance issued by the IRS result in lower levels of energy efficiency improvements, it could impact the deduction available and the tax rate.
In addition, like other companies, we may be subject to examination of our income tax returns by the U.S. Internal Revenue Service and other tax authorities; our U.S. federal tax returns for 2019 through 2022 are subject to audit by federal, state, and foreign tax authorities. Though we regularly assess the likelihood of adverse outcomes from such examinations and the adequacy of our provision for income taxes and tax reserves, there can be no assurance that such provision is sufficient and that a determination by a tax authority will not have an adverse effect on our net income.
Changes in the laws and regulations governing the public procurement of ESPCs could have a material impact on our business.
We derive a significant amount of our revenue from ESPCs with our government customers. While federal, state and local government rules governing such contracts vary, such rules may, for example, permit the funding of such projects through long-term financing arrangements; permit long-term payback periods from the savings realized through such contracts; allow units of government to exclude debt related to such projects from the calculation of their statutory debt limitation; allow for award of contracts on a “best value” instead of “lowest cost” basis; and allow for the use of sole source providers. To the extent these rules become more restrictive in the future, our business could be harmed.
We need governmental approvals and permits, and we typically must meet specified qualifications, in order to undertake our energy efficiency projects and construct, own and operate our small-scale renewable energy projects, and any failure to do so would harm our business.
The design, construction, and operation of our energy efficiency and small-scale renewable energy projects require various governmental approvals and permits and may be subject to the imposition of related conditions that vary by jurisdiction. In some cases, these approvals and permits require periodic renewal. We cannot predict whether all permits required for a given project will be granted or whether the conditions associated with the permits will be achievable. The denial of a permit essential to a project or the imposition of impractical conditions would impair our ability to develop the project. In addition, we cannot predict whether the permits will attract significant opposition or whether the permitting process will be lengthened due to complexities and appeals. Delay in the review and permitting process for a project can impair or delay our ability to develop that project or increase the cost so substantially that the project is no longer attractive to us. We have experienced delays in developing our projects due to delays in obtaining permits and may experience delays in the future. If we were to commence construction in anticipation of obtaining the final, non-appealable permits needed for that project, we would be subject to the risk of being unable to complete the project if all the permits were not obtained. If this were to occur, we would likely lose a significant portion of our investment in the project and could incur a loss as a result. Further, the continued operations of our projects require continuous compliance with permit conditions. This compliance may require capital improvements or result in reduced operations. Any failure to procure, maintain and comply with necessary permits would adversely affect ongoing development, construction and continuing operation of our projects.
In addition, the projects we perform for governmental agencies are governed by particular qualification and contracting regimes. Certain states require qualification with an appropriate state agency as a precondition to performing work or appearing as a qualified energy service provider for state, county, and local agencies within the state. For example, the Commonwealth of Massachusetts and the states of Colorado and Washington pre-qualify energy service providers and provide contract documents
that serve as the starting point for negotiations with potential governmental clients. Most of the work that we perform for the federal government is performed under IDIQ agreements between a government agency and us or a subsidiary. These IDIQ agreements allow us to contract with the relevant agencies to implement energy projects, but no work may be performed unless we and the agency agree on a task order or delivery order governing the provision of a specific project. The government agencies enter into contracts for specific projects on a competitive basis. We and our subsidiaries and affiliates are currently party to an IDIQ agreement with the U.S. Department of Energy expiring in 2022, which may be extended through December 2023.2026. We are also party to similar agreements with other federal agencies, including the U.S. Army Corps of Engineers and the U.S. General Services Administration. If we are unable to maintain or renew our IDIQ qualification under the U.S. Department of Energy program for ESPCs, or similar federal or state qualification regimes, our business could be materially harmed.
Many of our small-scale renewable energy projects are, and other future projects may be, subject to or affected by U.S. federal energy regulation or other regulations that govern the operation, ownership, and sale of the facility, or the sale of electricity from the facility.
PUHCA and the FPA regulate public utility holding companies and their subsidiaries and place constraints on the conduct of their business. The FPA regulates wholesale sales of electricity and the transmission of electricity in interstate commerce by public utilities. Under PURPA, all of our current small-scale renewable energy projects are small power “qualifying facilities” (facilities meeting statutory size, fuel, and filing requirements) that are exempt from regulations under PUHCA, most provisions of the FPA and state rate and financial regulation. None of our renewable energy projects are currently subject to rate regulation for wholesale power sales by the Federal Energy Regulatory Commission (“FERC”) under the FPA, but certain of our projects that are under construction or development could become subject to such regulation in the future. Also, we may acquire interests in or develop generating projects that are not qualifying facilities. Non-qualifying facility projects would be fully subject to FERC corporate and rate regulation, and would be required to obtain FERC acceptance of their rate schedules for wholesale sales of energy, capacity, and ancillary services, which requires substantial disclosures to and discretionary approvals from FERC. FERC may revoke or revise an entity’s authorization to make wholesale sales at negotiated, or market-based, rates if FERC determines that we can exercise market power in transmission or generation, create barriers to entry or engage in abusive affiliate transactions or market manipulation. In addition, many public utilities (including any non-qualifying facility generator in which we may invest) are subject to FERC reporting requirements that impose administrative burdens and that, if violated, can expose the company to civil penalties or other risks.
All of our wholesale electric power sales are subject to certain market behavior rules. These rules change from time to time, by virtue of FERC rulemaking proceedings and FERC-ordered amendments to utilities’ or power pools’ FERC tariffs. If we are deemed to have violated these rules, we will be subject to potential disgorgement of profits associated with the violation and/or suspension or revocation of our market-based rate authority, as well as potential criminal and civil penalties. If we were to lose market-based rate authority for any non-qualifying facility project we may acquire or develop in the future, we would be required to obtain FERC’s acceptance of a cost-based rate schedule and could become subject to, among other things, the burdensome accounting, record keeping and reporting requirements that are imposed on public utilities with cost-based rate schedules. This could have an adverse effect on the rates we charge for power from our projects and our cost of regulatory compliance.
Wholesale electric power sales are subject to increasing regulation. The terms and conditions for power sales, and the right to enter and remain in the wholesale electric sector, are subject to FERC oversight. Due to major regulatory restructuring initiatives at the federal and state levels, the U.S. electric industry has undergone substantial changes over the past decade. We cannot predict the future design of wholesale power markets, or the ultimate effect ongoing regulatory changes will have on our business. Other proposals to further regulate the sector may be made and legislative or other attention to the electric power market restructuring process may delay or reverse the movement towards competitive markets.
If we become subject to additional regulation under PUHCA, FPA, or other regulatory frameworks, if existing regulatory requirements become more onerous, or if other material changes to the regulation of the electric power markets take place, our business, financial condition, and operating results could be adversely affected.
Compliance with environmental laws could adversely affect our operating results.
Costs of compliance with federal, state, provincial, local and other foreign existing and future environmental regulations could adversely affect our cash flow and profitability. We are required to comply with numerous environmental laws and regulations and to obtain numerous governmental permits in connection with energy efficiency and renewable energy projects, and we may incur significant additional costs to comply with these requirements. If we fail to comply with these requirements, we could be subject to civil or criminal liability, damages and fines. Existing environmental regulations could be revised or reinterpreted and new laws and regulations could be adopted or become applicable to us or our projects, and future changes in environmental laws and regulations could occur. These factors may materially increase the amount we must invest to bring our projects into compliance and impose additional expense on our operations.
In addition, private lawsuits or enforcement actions by federal, state, provincial and/or foreign regulatory agencies may materially increase our costs. Certain environmental laws make us potentially liable on a joint and several basis for the remediation of contamination at or emanating from properties or facilities we currently or formerly owned or operated or properties to which we arranged for the disposal of hazardous substances. Such liability is not limited to the cleanup of contamination we actually caused. Although we seek to obtain indemnities against liabilities relating to historical contamination
at the facilities we own or operate, we cannot provide any assurance that we will not incur liability relating to the remediation of contamination, including contamination we did not cause.
We may not be able to obtain or maintain, from time to time, all required environmental regulatory approvals. A delay in obtaining any required environmental regulatory approvals or failure to obtain and comply with them could adversely affect our business and operating results.
International expansion is one of our growth strategies, and international operations will expose us to additional risks that we do not face in the United States, which could have an adverse effect on our operating results.
We generate a portion of our revenues from operations outside of the United States, mainly in Canada and the United Kingdom. International expansion is one of our growth strategies, and we expect our revenues and operations outside of the United States will expand in the future. These operations will be subject to a variety of risks that we do not face in the United States, and that we may face only to a limited degree in Canada, the United Kingdom and Greece, including:
building and managing highly experienced foreign workforces and overseeing and ensuring the performance of foreign subcontractors;
increased travel, infrastructure and legal and compliance costs associated with multiple international locations;
additional withholding taxes or other taxes on our foreign income, and tariffs or other restrictions on foreign trade or investment;
imposition of, or unexpected adverse changes in, foreign laws or regulatory requirements, many of which differ from those in the United States;
increased exposure to foreign currency exchange rate risk;
longer payment cycles for sales in some foreign countries and potential difficulties in enforcing contracts and collecting accounts receivable;
difficulties in repatriating overseas earnings;
general economic conditions in the countries in which we operate; and
political unrest, war, incidents of terrorism, or responses to such events.
We also continue to evaluate the potential effect of the United Kingdom’s planned departure from the European Union (“EU”) (commonly referred to as Brexit) on our business operations and financial results. On January 29, 2020, the European Parliament approved the U.K.’s withdrawal from the EU. The U.K. officially left the EU on January 31, 2020. Following its departure, the U.K. entered into a transition period that is scheduled to last until December 31, 2020 during which period of time the U.K.’s trading relationship with the EU is expected to remain largely the same while the two parties negotiate a trade agreement as well as other aspects of the U.K.’s relationship with the EU. Brexit could adversely affect European or worldwide political, regulatory, economic or market conditions and could contribute to instability in global political institutions, regulatory agencies and financial markets.
Our overall success in international markets will depend, in part, on our ability to succeed in differing legal, regulatory, economic, social and political conditions. We may not be successful in developing and implementing policies and strategies that will be effective in managing these risks in each country where we do business. Our failure to manage these risks successfully could harm our international operations, reduce our international sales and increase our costs, thus adversely affecting our business, financial condition and operating results.
Changes in utility regulation and tariffs could adversely affect our business.
Our business is affected by regulations and tariffs that govern the activities and rates of utilities. For example, utility companies are commonly allowed by regulatory authorities to charge fees to some business customers for disconnecting from the electric grid or for having the capacity to use power from the electric grid for back-up purposes. These fees could increase the cost to our customers of taking advantage of our services and make them less desirable, thereby harming our business, financial condition, and operating results. Our current generating projects are all operated as qualifying facilities. FERC regulations under the FPA confer upon these facilities key rights to interconnection with local utilities and can entitle qualifying facilities to enter into power purchase agreements with local utilities, from which the qualifying facilities benefit. Changes to these federal laws and regulations could increase our regulatory burdens and costs and could reduce our revenues.
State regulatory agencies could award renewable energy certificates or credits that our electric generation facilities produce to our power purchasers, thereby reducing the power sales revenues we otherwise would earn. In addition, modifications to the pricing policies of utilities could require
renewable energy systems to charge lower prices in order to compete with the price of electricity from the electric grid and may reduce the economic attractiveness of certain energy efficiency measures.
Some of the demand-reduction services we provide for utilities and institutional clients are subject to regulatory tariffs imposed under federal and state utility laws. In addition, the operation of, and electrical interconnection for, our renewable energy projects are subject to federal, state, or provincial interconnection and federal reliability standards that are also set forth in utility tariffs. These tariffs specify rules, business practices, and economic terms to which we are subject. The tariffs are drafted by the utilities and approved by the utilities’ state and federal regulatory commissions. These tariffs change frequently, and it is possible that future changes will increase our administrative burden or adversely affect the terms and conditions under which we render service to our customers.
Compliance with environmental laws could adversely affect our operating results.
Costs of compliance with federal, state, provincial, local and other foreign existing and future environmental regulations could adversely affect our cash flow and profitability. We are required to comply with numerous environmental laws and regulations and to obtain numerous governmental permits in connection with energy efficiency and renewable energy projects. In addition, we may become subject to additional legislation and regulation regarding climate change, and we may incur significant additional costs to comply with existing and new requirements. If we fail to comply with these requirements, we could be subject to civil or criminal liability, damages, and fines. Existing environmental regulations could be revised or reinterpreted, and new laws and regulations could be adopted or become applicable to us or our projects, and future changes in environmental laws and regulations, including those intended to combat climate change, could occur. These factors may materially increase the amount we must invest to bring our projects into compliance and impose additional expense on our operations. In addition, private lawsuits or enforcement actions by federal, state, provincial, and/or foreign regulatory agencies may materially increase our costs. Certain environmental laws make us potentially liable on a joint and several basis for the remediation of contamination at or emanating from properties or facilities we currently or formerly owned or operated or properties to which we arranged for the disposal of hazardous substances. Such liability is not limited to the cleanup of contamination we actually caused. Although we seek to obtain indemnities against liabilities relating to historical contamination at the facilities we own or operate, we cannot provide any assurance that we will not incur liability relating to the remediation of contamination, including contamination we did not cause. We may not be able to obtain or maintain, from time to time, all required environmental regulatory approvals. A delay in obtaining any required environmental regulatory approvals or failure to obtain and comply with them could adversely affect our business and operating results.
Our activities and operations are subject to numerous health and safety laws and regulations, and if we violate such regulations, we could face penalties and fines.fines.
We are subject to numerous health and safety laws and regulations in each of the jurisdictions in which we operate. These laws and regulations require us to obtain and maintain permits and approvals and implement health and safety programs and procedures to control risks associated with our projects. Compliance with those laws and regulations can require us to incur substantial costs. Moreover, if our compliance programs are not successful, we could be subject to penalties or to revocation of our permits, which may require us to curtail or cease operations of the affected projects. Violations of laws, regulations and permit requirements may also result in criminal sanctions or injunctions.
Health and safety laws, regulations and permit requirements may change or become more stringent. Any such changes could require us to incur materially higher costs than we currently have. Our costs of complying with current and future health and safety laws, regulations and permit requirements, and any liabilities, fines or other sanctions resulting from violations of them, could adversely affect our business, financial condition, and operating results.
We are subject tovarious privacy and consumer protection laws.
Our privacy policy is posted on our website, and any failure by us or our vendor or other business partners to comply with it or with federal, state, or international privacy, data protection or security laws or regulations could result in regulatory or litigation-related actions against us, legal liability, fines, damages and other costs. We may also incur substantial expenses and costs in connection with maintaining compliance with such laws. For example, commencing in May 2018,Globally, laws such as the General Data Protection Regulation (the “GDPR”(“GDPR”) became fully effective with respect to the processing of personal information collected from individuals locatedin Europe and new and emerging state laws in the European Union. The GDPRUnited States on privacy, data, and related technologies, have created new compliance obligations and significantly increases fines for noncompliance. Although we take steps to protect the security of our customers’ personal information, we may be required to expend significant resources to comply with data breach requirements if third parties improperly obtain and use the personal information of our customers or we otherwise experience a data loss with respect to customers’ personal information. A major breach of our network security and systems could have negative consequences for our business and future prospects, including possible fines, penalties and damages, reduced customer demand for our services, and harm to our reputation and brand.
Risks Related to our Indebtedness
Our senior credit facility, project financing term loans and construction loans contain financial and operating restrictions that may limit our business activities and our access to credit and they may not be sufficient to fund our capital needs and growth.
Provisions in our senior credit facility and term loan, project financing term loans and construction loans impose customary restrictions on our and certain of our subsidiaries’ business activities and uses of cash and other collateral. These agreements also contain other customary covenants, including covenants that require us to meet specified financial ratios and financial tests.
We have a $200 million revolving senior secured credit facility and $75 million term loan that mature March 2025 as well as a $220 million delayed draw term loan that matures September 4, 2023 (collectively, the “Senior Credit Facilities”), which are subject to the quarter end ratio covenant described below as well as certain other customary operational covenants. As of December 31, 2022, the balance of our Senior Credit Facilities were $477.9 million. These Senior Credit Facilities may not be sufficient to meet our needs as our business grows, and we may be unable to extend or replace them on acceptable terms, or at all. Under these facilities, we are required to maintain a maximum ratio of total funded debt to EBITDA (as defined in the agreement) of less than 4.0 to 1.0 as of December 31, 2022 and 3.5 to 1.0 beginning with the quarter ending March 31, 2023. We are also required to maintain a debt service coverage ratio (as defined in the agreements) of at least 1.5 to 1.0. EBITDA for purposes of the facilities excludes the results of certain renewable energy projects that we own and for which financing from others remains outstanding and the results of our joint ventures.
In addition, our project financing term loans and construction loans require us to comply with a variety of financial and operational covenants. Although we do not consider it likely that we will fail to comply with any material covenants for the next twelve months, we cannot assure that we will be able to do so. Our failure to comply with these covenants may result in the declaration of an event of default and cause us to be unable to borrow under our Senior Credit Facilities. In addition to preventing additional borrowings under these facilities, an event of default, if not cured or waived, may result in the acceleration of the maturity of indebtedness outstanding under it or the applicable project financing term loan, which would require us to pay all amounts outstanding. If an event of default occurs, we may not be able to cure it within any applicable cure period, if at all. Certain of our debt agreements, including our Senior Credit Facilities, also contain subjective acceleration clauses based on a lender deeming that a “material adverse change” in our business has occurred. If these clauses are implicated, and the lender declares that an event of default has occurred, the outstanding indebtedness would likely be immediately due and owing. If the maturity of our indebtedness is accelerated, we may not have sufficient funds available for repayment or we may not have the ability to borrow or obtain sufficient funds to replace the accelerated indebtedness on terms acceptable to us or at all.
If our subsidiaries default on their obligations under their debt instruments, we may need to make payments to lenders to prevent foreclosure on the collateral securing the debt.
We typically set up subsidiaries to own and finance our renewable energy projects. These subsidiaries incur various types of debt which can be used to finance one or more projects. This debt is typically structured as non-recourse debt, which means it is repayable solely from the revenues from the projects financed by the debt and is secured by such projects’ physical assets, major contracts and cash accounts and a pledge of our equity interests in the subsidiaries involved in the projects. Although our subsidiary debt is typically non-recourse to Ameresco, if a subsidiary of ours defaults on such obligations, or if one project out of several financed by a particular subsidiary’s indebtedness encounters difficulties or is terminated, then we may from time to time determine to provide financial support to the subsidiary in order to maintain rights to the project or otherwise avoid the adverse consequences of a default. In the event a subsidiary defaults on its indebtedness, its creditors may foreclose on the collateral securing the indebtedness, which may result in our losing our ownership interest in some or all of the subsidiary’s assets. The loss of our ownership interest in a subsidiary or some or all of a subsidiary’s assets could have a material adverse effect on our business, financial condition and operating results.
The London interbank offered rate (“LIBOR”) calculation method under certain of our financing arrangements may change as LIBOR is expected to be phased out by June 2023.
Certain of our project financing term loans permit or require interest on the outstanding principal balance to be calculated based on LIBOR. After June 30, 2023, the United Kingdom Financial Conduct Authority (the “FCA”) will no longer require banks to submit rates for the calculation of LIBOR. As a result, actions by the FCA, other regulators, or law enforcement agencies may result in changes to the method by which LIBOR is calculated. While we have transitioned our senior credit facilities and some of our other financing arrangements from LIBOR, we still have financing arrangement that utilize LIBOR, and we cannot predict the effect of the FCA or any other reforms to LIBOR that may be enacted in the United Kingdom or elsewhere.
We are exposed to the credit risk of some of our customers.
Most of our revenues are derived under multi-year or long-term contracts with our customers, and our revenues are therefore dependent to a large extent on the creditworthiness of our customers. During periods of economic downturn, our exposure to credit risks from our customers increases, and our efforts to monitor and mitigate the associated risks may not be effective in reducing our credit risks. In the event of non-payment by one or more of our customers, our business, financial condition and operating results could be adversely affected.
Fluctuations in foreign currency exchange rates can impact our results.
A portion of our total revenues are generated outside of the United States in currencies including Canadian dollars, British pound sterling and Euros. Changes in exchange rates between the currencies in which we generate revenues, may adversely affect our operating results.
A failure of our information technology (“IT”) and data security infrastructure could adversely impact our business and operations.
We rely upon the capacity, reliability and security of our IT and data security infrastructure and our ability to expand and continually update this infrastructure in response to the changing needs of our business. As we implement new systems, they may not perform as expected. We also face the challenge of supporting our older systems and implementing necessary upgrades. If we experience a problem with the functioning of an important IT system or a security breach of our IT systems, including during system upgrades and/or new system implementations, the resulting disruptions could have an adverse effect on our business.
We and certain of our third-party vendors receive and store personal information in connection with our human resources operations and other aspects of our business. Despite our implementation of security measures, our IT systems, like those of other companies, are vulnerable to damages from computer viruses, natural disasters, unauthorized access, cyber attack and other similar disruptions, and we have experienced such incidents in the past. Any system failure, accident or security breach could result in disruptions to our operations. A material network breach in the security of our IT systems could include the theft of our intellectual property, trade secrets, customer information, human resources information or other confidential matter. Although past incidents have not had a material impact on our business operations or financial performance, to the extent that any disruptions or security breach results in a loss or damage to our data, or an inappropriate disclosure of confidential, proprietary or customer information, it could cause significant damage to our reputation, affect our relationships with our customers, lead to claims against the Company and ultimately harm our business. In addition, we may be required to incur significant costs to protect against damage caused by these disruptions or security breaches in the future. See the discussion of GDPR in the above risk factor “We are subject to various privacy and consumer protection laws” for an example of new regulations impacting IT risk.
Risks Related to Ownership of Our Class A Common Stock
The trading price of our Class A common stock is volatile.
The trading price of our Class A common stock is volatile and could be subject to wide fluctuations. In addition, iffluctuations, some of which are beyond our control. During the year ended December 31, 2022, our Class A common stock has traded at a low of $40.73 and a high of $86.73. The stock market in general has experienced extreme price and volume fluctuations that have often been unrelated or disproportionate to the operating performance of publicly traded companies. If the stock market in general experiences a significant decline, the trading price of our Class A common stock could decline for reasons unrelated to our business, financial condition, or operating results. SomeAs a result of this volatility, you may not be able to sell your Class A common stock at or above the price you paid for it, and you may lose some or all of your investment. Additionally, although historically there has not been a large short position in our Class A common stock, securities of certain companies have recently experienced extreme and significant volatility as a result of a large aggregate short position driving up the stock price over a short period of time, which is known as a “short squeeze.” Furthermore, some companies that have had volatile market prices for their securities have had securities class actions filed against them. If a suit were filed against us, regardless of its merits or outcome, it would likely result in substantial costs and divert management’s attention and resources. This could have a material adverse effect on our business, operating results, and financial condition.
Holders of our Class A common stock are entitled to one vote per share, and holders of our Class B common stock are entitled to five votes per share. The lower voting power of our Class A common stock may negatively affect the attractiveness of our Class A common stock to investors and, as a result, its market value.
We have two classes of common stock: Class A common stock, which is listed on the NYSE and which is entitled to one vote per share, and Class B common stock, which is not listed on the any security exchange and is entitled to five votes per share. The difference in the voting power of our Class A and Class B common stock could diminish the market value of our Class A common stock because of the superior voting rights of our Class B common stock and the power those rights confer.
For the foreseeable future, Mr. Sakellaris or his affiliates will be able to control the selection of all members of our board of directors, as well as virtually every other matter that requires stockholder approval, which will severely limit the ability of other stockholders to influence corporate matters.
Except in certain limited circumstances required by applicable law, holders of Class A and Class B common stock vote together as a single class on all matters to be voted on by our stockholders. Mr. Sakellaris, our founder, principal stockholder, president, and chief executive officer, owns all of our Class B common stock, which, together with his Class A common stock, represents approximately 80%74% of the combined voting power of our outstanding Class A and Class B common stock. Under our restated certificate of incorporation, holders of shares of Class B common stock may generally transfer those shares to family members, including spouses and descendants or the spouses of such descendants, as well as to affiliated entities, without having the shares automatically convert into shares of Class A common stock. Therefore, Mr. Sakellaris, his affiliates, and his family members and descendants will, for the foreseeable future, be able to control the outcome of the voting on virtually all matters requiring stockholder approval, including the election of directors and significant corporate transactions such as an acquisition of our company, even if they come to own, in the aggregate, as little as 20% of the economic interest of the outstanding shares of our Class A and Class B common stock. Moreover, these persons may take actions in their own interests that you or our other stockholders do not view as beneficial.
Though we may repurchase shares of our Class A common stock pursuant to our recently announced share repurchase program, we are not obligated to do so and if we do, we may purchase only a limited number of shares of Class A common stock.
OnIn May 5, 2016, we announced a stock repurchase program under which the Company is currently authorized to repurchase, in the aggregate, up to $17.6 million of our outstanding Class A common stock. However, we are not obligated to acquire any shares of our Class A common stock, and holders of our Class A common stock should not rely on the share repurchase program to increase their liquidity. The amount and timing of any share repurchases will depend upon a variety of factors, including the trading price of our Class A common stock, liquidity, securities laws restrictions, other regulatory restrictions, potential alternative uses of capital, and market and economic conditions. We intend to purchaseAny stock repurchase would be through open market transactions or in privately negotiated transactions, in accordance with applicable securities laws and regulatory limitations. We may reduce or eliminate our share repurchase program in the future. The reduction or elimination of our share repurchase program, particularly if we do not repurchase the full number of shares authorized under the program, could adversely affect the market price of our common stock.
Item 1B. Unresolved Staff Comments
None.
Item 2. Properties
Our corporate headquarters is located in Framingham, Massachusetts, where we occupy approximately 26,00023,000 square feet under a lease expiring on June 30, 2025. We occupy nine regional offices in Phoenix, Arizona; Islandia, New York; Oak Brook, Illinois; Portland, Maine; Columbia, Maryland; Charlotte, North Carolina; Knoxville, Tennessee; Tomball, Texas; Spokane,Renton, Washington, and Richmond Hill, Ontario,Ontario; and London, England, each less than 25,00020,000 square feet, under lease or sublease agreements. In addition, we lease space, typically less space,of lesser size, for 7450 field offices throughout North America and the U.K.United Kingdom We also own 99160 small-scale renewable energy plants throughout North America and two in Ireland, which are located on leased sites we own or lease, or sites provided by customers. We expect to add new facilities and expand existing facilities as we continue to add employees and expand our business into new geographic areas.
Item 3. Legal Proceedings
In the ordinary conduct of our business we are subject to periodic lawsuits, investigations, and claims. Although we cannot predict with certainty the ultimate resolution of such lawsuits, investigations, and claims against us, we do not believe that any currently pending or threatened legal proceedings to which we are a party will have a material adverse effect on our business, results of operations, or financial condition.
As previously disclosed, the staff of the United States SEC requested information with respect to revenue recognition for our software-as-a-service businesses during the period beginning January 1, 2014 through September 30, 2020. We cooperated with the SEC’s request and in August 2022 the SEC staff notified us that their review has been concluded, and that they do not intend to recommend any further action at this time.
For additional information about certain proceedings, please refer to Note 15, “Commitments and Contingencies”, to our Consolidated Financial Statementsconsolidated financial statements included in this report,Report, which is incorporated into this item by reference.
Item 4. Mine Safety Disclosures
Not applicable.
PART II
| |
Item 5. | Market for Registrant’s Common Equity, Related Stockholder Matters and Issuer Purchases of Equity Securities |
Item 5. Market for Registrant’s Common Equity, Related Stockholder Matters, and Issuer Purchases of Equity Securities
Our Class A common stock trades on the New York Stock Exchange under the symbol “AMRC”.
As of March 2, 2020,February 24, 2023, and according to the records of our transfer agent, there were 1011 shareholders of record of our Class A common stock. A substantially greater number of holders of our Class A common stock are “street name” or beneficial holders, whose shares are held of record by banks, brokers, and other financial institutions.
Our Class B common stock is not publicly traded and is held of record by George P. Sakellaris, our founder, principal stockholder, president, and chief executive officer, as well as the Ameresco 2017 Annuity Trust, ofand a trust which Mr. Sakellaris isSakellaris’s immediate family members are trustee and the sole beneficiary.beneficiaries.
Dividend Policy
We have never declared or paid any cash dividends on our capital stock. We currently intend to retain earnings, if any, to finance the growth and development of our business and do not expect to pay any cash dividends for the foreseeable future. Our revolving senior secured credit facility contains provisions that limit our ability to declare and pay cash dividends during the term of that agreement. Payment of future dividends, if any, will be at the discretion of our board of directors and will depend on our financial condition, results of operations, capital requirements, restrictions contained in current or future financing instruments, provisions of applicable law and other factors our board of directors deems relevant.
Stock Performance Graph
The following performance graph and related information shall not be deemed “soliciting material” or to be “filed” with the SEC, nor shall such information be incorporated by reference into any future filing under the Securities Act of 1933 (the “Securities Act”) or the Exchange Act, except to the extent that we specifically incorporate it by reference into such filing.
The following graph compares the cumulative total return attained by shareholders on our Class A common stock relative to the cumulative total returns ofshareholders with the Russell 2000 index and the NASDAQ Clean Edge Green Energy index. AnThe information presented assumes an investment of $100 (with reinvestment of all dividends) is assumed to have been made in our Class A common stock on December 31, 2014,2017 and inthat all dividends were reinvested. The graph shows the value that each of these investments would have had at the indexes on December 31, 2014 and its relative performance is tracked through December 31, 2019.
COMPARISON OF FIVE-YEAR CUMULATIVE TOTAL RETURN*
Among Ameresco, Inc., the Russell 2000 Index
and the NASDAQ Clean Edge Green Energy Index
*$100 invested on December 31, 2014 in our Class A common stock or December 31, 2014 in respective index, including reinvestmentend of dividends. Fiscal year ending December 31, 2019. 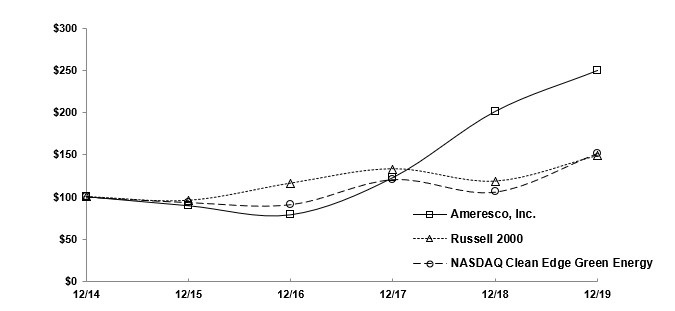
| | | | 12/31/2013 | | 12/31/2014 | | 12/31/2015 | | 12/31/2016 | | 12/31/2017 | | 12/31/2018 | | 12/31/2019 | | 12/31/2017 | | 12/31/2018 | | 12/31/2019 | | 12/30/2020 | | 12/30/2021 | | 12/31/2022 |
| Ameresco, Inc. | $100.00 | | $72.46 | | $64.70 | | $56.94 | | $89.03 | | $145.96 | | $250.00 | Ameresco, Inc. | $100.00 | | $163.95 | | $203.49 | | $607.44 | | $946.98 | | $664.42 |
| Russell 2000 Index | $100.00 | | $104.89 | | $100.26 | | $121.63 | | $139.44 | | $124.09 | | $148.49 | Russell 2000 Index | $100.00 | | $88.99 | | $111.70 | | $134.00 | | $153.85 | | $122.41 |
| NASDAQ Clean Edge Green Energy Index | $100.00 | | $107.02 | | $114.81 | | $113.17 | | $155.32 | | $140.36 | | $150.90 | NASDAQ Clean Edge Green Energy Index | $100.00 | | $87.89 | | $125.39 | | $357.14 | | $347.70 | | $242.88 |
Shareholder returns over the indicated period should not be considered indicative of future shareholder returns.
Issuer Purchases of Equity Securities
The following table provides information as of and for the quarter ended December 31, 2019 regardingWe did not repurchase any shares of our Class A common stock that were repurchased under our stock repurchase program authorized by the Board of Directors on April 27, 2016 (the “Repurchase Program”):
|
| | | | | | | | | | | | | |
| Period | Total Number of Shares Purchased | | Average Price Paid per Share | | Total Number of Shares Purchased as Part of Publicly Announced Plans or Programs | | Approximate Dollar Value of Shares that May Yet Be Purchased Under the Plans or Programs |
| October 1, 2019 - October 31, 2019 | — |
| | $ | — |
| | — |
| | $ | 5,907,722 |
|
| November 1, 2019 - November 30, 2019 | 300 |
| | 13.94 |
| | 300 |
| | 5,903,540 |
|
| December 1, 2019 - December 31, 2019 | — |
| | — |
| | — |
| | 5,903,540 |
|
| Total | 300 |
| | $ | 13.94 |
| | 300 |
| | $ | 5,903,540 |
|
during the quarter ended December 31, 2022. As of December 31, 2022, there were shares having a dollar value of approximately $5.9 million that may yet be purchased under the Repurchase Program.
Under the Repurchase Program, we are authorized to repurchase up to $17.6 million of our Class A common stock. Stock repurchases may be made from time to time through the open market and privately negotiated transactions. The amount and timing of any share repurchases will depend upon a variety of factors, including the trading price of our Class A common stock, liquidity, securities laws restrictions, other regulatory restrictions, potential alternative uses of capital, and market and economic conditions. The Repurchase Program may be suspended or terminated at any time without prior notice and has no expiration date.
Item 6. Selected Financial Data
You should read the following selected consolidated financial data in conjunction with Item 7 “Management’s Discussion and Analysis of Financial Condition and Results of Operations” and our consolidated financial statements and the related notes appearing in Item 8 “Financial Statements and Supplementary Data” of this Annual Report on Form 10-K. We prepare our financial statements in conformity with accounting principles generally accepted in the United States of America (“GAAP”).
We derived the consolidated statements of income data for the years ended December 31, 2019, 2018, and 2017 and the consolidated balance sheets data as of December 31, 2019 and 2018 from our audited consolidated financial statements appearing in Item 8 of this Annual Report on Form 10-K. We derived the consolidated statements of income data for the years ended December 31, 2016 and 2015, and the consolidated balance sheets data as of December 31, 2017, 2016, and 2015, from our audited consolidated financial statements that are not included in this Annual Report on Form 10-K. Our historical results are not necessarily indicative of the results to be expected in any future period.[Reserved]
|
| | | | | | | | | | | | | | | | | | | |
| | | | Year Ended December 31, |
| | 2019 | | 2018 | | 2017 | | 2016 | | 2015 |
| | | | (in thousands, except per share data) |
| Consolidated Statements of Income Data: | | | |
| | |
| | |
| | |
|
| Revenues | $ | 866,933 |
| | $ | 787,138 |
| | $ | 717,152 |
| | $ | 651,227 |
| | $ | 630,832 |
|
| Cost of revenues | 698,815 |
| | 613,526 |
| | 572,994 |
| | 516,883 |
| | 513,768 |
|
| Gross profit | 168,118 |
| | 173,612 |
| | 144,158 |
| | 134,344 |
| | 117,064 |
|
| Selling, general and administrative expenses | 116,504 |
| | 114,513 |
| | 107,570 |
| | 110,568 |
| | 110,007 |
|
| Operating income | 51,614 |
| | 59,099 |
| | 36,588 |
| | 23,776 |
| | 7,057 |
|
| Other expenses, net | 15,061 |
| | 16,709 |
| | 7,871 |
| | 7,409 |
| | 6,765 |
|
| Income before provision for income taxes | 36,553 |
| | 42,390 |
| | 28,717 |
| | 16,367 |
| | 292 |
|
| Income tax (benefit) provision | (3,748 | ) | | 4,813 |
| | (4,791 | ) | | 4,370 |
| | 4,976 |
|
| Net income (loss) | 40,301 |
| | 37,577 |
| | 33,508 |
| | 11,997 |
| | (4,684 | ) |
| Net loss attributable to redeemable non-controlling interests | 4,135 |
| | 407 |
| | 3,983 |
| | 35 |
| | 5,528 |
|
| Net income attributable to common shareholders | $ | 44,436 |
| | $ | 37,984 |
| | $ | 37,491 |
| | $ | 12,032 |
| | $ | 844 |
|
| Net income per share attributable to common shareholders: | | | |
| | |
| | |
| | |
|
| Basic | $ | 0.95 |
| | $ | 0.83 |
| | $ | 0.82 |
| | $ | 0.26 |
| | $ | 0.02 |
|
| Diluted | $ | 0.93 |
| | $ | 0.81 |
| | $ | 0.82 |
| | $ | 0.26 |
| | $ | 0.02 |
|
| Weighted average common shares outstanding: | | | |
| | |
| | |
| | |
|
| Basic | 46,586 |
| | 45,729 |
| | 45,509 |
| | 46,409 |
| | 46,494 |
|
| Diluted | 47,774 |
| | 46,831 |
| | 45,748 |
| | 46,493 |
| | 47,665 |
|
|
| | | | | | | | | | | | | | | | | | | |
| | As of December 31, |
| | 2019 | | 2018 | | 2017 | | 2016 | | 2015 |
| | (in thousands) |
| Consolidated Balance Sheets Data: | | | | | | | | | |
| Cash and cash equivalents | $ | 33,223 |
| | $ | 61,397 |
| | $ | 24,262 |
| | $ | 20,607 |
| | $ | 21,645 |
|
| Current assets | 425,192 |
| | 310,969 |
| | 287,078 |
| | 226,061 |
| | 263,698 |
|
Federal ESPC receivable(1) | 230,616 |
| | 293,998 |
| | 248,917 |
| | 158,209 |
| | 125,804 |
|
| Energy assets, net | 579,461 |
| | 459,952 |
| | 356,443 |
| | 319,758 |
| | 244,309 |
|
| Total assets | 1,374,013 |
| | 1,161,634 |
| | 983,951 |
| | 797,281 |
| | 723,440 |
|
| Current liabilities | 336,647 |
| | 222,630 |
| | 202,142 |
| | 190,602 |
| | 179,723 |
|
| Long-term debt, less current portion | 266,181 |
| | 219,162 |
| | 173,237 |
| | 140,593 |
| | 100,490 |
|
Federal ESPC liabilities(1) | 245,037 |
| | 288,047 |
| | 235,088 |
| | 133,003 |
| | 122,040 |
|
| Total stockholders’ equity | $ | 428,856 |
| | $ | 376,875 |
| | $ | 336,620 |
| | $ | 294,306 |
| | $ | 287,409 |
|
| |
(1) | Federal ESPC receivable represents the amount to be paid by various federal government agencies for work performed and earned by the Company under specific ESPCs. The Company assigns certain of its rights to receive those payments to third-party investors that provide construction and permanent financing for such contracts. Federal ESPC liabilities represent the advances received from third party investors under agreements to finance certain energy savings performance contract projects with various federal government agencies. Upon completion and acceptance of the project by the government, typically within 24 - 36 months of |
construction commencement, the ESPC receivable from the Government and corresponding related ESPC liability is eliminated from our consolidated balance sheets. Until recourse to us ceases for the ESPC receivables transferred to the investor, upon final acceptance of the work by the Government customer, we remain the primary obligor for financing received.
Item 7. Management’s Discussion and Analysis of Financial Condition and Results of Operations
You should read the following discussion and analysis of our financial condition and results of operations together with our consolidated financial statements and the related notes and other financial information included in Item 8 of this Annual Report on Form 10-K.Report. Some of the information contained in this discussion and analysis orare set forth elsewhere in this Report, including information with respect to our plans and strategy for our business and related financing, and includes forward-looking statements that involve risks and uncertainties. You should review the “Risk Factors” included in Item 1A of this Annual Report on Form 10-K for a discussion of important factors that could cause actual results to differ materially from the results described in or implied by the forward-looking statements contained in the following discussion and analysis.
Overview
Ameresco is a leading providerclean technology integrator with a comprehensive portfolio of energy efficiency and renewable energy supply solutions. We help organizations meet energy saving and energy management challenges with an integrated, comprehensive approach to energy efficiency and renewable energy. Leveraging budget neutral solutions, including ESPCs and PPAs, we aim to eliminate the financial barriers that traditionally hamper energy efficiency and renewable energy projects.
Drawing from decades of experience, Ameresco develops tailored energy management projects for facilities throughout North Americaits customers in the commercial, industrial, local, state and Europe. federal government, K-12 education, higher education, healthcare, public housing sectors, and utilities.
We provide solutions primarily throughout the U.S., Canada, the United Kingdom, and Europe, and our revenues are derived principally from energy efficiency projects, which entail the design, engineering, and installation of equipment and other measures that enable customersincorporate a range of innovative technology and techniques to reduce their energy consumption, lower their operatingimprove the efficiency and maintenance costs and realize environmental benefits. Our comprehensive setcontrol the operation of services includes upgrades to a facility’s energy infrastructureinfrastructure; this can include designing and the construction and operationconstructing a central plant or cogeneration system for a customer providing power, heat and/or cooling to a building, or other small-scale plant that produces electricity, gas, heat or cooling from renewable sources of small-scaleenergy. We also derive revenue from long-term O&M contracts, energy supply contracts for renewable energy plants.operating assets that we own, integrated-PV, and consulting and enterprise energy management services.
In addition to organic growth, strategic acquisitions of complementary businesses and assets, and joint venture arrangements have been an important part of our historical development. Since inception, we have completed numerous acquisitions, which have enabledgrowth enabling us to broaden our service offerings and expand our geographical reach. In December 2021, we completed the acquisition of Plug Smart, an Ohio-based energy services company that specializes in the development and implementation of budget neutral capital improvement projects including building controls and building automation systems, which is included in our U.S. Regions segment. The pro forma effects of this acquisition were not material to our operations for the fiscal years presented. During 2022, we entered into joint venture arrangements in Greece and California and acquired an operating wind farm in Ireland.
Energy Savings PerformanceKey Factors and Energy Trends
The Inflation Reduction Act
The IRA was signed into law by President Biden on August 16, 2022. The bill invests nearly $369 billion in energy and climate policies. The provisions of the IRA are intended to, among other things, incentivize domestic clean energy investment, manufacturing, and deployment. The IRA incentivizes the deployment of clean energy technologies by extending and expanding federal incentives such as the ITC and the Production Tax Credit (“PTC”). We view the enactment of the IRA as favorable for the overall business climate for the renewable energy industry, however, we are continuing to evaluate the overall impact and applicability of the IRA to our current and planned projects, and we may experience a delay in our sales cycles and new award activity as our customers consider the applicability of the IRA. The IRA may increase the competition in our industry and as such increase the demand and cost for labor, equipment and commodities needed for our projects.
Supply ContractsChain Disruptions and Other Global Factors
ForWe continue to monitor the impact of global economic conditions on our operations, financial results, and liquidity, including the result of supply chain challenges, development of the COVID-19 pandemic, war in Ukraine, evolving relations between the U.S. and China, and other geopolitical tensions. The impact to our future operations and results of operations as a result of these global trends remains uncertain and the challenges we face, including challenges and increases in costs for logistics and supply chains, such as increased port congestion, and intermittent supplier delays as well as shortage of certain components needed for our business, such as lithium-ion battery cells, semiconductors, and other components required for our clean energy solutions may continue or become more pronounced.
During the year ended December 31, 2022, we were impacted by supply chain disruptions and varying levels of inflation, as a result of COVID-19 and macroeconomic conditions, causing delays in the timely delivery of material to customer sites and delays and disruptions in the completion of certain projects, including those pursuant to the SCE Agreement, and increased shipping and transportation costs, as well as increased component and labor costs. This negatively impacted our results of operations during the year ended December 31, 2022. We expect the trends of supply chain challenges and inflationary pressures to continue beyond this year. We continue to monitor macroeconomic conditions to remain flexible and to optimize and evolve our business as appropriate to address the challenges presented from these conditions.
On April 1, 2022, the U.S. Department of Commerce initiated an investigation to determine whether imports of crystalline silicon photovoltaic cells and modules which are manufactured in Cambodia, Thailand, Vietnam, or Malaysia using components from China are circumventing existing anti-dumping (“ADD”) and countervailing duties (“CVD”) on solar cells and modules from China. The full investigation is estimated to take 365 days. In June 2022 President Biden announced an executive action which guaranteed that any duties that could be levied as a result of this investigation, will not be imposed on imports by U.S importers between June 2022 and June 2024.
While the Biden executive action will prevent new duties stemming from this investigation from being applied during this period, the Commerce Department investigation continues. In December 2022, the Department issued a preliminary determination which found that certain solar products from these four countries were, in fact, circumventing existing Chinese tariffs. The final results of the investigation are expected to be issued by May 1, 2023. If the Department upholds it preliminary ruling, new tariffs could be applied beginning June 2024. Additionally, legislation has been introduced in both the U.S. Senate and U.S. House of Representatives seeking to overturn President Biden’s executive action that suspended solar import duties.
Given that the Biden policy remains in place and that we have an existing inventory of solar panels from a large purchase several years ago, we do not expect that this investigation will have a material impact on our business in the near term. However, any resulting duties or other trade restrictions imposed may disrupt the solar panel supply chain, increase the cost for solar cells and panels, and ultimately impact the demand for clean energy solutions. We are closely monitoring the investigation and any regulations issued in connection with it.
Climate Change and Effects of Seasonality
The global emphasis on climate change and reducing carbon emissions has created opportunities for our industry. Sustainability has been at the forefront of our business since its inception and we are committed to staying at the leading edge of innovation taking place in the energy sector. We believe the next decade will be marked by dramatic changes in the power infrastructure with resources shifting to more distributed assets, storage, and microgrids to increase overall reliability and resiliency. The sustainability efforts are impacted by regulations, and changes in the regulatory climate may impact the demand for our products and offerings. See “Our business depends in part on federal, state, provincial and local government support or the imposition of additional taxes, tariffs, duties, or other assessments on renewable energy or the equipment necessary to generate or deliver it, for energy efficiency and renewable energy, and a decline in such support could harm our business” and “Compliance with environmental laws could adversely affect our operating results” in Item 1A, Risk Factors..
Climate change also brings risks, as the impacts have caused us to experience more frequent and severe weather interferences, and this trend is expected to continue. We are subject to seasonal fluctuations and construction cycles, particularly in climates that experience colder weather during the winter months, such as the northern United States and Canada, and climates that experience extreme weather events, such as wildfires, storms or flooding, hurricanes, or at educational institutions, where large projects are typically carried out during summer months when their facilities are unoccupied. In addition, government customers, many of which have fiscal years that do not coincide with ours, typically follow annual procurement cycles and appropriate funds on a fiscal-year basis even though contract performance may take more than one year. Further, government contracting cycles can be affected by the timing of, and delays in, the legislative process related to government programs and incentives that help drive demand for energy efficiency and renewable energy projects. As a result, our revenues and operating income in the third and fourth quarter are typically higher, and our revenues and operating income in the first quarter are typically lower, than in other quarters of the year, however, this may become harder to predict with the potential effects of climate change. As a result of such fluctuations, we typically entermay occasionally experience declines in revenues or earnings as compared to the immediately preceding quarter, and comparisons of our operating results on a period-to-period basis may not be meaningful.
Our annual and quarterly financial results are also subject to significant fluctuations as a result of other factors, many of which are outside our control. See “Our business is affected by seasonal trends and construction cycles, and these trends and cycles could have an adverse effect on our operating results” in Item 1A, Risk Factors.
The SCE Agreement
In October 2021, we entered into ESPCs,a contract with SCE to design and build three grid scale BESS at three sites near existing substation parcels throughout SCE’s service territory in California with an aggregate capacity of 537.5 MW (“the SCE Agreement”). The engineering, procurement and construction price is approximately $892.0 million, in the aggregate, including two years of O&M revenues, subject to customary potential adjustments for changes in the work. The SCE Agreement required substantial completion of all facilities, subject to extension for specified force majeure events and customer-caused delays, to be completed no later than August 1, 2022 (the “Guaranteed Completion Date”) and provided for availability and capacity guarantees. We have made force majeure claims under which we agreethe SCE Agreement as battery supply delays resulting from COVID-19 lockdowns in several regions around China, newly implemented Chinese transportation safety policies and related supply chain delays impacted our ability to develop, design, engineer and construct a project andachieve the Guaranteed Completion Date on August 1, 2022. In 2022, SCE also commit thatinstructed us to adjust the project will satisfy agreed-upon performance standards that vary from projectschedule into 2023 and in early 2023 we made further weather-related force majeure claims. Under the terms of the SCE Agreement, we are entitled to project. These performance commitmentsrecover costs associated with schedule changes requested by SCE. We are typicallyworking with SCE to analyze and estimate these costs as well as the applicability and scope of force majeure relief based on our force majeure claims. If we fail to come to an agreement with SCE about extensions to the design, capacity, efficiency or operationGuaranteed Completion Date and the applicability of the specific equipment and systemsforce majeure relief, we install. Our commitments generally fall into three categories: pre-agreed, equipment-level and whole building-level. Under a pre-agreed energy reduction commitment, our customer reviews the project design in advance and agrees that, upon or shortly after completion of installation of the specified equipment comprising the project, the commitment will have been met. Under an equipment-level commitment, we commit to a level of energy use reduction based on the difference in use measured first with the existing equipment and then with the replacement equipment. A whole building-level commitment requires demonstration of energy usage reduction for a whole building, often based on readings of the utility meter where usage is measured. Depending on the project, the measurement and demonstration may be required only once, upon installation, based on an analysis of one or more sample installations, or may be required to be repeated at agreed upon intervals generally overpay liquidated damages up to 25an aggregate maximum of $89 million and may not be able to recover costs associated with schedule changes, and under certain circumstances SCE may have a right to terminate the agreement.
Despite the delays, the SCE projects progressed further during the quarter ended December 31, 2022. Considering the schedule adjustments requested by SCE and the delays disclosed earlier, we anticipate the projects to be in service and achieve substantial completion prior to the summer of 2023. However, a majority of our revenues under this contract were recognized in 2022 based upon costs incurred in 2022 relative to total expected costs on this project.
Stock-based Compensation
During the year ended December 31, 2022, we granted 1,605,000 common stock options to certain employees and 12,978 restricted stock units to our non-employee Directors’ under our 2020 Stock Incentive Plan. As a result, our stock-based compensation expense increased from $8.7 million for the year ended December 31, 2021 to $15.0 million for the year ended December 31, 2022. The increase in the number of stock options granted and higher grant date fair value resulted in the increased stock-based compensation in 2022. In addition, our unrecognized stock-based compensation expense increased from $41.1 million at December 31, 2021 to $46.7 million at December 31, 2022, and is expected to be recognized over a weighted-average period of three years. See Note 14 “Stock-based Compensation and Other Employee Benefits” for additional information.
UnderBacklog and Awarded Projects
Backlog is an important metric for us because we believe strong order backlogs indicate growing demand and a healthy business over the medium to long term, conversely, a declining backlog could imply lower demand.
The following table presents our contracts,backlog:
| | | | | | | | | | | |
| As of December 31, |
| (In Thousands) | 2022 | | 2021 |
| Project Backlog | | | |
| Fully-contracted backlog | $ | 1,001,325 | | | $ | 1,509,300 | |
| Awarded, not yet signed customer contracts | 1,638,640 | | | 1,542,760 | |
| Total project backlog | $ | 2,639,965 | | | $ | 3,052,060 | |
| 12-month project backlog | $ | 595,020 | | | $ | 1,296,410 | |
| | | |
| O&M Backlog | | | |
| Fully-contracted backlog | $ | 1,231,120 | | | $ | 1,131,660 | |
| 12-month O&M backlog | $ | 89,520 | | | $ | 70,306 | |
Our $892 million SCE Agreement was entered into in October 2021 and increased our fully-contracted backlog at December 31, 2021 compared to December 31, 2022, and the majority of our revenues under this contract were recognized in 2022.
Total project backlog represents energy efficiency projects that are active within our sales cycle. Our sales cycle begins with the initial contact with the customer and ends, when successful, with a signed contract, also referred to as fully-contracted backlog.
Our sales cycle recently has been averaging 18 to 42 months. Awarded backlog is created when a potential customer awards a project to Ameresco following a request for proposal. Once a project is awarded but not yet contracted, we typically do notconduct a detailed energy audit to determine the scope of the project as well as identify the savings that may be expected to be generated from upgrading the customer’s energy infrastructure. At this point, we also determine the subcontractor, what equipment will be used, and assist in arranging for third party financing, as applicable. Recently, awarded projects have been taking an average of 12 to 24 months to result in a signed contract and convert to fully-contracted backlog. It may take responsibility for a wide varietylonger, as it depends on the size and complexity of factors outsidethe project. Historically, approximately 90% of our controlawarded backlog projects have resulted in a signed contract. After the customer and exclude or adjustAmeresco agree to the terms of the contract and the contract becomes executed, the project moves to fully-contracted backlog. The contracts reflected in our fully-contracted backlog typically have a construction period of 12 to 36 months and we typically expect to recognize revenue for such factors in commitment calculations. These factors include variations incontracts over the same period.
Our O&M backlog represents expected future revenues under signed multi-year customer contracts for the delivery of O&M services, primarily for energy pricesefficiency and utility rates, weather, facility occupancy schedules,renewable energy construction projects completed by us for our customers.
We define our 12-month backlog as the estimated amount of energy-using equipment in a facility and the failure of the customerrevenues that we expect to operate or maintain the project properly. Typically, our performance commitments apply to the aggregate overall performance of a project rather than to individual energy efficiency measures. Therefore, to the extent an individual measure underperforms, it may be offset by other measures that overperform during the same period. In the event that an energy efficiency project does not perform according to the agreed-upon specifications, our agreements typically allow us to satisfy our obligation by adjusting or modifying the installed equipment, installing additional measures to provide substitute energy savings or paying the customer for lost energy savings based on the assumed conditions specifiedrecognize in the agreement. Manynext twelve months from our fully-contracted backlog. See Note 2 “Summary of Significant Accounting Policies” for our equipment supply, local design and installation subcontracts contain provisions that enable us to seek recourse against our vendors or subcontractors if there is a deficiency in our energy reduction commitment.revenue recognition policies. See “We may have liabilitynot recognize all revenues from our backlog or receive all payments anticipated under awarded projects and customer contracts” and “In order to our customers under our ESPCs if oursecure contracts for new projects, fail to deliver the energy use reductions to which we are committed under the contract”typically face a long and variable selling cycle that requires significant resource commitments and requires a long lead time before we realize revenues” in Item 1A, Risk FactorsFactors.
Assets in this Annual Report on Form 10-K.Development
Payments byAssets in development, which represents the federal governmentpotential design/build project value of small-scale renewable energy plants that have been awarded or for energy efficiency measureswhich we have secured development rights, were estimated at $1,625.7 million as of December 31, 2022, including $98.8 million attributable to a non-controlling interest, and $1,247.5 million as of December 31, 2021. The portion related to spending for EaaS assets was approximately $36.4 million and $70.0 million at December 31, 2022 and 2021, respectively. These are based onalso important metrics because they help us gauge our future capacity to generate electricity or deliver renewable gas fuel which contributes to our recurring revenue stream.
Results of Operations
The following table sets forth certain financial data from the services providedconsolidated statements of income for the periods indicated (1):
| | | | | | | | | | | | | | | | | | | | | | | | | | | | | | | | | | | |
| Year Ended December 31, | | | | |
| 2022 | | 2021 | | Year-Over-Year Change |
| (In Thousands) | Dollar Amount | | % of Revenues | | Dollar Amount | | % of Revenues | | Dollar Change | | % Change |
| Revenues | $ | 1,824,422 | | | 100.0 | % | | $ | 1,215,697 | | | 100.0 | % | | $ | 608,725 | | | 50.1 | % |
| Cost of revenues | 1,533,589 | | | 84.1 | % | | 985,340 | | | 81.1 | % | | 548,249 | | | 55.6 | % |
| Gross profit | 290,833 | | | 15.9 | % | | 230,357 | | | 18.9 | % | | 60,476 | | | 26.3 | % |
| Selling, general and administrative expenses | 157,841 | | | 8.7 | % | | 134,923 | | | 11.1 | % | | 22,918 | | | 17.0 | % |
| | | | | | | | | | | |
| Operating income | 132,992 | | | 7.3 | % | | 95,434 | | | 7.9 | % | | 37,558 | | | 39.4 | % |
| Other expenses, net | 27,273 | | | 1.5 | % | | 17,290 | | | 1.4 | % | | 9,983 | | | 57.7 | % |
| Income before income taxes | 105,719 | | | 5.8 | % | | 78,144 | | | 6.4 | % | | 27,575 | | | 35.3 | % |
| Income tax expense (benefit) | 7,170 | | | 0.4 | % | | (2,047) | | | (0.2) | % | | 9,217 | | | (450.3) | % |
| Net income | $ | 98,549 | | | 5.4 | % | | $ | 80,191 | | | 6.6 | % | | $ | 18,358 | | | 22.9 | % |
| Net income attributable to non-controlling interest and redeemable non-controlling interest | $ | (3,623) | | | (0.2) | % | | $ | (9,733) | | | (0.8) | % | | $ | (6,110) | | | (62.8) | % |
| Net income attributable to common shareholders | $ | 94,926 | | | 5.2 | % | | $ | 70,458 | | | 5.8 | % | | $ | 24,468 | | | 34.7 | % |
| | | | | | | | | | | |
(1) A comparison of our 2021 and 2020 results can be found in Item 7 of our 2021 Form 10-K filed with the SEC. |
Our results of operations for the year-ended December 31, 2022 reflect year-over-year growth in terms of revenues, operating income, and net income attributable to common shareholders. All financial result comparisons are against the products installed, but are limited to the savings derived from such measures, calculated in accordance with federal regulatory guidelines and the specific contract’s terms. The savings are typically determined by comparing energy use and other costs before and after the installation of the energy efficiency measures, adjusted for changes that affect energy use and other costs but are not caused by the energy efficiency measures.prior year period.
Our strong operating results are due to the following:
For•Revenue: total revenues increased primarily due to a $577.3 million, or 64%, increase in our project revenue attributed to the timing of revenue recognized based upon costs incurred to date relative to total expected costs on active projects, involvingincluding our SCE battery storage project.
•Cost of Revenues and Gross Profit: the constructionincrease in cost of revenues is primarily due to the increase in project revenues described above, however, our gross profit as a small-scale renewable energy plant that we ownpercent of revenues decreased due to the higher revenue contribution from our lower margin, design-build SCE battery storage project.
•Selling, General and operate, we generally enter into long-term contractsAdministrative Expenses: the increase is primarily due to supplyhigher net salaries and benefits of $13.4 million as a result of increased headcount and an increase in non-cash stock-based compensation expense and higher insurance costs related to the electricity, processed LFG, heat or cooling generatedcontinued growth of the business.
•Other Expenses, Net: Other expenses, net, includes gains and losses from derivatives transactions, foreign currency transactions, interest expense, interest income, amortization of financing costs and certain government incentives. Other expenses, net increased primarily due to higher interest expenses, net of interest income of $12.1 million related to a higher average balance on our senior secured debt facility, partially offset by an increase in government incentives of $1.6 million.
•Income before Income Taxes: the increase is due to reasons described above.
•Income Tax Expense (Benefit): the provision for income taxes is based on various rates set by federal, state, provincial, and local authorities and is affected by permanent and temporary differences between financial accounting and tax reporting requirements. The effective tax rate was higher in 2022 as compared to 2021 primarily due to higher domestic income resulting in higher state taxes, lower levels of compensation deductions related to employee stock option exercises, and less favorable tax adjustments related to partnership flip transactions, partially offset by the plantavailability of additional Section 179D deductions for 2021 and 2022. The tax benefit rate for 2021 was favorable, primarily due to increases in the benefits associated with energy efficiency tax incentives, including Section 48 Solar Investment Tax Credits, deductions associated with the Section 179D Commercial Buildings Energy Efficiency Tax Deduction, and compensation deductions resulting from employee stock option disqualifying dispositions.
•Net Income and Earnings Per Share: Net income attributable to common shareholders increased due to the customer, which is typically a utility, municipality, industrial facility or other large purchaserreasons described above. Basic earnings per share for 2022 was $1.83 an increase of energy. The rights$0.45 per share compared to use the site2021. Diluted earnings per share for 2022 was $1.78, an increase of $0.43 per share, compared to 2021.
Business Segment Analysis
Our reportable segments for the plantyear ended December 31, 2022 were U.S. Regions, U.S. Federal, Canada, Alternative Fuels (formerly Non-Solar Distributed Generation (“Non-Solar DG”)), and All Other. On January 1, 2022, we changed the structure of our internal organization, and our “All Other” segment now includes our U.S.-based enterprise energy management services previously included in our U.S Regions segment and our U.S. Regions segment now includes U.S. project revenue and associated costs previously included in our former Non-Solar DG segment. As a result, previously reported amounts have been reclassified for comparative purposes. See Note 20 “Business Segment Information” for additional information about our segments.
Revenues
| | | | | | | | | | | | | | | | | | | | | | | |
| Year Ended December 31, | | Year-Over-Year Change |
| (In Thousands) | 2022 | | 2021 | | Dollar Change | | % Change |
| U.S. Regions | $ | 1,123,343 | | | $ | 551,118 | | | $ | 572,225 | | | 103.8 | % |
| U.S. Federal | 391,891 | | | 392,948 | | | (1,057) | | | (0.3) | |
| Canada | 58,558 | | | 49,483 | | | 9,075 | | | 18.3 | |
| Alternative Fuels | 114,459 | | | 111,223 | | | 3,236 | | | 2.9 | |
| All Other | 136,171 | | | 110,925 | | | 25,246 | | | 22.8 | |
| Total revenues | $ | 1,824,422 | | | $ | 1,215,697 | | | $ | 608,725 | | | 50.1 | % |
| | | | | | | |
| | | | | |
| | | | | | | |
| | | | | | | |
| | | | | | | |
•U.S. Regions: the increase is primarily due to a $561.0 million, or 115%, increase in project revenues attributable to the timing of revenue recognized based upon costs incurred to date relative to total expected costs on active projects, including our SCE battery storage project, versus the prior year and a $7.9 million, or 20%, increase in revenue from the growth of our energy assets in operation.
•U.S. Federal: the decrease is primarily due to a $6.8 million, or 2%, decrease in project revenue attributable to the timing of revenue recognized as a result of the phase of active projects compared to the prior year, partially offset by an
increase of $4.8 million in O&M revenue and a $0.9 million, or 19%, increase in revenue from the growth of our energy assets in operation.
•Canada: the increase is primarily due to higher project revenues which were partially offset by unfavorable foreign exchange rates.
•Alternative Fuels: the increase is primarily due to a $2.3 million, or 2%, increase in energy asset revenues resulting from the continued growth of our operating portfolio and increased renewable gas production levels.
•All Other: the increase is due to a $15.7 million increase in project revenues primarily in the United Kingdom related to an increase in volume and progression of certain active projects and a $8.5 million increase in integrated-PV revenues resulting from increased activity in the oil and gas market.
Income before Income Taxes and Unallocated Corporate Activity
| | | | | | | | | | | | | | | | | | | | | | | |
| Year Ended December 31, | | Year-Over-Year Change |
| (In Thousands) | 2022 | | 2021 | | Dollar Change | | % Change |
| U.S. Regions | $ | 88,531 | | | $ | 38,285 | | | $ | 50,246 | | | 131.2 | % |
| U.S. Federal | 50,866 | | | 52,388 | | | (1,522) | | | (2.9) | |
| Canada | 2,554 | | | 1,581 | | | 973 | | | 61.5 | |
| Alternative Fuels | 22,989 | | | 27,774 | | | (4,785) | | | (17.2) | |
| All Other | 11,959 | | | 5,477 | | | 6,482 | | | 118.3 | |
| Unallocated corporate activity | (71,180) | | | (47,361) | | | (23,819) | | | 50.3 | |
| Income before income taxes | $ | 105,719 | | | $ | 78,144 | | | $ | 27,575 | | | 35.3 | % |
| | | | | | | |
| | | | | |
| | | | | | | |
| | | | | | | |
| | | | | | | |
•U.S. Regions: the increase is primarily due to the higher revenues described above, partially offset by higher salaries and benefit costs, and other expenses which included a non-cash adjustment to recognize additional contingent consideration related to one of our acquisitions.
•U.S. Federal: the decrease is due primarily to the decrease in revenues described above, partially offset by a decrease in operating expenses attributed to an increase in earnings recognized from an unconsolidated equity investment.
•Canada: the increase is primarily due to the increase in project revenues described above.
•Alternative Fuels: the decrease is primarily due to higher direct costs related to unplanned downtime, higher depreciation expense related to the timing of assets placed in operations, and higher interest expense, partially offset by lower mark to market losses on our unhedged commodity gas swaps, and lower other expenses which included an impairment charge in the prior year.
•All Other: the increase is primarily due to higher revenues noted above.
•Unallocated corporate activity includes all corporate level selling, general and administrative expenses and other expenses not allocated to the reportable segments. We do not allocate any indirect expenses to the segments. Corporate activity increased primarily due to higher salaries and benefit costs of $9.8 million, which includes a $6.3 million increase in non-cash stock-based compensation expense due to increased option grants with a higher grant date fair value, and increased insurance costs and interest expenses described above.
Liquidity and Capital Resources
Overview
Since inception, we have funded operations primarily through cash flow from operations, advances from Federal ESPC projects, our senior secured credit facility, and various forms of other debt (see “Project Financing” below). In addition, in March 2021, we completed an underwritten public offering of 2,875,000 shares of our Class A Common Stock, for total net proceeds of $120.1 million. See Note 13 “Equity and Earnings per Share” for additional information.
Working capital requirements can be susceptible to fluctuations during the year due to timing differences between costs incurred, the timing of milestone-based customer invoices and actual cash collections. Working capital may also be affected by seasonality, growth rate of revenue, long lead-time equipment purchase patterns, advances from Federal ESPC projects, and payment terms for payables relative to customer receivables.
We expect to incur additional expenditures in connection with somethe following activities:
•equity investments, energy asset acquisitions and business acquisitions that we may fund from time to time
•capital investment in current and future energy assets
•material, equipment, and other expenditures for large projects
We regularly monitor and assess our ability to meet funding requirements. We believe that cash and cash equivalents, working capital and availability under our revolving senior secured credit facility, combined with our right (subject to lender consent) to increase our revolving credit facility by $100.0 million, and our general access to credit and equity markets, will be sufficient to fund our operations for twelve months from filing this Report and thereafter. We funded a significant portion of the contract expenditures for our SCE battery storage project in advance of customer receipts during the year ended December 31, 2022. With the schedule adjustment requested by SCE and the anticipated timeline for completing the projects, we expect to continue to incur and fund capital expenditures for the riskSCE battery project into the first half of 2023, net of any cash collected on amounts invoiced.
We continue to evaluate and take action, as necessary, to preserve adequate liquidity and ensure that fuel prices will increase”our business can continue to operate and that we can meet our capital requirements during these uncertain times. This may include limiting discretionary spending across the organization and re-prioritizing our capital projects amid times of political unrest, the evolution of the COVID-19 pandemic, the duration of supply challenges, and the rate and duration of the inflationary pressures. For example, increases in reference Item 1A, Risk Factorsinflation and interest rates have impacted overall market returns on assets. We have therefore been particularly prudent in this Annual Report on Form 10-K.our capital commitments over the past few quarters, ensuring that our assets in development continue to align with our hurdle rates.
Senior Secured Credit Facility — Revolver and Term Loans
On March 4, 2022, we entered into the fifth amended and restated senior secured credit facility, which increased the aggregate amount of total commitments from $245.0 million to $495.0 million. This amendment increased the aggregate amount of the revolving commitments from $180.0 million to $200.0 million, increased the existing term loan A to $75.0 million, and extended the maturity date of the revolving commitment and term loan A from June 28, 2024 to March 4, 2025. In addition, it added a delayed draw term loan A for up to $220.0 million through a September 4, 2023 maturity date, increased the total funded debt to EBITDA covenant ratio from a maximum of 3.50 to 4.50 for the quarter ended March 31, 2022; 4.25 for the quarter ended June 30, 2022; 4.00 for the quarters ended September 30, 2022 and December 31, 2022; and 3.50 thereafter. The amendment also specified the debt service coverage ratio to be less than 1.5 and increased our limit under an energy conservation project financing to $650.0 million, which provides us with flexibility to grow our federal business further. At December 31, 2022, our senior secured credit facility outstanding was $477.9 million, we had funds of $0.3 million available under the revolving credit facility, and had $16.8 million in letters of credit outstanding.
On June 9, 2022, we entered into the first amendment to the fifth amended and restated senior secured credit facility, which temporarily increased the maximum indebtedness incurred under an energy conservation project financing from $650.0 million to $725.0 million from and after April 1, 2022 to and including December 30, 2022. As of December 31, 2022, the maximum indebtedness incurred under an energy conservation project financing reverted back to $650,000.
Project Financing
To financeNon-recourse Construction Revolvers and Term Loans
We have entered into a number of construction and term loan agreements for the purpose of constructing and owning certain renewable energy plants. The physical assets and the operating agreements related to the renewable energy plants are generally owned by wholly owned, single member “special purpose” subsidiaries of Ameresco. These construction and term loans are structured as project financings made directly to a subsidiary, and upon commercial operation and achieving certain milestones in the credit agreement, the related construction loan converts into a term loan. While we are required under generally accepted accounting principles (“GAAP”) to reflect these loans as liabilities on our consolidated balance sheets, they are generally non-recourse and not direct obligations of Ameresco, Inc.
Our project financing facilities contain various financial and other covenant requirements which include debt service coverage ratios and total funded debt to EBITDA, as defined. Any failure to comply with the financial or other covenants of our project financings would result in inability to distribute funds from the wholly-owned subsidiary to Ameresco, Inc. or constitute an event of default in which the lenders may have the ability to accelerate the amounts outstanding, including all accrued interest and unpaid fees.
Material non-recourse construction revolvers and term loan financing during the year ended December 31, 2022 was our Non-recourse Fixed Rate Note, 6.50%, due October 2037.
As of December 31, 2022, our total construction and term loans outstanding was $300.8 million. See Note 9 “Debt and Financing Lease Liabilities” for additional information about these loans.
Non-recourse Sale-leasebacks and Financing Leases
We have entered into sale-leaseback arrangements for solar PV energy assets with multiple investors and in accordance with Topic 842, Leases, all sale-leaseback transactions that occurred after December 31, 2018, were accounted for as failed sales and the proceeds received from the transactions were recorded as long-term financing facilities.
As of December 31, 2022, our total sale-leasebacks classified as long-term financing facilities outstanding was $120.9 million.
As of December 31, 2022, our total financing leases outstanding was $16.1 million. These are our sale-leaseback arrangements entered into as of December 31, 2018 which remain under the previous guidance.
See Notes 8 “Leases” and 9 “Debt and Financing Lease Liabilities” for additional information on these financing facilities.
While we are required under GAAP to reflect these lease payments as liabilities on our consolidated balance sheets, they are generally non-recourse and not direct obligations of Ameresco Inc., except that we have guaranteed certain obligations relating to taxes and project warranties, operation, and maintenance.
Federal ESPC Liabilities
We have arrangements with certain third-parties to provide advances to us during the construction or installation of projects withfor certain customers, typically federal governmental agencies, we typically sellentities, in exchange for our assignment to third-partythe lenders of our rightrights to receive a portion of the long-term paymentsreceivables arising from the customer arising outESPCs related to such projects. These financings totaled $478.5 million in principal amounts as of the project for a purchase price reflecting a discount to the aggregate amount due from the customer. The purchase price is generally advanced to us over the implementation period based on completed work or a schedule predetermined to coincide with the constructionDecember 31, 2022 and $532.3 million as of the project.December 31, 2021. Under the terms of these financing arrangements, we are required to complete the construction or installation of the project in accordance with the contract with our customer, and the liability remains on our consolidated balance sheets until the completed project is accepted by the customer. Once
We are the completed project is acceptedprimary obligor for financing received, but only until final acceptance of the work by the customer. At this point recourse to us ceases and the ESPC receivables are transferred to the investor. The transfers of receivables under these agreements do not qualify for sales accounting until final customer acceptance of the work, so the advances from the investors are not classified as operating cash flows. Cash draws that we received under these ESPC agreements were $238.4 million during the year ended December 31, 2022 and are recorded as financing cash inflows. The use of the cash received under these arrangements is to pay project costs classified as operating cash flows and totaled $259.5 million during the year ended December 31, 2022. Due to the manner in which the ESPC contracts with the third-party investors are structured, our reported operating cash flows are materially impacted by the fact that operating cash flows only reflect the ESPC contract expenditure outflows and do not reflect any inflows from the corresponding contract revenues. Upon acceptance of the project by the federal customer the financing is treated as a true sale and the relatedESPC receivable and financingcorresponding ESPC liability are removed from our consolidated balance sheets.sheets as a non-cash settlement. See Note 2, “Summary of Significant Accounting Policies”, to our consolidated financial statements in this Report.
Institutional customers, such as state, provincialOther
We issue letters of credit and local governments, schools and public housing authorities, typically finance their energy efficiency and renewable energy projects through either tax-exempt leases or issuances of municipal bonds. We assist in the structuring of such third-party financing.
In some instances, customers prefer that we retain ownership of the renewable energy plants and related energy assets that we construct for them. In these projects, we typically enter into a long-term supply agreementperformance bonds, from time to furnish electricity, gas, heat or cooling to the customer’s facility. To finance the significant upfront capital costs required to develop and construct the plant, we rely either ontime, with our internal cash flow or, in some cases, third-party debt. For project financing by third-party lenders, we typically establish a separate subsidiary, usually a limited liability company, to ownprovide collateral.
Selected Measures of Liquidity and Capital Resources
| | | | | | | | | | | |
| December 31, |
| (In Thousands) | 2022 | | 2021 |
| Cash and cash equivalents | $ | 115,534 | | | $ | 50,450 | |
| Working capital | $ | 189,283 | | | $ | 164,361 | |
| Availability under revolving credit facility | $ | 345 | | | $ | 121,176 | |
Cash Flows
The following table summarizes our changes in cash and cash equivalents:
| | | | | | | | | | | |
| Year Ended December 31, |
| (In Thousands) | 2022 | | 2021 |
| Cash flows used in operating activities | $ | (338,288) | | | $ | (172,296) | |
| Cash flows used in investing activities | (328,358) | | | (205,257) | |
| Cash flows provided by financing activities | 730,227 | | | 365,461 | |
| Effect of exchange rate changes on cash | (747) | | | 309 | |
| Net increase (decrease) in cash, cash equivalents, and restricted cash | $ | 62,834 | | | $ | (11,783) | |
Our service offering also includes the energy assets and related contracts. The subsidiary contracts with us fordevelopment, construction, and operation of the project and enters into a financing agreement directly with the lenders. Additionally, we will provide assurance to the lender that the project will achieve commercial operation. Although the financing is secured by the assets of the subsidiary and a pledge of our equity interests in the subsidiary, and is non-recourse to Ameresco, Inc., we may from time to time determine to provide financial support to the subsidiary in order to maintain rights to the project or otherwise avoid the adverse consequences of a default. The amount of such financing is included on our consolidated balance sheets.
Effects of Seasonality
We are subject to seasonal fluctuations and construction cycles, particularly in climates that experience colder weather during the winter months, such as the northern United States and Canada, or at educational institutions, where large projects are typically carried out during summer months when their facilities are unoccupied. In addition, government customers, many of which have fiscal years that do not coincide with ours, typically follow annual procurement cycles and appropriate funds on a fiscal-year basis even though contract performance may take more than one year. Further, government contracting cycles can be affected by the timing of, and delays in, the legislative process related to government programs and incentives that help drive demand for energy efficiency and renewable energy projects. As a result, our revenues and operating income in the third and fourth quarter are typically higher, and our revenues and operating income in the first quarter are typically lower, than in other quarters of the year. As a result of such fluctuations, we may occasionally experience declines in revenues or earnings as compared to the immediately preceding quarter, and comparisons of our operating results on a period-to-period basis may not be meaningful.
Our annual and quarterly financial results are also subject to significant fluctuations as a result of other factors, many of which are outside our control. See “Our business is affected by seasonal trends and construction cycles, and these trends and cycles could have an adverse effect on our operating results” in Item 1A, Risk Factors in this Annual Report on Form 10-K.
Backlog and Awarded Projects
Total construction backlog represents projects that are active within our ESPC sales cycle. Our sales cycle begins with the initial contact with the customer and ends, when successful, with a signed contract, also referred to as fully-contracted backlog.
Our sales cycle recently has been averaging 18 to 42 months. Awarded backlog is created when a potential customer awards a project to Ameresco following a request for proposal. Once a project is awarded but not yet contracted, we typically conduct a detailed energy audit to determine the scope of the project as well as identify the savings that may be expected to be generated from upgrading the customer’s energy infrastructure. At this point, we also determine the subcontractor, what equipment will be used, and assist in arranging for third party financing, as applicable. Recently, awarded projects have been taking an average of 12 to 24 months to result in a signed contract and convert to fully-contracted backlog. It may take longer, however, depending upon the size and complexity of the project. Historically, approximately 90% of our awarded backlog projects have resulted in a signed contract. After the customer and Ameresco agree to the terms of the contract and the contract becomes executed, the project moves to fully-contracted backlog. The contracts reflected in our fully-contracted backlog typically have a construction period of 12 to 36 months and we typically expect to recognize revenue for such contracts over the same period. Fully-contracted backlog begins converting into revenues generated from backlog over time using cost based input methods once construction has commenced. See “We may not recognize all revenues from our backlog or receive all payments anticipated under awarded projects and customer contracts” and “In order to secure contracts for new projects, we typically face a long and variable selling cycle that requires significant resource commitments and requires a long lead time before we realize revenues” in Item 1A, Risk Factors in our Annual Report on Form 10-K.
As of December 31, 2019, we had fully-contracted backlog of approximately $1,107.6 million in expected future revenues under signed customer contracts for the installation or construction of projects. We also had been awarded projects for which we had not yet signed customer contracts with estimated total future revenues of an additional $1,160.4 million. As of December 31, 2018, we had fully-contracted backlog of approximately $726.6 million in future revenues under signed customer contracts for the installation or construction of projects. We also had been awarded projects for which we had not yet signed customer contracts with estimated total future revenues of an additional $1,241.4 million.
We define our 12-month backlog as the estimated amount of revenues that we expect to recognize in the next twelve months from our fully-contracted backlog. As of December 31, 2019 and 2018, our 12-month backlog was $564.4 million and $360.5 million, respectively.
As of December 31, 2019, we had O&M backlog of approximately $1,142.3 million in expected future revenues under signed multi-year customer contracts for the delivery of O&M services. As of December 31, 2018, we had O&M backlog of approximately $934.2 million in expected future revenues under signed multi-year customer contracts for the delivery of O&M services.
Assets in development, which represents the potential design/build project value of small-scale renewable energy plants that have been awarded or for which we have secured development rights, was approximately $681.0 million and $424.7 million as of December 31, 2019 and 2018, respectively.
Financial Operations Overview
Revenues
We derive revenues principally from energy efficiency projects, which entails the design, engineering and installation of equipment and other measures that incorporate a range of innovative technology and techniques to improve the efficiency and control the operation of a facility’s energy infrastructure; this can include designing and constructing for a customer a central plant or cogeneration system providing power, heat and/or cooling to a building, or other small-scale plant that produces electricity, gas, heat or cooling from renewable sources of energy. We also derive revenue from: long-term O&M contracts; energy supply contracts forplants. Small-scale renewable energy operatingprojects, or energy assets, that we own; integrated-PV; and consulting and enterprise energy management services.
Historically, includingcan either be developed for the years ended December 31, 2019, and 2018, approximately 75%portfolio of our revenues have been derived from federal, state, provincial or local government entities, including public housing authorities and public universities.
Cost of Revenues and Gross Margin
Cost of revenues include the cost of labor, materials, equipment, subcontracting and outside engineering that are required for the development and installation of our projects, as well as pre-construction costs, sales incentives, associated travel, inventory obsolescence charges, amortization of intangible assets related to customer contracts, and, if applicable, costs of procuring financing. A majority of our contracts have fixed price terms; however, in some cases we negotiate protections, such as a cost-plus structure, to mitigate the risk of rising prices for materials, services and equipment.
Cost of revenues also include costs for the small-scale renewable energy plants that we own, including the cost of fuel (if any) and depreciation charges.
As a result of certain acquisitions, we have intangible assets related to customer contracts; these are amortized over a period of approximately one to eight years from the respective date of acquisition. This amortization is recorded as a cost of revenues in the consolidated statements of income. Amortization expense for the year ended December 31, 2019 related to customer contracts was not significant.
Gross margin, which is gross profit as a percent of revenues, is affected by a number of factors, including the type of services performed. Renewable energy projects that we own and operate typically have higher margins than energy efficiencyor designed and built for customers. Expenditures related to projects that we own are recorded as cash outflows from investing activities. Expenditures related to projects that we build for customers are recorded as cash outflows from operating activities as cost of revenues.
Cash Flows from Operating Activities
Our cash flow from operating activities in 2022 decreased over 2021 primarily due to a $159.4 million increase in unbilled revenue (costs and revenueestimated earnings in the United States typically have higher margins than in Canadaexcess of billings) due to the typical mixtiming of productswhen certain projects are invoiced, including our SCE battery storage project, a decrease of $47.3 million in accounts payable, accrued expenses and services thatother current liabilities, and an increase of $9.8 million in Federal ESPC receivables, partially offset by an increase of $18.4 million in net income.
Cash Flows from Investing Activities
During 2022, we sell there. In addition, gross margin frequently varies acrossmade capital investments of $304.6 million in new energy assets and $18.0 million in major maintenance of energy assets, compared to $170.3 million and $8.6 million, respectively, in 2021. Last year we paid $14.9 million, net of cash received, for an acquisition and also contributed $9.0 million to an equity investment.
We currently plan to invest approximately $325.0 million to $375.0 million in capital investments in 2023, principally for the construction periodor acquisition of a project. new renewable energy plants.
Cash Flows from Financing Activities
Our expected gross marginprimary sources of financing during 2022 were proceeds of $468.5 million from long-term debt financings and construction revolvers, $252.7 million from advances on Federal ESPC projects and expected revenues for, a project are basedenergy assets, and net proceeds from our senior secured revolving credit facility of $137.9 million, partially offset by repayments of long-term debt totaling $161.9 million.
During 2021, we received net proceeds of $186.0 million from long-term debt financings, $161.2 million from advances on budgeted costs. In some cases, actual costs incurred,Federal ESPC projects and energy assets, and net proceeds of $120.1 million from our equity offering, partially offset by repayments of long-term debt totaling $98.2 million.
We currently plan additional financings of $250.0 million to $300.0 million in 2023 to fund the construction or expected to be incurred, exceed the budgeted costs. In this case, we will adjust the revenue accordinglyacquisition of new renewable energy plants as a result of a slower progress-towards-completion estimate on a lower project gross margin estimate. From time to time, a portion of the contingencies reflected in budgeted costs are not incurred due to strong execution. In that case, and generally at or near project completion, we recognize revenues for which there is no further corresponding cost of revenues. As a result, gross margin tends to be backloaded for projects with strong execution; this explains the gross margin improvement that occursdiscussed above.
We may also, from time to time, at project closeout.
Selling, General and Administrative Expenses
Selling, general and administrative expenses include salaries and benefits, project development costs, and general and administrative expenses not directly related to the developmentfinance our operations through issuance or installationoffering of projects.
Salaries and benefits. Salaries and benefits consist primarily of expenses for personnel not directly engaged in specific projectequity or revenue generating activity. These expenses include the time of executive management, legal, finance, accounting, human resources, information technology and other staff not utilized in a particular project. We employ a comprehensive time card system which creates a contemporaneous record of the actual time by employees on project activity.debt securities.
Project development costs. Project development costs consist primarily of sales, engineering, legal, finance and third-party expenses directly related to the development of a specific customer opportunity. This also includes associated travel and marketing expenses.
General and administrative expenses. These expenses consist primarily of rents and occupancy, professional services, insurance, unallocated travel expenses, telecommunications, office expenses, depreciation and amortization of intangible assets not related to customer contracts. Professional services consist principally of recruiting costs, external legal, audit, tax and other consulting services. For the years ended December 31, 2019 and 2018, we recorded amortization expense of $0.9 million and $1.1 million, respectively, related to customer relationships, non-compete agreements, technology and trade names.
Other Expenses, Net
Other expenses, net, includes gains and losses from derivatives, interest income and expenses, amortization of deferred financing costs, net, and foreign currency transaction gains and losses. Interest expense will vary periodically depending on the amounts drawn on our revolving senior secured credit facility and the prevailing short-term interest rates.
Provision or Benefit for Income Taxes
The provision or benefit for income taxes is based on various rates set by federal and local authorities and is affected by permanent and temporary differences between financial accounting and tax reporting requirements.
Critical Accounting Policies and Estimates
This discussion and analysis of our financial condition and results of operations is based uponPreparing our consolidated financial statements which have been prepared in accordance with accounting principles generally accepted in the United States. The preparation of these consolidated financial statements requires management to makeGAAP involves us making estimates and assumptions that affect the reported amounts of assets and liabilities, revenue, expensenet sales, and expenses, and related disclosures. The most significant estimates with regard to these consolidateddisclosures in the accompanying notes at the date of our financial statements relate tostatements. We base our estimates of final construction contract profit in accordance with accounting for long-term contracts under the revenue recognition requirements of contracts with our customers, allowance for doubtful accounts, inventory reserves, realization of project development costs, leases, fair value of derivative financial
instruments, accounting for business acquisitions, stock-based awards, impairment of long-lived assets and goodwill, income taxes, self insurance reserves and potential liability in conjunction with certain commitments and contingencies. Actual results could differ from those estimates.
Such estimates and assumptions are based on historical experience, industry and market trends, and on various other factorsassumptions that management believeswe believe to be reasonable under the circumstances. EstimatesHowever, by their nature, estimates are subject to various assumptions and assumptions are made on an ongoing basis,uncertainties, and accordingly, thechanges in circumstances could cause actual results mayto differ from these estimates, under different assumptions or conditions.sometimes materially.
The followingWe believe that our policies and estimates that require our most significant judgments are considered our critical accounting policies that, among others, affect our more significant judgments and estimates used in the preparationare discussed below. In addition, refer to Note 2 “Summary of our consolidated financial statements.Significant Accounting Policies” for further details.
Revenue Recognition
On January 1, 2018, we adopted ASU 2014-09, “Revenue from Contracts with Customers” (Topic 606) using the modified retrospective method applied to those contracts which were not completed as of December 31, 2017. Results for reporting periods beginning January 1, 2018 are presented under Topic 606, while prior period amounts are not adjusted and continue to be reported under the accounting standardsAs described in effect for the prior periods. We recorded an adjustment to retained earnings on January 1, 2018 due to the cumulative impact of adopting Topic 606. See Note 3 "Revenue from Contracts with Customers" for the required disclosures related to the impact of adopting this standard and a discussion of updated policies related to revenue recognition discussed below.
We derive revenues from energy efficiency and renewable energy products and services. Energy efficiency products and services include the design, engineering, and installation of equipment and other measures to improve the efficiency, and control the operation, of a facility’s energy infrastructure. Renewable energy products and services include the construction of small-scale plants that produce electricity, gas, heat or cooling from renewable sources of energy, the sale of such electricity, gas, heat or cooling from plants that we own, and the sale and installation of solar energy products and systems. Below is a description of our primary lines of business.
Projects - Our principal service relates to energy efficiency projects, which entails the design, engineering and installation of, and assisting with the arranging of financing for an ever-increasing array of innovative technologies and techniques to improve the energy efficiency, and control the operation, of a building’s energy and water consuming systems. In certain projects, we also designed and constructed for a customer a central plant or cogeneration system providing power, heat and/or cooling to a building, or a small-scale plant that produces electricity, gas, heat or cooling from renewable sources of energy.
Under Topic 606 requirements,2, we recognize revenue from the installation or construction of projects over time using the cost-based input method. We use the total costs incurred on the project relative to the total expected costs to satisfy the performance obligation.
When the estimate on a contract indicates a loss or claims against costs incurred reduce the likelihood of recoverability of such costs, we record the entire estimated loss in the period the loss becomes known.
Operations & Maintenance (“O&M”) - After In addition, some contracts contain an energy efficiency element of variable consideration, including liquidated damages and/or renewable energy project is completed, we often provide ongoing O&M services under a multi-year contract. These services include operating, maintaining and repairing facility energy systems such as boilers, chillers and building controls, as well as central power and other small-scale plants. For larger projects, we frequently maintain staff on-site to perform these services.
Maintenance revenue uses the input method to recognize revenue. In most cases, O&M fees are fixed annual fees. Because we are on-site to perform O&M services, the services are typically a distinct series of promises, and those services have the same pattern of transfer to the customer (i.e., evenly over time), we record the revenue on a straight-line basis. Some O&M service contract fees are billed on time expended. In those cases, revenue is recorded based on the time expended in that month.
Energy Assets - Our service offerings also include the sale of electricity, processed renewable gas fuel, heat or cooling from the portfolio of assets that we own and operate. We have constructed and are currently designing and constructing a wide range of renewable energy plants using LFG, wastewater treatment biogas, solar, biomass, other bio-derived fuels, wind and hydro sources of energy. Most of our renewable energy projects to date have involved the generation of electricity from solar PV and LFG or the sale of processed LFG. We purchase the LFG that otherwise would be combusted or flared, processes it, and either sell it or use it in our energy plants. We also design and build, as well as own, operate and maintain, plants that take biogas generated in the anaerobic digesters of wastewater treatment plants and turn it into renewable natural gas that is either used to generate energy on-site or that can be sold through the nation’s natural gas pipeline grid. Where we own and operate energy
producing assets, we typically enter into a long-term power purchase agreement (“PPA”) for the sale of the energy. Many of our energy assets also produce environmental attributes, including RECs and RINs. In most cases, we sell these attributes under separate agreements with third parties other than the PPA customer.
We recognize revenues from the sale and delivery of the energy output from renewable energy plants, over time as produced and deliveredpenalties, which requires payment to the customer in accordance with specific PPA contract terms. Environmental attributes revenue is recognized at a point in time,the event that construction timelines or milestones are not met. We estimate the total consideration payable by the customer when the environmental attributes are transferredcontracts contain variable consideration provisions, based on the most likely amount anticipated to be recognized for transferring the promised goods or services. As a result, we may constrain revenue to the customerextent that a significant reversal in accordancethe amount of cumulative revenue recognized will not occur when the uncertainty associated with the transfer protocols of the attribute market that we operate in. In those cases where environmental attributes are sold to the same customer as the energy output, we record revenue monthly for both the energy output and the environmental attributes output, as generated and delivered to the customer.
Other - Our service and product offerings also include integrated-PV and consulting and enterprise energy management services.
We recognize revenues from delivery of engineering, consulting services and enterprise energy management services over time. For the sale of solar materials, revenuevariable consideration is recognized at a point in time when we have transferred physical control of the asset to the customer upon shipment.subsequently resolved.
To the extent a contract is deemed to have multiple performance obligations, we allocate the transaction price of the contract to each performance obligation using itsour best estimate of the standalone selling price of each distinct good or service in the contract.
BillingsSignificant judgement is required to estimate the total expected costs and variable consideration for projects that typically have a construction period of 12 to 36 months. Any increase or decrease in excessestimated costs to complete a performance obligation without a corresponding change to the contract price could impact the calculation of costcumulative revenue to date and estimated earnings represents advanced billingsgross profit on certainthe project. Similarly, if we recognize revenue based upon our current estimate of variable consideration, and our estimate is later adjusted, we may be required to increase or decrease cumulative revenue to date and gross profit on the project. Factors that may result in a change to our estimates include unforeseen engineering problems, construction contracts. Costsdelays, the performance of contractors and estimated earnings in excess of billings represent certain amounts under customer contracts that were earnedmajor material suppliers, and billable but not invoiced.
Results for reporting periods beginning January 1, 2018 are presented under Topic 606, while prior period amounts are not adjusted and continue to be reported under Accounting Standards Codification (“ASC”) 605, Revenue Recognition.
Project Development Costsunusual weather conditions, among others.
We capitalize as project development costs only those costs incurred in connectionhave a long history of working with multiple types of projects and preparing cost estimates, and we rely on the developmentexpertise of energy efficiencykey personnel to prepare what we believe are reasonable best estimates given available facts and renewable energy projects, primarily direct labor, interest costs, outside contractor services, consulting fees, legal fees and associated travel, if incurred after a point in time when the realization of related revenue becomes probable. Project development costs incurred priorcircumstances. Due to the probable realization of revenues are expensed as incurred.
Energy Assets
Energy assets consist of costs of materials, direct labor, interest costs, outside contract services, deposits and project development costs incurred in connection with the construction of small-scale renewable energy plants that we own. These amounts are capitalized and amortized to cost of revenues in our consolidated statements of income on a straight line basis over the livesnature of the related assets or the terms of the related contracts.
We capitalize interest costs relatingwork involved, however, judgment is involved to construction financing during the period of construction. Capitalized interest is included in energy assets, net, in our consolidated balance sheets. Capitalized interest is amortized to cost of revenues in our consolidated statements of income on a straight line basis over the useful life of the associated energy asset. The amount of interest capitalized for the years ended December 31, 2019 and 2018 was $3.0 million and $3.8 million, respectively.
Routine maintenance costs are expensed in the current year’s consolidated statements of income to the extent that they do not extend the life of the asset. Major maintenance, upgrades and overhauls are required for certain components of our assets. In these instances,estimate the costs associated with these upgrades are capitalizedto complete and are depreciated over the shorter ofamounts estimated could have a material impact on the remaining life of the asset or the period until the next required major maintenance or overhaul.revenue we recognize in each accounting period. We cannot estimate unforeseen events and circumstances which may result in actual results being materially different from previous estimates.
Impairment Assessments
We evaluate our long-lived assets, including goodwill and intangible assets, for impairment as events or changes in circumstances indicate the carrying value of these assets may not be fully recoverable.recoverable, and at least annually (December 31st) for goodwill and intangible assets that have indefinite lives. Examples of such triggering events applicable to our assets include a significant decrease in the market price of a long-lived asset or asset group, or a current-period operating or cash flow loss combined with a history of operating or cash flow losses, or a projection or forecast that demonstrates continuing losses associated with the use of a long-lived asset or asset group.group, or adverse industry or economic trends.
We evaluate recoverability of long-lived assets to be held and useddefinite-lived intangible assets by estimating the undiscounted future cash flows associated with the expected uses and eventual disposition of those assets. When these comparisons indicate that the carrying
value of those assets is greater than the undiscounted cash flows, we recognize an impairment loss for the amount that the carrying value exceeds the fair value.
From time to time, we have applied for and received cash grant awards from the U.S. Treasury Department (the “Treasury”) under Section 1603 of the American Recovery and Reinvestment Act of 2009 (the “Act”). The Act authorized the Treasury to make payments to eligible persons who place in service qualifying renewable energy projects. The grants are paid in lieu of investment tax credits. All of the cash proceeds from the grants were used and recorded as a reduction in the cost basis of the applicable energy assets. If we dispose of the property, or the property ceases to qualify as specified energy property, within five years from the date the property is placed in service, then a prorated portion of the Section 1603 payment must be repaid.
We last received a Section 1603 grant during the year ended December 31, 2014. No further Section 1603 grant payments are expected to be received as the program has expired.
For tax purposes, the Section 1603 payments are not included in federal and certain state taxable income and the basis of the property is reduced by 50% of the payment received. Deferred grant income of $6.1 million and $6.6 million in the accompanying consolidated balance sheets at December 31, 2019 and 2018, respectively, represents the benefit of the basis difference to be amortized to income tax expense over the life of the related property.
Leases
We adopted Accounting Standard Update (“ASU”) 2016-02, Leases (Topic 842) as of January 1, 2019 and, along with the standard, elected to take the practical expedient that the Company will not reassess lease classifications at adoption. Accordingly, the Company’s sales-leaseback arrangements entered into as of December 31, 2018 will remain under the previous guidance. See Note 7 and 8 for additional information on these sale-leasebacks.
All significant lease arrangements are recognized at lease commencement. Operating lease right-of-use (“ROU”) assets and lease liabilities are recognized at commencement. An ROU asset and corresponding lease liability are not recorded for leases with an initial term of 12 months or less (short-term leases) as the Company recognizes lease expense for these leases as incurred over the lease term.
ROU assets represent the Company’s right to use an underlying asset during the reasonably certain lease term and lease liabilities represent the Company’s obligation to make lease payments arising from the lease. The Company’s lease terms may include options to extend or terminate the lease when it is reasonably certain that the Company will exercise that option. Operating lease ROU assets and liabilities are recognized at commencement date based on the present value of lease payments over the lease term. The Company uses its incremental borrowing rate, which is updated annually or when a significant event occurs that would indicate a significant change in rates, based on the information available at commencement date, in determining the present value of lease payments. The operating lease ROU asset also includes any lease payments related to initial direct cost and prepayments and excludes lease incentives. Lease expense is recognized on a straight-line basis over the lease term. The Company has lease agreements with lease and non-lease components, which are accounted for as a single component. See Note 8 for additional discussion on the Company’s leases.
Impairment of Goodwill and Intangible Assets
We have classified as goodwill the amounts paid in excess of fair value of the net assets (including tax attributes) of companies acquired in purchase transactions. We have recorded intangible assets related to customer contracts, customer relationships, non-compete agreements, trade names and technology, each with defined useful lives. We assess the impairment of goodwill and intangible assets that have indefinite lives on an annual basis (December 31st) and whenever events or changes in circumstances indicate that the carrying value of the asset may not be recoverable.
Goodwill is reviewed for impairment annually and whenever events or changes in circumstances indicate that the carrying value of an asset may not be recoverable. The process of evaluating the potential impairment of long-lived assets, goodwill and intangible assets requires significant judgment. We regularly monitor current business conditions and other factors including, but not limited to, adverse industry or economic trends, restructuring actions and projections of future results. WeFor goodwill, we estimate the reporting unit’s fair value and compare it with the carrying value of the reporting unit, including goodwill. If the fair value is greater than the carrying value of its reporting unit, no impairment is recorded. Fair value is determined using both an income approach and a market approach. The estimates and assumptions used in our calculations include revenue growth rates, expense growth rates, expected capital expenditures to
determine projected cash flows, expected tax rates and an estimated discount rate to determine present value of expected cash flows. These estimates are based on historical experiences, our projections of future operating activity and our weighted-average cost of capital.
Acquired intangible assets other than goodwill that are subject to amortization include customer contracts Unforeseen events and customer relationships, as well as software/technology, trade names and non-compete agreements. The intangible assets are amortized over periods ranging from one to fifteen years from their respective acquisition dates. We evaluate the intangible assets for impairment consistent with, and part of, their long-lived assets evaluation, as discussed in Energy Assets above.
Impairment of Long-Lived Assets
We use the guidance prescribed in ASC 360,Property, Plant and Equipment, for the proper testing and valuation methodology to ensure we record any impairment when the carrying amount of a long-lived asset is not recoverable equivalent to an amount equal to its fair market value.
We review long-lived asset groups for potential impairment whenever events or changes in circumstances indicate that the carrying amount of the assets may not be fully recoverable or that the useful lives ofmarket conditions could adversely affect these assets are no longer appropriate. Examples of such triggering events applicable to our asset groups include a significant decreaseestimates, which could result in the market price of a long-lived asset group or a current-period operating or cash flow loss combined with a history of operating or cash flow losses or a projection or forecast that demonstrates continuing losses associated with the use of a long-lived asset group, among others.
Should an asset group be identified as potentially impaired based on the defined criteria, an impairment test is performed that includes a comparison of the estimated undiscounted cash flows of the asset as compared to the recorded value of the asset. If these estimates or their related assumptions change in the future, an impairment charge may be required against these assets in the reporting period in which the impairment is determined.charge.
Derivative Financial Instruments
We account for our interest rate swaps and commodity swaps as derivative financial instruments. As required under Generally Accepted Accounting Principles (“GAAP”), derivatives are carriedBased on our consolidated balance sheets at fair value. The fair valuegoodwill impairment assessment, all of our interest rate and commodity swaps are determined based on observable market data in combinationreporting units with expected cash flows for each instrument.
We follow the guidance which expands the disclosure requirements for derivative instruments and hedging activities.
In the normal course of business, we utilize derivative contracts as part of our risk management strategy to manage exposure to market fluctuations in interest rates and natural gas prices. These instruments are subject to various credit and market risks. Controls and monitoring procedures for these instruments have been established and are routinely reevaluated. Credit risk represents the potential lossgoodwill had estimated fair values that may occur because a party to a transaction fails to perform according to the terms of the contract. The measure of credit exposure is the replacement cost of contracts with a positive fair value. We seek to manage credit riskexceeded their carrying values by entering into financial instrument transactions only through counterparties that we believe to be creditworthy. Market risk represents the potential loss due to the decrease in the value of a financial instrument caused primarily by changes in interest rates and natural gas prices. We seek to manage market risk by establishing and monitoring limits on the types and degree of risk that may be undertaken. As a matter of policy, we do not use derivatives for speculative purposes.
We are exposed to interest rate risk through our borrowing activities. A portion of our project financing includes twelve credit facilities that utilize a variable rate swap instrument. We are also exposed to commodity price risk through our variable rate commodity swap instruments. We have two commodity swapsat least 20% as of December 31, 2019.
In June 2018, the Company entered into a term loan agreement, discussed in Note 9, that contained an interest make-whole provision. In August 2018, the Company signed a joinder to the above agreement, which added another series of notes to the term loan that also contained an interest make-whole provision. The Company determined that these provisions fulfill the requirements of embedded derivative instruments that were required to be bifurcated from the host agreement. The fair value of these make-whole provisions was determined based on available market data2022 and a with and without model.
The following tables present a listing of all our active derivative instruments61% as of December 31, 2019 ($ in thousands):2021. During the year ended December 31, 2021, we recognized a long-lived asset impairment charge of $1.9 million on one of our energy asset groups. See Note 7 “Energy Assets” for additional information.
|
| | | | | | |
| Active Interest Rate Swap | Effective Date | Expiration Date | Initial Notional Amount ($) | Status |
| 11-Year, 5.77% Fixed | October 2018 | October 2029 | $ | 9,200 |
| Designated |
| 15-Year, 5.24% Fixed | June 2018 | June 2033 | 10,000 |
| Designated |
| 3-Year, 2.46% Fixed | March 2018 | December 2020 | 17,100 |
| Not Designated |
| 10-Year, 4.74% Fixed | June 2017 | December 2027 | 14,100 |
| Designated |
| 15-Year, 3.26% Fixed | February 2023 | December 2038 | 14,084 |
| Designated |
| 7-Year, 2.19% Fixed | February 2016 | February 2023 | 20,746 |
| Designated |
| 8-Year, 3.70% Fixed | March 2020 | June 2028 | 14,643 |
| Designated |
| 8-Year, 3.70% Fixed | March 2020 | June 2028 | 10,734 |
| Designated |
| 8-Year, 1.71% Fixed | October 2012 | March 2020 | 9,665 |
| Designated |
| 8-Year, 1.71% Fixed | October 2012 | March 2020 | 7,085 |
| Designated |
| 15-Year, 5.30% Fixed | February 2006 | February 2021 | 3,256 |
| Designated |
| 15.5-Year, 5.40% Fixed | September 2008 | March 2024 | 13,081 |
| Designated |
|
| | | | | | |
Active Commodity Swap | Effective Date | Expiration Date | Initial Notional Amount (Volume) | Commodity Measurement | Status |
1-Year, $2.68 MMBtu Fixed | May 2019 | April 2020 | 437,004 |
| MMBtus | Not Designated |
1-Year, $2.70 MMBtu Fixed | May 2020 | April 2021 | 435,810 |
| MMBtus | Not Designated |
|
| | | | | | |
| Other Derivatives | Classification | Effective Date | Expiration Date | Fair Value ($) |
| Interest make-whole provisions | Liability | June/August 2018 | December 2038 | $ | 918 |
|
We entered into each of the interest rate and commodity swap contracts as an economic hedge.
We recognize all derivatives in our consolidated financial statements at fair value.
We recognize the fair value of derivative instruments designated as hedges in our consolidated balance sheets and any changes in the fair value are recorded as adjustments to other comprehensive income if the hedges operate effectively.
Income TaxesLiquidity and Capital Resources
We provideOverview
Since inception, we have funded operations primarily through cash flow from operations, advances from Federal ESPC projects, our senior secured credit facility, and various forms of other debt (see “Project Financing” below). In addition, in March 2021, we completed an underwritten public offering of 2,875,000 shares of our Class A Common Stock, for income taxes based ontotal net proceeds of $120.1 million. See Note 13 “Equity and Earnings per Share” for additional information.
Working capital requirements can be susceptible to fluctuations during the liability method. We provide for deferred income taxes based on the expected future tax consequences ofyear due to timing differences between costs incurred, the financial statement basistiming of milestone-based customer invoices and the tax basisactual cash collections. Working capital may also be affected by seasonality, growth rate of assetsrevenue, long lead-time equipment purchase patterns, advances from Federal ESPC projects, and liabilities calculated using the enacted tax rates in effectpayment terms for the year in which the differences are expectedpayables relative to be reflected in the tax return.
We account for uncertain tax positions using a “more-likely-than-not” threshold for recognizing and resolving uncertain tax positions. The evaluation of uncertain tax positions is based on factors that include, but are not limited to, changes in tax law, the measurement of tax positions taken or expected to be taken in tax returns, the effective settlement of matters subject to audit, new audit activity and changes in facts or circumstances related to a tax position. We evaluate uncertain tax positions on a quarterly basis and adjust the level of the liability to reflect any subsequent changes in the relevant facts surrounding the uncertain positions. Our liabilities for an uncertain tax position can be relieved only if the contingency becomes legally extinguished through either payment to the taxing authority or the expiration of the statute of limitations, the recognition of the benefits associated with the position meet the “more-likely-than-not” threshold or the liability becomes effectively settled through the examination process. We consider matters to be effectively settled once the taxing authority has completed all of its required or expected examination procedures, including all appeals and administrative reviews, we have no plans to appeal orcustomer receivables.
We expect to incur additional expenditures in connection with the following activities:
litigate any aspect•equity investments, energy asset acquisitions and business acquisitions that we may fund from time to time
•capital investment in current and future energy assets
•material, equipment, and other expenditures for large projects
We regularly monitor and assess our ability to meet funding requirements. We believe that cash and cash equivalents, working capital and availability under our revolving senior secured credit facility, combined with our right (subject to lender consent) to increase our revolving credit facility by $100.0 million, and our general access to credit and equity markets, will be sufficient to fund our operations for twelve months from filing this Report and thereafter. We funded a significant portion of the tax positioncontract expenditures for our SCE battery storage project in advance of customer receipts during the year ended December 31, 2022. With the schedule adjustment requested by SCE and the anticipated timeline for completing the projects, we believeexpect to continue to incur and fund capital expenditures for the SCE battery project into the first half of 2023, net of any cash collected on amounts invoiced.
We continue to evaluate and take action, as necessary, to preserve adequate liquidity and ensure that our business can continue to operate and that we can meet our capital requirements during these uncertain times. This may include limiting discretionary spending across the organization and re-prioritizing our capital projects amid times of political unrest, the evolution of the COVID-19 pandemic, the duration of supply challenges, and the rate and duration of the inflationary pressures. For example, increases in inflation and interest rates have impacted overall market returns on assets. We have therefore been particularly prudent in our capital commitments over the past few quarters, ensuring that our assets in development continue to align with our hurdle rates.
Senior Secured Credit Facility — Revolver and Term Loans
On March 4, 2022, we entered into the fifth amended and restated senior secured credit facility, which increased the aggregate amount of total commitments from $245.0 million to $495.0 million. This amendment increased the aggregate amount of the revolving commitments from $180.0 million to $200.0 million, increased the existing term loan A to $75.0 million, and extended the maturity date of the revolving commitment and term loan A from June 28, 2024 to March 4, 2025. In addition, it is highly unlikely thatadded a delayed draw term loan A for up to $220.0 million through a September 4, 2023 maturity date, increased the taxing authority would examine or re-examinetotal funded debt to EBITDA covenant ratio from a maximum of 3.50 to 4.50 for the related tax position. Wequarter ended March 31, 2022; 4.25 for the quarter ended June 30, 2022; 4.00 for the quarters ended September 30, 2022 and December 31, 2022; and 3.50 thereafter. The amendment also accrue for potential interestspecified the debt service coverage ratio to be less than 1.5 and penalties, relatedincreased our limit under an energy conservation project financing to unrecognized tax benefits$650.0 million, which provides us with flexibility to grow our federal business further. At December 31, 2022, our senior secured credit facility outstanding was $477.9 million, we had funds of $0.3 million available under the revolving credit facility, and had $16.8 million in income tax expense.letters of credit outstanding.
On June 9, 2022, we entered into the first amendment to the fifth amended and restated senior secured credit facility, which temporarily increased the maximum indebtedness incurred under an energy conservation project financing from $650.0 million to $725.0 million from and after April 1, 2022 to and including December 30, 2022. As of December 31, 2022, the maximum indebtedness incurred under an energy conservation project financing reverted back to $650,000.
Project Financing
Non-recourse Construction Revolvers and Term Loans
We have presented all deferred taxentered into a number of construction and term loan agreements for the purpose of constructing and owning certain renewable energy plants. The physical assets and liabilitiesthe operating agreements related to the renewable energy plants are generally owned by wholly owned, single member “special purpose” subsidiaries of Ameresco. These construction and term loans are structured as noncurrentproject financings made directly to a subsidiary, and upon commercial operation and achieving certain milestones in the credit agreement, the related construction loan converts into a term loan. While we are required under generally accepted accounting principles (“GAAP”) to reflect these loans as liabilities on our consolidated balance sheets, they are generally non-recourse and not direct obligations of Ameresco, Inc.
Our project financing facilities contain various financial and other covenant requirements which include debt service coverage ratios and total funded debt to EBITDA, as defined. Any failure to comply with the financial or other covenants of December 31, 2019, and 2018, respectively.
Stock-Based Compensation Expense
Our stock-based compensation expense resultsour project financings would result in inability to distribute funds from the issuanceswholly-owned subsidiary to Ameresco, Inc. or constitute an event of shares of restricted common stockdefault in which the lenders may have the ability to accelerate the amounts outstanding, including all accrued interest and grants of stock options to employees, directors, outside consultants and others. We recognize the costs associated with option grants using the fair value recognition provisions of ASC 718, Compensation — Stock Compensation. Generally, ASC 718 requires the value of all stock-based payments to be recognized in the statement of income based on their estimated fair value at date of grant amortized over the grants’ respective vesting periods. For the years ended December 31, 2019 and 2018, we recorded stock-based compensation expense of approximately $1.6 million and $1.3 million, respectively, in connection with stock-based payment awards. The compensation expense is categorized as a portion of general and administrative expenses in the accompanying consolidated statements of income. Stock-based compensation expense is also recognized in association with employee stock purchases related to the Company’s Employee Stock Purchase Plan.
Stock Option Grants
We have granted stock options to certain employees and directors under our 2010 stock incentive plan and at December 31, 2019, 5,717 shares were available for grant under that plan. We have also granted stock options to certain employees and directors under our 2000 stock incentive plan; however, we will grant no further stock options or restricted stock awards under that plan.
Stock options issued under our 2000 stock incentive plan generally expire if not exercised within ten years after the grant date. Under the terms of our 2010 stock incentive plan, all options expire if not exercised within ten years after the grant date. During 2011, we began awarding options which typically vest over a five year period on an annual ratable basis. If the employee ceases to be employed for any reason before vested options have been exercised, the employee generally has three months to exercise vested options or they are forfeited. Certain option grants have performance conditions that must be achieved prior to vesting and are expensed based on the expected achievement at each reporting period.
We follow the fair value recognition provisions of ASC 718 requiring that all stock-based payments to employees, including grants of employee stock options and modifications to existing stock options, be recognized in the consolidated statements of income based on their fair values, using the prospective-transition method.
We use the Black-Scholes option pricing model to determine the weighted-average fair value of options granted and record stock-based compensation expense utilizing the straight-line method.
The determination of the fair value of stock-based payment awards utilizing the Black-Scholes model is affected by the stock price and a number of assumptions, including expected volatility, expected life, risk-free interest rate and expected dividends. The following table sets forth the significant assumptions used in the model during 2019, 2018 and 2017:unpaid fees.
|
| | | | | | |
| | | Year Ended December 31, |
| | | 2019 | | 2018 | | 2017 |
| Expected dividend yield | | —% | | —% | | —% |
| Risk-free interest rate | | 1.60%-2.39% | | 2.71%-3.00% | | 1.96%-2.36% |
| Expected volatility | | 43%-44% | | 43%-45% | | 46% |
| Expected life | | 6.5 years | | 6.5 years | | 6.5 years |
We will continue to use our judgment in evaluating the expected term, volatility and forfeiture rate related to our own stock-based compensation on a prospective basis, and incorporating these factors into the Black-Scholes pricing model. Higher volatility and longer expected lives result in an increase to stock-based compensation expense determined at the date of grant. These expenses will affect our cost of revenues as well as our selling, general and administrative expenses.
As of December 31, 2019, we had $9.5 million of total unrecognized stock-based compensation expense related to employee and director stock options. We expect to recognize this cost over a weighted-average period of 2.7 years after
December 31, 2019. This expense is categorized as a portion of selling, generalMaterial non-recourse construction revolvers and administrative expenses in the accompanying consolidated statements of income.
Recent Accounting Pronouncements
See Note 2 of the “Notes to Consolidated Financial Statements” for a discussion of recent accounting standards.
Results of Operations
On January 1, 2018, the Company adopted new accounting guidance on revenue from contracts with customers, using the modified retrospective method applied to contracts that were not completed as of January 1, 2018. Results for reporting periods beginning after January 1, 2018 are presented under that guidance, while prior period amounts are not adjusted and continue to be reported in accordance with the previous guidance. See Note 3, Revenue From Contracts with Customers, of Notes to Consolidated Financial Statements for further details.
The following table sets forth certain financial data from the consolidated statements of income expressed as a percentage of revenues for the periods indicated (in thousands):
|
| | | | | | | | | | | | | | |
| | Year Ended December 31, |
| | 2019 | | 2018 | |
| | Dollar | | % of | | Dollar | | % of | |
| | Amount | | Revenues | | Amount | | Revenues | |
| Revenues | $ | 866,933 |
| | 100.0 | % | | $ | 787,138 |
| | 100.0 | % | |
| Cost of revenues | 698,815 |
| | 80.6 | % | | 613,526 |
| | 77.9 | % | |
| Gross profit | 168,118 |
| | 19.4 | % | | 173,612 |
| | 22.1 | % | |
| Selling, general and administrative expenses | 116,504 |
| | 13.4 | % | | 114,513 |
| | 14.5 | % | |
| Operating income | 51,614 |
| | 6.0 | % | | 59,099 |
| | 7.5 | % | |
| Other expenses, net | 15,061 |
| | 1.7 | % | | 16,709 |
| | 2.1 | % | |
| Income before (benefit) provision for income taxes | 36,553 |
| | 4.2 | % | | 42,390 |
| | 5.4 | % | |
| Income tax (benefit) provision | (3,748 | ) | | (0.4 | )% | | 4,813 |
| | 0.6 | % | |
| Net income | $ | 40,301 |
| | 4.6 | % | | $ | 37,577 |
| | 4.8 | % | |
| Net loss attributable to redeemable non-controlling interests | $ | 4,135 |
| | 0.5 | % | | $ | 407 |
| | 0.1 | % | |
| Net income attributable to common shareholders | $ | 44,436 |
| | 5.1 | % | | $ | 37,984 |
| | 4.8 | % | |
Revenues
The following table sets forth a comparison of our revenues for the periods indicated (in thousands):
|
| | | | | | | | | | | | | | |
| | Year Ended December 31, | | Dollar | | Percentage |
| | 2019 | | 2018 | | Change | | Change |
| Revenues | $ | 866,933 |
| | $ | 787,138 |
| | $ | 79,795 |
| | 10.1 | % |
Total revenues increased by $79.8 million, or 10.1%, from 2018 to 2019 primarily due to a $41.1 million increase in revenues from our U.S. Federal segment, a $30.7 million increase in revenues from our U.S. Regions segment, a $7.0 million increase from All Other, and a $2.0 million increase in revenues from our Non-solar Distributed Generation (“DG”) segment. These increases were partially offset by a $1.1 million decrease in revenues from our Canada segment.
Cost of Revenues and Gross Margin
The following table sets forth a comparison of our cost of revenues and gross profit for the periods indicated (in thousands):
|
| | | | | | | | | | | | | | |
| | Year Ended December 31, | | Dollar | | Percentage |
| | 2019 | | 2018 | | Change | | Change |
| Cost of revenues | $ | 698,815 |
| | $ | 613,526 |
| | $ | 85,289 |
| | 13.9 | % |
| Gross margin % | 19.4 | % | | 22.1 | % | |
| |
|
|
Cost of revenues. Total cost of revenues increased $85.3 million, or 13.9%, from 2018 to 2019 due primarily to an increase in project revenues from our U.S. Federal and U.S. Regions segments.
Gross margin. Gross margin decreased from 22.1% in 2018 to 19.4% in 2019. The decrease in gross margin is primarily due to an increase in lower margin projects in our U.S. Regions and Federal segments and lower margin energy and incentive revenue in our Non-Solar DG segment.
Selling, General and Administrative Expenses
The following table sets forth a comparison of our selling, general and administrative expenses for the periods indicated (in thousands):
|
| | | | | | | | | | | | | | |
| | Year Ended December 31, | | Dollar | | Percentage |
| | 2019 | | 2018 | | Change | | Change |
| Selling, general and administrative expenses | $ | 116,504 |
| | $ | 114,513 |
| | $ | 1,991 |
| | 1.7 | % |
Selling, general and administrative expenses increased $2.0 million or 1.7% to $116.5 million from $114.5 million from 2018 to 2019 primarily due to an increase in salaries and benefits of $4.3 million resulting from increased headcount partially offset by a gain of $2.2 million recognized on the deconsolidation of a variable interest entity.
Other Expenses, Net
Other expenses, net, includes gains and losses from derivatives transactions, foreign currency transactions, interest expense, interest income and amortization of deferredterm loan financing costs, net. Other expenses, net, decreased from 2018 to 2019 by $1.6 million primarily due to favorable foreign exchange rate fluctuations realized.
Income Before Taxes
Income before taxes decreased from 2018 to 2019 by $5.8 million primarily due to the reasons described above.
Provision (Benefit) for Income Taxes
The provision (benefit) for income taxes is based on various rates set by federal, state, provincial and local authorities and is affected by permanent and temporary differences between financial accounting and tax reporting requirements. During 2019, we recognized an income tax benefit of $(3.7) million, equivalent to an effective tax rate of (10.3)%. The effective tax rate decreased for 2019 as compared to 2018 primarily due to the availability of Section 179D energy efficiency deduction which was retroactively extended for 2018 and 2019 on December 20, 2019. During 2018, we recognized an income tax provision of $4.8 million, equivalent to an effective tax rate of 11.4%.
The principal reasons for the difference between the statutory rate and the estimated annual effective rate for 2019 related to our recognizing a tax benefit of approximately $29.7 million associated with energy related credits and deductions available under the U.S. Tax Code for 2019 as well as a deduction available under Section 179D of the Tax Code for 2019 and 2018. In December 2019, the Code Section 179D Commercial Buildings Energy Efficiency Tax Deduction was retroactively extended for 2018 and 2019, and through the end of 2020. Because of the timing of the extension the impact of the 2018 Section 179D deduction was not reflected in the 2018 tax provision but was instead reflected in 2019.
Net Income
Net income increased $2.7 million to a net income of $40.3 million for the twelve months ended December 31, 2019 compared to a net income of $37.6 million for the same period of 2018 for the reasons discussed above. Basic income per share for the twelve months ended December 31, 2019 was $0.95 per share, an increase of $0.12 per share, compared to the same period of 2018. Diluted income per share for the twelve months ended December 31, 2019 was $0.93 per share, an increase of $0.12 per share, compared to the same period of 2018.
Business Segment Analysis (in thousands)
We report results under ASC 280, Segment Reporting. Our reportable segments forduring the year ended December 31, 20192022 was our Non-recourse Fixed Rate Note, 6.50%, due October 2037.
As of December 31, 2022, our total construction and term loans outstanding was $300.8 million. See Note 9 “Debt and Financing Lease Liabilities” for additional information about these loans.
Non-recourse Sale-leasebacks and Financing Leases
We have entered into sale-leaseback arrangements for solar PV energy assets with multiple investors and in accordance with Topic 842, Leases, all sale-leaseback transactions that occurred after December 31, 2018, were accounted for as failed sales and the proceeds received from the transactions were recorded as long-term financing facilities.
As of December 31, 2022, our total sale-leasebacks classified as long-term financing facilities outstanding was $120.9 million.
As of December 31, 2022, our total financing leases outstanding was $16.1 million. These are U.S. Regions, U.S. our sale-leaseback arrangements entered into as of December 31, 2018 which remain under the previous guidance.
See Notes 8 “Leases” and 9 “Debt and Financing Lease Liabilities” for additional information on these financing facilities.
While we are required under GAAP to reflect these lease payments as liabilities on our consolidated balance sheets, they are generally non-recourse and not direct obligations of Ameresco Inc., except that we have guaranteed certain obligations relating to taxes and project warranties, operation, and maintenance.
Federal Canada and Non-Solar Distributed Generation “ Non-Solar DG”. Our U.S. Regions, U.S. Federal and Canada segments offer energy efficiency products and services, which include:ESPC Liabilities
We have arrangements with certain third-parties to provide advances to us during the design, engineering andconstruction or installation of equipmentprojects for certain customers, typically federal governmental entities, in exchange for our assignment to the lenders of our rights to the long-term receivables arising from the ESPCs related to such projects. These financings totaled $478.5 million in principal amounts as of December 31, 2022 and other measures$532.3 million as of December 31, 2021. Under the terms of these financing arrangements, we are required to improvecomplete the efficiencyconstruction or installation of the project in accordance with the contract with our customer, and control the liability remains on our consolidated balance sheets until the completed project is accepted by the customer.
We are the primary obligor for financing received, but only until final acceptance of the work by the customer. At this point recourse to us ceases and the ESPC receivables are transferred to the investor. The transfers of receivables under these agreements do not qualify for sales accounting until final customer acceptance of the work, so the advances from the investors are not classified as operating cash flows. Cash draws that we received under these ESPC agreements were $238.4 million during the year ended December 31, 2022 and are recorded as financing cash inflows. The use of the cash received under these arrangements is to pay project costs classified as operating cash flows and totaled $259.5 million during the year ended December 31, 2022. Due to the manner in which the ESPC contracts with the third-party investors are structured, our reported operating cash flows are materially impacted by the fact that operating cash flows only reflect the ESPC contract expenditure outflows and do not reflect any inflows from the corresponding contract revenues. Upon acceptance of the project by the federal customer the ESPC receivable and corresponding ESPC liability are removed from our consolidated balance sheets as a non-cash settlement. See Note 2, “Summary of Significant Accounting Policies”, to our consolidated financial statements in this Report.
Other
We issue letters of credit and performance bonds, from time to time, with our third-party lenders, to provide collateral.
Selected Measures of Liquidity and Capital Resources
| | | | | | | | | | | |
| December 31, |
| (In Thousands) | 2022 | | 2021 |
| Cash and cash equivalents | $ | 115,534 | | | $ | 50,450 | |
| Working capital | $ | 189,283 | | | $ | 164,361 | |
| Availability under revolving credit facility | $ | 345 | | | $ | 121,176 | |
Cash Flows
The following table summarizes our changes in cash and cash equivalents:
| | | | | | | | | | | |
| Year Ended December 31, |
| (In Thousands) | 2022 | | 2021 |
| Cash flows used in operating activities | $ | (338,288) | | | $ | (172,296) | |
| Cash flows used in investing activities | (328,358) | | | (205,257) | |
| Cash flows provided by financing activities | 730,227 | | | 365,461 | |
| Effect of exchange rate changes on cash | (747) | | | 309 | |
| Net increase (decrease) in cash, cash equivalents, and restricted cash | $ | 62,834 | | | $ | (11,783) | |
Our service offering also includes the development, construction, and operation of a facility’s energy infrastructure;small-scale renewable energy solutions and services, which includeplants. Small-scale renewable energy projects, or energy assets, can either be developed for the constructionportfolio of small-scale plantsassets that we own and operate or developdesigned and built for customers. Expenditures related to projects that we own are recorded as cash outflows from investing activities. Expenditures related to projects that we build for customers that produce electricity, gas, heat or coolingare recorded as cash outflows from renewable sourcesoperating activities as cost of energy; and O&M services. revenues.
Cash Flows from Operating Activities
Our Non-Solar DG segment primarily sells electricity, processed renewable gas fuel, heat or cooling, producedcash flow from renewable sources of energy, other than solar, and generated by small-scale plants that we own. This segment also performs O&M services for customer-owned small-scale plants. The “All Other” category offers enterprise energy management services, consulting services and integrated-PV. These segments do not include results of otheroperating activities such as corporate operating expenses not specifically allocated to the segments.
U.S. Regions
|
| | | | | | | | | | | | | | |
| | Year Ended December 31, | | Dollar | | Percentage |
| | 2019 | | 2018 | | Change | | Change |
| Revenues | $ | 365,060 |
| | $ | 334,344 |
| | $ | 30,716 |
| | 9.2 | % |
| Income before taxes | $ | 15,925 |
| | $ | 20,543 |
| | $ | (4,618 | ) | | (22.5 | )% |
Revenues for the U.S. Regions segment increased by $30.7 million, or 9.2%, to $365.1 million for the twelve months ended December 31, 2019 compared to the same period of 2018 primarily due to an increase in project revenues attributable to the quantity of projects and timing of revenue recognized as a result of the phase of active projects versus the prior year.
Income before taxes for the U.S. Regions segment2022 decreased by $4.6 million, or 22.5%, for the twelve months ended December 31, 2019 compared to the same period of 2018 primarily due to the increase in lower margin projects and operating expenses in 2019.
U.S. Federal
|
| | | | | | | | | | | | | | |
| | Year Ended December 31, | | Dollar | | Percentage |
| | 2019 | | 2018 | | Change | | Change |
| Revenues | $ | 287,426 |
| | $ | 246,309 |
| | $ | 41,117 |
| | 16.7 | % |
| Income before taxes | $ | 40,553 |
| | $ | 36,332 |
| | $ | 4,221 |
| | 11.6 | % |
Revenues for the U.S. Federal segment increased by $41.1 million, or 16.7%, to $287.4 million for the twelve months ended December 31, 2019 compared to the same period of 2018, primarily due to timing of revenue recognized as a result of the phase of active projects.
Income before taxes for the U.S. Federal segment increased by $4.2 million, or 11.6%, to $40.6 million for the twelve months ended December 31, 2019 compared to the same period of 2018, primarily due to an increase in revenues described above and decrease in operating expenses attributed to lower project development costs.
Canada
|
| | | | | | | | | | | | | | |
| | Year Ended December 31, | | Dollar | | Percentage |
| | 2019 | | 2018 | | Change | | Change |
| Revenues | $ | 37,910 |
| | $ | 38,982 |
| | $ | (1,072 | ) | | (2.7 | )% |
| Income (loss) before taxes | $ | 1,771 |
| | $ | (2,746 | ) | | $ | 4,517 |
| | 164.5 | % |
Revenues for the Canada segment decreased $1.1 million, or 2.7%, to $37.9 million for the twelve months ended December 31, 2019 compared to the same period of 2018over 2021 primarily due to a $159.4 million increase in unbilled revenue (costs and estimated earnings in excess of billings) due to the timing of when certain projects are invoiced, including our SCE battery storage project, a decrease of $47.3 million in accounts payable, accrued expenses and other current liabilities, and an increase of $9.8 million in Federal ESPC receivables, partially offset by an increase of $18.4 million in net income.
Cash Flows from Investing Activities
During 2022, we made capital investments of $304.6 million in new energy assets and $18.0 million in major maintenance of energy assets, compared to $170.3 million and $8.6 million, respectively, in 2021. Last year we paid $14.9 million, net of cash received, for an acquisition and also contributed $9.0 million to an equity investment.
We currently plan to invest approximately $325.0 million to $375.0 million in capital investments in 2023, principally for the construction or acquisition of new renewable energy plants.
Cash Flows from Financing Activities
Our primary sources of financing during 2022 were proceeds of $468.5 million from long-term debt financings and construction revolvers, $252.7 million from advances on Federal ESPC projects and energy assets, and net proceeds from our senior secured revolving credit facility of $137.9 million, partially offset by repayments of long-term debt totaling $161.9 million.
During 2021, we received net proceeds of $186.0 million from long-term debt financings, $161.2 million from advances on Federal ESPC projects and energy assets, and net proceeds of $120.1 million from our equity offering, partially offset by repayments of long-term debt totaling $98.2 million.
We currently plan additional financings of $250.0 million to $300.0 million in 2023 to fund the construction or acquisition of new renewable energy plants as discussed above.
We may also, from time to time, finance our operations through issuance or offering of equity or debt securities.
Critical Accounting Policies and Estimates
Preparing our consolidated financial statements in accordance with GAAP involves us making estimates and assumptions that affect reported amounts of assets and liabilities, net sales, and expenses, and related disclosures in the accompanying notes at the date of our financial statements. We base our estimates on historical experience, industry and market trends, and on various other assumptions that we believe to be reasonable under the circumstances. However, by their nature, estimates are subject to various assumptions and uncertainties, and changes in circumstances could cause actual results to differ from these estimates, sometimes materially.
We believe that our policies and estimates that require our most significant judgments are considered our critical accounting policies and are discussed below. In addition, refer to Note 2 “Summary of Significant Accounting Policies” for further details.
Revenue Recognition
As described in Note 2, we recognize revenue from the installation or construction of projects over time using the cost-based input method. We use the total costs incurred on the project relative to the total expected costs to satisfy the performance obligation. When the estimate on a contract indicates a loss or claims against costs incurred reduce the likelihood of recoverability of such costs, we record the entire estimated loss in the period the loss becomes known. In addition, some contracts contain an element of variable consideration, including liquidated damages and/or penalties, which requires payment to the customer in the event that construction timelines or milestones are not met. We estimate the total consideration payable by the customer when the contracts contain variable consideration provisions, based on the most likely amount anticipated to be recognized for transferring the promised goods or services. As a result, we may constrain revenue to the extent that a significant reversal in the amount of cumulative revenue recognized will not occur when the uncertainty associated with the variable consideration is subsequently resolved.
To the extent a contract is deemed to have multiple performance obligations, we allocate the transaction price of the contract to each performance obligation using our best estimate of the standalone selling price of each distinct good or service in the contract.
Significant judgement is required to estimate the total expected costs and variable consideration for projects that typically have a construction period of 12 to 36 months. Any increase or decrease in project revenues relatedestimated costs to slower progressioncomplete a performance obligation without a corresponding change to the contract price could impact the calculation of certain activecumulative revenue to date and gross profit on the project. Similarly, if we recognize revenue based upon our current estimate of variable consideration, and our estimate is later adjusted, we may be required to increase or decrease cumulative revenue to date and gross profit on the project. Factors that may result in a change to our estimates include unforeseen engineering problems, construction delays, the performance of contractors and major material suppliers, and unusual weather conditions, among others.
We have a long history of working with multiple types of projects. and preparing cost estimates, and we rely on the expertise of key personnel to prepare what we believe are reasonable best estimates given available facts and circumstances. Due to the nature of the work involved, however, judgment is involved to estimate the costs to complete and the amounts estimated could have a material impact on the revenue we recognize in each accounting period. We cannot estimate unforeseen events and circumstances which may result in actual results being materially different from previous estimates.
Income (loss) before taxesImpairment Assessments
We evaluate our long-lived assets, including goodwill and intangible assets, for impairment as events or changes in circumstances indicate the carrying value of these assets may not be fully recoverable, and at least annually (December 31st) for goodwill and intangible assets that have indefinite lives. Examples of such triggering events applicable to our assets include a significant decrease in the market price of a long-lived asset or asset group, a current-period operating or cash flow loss combined with a history of operating or cash flow losses, a projection or forecast that demonstrates continuing losses associated with the use of a long-lived asset or asset group, or adverse industry or economic trends.
We evaluate recoverability of long-lived assets and definite-lived intangible assets by estimating the undiscounted future cash flows associated with the expected uses and eventual disposition of those assets. When these comparisons indicate that the carrying value of those assets is greater than the undiscounted cash flows, we recognize an impairment loss for the Canada segment increased $4.5 million, or 164.5%, toamount that the carrying value exceeds the fair value.
The process of evaluating the potential impairment of long-lived assets, goodwill and intangible assets requires significant judgment. For goodwill, we estimate the reporting unit’s fair value and compare it with the carrying value of the reporting unit, including goodwill. If the fair value is greater than the carrying value of its reporting unit, no impairment is recorded. Fair value is determined using both an income approach and a market approach. The estimates and assumptions used in our calculations include revenue growth rates, expense growth rates, expected capital expenditures to determine projected cash flows, expected tax rates and an estimated discount rate to determine present value of $1.8 million forexpected cash flows. These estimates are based on historical experiences, our projections of future operating activity and our weighted-average cost of capital. Unforeseen events and changes in circumstances or market conditions could adversely affect these estimates, which could result in an impairment charge.
Based on our goodwill impairment assessment, all of our reporting units with goodwill had estimated fair values that exceeded their carrying values by at least 20% as of December 31, 2022 and 61% as of December 31, 2021. During the twelve monthsyear ended December 31, 2019 compared to2021, we recognized a losslong-lived asset impairment charge of $2.7$1.9 million on one of our energy asset groups. See Note 7 “Energy Assets” for the same period of 2018 primarily due to a decrease in operating expenses attributed to lower salaries and benefits and project development costs, lower interest expenses and favorable foreign currency exchange rate fluctuations.
Non-Solar DGadditional information.
|
| | | | | | | | | | | | | | |
| | Year Ended December 31, | | Dollar | | Percentage |
| | 2019 | | 2018 | | Change | | Change |
| Revenues | $ | 84,683 |
| | $ | 82,655 |
| | $ | 2,028 |
| | 2.5 | % |
| Income before taxes | $ | 3,813 |
| | $ | 13,412 |
| | $ | (9,599 | ) | | (71.6 | )% |
Revenues for the Non-Solar DG segment increased $2.0 million, or 2.5%, to $84.7 million for the twelve months ended December 31, 2019 compared to the same period of 2018 primarily due to an increase in project and operations and maintenance revenue partially offset by a decrease in energy and incentive revenue.
Income before taxes for the Non-Solar DG segment decreased by $9.6 million, or 71.6%, to $3.8 million for the twelve months ended December 31, 2019 compared to the same period of 2018 primarily due to the increase in lower margin project revenues and lower margin energy and incentive revenue attributed to lower pricing realized from the sale of certain environmental attributes.
All Other
|
| | | | | | | | | | | | | | |
| | Year Ended December 31, | | Dollar | | Percentage |
| | 2019 | | 2018 | | Change | | Change |
| Revenues | $ | 91,854 |
| | $ | 84,848 |
| | $ | 7,006 |
| | 8.3 | % |
| Income before taxes | $ | 8,647 |
| | $ | 5,264 |
| | $ | 3,383 |
| | 64.3 | % |
| Unallocated corporate activity | $ | (34,156 | ) | | $ | (30,415 | ) | | $ | (3,741 | ) | | (12.3 | )% |
Revenues from all other segments increased $7.0 million, or 8.3%, to $91.9 million for the twelve months ended December 31, 2019 compared to the same period of 2018 primarily due to an increase in integrated-PV revenues attributed to sales to customers for oilfield microgrid applications.
Income before taxes from all other segments increased $3.4 million to income of $8.6 million for the twelve months ended December 31, 2019 compared to the same period of 2018 primarily due to the increase in revenues described above.
Unallocated corporate activity includes all corporate level selling, general and administrative expenses and other expenses not allocated to the segments. We do not allocate any indirect expenses to the segments.
Corporate activity increased by$3.7 million,or 12.3%, to $34.2 million for the twelve months ended December 31, 2019 compared to the same period of 2018 primarily due to an increase in salary and benefit costs and insurance costs.
Liquidity and Capital Resources
Sources of liquidity. Overview
Since inception, we have funded operations primarily through cash flow from operations, advances from Federal ESPC projects, our senior secured credit facility, and various forms of debt.other debt (see “Project Financing” below). In addition, in March 2021, we completed an underwritten public offering of 2,875,000 shares of our Class A Common Stock, for total net proceeds of $120.1 million. See Note 13 “Equity and Earnings per Share” for additional information.
The changes inWorking capital requirements can be susceptible to fluctuations during the year due to timing differences between costs incurred, the timing of milestone-based customer invoices and actual cash collections. Working capital may also be affected by seasonality, growth rate of revenue, long lead-time equipment purchase patterns, advances from Federal ESPC projects, and cash equivalentspayment terms for the years ended December 31, 2019 and 2018 were as follows:payables relative to customer receivables.
|
| | | | | | | | |
| | Year Ended December 31, |
| | 2019 | | 2018 | |
| Cash flows used in operating activities | $ | (196,293 | ) | | $ | (53,201 | ) | |
| Cash flows used in investing activities | (142,223 | ) | | (133,206 | ) | |
| Cash flows provided by financing activities | 317,419 |
| | 224,511 |
| |
| Effect of exchange rate changes on cash | 447 |
| | (295 | ) | |
| Net increase (decrease) in cash and cash equivalents | $ | (20,650 | ) | | $ | 37,809 |
| |
•equity investments, energy asset acquisitions and business acquisitions that we may fund from time to time
•capital investment in current and future energy assets
•material, equipment, and other expenditures for large projects
We regularly monitor and assess our ability to meet funding requirements. We believe that cash and cash equivalents, working capital and availability under our revolving senior secured credit facility, combined with our right (subject to lender consent) to increase our revolving credit facility by $100.0 million, and our general access to credit and equity markets, will be sufficient to fund our operations through at least March 2021for twelve months from filing this Report and thereafter.
Proceeds from our Federal ESPC projects are generally received through agreements to sell the ESPC receivables related to certain ESPC contracts to third-party investors. We use the advances from the investors under these agreements to finance the projects. We are the primary obligor for financing received, but only until final acceptancefunded a significant portion of the work by the customer. At this point recourse to us ceases and the ESPC receivables are transferred to the investor. The transferscontract expenditures for our SCE battery storage project in advance of receivables under these agreements do not qualify for sales accounting until final customer acceptance of the work, so the advances from the investors are not classified as operating cash flows. Cash draws that we receive under these ESPC agreements were $199.4 millionreceipts during the year ended December 31, 2019,2022. With the schedule adjustment requested by SCE and are recordedthe anticipated timeline for completing the projects, we expect to continue to incur and fund capital expenditures for the SCE battery project into the first half of 2023, net of any cash collected on amounts invoiced.
We continue to evaluate and take action, as financing cash inflows. The usenecessary, to preserve adequate liquidity and ensure that our business can continue to operate and that we can meet our capital requirements during these uncertain times. This may include limiting discretionary spending across the organization and re-prioritizing our capital projects amid times of political unrest, the evolution of the cash received under these arrangements is to pay project costs classified as operating cash flows, totaled $(188.1) million duringCOVID-19 pandemic, the year ending December 31, 2019. Due toduration of supply challenges, and the manner in which the ESPC contracts with the third-party investors are structured, our reported operating cash flows are materially impacted by the fact that operating cash flows only reflect the ESPC contract expenditure outflowsrate and do not reflect any inflows from the corresponding contract revenues. Upon acceptanceduration of the project by the federal customer the ESPC receivableinflationary pressures. For example, increases in inflation and corresponding ESPC liability are removed from our consolidated balance sheets as a non-cash settlement. See Note 2, “Summary of Significant Accounting Policies”, to our Consolidated Financial Statements appearing in Item 8 of this Annual Reportinterest rates have impacted overall market returns on Form 10-K.
Our service offering also includes the development, construction and operation of small-scale renewable energy plants. Small-scale renewable energy projects, or energy assets, can either be developed for the portfolio of assets that we own and operate or designed and built for customers. Expenditures related to projects that we own are recorded as cash outflows from investing activities. Expenditures related to projects that we build for customers are recorded as cash outflows from operating activities as cost of revenues.
Capital expenditures. Our total capital expenditures were $140.6 million and $129.6 million for the the year ended December 31, 2019 and 2018, respectively. Additionally, we invested $1.3 million in acquisitions for the twelve months ended December 31, 2019, and we invested $3.6 million in acquisitions for the year ended December 31, 2018. Includedassets. We have therefore been particularly prudent in our capital expenditures arecommitments over the purchases of solar PV projectspast few quarters, ensuring that our assets in development for $8.5 millioncontinue to align with our hurdle rates.
Senior Secured Credit Facility — Revolver and $72.9 million forTerm Loans
On March 4, 2022, we entered into the years ended December 31, 2019fifth amended and 2018, respectively . We currently plan to invest approximately $200.0 million to $250.0 million in capital expenditures in 2020, principally for the construction or acquisition of new renewable energy plants.
Cash flows from operating activities. Operating activities used $196.3 million of net cash during 2019. In 2019, we had net income of $40.3 million, which is net of non-cash compensation, depreciation, amortization, deferred income taxes and other non-cash items totaling $36.5 million. Net increases in costs and estimated earnings in excess of billings, accounts receivable including retainage, inventory, prepaid expenses and other current assets and net decreases in other liabilities and income taxes payable used $140.4 million. These uses of cash were offset by net decreases in project development costs and other assets and an increase in accounts payable and accrued expenses, and billings in excess of cost and estimated earnings which provided $55.4 million. Federal ESPC receivables used $188.1 million. As described above, Federal ESPC operating cash flows only reflect the ESPC expenditure outflows and do not reflect any inflows from the corresponding contract revenues, which are recorded as cash inflows from financing activities due to the timing of the receipt of cash related to the assignment of the ESPC receivables to the third-party investors.
Operating activities used $53.2 million of net cash during 2018. In 2018, we had a net income of $37.6 million, which is net of non-cash compensation, depreciation, amortization, deferred income taxes and other non-cash items totaling $42.1 million. Net increases in project development costs and other assets and net decreases in other liabilities used $12.9 million. These uses of cash were offset by net decrease in accounts receivable including retainage, inventory, costs and estimated earnings in excess of billings, prepaid expenses and other current assets and an increase in accounts payable, accrued expenses and other current liabilities, billings in excess of cost and estimated earnings and income taxes payable which provided $35.6 million. Federal ESPC receivables used $155.5 million.
Cash flows from investing activities. Cash used for investing activities totaled $142.2 million during 2019 and consisted of capital investments, net of grant proceeds, of $134.0 million related to the development and acquisition of renewable energy plants, $6.7 million related to purchases of other property and equipment, acquisitions of businesses of $1.3 million and contributions to equity investments of $0.3 million.
Cash used for investing activities totaled $133.2 million during 2018 and consisted of capital investments of $125.7 million related to the development and acquisition of renewable energy plants, $3.9 million related to purchases of other property and equipment and $3.6 million related to acquisitions of renewable energy businesses.
Cash flows from financing activities. Net cash provided by financing activities totaled $317.4 million during 2019 and included repayments of $28.4 million on long-term debt, payments of $1.7 million relating to financing fees and $0.1 million for the repurchase of stock. These uses of financing cash were offset by proceeds from ourrestated senior secured credit facility, which increased the aggregate amount of $73.3 million and long-term debt financings of $43.9 million, contributionstotal commitments from redeemable non-controlling interests of $21.4 million and proceeds from exercises of options which provided $7.4 million. Proceeds from Federal ESPC projects and energy assets provided $201.6 million in cash.
Net cash provided by financing activities totaled $224.5 million during 2018 and included repayments of $36.4 million on long-term debt, payments of $4.1 million relating to financing fees, $1.8 million for the repurchase of stock and net payments on our senior secured credit facility of $0.9 million. These uses of financing cash were offset by proceeds from long-term debt financings of $88.1 million, proceeds from sale-leaseback financings of $5.1 million, contributions from redeemable non-controlling interests of $4.8 million and proceeds from exercises of options which provided $7.2 million. Proceeds from Federal ESPC projects and energy assets provided $162.5 million in cash.
We currently plan additional financings of $125.0$245.0 million to $175.0 million in 2020 to fund the construction or acquisition of new renewable energy plants as discussed above.
We may also, from time to time, finance our operations through issuance or offering of equity or debt securities.
Senior Secured Credit Facility — Revolver and Term Loan
On June 28, 2019, we entered into a fourth amended and restated bank credit facility with three banks. The new credit facility replaces and extends our existing credit facility, which was scheduled to expire on June 30, 2020. The amended revolving credit and term loan facility mature on June 28, 2024, when all amounts will be due and payable in full. The Company expects to use the new credit facility for general corporate purposes of the Company and its subsidiaries, including permitted acquisitions, refinancing of existing indebtedness and working capital. The$495.0 million. This amendment increased the aggregate amount of the revolving commitments from $85,000$180.0 million to $115,000 through an$200.0 million, increased the existing term loan A to $75.0 million, and extended the maturity date of the revolving commitment and term loan A from June 28, 2024 maturity date, increased theto March 4, 2025. In addition, it added a delayed draw term loan from $40,000A for up to $65,000 to reduce the outstanding revolving loan balance by the same amount and extend the$220.0 million through a September 4, 2023 maturity date, from June 30, 2020 to June 28, 2024, and increased the total funded debt to EBITDA covenant ratio from a maximum of 3.003.50 to 3.25.4.50 for the quarter ended March 31, 2022; 4.25 for the quarter ended June 30, 2022; 4.00 for the quarters ended September 30, 2022 and December 31, 2022; and 3.50 thereafter. The total commitmentamendment also specified the debt service coverage ratio to be less than 1.5 and increased our limit under the amended credit facility (revolving credit, term loan and swing line) is $185,000.
The credit facility consists of a $115an energy conservation project financing to $650.0 million, revolving credit facility and a $65 million term loan. The revolving credit facility may be increased by upwhich provides us with flexibility to an additional $25 million atgrow our option if lenders are willing to provide such increased commitments, subject to certain conditions. Up to $20 million of the revolving credit facility may be borrowed in Canadian dollars, Euros and Pounds Sterling. We are the sole borrower under the credit facility. The obligations under the credit facility are guaranteed by certain of our direct and indirect wholly owned domestic subsidiaries and are secured by a pledge of all of our and such of our subsidiary guarantors’ assets, other than the equity interests of certain subsidiaries and assets held in non-core subsidiaries (as defined in the agreement).federal business further. At December 31, 2019 and 2018, $62.62022, our senior secured credit facility outstanding was $477.9 million, and $41.5 we had funds of $0.3 million was outstanding under the term loan, respectively. At December 31, 2019 and 2018, $50.0 million and $1.7 million was outstandingavailable under the revolving credit facility, respectively. Atand had $16.8 million in letters of credit outstanding.
On June 9, 2022, we entered into the first amendment to the fifth amended and restated senior secured credit facility, which temporarily increased the maximum indebtedness incurred under an energy conservation project financing from $650.0 million to $725.0 million from and after April 1, 2022 to and including December 30, 2022. As of December 31, 2019 funds of $29.1 million was available for2022, the revolving credit facility.
The interest rate for borrowingsmaximum indebtedness incurred under the credit facility is based on, at our option, either (1) a base rate equalan energy conservation project financing reverted back to a margin of 0.5% or 0.25%, depending on our ratio of Total Funded Debt to EBITDA (each as defined in the agreement), over the highest of (a) the federal funds effective rate, plus 0.50% , (b) Bank of America’s prime rate and (c) a rate based on the London interbank deposit rate (“LIBOR”) plus 1.50%, or (2) the one-, two- three- or six-month LIBOR plus a margin of 2.00% or 1.75%, depending on our ratio of Total Funded Debt to EBITDA. A commitment fee of 0.375% is payable quarterly on the undrawn portion of the revolving credit facility. At December 31, 2019, the interest rate for borrowings under the revolving credit facility was 4.52% and the weighted average interest rate for borrowings under the term loan was 4.27%.$650,000.
The revolving credit facility does not require amortization of principal. The term loan requires quarterly principal payments of $1.2 million, with the balance due at maturity. All borrowings may be paid before maturity in whole or in part at our option without penalty or premium, other than reimbursement of any breakage and deployment costs in the case of LIBOR borrowings.
The credit facility limits our ability to, among other things: incur additional indebtedness; incur liens or guarantee obligations; merge, liquidate or dispose of assets; make acquisitions or other investments; enter into hedging agreements; pay dividends and make other distributions and engage in transactions with affiliates, except in the ordinary course of business on an arms’ length basis.
Under the credit facility, we may not invest cash or property in, or loan to, our non-core subsidiaries in aggregate amounts exceeding 49% of our consolidated stockholders’ equity. In addition, under the credit facility, we and our core subsidiaries must maintain the following financial covenants:
|
| | | |
| • | | a ratio of total funded debt to EBITDA of less than 3.25 to 1.0 as of the end of each fiscal quarter ending June 30, 2024 and thereafter; and |
| • | | a debt service coverage ratio (as defined in the agreement) of at least 1.5 to 1.0. |
Any failure to comply with the financial or other covenants of the credit facility would not only prevent us from being able to borrow additional funds, but would constitute a default, permitting the lenders to, among other things, accelerate the amounts outstanding, including all accrued interest and unpaid fees, under the credit facility, to terminate the credit facility, and enforce liens against the collateral.
The credit facility also includes several other customary events of default, including a change in control, permitting the lenders to accelerate the indebtedness, terminate the credit facility, and enforce liens against the collateral.
Project Financing
Non-recourse Construction Revolvers and Term Loans.Loans
We have entered into a number of construction and term loan agreements for the purpose of constructing and owning certain renewable energy plants. The physical assets and the operating agreements related to the renewable energy plants are generally owned by wholly owned, single member “special purpose” subsidiaries of the Company.Ameresco. These construction and term loans are structured as project financings made directly to a subsidiary, and upon commercial operationsoperation and achieving certain milestones in the credit agreement, the related construction loan converts into a term loan. While we are required under GAAPgenerally accepted accounting principles (“GAAP”) to reflect these loans as liabilities on our consolidated balance sheets, they are generally non-recourse and not direct obligations of Ameresco, Inc. As of December 31, 2019, we had outstanding $204.5 million in aggregate principal amount under these loans with maturities at various dates from 2020 to 2039. Effective interest rates, after consideration for our interest rate swap contracts, ranged from 0% to 9.41%. As of December 31, 2018, we had outstanding $179.9 million in aggregate principal amount under these loans with maturities at various dates from 2020 to 2038. Effective interest rates, after consideration for our interest rate swap contracts, ranged from 4.38% to 9.89% as of December 31, 2018.
The Company’sOur project financing facilities contain various financial and other covenant requirements which include debt service coverage ratios and total funded debt to EBITDA, as defined. Any failure to comply with the financial or other covenants of the Company’s projectsour project financings would result in inability to distribute funds from the wholly-owned subsidiary to the CompanyAmeresco, Inc. or constitute an event of default in which the lenders may have the ability to accelerate the amounts outstanding, including all accrued interest and unpaid fees.
Material non-recourse construction revolvers and term loan financing during the year ended December 31, 2022 was our Non-recourse Fixed Rate Note, 6.50%, due October 2037.
As of December 31, 20192022, our total construction and term loans outstanding was $300.8 million. See Note 9 “Debt and Financing Lease Liabilities” for additional information about these loans.
Non-recourse Sale-leasebacks and Financing Leases
We have entered into sale-leaseback arrangements for solar PV energy assets with multiple investors and in accordance with Topic 842, Leases, all sale-leaseback transactions that occurred after December 31, 2018, were accounted for as failed sales and the Company’s debt, excludingproceeds received from the transactions were recorded as long-term financing facilities.
As of December 31, 2022, our total sale-leasebacks classified as long-term financing facilities outstanding was $120.9 million.
As of December 31, 2022, our total financing leases consistedoutstanding was $16.1 million. These are our sale-leaseback arrangements entered into as of December 31, 2018 which remain under the following:previous guidance.
See Notes 8 “Leases” and 9 “Debt and Financing Lease Liabilities” for additional information on these financing facilities. |
| | | | | | | | | | | |
| Commencement Date | Maturity Date | Balance as of December 31, | | |
| 2019 | | 2018 | | |
| Senior secured credit facility, interest at varying rates monthly in arrears | June 2015 | June 2024 | $ | 112,216 |
| | $ | 43,074 |
| | |
| Variable rate term loan payable in semi-annual installments | January 2006 | February 2021 | 625 |
| | 936 |
| | |
| Variable rate term loan payable in semi-annual installments | January 2006 | June 2024 | 6,609 |
| | 7,426 |
| | |
| Term loan payable in quarterly installments | March 2011 | March 2021 | 831 |
| | 1,464 |
| | |
| Term loan payable in monthly installments | October 2011 | June 2028 | 3,649 |
| | 3,843 |
| | |
| Variable rate term loan payable in quarterly installments | October 2012 | June 2020 | 28,217 |
| | 30,674 |
| | |
| Variable rate term loan payable in quarterly installments | September 2015 | March 2023 | 15,976 |
| | 17,208 |
| | |
| Term loan payable in quarterly installments | August 2016 | June 2031 | 3,769 |
| | 3,925 |
| | |
| Term loan payable in quarterly installments | March 2017 | March 2028 | 3,521 |
| | 3,945 |
| | |
| Term loan payable in monthly installments | April 2017 | April 2027 | 22,553 |
| | 22,081 |
| | |
| Term loan payable in quarterly installments | April 2017 | February 2034 | 2,706 |
| | 2,735 |
| | |
| Variable rate term loan payable in quarterly installments | June 2017 | December 2027 | 11,740 |
| | 12,915 |
| | |
| Variable rate term loan payable in quarterly installments | February 2018 | August 2022 | 15,645 |
| | 21,475 |
| | |
| Term loan payable in quarterly installments | June 2018 | December 2038 | 28,583 |
| | 30,069 |
| | |
| Variable rate term loan payable in semi-annual installments | June 2018 | June 2033 | 9,003 |
| | 9,668 |
| | |
| Variable rate term loan payable in monthly/quarterly installments | October 2018 | October 2029 | 9,092 |
| | 9,072 |
| | |
| Long term finance liability in semi-annual installments | July 2019 | July 2039 | 3,841 |
| | — |
| | |
| Long term finance liability in semi-annual installments | November 2019 | November 2039 | 8,794 |
| | — |
| | |
| Term loan payable in quarterly installments | December 2019 | December 2021 | 27,226 |
| | — |
| | |
| Total construction and term loans | | | $ | 314,596 |
| | $ | 220,510 |
| | |
Federal ESPC liabilities.Liabilities
We have arrangements with certain third-parties to provide advances to us during the construction or installation of projects for certain customers, typically federal governmental entities, in exchange for our assignment to the lenders of our rights to the long-term receivables arising from the ESPCs related to such projects. These financings totaled $245.0 million and $288.0$478.5 million in principal amounts atas of December 31, 20192022 and 2018, respectively.$532.3 million as of December 31, 2021. Under the terms of these financing arrangements, we are required to complete the construction or installation of the project in accordance with the contract with our customer, and the liability remains on our consolidated balance sheets until the completed project is accepted by the customer.
We are the primary obligor for financing received, but only until final acceptance of the work by the customer. At this point recourse to us ceases and the ESPC receivables are transferred to the investor. The transfers of receivables under these agreements do not qualify for sales accounting until final customer acceptance of the work, so the advances from the investors are not classified as operating cash flows. Cash draws that we received under these ESPC agreements were $238.4 million during the year ended December 31, 2022 and are recorded as financing cash inflows. The use of the cash received under these arrangements is to pay project costs classified as operating cash flows and totaled $259.5 million during the year ended December 31, 2022. Due to the manner in which the ESPC contracts with the third-party investors are structured, our reported operating cash flows are materially impacted by the fact that operating cash flows only reflect the ESPC contract expenditure outflows and do not reflect any inflows from the corresponding contract revenues. Upon acceptance of the project by the federal customer the ESPC receivable and corresponding ESPC liability are removed from our consolidated balance sheets as a non-cash settlement. See Note 2, “Summary of Significant Accounting Policies”, to our consolidated financial statements in this Report.
Other
We issue letters of credit and performance bonds, from time to time, with our third-party lenders, to provide collateral.
Selected Measures of Liquidity and Capital Resources
| | | | | | | | | | | |
| December 31, |
| (In Thousands) | 2022 | | 2021 |
| Cash and cash equivalents | $ | 115,534 | | | $ | 50,450 | |
| Working capital | $ | 189,283 | | | $ | 164,361 | |
| Availability under revolving credit facility | $ | 345 | | | $ | 121,176 | |
Cash Flows
Sale-Leaseback/Finance Liabilities. The following table summarizes our changes in cash and cash equivalents:
| | | | | | | | | | | |
| Year Ended December 31, |
| (In Thousands) | 2022 | | 2021 |
| Cash flows used in operating activities | $ | (338,288) | | | $ | (172,296) | |
| Cash flows used in investing activities | (328,358) | | | (205,257) | |
| Cash flows provided by financing activities | 730,227 | | | 365,461 | |
| Effect of exchange rate changes on cash | (747) | | | 309 | |
| Net increase (decrease) in cash, cash equivalents, and restricted cash | $ | 62,834 | | | $ | (11,783) | |
Our service offering also includes the development, construction, and operation of small-scale renewable energy plants. Small-scale renewable energy projects, or energy assets, can either be developed for the portfolio of assets that we own and operate or designed and built for customers. Expenditures related to projects that we own are recorded as cash outflows from investing activities. Expenditures related to projects that we build for customers are recorded as cash outflows from operating activities as cost of revenues.
Cash Flows from Operating Activities
Our cash flow from operating activities in 2022 decreased over 2021 primarily due to a $159.4 million increase in unbilled revenue (costs and estimated earnings in excess of billings) due to the timing of when certain projects are invoiced, including our SCE battery storage project, a decrease of $47.3 million in accounts payable, accrued expenses and other current liabilities, and an increase of $9.8 million in Federal ESPC receivables, partially offset by an increase of $18.4 million in net income.
Cash Flows from Investing Activities
During 2022, we made capital investments of $304.6 million in new energy assets and $18.0 million in major maintenance of energy assets, compared to $170.3 million and $8.6 million, respectively, in 2021. Last year we paid $14.9 million, net of cash received, for an acquisition and also contributed $9.0 million to an equity investment.
We currently plan to invest approximately $325.0 million to $375.0 million in capital investments in 2023, principally for the first quarterconstruction or acquisition of 2015,new renewable energy plants.
Cash Flows from Financing Activities
Our primary sources of financing during 2022 were proceeds of $468.5 million from long-term debt financings and construction revolvers, $252.7 million from advances on Federal ESPC projects and energy assets, and net proceeds from our senior secured revolving credit facility of $137.9 million, partially offset by repayments of long-term debt totaling $161.9 million.
During 2021, we entered intoreceived net proceeds of $186.0 million from long-term debt financings, $161.2 million from advances on Federal ESPC projects and energy assets, and net proceeds of $120.1 million from our equity offering, partially offset by repayments of long-term debt totaling $98.2 million.
We currently plan additional financings of $250.0 million to $300.0 million in 2023 to fund the construction or acquisition of new renewable energy plants as discussed above.
We may also, from time to time, finance our operations through issuance or offering of equity or debt securities.
Critical Accounting Policies and Estimates
Preparing our consolidated financial statements in accordance with GAAP involves us making estimates and assumptions that affect reported amounts of assets and liabilities, net sales, and expenses, and related disclosures in the accompanying notes at the date of our financial statements. We base our estimates on historical experience, industry and market trends, and on various other assumptions that we believe to be reasonable under the circumstances. However, by their nature, estimates are subject to various assumptions and uncertainties, and changes in circumstances could cause actual results to differ from these estimates, sometimes materially.
We believe that our policies and estimates that require our most significant judgments are considered our critical accounting policies and are discussed below. In addition, refer to Note 2 “Summary of Significant Accounting Policies” for further details.
Revenue Recognition
As described in Note 2, we recognize revenue from the installation or construction of projects over time using the cost-based input method. We use the total costs incurred on the project relative to the total expected costs to satisfy the performance obligation. When the estimate on a contract indicates a loss or claims against costs incurred reduce the likelihood of recoverability of such costs, we record the entire estimated loss in the period the loss becomes known. In addition, some contracts contain an agreementelement of variable consideration, including liquidated damages and/or penalties, which requires payment to the customer in the event that construction timelines or milestones are not met. We estimate the total consideration payable by the customer when the contracts contain variable consideration provisions, based on the most likely amount anticipated to be recognized for transferring the promised goods or services. As a result, we may constrain revenue to the extent that a significant reversal in the amount of cumulative revenue recognized will not occur when the uncertainty associated with the variable consideration is subsequently resolved.
To the extent a contract is deemed to have multiple performance obligations, we allocate the transaction price of the contract to each performance obligation using our best estimate of the standalone selling price of each distinct good or service in the contract.
Significant judgement is required to estimate the total expected costs and variable consideration for projects that typically have a construction period of 12 to 36 months. Any increase or decrease in estimated costs to complete a performance obligation without a corresponding change to the contract price could impact the calculation of cumulative revenue to date and gross profit on the project. Similarly, if we recognize revenue based upon our current estimate of variable consideration, and our estimate is later adjusted, we may be required to increase or decrease cumulative revenue to date and gross profit on the project. Factors that may result in a change to our estimates include unforeseen engineering problems, construction delays, the performance of contractors and major material suppliers, and unusual weather conditions, among others.
We have a long history of working with multiple types of projects and preparing cost estimates, and we rely on the expertise of key personnel to prepare what we believe are reasonable best estimates given available facts and circumstances. Due to the nature of the work involved, however, judgment is involved to estimate the costs to complete and the amounts estimated could have a material impact on the revenue we recognize in each accounting period. We cannot estimate unforeseen events and circumstances which may result in actual results being materially different from previous estimates.
Impairment Assessments
We evaluate our long-lived assets, including goodwill and intangible assets, for impairment as events or changes in circumstances indicate the carrying value of these assets may not be fully recoverable, and at least annually (December 31st) for goodwill and intangible assets that have indefinite lives. Examples of such triggering events applicable to our assets include a significant decrease in the market price of a long-lived asset or asset group, a current-period operating or cash flow loss combined with a history of operating or cash flow losses, a projection or forecast that demonstrates continuing losses associated with the use of a long-lived asset or asset group, or adverse industry or economic trends.
We evaluate recoverability of long-lived assets and definite-lived intangible assets by estimating the undiscounted future cash flows associated with the expected uses and eventual disposition of those assets. When these comparisons indicate that the carrying value of those assets is greater than the undiscounted cash flows, we recognize an investorimpairment loss for the amount that the carrying value exceeds the fair value.
The process of evaluating the potential impairment of long-lived assets, goodwill and intangible assets requires significant judgment. For goodwill, we estimate the reporting unit’s fair value and compare it with the carrying value of the reporting unit, including goodwill. If the fair value is greater than the carrying value of its reporting unit, no impairment is recorded. Fair value is determined using both an income approach and a market approach. The estimates and assumptions used in our calculations include revenue growth rates, expense growth rates, expected capital expenditures to determine projected cash flows, expected tax rates and an estimated discount rate to determine present value of expected cash flows. These estimates are based on historical experiences, our projections of future operating activity and our weighted-average cost of capital. Unforeseen events and changes in circumstances or market conditions could adversely affect these estimates, which gives us the option to sellcould result in an impairment charge.
Based on our goodwill impairment assessment, all of our reporting units with goodwill had estimated fair values that exceeded their carrying values by at least 20% as of December 31, 2022 and contemporaneously lease back solar photovoltaic (“solar PV”) projects. This agreement expired on June 30, 2018.61% as of December 31, 2021. During the year ended December 31, 2017,2021, we sold twelve solar PV projects and in return received $47.2recognized a long-lived asset impairment charge of $1.9 million as parton one of this arrangement. Additionally, we sold and contemporaneously leased back one solar PV project to a separate investor, not a party to the master lease agreement, under a new agreement during the year ended December 31, 2017, and in return received $2.0 million. In August 2018, we entered into an agreement with an investor which gives us the option to sell and contemporaneously lease back solar PV projects through August 2019up to a maximum funding amount of $100 million. During the year ended December 31, 2018, we sold two solar PV projects and in return received $4.9 million as part of this arrangement.
During the year ended December 31, 2019, we amended the August 2018 agreement with the investor to extend the end date of the agreement to November 24, 2019, and we sold three projects and in return received $13.7 million. In accordance with Topic 842, Leases, these transactions were accountedour energy asset groups. See Note 7 “Energy Assets” for as failed sales as we retain control of the underlying assets. We recorded the proceeds received from the transactions as long term financing facilities with interest rates ranging from 0% to 0.28%, as a result of tax credits which were transferred to the counterparties. As of December 31, 2019, approximately $81 million remained available under the lending commitment although this full amount is not expected to be used.
In January 2020, we amended the August 2018 agreement with the investor to extend the end date of the agreement to November 24, 2020 and increase the maximum funding amount up to $150 million. While we are required under GAAP to reflect these lease payments as liabilities on our consolidated balance sheets, they are generally non-recourse and not direct obligations of Ameresco, Inc., except that Ameresco, Inc. has guaranteed certain obligations relating to taxes and project warranties, operation and maintenance.
Contractual Obligations
The following table summarizes our significant contractual obligations and commitments as of December 31, 2019 (in thousands):additional information.
|
| | | | | | | | | | | | | | | | | | | | |
| | | Payments due by Period |
| | | | | Less than | | One to | | Three to | | More than |
| | | Total | | One Year | | Three Years | | Five Years | | Five Years |
| Senior Secured Credit Facility: | | | | | | | | | | |
| Revolver | | $ | 50,073 |
| | $ | — |
| | $ | — |
| | $ | 50,073 |
| | $ | — |
|
| Term Loan | | 62,563 |
| | 4,875 |
| | 14,625 |
| | 43,063 |
| | — |
|
| Project Financing: | | | | | | | | | | |
| Construction and term loans | | 204,470 |
| | 60,097 |
| | 75,534 |
| | 22,331 |
| | 46,508 |
|
| Federal ESPC liabilities(1) | | 245,037 |
| | — |
| | 245,037 |
| | — |
| | — |
|
| Interest obligations(2) | | 81,691 |
| | 17,449 |
| | 26,753 |
| | 16,432 |
| | 21,057 |
|
| Financing lease liabilities | | 28,497 |
| | 4,997 |
| | 9,431 |
| | 1,802 |
| | 12,267 |
|
| Operating leases | | 55,234 |
| | 9,153 |
| | 14,115 |
| | 9,375 |
| | 22,591 |
|
| Total | | $ | 727,565 |
| | $ | 96,571 |
| | $ | 385,495 |
| | $ | 143,076 |
| | $ | 102,423 |
|
|
| | | |
(1 | ) | | Federal ESPC arrangements relate to the installation and construction of projects for certain customers, typically federal governmental entities, where we assign to third-parties our right to customer receivables. We are relieved of the liability, without making a payment, when the project is completed and accepted by the customer. We typically expect to be relieved of the liability between one and three years from the date of project construction commencement. The table does not include, for our Federal ESPC liability arrangements, the difference between the aggregate amount of the long-term customer receivables sold by us to the third-party and the amount received by us from the third party for such sale. |
| | |
(2 | ) | | For both the revolving and term loan portions of our senior secured credit facility, the table above assumes that the variable interest rate in effect at December 31, 2019 remains constant for the term of the facility. |
Off-Balance Sheet Arrangements
Income Taxes
We didare subject to income taxes in the U.S. and five foreign jurisdictions. Significant judgment is required in determining income tax expense, deferred tax assets and liabilities and uncertain tax positions. The underlying assumptions are also highly susceptible to change from period to period. We took advantage of the Safe Harbor commence-construction provisions contained in IRS Notice 2018-59 by pre-purchasing solar equipment in 2019 thereby preserving the ability to take 30% ITC for projects placed in service before 2024. However, the IRA signed by the President on August 16, 2022 increased the ITC rate back to 30% for projects placed in service after January 1, 2022 and before January 1, 2033. If these or other deductions and credits expire without being extended, or otherwise are reduced or eliminated, our effective tax rate would increase, which could increase our income tax expense and reduce our net income. In addition, our tax rate has historically been significantly impacted by the IRC Section 179D deduction. This deduction is related to energy-efficient improvements we provide under government contracts. The Consolidated Appropriations Act, 2021 made permanent the Section 179D Energy Efficient Commercial Building Deduction. That Act made changes to the way the deduction is calculated. On December 23, 2022, the IRS issued Announcement 2023-1 which clarified the energy efficiency standards which will be applied to projects placed in service for 2021 and 2022. If those changes result in lower levels of energy efficiency improvements, it could impact the deduction available and the tax rate.
We accrue for the estimated additional tax and interest that may result from tax authorities disputing uncertain tax positions. We believe we have made adequate provisions for income taxes for all years that are subject to audit based upon the latest information available. We operate within multiple taxing jurisdictions and are subject to tax audits in these jurisdictions. These audits can involve complex issues and may require an extended period of time to resolve. We recognize tax benefits from uncertain tax positions only if we believe that it is more likely than not that the tax position will be sustained on examination by the taxing authorities based on the technical merits of the position. Although we believe that we have adequately reserved for our uncertain tax positions, we can provide no assurance that the final tax outcome of these matters will not be materially different. We adjust these reserves when facts and circumstances change, such as the closing of a tax audit or the refinement of an estimate. To the extent that the final tax outcome of these matters is different than the amounts recorded, such differences may affect the provision for income taxes in the period in which such determination is made and could have an impact on our results of operations.
On a quarterly basis, we assess our current and projected earnings by jurisdiction to determine whether or not our earnings during the periods presented, andwhen the temporary differences become deductible will be sufficient to realize the related future tax benefits. Should we dodetermine that we would not currently have, any off-balance sheet arrangements, as defined under SEC rules,be able to realize all or part of our net deferred tax asset in a particular jurisdiction in the future, a valuation allowance to the deferred tax asset would be charged to income in the period such as relationships with unconsolidated entities or financial partnerships, whichdetermination was made. This valuation allowance is maintained for deferred tax assets that we estimate are often referred to as structured finance or special purpose entities, established for the purpose of facilitating financing transactions that aremore likely than not required to be reflectedunrealizable based on available evidence at the time the estimate is made. The determination of whether a valuation allowance for deferred tax assets is appropriate is subject to considerable judgment and requires an evaluation of all positive and negative evidence, including our historical financial results, the source and consistency of those results, whether they should be adjusted for certain one-time or nonrecurring items, whether losses cumulatively exceed income over a reasonable period of time, the availability of tax planning strategies, availability of carryback and carryforward periods, and other factors, including our expectations of future taxable income. Adjustments to income tax expense to the extent we establish a valuation allowance or adjust this allowance in a period could have a material impact on our balance sheets. The Company from timefinancial condition and results of operations.
Recent Accounting Pronouncements
See Note 2 of the “Notes to time issues lettersConsolidated Financial Statements” for a discussion of credit and performance bonds, with their third-party lenders, to provide collateral.recent accounting standards.
Item 7A. Quantitative and Qualitative Disclosures About Market Risk
We are exposed to changes in interest rates and foreign currency exchange rates because we finance certain operations through fixed and variable rate debt instruments and denominate our transactions in U.S. anddollars, Canadian dollars, and British pounds sterling (“GBP”)., and Euros. Changes in these rates may have an impact on future cash flows and earnings. We manage these risks through normal operating and financing activities and, when deemed appropriate, through the use of derivative financial instruments.
Interest Rate Risk
We had cash and cash equivalents totaling $33.2$115.5 million as of December 31, 20192022 and $61.4$50.5 million as of December 31, 2018.2021. Our exposure to interest rate risk primarily relates to the interest expense paid on our senior secured credit facility.
Derivative Instruments
We do not enter into financialderivative instruments for trading or speculative purposes. However, through our subsidiaries we do enter into derivative instruments for purposes other than trading purposes. Certain of the term loans that we use to finance our
renewable energy projects bear variable interest rates that are indexed to short-term market rates. We have entered into interest rate swaps in connection with these term loans in order to seek to hedge our exposure to adverse changes in the applicable short-term market rate. In some instances, the conditions of our renewable energy project term loans require us to enter into interest rate swap agreements in order to mitigate our exposure to adverse movements in market interest rates. All but onetwo of the interest rate swaps that we have entered into qualify and have been designated as fair valuecash flow hedges. We have alsoIn the past, we entered into two commodity swap contracts in order to hedge our exposure to adverse changes in the short-term market rates of natural gas, which have not been designated for hedge accounting. See Notes 2, 18accounting, and 19 of “Notes to Consolidated Financial Statements” includedmay do so in Item 8 of this Annual Report on Form 10-K.the future.
We have also entered into term loan agreements that contain interest make-whole provisions that qualify as embedded derivatives thatand are required to be bifurcated from their host term loan agreement and valued separately. These derivatives cannot be hedged. See Notes 2, 18 and 19 of “Notes to Consolidated Financial Statements” included in Item 8 of this Annual Report on Form 10-K.
By using derivative instruments, we are subject to credit and market risk. The fair market value of the interest rate and commodity swaps are determined by using valuation models whose inputs are derived using market observable inputs, including interest rate yield curves, and reflects the asset or liability position as of the end of each reporting period. When the fair value of a derivative contract is positive, the counterparty owes us, thus creating a receivable risk for us. We are exposed to counterparty credit risk in the event of non-performance by counterparties to our derivative agreements. We minimize counterparty credit (or repayment) risk by entering into transactions with major financial institutions of investment grade credit rating. The fair value of these make-whole provisions was determined based on available market data and a with and without model.
Our exposure to market interest rate risk is not hedged in a manner that completely eliminates the effects of changing market conditions on earnings or cash flow. See Notes 2 “Summary of Significant Accounting Policies”, 18 “Fair Value Measurement”, and 19 “Derivative Instruments and Hedging Activities” included in Item 8 of this Report for additional information about our derivative instruments.
Foreign Currency Risk
We have revenues, expenses, assets, and liabilities that are denominated in foreign currencies, principally the Canadian dollar and British pound sterling.sterling (“GBP”). Also, a significant number of employees are located in Canada and the U.K.,United Kingdom, and our subsidiaries in those countries transact business in those respective currencies. As a result, we have designated the Canadian dollar as the functional currency for Canadian operations. Similarly, the GBP has been designated as the functional currency for our operations in the U.K.United Kingdom When we consolidate the operations of these foreign subsidiaries into our financial results, because we report our results in U.S. dollars, we are required to translate the financial results and position of our foreign subsidiaries from their respective functional currencies into U.S. dollars. We translate the revenues, expenses, gains, and losses from our Canadian and U.K.United Kingdom subsidiaries into U.S. dollars using a weighted average exchange rate for the applicable fiscal period. We
translate the assets and liabilities of our Canadian and U.K.United Kingdom subsidiaries into U.S. dollars at the exchange rate in effect at the applicable balance sheet date. Translation adjustments are not included in determining net income for the period but are disclosed and accumulated in a separate component of consolidated equity until sale or until a complete or substantially complete liquidation of the net investment in our foreign subsidiary takes place. Changes in the values of these items from one period to the next which result from exchange rate fluctuations are recorded in our consolidated statements of changes in stockholders’ equity as accumulated other comprehensive loss.income (loss). For the year ended December 31, 2019,2022, due to the strengtheningweakening of the GBPCanadian dollar and CAD versus the U.S. dollar, our foreign currency translation resulted in a gain of $1.4 million which we recorded as a decrease in accumulated other comprehensive loss. For the year ended December 31, 2018, the weakening of the GBP versus the U.S. dollar, our foreign currency translation resulted in a loss of $0.3$3.4 million which we recorded as an increasea decrease in accumulated other comprehensive loss.loss, compared to $0.2 million for the year ended December 31, 2021. As a consequence, gross profit, operating results, profitability, and cash flows are impacted by relative changes in the value of the Canadian dollar and GBP. We have not repatriated earnings from our foreign subsidiaries but have elected to invest in new business opportunities there. See Note 10, “Income Taxes” to our consolidated financial statements appearing in Item 8 of this Annual Report on Form 10-K.Report. We do not hedge our exposure to foreign currency exchange risk.
Item 8. Financial Statements and Supplementary Data
INDEX TO CONSOLIDATED FINANCIAL STATEMENTS
Report of Independent Registered Public Accounting Firm
To the Stockholders and the Board of Directors of Ameresco, Inc.
Opinions on the Financial Statements and Internal Control Over Financial Reporting
We have audited the accompanying consolidated balance sheets of Ameresco, Inc. (the Company) as of December 31, 2022 and 2021, and the related consolidated statements of income, other comprehensive income, changes in redeemable non-controlling interests and stockholders' equity and cash flows for each of the three years in the period ended December 31, 2022, and the related notes (collectively, the financial statements). We also have audited the Company’s internal control over financial reporting as of December 31, 2022, based on criteria established in Internal Control — Integrated Framework issued by the Committee of Sponsoring Organizations of the Treadway Commission in 2013.
In our opinion, the financial statements referred to above present fairly, in all material respects, the financial position of the Company as of December 31, 2022 and 2021, and the results of its operations and its cash flows for each of the years in the three-year period ended December 31, 2022, in conformity with accounting principles generally accepted in the United States of America. Also in our opinion, the Company maintained, in all material respects, effective internal control over financial reporting as of December 31, 2022, based on criteria established in Internal Control — Integrated Framework issued by the Committee of Sponsoring Organizations of the Treadway Commission in 2013.
Basis for Opinions
The Company's management is responsible for these financial statements, for maintaining effective internal control over financial reporting, and for its assessment of the effectiveness of internal control over financial reporting, included in the accompanying Management’s Annual Report on Internal Control over Financial Reporting. Our responsibility is to express an opinion on the Company's financial statements and an opinion on the Company's internal control over financial reporting based on our audits. We are a public accounting firm registered with the Public Company Accounting Oversight Board (United States) (PCAOB) and are required to be independent with respect to the Company in accordance with U.S. federal securities laws and the applicable rules and regulations of the Securities and Exchange Commission and the PCAOB.
We conducted our audits in accordance with the standards of the PCAOB. Those standards require that we plan and perform the audits to obtain reasonable assurance about whether the financial statements are free of material misstatement, whether due to error or fraud, and whether effective internal control over financial reporting was maintained in all material respects.
Our audits of the financial statements included performing procedures to assess the risks of material misstatement of the financial statements, whether due to error or fraud, and performing procedures that respond to those risks. Such procedures included examining, on a test basis, evidence regarding the amounts and disclosures in the financial statements. Our audits also included evaluating the accounting principles used and significant estimates made by management, as well as evaluating the overall presentation of the financial statements. Our audit of internal control over financial reporting included obtaining an understanding of internal control over financial reporting, assessing the risk that a material weakness exists, and testing and evaluating the design and operating effectiveness of internal control based on the assessed risk. Our audits also included performing such other procedures as we considered necessary in the circumstances. We believe that our audits provide a reasonable basis for our opinions.
Definition and Limitations of Internal Control Over Financial Reporting
A company's internal control over financial reporting is a process designed to provide reasonable assurance regarding the reliability of financial reporting and the preparation of financial statements for external purposes in accordance with generally accepted accounting principles. A company's internal control over financial reporting includes those policies and procedures that (1) pertain to the maintenance of records that, in reasonable detail, accurately and fairly reflect the transactions and dispositions of the assets of the company; (2) provide reasonable assurance that transactions are recorded as necessary to permit preparation of financial statements in accordance with generally accepted accounting principles, and that receipts and expenditures of the company are being made only in accordance with authorizations of management and directors of the company; and (3) provide reasonable assurance regarding prevention or timely detection of unauthorized acquisition, use or disposition of the company's assets that could have a material effect on the financial statements.
Because of its inherent limitations, internal control over financial reporting may not prevent or detect misstatements. Also, projections of any evaluation of effectiveness to future periods are subject to the risk that controls may become inadequate because of changes in conditions, or that the degree of compliance with the policies or procedures may deteriorate.
Critical Audit Matters
The critical audit matters communicated below are matters arising from the current period audit of the financial statements that were communicated or required to be communicated to the audit committee and that: (1) relate to accounts or disclosures that are material to the financial statements and (2) involved our especially challenging, subjective or complex judgments. The communication of critical audit matters does not alter in any way our opinion on the financial statements, taken as a whole, and we are not, by communicating the critical audit matters below, providing separate opinions on the critical audit matters or on the accounts or disclosures to which they relate.
Goodwill Impairment
As described in Notes 2 and 5 to the financial statements, management tests the Company’s goodwill, which had a balance of $70.6 million as of December 31, 2022, for impairment, at the reporting unit level, at December 31 of each fiscal year, or more frequently if events or changes in circumstances indicate the asset might be impaired. To test goodwill for impairment, management compares the estimated fair value of each reporting unit with the carrying amount of each reporting unit, including the recorded goodwill. In estimating the fair value of each reporting unit, management uses a methodology which combines an income approach, using a discounted cash flows method, with a market approach, using a peer-based guideline company method based on the average of published multiples of earnings of comparable entities with similar operations and economic characteristics.
We identified the annual goodwill impairment assessment for one of the Company’s reporting units as a critical audit matter because of the significant estimates and assumptions used by management when estimating the fair value of this reporting unit, including management’s forecasts of revenue and expense growth rates, management’s selection of the discount rate for the income approach and management’s estimates of the multiples of earnings of comparable entities with similar operations and economic characteristics for the market approach. Auditing management’s estimates and assumptions involved a high degree of auditor judgment and increased audit effort, including the use of our valuation specialists, due to the impact these assumptions have on the goodwill impairment assessment.
Our audit procedures related to the assessment of goodwill impairment included the following, among others:
•We obtained an understanding of the relevant controls relating to management’s goodwill impairment assessment and tested such controls for design and operating effectiveness, including controls over management’s review of the significant assumptions used in the estimate of fair value, including forecasted revenue and expense growth rates, the selected discount rates, and the selected multiples of earnings.
•We evaluated the reasonableness of management’s forecasts of revenue and expense growth rates by comparing the projections to historical results and testing certain contracts contributing to the revenue forecast..
•We tested the underlying data used by management in their development of forecasts of revenue and expense growth rates for accuracy and completeness.
•We evaluated the reasonableness of management’s selection of comparable entities with similar operations and economic characteristics.
•With the assistance of our valuation specialists, we evaluated the reasonableness of management’s valuation methodology and significant assumptions by:
◦Evaluating the reasonableness of the discount rate and multiples of earnings by comparing the underlying source information to publicly available market data and verifying the accuracy of the calculations.
◦Developing an independent expectation of the discount rate and compared against the discount rate selected by management.
◦Evaluating the appropriateness of the valuation methods used by management and testing their mathematical accuracy.
Revenue from Contracts with Customers – Project Revenue
As described in Notes 2 and 3 to the financial statements, the Company’s projects line of business, which relates to the construction of energy efficiency projects, including the design, engineering and installation of technologies and techniques to improve energy efficiency and control the operation of a building’s energy- and-water-consuming systems, recognized revenue of $1.48 billion during the year ended December 31, 2022. Typically, the Company provides a service of integrating a complex set of tasks and components such as design, engineering, construction management, and equipment procurement for a project contract. The Company’s project revenues are generated from long-term contracts whereby revenue is recognized over time using the cost-based input method. The Company uses total costs incurred on the project relative to the total expected costs to estimate progression towards the satisfaction of the performance obligation.
Estimating the amount of project revenue to record from the Company’s long-term contracts requires management’s judgment in estimating final construction contract profits, which are driven by the total estimated consideration payable by the customer and total estimated contract costs. The Company estimates the total consideration payable by the customer when the contracts contain variable consideration provisions, which can include liquidated damages and/or penalties, based on the most likely amount anticipated to be recognized for transferring the promised goods or services. As a result, the Company may constrain revenue to the extent that a significant reversal in the amount of cumulative revenue recognized will not occur when the uncertainty associated with the variable consideration is subsequently resolved. Anticipated contract costs can be incurred over several years and are largely determined based on negotiated or estimated purchase contract terms and consider factors such as historical performance, seasonal and construction schedule risks, estimated subcontractor costs and contingency costs.
We identified the Company’s accounting for revenue recognition from the project line of business to be a critical audit matter due to the significant judgments used by management related to the estimation of final construction profits. Estimating the final construction profit on these long-term contracts requires management to develop estimates of the total consideration payable by the customer, when contracts contain variable consideration provisions, as well as total expected contract costs, including costs associated with labor, materials, equipment, subcontracting and outside engineering cost. Auditing management’s estimates and assumptions involved a high degree of auditor judgment and increased audit effort due to the impact these assumptions have on the revenue recognized.
Our audit procedures related to project revenue included the following, among others:
•We obtained an understanding of the relevant controls related to the recognition of project revenue and tested such controls for design and operating effectiveness, including controls over the determination of the final estimated construction profit, which includes management’s review of the assumptions and key inputs used to recognize revenue on project contracts using the cost-to-cost input method, including costs associated with labor, materials, equipment, subcontracting and outside engineering along with estimates of total consideration payable when contracts contain variable consideration provisions.
•We performed substantive analytical procedures on the Company’s project revenue line of business, with a focus on significant changes in gross margin, contract budgets and contract pricing from the prior year, on contracts open in both the current year and prior year.
•We selected a sample of project contracts and evaluated the estimates of total costs for each of the project contracts by:
◦Evaluating management’s judgments related to the Company’s ability to achieve the estimates of final construction contract profit as well as achievement on project timelines by performing corroborating inquiries with Company personnel, including project managers, and comparing the estimates to documentation such as management’s internal budgets and specified contract terms.
◦Confirmation of project progression with customers, including identification of any delays in project timeline.
/s/ RSM US LLP
We have served as the Company's auditor since 2010.
Boston, Massachusetts
February 28, 2023
AMERESCO, INC.
CONSOLIDATED BALANCE SHEETS
(inIn thousands, except share amounts)
| | | | | | | | | | | |
| December 31, |
| 2022 | | 2021 |
| ASSETS | | | |
| Current assets: | | | |
Cash and cash equivalents (1) | $ | 115,534 | | | $ | 50,450 | |
Restricted cash (1) | 20,782 | | | 24,267 | |
Accounts receivable, net (1) | 174,009 | | | 161,970 | |
| Accounts receivable retainage | 38,057 | | | 43,067 | |
Costs and estimated earnings in excess of billings (1) | 576,363 | | | 306,172 | |
| Inventory, net | 14,218 | | | 8,807 | |
Prepaid expenses and other current assets (1) | 38,617 | | | 25,377 | |
| Income tax receivable | 7,746 | | | 5,261 | |
| Project development costs, net | 16,025 | | | 13,214 | |
Total current assets (1) | 1,001,351 | | | 638,585 | |
| Federal ESPC receivable | 509,507 | | | 557,669 | |
Property and equipment, net (1) | 15,707 | | | 13,117 | |
Energy assets, net (1) | 1,181,525 | | | 856,531 | |
| Goodwill, net | 70,633 | | | 71,157 | |
| Intangible assets, net | 4,693 | | | 6,961 | |
Operating lease assets (1) | 38,224 | | | 41,982 | |
| Restricted cash, non-current portion | 13,572 | | | 12,337 | |
| Deferred income tax assets, net | 3,045 | | | 3,703 | |
Other assets (1) | 38,564 | | | 22,779 | |
Total assets (1) | $ | 2,876,821 | | | $ | 2,224,821 | |
| LIABILITIES, REDEEMABLE NON-CONTROLLING INTERESTS AND STOCKHOLDERS’ EQUITY |
| Current liabilities: | | | |
Current portion of long-term debt and financing lease liabilities (1) | $ | 331,479 | | | $ | 78,934 | |
Accounts payable (1) | 349,126 | | | 308,963 | |
Accrued expenses and other current liabilities (1) | 89,166 | | | 43,311 | |
Current portion of operating lease liabilities (1) | 5,829 | | | 6,276 | |
| Billings in excess of cost and estimated earnings | 34,796 | | | 35,918 | |
| Income taxes payable | 1,672 | | | 822 | |
Total current liabilities (1) | 812,068 | | | 474,224 | |
Long-term debt and financing lease liabilities, net of current portion, unamortized discount, and debt issuance costs (1) | 568,635 | | | 377,184 | |
| Federal ESPC liabilities | 478,497 | | | 532,287 | |
| Deferred income tax liabilities, net | 9,181 | | | 3,871 | |
| Deferred grant income | 7,590 | | | 8,498 | |
Long-term operating lease liabilities, net of current portion (1) | 31,703 | | | 35,135 | |
Other liabilities (1) | 49,493 | | | 43,176 | |
| Commitments and contingencies: | | | |
| Redeemable non-controlling interests, net | 46,623 | | | 46,182 | |
(1) Includes restricted assets of consolidated variable interest entities (“VIEs”) of $213,913 as of December 31, 2022 and $124,454 as of December 31, 2021. Includes non-recourse liabilities of consolidated VIEs of $50,729 as of December 31, 2022 and $31,125 as of December 31, 2021. See Note 11.
|
| | | | | | | |
| | December 31, |
| | 2019 | | 2018 |
| ASSETS |
| Current assets: | | | |
| Cash and cash equivalents (including amounts in VIEs of $4,666 and $1,255, respectively) | $ | 33,223 |
|
| $ | 61,397 |
|
| Restricted cash (including amounts in VIEs of $586 and $156, respectively) | 20,006 |
|
| 16,880 |
|
| Accounts receivable, net (including amounts in VIEs of $532 and $374, respectively) | 95,863 |
| | 85,985 |
|
| Accounts receivable retainage, net | 16,976 |
| | 13,516 |
|
| Costs and estimated earnings in excess of billings (including amounts in VIEs of $1,125 and $498, respectively) | 202,243 |
| | 86,842 |
|
| Inventory, net | 9,236 |
| | 7,765 |
|
| Prepaid expenses and other current assets (including amounts in VIEs of $108 and $190, respectively) | 29,424 |
| | 11,571 |
|
| Income tax receivable | 5,033 |
| | 5,296 |
|
| Project development costs | 13,188 |
| | 21,717 |
|
| Total current assets | 425,192 |
| | 310,969 |
|
| Federal ESPC receivable | 230,616 |
| | 293,998 |
|
| Property and equipment, net (including amounts in VIEs of $1,266 and $0, respectively) | 10,104 |
| | 6,985 |
|
| Energy assets, net (including amounts in VIEs of $142,456 and $122,641, respectively) | 579,461 |
| | 459,952 |
|
| Goodwill | 58,414 |
| | 58,332 |
|
| Intangible assets, net | 1,614 |
| | 2,004 |
|
| Operating lease assets (including amounts in VIEs of $6,511 and $0, respectively) | 32,791 |
| | — |
|
| Other assets (including amounts in VIEs of $1,662 and $1,613, respectively) | 35,821 |
| | 29,394 |
|
| Total assets | $ | 1,374,013 |
| | $ | 1,161,634 |
|
| | | | |
| LIABILITIES, REDEEMABLE NON-CONTROLLING INTERESTS AND STOCKHOLDERS’ EQUITY |
| Current liabilities: | | | |
| Current portions of long-term debt and financing lease liabilities (including amounts in VIEs of $2,252 and $1,712, respectively) | $ | 69,969 |
| | $ | 26,890 |
|
| Accounts payable (including amounts in VIEs of $2,006 and $234, respectively) | 202,416 |
| | 134,330 |
|
| Accrued expenses and other current liabilities (including amounts in VIEs of $2,203 and $4,146, respectively) | 31,356 |
| | 35,947 |
|
| Current portions of operating lease liabilities (including amounts in VIEs of $102 and $0, respectively) | 5,802 |
| | — |
|
| Billings in excess of cost and estimated earnings | 26,618 |
| | 24,363 |
|
| Income taxes payable | 486 |
| | 1,100 |
|
| Total current liabilities | 336,647 |
| | 222,630 |
|
| Long-term debt and financing lease liabilities, less current portions and net of deferred financing fees (including amounts in VIEs of $24,654 and $26,461, respectively) | 266,181 |
| | 219,162 |
|
| Federal ESPC liabilities | 245,037 |
| | 288,047 |
|
| Deferred income taxes, net | 115 |
| | 4,352 |
|
| Deferred grant income | 6,885 |
| | 6,637 |
|
| Long-term portions of operating lease liabilities, less current portions (including amounts in VIEs of $6,180 and $0, respectively) | 29,101 |
| | — |
|
| Other liabilities (including amounts in VIEs of $1,171 and $2,131, respectively) | 29,575 |
| | 29,212 |
|
| Commitments and contingencies (Note 15) |
| |
|
| Redeemable non-controlling interests | 31,616 |
| | 14,719 |
|
TheAMERESCO, INC.
CONSOLIDATED BALANCE SHEETS
(In thousands, except share amounts) (Continued)
| | | | | | | | | | | |
| December 31, |
| 2022 | | 2021 |
| Stockholders’ equity: | | | |
| Preferred stock, $0.0001 par value, 5,000,000 shares authorized, no shares issued and outstanding at December 31, 2022 and 2021 | $ | — | | | $ | — | |
| Class A common stock, $0.0001 par value, 500,000,000 shares authorized, 36,050,157 shares issued and 33,948,362 shares outstanding at December 31, 2022, 35,818,104 shares issued and 33,716,309 shares outstanding at December 31, 2021 | 3 | | | 3 | |
| Class B common stock, $0.0001 par value, 144,000,000 shares authorized, 18,000,000 shares issued and outstanding at December 31, 2022 and 2021 | 2 | | | 2 | |
| Additional paid-in capital | 306,314 | | | 283,982 | |
| Retained earnings | 533,549 | | | 438,732 | |
| Accumulated other comprehensive loss, net | (4,051) | | | (6,667) | |
| Treasury stock, at cost, 2,101,795 shares at December 31, 2022 and 2021 | (11,788) | | | (11,788) | |
| Stockholders’ equity before non-controlling interest | 824,029 | | | 704,264 | |
| Non-controlling interests | 49,002 | | | — | |
| Total stockholders’ equity | 873,031 | | | 704,264 | |
| Total liabilities, redeemable non-controlling interests and stockholders’ equity | $ | 2,876,821 | | | $ | 2,224,821 | |
| | | |
| | | |
| | | |
| | | |
| | | |
See accompanying notes are an integral part of theseto consolidated financial statements.
|
| | | | | | | |
| AMERESCO, INC. |
| CONSOLIDATED BALANCE SHEETS — (Continued) |
| (in thousands, except share amounts) |
| | December 31, |
| | 2019 | | 2018 |
| Stockholders’ equity: | | | |
| Preferred stock, $0.0001 par value, 5,000,000 shares authorized, no shares issued and outstanding at December 31, 2019 and 2018 | $ | — |
| | $ | — |
|
| Class A common stock, $0.0001 par value, 500,000,000 shares authorized, 31,331,345 shares issued and 29,230,005 shares outstanding at December 31, 2019, 30,366,546 shares issued and 28,275,506 shares outstanding at December 31, 2018 | 3 |
| | 3 |
|
| Class B common stock, $0.0001 par value, 144,000,000 shares authorized, 18,000,000 shares issued and outstanding at December 31, 2019 and 2018 | 2 |
| | 2 |
|
| Additional paid-in capital | 133,688 |
| | 124,651 |
|
| Retained earnings | 314,459 |
| | 269,806 |
|
| Accumulated other comprehensive loss, net of income taxes | (7,514 | ) | | (5,949 | ) |
| Less - treasury stock, at cost, 2,101,340 shares at December 31, 2019, and 2,091,040 shares at December 31, 2018 | (11,782 | ) | | (11,638 | ) |
| Total stockholder’s equity | 428,856 |
| | 376,875 |
|
| Total liabilities, redeemable non-controlling interests and stockholders’ equity | $ | 1,374,013 |
| | $ | 1,161,634 |
|
The accompanying notes are an integral part of these consolidated financial statements.
AMERESCO, INC.
CONSOLIDATED STATEMENTS OF INCOME
(inIn thousands, except per share amounts)
| | | | | | | | | | | | | | | | | |
| | Year Ended December 31, |
| | 2022 | | 2021 | | 2020 |
| Revenues | $ | 1,824,422 | | | $ | 1,215,697 | | | $ | 1,032,275 | |
| Cost of revenues | 1,533,589 | | | 985,340 | | | 844,726 | |
| Gross profit | 290,833 | | | 230,357 | | | 187,549 | |
| Selling, general and administrative expenses | 157,841 | | | 134,923 | | | 116,050 | |
| | | | | |
| Operating income | 132,992 | | | 95,434 | | | 71,499 | |
| Other expenses, net | 27,273 | | | 17,290 | | | 15,071 | |
| Income before income taxes | 105,719 | | | 78,144 | | | 56,428 | |
| Income tax expense (benefit) | 7,170 | | | (2,047) | | | (494) | |
| Net income | 98,549 | | | 80,191 | | | 56,922 | |
| Net income attributable to non-controlling interest and redeemable non-controlling interest | (3,623) | | | (9,733) | | | (2,870) | |
| Net income attributable to common shareholders | $ | 94,926 | | | $ | 70,458 | | | $ | 54,052 | |
| Net income per share attributable to common shareholders: | | | | | |
| Basic | $ | 1.83 | | | $ | 1.38 | | | $ | 1.13 | |
| Diluted | $ | 1.78 | | | $ | 1.35 | | | $ | 1.10 | |
| Weighted average common shares outstanding: | | | | | |
| Basic | 51,841 | | | 50,855 | | | 47,702 | |
| Diluted | 53,278 | | | 52,268 | | | 49,006 | |
|
| | | | | | | | | | | |
| | Year Ended December 31, |
| | 2019 | | 2018 | | 2017 |
| Revenues | $ | 866,933 |
| | $ | 787,138 |
| | $ | 717,152 |
|
| Cost of revenues | 698,815 |
| | 613,526 |
| | 572,994 |
|
| Gross profit | 168,118 |
| | 173,612 |
| | 144,158 |
|
| Selling, general and administrative expenses | 116,504 |
| | 114,513 |
| | 107,570 |
|
| Operating income | 51,614 |
| | 59,099 |
| | 36,588 |
|
| Other expenses, net | 15,061 |
| | 16,709 |
| | 7,871 |
|
| Income before (benefit) provision for income taxes | 36,553 |
| | 42,390 |
| | 28,717 |
|
| Income tax (benefit) provision | (3,748 | ) | | 4,813 |
| | (4,791 | ) |
| Net income | 40,301 |
| | 37,577 |
| | 33,508 |
|
| Net loss attributable to redeemable non-controlling interests | 4,135 |
| | 407 |
| | 3,983 |
|
| Net income attributable to common shareholders | $ | 44,436 |
| | $ | 37,984 |
| | $ | 37,491 |
|
| Net income per share attributable to common shareholders: | |
| | |
| | |
|
| Basic | $ | 0.95 |
| | $ | 0.83 |
| | $ | 0.82 |
|
| Diluted | $ | 0.93 |
| | $ | 0.81 |
| | $ | 0.82 |
|
| Weighted average common shares outstanding: | |
| | | | |
| Basic | 46,586 |
| | 45,729 |
| | 45,509 |
|
| Diluted | 47,774 |
| | 46,831 |
| | 45,748 |
|
TheSee accompanying notes are an integral part of theseto consolidated financial statements.
AMERESCO, INC.
CONSOLIDATED STATEMENTS OF COMPREHENSIVE INCOME
(inIn thousands)
| | | | | | | | | | | | | | | | | |
| Year Ended December 31, |
| 2022 | | 2021 | | 2020 |
| Net income | $ | 98,549 | | | $ | 80,191 | | | $ | 56,922 | |
| Other comprehensive income (loss): | | | | | |
| Unrealized gain (loss) from interest rate hedges, net of tax effect of $2,039, $662, and $(1,014), respectively | 6,017 | | | 2,793 | | | (2,784) | |
| Foreign currency translation adjustment | (3,401) | | | (170) | | | 1,008 | |
| Total other comprehensive income (loss) | 2,616 | | | 2,623 | | | (1,776) | |
| Comprehensive income | 101,165 | | | 82,814 | | | 55,146 | |
| Comprehensive income attributable to redeemable non-controlling interests | (3,623) | | | (9,733) | | | (2,870) | |
| Comprehensive income attributable to common shareholders | $ | 97,542 | | | $ | 73,081 | | | $ | 52,276 | |
|
| | | | | | | | | | | |
| | Year Ended December 31, |
| | 2019 | | 2018 | | 2017 |
| Net income | $ | 40,301 |
| | $ | 37,577 |
| | $ | 33,508 |
|
| Other comprehensive income (loss): | | | | | |
| Unrealized (loss) gain from interest rate hedges, net of tax effect of $(984), $(12) and $(35), respectively | (2,944 | ) | | (73 | ) | | 310 |
|
| Foreign currency translation adjustment | 1,379 |
| | (250 | ) | | 655 |
|
| Total other comprehensive income (loss) | (1,565 | ) | | (323 | ) | | 965 |
|
| Comprehensive income | 38,736 |
| | 37,254 |
| | 34,473 |
|
| Comprehensive loss attributable to redeemable non-controlling interests | 4,135 |
| | 407 |
| | 3,983 |
|
| Comprehensive income attributable to common shareholders | $ | 42,871 |
| | $ | 37,661 |
| | $ | 38,456 |
|
TheSee accompanying notes are an integral part of theseto consolidated financial statements.
AMERESCO, INC.
CONSOLIDATED STATEMENTS OF CHANGES IN REDEEMABLE NON-CONTROLLING INTERESTS AND STOCKHOLDERS’ EQUITY
(inIn thousands, except share amounts) | | | | | | | | | | | | | | | | | | | | | | | | | | | | | | | | | | | | | | | | | | | | | | | | | | | | | | | | | | | | | | | | | | | | | | | |
| Redeemable Non-controlling Interests | | Class A Common Stock | | Class B Common Stock | | Additional Paid-in Capital | | Retained Earnings | | Treasury Stock | | Accumulated Other Comprehensive Loss | | Non-controlling Interest | | Total Stockholders' Equity |
| | Shares | | Amount | | Shares | | Amount | | | | Shares | | Amount | | | |
| Balance, December 31, 2019 | $ | 31,616 | | | 29,230,005 | | | $ | 3 | | | 18,000,000 | | | $ | 2 | | | 133,688 | | | $ | 314,459 | | | 2,101,340 | | | $ | (11,782) | | | $ | (7,514) | | | $ | — | | | $ | 428,856 | |
| Exercise of stock options, net | — | | | 946,139 | | | — | | | — | | | — | | | 8,995 | | | — | | | — | | | — | | | — | | | — | | | 8,995 | |
| Stock-based compensation expense | — | | | — | | | — | | | — | | | — | | | 1,933 | | | — | | | — | | | — | | | — | | | — | | | 1,933 | |
| Employee stock purchase plan | — | | | 48,965 | | | — | | | — | | | — | | | 880 | | | — | | | — | | | — | | | — | | | — | | | 880 | |
| Open market purchase of common shares | — | | | (455) | | | — | | | — | | | — | | | — | | | — | | | 455 | | | (6) | | | — | | | — | | | (6) | |
| Unrealized loss from interest rate hedges, net | — | | | — | | | — | | | — | | | — | | | — | | | — | | | — | | | — | | | (2,784) | | | — | | | (2,784) | |
| Foreign currency translation adjustment | — | | | — | | | — | | | — | | | — | | | — | | | — | | | — | | | — | | | 1,008 | | | — | | | 1,008 | |
| Contributions from redeemable non-controlling interests, net of tax equity financing fees of $622 | 5,777 | | | — | | | — | | | — | | | — | | | — | | | — | | | — | | | — | | | — | | | — | | | — | |
| Distributions to redeemable non-controlling interests | (1,534) | | | — | | | — | | | — | | | — | | | — | | | — | | | — | | | — | | | — | | | — | | | — | |
| Accretion of tax equity financing fees | 121 | | | — | | | — | | | — | | | — | | | — | | | (121) | | | — | | | — | | | — | | | — | | | (121) | |
| Net income | 2,870 | | | — | | | — | | | — | | | — | | | — | | | 54,052 | | | — | | | — | | | — | | | — | | | 54,052 | |
| Balance, December 31, 2020 | 38,850 | | | 30,224,654 | | | 3 | | | 18,000,000 | | | 2 | | | 145,496 | | | 368,390 | | | 2,101,795 | | | (11,788) | | | (9,290) | | | — | | | 492,813 | |
| Equity offering of common stock, net of offering costs of $6,416 | — | | | 2,875,000 | | | — | | | — | | | — | | | 120,084 | | | — | | | — | | | — | | | — | | | — | | | 120,084 | |
| Exercise of stock options, net | — | | | 587,775 | | | — | | | — | | | — | | | 5,563 | | | — | | | — | | | — | | | — | | | — | | | 5,563 | |
| Stock-based compensation expense | — | | | — | | | — | | | — | | | — | | | 8,716 | | | — | | | — | | | — | | | — | | | — | | | 8,716 | |
| Employee stock purchase plan | — | | | 28,880 | | | — | | | — | | | — | | | 1,364 | | | — | | | — | | | — | | | — | | | — | | | 1,364 | |
| Unrealized gain from interest rate hedges, net | — | | | — | | | — | | | — | | | — | | | — | | | — | | | — | | | — | | | 2,793 | | | — | | | 2,793 | |
| Foreign currency translation adjustment | — | | | — | | | — | | | — | | | — | | | — | | | — | | | — | | | — | | | (170) | | | — | | | (170) | |
| Contributions from redeemable non-controlling interests, net of tax equity financing fees of $65 | 2,251 | | | — | | | — | | | — | | | — | | | — | | | — | | | — | | | — | | | — | | | — | | | — | |
| Distributions to redeemable non-controlling interests | (1,009) | | | — | | | — | | | — | | | — | | | — | | | — | | | — | | | — | | | — | | | — | | | — | |
| Accretion of tax equity financing fees | 116 | | | — | | | — | | | — | | | — | | | — | | | (116) | | | — | | | — | | | — | | | — | | | (116) | |
| Investment fund call option exercise | (3,759) | | | — | | | — | | | — | | | — | | | 2,759 | | | — | | | — | | | — | | | — | | | — | | | 2,759 | |
| Net income | 9,733 | | | — | | | — | | | — | | | — | | | — | | | 70,458 | | | — | | | — | | | — | | | — | | | 70,458 | |
| Balance, December 31, 2021 | 46,182 | | | 33,716,309 | | | 3 | | | 18,000,000 | | | 2 | | | 283,982 | | | 438,732 | | | 2,101,795 | | | (11,788) | | | (6,667) | | | — | | | 704,264 | |
| | | | | | | | | | | | | | | | | | | | | | | |
| Exercise of stock options, net | — | | | 195,888 | | | — | | | — | | | — | | | 3,954 | | | — | | | — | | | — | | | — | | | — | | | 3,954 | |
| Stock-based compensation expense | — | | | — | | | — | | | — | | | — | | | 15,046 | | | — | | | — | | | — | | | — | | | — | | | 15,046 | |
| Employee stock purchase plan | — | | | 36,165 | | | — | | | — | | | — | | | 2,009 | | | — | | | — | | | — | | | — | | | — | | | 2,009 | |
| Unrealized gain from interest rate hedges, net | — | | | — | | | — | | | — | | | — | | | — | | | — | | | — | | | — | | | 6,017 | | | — | | | 6,017 | |
| Foreign currency translation adjustment | — | | | — | | | — | | | — | | | — | | | — | | | — | | | — | | | — | | | (3,401) | | | — | | | (3,401) | |
| | | | | | | | | | | | | | | | | | | | | | | |
| Distributions to redeemable non-controlling interests | (1,039) | | | — | | | — | | | — | | | — | | | — | | | — | | | — | | | — | | | — | | | — | | | — | |
| Accretion of tax equity financing fees | 109 | | | — | | | — | | | — | | | — | | | — | | | (109) | | | — | | | — | | | — | | | — | | | (109) | |
| Investment fund call option exercise | (2,162) | | | — | | | — | | | — | | | — | | | 1,323 | | | — | | | — | | | — | | | — | | | — | | | 1,323 | |
| Contributions from non-controlling interest | — | | | — | | | — | | | — | | | — | | | — | | | — | | | — | | | — | | | — | | | 48,912 | | | 48,912 | |
| Net income | 3,533 | | | — | | | — | | | — | | | — | | | — | | | 94,926 | | | — | | | — | | | — | | | 90 | | | 95,016 | |
| Balance, December 31, 2022 | $ | 46,623 | | | 33,948,362 | | | $ | 3 | | | 18,000,000 | | | $ | 2 | | | $ | 306,314 | | | $ | 533,549 | | | 2,101,795 | | | $ | (11,788) | | | $ | (4,051) | | | $ | 49,002 | | | $ | 873,031 | |
|
| | | | | | | | | | | | | | | | | | | | | | | | | | | | | | | | | | | | | | | | |
| | Redeemable | | | | | | | | | | | | | | | | | | Accumulated | | |
| | Non- | | | | | | | | | | Additional | | | | | | | | Other | | Total |
| | Controlling | | Class A Common Stock | | Class B Common Stock | | Paid-in | | Retained | | Treasury Stock | | Comprehensive | | Stockholders’ |
| | Interests | | Shares | | Amount | | Shares | | Amount | | Capital | | Earnings | | Shares | | Amount | | Loss | | Equity |
| Balance, December 31, 2016 | $ | 6,847 |
| | 27,706,866 |
| | $ | 3 |
| | 18,000,000 |
| | $ | 2 |
| | $ | 112,926 |
| | $ | 194,353 |
| | 1,298,418 |
| | $ | (6,387 | ) | | $ | (6,591 | ) | | $ | 294,306 |
|
| Cumulative impact from the adoption of ASU No. 2016-09 (Note 2) | — |
| | — |
| | — |
| | — |
| | — |
| | — |
| | 4,000 |
| | — |
| | — |
| | — |
| | 4,000 |
|
| Exercise of stock options, net | — |
| | 401,031 |
| | — |
| | — |
| | — |
| | 1,977 |
| | — |
| | — |
| | — |
| | — |
| | 1,977 |
|
| Stock-based compensation expense | — |
| | — |
| | — |
| | — |
| | — |
| | 1,293 |
| | — |
| | — |
| | — |
| | — |
| | 1,293 |
|
| Open market purchase of common shares | — |
| | (574,848 | ) | | — |
| | — |
| | — |
| | — |
| | — |
| | 574,848 |
| | (3,412 | ) | | — |
| | (3,412 | ) |
| Unrealized gain from interest rate hedge, net | — |
| | — |
| | — |
| | — |
| | — |
| | — |
| | — |
| | — |
| | — |
| | 310 |
| | 310 |
|
| Foreign currency translation adjustment | — |
| | — |
| | — |
| | — |
| | — |
| | — |
| | — |
| | — |
| | — |
| | 655 |
| | 655 |
|
| Contributions from redeemable non-controlling interests | 7,762 |
| | — |
| | — |
| | — |
| | — |
| | — |
| | — |
| | — |
| | — |
| | — |
| | — |
|
| Distributions to redeemable non-controlling interests | (288 | ) | | — |
| | — |
| | — |
| | — |
| | — |
| | — |
| | — |
| | — |
| | — |
| | — |
|
| Net (loss) income | (3,983 | ) | | — |
| | — |
| | — |
| | — |
| | — |
| | 37,491 |
| | — |
| | — |
| | — |
| | 37,491 |
|
| Balance, December 31, 2017 | 10,338 |
| | 27,533,049 |
| | 3 |
| | 18,000,000 |
| | 2 |
| | 116,196 |
| | 235,844 |
| | 1,873,266 |
| | (9,799 | ) | | (5,626 | ) | | 336,620 |
|
| Cumulative impact from the adoption of ASU No. 2014-09 (Note 2) | — |
| | — |
| | — |
| | — |
| | — |
| | — |
| | (4,454 | ) | | — |
| | — |
| | — |
| | (4,454 | ) |
| Cumulative impact from the adoption of ASU No. 2017-12 (Note 2) | — |
| | — |
| | — |
| | — |
| | — |
| | — |
| | 432 |
| | — |
| | — |
| | (486 | ) | | (54 | ) |
| Exercise of stock options, net | — |
| | 908,851 |
| | — |
| | — |
| | — |
| | 6,696 |
| | — |
| | — |
| | — |
| | — |
| | 6,696 |
|
| Stock-based compensation expense | — |
| | — |
| | — |
| | — |
| | — |
| | 1,258 |
| | — |
| | — |
| | — |
| | — |
| | 1,258 |
|
| Employee stock purchase plan | — |
| | 51,380 |
| | — |
| | — |
| | — |
| | 501 |
| | — |
| | — |
| | — |
| | — |
| | 501 |
|
| Open market purchase of common shares | — |
| | (217,774 | ) | | — |
| | — |
| | — |
| | — |
| | — |
| | 217,774 |
| | (1,839 | ) | | — |
| | (1,839 | ) |
| Unrealized gain from interest rate hedge, net | — |
| | — |
| | — |
| | — |
| | — |
| | — |
| | — |
| | — |
| | — |
| | 413 |
| | 413 |
|
| Foreign currency translation adjustment | — |
| | — |
| | — |
| | — |
| | — |
| | — |
| | — |
| | — |
| | — |
| | (250 | ) | | (250 | ) |
| Contributions from redeemable non-controlling interests | 5,198 |
| | — |
| | — |
| | — |
| | — |
| | — |
| | — |
| | — |
| | — |
| | — |
| | — |
|
| Distributions to redeemable non-controlling interests | (410 | ) | | — |
| | — |
| | — |
| | — |
| | — |
| | — |
| | — |
| | — |
| | — |
| | — |
|
| Net (loss) income | (407 | ) | | — |
| | — |
| | — |
| | — |
| | — |
| | 37,984 |
| | — |
| | — |
| | — |
| | 37,984 |
|
| Balance, December 31, 2018 | 14,719 |
| | 28,275,506 |
| | 3 |
| | 18,000,000 |
| | 2 |
| | 124,651 |
| | 269,806 |
| | 2,091,040 |
| | (11,638 | ) | | (5,949 | ) | | 376,875 |
|
| Cumulative impact from the adoptions of ASU -No. 2018-02 (Note 2) | — |
| | — |
| | — |
| | — |
| | — |
| | — |
| | 217 |
| | — |
| | — |
| | (217 | ) | | — |
|
| Exercise of stock options, net | — |
| | 915,834 |
| | — |
| | — |
| | — |
| | 6,742 |
| | — |
| | — |
| | — |
| | — |
| | 6,742 |
|
| Stock-based compensation expense | — |
| | — |
| | — |
| | — |
| | — |
| | 1,620 |
| | — |
| | — |
| | — |
| | — |
| | 1,620 |
|
| Employee stock purchase plan | — |
| | 48,965 |
| | — |
| | — |
| | — |
| | 675 |
| | — |
| | — |
| | — |
| | — |
| | 675 |
|
| Open market purchase of common shares | — |
| | (10,300 | ) | | — |
| | — |
| | — |
| | — |
| | — |
| | 10,300 |
| | (144 | ) | | — |
| | (144 | ) |
| Unrealized loss from interest rate hedge, net | — |
| | — |
| | — |
| | — |
| | — |
| | — |
| | — |
| | — |
| | — |
| | (2,727 | ) | | (2,727 | ) |
| Foreign currency translation adjustment | — |
| | — |
| | — |
| | — |
| | — |
| | — |
| | — |
| | — |
| | — |
| | 1,379 |
| | 1,379 |
|
| Contributions from redeemable non-controlling interests | 21,835 |
| | — |
| | — |
| | — |
| | — |
| | — |
| | — |
| | — |
| | — |
| | — |
| | — |
|
| Distributions to redeemable non-controlling interests | (803 | ) | | — |
| | — |
| | — |
| | — |
| | — |
| | — |
| | — |
| | — |
| | — |
| | — |
|
| Net (loss) income | (4,135 | ) | | — |
| | — |
| | — |
| | — |
| | — |
| | 44,436 |
| | — |
| | — |
| | — |
| | 44,436 |
|
| Balance, December 31, 2019 | 31,616 |
| | 29,230,005 |
| | $ | 3 |
| | 18,000,000 |
| | $ | 2 |
| | $ | 133,688 |
| | $ | 314,459 |
| | 2,101,340 |
| | $ | (11,782 | ) | | $ | (7,514 | ) | | $ | 428,856 |
|
TheSee accompanying notes are an integral part of theseto consolidated financial statements.
AMERESCO, INC.
CONSOLIDATED STATEMENTS OF CASH FLOWS
| | | | Year Ended December 31, | | Year Ended December 31, |
| | 2019 | | 2018 | | 2017 | | 2022 | | 2021 | | 2020 |
| Cash flows from operating activities: | | | |
| | |
| Cash flows from operating activities: | | | | | |
| Net income | 40,301 |
| | 37,577 |
| | $ | 33,508 |
| Net income | $ | 98,549 | | | $ | 80,191 | | | $ | 56,922 | |
| Adjustments to reconcile net income to net cash flows from operating activities: | | | | | | Adjustments to reconcile net income to net cash flows from operating activities: | |
| Depreciation of energy assets | 35,543 |
| | 27,305 |
| | 21,648 |
| |
| Depreciation of energy assets, net | | Depreciation of energy assets, net | 49,755 | | | 43,113 | | | 38,039 | |
| Depreciation of property and equipment | 2,987 |
| | 2,167 |
| | 2,394 |
| Depreciation of property and equipment | 2,665 | | | 3,143 | | | 3,317 | |
| Amortization of deferred financing fees | 2,229 |
| | 2,193 |
| | 1,620 |
| |
| Amortization of debt discount and debt issuance costs | | Amortization of debt discount and debt issuance costs | 4,211 | | | 2,849 | | | 2,686 | |
| Amortization of intangible assets | 909 |
| | 1,057 |
| | 1,451 |
| Amortization of intangible assets | 1,858 | | | 321 | | | 685 | |
| Accretion of ARO and contingent consideration | 137 |
| | — |
| | — |
| |
| Provision for (recovery of) bad debts | (216 | ) | | 610 |
| | 77 |
| |
| Loss (gain) on disposal / sale of assets | (2,160 | ) | | 298 |
| | (103 | ) | |
| Net gain from derivatives | (1,068 | ) | | (121 | ) | | (271 | ) | |
| Net increase in fair value of contingent consideration | | Net increase in fair value of contingent consideration | 1,614 | | | — | | | — | |
| Accretion of ARO | | Accretion of ARO | 146 | | | 123 | | | 93 | |
| | (Recoveries of) provision for bad debts | | (Recoveries of) provision for bad debts | (382) | | | 187 | | | 282 | |
| Impairment of long-lived assets / loss on disposal | | Impairment of long-lived assets / loss on disposal | 937 | | | 1,901 | | | 2,696 | |
| Gain on sale of equity investments | | Gain on sale of equity investments | — | | | (575) | | | — | |
| (Earnings) loss of unconsolidated entities | | (Earnings) loss of unconsolidated entities | (1,647) | | | 118 | | | 225 | |
| Net (gain) loss from derivatives | | Net (gain) loss from derivatives | (212) | | | 240 | | | (705) | |
| Stock-based compensation expense | 1,620 |
| | 1,258 |
| | 1,293 |
| Stock-based compensation expense | 15,046 | | | 8,716 | | | 1,933 | |
| Deferred income taxes | (3,346 | ) | | 5,517 |
| | (4,527 | ) | |
| Unrealized foreign exchange loss (gain) | (130 | ) | | 1,816 |
| | (1,406 | ) | |
| Deferred income taxes, net | | Deferred income taxes, net | 3,918 | | | (4,760) | | | 3,401 | |
| Unrealized foreign exchange (gain) loss | | Unrealized foreign exchange (gain) loss | (123) | | | 142 | | | (306) | |
| Changes in operating assets and liabilities: | | | | | | Changes in operating assets and liabilities: | |
| Accounts receivable | (8,499 | ) | | 9,772 |
| | 1,870 |
| Accounts receivable | 3,477 | | | (15,953) | | | (24,178) | |
| Accounts receivable retainage | (3,370 | ) | | 3,774 |
| | 1,279 |
| Accounts receivable retainage | 4,716 | | | (12,882) | | | (13,113) | |
| Federal ESPC receivable | (188,060 | ) | | (155,539 | ) | | (157,538 | ) | Federal ESPC receivable | (259,499) | | | (249,728) | | | (227,078) | |
| Inventory, net | (1,471 | ) | | 373 |
| | 3,966 |
| Inventory, net | (5,411) | | | (232) | | | 660 | |
| Costs and estimated earnings in excess of billings | (106,696 | ) | | 8,015 |
| | (46,730 | ) | Costs and estimated earnings in excess of billings | (272,629) | | | (113,192) | | | 19,474 | |
| Prepaid expenses and other current assets | (18,397 | ) | | 6,763 |
| | (2,471 | ) | Prepaid expenses and other current assets | (3,182) | | | 1,770 | | | 517 | |
| Project development costs | 8,120 |
| | (8,659 | ) | | (3,007 | ) | Project development costs | (685) | | | 1,949 | | | (3,085) | |
| Other assets | 1,056 |
| | (3,499 | ) | | 111 |
| Other assets | (11,327) | | | (1,870) | | | 311 | |
| Accounts payable, accrued expenses and other current liabilities | 43,531 |
| | 2,938 |
| | 19,652 |
| |
| Accounts payable, accrued expenses, and other current liabilities | | Accounts payable, accrued expenses, and other current liabilities | 36,155 | | | 83,473 | | | 29,047 | |
| Billings in excess of cost and estimated earnings | 2,662 |
| | 2,866 |
| | (2,168 | ) | Billings in excess of cost and estimated earnings | 449 | | | (693) | | | 8,042 | |
| Other liabilities | (1,625 | ) | | (783 | ) | | (540 | ) | Other liabilities | (5,074) | | | (5,036) | | | 1,844 | |
| Income taxes payable | (350 | ) | | 1,101 |
| | (5,678 | ) | |
| Income taxes payable, net | | Income taxes payable, net | (1,613) | | | 4,389 | | | (4,292) | |
| Cash flows from operating activities | (196,293 | ) | | (53,201 | ) | | (135,570 | ) | Cash flows from operating activities | (338,288) | | | (172,296) | | | (102,583) | |
| Cash flows from investing activities: | | | | | |
| Cash flows from investing activities: | | |
| Purchases of property and equipment | (6,674 | ) | | (3,943 | ) | | (2,851 | ) | Purchases of property and equipment | (5,296) | | | (4,896) | | | (2,211) | |
| Purchases of energy assets, net of grant proceeds | (133,954 | ) | | (125,673 | ) | | (85,559 | ) | |
| Proceeds from sale of assets of a business | — |
| | — |
| | 2,777 |
| |
| Capital investment in energy assets | | Capital investment in energy assets | (304,596) | | | (170,277) | | | (175,650) | |
| Capital investment in major maintenance of energy assets | | Capital investment in major maintenance of energy assets | (18,007) | | | (8,602) | | | (4,896) | |
| Grant award proceeds for energy assets | | Grant award proceeds for energy assets | — | | | 774 | | | 1,874 | |
| | Proceeds from sale of equity investment | | Proceeds from sale of equity investment | — | | | 1,672 | | | — | |
| Acquisitions, net of cash received | (1,294 | ) | | (3,590 | ) | | (2,409 | ) | Acquisitions, net of cash received | — | | | (14,928) | | | — | |
| Contributions to equity investment | (301 | ) | | — |
| | — |
| Contributions to equity investment | — | | | (9,000) | | | (132) | |
| Loans to joint venture investments | | Loans to joint venture investments | (459) | | | — | | | — | |
| Cash flows from investing activities | $ | (142,223 | ) | | $ | (133,206 | ) | | $ | (88,042 | ) | Cash flows from investing activities | (328,358) | | | (205,257) | | | (181,015) | |
The accompanying notes are an integral part of these consolidated financial statements.
See accompanying notes to consolidated financial statements.
AMERESCO, INC.
CONSOLIDATED STATEMENTS OF CASH FLOWS —
(In thousands) (Continued)
(in thousands)
| | | | Year Ended December 31, | | Year Ended December 31, |
| | 2019 | | 2018 | | 2017 | | 2022 | | 2021 | | 2020 |
| | | | | | | | | | | | |
| Cash flows from financing activities: | | | |
| | |
| Cash flows from financing activities: | | | | |
| Payments of financing fees | (1,666 | ) | | (4,073 | ) | | (2,877 | ) | |
| Proceeds from equity offering, net of offering costs | | Proceeds from equity offering, net of offering costs | $ | — | | | $ | 120,084 | | | $ | — | |
| Payments of debt discount and debt issuance costs | | Payments of debt discount and debt issuance costs | (3,695) | | | (2,919) | | | (5,234) | |
| Proceeds from exercises of options and ESPP | 7,417 |
| | 7,197 |
| | 1,977 |
| Proceeds from exercises of options and ESPP | 5,963 | | | 6,927 | | | 9,875 | |
| Repurchase of common stock | (144 | ) | | (1,839 | ) | | (3,412 | ) | Repurchase of common stock | — | | | — | | | (6) | |
| Proceeds (payments) from senior secured credit facility, net | 73,347 |
| | (900 | ) | | 12,547 |
| |
| Proceeds from (payments on) senior secured revolving credit facility, net | | Proceeds from (payments on) senior secured revolving credit facility, net | 137,900 | | | (8,073) | | | 3,000 | |
| Proceeds from long-term debt financings | 43,883 |
| | 88,115 |
| | 48,483 |
| Proceeds from long-term debt financings | 468,476 | | | 185,994 | | | 116,067 | |
| Proceeds from Federal ESPC projects | 199,358 |
| | 158,237 |
| | 165,013 |
| Proceeds from Federal ESPC projects | 238,360 | | | 159,216 | | | 248,917 | |
| Proceeds for energy assets from Federal ESPC | 2,277 |
| | 4,236 |
| | 3,993 |
| |
| Proceeds from sale-leaseback financings | — |
| | 5,145 |
| | 51,204 |
| |
| Contributions from redeemable non-controlling interests, net | 21,372 |
| | 4,788 |
| | 7,473 |
| |
| Payments on long-term debt | (28,425 | ) | | (36,395 | ) | | (54,164 | ) | |
| Net proceeds for customer energy asset projects | | Net proceeds for customer energy asset projects | 14,341 | | | 2,033 | | | 1,378 | |
| Investment fund call option exercise | | Investment fund call option exercise | (839) | | | (1,000) | | | — | |
| Contributions from non-controlling interest | | Contributions from non-controlling interest | 32,706 | | | — | | | — | |
| (Distributions to) proceeds from redeemable non-controlling interests, net | | (Distributions to) proceeds from redeemable non-controlling interests, net | (1,128) | | | 1,399 | | | 4,805 | |
| Payments on long-term debt and financing leases | | Payments on long-term debt and financing leases | (161,857) | | | (98,200) | | | (73,633) | |
| Cash flows from financing activities | 317,419 |
| | 224,511 |
| | 230,237 |
| Cash flows from financing activities | 730,227 | | | 365,461 | | | 305,169 | |
| Effect of exchange rate changes on cash | 447 |
| | (295 | ) | | 654 |
| Effect of exchange rate changes on cash | (747) | | | 309 | | | 2 | |
| Net (decrease) increase in cash and cash equivalents, and restricted cash | (20,650 | ) | | 37,809 |
| | 7,279 |
| |
| Net increase (decrease) in cash, cash equivalents, and restricted cash | | Net increase (decrease) in cash, cash equivalents, and restricted cash | 62,834 | | | (11,783) | | | 21,573 | |
| Cash, cash equivalents, and restricted cash, beginning of year | 97,914 |
| | 60,105 |
| | 52,826 |
| Cash, cash equivalents, and restricted cash, beginning of year | 87,054 | | | 98,837 | | | 77,264 | |
| Cash, cash equivalents, and restricted cash, end of year | $ | 77,264 |
| | $ | 97,914 |
| | $ | 60,105 |
| Cash, cash equivalents, and restricted cash, end of year | $ | 149,888 | | | $ | 87,054 | | | $ | 98,837 | |
| Supplemental disclosures of cash flow information: | | | | | | Supplemental disclosures of cash flow information: | | | | | |
| Cash paid for interest | $ | 17,467 |
| | $ | 15,563 |
| | $ | 11,675 |
| Cash paid for interest | $ | 32,954 | | | $ | 18,782 | | | $ | 20,143 | |
| Cash paid for income taxes | $ | 3,897 |
| | $ | 2,257 |
| | $ | 5,782 |
| Cash paid for income taxes | $ | 7,278 | | | $ | 2,670 | | | $ | 1,465 | |
| Non-cash Federal ESPC settlement | $ | 242,519 |
| | $ | 101,557 |
| | $ | 66,921 |
| Non-cash Federal ESPC settlement | $ | 293,427 | | | $ | 67,286 | | | $ | 54,139 | |
| Accrued purchases of energy assets | $ | 34,871 |
| | $ | 15,005 |
| | $ | 7,335 |
| Accrued purchases of energy assets | $ | 88,793 | | | $ | 37,064 | | | $ | 43,807 | |
| Conversion of revolver to term loan | $ | 25,000 |
| | $ | 25,000 |
| | $ | — |
| |
| Non-cash contributions from non-controlling interest | | Non-cash contributions from non-controlling interest | $ | 16,206 | | | $ | — | | | $ | — | |
| Non-cash portion of investment fund call option exercise | | Non-cash portion of investment fund call option exercise | $ | 1,323 | | | $ | 2,759 | | | $ | — | |
|
The following table provides a reconciliation of cash, cash equivalents and restricted cash reported within the consolidated balance sheets to the total of the same such amounts shown above:
| | | | | | | | | | | | | | | | | | | | |
| | Year Ended December 31, |
| | 2022 | | 2021 | | 2020 |
| Cash and cash equivalents | | $ | 115,534 | | | $ | 50,450 | | | $ | 66,422 | |
| Short-term restricted cash | | 20,782 | | | 24,267 | | | 22,063 | |
| Long-term restricted cash | | 13,572 | | | 12,337 | | | 10,352 | |
| Total cash, cash equivalents, and restricted cash | | $ | 149,888 | | | $ | 87,054 | | | $ | 98,837 | |
|
| | | | | | | | | | | | |
| | | Year Ended December 31, |
| | | 2019 | | 2018 | | 2017 |
| Cash and cash equivalents | | $ | 33,223 |
| | $ | 61,397 |
| | $ | 24,262 |
|
| Short-term restricted cash | | 20,006 |
| | 16,880 |
| | 15,751 |
|
| Long-term restricted cash included in other assets | | 24,035 |
| | 19,637 |
| | 20,092 |
|
| Total cash and cash equivalents, and restricted cash | | $ | 77,264 |
| | $ | 97,914 |
| | $ | 60,105 |
|
TheSee accompanying notes are an integral part of theseto consolidated financial statements.
AMERESCO, INC.
NOTES TO CONSOLIDATED FINANCIAL STATEMENTS
(inIn thousands, except per share amounts)
1. DESCRIPTION OF BUSINESS
Ameresco, Inc. (including its subsidiaries, the “Company”“Company,” “Ameresco”, “we,” “our,” or “us”) was organized as a Delaware corporation on April 25, 2000. The Company isWe are a provider ofleading cleantech integrator and renewable energy asset developer, owner and operator. Our comprehensive portfolio includes energy efficiency, infrastructure upgrades, asset sustainability and renewable energy solutions for facilitiesdelivered to clients throughout North America, the United Kingdom, and Europe. The Company providesWe provide solutions, both services and products, that enable our customers to reduce their energy consumption, lower their operating and maintenance costs and realize environmental benefits. The Company’sOur comprehensive set of solutions includes upgrades to a facility’s energy infrastructure and the development, construction, and operation of small-scale renewabledistributed energy plants. Itresources. We also sellssell certain solar photovoltaic (“solar PV”) equipment worldwide. The Company operatesworldwide and operate in the United States, Canada United Kingdom and Europe. We have successfully completed energy saving, environmentally responsible projects with Federal, state and local governments, healthcare and educational institutions, housing authorities, and commercial and industrial customers.
The Company isWe are compensated through a variety of methods, including: 1) direct payments based on fee-for-services contracts (utilizing lump-sum or cost-plus pricing methodologies);, 2) the sale of energy from the Company’sour energy assets;assets, and 3) direct payment for solar PV equipment and systems.
2. SUMMARY OF SIGNIFICANT ACCOUNTING POLICIES
Principles of Consolidation
The accompanying consolidated financial statements include the accounts of the Company, itsAmeresco, our subsidiaries, and certain contracts in which the Company haswe have a controlling financial interest and fivethree investment funds formed to fund the purchase and operation of solar energy systems, which are consolidated with the CompanyAmeresco as variable interest entities (“VIE”VIEs”). The Company usesWe use a qualitative approach in assessing the consolidation requirement for VIEs. This approach focuses on determining whether the Company haswe have the power to direct the activities of the VIE that most significantly affect the VIE’s economic performance and whether the Company haswe have the obligation to absorb losses or the right to receive benefits that could potentially be significant to the VIE. For all periods presented, the Company haswe have determined that it iswe are the primary beneficiary in all of itsour operational VIEs. The Company evaluates itsWe evaluate our relationships with the VIEs on an ongoing basis to ensure that it continueswe continue to be the primary beneficiary. All significant intercompany accounts and transactions have been eliminated. Gains and losses from the translation of all foreign currency financial statements are recorded in accumulated other comprehensive loss,income, net, within stockholders’ equity. The Company prepares itsWe prepare our consolidated financial statements in conformity with the accounting principles generally accepted in the United States of America (“GAAP”).
Reclassification
Certain prior period amounts were reclassified to conform to the presentation in the current period.
Use of Estimates
GAAP requires management to make estimates and assumptions that affect the reported amounts of assets and liabilities, the disclosure of contingent assets and liabilities at the date of the consolidated financial statements and the reported amounts of revenue and expenses during the reporting period. Changes in circumstances could cause actual results to differ materially from those estimates. The most significant estimates and assumptions used in these consolidated financial statements relate to management’s estimates of final construction contract profit in accordance with accounting for long-term contracts, allowance for doubtful accounts, inventory reserves,credit losses, realization of project development costs, leases, fair value of derivative financial instruments, accounting for business acquisitions, stock-based awards, impairment of goodwill and long-lived assets, asset retirement obligations (“AROs”), income taxes, self insurance reserves and potential liability in conjunction with certain commitments and contingencies. Actual results could differ from those estimates.contingent consideration.
The Company isSelf-insured Health Insurance
We are self-insured for employee health insurance. Theinsurance and the maximum exposure in fiscal year 20192022 under the plan was $150$175 per covered participant, after which reinsurance takes effect. The liability for unpaid claims and associated expenses, including incurred but not reported claims, is determined by management and reflected in the Company’sour consolidated balance sheets in accrued expenses and other current liabilities. The liability is calculated based on historical data, which considers both the frequency and settlement amount of claims. The Company’sOur estimated accrual for this liability could be different than itsour ultimate obligation if variables such as the frequency or amount of future claims differ significantly from management’s assumptions. 5
AMERESCO, INC.
NOTES TO CONSOLIDATED FINANCIAL STATEMENTS
(In thousands, except per share amounts)
Significant Risks and Uncertainties
The COVID-19 pandemic and other global factors have continued to result in global supply chain disruptions, certain governmental travel and other restrictions, and inflationary pressures.
We have considered the impact of COVID-19 and general global economic conditions on the assumptions and estimates used, which may change in response to this evolving situation. Results of future operations and liquidity could be adversely impacted by a number of factors including supply chain disruptions, varying levels of inflation, payments of outstanding receivable amounts beyond normal payment terms, workforce disruptions, and uncertain demand. As of the date of issuance of these consolidated financial statements, we cannot reasonably estimate the extent to which the COVID-19 pandemic and macroeconomic conditions may impact our financial condition, liquidity, or results of operations in the foreseeable future. The ultimate impact of the pandemic and general global economic conditions on our business is highly uncertain and will depend on future developments, and such impacts could exist for an extended period of time, even after the pandemic subsides.
Cash and Cash Equivalents
Cash and cash equivalents includesinclude cash on deposit, overnight repurchase agreements and amounts invested in highly liquid money market funds. Cash equivalents consist of short termshort-term investments with original maturities of three months or less. The Company maintains itsWe maintain our accounts with financial institutions and the balances in such accounts, at times, exceed federally insured limits. This credit risk is divided among a number of financial institutions that management believes to be of high quality. The carrying amount of cash and cash equivalents approximates its fair value measured using level 1 inputs per the fair value hierarchy as defined in Note 18.
AMERESCO, INC.
NOTES TO CONSOLIDATED FINANCIAL STATEMENTS - (Continued)
(in thousands, except per share amounts)
Restricted Cash
Restricted cash consists of cash and cash equivalents held in an escrow accountaccounts in association with construction draws for energy savings performance contracts (“ESPC”), construction of energy assets, operations and maintenance (“O&M”) reserve accounts, cash collateralized letters of credit, as well as cash required under term loans to be maintained in debt service reserve accounts until all obligations have been indefeasibly paid in full. These accounts are primarily invested in highly liquid money market funds.full for energy assets. The carrying amount of the cash and cash equivalents in these accounts approximates its fair value measured using level 1 inputs per the fair value hierarchy as defined in Note 18. Restricted cash also includes funds held for clients, which represent assets that, based upon the Company’sour intent, are restricted for use solely for the purposes of satisfying the obligations to remit funds to third parties, primarily utility service providers, relating to the Company’sour enterprise energy management services. As of December 31, 2019 and 2018, the Company classified the non-current portion of restricted cash of $24,035 and $19,637, respectively, in other assets on its consolidated balance sheets.
Accounts Receivable
Accounts receivable are stated at the amount management expects to collect from outstanding balances. AnOur methodology to estimate the allowance for doubtful accounts is provided for those accounts receivable considered to be uncollectible based uponcredit losses includes quarterly assessments of historical bad debt write-off experience, current economic and market conditions, management’s evaluation of outstanding accounts receivable.receivable, anticipated recoveries and our forecasts. Due to the short-term nature of our receivables, the estimate of credit losses is primarily based on aged accounts receivable balances and the financial condition of our customers. In addition, specific allowance amounts are established to record the appropriate provision for customers that have a higher probability of default. Bad debts are written off against the allowance when identified. As part of our assessment, we also considered the current and expected future economic and market conditions due to the COVID-19 pandemic and determined that the estimate of credit losses was not significantly impacted as of December 31, 2022 and 2021.
Changes in the allowance for doubtful accounts arecredit losses was as follows:
| | | | | | | | | | | | | | | | | |
| Year Ended December 31, |
| 2022 | | 2021 | | 2020 |
| Allowance for credit loss, beginning of period | $ | 2,263 | | | $ | 2,266 | | | $ | 2,260 | |
| (Recoveries of) charges to costs and expenses, net | (382) | | | 187 | | | 282 | |
| Account write-offs and other | (970) | | | (190) | | | (276) | |
| Allowance for credit loss, end of period | $ | 911 | | | $ | 2,263 | | | $ | 2,266 | |
AMERESCO, INC.
NOTES TO CONSOLIDATED FINANCIAL STATEMENTS
(In thousands, except per share amounts)
|
| | | | | | | | | | | |
| | Year Ended December 31, |
| | 2019 | | 2018 | | 2017 |
| Allowance for doubtful accounts, beginning of period | $ | 2,765 |
| | $ | 3,315 |
| | $ | 7,836 |
|
| Charges (recovery) to costs and expenses, net | (216 | ) | | 610 |
| | 81 |
|
| Account write-offs and other | (289 | ) | | (1,160 | ) | | (4,602 | ) |
| Allowance for doubtful accounts, end of period | $ | 2,260 |
| | $ | 2,765 |
| | $ | 3,315 |
|
Accounts Receivable Retainage
Accounts receivable retainage represents amounts due from customers, but where payments are withheld contractually until certain construction milestones are met. Amounts retained typically range from 5% to 10% of the total invoice. The Company classifies as a current asset thoseWe classify retainages that are expected to be billed in the next twelve months.months as current assets. As of December 31, 20192022 and 2018,2021, no amounts were determined to be uncollectible.
Inventory
Inventories, which consist primarily of PV solar panels, batteries and related accessories, are stated at the lower of cost (“first-in, first-out” method) or net realizable value (determined as the estimated selling prices in the ordinary course of business, less reasonably predictable costs of completion, disposal, and transportation). Provisions have been made to reduce the carrying value of inventory to the net realizable value.
Prepaid Expenses
Prepaid expenses consist primarily of short-term prepaid expenditures that will amortize within one year.
Federal ESPC Receivable
Federal ESPC receivable represents the amount to be paid by various federal government agencies for work performed and earned by the CompanyAmeresco under specific ESPCs. The Company assignsWe assign certain of itsour rights to receive those payments to third-parties that provide construction and permanent financing for such contracts. Upon completion and acceptance of the project by the government, typically within 24 to 36 months of construction commencement, the assigned ESPC receivable from the government and corresponding ESPC liability are eliminated from the Company’sour consolidated financial statements.
Project Development Costs
The Company capitalizes as project development costsWe capitalize only those costs incurred in connection with the development of energy projects, primarily direct labor, interest costs, outside contractor services, consulting fees, legal fees, and travel, if incurred after a point in time where the realization of related revenue becomes probable. Project development costs incurred
AMERESCO, INC.
NOTES TO CONSOLIDATED FINANCIAL STATEMENTS - (Continued)
(in thousands, except per share amounts)
prior to the probable realization of revenue are expensed as incurred. The Company classifies as a current asset thoseWe classify project development efforts that are expected to proceed to construction activity in the next twelve months that follow. The Companyas a current asset. We periodically reviewsreview these balances and writeswrite off any amounts where the realization of the related revenue is no longer probable. Project development costs of $1,080$0 and $639$2,217 were included in other long-term assets as of December 31, 20192022 and 2018,2021, respectively.
Property and Equipment
Property and equipment consistsconsist primarily of office and computer equipment, and is recorded at cost. Major additions and improvements are capitalized as additions to the property and equipment accounts, while replacements, maintenance, and repairs that do not improve or extend the life of the respective assets, are expensed as incurred. Depreciation and amortization of property and equipment are computed on a straight-line basis over the following estimated useful lives:
|
| | | | | | | |
| Asset Classification | | Estimated Useful Life |
| Furniture and office equipment | | Five years |
| Computer equipment and software costs | | Three to five years |
| Leasehold improvements | | Lesser of term of lease or five years |
| Automobiles | | Five years |
| Land | | Unlimited |
Gains or losses on disposal of property and equipment are reflected in selling, general, and administrative expenses in the consolidated statements of income.
Energy Assets
Energy assets consist of costs of materials, direct labor, interest costs, outside contract services, deposits, asset retirement obligations (“AROs”), and project development costs incurred in connection with the construction of small-scale renewable energy plants that the Company owns.we own. These amounts are capitalized and amortized to cost of revenues in the Company’sour consolidated statements of income on a straight linestraight-line basis over the lives of the related assets or the terms of the related contracts.
The Company capitalizes interest costs relating to construction financing during the period of construction. Capitalized interest is included in energy assets, net, in the Company’s consolidated balance sheets. Capitalized interest is amortized to cost of revenues in the Company’s consolidated statements of income on a straight line basis over the useful life of the associated energy asset. The amount of interest capitalized for the years ended December 31, 2019, 2018 and 2017 was $2,966, $3,817 and $4,256, respectively.
Routine maintenance costs are expensed as incurred in the current year’sour consolidated statements of income to the extent that they do not extend the life of the asset. Major maintenance includes upgrades and overhaulsthe refurbishment or replacing of components that are required for certain componentsintegral to
AMERESCO, INC.
NOTES TO CONSOLIDATED FINANCIAL STATEMENTS
(In thousands, except per share amounts)
the Company’s assets.energy assets operating. In these instances, the costs associated with these upgradesmajor maintenance are capitalized and are depreciated over the shorter of the remaining life of the asset or the period untilup to the next required major maintenance or overhaul.maintenance.
Included in energy assets are financingFinancing lease assets and accumulated depreciation of financing lease assets are included in energy assets. For additional information see the Sale-Leaseback section below and NoteNotes 7 and 8.
The Company evaluates itsCapitalized Interest
We capitalize interest costs relating to construction financing during the period of construction on energy assets we own. Capitalized interest is included in energy assets, net, in our consolidated balance sheets. Capitalized interest is amortized to cost of revenues in our consolidated statements of income on a straight-line basis over the useful life of the associated energy asset.
Long-lived Asset Impairment
We evaluate our long-lived assets, including operating lease right-of-use assets, for impairment as events or changes in circumstances indicate the carrying value of these assets may not be fully recoverable. Examples of such triggering events applicable to the Company’sour assets include a significant decrease in the market price of a long-lived asset or asset group or a current-period operating or cash flow loss combined with a history of operating or cash flow losses or a projection or forecast that demonstrates continuing losses associated with the use of a long-lived asset or asset group.
The Company evaluatesWe evaluate recoverability of long-lived assets to be held and used by estimating the undiscounted future cash flows before interest associated with the expected uses and eventual disposition of those assets. When these comparisons indicate that the carrying value of those assets is greater than the undiscounted cash flows, the Company recognizeswe recognize an impairment loss for the amount that the carrying value exceeds the fair value.value of the asset group. Impairment losses are reflected in selling, general, and administrative expenses in the consolidated statements of income.
Government Grants
From time to time, the Company haswe have applied for and received cash grant awards from the U.S. Treasury Department (the “Treasury”) under Section 1603 of the American Recovery and Reinvestment Act of 2009 (the “Act”). The Act authorized the Treasury to make payments to eligible persons who place in service qualifying renewable energy projects. The grants are paid in lieu of investment tax credits. All of the cash proceeds from the grants were used and recorded as a reduction in the cost
AMERESCO, INC.
NOTES TO CONSOLIDATED FINANCIAL STATEMENTS - (Continued)
(in thousands, except per share amounts)
basis of the applicable energy assets. IfFor tax purposes, the Company disposesSection 1603 payments are not included in federal and certain state taxable income and the basis of the property or the property ceases to qualify as specified energy property, within five years from the date the property is placed in service, then a prorated portionreduced by 50% of the Section 1603 payment must be repaid.received.
The CompanyWe last received a Section 1603 grant during the year ended December 31, 2014. No further Section 1603 grant payments are expected to be received as the program has expired and no repayments will be required.
During the year ended December 31, 2019, the CompanyWe received grant proceeds of $784 from the Canadian government in connection with the construction of one of the Company’sour energy assets in Canada.
For tax purposes,Canada of $774 during the Section 1603 payments areyear ended December 31, 2021. We did not includedreceive any grant proceeds during the year ended December 31, 2022. We have a contribution agreement in federal and certain state taxable income and the basis of the property is reduced byplace with Natural Resources Canada to fund 50% of the payment received. construction costs on a specific pilot project in Ontario. Cash proceeds are recorded as a deferred grant liability. Following commercial operation, the grant is subject to repayment to the government for a five-year period.
Deferred grant income of $6,086$7,590 and $6,637$8,498 in the accompanying consolidated balance sheets at as of December 31, 20192022 and 2018,2021, respectively, represents the benefit of the basis difference to be amortized to income taxdepreciation expense over the life of the related property.
Acquisitions
For acquisitions that meet the definition of a business combination, we apply the acquisition method of accounting in accordance with Accounting Standards Codification (“ASC”) 805, BusinessCombinations, where assets acquired and liabilities assumed are recorded at fair value at the date of each acquisition. Any excess of the consideration we transferred over the amounts recognized for assets acquired and liabilities assumed is recorded as goodwill. Intangible assets, if identified, are also recorded.
Determining the fair value of certain assets and liabilities assumed is judgmental in nature, often involves the use of significant estimates and assumptions, and is calculated using level 3 inputs per the fair value hierarchy as defined in Note 18. We continue to evaluate acquisitions for a period not to exceed one year after the acquisition date of each transaction to determine whether any
AMERESCO, INC.
NOTES TO CONSOLIDATED FINANCIAL STATEMENTS
(In thousands, except per share amounts)
additional adjustments are needed to the allocation of the purchase price. The results of the acquired companies are included in our consolidated statements of income, comprehensive income, and cash flows from the date of the respective acquisition.
The Company has historically received cash rebates from utility companies, which were accountedconsideration for as reductionsour acquisitions often includes future payments that are contingent upon the occurrence of a particular event. We record a contingent consideration obligation for such contingent consideration payments at fair value on the acquisition date. We estimate the fair value of contingent consideration obligations through valuation models that incorporate probability adjusted assumptions related to the achievement of the milestones and the likelihood of making related payments. Each reporting period we revalue the contingent consideration obligations associated with our acquisitions to fair value and record changes in the bookfair value within the selling, general, and administrative expenses in our consolidated statements of the related energy assets. The rebates were one-time payments based on the cost and efficiency of the installed units, and are earned upon installation and inspection by the utility. The payments are not related to,income. Increases or subject to adjustment based on, future operating performance. No rebates were received duringdecreases in the years ended December 31, 2019, 2018 and 2017.
Deferred Financing Fees
Deferred financing fees relate to the external costs incurred to obtain financing for the Company. Deferred financing fees are amortized over the respective term of the financing using the effective interest method, with the exception of the Company’s revolving credit facility and construction loans, as discussed in Note 9, for which deferred financing fees are amortized on a straight-line basis over the term of the agreement. Deferred financing fees are presented on the consolidated balance sheets as a reduction to long-term debt and capital lease liabilities.
Goodwill and Intangible Assets
The Company has classified as goodwill the amounts paid in excess of fair value of the netcontingent consideration obligations can result from changes in assumed discount periods and rates, changes in the assumed timing and amount of revenue and expense estimates and changes in assumed probability with respect to the attainment of certain financial and operational metrics, among others. Significant judgment is employed in determining these assumptions as of the acquisition date and for each subsequent period. Accordingly, future business and economic conditions, as well as changes in any of the assumptions described above, can materially impact the fair value of contingent consideration recorded at each reporting period. Deferred consideration related to certain holdbacks and completion payments are considered short-term in nature. These amounts are recorded at full value and are only revalued if one of those underlying assumptions changes. See Note 4 for additional information about our acquisitions.
In October 2021, the FASB issued ASU 2021-08, Business Combinations (Topic 805): Accounting for Contract Assets and Contract Liabilities from Contracts with Customers, which requires entities to apply Topic 606 to recognize and measure contract assets (including tax attributes)and contract liabilities in a business combination. ASU 2021-08 is effective for our fiscal year beginning after December 15, 2022, however, early adoption is permitted. We early adopted this new accounting standard as of companiesJanuary 1, 2021 and applied it to our December 2021 acquisition discussed in Note 4. We elected the practical expedient related to contract modifications made before the acquisition date and the adoption did not have a material impact on our consolidated financial statements.
In accordance with ASC 805, Business Combinations, our solar project acquisitions do not constitute a business as the assets acquired in purchase transactions. The Company has recorded intangibleeach case could be considered a single asset or group of similar assets relatedthat made up substantially all of the fair market value of the acquisitions. See Note 7 for information on solar projects we have purchased or are under definitive agreement to customer contracts, customer relationships, non-compete agreements, trade names and technology, each with defined useful lives. The Company assessespurchase.
Goodwill
As noted in the Acquisitions section above, our goodwill is derived when we acquire another business. Goodwill is not amortized, but the potential impairment of goodwill is assessed at least annually (December 31st) and intangible assets that have indefinite lives on an annualinterim basis (December 31st) and whenever events or changes in circumstances indicate that the carrying value of the asset may not be fully recoverable.
Goodwill is reviewed for impairment annually and whenever events or changes in circumstances indicate thatWe estimate the carryingfair value of an asset may not be recoverable. The process of evaluating the potential impairment of goodwill requires significant judgment. The Company regularly monitors current business conditions and other factors including, but not limited to, adverse industry or economic trends, restructuring actions and projections of future results. The Company estimates theour reporting units fair value and comparescompare it with the carrying value of the reporting unit, including goodwill. If the fair value is greater than the carrying value of itsthe reporting unit, no impairment is recorded. Fair value is determined using both an income approach and a market approach. The estimates and assumptions used in the Company’s calculations include revenue growth rates, expense growth rates, expected capital expenditures to determine projected cash flows, expected tax rates and an estimated discount rate to determine present value of expected cash flows. These estimates are based on historical experiences, the Company’s projections of future operating activity and its weighted-average cost of capital. If the fair value is less than the carrying value, an impairment loss is recognized for the amount that the carrying amount of a reporting unit, including goodwill, exceeds its fair value, limited to the total amount of goodwill allocated to that reporting unit. The impairment charge would be recorded to earnings in the consolidated statements of income. Judgment is required in determining whether an event has occurred that may impair the value of goodwill or identifiable intangible assets.
Intangible Assets
Acquired intangible assets, other than goodwill, that are subject to amortization include customer contracts, and customer relationships, as well as software/technology, trade names and non-compete agreements. The intangible assets are amortized over periods ranging from one to fifteen years from their respective acquisition dates. The Company evaluates itsWe evaluate our intangible assets for impairment consistent with, and part of, theirour long-lived assetsasset evaluation, as discussed in Energy Assets above.
See Notes 4 and 5 for additional disclosures.
AMERESCO, INC.
NOTES TO CONSOLIDATED FINANCIAL STATEMENTS - (Continued)
(in thousands, except per share amounts)
Leases
As of January 1, 2019, the Company adopted Accounting Standard Update (“ASU”) 2016-02, Leases (Topic 842) and, along with the standard, elected to take the practical expedient that the Company will not reassess lease classifications at adoption. Accordingly, the Company’s sales-leaseback arrangements entered into as of December 31, 2018 will remain under the previous guidance. See Note 7 and 8 for additional information on these sale-leasebacks.
All significant lease arrangements are recognized at lease commencement. Operating lease right-of-use (“ROU”) assets and lease liabilities are recognized at commencement. An ROU asset and corresponding lease liability are not recorded for leases with an initial term of 12 months or less (short term leases) as the Company recognizes lease expense for these leases as incurred over the lease term.
ROU assets represent the Company’sour right to use an underlying asset during the reasonably certain lease term and lease liabilities represent the Company’sour obligation to make lease payments arising from the lease. The Company’s lease terms may include options to extend or terminate the lease when it is reasonably certain that the Company will exercise that option. Operating lease ROU assets and lease liabilities for significant lease arrangements are recognized at commencement date based on the present value of lease payments over the lease term. The Company uses itsWe use our incremental borrowing rate, which is updated annually or when a significant event occurs that would indicate a significant change in rates, based on the information available at commencement date, in determiningto calculate the present value of lease payments. The operating lease ROU asset also includes any
AMERESCO, INC.
NOTES TO CONSOLIDATED FINANCIAL STATEMENTS
(In thousands, except per share amounts)
lease payments related to initial direct cost and prepayments and excludes lease incentives. Lease expense is recognized on a straight-line basis over the lease term which may include options to extend or terminate the lease when it is reasonably certain that we will exercise that option. Our ROU assets are evaluated for impairment using the same method as described above under the Long-lived Asset Impairment section.
We do not record ROU assets and corresponding lease liabilities for leases with an initial term of 12 months or less (“short-term leases”) as we recognize lease expense for these leases as incurred over the lease term.
The Company hasWe elected the package of practical expedients and did not reassess lease classifications of existing contracts or leases at adoption or the initial direct costs associated with existing leases. Accordingly, our sale-leaseback arrangements entered into as of December 31, 2018 remain under the previous guidance. See the Sale-leasebacks and Financing Leases section below and Note 8 for additional information on these sale-leasebacks.
We have historical leases under ASC 840, Leases, which may have lease and non-lease components. Upon adoption of Topic 842, the Company haswe elected to continue to account for these historical leases as a single component, as permitted by Topic 842. As of January 1, 2019, as it relates to all prospective leases, the Company allocateswe allocate consideration to lease and non-lease components based on pricing information in the respective lease agreement, or, if this information is not available, the Company makeswe make a good faith estimate based on the available pricing information at the time of the lease agreement. See Note 8 for additional discussion on the Company’sinformation about our leases.
Other Assets
Other assets consist primarily of notes and contracts receivable due to the CompanyAmeresco from various customers and non-current restricted cash. Other assets also includeincludes the fair value of derivatives determined to be assets, investments in unconsolidated joint ventures, the non-current portions of project development costs, accounts receivable retainages, sale-leaseback deferred loss and deferred contract costs.
Accrued Expenses and Other Current Liabilities
Accrued expenses and other current liabilities consist primarily of $47,041 in use and franchise tax payable, accrued payroll and payroll related expenses, sales tax payable, current portion of contingent consideration, and other accrued operating expenses.
Asset Retirement Obligations
The Company recognizesWe recognize a liability for the fair value of required asset retirement obligations (“AROs”) when such obligations are incurred. The Company records, as liabilities, the fair value of the AROs on a discounted basis when these obligations are incurred and can be reasonably estimated, which is typically at the time the assets are in development, installed or operating. Over time, the liabilities increase due to the change in present value, and initial capitalized costs are depreciated over the useful life of the related assets. Upon satisfaction of the ARO conditions, any difference between the recorded ARO liability and the actual retirement cost incurred is recognized as an operating gain or loss in the consolidated statements of income. See Note 7 for additional disclosures on the Company’sour AROs.
Federal ESPC Liabilities
Federal ESPC liabilities, for both projects and energy assets, represent the advances received from third-parties under agreements to finance certain ESPC projects with various federal government agencies. For projects related to the construction or installation of certain energy savings equipment or facilities developed for the government customer, the ESPC receivable from the government and corresponding ESPC liability is eliminated from our consolidated balance sheets upon completion and acceptance of the project by the government, typically within 24 to 36 months of construction commencement,commencement. We remain the ESPC receivable from the government and corresponding ESPC liability is eliminated from the Company’s consolidated balance sheets. Untilprimary obligor for financing received until recourse to the Companyus ceases for the ESPC receivables transferred to the investor upon final acceptance of the work by the government customer, the Company remains the primary obligor for financing received.customer.
For small-scale energy assets developed for a government customer that the Company ownswe own and operates, upon final acceptance of the work by the government customer, the Company remainsoperate, we remain the primary obligor for financing received until the liability is eliminated from the Company’sour consolidated balance sheets as contract payments assigned by the customer are transferred to the investor.investor upon final acceptance of the work by the government customer.
AMERESCO, INC.
NOTES TO CONSOLIDATED FINANCIAL STATEMENTS - (Continued)
(inIn thousands, except per share amounts)
Sale-leasebacks and Financing Leases
Sale-Leaseback
The Company has previouslyWe entered into sale-leaseback arrangements that provided for the sale of solar photovoltaic (“solar PV”) projectsPV energy assets to a third-party investorinvestors and the simultaneous leaseback of the projects,energy assets, which the Companywe then operatesoperate and maintains,maintain, recognizing revenue through the sale of the electricity and solar renewable energy credits generated by these projects.energy assets.
In sale-leaseback arrangements, the Companywe first determinesdetermine whether the solar PV projectenergy asset under the sale-leaseback arrangement is “integral equipment.”equipment”. A solar PV projectenergy asset is determined to be integral equipment when the cost to remove the projectenergy asset from its existing location, including the shipping and reinstallation costs of the solar PV projectenergy asset at the new site, includingand any diminution in fair value, exceeds 10% of the fair value of the solar PV projectenergy asset at the time of its original installation. When the leaseback arrangement expires, the Company haswe have the option to purchase the solar PV projectenergy asset for the then fair market value or, in certain circumstances, renew the lease for an extended term. AllWe have determined that none of the solar PV projectsenergy assets sold to date under the sale-leaseback program have been determined by the Company not to beconsidered integral equipment as the cost to remove the projectenergy asset from its existing location would not exceed 10% of its original fair value.
For solar PV projects that the Company has determined not to be integral equipment, the Company then determines if the leaseback should be classified as a capital lease or an operating lease. All solar PV projects sold to date under the sale-leaseback program have been determined by the Company to be capital leases. For leasebacks classified as capital leases, the Company initially records a capital lease asset and capital lease obligation in its consolidated balance sheets equal to the lower of the present value of the Company’s future minimum leaseback payments or the fair value of the solar PV project. For capital leasebacks, the Company defers any gain or loss, representing the excess or shortfall of cash received from the investor compared to the net book value of the asset in the Company’s consolidated balance sheets at the time of the sale. The Company records the long term portion of any deferred gain or loss in other liabilities and other assets, respectively, and the current portion of any deferred gain and loss in accrued expenses and other current liabilities and prepaid expenses and other current assets, respectively, in its consolidated balance sheets and amortizes the deferred amounts over the lease term in cost of revenues in its consolidated statements of income.
In accordance with the Company’sour adoption of Topic 842, sale-leaseback transactions shall beare accounted for as a financing liabilityliabilities on a prospective basis as the Company retainswe retain control of the underlying assets. As these transactions meet the criteria of a failed sale, the proceeds received in prospective transactions as of January 1, 2019, are accounted for as a long termlong-term financing liabilityliabilities with interest rates determined based upon the underlying details of each specific transaction.
We entered into sale-leaseback arrangements for solar PV energy assets prior to January 1, 2019, which remain under the previous guidance. We recorded a financing lease asset and financing lease obligation in our consolidated balance sheets equal to the lower of the present value of our future minimum leaseback payments or the fair value of the solar PV energy asset. We deferred any gain or loss, which represents the excess or shortfall of cash received from the investor compared to the net book value of the asset, at the time of the sale. We recorded the long-term portion of any deferred gain in other liabilities or deferred loss in other assets and the current portion in accrued expenses and other current liabilities or prepaid expenses and other current assets in our consolidated balance sheets. The deferred amounts are amortized over the lease term and are included in cost of revenues in our consolidated statements of income.
See NoteNotes 8 and 9 for details of our sales-leaseback and financing lease transactions.
Debt Issuance Costs
Debt issuance costs include external costs incurred to obtain financing. Debt issuance costs are amortized over the respective term of the financing using the effective interest method, with the exception of our revolving credit facility and construction loans, as discussed in Note 9, for further discussion and detailswhich are amortized on a straight-line basis over the term of sale lease-backthe agreement. Debt issuance costs are presented on the consolidated balance sheets along with unamortized debt discounts as a reduction to long-term debt and financing liability transactions.lease liabilities.
Other Liabilities
Other liabilities consist primarily of the long-term portion of deferred revenue related to multi-year operation and maintenance contracts which expire at various dates through 2033.2050. Other liabilities also include the fair value of derivatives and the long-term portions of sale-leaseback deferred gains. See Note 19 for additional derivative disclosures.
Revenue Recognition
The Company derives revenues fromWe are a provider of comprehensive energy services, including energy efficiency, infrastructure upgrades, energy security and resilience, asset sustainability, and renewable energy productssolutions for businesses and services. Energyorganizations. Our sustainability services include capital and operational upgrades to a facility's energy infrastructure and the development, construction, ownership, and operation of renewable energy plants. Our revenue is generated from the primary lines of business described below and is recognized in accordance with Revenue from Contracts with Customers (Topic 606).
Projects
Our Projects service relates to energy efficiency products and servicesprojects, which include the design, engineering, and installation of equipment and other measures to improve the efficiency, and control the operation, of a facility’s energy infrastructure. Renewable energy products and services include the construction of small-scale plants that produce electricity, gas, heat or cooling from renewable sources of energy, the sale of such electricity, gas, heat or cooling from plants that the Company owns, and the sale and installation of solar energy products and systems. Below is a description of the Company’s primary lines of business.
Projects - The Company’s principal service relates to energy efficiency projects, which entails the design, engineering and installation of, and assisting with the arranging of financing for an ever-increasing array of innovative technologies and techniques to improve the energy efficiency and control the operation of a building’s energy- and water- consumingwater-consuming systems. Renewable energy products and services include, but are not limited to, the design and construction of a
AMERESCO, INC.
NOTES TO CONSOLIDATED FINANCIAL STATEMENTS
(In certain projects, the Company also designs and constructs for a customer a thousands, except per share amounts)
central plant or cogeneration system providing power, heat and/or cooling to a building, or a small-scale plant that produces electricity, gas, heat or cooling from renewable sources of energy.
Under ASU 2014-09, Revenue from Contracts with Customers (Topic 606) the Company recognizesWe recognize revenue from the installation or construction of projects over time using the cost-based input method. The Company usesWe use the total costs incurred on the project relative to the total expected costs to account for the satisfaction of the performance obligation.
AMERESCO, INC.
NOTES TO CONSOLIDATED FINANCIAL STATEMENTS - (Continued)
(in thousands, except per share amounts)
When the estimate on a contract indicates a loss, or claims against costs incurred reducereduces the likelihood of recoverability of such costs, the Company recordswe record the entire estimated loss in the period the loss becomes known. In addition, some contracts contain an element of variable consideration, including liquidated damages and/or penalties, which requires payment to the customer in the event that construction timelines or milestones are not met. We estimate the total consideration payable by the customer when the contracts contain variable consideration provisions, based on the most likely amount anticipated to be recognized for transferring the promised goods or services. As a result, we may constrain revenue to the extent that a significant reversal in the amount of cumulative revenue recognized will not occur when the uncertainty associated with the variable consideration is subsequently resolved.
Operations & Maintenance (“Contracts are often modified for a change in scope or other requirements. Contract modifications exist when the modification either creates new or changes the existing enforceable rights and obligations. Most of our contract modifications are for goods or services that are not distinct from the existing performance obligations. The effect of a contract modification on the transaction price, and the measure of progress for the performance obligation to which it relates, is recognized as an adjustment to revenue (either as an increase or decrease) on a cumulative catch-up basis.
O&M”) - &M
After an energy efficiency or renewable energy project is completed, the Companywe often providesprovide ongoing O&M services under a multi-year contract. These services include operating, maintaining and repairing facility energy systems such as boilers, chillers, and building controls, as well as central power and other small-scale plants. For larger projects, the Companywe frequently maintainsmaintain staff on-site to perform these services.
Maintenance revenue is recognized using the input method to recognize revenue.method. In most cases, O&M fees are fixed annual fees. Becausefees and we record the Company isrevenue on a straight-line basis because the on-site to perform O&M services, the services are typically a distinct series of promises and those services have the same pattern of transfer to the customer (i.e., evenly over time), the Company records the revenue on a straight-line basis.. Some O&M service contract fees are billedbased on time expended. Inexpended and in those cases, revenue is recorded based on the time expended in that month.
Energy Assets - The Company’s
Our service offerings also includesinclude the sale of electricity, heat, cooling, processed biogas, and renewable gasbiomethane fuel heat or cooling from the portfolio of assets that the Company ownswe own and operates. The Company hasoperate. We have constructed and isare currently designing and constructing a wide range of renewable energy plants using landfill gas (“LFG”), wastewater treatment biogas, solar, biomass, other bio-derived fuels, wind, and hydro sources of energy. Most of the Company’sour renewable energy projects to date have involved the generation of electricity from solar PV and LFG or the sale of processed LFG. The Company purchaseselectricity, thermal, renewable fuel, or biomethane using biogas as a feedstock. We purchase the LFGbiogas that otherwise would be combusted or vented, processesprocess it, and either sellssell it or usesuse it in itsour energy plants. The Company hasWe have also designed and built, as well as owns, operatesown, operate and maintains,maintain plants that take biogas generated in the anaerobic digesters of wastewater treatment plants and turnsturn it into renewable natural gas that is either used to generate energy on-site or that can be sold through the nation’s natural gas pipeline grid. Where the Company owns and operates energy producing assets, the CompanyWe typically entersenter into a long-term power purchase agreement (“PPA”) for the sale of the energy.energy where we own and operate energy producing assets. Many of the Company’sour energy assets also produce environmental attributes, including renewable energy credits (“RECs”) and Renewable Identification Numbers (“RINs”).RINs. In most cases, the Company sellswe sell these attributes under separate agreements with third parties other than the PPA customer.
The Company recognizesIn accordance with specific PPA contract terms, we recognize revenues from the sale and delivery of the energy output from renewable energy plants over time as produced and delivered to the customer, in accordance with specific PPA contract terms.customer. Environmental attributes revenue is recognized at a point in time when the environmental attributes are transferred to the customer in accordance with the transfer protocols of the environmental attributes market that the Company operateswe operate in. In thosethe cases where environmental attributes are sold to the same customer as the energy output, the Company recordswe record revenue monthly for both the energy output and the environmental attribute output, as generated and delivered to the customer. The Company hasWe have determined that certain power purchase agreements containPPAs contained a lease component in accordance with ASC 840, Leases, prior to the adoption of Topic 842. The CompanyWe recognized $8,189, $7,238$10,904, $11,726 and $3,409$9,143 of operating lease revenue under these agreements during the years ended December 31, 2019, 20182022, 2021, and 2017,2020, respectively.
AMERESCO, INC.
NOTES TO CONSOLIDATED FINANCIAL STATEMENTS
(In thousands, except per share amounts)
Other - The Company’s
Our service and product offerings also include integrated-PV, andengineering, consulting, and enterprise energy management services.
The Company recognizes revenuesservices, which we recognize over time as the services are provided. We recognize revenue from delivery of engineering, consulting services and enterprise energy management services over time. For the sale of solar materials revenue is recognized at a point in time when the Company haswe have transferred physical control of the asset to the customer upon shipment.shipment or delivery.
To the extentPerformance Obligations
A performance obligation is a promise in a contract to transfer a distinct good or service to the customer and is deemedthe unit of account. Performance obligations are satisfied as of a point in time or over time and are supported by contracts with customers. For most of our contracts, there are multiple promises of goods or services. Typically, we provide a significant service of integrating a complex set of tasks and components such as design, engineering, construction management, and equipment procurement for a project contract. The bundle of goods and services are provided to have multipledeliver one output for which the customer has contracted. In these cases, we consider the bundle of goods and services to be a single performance obligations,obligation. We may also promise to provide distinct goods or services within a contract, such as a project contract for installation of energy conservation measures and post-installation O&M services. In these cases, we separate the Company allocatescontract into more than one performance obligation and allocate the total transaction price of the contract to each performance obligation using its best estimatein an amount based on the estimated relative standalone selling prices of the standalone selling pricepromised goods or services underlying each performance obligation.
Contract Acquisition Costs
We are required to account for certain acquisition costs over the life of each distinct good or servicethe contract, consisting primarily of commissions. Commission costs are incurred commencing at contract signing. Commission costs are allocated across all performance obligations and deferred and amortized consistent with the pattern of revenue recognition.
Contract Assets and Contract Liabilities
Contract assets represent our rights to consideration in exchange for services transferred to a customer that have not been billed as of the contract.
Billings in excess of cost and estimated earnings represents advanced billings on certain construction contracts. Costsreporting date. Our rights to consideration are generally unconditional at the time our performance obligations are satisfied. Unbilled revenue, presented as costs and estimated earnings in excess of billings, represent certain amounts under customer contracts that were earned and billable butthat were not invoiced.invoiced at the end of the fiscal period.
ResultsWhen we receive consideration, or such consideration is unconditionally due, from a customer prior to transferring goods or services to the customer under the terms of a sales contract, we record deferred revenue, which represents a contract liability. Deferred revenue, presented as billings in excess of cost and estimated earnings, typically results from billings in excess of costs incurred and advance payments received on project contracts.
At the inception of a contract, we expect the period between when we satisfy our performance obligations, and when the customer pays for reporting periods beginning January 1, 2018 are presented under Topic 606, while prior period amounts arethe services, will be one year or less. As such, we elected to apply the practical expedient which allows us not adjusted and continue to be reported under ASC 605, Revenue Recognition. adjust the promised amount of consideration for the effects of a significant financing component, when a financing component is present.
Cost of Revenues
AMERESCO, INC.
NOTES TO CONSOLIDATED FINANCIAL STATEMENTS - (Continued)
(in thousands, except per share amounts)
Cost of revenues includeincludes the cost of labor, materials, equipment, subcontracting and outside engineering that are required for the development and installation of projects, as well as preconstruction costs, sales incentives, associated travel, inventory obsolescence charges, amortization of intangible assets related to customer contracts, and, if applicable, costs of procuring financing. A majority of the Company’sour contracts have fixed price terms;terms, however, in some cases the Company negotiateswe negotiate protections, such as a cost-plus structure, to mitigate the risk of rising prices for materials, services, and equipment.
Cost of revenues also includeincludes the costs of maintaining and operating the small-scale renewable energy plants that the Company owns,we own, including the cost of fuel (if any) and depreciation charges.
Income Taxes
The Company providesWe account for income taxes based on the liability method. The Company provides formethod that requires the recognition of deferred income taxes based on the expected future tax consequences of differences between the financial statement basis and the tax basis of assets and liabilities calculatedliabilities. We calculate deferred income taxes using the enacted tax rates in effect for the year in which the differences are expected to be reflected in the tax return.
AMERESCO, INC.
NOTES TO CONSOLIDATED FINANCIAL STATEMENTS
(In thousands, except per share amounts)
We account for uncertain tax positions using a “more-likely-than-not” threshold for recognizing and resolving uncertain tax positions. The evaluation of uncertain tax positions is based on factors that include but are not limited to, changes in tax law, the measurement of tax positions taken or expected to be taken in tax returns, the effective settlement of matters subject to audit, new audit activity and changes in facts or circumstances related to a tax position. The Company evaluatesWe evaluate uncertain tax positions on a quarterly basis and adjustsadjust the level of the liability to reflect any subsequent changes in the relevant facts surrounding the uncertain positions.
The Company’sOur liabilities for uncertain tax positions can be relieved only if the contingency becomes legally extinguished through either payment to the taxing authority or the expiration of the statute of limitations, the recognition of the benefits associated with the position meet the “more-likely-than-not” threshold or the liability becomes effectively settled through the examination process.
The Company considersWe consider matters to be effectively settled once the taxing authority has completed all of its required or expected examination procedures, including all appeals and administrative reviews; the Company haswe have no plans to appeal or litigate any aspect of the tax position; and the Company believeswe believe that it is highly unlikely that the taxing authority would examine or re-examine the related tax position. The CompanyWe also accruesaccrue for potential interest and penalties related to unrecognized tax benefits inas a component of income tax expense.
The Company has presented allUnder the guidance, we have recorded long term deferred tax assets and deferred tax liabilities as net and noncurrentbased on itsthe underlying jurisdiction in the consolidated balance sheets as of December 31, 20192022 and 2018,2021, respectively.
See Note 10 for additional information on the Company’s income taxes.
Foreign Currency
The local currency of the Company’sour foreign operations is considered the functional currency of such operations. All assets and liabilities of the Company’sthese foreign operations are translated into U.S. dollars at year-end exchange rates. Income and expense items are translated at average exchange rates prevailing during the year. Translation adjustments are accumulated as a separate component of stockholders’ equity. Foreign currency translation gains and losses are reported in the consolidated statements of comprehensive income. Foreign currency transaction gains and losses are reported within other expenses, net in the consolidated statements of income. See Note 17.
Financial InstrumentsFair Value Measurements
We follow the guidance related to fair value measurements for all of our non-financial assets and non-financial liabilities, except for those recognized at fair value in the financial statements at least annually. These assets include goodwill and long-lived assets measured at fair value for impairment assessments, and non-financial assets and liabilities initially measured at fair value in a business combination.
Financial instruments consist of cash and cash equivalents, restricted cash, accounts and notes receivable, long-term contract receivables, accounts payable, accrued expenses and other current liabilities, financing lease assets and liabilities, contingent considerations,consideration, short- and long-term borrowings, make-whole provisions, interest rate swaps, and commodity swaps. Because of their short maturity, the carrying amounts of cash and cash equivalents, restricted cash, accounts and notes receivable, accounts payable, accrued expenses certain contingent considerations,and other current liabilities, and short-term borrowings approximate fair value.
Stock-BasedThe carrying value of long-term variable-rate debt approximates fair value. As of December 31, 2022, the carrying value of our long-term debt exceeds its fair value of $869,771 by approximately $14,283. Fair value of our debt is based on quoted market prices or on rates available to us for debt with similar terms and maturities, which are level two inputs of the fair value hierarchy, as defined in Note 18.
Stock-based Compensation Expense
Stock-basedWe measure and record stock-based compensation expense results from the issuancefor all stock-based payment awards based on estimated fair value. We may provide stock-based awards of shares of restricted common stock and grants of stock options to employees, directors, outside consultants, and others. The Company recognizes the costs associated with restricted stock option grants, and employee stock purchases made via the Company’sothers through various equity plans including our Employee Stock Purchase Plan (the “ESPP”) usingfor employees.
AMERESCO, INC.
NOTES TO CONSOLIDATED FINANCIAL STATEMENTS - (Continued)
(in thousands, except per share amounts)
actual forfeitures, is recognized based on the grant-date fair value recognition provisions of ASC 718, Compensation - Stock Compensation, on a straight-line basis over the vestingrequisite service period of the awards. Certain option grants have performance conditions that must be achieved prior to vesting and are expensed based on the expected achievement at each reporting period. Stock-based compensation expense is also recognized in association with employee stock purchases related to the Company’s ESPP.
Stock-based compensation expense is recognized based on the grant-date fair value. The Company estimatesWe estimate the fair value of the stock-based awards, including stock options, using the Black-Scholes option-pricing model. Determining the fair value of stock-based awards requires the use of highly subjective assumptions, including the fair value of the common stock underlying the award, the expected term of the award and expected stock price volatility.
AMERESCO, INC.
NOTES TO CONSOLIDATED FINANCIAL STATEMENTS
(In thousands, except per share amounts)
The assumptions used in determining the fair value of stock-based awards represent management’s estimates, which involve inherent uncertainties and the application of management judgment. As a result, if factors change, and different assumptions are employed, the stock-based compensation could be materially different in the future. The risk-free interest rates are based on the U.S. Treasury yield curve in effect at the time of grant, with maturities approximating the expected life of the stock options.
The Company hasWe have no history of paying dividends. Additionally, as of each of the grant dates, there was no expectation that the Companywe would pay dividends over the expected life of the options. The expected life of the awards is estimated based upon the period stock option holders will retain their vested options before exercising them. The Company usesWe use historical volatility as the expected volatility assumption required in the Black-Scholes model.
The Company recognizesWe recognize compensation expense for only the portion of options that are expected to vest. If there are any modifications or cancellations of the underlying invested securities or the terms of the stock option, it may be necessary to accelerate, increase or cancel any remaining unamortized stock-based compensation expense. As a result of the adoption of ASU 2016-09, Compensation-Stock Compensation (Topic 718): Improvements to Employee Share-Based Payment Accounting, during fiscal year 2017, no significant changes were made to the Company’s accounting for forfeitures. Upon adoption the Company recorded a $4,000 deferred tax asset and corresponding credit to retained earnings for excess tax benefits that had not previously been recognized because the related tax deductions had not reduced taxes payable.
The Company also accounts for equity instruments issued to non-employee directors and consultants at fair value. All transactions in which goods or services are the consideration received for the issuance of equity instruments are accounted for based on the fair value of the equity instruments to be issued. The measurement date of the fair value of the equity instrument issued is the grant date, which is the date that the Company and the grantee reach a mutual understanding of the key terms and conditions of the award.
No awards to individuals who were not either an employee or director of the Company occurred during the years ended December 31, 2019, 2018 and 2017.
Fair Value Measurements
The Company follows the guidance related to fair value measurements for all of its non-financial assets and non-financial liabilities, except for those recognized at fair value in the financial statements at least annually. These assets include goodwill and long-lived assets measured at fair value for impairment assessments, and non-financial assets and liabilities initially measured at fair value in a business combination.
The Company’s financial instruments consist of cash and cash equivalents, restricted cash, accounts and notes receivable, long-term contract receivables, accounts payable, accrued expenses, financing lease assets and liabilities, contingent considerations, short- and long-term borrowings, make-whole provisions, interest rate swaps, and commodity swaps. Because of their short maturity, the carrying amounts of cash and cash equivalents, restricted cash, accounts and notes receivable, accounts payable, accrued expenses, certain contingent considerations, and short-term borrowings approximate fair value.
The carrying value of long-term variable-rate debt approximates fair value. As of December 31, 2019, the carrying value of the Company’s long-term debt exceeds its fair value of $309,377 by approximately $1,869. Fair value of the Company’s debt is based on quoted market prices or on rates available to the Company for debt with similar terms and maturities, which are level two inputs of the fair value hierarchy, as defined in Note 18.
The Company accounts for its interest rate swaps and commodity swaps as derivative financial instruments in accordance with the related guidance. Under this guidance, derivatives are carried on the Company’s consolidated balance sheets at fair value. The fair value of the Company’s interest rate and commodity swaps are determined based on observable market data in combination with expected cash flows for each instrument. The Company accounts for its make-whole provision features as
AMERESCO, INC.
NOTES TO CONSOLIDATED FINANCIAL STATEMENTS - (Continued)
(in thousands, except per share amounts)
embedded derivatives in accordance with related guidance. Under this guidance, the derivative is bifurcated from its host contract and recorded on the Company’s consolidated balance sheets at fair value. The fair value of the Company’s make-whole provisions are determined based on observable market data and a with and without model.
The consideration for the Company’s acquisitions often includes future payments that are contingent upon the occurrence of a particular event. The Company records a contingent consideration obligation for such contingent consideration payments at fair value on the acquisition date. The Company estimates the acquisition date fair value of contingent consideration obligations through valuation models that incorporate probability adjusted assumptions related to the achievement of the milestones and the likelihood of making related payments. Each period the Company revalues the contingent consideration obligations associated with the acquisition to fair value and records changes in the fair value within the selling, general and administrative expenses line in our consolidated statements of income. Increases or decreases in the fair value of the contingent consideration obligations can result from changes in assumed discount periods and rates, changes in the assumed timing and amount of revenue and expense estimates and changes in assumed probability with respect to the attainment of certain financial and operational metrics, among others. Significant judgment is employed in determining these assumptions as of the acquisition date and for each subsequent period. Accordingly, future business and economic conditions, as well as changes in any of the assumptions described above, can materially impact the fair value of contingent consideration recorded at each reporting period. However, deferred consideration related to certain holdbacks and completion payments are considered short-term in nature. These amounts are recorded at full value and are only revalued if one of those underlying assumptions changes.
See Note 18 for additional information related to fair value measurements.
Share Repurchase Program
In April 2016, the Company’sour Board of Directors authorized the repurchase of up to $10,000 of the Company’sour Class A common stock from time to time on the open market or in privately negotiated transactions. The Company’sOur Board of Directors authorized an increase in the Company’s share repurchase authorization to $15,000 of the Company'sour Class A common stock in February 2017 and to $17,553 of the Company'sour Class A common stock in August 2019. The timing and amount of any shares repurchased will be determined by the Company’s management based on its evaluation of market conditions and other factors. Any repurchased shares will be available for use in connection with itsour stock plans and for other corporate purposes. The repurchase program has and will be funded using the Company’sour working capital and borrowings under itsour revolving line of credit. The Company accountsWe account for share repurchases using the cost method. Under this method and the cost of the share repurchase is recorded entirely in treasury stock, a contra equity account. During the years ended December 31, 2022 and December 31, 2021, we repurchased no shares, and during the year ended December 31, 2019, the Company2020, we repurchased 10.30.5 shares of common stock in the amount of $144,$6, net of fees of immaterial amounts. During the year ended December 31, 2018, the Company repurchased 218 shares of common stock in the amount of $1,839, net of fees of $9.
Derivative Financial Instruments
In the normal course of business, the Company utilizeswe utilize derivatives contracts as part of itsour risk management strategy to manage exposure to market fluctuations in interest and commodity rates. These instruments are subject to various credit and market risks. Controls and monitoring procedures for these instruments have been established and are routinely reevaluated. Credit risk represents the potential loss that may occur because a party to a transaction fails to perform according to the terms of the contract. The measure of credit exposure is the replacement cost of contracts with a positive fair value. The Company seeksWe seek to manage credit risk by entering into financial instrument transactions only through counterparties that the Company believes to bewe believe are creditworthy.
Market risk represents the potential loss due to the decrease in the value of a financial instrument caused primarily by changes in interest rates and commodity prices. The Company seeksWe seek to manage market risk by establishing and monitoring limits on the types and degree of risk that may be undertaken. As a matter of policy, the Company doeswe do not use derivatives for speculative purposes. The Company considerspurposes and consider the use of derivatives with all financing transactions to mitigate risk.
The Company recognizesWe account for our interest rate and commodity swaps as derivative financial instruments in accordance with ASC Topic 815, Derivatives and Hedging. Under this guidance, derivatives are carried on our consolidated balance sheets at fair value which is determined based on observable market data in combination with expected cash flows for each instrument. Some of our debt agreements contain make-whole provisions which we account for as embedded derivatives in accordance with related guidance. Under this guidance, the derivative is bifurcated from its host contract and recorded on our consolidated balance sheets at fair value by either comparing it against the rates of similar debt instruments under similar terms without a make-whole provision obtained from various highly rated third-party pricing sources or evaluating the present value of the prepayment fee.
We recognize cash flows from derivative instruments not designated as hedges as operating activities in the consolidated statements of cash flows. The Company recognizesWe recognize all changes in fair value on interest rate swaps designated as effective cash flow hedges in the Company’sour consolidated statements of comprehensive income. Changes in fair value on derivatives not designated as hedges are recognized in the Company’sour consolidated statements of income.
In July 2018, the Company made a prepayment on one of its term loans that had a related interest rate swap that was designated as a hedging instrument, which was canceled and de-designated as a hedge instrument. The Company does not have a history of prepaying its debt facilities and is not planning a prepayment or a forced prepayment of any of the Company’s hedged debt facilities. See Note 19 for additional information concerning the de-designation of this interest rate swap.
AMERESCO, INC.
NOTES TO CONSOLIDATED FINANCIAL STATEMENTS - (Continued)
(in thousands, except per share amounts)
In June 2018, the Company entered into a term loan agreement, discussed in Note 9, that contained an interest make-whole provision. In August 2018, the Company signed a joinder to the above agreement, which added another series of notes to the term loan that also contained an interest make-whole provision. The Company determined that these provisions fulfill the requirements of an embedded derivative instrument that were required to be bifurcated from its host agreement. The instrument is revalued periodically and the changes in fair value are recognized as either gains or losses in other expenses, net in the Company’s consolidated statements of income.
See Notes 18 and 19 for additional information on the Company’sour derivative instruments.
Earnings Per Share
Basic earnings per share is calculated using the Company’sour weighted-average outstanding common shares, including vested restricted shares. When the effects are not anti-dilutive, diluted earnings per share is calculated using the weighted-average outstanding common
AMERESCO, INC.
NOTES TO CONSOLIDATED FINANCIAL STATEMENTS
(In thousands, except per share amounts)
shares; the dilutive effect of convertible preferred stock, under the “if converted” method; and the treasury stock method with regard to warrants and stock options; all as determined under the treasury stock method.
|
| | | | | | | | | | | |
| | Year Ended December 31, |
| | 2019 | | 2018 | | 2017 |
| Net income attributable to common shareholders | $ | 44,436 |
| | $ | 37,984 |
| | $ | 37,491 |
|
| Basic weighted-average shares outstanding | 46,586 |
| | 45,729 |
| | 45,509 |
|
| Effect of dilutive securities: | |
| | |
| | |
|
| Stock options | 1,188 |
| | 1,102 |
| | 239 |
|
| Diluted weighted-average shares outstanding | 47,774 |
| | 46,831 |
| | 45,748 |
|
For the years ended December 31, 2019, 2018 and 2017, 806, 692 and 2,560 shares See Note 13 for our computation of common stock, respectively, related to stock options were excluded from the calculation of dilutive shares since the inclusion of such shares would be anti-dilutive. earnings per share.
Variable Interest Entities
Certain contracts are executed jointly through partnership and joint venture arrangements with unrelated third parties. The arrangements are often formed for the single business purpose of executing a specific project and allow the Companyus to share risks and/or secure specialty skills required for project execution.
The Company evaluatesWe evaluate each partnership and joint venture at inception to determine if it qualifies as a VIE under ASC 810, Consolidation. A variable interest entityVIE is an entity used for business purposes that either (a)(i) does not have equity investors with voting rights or (b)(ii) has equity investors who are not required to provide sufficient financial resources for the entity to support its activities without additional subordinated financial support. Upon the occurrence of certain events outlined in ASC 810, the Company reassesses itswe reassess our initial determination of whether the partnership or joint venture is a VIE.
The CompanyWe also evaluatesevaluate whether it iswe are the primary beneficiary of each VIE and consolidatesconsolidate the VIE if the Company haswe have both (a)(i) the power to direct the economically significant activities of the entity and (b)(ii) the obligation to absorb losses of, or the right to receive benefits from, the entity that could potentially be significant to the VIE. The Company considersWe consider the contractual agreements that define the ownership structure, distribution of profits and losses, risks, responsibilities, indebtedness, voting rights and board representation of the respective parties in determining whether it qualifieswe qualify as the primary beneficiary. The CompanyWe also considersconsider all parties that have direct or implicit variable interests when determining whether it iswe are the primary beneficiary. When the Company is determined to be the primary beneficiary, the VIE is consolidated. As required by ASC 810, management's assessment of whether the Company iswe are the primary beneficiary of a VIE is continuously performed.
The CompanyWe generally aggregatesaggregate the disclosures of itsour VIEs based on certain qualitative and quantitative factors including the purpose and design of the underlying VIEs, the nature of the assets in the VIE, and the type of involvement the Company haswe have with the VIE including itsour role and type of interest held in the VIE. As of December 31, 2019,2022, all the VIEs that make up the Company’sour investment funds (tax equity partnerships) are similar in purpose, design, and the Company’sour involvement and are aggregated together. Our other consolidated VIEs are similar in purpose, design, and our involvement, and as such, are aggregated in one disclosure.together. See NoteNotes 11 and 12 for additional disclosures.
Equity Method InvestmentInvestments
The Company hasWe have entered into foura number of joint ventures and hasusing the methodology described above for VIEs, we determined theythat we are not the primary beneficiaries using the methodology previously described for variable interest entities. The Company doesbeneficiary. We do not consolidate the operations of these joint
AMERESCO, INC.
NOTES TO CONSOLIDATED FINANCIAL STATEMENTS - (Continued)
(in thousands, except per share amounts)
ventures and treatstreat the joint ventures as equity method investments. See Note 11 for additional information on the Company’sour equity method investments.
Non-Controlling Interests and Redeemable Non-Controlling Interests
Non-controlling interests represent the portion of equity (net assets) in a VIE not attributable, directly or indirectly, to us. For some of our VIEs we perform the attribution of income or loss and comprehensive income or loss on the basis of our relative ownership interests and the non-controlling interests. These non-controlling interests which do not contain redemption features are classified within equity on our consolidated balance sheets.
In each of September 2015, June 2017, June 2018, October 2018 and December 2019, the Companywe formed an investment fundfunds (tax equity partnerships) with a different third party investorthird-party investors which granted the applicable investor ownership interests in the net assets of certain of the Company’sour renewable energy project subsidiaries. The Company currently has fiveAs of December 31, 2022, we had three such investment funds remaining, each with a different third partythird-party investor.
The CompanyWe entered into these agreements in order to finance the costs of constructing energy assets which are under long-term customer contracts. The Company hasWe have determined that these entities qualify as VIEs and that it iswe are the primary beneficiary in the operational partnerships for accounting purposes. Accordingly, the Company willwe consolidate the assets and liabilities and operating results of the entities in itsour consolidated financial statements. The Company willWe recognize the investors’ share of the net assets of the subsidiaries as redeemable non-controlling interests in itsour consolidated balance sheets.
The Company hasWe have determined that the provisions in the contractual arrangements represent substantive profit-sharing arrangements. The Company has further determinedarrangements and that the appropriate methodology for attributing income and loss to the redeemable non-controlling interests each period is a balance sheet approach referred to as the hypothetical liquidation at book value (“HLBV”) method. Under the HLBV method, the amounts of income and loss attributed to the redeemable non-controlling interests in the consolidated statements of income reflect changes
AMERESCO, INC.
NOTES TO CONSOLIDATED FINANCIAL STATEMENTS
(In thousands, except per share amounts)
in the amounts the investors would hypothetically receive at each balance sheet date under the liquidation provisions of the contractual agreements, assuming the net assets of this funding structure were liquidated at recorded amounts. The investors’ non-controlling interest in the results of operations of this funding structure is determined as the difference in the non-controlling interest’s claim under the HLBV method at the start and end of each reporting period, after taking into account any capital transactions, such as contributions or distributions, between the Company’sour subsidiaries and the investors. The use of the HLBV methodology to allocate income to the redeemable non-controlling interest holders may create volatility in the Company’s consolidated statements of income as the application of HLBV can drive changes in net income available and loss attributable to the redeemable non-controlling interests from quarter to quarter.
The CompanyWe classified the non-controlling interests with redemption features that are not solely within theour control of the Company outside of permanent equity on itsour consolidated balance sheets. The redeemable non-controlling interests will be reported using the greater of their carrying value at each reporting date as determined by the HLBV method or the estimated redemption values in each reporting period.
See Notes 11 and 12 for additional disclosures.information.
Recent Accounting Pronouncements
Intangibles-Goodwill and OtherReference Rate Reform
In August 2018,March 2020, the FASB issued ASU No. 2018-15, Intangibles - Goodwill2020-04, Reference Rate Reform (Topic 848): Facilitation of the Effects of Reference Rate Reform on Financial Reporting. ASU 2020-04, as amended by ASU 2021-01 in January 2021, directly addressing the effects of reference rate reform on financial reporting as a results of the cessation of the publication of certain London interbank offered rate (“LIBOR”) rates beginning December 31, 2021, with complete elimination of the publication of the LIBOR rates by June 30, 2023. The guidance provides optional expedients and Other - Internal-Use-Software (Subtopic 350-40)exceptions for applying GAAP to contracts, hedging relationships, and other transactions affected by reference rate reform by virtue of referencing LIBOR or another reference rate expected to be discontinued. This guidance became effective on March 12, 2020, and then amended by ASU 2022-06 in December 2022, extending the adoption date to no later than December 31, 2024, with early adoption permitted. We are currently evaluating the impact that adopting this new accounting standard would have on our consolidated financial statements.
Government Assistance
In November 2021, the FASB issued ASU 2021-10, Government Assistance (Topic 832): Customer’sDisclosures by Business Entities about Government Assistance, Accounting for Implementation Costs Incurred in a Cloud Computing Arrangement That Is a Service Contract Assets and Contract Liabilities from Contracts with Customers, which clarifies the accounting for implementation, setup, and upfront costs and aligns the requirements for capitalizing implementation costs incurred in a hosting arrangement that is a service contract with the requirements for capitalizing implementation costs incurred to develop or obtain internal-use software. The new standardrequires annual disclosures about certain types of government assistance received. ASU 2021-10 is effective for the interim and annual periodsour fiscal year beginning after December 15, 2019, with early adoption permitted, and can be applied either retrospectively or prospectively. The Company2021. We adopted this guidance as of January 1, 20192022, and the adoption did not have an impact on the Company’sour consolidated financial statements.
Derivatives and Hedging
In April 2019,March 2022, the FASB issued ASU No. 2019-04, Codification Improvements to Topic 326, Financial Instruments - Credit Losses, Topic 815,2022-01, Derivatives and Hedging and Topic 825, Financial Instruments,(Topic 815): Fair Value Hedging—Portfolio Layer Method, which among other things, clarifies some areas around partial-term fair value hedges, interest rate risk,expands the amortizationcurrent single-layer method to allow multiple hedged layers of fair value hedge basis adjustments and their disclosure, and some clarification of some matters relateda single closed portfolio to transitioning tobe hedged under the method. ASU No. 2017-12, which was adopted by the Company during the year ended December 31, 2018. For those that have already adopted ASU No. 2017-12, the new standard2022-01 is effective the first annual periodfor our fiscal year ending beginning after the issuance date of ASU No. 2019-04, or as of January 1, 2020 for the Company, with early adoption permitted. The Company isDecember 15, 2022. We are currently evaluating the impact of ASU No. 2019-04that adopting this new accounting standard would have on its
AMERESCO, INC.
NOTES TO CONSOLIDATED FINANCIAL STATEMENTS - (Continued)
(in thousands, except per share amounts)
consolidated financial statements, but does not expect that the adoption of this guidance will have a significant impact on itsour consolidated financial statements.
Fair Value Measurement
In August 2018,June 2022, the FASB issued ASU 2018-132022-03, Fair Value Measurement (Topic 820): Disclosure Framework—Changes to the Disclosure Requirements for Fair Value Measurement of Equity Securities Subject to Contractual Sale Restrictions, which modifiesclarifies the measurement criteria for equity securities and refines the disclosure requirements on fair value measurements.for equity securities subject to contractual sale restrictions. ASU 2018-132022-03 is effective for our fiscal yearsyear ending beginning after December 15, 2019, including interim periods within those fiscal years. The Company is2023. We are currently evaluating the impact ASU 2018-13that adopting this new accounting standard would have on its consolidated financial statements, but does not expect that the adoption of this guidance will have a significant impact on itsour consolidated financial statements.
Leases
In February 2016, the FASB issued ASU 2016-02, Leases (Topic 842). The guidance in this ASU supersedes the leasing guidance in Topic 840, Leases. Under the new guidance, the Company is electing to only recognize lease assets and lease liabilities on the balance sheet for all leases with terms longer than 12 months. Leases will be classified as either finance or operating, with classification affecting the pattern of expense recognition in the income statement. ASU 2016-02 is effective for fiscal years beginning after December 15, 2018, including interim periods within those fiscal years.
On January 1, 2019, the Company adopted ASU 2016-02 using the modified retrospective approach of applying the new standard at the adoption date. See Note 8 for the impact of the adoption and the new disclosures required by this standard.
In March 2019, the FASB issued ASU No. 2019-01, Leases (Topic 842): Codification Improvements, which provides clarification and improvements to the previous issued guidance. The standard is effective for fiscal years beginning after December 15, 2019 and interim periods within those fiscal years. The Company is currently evaluating the impact of ASU 2019-01 on its consolidated financial statements, but does not expect that the adoption of this guidance will have a significant impact on its consolidated financial statements.
Accumulated Other Comprehensive Income
In February 2018, the FASB issued ASU No. 2018-02, Income Statement – Reporting Comprehensive Income (Topic 220): Reclassification of Certain Tax Effects from Accumulated Other Comprehensive Income, to allow entities to reclassify the income tax effects of tax reform legislation commonly referred to as the Tax Cuts and Jobs Act (the “Tax Act”) on items within accumulated other comprehensive income to retained earnings. ASU 2018-02 is effective for fiscal years and interim periods within those years beginning after December 15, 2018, and early adoption is permitted. The Company adopted the guidance as of January 1, 2019. Upon adoption, the Company recognized an increase to retained earnings and a corresponding increase to accumulated other comprehensive loss of $217.
Consolidations
In October 2018, the FASB issued ASU No. 2018-17, Consolidation (Topic 810), Targeted Improvements to Related Party Guidance for Variable Interest Entities, which aligns the evaluation of whether a decision maker's fee is a variable interest with the guidance in the primary beneficiary test by requiring the decision maker to consider an indirect interest in a VIE held by related party under common control on a proportionate basis. The new standard is effective interim and annual periods beginning after December 15, 2019, with early adoption permitted. The Company is currently evaluating the impact of ASU 2018-17 on its consolidated financial statements, but does not expect that the adoption of this guidance will have a significant impact on its consolidated financial statements.
Credit Losses
In June 2016, the FASB issued ASU 2016-13, Financial Instruments-Credit Losses (Topic 326): Measurement of Credit Losses on Financial Instruments (ASU 2016-13), and a subsequent amendment to the initial guidance, ASU 2018-19 Codification Improvements to Topic 326, Financial Instruments—Credit Losses (collectively, Topic 326). Topic 326 requires measurement and recognition of expected credit losses for financial assets held, which include, but are not limited to, trade and other receivables. The new standard is effective for fiscal years beginning after December 15, 2019. The Company is currently evaluating the impact of this guidance on its consolidated financial statements, but does not expect that the adoption of this guidance will have a significant impact on its consolidated financial statements.
Income Taxes
AMERESCO, INC.
NOTES TO CONSOLIDATED FINANCIAL STATEMENTS - (Continued)
(in thousands, except per share amounts)
In December 2019, the FASB issued ASU No. 2019-12, Simplifying the Accounting for Income Taxes, which simplifies the accounting for income taxes, eliminates certain exceptions within ASC 740, Income Taxes, and clarifies certain aspects of the current guidance to promote consistency among reporting entities. ASU 2019-12 is effective for the Company for the fiscal year beginning after December 15, 2020. The Company is currently evaluating the impacts of the provisions of ASU 2019-12 on its financial statements and disclosures.
AMERESCO, INC.
NOTES TO CONSOLIDATED FINANCIAL STATEMENTS - (Continued)
(in thousands, except per share amounts)
3. REVENUE FROM CONTRACTS WITH CUSTOMERS
Adoption
On January 1, 2018, the Company adopted ASU 2014-09, Revenue from Contracts with Customers, (Topic 606) using the modified retrospective method applied to those contracts which were not completed as of December 31, 2017. Results for reporting periods beginning January 1, 2018 are presented under Topic 606, while prior period amounts are not adjusted and continue to be reported under the accounting standards in effect for the prior period. The Company recorded a net decrease to beginning retained earnings of $4,454 on January 1, 2018 due to the cumulative impact of adopting Topic 606, as detailed below.
|
| | | | | | | | | | | | | | | |
| | January 1, 2018 |
| | As Reported | | 606 Adjustments | | Adjusted Balances | |
| Assets: | | | | | | | | | |
| Costs and estimated earnings in excess of billings | | $ | 104,852 |
| | | $ | (9,194 | ) | | | $ | 95,658 |
| |
| Prepaid expenses and other current assets | | 14,037 |
| | | 4,343 |
| | | 18,380 |
| |
| Deferred income taxes, net | | — |
| | | 1,003 |
| | | 1,003 |
| |
| Liabilities: | |
| | | | | | | |
Accrued expenses and other current liabilities
| | 23,260 |
| | | 1,190 |
| | | 24,450 |
| |
| Deferred income taxes, net | | 584 |
| | | (584 | ) | | | — |
| |
| Shareholders' Equity: | | | | | | | | | |
| Retained earnings | | 235,844 |
| | | (4,454 | ) | | | 231,390 |
| |
AMERESCO, INC.
NOTES TO CONSOLIDATED FINANCIAL STATEMENTS - (Continued)
(in thousands, except per share amounts)
In accordance with Topic 606, the disclosure of the impact of adoption to the Company’s consolidated statements of income and balance sheets was as follows:
|
| | | | | | | | | | | | | | | | | | | | | | | | |
| | | Impact of changes in accounting policies |
| | | 12/31/2019 | | 12/31/2018 |
| | | As Reported | | Balances without adoption of Topic 606 | | Effect of Change Higher/(Lower) | | As Reported | | Balances without adoption of Topic 606 | | Effect of Change Higher/(Lower) |
| Revenues | | $ | 866,933 |
| | $ | 871,409 |
| | $ | (4,476 | ) | | $ | 787,138 |
| | $ | 784,316 |
| | $ | 2,822 |
|
| Cost of revenues | | 698,815 |
| | 701,397 |
| | (2,582 | ) | | 613,526 |
| | 610,229 |
| | 3,297 |
|
| Gross profit | | 168,118 |
| | 170,012 |
| | (1,894 | ) | | 173,612 |
| | 174,087 |
| | (475 | ) |
| Operating expenses: | | |
| | |
| | |
| | | | | | |
| Selling, general and administrative expenses | | 116,504 |
| | 116,504 |
| | — |
| | 114,513 |
| | 114,513 |
| | — |
|
| Operating income | | 51,614 |
| | 53,508 |
| | (1,894 | ) | | 59,099 |
| | 59,574 |
| | (475 | ) |
| Other expenses, net | | 15,061 |
| | 15,061 |
| | — |
| | 16,709 |
| | 16,709 |
| | — |
|
| Income before provision for income taxes | | 36,553 |
| | 38,447 |
| | (1,894 | ) | | 42,390 |
| | 42,865 |
| | (475 | ) |
| Income tax (benefit) provision | | (3,748 | ) | | (3,256 | ) | | (492 | ) | | 4,813 |
| | 4,998 |
| | (185 | ) |
| Net income | | 40,301 |
| | 41,703 |
| | (1,402 | ) | | 37,577 |
| | 37,867 |
| | (290 | ) |
| Net loss attributable to redeemable non-controlling interests | | 4,135 |
| | 4,135 |
| | — |
| | 407 |
| | 407 |
| | — |
|
| Net income attributable to common shareholders | | $ | 44,436 |
| | $ | 45,838 |
| | $ | (1,402 | ) | | $ | 37,984 |
| | $ | 38,274 |
| | $ | (290 | ) |
| Basic income per share | | $ | 0.95 |
| | $ | 0.98 |
| | $ | (0.03 | ) | | $ | 0.83 |
| | $ | 0.84 |
| | $ | (0.01 | ) |
| Diluted income per share | | $ | 0.93 |
| | $ | 0.96 |
| | $ | (0.03 | ) | | $ | 0.81 |
| | $ | 0.82 |
| | $ | (0.01 | ) |
|
| | | | | | | | | | | | | | | | | | | | | | | |
| | December 31, 2019 | | December 31, 2018 |
| | As Reported | | Balances without adoption of Topic 606 | | Effect of Change Higher/(Lower) | | As Reported | | Balances without adoption of Topic 606 | | Effect of Change Higher/(Lower) |
| Assets: | | | | | | | | | | | |
| Costs and estimated earnings in excess of billings | $ | 202,243 |
| | $ | 213,091 |
| | $ | (10,848 | ) | | $ | 86,842 |
| | $ | 93,214 |
| | $ | (6,372 | ) |
| Prepaid expenses and other current assets | 29,424 |
| | 25,776 |
| | 3,648 |
| | 11,571 |
| | 10,644 |
| | 927 |
|
| Liabilities: | | | | | | |
| | | | |
Accrued expenses and other current liabilities
| 31,356 |
| | 30,147 |
| | 1,209 |
| | 35,947 |
| | 34,877 |
| | 1,070 |
|
| Deferred income taxes, net | 115 |
| | 2,378 |
| | (2,263 | ) | | 4,352 |
| | 6,123 |
| | (1,771 | ) |
| Shareholders' Equity: | | | | | | |
| | | | |
| Retained earnings | 314,459 |
| | 320,605 |
| | (6,146 | ) | | 269,806 |
| | 274,550 |
| | (4,744 | ) |
The impact in revenue recognition due to the adoption of Topic 606 is primarily from the timing of revenue recognition for uninstalled materials, amortization of contract acquisition costs over the contract term, and timing of revenue recognition from renewable energy credits. See Note 2 for a summary of the Company’s significant policies for revenue recognition.
AMERESCO, INC.
NOTES TO CONSOLIDATED FINANCIAL STATEMENTS - (Continued)
(in thousands, except per share amounts)
Disaggregation of Revenue
The following table provides information about disaggregated revenue by line of business and geographical region, byOur reportable segments for the year ended December 31, 2019.2022 were U.S. Regions, U.S. Federal, Canada, Alternative Fuels (formerly Non-Solar Distributed Generation (“Non-Solar DG”)), and All Other. On January 1, 2022, we changed the structure of our internal organization, and our “All Other” segment now includes our U.S.-based enterprise energy management services previously included in our U.S Regions segment and our U.S. Regions segment now includes U.S. project revenue and associated costs previously included in our former Non-Solar DG segment. As a result, previously reported amounts have been reclassified for comparative purposes.
|
| | | | | | | | | | | | | | | | | | | | | | | |
| | US Regions | | U.S. Federal | | Canada | | Non-Solar DG | | All Other | | Total |
| Line of Business |
| Year ended December 31, 2019 |
| Project revenue | $ | 321,973 |
| | $ | 240,656 |
| | $ | 27,995 |
| | $ | 9,221 |
| | $ | 11,219 |
| | $ | 611,064 |
|
| O&M revenue | 15,753 |
| | 41,599 |
| | 5 |
| | 9,183 |
| | 169 |
| | 66,709 |
|
| Energy assets | 24,897 |
| | 3,652 |
| | 3,306 |
| | 65,365 |
| | 822 |
| | 98,042 |
|
| Other | 2,437 |
| | 1,519 |
| | 6,604 |
| | 914 |
| | 79,644 |
| | 91,118 |
|
| Total revenues | $ | 365,060 |
| | $ | 287,426 |
| | $ | 37,910 |
| | $ | 84,683 |
| | $ | 91,854 |
| | $ | 866,933 |
|
| | | | | | | | | | | | |
| Geographical Regions |
| Year ended December 31, 2019 |
| United States | $ | 364,987 |
| | $ | 287,426 |
| | $ | 3,007 |
| | $ | 84,683 |
| | $ | 75,302 |
| | $ | 815,405 |
|
| Canada | — |
| | — |
| | 34,830 |
| | — |
| | 201 |
| | 35,031 |
|
| Other | 73 |
| | — |
| | 73 |
| | — |
| | 16,351 |
| | 16,497 |
|
| Total revenues | $ | 365,060 |
| | $ | 287,426 |
| | $ | 37,910 |
| | $ | 84,683 |
| | $ | 91,854 |
| | $ | 866,933 |
|
AMERESCO, INC.
NOTES TO CONSOLIDATED FINANCIAL STATEMENTS
(In thousands, except per share amounts)
The following table provides information aboutpresents our revenue disaggregated revenue by line of business and geographical region, by reportable segments,segment for the year ended December 31, 2018.2022:
| | | | | | | | | | | | | | | | | | | | | | | | | | | | | | | | | | | | | | |
| | US Regions | | U.S. Federal | | Canada | | Alternative Fuels | | All Other | | Total |
| Project revenue | | $ | 1,049,465 | | | $ | 333,846 | | | $ | 44,273 | | | $ | — | | | $ | 53,680 | | | $ | 1,481,264 | |
| O&M revenue | | 22,217 | | | 51,857 | | | 42 | | | 10,377 | | | 472 | | | 84,965 | |
| Energy assets | | 47,372 | | | 5,822 | | | 4,447 | | | 104,082 | | | 368 | | | 162,091 | |
| Integrated-PV | | — | | | — | | | — | | | — | | | 49,696 | | | 49,696 | |
| Other | | 4,289 | | | 366 | | | 9,796 | | | — | | | 31,955 | | | 46,406 | |
| Total revenues | | $ | 1,123,343 | | | $ | 391,891 | | | $ | 58,558 | | | $ | 114,459 | | | $ | 136,171 | | | $ | 1,824,422 | |
|
| | | | | | | | | | | | | | | | | | | | | | | |
| | US Regions | | U.S. Federal | | Canada | | Non-Solar DG | | All Other | | Total |
| Line of Business |
| Year ended December 31, 2018 |
| Project revenue | $ | 296,226 |
| | $ | 202,286 |
| | $ | 29,571 |
| | $ | 4,550 |
| | $ | 12,420 |
| | $ | 545,053 |
|
| O&M revenue | 17,814 |
| | 39,250 |
| | 37 |
| | 8,135 |
| | — |
| | 65,236 |
|
| Energy assets | 18,442 |
| | 4,062 |
| | 2,604 |
| | 69,599 |
| | 1,069 |
| | 95,776 |
|
| Other | 1,862 |
| | 711 |
| | 6,770 |
| | 371 |
| | 71,359 |
| | 81,073 |
|
| Total revenues | $ | 334,344 |
| | $ | 246,309 |
| | $ | 38,982 |
| | $ | 82,655 |
| | $ | 84,848 |
| | $ | 787,138 |
|
| | | | | | | | | | | | |
Geographical Regions
|
| Year ended December 31, 2018 |
| United States | $ | 334,344 |
| | $ | 246,309 |
| | $ | 2,557 |
| | $ | 82,655 |
| | $ | 68,883 |
| | $ | 734,748 |
|
| Canada | — |
| | — |
| | 36,425 |
| | — |
| | 303 |
| | 36,728 |
|
| Other | — |
| | — |
| | — |
| | — |
| | 15,662 |
| | 15,662 |
|
| Total revenues | $ | 334,344 |
| | $ | 246,309 |
| | $ | 38,982 |
| | $ | 82,655 |
| | $ | 84,848 |
| | $ | 787,138 |
|
ForThe following table presents our revenue disaggregated by line of business and reportable segment for the yearsyear ended December 31, 20192021:
| | | | | | | | | | | | | | | | | | | | | | | | | | | | | | | | | | | | | | |
| | US Regions | | U.S. Federal | | Canada | | Alternative Fuels | | All Other | | Total |
| Project revenue | | $ | 488,507 | | | $ | 340,686 | | | $ | 36,776 | | | $ | — | | | $ | 37,991 | | | $ | 903,960 | |
| O&M revenue | | 21,551 | | | 47,072 | | | 71 | | | 9,288 | | | 631 | | | 78,613 | |
| Energy assets | | 39,433 | | | 4,913 | | | 4,532 | | | 101,811 | | | 562 | | | 151,251 | |
| Integrated-PV | | — | | | — | | | — | | | — | | | 41,202 | | | 41,202 | |
| Other | | 1,627 | | | 277 | | | 8,104 | | | 124 | | | 30,539 | | | 40,671 | |
| Total revenues | | $ | 551,118 | | | $ | 392,948 | | | $ | 49,483 | | | $ | 111,223 | | | $ | 110,925 | | | $ | 1,215,697 | |
The following table presents our revenue disaggregated by line of business and 2018, approximately 92% and 93%, respectively, ofreportable segment for the year ended December 31, 2020:
| | | | | | | | | | | | | | | | | | | | | | | | | | | | | | | | | | | | | | |
| | US Regions | | U.S. Federal | | Canada | | Alternative Fuels | | All Other | | Total |
| Project revenue | | $ | 369,341 | | | $ | 327,626 | | | $ | 36,689 | | | $ | — | | | $ | 30,950 | | | $ | 764,606 | |
| O&M revenue | | 18,633 | | | 45,423 | | | 169 | | | 7,848 | | | 289 | | | 72,362 | |
| Energy assets | | 33,792 | | | 4,358 | | | 4,069 | | | 75,168 | | | 810 | | | 118,197 | |
| Integrated-PV | | — | | | — | | | — | | | — | | | 39,112 | | | 39,112 | |
| Other | | 1,888 | | | 475 | | | 6,830 | | | 612 | | | 28,193 | | | 37,998 | |
| Total revenues | | $ | 423,654 | | | $ | 377,882 | | | $ | 47,757 | | | $ | 83,628 | | | $ | 99,354 | | | $ | 1,032,275 | |
See Note 16 for our revenue isdisaggregated by geographical region.
The following table presents information related to our revenue recognized over time, and thetime:
| | | | | | | | | | | | | | | | | | | | |
| | Year Ended December 31, |
| | 2022 | | 2021 | | 2020 |
| Percentage of revenue recognized over time | | 96 | % | | 95 | % | | 94 | % |
The remainder of our revenue is for products and services transferred at a point in time.
time, at which point revenue is recognized.
AMERESCO, INC.
NOTES TO CONSOLIDATED FINANCIAL STATEMENTS - (Continued)
(inIn thousands, except per share amounts)
Contract Balances
The following table provides information about receivables, contract assets, and contract liabilities from contracts with customers:
|
| | | | | | | | | |
| | | December 31, 2019 | | December 31, 2018 | |
| Accounts receivable, net | | $ | 95,863 |
| | $ | 85,985 |
| |
| Accounts receivable retainage, net | | 16,976 |
| | 13,516 |
| |
| Contract Assets: | | | | | |
| Costs and estimated earnings in excess of billings | | 202,243 |
| | 86,842 |
| |
| Contract Liabilities: | | | | | |
| Billings in excess of cost and estimated earnings | | 32,178 |
| | 30,706 |
| |
Accounts receivable retainage represents amounts due from customers, but where payments are withheld contractually until certain construction milestones are met. Amounts retained typically range from 5% to 10% of the total invoice. The Company classifies as a current asset those retainages that are expected to be billed in the next twelve months. Unbilled revenue, presented as costs and estimated earnings in excess of billings, represent amounts earned and billable that were not invoiced at the end of the fiscal period.
Contract assets represent the Company’s rights to consideration in exchange for services transferred to a customer that have not been billed as of the reporting date. The Company’s rights to consideration are generally unconditional at the time its performance obligations are satisfied.
At the inception of a contract, the Company expects the period between when it satisfies its performance obligations, and when the customer pays for the services, will be one year or less. As such, the Company has elected to apply the practical expedient which allows the Company to not adjust the promised amount of consideration for the effects of a significant financing component, when a financing component is present.
When the Company receives consideration, or such consideration is unconditionally due, from a customer prior to transferring goods or services to the customer under the terms of a sales contract, the Company records deferred revenue, which represents a contract liability. Such deferred revenue typically results from billings in excess of costs incurred and advance payments received on project contracts. As of December 31, 2019 and 2018, the Company classified $5,560 and $6,342, respectively, as a non-current liability, included in other liabilities on the consolidated balance sheets, for those performance obligations expected to be completed beyond the next twelve months. | | | | | | | | | | | |
| | December 31, 2022 | | December 31, 2021 |
| Accounts receivable, net | $ | 174,009 | | | $ | 161,970 | |
| Accounts receivable retainage | 38,057 | | | 43,067 | |
| Contract Assets | | | |
| Costs and estimated earnings in excess of billings | 576,363 | | | 306,172 | |
| Contract Liabilities | | | |
| Billings in excess of cost and estimated earnings | 34,796 | | | 35,918 | |
Billings in excess of cost and estimated earnings, non-current (1) | 7,617 | | | 6,481 | |
| Total contract liabilities | $ | 42,413 | | | $ | 42,399 | |
|
| (1) Performance obligations that are expected to be completed beyond the next twelve months and are included in other liabilities in the consolidated balance sheets. |
The increase in contract assets for the year ended December 31, 20192022 was primarily due to revenue recognized of $535,021,$1,371,455, offset in part by billings of approximately $431,717.$1,103,926. Contract assets also increased due to reclassifications, primarily from contract liabilities as a result of timing of customer payments. The increase in contract liabilities was primarily driven by the receipt of advance payments from customers, and related billings, as well as reclassifications from contract assets as a result of timing of customer payments. The advance payments and reclassifications exceeded the recognition of revenue as performance obligations were satisfied. For the year ended December 31, 2022, we recognized revenue of $135,506 and billed $129,749 to customers that had balances which were included in contract liabilities at December 31, 2021.
The increase in contract assets for the year ended December 31, 2021 was primarily due to revenue recognized of $708,384, offset in part by billings of $618,041. The increase in contract liabilities was primarily driven by the receipt of advance payments from customers, and related billings, exceeding recognition of revenue as performance obligations were satisfied. For the year ended December 31, 2019, the Company2021, we recognized revenue of $75,070,$207,746, and billed customers $73,675$181,284 to customers that was previouslyhad balances which were included in the beginning balance of contract liabilities. Changes in contract liabilities are also driven by reclassifications to or from contract assets as a result of timing of customer payments.
The decrease in contract assets for the year endedat December 31, 2018 was primarily due to billings of approximately $510,470, offset in part by revenue recognized of $485,143. The increase in contract liabilities was primarily driven by the receipt of advance payments from customers, and related billings, exceeding recognition of revenue as performance obligations were satisfied. For the year ended December 31, 2018, The Company recognized revenue of $95,318, and billed customers $80,007, that was previously included in the beginning balance of contract liabilities. Changes in contract liabilities are also driven by reclassifications to or from contract assets as a result of timing of customer payments.2020.
Contracts are often modified for a change in scope or other requirements. The Company considers contract modifications to exist when the modification either creates new or changes the existing enforceable rights and obligations. Most of the Company’s contract modifications are for goods or services that are not distinct from the existing performance obligations. The effect of a contract modification on the transaction price, and the measure of progress for the performance obligation to which it relates, is recognized as an adjustment to revenue (either as an increase or decrease) on a cumulative catchup basis.Backlog
AMERESCO, INC.
NOTES TO CONSOLIDATED FINANCIAL STATEMENTS - (Continued)
(in thousands, except per share amounts)
The Company elected to utilize the modified retrospective transition practical expedient which allows the Company to evaluate the impact of contract modifications as of the adoption date rather than evaluating the impact of the modifications at the time they occurred prior to the adoption date.
Performance obligations
A performance obligation is a promise in a contract to transfer a distinct good or service to the customer, and is the unit of account in ASC Topic 606. Performance obligations are satisfied as of a point in time or over time and are supported by contracts with customers. For most of the Company’s contracts, there are multiple promises of goods or services. Typically, the Company provides a significant service of integrating a complex set of tasks and components such as design, engineering, construction management, and equipment procurement for a project contract. The bundle of goods and services are provided to deliver one output for which the customer has contracted. In these cases, the Company considers the bundle of goods and services to be a single performance obligation. The Company may also promise to provide distinct goods or services within a contract, such as a project contract for installation of energy conservation measures and post-installation O&M services. In these cases the Company separates the contract into more than one performance obligation. If a contract is separated into more than one performance obligation, the Company allocates the total transaction price to each performance obligation in an amount based on the estimated relative standalone selling prices of the promised goods or services underlying each performance obligation.
Backlog - The Company’sOur remaining performance obligations (hereafter referred to as “backlog”(“fully-contracted backlog”) represent the unrecognized revenue value of the Company’sour contract commitments. The Company’sOur backlog may vary significantly each reporting period based on the timing of major new contract commitments and the fully-contracted backlog may fluctuate with currency movements. In addition, our customers have the right, under some circumstances, to terminate contracts or defer the timing of the Company’sour services and their payments to us. At December 31, 2019, the Company2022, we had fully-contracted backlog of $2,232,445 and approximately $2,249,970. Approximately 28%,31% of our December 31, 2019fully-contracted backlog is anticipated to be recognized as revenue in the next twelve months and the remaining, thereafter.months. The remaining performance obligations primarily relate primarily to the energy efficiency and renewable energy construction projects, including the long-term O&M services related to these projects. The long-term services have varying initial contract terms, up to 25 years.
The Company hasWe applied the practical expedient for certain revenue streams to exclude the value of remaining performance obligations for (i) contracts with an original expected term of one year or less or (ii) contracts for which the Company recognizeswe recognize revenue in proportion to the amount it haswe have the right to invoice for services performed.
Contract acquisition costs
In connection with the adoption of Topic 606, the Company is required to account for certain acquisition costs over the life of the contract, consisting primarily of commissions. Commission costs are incurred commencing at contract signing. Commission costs are allocated across all performance obligations and deferred and amortized over the contract term on a progress towards completion basis.Acquisition Costs
As of December 31, 20192022 and 2018,2021, we had capitalized commission costs of $1,735, related to contracts that were not completed, which were included in other assets in the accompanying consolidated balance sheets, the Company capitalized $1,735 and $927, respectively, in commission costs related to contracts that were not completed.sheets. For contracts that have a duration of less than one year, the Company followswe follow a practical expedient and expensesexpense these costs when incurred. During the years ended December 31, 20192022 and 2018,2021, the amortization of commission costs related to contracts werewas not material and have been included in the accompanying consolidated statements of income.
AMERESCO, INC.
NOTES TO CONSOLIDATED FINANCIAL STATEMENTS
(In thousands, except per share amounts)
The Company analyzed the impact of adoption of Topic 606 on the Company’sfollowing table presents information related to our project development costs and determined no change in the Company’s accounting policy was required. During the years ended December 31, 2019 and 2018, $35,172 and $15,672, respectively, of project development costs were recognized in the consolidated statements of income on projects that converted to customer contracts.contracts:
| | | | | | | | | | | | | | | | | |
| Year Ended December 31, |
| 2022 | | 2021 | | 2020 |
| Project development costs recognized | $ | 15,507 | | | $ | 12,737 | | | $ | 12,790 | |
No impairment charges in connection with the Company’sour commission costs or project development costs were recorded during the years ended December 31, 20192022, 2021 and 2018.2020.
4. BUSINESS ACQUISITIONS AND RELATED TRANSACTIONS
The Company accounts for acquisitions usingIn November 2021, we entered into a stock purchase agreement to acquire all of the stock of Juice Technologies, Inc. (d/b/a Plug Smart), an Ohio-based energy services company that specializes in the development and implementation of budget neutral capital improvement projects including building controls and building automation systems. In December 2021, we completed the acquisition methodof Plug Smart, which allows us to expand our existing pipeline and solution offerings in accordance with ASC 805, BusinessCombinations.the smart buildings sector. The adjusted purchase price for each has been allocatedconsideration was $21,240, of which $17,692 was paid as of December 31, 2021. The consideration also included a hold-back of $750 and other accruals related to the assets based on their estimated fair valuespossible adjustments to net working capital at the acquisition date of
AMERESCO, INC.
NOTES TO CONSOLIDATED FINANCIAL STATEMENTS - (Continued)
(in thousands, except per share amounts)
each acquisition as set forth inand future claims about representations and warranties by the table below. The excess purchase price over the estimatedsellers, if any, and a potential contingent consideration earn-out that had a fair value of $2,160 on the net assets, which are calculated using level 3 inputs per the fair value hierarchy as defined in Note 18, acquired has been recorded as goodwill. Intangible assets, if identified, have been recorded and are being amortized over periods ranging from one to fifteen years. See Note 5 for additional information.
Determining the fair valuedate of certain assets and liabilities assumed is judgmental in nature and often involves the use of significant estimates and assumptions. Certain amounts below are provisional based on our best estimates using information available as of the reporting date.acquisition. The Company is waiting for information to become available to finalize its valuation of certain elements of these transactions. Specifically, the assigned values for energy assets, intangibles, and goodwill are provisional in nature and subject to change upon the completion of the final valuation of such elements.
In January 2019, the Company completed an acquisition of a Massachusetts based solar operations and maintenance firm forearn-out includes contingent consideration of $1,294.up to $5,000 based upon meeting certain future EBITDA targets over the next five years. Cash acquired was $2,771 and no debt was assumed. The transaction costs, pro-forma effects of this acquisition on our operations, and contribution to revenue and net income for the Company’s operations areyears ended December 31, 2021 presented in the consolidated statements of income were not material.
In December 2018, the Company completed an acquisitionThe estimated goodwill of certain assets of Washington, DC based mechanical, electrical, plumbing, and fire protection design company, JVP Engineers, P.C. The consideration consisted of $2,326, of which, $1,901 has been paid to date. The remaining balance is attributed to a contingent consideration holdback related to the collection of certain receivables and will be be paid 15 months$12,499 from the completionPlug Smart acquisition consists largely of expected benefits, including the combined entities experience, technical problem-solving capabilities, and the acquired workforce. This goodwill is not deductible for income tax purposes. The estimated fair value of tangible and intangible assets acquired and liabilities assumed are based on management's estimates and assumptions that are preliminary and subject to final working capital adjustments as of the acquisition. No debt was assumed or cash acquired in the transaction. The pro-forma effects of this acquisition on the Company’s operations are not material.date. During the year ended December 31, 2018, the Company had2022, we made a final measurement period adjustment of $197, which was recorded as a reduction to goodwill.
In December 2018, the Company completed an acquisition of certain assets of the Hawaii-based building science and design engineering consulting firm, Chelsea Group Limited. The consideration consisted of $1,691 of cash and potential contingent consideration of up to $2,000 based upon meeting certain future revenue targets over the next 5 years. The final purchase price is subject to a net working capital, adjustment, dependent ongoodwill, and intangible assets, and made a payment of $275 for the level of working capital at the acquisition date, that has not been finalized yet.December 2021 earn-out. The fair value of the contingent consideration was $555 as of the date of acquisition. No debt was assumed or cash acquired in the transaction. The pro-forma effects of this acquisition on the Company’s operations are not material. The value of theremaining contingent consideration increased by $44 during the year ended December 31, 2018 to a ending balance of $599$3,800 as of December 31, 2018. The value of the contingent consideration increased by $79 during the year ended December 31, 2019 to a ending balance of $678 as of December 31, 2019.2022. See Note 18 for additional information on contingent consideration.
We did not complete any acquisitions during the year ended December 31, 2022.
AMERESCO, INC.
NOTES TO CONSOLIDATED FINANCIAL STATEMENTS
(In January 2017, the Company acquired two solar PV projects currently under construction as well as associated construction loan agreements with a bank for use in providing non-recourse financing for these acquired solar PV projects currently under construction. The Company paid $2,409 to acquire the assets under construction, and assumed $5,635 of associated non-recourse financing.thousands, except per share amounts)
A summary of the cumulative consideration paid, and the allocation of the purchase price, of all ofand adjustments made for the acquisitions in each respective year is as follows:
|
| | | | | | | | | |
| | 2019 | 2018 | 2017 |
| Accounts receivable | $ | 232 |
| $ | 1,015 |
| $ | — |
|
| Prepaid expenses and other current assets | 2 |
| 12 |
| 256 |
|
| Property and equipment and energy assets | 315 |
| — |
| 7,788 |
|
| Intangibles | 500 |
| 680 |
| — |
|
| Goodwill | 337 |
| 2,845 |
| — |
|
| Accounts payable | 30 |
| 67 |
| — |
|
| Accrued Exp | 1 |
| — |
| — |
|
| Deferred Revenue | 61 |
| — |
| — |
|
| Purchase price | $ | 1,294 |
| $ | 4,619 |
| $ | 8,044 |
|
| Total, net of cash received | $ | 1,294 |
| $ | 4,619 |
| $ | 8,044 |
|
| Debt assumed | $ | — |
| $ | — |
| $ | 5,635 |
|
| Total fair value of consideration | $ | 1,294 |
| $ | 4,619 |
| $ | 2,409 |
|
AMERESCO, INC.
NOTES TO CONSOLIDATED FINANCIAL STATEMENTS - (Continued)
(in thousands, except per share amounts)
The results of the acquired assets since the dates of the acquisitions have been asPlug Smart acquisition are presented in the accompanying consolidated statements of income, consolidated statements of comprehensive income and consolidated statements of cash flows.table below:
For the year ended December 31, 2019, the Company had an additional measurement period adjustment of $628 related to a 2018 acquisition which was recorded as a reduction to goodwill and included a $398 reduction in the holdback contingency discussed further in Notes 5 and 15. | | | | | | | | | | | | | | | | | |
| Preliminary December 31, 2021 | | Measurement Period Adjustment | | As Adjusted December 31, 2022 |
| Cash and cash equivalents | $ | 2,771 | | | $ | — | | | $ | 2,771 | |
| Accounts receivable | 3,370 | | | — | | | 3,370 | |
| Costs and estimated earnings in excess of billings | 1,663 | | | — | | | 1,663 | |
| | | | | |
| Prepaid expenses and other current assets | 1,499 | | | — | | | 1,499 | |
| | | | | |
| | | | | |
| Goodwill | 12,499 | | | 389 | | | 12,888 | |
| Intangible assets | 6,354 | | | (409) | | | 5,945 | |
| Operating lease assets | 488 | | | — | | | 488 | |
| Accounts payable | (1,795) | | | — | | | (1,795) | |
| Accrued expenses and other current liabilities | (964) | | | (127) | | | (1,091) | |
| Current portion of operating lease liabilities | (145) | | | | | (145) | |
| Billings in excess of cost and estimated earnings | (2,464) | | | — | | | (2,464) | |
| Deferred income tax liabilities | (1,693) | | | | | (1,693) | |
| Long-term operating lease liabilities, net of current portion | (343) | | | — | | | (343) | |
| Purchase price | $ | 21,240 | | | $ | (147) | | | $ | 21,093 | |
| Purchase price, net of cash acquired | $ | 18,469 | | | $ | (147) | | | $ | 18,322 | |
| | | | | |
| Total fair value of consideration | $ | 21,240 | | | | | $ | 21,093 | |
| Cash paid to date | $ | 17,692 | | | | | $ | 18,727 | |
| Hold-back | $ | 750 | | | | | $ | 500 | |
For the year ended December 31, 2019, in order to expand its portfolio of energy assets, the Company acquired nine solar projects from two separate developers and is under definitive agreement to acquire ten additional solar projects. For the year ended December 31, 2018, the Company acquired twelve solar projects from two separate developers and at December 31, 2018 was under definitive agreement to acquire six additional solar projects, three of which were subsequently acquired in 2019, and one of which was amended and will no longer be acquired.
The Company has concluded that in accordance with ASC 805, Business Combinations, these acquisitions in 2019 and 2018 did not constitute a business as the assets acquired in each case could be considered a single asset or group of similar assets that made up substantially all of the fair market value of the acquisitions. See Note 7 for additional disclosures on these asset acquisitions.
5. GOODWILL AND INTANGIBLE ASSETS, NET
Goodwill, Net
The changes in the carrying value of goodwill attributable to eachbalances by reportable segment are as follows:
| | | | | | | | | | | | | | | | | | | | | | | | | | | | | |
| U.S. Regions | | U.S. Federal | | Canada | | Other | | Total |
| Carrying Value of Goodwill | | | | | | | | | |
| Balance, December 31, 2020 | $ | 26,705 | | | $ | 3,981 | | | $ | 3,441 | | | $ | 24,587 | | | $ | 58,714 | |
| Goodwill acquired during the year | 12,499 | | | — | | | — | | | — | | | 12,499 | |
| | | | | | | | | |
| Foreign currency translation | — | | | — | | | 13 | | | (69) | | | (56) | |
| Balance, December 31, 2021 | 39,204 | | | 3,981 | | | 3,454 | | | 24,518 | | | 71,157 | |
| | | | | | | | | |
| Remeasurement adjustments | 389 | | | — | | | — | | | — | | | 389 | |
| Foreign currency translation | — | | | — | | | (218) | | | (695) | | | (913) | |
| Balance, December 31, 2022 | $ | 39,593 | | | $ | 3,981 | | | $ | 3,236 | | | $ | 23,823 | | | $ | 70,633 | |
| | | | | | | | | |
| | | | | | | | | |
| | | | | | | | | |
| | | | | | | | | |
|
| | | | | | | | | | | | | | | | | | | |
| | U.S. Regions | | U.S. Federal | | Canada | | Other | | Total |
| Balance, December 31, 2017 | 24,759 |
| | 3,375 |
| | 3,494 |
| | 24,507 |
| | 56,135 |
|
| Goodwill acquired during the year | 1,611 |
| | 1,234 |
| | — |
| | — |
| | 2,845 |
|
| Currency effects | — |
| | — |
| | (277 | ) | | (371 | ) | | (648 | ) |
| Balance, December 31, 2018 | 26,370 |
| | 4,609 |
| | 3,217 |
| | 24,136 |
| | 58,332 |
|
| Goodwill acquired during the year | 337 |
| | — |
| | — |
| | — |
| | 337 |
|
| Re-measurement adjustments | (2 | ) | | (628 | ) | | — |
| | — |
| | (630 | ) |
| Currency effects | — |
| | — |
| | 152 |
| | 223 |
| | 375 |
|
| Balance, December 31, 2019 | 26,705 |
| | 3,981 |
| | 3,369 |
| | 24,359 |
| | 58,414 |
|
| Accumulated Goodwill Impairment Balance, December 31, 2018 | $ | — |
| | $ | — |
| | $ | (1,016 | ) | | $ | — |
| | $ | (1,016 | ) |
| Accumulated Goodwill Impairment Balance, December 31, 2019 | $ | — |
| | $ | — |
| | $ | (1,016 | ) | | $ | — |
| | $ | (1,016 | ) |
In accordance with ASC 350,Our annual goodwill impairment review was performed each year-end using a quantitative approach, and we determined that there was no goodwill impairment for the years ended December 31, 2022 and 2021. We tested goodwill for impairment as of December 31, 2019, 2018 and 2017 at the reporting unit level underutilizing the income approach which uses, in part,included a discounted cash flow method andwith a peer-based guideline method, and a risk-adjusted weighted average cost of capital. No impairment was recorded in the December 31, 2019, 2018 or 2017 assessments.market approach. Based on the Company’s goodwill impairmentour assessment, all of itsour reporting units with goodwill had estimated fair values as of December 31, 2019 and 2018 that exceeded their carrying values by at least 15% and 20%, respectively. During the course of the valuation analysis it was determined that although the fair value of the Company’s Federal reporting unit exceeded the carrying amount of this reporting unit, the carrying value of the reporting unit was negative as of December 31, 2019. The Federal reporting unit had goodwill of $3,9812022 and 61% as of December 31, 2019.
The gross carrying amount and accumulated amortization of intangible assets are as follows:2021.
AMERESCO, INC.
NOTES TO CONSOLIDATED FINANCIAL STATEMENTS - (Continued)
(inIn thousands, except per share amounts)
Intangible Assets, Net
Definite-lived intangible assets, net consisted of the following: | | | | | | | | As of December 31, |
| | As of December 31, | | 2022 | | 2021 |
| | 2019 | | 2018 | |
| Gross Carrying Amount | | | | |
| Gross carrying amount | | Gross carrying amount | | | |
| Customer contracts | $ | 7,904 |
| | $ | 7,818 |
| Customer contracts | $ | 8,288 | | | $ | 8,459 | |
| Customer relationships | 12,749 |
| | 12,082 |
| Customer relationships | 17,755 | | | 18,723 | |
| Non-compete agreements | 3,037 |
| | 3,013 |
| Non-compete agreements | 2,980 | | | 3,054 | |
| Technology | 2,732 |
| | 2,710 |
| Technology | 2,713 | | | 2,745 | |
| Trade names | 544 |
| | 541 |
| |
| | 26,966 |
| | 26,164 |
| |
| Tradenames | | Tradenames | 541 | | | 545 | |
| Total gross carrying amount | | Total gross carrying amount | 32,277 | | | 33,526 | |
| Accumulated Amortization | | | | Accumulated Amortization | | | |
| Customer contracts | 7,844 |
| | 7,668 |
| Customer contracts | 8,288 | | | 7,961 | |
| Customer relationships | 11,236 |
| | 10,302 |
| Customer relationships | 13,066 | | | 12,268 | |
| Non-compete agreements | 3,037 |
| | 3,013 |
| Non-compete agreements | 2,980 | | | 3,054 | |
| Technology | 2,704 |
| | 2,651 |
| Technology | 2,713 | | | 2,744 | |
| Trade names | 531 |
| | 526 |
| |
| | 25,352 |
| | 24,160 |
| |
| Tradenames | | Tradenames | 537 | | | 538 | |
| Total accumulated amortization | | Total accumulated amortization | 27,584 | | | 26,565 | |
| Intangible assets, net | $ | 1,614 |
| | $ | 2,004 |
| Intangible assets, net | $ | 4,693 | | | $ | 6,961 | |
Amortization expense related to customer contracts is included in cost of revenues in the consolidated statements of income. Amortization expense related to customer relationships, non-compete agreements, technology and trade names is included in selling, general and administrative expenses in the consolidated statements of income.
Customer contracts are amortized ratably over the period of the acquired customer contracts ranging in periods from approximately one to eight years. All other intangible assets are amortized over periods ranging from approximately four to fifteen years, as defined by the nature of the respective intangible asset.
Separable intangible assets that are not deemed to have indefinite lives are amortized over their useful lives. The CompanyWe annually assessesassess whether a change in the useful life over which the Company’s assets are amortized is necessary, or more frequently if events or circumstances warrant. No changes to useful lives were made during the years ended December 31, 2019, 20182022, 2021, and 2017.2020.
The table below sets forth amortization expense:
Amortization expense for the years ended December 31, 2019, 2018 and 2017 is as follows: | | | | | | | | | | | | | | | | | | | | | | | |
| | | Year Ended December 31, |
| Location | | 2022 | | 2021 | | 2020 |
| Customer contracts | Cost of revenues | | $ | 551 | | | $ | — | | | $ | 59 | |
| Customer relationships | Selling, general and administrative expenses | | 1,303 | | | 310 | | | 604 | |
| Non-compete agreements | Selling, general and administrative expenses | | — | | | — | | | — | |
| Technology | Selling, general and administrative expenses | | 1 | | | 8 | | | 19 | |
| Tradenames | Selling, general and administrative expenses | | 3 | | | 3 | | | 3 | |
| Total amortization expense | | $ | 1,858 | | | $ | 321 | | | $ | 685 | |
|
| | | | | | | | | | | |
| | Year Ended December 31, |
| | 2019 | | 2018 | | 2017 |
| Customer contracts | $ | 90 |
| | $ | 30 |
| | $ | 31 |
|
| Customer relationships | 806 |
| | 973 |
| | 1,244 |
|
| Non-compete agreements | 1 |
| | 3 |
| | 42 |
|
| Technology | 12 |
| | 47 |
| | 128 |
|
| Trade names | — |
| | 4 |
| | 6 |
|
| Total intangible amortization expense | $ | 909 |
| | $ | 1,057 |
| | $ | 1,451 |
|
Amortization expense for the intangible assets related to customer contracts for the next five succeeding fiscal years is immaterial. Amortization expense for the intangible assets related to customer relationships, non-compete agreements, technology and trade names for the next five succeeding fiscal years is as follows:
AMERESCO, INC.
NOTES TO CONSOLIDATED FINANCIAL STATEMENTS - (Continued)
(inIn thousands, except per share amounts)
|
| | | |
| | Estimated Amortization |
| | Included in Selling, General and Administrative Expenses |
| 2020 | 628 |
|
| 2021 | 318 |
|
| 2022 | 140 |
|
| 2023 | 129 |
|
| 2024 | 127 |
|
| Thereafter | 212 |
|
| | $ | 1,554 |
|
6. PROPERTY AND EQUIPMENT
Property and equipment consists of the following:
|
| | | | | | | |
| | December 31, |
| | 2019 | | 2018 |
| Furniture and office equipment | $ | 6,108 |
|
| $ | 6,118 |
|
| Computer equipment and software costs | 27,380 |
|
| 23,781 |
|
| Leasehold improvements | 4,062 |
|
| 3,990 |
|
| Automobiles | 1,995 |
|
| 1,373 |
|
| Land | 2,991 |
| | 1,454 |
|
| Property and equipment, gross | 42,536 |
|
| 36,716 |
|
| Less - accumulated depreciation | (32,432 | ) |
| (29,731 | ) |
| Property and equipment, net | $ | 10,104 |
|
| $ | 6,985 |
|
DepreciationAmortization expense on property and equipmentfor our definite-lived intangible assets for the next five years ended December 31, 2019, 2018 and 2017 was $2,987, $2,167 and $2,394, respectively, and isto be included in cost of revenues or selling, general, and administrative expenses inis as follows:
| | | | | | | | | |
| | | Estimated Amortization Expense |
| 2023 | | | $ | 1,303 | |
| 2024 | | | 1,298 | |
| 2025 | | | 1,296 | |
| 2026 | | | 796 | |
| | | |
| | | |
| Total | | | $ | 4,693 | |
6. PROPERTY AND EQUIPMENT, NET
Property and equipment, net consisted of the accompanying consolidated statements of income.
AMERESCO, INC.NOTES TO CONSOLIDATED FINANCIAL STATEMENTS - (Continued) | | | | | | | | | | | |
| December 31, |
| | 2022 | | 2021 |
| Furniture and office equipment | $ | 3,023 | | | $ | 3,008 | |
| Computer equipment and software costs | 22,179 | | | 17,593 | |
| Leasehold improvements | 2,483 | | | 2,472 | |
| Automobiles | 1,896 | | | 1,419 | |
| Land | 6,781 | | | 6,781 | |
| Property and equipment, gross | 36,362 | | | 31,273 | |
| Less: accumulated depreciation | (20,655) | | | (18,156) | |
| Property and equipment, net | $ | 15,707 | | | $ | 13,117 | |
(in thousands, except per share amounts)The following table sets forth our depreciation expense on property and equipment:
| | | | | | | | | | | | | | | | | |
| Year Ended December 31, |
| Location | 2022 | | 2021 | | 2020 |
| Selling, general & administrative expenses | $ | 2,665 | | | $ | 3,143 | | | $ | 3,317 | |
7. ENERGY ASSETS, NET
Energy assets, consistnet consisted of the following:
|
| | | | | | | |
| | December 31, |
| | 2019 | | 2018 |
| Energy assets | $ | 767,331 |
| | $ | 619,707 |
|
| Less - accumulated depreciation and amortization | (187,870 | ) |
| (159,756 | ) |
| Energy assets, net | $ | 579,461 |
|
| $ | 459,951 |
|
| | | | | | | | | | | |
| December 31, |
| | 2022 | | 2021 |
Energy assets (1) | $ | 1,493,913 | | | $ | 1,120,712 | |
| Less: accumulated depreciation and amortization | (312,388) | | | (264,181) | |
| Energy assets, net | $ | 1,181,525 | | | $ | 856,531 | |
| | | |
| (1) Includes financing lease assets (see Note 8), capitalized interest and ARO assets (see tables below). |
Included in energy assets are financing lease assets and accumulatedThe following table sets forth our depreciation of financing lease assets. Financing lease assets consist of the following:
|
| | | | | | | |
| | December 31, |
| | 2019 | | 2018 |
| Financing lease assets | $ | 42,402 |
|
| $ | 42,402 |
|
| Less - accumulated depreciation and amortization | (6,268 | ) |
| (4,139 | ) |
| Financing lease assets, net | $ | 36,134 |
|
| $ | 38,263 |
|
Depreciation and amortization expense on the above energy assets, net of deferred grant amortization, for the years ended December 31, 2019, 2018 and 2017 was $35,543, $27,305 and $21,648, respectively, and is included in costamortization:
| | | | | | | | | | | | | | | | | |
| Year Ended December 31, |
| Location | 2022 | | 2021 | | 2020 |
Cost of revenues (1) | $ | 49,755 | | | $ | 43,113 | | | $ | 38,039 | |
| | | | | |
| (1) Includes depreciation and amortization expense on financing lease assets. See Note 8. |
AMERESCO, INC.
NOTES TO CONSOLIDATED FINANCIAL STATEMENTS
(In thousands, except per share amounts)
The Company capitalizesfollowing table presents the interest costs relating to construction financing during the period of construction. Capitalized interest isconstruction, which were capitalized as part of energy assets, net:
| | | | | | | | | | | | | | | | | |
| Year Ended December 31, |
| 2022 | | 2021 | | 2020 |
| Capitalized interest | $ | 13,050 | | | $ | 2,814 | | | $ | 4,341 | |
During September 2021, there was a triggering event which caused us to perform an impairment analysis on an energy asset group within the Alternative Fuels segment. This triggering event was related to a decision by the applicable state environmental agency to discontinue an environmental permit. This action materially modified the obligation of the landfill owner to continue maintaining the wellfield, therefore, we plan to decommission the impacted landfill gas plant. As a result, we recorded an impairment charge of $1,901, which fully impaired this asset group.
During August 2020, we performed an engine overhaul on one of our energy assets, however, the engine consistently failed to achieve emissions compliance and we considered the engine unsalvageable. As a result of this event, we performed an impairment analysis on this energy asset group within the Alternative Fuels segment and recorded an impairment charge of $1,028, which fully impaired this asset group.
The impairment charges are included in energy assets, net inselling, general, and administrative expenses within the Company’s consolidated balance sheets. Capitalized interest is amortized to cost of revenues in the Company’s consolidated statements of income on a straight line basis over the useful life of the associated energy asset. There was $2,966 and $3,817 of interest capitalized for the twelve monthsyears ended December 31, 20192021 and 2018, respectively.2020.
AsWe assessed the impact that the supply chain challenges, development of the COVID-19 pandemic, war in Ukraine, evolving relations between the U.S. and China, and other geopolitical tensions has or is expected to have on the business, and concluded that it was not a triggering event for impairment purposes and there was no indication of impairment of long-lived assets, except as indicated above, for the years ended December 31, 20192022 and 2018, there are three ESPC2021.
We include certain customer energy asset projects which are included withinin our energy assets, net on the Company’s consolidated balance sheets. The Company controlsas we control and operatesoperate the assets as well as obtainsobtain financing during the construction periodand operating periods of the assets. As the Company hasWe also carry a liability associated with these energy assets as we have an obligation to the customer for performance of the asset, the Company records a liability associated with these energy assets, although,asset. Provided that performance criteria is met, the customer is responsible for paymentsrepayment of the liability to the lender based on the energy asset’s production.financing party. As of December 31, 20192022 there were five energy asset projects which were included in energy assets and 2018, theas of December 31, 2021, there were four.
The liabilities recognized in association with these customer energy assets were $10,243 and $9,863, respectively, of which $827 and $354, respectively, has been classified as the current portion and is included in accrued expenses and other current liabilities and the remainder is included in other liabilities in the accompanying consolidated balance sheets.follows:
For the year ended December 31, 2019, in | | | | | | | | | | | |
| December 31, |
| Location | 2022 | | 2021 |
| Accrued expenses and other current liabilities | $ | 261 | | | $ | 245 | |
| Other liabilities | 27,168 | | | 12,827 | |
| Total customer energy asset projects liability | $ | 27,429 | | | $ | 13,072 | |
In order to expand itsour portfolio of energy assets, the Companywe have acquired nine energy projects, which did not constitute businesses under the new guidance. The Companyguidance discussed in Note 2.
We acquired and closed on nine solar projects from two developers for a total purchase price of $8,519. The purchase price included deferred consideration of $6,059, included in accrued expenses and other current liabilities on the accompanying consolidated balance sheets, will be paid upon final completion of the respective projects throughout 2020. As of December 31, 2019, the Company has paid $2,460 to the developers of the projects. The Company also has a definitive agreement to purchase an additional ten solar projects from a developer for a total purchase price of $13,902, of which, the Company has paid $366 to the developers of the projects.following energy projects:
For the year ended December 31, 2018, in order to expand its portfolio of energy assets, the Company acquired and closed on twelve solar projects from two developers for a total purchase price of $72,921. The purchase price included deferred consideration of $5,437 that will be paid upon final completion of the respective projects and throughout 2019. As of December 31, 2018, the Company has paid $62,116 to the developers of the projects. As of December 31, 2019, deferred purchase price consideration of $1,178, included in accrued expenses and other current liabilities on the accompanying consolidated balance sheets, remains outstanding on the projects previously closed in 2018. | | | | | | | | | | | |
| December 31, |
| 2022 | | 2021 |
| Number of projects | 2 | | 1 |
| | | |
Purchase price (1) | $ | 11,022 | | | $ | 3,461 | |
| | | |
| | | |
Remaining deferred purchase consideration on previously closed projects (1) | $ | — | | | $ | 303 | |
| | | |
| (1) In 2021 amounts were included in accrued expenses and other current liabilities. |
As of December 31, 2019, the Company had $852 inOur ARO assets recorded in project assets, net of accumulated depreciation, and $941 in ARO liabilities recorded in accrued expenses and other current liabilities and other liabilities. During
AMERESCO, INC.
NOTES TO CONSOLIDATED FINANCIAL STATEMENTS - (Continued)
(in thousands, except per share amounts)
the year end December 31, 2019, the Company recorded $45 of depreciation expense related to the ARO assets and $44 in accretion expense to the ARO liability, which is reflected in the accretion of ARO and contingent consideration on the consolidated statements of cash flows. As of December 31, 2018, the Company had $897 in ARO assets recorded in project assets, net of accumulated depreciation, and $897 in ARO liabilities recorded in accrued expenses and other current liabilities and other liabilities. During the year end December 31, 2018, the Company recorded $0 of depreciation expense related to the ARO assets and $0 in accretion expense to the ARO liability. The Company’s current ARO liabilities relate to the removal of equipment and pipelines at certain renewable gas projects and obligations related to the decommissioning of certain solar facilities.
AMERESCO, INC.
NOTES TO CONSOLIDATED FINANCIAL STATEMENTS - (Continued)
(inIn thousands, except per share amounts)
The following tables sets forth information related to our ARO assets and ARO liabilities:
| | | | | | | | | | | | | | |
| | December 31, |
| Location | 2022 | | 2021 |
| ARO assets, net | Energy assets, net | $ | 2,359 | | | $ | 1,939 | |
| | | | |
| ARO liabilities, current | Accrued expenses and other current liabilities | $ | — | | | $ | 6 | |
| ARO liabilities, non-current | Other liabilities | 3,052 | | | 2,342 | |
| | $ | 3,052 | | | $ | 2,348 | |
| | | | | | | | | | | | | | | | | |
| Year Ended December 31, |
| 2022 | | 2021 | | 2020 |
| Depreciation expense of ARO assets | $ | 146 | | | $ | 113 | | | $ | 78 | |
| Accretion expense of ARO liabilities | $ | 146 | | | $ | 123 | | | $ | 93 | |
8. LEASES
On January 1, 2019, the Company adopted Topic 842, using the modified retrospective approach. The Company elected the package of practical expedients available in the standard and as a result, did not reassess the lease classification of existing contracts or leases or the initial direct costs associated with existing leases. The Company has also elected the practical expedient to not separate lease components and non-lease components and will account for the leases as a single lease component for all classes of leases.
As a result of the adoption of Topic 842, the Company recognized an increase in lease ROU assets of $31,639, current portions of operating lease ROU liabilities of $5,084 and an increase to long-term portions of operating lease liabilities of $28,480, as of January 1, 2019. There was no net impact to the consolidated statements of income or retained earnings for the adoption of Topic 842. No impairment was recognized on the ROU asset upon adoption. The adoption adjustments for the Company’s outstanding operating and financing leases are detailed as follows:
|
| | | | | | | | | | | |
| | As of January 1, 2019 |
| | As Reported | | 842 Adjustment | | Adjusted Balances |
| Operating Leases: | | | | | |
| Operating lease assets | $ | — |
| | $ | 31,639 |
| | $ | 31,639 |
|
| Current portions of operating lease liabilities | — |
| | 5,084 |
| | 5,084 |
|
| Long-term portions of operating lease liabilities | — |
| | 28,480 |
| | 28,480 |
|
| Total operating lease liabilities | $ | — |
| | $ | 33,564 |
| | $ | 33,564 |
|
| Weighted-average remaining lease term | | | | | 10 years |
|
| Weighted-average discount rate | | | | | 6.0 | % |
| | | | | | |
| Financing Leases: | | | | | |
| Energy assets, net | $ | 38,263 |
| | $ | — |
| | $ | 38,263 |
|
| Current portions of financing lease liabilities | 4,956 |
| | — |
| | 4,956 |
|
| Long-term financing lease liabilities, less current portions and net of deferred financing fees | 28,407 |
| | — |
| | 28,407 |
|
| Total financing lease liabilities | $ | 33,363 |
| | $ | — |
| | $ | 33,363 |
|
| Weighted-average remaining lease term | | | | | 18 years |
|
| Weighted-average discount rate | | | | | 11.7 | % |
The Company entersWe enter into a variety of operating lease agreements through the normal course of its business including certain administrative offices. The leases are long-term, non-concealablenon-cancelable real estate lease agreements, expiring at various dates through fiscal 2028.2032. The agreements generally provide for fixed minimum rental payments and the payment of utilities, real estate taxes, insurance, and repairs. The CompanyWe also leaseslease vehicles, IT equipment and certain land parcels related to our energy projects, expiring at various dates through fiscal 2045.2050. The office and land leases make up a significant portion of the Company’sour operating lease activity. Many of these leases have one or more renewal options that allow the Company,us, at it’sour discretion, to renew the lease for six months to seven years. Only renewal options that the Companywe believed were likely to be exercised were included in our lease calculations. Many land leases include minimum lease payments that commence or increase when the related project becomes operational. In these cases, we estimated the commercial operation date was estimated by the Company and used to calculate the estimatedROU asset and minimum lease payments. Rent and related expenses for the years ended December 31, 2019, 2018 and 2017 was $8,179, $6,463 and $6,362, respectively.
The Company also enters into leases for IT equipment and service agreements, automobiles, and other leases related to our construction projects such as equipment, mobile trailers and other temporary structures. The Company utilizes the portfolio approach for this class of lease. These leases are either short-term in nature or immaterial.
A portion of the Company’sour real estate leases are generally subject to annual changes in the Consumer Price Index (“CPI”). The CompanyWe utilized each lease’s minimum lease payments to calculate the lease balances upon transition. The subsequent
AMERESCO, INC.
NOTES TO CONSOLIDATED FINANCIAL STATEMENTS - (Continued)
(in thousands, except per share amounts)
increases in rent based on changes in CPI were excluded and will be excluded for future leases from the calculation of the lease balances, but will be recorded to the consolidated statementstatements of income as part of our operating lease costs.
The Company has elected the practical expedient to not separate lease and non-lease components for existing leases for real estate and land leases. The Company has historical leases under ASC 840, Leases, which may have lease and non-lease components. Upon adoption of Topic 842, the Company has elected to continue to account for these historical leases as a single component, as permitted by Topic 842. As of January 1, 2019, as it relates to all prospective leases, the Company will allocate consideration to lease and non-lease components based on pricing information in the respective lease agreement, or, if this information is not available, the Company will make a good faith estimate based on the available pricing information at the time of the lease agreement.
The discount rate was calculated using an incremental borrowing rate based on financing rates on secured comparable notes with comparable terms and a synthetic credit rating calculated by a third party. The CompanyWe elected to apply the discount rate using the remaining lease term at the date of adoption.
The Company hasWe also enter into leases for service agreements and other leases related to our construction projects such as equipment, mobile trailers, and other temporary structures. We utilize the portfolio approach for this class of lease, which are either short-term leases or are not material.
Rent and related expenses were as follows:
| | | | | | | | | | | | | | | | | |
| Year Ended December 31, |
| 2022 | | 2021 | | 2020 |
| Rent and related expenses | $ | 9,199 | | | $ | 9,740 | | | $ | 8,891 | |
We have a number of leases that are classified as financing leases, which relaterelated to transactions that arewere considered sale-leasebacks under ASC 840. See the sale-leaseback section below for additional information on the Company’sour financing leases.
AMERESCO, INC.
NOTES TO CONSOLIDATED FINANCIAL STATEMENTS
(In thousands, except per share amounts)
The table below sets forth supplemental balance sheet information related to leases at December 31, 2019 is as follows:leases:
| | | | | | December 31, |
| | December 31, 2019 | | 2022 | | 2021 |
| Operating Leases: | | |
| Operating Leases | | Operating Leases | | | |
Operating lease assets
| $ | 32,791 |
| Operating lease assets | $ | 38,224 | | | $ | 41,982 | |
| Current operating lease liabilities | 5,802 |
| |
| Long-term portions of operating lease liabilities | 29,101 |
| |
| Total operating lease liabilities | $ | 34,903 |
| |
| | Current portion of operating lease liabilities | | Current portion of operating lease liabilities | $ | 5,829 | | | $ | 6,276 | |
| Long-term operating lease liabilities, net of current portion | | Long-term operating lease liabilities, net of current portion | 31,703 | | | 35,135 | |
| Total Operating lease liabilities | | Total Operating lease liabilities | $ | 37,532 | | | $ | 41,411 | |
| Weighted-average remaining lease term | 11 years |
| Weighted-average remaining lease term | 13 years | | 12 years |
| Weighted-average discount rate | 6.3 | % | Weighted-average discount rate | 6.0 | % | | 5.7 | % |
| | | |
| Financing Leases: | | |
Financing Leases (1) | | Financing Leases (1) | |
| Energy assets, net | $ | 36,134 |
| Energy assets, net | $ | 29,365 | | | $ | 31,876 | |
| | Current portions of financing lease liabilities | 4,997 |
| Current portions of financing lease liabilities | $ | 1,992 | | | $ | 3,125 | |
| Long-term financing lease liabilities, less current portions and net of deferred financing fees | 23,500 |
| |
| Long-term financing lease liabilities, net of current portion, unamortized discount and debt issuance costs | | Long-term financing lease liabilities, net of current portion, unamortized discount and debt issuance costs | 14,068 | | | 16,101 | |
| Total financing lease liabilities | $ | 28,497 |
| Total financing lease liabilities | $ | 16,060 | | | $ | 19,226 | |
| Weighted-average remaining lease term | 17 years |
| Weighted-average remaining lease term | 14 years | | 15 years |
| Weighted-average discount rate | 11.8 | % | Weighted-average discount rate | 12.1 | % | | 12.1 | % |
| | (1) Includes sale-leaseback transactions entered into prior to January 1, 2019. | | (1) Includes sale-leaseback transactions entered into prior to January 1, 2019. |
The costs related to our leases arewere as follows:
| | | | | | | | | | | | | | | | | |
| Year Ended December 31, |
| 2022 | | 2021 | | 2020 |
| Operating Leases | | | | | |
| Operating lease costs | $ | 8,372 | | | $ | 8,780 | | | $ | 7,970 | |
| | | | | |
| Financing Leases | | | | | |
| Amortization expense | 2,104 | | | 2,129 | | | 2,129 | |
| Interest on lease liabilities | 2,147 | | | 2,541 | | | 3,019 | |
| Total financing lease costs | 4,251 | | | 4,670 | | | 5,148 | |
| Total lease costs | $ | 12,623 | | | $ | 13,450 | | | $ | 13,118 | |
|
| | | | |
| | | Year ended December 31, 2019 |
| Operating Lease: | | |
| Operating lease costs | | $ | 7,460 |
|
| | | |
| Financing Lease: | | |
| Amortization expense | | 2,129 |
|
| Interest on lease liabilities | | 3,630 |
|
| | | |
| Total lease costs | | $ | 13,219 |
|
Supplemental cash flow information related to our leases was as follows:
| | | | | | | | | | | |
| Year Ended December 31, |
| 2022 | | 2021 |
| Cash paid for amounts included in the measurement of operating lease liabilities | $ | 7,978 | | | $ | 11,385 | |
| Right-of-use assets obtained in exchange for new operating lease liabilities | $ | 4,872 | | | $ | 10,007 | |
| | | |
AMERESCO, INC.
NOTES TO CONSOLIDATED FINANCIAL STATEMENTS - (Continued)
(inIn thousands, except per share amounts)
The Company’stable below sets forth our estimated minimum future lease obligations under our leases:
| | | | | | | | | | | |
| | Operating Leases | | Financing Leases |
| Year ended December 31, | | | |
| 2023 | $ | 7,769 | | | $ | 3,627 | |
| 2024 | 6,585 | | | 2,565 | |
| 2025 | 5,319 | | | 2,213 | |
| 2026 | 3,233 | | | 2,054 | |
| 2027 | 2,631 | | | 1,922 | |
| Thereafter | 29,383 | | | 17,891 | |
| Total minimum lease payments | $ | 54,920 | | | $ | 30,272 | |
| Less: interest | 17,388 | | | 14,212 | |
| Present value of lease liabilities | $ | 37,532 | | | $ | 16,060 | |
We have future lease commitments for four leases, arewhich do not yet meet the criteria for recording ROU assets or ROU liabilities as follows:the leases have not commenced. The net present value of these commitments total $12,560 as of December 31, 2022 which relate to lease payments to be made over a range of five to 20 years.
Non-recourse Sale-leasebacks and Financing Leases |
| | | | | | | |
| | Operating Leases | | Financing Leases |
| Year ended December 31, | |
| | |
| 2020 | $ | 7,768 |
| | $ | 8,078 |
|
| 2021 | 6,340 |
| | 6,775 |
|
| 2022 | 5,775 |
| | 5,173 |
|
| 2023 | 4,486 |
| | 3,686 |
|
| 2024 | 3,668 |
| | 2,585 |
|
| Thereafter | 21,220 |
| | 24,215 |
|
| Total minimum lease payments | $ | 49,257 |
| | $ | 50,512 |
|
| Less: interest | 14,354 |
| | 22,015 |
|
| Present value of lease liabilities | $ | 34,903 |
| | $ | 28,497 |
|
Sale-Leaseback
During the first quarter of 2015, the CompanyWe entered into an agreement with an investor which gives the Company the option to sell and contemporaneously lease backsale-leaseback arrangements for solar PV projects. This agreement expired on June 30, 2018. Additionally,energy assets prior to January 1, 2019, which remain under the Company soldprevious guidance.
The following table presents a summary of amounts related to these sale-leasebacks included in our consolidated balance sheets:
| | | | | | | | | | | | | | | | | | | | | |
| December 31, | | | | | | | | | | |
| 2022 | | 2021 | | | | | | |
| Deferred loss, short-term, net | 115 | | | 115 | | | | | | | | | | | |
| Deferred loss, long-term, net | 1,455 | | | 1,571 | | | | | | | | | | | |
| Total deferred loss | $ | 1,570 | | | $ | 1,686 | | | | | | | | | | | |
| | | | | | | | | | | | | |
| Deferred gain, short-term, net | 345 | | | 345 | | | | | | | | | | | |
| Deferred gain, long-term, net | 4,430 | | | 4,775 | | | | | | | | | | | |
| Total deferred gain | $ | 4,775 | | | $ | 5,120 | | | | | | | | | | | |
Net gains from amortization expense in cost of revenues related to deferred gains and contemporaneously leased back one solar PV project to another investor, not a party tolosses were $383, $230 and $228 for the master lease agreement, under a new agreement during the yearyears ended December 31, 2017. During 2022, 2021, and 2020, respectively.
August 2018 Master Sale-leaseback
We enter into amendments to our August 2018 master lease and participation agreement from to time to time, which may extend the
Company entered into an agreement with an investor which givesmaturity date, increase the
Company the option to sell and contemporaneously lease back solar PV projects through August 2019up to a maximum funding amount of $100,000. During the year ended December 31, 2018, the Company sold and contemporaneously leased back two solar PV projects. See below for a summary of solar PV project sales by fiscal year: |
| | | | | | | | | | | | | | | | | | | | | | | | | | | | |
| Year Ended | | # Solar PV Projects Sold (actual #’s) | | Sale Price | | Deferred Gain Recorded | | Deferred Loss Recorded | | Financing Lease Asset/Liability Recorded | | Initial Lease Term (years) | | Minimum Lease Payment | | Maximum Lease Payment |
| Year-ended December 31, 2017 | | 13 | | $ | 51,204 |
| | $ | 4,625 |
| | $ | 1,204 |
| | $ | 22,934 |
| | 10-20 | | $ | 4 |
| | $ | 510 |
|
| Year-ended December 31, 2018 | | 2 | | $ | 5,145 |
| | $ | 574 |
| | $ | — |
| | $ | 2,625 |
| | 20 | | $ | 3 |
| | $ | 144 |
|
During the year ended December 31, 2019,2022, we entered into amendments to this facility which extended the Company amended the August 2018 agreement with the investorcurrent maturity date to extend the end date of the agreement to November 24, 2019. DuringJune 30, 2023.
We sold and leased back four energy assets for $23,905 in cash proceeds under this facility during the year ended December 31, 2019, the Company sold three projects and in return received $13.7 million. In accordance with Topic 842, Leases, the 2019 transactions were accounted for as failed sales as the Company retains control of the underlying assets.2022. The Company recorded the proceeds received from the transactions as long term financing facilities withagreements have low interest raterates ranging from 0% to 0.28%1.17%, as a result of tax credits which were transferred to the counterparty. As of December 31, 2022, approximately $204,664 remained available under this lending commitment.
December 2020 Master Sale-leaseback
We enter into amendments to our December 2020 master lease and participation agreement from to time to time, which may extend the maturity date, increase the availability, or modify other covenants.
AMERESCO, INC.
NOTES TO CONSOLIDATED FINANCIAL STATEMENTS
(In thousands, except per share amounts)
During the year ended December 31, 2022, we entered into amendments to increase our maximum commitment by $23,559 and the extended the current maturity date to December 31, 2022. We sold and leased back eight energy assets for $18,254 in cash proceeds under this facility during the year ended December 31, 2022. As of December 31, 2022, no funding is available under this lending commitment.
See Note 9 for additional information on these financefinancing facilities. As of December 31, 2019, approximately $81 million remained available under the lending commitment.
In January 2020, the Company amended the August 2018 agreement with the investor to extend the end date of the agreement to November 24, 2020 and increase the maximum funding amount up to $150 million.
AMERESCO, INC.
NOTES TO CONSOLIDATED FINANCIAL STATEMENTS - (Continued)
(inIn thousands, except per share amounts)
9. DEBT AND FINANCING LEASE LIABILITIES
A summaryLong-term debt was comprised of amounts related to sale leasebacks in the Company’s consolidated balance sheets is as follows:following:
| | | | | | | | | | | |
| As of December 31, |
| 2022 | | 2021 |
Senior secured credit facility, 6.58%, due September 2023 to March 2025 (1) (8) | $ | 477,900 | | | $ | 97,813 | |
| | | |
June 2020 construction revolver, 5.68%, due June 2023 (2) (8) | $ | 39,536 | | | $ | 23,935 | |
July 2020 construction revolver, 5.92%, due June 2023 (2) (8) | 5,855 | | | 7,763 | |
| Subtotal non-recourse construction revolvers | $ | 45,391 | | | $ | 31,698 | |
| | | |
| | | |
Variable rate term loan, 7.02%, due June 2024 (2) (3) | $ | 3,403 | | | $ | 4,264 | |
Term loan, 6.11% due June 2028 (5) | 2,348 | | | 2,933 | |
Variable rate term loan, 7.02%, due May 2025 (4) | 37,204 | | | 38,844 | |
Variable rate term loan, 7.52%, due March 2023 (4) | 14,084 | | | 14,442 | |
Term loan, 4.95%, due July 2031 (4) | 2,588 | | | 3,157 | |
Term loan, 5.00%, due March 2028 (4) | 2,258 | | | 2,688 | |
Term loan, 4.50%, due April 2027 (5) | 1,846 | | | 10,302 | |
Term loan, 5.61%, due February 2034 (4) | 1,437 | | | 2,423 | |
Variable rate term loan, 7.22%, due December 2027 (4) | 7,874 | | | 9,238 | |
Variable rate term loan, due March 2026 (2) (4) | — | | | 38,753 | |
| Fixed rate note, 6.50%, due October 2037 | 92,203 | | | — | |
Term loan, 5.15%, due December 2038 (2) (4) | 23,255 | | | 25,465 | |
Variable rate term loan, 6.82%, due June 2033 (2) (3) | 6,951 | | | 7,657 | |
Variable rate term loan, 6.89%, due October 2029 (2) (5) | 6,977 | | | 7,762 | |
| Fixed rate note, due April 2040 | — | | | 224 | |
Fixed rate note, 3.58%, due December 2027 (4) | 2,425 | | | 3,072 | |
Fixed rate note, 4.92%, due June 2045 (4) | 3,474 | | | 3,776 | |
Fixed rate note, 3.25%, due March 2046 (4) | 37,302 | | | 39,474 | |
Variable rate term loan, 7.27%, due July 2030 (4) (8) | 2,915 | | | 3,662 | |
| Fixed rate note, 5.45%, due March 2046 | 6,859 | | | $ | — | |
| Subtotal non-recourse term loans | $ | 255,403 | | | $ | 218,136 | |
| | | |
August 2018 master sale-leaseback, —% to 1.17% , due July 2039 to July 2047 (3) (6) | $ | 104,011 | | | $ | 99,654 | |
December 2020 master sale-leaseback, —%, due December 2040 to December 2042 (4) (6) | 16,912 | | | 4,961 | |
| Subtotal non-recourse sale-leasebacks | $ | 120,923 | | | $ | 104,615 | |
|
Financing leases (7) | $ | 16,060 | | | $ | 19,226 | |
| | | |
| Total debt and financing leases | $ | 915,677 | | | $ | 471,488 | |
| Less: current maturities | 331,479 | | | 78,934 | |
| Less: unamortized discount and debt issuance costs | 15,563 | | | 15,370 | |
| Long-term debt and financing lease liabilities, net of current portion, unamortized discount and debt issuance costs | $ | 568,635 | | | $ | 377,184 | |
|
| (1) Facility has interest at varying rates monthly in arrears. |
| (2) These agreements have acceleration causes that, in the event of default, as defined, the payee has the option to accelerate payment terms and make the remaining principal and the required interest balance due according to the agreement. |
| (3) Facility is payable in semi-annual installments. |
|
| | | | | | | |
| | December 31, | | December 31, |
| | 2019 | | 2018 |
| Financing lease assets, net | $ | 36,134 |
| | $ | 38,263 |
|
| Deferred loss, short-term, net | 115 |
| | 115 |
|
| Deferred loss, long-term, net | 1,801 |
| | 1,917 |
|
| Total deferred loss | $ | 1,916 |
| | $ | 2,032 |
|
| Financing lease liabilities, short-term | 4,997 |
| | 4,956 |
|
| Financing lease liabilities, long-term | 23,500 |
| | 28,407 |
|
| Total financing lease liabilities | $ | 28,497 |
| | $ | 33,363 |
|
| Deferred gain, short-term, net | 345 |
| | 345 |
|
| Deferred gain, long-term, net | 5,463 |
| | 5,808 |
|
| Total deferred gain | $ | 5,808 |
| | $ | 6,153 |
|
Upon adoption of Topic 842, the Company elected to take the practical expedient and will not reassess lease classifications at adoption. Accordingly, these sales-leasebacks will remain under the previous guidance.
AMERESCO, INC.
NOTES TO CONSOLIDATED FINANCIAL STATEMENTS - (Continued)
(inIn thousands, except per share amounts)
| | | | | | | | | | | |
| (4) Facility is payable in quarterly installments. |
| (5) Facility is payable in monthly installments. |
| (6) These agreements are sale-leaseback arrangements and are accounted for as failed sales under the guidance and are classified as financing liabilities. See Note 8. |
| (7) Financing leases are sale-leaseback arrangements under previous guidance and do not include approximately $14,212 in future interest payments as of December 31, 2022 and $16,272 as of December 31, 2021. See Note 8. |
| (8) These agreements are now using the Secured Overnight Financing Rate (“SOFR”) as the primary reference rate used to calculate interest. See Note 8. |
9. LONG-TERM DEBT
Long-term debt comprisedThe following table presents the following:
|
| | | | | | | | | | | | |
| Commencement Date | Maturity Date | Acceleration Clause(2) | Rate as of December 31, | Balance as of December 31, |
| 2019 | 2019 | | 2018 |
| Senior secured credit facility, interest at varying rates monthly in arrears | June 2015 | June 2024 | NA | 4.270 | % | $ | 112,216 |
| | $ | 43,074 |
|
| Variable rate term loan payable in semi-annual installments | January 2006 | February 2021 | Yes | 4.158 | % | 625 |
| | 936 |
|
| Variable rate term loan payable in semi-annual installments | January 2006 | June 2024 | Yes | 3.908 | % | 6,609 |
| | 7,426 |
|
| Term loan payable in quarterly installments | March 2011 | March 2021 | Yes | 7.250 | % | 831 |
|
| 1,464 |
|
| Term loan payable in monthly installments | October 2011 | June 2028 | NA | 6.110 | % | 3,649 |
|
| 3,843 |
|
| Variable rate term loan payable in quarterly installments | October 2012 | June 2020 | NA | 5.408 | % | 28,217 |
|
| 30,674 |
|
| Variable rate term loan payable in quarterly installments | September 2015 | March 2023 | NA | 4.408 | % | 15,976 |
|
| 17,208 |
|
| Term loan payable in quarterly installments | August 2016 | June 2031 | NA | 4.950 | % | 3,769 |
|
| 3,925 |
|
| Term loan payable in quarterly installments | March 2017 | March 2028 | NA | 5.000 | % | 3,521 |
|
| 3,945 |
|
| Term loan payable in monthly installments | April 2017 | April 2027 | NA | 4.500 | % | 22,553 |
|
| 22,081 |
|
| Term loan payable in quarterly installments | April 2017 | February 2034 | NA | 5.610 | % | 2,706 |
|
| 2,735 |
|
| Variable rate term loan payable in quarterly installments | June 2017 | December 2027 | NA | 4.358 | % | 11,740 |
|
| 12,915 |
|
| Variable rate term loan payable in quarterly installments | February 2018 | August 2022 | Yes | 9.408 | % | 15,645 |
|
| 21,475 |
|
| Term loan payable in quarterly installments | June 2018 | December 2038 | Yes | 5.150 | % | 28,583 |
|
| 30,069 |
|
| Variable rate term loan payable in semi-annual installments | June 2018 | June 2033 | Yes | 3.958 | % | 9,003 |
|
| 9,668 |
|
| Variable rate term loan payable in monthly/quarterly installments | October 2018 | October 2029 | Yes | 4.600 | % | 9,092 |
| | 9,072 |
|
Long term finance liability in semi-annual installments (3) | July 2019 | July 2039 | NA | 0.280 | % | 3,841 |
| | — |
|
Long term finance liability in semi-annual installments (3) | November 2019 | November 2039 | NA | — | % | 8,794 |
| | — |
|
| Term loan payable in quarterly installments | December 2019 | December 2021 | Yes | 6.500 | % | 27,226 |
| | — |
|
Financing leases(1) | | | |
| 28,497 |
|
| 33,363 |
|
| | | | |
| 343,093 |
| | 253,873 |
|
| Less - current maturities | | | |
|
| 69,969 |
| | 26,890 |
|
| Less - deferred financing fees | | | |
|
| 6,943 |
|
| 7,821 |
|
| Long-term debt | | | |
|
| $ | 266,181 |
| | $ | 219,162 |
|
(1)Financing leases do not include approximately $22,015 in future interest payments
(2)These agreements have acceleration causes that, in the event of default, as defined, the payee has the option to accelerate payment terms and make due the remaining principal and the required interest balance according to the agreement
(3) These agreements are sale-leaseback arrangements that provides for the sale of solar PV projects to a third party investor and the simultaneous leaseback of the projects. In accordance with Topic 842, Leases, these transactions are accounted for as a failed sale as the Company retains control of the underlying assets and as such, are classified as financing liabilities. The low interest rates are the results of tax credits which were transferred to the coutnerparty.
AMERESCO, INC.
NOTES TO CONSOLIDATED FINANCIAL STATEMENTS - (Continued)
(in thousands, except per share amounts)
Aggregateaggregate maturities of long-term debt for the years endedand financing leases as of December 31, are as follows:2022:
|
| | | |
| 2020 | $ | 69,969 |
|
| 2021 | 36,930 |
|
| 2022 | 29,940 |
|
| 2023 | 32,719 |
|
| 2024 | 105,732 |
|
| Thereafter | 70,458 |
|
| Debt Discount | (2,655 | ) |
| | $ | 343,093 |
|
| | | | | |
| 2023 | $ | 331,479 | |
| 2024 | 55,717 | |
| 2025 | 332,495 | |
| 2026 | 27,742 | |
| 2027 | 17,253 | |
| Thereafter | 150,991 | |
| |
| Total maturities | $ | 915,677 | |
Senior Secured Credit Facility - Revolver and Term LoanLoans
On June 28, 2019,In March 2022, we entered into a fourththe fifth amended and restated banksenior secured credit facility with three banks. The new credit facility replaces and extends our existing credit facility,five banks, which was scheduledincluded the following amendments:
•increased the aggregate amount of total commitments from $245,000 to expire on June 30, 2020. The amended revolving credit and term loan facility mature on June 28, 2024, when all amounts will be due and payable in full. The Company expects to use the new credit facility for general corporate purposes of the Company and its subsidiaries, including permitted acquisitions, refinancing of existing indebtedness and working capital. The amendment $495,000,
•increased the aggregate amount of the revolving commitments from $85,000$180,000 to $115,000 through an $200,000,
•increased the existing term loan A from $65,000 to $75,000,
•extended the maturity date of the revolving commitment and term loan A from June 28, 2024 maturity date, increased theto March 4, 2025,
•added a delayed draw term loan from $40,000A for up to $65,000 to reduce the outstanding revolving loan balance by the same amount and extend the$220,000 through a September 4, 2023 maturity date, from June 30, 2020 to June 28, 2024, and
•increased the total funded debt to EBITDA covenant ratio from a maximum of 3.003.50 to 3.25.4.50 for the quarter ended March 31, 2022; 4.25 for the quarter ending June 30, 2022, 4.00 for the quarters ending September 30, 2022 and December 31, 2022; and 3.50 thereafter,
•specified the debt service coverage ratio (the ratio of (a) cash flow of the core Ameresco companies, to (b) debt service of the core Ameresco companies as of the end of each fiscal quarter) to be less than 1.5, and
•increased our limit under an energy conversation project financing to $650,000, which provides us with flexibility to grow our federal business further.
We accounted for this amendment as a modification and at closing we incurred $2,048 in lenders fees which were reflected as debt discount and $352 in third party fees which were reflected as debt issuance costs. The total commitment underunamortized debt discount and issuance costs of the previous agreement are being amortized over the remaining term of the amended agreement, with the exception of $96 of costs relating to a previous syndicated lender which did not participate in this amendment. These costs were expensed in other expenses, net during the year ended December 31, 2022.
In June 2022, we entered into the first amendment to the fifth amended and restated senior secured credit facility, (revolving credit, term loanwhich increased the maximum indebtedness incurred under an energy conservation project financing from $650,000 to $725,000 from and swing line) is $185,000.after April 1, 2022, to and including December 30, 2022. As of December 31, 2022, the maximum indebtedness incurred under an energy conservation project financing reverted back to $650,000.
The credit facility consists of a $115,000 revolving credit facility and a $65,000 term loan. The revolving credit facility may be increased by up to an additional $100,000 in increments of at least $25,000 at the Company’s option ifapproval of lenders, are willing to provide such increased commitments, subject to certain conditions. Up to $20,000 of the revolving credit facility may be borrowed in Canadian dollars, Euros, or pounds sterling. The Company isWe are the sole borrower under the credit facility. The obligations under the credit facility are guaranteed by certain of the Company’sour direct and indirect wholly owned domestic subsidiaries and are secured by a pledge of all of the Company’sAmeresco’s and such subsidiary guarantors’ assets, other than the equity interests of certain subsidiaries and assets held in non-core subsidiaries (as defined in the agreement). At December 31, 2019 and 2018, $62,563 and $41,500, excluding debt discounts, was
AMERESCO, INC.
NOTES TO CONSOLIDATED FINANCIAL STATEMENTS
(In thousands, except per share amounts)
The table below sets forth amounts outstanding under the term loan, respectively. Atcredit facility, net of unamortized debt discounts and debt issuance costs:
| | | | | | | | | | | | | | | | | |
| Rate as of December 31, 2022 | | As of December 31, |
| | 2022 | | 2021 |
| Term loan A | 6.13 | % | | $ | 75,000 | | | $ | 52,720 | |
| Delayed draw term loan | 6.09 | % | | $ | 220,000 | | | $ | — | |
| Revolving credit facility | 7.35 | % | | $ | 182,900 | | | $ | 44,681 | |
Total senior secured credit facility outstanding (1) | | | $ | 477,900 | | | $ | 97,401 | |
| | | | | |
| (1) Net of unamortized debt discount and debt issuance costs of $1,562 in 2022 and $412 in 2021. |
As of December 31, 2019 and 2018, $50,073 and $1,696, excluding debt discounts, was outstanding under the revolving credit facility, respectively. At December 31, 20192022, funds of $29,144$345 were available for borrowing under the revolving credit facility. At December 31, 2019, the Companyfacility and we had $13,090$16,755 in letters of credit outstanding. We expect to use the remaining funds available under the credit facility for general corporate purposes, including permitted acquisitions, refinancing of existing indebtedness and working capital.
The interest rate for borrowings under the credit facility is based on (i) each term loan shall bear interest at the Company’s option, either (1) aterm SOFR for such interest period plus the applicable rate for such facility; (ii) each base rate loan shall bear interest at a rate per annum equal to a margin of 0.5% or 0.25%, depending on the Company’s ratio of total funded debt to EBITDA (as defined in the agreement), over the highest of (a) the federal funds effectivebase rate plus 0.50% , (b) Bank of America’s primethe applicable rate; (iii) each alternative currency daily rate and (c)loan shall bear at a rate based onper annum equal to the London interbank depositalternative currency daily rate (“LIBOR”) plus 1.50%, or (2) the one-, two- three- or six-month LIBOR plusapplicable rate; (iv) each alternative currency term rate loan shall bear interest at a margin of 2.00% or 1.75%, depending onrate per annum equal to the Company’s ratio of total funded debt to EBITDA, as defined. A commitment fee of 0.375% is payable quarterly on the undrawn portion of the revolving credit facility. At December 31, 2019, the interestalternative currency term rate for borrowings undersuch interest period plus the revolving credit facility was 4.70%applicable rate; and (v) each swingline loan shall bear interest at a rate per annum equal to the weighted average interestbase rate for borrowings underplus the term loan was 3.99%.applicable rate.
The revolving credit facility does not require amortization of principal. The term loan requires quarterly principal payments of $1,219,$1,250 beginning in the first quarter of 2024, with the balance due at maturity. All borrowings may be paid before maturity in whole or in part at the Company’sour option without penalty or premium, other than reimbursement of any breakage and deployment costs in the case of LIBOR borrowings.
The credit facility limits the Company’sAmeresco’s and itsour subsidiaries’ ability to, among other things: incur additional indebtedness; incur liens or guarantee obligations; merge, liquidate or dispose of assets; make acquisitions or other investments; enter into
AMERESCO, INC.
NOTES TO CONSOLIDATED FINANCIAL STATEMENTS - (Continued)
(in thousands, except per share amounts)
hedging agreements; pay dividends and make other distributions and engage in transactions with affiliates, except in the ordinary course of business on an arms’ length basis.
Under the credit facility, the CompanyAmeresco and itsour core domestic subsidiaries may not invest cash or property in, or loan to, the Company’sour non-core subsidiaries in aggregate amounts exceeding 49% of the Company’sour consolidated stockholders’ equity. In addition, under the credit facility, the Companywe and itsour core subsidiaries must maintain the following financial covenants:
|
| | | |
| • | | a ratio of total funded debt to EBITDA, as defined, of less than 3.25 to 1.0 as of the end of each fiscal quarter ending June 28, 2024a ratio of total funded debt to EBITDA as noted above, and thereafter; and |
| • | | a debt service coverage ratio (as defined in the agreement) of at least 1.5 to 1.0. |
Any failure to comply with the financial or other covenants of the credit facility would not only prevent the Companyus from being able to borrow additional funds, but would constitute a default, permitting the lenders to, among other things, accelerate the amounts outstanding, including all accrued interest and unpaid fees, under the credit facility, to terminate the credit facility, and enforce liens against the collateral.
The credit facility also includes several other customary events of default, including a change in control of the Company,Ameresco, permitting the lenders to accelerate the indebtedness, terminate the credit facility, and enforce liens against the collateral.
For purposes of the Company’sour senior secured facility:facility, EBITDA, as defined, excludes the results of certain renewable energy projects that the Company ownswe own and for which financing from others remains outstanding; total funded debt, as defined, includes amounts outstanding under both the term loan and revolver portions of the senior secured credit facility plus other indebtedness, but excludes non-recourse indebtedness of project company subsidiaries; and debt service, as defined, includes principal and interest payments on the indebtedness included in total funded debt other than principal payments on the revolver portion of the facility.
At DecemberNon-recourse Fixed Rate Note, 6.50%, due October 2037
In October 2022, one of our subsidiaries entered into a loan agreement with a new lender under a non-recourse credit facility, refinancing a previous non-recourse credit facility originally signed on October 23, 2020, which was scheduled to expire March 31, 20192026.
AMERESCO, INC.
NOTES TO CONSOLIDATED FINANCIAL STATEMENTS
(In thousands, except per share amounts)
The new loan is scheduled to mature on October 26, 2037, provides a principal amount of up to $125,000 and bears interest at a rate of 6.50% with a residual percentage of distributable cash flows payable after the maturity date of the loan, until the earlier of the lender achieving an 8.25% “IRR” on funds of $29,144 are available for borrowingborrowed under the revolving credit facility.
July 2019 Long Term Finance Liability
In July 2019,facility, or the Company closedfacility discharge date on one solar PV project under the Company’s master lease agreement, as discussed in Note 8, with a twenty-year term. In accordance with Topic 842, Leases, this transaction was accounted for as a failed sale as the Company retains control of the underlying assets. The proceeds received from the transaction were recorded by the Company as a long term financing facility with an interest rate of 0.28%, as a result of tax credits which were transferred to the counterparty.October 26, 2047. The principal and interest payments are due in semi annualquarterly installments based on an 5-year amortization schedule with the principal payments being adjusted based on the distributable cash flows from the three renewable natural gas projects owned and operated by the project companies. No up-front, commitment or structuring fees were payable on the credit facility. The obligations under the loan are guaranteed by all the related subsidiaries and are secured by the subsidiaries’ assets as well as our equity interest in the signing subsidiary. Borrowings under the credit facility are otherwise non-recourse to Ameresco.
At the closing, we drew down $80,000 under this facility, approximately $26,530 of which was used to repay all amounts outstanding under the prior loan and the longremainder was used to terminate swap obligations, pay transaction costs, make permitted distributions to Ameresco and for the project companies’ working capital needs. Unamortized debt discount fees of $528 and debt issuance costs of $35 related to the prior loan were expensed in other expenses, net during the year ended December 31, 2022. In addition, we terminated an interest rate swap and a commodity swap related to the prior loan before their maturity dates. These swap terminations resulted in a settlement gain on undesignated derivatives of $694.
The new facility allows two additional draws, subject to certain conditions, up to the remaining principal amount, to be used to make distributions to Ameresco. On December 21, 2022, we drew down an additional $15,000 under this facility. As of December 31, 2022, $91,698 was outstanding under this facility, net of unamortized debt discount and issuance costs of $505.
Non-recourse Fixed Rate Note, 3.25%, due March 2046, Variable Rate Term Loan, 7.27%, due July 2030, and Fixed Rate Note, 5.45%, due March 31, 2042
In July 2021, we entered into a $44,748 non-recourse debt agreement with a group of lenders. The financing facility consists of gross proceeds of $40,683 in senior secured first lien term financenotes due March 2046 (“Senior Notes”), gross proceeds of $4,065 in floating rate senior secured second lien term notes due July 2030 (“Second Lien Notes”), and a shelf facility maturesof up to $60,000 available until July 2024. The lenders, in their sole discretion, have the right to approve or deny our funding requests.
In June 2022, two senior secured notes (“Shelf Notes”) due March 31, 2042 were issued under our shelf facility, with gross proceeds of $7,113. The Shelf Notes bear interest at a fixed rate of 5.45% per annum and are payable quarterly commencing September 30, 2022.
The Senior Notes bear interest at a fixed rate of 3.25% per annum, are payable quarterly commencing September 30, 2021, and require that the project’s debt service coverage ratio for both the historical 12-month and projected 12-month periods at each payment date equal or exceed 1.2 to 1.0.
The Second Lien Notes bear a floating rate equal to the applicable SOFR plus 3.50% from July 27, 2021 to July 26, 2025 and on July 16, 2039,27, 2025 the rate increases to the applicable SOFR plus 3.75%. The Second Lien Notes are payable on each quarterly payment date commencing September 30, 2021, as specified in the debt agreement.
The agreement also requires us to maintain six months of scheduled payments of principal and interest as the minimum debt service reserve and to make additional principal prepayments based on project cash flows and certain other conditions through the earlier of maturity or when the principal balance is paid in full.
At closing, we incurred $103 in lender fees and debt issuance costs on the Shelf Notes. In connection with allthe Senior Notes, we recorded a derivative instrument for make-whole provisions with an initial value of $1,088, which was recorded as a debt discount. See Note 19 for additional information. The aggregate balance of the Senior Notes, and Second Lien Notes as of December 31, 2022 was $40,645, net of unamortized debt discount and issuance costs.
Non-recourse Construction Revolvers
June 2020 Construction Revolver, 5.68%, due June 2023
In June 2020, we entered into a revolving credit agreement with a bank, with an aggregate borrowing capacity of $100,000 for use in financing the construction cost of our owned projects.
We enter into amendments to our June 2020 construction revolver from to time to time, which may extend the maturity date, increase the availability, or modify other covenants.
AMERESCO, INC.
NOTES TO CONSOLIDATED FINANCIAL STATEMENTS
(In thousands, except per share amounts)
During the year ended December 31, 2022, we entered into amendments to extend this revolver and the current maturity date is June 2023. All remaining unpaid amounts outstanding under the agreementfacility are due at that time. AtIn December 31, 2019, $3,841 was outstanding under2022, we entered into an amended and restated master construction loan agreement. which modified the long term finance liability.
November 2019 Long Term Finance Liability
In November 2019, the Company closed on two solar PV projects under the Company’s master lease agreement, as discussed in Note 8, with a twenty-year term. In accordance with Topic 842, Leases, this transaction was accounted for as a failed sale as the Company retains control of the underlying assets. The proceeds receivedreference rate from the transaction were recorded by the Company as a long term financing facility with an interest rate of 0.00%,LIBOR to SOFR as a result of tax creditsthe expected cessation of LIBOR. Per the amendment, this instrument will bear interest at the applicable term SOFR rate plus an applicable margin of 1.61%.
During the year ended December 31, 2022, we drew down $29,204 under this revolver. As of December 31, 2022, $39,536 was outstanding and $60,464 was available for borrowing.
July 2020 Construction Revolver, 5.92%, due June 2023
We enter into amendments to our July 2020 construction revolver from to time to time, which were transferredmay extend the maturity date, increase the availability, or modify other covenants.
During the year ended December 31, 2022, we entered into amendments to the counterparty. The principal and interest payments are due in semi annual installmentsextend this revolver and the long term finance facility maturescurrent maturity date is January 31, 2023. In January 2023, we signed an amendment which extended the maturity dates on November 8, 2039, with all remaining unpaid amounts outstanding undertwo projects to June 2023, extended the agreement due at that time. At December 31, 2019, $8,794 was outstanding undermaturity date of the long term finance liability.
December 2019 Term Loan
In December 2019, the Company entered into a loan agreement at a fixed rate of 6.5% for gross proceeds of $27,473, for use in providing non-recourse financing for purchase of solar PV modules. Principaluntil July 2023, and interest amounts are due in quarterly installments beginning in March 2020. The termreduced the revolving loan matures on December 31, 2021. At December 31, 2019, $26,970 was outstanding under the term loan, net of debt discounts and deferred financing fees.
AMERESCO, INC.
NOTES TO CONSOLIDATED FINANCIAL STATEMENTS - (Continued)
(in thousands, except per share amounts)
10. INCOME TAXES
The following table sets forth components of income before income taxes are as follows:taxes:
| | | | | | | | | | | | | | | | | |
| Year Ended December 31, |
| | 2022 | | 2021 | | 2020 |
| Domestic | $ | 98,004 | | | $ | 74,256 | | | $ | 52,595 | |
| Foreign | 7,715 | | | 3,888 | | | 3,833 | |
| Income before income taxes | $ | 105,719 | | | $ | 78,144 | | | $ | 56,428 | |
|
| | | | | | | | | | | |
| | Year Ended December 31, |
| | 2019 | | 2018 | | 2017 |
| Domestic | $ | 34,700 |
|
| $ | 46,542 |
|
| $ | 29,792 |
|
| Foreign | 1,853 |
|
| (4,152 | ) |
| (1,075 | ) |
| Income before (benefit) provision for income taxes | $ | 36,553 |
|
| $ | 42,390 |
|
| $ | 28,717 |
|
The components of the provision (benefit) provision for income taxes arewere as follows:
| | | | | | | | | | | | | | | | | |
| Year Ended December 31, |
| | 2022 | | 2021 | | 2020 |
| Current income tax provision (benefit): | | | | | |
| Federal | $ | (722) | | | $ | (779) | | | $ | (4,566) | |
| State | 733 | | | 1,779 | | | 1,522 | |
| Foreign | 1,202 | | | 844 | | | 298 | |
| Total current | 1,213 | | | 1,844 | | | (2,746) | |
| | | | | |
| Deferred income tax provision (benefit): | | | | | |
| Federal | 2,528 | | | (8,025) | | | 3,655 | |
| State | 2,300 | | | 3,561 | | | 2,207 | |
| Foreign | 1,129 | | | 573 | | | (3,610) | |
| Total deferred | 5,957 | | | (3,891) | | | 2,252 | |
| Total income tax provision (benefit) | $ | 7,170 | | | $ | (2,047) | | | $ | (494) | |
|
| | | | | | | | | | | |
| | Year Ended December 31, |
| | 2019 | | 2018 | | 2017 |
| Current: | |
| | |
| | |
|
| Federal | $ | 109 |
|
| $ | (1,888 | ) |
| $ | (1,055 | ) |
| State | 474 |
|
| 1,176 |
|
| 671 |
|
| Foreign | (1 | ) |
| 30 |
|
| 161 |
|
| | 582 |
|
| (682 | ) |
| (223 | ) |
| Deferred: | | | | | |
| Federal | (4,794 | ) |
| 2,662 |
|
| (6,683 | ) |
| State | 202 |
|
| 2,530 |
|
| 1,853 |
|
| Foreign | 262 |
|
| 303 |
|
| 262 |
|
| | $ | (4,330 | ) |
| $ | 5,495 |
|
| $ | (4,568 | ) |
| | $ | (3,748 | ) | | $ | 4,813 |
| | $ | (4,791 | ) |
The Company’sOur deferred tax assets and liabilities result primarily from temporary differences between financial reporting and tax recognition of depreciation, energy efficiency, sale-leasebacks and NOLother accruals, and net operating loss carryforwards.
AMERESCO, INC.
NOTES TO CONSOLIDATED FINANCIAL STATEMENTS - (Continued)
(inIn thousands, except per share amounts)
Deferred tax assets and liabilities consistconsisted of the following:
| | | | | | | | | | | | | |
| December 31, | | |
| | 2022 | | 2021 | | |
| Deferred income tax assets: | | | | | |
| Compensation accruals | $ | 3,306 | | | $ | 2,570 | | | |
| Reserves | 4,111 | | | 4,150 | | | |
| Sale-leasebacks and other accruals | 32,945 | | | 27,806 | | | |
| Net operating losses | 18,395 | | | 28,807 | | | |
| Interest rate swaps | — | | | 1,928 | | | |
| Energy efficiency | 71,433 | | | 59,618 | | | |
| | | | | |
| Deferred revenue | 2,132 | | | 2,181 | | | |
| Gross deferred income tax assets | 132,322 | | | 127,060 | | | |
| Valuation allowance | (3,621) | | | (4,039) | | | |
| Total deferred income tax assets | $ | 128,701 | | | $ | 123,021 | | | |
| Deferred income tax liabilities: | | | | | |
| Depreciation | $ | (122,762) | | | $ | (112,896) | | | |
| Deferred effect of derivative liability | (1,640) | | | (1,541) | | | |
| Canadian capital cost, allowance and amortization | (3,098) | | | (984) | | | |
| United Kingdom goodwill amortization | (952) | | | (718) | | | |
| Outside basis difference | (5,038) | | | (7,050) | | | |
| Interest rate swaps | (1,347) | | | — | | | |
| Total deferred income tax liabilities | (134,837) | | | (123,189) | | | |
| Deferred income tax liabilities, net | $ | (6,136) | | | $ | (168) | | | |
|
| | | | | | | |
| | December 31, |
| | 2019 | | 2018 |
| Deferred tax assets: | |
| | |
|
| Compensation accruals | $ | 1,745 |
| | $ | 3,489 |
|
| Reserves | 2,739 |
| | 2,940 |
|
| Other | 9,398 |
| | 127 |
|
| Net operating losses | 14,355 |
| | 10,010 |
|
| Interest rate swaps | 1,604 |
| | 666 |
|
| Energy efficiency | 35,939 |
| | 28,911 |
|
| Interest limitation | 5,148 |
| | 3,292 |
|
| Deferred revenue | 1,635 |
| | 1,943 |
|
| Gross deferred income tax assets | 72,563 |
| | 51,378 |
|
| Valuation allowance | (8,583 | ) | | (7,931 | ) |
| Total deferred income tax assets | $ | 63,980 |
| | $ | 43,447 |
|
| Deferred tax liabilities: | | | |
| Depreciation | $ | (51,579 | ) | | $ | (37,107 | ) |
| Deferred effect of derivative liability and ASU 2016-09 adoption | (328 | ) | | (475 | ) |
| Canadian capital cost, allowance and amortization | (2,919 | ) | | (1,974 | ) |
| United Kingdom goodwill amortization | (781 | ) | | (755 | ) |
| Outside basis difference | (8,488 | ) | | (7,488 | ) |
| Total deferred income tax liabilities | (64,095 | ) | | (47,799 | ) |
| Deferred income tax liabilities, net | $ | (115 | ) | | $ | (4,352 | ) |
The Company recorded aOur valuation allowance in the amount of $8,583 and $7,931 as of December 31, 2019 and 2018, respectively, related to the following items: 1) The Company recorded a valuation allowance on a deferred tax asset relating to interest rate swaps in the amount
| | | | | | | | | | | |
| December 31, |
| 2022 | | 2021 |
Interest rate swaps (1) | $ | 49 | | | $ | 50 | |
Foreign net operating loss (2) | 3,555 | | | 3,724 | |
State net operating loss at one of our subsidiaries (3) | 17 | | | 265 | |
| Total valuation allowance | $ | 3,621 | | | $ | 4,039 | |
| | | |
| (1) The deferred tax asset represents a future capital loss which can only be recognized for income tax purposes to the extent of capital gain income. Although we anticipate sufficient future taxable income, it is more likely than not that it will not be the appropriate character to allow for the recognition of the future capital loss. |
| (2) It is more likely than not that we will not generate sufficient taxable income at the foreign subsidiary level to utilize the net operating loss. |
| (3) It is more likely than not that we will not generate sufficient taxable income at the subsidiary level to utilize the net operating loss. |
AMERESCO, INC.
NOTES TO CONSOLIDATED FINANCIAL STATEMENTS
(In thousands, except per share amounts)
As of December 31, 20192022, we had the following tax loss and 2018, the Company recorded a valuation allowance on a deferred tax asset relatingcredit carryforwards to a foreign net operating loss in the amount of $8,169 and $7,500, respectively. It is more likely than not that the Company will not generate sufficientoffset taxable income at the foreign subsidiary level to utilize the net operating loss. 3) The Company recorded a valuation allowance on a deferred tax asset relating to a state net operating loss of $292in prior and $247 at one of its subsidiaries as of December 31, 2019 and 2018, respectively. It is more likely than not that the Company will not generate sufficient taxable income at the subsidiary level to utilize the net operating loss.future years:
| | | | | | | | | | | |
| Amount | | Expiration Period |
| Federal net operating loss carryforwards | $ | 46,070 | | | Indefinite |
| State net operating loss carryforwards | 31,109 | | | Various |
| Canadian net operating loss carryforwards | 24,699 | | | 2028 through 2042 |
| Ireland net operating loss carryforwards | 754 | | | Indefinite |
| Greece net operating loss carryforwards | 136 | | | 2027 |
| Spain net operating loss carryforwards | 2,302 | | | Indefinite |
| Total tax loss carryforwards | $ | 105,070 | | | |
| | | |
| Federal Energy Investment and Production tax credit carryforward | $ | 71,373 | | | 2030 through 2042 |
The provision for income taxes is based on the various rates set by federal and local authorities and is affected by permanent and temporary differences between financial accounting and tax reporting requirements.
The principal reasons for the difference between the statutory rate and the estimated annual effective rate for 20192022 were the effects of investment tax credits we are entitled from solar plants which have been placed into service during 2022, the tax deductions related to the Company’s recognizing a tax benefit of approximately $29.7 million associated with energy related credits and deductions available under the U.S. Tax Code for 2019 as well as a deduction available under Section 179D of the Tax Code for 2019 and 2018. In December 2019, the Code Section 179D Commercial Buildings Energy-Efficiency deduction, the benefit of disqualifying dispositions on certain employee stock options and favorable tax basis adjustments on certain partnership flip transactions.
The principal reasons for the difference between the statutory rate and the estimated annual effective rate for 2021 were the effects of investment tax credits we are entitled from solar plants which have been placed into service during 2021, the tax deductions related to the Section 179D Commercial Buildings Energy-Efficiency deduction, the benefit of disqualifying dispositions on certain employee stock options and favorable tax basis adjustments on certain partnership flip transactions.
The investment tax credits and production tax credits we may be entitled to fluctuate from year to year based on the cost of the renewable energy plants we place in service and production levels at facilities we own in that year.
On December 27, 2020 the President signed the Consolidated Appropriations Act, 2021 H.R. 133, which among other things made the Section 179D Energy Efficiency TaxEfficient Commercial Building Deduction was retroactivelypermanent. The Section had previously been extended for 2018years up to December 31, 2020. That Act also made changes to the way in which the deduction is calculated including adding an inflation adjustment and 2019, and through the end of 2020. Becausean update of the timingAmerican Society of Heating, Refrigerating and Air-Conditioning Engineers (“ASHRAE”) Standard by which energy improvements are measured. On December 23, 2022, the extensionIRS issued Announcement 2023-1 which clarified the impact of the 2018 Section 179D deduction was not reflectedASHRAE energy efficiency standards which will be applied to projects placed in the 2018 tax provision but was instead reflected in 2019.
service for 2021 and 2022.
AMERESCO, INC.
NOTES TO CONSOLIDATED FINANCIAL STATEMENTS - (Continued)
(inIn thousands, except per share amounts)
The following is a reconciliation of the effective tax rates:
| | | | | | | | | | Year Ended December 31, |
| | Year Ended December 31, | | 2022 | | 2021 | | 2020 |
| | 2019 | | 2018 | | 2017 | |
| Income before (benefit) provision for income taxes | $ | 36,553 |
| | $ | 42,390 |
| | $ | 28,717 |
| |
| Income before provision (benefit) for income taxes | | Income before provision (benefit) for income taxes | $ | 105,719 | | | $ | 78,144 | | | $ | 56,428 | |
| Federal statutory tax expense | $ | 7,676 |
| | $ | 8,902 |
|
| $ | 10,048 |
| Federal statutory tax expense | $ | 22,201 | | | $ | 16,410 | | | $ | 11,850 | |
| State income taxes, net of federal benefit | 2,140 |
| | 3,071 |
|
| 1,584 |
| State income taxes, net of federal benefit | 3,844 | | | 2,648 | | | 2,257 | |
| Net state impact of deferred rate change | (53 | ) | | 174 |
| | 327 |
| Net state impact of deferred rate change | (575) | | | (502) | | | (29) | |
| Non deductible expenses | 150 |
| | 982 |
| | 1,473 |
| |
| Nondeductible expenses | | Nondeductible expenses | 2,198 | | | 2,572 | | | 987 | |
| Impact of reserve for uncertain tax positions | (925 | ) | | 879 |
| | 42 |
| Impact of reserve for uncertain tax positions | 59 | | | 286 | | | (124) | |
| Stock-based compensation expense | (169 | ) | | (441 | ) | | 116 |
| Stock-based compensation expense | 353 | | | (4,618) | | | (2,922) | |
| Energy efficiency preferences | (12,699 | ) | | (8,636 | ) | | (6,416 | ) | Energy efficiency preferences | (21,410) | | | (17,639) | | | (8,595) | |
| Foreign items and rate differential | 56 |
| | (41 | ) | | 139 |
| Foreign items and rate differential | 37 | | | 4 | | | 160 | |
| Redeemable non-controlling interests | 1,101 |
| | 70 |
| | 1,579 |
| Redeemable non-controlling interests | (411) | | | (2,546) | | | (767) | |
| Tax rate change | — |
| | — |
| | (13,948 | ) | |
| Valuation allowance | 205 |
| | 641 |
| | 424 |
| Valuation allowance | (159) | | | 337 | | | (4,308) | |
| Miscellaneous | (1,230 | ) | | (788 | ) | | (159 | ) | Miscellaneous | 1,033 | | | 1,001 | | | 997 | |
| | $ | (3,748 | ) | | $ | 4,813 |
| | $ | (4,791 | ) | |
| Total income tax provision (benefit) | | Total income tax provision (benefit) | $ | 7,170 | | | $ | (2,047) | | | $ | (494) | |
| Effective tax rate: | | | |
| | |
| Effective tax rate: | | | | | |
| Federal statutory rate expense | 21.0 | % | | 21.0 | % | | 35.0 | % | Federal statutory rate expense | 21.0 | % | | 21.0 | % | | 21.0 | % |
| State income taxes, net of federal benefit | 5.9 | % | | 7.2 | % | | 5.5 | % | State income taxes, net of federal benefit | 3.6 | % | | 3.4 | % | | 4.0 | % |
| Net state impact of deferred rate change | (0.1 | )% | | 0.4 | % | | 1.1 | % | Net state impact of deferred rate change | (0.5) | % | | (0.6) | % | | (0.1) | % |
| Non deductible expenses | 0.4 | % | | 2.3 | % | | 5.1 | % | |
| Nondeductible expenses | | Nondeductible expenses | 2.1 | % | | 3.3 | % | | 1.7 | % |
| Impact of reserve for uncertain tax positions | (2.5 | )% | | 2.1 | % | | 0.1 | % | Impact of reserve for uncertain tax positions | 0.1 | % | | 0.4 | % | | (0.2) | % |
| Stock-based compensation expense | (0.5 | )% | | (1.0 | )% | | 0.4 | % | Stock-based compensation expense | 0.3 | % | | (5.9) | % | | (5.2) | % |
| Energy efficiency preferences | (34.7 | )% | | (20.4 | )% | | (22.3 | )% | Energy efficiency preferences | (20.3) | % | | (23.2) | % | | (15.2) | % |
| Foreign items and rate differential | 0.2 | % | | (0.1 | )% | | 0.5 | % | Foreign items and rate differential | — | % | | — | % | | 0.3 | % |
| Redeemable non-controlling interests | 3.0 | % | | 0.2 | % | | 5.5 | % | Redeemable non-controlling interests | (0.4) | % | | (3.3) | % | | (1.4) | % |
| Tax rate change | — | % | | — | % | | (48.6 | )% | |
| Valuation allowance | 0.6 | % | | 1.5 | % | | 1.5 | % | Valuation allowance | (0.2) | % | | 0.4 | % | | (7.6) | % |
| Miscellaneous | (3.6 | )% | | (1.8 | )% | | (0.5 | )% | Miscellaneous | 1.1 | % | | 1.9 | % | | 1.8 | % |
| | (10.3 | )% | | 11.4 | % | | (16.7 | )% | |
| Effective tax rate | | Effective tax rate | 6.8 | % | | (2.6) | % | | (0.9) | % |
AThe following table provides a reconciliation of the beginning and ending balances of the total amounts of gross unrecognized tax benefits is as follows:which are included in other liabilities within the consolidated balance sheets:
| | | | | | | | | | | |
| Year Ended December 31, |
| | 2022 | | 2021 |
| Balance, beginning of year | $ | 900 | | | $ | 600 | |
| Additions for current year tax positions | — | | | 300 | |
| | | |
| | | |
| | | |
| Balance, end of year | $ | 900 | | | $ | 900 | |
|
| | | | | | | |
| | Year Ended December 31, |
| | 2019 | | 2018 |
| Balance, beginning of year | $ | 1,600 |
|
| $ | 600 |
|
| Additions for current year tax positions | — |
| | 300 |
|
| Additions for prior year tax positions | — |
|
| 900 |
|
| Settlements paid to tax authorities | — |
|
| — |
|
| Reductions of prior year tax positions | (1,200 | ) |
| (200 | ) |
| Balance, end of year | $ | 400 |
|
| $ | 1,600 |
|
At December 31, 2019 and 2018, the Company had approximately $400 and $1,600, respectively, of total gross unrecognized tax benefits.
Of the total gross unrecognized tax benefits as of December 31, 2019 and 2018, $80 and $705, respectively, (both net of the federal benefit on state amounts) represent theThe amount of unrecognized tax benefits that, if recognized, would favorably affect the effective income tax rate in any future periods.
AMERESCO, INC.
NOTES TO CONSOLIDATED FINANCIAL STATEMENTS - (Continued)
(in thousands, except per share amounts)
At December 31, 2019 the Company had a federal net operating loss carryforwards2022 and $440 as of approximately $34,090 which has an indefinite life, state net operating loss carryforwards of approximately $45,260, which will expire from 2018 through 2034 and an interest deduction carryforward of approximately $19,659 which has an indefinite life. At December 31, 20192021 (both net of the Company had Canadian net operating loss carryforwards of approximately $25,939, which will expire for tax years 2018 through 2028.federal benefit on state amounts).
The Company doesWe do not accrue U.S. tax for foreign earnings that it considerswe consider to be permanently reinvested outside the United States. Consequently, the Company haswe have not provided any withholding tax on the unremitted earnings of itsour foreign subsidiaries. As of December 31, 2019, the amount of2022 and 2021, we estimated that there were no earnings for which no repatriation tax has not been provided is estimated to be $0.provided.
At December 31, 2019 the company had a federal tax credit carryforward
AMERESCO, INC.
NOTES TO CONSOLIDATED FINANCIAL STATEMENTS
(In thousands, except per share amounts)
The tax years 20152018 through 20192022 remain open to examination by major taxing jurisdictions. The Company accounts forWe recognize interest and penalties related to uncertain tax positions as partcomponents of itsour income tax provision for federal and state(benefit) in our consolidated statements of income. We increased income taxes. The (decrease) increase included in tax expense for the years end December 31, 2019, 2018these items by $22 in 2022, $14 in 2021, and 2017 was $19, $(50) and $60, respectively.$0 in 2020.
11. INVESTMENT FUNDSVARIABLE INTEREST ENTITIES AND EQUITY METHOD INVESTMENTS
In eachInvestment Funds
Over a period of September 2015, June 2017, June 2018, October 2018, and December 2019 the Companyfive years (2015 through 2019), we formed anfive investment fundfunds (tax equity partnerships) with third party investors which granted the applicable investor ownership interests in the net assets of certain of the Company’sour renewable energy project subsidiaries. The Company currently has fiveAs of December 31, 2022, we had three such investment funds each with a different third partythird-party investor.
The Company consolidatesWe consolidate the investment funds, and all inter-company balances and transactions between the CompanyAmeresco and the investment funds are eliminated in itsour consolidated financial statements. The CompanyWe determined that the investment funds meet the definition of a VIE. The Company usesWe use a qualitative approach in assessing the consolidation requirement for VIEs that focuses on determining whether the Company haswe have the power to direct the activities of the VIE that most significantly affect the VIE’s economic performance and whether the Company haswe have the obligation to absorb losses or the right to receive benefits that could potentially be significant to the VIE.
The Company hasWe have considered the provisions within the contractual arrangements that grant itus power to manage and make decisions that affect the operation of these VIEs, including determining the solar energy systems and associated long term customer contracts to be sold or contributed to the VIEs, and installation, operation, and maintenance of the solar energy systems. The Company considers thatWe considered the rights granted to the other investors under the contractual arrangements areto be more protective in nature rather than participating rights. As such, the Company haswe determined it isthat we are the primary beneficiary of the VIEs for all periods presented. The Company evaluates itsWe evaluate our relationships with VIEs on an ongoing basis to ensure that it continueswe continue to be the primary beneficiary.
Under the related agreements, cash distributions of income and other receipts by the funds, net of agreed-upon expenses and estimated expenses, tax benefits and detriments of income and loss, and tax benefits of tax credits, are assigned to the funds’ investor and Company’sour subsidiaries as specified in contractual arrangements. Certain of these arrangements have call and put options to acquire the investor’s equity interest as specified in the contractual agreements. See Note 12 for additional information onabout these investment funds and the call and put options.
AMERESCO, INC.
NOTES TO CONSOLIDATED FINANCIAL STATEMENTS - (Continued)
(in thousands, except per share amounts)
A summary of amounts related to the investment funds in the Company’s consolidated balance sheets for the years ending December 31, 2019 and 2018 is as follows: |
| | | | | | |
| | 2019(1) | 2018(1) |
| Cash | $ | 4,666 |
| $ | 1,255 |
|
| Restricted cash | 586 |
| 156 |
|
| Accounts receivable | 532 |
| 374 |
|
| Costs and estimated earnings in excess of billings | 1,125 |
| 498 |
|
| Prepaid expenses and other current assets | 108 |
| 190 |
|
| Property and equipment, net | 1,266 |
| — |
|
| Energy assets, net | 142,456 |
| 122,641 |
|
| Operating lease asset | 6,511 |
| — |
|
| Other assets | 1,662 |
| 1,613 |
|
| Accounts payable | 2,006 |
| 234 |
|
| Accrued liabilities | 2,203 |
| 4,146 |
|
| Current lease liabilities | 102 |
| — |
|
| Current portions of long-term | 2,252 |
| 1,712 |
|
| Long-term debt, net of deferred financing costs | 24,654 |
| 26,461 |
|
| Long-term lease liabilities | 6,180 |
| — |
|
| Other long-term liabilities | 1,171 |
| 2,131 |
|
(1)The amounts in the above table are reflected in parenthetical references on the Company’s consolidated balance sheets. See the Company’s consolidated balance sheets for additional information.
Other Variable Interest Entities
The Company executesWe execute certain contracts jointly with third parties through various forms of joint ventures. Although the joint ventures own and hold the contracts with the clients, the services required by the contracts are typically performed by the Companyus and the Company’sour joint venture partners, or by other subcontractors under subcontracting agreements with the joint ventures. Many of these joint ventures are formed for a specific project. The assets of the Company’sthese joint ventures generally consist almost entirely of cash and land, and the liabilities of our joint ventures generally consist almost entirely of amounts due to the joint venture partners.
The Company followsWe follow guidance on the consolidation of VIEs that requires companies to utilize a qualitative approach to determine whether it is the primary beneficiary of a VIE. The process for identifying the primary beneficiary of a VIE requires consideration of the factors that indicate a party has the power to direct the activities that most significantly impact the joint ventures economic performance, including powers granted to the joint ventures program manager, powers contained in the joint venture governing board and, to a certain extent, a company's economic interest in the joint venture. The Company analyzes itsWe analyze our joint ventures and classifiesclassify them as either:
•a VIE that must be consolidated because the Company iswe are the primary beneficiary or the joint venture is not a VIE and the Company holdswe hold the majority voting interest with no significant participative rights available to the other partners;partners, or
•a VIE that does not require consolidation and is treated as an equity method investment because the Company iswe are not the primary beneficiary or the joint venture is not a VIE and the Company doeswe do not hold the majority voting interest.
Many of theour joint ventures are deemed to be VIEs because they lack sufficient equity to finance the activities of the joint venture.
In January 2019, the Company entered into a joint venture with one other party to co-own an entity whose purpose is owning and leasing a parcel of land and attached structures to third-party entities. The joint venture has no employees and is controlled by the board of directors made up of representatives from both companies. Prior to January 2019, the Company had determined it was the primary beneficiary of the VIE and fully consolidated the entity. Upon the formation of the joint venture, the Company determined it was no longer the primary beneficiary, based on the assessment of considerations referenced above, and deconsolidated the VIE and recorded the Company’s investment in the joint venture as an equity method investment. With the deconsolidation of the VIE and the recognition of the equity method investment the Company recognized a gain of $2,160
AMERESCO, INC.
NOTES TO CONSOLIDATED FINANCIAL STATEMENTS - (Continued)
(inIn thousands, except per share amounts)
The table below presents a summary of amounts related to our VIEs reflected in Note 1 on our consolidated balance sheets:
in operating income and recorded an equity method investment of $1,361 in other assets. In addition, the Company has loaned the joint venture $1,506 and made an initial contribution at its formation in exchange for 50% of the shares in the joint venture. | | | | | | | | | | | | | | | | | | | | | | | | | | | | | | | | | |
| As of December 31, | | | | | | | | | | |
| 2022 | | 2021 | | | | | | |
| Investment Funds | | Other VIEs | | Total VIEs | | Investment Funds | | | | | | | | | | |
| Cash and cash equivalents | $ | 1,715 | | | $ | 8,392 | | | $ | 10,107 | | | $ | 4,915 | | | | | | | | | | | |
| Restricted cash | 799 | | | — | | | 799 | | | 822 | | | | | | | | | | | |
| Accounts receivable, net | 24 | | | 566 | | | 590 | | | 656 | | | | | | | | | | | |
| Costs and estimated earnings in excess of billings | 951 | | | 1 | | | 952 | | | 1,421 | | | | | | | | | | | |
| Prepaid expenses and other current assets | 35 | | | 14,287 | | | 14,322 | | | 151 | | | | | | | | | | | |
| Total VIE current assets | 3,524 | | | 23,246 | | | 26,770 | | | 7,965 | | | | | | | | | | | |
| Property and equipment, net | 89 | | | — | | | 89 | | | 1,266 | | | | | | | | | | | |
| Energy assets, net | 84,081 | | | 97,969 | | | 182,050 | | | 108,498 | | | | | | | | | | | |
| Operating lease assets | 4,901 | | | — | | | 4,901 | | | 6,271 | | | | | | | | | | | |
| Restricted cash, non-current portion | 73 | | | — | | | 73 | | | 418 | | | | | | | | | | | |
| Other assets | 30 | | | — | | | 30 | | | 36 | | | | | | | | | | | |
| Total VIE assets | $ | 92,698 | | | $ | 121,215 | | | $ | 213,913 | | | $ | 124,454 | | | | | | | | | | | |
| Current portions of long-term debt and financing lease liabilities | $ | 2,087 | | | $ | — | | | $ | 2,087 | | | $ | 2,210 | | | | | | | | | | | |
| Accounts payable | 48 | | | 8,007 | | | 8,055 | | | 47 | | | | | | | | | | | |
| Accrued expenses and other current liabilities | 304 | | | 12,255 | | | 12,559 | | | 643 | | | | | | | | | | | |
| Current portions of operating lease liabilities | 117 | | | — | | | 117 | | | 142 | | | | | | | | | | | |
| Total VIE current liabilities | 2,556 | | | 20,262 | | | 22,818 | | | 3,042 | | | | | | | | | | | |
| Long-term debt and financing lease liabilities, net of current portion, unamortized discount and debt issuance costs | 19,177 | | | — | | | 19,177 | | | 20,952 | | | | | | | | | | | |
| Long-term operating lease liabilities, net of current portion | 5,159 | | | — | | | 5,159 | | | 6,558 | | | | | | | | | | | |
| Other liabilities | 866 | | | 2,709 | | | 3,575 | | | 573 | | | | | | | | | | | |
| Total VIE liabilities | $ | 27,758 | | | $ | 22,971 | | | $ | 50,729 | | | $ | 31,125 | | | | | | | | | | | |
Equity Method Investments
Unconsolidated VIEs/joint ventures are accounted for under the equity method. For thoseDuring the year ended December 31, 2022, we entered into three unconsolidated joint ventures and during the Company'syear ended December 31, 2021 we invested $9,000 in one new joint venture. No other material investments were made.
Our investment balances for the joint venturethese equity method investments are included in other assets on the consolidated balance sheets and the Company’sour pro rata share of net income or loss is included in operating income.
The Company’sfollowing table provides information about our equity method investments in equity method joint ventures on the consolidated balance sheets as of December 31, 2019 and 2018 was a net asset of $1,292 and $0, respectively. During the years ended December 31, 2019 and 2018, the Company recognized expense of $183 and $0, respectively, from equity method joint ventures.ventures:
| | | | | | | | | | | | | | |
| | As of December 31, |
| | 2022 | | 2021 |
| Equity method investments | | $ | 10,855 | | | $ | 9,206 | |
| Earnings (loss) of unconsolidated entities | | $ | 1,647 | | | $ | (118) | |
12. REDEEMABLE NON-CONTROLLING INTERESTS AND EQUITY
Redeemable Non-controlling Interest
The Company’s wholly owned subsidiaryOur subsidiaries with a membership interestinterests in the investment fundfunds we formed inhave the third quarter of 2015 has the right beginning on the fifth anniversary of the final funding of the variable rate construction and term loans due 2023 and extending for six months, to elect to require the non-controlling interest holder to sell all of its membership units to the Company’s wholly owned subsidiary,our subsidiaries, a call option. The Company’sOur investment fund, which was formed in the third quarterfunds also include
AMERESCO, INC.
NOTES TO CONSOLIDATED FINANCIAL STATEMENTS
(In thousands, except per share amounts)
rights for the non-controlling interest holder to elect to require the Company’s wholly owned subsidiaryour subsidiaries to purchase all of itsthe non-controlling membership interests in the fund, a put option.
The Company’s wholly owned subsidiary with a membership interest in the investment fund formed in the second quarter of 2017 has the right, beginning on the fifth anniversary of the final funding of the non-controlling interest holder and extending for six months, to elect to require the non-controlling interest holder to sell all of its membership units to the Company’s wholly owned subsidiary, a call option. The Company’s investment fund formed in the second quarter of 2017 also includes a right, beginning on the sixth anniversary of the final funding and extending for one year, for the non-controlling interest holder to elect to require the Company’s wholly owned subsidiary to purchase all of its membership interests in the fund, a put option.
The Company’s wholly owned subsidiary with a membership interest in the investment fund formed in the second quarter of 2018 has the right, beginning on the fifth anniversary of the investment fund’s final project being placed into service and extending for six months, to elect to require the non-controlling interest holder to sell all of its membership units to the Company’s wholly owned subsidiary, a call option. The Company’s investment fund formed in the second quarter of 2018 also includes a right, upon the expiration offollowing table sets forth information about the call option and extendingput options for six months, for the non-controlling interest holder to elect to require the Company’s wholly owned subsidiary to purchase all of its membership interests in the fund, a put option.
The Company’s wholly owned subsidiary with a membership interest in the investment fund formed in the fourth quarter of 2018 has the right, beginning on the fifth anniversary on the last projects placed in-service date and extending for six months, to elect to require the non-controlling interest holder to sell all of its membership units to the Company’s wholly owned subsidiary, a call option. The Company’s investment fund formed in the fourth quarter of 2018 also includes a right, upon the expiration of the call option and extending for six months, for the non-controlling interest partner to elect to require the Company’s wholly owned subsidiary to purchase all of its membership interests in the fund, a put option.
The Company’s wholly owned subsidiary with a membership interest in the investment fund formed in the fourth quarter of 2019 has the right, beginning on the fifth anniversary on the last projects placed in-service date and extending for six months, to elect to require the non-controlling interest holder to sell all of its membership units to the Company’s wholly owned subsidiary, a call option. The Company’s investment fund formed in the fourth quarter of 2019 also includes a right, beginning six months after the fifth anniversary of the final funding and extending for one year, for the non-controlling interest partner to elect to require the Company’s wholly owned subsidiary to purchase all of its membership interests in the fund, a put option.
The purchase price for two of theour investment funds investors’ interests under the call options is equal to the fair market valueoutstanding as of such interest at the time the option is exercised. December 31, 2022:
| | | | | | | | | | | | | | | | | | | | | | | | | | | | | | | | | | | | | | | | | | | | |
| | | | Call Option | | Put Option |
| Investment Fund Number | | Formation Date | | Start Date | | End Date | | Purchase Price | | Start Date | | End Date | | Purchase Price |
| 1 | | June 2018 | | April 2024 | | October 2024 | | (1) | | October 2024 | | April 2025 | | (3) |
| 2 | | October 2018 | | June 2024 | | December 2024 | | (1) | | December 2024 | | June 2025 | | (3) |
| 3 | | December 2019 | | March 2026 | | September 2026 | | (2) | | September 2026 | | September 2027 | | (4) |
| | | | | | | | | | | | | | |
| (1) Purchase price is equal to the greater of (i) the fair market value of such interests at the time the option is exercised or (ii) 7% of the investors’ contributed capital balance at the time the option is exercisable. |
| (2) Purchase price is equal to the greater of (i) the fair market value of such interests at the time the option is exercised or (ii) 5% of the investors’ contributed capital balance at the time the option is exercisable. The call options are exercisable beginning on the date that specified conditions are met for each respective fund. These dates are estimate and subject to change based on last funding date. |
| (3) Purchase price is the sum of (i) the fair market value at the time the option is exercised, and (ii) the closing costs incurred by the investor in connection with the exercise of the put option. |
| (4) Purchase price is the lessor of fair market value at the time the option is exercised and the sum of (i) 5% of the investors’ contributed capital balance at the time the option is exercisable, and (ii) the fair market value of any unpaid tax law change losses incurred by the investor in connection with the exercise of the put option. |
The purchase price for two of the investment funds investor’s interests under the call options is equal to the greater of (i) the fair market value of such interests at the time the option is exercised or (ii) 7% of the investors’ contributed capital balance at the time the option is exercisable. The purchase price for the remaining investment fund investor’s interests under the call options is equal to the greater of (i) the fair market value of such interests at the time the option is exercised or (ii) 5% of the investors’ contributed capital balance at the time the option is exercisable.The
AMERESCO, INC.
NOTES TO CONSOLIDATED FINANCIAL STATEMENTS - (Continued)
(in thousands, except per share amounts)
call options are exercisable beginning on the date that specified conditions are met for each respective fund.
None of theThe following table presents our call
options are expected to become exercisable prior to 2021.option exercised during the: | | | | | | | | | | | |
| Year Ended December 31, |
| 2022 | | 2021 |
| Start date of call option | December 2022 | | March 2021 |
| Date purchase of investor's share was finalized | December 2022 | | September 2021 |
| Cash paid | $ | 839 | | | $ | 1,000 | |
The purchase price for two of the funds investors’ interests in the investment funds under the put options is the lessor of fair market value at the time the option is exercised and a specified amount, ranging from $659 - $917. The purchase price for the two remaining funds investors’ interest in the investment funds under the put options is the sum of (i) the fair market value at the time the option is exercised, and (ii) the closing costs incurred by the investor in connection with the exercise of the put option. The purchase price forWe reclassified the remaining fund investors’redeemable non-controlling interest inbalance to paid-in capital to reflect the investment funds under the put options is the lessor of fair market value at the time the option is exercised and the sum of (i) 5% of the investors’ contributed capital balance at the time the option is exercisable, and (ii) the fair market value of any unpaid tax law change losses incurred by the investor in connection with the exercise of the put option. The put options for the investment funds are exercisable beginning on the date that specified conditions are met for each respective fund. The put options are not expectedadditional contribution from us to become exercisable prior to 2022.our wholly-owned subsidiaries.
Because the put options representsrepresent redemption features that are not solely within theour control, of the Company, the non-controlling interests in these funds are presented outside of permanent equity. Redeemable non-controlling interests are reported using the greater of their carrying value at each reporting date (which is impacted by attribution under the HLBV method) or their estimated redemption value inat each reporting period. At both December 31, 20192022 and 2018,2021, redeemable non-controlling interests were reported in the accompanying consolidated balance sheets at their carrying value of $31,616 and $14,719, respectively,values, as the carrying value at each reporting period was greater than the estimated redemption value.
13. STOCK INCENTIVE PLANEQUITY AND EARNINGS PER SHARE
Equity Offering
On March 9, 2021, we closed on an underwritten public offering of 2,500 shares of our Class A common stock at a public offering price of $44.00 per share. Net proceeds from the offering were $104,326, after deducting offering costs of $5,674. On March 15, 2021, we closed on the underwriters’ option to purchase 375 additional shares of Class A common stock from us, resulting in net proceeds of $15,758 after deducting offering costs of $742. We used $80,000 of the net proceeds to repay in full the outstanding U.S. dollar balance under our senior secured revolving credit facility and used the remaining proceeds for general corporate purposes.
In the offering, selling shareholders sold 805 shares of our Class A Common Stock at a public offering price of $44.00 per share, less the underwriting discount. We did not receive any proceeds from the sale of the shares by the selling stockholders.
AMERESCO, INC.
NOTES TO CONSOLIDATED FINANCIAL STATEMENTS
(In thousands, except per share amounts)
Common and Preferred Stock
The Company has authorized 500,000 shares of Class A common stock, par value $0.0001 per share, 144,000 shares of Class B common stock, par value $0.0001 per share, and 5,000 shares of Preferred Stock, par value $0.0001 per share. The rights of the holders of the Company’sour Class A common stock and Class B common stock are identical, except with respect to voting and conversion. Each share of the Company’sour Class A common stock is entitled to one vote per share and is not convertible into any other shares of the Company’sour capital stock. Each share of the Company’sour Class B common stock is entitled to five votes per share, is convertible at any time into one share of Class A common stock at the option of the holder of such share and will automatically convert into one share of Class A common stock upon the occurrence of certain specified events, including a transfer of such shares (other than to such holder’s family members, descendants or certain affiliated persons or entities). The Company’sOur Board of Directors is authorized to fix the rights and terms for any series of preferred stock without additional shareholder approval.
In 2000,Earnings Per Share
The following is a reconciliation of the Company’s Board of Directors approved the Company’s 2000 Stock Incentive Plan (the “2000 Plan”)numerator and between 2000 and 2010 authorized the Company to reserve a total of 28,500 shares of its then authorized common stock, par value $0.0001 per share (”Common Stock”) for issuance under the 2000 Plan. The 2000 Plan provideddenominator for the issuancecomputation of restricted stock grants, incentive stock optionsbasic and nonqualified stock options. The Company will grant no further stock options or restricted awards under the 2000 Plan.diluted earnings per share:
The Company’s | | | | | | | | | | | | | | | | | |
| Year Ended December 31, |
| 2022 | | 2021 | | 2020 |
| Numerator: | | | | | |
| Net income attributable to common shareholders | $ | 94,926 | | | $ | 70,458 | | | $ | 54,052 | |
| Adjustment for accretion of tax equity financing fees | (116) | | | (116) | | | (121) | |
| Income attributable to common shareholders | $ | 94,810 | | | $ | 70,342 | | | $ | 53,931 | |
| Denominator: | | | | | |
| Basic weighted-average shares outstanding | 51,841 | | | 50,855 | | | 47,702 | |
| Effect of dilutive securities: | | | | | |
| Stock options | 1,437 | | | 1,413 | | | 1,304 | |
| Diluted weighted-average shares outstanding | 53,278 | | | 52,268 | | | 49,006 | |
| Net income per share attributable to common shareholders: | | | | | |
| Basic | $ | 1.83 | | | $ | 1.38 | | | $ | 1.13 | |
| Diluted | $ | 1.78 | | | $ | 1.35 | | | $ | 1.10 | |
| | | | | |
Potentially dilutive shares (1) | 1,108 | | | 1,443 | | | 1,199 | |
| | | | | |
| (1) Potentially dilutive shares attributable to stock options were excluded from the computation of diluted earnings per share as the effect would have been anti-dilutive. |
14. STOCK-BASED COMPENSATION AND OTHER EMPLOYEE BENEFITS
Our 2010 Stock Incentive Plan (the “2010 Plan”), was adopted by the Company’sour Board of Directors in May 2010 and approved by itsour stockholders in June 2010. The 2010 Plan provides for the grant of incentive stock options, non-statutory stock options, performance-based stock options, restricted stock awardsunits (“RSUs”) and other stock-based awards. Upon its effectiveness, 10,000 shares of the Company’sour Class A common stock were reserved for issuance under the 2010 Plan. As of December 31, 2019,2020, there were no longer shares available for grant under the Company had2010 Plan.
Our 2020 Stock Incentive Plan (the “2020 Plan”), was adopted by our Board of Directors in February 2020 and approved by our stockholders in May 2020. The 2020 Plan provides for the grant of incentive stock options, non-statutory stock options, stock appreciation rights, RSUs, and other stock-based awards. Upon its effectiveness, 5,000 shares of our Class A common stock were reserved for issuance under the 2020 Plan. As of December 31, 2022, we granted options and RSUs to purchase 5,2173,170 shares of Class A common stock, of which 206 shares were forfeited or expired, leaving 2,036 shares available for grant under the 20102020 Plan.
The Company’s 2017 Employee Stock Purchase Plan ("ESPP") permits eligible employeesOptions
We did not grant awards to purchase up toindividuals who were not either an aggregateemployee or director of 200 shares of the Company’s Class A common stock. This plan commenced December 1, 2017 and was most recently amended on August 2018. The ESPP allows participants to purchase shares of common stock at a 5% discount from the fair market value of the stock as determined on specific dates at six-month intervals. Duringours during the years ended December 31, 20192022, 2021, and 2018, the Company issued 49 and 51 shares, respectively, under the ESPP. As of December 31, 2019, the amount that had been withheld from employees for future purchases under the ESPP is$0.1 million. As of December 31, 2018, the amount that had been withheld from employees for future purchases under the ESPP was immaterial.
Stock Option Grants
2020.
AMERESCO, INC.
NOTES TO CONSOLIDATED FINANCIAL STATEMENTS - (Continued)
(inIn thousands, except per share amounts)
The Company has granted stock options to certain employees and directors, including its principal and controlling stockholder, under the 2000 Plan. The Company has also granted stock options to certain employees and directors under the 2010 Plan. At December 31, 2019, 5,717 shares were available for grant under the 2010 Plan.
The following table summarizes the collective activity under the 2000 Plan and the 2010 Plan:plans:
| | | | | | | | | | | Number of Options | | Weighted-Average Exercise Price | | Weighted-Average Remaining Contractual Term | | Aggregate Intrinsic Value |
| | Number of Options | | Weighted-Average Exercise Price | | Weighted-Average Remaining Contractual Term | | Aggregate Intrinsic Value | |
| Outstanding at December 31, 2016 | 3,971 |
| | 7.300 |
| | | |
Granted(1) | 390 |
| | 6.061 |
| | | |
| | Outstanding at December 31, 2021 | | Outstanding at December 31, 2021 | 3,532 | | | 30.336 | | | | | |
| Granted | | Granted | 1,605 | | | 72.691 | | |
| Exercised | (401 | ) | | 4.935 |
| | | Exercised | (196) | | | 20.186 | | |
| Forfeited | (41 | ) | | 6.421 |
| | | Forfeited | (370) | | | 19.503 | | |
| Expired | (85 | ) | | 10.157 |
| | | Expired | (38) | | | 22.974 | | |
| Outstanding at December 31, 2017 | 3,834 |
| | 7.367 |
| | | |
Granted(1) | 518 |
| | 10.878 |
| | | |
| Exercised | (909 | ) | | 7.367 |
| | | |
| Forfeited | (87 | ) | | 4.726 |
| | | |
| Expired | (51 | ) | | 9.146 |
| | | |
| Outstanding at December 31, 2018 | 3,305 |
| | 8.050 |
| |
| |
|
| |
Granted(1) | 1,330 |
| | 14.026 |
| | | |
| Exercised | (916 | ) | | 7.362 |
| | | |
| Forfeited | (210 | ) | | 8.070 |
| | | |
| Expired | (4 | ) | | 9.904 |
| | | |
| Outstanding at December 31, 2019 | 3,505 |
| | $ | 10.524 |
| | 6.60 | | $ | 24,455 |
| |
| Options exercisable at December 31, 2019 | 1,528 |
| | $ | 8.757 |
| | 4.01 | | $ | 13,356 |
| |
| Expected to vest at December 31, 2019 | 1,977 |
| | $ | 11.889 |
| | 8.76 | | $ | 11,098 |
| |
| Outstanding at December 31, 2022 | | Outstanding at December 31, 2022 | 4,533 | | | $ | 45.799 | | | 7.6 years | | $ | 88,164 | |
| Options exercisable at December 31, 2022 | | Options exercisable at December 31, 2022 | 1,629 | | | $ | 17.511 | | | 5.7 years | | $ | 66,600 | |
| Expected to vest at December 31, 2022 | | Expected to vest at December 31, 2022 | 2,904 | | | $ | 61.673 | | | 8.6 years | | $ | 21,564 | |
(1) Grants are related to the 2010 Plan.The following table sets forth additional disclosures about our plans:
The aggregate intrinsic value of stock options exercised during the years ended December 31, 2019, 2018 and 2017 was $7,154, $5,588 and $808, respectively. | | | | | | | | | | | | | | | | | |
| Year Ended December 31, |
| 2022 | | 2021 | | 2020 |
| Aggregate intrinsic value of options exercised | $ | 9,775 | | | $ | 33,494 | | | $ | 19,762 | |
| Cash received from stock option exercises | $ | 3,954 | | | $ | 5,563 | | | $ | 8,995 | |
| Weighted-average fair value of stock options granted | $ | 37.87 | | | $ | 28.94 | | | $ | 11.52 | |
Stock-based compensation expense (1) | $ | 15,046 | | | $ | 8,716 | | | $ | 1,933 | |
| Income tax benefit from stock-based compensation expense | $ | 659 | | | $ | 4,932 | | | $ | 2,826 | |
| | | | | |
| (1) Included in selling, general, and administrative expenses in the accompanying consolidated statements of income and includes expense in connection with our ESPP and RSUs. |
During the year ended December 31, 2019, a total of 916 shares were issued upon the exercise of options under the 2000 and 2010 Plan at an average price of 7.362 per share. Cash received from option exercises under all stock-based payment arrangements, net, for the years ended December 31,2019, 2018 and 2017 was $6,742, $6,696 and $1,977, respectively.
Stock options issued under our 2000 Plan generally expire if not exercised within ten years after the grant date. Under the terms of our 2010 stock incentive plan,Plan and 2020 Plan, all options expire if not exercised within ten years after the grant date. During 2011, the Companywe began awarding options which typically vest over a five yearfive-year period on an annual ratable basis. From time to time, the Company awardswe award options providing for vesting over three years, with one-third vesting on each of the first three anniversaries of the grant date. During the year endingended December 31, 2019, the Companywe granted 1,000 common stock options to certain employees and directors under itsour 2010 Stock Incentive Plan, which have a contractual life of ten years and vest based upon the achievement of specific performance goals over a three years. If the employee ceases to be employed by the Companyus for any reason before vested options have been exercised, the employee has 90 days to exercise options that have vested as of the date of such employee’s termination, or they are forfeited.
During August and September 2019, the Company’s Chief Executive Officer (“CEO”), who is also a significant shareholder of the Company, exercised a nonqualified option to purchase 600 shares of the Company’s Class A common stock. Due to an administrative oversight, in November 2019, the Company paid the required withholding taxes of $2,292 to the Internal Revenue Service on the compensation element resulting from such exercise without a corresponding withholding from the CEO. Accordingly, the Company recorded a reimbursement due from the CEO as of December 31, 2019 of $2,292, which
AMERESCO, INC.
NOTES TO CONSOLIDATED FINANCIAL STATEMENTS - (Continued)
(in thousands, except per share amounts)
has been included in prepaid expenses and other current assets in the accompanying balance sheet. In January 2020, the Company received payment in full from the CEO.
The Company usesWe use the Black-Scholes option pricing model to determine the weighted-average fair value of options granted. The Company willWe recognize the compensation cost of stock-based awards on a straight-line basis over the vestingrequisite service period of the award.
The determination of the fair value of stock-based payment awards utilizing the Black-Scholes model is affected by the stock price and a number of assumptions, including expected volatility, expected life, risk-free interest rate and expected dividends.
The following table sets forth the significant assumptions used in the model during 2019, 2018 and 2017:model:
| | | | | | | | | | | | | | | | | |
| | Year Ended December 31, |
| | 2022 | | 2021 | | 2020 |
| Expected dividend yield | —% | | —% | | —% |
| Risk-free interest rate | 1.69% -3.82% | | 0.92%-1.46% | | 0.35%-0.76% |
| Expected volatility | 51%-53% | | 48%-50% | | 43%-48% |
| Expected life | 6.5 years | | 6.5 years | | 6.5 years |
|
| | | | | |
| | Year Ended December 31, |
| | 2019 | | 2018 | | 2017 |
| Expected dividend yield | —% | | —% | | —% |
| Risk-free interest rate | 1.60%-2.39% | | 2.71%-3.00% | | 1.96%-2.36% |
| Expected volatility | 43%-44% | | 43%-45% | | 46% |
| Expected life | 6.5 years | | 6.5 years | | 6.5 years |
The CompanyWe will continue to use judgment in evaluating the expected term and volatility related to the stock-based compensation on a prospective basis and incorporatingincorporate these factors into the Black-Scholes pricing model. The Company recordsWe record forfeitures as they occur. Higher volatility and longer expected lives result in an increase to stock-based compensation expense determined at the date of grant.
The weighted-average fair value
AMERESCO, INC.
NOTES TO CONSOLIDATED FINANCIAL STATEMENTS
(In thousands, except per share. For the years ended December 31, 2019, 2018 and 2017, the Company recorded stock-based compensation expense of approximately $1,620, $1,258, and $1,293, respectively, in connection with stock-based payment awards and including expense in connection with the ESPP. The compensation expense is categorized as a portion of selling, general and administrative expenses in the accompanying consolidated statements of income. share amounts)
As of December 31, 2019,2022, there was approximately $9,486$46,747 of unrecognized compensation expense related to non-vested stock option awards that is expected to be recognized over a weighted-average period of 2.72.9 years.
14. EMPLOYEE BENEFITSDuring the year ended December 31, 2022, we granted awards of RSUs to our non-employee directors under our 2020 Plan. These RSUs represent a promise to deliver shares to participants at a future date after certain vesting conditions are met. RSUs do not have the voting rights of common stock and the shares underlying RSUs are not considered issued and outstanding upon grant. The fair value of RSUs is based on the closing stock price of our common stock on the grant-date and expensed over the requisite service period of the award.
The Company has salary reduction/profit sharing plansfollowing table summarizes the activity under the provisionsplan:
| | | | | | | | | | | | | | |
| Number of Options | | Weighted-Average Grant Date Fair Value Per Share | |
| Outstanding at December 31, 2021 | — | | | $ | — | | |
| Granted | 13 | | | 52.94 | | |
| | | | |
| | | | |
| | | | |
| Outstanding at December 31, 2022 | 13 | | | $ | 52.94 | | |
Total stock-based compensation expense for the year ended December 31, 2022 related to RSUs was $202.
As of Section 401(k)December 31, 2022, none of the Internal Revenue Code.RSUs were vested and there was $485 of unrecognized compensation expense related to RSUs that is expected to be recognized over a period of 0.4 years.
Employee Stock Purchase Plan
Our 2017 Employee Stock Purchase Plan permits eligible employees to purchase up to an aggregate of 200 shares of the Company’s Class A common stock. In May 2020, we amended our ESPP, which permits eligible employees to purchase up to an aggregate of 350 shares of our Class A common stock. This plan commenced December 1, 2017 and was subsequently amended in August 2018. The plans cover allESPP allows participants to purchase shares of common stock at a 5% discount from the fair market value of the stock as determined on specific dates at six-month intervals.
During the years ended December 31, 2022 and 2021, we issued 36 and 29 shares, respectively, under the ESPP. As of December 31, 2022 and 2021, the amount that had been withheld from employees for future purchases under the ESPP was $179 and $164, respectively.
Other Employee Benefits
We maintain a qualified 401(k) plan covering eligible U.S. employees who have completed the minimum service requirement, as defined by the plans. The plans require the Companyus to contribute 100% of the first six percent of base compensation that a participant contributes to the plans. Matching contributions made by the Company were $5,452, $4,957, and $3,832 for the years ended December 31, 2019, 2018 and 2017, respectively.
The Company hasIn 2016, we established a Group Personal Pension Plan (GPPP) for employees in the U.K., established in 2016, wherebyUnited Kingdom, for eligible employees who may contribute a portion of their compensation, subject to their age and other limitations established by HM Revenue & Customs. The plan requires the Companyus to contribute 100% of the first six percent of base compensation that a participant contributes to the plans. Matching contributions made by the Company were $190, $161, and $344 for the years ended December 31, 2019, 2018 and 2017, respectively.
The Company hasWe also have a Registered Retirement Savings Plan (RRSP) for employees in Canada, wherebyfor eligible employees who may contribute a portion of their compensation. The plan requires the Companyus to contribute 100% of the first six percent of base compensation that a participant contributes to the plans. Matching
AMERESCO, INC.
NOTES TO CONSOLIDATED FINANCIAL STATEMENTS
(In thousands, except per share amounts)
The following table sets forth our matching contributions made byunder the Company were $356, $351, and $774 for the years ended December 31, 2019, 2018 and 2017, respectively.plans:
| | | | | | | | | | | | | | | | | |
| Year Ended December 31, |
| 2022 | | 2021 | | 2020 |
| 401(k) plan | $ | 6,974 | | | $ | 6,189 | | | $ | 5,650 | |
| Group Personal Pension Plan | 290 | | | 252 | | | 202 | |
| Registered Retirement Savings Plan | 406 | | | 405 | | | 348 | |
| Total matching contributions | $ | 7,670 | | | $ | 6,846 | | | $ | 6,200 | |
15. COMMITMENTS AND CONTINGENCIES
The Company fromFrom time to time, issueswe issue letters of credit and performance bonds with theirour third-party lenders, to provide collateral.
AMERESCO, INC.
NOTES TO CONSOLIDATED FINANCIAL STATEMENTS - (Continued)
(in thousands, except per share amounts)
The Company has future lease commitments which do not yet meet the criteria of a ROU asset or ROU liability as of December 31, 2019, for certain business offices. These commitments total $721 as of December 31, 2019 and relate to payments through 2026.
Legal Proceedings
On November 6, 2017, we were served with a complaint filed by a customer against nine contractors, including us, claiming both physical damages to the customer’s tangible property and damages caused by various alleged defects in the design of the project through negligent acts and/or omissions, breaches of contract and breaches of the “implied warranty of good and workmanlike manner.” During the year ended December 31, 2021, we accrued a reasonable estimate of the loss, which was included in accrued expenses and other current liabilities in our consolidated balance sheets and we accrued a loss recovery from insurance proceeds which was included in prepaid expenses and other current assets in our consolidated balance sheets. The Company also isestimated loss and the loss recovery were included in selling, general, and administrative expenses in our consolidated statements of income for the year ended December 31, 2021. During the year ended December 31, 2022, we entered into a settlement agreement and the net settlement was paid and the loss recovery from insurance proceeds was reversed during this same period.
We are involved in a variety of other claims and other legal proceedings generally incidental to itsour normal business activities. While the outcome of any of these proceedings cannot be accurately predicted, the Company doeswe do not believe the ultimate resolution of any of these existing matters would have a material adverse effect on itsour financial condition or results of operations.
Commitments as a Result of Acquisitions
In MayAugust 2018, the Companywe completed an acquisition which provided for a $425 cash consideration holdback contingent upon the Company collecting certain acquired receivables, which was subsequently reduced to $0 as of December 31, 2019 in connection with the measurement period adjustment discussed in Note 5.
In August 2018, the Company completed an acquisitionChelsea Group Limited which provided for a revenue earn-out contingent upon the acquired business meeting certain cumulative revenue targets over five years from the next five years. The Companyacquisition date. We evaluated financial forecasts of the acquired business and concluded that the fair value of this earn-out was approximately $555 upon acquisition. The fair value was $599 as of December 31, 2018 andsubsequently increased to $678 as of December 31, 2019,2021, decreased to $358 as of December 31, 2022, and is recordedincluded in the other liabilities on the consolidated balance sheets. The contingent consideration will be paid yearly, commencingannually in 2021,May, if any of the cumulative revenue targets are achieved and theachieved. No payments have been made to date. The fair value of the earn-out will be periodically re-evaluated at each reporting period and adjustments will be recorded as needed.
In December 2021, we completed an acquisition of Plug Smart which provided for an earn-out based on future EBITDA targets beginning with EBITDA performance for the month of December 2021 and each fiscal year thereafter, over a five-year period through December 31, 2026. The maximum cumulative earn-out is $5,000 and we evaluated financial forecasts of the acquired business and concluded that the fair value of this earn-out was approximately $2,160 upon acquisition and remained consistent as of December 31, 2021. During the year ended December 31, 2022, a payment of $275 was made for the month of December 2021 EBITDA target and the fair value of the remaining contingent consideration was increased to $3,800. An increase of $1,934 in the fair value of contingent consideration was included in selling, general and administrative expenses in our consolidated statements of income during the year ended December 31, 2022. The current portion of the contingent consideration is included in accrued expenses and other current liabilities and the non-current portion is included in other liabilities on the consolidated balance sheets.
See Notes 4 and 18 for additional information.
AMERESCO, INC.
NOTES TO CONSOLIDATED FINANCIAL STATEMENTS
(In November 2018, the Company completed an asset acquisition of certain lease options, which provided for a payout if the lease option is exercised and if certain financial metrics are achieved. The Company evaluated the the acquired lease options and concluded that the fair-value of this contingent liability was approximately $363 as of December 31, 2018, which was subsequently increased to $378 as of December 31, 2019 and is recorded in accrued expenses and other current liabilities and other liabilities on the consolidated balance sheets. Payments will be made when milestones are achieved. The contingent liability will be periodically re-evaluated and adjustments will be recorded as needed. See Note 18 for additional information.thousands, except per share amounts)
16. GEOGRAPHIC INFORMATION
The Company attributesfollowing table presents our long-lived assets related to our operations by geographic area:
| | | | | | | | | | | |
| As of December 31, |
| | 2022 | | 2021 |
| Long-lived Assets | | | |
| United States | $ | 1,162,705 | | | $ | 839,231 | |
| Canada | 24,590 | | 27,964 |
| Other | 9,937 | | | 2,453 | |
| Total long-lived assets | $ | 1,197,232 | | | $ | 869,648 | |
We attribute revenues to customers based on the location of the customer. Information as to the Company’s operations in different geographical areas is as follows:The following table presents revenues by geographic region:
| | | | | | | | | | | | | | | | | |
| Year Ended December 31, |
| 2022 | | 2021 | | 2020 |
| Revenues | | | | | |
| United States | $ | 1,712,326 | | | $ | 1,126,141 | | | $ | 955,436 | |
| Canada | 53,461 | | 45,782 | | 45,089 |
| Other | 58,635 | | | 43,774 | | | 31,750 | |
| Total revenues | $ | 1,824,422 | | | $ | 1,215,697 | | | $ | 1,032,275 | |
|
| | | | | | | |
| | December 31, |
| | 2019 | | 2018 |
| Long-lived assets: | |
| | |
|
| United States | $ | 564,047 |
| | $ | 443,385 |
|
| Canada | 24,684 |
| | 22,107 |
|
| Other | 834 |
| | 1,445 |
|
| Total long-lived assets | $ | 589,565 |
| | $ | 466,937 |
|
|
| | | | | | | | | | | |
| | Year Ended December 31, |
| | 2019 | | 2018 | | 2017 |
| Revenues: | |
| | | | |
| United States | $ | 815,405 |
| | $ | 734,748 |
| | $ | 665,793 |
|
| Canada | 35,031 |
| | 36,728 |
| | 42,186 |
|
| Other | 16,497 |
| | 15,662 |
| | 9,173 |
|
| Total revenues | $ | 866,933 |
| | $ | 787,138 |
| | $ | 717,152 |
|
17. OTHER EXPENSES, NET
The following table presents the components of other expenses, net, are as follows: net:
AMERESCO, INC.
NOTES TO CONSOLIDATED FINANCIAL STATEMENTS - (Continued)
(in thousands, except per share amounts)
|
| | | | | | | | | | | |
| | Year Ended December 31, |
| | 2019 | | 2018 | | 2017 |
| Gain on derivatives | $ | (1,068 | ) | | $ | (121 | ) | | $ | (271 | ) |
| Interest expense, net of interest income | 13,841 |
| | 13,132 |
| | 8,086 |
|
| Amortization of deferred financing fees, net | 2,229 |
| | 1,894 |
| | 1,350 |
|
| Foreign currency transaction (gain) loss | 59 |
| | 1,804 |
| | (1,294 | ) |
| Other expenses, net | $ | 15,061 |
| | $ | 16,709 |
| | $ | 7,871 |
|
| | | | | | | | | | | | | | | | | |
| Year Ended December 31, |
| | 2022 | | 2021 | | 2020 |
| (Gain) loss on derivatives | $ | (906) | | | $ | 240 | | | $ | (705) | |
| Interest expense, net of interest income | 26,423 | | | 14,361 | | | 15,422 | |
| Amortization of debt discount and debt issuance costs | 4,211 | | | 2,849 | | | 2,686 | |
| Foreign currency transaction loss (gain) | 144 | | | 852 | | | (481) | |
| Government incentives | (2,599) | | | (1,012) | | | (1,851) | |
| Other expenses, net | $ | 27,273 | | | $ | 17,290 | | | $ | 15,071 | |
Estimated amortization expense for existing deferred financing feesdebt discount and debt issuance costs for the next five succeeding fiscal years is as follows:
| | | | | | | | |
| | Estimated Amortization |
| 2023 | | $ | 3,139 | |
| 2024 | | $ | 2,394 | |
| 2025 | | $ | 1,660 | |
| 2026 | | $ | 1,127 | |
| 2027 | | $ | 998 | |
|
| | | |
| | | Estimated Amortization |
| 2020 | | 1,484 |
|
| 2021 | | 1,083 |
|
| 2022 | | 881 |
|
| 2023 | | 674 |
|
| 2024 | | 532 |
|
18. FAIR VALUE MEASUREMENT
The Company recognizes itsWe recognize certain financial assets and liabilities at fair value on a recurring basis (at least annually). Fair value is defined as the price that would be received for an asset or paid to transfer a liability (an exit price) in the principal or most advantageous
AMERESCO, INC.
NOTES TO CONSOLIDATED FINANCIAL STATEMENTS
(In thousands, except per share amounts)
market for the asset or liability in an orderly transaction between market participants on the measurement date. Three levels of inputs that may be used to measure fair value are as follows:
Level 1:Inputs are based uponon unadjusted quoted prices for identical instruments traded in active markets.
Level 2:Inputs are based uponon quoted prices for similar instruments in active markets, quoted prices for identical or similar instruments in markets that are not active, and model basedmodel-based valuation techniques for which all significant assumptions are observable in the market or can be corroborated by observable market data for substantially the full term of the assets or liabilities.
Level 3:Inputs are generally unobservable and typically reflect management’s estimates of assumptions that market participants would use in pricing the asset or liability. The fair values are therefore determined using model-based techniques that include option pricing models, discounted cash flow models, and similar techniques.
The following table presents the input level used to determine the fair values of the Company’sour financial instruments measured at fair value on a recurring basis:
| | | | | | | | | | | | | | | | | |
| | | Fair Value as of December 31, |
| Level | | 2022 | | 2021 |
| Assets | | | | | |
| Interest rate swap instruments | 2 | | $ | 5,202 | | | $ | 919 | |
| | | | | |
| | | | | |
| Liabilities | | | | | |
| Interest rate swap instruments | 2 | | $ | 9 | | | $ | 6,316 | |
| Commodity swap instruments | 2 | | — | | | 1,962 | |
| Make-whole provisions | 2 | | 5,348 | | | 4,800 | |
| Contingent consideration | 3 | | 4,158 | | | 2,838 | |
| Total liabilities | | | $ | 9,515 | | | $ | 15,916 | |
| | | | | |
| | | | | |
|
| | | | | | | | | |
| | | | Fair Value as of December 31, |
| | Level | | 2019 | | 2018 |
| Assets: | | | | | |
| Interest rate swap instruments | 2 | | $ | 15 |
| | $ | 733 |
|
| Commodity swap instruments | 2 | | 198 |
| | 33 |
|
| Total assets | | | $ | 213 |
| | $ | 766 |
|
| Liabilities: | | | |
| | |
|
| Interest rate swap instruments | 2 | | $ | 6,236 |
| | 3,187 |
|
| Commodity swap instruments | 2 | | — |
| | 70 |
|
| Interest make-whole provisions | 2 | | 918 |
| | 1,808 |
|
| Contingent consideration liabilities | 3 | | 678 |
| | 599 |
|
| Total liabilities | | | $ | 7,832 |
| | $ | 5,664 |
|
The fair value of the Company’sour interest rate swaps was determined using cash flow analysis on the expected cash flow of the contract in combination with observable market-based inputs, including interest rate curves and implied volatilities.volatility. As part
AMERESCO, INC.
NOTES TO CONSOLIDATED FINANCIAL STATEMENTS - (Continued)
(in thousands, except per share amounts)
of this valuation, the Companywe considered the credit ratings of the counterparties to the interest rate swaps to determine if a credit risk adjustment was required.
The fair value of the Company’sour commodity swaps was determined using a cash flow analysis on the expected cash flow of the contract in combination with observable forward price inputs obtained from a third-party pricing source. As part of this valuation, the Companywe considered the credit ratings of the counterparties to the commodity swaps to determine if a credit risk adjustment was required.
The fair value of the Company’sour make-whole provisions werewas determined by comparing them against the rates of similar debt instruments under similar terms without a make-whole provision obtained from various highly rated third-party pricing sources.
The fair value of the Company’sour contingent consideration liabilities werewas determined by evaluating the acquired asset’s future financial forecasts and evaluating which, if any, of the cumulative revenue targets, financial metrics and/or milestones are likely to be met. The Company hasWe classified contingent consideration related to certain acquisitions within Levellevel 3 of the fair value hierarchy because the fair value is derived using significant unobservable inputs, which include discount rates, and probability-weighted cash flows. The Companyflows, and volatility. We determined the fair value of itsour contingent consideration obligations based on a probability-weighted income approach derived from financial performance estimates and probability assessments of the attainment of certain targets. The Company establishestargets for some acquisitions. For other acquisitions, we derived the fair value of contingent consideration using a Monte Carlo simulation in an option pricing framework. We established discount rates to be utilized in itsour valuation models based on the cost to borrow that would be required by a market participant for similar instruments. In determining the probability of attaining certain technical, financial and operationoperational targets, the Company utilizeswe utilized data regarding similar milestone events from our own experience, while considering the inherent difficulties and uncertainties in developing a product. On a quarterly basis, the Company reassesseswe reassess the probability factors associated with the financial, operational, and technical targets for itsour contingent consideration obligations. Significant judgment is employed in determining the appropriateness of these assumptions as of the acquisition date and for each subsequent period.
We derived the fair value of the contingent consideration of $2,160 from the acquisition of Plug Smart in December 2021 using a Monte Carlo simulated model. The key assumptions used in the model include two scenarios of EBITDA projections, a base case
AMERESCO, INC.
NOTES TO CONSOLIDATED FINANCIAL STATEMENTS
(In thousands, except per share amounts)
and a higher case, a risk-adjusted discount rate of 14.2%, and estimated EBITDA volatility of 80.0%. We derived the fair value of contingent consideration of $3,800 for the acquisition of Plug Smart as of December 31, 2019,2022 using a Monte Carlo simulated model. The key assumptions used in the model include two scenarios of EBITDA projections, a base case and a higher case, a risk-adjusted discount rate of 16.9%, and estimated EBITDA volatility of 75.0%.
As of December 31, 2022, the key assumptions used in the model related to the contingent consideration from the acquisition of certain assets of Chelsea Group Limited used in the model include a discount rate of 18% for purposes of discounting the low and base case scenarios associated with achievement of the financial based earn-out. The probabilities assigned to these scenarios were 50% for both the low and base case scenarios. An increase or decrease in the probability of achievement of any scenario could result in a significant increase or decrease to the estimated fair value of the contingent consideration liability. The fair value of the contingent consideration from this acquisition was $678 as of December 31, 2021 and was decreased to $358 as of December 31, 2022.
The following table sets forth a summary of changes in the fair value of contingent consideration liabilities classified as Level 3 for the year ended December 31, 2019 and 2018:level 3:
| | | | Year Ended | | Year Ended December 31, |
| | December 31, 2019 | December 31, 2018 | | 2022 | | 2021 |
| Contingent consideration liabilities balance at the beginning of year | $ | 599 |
| $ | — |
| Contingent consideration liabilities balance at the beginning of year | $ | 2,838 | | | $ | 678 | |
| Contingent consideration issued in connection with acquisitions | — |
| 555 |
| Contingent consideration issued in connection with acquisitions | — | | | 2,160 | |
| Loss on change in fair value | 79 |
| 44 |
| |
| Remeasurement period adjustment | | Remeasurement period adjustment | (19) | | | — | |
| Changes in fair value included in earnings | | Changes in fair value included in earnings | 1,614 | | | — | |
| Payment of contingent consideration | | Payment of contingent consideration | (275) | | | — | |
| Contingent consideration liabilities balance at the end of year | $ | 678 |
| $ | 599 |
| Contingent consideration liabilities balance at the end of year | $ | 4,158 | | | $ | 2,838 | |
The fair value of financial instruments is determined by reference to observable market data and other valuation techniques, as appropriate. TheLong-term debt is the only category of financial instruments where the difference between fair value and recorded book value is notable is long-term debt.notable. At December 31, 20192022 and 2018,2021, the fair value of the Company’sour long-term debt was estimated using discounted cash flows analysis, based on the Company’sour current incremental borrowing rates for similar types of borrowing arrangements which are considered to be level two inputs. There have been no transfers in or out of level two or three for the years ended December 31, 20192022 and 2018. Based on the analysis performed,2021.
The following table sets forth the fair value and the carrying value of the Company’sour long-term debt, excluding financing leases,leases:
| | | | | | | | | | | | | | | | | | | | | | | |
| December 31, 2022 | | December 31, 2021 |
| | Fair Value | | Carrying Value | | Fair Value | | Carrying Value |
| Long-term debt value (level 2) | $ | 869,771 | | | $ | 884,054 | | | $ | 442,429 | | | $ | 436,892 | |
We are as follows:
|
| | | | | | | | | | | | | | | |
| | December 31, 2019 | | December 31, 2018 |
| | Fair Value | | Carrying Value | | Fair Value | | Carrying Value |
| Long-term debt value (Level 2) | $ | 309,377 |
| | $ | 307,508 |
| | $ | 211,823 |
| | $ | 212,687 |
|
AMERESCO, INC.
NOTES TO CONSOLIDATED FINANCIAL STATEMENTS - (Continued)
(in thousands, except per share amounts)
The Company is also required to periodically to measure certain other assets at fair value on a nonrecurring basis, including long-lived assets, goodwill, and other intangible assets. The Company determinedWe calculated the fair value used in itsour annual goodwill impairment analysis with its ownutilizing a discounted cash flow analysis. The Company hasanalysis and determined that the inputs used in such analysis as Levelwere level 3 inputs. ThereOther than intangible assets acquired from the Plug Smart acquisition, as noted in Note 4, there were no other assets recorded at fair value on a non-recurring basis atas of December 31, 20192022 or 2018.2021.
AMERESCO, INC.
NOTES TO CONSOLIDATED FINANCIAL STATEMENTS
(In thousands, except per share amounts)
19. DERIVATIVE INSTRUMENTS AND HEDGING ACTIVITIES
At December 31, 2019 and 2018, theThe following table presents information about the fair value amounts of the Company’sour derivative instruments:
| | | | | | | | | | | | | | | | | |
| | | Derivatives as of December 31, |
| | | 2022 | | 2021 |
| Balance Sheet Location | | Fair Value | | Fair Value |
| Derivatives Designated as Hedging Instruments | | | | | |
| Interest rate swap contracts | Other assets | | $ | 1,748 | | | $ | — | |
| Interest rate swap contracts | Other liabilities | | $ | 9 | | | $ | 6,316 | |
| Derivatives Not Designated as Hedging Instruments | | | | | |
| Interest rate swap contracts | Other assets | | $ | 3,454 | | | $ | 919 | |
| | | | | |
| | | | | |
| Commodity swap contracts | Other liabilities | | $ | — | | | $ | 1,962 | |
| Make-whole provisions | Other liabilities | | $ | 5,348 | | | $ | 4,800 | |
|
| | | | | | | | | | | |
| | Derivatives as of December 31, |
| | 2019 | | 2018 |
| | Balance Sheet Location | | Fair Value | | Balance Sheet Location | | Fair Value |
| Derivatives Designated as Hedging Instruments: | | | |
| | | | |
|
| Interest rate swap contracts | Other assets | | $ | 15 |
| | Other assets | | $ | 703 |
|
| Interest rate swap contracts | Other liabilities | | $ | 6,210 |
| | Other liabilities | | $ | 3,187 |
|
| Derivatives Not Designated as Hedging Instruments: | | | | | | | |
| Interest rate swap contracts | Other assets | | $ | — |
| | Other assets | | $ | 30 |
|
| Commodity swap contracts | Other assets | | $ | 198 |
| | Other assets | | $ | 33 |
|
| Interest rate swap contracts | Other liabilities | | $ | 26 |
| | Other liabilities | | $ | — |
|
| Commodity swap contracts | Other liabilities | | $ | — |
| | Other liabilities | | $ | 70 |
|
| Interest make-whole provisions | Other liabilities | | $ | 918 |
| | Other liabilities | | $ | 1,808 |
|
AllAs of December 31, 2022, all but threetwo of the Company’sour freestanding derivatives were designated as hedging instruments and as of December 31, 2019 and2021, all but four of the Company’sour derivatives were designated as hedging instruments as of December 31, 2018.instruments.
The following tables present information about the effects of the Company’sour derivative instruments on the consolidated statements of income and consolidated statements of comprehensive income:
| | | | | | | | | | | | | | | | | | | | | | | |
| Location of (Gain) Loss Recognized in Net Income | | Amount of (Gain) Loss Recognized in Net Income for the Year Ended December 31, |
| | 2022 | | 2021 | | 2020 |
| Derivatives Designated as Hedging Instruments | | | | | | | |
| Interest rate swap contracts | Other expenses, net | | $ | 1,037 | | | $ | 2,086 | | | $ | 1,455 | |
| Derivatives Not Designated as Hedging Instruments | | | | | | | |
| Interest rate swap contracts | Other expenses, net | | $ | (2,738) | | | $ | (996) | | | $ | 51 | |
| Commodity swap contracts | Other expenses, net | | $ | 2,338 | | | $ | 2,325 | | | $ | (165) | |
| Make-whole provisions | Other expenses, net | | $ | (506) | | | $ | (1,089) | | | $ | (591) | |
|
| | | | | | | | | | | | | |
| | Location of (Gain) Loss Recognized in Net Income | | Amount of (Gain) Loss Recognized in Net Income for the Year Ended December 31, |
| | | | 2019 | | 2018 | | 2017 |
| Derivatives Designated as Hedging Instruments: | | | | | | | |
| Interest rate swap contracts | Other expenses, net | | $ | 71 |
| | $ | (196 | ) | | $ | (271 | ) |
Derivatives Not Designated as Hedging Instruments:
| | | | | | | |
| Interest rate swap contracts | Other expenses, net | | $ | 56 |
| | $ | (308 | ) | | $ | — |
|
| Commodity swap contracts | Other expenses, net | | $ | (234 | ) | | $ | 36 |
| | $ | — |
|
| Interest make-whole provisions | Other expenses, net | | $ | (890 | ) | | $ | 337 |
| | $ | — |
|
| | | | | |
| Year Ended December 31, 2022 |
| Derivatives Designated as Hedging Instruments: | |
| Accumulated loss in AOCI at the beginning of the year | $ | (4,733) | |
| |
| Unrealized gain recognized in AOCI | 4,980 | |
| Loss reclassified from AOCI to other expenses, net | 1,037 | |
| Net gain on derivatives | 6,017 | |
| AOCI at the end of the year | $ | 1,284 | |
|
| | | |
| | Year Ended |
| | December 31, 2019 |
| Derivatives Designated as Hedging Instruments: | |
| Accumulated loss in AOCI at the beginning of the period | $ | (1,824 | ) |
| Cumulative impact from the adoption of ASU No. 2018-02 | (217 | ) |
| Unrealized loss recognized in AOCI | (2,630 | ) |
| Gain reclassified from AOCI to other expenses, net | (71 | ) |
| Accumulated loss in AOCI at the end of the period | $ | (4,742 | ) |
AMERESCO, INC.
NOTES TO CONSOLIDATED FINANCIAL STATEMENTS - (Continued)
(inIn thousands, except per share amounts)
In March 2010, the Company entered into a fourteen-year interest rate swap contract under which the Company agreed to pay an amount equal to a specified fixed rate of interest times a notional amount, and to in turn receive an amount equal to a specified variable rate of interest times the same notional principal amount. The swap covered an initial notional amount of approximately $27,900 variable rate note at a fixed interest rate of 3.74% and expired in December 2024. This swap was designated as a hedge in March 2013. During the second quarter of 2014, this swap was de-designated and re-designated as a hedge as a result of a partial pay down of the associated hedged debt principal. As a result $566 was reclassified from accumulated other comprehensive loss and recorded as a reduction to other expenses, net in the Company’s consolidated statements of income (loss) during the second quarter of 2014. During the second quarter 2018, this swap was de-designated as a hedge as a result of the expected pay down of the associated hedged debt principal. As a result, $34 was reclassified from accumulated other comprehensive loss and recorded to other expenses, net in the Company’s consolidated statements of income during the second quarter 2018. In the third quarter of 2018, the expected pay down of the hedged debt principal occurred and the balance of the related hedge was written off. This resulted in a decrease of other liabilities of $252 in the Company’s consolidated balance sheets and a corresponding decrease in other expenses, net in the Company’s consolidated statements of income.
In the third quarter of 2018, the Company adopted ASU 2017-12 Derivatives and Hedging (Topic 815), which resulted in an increase to retained earnings of $432 and accumulated other comprehensive loss of $486 to remove the cumulative effect of hedging ineffectiveness previously recognized in earnings, as of July 1, 2018, for contracts designated as hedging instruments that were outstanding at the beginning of the third quarter 2018. Upon adoption of the ASU, the impact to reclassify the ineffectiveness of the Company’s hedge instruments in connection with prior periods was recorded. Accordingly, the Company’s consolidated statement of changes in redeemable non-controlling interests and stockholders’ equity for the years ended December 31, 2019 and 2018, reflect the adoption of ASU 2017-12.
The followingsfollowing tables present a listingall of all the Company’sour active derivative instruments as of December 31, 2019:
|
| | | | | | |
| Active Interest Rate Swap | Effective Date | Expiration Date | Initial Notional Amount ($) | Status |
| 11-Year, 5.77% Fixed | October 2018 | October 2029 | $ | 9,200 |
| Designated |
| 15-Year, 5.24% Fixed | June 2018 | June 2033 | 10,000 |
| Designated |
| 3-Year, 2.46% Fixed | March 2018 | December 2020 | 17,100 |
| Not Designated |
| 10-Year, 4.74% Fixed | June 2017 | December 2027 | 14,100 |
| Designated |
| 15-Year, 3.26% Fixed | February 2023 | December 2038 | 14,084 |
| Designated |
| 7-Year, 2.19% Fixed | February 2016 | February 2023 | 20,746 |
| Designated |
| 8-Year, 3.70% Fixed | March 2020 | June 2028 | 14,643 |
| Designated |
| 8-Year, 3.70% Fixed | March 2020 | June 2028 | 10,734 |
| Designated |
| 8-Year, 1.71% Fixed | October 2012 | March 2020 | 9,665 |
| Designated |
| 8-Year, 1.71% Fixed | October 2012 | March 2020 | 7,085 |
| Designated |
| 15-Year, 5.30% Fixed | February 2006 | February 2021 | 3,256 |
| Designated |
| 15.5-Year, 5.40% Fixed | September 2008 | March 2024 | 13,081 |
| Designated |
| | | | | | | | | | | | | | | | | | | | | | | | | | |
| Active Interest Rate Swaps | | Effective Date | | Expiration Date | | Initial Notional Amount ($) | | Status |
| 11-Year, 5.77% Fixed | | October 2018 | | October 2029 | | $ | 9,200 | | | Designated |
| 15-Year, 5.24% Fixed | | June 2018 | | June 2033 | | $ | 10,000 | | | Designated |
| 10-Year, 4.74% Fixed | | June 2017 | | December 2027 | | $ | 14,100 | | | Designated |
| 15-Year, 3.26% Fixed | | February 2023 | | December 2038 | | $ | 14,084 | | | Designated |
| 7-Year, 2.19% Fixed | | February 2016 | | February 2023 | | $ | 20,746 | | | Designated |
| 8-Year, 3.70% Fixed | | March 2020 | | June 2028 | | $ | 14,643 | | | Designated |
| 8-Year, 3.70% Fixed | | March 2020 | | June 2028 | | $ | 10,734 | | | Designated |
| 13-Year, 0.93% Fixed | | May 2020 | | March 2033 | | $ | 9,505 | | | Not Designated |
| 13-Year, 0.93% Fixed | | May 2020 | | March 2033 | | $ | 6,968 | | | Not Designated |
| | | | | | |
Active Commodity Swap | Effective Date | Expiration Date | Initial Notional Amount (Volume) | Commodity Measurement | Status |
1-Year, $2.68 MMBtu15.5-Year, 5.40% Fixed | May 2019 | April 2020September 2008 | 437,004 |
March 2024 | MMBtus | Not $ | 13,081 | | | Designated |
1-Year, $2.70 MMBtu Fixed | May 2020 | April 2021 | 435,810 |
| MMBtus | Not Designated | | |
| | | | | | | | | | | | | | | | | | | | | | | | | | |
| Other Derivatives | | Classification | | Effective Date | | Expiration Date | | Fair Value ($) |
| Make-whole provisions | | Liability | | June/August 2018 | | December 2038 | | $ | 697 | |
| Make-whole provisions | | Liability | | August 2016 | | April 2031 | | $ | 55 | |
| Make-whole provisions | | Liability | | April 2017 | | February 2034 | | $ | 46 | |
| Make-whole provisions | | Liability | | November 2020 | | December 2027 | | $ | 48 | |
| Make-whole provisions | | Liability | | October 2011 | | May 2028 | | $ | 14 | |
| Make-whole provisions | | Liability | | May 2021 | | April 2045 | | $ | 129 | |
| Make-whole provisions | | Liability | | July 2021 | | March 2046 | | $ | 3,204 | |
| Make-whole provisions | | Liability | | June 2022 | | March 2042 | | $ | 1,155 | |
AMERESCO, INC.
NOTES TO CONSOLIDATED FINANCIAL STATEMENTS - (Continued)
(in thousands, except per share amounts)
|
| | | | | | |
| Other Derivatives | Classification | Effective Date | Expiration Date | Fair Value ($) |
| Interest make-whole provisions | Liability | June/August 2018 | December 2038 | $ | 918 |
|
20. BUSINESS SEGMENT INFORMATION
The Company reports results under ASC 280, Segment Reporting. The Company’sOur reportable segments for the year ended December 31, 2019 are2022 were U.S. Regions, U.S. Federal, Canada, andAlternative Fuels (formerly Non-Solar Distributed Generation (“Non-Solar DG”). The Company’s), and All Other. On January 1, 2022, we changed the structure of our internal organization, and our “All Other” segment now includes our U.S.-based enterprise energy management services previously included in our U.S Regions segment and our U.S. Regions segment now includes U.S. project revenue and associated costs previously included in our former Non-Solar DG segment. As a result, previously reported amounts have been reclassified for comparative purposes.
Our U.S. Regions, U.S. Federal and Canada segments offer energy efficiency products and services which include the design, engineering, and installation of equipment and other measures to improve the efficiency and control the operation of a facility’s energy infrastructure, renewable energy solutions, and services which include the construction of small-scale plants that the CompanyAmeresco owns or develops for customers that produce electricity, gas, heat, or cooling from renewable sources of energy and O&M services. The Company’s Non-Solar DG
Our Alternative Fuels segment sells electricity, processed renewable gas fuel, heat or cooling, produced from renewable sources of energy, other than solar, and generated by small-scale plants that the Company ownswe own and O&M services for customer owned small-scale plants. The Company’sOur U.S. Regions segment also includes certain small-scale solar grid-tie plants developed for customers. The “All Other” category offers enterprise energy management services, consulting services, and the sale of solar PV energy products and systems which we refer to as integrated-PV. These segments do not include results of other activities, such as corporate operating expenses not specifically allocated to the segments. Certain reportable segments are an aggregation of operating segments.
For the years ended December 31, 2019, 20182022, 2021, and 2017 unallocated corporate expenses were $34,156, $30,4152020, 46.0%, 67.0%, and $27,195, respectively.
For the years ended December 31, 2019, 2018 and 2017 more than 75%71.5%, respectively, of the Company’sour revenues have been derived from federal, state, provincial, or local government entities, including public housing authorities, public universities and public universities.municipal utilities. The U.S. federal government, which is considered a single customer for reporting purposes, constituted 33.2%21.5%, 31.3%32.3%, and 32.0%36.6% of the Company’sour consolidated revenues for the years ended December 31,2019, 2018 2022, 2021, and 2017,2020, respectively. Revenues from the U.S. federal government are included in the Company’sour U.S. Federal segment. Other than the U.S. federal government, one
AMERESCO, INC.
NOTES TO CONSOLIDATED FINANCIAL STATEMENTS
(In thousands, except per share amounts)
customer represented 39.6% and 10.2% of our revenues during the years ended December 31, 2022 and 2021, respectively. Revenues from this customer is included in our U.S. Regions segment.
The reports of the Company’sour chief operating decision maker do not include assets at the operating segment level.
AMERESCO, INC.
NOTES TO CONSOLIDATED FINANCIAL STATEMENTS - (Continued)
(in thousands, except per share amounts)
An analysis of the Company’sThe table below presents our business segment information and reconciliation to theour consolidated financial statements is as follows:statements:
| | | | | | | | | | | | | | | | | | | | | | | | | | | | | | | | | | | |
| | US Regions | | U.S. Federal | | Canada | | Alternative Fuels | | All Other | | Total |
| 2022 | | | | | | | | | | | |
| Revenues | $ | 1,123,343 | | | $ | 391,891 | | | $ | 58,558 | | | $ | 114,459 | | | $ | 136,171 | | | $ | 1,824,422 | |
| (Gain) loss on derivatives | (354) | | | — | | | (152) | | | 294 | | | — | | | (212) | |
| Net interest expense | 6,948 | | | 1,231 | | | 917 | | | 8,657 | | | 22 | | | 17,775 | |
| Depreciation and intangible asset amortization | 21,463 | | | 4,905 | | | 1,702 | | | 23,354 | | | 1,008 | | | 52,432 | |
| Unallocated corporate activity | — | | | — | | | — | | | — | | | — | | | (71,180) | |
| Income before taxes, excluding unallocated corporate activity | 88,531 | | | 50,866 | | | 2,554 | | | 22,989 | | | 11,959 | | | 176,899 | |
| | | | | | | | | | | |
| 2021 | | | | | | | | | | | |
| Revenues | 551,118 | | | 392,948 | | | 49,483 | | | 111,223 | | | 110,925 | | | 1,215,697 | |
| (Gain) loss on derivatives | (1,017) | | | — | | | (73) | | | 1,330 | | | — | | | 240 | |
| Net interest expense | 6,255 | | | 1,294 | | | 879 | | | 5,793 | | | 378 | | | 14,599 | |
| Depreciation and intangible asset amortization | 15,699 | | | 4,666 | | | 1,872 | | | 21,080 | | | 1,440 | | | 44,757 | |
| Unallocated corporate activity | — | | | — | | | — | | | — | | | — | | | (47,361) | |
| Income before taxes, excluding unallocated corporate activity | 38,285 | | | 52,388 | | | 1,581 | | | 27,774 | | | 5,477 | | | 125,505 | |
| | | | | | | | | | | |
| 2020 | | | | | | | | | | | |
| Revenues | 423,654 | | | 377,882 | | | 47,757 | | | 83,628 | | | 99,354 | | | 1,032,275 | |
| (Gain) loss on derivatives | (744) | | | — | | | 153 | | | (114) | | | — | | | (705) | |
| Net interest expense | 6,392 | | | 1,694 | | | 699 | | | 4,467 | | | 184 | | | 13,436 | |
| Depreciation and intangible asset amortization | 12,230 | | | 3,945 | | | 1,584 | | | 20,722 | | | 1,656 | | | 40,137 | |
| Unallocated corporate activity | — | | | — | | | — | | | — | | | — | | | (39,308) | |
| Income before taxes, excluding unallocated corporate activity | 26,227 | | | 44,571 | | | 1,758 | | | 14,509 | | | 8,671 | | | 95,736 | |
|
| | | | | | | | | | | | | | | | | | | | | | | |
| | U.S. Regions | | U.S. Federal | | Canada | | Non-Solar DG | | All Other | | Total Consolidated |
| 2019 | | | | | | | | | | | |
| Revenues | $ | 365,060 |
| | $ | 287,426 |
| | $ | 37,910 |
| | $ | 84,683 |
| | $ | 91,854 |
| | $ | 866,933 |
|
| Interest income | 166 |
| | 208 |
| | — |
| | 82 |
| | 68 |
| | 524 |
|
| Interest expense | 5,858 |
| | 831 |
| | 691 |
| | 5,242 |
| | — |
| | 12,622 |
|
| Depreciation and intangible asset amortization | 9,934 |
| | 3,427 |
| | 1,386 |
| | 21,359 |
| | 1,603 |
| | 37,709 |
|
| Unallocated corporate activity | — |
| | — |
| | — |
| | — |
| | — |
| | (34,156 | ) |
| Income before taxes, excluding unallocated corporate activity | 15,925 |
| | 40,553 |
| | 1,771 |
| | 3,813 |
| | 8,647 |
| | 70,709 |
|
| 2018 | | | | | | | | | | | |
| Revenues | 334,344 |
| | 246,309 |
| | 38,982 |
| | 82,655 |
| | 84,848 |
| | 787,138 |
|
| Interest income | 9 |
| | 126 |
| | — |
| | 147 |
| | — |
| | 282 |
|
| Interest expense | 6,188 |
| | 1,045 |
| | 1,917 |
| | 6,172 |
| | 22 |
| | 15,344 |
|
| Depreciation and intangible asset amortization | 5,578 |
| | 2,772 |
| | 1,155 |
| | 18,101 |
| | 1,542 |
| | 29,148 |
|
| Unallocated corporate activity | — |
| | — |
| | — |
| | — |
| | — |
| | (30,415 | ) |
| Income (loss) before taxes, excluding unallocated corporate activity | 20,543 |
| | 36,332 |
| | (2,746 | ) | | 13,412 |
| | 5,264 |
| | 72,805 |
|
| 2017 | | | | | | | | | | | |
| Revenues | 290,196 |
| | 229,146 |
| | 43,803 |
| | 79,220 |
| | 74,787 |
| | 717,152 |
|
| Interest income | 2 |
| | 44 |
| | 1 |
| | 83 |
| | — |
| | 130 |
|
| Interest expense | 2,672 |
| | 1,056 |
| | 1,927 |
| | 3,389 |
| | 38 |
| | 9,082 |
|
| Depreciation and intangible asset amortization | 2,974 |
| | 2,623 |
| | 1,178 |
| | 15,259 |
| | 1,881 |
| | 23,915 |
|
| Unallocated corporate activity | — |
| | — |
| | — |
| | — |
| | — |
| | (27,195 | ) |
| Income before taxes, excluding unallocated corporate activity | 13,865 |
| | 29,261 |
| | 1,751 |
| | 8,115 |
| | 2,920 |
| | 55,912 |
|
Information as to the Company’sSee Note 3 for additional information about our revenues by serviceproduct line.
21. SUBSEQUENT EVENTS
On February 24, 2023, we signed a definitive purchase and product linessale agreement to acquire Enerqos Energy Solutions S.r.l., a renewable energy and energy efficiency company headquartered in Milan, Italy. With this acquisition, we expect to expand our portfolio of clean energy projects and solutions throughout Italy. The acquisition is as follows:expected to close in March 2023.
|
| | | | | | | | | | | |
| | Year Ended December 31, |
| | 2019 | | 2018 | | 2017 |
| Project | $ | 611,064 |
| | $ | 545,053 |
| | $ | 506,550 |
|
| Energy Assets | 98,042 |
| | 95,776 |
| | 69,241 |
|
| O&M | 66,709 |
| | 65,236 |
| | 60,574 |
|
| Integrated-PV | 47,953 |
| | 41,349 |
| | 38,796 |
|
| Other Services | 43,165 |
| | 39,724 |
| | 41,991 |
|
| Total Revenues | $ | 866,933 |
| | $ | 787,138 |
| | $ | 717,152 |
|
AMERESCO, INC.
NOTES TO CONSOLIDATED FINANCIAL STATEMENTS - (Continued)
(in thousands, except per share amounts)
21. QUARTERLY INFORMATION (Unaudited)
The following tables set forth selected unaudited consolidated statements ofincome data for each of the most recent eight quarters ended December 31, 2019. Operating results for any quarter are not necessarily indicative of results for any future period.
|
| | | | | | | | | | | | | | | |
| | Three Months Ended, |
| | March 31 | | June 30 | | September 30 | | December 31 |
| 2019 | | | | | | | |
| Revenues | $ | 150,112 |
| | $ | 198,183 |
| | $ | 212,026 |
| | $ | 306,612 |
|
| Gross profit | $ | 32,632 |
| | $ | 43,139 |
| | $ | 44,693 |
| | $ | 47,654 |
|
| Net income attributable to common shareholders | $ | 4,147 |
| | $ | 9,216 |
| | $ | 8,870 |
| | $ | 22,203 |
|
| Net income per share attributable to common shareholders: | | | | | | | |
| Basic | $ | 0.09 |
| | $ | 0.20 |
| | $ | 0.19 |
| | $ | 0.47 |
|
| Diluted | $ | 0.09 |
| | $ | 0.19 |
| | $ | 0.19 |
| | $ | 0.46 |
|
| Weighted average common shares outstanding: | | | | | | | |
| Basic | 46,293 |
| | 46,387 |
| | 46,555 |
| | 47,101 |
|
| Diluted | 47,654 |
| | 47,681 |
| | 47,693 |
| | 48,061 |
|
| | | | | | | | |
| 2018 | |
| Revenues | $ | 167,410 |
| | $ | 196,982 |
| | $ | 205,375 |
| | $ | 217,371 |
|
| Gross profit | $ | 35,473 |
| | $ | 42,776 |
| | $ | 46,162 |
| | $ | 49,201 |
|
| Net income attributable to common shareholders | $ | 6,988 |
| | $ | 8,702 |
| | $ | 10,701 |
| | $ | 11,593 |
|
| Net income per share attributable to common shareholders: | | | | | | | |
| Basic | $ | 0.15 |
| | $ | 0.19 |
| | $ | 0.23 |
| | $ | 0.25 |
|
| Diluted | $ | 0.15 |
| | $ | 0.19 |
| | $ | 0.23 |
| | $ | 0.24 |
|
| Weighted average common shares outstanding: | | | | | | | |
| Basic | 45,373 |
| | 45,470 |
| | 45,854 |
| | 46,114 |
|
| Diluted | 45,994 |
| | 46,406 |
| | 46,944 |
| | 47,327 |
|
| | | | | | | | |
REPORT OF INDEPENDENT REGISTERED PUBLIC ACCOUNTING FIRM
To the Board of Directors and Shareholders of
Ameresco, Inc.
Opinions on the Financial Statements and Internal Control over Financial Reporting
We have audited the accompanying consolidated balance sheets of Ameresco, Inc. and Subsidiaries (the Company) as of December 31, 2019 and 2018 and the related consolidated statements of income, comprehensive income, changes in redeemable non-controlling interest and stockholders’ equity, and cash flows for each of the years in the three-year period ended December 31, 2019, and the related notes (collectively, the financial statements). We also have audited the Company's internal control over financial reporting as of December 31, 2019, based on the criteria established in Internal Control - Integrated Framework issued by the Committee of Sponsoring Organizations of the Treadway Commission in 2013.
In our opinion, the financial statements referred to above present fairly, in all material respects, the financial position of the Company as of December 31, 2019 and 2018, and the results of its operations and its cash flows for each of the three years in the period ended December 31, 2019 in conformity with accounting principles generally accepted in the United States of America. Also in our opinion, the Company maintained, in all material respects, effective internal control over financial reporting as of December 31, 2019, based on the criteria established in Internal Control - Integrated Framework issued by the Committee of Sponsoring Organizations of the Treadway Commission in 2013.
Basis for Opinion
The Company's management is responsible for these financial statements, for maintaining effective internal control over financial reporting, and for its assessment of the effectiveness of internal control over financial reporting, included in the accompanying Management’s Annual Report on Internal Control over Financial Reporting. Our responsibility is to express an opinion on the Company's financial statements and an opinion on the Company's internal control over financial reporting based on our audits. We are a public accounting firm registered with the Public Company Accounting Oversight Board (United States) ("PCAOB") and are required to be independent with respect to the Company in accordance with the U.S. federal securities laws and the applicable rules and regulations of the Securities and Exchange Commission and the PCAOB.
We conducted our audits in accordance with the standards of the PCAOB. Those standards require that we plan and perform the audits to obtain reasonable assurance about whether the financial statements are free of material misstatement, whether due to error or fraud, and whether effective internal control over financial reporting was maintained in all material respects.
Our audits of the financial statements included performing procedures to assess the risks of material misstatement of the financial statements, whether due to error or fraud, and performing procedures that respond to those risks. Such procedures included examining, on a test basis, evidence regarding the amounts and disclosures in the financial statements. Our audits also included evaluating the accounting principles used and significant estimates made by management, as well as evaluating the overall presentation of the financial statements. Our audit of internal control over financial reporting included obtaining an understanding of internal control over financial reporting, assessing the risk that a material weakness exists, and testing and evaluating the design and operating effectiveness of internal control based on the assessed risk. Our audits also included performing such other procedures as we considered necessary in the circumstances. We believe that our audits provide a reasonable basis for our opinions.
Definition and Limitations of Internal Control Over Financial Reporting
A company's internal control over financial reporting is a process designed to provide reasonable assurance regarding the reliability of financial reporting and the preparation of financial statements for external purposes in accordance with generally accepted accounting principles. A company's internal control over financial reporting includes those policies and procedures that (1) pertain to the maintenance of records that, in reasonable detail, accurately and fairly reflect the transactions and dispositions of the assets of the company; (2) provide reasonable assurance that transactions are recorded as necessary to permit preparation of financial statements in accordance with generally accepted accounting principles, and that receipts and expenditures of the company are being made only in accordance with authorizations of management and directors of the company; and (3) provide reasonable
assurance regarding prevention or timely detection of unauthorized acquisition, use, or disposition of the company's assets that could have a material effect on the financial statements.
Because of its inherent limitations, internal control over financial reporting may not prevent or detect misstatements. Also, projections of any evaluation of effectiveness to future periods are subject to the risk that controls may become inadequate because of changes in conditions, or that the degree of compliance with the policies or procedures may deteriorate.
/s/ RSM US LLP
We have served as the Company's auditor since 2010.
Boston, Massachusetts
March 4, 2020
Item 9. Changes in and Disagreements with Accountants on Accounting and Financial Disclosure
None.
Item 9A. Controls and Procedures
Evaluation of Disclosure Controls and Procedures
Our management, with the participation of our principal executive officer and principal financial officer, evaluated the effectiveness of our disclosure controls and procedures, as defined in Rules 13a-15(e) and 15d-15(e) under the Exchange Act, as of the end of the period covered by this annual report, or the evaluation date. Disclosure controls and procedures are designed to ensure that information required to be disclosed by a company in the reports that it files or submits under the Exchange Act is recorded, processed, summarized and reported, within the time periods specified in the SEC’s rules and forms. Our management recognizes that any controls and procedures, no matter how well designed and operated, can provide only reasonable assurance of achieving their objectives, and management necessarily applies its judgment in evaluating the cost-benefit relationship of possible controls and procedures. Our management, after evaluating the effectiveness of our disclosure controls and procedures as of the evaluation date, concluded that as of the evaluation date, our disclosure controls and procedures were effective at the reasonable assurance level.
Management’s Annual Report on Internal Control over Financial Reporting
Our management, with the participation of our principal executive officer and principal financial officer, is responsible for establishing and maintaining adequate internal control over our financial reporting as defined in Rules 13a-15(f) and 15d-15(f) under the Exchange Act as a process designed by, or under the supervision of, a company’s principal executive and principal financial officers and effected by our board of directors, management, and other personnel to provide reasonable assurance regarding the reliability of financial reporting and the preparation of financial statements for external purposes in accordance with GAAP. Our internal control over financial reporting includes those policies and procedures that:
•pertain to the maintenance of records that, in reasonable detail, accurately and fairly reflect our transactions and dispositions of our assets;assets,
•provide reasonable assurance that transactions are recorded as necessary to permit preparation of financial statements in accordance with GAAP, and that our receipts and expenditures are being made only in accordance with authorizations of our management and directors;directors, and
•provide reasonable assurance regarding prevention or timely detection of unauthorized acquisition, use, or disposition of our assets that could have a material effect on our financial statements.
Because of its inherent limitations, internal control over financial reporting may not prevent or detect misstatements. Projections of any evaluation of effectiveness to future periods are subject to the risk that controls may become inadequate because of changes in conditions, or that the degree of compliance with the policies or procedures may deteriorate.
Our management assessed the effectiveness of our internal control over financial reporting as of December 31, 2019.2022. In making this assessment, management used the criteria set forth by the Committee of Sponsoring Organizations of the Treadway Commission (COSO) in Internal Control - Integrated Framework (2013).
Based on this assessment and those criteria, our management concluded that, as of December 31, 2019,2022, our internal control over financial reporting was effective.
The effectiveness of our internal control over financial reporting as of December 31, 20192022 has been audited by RSM US LLP, an independent registered public accounting firm, as stated in their report, which appears under Item 8.
Changes in Internal Control over Financial Reporting
ThereDuring the year ended December 31, 2022, we implemented a new Enterprise Resource Planning (“ERP”) system. In connection with this ERP implementation, we updated and will continue to update our internal control over financial reporting, as necessary, to accommodate modifications to our business processes and accounting procedures. We do not believe this implementation has had or will have a material adverse effect on our internal control over financial reporting.
Except as disclosed above, there were no changes in our internal control over financial reporting other than those stated above, during our most recent fiscal quarter that have materially affected, or are reasonably likely to materially affect, our internal control over financial reporting.
Item 9B. Other Information
None.
PART III
Item 9C. Disclosure Regarding Foreign Jurisdictions that Prevent Inspections
Not applicable.
PART III
Item 10. Directors, Executive Officers, and Corporate Governance
The information concerningcomplete response to this Item regarding the backgrounds of our executive officers is set forth under the heading “Executive Officers” at the endand directors and other information required by Items 401, 405 and 407 of Item 1Regulation S-K will be contained in Part Iour definitive proxy statement for our 2023 annual meeting of this report.stockholders
Code of Business Conduct and Ethics: We have adopted a written code of business conduct and ethics that appliesis applicable to all of our directors,employees, officers and employees,directors including our principalchief executive officer principaland senior financial officer, principal accounting officer or controller, and persons performing similar functions. A copy of the code of business conduct and ethicsofficers, which is posted onavailable under the Investor Relations section of our website which is located at www.ameresco.com. In addition, we intend to post on our website all disclosures that are required by law or applicable NYSE listing standards concerning any amendments to, or waivers from, any provision of the code. We include our website address in this report only as an inactive textual reference and do not intend it to be an active link to our website. None of the material on our website is part of this Annual Report on Form 10-K.
The response to the remainder of this item is incorporated by reference from the discussion responsive thereto in the sections titled “Corporate Governance” and “Stock Ownership - Section 16(a) Beneficial Ownership Reporting Compliance” contained in the definitive proxy statement for our 2020 annual meeting of stockholders.
Item 11. Executive Compensation
The response to this item is incorporated by reference from the discussion responsive thereto in the sections titled “Executive Compensation and Related Information” and “Corporate Governance” contained in the definitive proxy statement for our 20202023 annual meeting of stockholders.
Item 12. Security Ownership of Certain Beneficial Owners and Management and Related Stockholder Matters
Equity Compensation Plan Information
The following table provides information about the securities authorized for issuance under our equity compensation plans as of December 31, 2019:
Equity Compensation Plan Information
|
| | | | | | | | | | |
| | | (a) | | (b) | | (c) |
| Plan category | | Number of securities to be issued upon exercise of outstanding options, warrants and rights | | Weighted-average exercise price of outstanding options, warrants and rights | | Number of securities remaining available for future issuance under equity compensation plans (excluding securities reflected in column (a)) |
Equity compensation plans approved by security holders(1)(2) | | 3,505,000 |
| | $ | 10.524 |
| | 5,785,049 |
|
| Equity compensation plans not approved by security holders | | — |
| | — |
| | — |
|
| Total | | 3,505,000 |
| | $ | 10.524 |
| | 5,785,049 |
|
| |
(1) | Consists of our 2000 stock incentive plan and our 2010 stock incentive plan and our 2017 employee stock purchase plan. |
| |
(2) | Consists of 5,717,228 shares of our class A common stock remaining available for future issuance are under our 2010 stock incentive plan and 99,655 shares of our class A common stock remaining available for future issuance under our 2017 employee stock purchase plan, including shares subject to purchase during the current purchase period. In addition to being available for future issuance upon exercise of options that may be granted after December 31, 2019, shares under our 2010 stock incentive plan may instead be issued in the form of stock appreciation rights, restricted stock, restricted stock units and other stock-based awards.
|
The response to the remainder of this item is incorporated by reference from the discussion responsive thereto in the section titled “Stock Ownership” contained in the definitive proxy statement for our 20202023 annual meeting of stockholders.
Item 13. Certain Relationships and Related Transactions, and Director Independence
The response to this item is incorporated by reference from the discussion responsive thereto in the sections titled “Certain Relationships and Related Person Transactions” and “Corporate Governance” contained in the definitive proxy statement for our 20202023 annual meeting of stockholders.
Item 14. Principal Accountant Fees and Services
The response to this item is incorporated by reference from the discussion responsive thereto in the section titled “Proposal 2 - Ratification of the Selection of our Independent Registered Public Accounting Firm” contained in the definitive proxy statement for our 20202023 annual meeting of stockholders.
PART IV
Item 15. Exhibits and Financial Statement Schedules
(a)(1) Consolidated Financial Statements.
The following consolidated financial statements of Ameresco, Inc. are filed in Item 8 of this Annual Report on Form 10-K:
(2) Financial Statement Schedules.
Schedules are omitted because they are not applicable, or are not required, or because the information is included in the consolidated financial statements and notes thereto.
(3) Exhibits.
The exhibits filed or furnished with this report or that are incorporated herein by reference are set forth in the Exhibit Index immediately preceding such exhibits, which Exhibit Index is incorporated herein by reference.
SIGNATURE
Pursuant to the requirements of Section 13 or 15(d) of the Securities Exchange Act of 1934, the Registrant has duly caused this report to be signed on its behalf by the undersigned, thereunto duly authorized.
|
| | |
| AMERESCO, INC. |
Date: March 4, 2020 | By: | /s/ George P. Sakellaris |
| | George P. Sakellaris |
| | President and Chief Executive Officer |
SIGNATURES
Pursuant to the requirements of the Securities Exchange Act of 1934, this Annual Report on Form 10-K has been signed below by the following persons on behalf of the Registrant and in the capacities and on the dates indicated.
|
| | | | |
Signature | | Title | | DatePage |
/s/ George P. Sakellaris | (a)(1) | Chairman of the Board of Directors,
President and Chief Executive Officer
(Principal Executive Officer)Financial Statements: See “Index to Consolidated Financial Statements”
| | March 4, 2019 |
George P. Sakellaris | | | |
/s/ Spencer Doran Hole | (a)(2) | Senior Vice President and Chief Financial Officer
(Principal Financial Officer)Statement Schedules: None
| | March 4, 2019 |
Spencer Doran Hole | | | |
/s/ Mark Chiplock | | Vice President and Chief Accounting Officer
(Principal Accounting Officer)
| | March 4, 2019 |
Mark Chiplock | | | |
/s/ David J. Anderson | | Director | | March 4, 2019 |
David J. Anderson | | | | |
/s/ David J. Corrsin | | Director | | March 4, 2019 |
David J. Corrsin | | | | |
/s/ Douglas I. Foy | | Director | | March 4, 2019 |
Douglas I. Foy | | | | |
/s/ Thomas S. Murley | | Director | | March 4, 2019 |
Thomas S. Murley | | | | |
/s/ Nickolas Stavropoulos | | Director | | March 4, 2019 |
Nickolas Stavropoulos | | | | |
/s/ Jennifer L. Miller | | Director | | March 4, 2019 |
Jennifer L. Miller | | | | |
/s/ Joseph W. Sutton | | Director | | March 4, 2019 |
Joseph W. Sutton | | | | |
/s/ Frank V. Wisneski | | Director | | March 4, 2019 |
Frank V. Wisneski | | | | |
Exhibit Index
|
| Schedules are omitted because they are not applicable, or are not required, or because the information is included in the consolidated financial statements and notes thereto. | |
Exhibit(a)(3)
| Exhibits: | |
Number
| Description | | | | |
| Exhibit Number | Exhibit Description |
| 3.1 | |
| 3.2 | |
| 4.1 | |
4.16*4.16 | |
| 10.1.1 | |
10.2.1+10.1.2 | |
10.2.2+ | |
10.2.3+ | |
| 10.3.1+ | |
| 10.3.2+ | |
| | | | | |
Exhibit
Number | Description |
| |
| |
| 10.3.3+ | |
| 10.4.1+ | |
| 10.4.2+ | |
| 10.4.3+ | |
| 10.5.1+ | |
10.4.2+10.5.2+ | |
10.5.1+10.6+ | |
| 10.7+ | |
|
| |
Exhibit
Number
| Description |
10.6.1+10.8+ | |
10.7+10.9+ | |
| 10.10# | |
| 10.11** | |
| 10.12** | |
| 21.1* | |
| 23.1* | |
| 31.1* | |
| 31.2* | |
| 32.1** | |
| 101 | The following consolidated financial statements from Ameresco, Inc.’s Annual Report on Form 10-K for the year ended December 31, 2019,2022, formatted in XBRL (Extensible Business Reporting Language): (i) Consolidated Balance Sheets (ii) Consolidated Statements of Income, (iii) Consolidated Statements of Comprehensive Income, (iv) Consolidated Statement of Changes in Redeemable Non-Controlling Interests and Stockholders’ Equity, (v) Consolidated Statements of Cash Flows, and (vi) Notes to Consolidated Financial Statements. |
| 104* | Cover Page Interactive Data File (formatted as Inline XBRL and contained in Exhibit 101) |
| |
| * | Filed herewith. |
| |
| + | Identifies a management contract or compensatory plan or arrangement in which an executive officer or director of Ameresco participates. |
| # | Certain portions of this exhibit are considered confidential and have been omitted as permitted under SEC rules and regulations. Schedules and exhibits have been omitted pursuant to Item 601(b)(2) of Regulation S-K. |
SIGNATURE
Pursuant to the requirements of Section 13 or 15(d) of the Securities Exchange Act of 1934, the Registrant has duly caused this report to be signed on its behalf by the undersigned, thereunto duly authorized.
| | | | | | | | |
++ | Confidential treatment requested as to certain portions, which portions have been omittedAMERESCO, INC. |
| Date: February 28, 2023 | By: | /s/ George P. Sakellaris |
| | George P. Sakellaris |
| | President and filed separately with the Securities and Exchange Commission.Chief Executive Officer |
SIGNATURES
Pursuant to the requirements of the Securities Exchange Act of 1934, this Annual Report on Form 10-K has been signed below by the following persons on behalf of the Registrant and in the capacities and on the dates indicated.
| | | | | | | | | | | | | | |
| Signature | | Title | | Date |
| /s/ George P. Sakellaris | | Chairman of the Board of Directors,
President and Chief Executive Officer
(Principal Executive Officer) | | February 28, 2023 |
| George P. Sakellaris | | | |
| /s/ Spencer Doran Hole | | Executive Vice President and Chief Financial Officer
(Principal Financial Officer) | | February 28, 2023 |
| Spencer Doran Hole | | | |
| /s/ Mark Chiplock | | Senior President and Chief Accounting Officer
(Principal Accounting Officer) | | February 28, 2023 |
| Mark Chiplock | | | |
| /s/ David J. Corrsin | | Director | | February 28, 2023 |
| David J. Corrsin | | | | |
| /s/ Claire Hughes Johnson | | Director | | February 28, 2023 |
| Claire Hughes Johnson | | | | |
| /s/ Nickolas Stavropoulos | | Director | | February 28, 2023 |
| Nickolas Stavropoulos | | | | |
| /s/ Jennifer L. Miller | | Director | | February 28, 2023 |
| Jennifer L. Miller | | | | |
| /s/ Joseph W. Sutton | | Director | | February 28, 2023 |
| Joseph W. Sutton | | | | |
| /s/ Frank V. Wisneski | | Director | | February 28, 2023 |
| Frank V. Wisneski | | | | |