UNITED STATES
SECURITIES AND EXCHANGE COMMISSION
Washington, D.C. 20549
FORM 10-K
|
| |
| x | ANNUAL REPORT PURSUANT TO SECTION 13 OR 15(d) OF THE SECURITIES EXCHANGE ACT OF 1934 |
For the fiscal year ended December 31, 20142016
OR
|
| |
| ¨ | TRANSITION REPORT PURSUANT TO SECTION 13 OR 15(d) OF THE SECURITIES EXCHANGE ACT OF 1934 |
For the transition period from to
Commission file number 001-35339
ANGIE’S LIST, INC.
(Exact name of registrant as specified in its charter)
|
| | |
| Delaware | | 27-2440197 |
| (State or other jurisdiction of incorporation or organization) | | (I.R.S. Employer Identification Number) |
| 1030 E. Washington Street Indianapolis, IN | | 46202 |
| (Address of principal executive offices) | | (Zip Code) |
|
|
| (888) 888-5478 |
| (Registrant’s telephone number, including area code) |
Securities registered pursuant to Section 12(b) of the Act:
|
| | |
| Common Stock, $0.001 par value | | The NASDAQ Global Market |
| (Title of each class) | | (Name of each exchange on which registered) |
Securities registered pursuant to Section 12(g) of the Act:
|
|
| None |
| (Title of each class) |
Indicate by check mark if the registrant is a well-known seasoned issuer, as defined in Rule 405 of the Securities Act. Yes ☐¨ No ☒x
Indicate by check mark if the registrant is not required to file reports pursuant to Section 13 or Section 15(d) of the Exchange Act. Yes ☐¨ No ☒x
Indicate by check mark whether the registrant (1) has filed all reports required to be filed by Section 13 or 15(d) of the Securities Exchange Act of 1934 during the preceding 12 months (or for such shorter period that the registrant was required to file such reports), and (2) has been subject to such filing requirements for the past 90 days. Yes ☒x No ☐¨
Indicate by check mark whether the registrant has submitted electronically and posted on its corporate Web site, if any, every Interactive Data File required to be submitted and posted pursuant to Rule 405 of Regulation S-T (§232.405 of this chapter) during the preceding 12 months (or for such shorter period that the registrant was required to submit and post such files). Yes ☒x No ☐¨
Indicate by check mark if disclosure of delinquent filers pursuant to Item 405 of Regulation S-K is not contained herein, and will not be contained, to the best of registrant’s knowledge, in definitive proxy or information statements incorporated by reference in Part III of this Form 10-K or any amendment to this Form 10-K. ☐x
Indicate by check mark whether the registrant is a large accelerated filer, an accelerated filer, a non-accelerated filer, or a smaller reporting company. See the definitions of “large accelerated filer,” “accelerated filer” and “smaller reporting company” in Rule 12b-2 of the Exchange Act.
|
| | | |
| Large accelerated filer | ☒¨
| Accelerated filer | ☐x
|
| Non-accelerated filer | ☐¨ (Do not check if a smaller reporting company) | Smaller reporting company | ☐¨ |
Indicate by check mark whether the registrant is a shell company (as defined in Rule 12b-2 of the Exchange Act). Yes ☐¨ No ☒x
The aggregate market value of the voting common stock held by non-affiliates of the registrant as of June 30, 2014,2016, computed by reference to the number of shares outstanding and using the price at which the stock was last sold, was $523,395,679.$256,325,912.
As of February 23, 2015,17, 2017, the number of shares of the registrant’s common stock outstanding was 58,516,677.59,429,518.
DOCUMENTS INCORPORATED BY REFERENCE
Portions of the registrant’s Definitive Proxy Statement relating to its 2015 annual meeting2017 Annual Meeting of stockholders,Stockholders, to be filed subsequent to the date hereof, are incorporated by reference into Part III of this Annual Report on Form 10-K where indicated. Such Definitive Proxy Statement will be filed with the Securities and Exchange Commission not later than 120 days after the conclusion of the registrant’s fiscal year ended December 31, 2014.2016. Except with respect to information specifically incorporated by reference in this Annual Report on Form 10-K, the Definitive Proxy Statement is not deemed to be filed as part of this Annual Report on Form 10-K.
|
| | |
| Table of Contents |
| | Page No. |
| |
| | |
| | |
| | |
| | |
| | |
| | |
| | |
| |
| | |
| | |
| | |
| | |
| | |
| | |
| | |
| | |
| | |
| |
| | |
| | |
| | |
| | |
| | |
| | |
| |
| | |
| | |
| | | |
PART I
SPECIAL NOTE REGARDING FORWARD-LOOKING STATEMENTS AND INDUSTRY DATA
This Annual Report on Form 10-K (this “Form 10-K”) contains statements that constitute “forward-looking statements” within the meaning of the Private Securities Litigation Reform Act of 1995, Section 27A of the Securities Act of 1933 and Section 21E of the Securities Exchange Act of 1934, each as amended.1995. All statements other than statements of historical fact, including statements regarding market and industry prospects and future results of operations or financial position, made in this Annual Report on Form 10-K are forward-looking. In many cases, you can identify forward-looking statements by terminology, such as “may”, “should”, "will"“will”, “expects”, “intends”, “plans”, “anticipates”, “believes”, “estimates”, “predicts”, “potential” or “continue” or the negative of such terms and other comparable terminology. The forward-looking information may include, among other information, statements concerning our estimated and projected earnings, revenues, costs, expenditures, cash flows, growth rates, financial results, our plans and objectives for future operations, changes to our business model, growth initiatives or strategies, profitability plans, evaluation of strategic alternatives, availability of debt or equity financing to support our liquidity needs or the expected outcome or impact of pending or threatened litigation. There may also be other statements of expectations, beliefs, future plans and strategies, anticipated events or trends and similar expressions concerning matters that are not historical facts. Readers are cautioned that any such forward-looking statements are not guarantees of future performance and involve risks and uncertainties. Actual results may differ materially from those in the forward-looking statements as a result of various factors, many of which are beyond the Company’s control.
The Company has based these forward-looking statements on its current expectations and projections about future events. Although the Company believes that the assumptions on which the forward-looking statements contained herein are based are reasonable, any of those assumptions could prove to be inaccurate. As a result, the forward-looking statements based upon those assumptions also could be incorrect. Risks and uncertainties may affect the accuracy of forward-looking statements, including, without limitation, those set forth in Item 1A of this Annual Report on Form 10-K and in other reports we file with the Securities and Exchange Commission ("SEC"(“SEC”).
The forward-looking statements included in this report are made only as of the date hereof. The Company undertakes no obligation to publicly update or revise any forward-looking statements, whether as a result of new information, future events or otherwise, except as required by law.
ITEM 1. BUSINESS
Overview
Angie's List operatesWe operate a national local services consumer review service and marketplace where consumers canwith a mission of improving the local service experience for both members and service providers. To that end, we help facilitate happy transactions between more than five million members and our collection of service providers in over 700 categories of service nationwide. Built on a foundation of more than ten million verified reviews of local services, our unique tools, services and content across multiple platforms enable members to research, shop for and purchase local services for critical needs, such as home, health and automotive services, as well as rate and review the providers of these services across 253 markets in the United States.services. Our ratings and reviews, which are now available only to members free-of-charge following our members,introduction of a free membership tier during 2016, assist our members in identifying and hiring the besta provider for their local service needs.
We help consumers purchase "high cost of failure" services in an extremely fragmented local services marketplace. These services are typically expensive and carry a high cost to the consumer if performed poorly. Consumers seeking reputable providers of local services are often forced to rely on data from word-of-mouth testimonials, local advertisements, the Yellow Pages or Internet search results, all of which may be incomplete, unreliable or misleading. Our ratings are based exclusively on reviews from our members, and we do not accept anonymous reviews. As a result, we believe our reviews are a trusted resource for consumers seeking high-quality service providers.
In addition to serving as a reliable source of vital information on providers of local services for consumers, we also assist service providers in finding quality customers and differentiating themselves in a competitive marketplace. As of December 31, 2014, we offered our service to more than three million paying members, who represent an attractive, targeted group of consumers for service providers. Our typical member is between the ages of 35 and 64, is married, owns a home, is college educated and earns an annual household income of at least $75,000 based on information derived from third-party demographic data and interpreted by us.
We enable highly-rated service providers to advertise discounts and other promotions to our consumers across our platforms, which include our website, mobile application, email promotions, monthly magazine and our call center. Beyond traditional advertising on our platforms, our e-commerce marketplace solutions offer highly-rated service providers the opportunity to sell their services through us to our members as well as visitors to our website and mobile application.
The value proposition we offer to both consumers and service providers strengthens our position as a trusted resource and enables us to derive revenue from both consumers and service providers. As more consumers contribute reviews to our service, we increase the breadth and depth of content and offerings available to consumers, attracting more traffic to our platforms and enhancing the value of our service to reputable service providers for whom our consumers constitute a large pool of qualified customers. We believe our strong levels of consumer engagement and our consistent membership and service provider renewal rates are evidence of the value we offer both consumers and service providers.
As we continue the process of transitioning our business to a marketplace model wherein we act as an intermediary in local services transactions between consumers and service providers, our approach to generating revenue from e-commerce has evolved such that e-commerce is now becoming a core component of the holistic value proposition we offer to service providers and an increasingly important aspect of our service provider pricing and monetization strategies. Accordingly, we are making substantial investments in the development of our marketplace platforms and initiatives in an effort to provide greater value to consumers, improve consumer engagement, drive higher dollar service provider renewals, increase the number of service providers who sell e-commerce and enhance service provider retention. Our completely redesigned mobile application gives consumers three easy ways to get work done: (1) search for providers, (2) shop for specific home improvement services and (3) SnapFix a project, which is our revolutionary new feature that eliminates the hassle of hiring a professional.
Our Services
We help facilitate happy transactions between consumers nationwidegenerate revenue from both members and service providers as reflected in the table below for the years ended December 31, 2016, 2015 and 2014:
|
| | | | | | | | | | | | |
| | | Year Ended December 31, |
| | | 2016 | | 2015 | | 2014 |
| | | | | | | |
| | | (in thousands) |
| Revenue | | | | | | |
| Membership | | $ | 58,090 |
| | $ | 67,992 |
| | $ | 73,113 |
|
| Service provider | | 265,239 |
| | 276,133 |
| | 241,898 |
|
| Total revenue | | $ | 323,329 |
| | $ | 344,125 |
| | $ | 315,011 |
|
Member Services. During 2016, we introduced a free membership tier that provides access to our ratings and reviews in all markets free-of-charge for the first time. We continue to offer paid membership tiers as well, and our collectionprimary source of highly-rated service providersmembership revenue remains subscription fees. The subscription fees are typically charged in more than 720 categoriesadvance and recognized ratably over the term of service, ranging from home improvement to health care. Built on a foundation of authentic reviews of local service, Angie's List connects consumers directly to its online marketplace of services from member-reviewed providers and offers unique tools and support designed to improve the local service experience for both consumers and service professionals.
Member Services
membership, which is generally twelve months in length. We compile a breadth of highly relevant, member-generated ratings and reviews that provide insights that wouldwhich could otherwise be difficult for consumers to obtain on their own. We collect reviews from both members and non-members, and we actively monitor for fraudulent reviews. Only our members’reviews, and only verified reviews factor into service providers’ ratings,ratings.
Under our current tiered pricing membership structure, we now offer a free tier (Green) and consumers must subscribe to our service in order to access our ratingstwo paid tiers (Silver and reviews.
Our members’ reviews span more than 720 categories of service. Consumers may purchase monthly, annual or multi-year memberships to Angie’s List in one of three membership plans: (1) Basic, (2) Plus or (3) Premium, each of whichGold). Each tier offers a different levelunique levels of service and membership benefits to our members, including varying access to reviews,degrees of online and phone support, offers, rebatesaccess to discounts and promotions, all at tieredour award-winning Angie’s List Magazine. The Angie’s Fair Price Guarantee, which promises a fair price points. The table below highlightsfor purchases made in our e-commerce marketplace, and the Angie’s Service Quality Guarantee, which promises satisfaction with the quality delivered by service providers on purchases of services made through our e-commerce marketplace, are among the benefits afforded to our paid members.
We offer our services in a wide variety of categories, a sampling of our service provider categories.which is highlighted in the table below:
|
| | | | | | |
Home ImprovementAlarms | Health | AutoDriveways | Services | Housecleaning | | Pest Control |
| Appliance Repair | | Dry Cleaning | | Interior Design & Decorating | | Plumbing |
| Auto Repair | | Electrical | | Landscaping | | Pool & Spa Service |
Builders - Homes/GaragesHomes | Allergy | Fencing | | Lawn & ImmunologyYard | Accessories | Accountants/Tax ConsultantsRemodeling |
Electrical | Blood Care/Hematology | Alarms | Cake Decorating |
Handymen | Cancer/Oncology | Body Work | Carpet Cleaning | | Flooring | | Lighting | | Rentals |
| Closets | | Garage Doors | | Masonry | | Roofing |
| Decks & Porches | | Handyman | | Moving | | Snow Removal |
| Doors | | Heating & A/C | Dentistry | Detailing | Child Care |
Landscaping | Dermatology | Glass | Financial Planning |
Painting | Eye Care | Mufflers | Housecleaning |
Plumbing | Heart Care | Painting | Insurance Agencies |
Remodeling | Orthopedics | Radiators | Limousine Service |
Roofing | Primary Care | Tires | Photography |
| Windows | Rehabilitation | Transmission | Rentals |
Our members rate service providers on an “A” (Excellent) throughto “F” (Lousy) grading scale based on a variety of criteria, including overall experience, availability, price, quality, responsiveness, punctuality and professionalism as well asand other criteria, depending on the type of service provided. Ratings on each applicable criterion are averaged across all member reviews submitted for the service provider to produce the service provider’s grade on Angie’s List. Non-member reviews do not factor into ratings but appear in a separate section from the member reviews on a service provider’s profile. Service providers cannot influence their ratings on Angie’s List. In addition to a letter grade, we encourage members and non-members to provide a detailed description and commentary on the service experience. We also request the approximate cost of the service, the date that the service was provided and whether the member or non-member would hire the service provider again in the future. We
allow both members and non-members to report on each unique experience they engage inhave with a service provider. However, if an individual submits more than one review for the same service provider within a 180-day period, the second review is published only if we determine that it is for a separate, unique service experience. Member ratings and number of reviews submitted dictate which service providers are eligible to offer discounts, promotions and e-commerce offers to members and non-members through our platforms.
We do not allow our members or non-members to submit reviews anonymously, and our certified data collection process prevents service providers from reporting on themselves or their competitors. We believe that this policy is critical to maintaining the integrity of our reviews. We permit service providers to respond to reviews, both positive and negative, to provide our members with both sides of the story. We also deploy a variety of other resources, including a team of internal auditquality control and certification personnel and our proprietary fraud detection technology, to ensure that our members can trust the service provider reviews available via our service. We use automated techniques to screen all reviews for fraudulent activity, duplicate reviews, vulgar language and fake or defamatory content prior to publication, and flagged reviews receive additional screening to ensure their accuracy, reliability and propriety.
We provide convenient access to our ratings and reviews on our website and mobile platforms as well as over the telephone for certain membership plans. applications.
We also offerremain committed to helping our members live customer supportfind the best provider for their service needs. Accordingly, the sort logic utilized in search results displays our certified service providers, which must purchase advertising from us in order to obtain our inbound member call center and assistcertification, above service providers that are not certified, making it easier for our members in resolving disputes withto find service providers throughthat have met certain eligibility requirements, agreed to offer a discount to members and generally demonstrated a strong interest in building relationships with and serving our complaint resolution process.members.
In 2014, 2013 and 2012, membership revenue accounted for approximately 23%, 27% and 31% of our total revenue, respectively.
Service Provider Services
Services. Our consumersprimary source of service provider revenue is term-based sales of advertising to service providers. Our members are seeking reputable providers of high cost of failurehigh-cost-of-failure services and utilize our platforms and offerings to find them, thereby providing a large, qualified pool of demand and a strong value proposition to our participating service provider population,providers, thus establishing the basis for the service provider side of our business.
Service providers are able to take advantage of a variety of services and tools based on the nature and extent of their relationship with us. Our consumers grademembers rate service providers on an “A” to “F” scale, and we invite service providers with an averageoverall member grade of “A” or “B” or better and at least two reviews submitted in the last three yearsto complete our certification process to advertise their services and offerprovide exclusive discounts, promotions and e-commerce offers to consumers through their online profiles on our websitemembers. Service providers must meet certain criteria in order to become eligible for certification, including:
retaining an overall member grade of “A” or “B”;
passing an annual criminal background check;
attesting to proper licensing to perform listed work;
maintaining a company-verified profile page; and mobile application, via
remaining in good business standing with us.
Once the eligibility criteria outlined above are satisfied, a service provider must purchase advertising from us to obtain our inbound member call center, through our email promotions or in the Angie’s List Magazine.certification. If a service provider’s grade falls below a “B”provider fails to meet any of our eligibility criteria during the term of its contract, or if a service provider refuses to participate in our complaint resolution process or engages in what we determine to be dishonestprohibited behavior through any of our service channels, we immediately terminate the service provider's contract andpromptly suspend any existing advertising, discounts, promotions or e-commerce offers.offers, and the service provider’s contract is subject to termination. This policy, which may result in us foregoing revenue that we would otherwise receive, is guided by our commitment to consumers.our members.
A certified service provider rotates among the first service providers listed in search results for an applicable category, and their company name, overall rating, number of reviews, certification badge and basic profile information are displayed in the search results. Service providers without our certification are listed below our certified service providers in search results, and while the nature and extent of benefits afforded to non-certified service providers is less than what is made available to their certified counterparts, non-certified service providers are still able to take an active role in managing their profiles and monitoring members’ ratings and reviews through our platforms. Our annual Super Service Award, for which both certified and non-certified service providers are eligible, recognizes excellence among service providers that maintain a superior service record.
In addition to traditional advertising on our platforms, our e-commerce marketplace solutions offer consumersmembers the opportunity to purchase services through us from highly-rated service providers rated highly by our members.providers. These e-commerce offerings are available through both email promotions and through postings on our website and mobile applicationapplications as well as via email promotions and offers and are an important aspect of our business. When a consumermember completes an e-commerce purchase from our marketplace, we process the transaction is processed through Angie’s List. The purchaser can then indicate scheduling preferences automatically using our tools or work directly withand receive a portion of the service provider to schedule the service.price paid as revenue. E-commerce offerings provide our consumersmembers with an easier and more convenient way to fulfill their service needs and may offer a discount as well. We have increased our focus on our e-commerce marketplace as a way to further enhance the value of our services for both consumers and service providers.
As our members' reviews, and not Angie’s List, dictate which service providers are eligible to advertise and offer discounts, promotions or e-commerce to consumers through our platforms, participating service providers are afforded a certain level of credibility. A service provider is not required to advertise or offer e-commerce with us to be included on Angie’s List or to manage an online profile. We encourage service providers to take an active role in managing their profiles and monitoring members’ ratings and reviews through our free Business Center service, which enables service providers to update their profile contact information, sign up for new review email notifications and respond to reviews. We believe that service providers operating smaller businesses particularly benefit from our service as we enable them to compete based on the quality and value of their services rather than simply the size of their respective marketing budgets.
In 2014, 2013 and 2012, service provider revenue accounted for approximately 77%, 73% and 69% of our total revenue, respectively.
Marketing and Sales
We traditionally focused ourOur primary strategy for new member acquisition is national advertising, including both offline and online media, with continued expansion into digital marketing platforms. Our marketing efforts are not only focused on acquiring new members to increaseand increasing market penetration, but also on improving our market penetration. In 2014, we began to shift our marketing focus from solely driving member growth to alsobrand’s awareness and consideration and highlighting our e-commerce offeringsproducts and marketplace initiatives,services with the objectivegoal of which was to take better advantage ofdriving qualified traffic to and engagement on our site and open our platforms and services to a broader base of consumers. Ourplatforms. The marketing strategymix we employ includes a mix ofoffline advertising offline via national cable and broadcast television and national broadcast radio and magazines as well as onlinedigital advertising through search engine marketing, onlineweb display, affiliate and other forms of digital advertising.retargeting. Our co-founder and Chief Marketing Officer, Angie Hicks, serves as the companyour spokeswoman. We also utilize our original content, search engine optimization (“SEO”) and other inbound marketing tactics to supplement our marketing spend and further strengthen our brand as well as to drive more marketplaceengagement and transactions through search engine optimization ("SEO"). We optimizeon our marketing channel mix and creative to improve targeting effectiveness, drive efficiency in our spend and amplify our messaging.platforms.
Our sales personnel, the majority of whichwhom are located at our headquarters in Indianapolis, Indiana, focus on originating and renewing service provider advertising contracts and identifying and converting e-commerce opportunities with service providers across our 253 paid membershipthe markets in which we operate in the United States.
Competition
We compete for consumer attention with traditional, offline consumer resources as well as with online providers of consumer ratings, reviews and referrals on the basis of a number of factors, including breadth of our service provider listings, reliability of our content, depth and timeliness of information, quality and availability of e-commerce marketplace offerings and strength and recognition of our brand. We also compete for a share of service providers’ overall advertising budgets with traditional, offline media companies and other Internet marketing providers on the basis of a number of factors, including return on investment, our high-quality membership profile, effectiveness and relevance of our discount and e-commerce initiatives, our pricing and monetization strategies and recognition of our brand. Our competitors include:
Traditional, offline competitors. We compete with a number of traditional, offline consumer resources, such as the Yellow Pages and Consumers’ CHECKBOOK. Many of these competitors also provide consumer reviews and information about service providers online.
Online competitors. We compete with “free to consumer” online ratings websites and referral services, such as Handy, Inc., HomeAdvisor, Inc., Houzz, Inc., Porch.com, Inc., Red Beacon, Inc., Thumbtack, Inc. and Yelp, Inc. In our Health categories, we compete for members with other online resources for patients, such as RateMDs, Inc. and Health Grades, Inc. Across all categories, we also compete with established Internet companies such as Amazon.com, Inc., eBay Inc., Facebook, Inc., Google, Inc., Groupon, Inc., LivingSocial, Inc., Microsoft Corporation and Yahoo! Inc.
Our Technology
Our proprietary technology platform is designed to create an engaging user experience for both our consumers,members and service providers, to enable us to collect and verify the integrity of our reviews and to help us connect our consumersmembers to our online marketplace of services from our highly-rated service providers. We employ a team of internal product and engineering professionals, as well as external resources when necessary, at our headquarters in Indianapolis, Indiana dedicated to enhancing our technology platform, developing new products and services for consumersmembers and service providers and conducting product and quality assurance testing.
Key elements of our proprietary technology platform, which was enhanced with the introduction of our new technology platform across all markets during 2016, include:
Search. Our search technology combines structured and free-form content to enable consumersour members to search for service providers in numerous categories. The search and sort functionality utilizes a number of factors, such as grade, number of reviews, service area and current discounts or other promotions, to connect consumersour members with the most relevant service providers.
Targeted review acquisition. We developed a review targeting engine for collecting reviews on service providers. This engine enables us to identify individuals who may have hired a service provider found through Angie’s List,our platforms, and we then encourage these individuals to submit a review of their service experience.
Fraud detection. We employ various technology-based algorithms and filters, as well as third-party tools, to detect fraudulent reviews. Our reviews are not anonymous and provide a degree of traceability and accountability not present in many competitor websites.
Service provider sales lead targeting. We utilize a scoring engine that assigns weights to a variety of attributes in order to effectively identify the most qualified prospective service provider leads for our service provider sales representatives to target.
Membership contractstools and renewal toolsservice provider contracts. We use sophisticated and proprietary tools for managing memberships and markets, highly localized andrenewals as well as targeted service provider contracts and automatic renewals of both memberships and service provider contracts.
E-commerce tools. We developed and continue to evolveutilize dynamic tools that enable consumers including both members and non-members, to purchase services through our e-commerce marketplace platforms from highly-rated service providers. Our offerings provide our consumers with the ability to receive e-commerce deal alerts via email as well as peruse and purchase service provider offerings on our website and mobile platforms.
We developed our website and related infrastructure, which are hosted in a redundant fashion within multiple third-party co-location facilities and cloud computing services, with the goal of offering unique tools and support to facilitate improvement of the local service experience for both consumersmembers and service professionals.providers.
Cybersecurity
The infrastructure and third-party services we utilize have been subject to various cybersecurity incidents from external sources, including vulnerability scanning, penetration attempts and distributed denial of service attacks. Additionally, individual workstations used by our employees have been exposed to malicious software or advanced persistent threats that are commonplace on the Internet. We maintain systems and processes to detect, alert and mitigate incidents related to malware, attempted intrusions and attacks against our technology and services, and we employ certain preventative measures to reduce the risk of such incidents. We believe our systems and processes are effective in mitigating the risks of cybersecurity threats. The cybersecurity incidents we have experienced to date have not materially impacted our business, results of operations, liquidity or financial condition or impaired our ability to accurately record, process, summarize or report information for financial reporting purposes, and there is no indication such incidents have resulted in a loss or breach of member, service provider or employee personal data.
Competition
We compete for consumer attention with numerous providers of consumer ratings, reviews and referrals on the basis of a number of factors, including, among other things, breadth of our service provider listings, reliability of our content, depth and timeliness of information, quality and availability of our products, services and technology and strength and recognition of our brand. We also compete for a share of service providers’ overall advertising budgets with traditional, offline media companies and online marketing providers on the basis of several factors, including, among other things, return on investment, the quality of our membership profile, the effectiveness and relevance of our discount and e-commerce initiatives, our pricing and monetization strategies and recognition of our brand. Our competitors include:
Amazon Home & Business Services, Better Business Bureau, Consumers’ Checkbook, Facebook, Inc., Google AdWords Express, Groupon, Inc., HomeAdvisor, Inc., Houzz, Inc., Porch.com, Inc., Pro.com, Pro Referral.com (owned and operated by Red Beacon, Inc.), TaskRabbit, Inc., Thumbtack, Inc., the Yellow Pages and Yelp, Inc.
We are facing an increasingly competitive business environment as many of the competitors identified above continue to expand their presence, including increasing their advertising spend, entering international markets and improving their technology and product and service offerings, in the local services sector.
Research and Development
Our research and development expenditures primarily consist of costs incurred related to the development of our new technology platform, including product and technology personnel and external resources, as applicable. For the years ended December 31, 2016, 2015 and 2014, development costs attributable to our new technology platform amounted to $13.7 million, $25.2 million and $20.1 million, respectively.
Intellectual Property
We protect our intellectual property rights by relying on federal, state and common law rights as well as contractual restrictions. We control access to our proprietary technology by entering into confidentiality and invention assignment agreements with our personnel and contractors and confidentiality agreements with third parties. In addition to these contractual arrangements, we also rely on a combination of trade secrets, trademarks, trade dress, domain names and copyrights to protect our intellectual property. We believe our domain names, trademarks and service marks are important to our marketing strategy and the continued development of awareness of our brand, and therefore, we pursue their registration in the United States and in certain locations outside the United States. As of December 31, 2014,2016, we havehad 25 registered 23 trademarks in the United States including “Angie’s List,” and twoone registered trademarkstrademark in Canada,Europe, as well as twofour pending trademark applications in the United States.
Personnel
As of DecemberJanuary 31, 2014,2017, we employed 1,852approximately 1,567 full-time personnel in the United States. None of our personnel are covered by a collective bargaining agreement. We believe that relations with our personnel are good.
Seasonality
We believe our business is subject to trends related to seasonal trendsactivity levels in the local services sector and that we will continue tomay be impacted by such seasonality in the future, potentially resulting in fluctuations toin our revenue, operating expenses or overall financial results. However, we believeGenerally, our growth trajectory may have overshadowed any such seasonal effectshighest volume of activity occurs in the second and third quarters of the year, corresponding to date.the periods of the year when consumers are typically most actively seeking our services.
Backlog
Service provider contract value backlog consists of the portion of service provider contract value at the end of the period that is not yet recognized as revenue. Our total service provider contract value backlog was $147.3 million and $162.5 million at December 31, 2016 and 2015, respectively.
Operating Segments and Geographic Areas
We manage our business on the basis of one operating segment. Substantially all of our revenue infor the year ended December 31, 20142016 was generated from members and participating service providers located in the United States.States, separately stated as membership revenue and service provider revenue in our consolidated financial statements. The financial information received and reviewed by our President and Chief Executive Officer, who serves as our chief operating decision maker (“CODM”) with respect to our evaluation of segment reporting, contains detail on the components of our revenue streams, but operating expenses and assets and liabilities are only reported on a consolidated basis. Further, the financial information reviewed by our CODM does not contain margin information for, nor are operating expenses, assets or liabilities allocated to, each revenue stream. As the financial information reviewed by our CODM does not contain a measure of profit or loss by revenue stream, discrete financial information is not available, and operating results for each revenue stream are therefore not regularly reviewed by the CODM. Accordingly, the CODM does not possess enough information to assess performance and make resource allocation decisions by revenue stream, thus supporting our conclusion that the business is managed on the basis of one operating segment.
Available Information
We were organized in the State of Indiana in April 1995 as Brownstone Publishing, LLC. In April 2010, we became a Delaware corporation and changed our name to Angie’s List, Inc. Our principal executive offices are located at 1030 East Washington Street, Indianapolis, Indiana, 46202, and our telephone number is (888) 888-5478.
Our website is located at www.angieslist.com, and our “Investor Relations” website is located at investor.angieslist.com.investor.angieslist.com.
We file reports with the SEC including annual reports on Form 10-K, quarterly reports on Form 10-Q, current reports on Form 8-K and any other filings required by the SEC. We make available on our “Investor Relations” website, free of charge, our annual report on Form 10-K, quarterly reports on Form 10-Q, current reports on Form 8-K and all amendments to those reports as soon as reasonably practicable after such material is electronically filed with or furnished to the SEC. We use our “Investor Relations” website as a means of disclosing material non-public information and for complying with disclosure obligations under Regulation FD. Accordingly, investors should monitor investor.angieslist.com, in addition to following our press releases, SEC filings and public conference calls and webcasts. References to our website and our “Investor Relations” website in this report are intended to be inactive textual references only, and none of the information contained on our website or our “Investor Relations” website is part of this report or incorporated in this report by reference.
The public may read and copy any materials we file with the SEC at the SEC’s Public Reference Room at 100 F Street, NE, Washington, DC 20549. The public may obtain information on the operation of the Public Reference Room by calling the SEC at 1-800-SEC-0330. The SEC maintains an Internet site (http://www.sec.gov) that contains reports, proxy and information statements and other information regarding issuers that file electronically with the SEC.
ITEM 1A. RISK FACTORS
Investing in our common stock involves a high degree of risk. Before deciding to invest in our common stock, you should carefully consider each of the following risk factors and all other information set forth in this Annual Report on Form 10-K. The following risks and the risks described elsewhere in this Annual Report on Form 10-K, including in the section entitled “Management’s Discussion and Analysis of Financial Condition and Results of Operations,” could materially harm our business, financial condition, operating results, cash flow and future prospects. IfThese risks are not the only risks facing us as additional risks and uncertainties not currently known to us or that occurs, thewe currently deem to be immaterial also may become important factors that may materially affect our business, financial condition and future results. The trading price of our common stock could decline due to any of these risks or uncertainties, and you may lose all or part of your investment.investment as a result.
We have incurred annual net losses each year since inception,in the past, and we may continue to incur additional net losses as we invest to grow and penetrateimplement our markets.business strategies.
WeAside from 2015, we have incurred annual net losses each year since inception. As a result, our accumulated deficit was $264.4$262.0 million as of December 31, 2014.2016. Consequently, we have primarily funded our operations primarily through equity and debt financings. Key elements of our growth strategybusiness strategies often include growing and strengthening our membership and service provider bases, increasing traffic to and penetration rates in each of the markets where we offerengagement across our services as well as enhancing consumer engagement in our marketplace.platforms and increasing revenue from service providers. We anticipate that our expenses will continue to increase as we, sustainamong other things, expand our investments in growing our paid membership base, increasing the numbermember and variety of participating service providers, developingprovider bases, develop new marketing initiatives, enhancingincentivize consumers to interact and transact on our platforms, enhance our technology platform and launchinglaunch new products and services. In particular, we intend to continue to invest substantial resources in marketing to acquire new paid memberships and highlight our e-commerce offerings in an effort to increase the number of transactions in our marketplace. Further, we also plan to maintain our investments in our sales personnel and selling expenditures to grow our base of service providers participating in both advertising and e-commerce as well as in product and technology as we enhance our product offerings and technology platforms. These planned investments may result in additional net losses or negative cash flow impacts. We also expect to incur increased operating expenses as we hire additional personnel and invest in our infrastructure to support anticipated future growth and the reporting and compliance obligations to which we are subject as a public company. We have also expanded and expect to continue to grow the number of personnel in our sales force in an effort to increase revenue as the number of members has grown.
IfFurther, if our revenue does not grow or declines, or if our operating expenses exceed our expectations, we may not become profitable on a sustained basis. In addition, if our future growth and operating performancebasis, or our cash flows or losses resulting from our investments fail to meet investor or analyst expectations, our operating results, financial condition and stock price could be materially adversely affected. Additionally, if our hiring of additional sales personnel does not result in a sufficient corresponding increase in revenue, the cost of the additional headcount will not be offset,at all, which could harm our business, financial condition or results of operations.
Our inability to develop, execute and evolve our business strategies may adversely impact future results.
Our ability to successfully develop, execute and evolve our business strategies could require significant capital investment and management attention, which might result in the diversion of these resources from other business initiatives or opportunities. Additionally, any new or modified initiative is subject to risks, including market acceptance, competition, product differentiation, challenges to scale in our marketplace and the ability to attract and retain qualified management and other personnel. There can be no assurance we will be able to successfully develop, execute and evolve our business strategies, and if we ultimately are unable to successfully do so, our business, financial condition or results of operations could be adversely impacted.
We encountered, and may continue to encounter, difficulties related to the implementation of our new technology platform.
We began implementing our new technology platform, AL 4.0, in a limited number of markets in the fourth quarter of 2015, followed by a nationwide rollout during the first half of 2016. We encountered difficulties migrating to our new technology platform and, accordingly, experienced delays in implementing certain new products and services. We incurred costs to address the issues identified and also experienced revenue losses associated with non-renewal of service provider contracts and paid membership subscriptions, as well as declines in e-commerce unit sales, as a result of disruptions attributable to our new technology platform. If we encounter more issues as we add additional functionalities and introduce upgrades and enhancements to the platform, our reputation and overall business performance could be damaged. Further, our business operations and relationships will continue to be at risk if the new platform does not meet our performance expectations, or those of our users, which could harm our business in numerous ways, including, without limitation, losses of revenue, memberships or service provider contracts or damage to our reputation, all of which could negatively impact our financial condition or operating results.
We are exploring strategic alternatives, but there can be no assurance we will be successful in identifying or implementing any strategic alternative or that any such strategic alternative will yield additional value for stockholders.
We have commenced a review of strategic alternatives which could result in, among other things, a sale, merger, consolidation or business combination, asset divestiture, partnership or other collaboration agreements, or potential acquisitions or recapitalizations, in one or more transactions, or a continuance of existing operations under our current business plan and strategy or under new business plans or strategies. There can be no assurance that the exploration of strategic alternatives will result in the identification or consummation of any transaction. In addition, we could incur substantial expenses associated with identifying and evaluating potential strategic alternatives, including those related to employee retention payments, equity compensation, severance pay and legal, accounting and financial advisory fees, which could negatively impact our profitability. The public announcement of strategic alternatives may also yield a negative impact on sales if prospective or existing service providers are reluctant to commit to new or renewal contracts, if existing members decide not to renew or upgrade their memberships or to purchase e-commerce offers or consumers decide not to become members. The process of exploring strategic alternatives may be time consuming and disruptive to our business operations, and there is a risk that our current employees will leave as a result of uncertainties related to our exploration of strategic alternatives. If we are unable to effectively manage the process, our business, financial condition and results of operations could be adversely impacted. We also cannot be certain that any potential transaction or other strategic alternative, if identified, evaluated and consummated, will provide greater value to our stockholders than is reflected in the current stock price. Any potential transaction would be dependent upon a number of factors that may be beyond our control, including, among other factors, market conditions, industry trends, the interest of third parties in our business and the availability of financing to potential buyers on reasonable terms.
Our success depends in part upon our ability to increase our service provider revenue as our membership grows and our membership packaging, pricing and monetization strategies evolve.
Typically, we are able to charge higher rates for advertising when service providers are able to reach a larger base of potential customers. However, as we generally only adjust advertising rates at the time of contract renewal, growth in service provider revenue commonly trails increases in membership. Accordingly, growth of our membership base may not result in service provider revenue increases until future periods, if at all. In addition, we are subject to risks associated with the credit quality of our service providers, and our business could suffer if service providers to which we provide advertising and e-commerce services are unable to meet their contractual obligations to us. Further, as our business evolves and membership packaging, pricing and monetization strategies change, any resulting declines in membership revenue may not be offset by concurrent increases in service provider revenue. Ultimately, if we are unable to increase our service provider revenue as our business strategies evolve, our business, financial condition or results of operations could be harmed.
If we fail to attract, retain or deepen our relationships with service providers, our business, financial condition or operating results could be harmed.
For 2016 and 2015, we derived 82% and 80%, respectively, of our revenue from service providers, and we expect to continue to generate an increasing portion of our revenue from service providers in the future. Our ability to attract, retain and deepen our relationships with service providers and, ultimately, to generate revenue from service providers depends on a number of factors, including:
increasing the number of memberships in our markets;
maintaining high levels of member and service provider engagement;
enticing members to engage and transact via our e-commerce marketplace;
competing effectively for advertising dollars with other online and offline advertising providers;
continuing to enhance our advertising and e-commerce packaging and pricing strategies; and
developing new products and services that are attractive to both members and service providers.
We offer both offline and online advertising products as well as an array of e-commerce opportunities to certified service providers, and our business depends, in part, on service providers’ willingness to actively participate in the various initiatives we offer, including advertising on our platforms. Service providers may choose not to advertise or engage in e-commerce with us or may leave us for competing alternatives upon expiration or termination of their agreements with us. Failure to demonstrate the value of our products and services to service providers could result in reduced spending by, or loss of, existing or potential future participating service providers, which could materially harm our business, revenue or financial condition.
We generally do not employ local “feet on the street” sales personnel to sell advertising or pitch e-commerce to service providers and instead rely on call center sales personnel. The resulting lack of a personal connection with service providers may impede us in growing or maintaining service provider revenue. As we expand our business, it will be important for us to continue to recruit, integrate and retain additional skilled and experienced sales personnel who can effectively communicate our value proposition to service providers. Accordingly, we could be adversely affected if we hire poorly or if sales personnel do not reach desired levels of effectiveness within a period of time consistent with our historical experience, thereby potentially harming our business, revenue or overall financial condition.
If we are unable to maintain high levels of member satisfaction and engagement, our business, financial condition or operating results could be adversely impacted.
We believe the success of our business strategies is contingent, in part, on our ability to provide our members with high-quality services and benefits that meet or exceed their expectations and therefore drive traffic to and engagement on our platforms. Member satisfaction and engagement may be inhibited for a number of reasons, including, but not limited to:
our failure to develop or offer new or improved products and services in a timely manner to keep pace with our competitors and the evolving needs of our members;
our inability to market our products and services in a cost-effective manner to prospective and existing members; and
our failure to provide a differentiated user experience, including regular upgrades and improvements to our products, services and technology platform.
If we are unable to provide our members with engaging products, services and technology, we may not be able to attract new members or retain existing members, which could yield, among other things, decreases in traffic, searches, service provider profile views or the quantity or quality of member reviews submitted, all of which could negatively impact our business, financial condition or operating results.
If we are unable to sustain or improve member engagement, our business, financial condition or operating results could be harmed.
As our business matures and we achieve higher penetration rates in the markets in which we operate, the traffic across our platforms may slow over time, and potentially decrease in certain periods. Accordingly, our success may become increasingly dependent on our ability to increase member engagement. A number of factors may negatively impact member engagement, including:
member engagement with products and services on competitors’ platforms;
decreases in the number, or perceived quality, of reviews contributed by our members;
failure to introduce new and improved products and services, or introduction of new products and services that do not effectively address member needs;
technical or other problems impairing the availability or reliability of our products and services or otherwise negatively impacting the user experience; and
damage to our brand reputation or image.
If we are unable to sustain or improve member engagement, our business, financial condition or operating results could be harmed.
If we are unable to introduce new or upgraded products, services or technology that consumers and service providers recognize as valuable, we may fail to generate additional traffic to and engagement on our platforms, attract and retain members and service providers or monetize the activity on our platforms. Our efforts to develop new and upgraded products, services or technology could require us to incur significant costs.
In order to attract and retain members and service providers, generate consumer traffic to and engagement on our platforms and monetize such traffic and engagement via service provider advertising, we will need to continue to invest in the development of new or upgraded products, services and technology that add value for members and service providers and differentiate us from our competitors. The success of new products, services and technology depends on several factors, including our ability to effectively address consumer needs and preferences and timely completion, introduction and market acceptance. If members and service providers do not recognize the value of our new products, services or technology, they may choose not to utilize or advertise on our platforms.
We may experience difficulties in developing and delivering new or upgraded products, services or technology, which may increase our expenses. Moreover, we cannot be certain that new or upgraded products, services or technology will work as intended or provide value to members or service providers. Additionally, some new or upgraded products, services or technology may be complex and challenging to effectively market to prospective and existing members and may also involve additional changes to our current pricing tiers.
We cannot guarantee current or prospective members and service providers will respond favorably to new products, services or technology. Furthermore, there are inherent risks associated with our efforts to enhance and improve the ease of use, responsiveness, functionality and features of our existing platforms, and we may not be able to manage such enhancements and improvements successfully. We may also choose to license or otherwise integrate applications, content and data from third parties, which may impose costs on our business and require the use of our own resources. We may be unable to continue to access such applications, content or data on commercially reasonable terms, or at all, all of which could harm our business, financial condition or results of operations.
If our efforts to increase memberships, retain existing paid memberships, drive traffic across our platforms or maintain high levels of member engagement are not successful, our growth prospects and revenue could be adversely affected.
Our ability to grow our business and generate increased revenue depends, in part, on attracting new members, retaining our existing paid membership base and driving traffic to and high levels of engagement across our platforms. Growing our membership base and generating traffic to and engagement on our platforms will require us to continually address a number of challenges, and we may fail to do so successfully. Some of these challenges include:
continuing to build our database of ratings and reviews of service providers;
increasing the number and variety of service providers reviewed by our members;
convincing prospective members of the benefits that can be derived from our products and services;
providing membership tiers that offer desirable benefits and levels of service at attractive price points;
delivering a compelling member experience, including relevant, high-quality discounts and deals and other promotional offers from our participating service providers; and
innovating to keep pace with changes in technology and competition.
Our inability to grow our membership base, retain existing paid memberships or generate traffic to and high levels of engagement across our platforms could negatively impact our business, financial condition or results of operations.
Our paid membership renewal rates and membership revenue have declined, and are likely to continue to decline, in connection with our introduction of a free membership tier during 2016, which could harm our business, financial condition or operating results.
Prior to June 2016, we only offered paid membership tiers to consumers. Following our introduction of a free membership tier in June 2016, our paid membership base is decreasing as new members are primarily joining via our free membership offering, and existing paid members are not renewing as paid members at rates consistent with our historical averages. Our paid membership renewal rates are likely to continue to decline as a result of a number of factors, including additional pricing changes in the future, adjustments to our product or service offerings, competitive pressures or general customer satisfaction, among other things. The introduction of a free membership tier may ultimately yield reductions in our revenue if we are unable to effectively monetize our free member traffic and engagement with service provider revenue, and our business, financial condition or operating results could be harmed as a result.
We continue to make substantial investments in membership acquisition. If the revenue generated by new memberships varies significantly from our expectations, or if our membership acquisition costs or costs associated with servicing our members increase, we may not be able to recover our membership acquisition costs or generate profits from this investment.
We incurred marketing expense of $65.1 million and $83.8 million in 2016 and 2015, respectively, a portion of which was for the intended purpose of acquiring new members, in addition to generating traffic to and engagement across our platforms. We expect to continue to invest in acquiring new members and driving engagement, primarily through national advertising. Our analysis of the revenue we expect new memberships to generate depends on several estimates and assumptions, including our membership tier structure, paid membership renewal rates, future membership fees, e-commerce purchase rates and incremental advertising and e-commerce revenue from service providers driven by the growth of our membership base and increased penetration of our markets. If our estimates and assumptions regarding the revenue we can generate from new memberships prove incorrect, we may be unable to recover our membership acquisition costs or generate a return on our investment in acquiring new memberships. Moreover, if our membership acquisition costs or the costs associated with servicing our members increase, the return on our investment may be lower than we anticipate irrespective of the revenue generated by new memberships. If we cannot generate a return on this investment, our growth rate, business, financial condition or results of operations may be adversely affected.
Our business depends on the strength of our brand, which is built on a foundation of authentic reviews and the trust of consumers, and the failure to maintain that authenticity and trust could damage our brand and harm our ability to maintain or expand our membership and service provider bases.
Trust in the integrity of our brand and in the objective, unbiased nature of our ratings and reviews contributes significantly to our ability to attract new members and service providers. Maintaining consumer trust and enhancing our brand depends largely on our ability to maintain our commitment to and reputation for placing the interests of our members first. If existing or prospective members perceive that our focus is not member-oriented, our reputation and the strength of our brand could be adversely affected. Complaints or negative publicity about our sales and business practices, products, services and technology, personnel or customer service, irrespective of their validity, or concerns regarding data privacy and security, could diminish consumers’ confidence in our service and adversely impact our brand.
Trust in our brand could also be impaired if we are unable to maintain the quality and integrity of the ratings and reviews that appear across our platforms. While we utilize various technology-based algorithms and filters to detect fraudulent reviews, and we believe our prohibition of anonymous reviews provides a degree of traceability and accountability not present on other websites, we cannot guarantee the accuracy of our reviews. Moreover, as our membership base expands and the number of service providers rated and reviewed by our members grows, we may see an increase in fraudulent or inaccurate reviews. If fraudulent or inaccurate reviews - positive or negative - increase on our platforms, and we are unable to effectively identify and remove such reviews, the overall quality of our ratings and reviews could decrease, our reputation as a source of trusted ratings and reviews might be harmed and consumers and service providers might be deterred from using our products and services, which could negatively impact our brand, business, financial condition or results of operations.
In addition, our brand could be harmed if any of our trademarks are used inappropriately. For example, service providers might use our trademarks without our permission, including our Super Service Award, which is available only to service providers that maintain superior service ratings. We have in the past taken, and will in the future take, action, including initiating litigation, to protect our trademarks and the integrity of our brand. If such efforts are unsuccessful, our brand and our business could be adversely affected.
Our stock price may be volatile, and the value of an investment in our common stock may decline.
The trading price of our common stock has historically demonstrated, and is likely to continue to exhibit, volatility, and could decline substantially within a short period of time. For example, as of February 17, 2017, since shares of our common stock were sold in our initial public offering in November 2011 at a price of $13.00 per share, our trading price has ranged from $4.36$3.73 to $28.32. The trading price of our common stock may be subject to wide fluctuations in response to various factors, some of which are beyond our control. In addition to the risk factors discussed herein, these factors include:
our operating performance and the operating performance of similar companies;
our business strategies and related initiatives;
the overall performance of the equity markets;
the number of shares of our common stock publicly owned and available for trading;
threatened or actual litigation;
changes in laws or regulations relating to our business;
any major change in our board of directors or management;
publication of research reports about us or our industry, changes in securities analysts’ projections or recommendations, withdrawal of research coverage or our failure to meet analysts’ expectations;
large volumes of sales of shares of our common stock by existing stockholders; and
general political and economic conditions.
Furthermore, the stock market has experienced extreme price and volume fluctuations that were often unrelated or disproportionate to the operating performance of listed companies. Our operating results and financial condition could be materially and adversely impacted due to declines or volatility in our stock price, and the value of an investment in our common stock could decrease as a result.
Securities class action litigation has often been instituted against companies following periods of volatility in the overall stock market or in the market price of a company’s securities. We are currentlyhave in the past been, and may in the future be, subject of multiple stockholder class action lawsuits. These lawsuits, and any futureto stockholder class action lawsuits, initiated against us,which could result in substantial costs, divert our management’s attention and resources and therefore harm our business, financial condition or results of operations.
We continue to make substantial investments in membership acquisition. If the revenue generated by new paid memberships varies significantly from our expectations, or if our membership acquisition costs or costs associated with servicing our members increase, we may not be able to recover our membership acquisition costs or generate profits from this investment.
We spent $87.4 million and $87.5 million on marketing expenditures in 2014 and 2013, respectively, much of which was for the intended purpose of acquiring new paid members, in addition to highlighting our e-commerce offerings and generating consumer traffic in our marketplace. We expect to continue to spend significant amounts to acquire additional paid members, primarily through national offline and online advertising, including an increasing emphasis on digital marketing platforms. Our decisions regarding investments in membership acquisition are based on our marginal marketing cost per paid membership acquisition and our analysis of the revenue we have historically generated per paid membership over the expected lifetime of such membership. Our analysis of the revenue that we expect new paid memberships to generate over their lifetimes depends on several estimates and assumptions, including membership renewal rates, future membership fees, e-commerce purchased by our members and incremental advertising and e-commerce revenue from service providers driven by increased penetration in a particular market. Our experience, estimates and assumptions in markets in which our penetration rates are presently lower may differ from our more established markets.
Our average revenue per market and total revenue per paid membership in a geographic market have generally grown with the maturity and corresponding increased penetration of such markets in prior periods. In the future, we expect total revenue per paid membership to fluctuate from period to period, reflecting the timing of our ability to adjust advertising rates given our advertising contract terms and membership pricing and monetization strategies designed to drive increased penetration, among other factors. In addition, we continue to evaluate and adopt innovative pricing and packaging strategies, such as tiered pricing membership offerings, in an effort to deliver compelling value to our members and thereby support membership growth and retention, which has caused and may continue to cause membership revenue per paid membership and total revenue per paid membership to decline in some or all of our membership cohorts. In 2015, we are expecting membership revenue to decline in absolute dollars as compared to 2014 as a result of the impact associated with our introduction of tiered pricing membership plans on a national basis during the year, which reduced new membership fees, on average, across all markets and is putting downward pressure on our membership revenue and membership revenue per paid member.
If our estimates and assumptions regarding the revenue we can generate from new paid memberships prove incorrect, we may be unable to recover our membership acquisition costs or generate profits from our investment in acquiring new paid memberships. Moreover, if our membership acquisition costs or the costs associated with servicing our members increase, the return on our investment may be lower than we anticipate irrespective of the revenue generated by new memberships. If we cannot generate profits from this investment, our growth rate, business, financial condition or results of operations may be adversely affected.
Our business depends on the strength of our brand, which is built on a foundation of authentic reviews and the trust of consumers, and the failure to maintain that authenticity and trust would damage our brand and harm our ability to maintain or expand our base of paid memberships and participating service providers.
Trust in the integrity of the “Angie’s List” brand and in the objective, unbiased nature of our ratings and reviews contributes significantly to our ability to attract new paid memberships and participating service providers. Maintaining consumer trust and enhancing our brand depends largely on our ability to maintain our commitment to and reputation for placing the interests of the consumer first. If our existing or potential members perceive that we are not focused on helping them make more informed purchasing decisions about local services transactions or that the revenue we receive from service providers interferes with the objective rating of service providers on the basis of member reviews, our reputation and the strength of our brand would be adversely affected. Complaints or negative publicity about our sales and business practices, products and services, personnel or customer service, irrespective of their validity, and data privacy and security issues could diminish consumers’ confidence in our service and adversely impact our brand.
Trust in our brand also will suffer if we are unable to maintain the quality and integrity of the ratings and reviews that appear on Angie’s List. We collect reviews from both members and non-members (which do not factor into service provider ratings and are provided for informational purposes), and make these reviews available to members on our website and mobile application. While we utilize various technology-based algorithms and filters to detect fraudulent reviews, and we believe that our prohibition of anonymous reviews provides a degree of traceability and accountability not present in other websites, we cannot guarantee the accuracy of our reviews. Moreover, as our base of paid memberships expands and the number of service providers rated and reviewed by our members grows, we may see an increase in fraudulent or inaccurate reviews. If fraudulent or inaccurate reviews - positive or negative - increase on Angie’s List, and we are unable to effectively identify and remove such reviews, the overall quality of our ratings and reviews would decrease, our reputation as a source of trusted ratings and reviews may be harmed and consumers and service providers may be deterred from using our products and services. We employ steps designed to ensure that consumer reviews are not inaccurate or fraudulent and that service providers are rated based solely on member reviews and not on the basis of any other factor, such as their advertising with us. If such steps prove ineffective or if members otherwise believe that we are not objective, we could lose their trust, and our brand, business, financial condition or results of operations could be harmed as a result.
In addition, our brand could be harmed if others use any of our trademarks inappropriately. For example, service providers may use our trademarks without our permission, including our “Super Service Award,” which is available only to service providers that maintain superior service ratings. We have in the past taken, and will in the future take, action, including initiating litigation, to protect our trademarks and the integrity of our brand. If such efforts are unsuccessful, our brand and our business could be adversely affected.
The covenants in the instruments that govern our current indebtedness may limit our operating and financial flexibility.
The covenants in the instruments that govern our debt facilityfinancing agreement limit our ability to:
incur debt and liens;
pay dividends;
make redemptions and repurchases of capital stock;
make loans and investments;
make capital expenditures;
prepay, redeem or repurchase debt, other than under our credit facility;the financing agreement;
engage in acquisitions, consolidations, asset dispositions, sale-leaseback transactions and affiliate transactions;
change our business;
amend our material agreements;
issue and sell capital stock of subsidiaries;
restrictreceive distributions from subsidiaries; and
grant negative pledges to other creditors.
The debt facilityfinancing agreement also containsrequires us to comply with certain financial covenants, that require us to achieve certainincluding minimum levels of membership revenueactive service provider contract value, minimum consolidated EBITDA, minimum liquidity and EBITDAmaximum consolidated capital expenditures, and to maintain minimum levels of liquidity. The debt facility is secured by a pledge of substantially all of our assets and, through a delayed draw term loan facility, provides a source of liquidity to enable us to fund our current and future operations.operations, if necessary. A breach of any of the covenants or requirements in the debt facilityfinancing agreement could result in a default under the debt facility,financing agreement, unless we are able to obtain the necessary waivers or amendments. Our capital expenditures in the fourth quarter of 2014 exceeded the maximum allowable amount under the financial covenant set forth in the debt facility related to consolidated capital expenditures, and as such, we were not in compliance with this covenant at December 31, 2014. We remedied the noncompliance by obtaining a waiver of non-compliance under the financing agreement from the lender. Upon the occurrence of an event of default that is not waived, and subject to any appropriate cure periods, the lenders could elect to exercise any of their available remedies, which may include the right to not lend any additional amounts to us or, in certain instances, to declare all outstanding borrowings, together with accrued interest and other fees, to be immediately due and payable. If we are unable to repay the borrowings with respect to the debt facilityfinancing agreement when due, the lender would be permitted to proceed against our collateral. If the lender takes any or all of these steps, our business, financial condition or results of operations could be materially and adversely impacted, and we may be unable to continue to fund our operations.
If our security measures are breached and unauthorized access is obtained to our members’ or service providers’ data is obtained, our service may be perceived as not being secure, and members and service providers may curtail or terminate their use of our service.
In the ordinary course of business, we collect and store in our data centers and networks sensitive data, including intellectual property, our proprietary business information and personally identifiable information of our consumers, including both members, and non-members, service providers and employees, in our data centers and networks.employees. The secure processing, maintenance and transmission of this information is critical to our operations and business strategy.strategies. Our service involves the storage and transmission of our members’ and service providers’ proprietary information, such as credit card and bank account numbers, and security breaches could expose us to a risk of loss of this information, resulting in potential litigation and liability. OurFurther, our payment services may be susceptible to credit card and other fraud schemes, including unauthorized use of credit cards, debit cards or bank account information, identity theft or merchant fraud, and could result in fines by credit card companies or the loss of our ability to accept credit and debit card payments.
Despite a number ofthe precautionary measures alreadywe have in place, we are subject to a number of risks related to intentional business disruptions, cyber-attacks, data protection breaches, piracy and other security risks, and we expect to be an ongoing target of attacks specifically designed to impede the performance of our products and offeringsservices and harm our reputation as a company. If our security measures are breached as a result of third-party action, employee error, malfeasance or otherwise, and as a result, someone obtains unauthorized access to our members’ or service providers'providers’ data, our reputation may be damaged, our business may suffer and we could incur significant liability. As techniques used to obtain unauthorized access or to sabotage systems change frequently and generally are not recognized until launched against a target, we may be unable to anticipate these techniques or implement adequate preventative measures. The theft or unauthorized use or publication of our trade secrets and other confidentialintellectual property, proprietary business information or personally identifiable information as a result of such events could adversely affect our competitive position, reputation, brand or future sales of our products and services, and our customers may assert claims against us related to resulting losses of confidential or proprietary information. If an actual or perceived breach of our security occurs, the public perception of the effectiveness of our security measures could be harmed, and we could lose members and service providers, which could adversely affect our business, financial condition or results of operations.
If security measures at third-parties are breached, our ability to automatically renew memberships and service provider commitments could be harmed.
Many of our members and service providers shop at third-parties, including retailers such as Target and Home Depot, and pay by credit card at such places. While we assume third-parties adequately protect their customers’ personal information, including bank account and credit card details, the techniques used to obtain unauthorized access to such personal information change frequently, and third-parties may be unable to implement sufficient preventive measures to protect that information. If any of our members’ or service providers’ bank account or credit card information is compromised by a security breach at a third-party, any such members or service providers may be forced to open a new bank account or obtain a new credit card, and the payment information we have on file for those impacted members and service providers would no longer be valid, impairing our ability to automatically renew the affected members’ and service providers’ accounts at the end of the applicable term. Our inability to automatically renew memberships and service provider commitments may have a significant negative impact on our revenue, and our business, financial condition or results of operations could be harmed as a result.
Interruptions or delays in service arising from our third-party co-location technology facilities and cloud-based data service providers or our own systemsinfrastructure could impair the delivery of our services and harm our business.
We rely, in part, upon third-party co-location technology facilities and cloud-based data services vendors, including data center, Internetonline infrastructure and bandwidth, as well as payment processing vendors, none of which are under our control, to provide our products and services to our consumersmembers and service providers. We do not control the operation of third-party facilities or vendors, and both ourOur own internal facilities, as well as the external third-party technology facilities and vendors we useutilize, are vulnerable to damage or interruption from tornadoes, floods, fires, power loss, telecommunications failures, and similar events. These facilities and vendors are also subject to break-ins, sabotage, intentional acts of vandalism, cyber-attacks, the failure of physical, administrative and technical securitycybersecurity measures, terrorist acts, human error, financial insolvency of third-party providers or other unanticipated problems or events. The occurrence of any of these events could result in interruptions in our service and unauthorized access to, or alteration of, the content and data contained on our systems or stored and delivered on our behalf by third-party vendors and facilities. As our technology infrastructure is critical to the performance of our systems and our overall operations, such disruptions could negatively impact our ability to run our business, result in a loss of existing or potential members and service providers or increase our technology maintenance and support costs, all of which could adversely impact our operating results and financial condition. Further, our business interruption insurance may be insufficient to compensate us for any losses that may occur as a result of any such interruptions or delays.
Our technology infrastructure is critical to the performance of our systems and our overall operations. Certain aspects of our technology infrastructure run on a complex distributed system, or what is commonly known as cloud computing. We own, operate and maintain the primary elements of this system, but some elements of this system are operated by third parties that we do not control and which would require significant time to replace, thereby increasing our vulnerability to problems
with the services they provide. We have experienced, and expect to continue to experience, interruptions and delays in service and availability for such elements. Any errors, failures, interruptions or delays experienced in connection with cloud computing technologies and information services could negatively impact our brand and reputation, our relationship with our consumersmembers and service providers or our ability to attract, retain and serve our consumersmembers and service providers.
In addition, we designed and developed key aspects of the software code and technical infrastructure for the technology platforms through which we provide our products and services, and we plan to continue to maintain and develop certain elements of our technology platforms internally. Our software code and technical infrastructure are complex, and such efforts may therefore lead to increased product and technology expense, operational inefficiencies or interruptions in the delivery or degradation of the quality of our products and services. These issues may not be identified immediately, which could result in further interruption, degradation or cost, thereby resulting in potential adverse impacts on our business, financial condition or results of operations.
If security measures at third parties are breached, our effortsability to increase our number of paid memberships, retain existingautomatically renew paid memberships or maintain high levels of member engagement are not successful, our growth prospects and revenue will be adversely affected.
Our ability to grow our business and generate both membership revenue andprocess service provider revenue depends in part on attracting new paid members, retaining our existing paid membership base, maintaining high levels of consumer engagement and attracting consumers to utilize our e-commerce marketplace. It is important that we convince prospective members of the benefits of our service and existing members of its continuing value. In addition, it is also imperative that we elicit our members to submit reviews of service providers to our database. Driving membership revenue per paid membership entails increased penetration and active member engagement in each of our markets to both grow our database of reviews of service providers and enhance the value of our service to other members and prospective members. We also depend on growing our paid membership base as a means for increasing our service provider revenue via higher advertising rates and more active participation by service providers in our advertising and e-commerce initiatives. There is no guarantee that we willpayments could be successful in maintaining or expanding our paid membership base, or in increasing our revenue per paid membership.harmed.
In addition, we rely upon high membership renewal rates and “word of mouth” referrals from existing members to maintain and grow our paid membership base. If our efforts to satisfy our existing members are not successful, we may not be able to maintain our renewal rates or continue receiving those referrals. Furthermore, although we use our number of paid memberships as one indicator of the growth of our business, someMany of our members may not actively utilize our service or submit reviews ofand service providers shop at third parties, including retailers such as Target and Home Depot, and pay by credit card at such places. While we assume third parties adequately protect their customers’ personal information, including bank account and credit card details, the techniques used to obtain unauthorized access to such personal information change frequently, and third parties may be unable to implement sufficient preventive measures to protect that information. If any of our database. If member engagement does not meet our expectations, we may losemembers’ or service providers’ bank account or credit card information is compromised by a security breach at a third-party, any such members or service providers who advertise with us,may be forced to open a new bank account or obtain a new credit card, and the payment information we have on file for those impacted members and service providers would no longer be valid, impairing our revenue may not increase or may decline.
Our ability to increase the number of ourautomatically process paid membership renewals and service provider payments. Our inability to automatically renew paid memberships and to maintain high levels of member engagement will require us to continually addressprocess service provider payments may have a number of challenges, and we may fail to do so successfully. Some of these challenges include:
continuing to build our database of ratings and reviews of service providers;
increasing the number and variety of service providers reviewed by our members and non-members;
convincing consumers of the benefits of our service and making it easy for them to become paid members and purchase services;
providing membership plans that offer desirable benefits and levels of service at attractive price points;
delivering an optimal member experience, including relevant, high-quality discount coupons and other promotional offers from our participating service providers and compelling, easy-to-use e-commerce offerings; and
continuing to innovate and keep pace with changes in technology and our competitors.
Our inability to increase our number of paid memberships and to maintain high levels of member engagement would have an adversesignificant negative impact on our growth prospects, business, financial condition or results of operations.
Our future growth depends in part on our ability to effectively develop and sell additional products, services and features, including e-commerce and marketplace initiatives.
We invest in the development of new products, services and features with the expectation that we will be able to effectively offer them to consumers and service providers. For example, we continue to expand our marketplace initiatives, including enhancing the quality, availability and inventory of our e-commerce offers, and also introduced new tiered pricing membership plans with varying levels of service and benefits during the current year. Further, we also released a new and improved Angie's List mobile application, which incorporates our SnapFix functionality, and launched the Angie's List Weekly
digital magazine during 2014. We also continue to develop innovative products and services for qualified service providers. Moving forward, we plan to continue to invest in our marketplace efforts to sell new products, services and features. In addition, we may acquire vertical offerings that address additional “high cost of failure” segments of the market for local services.
We are making substantial investments of time and resources in the development of our e-commerce marketplace strategy wherein we act as an intermediary in local service transactions. Acceptance of this business model by consumers and local service providers is not assured and may be affected by numerous factors, many of which are outside of our control. We are still experimenting with the design and pricing of offers in our e-commerce marketplace as well as new ways to monetize advertising and e-commerce opportunities with our service providers, and we may fail to provide offers that are desirable to consumers or advertising and e-commerce opportunities that are attractive to service providers. Further, if our competitors begin following a similar marketplace strategy, our prospects for success in this initiative may be adversely affected.
Our future growth depends in part on our ability to effectively sell new products, services and features as well as additional enhancements to our existing offerings. As our new product and service offerings evolve, we adapt our sales and marketing strategies accordingly, and changes in these strategies may delay or prevent growth in these parts of our business. For example, we continue to refine our service provider eligibility criteria, pricing and monetization strategies as well as our vendor credit and customer refund policies for our e-commerce offerings, which may cause our revenue, from these offerings to fluctuate from period to period in the future. As many of our current and potential participating service providers have modest advertising budgets, there is no guarantee that the successful introduction of new products or services will not adversely affect sales of our current products and services or that those service providers that currently advertise or provide e-commerce offers with us will increase their aggregate spending as a result of the introduction of new products and services. If our efforts to effectively develop and sell additional products, services and features, including e-commerce and marketplace initiatives, are not successful, our business, financial condition or results of operations may suffer.
Any failure to convince service providers of the benefits of advertising or providing e-commerce offerings on our platforms would harm our business.
For 2014 and 2013, we derived 77% and 73%, respectively, of our revenue from service providers, and we expect to continue to derive an increasing percentage of our revenue from service providers in the future. Our ability to attract, retain and deepen our relationships with service providers and, ultimately, to generate revenue depends on a number of factors, including:
increasing the number of paid memberships in our markets;
maintaining high levels of member and service provider engagement;
enticing consumers to purchase e-commerce offerings;
competing effectively for advertising dollars with other online and offline advertising providers; and
continuing to develop and diversify our advertising and e-commerce offerings.
We offer both offline and online advertising products as well as an array of e-commerce opportunities to eligible service providers, and our business depends, in part, on service providers’ willingness to engage in advertising and e-commerce. Service providers may view advertising or providing e-commerce offers with us as experimental, may choose not to advertise or engage in e-commerce with us or may leave us for competing alternatives upon expiration or termination of their agreements with us. Failure to demonstrate the value of our service would result in reduced spending by, or loss of, existing or potential future participating service providers, which could materially harm our business, revenue or financial condition.
We generally do not employ local “feet on the street” sales forces to sell advertising and pitch e-commerce to service providers and instead rely on call center sales personnel. The resulting lack of a personal connection with service providers may impede us in growing service provider revenue. As we expand our business, it will be important for us to continue to recruit, integrate and retain additional skilled and experienced sales personnel who can effectively communicate our value proposition to service providers and increase the monetization of our membership base. Accordingly, we will be adversely affected if we hire poorly or if sales personnel do not reach desired levels of effectiveness within a period of time consistent with our historical experience as well as if we are unable to convince service providers to advertise or engage in e-commerce with us.
Our success depends in part upon our ability to increase our service provider revenue per paid membership as we increase our market penetration.
Historically, our service provider revenue per paid membership in a given market generally has increased concurrently with market penetration as we attracted more service providers, charged higher advertising rates and expanded our e-commerce initiatives in conjunction with the growth in the pool of members and non-members using our service. As we historically only increase advertising rates at the time of contract renewal, such rate increases in a given market may trail growth in market penetration. Moreover, trends in market penetration and growth in service provider revenue per paid membership in our larger markets have varied from our experiences in our smaller markets, and the same can be said with respect to comparisons between our more and less penetrated markets. Accordingly, growth of our membership bases or penetration of our markets may not result in service provider revenue increases until future periods, if at all. In addition, we are subject to risks associated with the credit quality of our service providers. If service providers to whom we provide advertising and e-commerce services are unable to meet their contractual obligations to us or we are generally unable to increase our service provider revenue per paid membership as we increase our market penetration, our service provider revenue could decrease, and our business, financial condition or results of operations could be harmed.harmed as a result.
We are involved in litigation matters that are expensive and time-consuming, and if resolved adversely, such matters could harm our business, financial condition or results of operations.
From time to time, weWe are subject to claims and lawsuits incident to the ordinary course of business, suchand regularly involved in litigation, both as a putative class action lawsuit brought by membersplaintiff and stockholder class action lawsuits,as a defendant, related to our business and operations, and we anticipate that we will continue to be a target for such litigation in the future. Any negative outcomes from litigation thatin which we are party toinvolved could result in payment of substantial monetary damages or fines or undesirable changes to our products, services or business practices, and accordingly, our business, financial condition or results of operations could be materially and adversely affected. Although the results of litigation and claims brought against us cannot be predicted with certainty, we currently believe that the final outcome of such matters that we are currently facefacing will not have a material adverse effectimpact on our business, financial condition, results of operations or cash flows, except as otherwise recorded within the consolidated financial statements. However, there can be no assurance of a favorable final outcome for all present and future legal matters, and regardless of the outcomes of present or future cases, any lawsuit can adversely impact our business due to the potential related defense and settlement costs, diversion of management resources and other factors. Any litigation to which we are a party may result in an onerous or unfavorable judgment that may not be reversed upon appeal, potentially leading to payments of substantial damages or fines, or we may decide to settle lawsuits on similarly unfavorable terms, which could adversely affect our business, financial condition or results of operations. See Note 9, "Commitments“Commitments and Contingencies"Contingencies,” in the accompanying Notes to Consolidated Financial Statements included in Item 8 of this Form 10-K.
We are and will continue to be faced with many competitive challenges, any of which could adversely affect our business prospects, results of operations andor financial condition.
We compete for consumers, including both members and non-members,consumer attention with traditional, offline consumer resources as well as with onlinenumerous providers of consumer ratings, reviews and referrals on the basis of a number of factors, including, among other things, breadth of our service provider listings, reliability of our content, depth and timeliness of information, quality and availability of e-commerce offeringsour products, services and technology and strength and recognition of our brand. We also compete for a share of service providers’ overall advertising budgets with traditional, offline media companies and other Internetonline marketing providers on the basis of a number ofseveral factors, including, among other things, return on investment, the quality of our high-quality membership profile, the effectiveness and relevance of our discount and e-commerce initiatives, our pricing and monetization strategies and recognition of our brand. Our current competitors include a number of traditional offline consumer resources, such as the Yellow Pages and Consumers’ CHECKBOOK. Many of these competitors also provide consumer reviews and information about service providers online. We also compete with “free to consumer” online ratings websites and referral services, such as Handy, Inc., HomeAdvisor, Inc., Houzz, Inc., Porch.com, Inc., Red Beacon, Inc., Thumbtack, Inc. and Yelp, Inc. In our Health categories, we compete for members with other online resources for patients, such as RateMDs, Inc. and Health Grades, Inc. Across all categories, we also compete with established Internet companies who possess significantly greater resources and name recognition than we do.
To compete effectively, across our membership and service provider platforms, we must continue to invest significant resources in marketing, sales and technology. Many of our competitors continue to invest in the developmentexpansion of our products and services to enhance our value proposition to consumers as well as sustain our investments in our sales force, the development of existing and new advertising products and e-commerce offerings, the acquisition of new paid memberships and the collection of reviews of service providers.their businesses internationally. Failure to compete effectively against our current or future competitors, domestically or internationally, could result in losses of existing or prospective paid members, current or potential participating service providers or a reduced share of our participating service providers’ overall operating budgets, which could adversely affect our pricing and margins, lower our service provider revenue or prevent us from achieving or maintaining profitability. There is no guarantee that we will be able to compete effectively in the future against existing or new competitors, and the failure to do so could result in losses of existing or potential paid memberships reducedand participating service provider revenue,providers, increased marketing or selling expenses or diminished brand strength, any of which could harm our business, financial condition or results of operations.
If we are unable to replicate our performance in our larger markets, our operating results and financial condition may be harmed.
Our penetration rates in a number of our larger geographic markets lag those in many of our mid-size markets. Several of our largest markets, including New York City, Los Angeles and San Francisco, were converted to paid status beginning in 2006 and 2007, and these larger markets have produced the largest number of paid members to date. However, the penetration rates in these larger markets has generally lagged, on a percentage basis, those of our mid-size markets that converted to paid status in the same time frame. We believe that a principal reason for the lower penetration rates in our larger markets is the manner in which we market Angie’s List. We spend the majority of our marketing dollars on national advertising, which we believe provides us the most cost-efficient manner of acquiring new paid members and highlighting our e-commerce offerings. However, advertising nationally means we deliver the same volume of advertising regardless of the size of market. We believe the same volume of advertising in a smaller market is more effective in building brand awareness and generating new memberships than in larger markets. Slower penetration of our larger markets may delay or prevent us from increasing total revenue per paid membership in these markets. If we are unable to replicate the performance we have achieved in our most mature markets in our larger and less penetrated markets, or if growth in larger or less penetrated markets is significantly slower than we anticipate, our business, financial condition or results of operations could be harmed.
If we fail to effectively manage our growth,business strategies, our business, financial condition or results of operations may suffer.
WeOur business strategies have experienced,required, and expect tomay continue to experience, significant growth in newrequire, us to utilize substantial financial, operational and existing markets, which has placed, and will continue to place,technical resources, including placing significant demands on our management and our operational and financial infrastructure. Our growth strategy has required, and will continue to require, us to utilize substantial financial, operational and technical resources. Continued growth could strain our ability to maintain reliable service levels for our consumersmembers and participating service providers, to effectively monetize our membership base, to develop and improve our operational, financial and management controls, to enhance our reporting systems and procedures and to recruit, train and retain highly skilled personnel. Asproviders. If our operations continue to grow in size, scope and complexity, it will be important for us to continue to improve and upgrade our systems and infrastructure, and we may determine it is necessary to open additional operational locations, such as call centers, to support our advertising and e-commerce sales efforts, which wouldcould require significant expenditures and allocation of valuable management resources. If we fail to maintain thea necessary level of discipline and efficiency, or if we fail to allocate limited resources effectively in our organization as it grows,we implement our business strategies, our business, financial condition or results of operations may suffer.
Our inability to implement our strategic plan and growth initiatives may adversely impact future results.
Our ability to succeed in implementing our strategic plan and growth initiatives could require significant capital investment and management attention, which may result in the diversion of these resources from our core business and other business issues and opportunities. Additionally, any new initiative is subject to risks, including customer acceptance, competition, product differentiation, challenges to economies of scale in our marketplace, sourcing and the ability to attract and retain qualified management and other personnel. There can be no assurance that we will be able to develop and successfully implement our strategic plan and growth initiatives to a point where they will become profitable or generate positive cash flow. If we cannot successfully execute our strategic plan and growth initiatives, our business, financial condition or results of operations may be adversely impacted.
Our operating results may fluctuate from period to period, which makes our resultsperformance difficult to predict and could cause our results to fall short of expectations.
Our revenue and operating results have varied and may continue to vary significantly from quarter to quarter and year to year as a result of a variety of factors, many of which are outside our control. Therefore, comparing our operating results on a period to period basis may not be meaningful. In addition to other risk factors discussed herein, factors that may contribute to the variability of our quarterly and annual results include:
our ability to retain our current paid memberships and build our paidoverall membership base;
our ability to attract and retain ourparticipating service providers that currently advertise and sell e-commerce with us and convince them to increase their advertising spending and e-commerce offers with us;
engagement across our ability to attract new service providers to advertise and provide e-commerce offerings;platforms;
our ability to drive engagement and transaction volume inacross our marketplace;platforms;
our revenue mix and any changes we make to our membership feestiers and fee structure, e-commerce take rates or other sources of revenue;
our marketing costs orand selling expenses;
our ability to effectively manage our growth;
the effects of increased competition in our business;
business and our ability to keep pace with changes inour competitors’ advertising spending and technology innovations;
our ability to successfully develop new products and our competitors;services;
costs associated with defending any litigation or enforcing our intellectual property rights;
the impact of economic conditions in the United States on our revenue and expenses; and
changes in government regulation affecting our business.
From time to time, we change the compensation plans for our sales personnel. Any future changes to such compensation plans could disrupt our sales personnel, adversely affecting sales and reducing our revenue. We cannot guarantee that we will accurately forecast the impact of future changes to such compensation plans on our operating results.
Seasonal variations in the behavior of our members and service providers also may cause fluctuations in our financial results. For example, we expect to continue to experience some effects of seasonal trends in member and service provider behavior due to decreased demand for home improvement services in winter months. In addition, advertising expenditures by service providers tend to be discretionary in nature and may be sporadic reflecting overall economic conditions, the economic prospectsas a result of specific service providers or industries, budgeting constraints, buying patterns and a variety of other factors, including seasonality, many of which are outside our control. We also expect revenue contributions from our e-commerce offerings to fluctuate from period to period as the offerings evolve and due to seasonality. While we believe seasonal trends have affected and will continue to affect our quarterly financial results, our growth trajectory may overshadow these effects from time to time. We believe that our business will continue to be subject to seasonality in the future, which may result in fluctuations in our financial results.results from period to period.
We depend on key personnel to operate our business, and if we are unable to attract, retain attract and integrate qualified personnel, our ability to develop and successfully grow our business could be harmed.
We believe that our future success depends, in part, upon the continued service of key members of our management team as well as our ability to attract and retain highly skilled and experienced sales, technicaltechnology and other personnel. Our co-founders, William S. OesterlePresident and Chief Executive Officer, Scott A. Durchslag, and our co-founder and Chief Marketing Officer, Angie Hicks, are critical to our overall management as well asand the development of our culture and strategic direction. In particular, the reputation, popularity and talent of Ms. Hicks is anare important factorfactors in the public perceptionsperception of Angie’s List, and the loss of her services or any repeated or sustained shifts in public perceptions of her could adversely affect our business.
In addition, qualified individuals are in high demand in the Internettechnology sector, and we may therefore incur significant costs to attract them.or retain qualified personnel. Competition for thesequalified personnel iscan be intense, and we may not be successful in attracting and retaining them.such personnel as a result. Many of the companies with which we compete for experienced personnel possess more resources than us. In addition, in making employment decisions, particularly in the technology sector, job candidates often consider the value of the stock compensation they would receive in connection with their employment. If we are unable to attract and retain our executive officers and key employees, we may not be able to achieve our strategic objectives, and our business could be harmed.
We provide our executive officers and other key personnel with a mix of cash and equity compensation. With respect to equity compensation, prior to 2015, we have only offered stock options to these parties, but during 2015, we began granting time-based and performance-based restricted stock units to date.these parties as well. If optionsshare-based payment awards granted to executive officers and other key personnel lose value or, in the case of stock options, are not in the money subsequent to the grant date, the viability of optionssuch share-based payment awards as a retention tool could be negatively impacted, which may make it difficult to retain these employees. If we are unable to attract and retain executive officers and key personnel, to our business, financial condition or results of operations could be harmed.
We may require additional capital to pursue our business objectives and respond to business opportunities, challenges or unforeseen circumstances. If capital is not available to us, our business, financial condition or results of operations may be harmed.
We may require additional capital to operate or expand our business, asand certain of our strategic initiatives may necessitate substantial capital resources before they begin to generate revenue. Our working capital may vary, which could require us to seek additional financing. Although we believe we possess adequate working capital resources to support the execution of our business strategies, we may need additional funding to accomplish our plans. Our working capital needs are extremely difficult to predict and may continue to be extremely difficult to predict even after we have settled on a strategic course of direction. We may therefore be subject to significant and rapid increases in our working capital needs that could require us to seek additional financing sources. Additional funds may not be available when we need them,needed, on terms that are acceptable to us, or at all. For example, our debt facility contains various restrictive covenants with respect to the use of funds from our borrowings, and any debt financing secured by us in the future could involve additional restrictive covenants, which may make it more difficult for us to obtain additional capital and pursue business opportunities.capital. If we attempt to raise additional funds through the issuance of equity or convertible securities, the percentage ownership of holders of our common stock could be significantly diluted, and these newly issued securities may have rights, preferences or privileges senior to those of holders of our common stock.stock, which could adversely affect the availability of such funds. Furthermore, volatility in the credit or equity markets may have an adverse effect onnegatively impact our ability to obtain debt or equity financing, or the cost of such financing may not be favorable. If sufficient funds are not available to enhance our solutions, maintain the competitiveness of our technology or pursue business opportunities, we may not be able to service our existing members, acquire new members or attract or retain participating service providers, which could have an adverse impact onus, our business, financial condition or results of operations.
If we fail to maintain proper and effective internal controls, our ability to produce accurate financial statements on a timely basisoperations could be impaired, which could adversely affect our business and our stock price.
Ensuring that we maintain adequate internal financial and accounting controls and procedures to produce accurate financial statements on a timely basis is a costly and time-consuming effort that needs to be reevaluated frequently. We have in the past discovered, and may in the future discover, areas of our internal financial and accounting controls and procedures that need improvement.
Our management is responsible for establishing and maintaining adequate internal control over financial reporting to provide reasonable assurance regarding the reliability of our financial reporting and the preparation of financial statements for external purposes in accordance with U.S. generally accepted accounting principles. Our management does not expect that our internal control over financial reporting will prevent or detect all errors and all fraud. A control system, no matter how well designed and operated, can provide only reasonable, not absolute, assurance that the control system’s objectives will be met. Due to the inherent limitations in all control systems, no evaluation of controls can provide absolute assurance that misstatements due to error or fraud will not occur or that all control issues and instances of fraud, if any, within our company will be detected.impacted.
As we recognize membership revenue over the term of the membership and recognize service provider revenue ratably over the relevant contract period, downturns or upturns in membership or in service provider advertising may not be immediately reflected in our operating results.
We recognize membership revenue ratably over the term of a paid subscription and service provider revenue ratably over the time period during which the advertisements are run. As approximately 96% of our members subscribed on an annual or multi-year basis as of December 31, 2014, a large portion of our membership revenue reflects deferred revenue from memberships purchased in previous periods. Similarly, as our service provider contracts run for an average term of approximately one year, a large portion of our service provider revenue each period reflects purchasing decisions made in prior periods. Therefore, an increase or decrease in new or renewed memberships or new or renewed service provider contracts in any one period will not necessarily be fully reflected in our revenue for that period but will affect our revenue in future periods. Accordingly, the effect of significant downturns or upturns in membership or advertising sales may not fully impact our results of operations until future periods.
If we fail to generate or maintain high-quality reviews and reports from our consumers, we may be unable to provide members with the information they seek, which could negatively impact membership retention and growth as well as service provider retention and growth.
Our business depends, in part, on our ability to provide our members with the information they seek, which is directly impacted by the quality and quantity of reviews and reports provided by our member and non-member consumers. For example, we may be unable to offer our members adequate information on service providers if content is not contributed that is helpful or relevant to a service category in a particular market. We may be unable to provide members with the information they seekmarket or if consumers are unwilling to contribute reviews and reports due to concerns related to potential lawsuits or harassment by service providers they review, instances of which have occurred in the past and may occur again in the future. In addition, we may not be able to provide members with the information they seekare seeking if the information on our site is not updated.
We do not remove older reviews, and members may view these reviews as less relevant, helpful or reliable. If our site doesplatforms do not provide current information about service providers, or members perceive reviews on our site as less relevant or stale, our brand, business, financial condition or results of operations could suffer.
Membership growth is impacted by traffic to our website from search engines, such as Google, Bing and Yahoo!, some of which offer products and services that compete directly with our services.offerings. If our website fails to rank prominently in unpaid search results, traffic to our site could decline, and our business could be adversely impacted.
A portion of our website traffic is generated by non-paid search results that appear on search engines, such as Google and Bing.Google. While SEO has a much lower cost per acquisition as compared to many outbound marketing channels and has helpedhelps reduce our overall cost per membership acquisition, our ability to maintain high organic search rankings is not completely within our control. As such, our competitors’ SEO efforts may result in their websites receiving a higher search result page ranking than ours. Separately, Internetonline search engines could revise their methodologies in such a way that could adversely affect our search result rankings. For example, Google makes changes to its algorithm(s)algorithms from time to time, any one of which could potentially impact our rankings, which we are dependent upon, to a certain extent, to drive traffic to and ultimately sales toengagement on our site.platforms. Our website has experienced fluctuations in search result rankings in the past, and we anticipate similar fluctuations in the future. Any reduction in the number of Internet users directed to our website through search engines could harm our business, financial condition or results of operations.
If service providers rated on our website do not meet the expectations of our members, or engage in unethical or illegal conduct, we may suffer reputational harm, liability or adverse impacts on our profitability and liquiditybusiness, financial condition or results of operations as a result.
Quality and integrity are important foundations of our business that could be harmed by actions taken by service providers outside our control. Given thatOur members utilize our members use our servicesplatforms and tools to gather information about services that oftentimes carry a high risk of failure and also, at times, to purchase services at discounted rates through our e-commerce offerings, ifofferings. If such services are performed incompetently, or if service providers fail to perform prepaid services, our reputation could be adversely affected. We cannot be certain that highly-rated service providers will perform to the satisfaction of our members, or at all. In addition, unethical or illegal conduct by service providers rated on our website could damage our reputation or expose us to liability arising from claims made by or on behalf of those harmed by such conduct.
We pay service providers in advance for e-commerce offerings purchased by members.members in advance of the performance of the service. Under this payment model, service providers are paid regardless of whether the e-commerce offers are redeemed or the services are performed. SubjectWe offer guarantees around price and service quality to our paid members on work performed by service providers under e-commerce transactions executed on our platforms, and, subject to certain limitations, our members may request a refund from us on theirthese e-commerce transactions. As we do not have control overthe service providers andor the quality and price of the services they deliver, we develop estimates for refund claims. Our actual level of refund claims could prove to be greater than the level of refund claims we estimate, particularly as our revenue from e-commerce offerings grows and we develop additional e-commerce products, services and features.estimate. Moreover, our members may make requests for refunds with respect to which we are unable to recover reimbursement from ourthe applicable service providers, particularly as we alter our service provider monetization strategies.providers. An increase in our refund rates, or our inability to recover from our service providers, as well as any failure of service providers rated on our website to meet the expectations of our members, could adversely affect our profitability and liquidity.business, financial condition or results of operations.
Many peopleconsumers utilize mobile devices, such as smartphones and tablets, to access information about service providers and to search for and purchase e-commerce offers.our platforms. If we are not successful in developing products and services that can be efficiently and effectively utilized through the use of thesemobile technologies, or oursuch products and services are not widely adopted, our business could be adversely affected.
The number of people who seekconsumers seeking information about service providers through mobile devices, including smartphones and tablets, has increased significantly over the past several years and is likely to continue to grow in the future. If our members are unable to access our ratings and reviews of service providers on their mobile devices, if we otherwise fail to develop and maintain effective mobile advertising and e-commercerelated products and services or if our mobile products and services are not widely adopted by consumers,our members, our business, financial condition or results of operations may suffer. Additionally, as new mobile devices and platforms are released, it is difficult to forecast the challenges that may arise, and we may need to devote significant resources to the development, support and maintenance of these products. Finally, if we experience problems with continued integration of our mobile applicationapplications into mobile devices, if we experience issues with providers of mobile operating systems or mobile application download stores such as Apple, Inc.'s App Store or Google Play, or if we face increased costs to distribute our mobile apps,applications, our business, financial condition or results of operations could suffer.
Failure to comply with federal and state laws and regulations relating to privacy and security of personal information, including personal health information, could result in liability to us, damage our reputation or harm our business.
A variety of federal and state laws and regulations govern the collection, use, retention, sharing and security of personal information. We collect and utilize demographic and other information from and about consumers, including bothour members and non-members, as they interact with our various platforms. We may also collect information from consumersour members when they provide ratings and reviews of service providers, purchase e-commerce offers, participate in polls or contests or sign up to receive emails from us. Further, we utilize tracking technologies, including “cookies,” to help us manage and track consumers'our members’ interactions with our platforms and deliver relevant advertising. Claims or allegations that we violated laws and regulations related to privacy and data security could in the future result in negative publicity or a loss of confidence in us by consumersmembers and service providers and may subject us to government fines. In addition, we have posted privacy policies and practices concerning the collection, use and disclosure of consumer data on our websites and mobile application.applications. Several Internet companies have incurred penalties for failing to abide by the representations made in their privacy policies and practices.
In the course of rating and reviewing health care or wellness providers, our consumersmembers may post personal health information about themselves or others, and the health care or wellness providers reviewed by consumersour members may submit responses that contain private or confidential health information about those that leftprovided the reviews or others. While we strive to comply with applicable privacy and security laws and regulations regarding personal health information, as well as our own posted privacy policies, any failure or perceived failure to comply may result in proceedings or actions against us by government entities or others or could cause us to lose consumersmembers or service providers, which could adversely affect our business.
We have incurred, and will continue to incur, expenses to comply with privacy and security standards and protocols for personal information, including personal health information, imposed by law, regulation, self-regulatory bodies, industry standards and contractual obligations. However, such laws and regulations are evolving and are subject to potentially differing interpretations. Also, federal and state legislative and regulatory bodies may expand current, or enact new, laws or regulations regarding privacy matters. We are unable to predict what additional legislation or regulation in the area of privacy of personal information could be enacted or its effect on our operations and business. If we fail to comply with laws and regulations relating to privacy and security of personal information, our business, financial condition or results of operations could be adversely impacted.
We are subject to a number of risks related to accepting credit card and debit card payments.
We accept payments from consumers, including bothservice providers and members and non-members, primarily through credit and debit card transactions. For credit and debit card payments, we pay interchange and other fees, which may increase over time. An increase in those fees could require us to either increase the prices we charge for our services, which could cause us to lose members and membership revenue,yield declines in memberships or sufferservice provider participation, or incur an increase in our operating expenses, either of which could adversely affect our business, financial condition or results of operations.
If we, or any of our processing vendors, experience problems with our billing software, or if the billing software malfunctions, it could adversely affect our member and service provider satisfaction and could cause one or more of the major credit card companies to disallow our continued use of their payment products. In addition, if our billing software fails to work properly and, as a result, we are unable to automatically charge our members’ or service providers’ credit cards on a timely basis, or at all, we could lose membership revenue, which could harm our business, financial condition or results of operations.
We are also subject to payment card association operating rules, certification requirements and rules governing electronic funds transfers, including the Payment Card Industry Data Security Standard, or PCI DSS, a security standard with which companies that collect, store or transmit certain data related to credit and debit cards, credit and debit card holders and credit and debit card transactions are required to comply. Our failure to fully comply fully with the PCI DSS may violate payment card association operating rules, federal and state laws and regulations and the terms of our contracts with payment processors and merchant banks. Such compliance failures may also subject us to fines, penalties, damages or civil liability and may result in the loss of our ability to accept credit and debit card payments. In addition, there is no guarantee that PCI DSS compliance will prevent illegal or improper use of our payment systems or the theft, loss or misuse of data pertaining to credit and debit cards, credit and debit card holders or credit and debit card transactions.
If we fail to adequately control fraudulent credit card transactions, we may face civil liability, diminished public perception of our security measures or significantly higher credit card costs, each of which could adversely affect our business, financial condition or results of operations.
If we are unable to maintain our chargeback rate at acceptable levels, our credit card fees for chargeback transactions or our fees for many or all categories of credit and debit card transactions, credit card companies and debit card issuers may increase our fees or terminate their relationship with us. Any increases in our credit card or debit card fees could adversely affect our results of operations, particularly if we elect not to raise the rates for our services to offset the increase. Meanwhile, the termination of our ability to process payments on any major credit or debit card wouldcould significantly impair our ability to operate our business and potentially negatively impact our financial condition or results of operations.
As we develop and sell new products services and features,services, we may be subject to additional and unexpected regulations, which could increase our costs or otherwise harm our business.
As we develop and sell new products and services, that address new segments of the market for local services and expand our marketplace initiatives, we may become subject to additional laws and regulations that could create unexpected liabilities for us, cause us to incur additional costs or restrict our operations. For example, our Angie’s List Health offerings may become subject to complex federal and state health care laws and regulations, the application of which to specific products and services is unclear. Many existing health care laws and regulations, when enacted, did not anticipate the online health and wellness information and advertising products and services that we provide; nevertheless, they may be applied to our products and services.
We generate e-commerce offerings that enable consumers to purchase services or products from our service providers. Transactions between consumers and service providers through our platforms in connection with these offerings may be subject to regulation, in whole or in part, by federal, state and local authorities.
In addition, theThe application of certain laws and regulations to some of our promotions are uncertain. These include laws and regulations such as the Credit Card Accountability Responsibility and Disclosure Act of 2009, or the CARD Act, and unclaimed and abandoned property laws. If theseour promotions are subject to the CARD Act, unclaimed and abandoned property laws or any similar state law or regulation, we may be required to record liabilities with respect to unredeemed promotions, and we may be subject to additional fines and penalties.
From time to time, we may also be notified of additionalnew laws and regulations, thatsuch as the Department of Labor’s recent revisions to the Fair Labor Standards Act, which governmental organizations or others may claim should be applicable to our business. Our failure to accurately anticipate the application of these laws and regulations, or any failure to comply, could create liability for us, result in adverse publicity or cause us to alter our business practices, which could cause our revenue to decrease or our costs to increase, or harmthus harming our business, financial condition or results of operations.
Our business depends on our ability to maintain, modify and scale the network infrastructure necessary to operate our website, mobile applicationapplications and related technologies and platforms.
Our members access reviews and other information through our website, mobile applicationapplications and related technologies and platforms. Our reputation and ability to acquire, retain and serve our consumers, including both members and non-members, and service providers is dependent upon the reliable performance of our website and mobile applicationapplications and the underlying network infrastructure. As our membership and service provider bases as well asgrow and the number of visitors to and level of activity on our website and various related technology platforms grow,increases, the amount of information shared across our technology infrastructure will continue to grow, and we will therefore require an increasing amount of network capacity and computing power.power to service our members and service providers. We have made, and expect to continue to make, substantial investments in our technology platforms, including data centers, equipment and related network infrastructure, as well as new technologies focused on driving enhanced customer experiences and business efficiencies, to support current and anticipated future growth and to effectively and efficiently handle the traffic and data flow on our website and systems. The development, expansion, operation and maintenance of our technology and network infrastructure is expensive and complex and requires significant internal and external resources. If we do not successfully develop, expand, operate or maintain our technology and network infrastructure, or if we experience operational failures, our reputation could be harmed, and we could lose current and potential consumers, includingprospective members and non-members, and participating service providers, which could adversely impact our business, financial condition or results of operations.
We may not be able to successfully prevent other companies including copycat websites, from misappropriating our data in the future.
From time to time, third parties attempt to misappropriate our ratings and reviews and other confidential data pertaining to our service providers, markets and sales procedures through website scraping, search robots, breach of confidentiality agreements or other means. We may not be able to successfully detect and prevent all such efforts in a timely manner or assurebe certain that no misuse of our data occurs.
In addition, third parties operating “copycat” websites have attempted to misappropriate data from our network and to imitate our brand orand the functionality of our website. When we have identified such efforts by other companies, we have employed technological or legal measures in an attempt to halt their operations. In other circumstances, we have enforced confidentiality rights with former employees via legal actions. However, we may not be able to detect all such efforts in a timely manner, or at all, and even if we could, the technological and legal measures available to us may be insufficient to stop their operations.insufficient. In some cases, particularly in the case of companies operating outside of the United States, our available remedies may not be adequate to protect us against the damage to our business caused by such websites. Regardless of whether or not we can successfully enforce our rights against the operation of these websites,third parties, any measures that we may take could require us to expend significant time and financial, legal, operational or technological resources as well as significantly and adversely impact our brand, business, financial condition or results of operations.
Failure to adequately protect our intellectual property could substantially harm our business and operating results.
We rely on a combination of intellectual property rights, including trade secrets, copyrights and trademarks, as well as contractual restrictions, to safeguard our intellectual property. We do not have any patents or pending patent applications. Despite our efforts to protect our proprietary rights, unauthorized parties may attempt to copy our digital content, aspects of our solutions for members and service providers, our technology, software, branding and functionality, or obtain and use other information that we consider proprietary. Moreover, policing our proprietary rights is difficult and may not always be effective. Should we expand internationally in the future, we may need to enforce our rights under the laws of countries that do not protect proprietary rights to as great an extent as do the laws of the United States.
As of December 31, 2014,2016, we have 23had 25 registered trademarks in the United States, including “Angie’s List,” and twoone registered trademarkstrademark in CanadaEurope, as well as twofour pending trademark applications in the United States. Some of our trade names may not be eligible to receive trademark protection. Trademark protection may also not be available, or sought by us, in every country in which our service may become available online. Competitors may adopt service names similar to ours or purchase our trademarks and utilize confusingly similar terms as keywords in Internet search engine advertising programs, thereby impeding our ability to build brand identity and possibly confusing consumers and service providers. Moreover, there could be potential trade name or trademark infringement claims brought by owners of other registered trademarks or trademarks that incorporate marks similar to our trademarks. In addition, in the past, some service providers have used our trademarks inappropriately or without our permission, including our “SuperSuper Service Award”, which is available only to service providers that maintain superior service ratings. We have in the past taken, and may in the future take, action, including initiating litigation, to protect our intellectual property rights and the integrity of our brand, but these efforts may prove costly, ineffective or both.
We currently hold the “Angie’s List” Internet domain name and various other related domain names. Domain names generally are regulated by Internet governing bodies. If we lose the ability to use a domain name in the United States or any other country, we wouldcould be forced to incur significant additional expense to market our solutions, including the development of a new brand and the creation of new promotional materials, which could substantially harm our business, financial condition andor results of operations. The regulation of domain names in the United States and in foreign countries is subject to change. Regulatory bodies could establish additional top-level domains, appoint additional domain name registrars or modify the requirements for holding domain names. As a result, we may not be able to acquire or maintain the domain names that utilize the “Angie’s List” name in all of the countries in which we currently intend tomay conduct business.business in the future. Further, our digital content is not protected by any registered copyrights or other registered intellectual property and is instead protected by statutory and common law rights and by user agreements that limit access to and use of our data, and by technological measures. Compliance with use restrictions is difficult to monitor, and our proprietary rights in our digital content databases may be more difficult to enforce than other forms of intellectual property rights.
Litigation or proceedings before the U.S. Patent and Trademark Office or other governmental authorities and administrative bodies in the United States and abroad may be necessary in the future to enforce our intellectual property rights, to protect our domain names andor to determine the validity and scope of the proprietary rights of others. Our efforts to enforce or protect our proprietary rights may be ineffective, could result in substantial costs and diversion of resources and could substantially harm our business, financial condition or results of operations.
In order to protect our trade secrets and other confidential information, we rely, in part, on confidentiality agreements with our personnel, consultants and third parties with whom we maintain relationships. These agreements may not effectively prevent disclosure of trade secrets and other confidential information and may not provide an adequate remedy in the event of misappropriation of trade secrets or any unauthorized disclosure of trade secrets and other confidential information. In addition, others may independently discover trade secrets and confidential information, and in such cases, we could not assert any trade secret rights against such parties. Costly and time-consuming litigation could be necessary to enforce and determine the scope of our trade secret rights and related confidentiality and nondisclosure provisions, and failure to obtain or maintain trade secret protection, or our competitors being able to obtain our trade secrets or independently develop similar or competing technologies, could adversely affect our competitive business position.position and therefore harm our business, financial condition or results of operations.
Assertions by third parties of infringement or other violations by us of intellectual property rights could result in significant costs and substantially harm our business, financial condition or results of operations.
Internet, technology and media companies are frequently subject to litigation based on allegations of infringement, misappropriation or other violations of intellectual property rights. Some Internet, technology and media companies, including some of our competitors, own large numbers of patents, copyrights, trademarks and trade secrets, any of which could be utilized to assert claims against us. Third parties may in the future assert that we have infringed, misappropriated or otherwise violated their intellectual property rights, and as we face increasing competition, the possibility of intellectual property rights claims against us grows. We cannot guarantee that we are not infringing or violating any third-party intellectual property rights.
We cannot predict whether assertionsAssertions of third-party intellectual property rights or any infringement or misappropriation claims arising from such assertions willcould substantially harm our business, financial condition or results of operations. If we are forced to defend against any infringement or misappropriation claims, whether they are with or without merit, are settled out of court or are decided in our favor, we may be required to expend significant time and financial resources on the defense of such claims. Furthermore, an adverse outcome of a dispute may require us to pay damages, potentially including treble damages and attorneys’ fees, if we are found to have willfully infringed a party’s patent or copyright rights, to cease making, licensing or using solutions that are alleged to infringe or misappropriate the intellectual property of others, to expend additional development resources to redesign our solutions, to enter into potentially unfavorable royalty or license agreements in order to obtain the right to use necessary technologies, content or materials andor to indemnify our partners and other third parties. Royalty or licensing agreements, if required or desirable, may be unavailable on terms acceptable to us, or at all, and may require significant royalty payments and other expenditures. Litigation related to intellectual property rights, regardless of the outcome, could be expensive to resolve and could divert the time and attention of our management and technical personnel. Any of these events could seriously harm our business, financial condition or results of operations.
Some of our services and technologies may utilize “open source” software, which may restrict how we use or distribute our services or require that we release the source code of certain services subject to those licenses.
Some of our services and technologies may incorporate software licensed under so-called “open source” licenses, including, but not limited to, the GNU General Public License and the GNU Lesser General Public License. These open source licenses typically require that source code subject to the licenses be made available to the public and that any modifications or derivative works to open source software continue to be licensed under open source licenses. These open source licenses typically mandate that certain proprietary software, when combined in specific ways with open source software, becomesis subject to the open source license. If we combine our proprietary software with open source software, we could be required to release the source code of our proprietary software.
We take steps to ensure that our proprietary software is not combined with, nor incorporates, open source software in ways that would require our proprietary software to be subject to an open source license. However, few courts have interpreted open source licenses, and the manner in which these licenses may be interpreted and enforced is therefore subject to some uncertainty. Additionally, we rely on multiple software programmersengineers to design our proprietary technologies, and although we take steps to prevent our programmersengineers from including open source software in the technologies and software code that they design, write and modify, we do not exercise complete control over the development efforts of our programmers,software engineers, and we cannot be certain that our programmersengineers have not incorporated open source software into our proprietary products and technologies or that they will not do so in the future. In the event that portions of our proprietary technology are determined to be subject to an open source license, we could be required to publicly release the affected portions of our source code, re-engineer all or a portion of our technologies or otherwise be limited in the licensing of our technologies, each of which could reduce or eliminate the value of our services and technologies and materially and adversely affect our business, financial condition or results of operations.
We rely on third parties to provide software and related services necessary for the operation of our business.
We utilize third-party software in our product and service offerings and expect to continue to do so. The operation of our product and service offerings could be impaired if errors or defects occur in the third-party software that we use. Itutilize, and it may be more difficult for us to correct any such errors or defects in third-party software as the development and maintenance of the software is not within our control. Accordingly,control, thereby potentially adversely affecting our business couldbusiness. Further, we cannot be adversely affected in the event of any errors in third-party software. We cannot ensurecertain that any third-party licensors will continue to make their software available to us on acceptable terms, or at all, invest the appropriate levels of resources in their software to maintain and enhance its capabilities or remain in business. Any impairment in our relationships with theseour third-party licensors could adversely impact our business, financial condition, results of operations or cash flows. Further,Additionally, third-party in-licenses may expose us to increased risk, including risks associated with the assimilation of new technology sufficient to offset associated acquisition and maintenance costs. The inability to obtain these licenses could result in delays in development of solutions until equivalent technology can be identified and integrated. Any such delays in servicesintegrated, which could cause our business, financial condition or results of operations to suffer.
Our revenue may be negatively affected if we are required to pay sales and use tax or other transaction taxes on all or a portion of our past and future sales in jurisdictions where we are currently not collecting and reporting tax.
We currently only pay sales or other transaction taxes in certain jurisdictions in whichCurrently, we do business. We do not separately collect sales and use or other transaction taxes.taxes from our members. Instead, we report and, if applicable, pay sales and use and other transaction taxes on behalf of our members in certain jurisdictions and record an accrual for such taxes based on probable liability within other applicable jurisdictions. A successful assertion by any state or local jurisdiction or country in which we do not pay suchsales and use or other transaction taxes that we should be paying sales or other transactionsuch taxes on the sale of our products or services, or the imposition of new laws requiring the payment of sales and use or other transaction taxes on the sale of our products or services, could result in substantial tax liabilities related to past sales, create increased administrative burdens or costs, discourage consumersmembers and service providers from purchasing products or services from us, decrease our ability to compete or otherwise substantially harm our business, financial condition or results of operations.
We may suffer liability as a result of the ratings or reviews posted on our website.
Our terms of use specifically require members and non-members submitting reviews to represent that their ratings and reviews are based on their actual first-hand experiences and are accurate, truthful and complete in all respects and that they possess the right and authority to grant us a license to publish their reviews. However, we do not possess the ability to verify the accuracy of these representations on a case-by-case basis. There is a risk that a review may be considered defamatory or otherwise offensive, objectionable or illegal under applicable law. Therefore, there is a risk that publication of our ratings and reviews on our website may give rise to a suit against us for defamation, civil rights infringement, negligence, copyright or trademark infringement, invasion of privacy, personal injury, product liability, breach of contract, unfair competition, discrimination, antitrust or other legal claims. From time to time, we are involved in claims and lawsuits based on the contents of the ratings and reviews posted on our website, including claims of defamation. To date, we have not suffered a material loss due to a claim of defamation. We may be subject to similar claims in the future, which could result in costly and time-consuming litigation, liability for moneymonetary damages or injury to our reputation, thereby adversely impacting our business, financial condition or results of operations.
We may not realize the expected business benefits of our efforts to reorganize certain of our sales force,departments, and the reorganized sales departmentdepartments could prove difficult to integrate, disrupt our business or adversely affect our revenues and operating income.results.
We periodically make changes to the structure of various departments within our sales departmentcompany in an effort to optimize performance, and productivity and we may make such changes again in the future. For example, in 2014, we reduced our sales force by 97 people.or costs. Such reorganizations involve numerous risks, including:
the potential failure to achieve the expected benefits of the reorganization;
difficulties in and the cost of reorganizing operations, services and personnel;
diversion of financial and managerial resources from existing operations;
potential loss of key employees;
inability to generate sufficient revenue to offset reorganization costs;
liabilities and expenses associated with the reorganization, both known and unknown; and
negative impacts on our operating income and revenues due to thea reduction in productivity and efficiency caused by the reorganization process.
If we fail to properly evaluate and execute internal reorganizations, our business may be seriously harmed, negatively impacting our financial condition and results of operations, and the value of your investment may decline as a result.
We face many risks associated with our long-term plan to expand our operations outside of the United States.
Expanding our operations into international markets is an element of our long-term strategy. However, offering our products and services outside of the United States involves numerous risks and challenges. Most importantly, acquiring paid memberships in foreign countries and convincing foreign service providers to do business with us would require substantial investment by us in local advertising and marketing, and there can be no assurance that we would succeed or achieve any return on this investment. In addition, international expansion would expose us to other risks such as:
the need to modify our technology and sell our products and services in non-English speaking countries;
the need to localize our products and services to the preferences and customs of foreign consumers and service providers;
difficulties in managing operations due to language barriers, distance, staffing, cultural differences and business infrastructure constraints;
our lack of experience in marketing, and encouraging viral marketing, in foreign countries;
the application of foreign laws and regulations to us, including more stringent consumer privacy and data protection laws;
fluctuations in currency exchange rates;
the risk of member or service provider fraud;
reduced or ineffective protection of our intellectual property rights in some countries; and
potential adverse tax consequences associated with foreign operations and revenue.
As a result of these obstacles, we may find it impossible or prohibitively expensive to enter international markets, or entry into international markets could be delayed, which could harmnegatively impact our business, financial condition or results of operations.
We may acquire other companies or technologies, which could divert our management’s attention, result in additional dilution to our stockholders andor otherwise disrupt our operations and harm our operating results.
Our success depends, in part, on our ability to expand our product and service offerings and grow our business in response to changing technologies, consumermember and service provider demands and competitive pressures. In some circumstances, we may do so through the acquisition of complementary businesses or technologies rather than through internal development. Our experience with respect to acquiring other businesses and technologies is limited. The pursuit of potential acquisitions may divert the attention of management and cause us to incur various expenses for identifying, investigating and pursuing suitable acquisitions, whether or not they are consummated. Furthermore, even if we successfully acquire additional businesses or technologies, we may not be able to integrate the acquired personnel, operations andor technologies successfully or effectively manage the combined business following the acquisition. We also may not achieve the anticipated benefits from the acquired business or technology. In addition, we may unknowingly inherit liabilities from future acquisitions that arise after the acquisition and are not adequately covered by indemnities. Acquisitions could also result in dilutive issuances of equity securities or the incurrence of debt, which could adversely impact our operating results.results or the value of our common stock. If an acquired business or technology fails to meet our expectations, our business, financial condition or results of operations may suffer.
Our ability to utilize our net operating loss carryforwards and certain other tax attributes may be limited.
As of December 31, 2014,2016, we had federal net operating loss carryforwards of approximately $128.3$159.3 million and state net operating loss carryforwards of approximately $158.9$210.9 million. Under Sections 382 and 383 of the Internal Revenue Code of 1986, as amended, if a corporation undergoes an “ownership change,” the corporation’s ability to use its pre-change net operating loss carryforwards and other pre-change tax attributes, such as research tax credits, to offset its post-change income and taxes may be limited. In general, an “ownership change” generally occurs if there is a cumulative change in our ownership by “5-percent shareholders” that exceeds 50 percentage points over a rolling three-year period. Similar rules may apply under state tax laws. We may have experienced an ownership change in the past and may experience ownership changes in the future as a result of future transactions in our stock, some of which may be outside our control. As a result, if we earn net taxable income, our ability to utilize our pre-change net operating loss carryforwards, or other pre-change tax attributes, to offset U.S. federal and state taxable income and taxes may be subject to limitations.
Future sales of our common stock by stockholders could depress the market price of our common stock.
As of December 31, 2014, holderslimitations, and transferees of approximately 15,000,877 shares, or 26%, of our common stock, vested stock options and stock options that vest within 60 days possess rights, subject to certain conditions, that require us to file registration statements covering the sale of their shares or to include their shares in registration statements that we may file for ourselves or other stockholders. In addition, in November 2011, March 2012, October 2013 and July 2014, we filed registration statements on Form S-8 under the Securities Act to register an aggregate of 13,753,277 shares of our common stock for issuance through our amended and restated omnibus incentive plan. This plan also provides for automatic increases in the shares reserved for issuance under the plan. These shares may be sold in the public market upon issuance and, once vested, any restrictions are provided under the terms of the applicable plan or award agreement. If these additional shares are sold, or if it is perceived that they will be sold, in the public market, the trading price of our common stock could decline.
If securities or industry analysts publish inaccurate or unfavorable research about our business, cease coveragefinancial condition or results of our company or make projections that exceed our actual results, our stock price and trading volume could decline.
The trading market for our common stock is influenced by the research and reports that securities or industry analysts publish about us or our business. If one or more of the analysts who cover our company downgrade our stock or publish inaccurate or unfavorable research about our business, our stock price would likely decline. If one or more of these analysts cease coverage of our company or fail to publish reports on us regularly, demand for our stock could decrease, which might result in a decline to our stock price and trading volume.
Furthermore, analysts publish their own projections for our actual results. These projectionsoperations may vary widely from one another and may not accurately predict the results we actually achieve. Our stock price may decline if we fail to meet securities and analysts’ projections.therefore suffer.
Concentration of ownership among our officers and directors and their affiliates may limit the influence of new investors on corporate decisions.
Our officers, directors and their affiliated funds beneficially own or control, directly or indirectly, approximately 27%18% of our company'scompany’s outstanding shares of common stock. As a result, if some of these persons or entities act together, they wouldcould be capable of meaningfully influencing the outcome of matters submitted to our stockholders for approval, including the election of directors and approval of significant corporate transactions, such as a merger or sale of our company or its assets. This concentration of ownership could limit the ability of other stockholders to influence corporate matters and may delay or preclude an acquisition or cause the market price of our stock to decline. Some of these persons or entities may have interests different from the rest of our stockholders.
Our business could be negatively affected as a result of actions of activist stockholders.
The actions of an activist stockholder could adversely affect our business. Specifically:
responding to common actions of an activist stockholder, such as public proposals and requests for special meetings, potential nominations of candidates for election to our board of directors, requests to pursue a strategic combination or other transaction or other special requests, could disrupt our operations, be costly and time-consuming or divert the attention of our management and employees;
perceived uncertainties as to our future direction in relation to the actions of an activist stockholder may result in the loss of potential business opportunities or the perception that we are unstable and need to make changes, which may be exploited by our competitors and make it more difficult to attract and retain key personnel as well as members and service providers;
pursuit of an activist stockholder’s agenda may adversely affect our ability to effectively implement our business strategies and create additional value for our stockholders; and
actions of an activist stockholder may cause fluctuations in our stock price based on speculative market perceptions or other factors that do not necessarily reflect the underlying fundamentals and prospects of our business.
Certain provisions in our charter documents and Delaware law could discourage takeover attempts and lead to management entrenchment.
Our certificate of incorporation and bylaws contain provisions that could delay or prevent changes in control or changes in our management without the consent of our board of directors, including, among other things:
a classified board of directors with three yearthree-year staggered terms, which could delay the ability of stockholders to replace a majority of our board of directors;
no cumulative voting in the election of directors, which limits the ability of minority stockholders to elect director candidates;
the ability of our board of directors to issue shares of preferred stock and to determine the price and other terms of those shares, including preferences and voting rights, without stockholder approval, which could be used to significantly dilute the ownership of a hostile acquirer;
the exclusive right of our board of directors to elect a director to fill a vacancy created by the expansion of our board of directors or the resignation, death or removal of a director, which prevents stockholders from being able to fill vacancies on our board of directors;
a prohibition on stockholder action by written consent, which forces stockholder action to be taken at an annual or special meeting of our stockholders;
the requirement that a special meeting of stockholders may be called only by a majority vote of ourthe Board of Directors, the Chairman of our Board of Directors, ourthe Chief Executive Officer our President or ourthe Secretary, which could delay the ability of our stockholders to force consideration of a proposal or to take action, including the removal of directors;
the requirement for the affirmative vote of holders of at least 66 2/3% of the voting power of all of the then-outstanding shares of the voting stock, voting together as a single class, to amend the provisions of our certificate of incorporation relating to the issuance of preferred stock and management of our business or our bylaws, which may inhibit the ability of an acquirer to amend our certificate of incorporation or bylaws to facilitate a hostile acquisition;
the ability of our board of directors, by majority vote, to amend our bylaws, which may allow our board of directors to take additional actions to prevent a hostile acquisition and inhibit the ability of an acquirer to amend our bylaws to facilitate a hostile acquisition; and
advance notice procedures with which stockholders must comply to nominate candidates to our board of directors or to propose matters to be acted upon at a stockholders’ meeting, which may discourage or deter a potential acquirer from conducting a solicitation of proxies to elect the acquirer’s own slate of directors or otherwise attempting to obtain control of our company.
We are also subject to certain anti-takeover provisions under the General Corporation Law of the State of Delaware, or the DGCL. Under Section 203 of the DGCL, a corporation may not, in general, engage in a business combination with any holder of 15% or more of its capital stock unless the holder has held the stock for three years or (i) our board of directors approves the transaction prior to the stockholder acquiring the 15% ownership position, (ii) upon consummation of the transaction that resulted in the stockholder acquiring the 15% ownership position, the stockholder owns at least 85% of the outstanding voting stock (excluding shares owned by directors or officers and shares owned by certain employee stock plans) or (iii) the transaction is approved by the boardBoard of directorsDirectors and by the stockholders at an annual or special meeting by a vote of 66 2/3% of the outstanding voting stock (excluding shares held or controlled by the interested stockholder). These provisions in our certificate of incorporation and bylaws and under Delaware law could discourage potential takeover attempts.attempts or make it more difficult for a third-party to acquire us, even if the third-party’s offer may be considered beneficial by many of our stockholders. As a result, our stockholders may be limited in their ability to obtain a premium for their shares.
We do not intend to pay dividends for the foreseeable future.
We have never declared or paid any cash dividends on our capital stock and do not intend to pay any cash dividends on our stock in the foreseeable future. In addition, our financing agreement restricts our ability to make distributions to our stockholders. We anticipate that we will retain any future earnings for use in the development of our business and for general corporate business operations purposes. Any determination to pay dividends in the future will be at the discretion of our board of directors, subject to the parameters and restrictions set forth in any outstanding debt agreements at the time.
ITEM 1B. UNRESOLVED STAFF COMMENTS
None.
ITEM 2. PROPERTIES
As of December 31, 2014,2016, we owned approximately 124,000195,000 square feet of office space at our headquarters in Indianapolis, Indiana, the majority of which we purchased in 2012. In addition, we leased approximately 167,000127,000 square feet of office space in Indianapolis, Indiana pursuant to leases expiring in 20152020 and 20202021 and in Denver, Colorado under a lease expiring in 2015.September 2017. We believe our current facilities, will be adequate orboth owned and leased, are in good condition and suitable for the conduct of our business and that additional space will be available to us, as needed, on commercially reasonable terms for the foreseeable future.
ITEM 3. LEGAL PROCEEDINGS
Information pertaining to legal proceedings can be found in Note 9, "Commitments“Commitments and Contingencies”Contingencies,” in the accompanying Notes to Consolidated Financial Statements included in Item 8 of this Form 10-K and is incorporated by reference herein.
ITEM 4. MINE SAFETY DISCLOSURES
Not applicable.
PART II
ITEM 5. MARKET FOR REGISTRANT’S COMMON EQUITY, RELATED STOCKHOLDER MATTERS AND ISSUER PURCHASES OF EQUITY SECURITIES
Our common stock has been listed on the Nasdaq Global Market under the symbol “ANGI” since our initial public offering on November 17, 2011. Prior to this time, there was no public market for our common stock. The following table shows the high and low sale prices per share of our common stock as reported on the Nasdaq Global Market for the periods indicated:
| | | | | 2014 | | 2016 |
| | | High | | Low | | High | | Low |
| First Quarter | | $ | 19.80 |
| | $ | 11.81 |
| | $ | 10.19 |
| | $ | 7.66 |
|
| Second Quarter | | $ | 14.65 |
| | $ | 9.60 |
| | 9.19 |
| | 6.46 |
|
| Third Quarter | | $ | 12.65 |
| | $ | 6.28 |
| | 10.76 |
| | 6.32 |
|
| Fourth Quarter | | $ | 8.90 |
| | $ | 5.54 |
| | 9.99 |
| | 6.99 |
|
| | | | | 2013 | | 2015 |
| | | High | | Low | | High | | Low |
| First Quarter | | $ | 20.17 |
| | $ | 11.14 |
| | $ | 7.80 |
| | $ | 4.36 |
|
| Second Quarter | | $ | 27.66 |
| | $ | 18.15 |
| | 7.38 |
| | 5.37 |
|
| Third Quarter | | $ | 28.32 |
| | $ | 19.05 |
| | 6.44 |
| | 3.73 |
|
| Fourth Quarter | | $ | 22.62 |
| | $ | 11.88 |
| | 11.25 |
| | 4.91 |
|
As of February 17, 2015,10, 2017, we had approximately 1311 registered shareholders of record. The number of shareholders of record is based upon the actual number of shareholders registered at such date and does not include holders of shares in "street names"“street names” or persons, partnerships, associations, corporations or other entities identified in security position listings maintained by depositories.
We have never declared or paid, and do not anticipate declaring or paying, any cash dividends on our common stock. Additionally, the financing agreement that governs our outstanding long-term debt contains a covenant restricting our ability to make distributions, such as dividends, to stockholders. Any future determination as to the declaration and payment of dividends, if any, will be at the discretion of our board of directors and will depend on then existing conditions, including our financial condition,position, operating results, contractual restrictions, capital requirements, debt covenants, business prospects and other factors our board of directors may deem relevant.
For equity compensation plan information, refer to Item 12 in Part III of this Form 10-K.
Performance Graph
The performance graph shall not be deemed “filed” with the Securities and Exchange Commission for purposes of Section 18 of the Exchange Act, or otherwise subject to the liabilities under that Section, and shall not be deemed to be incorporated by reference into any filing of Angie’s List, Inc. under the Securities Act, except as shall be expressly set forth by specific reference in such filing.
The following graph shows a comparison from November 17,December 31, 2011 (the date our common stock commenced trading on the Nasdaq Global Market) through December 31, 20142016 of cumulative total returns for our common stock, the Nasdaq Composite Index and the RDG Internet Composite Index. Such returns are based on historical results and are not intended to suggest future performance. Data for the Nasdaq Composite Index and the RDG Internet Composite Index assumeassumes reinvestment of dividends.
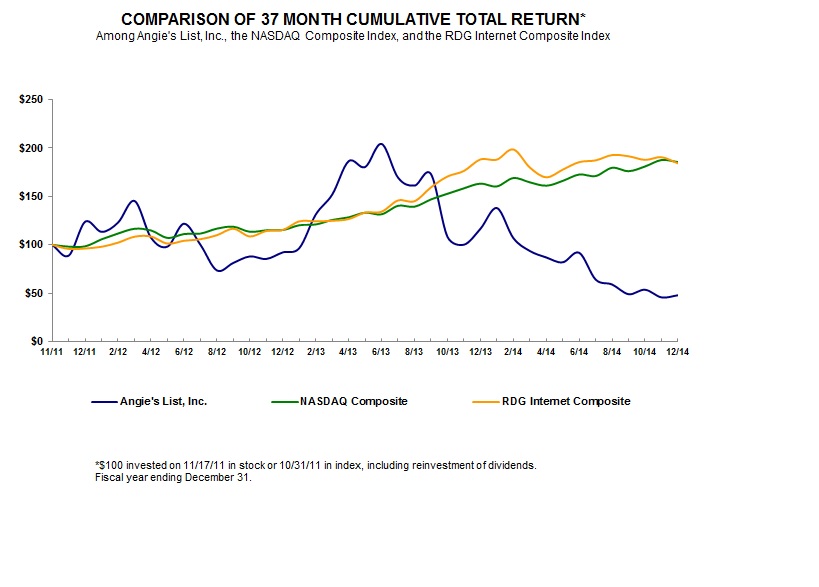
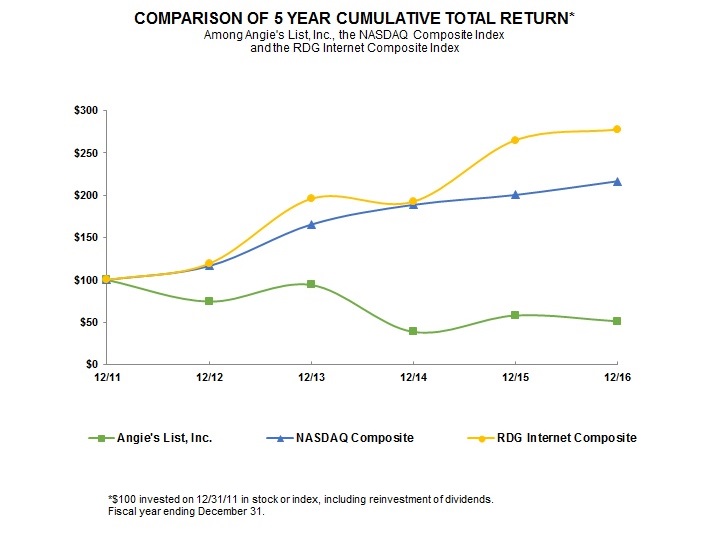
| | | | 11/11 | 12/11 | 12/12 | 3/13 | 6/13 | 9/13 | 12/13 | 3/14 | 6/14 | 9/14 | 12/14 | | 12/11 | | 12/12 | | 12/13 | | 12/14 | | 12/15 | | 12/16 |
| Angie’s List, Inc. | $ | 100.00 |
| $ | 88.88 |
| $ | 123.85 |
| $ | 92.23 |
| $ | 152.00 |
| $ | 204.31 |
| $ | 173.00 |
| $ | 116.54 |
| $ | 93.69 |
| $ | 91.85 |
| $ | 49.00 |
| $ | 47.92 |
| |
Angie’s List, Inc. | | | $ | 100.00 |
| | $ | 74.47 |
| | $ | 94.10 |
| | $ | 38.70 |
| | $ | 58.07 |
| | $ | 51.12 |
|
| NASDAQ Composite | 100.00 |
| 98.17 |
| 98.45 |
| 115.30 |
| 125.73 |
| 131.63 |
| 146.97 |
| 163.26 |
| 164.62 |
| 172.68 |
| 176.15 |
| 185.59 |
| | 100.00 |
| | 116.41 |
| | 165.47 |
| | 188.69 |
| | 200.32 |
| | 216.54 |
|
| RDG Internet Composite | 100.00 |
| 95.80 |
| 96.24 |
| 115.42 |
| 124.82 |
| 134.25 |
| 159.46 |
| 188.27 |
| 179.97 |
| 185.52 |
| 191.60 |
| 184.19 |
| | 100.00 |
| | 119.34 |
| | 195.83 |
| | 192.42 |
| | 264.96 |
| | 277.56 |
|
ITEM 6. SELECTED CONSOLIDATED FINANCIAL AND OTHER DATA
The following selected consolidated financial and other data regarding our business should be read in conjunction with, and areis qualified by reference to, Item 7 of this Form 10-K, as well as our consolidated financial statements and related notes included elsewhere in this report. Our historical results are not necessarily indicative of results to be expected in any future period. We did not issue or pay cash dividends on our common stock for any of the years presented.
|
| | | | | | | | | | | | | | | | | | | | |
| | | Year Ended December 31, |
| | | 2014 | | 2013 | | 2012 | | 2011 | | 2010 |
| | | (in thousands, except share and per share data) |
| Revenue | | |
| Membership | | $ | 73,113 |
| | $ | 65,307 |
| | $ | 47,717 |
| | $ | 33,815 |
| | $ | 25,149 |
|
| Service provider | | 241,898 |
| | 180,335 |
| | 108,082 |
| | 56,228 |
| | 33,890 |
|
| Total revenue | | 315,011 |
| | 245,642 |
| | 155,799 |
| | 90,043 |
| | 59,039 |
|
| Operating expenses | | | | | | | | | | |
Operations and support(1) | | 52,760 |
| | 40,072 |
| | 27,081 |
| | 16,417 |
| | 12,464 |
|
Selling(1) | | 117,176 |
| | 90,143 |
| | 58,596 |
| | 33,815 |
| | 16,892 |
|
| Marketing | | 87,386 |
| | 87,483 |
| | 80,230 |
| | 56,122 |
| | 30,237 |
|
Product and technology(1) | | 34,039 |
| | 27,570 |
| | 16,870 |
| | 9,109 |
| | 6,270 |
|
General and administrative(1) | | 34,012 |
| | 31,455 |
| | 24,055 |
| | 18,740 |
| | 16,302 |
|
| Operating loss | | (10,362 | ) | | (31,081 | ) | | (51,033 | ) | | (44,160 | ) | | (23,126 | ) |
| Interest expense, net | | 1,203 |
| | 1,868 |
| | 1,856 |
| | 3,004 |
| | 3,966 |
|
| Loss on debt extinguishment | | 458 |
| | — |
| | — |
| | 1,830 |
| | — |
|
| Loss before income taxes | | (12,023 | ) | | (32,949 | ) | | (52,889 | ) | | (48,994 | ) | | (27,092 | ) |
| Income tax expense | | 51 |
| | 40 |
| | 5 |
| | 43 |
| | 154 |
|
| Net loss | | $ | (12,074 | ) | | $ | (32,989 | ) | | $ | (52,894 | ) | | $ | (49,037 | ) | | $ | (27,246 | ) |
| Net loss per common share — basic and diluted | | $ | (0.21 | ) | | $ | (0.57 | ) | | $ | (0.92 | ) | | $ | (1.60 | ) | | $ | (0.99 | ) |
| Weighted average number of common shares outstanding — basic and diluted | | 58,510,106 |
| | 58,230,927 |
| | 57,485,589 |
| | 30,655,532 |
| | 27,603,927 |
|
| | | | | | | | | | | |
| (1) Includes non-cash stock-based compensation as follows: |
| Operations and support | | $ | 65 |
| | $ | 64 |
| | $ | — |
| | $ | — |
| | $ | — |
|
| Selling | | 397 |
| | 147 |
| | — |
| | — |
| | — |
|
| Product and technology | | 856 |
| | 136 |
| | 762 |
| | 786 |
| | 496 |
|
| General and administrative | | 6,571 |
| | 3,717 |
| | 2,181 |
| | 3,056 |
| | 6,203 |
|
| | | $ | 7,889 |
| | $ | 4,064 |
| | $ | 2,943 |
| | $ | 3,842 |
| | $ | 6,699 |
|
| | | | | | | | | | | |
|
| | | | | | | | | | | | | | | | | | | | |
| | | Year Ended December 31, |
| | | 2014 | | 2013 | | 2012 | | 2011 | | 2010 |
| Other Data (unaudited): | | | | | | | | | | |
Total paid memberships (end of period)(1) | | 3,041,651 |
| | 2,484,059 |
| | 1,787,394 |
| | 1,074,757 |
| | 602,882 |
|
Gross paid memberships added (in period)(2) | | 1,242,485 |
| | 1,218,258 |
| | 1,092,935 |
| | 716,350 |
| | 355,580 |
|
Marketing cost per paid membership acquisition (in period)(3) | | $ | 70 |
| | $ | 72 |
| | $ | 73 |
| | $ | 78 |
| | $ | 85 |
|
First-year membership renewal rate (in period)(4) | | 73 | % | | 74 | % | | 75 | % | | 75 | % | | 70 | % |
Average membership renewal rate (in period)(4) | | 77 | % | | 78 | % | | 78 | % | | 78 | % | | 75 | % |
Participating service providers (end of period)(5) | | 51,614 |
| | 46,329 |
| | 35,952 |
| | 24,095 |
| | 15,060 |
|
Total service provider contract value (end of period, in thousands)(6) | | $ | 249,045 |
| | $ | 194,137 |
| | $ | 132,646 |
| | $ | 73,609 |
| | $ | 43,050 |
|
| | | | | | | | | | | |
|
| | | | | | | | | | | | | | | | | | | | |
| | | Year Ended December 31, |
| | | 2016 | | 2015 | | 2014 | | 2013 | | 2012 |
| | | | | | | | | | | |
| | | (in thousands, except share and per share data) |
| Revenue | | |
| Membership | | $ | 58,090 |
| | $ | 67,992 |
| | $ | 73,113 |
| | $ | 65,307 |
| | $ | 47,717 |
|
| Service provider | | 265,239 |
| | 276,133 |
| | 241,898 |
| | 180,335 |
| | 108,082 |
|
| Total revenue | | 323,329 |
| | 344,125 |
| | 315,011 |
| | 245,642 |
| | 155,799 |
|
| Operating expenses | | | | | | | | | | |
Operations and support(1) | | 40,293 |
| | 56,074 |
| | 52,760 |
| | 40,072 |
| | 27,081 |
|
Selling(1) (2) | | 111,046 |
| | 116,027 |
| | 115,210 |
| | 87,688 |
| | 57,170 |
|
Marketing(1) (2) | | 65,140 |
| | 83,789 |
| | 96,953 |
| | 96,712 |
| | 88,152 |
|
Product and technology(1) | | 55,990 |
| | 36,661 |
| | 34,039 |
| | 27,570 |
| | 16,870 |
|
General and administrative(1) (2) | | 53,954 |
| | 38,316 |
| | 26,411 |
| | 24,681 |
| | 17,559 |
|
| Operating income (loss) | | (3,094 | ) | | 13,258 |
| | (10,362 | ) | | (31,081 | ) | | (51,033 | ) |
| Interest expense, net | | 4,720 |
| | 2,971 |
| | 1,203 |
| | 1,868 |
| | 1,856 |
|
| Loss on debt extinguishment | | — |
| | — |
| | 458 |
| | — |
| | — |
|
| Income (loss) before income taxes | | (7,814 | ) | | 10,287 |
| | (12,023 | ) | | (32,949 | ) | | (52,889 | ) |
| Income tax expense | | 43 |
| | 44 |
| | 51 |
| | 40 |
| | 5 |
|
| Net income (loss) | | $ | (7,857 | ) | | $ | 10,243 |
| | $ | (12,074 | ) | | $ | (32,989 | ) | | $ | (52,894 | ) |
| | | | | | | | | | | |
Net income (loss) per common share — basic(3) | | $ | (0.13 | ) | | $ | 0.18 |
| | $ | (0.21 | ) | | $ | (0.57 | ) | | $ | (0.92 | ) |
Net income (loss) per common share — diluted(3) | | $ | (0.13 | ) | | $ | 0.17 |
| | $ | (0.21 | ) | | $ | (0.57 | ) | | $ | (0.92 | ) |
| | | | | | | | | | | |
| Weighted-average number of common shares outstanding — basic | | 58,860,152 |
| | 58,520,546 |
| | 58,510,106 |
| | 58,230,927 |
| | 57,485,589 |
|
| Weighted-average number of common shares outstanding — diluted | | 58,860,152 |
| | 58,782,889 |
| | 58,510,106 |
| | 58,230,927 |
| | 57,485,589 |
|
| | | | | | | | | | | |
| |
| (1) | ReflectsIncludes non-cash stock-based compensation expense as follows: |
|
| | | | | | | | | | | | | | | | | | | | |
| Operations and support | | $ | 159 |
| | $ | 109 |
| | $ | 65 |
| | $ | 64 |
| | $ | — |
|
| Selling | | 1,745 |
| | 482 |
| | 393 |
| | 147 |
| | — |
|
| Marketing | | 372 |
| | 230 |
| | 205 |
| | 178 |
| | — |
|
| Product and technology | | 1,949 |
| | 931 |
| | 856 |
| | 136 |
| | 762 |
|
| General and administrative | | 10,519 |
| | 7,123 |
| | 6,370 |
| | 3,539 |
| | 2,181 |
|
| Total non-cash stock-based compensation expense | | $ | 14,744 |
| | $ | 8,875 |
| | $ | 7,889 |
| | $ | 4,064 |
| | $ | 2,943 |
|
| | | | | | | | | | | |
| |
| (2) | Prior year amounts related to marketing compensation and personnel-related costs and general marketing operating expenditures that were formerly recorded as general and administrative expense and selling expense were reclassified to marketing expense for consistency with the current period presentation. These reclassifications did not impact net income (loss) amounts previously reported. |
| |
| (3) | See Note 2, “Net Income (Loss) Per Common Share,” in the accompanying Notes to Consolidated Financial Statements included in Item 8 of this Form 10-K for further discussion of our computation of basic and diluted net income (loss) per common share. |
|
| | | | | | | | | | | | | | | | | | | | |
| | | Year Ended December 31, |
| | | 2016 | | 2015 | | 2014 | | 2013 | | 2012 |
| Other Data (unaudited): | | | | | | | | | | |
Total free memberships (end of period)(1) | | 2,543,705 |
| | — |
| | — |
| | — |
| | — |
|
Total paid memberships (end of period)(1) | | 2,550,941 |
| | 3,297,395 |
| | 3,041,651 |
| | 2,484,059 |
| | 1,787,394 |
|
| Total memberships (end of period) | | 5,094,646 |
| | 3,297,395 |
| | 3,041,651 |
| | 2,484,059 |
| | 1,787,394 |
|
| | | | | | | | | | | |
Gross free memberships added (in period)(2) | | 2,509,146 |
| | — |
| | — |
| | — |
| | — |
|
Gross paid memberships added (in period)(2) | | 348,302 |
| | 1,033,222 |
| | 1,242,485 |
| | 1,218,258 |
| | 1,092,935 |
|
| Gross memberships added (in period) | | 2,857,448 |
| | 1,033,222 |
| | 1,242,485 |
| | 1,218,258 |
| | 1,092,935 |
|
| | | | | | | | | | | |
Average paid membership renewal rate (in period)(3) | | 69 | % | | 77 | % | | 77 | % | | 78 | % | | 78 | % |
| | | | | | | | | | | |
Participating service providers (end of period)(4) | | 55,644 |
| | 54,402 |
| | 54,240 |
| | 46,329 |
| | 35,952 |
|
Total service provider contract value (end of period, in thousands)(5) | | $ | 250,588 |
| | $ | 270,841 |
| | $ | 249,045 |
| | $ | 194,137 |
| | $ | 132,646 |
|
Total service provider contract value backlog (end of period, in thousands)(6) | | $ | 147,335 |
| | $ | 162,478 |
| | $ | 153,137 |
| | $ | 121,370 |
| | $ | 82,145 |
|
| | | | | | | | | | | |
| |
| (1) | Total free memberships reflects the number of free members as of the end of the period who joined subsequent to us dropping our ratings and reviews paywall in June 2016, as well as the number of former paid members who requested a change in membership status from paid to free over the same time period. Total paid memberships represents the number of paid membershipsmembers at the end of each reporting period presented. Total paid memberships as of December 31, 2015, 2014, 2013 and 2012 also includesincluded a de minimis number of complimentary memberships in what formerly comprised our paid markets for all periods presented. The numbermarkets. These complimentary memberships are no longer included in our paid membership counts and are therefore not reflected in the paid membership totals presented in the table above as of memberships lost during the periods presented was 684,948, 521,593, 380,298, 244,475 and 164,425 for 2014, 2013, 2012, 2011 and 2010, respectively.December 31, 2016. |
| |
| (2) | ReflectsGross free memberships added represents the total number of new free members added during the reporting period. For the year ended December 31, 2016, this figure includes new free members added since we dropped our ratings and reviews paywall in June 2016 but does not include former paid members who requested a change in membership status from paid to free over the same time period. Gross paid memberships added reflects the total number of new paid membershipsmembers added in eachthe reporting period presented.period. |
| |
| (3) | Reflects marketing expense divided by gross paid memberships added in each reporting period presented. |
| |
(4) | First-year membership renewal rate reflects the percentage of paid memberships expiring in the reporting period after the first year of membership that are renewed, while average membership renewal rate reflects the percentage of all paid memberships expiring in the reporting period that are renewed. Renewal rates exclude monthly memberships.renewed as paid members. |
| |
(5)(4) | Reflects the total number of service providers under contract for advertising, e-commerce or both at the end of the period. |
| |
(6)(5) | Reflects the total contract value of active service provider contracts at the end of the period. Contract value is the service provider's total payment obligation of a service provider to us, including amounts already recognized in revenue, to us over the stated term of the contract. |
| |
| (6) | Reflects the portion of service provider contract value at the end of the period that is not yet recognized as revenue. |
|
| | | | | | | | | | | | | | | | | | | | |
| | | As of December 31, |
| | | 2014 | | 2013 | | 2012 | | 2011 | | 2010 |
| | | (in thousands) |
| Balance Sheet Data: | | |
| Cash and cash equivalents | | $ | 39,991 |
| | $ | 34,803 |
| | $ | 42,638 |
| | $ | 88,607 |
| | $ | 9,209 |
|
| Short-term investments | | 24,268 |
| | 21,055 |
| | 10,460 |
| | — |
| | — |
|
| Working capital | | (13,325 | ) | | (21,672 | ) | | 9,411 |
| | 58,085 |
| | (18,378 | ) |
| Total assets | | 154,538 |
| | 105,643 |
| | 96,229 |
| | 111,398 |
| | 22,601 |
|
| Total deferred revenue | | 87,579 |
| | 80,438 |
| | 55,331 |
| | 34,786 |
| | 23,261 |
|
| Long-term debt, net | | 58,854 |
| | 14,918 |
| | 14,869 |
| | 14,820 |
| | 16,463 |
|
| Common stock and additional paid-in capital | | 265,962 |
| | 257,572 |
| | 248,392 |
| | 236,015 |
| | 85,486 |
|
| Stockholders' equity (deficit) | | (22,174 | ) | | (18,490 | ) | | 5,319 |
| | 45,836 |
| | (33,757 | ) |
|
| | | | | | | | | | | | | | | | | | | | |
| | | As of December 31, |
| | | 2016 | | 2015 | | 2014 | | 2013 | | 2012 |
| | | | | | | | | | | |
| | | (in thousands) |
| Balance Sheet Data: | | |
Cash and cash equivalents(1) | | $ | 22,402 |
| | $ | 32,599 |
| | $ | 39,991 |
| | $ | 34,803 |
| | $ | 42,638 |
|
Short-term investments(2) | | 16,541 |
| | 23,976 |
| | 24,268 |
| | 21,055 |
| | 10,460 |
|
| Working capital | | (20,703 | ) | | (21,324 | ) | | (13,325 | ) | | (21,672 | ) | | 9,411 |
|
Total assets(3) | | 157,394 |
| | 173,411 |
| | 152,684 |
| | 105,246 |
| | 95,595 |
|
Total deferred revenue(4) | | 67,993 |
| | 86,014 |
| | 87,579 |
| | 80,438 |
| | 55,331 |
|
Total debt, net(5) | | 57,642 |
| | 57,634 |
| | 57,000 |
| | 14,521 |
| | 14,235 |
|
| Common stock and additional paid-in capital | | 290,250 |
| | 275,512 |
| | 265,962 |
| | 257,572 |
| | 248,392 |
|
| Stockholders' equity (deficit) | | 4,500 |
| | (2,381 | ) | | (22,174 | ) | | (18,490 | ) | | 5,319 |
|
| | | | | | | | | | | |
| |
| (1) | The decline in our cash and cash equivalents as of December 31, 2016 as compared to December 31, 2015 was primarily attributable to uses of cash in investing activities during the year for capital expenditures on our new technology platform as well as the impact of downward pressures on revenue associated with the migration to our new technology platform and the removal of our ratings and reviews paywall, the latter of which is yielding declines in our paid membership base. |
| |
| (2) | The decrease in short-term investments as of December 31, 2016 as compared to December 31, 2015 was due to our decision not to reinvest certain of these investments upon maturity during the year, instead electing to utilize such funds to support operations and make strategic investments in other areas of the business. |
| |
| (3) | The decline in total assets as of December 31, 2016 as compared to December 31, 2015 was largely the result of the aforementioned decreases in cash and cash equivalents and short-term investments, partially offset by a year over year increase in the balance of property, equipment and software, net, due to capital expenditures associated with our new technology platform. The year over year increases in total assets in 2015 and 2014 were attributable to capital expenditures for our new technology platform. The total asset amounts reflected in the table above for the years ended December 31, 2015, 2014, 2013 and 2012 do not agree to the presentation in previous years as a result of our adoption of Accounting Standards Update No. 2015-03 as of January 1, 2016, as further discussed in Note 1, “Description of Business, Basis of Presentation and Summary of Significant Accounting Policies,” in the accompanying Notes to Consolidated Financial Statements included in Item 8 of this Form 10-K. |
| |
| (4) | The decrease in total deferred revenue as of December 31, 2016 as compared to December 31, 2015 was due to the aforementioned downward pressures on both our membership and service provider revenue streams associated with the migration to our new technology platform and the removal of our ratings and reviews paywall during the year. |
30
| |
| (5) | The increase in total debt, net, as of December 31, 2014 as compared to December 31, 2013 was the result of the debt refinancing transaction completed in September of 2014. The total debt, net, amounts reflected in the table above for the years ended December 31, 2015, 2014, 2013 and 2012 do not agree to the presentation in previous years as a result of our adoption of Accounting Standards Update No. 2015-03 as of January 1, 2016, as further discussed in Note 1, “Description of Business, Basis of Presentation and Summary of Significant Accounting Policies,” in the accompanying Notes to Consolidated Financial Statements included in Item 8 of this Form 10-K. |
ITEM 7. MANAGEMENT’S DISCUSSION AND ANALYSIS OF FINANCIAL CONDITION AND RESULTS OF OPERATIONS
You should read the following discussion and analysis of our financial condition and results of operations in conjunction with our consolidated financial statements and the notes thereto included elsewhere in this Annual Report on Form 10-K. The following discussion contains forward-looking statements that reflect our plans, estimates and beliefs. Although the Company believes that the assumptions on which the forward-looking statements contained herein are based are reasonable, any of those assumptions could prove to be inaccurate. As a result, the forward-looking statements based upon those assumptions also could be incorrect. Risks and uncertainties may affect the accuracy of forward-looking statements, including, without limitation, those set forth in Item 1A of this Annual Report on Form 10-K and in other reports we file with the SEC.
Overview
We operate a national local services consumer review service and marketplace where consumersmembers can research, shop for and purchase local services for critical needs, such as home, health and automotive services, as well as rate and review the providers of these services across 253 markets in the United States. Our ratings and reviews, which are now available only to our members free-of-charge, assist our members in identifying and hiring the besta provider for their local service needs. We concludedneeds, and our dynamic tools and products provide members with multiple ways to get work done while reducing the time and effort required to hire a service provider.
In March 2016, we unveiled a new long-term profitable growth plan featuring a redefined product and service experience for members and service providers alike, transforming our legacy business model by introducing a free membership tier to provide access to our ratings and reviews at no charge. In addition to free memberships, our new model provides consumers with revamped tiered membership options offering an array of premium services at varying price points. Service providers are also able to take advantage of a host of new services and tools under our new model based on the nature and extent of the service provider’s relationship with us. Our profitable growth plan entails three phases to be implemented over several years:
Strengthen and Reposition the Core Business - includes redefining the paywall and launching premium member services, improving our consumer experience by scaling our new platform and optimizing the service provider sales organization to better monetize consumer traffic;
Leverage the Home Services Platform - includes expanding value-added services provided on our platforms and improving our member and service provider relationships with personalized offerings; and
Expand to Adjacencies - includes expanding our member and service provider bases and developing partnerships to provide additional value-added services.
Our new model is designed to identify and leverage more ways to attract, engage and ultimately monetize consumer and service provider traffic on our platforms. As we continue to execute our long-term profitable growth plan, we are leveraging a monetization strategy comprised of three waves. The first wave of the strategy entails acquiring new members and improving membership engagement, and the second wave is focused on converting our growing membership base into service provider originations. The third wave, which is still several months away, targets increasing service provider renewal rates and the contract value of such renewals.
During 2016, we achieved or made progress against several key milestones integral to the execution of our long-term profitable growth plan, including, among other things, (1) completing the migration to our new technology platform, (2) dropping our ratings and reviews paywall, (3) launching a new tiered membership model, (4) implementing new service provider monetization initiatives, including revamped presentation, certification badging and search logic, to differentiate between advertisers and non-advertisers and (5) optimizing marketing and operations. Our progress against our new model during the year yielded robust membership growth and a year over year increase in the number of participating service providers.
For the year ended December 31, 20142016, we incurred a net loss of $7.9 million on revenue of $323.3 million. While our progress with more than three million paid memberships.
We generate revenue from both our membersrespect to the implementation and our service providers. Our primary source of membership revenue is subscription fees, which are typically charged in advance and are recognized ratably over the subscription period. At December 31, 2014, approximately 96%execution of our total membership base purchased annual or multi-year memberships. These subscription fees represent a significant source of working capital and provide a relatively predictable revenue stream. During 2014,long-term profitable growth plan did not manifest in our financial results for the year, once fully implemented, we introduced a new tiered pricing membership model on a national basis, offering three different membership plans with varying levels of service and benefits at tiered price points.
We derive service provider revenue principally from term-based sales of advertising to service providers. We enable service providers who are rated highly bybelieve our members to advertise discounts and other promotions to our members. Our members grade service providers on an “A” to “F” scale, and we invite service providers with an average grade of “B” or better and at least two reviews submitted in the last three years to advertise to our members through any or all of our platforms. As of December 31, 2014, approximately 475,000 service providers rated by our members were eligible to offer discounts and other promotions to our members based on these criteria. Service provider contracts can be prepaid or invoiced monthly at the option of the service provider and carry an early termination penalty. We recognize service provider revenue ratably over the period in which an advertising campaign is run. Our high service provider renewal rates, both in number of service providers renewing and as a percentage of initial contract value renewed, provide us with an additional relatively predictable revenue stream.
In addition to traditional advertising on our platforms, our e-commerce marketplace solutions offer consumers the opportunity to purchase services through us from highly-rated service providers. These e-commerce offerings are available through both email promotions and postings on our website and mobile application and are an important aspect of our business. When a consumer completes an e-commerce purchase from our marketplace, the transaction is processed through Angie’s List. The purchaser can then indicate scheduling preferences automatically using our tools or work directly with the service provider to schedule the service. E-commerce offerings provide our consumers with an easier and more convenient way to fulfill their service needs and may offer a discount as well. We have increased our focus on our e-commerce marketplace as a way to furthergrowth plan will enhance the value of our services for both consumers and service providers.
Attracting new paid membersgenerate accelerated growth, retention and strengtheningengagement across our platforms, which we, in turn, believe will drive increased market reachpenetration and revenue growth. Looking ahead to 2017, we are among ourfocused on three key growth strategies. Increased penetration in a market results in more reviews of service providers, which enhancespriorities: 1) building products to increase member engagement, 2) strengthening the value ofproposition to our service to consumers and drives further growth in that market. Increased penetration in a market also generates growth in advertising sales to service providers and supports higher advertising rates as3) continuing to improve our cost structure.
In connection with the pool of consumers actively seeking to hire service providers grows. However, our ability to increase advertising rates tends to lag increased penetrationimplementation of our markets duelong-term profitable growth plan, we are taking actions to improve margins and better align our inability to increase rates under existing service provider contracts prior to renewal. Our primary strategy for new member acquisition is national offlinecost structure with our growth plan, and online advertising, including an increasing emphasis on digital marketing platforms. Our marketing expense is generally higher in the second or third quarters of the year asdoing so, we increasereduced our investment in advertising to attract consumersheadcount during the periods whenfourth quarter of 2016. Additionally, with a focus on opportunities to further accelerate our growth, during the fourth quarter of 2016 we have found they are most actively seekingannounced our services.intent to begin exploring strategic alternatives.
As described further in the “Market Cohort Analysis” herein, we believe that our estimated penetration rate and average revenue per market will increase as markets mature, and over the long-term, we believe that these increased revenues will offset our operating expenses and declines in membership pricing. Given that our marketing contracts are typically short-term, we can rapidly adjust marketing expense and thus decrease total operating expenses to reduce cash used in operations or
generate cash and profits from operations should we begin to experience adverse trends in marketing cost per paid membership acquisition or wish to optimize for profitability at the expense of rapid growth. We believe that our high membership renewal rates and “word of mouth” referrals from existing members, combined with effective purchasing of lower volumes of advertising and increased utilization of SEO should enable us to maintain and potentially grow the size of our paid membership base should we decide to reduce our overall level of advertising spending at any point in time.
As we continue the process of transitioning our business to a marketplace model wherein we act as an intermediary in local services transactions between consumers and service providers, our approach to generating revenue from e-commerce has evolved such that e-commerce is now becoming a core component of the holistic value proposition we offer to service providers and an increasingly important aspect of our service provider pricing and monetization strategies. Accordingly, we are making substantial investments in the development of our marketplace platforms and initiatives in an effort to provide greater value to consumers, improve consumer engagement, drive higher dollar service provider renewals, increase the number of service providers who sell e-commerce and enhance service provider retention. Our completely redesigned mobile application gives consumers three easy ways to get work done: (1) search for providers, (2) shop for specific home improvement services and (3) SnapFix a project, which is our revolutionary new feature that eliminates the hassle of hiring a professional.
Market Cohort Analysis
To assist with the evaluation of our performance, we compile certain financial and operating data for our markets, grouped by the years in which the markets transitioned to paid membership status. The table below summarizes this data for 2014 by each respective cohort. The pre-2003 cohort includes our ten most established markets where we initially built out our business model. The markets in this cohort include several mid-sized urban markets in the Midwest as well as Chicago and Boston. The 2003-2007 cohort is comprised of the first major subset of markets, including many of our largest potential markets, that we targeted in our national expansion strategy. The 2008-2010 and post-2010 cohorts primarily consist of smaller markets that we entered to fill out our national presence.
|
| | | | | | | | | | | | | | | | | | | | | | | | | | | | |
| Cohort | | # of
Markets | | Average
Revenue/
Market (1) | | Membership
Revenue/Paid
Membership (2) | | Service
Provider
Revenue/Paid
Membership (3) | | Average
Marketing
Expense/
Market (4) | | Total Paid
Memberships (5) | | Estimated
Penetration
Rate (6) | | Annual
Membership
Growth
Rate (7) |
| Pre-2003 | | 10 |
| | $ | 7,485,052 |
| | $ | 32.81 |
| | $ | 110.14 |
| | $ | 1,327,562 |
| | 576,980 |
| | 15.6 | % | | 23 | % |
| 2003-2007 | | 35 |
| | 5,653,860 |
| | 29.41 |
| | 102.16 |
| | 1,388,742 |
| | 1,657,882 |
| | 12.3 | % | | 23 | % |
| 2008-2010 | | 103 |
| | 363,118 |
| | 16.47 |
| | 43.09 |
| | 191,065 |
| | 681,796 |
| | 12.5 | % | | 19 | % |
| Post 2010 | | 105 |
| | 44,578 |
| | 12.70 |
| | 30.91 |
| | 55,472 |
| | 124,993 |
| | 7.7 | % | | 39 | % |
| Total | | 253 |
| | | | | | | | | | 3,041,651 |
| | | | |
| |
(1) | Average revenue per market is calculated by dividing the revenue recognized for the markets in a given cohort by the number of markets in the cohort at period end. |
| |
(2) | Membership revenue per paid membership is calculated as membership revenue in the cohort divided by the average number of paid memberships in the cohort. We calculate this average per market to facilitate comparisons among cohorts, but it is not intended to represent typical characteristics of actual markets within the cohort. |
| |
(3) | Service provider revenue per paid membership is calculated as service provider revenue in the cohort divided by the average number of paid memberships in the cohort. We calculate this average per market to facilitate comparisons among cohorts, but it is not intended to represent typical characteristics of actual markets within the cohort. |
| |
(4) | Average marketing expense per market is calculated by first allocating marketing expense to each cohort based on the percentage of our total target demographic for all markets in each cohort, as determined by third-party data, and then dividing the allocated cohort marketing expense by the number of markets in the cohort at period end. We calculate this average per market to facilitate comparisons among cohorts, but it is not intended to represent typical characteristics of actual markets within the cohort. According to a December 2014 demographic study by Merkle Inc. that we commissioned, there were approximately 27 million households in the United States in our target demographic, which consists of homeowners aged 35 to 64 with an annual household income of at least $75,000. Approximately 24 million of these households were in our markets. The average number of households per market in our target demographic was 370,000, 390,000, 50,000 and 20,000 for the pre-2003, 2003-2007, 2008-2010 and post-2010 cohorts, respectively. |
| |
(5) | Total paid memberships in each cohort as of December 31, 2014 includes a de minimis number of complimentary memberships in our paid markets for the period presented. |
| |
(6) | Estimated penetration rate is calculated by dividing the number of paid memberships in a given cohort as of December 31, 2014 by the number of households meeting our target demographic criteria in that cohort. |
| |
(7) | Annual membership growth rate represents the rate of increase in the total number of paid memberships in the cohort between December 31, 2014 and 2013. |
Our average revenue per market and total revenue per paid membership have generally grown with the maturity and corresponding increased penetration of our markets. In the future, we expect total revenue per paid membership to fluctuate from period to period, reflecting the timing of our ability to adjust advertising rates given our advertising contract terms and the impacts associated with our membership pricing and monetization strategies and our e-commerce marketplace initiatives. For example:
Our average advertising contract term typically approximates one year, and we are only able to increase rates for a given participating service provider upon contract renewal. As such, there is a lag in our ability to leverage increased penetration in a market into increased advertising rates;
Increasingly, we are seeing members opt for annual memberships, and as such, the percentage of our membership base on monthly memberships is declining. While we believe annual memberships are more beneficial to members and promote high renewal rates, these memberships generate reduced proceeds as compared to monthly memberships on an annualized basis;
On average across all markets, we are utilizing lower membership pricing as part of our new tiered pricing membership structure for varying levels of service and benefits that was introduced on a national basis during the current year with the goal of driving deeper penetration via enhanced membership growth and retention and generating increased service provider participation; and
As we continue the process of transitioning our business to a marketplace model, our approach to generating revenue from e-commerce is evolving such that e-commerce is now becoming a core component of the holistic value proposition we offer to service providers and an increasingly important aspect of our service provider pricing and monetization strategies.
One of our most important growth strategies remains expanding our membership base, which creates the network effects of a more valuable service for consumers and a more attractive commercial platform for service providers. We intend to continue to evaluate and adopt innovative pricing and packaging strategies, such as tiered membership offerings, in an effort to deliver compelling value to our members and thereby support membership growth and retention. Although the dynamics associated with the introduction of new monetization strategies have caused and may continue to cause membership revenue per paid membership to decline sequentially in some of our cohorts, we believe that the increase in our membership base is critical for producing overall growth in average revenue per market, service provider revenue per paid membership and total revenue per paid membership across all cohorts.
As a market matures, our penetration rate typically increases. Historically, while the absolute number of paid members may grow faster in larger markets, our small and medium size markets often achieve greater penetration over a shorter period of time than our larger markets. We believe that a principal reason for our lower penetration rates in large markets is the manner in which we market Angie’s List to our target demographic in such markets. We spend the majority of our marketing dollars on national advertising, including an increasing emphasis on digital marketing platforms, and we believe that this marketing strategy provides us the most cost effective and efficient manner of acquiring new paid memberships. However, advertising nationally means we deliver the same volume of advertising regardless of the size of the market. Since each market differs in terms of the number of advertising outlets available, the impact of our spending on national advertising varies across markets. In our experience, smaller markets typically provide fewer advertising outlets than larger markets. Therefore, we believe the same volume of advertising in a smaller market is more effective in building brand awareness and generating new memberships than in larger markets. We expect to continue to see lower relative penetration rates in our larger markets for these reasons. As several of these larger markets are in the 2003-2007 cohort, over time our penetration rate in this cohort may lag other cohorts.
Key Operating Metrics
In addition to the line items in our consolidated financial statements, we regularly review a number of other operating metrics related to our membership and service provider bases to evaluate our business, determine the allocation of resources and make decisions regarding business strategies. We believe these metrics are useful for investors and analysts to understand the underlying trends in our business. However, as our business evolves, the metrics we currently identify as critical to the evaluation of our operations and performance may change.
The following table summarizes our key operating metrics, which are unaudited, for the years ended December 31, 2014, 20132016, 2015 and 2012:2014:
| | | | | Years Ended December 31, | | Year Ended December 31, |
| | | 2014 | | 2013 | | 2012 | | 2016 | | 2015 | | 2014 |
| Total free memberships (end of period) | | | 2,543,705 |
| | — |
| | — |
|
| Total paid memberships (end of period) | | 3,041,651 |
| | 2,484,059 |
| | 1,787,394 |
| | 2,550,941 |
| | 3,297,395 |
| | 3,041,651 |
|
| Total memberships (end of period) | | | 5,094,646 |
| | 3,297,395 |
| | 3,041,651 |
|
| | | | | | | | |
| Gross free memberships added (in period) | | | 2,509,146 |
| | — |
| | — |
|
| Gross paid memberships added (in period) | | 1,242,485 |
| | 1,218,258 |
| | 1,092,935 |
| | 348,302 |
| | 1,033,222 |
| | 1,242,485 |
|
| Marketing cost per paid membership acquisition (in period) | | $ | 70 |
| | $ | 72 |
| | $ | 73 |
| |
| First-year membership renewal rate (in period) | | 73 | % | | 74 | % | | 75 | % | |
| Average membership renewal rate (in period) | | 77 | % | | 78 | % | | 78 | % | |
| Gross memberships added (in period) | | | 2,857,448 |
| | 1,033,222 |
| | 1,242,485 |
|
| | | | | | | | |
| Average paid membership renewal rate (in period) | | | 69 | % | | 77 | % | | 77 | % |
| | | | | | | | |
| Participating service providers (end of period) | | 51,614 |
| | 46,329 |
| | 35,952 |
| | 55,644 |
| | 54,402 |
| | 54,240 |
|
| Total service provider contract value (end of period, in thousands) | | $ | 249,045 |
| | $ | 194,137 |
| | $ | 132,646 |
| | $ | 250,588 |
| | $ | 270,841 |
| | $ | 249,045 |
|
| Total service provider contract value backlog (end of period, in thousands) | | | $ | 147,335 |
| | $ | 162,478 |
| | $ | 153,137 |
|
Total paid memberships. Total paidfree memberships reflects the number of free members as of the end of the period who joined subsequent to us dropping our ratings and reviews paywall in June 2016, as well as the number of former paid members who requested a change in membership status from paid to free over the same time period. Total paid memberships represents the number of paid members at the end of each period presented. Total paid memberships as of December 31, 2015 and December 31, 2014 also includesincluded a de minimis number of complimentary memberships in what formerly comprised our paid markets for all periods presented.markets. These complimentary memberships are no longer included in our paid membership counts and are therefore not reflected in the paid membership totals presented in the table above as of December 31, 2016. We generally expect that there will be one membership per household and, as such, each membership may actually represent multiple individual consumers.
Gross paid memberships added. Gross free memberships added represents the total number of new free members added during the reporting period. For the year ended December 31, 2016, this figure includes new free members added since we dropped our ratings and reviews paywall in June 2016 but does not include former paid members who requested a change in membership status from paid to free over the same period. Gross paid memberships added which tends to fluctuate based on our level of investment in national advertising, reflects the total number of new paid membershipsmembers added in athe reporting period and is an important performance indicator as increasing paid memberships is a key growth strategy.
Marketing cost per paid membership acquisition. We calculate marketing cost per paid membership acquisition in a reporting period as marketing expense divided by gross paid memberships added in that period. As we advertise in national media, a portion of our marketing expenditures also increase the number of unpaid memberships. On a comparative basis, marketing cost per paid membership acquisition can reflect our success in generating new paid memberships through our SEO efforts, “word of mouth” referrals and experimentation and adjustments to our marketing expense to focus on more effective advertising outlets for membership acquisition. We typically incur higher marketing expense in the second or third quarters of the year in order to attract consumers during the periods when we have found they are most actively seeking our services. We generally reduce our marketing expense in the fourth quarter due to decreased consumer activity in the service sector and higher advertising rates associated with holiday promotional activity.
Membership renewal rates. First-yearAverage paid membership renewal rate reflects the percentage of. Average paid memberships expiring in the reporting period after the first year of membership that are renewed. Average membership renewal rate reflects the percentage of all paid memberships expiring in the reporting period that are renewed. Renewal rates do not include monthly memberships, which comprised approximately 4% of our total membership baserenewed as of December 31, 2014. Given the correlation between increased penetration and higher total revenue per paid membership, we view first-year membership renewal rate and average membership renewal rate as key indicators of expected operating results in future periods.members.
Participating service providers. We include in participating service providers the total number of service providers under contract for advertising, e-commerce or both at the end of the period.
Total service provider contract value. We calculate service provider contract value as the total contract value of active service provider contracts at the end of the period. Contract value is the total payment obligation of a service provider to us, including amounts already recognized in revenue, over the stated term of the contract.
In addition, we also trackTotal service provider contract value backlog as a key metric. Contract. Service provider contract value backlog consists of the portion of service provider contract value at the stated date whichend of the period that is not yet recognized as revenue. At December 31, 2014 and 2013, our contract value backlog was $153.1 million and $121.4 million, respectively.
Basis of Presentation and Recent Trends
The accompanying consolidated financial statements were prepared in conformity with accounting principles generally accepted in the United States (“U.S. GAAP”). The consolidated financial statements include the accounts of Angie’s List, Inc. and our wholly owned subsidiaries and reflect all adjustments of a normal recurring nature considered, in the opinion of management, necessary to fairly report the results for the periods presented. All significant intercompany balances and transactions were eliminated in consolidation. Except as otherwise noted, the following discussion reflects the primary components of our current revenue and operating expenses, which are subject to change as our business evolves.
Revenue
Membership revenue. Our primary source of membership revenue is subscription fees. Our members sign up for monthly, annual or multi-year memberships to our service. Wefees from paid members. Historically, we charge, and our members prepay, as applicable, the full price of membership at the commencement of the corresponding subscription period and at each renewal date, (whether monthly, annual or multi-year), unless the member chooses not to renew the membership before the renewal date. We record prepaid membership fees as deferred revenue and generally recognize the fees as revenue ratably over the term of the associated subscription.subscription, which is typically twelve months in length.
In 2014,During 2016, we terminatedremoved our ratings and reviews paywall and introduced a free membership tier in all markets for the first time. While we continue to offer paid membership tiers with premium services, our paid membership base is declining as new members are primarily joining via our free membership offering, and existing paid members are not renewing as paid members at rates consistent with our historical practice of charging one-time, nonrefundable enrollment fees in connection with monthly memberships and the lowest cost annual memberships in less penetrated markets. For those one-time, nonrefundable enrollment fees charged prior to termination, we are recognizing revenue over an estimated averageaverages, thereby negatively impacting our membership life of 80 months for annual or multi-year members and 13 months for monthly members, which is based on our historical membership experience.revenue.
Membership revenue accounted for 23%18%, 27%20% and 31%23% of total revenue for 2014, 20132016, 2015 and 2012,2014, respectively, and we expect membership revenue as a percentage of total revenue to continue to decrease in 2015. We are also expecting membership revenue to decline in absolute dollars in 2015 as a result of the impact associated with our introduction of tiered pricing membership plans on a national basis during the year, which reduced new membership fees, on average, across all markets and is puttingfuture periods due to downward pressure on membership revenue associated with the evolution of our membership revenuetier offerings and pricing, and in particular, the introduction of a free membership revenue per paid member.tier for consumers.
Service provider revenue. Our primary sources of service provider revenue are term-based sales of advertising to service providers and our e-commerce fees.marketplace. Service providers generally pay for advertisements, which carry an early termination penalty, in advance on a monthly or annual basis.basis at the option of the service provider. Our average advertising contract term in effect as of December 31, 20142016 was approximately one year, and the vast majority of our service provider contracts cover a period of twelve months, providing us with a relatively predictable revenue stream as well as an opportunity to adjust advertising rates at the renewal period as we introduce new products and services or our penetration of a given market increases.
We recognize revenue from the sale of website, mobile and call center advertising ratably over the time period in which the advertisements run. Revenue from the sale of advertising in the Angie’s List Magazine publication is recognized in the monthperiod in which the publication, and therefore the advertisement, is published and distributed. Typically, we are able to charge higher rates for advertising as service providers are able to reach a larger base of potential customers. However, as we generally only adjust advertising rates at the time of contract renewal, growth in service provider revenue commonly trails increases in membership. Accordingly, as we continue to transition our business model, and our membership continues to grow, the anticipated corresponding increases in service provider revenue may not be immediate, or occur at all.
Our e-commerce marketplace enables consumers to purchase services from highly-rated service providers on our platforms. When a consumer completes an e-commerce purchase, the transaction is processed by us, and we receive a portion of the price paid as revenue, which is recognized on a net basis in the period the e-commerce voucher is delivered to the purchaser. While we are not the merchant of record with respect to these transactions, we do offer consumers refunds in certain circumstances. Accordingly, revenue from e-commerce transactions is recorded net of a reserve for estimated refunds. Our e-commerce revenue generally fluctuates from period to period as offerings and monetization strategies evolve and due to seasonality.
Service provider revenue accounted for 82%, 80% and 77% of total revenue for 2016, 2015 and 2014, respectively, and we expect service provider revenue as a percentage of total revenue to continue to increase in future periods as we evolve and enhance the value proposition we offer service providers and leverage new service provider monetization strategies in connection with the removal of our ratings and reviews paywall, notwithstanding any remaining negative impacts related to the migration to our new technology platform.
Operating expenses
Operations and support. Operations and support expense consists primarily of compensation and personnel-related costs for personnel we employ to operate our call center and provide support to our members and service providers, expenditures associated with publishing the Angie’s List Magazine and credit card processing fees for service provider transactions, membership enrollments and e-commerce purchases. Costs incurred with marketing research firms to enable our members to submit reviews by telephone to enrich the content available to our members and expand the number of service providers eligible to advertise and offer e-commerce are also included in operations and support expense. Operations and support expense does not include costs associated with maintaining our website, which are included in product and technology expense. Operations and support expense as a percentage of revenue was 13%, 16% and 17% for 2016, 2015 and 2014, respectively. During 2016, we implemented a digital content distribution strategy wherein we increased digital delivery, and reduced print copy distribution, of the Angie’s List Magazine, and we also reduced operations and support headcount and experienced a decrease in credit card processing fees, all of which contributed to a year over year decline in operations and support expense.
Selling. Selling expense consists primarily of commissions, wages and other employee benefits for the personnel we employ to sell and renew advertising contracts to eligible service providers and to generate offers in our e-commerce marketplace. Contracts with first-time participating service providers generally yield larger commissions for our sales personnel than do contract renewals. Our sales personnel responsible for e-commerce offers and purchases typically earn commissions based on the net revenue received from the sale of such offerings. Selling expense also includes expenditures for sales training and personnel-related costs for account management. Selling expense as a percentage of revenue was 34%, 34% and 37% for 2016, 2015 and 2014, respectively. During 2016, we revised certain sales compensation plans, restructured our sales organization, including a reduction in our sales headcount as compared to the prior year, and experienced a decrease in service provider contract value bookings, thereby contributing to a year over year decline in selling expense.
Marketing. Marketing expense consists primarily of national television, radio, print and online digital advertising and now also includes the marketing compensation and personnel-related costs and general marketing operating expenditures that were formerly classified as general and administrative expenses. While we continue to make investments in increasing our membership base and expanding our market reach, we also utilize advertising to engage our members by highlighting our e-commerce offerings and new products and services. Accordingly, our marketing expense is not only a reflection of the cost incurred to attract new members but also the marketing dollars we are spending to generate traffic to and engagement on our platforms. Our marketing contracts are typically short-term in length, and we therefore possess the ability to adjust marketing expense in order to reduce total operating expenses and maximize cash from operations should we begin to experience adverse trends in returns on our marketing expenditures or wish to optimize our profitability through focused reductions in advertising spend during any given period. Consistent with the seasonality that characterizes our business, we generally expect marketing expense to peak in either the second or third quarter of the year. Marketing expense as a percentage of revenue was 20%, 24% and 31% for 2016, 2015 and 2014, respectively. Although we continue to make investments in marketing to acquire new memberships and drive engagement on our platforms, we reduced our marketing expense in 2016 in order to make strategic investments in other areas of the business.
Product and technology. Product and technology expense consists primarily of compensation and personnel-related costs, depreciation and amortization expense and expenditures for outsourced services related to the maintenance and support of our product and technology platforms and infrastructure, including our website. Product and technology expense as a percentage of revenue was 17%, 11% and 11% for 2016, 2015 and 2014, respectively. During 2016, we increased our product and technology headcount to execute on our technology platform migration and product roadmap, and we also experienced an increase in depreciation and amortization expense in connection with our new technology platform. As utilization of the platform commenced in 2016, certain expenditures, including internal labor, that do not represent qualifying upgrades, enhancements or new functionality are no longer classified as capitalized website and software development costs and are instead expensed as incurred.
General and administrative. General and administrative expense, which no longer includes the marketing compensation and personnel-related costs and general marketing operating expenditures that are now classified as marketing expense, consists primarily of compensation and personnel-related costs for executive, legal, finance and human resources personnel as well as expenditures for outsourced services, professional fees, insurance premiums, facilities maintenance, depreciation of buildings and improvements and other miscellaneous corporate expenses, such as bad debt expense. General and administrative expense as a percentage of revenue was 17%, 11% and 7% for 2016, 2015 and 2014, respectively. These increases were driven, in part, by costs incurred for the development and execution of our long-term profitable growth plan, optimization of our service provider go-to-market activities and activist activity in our stock, as well as stock-based compensation expense.
Results of Operations
The following tables set forth our results of operations for the periods presented in absolute dollars and as a percentage of our revenue for those periods. The financial results below are not necessarily indicative of future results.
|
| | | | | | | | | | | | |
| | | Year Ended December 31, |
| | | 2016 | | 2015 | | 2014 |
| | | | | | | |
| | | (in thousands) |
| Revenue | | |
| Membership | | $ | 58,090 |
| | $ | 67,992 |
| | $ | 73,113 |
|
| Service provider | | 265,239 |
| | 276,133 |
| | 241,898 |
|
| Total revenue | | 323,329 |
| | 344,125 |
| | 315,011 |
|
| Operating expenses | | | | | | |
Operations and support(1) | | 40,293 |
| | 56,074 |
| | 52,760 |
|
Selling(1) | | 111,046 |
| | 116,027 |
| | 115,210 |
|
Marketing(1) | | 65,140 |
| | 83,789 |
| | 96,953 |
|
Product and technology(1) | | 55,990 |
| | 36,661 |
| | 34,039 |
|
General and administrative(1) | | 53,954 |
| | 38,316 |
| | 26,411 |
|
| Operating income (loss) | | (3,094 | ) | | 13,258 |
| | (10,362 | ) |
| Interest expense, net | | 4,720 |
| | 2,971 |
| | 1,203 |
|
| Loss on debt extinguishment | | — |
| | — |
| | 458 |
|
| Income (loss) before income taxes | | (7,814 | ) | | 10,287 |
| | (12,023 | ) |
| Income tax expense | | 43 |
| | 44 |
| | 51 |
|
| Net income (loss) | | $ | (7,857 | ) | | $ | 10,243 |
| | $ | (12,074 | ) |
|
| | | | | | | | | | | | |
| (1) Includes non-cash stock-based compensation expense as follows: | | | | | | |
| Operations and support | | $ | 159 |
| | $ | 109 |
| | $ | 65 |
|
| Selling | | 1,745 |
| | 482 |
| | 393 |
|
| Marketing | | 372 |
| | 230 |
| | 205 |
|
| Product and technology | | 1,949 |
| | 931 |
| | 856 |
|
| General and administrative | | 10,519 |
| | 7,123 |
| | 6,370 |
|
| Total non-cash stock-based compensation expense | | $ | 14,744 |
| | $ | 8,875 |
| | $ | 7,889 |
|
|
| | | | | | | | | |
| | | Year Ended December 31, |
| | | 2016 | | 2015 | | 2014 |
| | | | | | | |
| Revenue | | | | | | |
| Membership | | 18 | % | | 20 | % | | 23 | % |
| Service provider | | 82 | % | | 80 | % | | 77 | % |
| Total revenue | | 100 | % | | 100 | % | | 100 | % |
| Operating expenses | | | | | | |
| Operations and support | | 13 | % | | 16 | % | | 17 | % |
| Selling | | 34 | % | | 34 | % | | 37 | % |
| Marketing | | 20 | % | | 24 | % | | 31 | % |
| Product and technology | | 17 | % | | 11 | % | | 11 | % |
| General and administrative | | 17 | % | | 11 | % | | 7 | % |
| Operating income (loss) | | (1) | % | | 4 | % | | (3) | % |
| Interest expense, net | | 1 | % | | 1 | % | | 1 | % |
| Loss on debt extinguishment | | — | % | | — | % | | — | % |
| Income (loss) before income taxes | | (2) | % | | 3 | % | | (4) | % |
| Income tax expense | | — | % | | — | % | | — | % |
| Net income (loss) | | (2) | % | | 3 | % | | (4) | % |
Comparison of the Years Ended December 31, 2016, 2015 and 2014
Revenue
|
| | | | | | | | | | | | | | | | | | |
| | | Year Ended December 31, | | | | |
| | | 2016 | | 2015 | | 2014 | | 2016 vs. 2015 | | 2015 vs. 2014 |
| | | | | | | | | | | |
| | | (dollars in thousands) | | | | |
| Revenue | | | | | | | | | | |
| Membership | | $ | 58,090 |
| | $ | 67,992 |
| | $ | 73,113 |
| | (15 | )% | | (7 | )% |
| Service provider | | 265,239 |
| | 276,133 |
| | 241,898 |
| | (4 | )% | | 14 | % |
| Total revenue | | $ | 323,329 |
| | $ | 344,125 |
| | $ | 315,011 |
| | (6 | )% | | 9 | % |
| | | | | | | | | | | |
| Percentage of revenue by type | | | | | | | | | | |
| Membership | | 18 | % | | 20 | % | | 23 | % | | |
| | |
|
| Service provider | | 82 | % | | 80 | % | | 77 | % | | |
| | |
|
| Total revenue | | 100 | % | | 100 | % | | 100 | % | | |
| | |
|
2016 compared to 2015. Total revenue decreased $20.8 million for 2016 as compared to 2015.
Membership revenue decreased $9.9 million for 2016 as compared to 2015, primarily due to the year over year impact associated with a 66% decline in gross paid memberships added, an eight percentage point decrease in the average paid membership renewal rate and a 7% decrease in membership revenue per average paid membership. The declines in gross paid memberships added, paid membership renewal rates and membership revenue per average paid membership were largely the result of our introduction of a free membership tier in all markets in June 2016 in connection with the removal of our ratings and reviews paywall. Our paid membership base is decreasing as new members are primarily joining via our free membership offering, and existing paid members are not renewing as paid members at rates consistent with our historical averages, thereby negatively impacting our membership revenue. Adjustments in the level of our advertising spend also factored into the year over year decline in membership revenue. Our advertising spend decreased $25.5 million in 2016 as compared to 2015, further contributing to the aforementioned declines in gross paid memberships added and paid membership renewal rates, and, accordingly, membership revenue.
Service provider revenue decreased $10.9 million for 2016 as compared to 2015, due in large part to a decline in revenue from our e-commerce offerings. The year over year decrease in e-commerce revenue was the result of declines in e-commerce unit sales during the year, attributable to transitional challenges associated with the implementation of our new technology platform as well as limited new member e-commerce purchase activity. Additionally, decreases in service provider advertising renewal rates also contributed to the decline in service provider revenue for the year. While we experienced a 2% increase in the number of participating service providers year over year, service provider contract value and contract value backlog decreased by $20.3 million and $15.1 million, respectively, over the same time period, reflecting, in part, the impact of certain disruptions associated with the migration to our new technology platform, as well as declines in the average pricing of service provider contracts. Typically, we are able to charge higher rates for advertising as service providers are able to reach a larger base of potential customers. However, as we generally only adjust advertising rates at the time of contract renewal, and given the timing of revenue recognition, which spreads advertising revenue over the life of each service provider contract, growth in service provider revenue commonly trails increases in membership. Accordingly, as we continue to transition our business model, and our membership continues to grow, the anticipated corresponding increases in service provider revenue, contract value and contract value backlog may not be immediate, or occur at all, as evidenced by the fact that the significant current year growth in our total membership base has not yet produced such increases. Further, as we expected at the outset of our long-term profitable growth plan, service provider revenue is lagging, and may continue to lag in the near-term, certain operating metrics.
2015 compared to 2014. Total revenue increased $29.1 million for 2015 as compared to 2014.
Membership revenue decreased $5.1 million year over year, primarily due to a 19% decrease in membership revenue per average paid membership for the year ended December 31, 2015 as compared to 2014, as well as a 17% decline in gross paid memberships added during 2015, partially offset by the impact associated with an 8% increase in the total number of paid memberships over the same time period. The decrease in membership revenue per average paid membership was largely the result of reductions in average membership fees across all markets due to tiered membership pricing. The decline in gross paid memberships added year over year was attributable to adjustments in the level of our marketing spend, as well as the messaging associated with that spend, in 2015 as compared to 2014. We decreased advertising spend $15.9 million year over year while simultaneously shifting our marketing focus from solely driving member growth to also highlighting our e-commerce offerings and marketplace initiatives, as well as new products and services, thus negatively impacting gross paid memberships added, and thereby membership revenue, year over year.
Service provider revenue increased $34.2 million year over year, primarily as a result of a 6% increase in service provider revenue per average participating service provider as well as a year over year increase in service provider contract value of 9%. As our penetration of a given market increases, we are typically able to charge higher rates for advertising as service providers are able to reach a larger base of potential customers. However, as we only increase advertising rates at the time of contract renewal, increases in service provider revenue in a given market may trail increases in market penetration.
Our e-commerce revenue is generated through our Angie's List Big Deal and Storefront marketplace offerings, which enable our consumers, including both members and non-members, to purchase services or products from our service providers through our marketplace. We receive a portion of the offer price at the time of the purchase, recognizing the revenue on a net basis in the period the offer is sold to consumers. While we are not the merchant of record with respect to our members for these transactions, we do offer members refunds in certain circumstances. Revenue from e-commerce transactions is recorded, net of a reserve for estimated refunds, as a component of service provider revenue within the consolidated statements of operations.
Service provider revenue accounted for 77%, 73% and 69% of total revenue for 2014, 2013 and 2012, respectively, and we expect service provider revenue as a percentage of total revenue to continue to increase in 2015.
Operating expenses
Operations and support. Operations and support expense consists primarily of costs associated with publishing the Angie’s List Magazine, operating our call center and providing support to our members and service providers, including wages and other employee benefits, credit card processing fees for member enrollment and other service provider transactions, report transcription and data entry and amortization of the cost of acquired data. Operations and support expense does not include the cost of maintaining our website, which is included in product and technology expense. With the growth of our membership base, we expanded our call center staff to maintain high levels of customer service and encourage high renewal rates. We also utilize third-party marketing research firms to enable our members to submit reviews by telephone to enrich the content available to our members and expand the number of service providers eligible to advertise and offer e-commerce with us. We expect our operations and support expense to increase as we continue to grow our membership and service provider bases and scale our operations, subject to seasonal trends.
Selling. Selling expense consists primarily of commissions, wages and other employee benefits for personnel focused on selling and renewing advertising to eligible service providers and creating and selling our e-commerce marketplace offerings. We pay substantially higher commissions to our service provider sales personnel for contracts with first-time participating service providers than we pay for renewals. Our e-commerce sales personnel responsible for Big Deal purchases earn commissions based on the net revenue received from the sale of such offerings, while our e-commerce sales personnel responsible for creating Storefront offerings are primarily paid a base salary. Selling expense also includes the cost of service provider marketing efforts, facilities for sales personnel, sales training and personnel-related costs for account management. Our general expectation is that selling expense will fluctuate with service provider revenue and the composition of that revenue over time, but in 2015, we expect selling expense to decline as a percentage of service provider revenue.
Marketing. Marketing expense consists of national television, radio, print and online digital advertising for the purpose of acquiring new paid memberships and highlighting our e-commerce offerings and marketplace initiatives. As a significant portion of our marketing spending is for the intended purpose of perpetuating our growth strategy via the continued acquisition of new paid memberships, and our marketing contracts are typically short-term in length, we possess the ability to rapidly adjust marketing expense in order to reduce total operating expenses and maximize cash from operations and profitability should we begin to experience adverse trends in marketing cost per paid membership acquisition or wish to optimize for profitability at the expense of rapid growth. Consistent with the seasonality that characterizes our business, our marketing expense and marketing cost per paid membership acquisition typically peak in the second or third quarters of the year. While we intend to continue to make substantial investments in marketing to acquire new paid memberships and highlight our marketplace initiatives, we expect marketing expense to decrease as a percentage of revenue in 2015.
Product and technology. Product and technology expense consists primarily of personnel-related costs, such as wages, including stock-based compensation, and employee benefits, as well as expenditures for technology-related outsourced professional services and facilities, all of which are related to the maintenance of our existing technology infrastructure and website as well as our investments in new product development and the implementation of new technologies focused on driving enhanced customer experiences and business efficiencies. We expect product and technology expense to increase in future periods as we continue to develop our technology platform and service our growing base of members and service providers. In 2015, we are anticipating an increase to product and technology expense in absolute dollars as we execute on the development efforts around our technology platforms and infrastructure and subsequently launch and transition during the year.
General and administrative. General and administrative expense is principally comprised of personnel-related costs, such as wages, including stock-based compensation, and employee benefits, for executive, legal, finance, human resources, marketing and corporate communications personnel as well as expenditures for outsourced professional fees, facilities maintenance, insurance premiums, amortization of certain intangibles, depreciation of buildings and improvements and other corporate expenses. While we expect general and administrative expense as a percentage of revenue to generally remain constant or decrease over time as we realize efficiencies and economies of scale as we grow, we anticipate an increase to general and administrative expense in absolute dollars and as a percentage of revenue in 2015 as the impact of personnel added in 2014 is annualized.
Results of Operations
The following tables set forth our results of operations for the periods presented in absolute dollars and as a percentage of our revenue for those periods. The period-to-period comparison of financial results is not necessarily indicative of future results.
|
| | | | | | | | | | | | |
| | | Year Ended December 31, |
| | | 2014 | | 2013 | | 2012 |
| Revenue | | (in thousands) |
| Membership | | $ | 73,113 |
| | $ | 65,307 |
| | $ | 47,717 |
|
| Service provider | | 241,898 |
| | 180,335 |
| | 108,082 |
|
| Total revenue | | 315,011 |
| | 245,642 |
| | 155,799 |
|
| Operating expenses | | | | | | |
Operations and support(1) | | 52,760 |
| | 40,072 |
| | 27,081 |
|
Selling(1) | | 117,176 |
| | 90,143 |
| | 58,596 |
|
| Marketing | | 87,386 |
| | 87,483 |
| | 80,230 |
|
Product and technology(1) | | 34,039 |
| | 27,570 |
| | 16,870 |
|
General and administrative(1) | | 34,012 |
| | 31,455 |
| | 24,055 |
|
| Operating loss | | (10,362 | ) | | (31,081 | ) | | (51,033 | ) |
| Interest expense, net | | 1,203 |
| | 1,868 |
| | 1,856 |
|
| Loss on debt extinguishment | | 458 |
| | — |
| | — |
|
| Loss before income taxes | | (12,023 | ) | | (32,949 | ) | | (52,889 | ) |
| Income tax expense | | 51 |
| | 40 |
| | 5 |
|
| Net loss | | $ | (12,074 | ) | | $ | (32,989 | ) | | $ | (52,894 | ) |
|
| | | | | | | | | | | | |
| (1) Includes non-cash stock-based compensation as follows: | | | | | | |
| Operations and support | | $ | 65 |
| | $ | 64 |
| | $ | — |
|
| Selling | | 397 |
| | 147 |
| | — |
|
| Product and technology | | 856 |
| | 136 |
| | 762 |
|
| General and administrative | | 6,571 |
| | 3,717 |
| | 2,181 |
|
| Total non-cash stock-based compensation | | $ | 7,889 |
| | $ | 4,064 |
| | $ | 2,943 |
|
|
| | | | | | | | | |
| | | Year Ended December 31, |
| | | 2014 | | 2013 | | 2012 |
| Revenue | | | | | | |
| Membership | | 23 | % | | 27 | % | | 31 | % |
| Service provider | | 77 | % | | 73 | % | | 69 | % |
| Total revenue | | 100 | % | | 100 | % | | 100 | % |
| Operating expenses | | | | | | |
| Operations and support | | 17 | % | | 16 | % | | 17 | % |
| Selling | | 37 | % | | 37 | % | | 38 | % |
| Marketing | | 27 | % | | 36 | % | | 52 | % |
| Product and technology | | 11 | % | | 11 | % | | 11 | % |
| General and administrative | | 11 | % | | 13 | % | | 15 | % |
| Operating loss | | (3 | )% | | (13 | )% | | (33 | )% |
| Interest expense, net | | 1 | % | | 1 | % | | 1 | % |
| Loss on debt extinguishment | | — | % | | — | % | | — | % |
| Loss before income taxes | | (4 | )% | | (14 | )% | | (34 | )% |
| Income tax expense | | — | % | | — | % | | — | % |
| Net loss | | (4 | )% | | (14 | )% | | (34 | )% |
Comparison of the years ended December 31, 2014, 2013 and 2012
Revenue
|
| | | | | | | | | | | | | | | | | | |
| | | Year Ended December 31, | | | | |
| | | 2014 | | 2013 | | 2012 | | 2014 vs. 2013 | | 2013 vs. 2012 |
| | | (dollars in thousands) | | | | |
| Revenue | | | | | | | | | | |
| Membership | | $ | 73,113 |
| | $ | 65,307 |
| | $ | 47,717 |
| | 12 | % | | 37 | % |
| Service provider | | 241,898 |
| | 180,335 |
| | 108,082 |
| | 34 | % | | 67 | % |
| Total revenue | | $ | 315,011 |
| | $ | 245,642 |
| | $ | 155,799 |
| | 28 | % | | 58 | % |
| | | | | | | | | | | |
| Percentage of revenue by type | | | | | | | | | | |
| Membership | | 23 | % | | 27 | % | | 31 | % | | |
| | |
|
| Service provider | | 77 | % | | 73 | % | | 69 | % | | |
| | |
|
| Total revenue | | 100 | % | | 100 | % | | 100 | % | | |
| | |
|
| | | | | | | | | | | |
| Total paid memberships (end of period) | | 3,041,651 |
| | 2,484,059 |
| | 1,787,394 |
| | 22 | % | | 39 | % |
| Gross paid memberships added (in period) | | 1,242,485 |
| | 1,218,258 |
| | 1,092,935 |
| | 2 | % | | 11 | % |
| Participating service providers (end of period) | | 51,614 |
| | 46,329 |
| | 35,952 |
| | 11 | % | | 29 | % |
2014 compared to 2013. Total revenue increased $69.4 million for 2014 as compared to 2013.
Membership revenue increased $7.8 million year over year, primarily due to a 22% increase in the total number of paid memberships, partially offset by a 9% decrease in membership revenue per paid membership for the year ended December 31, 2014 as compared to the prior year. The decrease in membership revenue per paid membership resulted in part from growth in paid memberships in markets where average membership fees per paid membership are lower. In addition, we reduced new membership fees, on average, across all markets in the current year as compared to the prior year as a result of a new tiered pricing structure that was introduced on a national basis during the second quarter, significantly contributing to the year over year decline in membership revenue per paid membership. The decrease in membership revenue per paid membership for 2014 also resulted from an increase from 94% to 96% in total memberships constituting annual and multi-year memberships year over year. Membership revenue accounted for 23%, 27% and 31% of total revenue for 2014, 2013 and 2012, respectively, and we expect membership revenue as a percentage of total revenue to continue to decrease in 2015. We are also expecting membership revenue to decline in absolute dollars in 2015 as a result of the impact associated with our introduction of tiered pricing membership plans on a national basis during the year, which reduced new membership fees, on average, across all markets and is putting downward pressure on our membership revenue and membership revenue per paid member.
Service provider revenue increased $61.6 million year over year, primarily as a result of a 20% increase in service provider revenue per participating service provider as well as an 11% increase in the number of service providers participating in our advertising programs. Service provider revenue primarily consists of revenue from advertising contracts with service providers. As our penetration of a given market increases, we are typically able to charge higher rates for advertising as service providers are able to reach a larger base of potential customers. However, as we only increase advertising rates at the time of contract renewal, increases in service provider revenue in a given market may trail increases in market penetration. E-commerce revenue of $27.1 million and $22.1 million is also included in service provider revenue for 2014 and 2013, respectively. We expect the revenueRevenue from theseour e-commerce marketplace offerings to fluctuatefluctuates from period to period as the offerings and monetization strategies evolve and due to seasonality. Service provider revenue accounted for 77%, 73% and 69%Near-term reductions in average e-commerce take rates contributed to a realization of total revenue for 2014, 2013 and 2012, respectively, and we expectslower service provider revenue as a percentage of total revenue to continue to increasegrowth rates in 2015.
2013 compared to 2012. Total revenue increased $89.8 million for 20132015 as compared to 2012.
Membership revenue increased $17.6 million, primarily due to a 39% increase in the total number of paid memberships, partially offset by an 8% decrease in average membership revenue per paid membership in 2013. The decrease in average membership revenue per paid membership primarily resulted from growth in paid memberships in less penetrated markets where average membership fees per paid membership were lower. This decline also reflected the effect of allowing members in our more penetrated markets to purchase only those segments of Angie’s List that were most relevant to them at a lower membership rate than the full service rate. As of December 31, 2013, there were 80 markets in which we offered members the opportunity to purchase individual segments. We offered only bundled memberships to members in less penetrated markets. In addition, in 2013 we reduced prices in certain markets which also yielded a decline in revenue per average paid membership. The decrease in membership revenue per paid membership also resulted from an increase from 91% to 94% in total paid memberships constituting annual and multi-year memberships. Consumers pay more per month for a monthly membership than for an annual membership. Therefore, in periods in which our percentage of memberships shifts to more annual and multi-year memberships, our membership revenue per paid membership decreases.
Service provider revenue increased $72.3 million to 73% of total revenue, primarily as a result of a 29% increase in the number of service providers participating in our advertising programs and a 22% increase in revenue per average participating service provider. Service provider revenue primarily consists of revenue from advertising contracts with service providers. As our penetration of a given market increases, we are typically able to charge higher rates for advertising because service providers are able to reach a larger base of potential customers. However, as we only increase advertising rates at the time of contract renewal, increases in service provider revenue in a given market may trail increases in market penetration. We also include our e-commerce revenue of $22.1 million and $14.5 million in 2013 and 2012, respectively, in service provider revenue. Our e-commerce revenue is generated by our Angie’s List Big Deal and Storefront offerings.2014.
Operations and support
| | | | | | | | | | | | | | Year Ended December 31, | | | | |
| | | Year Ended December 31, | | | | | | 2016 | | 2015 | | 2014 | | 2016 vs. 2015 | | 2015 vs. 2014 |
| | | 2014 | | 2013 | | 2012 | | 2014 vs. 2013 | | 2013 vs. 2012 | | | | | | | | | | |
| | | (dollars in thousands) | | | | | | (dollars in thousands) | | | | |
| Operations and support | | $ | 52,760 |
| | $ | 40,072 |
| | $ | 27,081 |
| | 32 | % | | 48 | % | | $ | 40,293 |
| | $ | 56,074 |
| | $ | 52,760 |
| | (28 | )% | | 6 | % |
| Percentage of revenue | | 17 | % | | 16 | % | | 17 | % | | |
| | |
| | 13 | % | | 16 | % | | 17 | % | | |
| | |
|
| Non-cash stock-based compensation | | $ | 65 |
| | $ | 64 |
| | $ | — |
| | | | | |
| Non-cash stock-based compensation expense | | | $ | 159 |
| | $ | 109 |
| | $ | 65 |
| | | | |
20142016 compared to 2013.2015. Operations and support expense increased $12.7decreased $15.8 million for 20142016 as compared to 2013.2015. The most significant factors contributing to the year over year decline in operations and support expense were a $5.5 million reduction in compensation and personnel-related expenditures and a $5.5 million decrease in publication costs. The reduction in compensation and personnel-related expenditures was driven by a 31% decrease in operations and support headcount year over year, while the decline in publication costs was the result of our implementation of a digital content distribution strategy whereby we increased digital distribution, and reduced print copy distribution, of the Angie’s List Magazine as compared to the prior year, generating a year over year decrease in the costs incurred to provide the magazine to our members. A year over year decline in credit card processing fees of $2.4 million, which was largely attributable to lower transaction volumes across our platforms in 2016, also contributed to the decrease in operations and support expense.
2015 compared to 2014. Operations and support expense increased $3.3 million for 2015 as compared to 2014. This increase was due in part to a $5.8 million increase in personnel-related costs as we increased our operations and support headcount year over year by approximately 17% in order to service our growing member and service provider populations. Additionally, we incurred a $4.0$2.0 million increase in publication costs associated with the increased circulation of the Angie’s List Magazineas we continuecontinued to expand our membership. There was alsomembership and, concurrently, the distribution of our monthly publication during 2015. Additionally, we experienced a $1.9$1.8 million increase in credit card processing fees year overas compared to the prior year, attributable to the growing volume of membership enrollmentenrollments and service provider transactions as well ason our platforms. These increases were partially offset by a $0.6 million increase in outsourced services. Operations and support expense increased slightly as a percentage of revenue year over year. We expect operations and support expense to continue to increase as we grow our membership and service provider bases, subject to seasonal trends.
2013 compared to 2012. Operations and support expense increased $13.0 million for 2013 compared to 2012. This increase was due in part to a $5.3 million increasedecrease in operations and support personnel-related costs as we increasedoutsourced service expenditures of $1.0 million, attributable to a reduction in our headcount to service our growing member and service provider bases. Additionally, there was a $2.0 million increase in credit card processing fees year over year due to the increased volumeutilization of membership enrollment and service provider transactions. We also incurred a $3.7 million increase in publication-related costs associated with the increased circulation of our monthly Angie’s List Magazine due to the continued expansion of our membership base. Operationsexternal resources for certain operations and support expense as a percentage of revenue decreased to 16% from 17% as a result of the increasefunctions in revenue and our realization of economies of scale as we service our members and service providers.2015.
Selling
| | | | | | | | | | | | | | Year Ended December 31, | | | | |
| | | Year Ended December 31, | | | | | | 2016 | | 2015 | | 2014 | | 2016 vs. 2015 | | 2015 vs. 2014 |
| | | 2014 | | 2013 | | 2012 | | 2014 vs. 2013 | | 2013 vs. 2012 | | | | | | | | | | |
| | | (dollars in thousands) | | | | | | (dollars in thousands) | | | | |
| Selling | | $ | 117,176 |
| | $ | 90,143 |
| | $ | 58,596 |
| | 30 | % | | 54 | % | | $ | 111,046 |
| | $ | 116,027 |
| | $ | 115,210 |
| | (4 | )% | | 1 | % |
| Percentage of revenue | | 37 | % | | 37 | % | | 38 | % | | |
| | |
| | 34 | % | | 34 | % | | 37 | % | | |
| | |
|
| Non-cash stock-based compensation | | $ | 397 |
| | $ | 147 |
| | $ | — |
| | | | | |
| Non-cash stock-based compensation expense | | | $ | 1,745 |
| | $ | 482 |
| | $ | 393 |
| | | | |
20142016 compared to 2013.2015. Selling expense increased $27.0decreased $5.0 million for 20142016 as compared to 2013, the majority of which correlates with the growth in service provider revenue over the same time period. We increased the number of sales personnel and management responsible for contract renewals by 39%2015. The year over year to 267, and, together withdecline in selling expense was, in part, the 776 sales personnel and management responsible for originating new advertising contracts and e-commerce transactions that were employed by us asresult of the end of 2014, this contributed to an approximately $23.5a $2.8 million increasedecrease in selling compensation and personnel-related costs for commissions, wages and other employee benefits, which was attributable to changes in our sales compensation plans and organizational structure, including an 8% year over year decline in our sales organization headcount, during the year, as compared towell as the prior year. Selling expense as a percentageimpact of total revenue remained constantlower service provider contract value bookings. Prior year event costs also influenced the year over year reduction in 2014 as compared to 2013. Our general expectation is that selling expense, will fluctuate withcontributing to decreases in 2016 to (i) travel, meals and entertainment of $1.1 million, (ii) selling-related outsourced services of $0.6 million and (iii) service provider revenue and the compositionmarketing expenditures of that revenue over time, but in 2015, we expect selling expense to decline as a percentage of service provider revenue.$0.6 million.
20132015 compared to 2012.2014. Selling expense increased $31.5$0.8 million for 20132015 as compared to 2012. This increase was largely due2014, primarily attributable to an increasecosts we incurred to host a three-day service provider conference in May 2015, which contributed to year over year increases in selling-related outsourced services of $1.4 million and selling-related travel, meals and entertainment of $1.1 million. Although selling expense generally correlates with fluctuations in service provider revenue, whichwe experienced year over year leverage and efficiency in selling expense as service provider revenue increased 67%14% for 2015 as compared to 2014, while selling expense increased 1% over the prior year. Additionally, we increasedsame time period. Headcount was the most significant factor contributing to the leverage and efficiency in selling expense, as there was an 11% reduction in the total number of sales personnel and management responsible for originating new advertising contracts and e-commerce transactions by 39% to 773. We also increased the number of sales personnel and management responsible for contract renewals by 38% to 192 fromwe employed at December 31, 2012. Selling expense as a percentage2015 compared to December 31, 2014, and when coupled with the impact of revenue decreased to 37%changes in 2013 from 38% in 2012, primarily as a result of our transition to a newsales compensation structure during 2015, yielded a $1.9 million decrease in selling compensation and personnel-related costs for our sales personnel.commissions, wages, training and other employee benefits year over year.
Marketing
| | | | | | | | | | | | | | Year Ended December 31, | | | | |
| | | Year Ended December 31, | | | | | | 2016 | | 2015 | | 2014 | | 2016 vs. 2015 | | 2015 vs. 2014 |
| | | 2014 | | 2013 | | 2012 | | 2014 vs. 2013 | | 2013 vs. 2012 | | | | | | | | | | |
| | | (dollars in thousands) | | | | | | (dollars in thousands) | | | | |
| Marketing | | $ | 87,386 |
| | $ | 87,483 |
| | $ | 80,230 |
| | — | % | | 9 | % | | $ | 65,140 |
| | $ | 83,789 |
| | $ | 96,953 |
| | (22 | )% | | (14 | )% |
| Percentage of revenue | | 27 | % | | 36 | % | | 52 | % | | |
| | |
| | 20 | % | | 24 | % | | 31 | % | | |
| | |
|
| Gross paid memberships added (in period) | | 1,242,485 |
| | 1,218,258 |
| | 1,092,935 |
| | | | | |
| Marketing cost per paid membership acquisition (in period) | | $ | 70 |
| | $ | 72 |
| | $ | 73 |
| | |
| | |
| |
| Non-cash stock-based compensation expense | | | $ | 372 |
| | $ | 230 |
| | $ | 205 |
| | | | |
20142016 compared to 2013.2015. Marketing expense, which now includes the marketing compensation and personnel-related costs and general marketing operating expenditures that were formerly classified as general and administrative expense, decreased $18.6 million for 2016 as compared to 2015. While we continue to make investments in 2014increasing our membership base and expanding our market reach, we also utilize advertising to highlight our products and services and drive engagement on our platforms. Accordingly, our marketing expense is not only a reflection of the cost incurred to attract new members but also the marketing dollars we are spending to generate traffic to and transactions on our platforms. For the year ended December 31, 2016, the most significant factor contributing to the year over year decrease in marketing expense was consistenta $25.5 million decline in advertising spend. Although we accelerated our advertising spend during the third quarter of 2016 to highlight our new free membership offerings and related initiatives, the level at which we spent on advertising was lower in 2016 than in 2015 as we purposefully reduced such costs, while focusing on the efficiency and effectiveness of our spend, in the current year in order to make strategic investments in other areas of the business. The year over year decline in marketing expense associated with 2013reductions in advertising spend was partially offset by a $3.8 million increase in marketing-related outsourced service expenditures, a portion of which was attributable to fees paid to our advertising creative agency, a $1.8 million increase in marketing compensation and personnel-related costs and a $1.6 million increase in service provider marketing costs related to our efforts to further enhance our relationships with service providers. Consistent with the seasonality that characterizes our business, we generally expect marketing expense to peak in either the second or third quarter of the year.
2015 compared to 2014. Marketing expense, which includes the marketing compensation and personnel-related costs and general marketing operating expenditures that were reclassified from general and administrative expense, decreased $13.2 million for 2015 as compared to 2014. Although we continued to make significant investments in increasing our paid membership base and expanding our market reach via national offline and online advertising, we purposefully reduced our marketing spend in order2015 as compared to facilitate sustained growth2014 as we focused on the efficiency and effectiveness of our spend while making strategic investments in other areas of the business. Marketing expense as a percentage of revenue decreasedIn 2014, we began to shift our marketing focus from the prior year period as total revenue increased year over year while marketing expense was essentially flat over the same time period. Our marketing cost per paid membership acquisition declined from $72 for 2013solely driving member growth to $70 for 2014, reflecting efficiency inalso highlighting our spende-commerce offerings and marketplace initiatives, as well as the positive impacts we believe are attributable to the combination of membership fee reductions associated with tiered pricing, improved brand awareness, successful SEO efforts, improved effectivenessnew products and services, and that strategy remained in purchasing advertising and the "word of mouth" benefits associated with increased market penetration. Consistent with the seasonality that characterizes our business,place in 2015. As such, our marketing expense and marketing cost per paid membership acquisition typically peak in the second or third quartersfor 2015 was not only a reflection of the year. In 2014,cost incurred to obtain new members but also the marketing dollars we acceleratedspent to generate traffic to and transactions on our marketing expenditures in the second quarter, and as such, we curtailed marketing spend in the third and fourth quarters as compared to the prior year. We expect marketing expense to decrease as a percentage of revenue in 2015.platforms.
2013 compared to 2012. Marketing expense increased $7.3 million for 2013 compared to 2012, primarily due to a planned increase in national advertising spending for 2013 to acquire new members. Marketing expense as a percentage of revenue decreased from the prior year period due to total revenue increasing at a greater rate than marketing expense increased in absolute dollars. Even with the current year increase in marketing expense, our marketing cost per paid membership acquisition decreased from $73 to $72 as a result of improved brand awareness, successful SEO efforts, improved effectiveness
in purchasing advertising and the “word of mouth” benefits of increased penetration. Our marketing expense and marketing cost per paid membership acquisition typically peak in the second and third quarters of the year.
Product and technology
| | | | | | | | | | | | | | Year Ended December 31, | | | | |
| | | Year Ended December 31, | | | | | | 2016 | | 2015 | | 2014 | | 2016 vs. 2015 | | 2015 vs. 2014 |
| | | 2014 | | 2013 | | 2012 | | 2014 vs. 2013 | | 2013 vs. 2012 | | | | | | | | | | |
| | | (dollars in thousands) | | | | | | (dollars in thousands) | | | | |
| Product and technology | | $ | 34,039 |
| | $ | 27,570 |
| | $ | 16,870 |
| | 23 | % | | 63 | % | | $ | 55,990 |
| | $ | 36,661 |
| | $ | 34,039 |
| | 53 | % | | 8 | % |
| Percentage of revenue | | 11 | % | | 11 | % | | 11 | % | | |
| | |
| | 17 | % | | 11 | % | | 11 | % | | |
| | |
|
| Non-cash stock-based compensation | | $ | 856 |
| | $ | 136 |
| | $ | 762 |
| | |
| | |
| |
| Non-cash stock-based compensation expense | | | $ | 1,949 |
| | $ | 931 |
| | $ | 856 |
| | |
| | |
|
20142016 compared to 2013.2015. Product and technology expense increased $6.5$19.3 million for 20142016 as compared to 2013.2015. The increase in product and technology expense was duelargely the result of year over year increases in compensation and personnel-related costs and depreciation and amortization expense of $8.9 million and $5.6 million, respectively. The year over year increase in product and technology compensation and personnel-related costs was primarily attributable to the combined impact of a $2.3 million increase30% growth in technology-related outsourced services, a $0.9 million increase in general officeour product and utilities expenditures, a $0.8 milliontechnology headcount from December 31, 2015 to December 31, 2016, as we strengthened our product and technology organizations to execute on our technology platform migration and product roadmap, while the year over year increase in depreciation and amortization expense and a $0.4 million increasewas due to our new technology platform, which we placed in personnel-related costs, allservice as of which can be attributed to the maintenanceend of our existing technology infrastructure and website as well as our investments in new product development and the implementationfirst quarter of new technologies focused on driving enhanced customer experiences and business efficiencies. In addition, current year product2016. Product and technology expense was also negatively impacted by a $1.8$2.9 million one-time, non-cash long-lived asset impairment charge related to the abandonmentincrease in outsourced services expenditures. As utilization of our new technology platform has now commenced, certain expenditures, including internal labor, that do not represent qualifying upgrades, enhancements or new functionality are no longer classified as capitalized website and software development assets during the fourth quarter of 2014. Productcosts and technology expenseare instead expensed as a percentage of revenue was consistent year over year, and we expect this trend to generally perpetuate from period to period. In 2015, we are anticipating an increase to product and technology expense in absolute dollars as we execute on the development efforts around our technology platforms and infrastructure and subsequently launch and transition during the year.incurred.
20132015 compared to 20122014. . Product and technology expense increased $10.7$2.6 million for 20132015 as compared to 2012.2014. The increase in product and technology expense was primarilylargely attributable to a $6.4$3.0 million increase in personnel-related costs and a $2.9 millionyear over year increase in technology-related outside consultingoutsourced services, due to the maintenance and professional fees as well as costs incurredsupport of our existing technology infrastructure, including our website, in order to continue to developservice our membership and service provider bases while development efforts around our new technology platform and service our growing base of members and service providers. This was offset by a decreasecontinued throughout the year. The increase in non-cash stock based compensation related to forfeitures occurring in the current year. Productproduct and technology expense asassociated with outsourced service expenditures was partially offset by the impact of the non-cash long-lived asset impairment charges recorded in the fourth quarter in each of the two previous years. In the fourth quarter of 2014, we recorded a percentage$1.8 million long-lived asset impairment charge for certain capitalized website and software development assets, while in the fourth quarter of revenue remained consistent compared with the prior year.2015, we recorded a $0.9 million long-lived asset impairment charge related to certain software assets.
General and administrative
| | | | | | | | | | | | | | Year Ended December 31, | | | | |
| | | Year Ended December 31, | | | | | | 2016 | | 2015 | | 2014 | | 2016 vs. 2015 | | 2015 vs. 2014 |
| | | 2014 | | 2013 | | 2012 | | 2014 vs. 2013 | | 2013 vs. 2012 | | | | | | | | | | |
| | | (dollars in thousands) | | | | | | (dollars in thousands) | | | | |
| General and administrative | | $ | 34,012 |
| | $ | 31,455 |
| | $ | 24,055 |
| | 8 | % | | 31 | % | | $ | 53,954 |
| | $ | 38,316 |
| | $ | 26,411 |
| | 41 | % | | 45 | % |
| Percentage of revenue | | 11 | % | | 13 | % | | 15 | % | | |
| | |
| | 17 | % | | 11 | % | | 7 | % | | |
| | |
|
| Non-cash stock-based compensation | | $ | 6,571 |
| | $ | 3,717 |
| | $ | 2,181 |
| | |
| | |
| |
| Non-cash stock-based compensation expense | | | $ | 10,519 |
| | $ | 7,123 |
| | $ | 6,370 |
| | |
| | |
|
20142016 compared to 2013.2015. General and administrative expense, which no longer includes the marketing compensation and personnel-related costs and general marketing operating expenditures that are now classified as marketing expense, increased $2.6$15.6 million for 20142016 as compared to 2013. Among the2015. The most significant driversdriver of the fluctuationincrease in general and administrative expense year over year was a $5.3 million increase in personnel-related costs, including a $2.9 million increase in non-cash stock-based compensation expense, attributable to 40% growth in our headquarters headcount over the prior year. Additionally, we experienced a $0.9 million increase in general office and utilities expenditures related to the expansion and upgrading of our office facilities during the current year, a $0.8$6.3 million increase in outsourced servicesservice expenditures and professional fees due to facilitatethird-party consulting costs incurred for, among other things, the continued growthdevelopment and developmentexecution of our operationslong-term profitable growth plan, optimization of our service provider go-to-market activities and activist activity in our stock. General and administrative expense was also negatively impacted by a $0.8$2.8 million legal settlement accrual recorded in relation to the Moore litigation (see Note 9, “Commitments and Contingencies,” in the accompanying Notes to Consolidated Financial Statements included in Item 8 of this Form 10-K for additional information). A $3.3 million increase in depreciationcompensation and amortization expense. These increases were partially offset bypersonnel-related costs, largely attributable to stock-based compensation expense, and a decline$2.3 million increase in bad debt expense, of $0.6 million, a decrease in professional service fees andprimarily related to e-commerce receivables, also contributed to the impact associated with the $4.0 million prior year legal settlement charge recorded in the fourth quarter of 2013 that did not recur in the current year. We experienced a slight decreaseover year increase in general and administrative expense asexpense. Additionally, there was a percentage of revenue year over year. While we expect general and administrative expense as a percentage of revenue to generally remain constant or decrease over time as we realize efficiencies and economies of scale as we grow, we anticipate an increasecumulative $2.2 million net benefit to general and administrative expense in absolute dollars2015, related to adjustments to a legal settlement accrual for a prior legal obligation, which did not recur in 2016, further impacting the year over year fluctuation in general and as a percentage of revenue in 2015 as the impact of personnel added in 2014 is annualized.administrative expense.
20132015 compared to 20122014. . General and administrative expense, which does not include the marketing compensation and personnel-related costs and general marketing operating expenditures that were reclassified to marketing expense, increased $7.4$11.9 million for 20132015 as compared to 2012.2014. The most significant driver of the increase in general and administrative expense year over year was partially explaineda $10.2 million increase in compensation and personnel-related costs, including $0.8 million related to non-cash stock-based compensation expense, due to the impact of headquarters personnel added during 2015 in strategic growth areas such as human resources, finance and project management, as well as the addition of our new President and Chief Executive Officer in September 2015. While general and administrative non-cash stock-based compensation expense increased year over year, the 2015 amount was favorably impacted by approximately $1.2 million of forfeitures during the year. General and administrative expense was also negatively impacted by a $4.0$2.3 million increase in outsourced service expenditures, attributable to third-party consulting fees as well as costs incurred related to the identification and hiring of our new President and Chief Executive Officer and the development of our profitable growth plan. Additionally, we incurred a $0.7 million non-cash long-lived asset impairment charge recordedto general and administrative expense during the fourthsecond quarter of 2013 reflecting2015 related to our decision not to pursue our previously announced Indianapolis campus expansion plan. The aforementioned factors contributing to the expected settlement of pending litigation for which we had entered into a settlement agreement subject to court approval. Additionally, there was an approximately $1.8 million year over year increase in bad debt expense related to uncollectible receivables as well as a $1.5 million increase in non-cash stock-based compensation due to additional grants during 2013. The remaining portion of the fluctuation in general and administrative expense was attributable to increases in headquarters staff and outside consulting and professional fees and other public company costs. These increases were partially offset by non-recurring costs incurredthe impact of $0.7the adjustment of the legal settlement accrual for a prior legal obligation, amounting to $2.2 million for fees related to the follow-on sale of common stock in May 2012 that were not present in the current year. General and administrative expense as a percentage of revenue decreased primarily due to the increase in revenue and our realization of economies of scale.year ended December 31, 2015.
Interest expense
20142016 compared to 2013.2015. Interest expense was approximately $1.2$4.7 million for 20142016 as compared to $1.9$3.0 million for 2013,2015, reflecting the impact of recurring monthly interest payments on theour outstanding long-term debt balance and monthly interest charges for loandeferred financing fee and debt discount amortization, partially offset by capitalized interest on internal usewebsite and software development.development recorded during the first quarter of 2016. The year over year increase in interest expense was primarily attributable to a reduction in capitalized interest in 2016 as compared to 2015 as we ceased capitalizing interest on website and software development as of the end of the first quarter of 2016 in connection with the migration to our new technology platform.
20132015 compared to 20122014. Interest expense was approximately $1.9$3.0 million for both 20132015 as compared to $1.2 million for 2014, reflecting the impact of recurring monthly interest payments on our outstanding long-term debt and 2012 asmonthly interest charges for deferred financing fee and debt balances remained constant.discount amortization related to the September 2014 debt financing transaction, partially offset by capitalized interest on website and software development.
Loss on debt extinguishment
As a result of the current year debt refinancing completed in the third quarter of 2014, which included the retirement of our previous debt facility, we recorded a $0.5 million loss on debt extinguishment during the third quarter associated with the recognition of the remaining warrant interest expense under the previous debt facility, prepayment penalties and incremental interest incurred upon early retirement of the previous debt and the write-off of the remaining unamortized portion of the deferred financing fees capitalized under our previous debt facility.
Liquidity and Capital Resources
General
As ofAt December 31, 2014,2016, we had $40.0$22.4 million in cash and cash equivalents and $24.3$16.5 million in short-term investments. Cash and cash equivalents consists of bank deposit accounts and money market funds as well as any investments in corporate bonds or certificates of deposit, U.S. Treasury securities or corporate bonds with contractual maturities of three months or less, which, at times, may exceed federally insured limits. Short-term investments consist of corporate bonds and certificates of deposit, U.S. Treasury securities and corporate bonds with maturities of more than 90 days but less than one year. To date, the carrying valuevalues of these investments approximate their fair values, and we have incurred no material loss in these accounts.
We have historically financed our operations primarily through private and public sales of equity and in certain cases, from borrowings. Our principal sources of operating cash flows are receipts from service provider advertising and membership fees, and service provider transactions. We continue to invest aggressively in the growth of our business. Accordingly, over the past three years,while our most significant uses of cash in operating activities relatedgenerally relate to expenditures for our national marketingadvertising campaigns and commissions paid to service provider sales personnel as our service provider revenue increased.personnel.
Our operating cash flows fromin future periods will be impacted by our level of investment in advertising, changes in membership and service provider pricing and monetization strategies, the impact of new products and services, the size, composition and compensation structure for our sales organization and general fluctuations in employee headcount, among other things. We expect positive operating activities are influenced by certain timing differences. Membership fees are generally collected atcash flows in some periods and negative operating cash flows in others, depending on seasonality and the beginningextent of our investments in future growth of the membership period and impact our working capital although the associated revenue is recognized over the term of the subscription period. Additionally, from time to time we amend our commission plans for sales personnel, andbusiness or changes to these plans can result in a positive or negative impact on prepaid commissions, depending on the structure of the commission plan in place.our business model.
We believe that our existing cash and cash equivalents and short-term investments will be sufficient to fund our operations for, at a minimum, the next twelve months. Additionally, we believe our liquidity and capital resources will be adequate to meet our long-term cash requirements, including the long-term debt and operating lease contractual obligations highlighted herein, and there are no known material adverse trends or uncertainties related to cash flows or capital requirements as of December 31, 2016 that we believe will result in material changes in our ability to meet our obligations as they become due over the next twelve months. While we may explore additional financing sources, including equity, equity-linked or debt financing, in the future in order to develop or enhance our services, fund expansion, respond to competitive pressures, acquire or invest in complementary products, businesses or technologies or lower our cost of capital, there is no guarantee that such financing will be available to us on acceptable terms, if at all.
Summary cash flow information for the years ended December 31, 2014, 20132016, 2015 and 20122014 is set forth below.
|
| | | | | | | | | | | | |
| | | Year Ended December 31, |
| | | 2014 | | 2013 | | 2012 |
| Net cash provided by (used in) operating activities | | $ | 4,629 |
| | $ | 8,906 |
| | $ | (33,397 | ) |
| Net cash used in investing activities | | (41,152 | ) | | (21,857 | ) | | (22,006 | ) |
| Net cash provided by financing activities | | 41,711 |
| | 5,116 |
| | 9,434 |
|
|
| | | | | | | | | | | | |
| | | Year Ended December 31, |
| | | 2016 | | 2015 | | 2014 |
| | | | | | | |
| | | (in thousands) |
| Net cash provided by operating activities | | $ | 1,635 |
| | $ | 26,691 |
| | $ | 4,629 |
|
| Net cash (used in) investing activities | | (11,379 | ) | | (34,537 | ) | | (41,152 | ) |
| Net cash provided by (used in) financing activities | | (453 | ) | | 454 |
| | 41,711 |
|
Net Cash Provided By (Used in) Operating Activities
Cash provided by operating activities of $1.6 million for the year ended December 31, 2016 was achieved despite a net loss of $7.9 million, primarily due to non-cash activity of $36.2 million during the year, including stock-based compensation expense of $14.7 million and depreciation and amortization expense of $13.1 million. A $2.0 million decrease in prepaid expenses and other current assets, which was largely a byproduct of our efforts to identify operating expense efficiencies and cost savings, as well as changes in the timing and duration of certain prepaid contracts, also contributed to cash provided by operating activities for 2016. The most significant use of cash in operating activities during 2016 related to deferred revenue, which declined $18.0 million as a result of downward pressures on both our membership and service provider revenue streams associated with the migration to our new technology platform and the removal of our ratings and reviews paywall during the year. Additionally, we experienced a $3.9 million net decrease in accounts payable and accrued liabilities year over year due, in part, to a decline in the balance of trade accounts payable and the expected timing of payment of such costs.
Our net income of $10.2 million for the year ended December 31, 2015 was the most significant factor contributing to cash from operating activities of $26.7 million for the year. Operating cash flow for 2015 was also positively impacted by $23.6 million of non-cash activity, including stock-based compensation expense of $8.9 million, depreciation and amortization expense of $6.4 million, bad debt expense of $5.7 million and two separate long-lived asset impairment charges amounting to $1.6 million during the year. Additionally, a net increase in accounts payable and accrued liabilities of $2.9 million year over year, largely the result of increases in and the expected timing of payment of trade accounts payable, also contributed to our operating cash flows will continueflow for 2015. Uses of cash from operations for the year included a $7.6 million fluctuation in accounts receivable, attributable to be impacted principallyincreases in service provider billings outstanding at year-end, as well as a $0.9 million increase in prepaid expenses and other current assets associated with certain technology service agreements, offset by a reduction in prepaid commissions related to a decline in the extent to whichnumber of sales personnel we continue to pursue our growth strategy, including investments in national advertising, changes in price per average paid membership,employ and the size and compositioncontinued evolution of our sales force responsible for originatingcompensation structure. The $1.6 million year over year net decrease in deferred advertising and renewing service provider contracts and fluctuationsmembership revenue, which was primarily the result of declines in headcount as we growmembership revenue associated with our business. Our largest sourcerealization of lower membership revenue per paid member, also negatively impacted our operating cash flows is cash collections from our members and service providers. We expect positive operating cash flows in some periods and negative operating cash flows in others, depending on seasonality andflow for the extent of our investments in future growth of the business.year.
Cash provided by operating activities in 2014 of $4.6 million was achieved despite a net loss of $12.1 million, primarily as a result of the impact of non-cash activity during the year. More specifically, operatingOperating cash flows were positively impacted by current year stock-based compensation expense of $7.9 million, depreciation and amortization expense of $5.6 million, bad debt expense of $5.0 million and a one-time, non-cash long-lived asset impairment charge of $1.8 million associated with the abandonment of certain capitalized website and software development assets. Additionally, the change in total deferred revenue also contributed to current year cash provided by operations, amounting to $7.1 million, as we experienced year over year increases in both the number of paid memberships and the number of service providers participating in our advertising programs. Current year usesUses of cash from operations included $4.4 million related to the year over year increase in prepaid expenses and other current assets, attributable to the continued evolution of our compensation structure for sales personnel as well as the timing of such payments. Further, increases in service provider billings during the current year2014 contributed to a $7.8 million fluctuation in accounts receivable that also negatively impacted operating cash flows.
Net Cash provided by operating activities for 2013 of $8.9 million was generated despite a net loss of $33.0 million. Our cash provided by operating activities was attributable to a deferred revenue increase of $25.1 million as a result of an increase in both the number of our paid memberships and in the number of service providers participating in our advertising programs, a $6.6 million net increase in accounts payable and accrued liabilities primarily related to increases in accrued compensation, the impact of a $4.0 million legal accrual and the expected timing of payment of these balances, and a decrease in prepaid expenses of $6.2 million primarily attributable to our change in compensation structure for our sales personnel responsible for new advertising originations. In addition, our net loss included approximately $12.4 million of non-cash expenses, which included $4.1 million of stock-based compensation expense, $4.1 million of depreciation and amortization, $3.8 million of bad debt expense and $0.5 million attributable to the amortization of debt discount and deferred financing fees. Uses of cash included a $7.3 million increase in accounts receivable attributable to an increase in service provider billings.(Used In) Investing Activities
Our use of cash in operatinginvesting activities of $11.4 million for 2012the year ended December 31, 2016 was primarily attributable to the total combined $18.6 million in capital expenditures for property, equipment and software during the period, consisting of $13.7 million in capitalized website and software development costs related to our new technology platform as well as $4.9 million for facilities improvements and technology hardware and software, partially offset by $7.4 million in sales, net loss of $52.9 million, reflecting continuedpurchases, of short-term investments at maturity during 2016. While we will continue to make capital investments in our national advertising campaigns, an increasetechnology platform and infrastructure in our sales personnel,2017, there were no material commitments for capital expenditures in place as well as other headcount increases and other expenses to grow our business. This net loss included $8.0 million of non-cash expenses, which included $2.9 million of stock-based compensation expense, $2.8 million of depreciation and amortization, $2.0 million of bad debt expense, and $0.3 million of amortization of debt discount and deferred financing fees. Additional uses of cash included an $8.0 million increase in prepaid expenses primarily as a result of the timing of payment of commissions to our sales personnel and a $5.8 million increase in accounts receivable associated with the growth in service provider revenue. These usesDecember 31, 2016.
Our use of cash in operatinginvesting activities were offset in part by a $4.8of $34.5 million increase in accounts payable and accrued liabilities,for 2015 was primarily attributable to increasesthe total combined $34.3 million in accrued marketing expensescapital expenditures for property, equipment and accrued but unpaid commissions,software during the year, consisting of $25.2 million in capitalized website and increases in deferred revenue of $20.5 million, as a result of an increase both insoftware development costs related to the numberdevelopment of our paid membershipsnew technology platform and in the number of service providers participating in our advertising programs.$9.1 million for facilities improvements and technology hardware and software.
Net Cash Used in Investing Activities
Our use of cash in investing activities of $41.2 million in 2014 was largely attributable to the total combined $36.9 million in capital expenditures for property, equipment and software during the year, consisting of $20.1 million for capitalized website and software development costs related to the development of our new technology platform and mobile applications and $16.7 million for campus expansion and improvement efforts and upgrades and additions to technology hardware and software as well as nearly $20.1software. Additionally, our purchases of short-term investments exceeded sales at maturity during the year, amounting to $3.3 million, for capitalized website and software development as we continuefurther contributing to make significant investmentsour use of cash in the technology infrastructure supporting our web and mobile platforms to sustain our current and anticipated future growth.investing activities in 2014. We also spent $1.0 million during the year2014 on data acquisition costs to acquire consumer reports on service providers and to purchase a website domain name. Our current year sales of investments at maturity, net of purchases, in corporate bonds and certificates of deposit with maturities of more than 90 days but less than one year also contributed to our use of cash in investing activities in the amount of $3.3 million as purchases of short-term investments exceeded sales in 2014.
Our use of cash in investing activities in 2013 was attributable to the purchase, net of sales, of $10.8 million in investments in corporate bonds, commercial paper and certificates of deposit with maturities between 90 days and one year, $8.1 million for facilities, information technology hardware and software and capitalized website and software development, $2.2 million for the purchase of BrightNest assets in August 2013 and $0.8 million for data acquisition to acquire consumer reports on service providers.Net Cash Provided By (Used In) Financing Activities
Our use of cash in investingfinancing activities of $0.5 million for the year ended December 31, 2016 was primarily attributable to taxes paid for net share settlements associated with the vesting of restricted stock units and performance awards of restricted stock units during the year, amounting to $2.5 million, partially offset by $2.0 million in 2012proceeds from stock option exercises. Financing cash flows were also impacted by proceeds from our employee stock purchase plan ($0.5 million), payments on our capital lease obligation ($0.2 million) and the first of three equal annual installments for a fee payable to our lender in connection with the completion of the second amendment to the financing agreement during 2016 ($0.2 million).
Net cash provided by financing activities of $0.5 million for 2015 was attributable to proceeds from exercises of employee stock options during the purchase of $10.5 million in investments in corporate bonds and certificates of deposits with maturities between 90 days and one year, the purchase ofpartially offset by payments on our headquarters facilities, including both land and buildings, for $6.8 million, inclusive of the costs and fees to acquire the properties, $2.9 million in office improvements and information technology investments and $2.0 million for data acquisition.capital lease obligation.
Net Cash Provided by Financing Activities
Net cash provided by financing activities of $41.7 million in 2014 was largely attributable to the debt refinancing transaction completed during the third quarter,in September of 2014, which yielded gross proceeds of $60.0 million. The debt proceeds were offset by a $15.0 million cash outflow related to the retirement of our previous debt facility, cash paid for financing costs of $2.0 million and fees paid to the lender of $1.2 million. Current year financingFinancing cash flows were also impacted by an additional $0.5 million in contingent consideration that was paid out during the year2014 to satisfy our final obligation under the 2013 BrightNest acquisition, which was due and payable on the one-year anniversary of the closing of the transaction.
Net cash provided by financing activities for 2013 consisted solely of proceeds from the exercise of employee stock options.
Net cash provided by financing activities for 2012 included proceeds of $8.6 million from our follow-on offering of common stock, net of underwriting discounts and expenses and additional offering-related expenses. Additionally, we obtained proceeds of $0.8 million as a result of the exercise of stock options.
Debt Obligations
On September 26, 2014, we entered into aan $85.0 million financing agreement, that provided forcomprised of a $60.0 million term loan and a $25.0 million delayed draw term loan, to provide increased financial flexibility for investments in growth while simultaneously reducing our interest rate.
On June 10, 2016, we entered into a first amendment to the financing agreement which, among other things, (i) extended the commencement of our quarterly repayment obligations under the term loan from September 30, 2016 to September 30, 2017; (ii) revised the financial covenants for minimum consolidated EBITDA, as defined in the financing agreement, for periods ending after June 30, 2016; (iii) revised the financial covenant related to minimum required liquidity from $10.0 million to $30.0 million; (iv) removed the financial covenant related to minimum membership revenue for periods ending after March 31, 2016; and (v) modified the basis for the calculation of the applicable interest rate.
On November 1, 2016, we entered into a second amendment to the financing agreement which, among other things, (i) added a new financial covenant related to consolidated active service provider contract value beginning with the period ending December 31, 2016; (ii) revised the financial covenants for minimum consolidated EBITDA, as defined in the financing agreement and subsequently modified under the second amendment, for periods ending after September 30, 2016; (iii) revised the financial covenant related to minimum required liquidity; (iv) modified the basis for the calculation of the applicable interest rate; (v) modified the dates under which the prepayment premium is applicable; and (vi) modified certain terms related to the delayed draw term loan. AmountsAdditionally, the second amendment set forth a $0.6 million fee to be paid by us to the lender, in three equal annual installments, in connection with the execution of the amendment, and this fee was capitalized along with the existing unamortized fees paid to lender contra liability and is being amortized to interest expense over the remaining term of the financing agreement.
The financing agreement requires monthly interest payments on the first business day of each month until maturity on any principal amounts outstanding under either debt facility. In accordance with the second amendment to the financing agreement, if our consolidated EBITDA for the trailing four consecutive fiscal quarters is less than $20.0 million or our qualified cash, as defined in the financing agreement, is less than $20.0 million as of the applicable period end, amounts outstanding under the financing agreement bear interest at a per annum rate, at theour option, of us, equal to (i) the LIBOR rate for the interest period in effect, subject to a floor of 0.5%, plus 6.75%9.50% or (ii) the reference rate, which is based on the prime rate as published by the Wall Street Journal, subject to a floor of 3.25%, plus 5.75%8.50%. The financing agreement requires monthly interest-only payments onIf our qualified cash is greater than $20.0 million, and our consolidated EBITDA for the first business day of each month until maturity on any principal amounts outstanding under either debt facility. trailing four consecutive fiscal quarters is:
greater than $20.0 million but less than $25.0 million, the applicable LIBOR interest rate is 8.5%, and the applicable reference interest rate is 7.5%;
greater than $25.0 million but less than $30.0 million, the applicable LIBOR interest rate is 7.5%, and the applicable reference interest rate is 6.5%; or
greater than $30.0 million, the applicable LIBOR interest rate is 6.5%, and the applicable reference interest rate is 5.5%.
The financing agreement obligates us to make quarterly principal payments on the term loan of $0.8 million on the last day of each calendar quarter, commencing with the quarter ending September 30, 2016,2017, and to repay the remaining balance of the term loan at maturity. We are required to make principal payments on the outstanding balance of the delayed draw term loan equal to 1.25% of the amount of such loan funded at or prior to the last day of each calendar quarter commencing with the quarter ending September 30, 2016, and to repay the remaining outstanding balance of the delayed draw term loan at maturity. TheFrom the effective date of the financing agreement containsthrough September 26, 2017, we are also required to pay a provisioncommitment fee equal to 0.75% per annum of the unborrowed amounts of the delayed draw term loan.
We may prepay the amounts outstanding under the financing agreement at any time and are required to prepay the loans with (i) the net proceeds of certain asset sales, issuances of debt or equity, and certain casualty events, and (ii) up to 50% of consolidated excess cash flow, as defined in the financing agreement, for penalties relatedeach fiscal year during the term of the financing agreement, commencing with the year ended December 31, 2015. We did not have excess cash flow as of December 31, 2016. As specified by the second amendment to early prepayment.the financing agreement, we must pay a 1% premium on prepayments made on or before November 1, 2017, subject to certain exceptions set forth in the financing agreement. Our obligations under the financing agreement are guaranteed by each of our subsidiaries and are secured by first priority security interests in all of ourtheir respective assets and a pledge of the equity interests of our subsidiaries. The term loan and the delayed draw term loan mature on September 26, 2019. As of December 31, 2014,2016, we had $58.9$57.6 million in outstanding borrowings under the term loan, net of unamortized deferred financing fees of $1.1 million and unamortized fees paid to the lender of $1.1$1.3 million, underboth of which are being amortized into interest expense over the term loanof the financing agreement, and availability of $25.0 million under the delayed draw term loan.
The financing agreement contains various restrictive covenants, including restrictions on our ability to dispose of assets, make acquisitions or investments, incur debt or liens, make distributions to stockholders or repurchase outstanding stock, enter into related-party transactions and make capital expenditures.expenditures, other than upon satisfaction of the conditions set forth in the financing agreement. We are also required to comply with certain financial covenants, including minimum consolidated EBITDA, as defined in the financing agreement and subsequently modified under the second amendment, minimum liquidity, minimum consolidated active service provider contract value and maximum consolidated capital expenditures and minimum membership revenue.expenditures. Upon an event of default, which includes certain customary events such as, among other things, a failure to make required payments when due, a failure to comply with covenants, certain bankruptcy and insolvency events, defaults under other material indebtedness or a change in control, the lenders may accelerate amounts outstanding, terminate the agreement and foreclose on all collateral. Our capital expenditures in the fourth quarter of 2014 exceeded the maximum allowable amount under the financial covenant set forth in the financing agreement related to consolidated capital expenditures, and as such, we were not in compliance with this covenant at December 31, 2014. We remedied the noncompliance by obtaining a waiver of non-compliance under the financing agreement from the lender. We were in compliance with all other financial and non-financial covenants at December 31, 2014.
We used a portion of the proceeds from the term loan to retire the $15.0 million of debt that was outstanding under our previous credit facility and to pay bank and lender fees and transaction costs associated with the new financing agreement, resulting in a non-operating loss on debt extinguishment of $0.5 million within the consolidated statement of operations for the year ended December 31, 2014.2016.
Off-Balance Sheet Arrangements
We do not engage in any off-balance sheet activities, other than long-term non-cancellable operating leases as described herein, nor do we maintain any off-balance sheet interests in variable interest entities, special-purpose entities or other structured finance entities.
Contractual Obligations
In the normal course of business, we enter into long-term contractual obligations and commitments, primarily related to debt obligations and non-cancellable operating leases. During the current year, we entered into long-term operating lease agreements with payments due through 2020 for the purposeAs of office space expansion. Additionally, we refinancedDecember 31, 2016, our material contractual obligations consisted of long-term debt during the third quarter of 2014, resulting in the retirement of the previous term loan and revolving credit facility and the issuancecomprised of a new$60.0 million term loan and delayed draw term loan, both of which are scheduled to mature on September 26, 2019. Our contractual cash obligations2019 and long-term non-cancellable operating leases expiring through 2021, as of December 31, 2014 are set forth in the table below.
| | | | | Total | | Less than 1 Year | | 2-3 Years | | 4-5 Years | | More than 5 Years | | Total | | Less than 1 Year | | 2-3 Years | | 4-5 Years | | More than 5 Years |
| Long-term debt obligations | | $ | 79,913 |
| | $ | 4,350 |
| | $ | 13,019 |
| | $ | 62,544 |
| | $ | — |
| |
Long-term debt obligations, including interest(1) | | | $ | 73,781 |
| | $ | 6,733 |
| | $ | 67,048 |
| | $ | — |
| | $ | — |
|
Operating lease obligations | | 10,957 |
| | 2,069 |
| | 3,992 |
| | 4,185 |
| | 711 |
| | 7,112 |
| | 2,134 |
| | 4,234 |
| | 744 |
| | — |
|
| Total contractual obligations | | $ | 90,870 |
| | $ | 6,419 |
| | $ | 17,011 |
| | $ | 66,729 |
| | $ | 711 |
| | $ | 80,893 |
| | $ | 8,867 |
| | $ | 71,282 |
| | $ | 744 |
| | $ | — |
|
| |
| (1) | Represents principal and estimated interest payments to be made over the remaining term of our long-term debt obligation issued in September 2014 and subsequently amended in June and November 2016. In connection with the second amendment to the financing agreement completed in November 2016, the basis for the calculation of the applicable interest rate was modified such that the rate is now contingent upon our performance in relation to certain predetermined qualified cash and consolidated EBITDA thresholds. As such, we utilized an estimate of the applicable interest rate in effect following the release of our financial results for the period ended December 31, 2016, 8.75%, in determining the estimated interest payments included in the long-term debt obligation amounts presented in the table above. See Note 8, “Debt and Credit Arrangements,” in the accompanying Notes to Consolidated Financial Statements included in Item 8 of this Form 10-K for additional information. |
| |
| (2) | Represents future payments due under long-term non-cancellable operating leases expiring through 2021. See Note 9, “Commitments and Contingencies,” in the accompanying Notes to Consolidated Financial Statements included in Item 8 of this Form 10-K for additional information. |
Critical Accounting Policies and Estimates
Our financial statements are prepared in accordance with accounting principles generally accepted in the United States, or U.S. GAAP. The preparation of the consolidated financial statements requires us to make estimates and assumptions that affectimpact the reported amounts of assets, liabilities, revenue, expenses and related disclosures. We evaluate our estimates and assumptions on an ongoing basis. Our estimates are based on historical experience and various other assumptions that we believe to be reasonable under the circumstances. Our actual results could differ from these estimates.
We believe the following critical accounting policies represent areas that entail significant management judgment or estimates in the preparation of our consolidated financial statements. For a complete summary of the accounting policies we deem to be significant, see Note 1, “Description of Business, Basis of Presentation and Summary of Significant Accounting Policies,” in the accompanying Notes to Consolidated Financial Statements included in Item 8 of this Form 10-K.
Membership Revenue RecognitionCapitalized Website and Software Development Costs
As of December 31, 2016 and 2015, our gross capitalized website and software development costs amounted to $60.8 million and $47.9 million, respectively. In accordance with authoritative guidance, we begin to capitalize website and software development costs for internal use when planning and design efforts are successfully completed and development is ready to commence. Costs incurred during planning and design, together with costs incurred for training and maintenance, are expensed as incurred and recorded in product and technology expense within the consolidated statements of operations. We place capitalized website and software development assets into service and commence depreciation/amortization when the applicable project or asset is substantially complete and ready for its intended use. Once placed into service, we capitalize qualifying costs of specified upgrades or enhancements to capitalized website and software development assets when the upgrade or enhancement will result in additional functionality.
We recognize revenue when all of the following conditions are met: there is persuasive evidence of an arrangement, the service has been providedcapitalize internal labor costs, including compensation, benefits and payroll taxes, incurred for certain capitalized website and software development projects related to the customer, the collection of fees is reasonably assured and the amount of fees to be paid by the customer is fixed or determinable.our technology platform. Our primary revenue streams are membership revenue, which includes membership fees for monthly, annual and multi-year memberships as well as, in certain cases, one-time, nonrefundable enrollment fees, and service provider revenue, which is derived from service provider advertising and e-commerce marketplace transactions.
Revenue from membership fees is recognized ratably on a straight-line basis over the contractual term of the associated subscription. In 2014, we terminated our historical practice of charging one-time, non-refundable enrollment fees in connection with monthly memberships and the lowest cost annual memberships in less penetrated markets. For those one-time, non-refundable enrollment fees charged prior to termination, revenue is deferred and recognized on a straight-line basis over an estimated average membership life of 80 months for annual or multi-year members and 13 months for monthly members, which is based on our historical membership experience. We review estimated average membership lives on an annual basis, or more frequently if circumstances change. Changes in member behavior, performance, competition or economic conditions may cause attrition levels to change, which could impact estimated average membership lives. Accordingly, estimates made by uspolicy with respect to average membership lives may differ from actual lives,capitalized internal labor stipulates that labor costs for employees working on eligible internal use capital projects are capitalized as part of the historical cost of the project when the impact, as compared to expensing such labor costs, is material. As of December 31, 2016 and 2015, cumulative internal labor costs amounting to $17.6 million and $11.1 million, respectively, were recorded as capitalized website and software development costs and included in the balance of property, equipment and software reflected in the consolidated balance sheets.
We also capitalized a portion of the interest on funds borrowed in relation to the development of our technology platform. Our policy with respect to capitalized interest specifies that interest costs on eligible long-term internal use capital projects are capitalized as part of the historical cost of the project when the impact, as compared to expensing such differences could impact membership revenue. A change in estimated average membership lives by oneinterest costs, is material. For the year in either direction would not have a material impact on revenue.ended December 31, 2016, total interest costs incurred amounted to $5.6 million, of which $0.9 million was recorded as capitalized website and software development costs. For the year ended December 31, 2015, total interest costs incurred amounted to $5.1 million, of which $2.2 million was recorded as capitalized website and software development costs. For the year ended December 31, 2014, total interest costs incurred amounted to $2.6 million, of which $1.4 million was recorded as capitalized website and software development costs.
Stock-Based Compensation
We measure stock-based compensation expense for personnel atDetermining the fair value of an employee share-based payment award requires significant judgment. All share-based payments to employees, including grants of stock options, restricted stock units (“RSUs”) and performance awards of restricted stock units (“PRSUs”), are measured based on the grant date fair value of the award and recognize thatawards, with the resulting expense net of estimated forfeitures,generally recognized on a straight-line basis, subject to certain limited exceptions, over the requisiteperiod during which the employee is required to perform service period. Determiningin exchange for the fair value of an award requires judgment.award.
We estimate the fair value of stock-based paymentstock option awards using the Black-Scholes option-pricing model. The determination of the fair value of a stock-basedstock option award on the date of grant using the Black-Scholes option-pricing model is impacted by our stock price on the grant date of grant as well as assumptions regarding a number of complex and subjective variables. These variables include our expected stock price volatility over the expected term of the award, actual and projected employee stock-basedshare-based payment award exercise behaviors, the risk-free interest rate for the expected term of the award and expected dividends. The value of the portion of the award that is ultimately expected to vest is recognized as an expense in our consolidated statements of operations.
The following table summarizes the weighted-average grant date fair value and the weighted-average assumptions utilized to estimate the fair value forof stock options granted during 20142016 and 2013:2015:
| | | | | 2014 | | 2013 | | 2016 | | 2015 |
| Dividend yield | | — | % | | — | % | | 0 | % | | 0 | % |
| Volatility | | 53.0 | % | | 57.0 | % | | 64.6 | % | | 53.1 | % |
| Risk-free interest rate | | 1.67 | % | | 1.02 | % | | 1.26 | % | | 1.48 | % |
| Expected term, in years | | 5.00 |
| | 4.90 |
| | 5.00 |
| | 5.00 |
|
| Weighted-average estimated fair value of options granted during the year | | $ | 5.12 |
| | $ | 9.38 |
| |
| Weighted-average grant date fair value | | | $ | 4.76 |
| | $ | 2.95 |
|
We utilize an expected dividend rateyield of zero based on the fact that we currentlydo not have noa history or current expectation of paying cash dividends on our stock. As our common stock was never publicly traded prior to November 17, 2011, we estimated the expected volatility of our awards based on historical volatilities for publicly traded common stock of comparable peer companies with similarities in size, lines of business, market capitalization, revenue or financial leverage over the estimated expected life of the stock options. The risk-free interest rate is based on yields of U.S. Treasury securities with a maturity similar to the estimated expected term of the stock options. The expected term represents the period of time the stock options are expected to be outstanding based on our historical experience. Prior to 2016, the expected volatility assumption was estimated based on historical volatilities for publicly traded common stock of comparable peer companies with similarities in size, lines of business, market capitalization, revenue or financial leverage over the estimated expected life of the stock options. As we believe there is now sufficient historical data available with respect to the volatility of our common stock, effective January 1, 2016, we began utilizing our own historical volatility data for the volatility input to our calculation of the estimated fair value of stock option awards, which yielded an increase to the weighted-average volatility assumption year over year.
RSUs are measured based on the fair market value of the underlying stock on the date of grant and typically vest over a period of four years from the date of grant. Once vested, shares will generally either be issued net of the applicable tax withholding requirements to be paid by us on behalf of employees, or a portion of the shares issued will subsequently be sold by employees to satisfy the tax obligations created by the vesting of RSUs.
The PRSUs granted during 2015 to Scott A. Durchslag, our President and Chief Executive Officer, are market condition performance share-based payment awards that are earned and vest in separate tranches, contingent upon our achievement of certain predetermined stock price targets. We estimated the fair value of the PRSUs granted to Mr. Durchslag as of the date of grant using a Monte Carlo option-pricing simulation model, and we are recognizing stock-based compensation expense over the requisite service period of the award. Key inputs to the valuation included the fair market value of our underlying stock on the grant date, our expected stock price volatility over the expected term of the award and the risk-free interest rate for the expected term of the award. The PRSUs granted during 2016 to our executive officers and other members of our senior leadership team are subject to our performance with respect to certain predetermined performance conditions over a defined performance period. These share-based payment awards were measured based on the fair market value of the underlying stock on the date of grant, and we are recognizing stock-based compensation expense, if any, over the vesting period based on the projected probability of achievement of the performance conditions as of the end of each reporting period during the performance period. As necessary, we may periodically adjust the recognition of such expense in response to changes in our forecasts with respect to the performance conditions. Once vested, shares earned under PRSU awards will generally either be issued net of the applicable tax withholding requirements to be paid by us on behalf of employees, or a portion of the shares issued will subsequently be sold by employees to satisfy the tax obligations created by the vesting of PRSUs.
In connection with our adoption of Accounting Standards Update 2016-09 (see Note 1, “Description of Business, Basis of Presentation and Summary of Significant Accounting Policies,” in the accompanying Notes to Consolidated Financial Statements included in Item 8 of this Form 10-K for additional information) during 2016, we elected to begin accounting for forfeitures of share-based payment awards as they occur in lieu of the previous practice of estimating the number of awards expected to be forfeited and adjusting the estimate when it was no longer probable that the corresponding service condition would be fulfilled.
The assumptions utilized in calculating the fair value of employee share-based payment awards represent our best estimates at the time of grant, but such estimates involve inherent uncertainties and the application of judgment. If actual results differ from our estimates, or we determine it is necessary to utilize different assumptions with respect to the valuation of share-based payment awards, our stock-based compensation expense could be materially different in the future.
Loss Contingencies
We are involved, from time to time, in various lawsuits, claims, investigations and other legal and regulatory proceedings, both as a plaintiff and as a defendant, related to our business and operations. Certain of these matters include speculative claims for substantial or indeterminate amounts of damages. We evaluate the likelihood of any judgments or outcomes with respect to these matters and determine loss contingency assessments on a gross basis after considering the probability of incurrence of a loss and whether a loss is reasonably estimable. In addition, we consider other relevant factors that could impact our ability to reasonably estimate a loss. A 10%determination of the amount of reserves required, if any, for these contingencies is made after analyzing each matter. Our reserves may change in the future due to new developments or changes in strategy in handling these matters. We record a liability when we believe it is both probable that a loss has been incurred and the amount can be reasonably estimated. If we determine a loss is possible and a range of loss can be reasonably estimated, we disclose the range of the possible loss in the Notes to Consolidated Financial Statements.
Significant judgment is required to determine probability or possibility, as well as the estimated amount, as applicable, of a loss contingency. On at least a quarterly basis, as necessary, we review and evaluate developments with respect to our legal matters that could impact the amount of an associated liability previously accrued as well as the related ranges of possible losses disclosed and make adjustments and changes as appropriate. For example, during the first quarter of 2016, we recorded a $3.5 million contingent legal liability for the Moore litigation and related cases in connection with the settlement of this matter, representing our best estimate of the costs to be incurred as of that date. Each quarter thereafter, we reviewed the activity and any new developments under the Moore settlement to determine if an adjustment to the contingent liability previously recorded was necessary, and during the fourth quarter of 2016, our evaluation yielded a conclusion that such an adjustment was needed following completion of the election period for settlement class members, resulting in a $0.7 million reduction to our accrual for this matter, bringing our best estimate of loss to $2.8 million as of December 31, 2016.
As the outcome of litigation is inherently uncertain, if one or more legal matters are resolved against us for amounts in excess of our expectations, our business or consolidated financial statements could be materially adversely affected.
Income Taxes
We are subject to corporate federal and state income taxes in the United States at prevailing corporate rates. Income taxes are accounted for under the asset and liability method. Under this method, we accrue income taxes payable or refundable and recognize deferred tax assets and liabilities based on differences between the book and tax basis of assets and liabilities. We measure deferred tax assets and liabilities using enacted rates in effect for the years in which the differences are expected to reverse and recognize the effect of a change in enacted rates in the period of enactment. Significant judgment is required in evaluating our uncertain tax positions, as applicable, and determining our provision for income taxes and recording the related income tax assets and liabilities.
After determining the total amount of deferred tax assets, we determine whether it is more likely than not that some portion of the deferred tax assets will not be realized. If we conclude that a deferred tax asset is not likely to be realized, a valuation allowance is established against that asset to record it at its expected realizable value. As of December 31, 2016, we recorded a full valuation allowance on our deferred tax assets. We generated a pre-tax book net loss of $7.8 million for the year ended December 31, 2016, and aside from the year ended December 31, 2015, we have incurred a pre-tax book net loss in each year since our inception. Further, we had accumulated deficits of $262.0 million and $254.2 million as of December 31, 2016 and December 31, 2015, respectively. We are also in a three-year cumulative pre-tax net loss position, amounting to $9.6 million, and when considered in the context of future reversals of existing taxable temporary differences, projected future taxable income and tax planning strategies, we believe there is significant negative evidence justifying the presence of a valuation allowance. We periodically review deferred tax assets for recoverability, and should there be a change in our ability to recover deferred tax assets, the tax provision would be adjusted in the period in which the assessment changed.
We establish assets and liabilities for uncertain positions taken or expected to be taken in income tax returns using a more-likely-than-not recognition threshold, and we include in income tax expense any interest and penalties related to uncertain tax positions. We recognize the financial statement benefit of a tax position only after determining the relevant tax authority would more likely than not sustain the position following an audit. We concluded that we have no unrecognized tax benefits to be recorded for the year ended December 31, 2016.
Our effective tax rate has historically varied from the statutory rate, primarily due to the tax impact of state income taxes, stock-based compensation expense, incurredresearch and development credits and the valuation allowance. Our future provision for income taxes could be adversely impacted by adjustments to the valuation of our deferred tax assets or liabilities, including the valuation allowance, or changes in either direction would not have a material impact ontax laws, regulations or accounting principles and interpretations. We are subject to examination of our income tax returns by tax authorities in the consolidated statementsUnited States, and we regularly assess the likelihood of operations.adverse outcomes resulting from these examinations in determining the adequacy of our provision for income taxes.
Recent Accounting Pronouncements
For detailed information regarding recently issued accounting pronouncements and the expected impact on our consolidated financial statements, see Note 1, “Summary“Description of Business, Basis of Presentation and Summary of Significant Accounting Policies”Policies,” in the accompanying Notes to Consolidated Financial Statements included in Item 8 of this Form 10-K.
ITEM 7A. QUANTITATIVE AND QUALITATIVE DISCLOSURES ABOUT MARKET RISK
We are exposed to market risks in the ordinary course of business, including risks associated with interest rate and inflation rate fluctuations.business. Quantitative and qualitative disclosures about thesesuch market risks are set forth below.
Interest Rate Fluctuations
As of December 31, 2014,2016, we had $40.0$22.4 million in cash and cash equivalents and $24.3$16.5 million in short-term investments. Cash and cash equivalents consists of bank deposit accounts and money market funds as well as any investments in corporate bonds or certificates of deposit, U.S. Treasury securities or corporate bonds with contractual maturities of three months or less, which, at times, may exceed federally insured limits. Short-term investments consist of corporate bonds and certificates of deposit, U.S. Treasury securities and corporate bonds with maturities of more than 90 days but less than one year. We possess the ability and intent to hold these investments to maturity, and we do not make investments for trading or speculative purposes. We are paid interest on our deposits at variable rates and receive interest payments on held-to-maturity investments at fixed rates. Declines in interest rates may reduce future investment income on these deposits. Givenour deposits and could also negatively impact the fair value of our held-to-maturity investments. As we possess both the ability and intent to hold our investments to maturity, such interest rate declines would have no impact on our results of operations. Further, given their short-term maturities, we believe our cash and cash equivalents, which are primarily utilized for working capital purposes, are relatively insensitive to interest rate fluctuations. Further,Based on a sensitivity analysis, we do not believe that a hypothetical 10%1% (100 basis points) or 5% (500 basis points) increase or decrease in interest rates as of December 31, 20142016 would materially impact our investment income or portfolio of investments. Any gains or losses resulting from such fluctuations would only be realized to the extent we sold the investments prior to maturity.
In September 2014, we entered into a financing agreement that providesprovided for a $60.0 million term loan and a $25.0 million delayed draw term loan. The financing agreement was subsequently amended in June 2016 and again in November 2016, and the basis for the calculation of the applicable interest rate was modified by these amendments. Amounts outstanding under the financing agreement bear interest at a per annum rate, atas outlined in Note 8, “Debt and Credit Arrangements,” in the optionaccompanying Notes to Consolidated Financial Statements included in Item 8 of us, equal to (i) the LIBOR rate for the interest period in effect, subject to a floor of 0.5%, plus 6.75% or (ii) the reference rate, which is based on the prime rate as published by the Wall Street Journal, subject to a floor of 3.25%, plus 5.75%.this Form 10-K. The financing agreement requires monthly interest-only payments on the first business day of each month until maturity on any principal amounts outstanding under either debt facility. As of December 31, 2014,2016, we had $58.9$57.6 million in outstanding net borrowings under the term loan and available creditavailability of $25.0 million under the delayed draw term loan. We do not believe a hypothetical 10% increaseThe fair value of our long-term debt will fluctuate should there be movements in interest rates with respectapplicable to our long-term debt in the future, increasing in periods of declining rates of interest and declining in periods of increasing rates of interest. A hypothetical 1% (100 basis points) or 5% (500 basis points) increase in the interest rate applicable to our long-term debt as of December 31, 2016, utilizing a rate of 8.75% as the base rate, would materially impactyield an additional $1.6 million and $7.9 million in interest expense, respectively, over the remaining life of our business, financial condition or resultsoutstanding long-term debt, which matures in September of operations.2019.
Inflation Rate Fluctuations
If our costsexpenses were to become subject to significant inflationary pressures, we may not be able to fully offset such higher costs with corresponding price increases. We do not believe that inflation has materially impacted our business, financial condition or results of operations.operations to date.
ITEM 8. FINANCIAL STATEMENTS AND SUPPLEMENTARY DATA
INDEX TO CONSOLIDATED FINANCIAL STATEMENTS
Angie’s List, Inc.
Consolidated Financial Statements
Years Ended December 31, 2014, 20132016, 2015 and 20122014
Report of Independent Registered Public Accounting Firm
The Board of Directors and Stockholders of Angie’s List, Inc.
We have audited the accompanying consolidated balance sheets of Angie’s List, Inc. as of December 31, 20142016 and 2013,2015, and the related consolidated statements of operations, stockholders’ equity (deficit) and cash flows for each of the three years in the period ended December 31, 2014.2016. These financial statements are the responsibility of the Company’s management. Our responsibility is to express an opinion on these financial statements based on our audits.
We conducted our audits in accordance with the standards of the Public Company Accounting Oversight Board (United States). Those standards require that we plan and perform the audit to obtain reasonable assurance about whether the financial statements are free of material misstatement. An audit includes examining, on a test basis, evidence supporting the amounts and disclosures in the financial statements. An audit also includes assessing the accounting principles used and significant estimates made by management, as well as evaluating the overall financial statement presentation. We believe that our audits provide a reasonable basis for our opinion.
In our opinion, the financial statements referred to above present fairly, in all material respects, the consolidated financial position of Angie’s List, Inc. at December 31, 20142016 and 2013,2015, and the consolidated results of its operations and its cash flows for each of the three years in the period ended December 31, 2014,2016, in conformity with U.S. generally accepted accounting principles.
We also have audited, in accordance with the standards of the Public Company Accounting Oversight Board (United States), Angie’s List, Inc.’s internal control over financial reporting as of December 31, 2014,2016, based on criteria established in Internal Control-Integrated Framework issued by the Committee of Sponsoring Organizations of the Treadway Commission "(2013(2013 framework)" and our report dated February 25, 201521, 2017 expressed an unqualified opinion thereon.
/s/ Ernst & Young LLP
Indianapolis, Indiana
February 25, 201521, 2017
Angie’s List, Inc.
Consolidated Balance Sheets
(in thousands, except share data)
| | | | | December 31, | | December 31, |
| | | 2014 | | 2013 | | 2016 | | 2015 |
| Assets | | | | | | | | |
| Cash and cash equivalents | | $ | 39,991 |
| | $ | 34,803 |
| | $ | 22,402 |
| | $ | 32,599 |
|
| Short-term investments | | 24,268 |
| | 21,055 |
| | 16,541 |
| | 23,976 |
|
| Accounts receivable, net of allowance for doubtful accounts of $1,651 and $1,107 at December 31, 2014 and 2013 | | 15,141 |
| | 12,385 |
| |
| Accounts receivable, net of allowance for doubtful accounts of $3,296 and $1,658 at December 31, 2016 and 2015, respectively | | | 16,371 |
| | 17,019 |
|
| Prepaid expenses and other current assets | | 18,120 |
| | 13,701 |
| | 17,002 |
| | 19,026 |
|
| Total current assets | | 97,520 |
| | 81,944 |
| | 72,316 |
| | 92,620 |
|
| Property, equipment and software, net | | 51,264 |
| | 18,657 |
| | 82,714 |
| | 77,635 |
|
| Goodwill | | 1,145 |
| | 1,145 |
| | 1,145 |
| | 1,145 |
|
| Amortizable intangible assets, net | | 2,755 |
| | 3,500 |
| | 1,219 |
| | 2,011 |
|
| Other assets, noncurrent | | 1,854 |
| | 397 |
| |
| Total assets | | $ | 154,538 |
| | $ | 105,643 |
| | $ | 157,394 |
| | $ | 173,411 |
|
| | | | | | | | | |
| Liabilities and stockholders’ deficit | | | | | |
| Liabilities and stockholders’ equity (deficit) | | | | | |
| Accounts payable | | $ | 5,490 |
| | $ | 6,838 |
| | $ | 2,886 |
| | $ | 10,525 |
|
| Accrued liabilities | | 23,189 |
| | 21,770 |
| | 23,128 |
| | 20,287 |
|
| Deferred membership revenue | | 33,767 |
| | 35,560 |
| | 23,208 |
| | 32,702 |
|
| Deferred advertising revenue | | 48,399 |
| | 39,448 |
| | 42,297 |
| | 48,930 |
|
| Current maturities of long-term debt | | | 1,500 |
| | 1,500 |
|
| Total current liabilities | | 110,845 |
| | 103,616 |
| | 93,019 |
| | 113,944 |
|
| Long-term debt, net | | 58,854 |
| | 14,918 |
| | 56,142 |
| | 56,134 |
|
| Deferred membership revenue, noncurrent | | 4,744 |
| | 4,909 |
| | 2,032 |
| | 3,742 |
|
| Deferred advertising revenue, noncurrent | | 669 |
| | 521 |
| | 456 |
| | 640 |
|
| Other liabilities, noncurrent | | 1,600 |
| | 169 |
| | 1,245 |
| | 1,332 |
|
| Total liabilities | | 176,712 |
| | 124,133 |
| | 152,894 |
| | 175,792 |
|
| Commitments and contingencies (Note 9) | | — |
| | — |
| | — |
| | — |
|
| Stockholders’ deficit: | | | | | |
| Preferred stock, $0.001 par value: 10,000,000 shares authorized, no shares issued or outstanding at December 31, 2014 and December 31, 2013 | | — |
| | — |
| |
| Common stock, $0.001 par value: 300,000,000 shares authorized, 67,075,389 and 67,014,757 shares issued and 58,516,677 and 58,456,045 shares outstanding at December 31, 2014 and December 31, 2013, respectively | | 67 |
| | 67 |
| |
| Stockholders’ equity (deficit): | | | | | |
| Preferred stock, $0.001 par value: 10,000,000 shares authorized, no shares issued or outstanding at December 31, 2016 and 2015 | | | — |
| | — |
|
| Common stock, $0.001 par value: 300,000,000 shares authorized, 67,979,486 and 67,162,990 shares issued and 59,420,774 and 58,604,278 shares outstanding at December 31, 2016 and 2015, respectively | | | 68 |
| | 67 |
|
| Additional paid-in-capital | | 265,895 |
| | 257,505 |
| | 290,182 |
| | 275,445 |
|
| Treasury stock, at cost: 8,558,712 shares of common stock at December 31, 2014 and December 31, 2013 | | (23,719 | ) | | (23,719 | ) | |
| Treasury stock, at cost: 8,558,712 shares of common stock at December 31, 2016 and 2015 | | | (23,719 | ) | | (23,719 | ) |
| Accumulated deficit | | (264,417 | ) | | (252,343 | ) | | (262,031 | ) | | (254,174 | ) |
| Total stockholders’ deficit | | (22,174 | ) | | (18,490 | ) | |
| Total liabilities and stockholders’ deficit | | $ | 154,538 |
| | $ | 105,643 |
| |
| Total stockholders’ equity (deficit) | | | 4,500 |
| | (2,381 | ) |
| Total liabilities and stockholders’ equity (deficit) | | | $ | 157,394 |
| | $ | 173,411 |
|
See accompanying notes.
Angie’s List, Inc.
Consolidated Statements of Operations
(in thousands, except share and per share data)
| | | | | Year Ended December 31, | | Year Ended December 31, |
| | | 2014 | | 2013 | | 2012 | | 2016 | | 2015 | | 2014 |
| Revenue | | | | | | | | | | | | |
| Membership | | $ | 73,113 |
| | $ | 65,307 |
| | $ | 47,717 |
| | $ | 58,090 |
| | $ | 67,992 |
| | $ | 73,113 |
|
| Service provider | | 241,898 |
| | 180,335 |
| | 108,082 |
| | 265,239 |
| | 276,133 |
| | 241,898 |
|
| Total revenue | | 315,011 |
| | 245,642 |
| | 155,799 |
| | 323,329 |
| | 344,125 |
| | 315,011 |
|
| Operating expenses | | | | | | | | | | | | |
| Operations and support | | 52,760 |
| | 40,072 |
| | 27,081 |
| | 40,293 |
| | 56,074 |
| | 52,760 |
|
| Selling | | 117,176 |
| | 90,143 |
| | 58,596 |
| | 111,046 |
| | 116,027 |
| | 115,210 |
|
| Marketing | | 87,386 |
| | 87,483 |
| | 80,230 |
| | 65,140 |
| | 83,789 |
| | 96,953 |
|
| Product and technology | | 34,039 |
| | 27,570 |
| | 16,870 |
| | 55,990 |
| | 36,661 |
| | 34,039 |
|
| General and administrative | | 34,012 |
| | 31,455 |
| | 24,055 |
| | 53,954 |
| | 38,316 |
| | 26,411 |
|
| Operating loss | | (10,362 | ) | | (31,081 | ) | | (51,033 | ) | |
| Operating income (loss) | | | (3,094 | ) | | 13,258 |
| | (10,362 | ) |
| Interest expense, net | | 1,203 |
| | 1,868 |
| | 1,856 |
| | 4,720 |
| | 2,971 |
| | 1,203 |
|
| Loss on debt extinguishment | | 458 |
| | — |
| | — |
| | — |
| | — |
| | 458 |
|
| Loss before income taxes | | (12,023 | ) | | (32,949 | ) | | (52,889 | ) | |
| Income (loss) before income taxes | | | (7,814 | ) | | 10,287 |
| | (12,023 | ) |
| Income tax expense | | 51 |
| | 40 |
| | 5 |
| | 43 |
| | 44 |
| | 51 |
|
| Net loss | | (12,074 | ) | | (32,989 | ) | | (52,894 | ) | |
| Net loss per common share — basic and diluted | | $ | (0.21 | ) | | $ | (0.57 | ) | | $ | (0.92 | ) | |
| Weighted average number of common shares outstanding — basic and diluted | | 58,510,106 |
| | 58,230,927 |
| | 57,485,589 |
| |
| Net income (loss) | | | $ | (7,857 | ) | | $ | 10,243 |
| | $ | (12,074 | ) |
| | | | | | | | |
| Net income (loss) per common share — basic | | | $ | (0.13 | ) | | $ | 0.18 |
| | $ | (0.21 | ) |
| Net income (loss) per common share — diluted | | | $ | (0.13 | ) | | $ | 0.17 |
| | $ | (0.21 | ) |
| | | | | | | | |
| Weighted-average number of common shares outstanding — basic | | | 58,860,152 |
| | 58,520,546 |
| | 58,510,106 |
|
| Weighted-average number of common shares outstanding — diluted | | | 58,860,152 |
| | 58,782,889 |
| | 58,510,106 |
|
See accompanying notes.
Angie’s List, Inc.
Consolidated Statements of Stockholders’ Equity (Deficit)
(in thousands)
| | | | | Preferred Stock | | Common Stock | | Additional Paid- In Capital | | Treasury Stock | | Accumulated Deficit | | Total Equity (Deficit) | | Preferred Stock | | Common Stock | | Additional Paid- In-Capital | | Treasury Stock | | Accumulated Deficit | | Total Equity (Deficit) |
| Balance at December 31, 2011 | | $ | — |
| | $ | 65 |
| | $ | 235,950 |
| | $ | (23,719 | ) | | $ | (166,460 | ) | | $ | 45,836 |
| |
| Net loss | | — |
| | — |
| | — |
| | — |
| | (52,894 | ) | | (52,894 | ) | |
| Issuance of common stock, net of costs | | — |
| | 1 |
| | 8,626 |
| | — |
| | — |
| | 8,627 |
| |
| Stock-based compensation | | — |
| | — |
| | 2,943 |
| | — |
| | — |
| | 2,943 |
| |
| Exercise of stock options and warrants | | — |
| | — |
| | 807 |
| | — |
| | — |
| | 807 |
| |
| Balance at December 31, 2012 | | $ | — |
| | $ | 66 |
| | $ | 248,326 |
| | $ | (23,719 | ) | | $ | (219,354 | ) | | $ | 5,319 |
| |
| Net loss | | — |
| | — |
| | — |
| | — |
| | (32,989 | ) | | (32,989 | ) | |
| Stock-based compensation | | — |
| | — |
| | 4,064 |
| | — |
| | — |
| | 4,064 |
| |
| Exercise of stock options | | — |
| | 1 |
| | 5,115 |
| | — |
| | — |
| | 5,116 |
| |
| Balance at December 31, 2013 | | $ | — |
| | $ | 67 |
| | $ | 257,505 |
| | $ | (23,719 | ) | | $ | (252,343 | ) | | $ | (18,490 | ) | | $ | — |
| | $ | 67 |
| | $ | 257,505 |
| | $ | (23,719 | ) | | $ | (252,343 | ) | | $ | (18,490 | ) |
| Net loss | | — |
| | — |
| | — |
| | — |
| | (12,074 | ) | | (12,074 | ) | | — |
| | — |
| | — |
| | — |
| | (12,074 | ) | | (12,074 | ) |
| Stock-based compensation | | — |
| | — |
| | 7,889 |
| | — |
| | — |
| | 7,889 |
| |
| Non-cash stock-based compensation expense | | | — |
| | — |
| | 7,889 |
| | — |
| | — |
| | 7,889 |
|
| Exercise of stock options | | — |
| | — |
| | 501 |
| | — |
| | — |
| | 501 |
| | — |
| | — |
| | 501 |
| | — |
| | — |
| | 501 |
|
| Balance at December 31, 2014 | | $ | — |
| | $ | 67 |
| | $ | 265,895 |
| | $ | (23,719 | ) | | $ | (264,417 | ) | | $ | (22,174 | ) | | $ | — |
| | $ | 67 |
| | $ | 265,895 |
| | $ | (23,719 | ) | | $ | (264,417 | ) | | $ | (22,174 | ) |
| Net income | | | — |
| | — |
| | — |
| | — |
| | 10,243 |
| | 10,243 |
|
| Non-cash stock-based compensation expense | | | — |
| | — |
| | 8,875 |
| | — |
| | — |
| | 8,875 |
|
| Exercise of stock options | | | — |
| | — |
| | 675 |
| | — |
| | — |
| | 675 |
|
| Balance at December 31, 2015 | | | $ | — |
| | $ | 67 |
| | $ | 275,445 |
| | $ | (23,719 | ) | | $ | (254,174 | ) | | $ | (2,381 | ) |
| Net loss | | | — |
| | — |
| | — |
| | — |
| | (7,857 | ) | | (7,857 | ) |
| Non-cash stock-based compensation expense | | | — |
| | — |
| | 14,744 |
| | — |
| | — |
| | 14,744 |
|
| Issuance of common stock for settlement of share-based awards | | | — |
| | 1 |
| | — |
| | — |
| | — |
| | 1 |
|
| Issuance of common stock for employee stock purchase plan | | | — |
| | — |
| | 476 |
| | — |
| | — |
| | 476 |
|
| Exercise of stock options | | | — |
| | — |
| | 2,047 |
| | — |
| | — |
| | 2,047 |
|
| Shares withheld for taxes on settlement of share-based awards | | | — |
| | — |
| | (2,530 | ) | | — |
| | — |
| | (2,530 | ) |
| Balance at December 31, 2016 | | | $ | — |
| | $ | 68 |
| | $ | 290,182 |
| | $ | (23,719 | ) | | $ | (262,031 | ) | | $ | 4,500 |
|
See accompanying notes.
Angie’s List, Inc.
Consolidated Statements of Cash Flows
| | | | | Year Ended December 31, | | Year Ended December 31, |
| | | 2014 | | 2013 | | 2012 | | 2016 | | 2015 | | 2014 |
| Operating activities | | | | | | | | | | | | |
| Net loss | | $ | (12,074 | ) | | $ | (32,989 | ) | | $ | (52,894 | ) | |
| Adjustments to reconcile net loss to net cash provided by (used in) operating activities: | | | | | | |
| |
| Net income (loss) | | | $ | (7,857 | ) | | $ | 10,243 |
| | $ | (12,074 | ) |
| Adjustments to reconcile net income (loss) to net cash provided by operating activities: | | | | | | | |
|
| Depreciation and amortization | | 5,576 |
| | 4,069 |
| | 2,753 |
| | 13,148 |
| | 6,402 |
| | 5,576 |
|
| Amortization of debt discount, deferred financing fees and bond premium | | | 663 |
| | 697 |
| | 478 |
|
| Non-cash stock-based compensation expense | | | 14,744 |
| | 8,875 |
| | 7,889 |
|
| Non-cash loss on debt extinguishment | | | — |
| | — |
| | 266 |
|
| Non-cash long-lived asset impairment charge | | 1,778 |
| | — |
| | — |
| | — |
| | 1,578 |
| | 1,778 |
|
| Non-cash loss on disposal of long-lived assets | | | 173 |
| | 300 |
| | — |
|
| Deferred income taxes | | 11 |
| | 6 |
| | 5 |
| | 22 |
| | 17 |
| | 11 |
|
| Amortization of debt discount, deferred financing fees and bond premium | | 478 |
| | 527 |
| | 312 |
| |
| Non-cash loss on debt extinguishment | | 266 |
| | — |
| | — |
| |
| Non-cash stock-based compensation expense | | 7,889 |
| | 4,064 |
| | 2,943 |
| |
| Bad debt expense | | 5,028 |
| | 3,773 |
| | 1,955 |
| | 7,404 |
| | 5,746 |
| | 5,028 |
|
| Changes in certain assets: | | | | | | |
| | | | | | |
|
| Accounts receivable | | (7,784 | ) | | (8,371 | ) | | (5,805 | ) | | (6,756 | ) | | (7,624 | ) | | (7,784 | ) |
| Prepaid expenses and other current assets | | (4,419 | ) | | 6,159 |
| | (7,975 | ) | | 2,024 |
| | (906 | ) | | (4,419 | ) |
| Changes in certain liabilities: | | | | | | |
| | | | | | |
|
| Accounts payable | | (2,952 | ) | | (1,151 | ) | | 1,223 |
| | (6,717 | ) | | 5,467 |
| | (2,952 | ) |
| Accrued liabilities | | 3,691 |
| | 7,712 |
| | 3,541 |
| | 2,808 |
| | (2,539 | ) | | 3,691 |
|
| Deferred advertising revenue | | 9,099 |
| | 16,595 |
| | 9,492 |
| | (6,817 | ) | | 502 |
| | 9,099 |
|
| Deferred membership revenue | | (1,958 | ) | | 8,512 |
| | 11,053 |
| | (11,204 | ) | | (2,067 | ) | | (1,958 | ) |
| Net cash provided by (used in) operating activities | | 4,629 |
| | 8,906 |
| | (33,397 | ) | |
| Net cash provided by operating activities | | | 1,635 |
| | 26,691 |
| | 4,629 |
|
| | | | | | | | | | | | | |
| Investing activities | | | | | | | | | | | | |
| Restricted cash | | — |
| | — |
| | 250 |
| |
| Purchases of investments | | (26,671 | ) | | (32,814 | ) | | (10,491 | ) | | (17,474 | ) | | (24,537 | ) | | (26,671 | ) |
| Sales of investments | | 23,360 |
| | 21,978 |
| | — |
| | 24,891 |
| | 24,766 |
| | 23,360 |
|
| Acquisition of business assets | | — |
| | (2,150 | ) | | — |
| |
| Property, equipment and software | | (16,735 | ) | | (7,102 | ) | | (9,730 | ) | | (4,932 | ) | | (9,075 | ) | | (16,735 | ) |
| Capitalized website and software development costs | | (20,122 | ) | | (1,000 | ) | | — |
| | (13,693 | ) | | (25,193 | ) | | (20,122 | ) |
| Intangible assets | | (984 | ) | | (769 | ) | | (2,035 | ) | | (171 | ) | | (498 | ) | | (984 | ) |
| Net cash used in investing activities | | (41,152 | ) | | (21,857 | ) | | (22,006 | ) | |
| Net cash (used in) investing activities | | | (11,379 | ) | | (34,537 | ) | | (41,152 | ) |
| | | | | | | | | | | | | |
| Financing activities | | | | | | | | | | | | |
| Proceeds from exercise of stock options | | 501 |
| | 5,116 |
| | 807 |
| | 2,047 |
| | 675 |
| | 501 |
|
| Proceeds from employee stock purchase plan | | | 476 |
| | — |
| | — |
|
| Taxes paid on behalf of employees related to net share settlement | | | (2,529 | ) | | — |
| | — |
|
| Principal payments on long-term debt | | (15,000 | ) | | — |
| | — |
| | — |
| | — |
| | (15,000 | ) |
| Proceeds from long-term debt issuance | | 60,000 |
| | — |
| | — |
| | — |
| | — |
| | 60,000 |
|
| Fees paid to lender | | (1,210 | ) | | — |
| | — |
| | (212 | ) | | — |
| | (1,210 | ) |
| Cash paid for financing fees | | (1,957 | ) | | — |
| | — |
| | — |
| | — |
| | (1,957 | ) |
| Payment of contingent consideration from acquisition of business assets | | (500 | ) | | — |
| | — |
| | — |
| | — |
| | (500 | ) |
| Payments on capital lease obligations | | (123 | ) | | — |
| | — |
| |
| Proceeds from public stock offerings and other, net of fees | | — |
| | — |
| | 8,627 |
| |
| Net cash provided by financing activities | | 41,711 |
| | 5,116 |
| | 9,434 |
| |
| Payments on capital lease obligation | | | (235 | ) | | (221 | ) | | (123 | ) |
| Net cash provided by (used in) financing activities | | | (453 | ) | | 454 |
| | 41,711 |
|
| Net increase (decrease) in cash and cash equivalents | | $ | 5,188 |
| | $ | (7,835 | ) | | $ | (45,969 | ) | | $ | (10,197 | ) | | $ | (7,392 | ) | | $ | 5,188 |
|
| Cash and cash equivalents, beginning of period | | 34,803 |
| | 42,638 |
| | 88,607 |
| | 32,599 |
| | 39,991 |
| | 34,803 |
|
| Cash and cash equivalents, end of period | | $ | 39,991 |
| | $ | 34,803 |
| | $ | 42,638 |
| | $ | 22,402 |
| | $ | 32,599 |
| | $ | 39,991 |
|
| | | | | | | | | | | | | |
| | | Supplemental cash flow disclosures | | | | | | | | | | | | |
| Cash paid for interest | | $ | 2,356 |
| | $ | 1,602 |
| | $ | 1,680 |
| | $ | 4,699 |
| | $ | 4,203 |
| | $ | 2,356 |
|
| Cash paid for income taxes | | 34 |
| | — |
| | 15 |
| | 27 |
| | 37 |
| | 34 |
|
| Capital expenditures incurred but not yet paid | | 2,080 |
| | 1,000 |
| | — |
| | 328 |
| | 1,455 |
| | 2,080 |
|
| Financing costs incurred but not yet paid | | | 425 |
| | — |
| | — |
|
See accompanying notes.
Angie’s List, Inc.
Notes to Consolidated Financial Statements
Years Ended December 31, 2014, 20132016, 2015 and 20122014
(dollars in thousands, except share and per share data)
1. Description of Business, Basis of Presentation and Summary of Significant Accounting Policies
Nature of Operations
Angie’s List, Inc. (collectively with its wholly owned subsidiaries, the "Company"“Company”) operates a national local services consumer review service and marketplace where consumersmembers can research, shop for and purchase local services for critical needs, such as home, health and automotive services, as well as rate and review the providers of these services. Ratings and reviews, which are now available only to the Company’s members free-of-charge, assist members in identifying and hiring the besta provider for their local service needs. Membership subscriptions are sold on a monthly, annual and multi-year basis. The consumer rating network “Angie’s List” is maintained and updated based on consumer feedback. The Company also sells advertising in its monthly publication, on its website and mobile application and through its call center to service providers that meet certain ratings criteria. In addition, the Company’s e-commerce marketplace offerings provide consumers with the opportunity to purchase services directly through the Company's marketplace from highly-rated service providers. The Company’s services are provided in markets located across the continental United States.
Basis of Presentation
The consolidated financial statements were prepared in conformity with accounting principles generally accepted in the United States (“U.S. GAAP”) and reflect all adjustments of a normal recurring nature considered, in the opinion of management, necessary to fairly report the results for the periods presented.
Operating Segments
Operating segments are defined as components of an enterprise engaging in business activities for which discrete financial information is available and regularly reviewed by the chief operating decision maker in deciding how to allocate resources and in assessing performance. The Company manages its business on the basis of one operating segment.
Principles of Consolidation
The consolidated financial statements include the accounts of the Company and its wholly owned subsidiaries. All significant intercompany accounts and transactions are eliminated in consolidation.
Estimates
The preparation of financial statements in conformity with accounting principles generally accepted in the United StatesU.S. GAAP requires management to make estimates and assumptions that affect amounts reported in the consolidated financial statements and accompanying notes as well as the disclosure of contingent assets and liabilities and reported revenue and expenses. Actual results could differ from those estimates, but management does not believe such differences will materially affect Angie’s List, Inc.’s financial position or results of operations. The consolidated financial statements reflect all adjustments of a normal recurring nature considered, in the opinion of management, necessary to fairly present the results for the periods.estimates.
Reclassification of Prior Year Presentation
Certain prior year amounts were reclassified for consistency with the current period presentation.presentation, including the marketing compensation and personnel-related costs and general marketing operating expenditures that were moved from general and administrative expense and selling expense to marketing expense within the consolidated statements of operations. These reclassifications did not materially impact the consolidated financial statements.net income (loss) previously reported.
Significant Accounting Policies
Revenue Recognition and Deferred Revenue
The Company recognizes revenue when all of the following conditions are met: there is persuasive evidence of an arrangement, the service has been provided to the customer, the collection of fees is reasonably assured and the amount of fees to be paid by the customer is fixed or determinable.
Membership Revenue
Revenue. Revenue from the sale of membership subscriptions is generally recognized ratably over the term of the associated subscription. Prior to 2014, the Company generally received a one-time, nonrefundable enrollment fee at the time a member joined. Enrollment fees are deferred and recognized on a straight-line basis over an estimated average membership life of 80 months for annual or multi-year members and 13 months for monthly members, which is based on historical membership experience. The Company reviews the estimated average membership lives on an annual basis, or more frequently if circumstances change. Changes in member behavior, performance, competition and economic conditions may cause attrition levels to change, which
could impact the estimated average membership lives. The Company discontinued charging nonrefundable enrollment fees in 2014.
Service Provider Revenue
Revenue from the sale of advertising in the Company’sRevenue. Angie’s ListMagazine publication is recognized in the month in which the publication is published and distributed. Revenue from the sale of website, mobile and call center advertising is recognized ratably over the time period the advertisements run. Revenue from the sale of advertising in the Company’s Angie’s ListMagazine publication is recognized in the period in which the publication is published and distributed. Revenue from e-commerce vouchers is recognized on a net basis when the voucher is delivered to the purchaser. While the Company is not the merchant of record with respect to its customers for these transactions, it does offer customers refunds in certain circumstances. RevenueAccordingly, revenue from e-commerce transactions is recorded net of a reserve for estimated refunds. The Company’s e-commerce revenue was $27,133, $22,062 and $14,475 for 2014, 2013 and 2012, respectively.
Deferred Revenue
Revenue. Deferred revenue includes the unamortized portion of revenue associated with membership and service provider fees for which the Company received payment in advance of services or advertising to be provided. Deferred revenue is recognized as revenue when the related services or advertising are actually provided.
Cash and Cash Equivalents
The Company maintains its cash in bank deposit accounts and money market funds with contractual maturities of three months or less, which, at times, may exceed federally insured limits. The Company also classifies as cash and cash equivalents any investments in corporate bonds or certificates of deposit, U.S. Treasury securities or corporate bonds with originalcontractual maturities of three months or less.less, which also, at times, may exceed federally insured limits. To date, the Company has not incurred anycarrying values of the Company’s cash and cash equivalents approximate their fair values, and there have been no material losses in these accounts.
Short-Term Investments
Short-term investments consist of corporate bonds and certificates of deposit, U.S. Treasury securities or corporate bonds with maturities of more than 90 days but less than one year, all of which are designated as held-to-maturity investments and recorded at amortized cost, adjusted, as applicable, for amortization of premiums to maturity computed under the effective interest method, in the consolidated balance sheets. Amortization and interest income from held-to-maturity investments are included in interest expense, net, in the consolidated statements of operations. The Company’s objective with respect to these investments is to earn a higher rate of return on funds that are otherwise not anticipated to be required to meet liquidity needs in the near term while maintaining a low level of investment risk with the positive intent and ability to hold these investments to maturity. Short-term investments are reviewedThe Company reviews its investment portfolio for other-than-temporary impairment whenever events or changes in circumstances indicate that the carrying amount of the investment may be impaired.impaired, considering such factors as the duration, severity and reason for the decline in value as well as the potential recovery period. As of December 31, 20142016 and 2013,2015, the Company held $24,268$16,541 and $21,055,$23,976, respectively, in short-term investments with no material unrealized gains or losses in these accounts in either year then ended.
Accounts Receivable
Accounts receivable is stated at the amount billed to service providers, less an estimated allowance for doubtful accounts. The Company performs ongoing credit evaluations and generally requires no collateral from service providers. Management reviews individual accounts as they become past due to determine collectability. The Company'sCompany’s allowance for doubtful accounts balance is adjusted periodically based on management’s consideration of past due accounts. Individual accounts are charged against the allowance when all reasonable collection efforts are exhausted.
The changes in the Company'sCompany’s allowance for doubtful accounts balances during the years ended December 31, 2014, 20132016, 2015 and 20122014 were as follows:
| | | | | Year Ended December 31, | | Year Ended December 31, |
| | | 2014 | | 2013 | | 2012 | | 2016 | | 2015 | | 2014 |
| Beginning balance | | $ | 1,107 |
| | $ | 922 |
| | $ | 535 |
| | $ | 1,658 |
| | $ | 1,651 |
| | $ | 1,107 |
|
| Additions, net of recoveries | | 5,028 |
| | 3,773 |
| | 1,955 |
| | 7,404 |
| | 5,746 |
| | 5,028 |
|
| Deductions | | (4,484 | ) | | (3,588 | ) | | (1,568 | ) | | (5,766 | ) | | (5,739 | ) | | (4,484 | ) |
| Ending balance | | $ | 1,651 |
| | $ | 1,107 |
| | $ | 922 |
| | $ | 3,296 |
| | $ | 1,658 |
| | $ | 1,651 |
|
Property, Equipment and Software
Assets recorded as property, equipment and software are stated at cost and depreciated over their respective estimated useful lives. The Company also capitalizes certain costs related to website and software acquisition and development for internal use, including the associated interestinternal labor costs incurred during development. Construction in progress is comprised of costs incurred related to the construction or development of property, equipment and software that is not ready for its intended use and therefore not yet placed in service. The Company’s estimated useful lives for property, equipment and software generally range from 3 to 25 years. DepreciationDepreciation/amortization is computed using the straight-line method. Repairs and routine maintenance are charged to expense as incurred.
In accordance with authoritative guidance, the Company begins to capitalize website and software development costs for internal use when preliminary developmentplanning and design efforts are successfully completed and technological feasibilitydevelopment is established.ready to commence. Costs incurred prior to the establishment of technological feasibility,during planning and design, together with costs incurred for related training and maintenance, are expensed as incurred and recorded in product and technology expense within the consolidated statements of operations. The Company places capitalized website and software development assets into service and commences depreciation/amortization when the applicable project or asset is substantially complete and ready for its intended use. Once placed into service, the Company capitalizes qualifying costs of specified upgrades or enhancements to capitalized website and software development assets when the upgrade or enhancement will result in new or additional functionality.
During 2014,The Company capitalizes internal labor costs, including compensation, benefits and payroll taxes, incurred for certain capitalized website and software development projects related to the Company’s technology platform. The Company’s policy with respect to capitalized internal labor stipulates that labor costs for employees working on eligible internal use capital projects are capitalized as part of the historical cost of the project when the impact, as compared to expensing such labor costs, is material.
The Company began capitalizingalso capitalized a portion of the interest on funds borrowed in relation to the development of the Company’s technology platform. The Company’s policy with respect to capitalized interest specifies that interest costs on eligible long-term internal use capital projects are capitalized as part of its capitalized website and software development costs, primarily relatedthe historical cost of the project when the impact, as compared to ongoing development around internal use software. For the year ended December 31, 2014, totalexpensing such interest costs, incurred amounted to $2,613, of which $1,410 was capitalized as construction in progress for website and software development costs. No interest costs were capitalized for the years ended December 31, 2013 or 2012.is material.
Goodwill
Goodwill is not amortized and is instead reviewed for impairment, at a minimum, on an annual basis as of December 31, or more frequently should an event or circumstance occur that indicates the carrying amount of goodwill may be impaired. If goodwill is considered to be impaired, the impairment to be recognized equals the amount by which the carrying value of the goodwill exceeds its fair market value. To date, no impairment of goodwill has been identified or recognized.
Data Acquisition Costs
Data acquisition costs consist of external costs related to acquiring consumer reports on service providers. These reports are used by the Company to provide its members with feedback on service providers. Amortization is computed using the straight-line method over the period during which the information is expected to benefit the Company’s members, which is estimated to be three years. The capitalized costs are included in intangible assets in the consolidated balance sheets, and the amortized expense is reflected within operations and support expense in the consolidated statements of operations.
Long-Lived Assets
Long-lived assets, including property, equipment and software and amortizable intangible assets, are reviewed for impairment whenever events or changes in circumstances indicate that the carrying amount of an asset may not be recoverable. Recoverability is measured by comparison of the carrying amount to future net undiscounted cash flows expected to be generated by the related asset. If such assets are considered to be impaired, the impairment to be recognized is measured byas the amount by which the carrying amount exceeds the fair market value of the assets. A one-time, long-livedLong-lived asset impairment charge wascharges were recorded during the second and fourth quarterquarters of the current year related to the Company's abandonment of certain capitalized website and software development assets and is2015 as discussed in morefurther detail in Note 5, "Property,“Property, Equipment and Software,"” of this Form 10-K. To date, there have been no other adjustmentsthese Notes to the respective carrying values of the Company's long-lived assets.Consolidated Financial Statements.
Deferred Financing Fees
As a result of itsthe Company’s entry into a new financing agreement in September 2014, the Company incurred financing costs that were capitalized as a deferred financing fee assetasset. As further discussed below, upon adoption of the guidance set forth under Accounting Standards Update No. 2015-03, effective January 1, 2016, the Company reclassified the deferred financing fees previously recorded in other noncurrent assets to net long-term debt in the consolidated balance sheets. The deferred financing fees contra liability is offsetting the gross term loan balance and areis being amortized intoto interest expense on a straight-line basis over the term of the credit facility.financing agreement. The Company’s long-term debt balance is reported net of the remaining unamortized deferred financing fees within the consolidated balance sheets. In connection with the extinguishment of the Company'sCompany’s previous loan and security agreement during the course of the aforementioned current year financing transaction, the Company expensed the remaining unamortized portion of the capitalized deferred financing fees associated with the previous loan and security agreement in 2014, and the related amount iswas included in the loss on debt extinguishment within the consolidated statementsstatement of operations.operations for the year ended December 31, 2014.
Fees Paid to Lender
The Company incurred financing costs in the form of fees paid directly to the lender during the completion of its September 2014 long-term debt financing transaction.transaction and in connection with the execution of the second amendment to the financing agreement in November 2016. In accordance with the applicable authoritative guidance, these fees were recorded as a contra liability, offsetting the gross term loan balance. The fees paid to lender contra liability is being amortized to interest expense on a straight-line basis over the term of the related debt.financing agreement. The Company'sCompany’s long-term debt balance is reported net of the remaining unamortized fees paid to the lender within the consolidated balance sheets.
Leases
The Company leases office space pursuant to long-term noncancellablenon-cancellable operating leases expiring through 2020.2021. Rent expense is recognized on a straight-line basis over the expected lease term. Certain of the Company'sCompany’s leases contain provisions for tenant improvement allowances, which are recorded as a deferred rent liability and amortized over the term of the associated lease as an offset to rent expense each period. Leasehold improvements are capitalized to property, equipment and software and depreciated on a straight-line basis over the corresponding estimated useful lives.
Sales Commissions
Commissions expense from the sale of service provider advertisements is recognized ratably over the term of the associated advertisement. The Company defers the recognition of commission expense until such time as the revenue related to the customer contract for which the commission was paid is recognized. Deferred commissions for each contract are amortized to expense in a manner consistent with how revenue is recognized for sucheach contract, resulting in straight-line recognition of expense over the contractual term. Unamortized commission expense of $11,378$8,869 and $9,395$8,573 as of December 31, 20142016 and 2013,2015, respectively, is included in prepaid expenses and other current assets in the accompanying consolidated balance sheets.
Marketing Expense
Marketing expense consists of national television, radio and print advertising as well as online digital advertising. The Company generally expenses all advertising costs as incurred. The Company recorded advertising spend of $46,056, $71,534 and $87,386 as a component of marketing expense in the consolidated statements of operations for the years ended December 31, 2016, 2015 and 2014, respectively.
Stock-Based Compensation
The Company accounts for stock-based compensation expense using the fair value measurement and recognition provisions of Financial Accounting Standards Board (FASB)(“FASB”) Accounting Standards Codification (ASC)(“ASC”) 718, Stock Compensation. For its awards of stock options, restricted stock units (“RSUs”) and certain performance awards of restricted stock units (“PRSUs”), the Company recognizes stock-based compensation expense over the requisite service period in an amount equal to the fair market value on the grant date of the respective award. TheFor PRSUs granted subject to the Company’s performance in relation to predetermined performance conditions, the Company recognizes thisstock-based compensation expense net of estimated forfeitures, on a straight-line basis over the requisite service period. vesting period based on the projected probability of achievement of the performance conditions as of the end of each reporting period during the performance period and may periodically adjust the recognition of such expense, as necessary, in response to any changes in the Company’s forecasts with respect to the performance conditions.
The fair value of awards grantedstock options is estimated at the date of grant using the Black-Scholes option-pricing model withutilizing the historical weighted-average assumptions outlined in Note 11, "Stock-Based“Stock-Based Compensation,"” of this Form 10-K.these Notes to Consolidated Financial Statements. The fair value of RSUs, as well as PRSUs granted subject to the Company’s performance in relation to predetermined performance conditions, is based on the fair market value of the underlying stock on the date of grant. The fair value of PRSUs contingent upon the performance of the Company’s stock price in relation to certain predetermined thresholds is estimated as of the date of grant using a Monte Carlo option-pricing simulation model.
Effective January 1, 2016, the Company began utilizing its own historical data for the volatility input to the calculation of the estimated fair value of stock option awards as there is now sufficient historical volatility data available to do so. Additionally, in connection with the adoption of ASU 2016-09 during the third quarter of 2016, the Company elected to commence accounting for forfeitures of share-based payment awards as they occur instead of recognizing stock-based compensation expense net of estimated forfeitures.
Loss Contingencies
The Company is involved in various lawsuits, claims, investigations and other legal and regulatory proceedings, both as a plaintiff and as a defendant, related to its business and operations. The Company records a liability when it is both probable a loss has been incurred and the amount can be reasonably estimated. If the Company determines a loss is possible and a range of loss can be reasonably estimated, the Company discloses the range of the possible loss in these Notes to Consolidated Financial Statements. Significant judgment is required to determine the probability or possibility, as well as the estimated amount, as applicable, of a loss contingency. On at least a quarterly basis, as necessary, the Company reviews and evaluates developments with respect to legal matters that could impact the amount of an associated liability previously accrued, as well as the related ranges of possible losses disclosed, and makes adjustments and changes as appropriate.
Loss on Debt Extinguishment
The penalties, additional interest and other fees and expenses incurred in connection with the prepayment of the Company’s previous debt facility in September 2014, together with the amounts related to the write-off of the previous deferred financing fees and recognition of the remaining warrant interest expense under the priorprevious debt facility, arewere included within the loss on debt extinguishment contained in the consolidated statement of operations for the year ended December 31, 2014.
Sales and Use Tax
Currently, the Company does not separately collect sales and use taxes from its members. Instead, the Company reports and, if applicable, pays sales and use taxes on behalf of its members in certain jurisdictions and records an accrual for sales and use tax based on probable liability within other applicable jurisdictions. Sales and use tax expenses are included within operations and support expense in the consolidated statements of operations.
Income Taxes
The Company is subject to corporate-levelcorporate federal and state income taxes at prevailing corporate rates and accounts for income taxes and the related accounts using the asset and liability method in accordance with ASC 740, Income Taxes. Under this method, the Company accrues income taxes payable or refundable and recognizes deferred tax assets and liabilities based on differences between the book and tax basis of assets and liabilities. The Company measures deferred tax assets and liabilities using enacted rates in effect for the years in which the differences are expected to reverse and recognizes the effect of a change in enacted rates in the period of enactment. After determining the total amount of deferred tax assets, the Company determines whether it is more likely than not that some portion of the deferred tax assets will not be realized. If the Company determines that a deferred tax asset is not likely to be realized, a valuation allowance will beis established against that asset to record it at its expected realizable value. The Company periodically reviews deferred tax assets for recoverability based on historical taxable income, projected future taxable income and the expected timing of reversals of existing temporary differences. Should there be a change in the ability to recover deferred tax assets, the tax provision would be adjusted in the period in which the assessment changed. The Company establishes assets and liabilities for uncertain positions taken or
expected to be taken in income tax returns using a more-likely-than-not recognition threshold. The Company includes in income tax expense any interest and penalties related to uncertain tax positions.
Sales and Use Tax
Sales and use tax expenses are included within operations and support expense in the consolidated statements of operations. The Company does not separately collect sales and use taxes from its members.
Subsequent EventsPledged Assets
The Company evaluated subsequent events throughCompany’s obligations under the date these consolidated financial statements were issued.long-term debt financing agreement are guaranteed by each of the Company’s subsidiaries and are secured by first priority interests in all of the Company’s respective assets and a pledge of the equity interests of the Company’s subsidiaries.
Recent Accounting Pronouncements - Adopted
As of January 1, 2016, the Company adopted FASB Accounting Standards Update No. 2015-03: Interest - Imputation of Interest (Subtopic 835-30): Simplifying the Presentation of Debt Issuance Costs, which set forth a requirement that debt issuance costs related to a recognized debt liability be presented on the balance sheet as a direct deduction from the carrying amount of that liability, resulting in the Company reclassifying the deferred financing fees previously recorded in other noncurrent assets, amounting to $1,462 as of December 31, 2015, to net long-term debt in the consolidated balance sheets.
As of August 1, 2016, the Company adopted FASB Accounting Standards Update No. 2016-09: Compensation - Stock Compensation (Topic 718):Improvements to Employee Share-Based Payment Accounting (“ASU 2016-09”), which simplified several aspects of the accounting guidance for employee share-based payment transactions, including accounting for income taxes, forfeitures and statutory tax withholding requirements, as well as classification in the statement of cash flows. The guidance requires companies to record excess tax benefits and tax deficiencies as income tax benefit or expense in the statement of operations when share-based payment awards vest or are settled. Upon adoption, the Company’s previously unrecognized excess tax benefits were recorded as a deferred tax asset, which was fully offset by a valuation allowance. Without the valuation allowance, the Company’s deferred tax asset would have increased by $2,406. Additionally, under the new guidance, the Company elected to begin accounting for forfeitures of share-based payment awards as they occur in lieu of the previous practice of estimating the number of awards expected to be forfeited and adjusting the estimate when it was no longer probable that the corresponding service condition would be fulfilled. As ASU 2016-09 was adopted as of an interim date, the Company recorded a modified retrospective transition adjustment as of the beginning of 2016 during the third quarter to reflect an increase in stock-based compensation expense of $804 related to the forfeitures election. No changes in presentation or classification in the statement of cash flows were required in connection with the adoption of ASU 2016-09, and the Company is now allowing share withholding for taxes upon the vesting of RSUs and PRSUs in excess of the minimum statutory tax withholding requirements, as permitted by ASU 2016-09.
Recent Accounting Pronouncements - Not Yet Adopted
In January 2015,2017, the FASB issued Accounting Standards Update No. 2015-01:2017-04: Income StatementIntangibles - ExtraordinaryGoodwill and Unusual Items (Subtopic 225-20)Other (Topic 350): Simplifying Income Statement Presentation by Eliminating the Concept of Extraordinary ItemsTest for Goodwill Impairment ("(“ASU 2015-01"2017-04”). The objective ofamendments in this Update is toupdate simplify the income statement presentation requirements in Subtopic 225-20, Income Statement - Extraordinary and Unusual Items,accounting for goodwill impairments by eliminating step 2 from the conceptgoodwill impairment test. Instead, if the carrying amount of extraordinary items from U.S. GAAP. Eliminatinga reporting unit exceeds its fair value, an impairment loss will be recognized in an amount equal to that excess, limited to the extraordinary classification simplifies income statement presentation by altogether removingtotal amount of goodwill allocated to the concept of extraordinary items from consideration.reporting unit. ASU 2015-012017-04 will be effective for the Company in fiscal year 2016, and prospective application2020, but early adoption is permitted, with the lone required transition disclosure, if applicable, being the nature and the amount of an item included in income from continuing operations after adoption that adjusts an extraordinary item previously classified and presented before the date of adoption.permitted. The Company is currently assessingevaluating the future impact of this update toon the consolidated financial statements.
In August 2014,2016, the FASB issued Accounting Standards Update No. 2014-15:2016-15: PresentationStatement of Financial Statements - Going Concern (Subtopic 205-40)Cash Flows (Topic 230): DisclosureClassification of Uncertainties about an Entity's Ability to Continue as a Going Concern Certain Cash Receipts and Cash Payments(" (“ASU 2014-15"2016-15”). The update sets forth a requirement for management to evaluate whether there are conditions and events that raise substantial doubt about an entity's ability to continue as a going concern, a responsibility that did not previously exist in U.S. GAAP. The amendments included in this update require managementadd to assess an entity’s ability to continue as a going concern by incorporatingor clarify existing U.S. GAAP guidance on the classification of certain cash receipts and expanding upon certain principles that are currentlypayments in U.S. auditing standards. Specifically, the amendments (1) provide a definitionstatement of the term substantial doubt, (2) require an evaluation every reporting period, including interim periods, (3) provide principles for considering the mitigating effect of management’s plans, (4) require certain disclosures when substantial doubt is alleviated as a result of consideration of management’s plans, (5) require an express statement and other disclosures when substantial doubt is not alleviated, and (6) require an assessment for a period of one year after the date that the financial statements are issued (or available to be issued).cash flows. ASU 2014-152016-15 will be effective for the Company in fiscal year 2016.2018, but early adoption is permitted. The guidance set forth in this update must be applied retrospectively to all periods presented but may be applied prospectively if retrospective application would be impracticable. The Company is currently assessingevaluating the future impact of this update on the consolidated financial statements.
In June 2016, the FASB issued Accounting Standards Update No. 2016-13: Financial Instruments - Credit Losses (Topic 326): Measurement of Credit Losses on Financial Instruments (“ASU 2016-13”). The amendments in this update add to U.S. GAAP a current expected credit loss impairment model that is based on expected losses rather than incurred losses, requiring consideration of a broader range of reasonable and supportable information to inform credit loss estimates. Under the new guidance, an entity recognizes as an allowance its estimate of expected credit losses, which the FASB believes will result in more timely recognition of such losses. ASU 2016-13 is also intended to reduce the complexity of U.S. GAAP by decreasing the number of credit impairment models that entities use to account for debt instruments. ASU 2016-13 will be effective for the Company in fiscal year 2020, but early adoption is permitted beginning in 2019. The Company is currently evaluating the impact of this update on the consolidated financial statements.
In February 2016, the FASB issued Accounting Standards Update No. 2016-02: Leases (Topic 842) (“ASU 2016-02”). The amendments in this update require lessees, among other things, to recognize lease assets and lease liabilities on the balance sheet for those leases classified as operating leases under previous authoritative guidance. This update also introduces new disclosure requirements for leasing arrangements. ASU 2016-02 will be effective for the Company in fiscal year 2019, but early adoption is permitted. The Company is currently evaluating the impact of this update on the consolidated financial statements.
In January 2016, the FASB issued Accounting Standards Update No. 2016-01: Financial Instruments - Overall (Subtopic 825-10): Recognition and Measurement of Financial Assets and Financial Liabilities (“ASU 2016-01”). The amendments in this update address certain aspects of recognition, measurement, presentation and disclosure of financial instruments. In particular, the amendments in this update supersede, for public business entities, the requirement to disclose the methods and significant assumptions used in calculating the fair value of financial instruments required to be disclosed for financial instruments measured at amortized cost on the balance sheet. ASU 2016-01 will be effective for the Company in fiscal year 2018, but early adoption is permitted. The Company does not believe that the adoption of the guidance set forth in this update will have a material impact on the consolidated financial statements.
In May 2014, the FASB issued Accounting Standards Update No. 2014-09: Revenue from Contracts with Customers (Topic 606) ("(“ASU 2014-09"2014-09”). TheThis update outlines a single comprehensive model for entities to use in accounting for revenue arising from contracts with customers and supersedes most current revenue recognition guidance, including industry-specific guidance. The core principle of the revenue model is that "an“an entity recognizes revenue to depict the transfer of promised goods or services to customers in an amount that reflects the consideration to which the entity expects to be entitled in exchange for those goods or services." The” This update also requires significantly expanded disclosures related to revenue recognition. In March 2016, the FASB issued Accounting Standards Update No. 2016-08: Principal versus Agent Considerations (Reporting Revenue Gross versus Net) (“ASU 2016-08”), amending the principal-versus-agent implementation guidance set forth in ASU 2014-09. Among other things, ASU 2016-08 clarifies that an entity should evaluate whether it is the principal or the agent for each specified good or service promised in a contract with a customer. In April 2016, the FASB issued Accounting Standards Update No. 2016-10: Identifying Performance Obligations and Licensing (“ASU 2016-10”), which amends certain aspects of the guidance set forth in the FASB’s new revenue standard related to identifying performance obligations and licensing implementation. In May 2016, the FASB issued Accounting Standards Update No. 2016-12: Narrow-Scope Improvements and Practical Expedients (“ASU 2016-12”), amending certain aspects of ASU 2014-09 to address implementation issues identified by the FASB’s transition resource group and clarify the new revenue standard’s core revenue recognition principles. In December 2016, the FASB issued Accounting Standards Update No. 2016-20: Technical Corrections and Improvements to Topic 606, Revenue from Contracts with Customers (“ASU 2016-20”), which clarified or corrected unintended application of certain aspects of the guidance set forth under ASU 2014-09. ASU 2014-09 will be effective for the Company in fiscal year 2017. The Company is currently evaluating2018 following the future impact and methodissuance of adoption of this update with respect to the consolidated financial statements.
In July 2013, the FASB issued Accounting Standards Update No. 2013-11: 2015-14:Income Taxes (Topic 740): Presentation Deferral of the Effective Date in August 2015, which deferred the effective date of ASU 2014-09 by one year. The Company currently anticipates adopting the new revenue recognition standard effective January 1, 2018 utilizing the modified retrospective method of adoption. Accordingly, upon adoption, the Company currently anticipates recognizing the cumulative effect of adopting this guidance as an Unrecognized Tax Benefit When a Net Operating Loss Carryforward, a Similar Tax Loss, or a Tax Credit Carryforward Exists (“ASU 2013-11”). An entity is requiredadjustment to present unrecognized tax benefits as a decreasethe opening balance of the accumulated deficit within the consolidated balance sheet for the period of adoption, and prior periods will not be retrospectively adjusted. The Company identified the following revenue streams that will be further evaluated in a net operating loss, similar tax loss or tax credit carryforward if certain criteria are met. The determination of whether a deferred tax asset is available isdetail based on the unrecognized tax benefitcriteria established under the new revenue standard: membership revenue, service provider advertising revenue and the deferred tax asset that exists at the reporting date and presumes disallowance of the tax position at the reporting date.service provider e-commerce revenue. The guidance eliminates the diversity in practiceCompany is still in the presentationprocess of unrecognized tax benefits but does not alterevaluating the way in which entities assess deferred tax assets for realizability. ASU 2013-11 became effective and was adopted by the Company in fiscal year 2014 with no material impact toof these updates on the consolidated financial statements.statements and related disclosures.
2. Net LossIncome (Loss) Per Common Share
Basic and diluted net lossincome (loss) per common share isare computed by dividing consolidated net lossincome (loss) by the weighted averagebasic and diluted weighted-average number of common shares outstanding, respectively, for the period. Basic and diluted net lossincome (loss) per common share was $(0.21)$(0.13), $(0.57)$0.18 and $(0.92)$(0.21) for the years ended December 31, 2016, 2015 and 2014, 2013respectively. Diluted net income (loss) per common share was $(0.13), $0.17 and 2012,$(0.21) for the years ended December 31, 2016, 2015 and 2014, respectively.
The following table shows the calculation of the diluted weighted-average number of common shares outstanding:
|
| | | | | | | | | |
| | | December 31, |
| | | 2016 | | 2015 | | 2014 |
Weighted-average number of common shares outstanding — basic
| | 58,860,152 |
| | 58,520,546 |
| | 58,510,106 |
|
| Total dilutive effect of outstanding share-based payments | | — |
| | 262,343 |
| | — |
|
Weighted-average number of common shares outstanding — diluted
| | 58,860,152 |
| | 58,782,889 |
| | 58,510,106 |
|
The following potentially dilutive equity securities areoutstanding share-based payments were not included in the diluted net lossincome (loss) per common share calculationcalculations as theythe impact would have anbeen antidilutive impact:for the periods presented:
|
| | | | | | |
| | | December 31, |
| | | 2014 | | 2013 |
| Stock options | | 5,438,897 |
| | 3,310,764 |
|
|
| | | | | | | | | |
| | | December 31, |
| | | 2016 | | 2015 | | 2014 |
| Stock options | | 6,817,996 |
| | 6,477,872 |
| | 5,438,897 |
|
| Restricted stock units | | 1,699,053 |
| | 1,128,826 |
| | — |
|
| Performance awards of restricted stock units | | 3,087,949 |
| | 778,829 |
| | — |
|
| Shares to be purchased under employee stock purchase plan | | 2,829 |
| | — |
| | — |
|
See Note 11, “Stock-Based Compensation,” of these Notes to Consolidated Financial Statements for additional detail and discussion regarding the Company’s share-based payment awards and employee stock purchase plan. The PRSUs granted during 2016 (the “2016 LTIP”) that remained outstanding as of December 31, 2016 were not included in the computation of diluted net income (loss) per common share as the number of shares that will ultimately be issued is contingent upon the Company’s achievement of certain predetermined performance conditions and does not meet the criteria for inclusion per the applicable U.S. GAAP guidance.
3. Fair Value Measurements
Whenever possible, quoted prices in active markets are used to determine the fair value of the Company'sCompany’s financial instruments. The Company'sCompany’s financial instruments are not held for trading or other speculative purposes. The estimated fair value of financial instruments was determined using available market information and appropriate valuation methodologies. However, considerable judgment is required in interpreting market data to develop the estimates of fair value. Accordingly, the estimates presented herein are not necessarily indicative of the amounts the Company could realize in a current market exchange. The use of different market assumptions and/or estimation methodologies may have a material effect onmaterially impact the estimated fair value amounts.
Fair Value Hierarchy
Fair value is based on the price that would be received to sellupon sale of an asset or paid to transfer a liability in an orderly transaction between market participants at the measurement date. In accordance with ASC 820, Fair Value Measurement(“ASC 820”), the Company categorized the financial assets and liabilities that are adjusted to fair value based on the priority of the inputs to the valuation technique, following the three-level fair value hierarchy prescribed by ASC 820, as follows:
Level 1: Quoted prices (unadjusted) in active markets that are accessible at the measurement date for assets or liabilities.
Level 2: Observable prices that are based on inputs not quoted on active markets but corroborated by market data.
Level 3: Unobservable inputs that are used when little or no market data is available.
Valuation Techniques
The Company’s money market fund investments, the maturities for which are less than 90 days, are classified as cash equivalents within Level 1 of the fair value hierarchy on the basis of valuations using quoted market prices. Short-term investments consist of certificates of deposit, corporate bonds and U.S. Treasury securities with maturities of more than 90 days but less than one year. As many fixed income securities do not trade daily, fair values are often derived using recent trades of securities with similar features and characteristics. When recent trades are not available, pricing models are used to determine these prices. These models calculate fair values by discounting future cash flows at estimated market interest rates. Such market rates are derived by calculating the appropriate spreads over comparable U.S. Treasury securities, based on the credit quality, industry and structure of the asset. Typical inputs and assumptions to pricing models include, but are not limited to, a combination of benchmark yields, reported trades, issuer spreads, liquidity, benchmark securities, bids, offers, reference data and industry and economic events. The Company’s fixed income certificates of deposit, U.S. Treasury securities and corporate bond investments and certificates of deposit with fixed maturities are valued using recent trades or pricing models and are therefore classified within Level 2 of the fair value hierarchy.
Recurring Fair Value Measurements
There were no movements between fair value measurement levels offor the Company’s cash equivalents and investments during 20142016 or 2013,2015, and there were no material unrealized gains or losses in these accounts as of December 31, 20142016 or 2013.2015.
The following tables summarize the Company'sCompany’s financial instruments at fair value based on the fair value hierarchy for each class of instrument as of December 31, 20142016 and 2013:2015:
| | | | | | | Fair Value Measurement at December 31, 2014 Using | | | | Fair Value Measurement at December 31, 2016 Using |
| | | Carrying Value at December 31, 2014 | | Quoted Prices in Active Markets for Identical Assets (Level 1) | | Significant Other Observable Inputs (Level 2) | | Significant Unobservable Inputs (Level 3) | | Carrying Value at December 31, 2016 | | Quoted Prices in Active Markets for Identical Assets (Level 1) | | Significant Other Observable Inputs (Level 2) | | Significant Unobservable Inputs (Level 3) |
| Cash equivalents: | | | | | | | | | | | | | | | | |
| Money market funds | | $ | 365 |
| | $ | 365 |
| | $ | — |
| | $ | — |
| | $ | 2,419 |
| | $ | 2,419 |
| | $ | — |
| | $ | — |
|
| Certificates of deposit | | 240 |
| | — |
| | 240 |
| | — |
| |
| Investments: | | | | | | | | | | | | | | | | |
| Certificates of deposit | | 21,235 |
| | — |
| | 21,211 |
| | — |
| | 13,840 |
| | — |
| | 13,837 |
| | — |
|
| Corporate bonds | | 3,033 |
| | — |
| | 3,028 |
| | — |
| |
| U.S. Treasury securities | | | 2,701 |
| | — |
| | 2,702 |
| | — |
|
| Total assets | | $ | 24,873 |
| | $ | 365 |
| | $ | 24,479 |
| | $ | — |
| | $ | 18,960 |
| | $ | 2,419 |
| | $ | 16,539 |
| | $ | — |
|
| | | | | | | Fair Value Measurement at December 31, 2013 Using | | | | Fair Value Measurement at December 31, 2015 Using |
| | | Carrying Value at December 31, 2013 | | Quoted Prices in Active Markets for Identical Assets (Level 1) | | Significant Other Observable Inputs (Level 2) | | Significant Unobservable Inputs (Level 3) | | Carrying Value at December 31, 2015 | | Quoted Prices in Active Markets for Identical Assets (Level 1) | | Significant Other Observable Inputs (Level 2) | | Significant Unobservable Inputs (Level 3) |
| Cash equivalents: | | | | | | | | | | | | | | | | |
| Money market funds | | $ | 655 |
| | $ | 655 |
| | $ | — |
| | $ | — |
| | $ | 970 |
| | $ | 970 |
| | $ | — |
| | $ | — |
|
| Investments: | | | | | | | | | | | | | | | | |
| Certificates of deposit | | 13,750 |
| | — |
| | 13,734 |
| | — |
| | 19,310 |
| | — |
| | 19,292 |
| | — |
|
| U.S. Treasury securities | | | 3,652 |
| | — |
| | 3,649 |
| | — |
|
| Corporate bonds | | 7,305 |
| | — |
| | 7,303 |
| | — |
| | 1,014 |
| | — |
| | 1,013 |
| | — |
|
| Total assets | | $ | 21,710 |
| | $ | 655 |
| | $ | 21,037 |
| | $ | — |
| | $ | 24,946 |
| | $ | 970 |
| | $ | 23,954 |
| | $ | — |
|
The Company did not recognize any other-than-temporary impairment losses for the years ended December 31, 2016, 2015, or 2014.
The carrying amountsamount of the term loans approximateloan approximates fair value, using Level 2 inputs, as these borrowings bearthis borrowing bears interest at a variable (market) ratesrate at December 31, 20142016 and 2013.2015.
Non-Recurring Fair Value Measurements
The Company has certain assets that are measured at fair value on a non-recurring basis under circumstances and events, including those described in Note 5, "Property,“Property, Equipment and Software,"” and Note 6, "Goodwill“Goodwill and Amortizable Intangible Assets,"” of these Notes to Consolidated Financial Statements that are adjusted to fair value onlyin certain circumstances when the carrying values are more than the fair values. The categorization of the framework used to price the assets in the event of an impairment such as the current year non-cash long-lived asset impairment charge (see Note 5 for additional information), is considered a Level 3 measurement due to the subjective nature of the unobservable inputs used to determine the fair value.
Assets and liabilities acquired in business combinations are recorded at their fair value as of the date of acquisition. Refer to Note 6 for the fair values of assets acquiredacquisition using Level 2 and liabilities assumed in connection with the prior year acquisition of substantially all the assets of SmartHabitat (“BrightNest”).Level 3 inputs.
The carrying amounts of accounts receivable and accounts payable reported in the consolidated balance sheets approximate fair value.
4. Prepaid Expenses and Other Current Assets
Prepaid expenses and other current assets was comprised of the following as of December 31, 20142016 and 2013:2015:
| | | | | December 31, | | December 31, |
| | | 2014 | | 2013 | | 2016 | | 2015 |
| Prepaid and deferred commissions | | $ | 11,378 |
| | $ | 9,395 |
| | $ | 8,869 |
| | $ | 8,573 |
|
| Other prepaid expenses and current assets | | 6,742 |
| | 4,306 |
| | 8,133 |
| | 10,453 |
|
| Total prepaid expenses and other current assets | | $ | 18,120 |
| | $ | 13,701 |
| | $ | 17,002 |
| | $ | 19,026 |
|
5. Property, Equipment and Software
Property, equipment and software was comprised of the following as of December 31, 20142016 and 2013:2015:
| | | | | December 31, | | December 31, |
| | | 2014 | | 2013 | | 2016 | | 2015 |
| Furniture and equipment | | $ | 12,450 |
| | $ | 7,965 |
| | $ | 16,439 |
| | $ | 14,179 |
|
| Land | | 3,101 |
| | 1,464 |
| | 3,466 |
| | 3,392 |
|
| Buildings and improvements | | 17,082 |
| | 8,711 |
| | 20,768 |
| | 19,035 |
|
| Software | | 4,696 |
| | 2,629 |
| | 5,853 |
| | 5,814 |
|
| Capitalized website and software development costs | | 23,214 |
| | 3,320 |
| | 60,811 |
| | 47,877 |
|
| Total property, equipment and software | | 60,543 |
| | 24,089 |
| | 107,337 |
| | 90,297 |
|
| Less accumulated depreciation | | (9,279 | ) | | (5,432 | ) | | (24,623 | ) | | (12,662 | ) |
| Total property, equipment and software, net | | $ | 51,264 |
| | $ | 18,657 |
| | $ | 82,714 |
| | $ | 77,635 |
|
Included in the Company'sCompany’s net property, equipment and software balance at December 31, 20142016 was approximately $22,418$3,262 in construction in progress, comprised of $76$181 for furniture and equipment, $826$870 for buildings and improvements $138and $2,211 for capitalized website and software development costs.
At December 31, 2015, the Company’s construction in progress balance was $47,798, consisting of $1,017 for furniture and equipment, $802 for buildings and improvements, $883 for software and $21,378$45,096 for capitalized website and software development costs, which includes $1,410 forincluded $3,570 of capitalized interest. At December 31, 2013, the Company's construction in progress balance was $2,418, consisting primarily of capitalized website and software development costs.
Depreciation expense for the years ended December 31, 2016, 2015 and 2014 2013was $4,138, $3,257 and 2012 was $2,491, $1,565 and $994, respectively. Computer software amortization expense for 2016, 2015 and 2014 2013was $8,048, $1,903 and 2012 was $1,356, $961 and $524, respectively.
During the fourth quarter of 2014,2015, the Company recorded a $1,778 one-time,an $892 non-cash long-lived asset impairment charge related to the abandonment offor certain capitalized website and software development assets. The impairment was recordedassets as a result of a recalibration of the Company's decision to abandon certain aspects of its e-commerce order fulfillment functionality. The Company evaluated the ongoing value and specific costs incurred to dateCompany’s plans with respect to the functionality and ultimately identifiedimplementation of a new e-commerce platform. The long-lived asset impairment charge in the aforementioned amount that was recorded in the product and technology expense line within the consolidated statement of operations for the year ended December 31, 2014.2015.
TableDuring the second quarter of Contents2015, the Company recorded a $686 non-cash long-lived asset impairment charge for certain assets categorized as buildings and improvements related to the Company’s decision not to pursue its Indianapolis campus expansion plan. The long-lived asset impairment charge was recorded in the general and administrative expense line within the consolidated statement of operations for the year ended December 31, 2015.
6. Goodwill and Amortizable Intangible Assets
The Company has goodwill as well as certain amortizable intangible assets consisting of data acquisition costs, a member list, content, core technology and other intangible assets related to the purchase of a website domain name. The goodwill and amortizable intangible asset balances reflect the goodwill, member list, content and core technology acquired during the August 2, 2013 acquisitionAmortization of substantially all the assets of BrightNest for a purchase price of $2,650, inclusive of $1,920 in acquired intangible assets and goodwill of $730. The purchase price consisted of $2,150 in cash paid at closing and an additional $500 that was paid during 2014 as contingent consideration on the one-year anniversary of the closing of the acquisition. Revenues and expenses related to BrightNest, which are not material, are included in the consolidated results of operations from the date of acquisition.
Amortization on the intangible assets is computed using the straight-line method over the estimated lives of the assets, which are six years and three years, respectively, for the member list and other intangible assets, includingthree years for the content, core technology, and data acquisition costs. costs and other intangible assets.
Amortizable intangible assets as of December 31, 20142016 and 2013 are2015 were as follows:
| | | | Cost | | Accumulated Amortization | | Net | | Weighted-Average Remaining Amortization Period (in years) | Cost | | Accumulated Amortization | | Net Carrying Amount | | Weighted-Average Remaining Amortization Period (in years) |
| 2014 | | | | | | | | |
| 2016 | | | | | | | | |
| Member list | $ | 1,670 |
| | $ | 394 |
| | $ | 1,276 |
| | 4.6 | $ | 1,670 |
| | $ | 951 |
| | $ | 719 |
| | 2.6 |
| Content | 140 |
| | 66 |
| | 74 |
| | 1.6 | 140 |
| | 140 |
| | — |
| | 0.0 |
| Core technology | 110 |
| | 52 |
| | 58 |
| | 1.6 | 110 |
| | 110 |
| | — |
| | 0.0 |
| Data acquisition costs | 3,488 |
| | 2,358 |
| | 1,130 |
| | 1.2 | 1,333 |
| | 850 |
| | 483 |
| | 1.1 |
| Other intangible assets | 300 |
| | 83 |
| | 217 |
| | 2.2 | 300 |
| | 283 |
| | 17 |
| | 0.2 |
| Total amortizable intangible assets | $ | 5,708 |
| | $ | 2,953 |
| | $ | 2,755 |
| | | $ | 3,553 |
| | $ | 2,334 |
| | $ | 1,219 |
| | |
| | | | Cost | | Accumulated Amortization | | Net | | Weighted-Average Remaining Amortization Period (in years) | Cost | | Accumulated Amortization | | Net Carrying Amount | | Weighted-Average Remaining Amortization Period (in years) |
| 2013 | | | | | | | | |
| 2015 | | | | | | | | |
| Member list | $ | 1,670 |
| | $ | 122 |
| | $ | 1,548 |
| | 5.6 | $ | 1,670 |
| | $ | 673 |
| | $ | 997 |
| | 3.6 |
| Content | 140 |
| | 12 |
| | 128 |
| | 2.6 | 140 |
| | 113 |
| | 27 |
| | 0.6 |
| Core technology | 110 |
| | 16 |
| | 94 |
| | 2.6 | 110 |
| | 88 |
| | 22 |
| | 0.6 |
| Data acquisition costs | 3,296 |
| | 1,566 |
| | 1,730 |
| | 1.2 | 1,920 |
| | 1,072 |
| | 848 |
| | 1.5 |
| Other intangible assets | | 300 |
| | 183 |
| | 117 |
| | 1.2 |
| Total amortizable intangible assets | $ | 5,216 |
| | $ | 1,716 |
| | $ | 3,500 |
| | | $ | 4,140 |
| | $ | 2,129 |
| | $ | 2,011 |
| | |
Amortization expense on amortizable intangible assets for the years ended December 31, 2016, 2015 and 2014 2013was $962, $1,242 and 2012 was $1,729, $1,546 and $1,234, respectively. The estimated amortization expense related to amortizable intangible assets at December 31, 20142016 for each of the next five years is as follows: $1,159 in 2015, $758 in 2016, $398$621 in 2017, $278$418 in 2018, $180 in 2019, $0 in 2020 and $162$0 in 2019. 2021.
The Company’s recorded goodwill balance as of both December 31, 20142016 and 20132015 was $1,145.
7. Accrued Liabilities
Accrued liabilities was comprised of the following as of December 31, 20142016 and 2013:2015:
| | | | | December 31, | | December 31, |
| | | 2014 | | 2013 | | 2016 | | 2015 |
| Accrued sales commissions | | $ | 2,627 |
| | $ | 2,570 |
| | $ | 1,469 |
| | $ | 1,461 |
|
| Sales and use tax | | 4,263 |
| | 3,158 |
| | 3,792 |
| | 4,307 |
|
| Accrued compensation | | 6,126 |
| | 5,229 |
| | 7,369 |
| | 6,826 |
|
| Uninvoiced accounts payable | | 2,749 |
| | 2,977 |
| | 4,333 |
| | 2,384 |
|
| Legal settlement accrual | | 2,183 |
| | 4,000 |
| | 2,601 |
| | — |
|
| Other accrued liabilities | | 5,241 |
| | 3,836 |
| | 3,564 |
| | 5,309 |
|
| Total accrued liabilities | | $ | 23,189 |
| | $ | 21,770 |
| | $ | 23,128 |
| | $ | 20,287 |
|
8. Debt and Credit Arrangements
Long-term debt, net, was comprised of the following as of December 31, 20142016 and 2013:2015:
| | | | | December 31, | | December 31, |
| | | 2014 | | 2013 | | 2016 | | 2015 |
| Term loan | | $ | 60,000 |
| | $ | 15,000 |
| | $ | 60,000 |
| | $ | 60,000 |
|
| Fees paid to lender | | (1,146 | ) | | (82 | ) | |
| Unamortized deferred financing fees | | | (1,071 | ) | | (1,462 | ) |
| Unamortized fees paid to lender | | | (1,287 | ) | | (904 | ) |
| Total debt, net | | 58,854 |
| | 14,918 |
| | 57,642 |
| | 57,634 |
|
| Less current maturities | | — |
| | — |
| | (1,500 | ) | | (1,500 | ) |
| Total long-term debt, net | | $ | 58,854 |
| | $ | 14,918 |
| | $ | 56,142 |
| | $ | 56,134 |
|
On September 26, 2014, the Company entered into a financing agreement for a $60,000 term loan and a $25,000 delayed draw term loan.
AmountsOn June 10, 2016, the Company entered into a first amendment to the financing agreement which, among other things, (i) extended the commencement of the Company’s quarterly repayment obligations under the term loan from September 30, 2016 to September 30, 2017; (ii) revised the financial covenants for minimum consolidated EBITDA, as defined in the financing agreement, for periods ending after June 30, 2016; (iii) revised the financial covenant related to minimum required liquidity from $10,000 to $30,000; (iv) removed the financial covenant related to minimum membership revenue for periods ending after March 31, 2016; and (v) modified the basis for the calculation of the applicable interest rate.
On November 1, 2016, the Company entered into a second amendment to the financing agreement which, among other things, (i) added a new financial covenant related to consolidated active service provider contract value beginning with the period ending December 31, 2016; (ii) revised the financial covenants for minimum consolidated EBITDA, as defined in the financing agreement and subsequently modified under the second amendment, for periods ending after September 30, 2016; (iii) revised the financial covenant related to minimum required liquidity; (iv) modified the basis for the calculation of the applicable interest rate; (v) modified the dates under which the prepayment premium is applicable; and (vi) modified certain terms related to the delayed draw term loan. Additionally, the second amendment set forth a fee to be paid by the Company to the lender, in three equal annual installments, in connection with the execution of the amendment, and this fee was capitalized along with the existing unamortized fees paid to lender contra liability and is being amortized to interest expense over the remaining term of the financing agreement.
The financing agreement requires monthly interest payments on the first business day of each month until maturity on any principal amounts outstanding under either debt facility. In accordance with the second amendment to the financing agreement, if the Company’s consolidated EBITDA for the trailing four consecutive fiscal quarters is less than $20,000 or the Company’s qualified cash, as defined in the financing agreement, is less than $20,000 as of the applicable period end, amounts outstanding under the financing agreement bear interest at a per annum rate, at the option of the Company, equal to (i) the LIBOR rate for the interest period in effect, subject to a floor of 0.5%, plus 6.75%9.50% or (ii) the reference rate, which is based on the prime rate as published by the Wall Street Journal, subject to a floor of 3.25%, plus 5.75%8.50%. The financing agreement requires monthly interest-only payments onIf the first business day of each month until maturity on any principal amounts outstanding under either debt facility. Company’s qualified cash is greater than $20,000, and the Company’s consolidated EBITDA for the trailing four consecutive fiscal quarters is:
greater than $20,000 but less than $25,000, the applicable LIBOR interest rate is 8.5%, and the applicable reference interest rate is 7.5%;
greater than $25,000 but less than $30,000, the applicable LIBOR interest rate is 7.5%, and the applicable reference interest rate is 6.5%; or
greater than $30,000, the applicable LIBOR interest rate is 6.5%, and the applicable reference interest rate is 5.5%.
The financing agreement obligates the Company to make quarterly principal payments on the term loan of $750 on the last day of each calendar quarter, commencing with the quarter ending September 30, 2016,2017, and to repay the remaining balance of the term loan at maturity. The Company is required to make principal payments on the outstanding balance of the delayed draw term loan equal to 1.25% of the amount of such loan funded at or prior to the last day of each calendar quarter commencing with the quarter ending September 30, 2016, and to repay the remaining outstanding balance of the delayed draw term loan at maturity. From the effective date of the financing agreement through September 26, 2017, the Company is also required to pay a commitment fee equal to 0.75% per annum of the unborrowed amounts of the delayed draw term loan.
The Company may prepay the amounts outstanding under the financing agreement at any time and is required to prepay the loans with (i) the net proceeds of certain asset sales, issuances of debt or equity, and certain casualty events, and (ii) up to 50% of consolidated excess cash flow, as defined in the financing agreement, for each fiscal year during the term of the financing agreement, commencing with the year ended December 31, 2015. The Company did not have excess cash flow as of December 31, 2016. As specified by the second amendment to the financing agreement, the Company must pay a 1% premium on prepayments made on or before September 26, 2015,November 1, 2017, subject to certain exceptions set forth in the financing agreement. The Company’s obligations under the financing agreement are guaranteed by each of its subsidiaries and are secured by first priority security interests in all of their respective assets and a pledge of the equity interests of the Company’s subsidiaries. The term loan and the delayed draw term loan mature on September 26, 2019. As of December 31, 2014,2016, the Company had $58,854$57,642 in outstanding borrowings under the term loan, net of unamortized deferred financing fees of $1,071 and unamortized fees paid to the lender of $1,146, under$1,287, both of which are being amortized into interest expense over the term loanof the financing agreement, and availability of $25,000 under the delayed draw term loan. Principal amounts due over the remaining term of the financing agreement as of December 31, 2016 are as follows: $1,500 in 2017, $3,000 in 2018 and $55,500 in 2019.
The financing agreement contains various restrictive covenants, including restrictions on the Company'sCompany’s ability to dispose of assets, make acquisitions or investments, incur debt or liens, make distributions to stockholders or repurchase outstanding stock, enter into related-party transactions and make capital expenditures, other than upon satisfaction of the conditions set forth in the financing agreement. The Company is also required to comply with certain financial covenants, including minimum consolidated EBITDA, as defined in the financing agreement and subsequently modified under the second amendment, minimum liquidity, minimum consolidated active service provider contract value and maximum consolidated capital expenditures and minimum membership revenue.expenditures. Upon an event of default, which includes certain customary events such as, among other things, a failure to make required payments when due, a failure to comply with covenants, certain bankruptcy and insolvency events, defaults under other material indebtedness, or a change in control, the lenders may accelerate amounts outstanding, terminate the agreement and foreclose on all collateral. The Company's capital expenditures in the fourth quarter of 2014 exceeded the maximum allowable amount under the financial covenant set forth in the financing agreement related to consolidated capital expenditures, and as such, the Company was not in compliance with this covenant at December 31, 2014. The Company remedied the noncompliance by obtaining a waiver of non-compliance under the financing agreement from the lender. The Company was in compliance with all other financial and non-financial covenants at December 31, 2014.
The Company used a portion of the proceeds from the term loan to pay bank and lender fees and transaction costs associated with the new financing agreement. Furthermore, the Company also used a portion of the term loan proceeds to simultaneously repay in full the outstanding balance of $15,000 on the Company’s previous term loan, thereby terminating the related loan and security agreement. The Company incurred approximately $192 in incremental interest and fees as a result of
the prepayment, including additional interest of $105 and prepayment penalties of $75. The prepayment penalties, additional interest and other fees and expenses associated with the prepayment of the Company’s previous loan and security agreement, together with $221 related to the write-off of the previous deferred financing fees and $45 for the recognition of the remaining warrant interest expense under the prior debt facility, are included within the loss on debt extinguishment of $458 contained in the consolidated statement of operations for the year ended December 31, 2014.
As a result of its entry into the new financing agreement in September 2014, the Company incurred financing costs of $1,957 that were capitalized as a deferred financing fee asset and are being amortized into interest expense over the term of the credit facility. Deferred financing fees, net of accumulated amortization, totaled $1,854 and $397 at December 31, 2014 and 2013, respectively. Amortization expense of $279, $237 and $232 is included in interest expense in the consolidated statements of operations for 2014, 2013 and 2012, respectively.
On August 31, 2011, the Company entered into a loan and security agreement that provided for a $15,000 term loan and a $15,000 revolving credit facility, scheduled to mature in August 2015. The term loan bore interest at a per annum rate equal to the greater of (i) the current cash interest rate of LIBOR plus 10% or (ii) 10.5% and required monthly interest-only payments until maturity. The revolving credit facility required monthly interest-only payments on advances, bearing interest at a per annum rate equal to LIBOR plus 5%. In addition, when less than 50% of the revolving credit facility was drawn, the Company was required to pay a non-usage charge of 0.50% per annum of the average unused portion of the credit facility. The term loan contained a provision for penalties upon early prepayment, and together with the revolving credit facility, was secured by substantially all of the Company’s assets. The loan and security agreement contained various restrictive covenants, including restrictions on the Company’s ability to dispose of assets, make acquisitions or investments, incur debt or liens, make distributions to stockholders or enter into certain types of related-party transactions. The Company was also required to comply with certain financial covenants, including a minimum asset coverage ratio, and non-financial covenants. The Company was in compliance with all financial and non-financial covenants under the previous loan and security agreement at December 31, 2013, at which point in time the Company had $14,918 in outstanding borrowings under the term loan and available credit of $15,000 under the revolving credit facility. The Company retired this debt on September 26, 2014.2016.
9. Commitments and Contingencies
Contractual Obligations
During the current year, the Company entered intoThe Company’s contractual obligations primarily consist of long-term non-cancellable operating lease agreements with payments dueleases expiring through 2020 for the purpose of office space expansion. Additionally, the Company refinanced its2021 and long-term debt during the third quartercomprised of 2014, resulting in the retirement of the previousa term loan and revolving credit facility and the issuance of a new term loan and delayed draw term loan, both of which are scheduled to mature on September 26, 2019. There were no significant changes in the Company’s contractual obligations during the year ended December 31, 2016. See Note 8, "Debt“Debt and Credit Arrangements,"” of these Notes to Consolidated Financial Statements for additional information regarding the financing transaction.Company’s long-term debt.
Operating Leases
The Company leases office space pursuant to long-term noncancellablenon-cancellable operating leases expiring through 2020.2021. The Company is responsible for paying its proportionate share of the actual operating expenses and real estate taxes under certain of these lease arrangements.
As of December 31, 2014,2016, the estimated future minimum lease payments under long-term noncancellablenon-cancellable operating leases for each of the next five years and thereafter are as follows:
| | | | Operating | |
| 2015 | $ | 2,069 |
| |
| 2016 | 1,972 |
| |
| 2017 | 2,020 |
| $ | 2,134 |
|
| 2018 | 2,068 |
| 2,093 |
|
| 2019 | 2,117 |
| 2,141 |
|
| 2020 | | 736 |
|
| 2021 | | 8 |
|
| Thereafter | 711 |
| — |
|
| Total future minimum lease payments | $ | 10,957 |
| $ | 7,112 |
|
Rent expense under the Company'sCompany’s operating leases totaled $1,892, $1,997 and $1,643 $910in 2016, 2015 and $1,381 in 2014, 2013 and 2012, respectively.
Legal Matters
From timeThe Company is regularly involved in litigation, both as a plaintiff and as a defendant, relating to time, the Company has or may become party to litigation incident to the ordinary course of business.its business and operations. The Company assesses the likelihood of any adverse judgments or outcomes with respect to these matters and determines loss contingency assessments on a gross basis after assessing the probability of incurrence of a loss and whether a loss is reasonably estimable. In addition, the Company considers other relevant factors that could impact its ability to reasonably estimate a loss. A determination of the amount of reserves required, if any, for these contingencies is made after analyzing each matter. The Company’s reserves may change in the future due to new developments or changes in strategy in handling these matters. Although the results of litigation and claims cannot be predicted with certainty, the Company currently believes that the final outcome of the matters listed below will not have a material adverse effect on its business, consolidated financial position, results of operations or cash flows. Regardless of the outcome, litigation can adversely impact the Company as a result of defense and settlement costs, diversion of management resources and other factors.
FritzingerMoore, et al. v. Angie’s List, IncInc., 2:15cv-01243-SD.. On August 14, 2012,March 11, 2015, a lawsuit seeking class action status was filed against the Company in the U.S. District Court for the SouthernEastern District of Indiana (the “Court”).Pennsylvania. The lawsuit allegesalleged claims of breachfor breaches of contract and the covenant of good faith and fair dealing, fraud and fraudulent inducement, unjust enrichment allegingand violation of Pennsylvania’s Unfair Trade Practices and Consumer Protection Law premised on the allegations that the Company automatically renewsdoes not disclose that it accepts advertising payments from service providers or that the payments allegedly impact the service provider letter-grade ratings, the content and availability of reviews about the provider and the provider’s place in search-result rankings. The Company filed a motion to dismiss on May 13, 2015, which was granted in part on August 7, 2015. In particular, the plaintiff’s claims for breach of the covenant of good faith and fair dealing and unjust enrichment were dismissed from the action. On April 19, 2016, the parties agreed to settle the claims on a class-wide basis. Among other relief, the settlement provided for a cash payment of up to $2,350 to create a fund for the payment of cash to settlement class members and for the payment of plaintiffs’ attorneys’ fees and costs as approved by the Court. Settlement class members were given the option of sharing in the cash fund or selecting a free period of membership fees at a higher rate than customers are ledof up to believe, breachingfour months depending on the date and length of their membership agreements. On September 22, 2014,with Angie’s List. The settlement also provided certain prospective relief in the Court issued an Order approvingform of enhanced explanations in the parties' proposed settlement terms. UnderCompany’s membership agreement and in responses to frequently asked questions concerning, among other things, the settlement terms, total cash payments to the class will be $107. Additionally, 734,299 class members will receive a one month Angie's List membership, and 353,130 class members will receive a five dollar e-commerce voucher. The Company estimates that attorney's fees and litigation fees will amount to $875.advertising revenue earned from service providers. The Company recorded a $4,000 legal accrual$3,500 contingent liability related to this matter in the first quarter of 2016, and this amount included the estimated cost of the cash fund described above as well as the payment of reasonable notice and administration costs, attorneys’ fees and an assumption of revenue the Company would forego as a result of certain class members selecting the optio
n for a free period of membership. On December 12, 2016, the Court entered an order granting final approval of the settlement. One class member appealed the order, but the plaintiff settled with the class member, and the class member stipulated to dismiss the appeal. On January 13, 2017, the Third Circuit Court of Appeals entered an order dismissing the appeal, and the settlement at December 31, 2013. Basedbecame final and effective as of that date. The Company, with the assistance of its third-party settlement administrator, is now in the process of administering the settlement by making the above-referenced enhanced explanations regarding advertising revenue earned from service providers, by making the above-referenced cash payment into an escrow account that will be appropriately paid to the class members who selected the cash class benefit and to plaintiffs’ counsel and by providing instructions on how to redeem membership extensions to the termsclass members who selected the membership extension class benefit. The aforementioned contingent legal liability was subsequently reduced by $671 following completion of the election period for settlement approved byclass members during the Court, including payments made under the settlement to date, the Company's remaining legal settlement liability is $2,183fourth quarter. The Company’s accrual for this matter was $2,601 as of December 31, 2014. The Company believes this amount represents the best estimate of its remaining liability with respect to this litigation.2016.
Putative Securities Class Action Litigation. On December 23, 2013, the first of two putative securities class action complaints was filed in the United States District Court for the Southern District of Indiana, naming the Company and various of its current and former directors and officers as defendants. The first complaint is styled as BaronWilliams, et al. v. Angie’s List, Inc. et al., 1:13-cv-2032. 16-cv-878.On January 9, 2014, the second putative securities class action wasApril 20, 2016, a group of former employees filed a lawsuit in the United States District Court for the Southern District of Indiana. The lawsuit alleges the Company failed to pay (i) wages earned in a timely manner as required under Indiana Wage Statutes and (ii) overtime wages in violation of the Fair Labor Standards Act (29 U.S.C. §§ 206-07) and is requesting payment of all damages, including unpaid wages, interest, attorneys’ fees and other charges. First and second amended complaints were filed, adding additional named plaintiffs, and the Company’s answer to the second amended complaint was filed on July 26, 2016. The plaintiffs filed a motion for conditional certification on June 10, 2016, and the Company filed its response brief in opposition on July 15, 2016. The Court denied the plaintiffs’ motion for conditional certification on November 30, 2016 but allowed the plaintiffs to refile with a more narrow class definition. On December 9, 2016, the plaintiffs filed a renewed motion for conditional certification. The Company filed its response to the renewed motion on January 6, 2017, and the plaintiffs filed their reply on January 17, 2017. The Company is styled as currently unable to determine the likely outcome or reasonably estimate the amount or range of potential liability, if any, related to this matter, and accordingly, has not established any reserve for this matter.
BartoloneCrabtree, et al. v. Angie’s List, Inc., et al, 1:16-cv-8771:14-cv-0023. Both complaints allege that the defendants violated Section 10(b) of the Securities Exchange Act of 1934 (the “Exchange Act”) by making material misstatements in and omitting material information from the Company’s public disclosures concerning the Company’s business prospects. On June 16, 2014, the Court consolidated the two cases and appointed United Food & Commercial Workers Local 464A Pension Fund as lead plaintiff (“Local 464A”). On August 29, 2014, Local 464A filed its consolidated Amended Complaint (the "Amended Complaint"). The Amended Complaint alleges that Angie's List made material misrepresentations and omissions regarding its paid membership model ("PPM"). The defendantsApril 20, 2016, three former employees filed a motion to dismiss the Amended Complaint, which has yet to be ruled upon by the Court.
Korda v. Oesterle, et al. On January 3, 2014, a derivative complaint was filedlawsuit in the United States District Court for the Southern District of Indiana. The lawsuit alleges the Company failed to pay (i) wages earned in a timely manner as required under Indiana namingWage Statutes and (ii) overtime wages in violation of the Company’s BoardFair Labor Standards Act (29 U.S.C. §§ 206-07) and is requesting payment of Directorsall damages, including unpaid wages, interest, attorneys’ fees and various currentother charges. The plaintiffs filed a first amended complaint in May 2016, adding one additional Indiana wage statute claim. The Company filed its answer and former officers as individual defendants.defenses on June 9, 2016. Discovery with respect to this matter is ongoing. The Company is named as a nominal defendant. The complaint is styled as Korda v. Oesterle, et al., 1:14-cv-00004. The complaint asserts thatcurrently unable to determine the individual defendants breached their fiduciary duty based on their knowledge thatlikely outcome or reasonably estimate the Company’s public statements during 2013 concerning the Company’s business prospects were allegedly misleading. The complaint also alleges that certain defendants breached their fiduciary duty by selling sharesamount or range of Angie’s List common stock between December 2012potential liability, if any, related to this matter, and December 2013. The plaintiff asksaccordingly, has not established any reserve for unspecified amounts in damages, interest and costs as well as ancillary relief. The Court issued an order staying the action pending a ruling on the motion to dismiss Local 464A’s Amended Complaint in the Putative Securities Class Action Litigation described above. this matter.
Clark v. Oesterle, et al. On October 17, 2014, a derivative complaint was filed in the Court of Chancery of the State of Delaware, naming members of the Company’s Board of Directors and various current and former officers as individual defendants. The Company is named as a nominal defendant. The complaint is styled as Clark v. Oesterle, et al., C.A. No. 10255. The complaint alleges that the individual defendants breached their fiduciary duties by making misleading representations regarding, among other things, the Company’s business prospects. The complaint also alleges that certain individual defendants breached their fiduciary duties by selling shares of Angie’s List common stock between February 2013 and October 2013. The plaintiff asks for unspecified amounts in damages, interest and costs as well as ancillary relief. The Court issued an order staying the action pending a ruling on the motion to dismiss Local 464A’s Amended Complaint in the Putative Securities Class Action Litigation described above.
10. Profit-Sharing Plan
The Company sponsors a 401(k) profit-sharing plan (the Plan)“Plan”) covering substantially all of its personnel. The Company’s contributions to the Plan are discretionary. The Company contributed 3% of gross pay for all eligible personnel to the Plan in 2016, 2015 and 2014, which amounted to $2,211, $1,500$3,159, $2,881 and $1,032 in 2014, 2013 and 2012,$2,211, respectively.
11. Stock-Based Compensation
In April 2010, the Company adopted an Omnibus Incentive Plan (the (“Incentive Plan)Plan”) in order to provide an incentivestock-based compensation to certain executive officers, personneldirectors and directors.certain other employees. The Incentive Plan was amended and restated effective August 2011, increasing the number of shares issuable to 5,090,496. In March 2012, October 2013 and July 2014,each year since, additional shares of stock were reserved for issuance, bringing the total available shares issuable to 13,753,277.19,609,325. As of December 31, 2014,2016, there were 11,855,06016,621,491 shares of common stock reserved under the Incentive Plan, of which 6,416,1631,213,290 shares remained available for future grants. To date, the Company has granted stock options, restricted stock units (“RSUs”) and performance awards of restricted stock units (“PRSUs”) under the Incentive Plan, the latter two of which were issued for the first time during 2015.
In connection with the adoption of ASU 2016-09 in August 2016, the Company elected to begin accounting for forfeitures of share-based payment awards as they occur in lieu of the Company’s previous practice of estimating the number of awards expected to be forfeited and adjusting the estimate when it was no longer probable that the corresponding service condition would be fulfilled.
Stock Options
A summary of stock option activity under the Incentive Plan as of December 31, 2016 and 2015 and changes during the years then ended is as follows:
|
| | | | | | | | | | | | | |
| | | Number of Shares | | Weighted-Average
Exercise Price | | Weighted-Average
Remaining Contractual Term | | Aggregate
Intrinsic Value |
| | | | | | | (in years) | | (in thousands) |
| Outstanding at December 31, 2014 | | 5,438,897 |
| | $ | 13.09 |
| | 8.59 | | $ | 21 |
|
| Granted | | 3,026,780 |
| | 6.30 |
| | | | |
| Exercised | | (87,601 | ) | | 7.70 |
| | | | |
| Forfeited/Cancelled | | (1,900,204 | ) | | 12.18 |
| | | | |
| Outstanding at December 31, 2015 | | 6,477,872 |
| | $ | 10.26 |
| | 8.24 | | $ | 9,383 |
|
| Granted | | 1,463,051 |
| | 8.74 |
| | | | |
| Exercised | | (268,931 | ) | | 7.62 |
| | | | |
| Forfeited/Cancelled | | (675,707 | ) | | 9.26 |
| | | | |
| Outstanding at December 31, 2016 | | 6,996,285 |
| | $ | 10.14 |
| | 7.29 | | $ | 4,469 |
|
|
| | | | | | | | | | | | | |
| | | Number of Shares | | Weighted-Average
Exercise Price | | Weighted-Average
Remaining Contractual Term | | Aggregate
Intrinsic Value |
| | | | | | | (in years) | | (in thousands) |
| Vested and Exercisable at December 31, 2015 | | 2,211,094 |
| | $ | 12.09 |
| | 7.18 | | $ | 1,345 |
|
| Unvested at December 31, 2015 | | 4,266,778 |
| | 9.32 |
| | 8.34 | | |
| Vested and Exercisable at December 31, 2016 | | 3,269,095 |
| | $ | 11.57 |
| | 6.12 | | $ | 1,399 |
|
| Unvested at December 31, 2016 | | 3,727,190 |
| | 8.89 |
| | 7.61 | | |
Stock options are awarded with an exercise price equal to the market close price on the date of grant. The contractual terms forof stock options expire ten years from the grant date and generally vest over a period of four years. The fair value of stock options on the date of grant as determined using the Black-Scholes option-pricing model is amortized on a straight-line basis over the requisite service period. The aggregate intrinsic value shown in the tables above is calculated using the difference between the exercise price of the underlying stock options and the closing price of the Company’s stock on each respective date presented.
A summary of stock option activity under the Incentive Plan as of December 31, 2014 and 2013 and changes during the periods then ended are as follows:
|
| | | | | | | | | | | | | |
| | | Number of Shares | | Weighted-Average Price/Share | | Weighted-Average Remaining Contractual Term | | Aggregate Intrinsic Value |
| | | | | | | (in years) | | |
| Outstanding at December 31, 2012 | | 2,820,619 |
| | $ | 9.11 |
| | 8.62 | | $ | 8,687 |
|
| Granted | | 1,923,206 |
| | 19.46 |
| | | | |
| Exercised | | (588,769 | ) | | 8.69 |
| | | | |
| Cancelled | | (844,292 | ) | | (11.16 | ) | | | | |
| Outstanding at December 31, 2013 | | 3,310,764 |
| | $ | 14.67 |
| | 8.63 | | $ | 9,717 |
|
| Granted | | 3,239,740 |
| | 10.89 |
| | | | |
| Exercised | | (60,632 | ) | | 8.26 |
| | | | |
| Cancelled | | (1,050,975 | ) | | (11.54 | ) | | | | |
| Outstanding at December 31, 2014 | | 5,438,897 |
| | $ | 13.09 |
| | 8.59 | | $ | 21 |
|
|
| | | | | | | | | | | | | |
| | | Number of Shares | | Weighted-Average Price/Share | | Weighted-Average Remaining Contractual Term | | Aggregate Intrinsic Value |
| | | | | | | (in years) | | |
| Vested and Exercisable at December 31, 2013 | | 894,813 |
| | $ | 9.38 |
| | 7.61 | | $ | 5,358 |
|
| Unvested at December 31, 2013 | | 2,415,951 |
| | 16.63 |
| | 7.91 | | |
| Vested and Exercisable at December 31, 2014 | | 1,248,711 |
| | $ | 12.97 |
| | 7.23 | | $ | — |
|
| Unvested at December 31, 2014 | | 4,190,186 |
| | 13.13 |
| | 9.04 | | |
The fair value of awardsstock options granted is estimated at the date of grant using the Black-Scholes option-pricing model, withutilizing the following weighted-average assumptions:assumptions for the years ended December 31, 2016, 2015 and 2014:
| | | Year of Grant | | Risk-Free
Interest
Rate | | Dividend
Yield | | Expected
Term | | Volatility
Factor | | Risk-Free
Interest
Rate | | Dividend
Yield | | Expected
Term | | Volatility |
| | | | | | | (in years) | | | | | | | | (in years) | | |
| 2012 | | 0.71% | | 0% | | 4.40 | | 60.0% | |
| 2013 | | 1.02% | | 0% | | 4.90 | | 57.0% | |
| 2014 | | 1.67% | | 0% | | 5.00 | | 53.0% | | 1.67% | | 0% | | 5.00 | | 53.0% |
| 2015 | | | 1.48% | | 0% | | 5.00 | | 53.1% |
| 2016 | | | 1.26% | | 0% | | 5.00 | | 64.6% |
Expected volatilityThe risk-free interest rate is based on historical volatilities for publicly traded common stockyields of comparable peer companies overU.S. Treasury securities with a maturity similar to the estimated expected lifeterm of the stock options. The expected term represents the period of time the stock options are expected to be outstanding. The dividend yield assumption is based on the fact that the Company does not have a history of issuing dividends and does not anticipate issuing dividends in the near term. The risk-free interest rate isexpected term represents the period of time the stock options are expected to be outstanding based on yieldshistorical experience. Prior to 2016, the expected volatility assumption was estimated based on historical volatilities for publicly traded common stock of U.S. Treasury securitiescomparable peer companies with maturities similar tosimilarities in size, lines of business, market capitalization, revenue or financial leverage over the estimated expected termlife of the stock options. As the Company believes there is now sufficient historical data available with respect to the volatility of its common stock, effective January 1, 2016, the expected volatility assumption was based on the Company’s own historical volatility.
The weighted-average grant date fair value of stock options granted during 2016, 2015 and 2014 was $4.76, $2.95 and 2013 was $5.12 and $9.38 per share, respectively. The total intrinsic value of stock options exercised during 2016, 2015 and 2014 2013was $428, $133 and 2012 was $456, $7,376 and $297, respectively. The Company recognized stock-based compensation expense of $7,889, $4,064$8,114, $7,321 and $2,943$7,889 in the consolidated statements of operations related to stock options in 2014, 20132016, 2015 and 2012,2014, respectively. As of December 31, 2014,2016, total unrecognized stock-based compensation expense related to non-vestedunvested stock options not yet recognized was $21,227,$11,559, which will be recognized over the remaining weighted-average life of the awards, 2.872.30 years.
Restricted Stock Units
A summary of RSU activity under the Incentive Plan for the years ended December 31, 2016 and 2015 and changes during the years then ended is as follows:
|
| | | | | | | |
| | | RSUs |
| | | Number of Shares | | Weighted-Average Grant Date Fair Value |
| Unvested at December 31, 2014 | | — |
| | $ | — |
|
| Granted | | 1,440,645 |
| | 6.06 |
|
| Vested | | — |
| | — |
|
| Forfeited/Cancelled | | (225,731 | ) | | 6.54 |
|
| Unvested at December 31, 2015 | | 1,214,914 |
| | $ | 5.97 |
|
| Granted | | 1,823,767 |
| | 8.50 |
|
| Vested | | (434,619 | ) | | 6.35 |
|
| Forfeited/Cancelled | | (400,003 | ) | | 7.74 |
|
| Unvested at December 31, 2016 | | 2,204,059 |
| | $ | 7.66 |
|
RSUs are measured based on the fair market value of the underlying stock on the date of grant. RSUs generally vest over a period of four years from the grant date and are amortized on a straight-line basis over the requisite service period. Once vested, shares will generally either be issued net of the applicable tax withholding requirements to be paid by the Company on behalf of employees, or a portion of the shares issued will subsequently be sold by employees to satisfy the tax obligations created by the vesting of RSUs.
The Company recognized stock-based compensation expense of $4,756, $973 and $0 in the consolidated statements of operations related to RSUs in 2016, 2015 and 2014, respectively. As of December 31, 2016, total unrecognized stock-based compensation expense related to unvested RSUs was $13,922, which will be recognized over the remaining weighted-average life of the awards, 3.05 years.
Performance Awards of Restricted Stock Units
A summary of PRSU activity under the Incentive Plan for the years ended December 31, 2016 and 2015 and changes during the years then ended is as follows:
|
| | | | | | | |
| | | PRSUs |
| | | Number of Shares | | Weighted-Average Grant Date Fair Value |
| Unvested at December 31, 2014 | | — |
| | $ | — |
|
| Granted | | 955,084 |
| | 2.95 |
|
| Vested | | — |
| | — |
|
| Forfeited/Cancelled | | — |
| | — |
|
| Unvested at December 31, 2015 | | 955,084 |
| | $ | — |
|
| Granted | | 3,034,329 |
| | 6.55 |
|
| Vested | | (298,466 | ) | | 3.68 |
|
| Forfeited/Cancelled | | (286,256 | ) | | 6.55 |
|
| Unvested at December 31, 2016 | | 3,404,691 |
| | $ | 5.79 |
|
The Company’s President and Chief Executive Officer, Scott A. Durchslag, was granted 955,084 PRSUs on September 8, 2015 under the Incentive Plan. The PRSUs, which are market condition performance share-based payment awards, consist of four tranches, each with separate performance criteria based upon the Company’s achievement of certain predetermined stock price thresholds. The PRSUs were measured on the date of grant using a Monte Carlo option-pricing simulation model. The first and second PRSU tranches were earned during 2015, prior to the first anniversary of the grant date, and commenced vesting during 2016, one-half upon the first anniversary of the grant date and the remaining one-half ratably on a quarterly basis over a one-year period thereafter. PRSUs earned subsequent to the first anniversary of the grant date will vest one-half upon achievement of the corresponding stock price target, and the remaining one-half will vest ratably on a quarterly basis over a one-year period thereafter. No PRSUs have been earned subsequent to the first anniversary of the grant date as of December 31, 2016.
On June 29, 2016, the Company granted 3,034,329 PRSUs under the Incentive Plan to its executive officers and other members of the Company’s senior leadership team as of that date (i.e., the “2016 LTIP”). The PRSUs granted are contingent upon the Company’s performance with respect to certain predetermined Total Cumulative Revenue targets over the 33-month period commencing April 1, 2016 and concluding December 31, 2018, subject to the Company’s achievement of a predetermined cumulative Adjusted EBITDA threshold over the same time period. Of the 3,034,329 PRSUs granted, 2,748,073 PRSUs remained outstanding as of December 31, 2016 due to forfeitures during the year, representing the number of shares to be issued at the 100% target achievement level for this award. The number of shares ultimately issued could be 0% or range from 75% (threshold achievement level) to 200% (maximum achievement level) of the number of PRSUs outstanding, based on the Company’s performance in relation to the performance conditions, and linear interpolation will be applied should Total Cumulative Revenue fall between the threshold and maximum achievement levels. Any PRSUs earned under the 2016 LTIP will vest in full on May 31, 2019, subject to continued employment as of that date. The Company is recognizing stock-based compensation expense for these awards over the vesting period based on the projected probability of achievement of the aforementioned performance conditions as of the end of each reporting period during the performance period and may periodically adjust the recognition of such expense, as necessary, in response to any changes in the Company’s forecasts with respect to the performance conditions. For the year ended December 31, 2016, the Company did not recognize any stock-based compensation expense related to the 2016 LTIP based on the Company’s determination that achievement of the performance conditions was not probable as of that date.
Once vested, shares will generally either be issued net of the applicable tax withholding requirements to be paid by the Company on behalf of employees, or a portion of the shares issued will subsequently be sold by employees to satisfy the tax obligations created by the vesting of PRSUs. The Company recognized stock-based compensation expense of $1,685, $581 and $0 in the consolidated statements of operations related to PRSUs in 2016, 2015 and 2014, respectively. As of December 31, 2016, total unrecognized stock-based compensation expense related to PRSUs was $552, which will be recognized over a remaining weighted-average life of 0.93 years.
Employee Stock Purchase Plan
The Company implemented an Employee Stock Purchase Plan (“ESPP”) during 2016. The ESPP allows eligible employees to purchase shares of the Company’s common stock at a discount through payroll deductions of up to 15% of their eligible compensation, subject to any plan limitations, and provides for six-month offering periods, commencing in May and November of each year. At the end of each offering period, participating employees are able to purchase shares of common stock at 90% of the Company’s stock price at market close on the first trading day of the offering period or the last trading day of the offering period, whichever is lower. In April 2016, the Company registered 1,755,500 shares of common stock under the ESPP.
During 2016, there were 68,723 shares purchased by employees under the ESPP at a purchase price of $6.93 per share. The Company recognized stock-based compensation expense of $189 in the consolidated statement of operations related to the ESPP in 2016. As of December 31, 2016, 1,686,777 shares of common stock remained available for purchase under the ESPP.
12. Treasury Stock
The Company had 8,558,712 shares of its common stock in treasury stock as of December 31, 20142016 and 2013.2015. Of these, the Company’s wholly-ownedwholly owned subsidiary holds 5,743,744 shares of common stock. There was no activity or change with respect to the Company'sCompany’s treasury stock balance during the years ended December 31, 20142016 and 2013.2015.
13. Income Taxes
The Company accounts for income taxes in accordance with authoritative guidance, which requires the use of the asset and liability method. Under this method, deferred income tax assets and liabilities are determined based upon the difference between the consolidated financial statement amounts and the tax basis of assets and liabilities and are measured using the enacted tax rate expected to apply to taxable income in the years in which the differences are expected to be reversed. As management believes that it is more likely than not that the Company will not realize the full amount of its net deferred tax assets, the Company recorded a valuation allowance for the deferred tax assets as of December 31, 2014, 20132016, 2015 and 2012, respectively.2014.
The provision for income taxes for the years ended December 31, 2014, 20132016, 2015 and 20122014 consisted of the following components:
| | | | | 2014 | | 2013 | | 2012 | | 2016 | | 2015 | | 2014 |
| Current: | | | | | | | | | | | | |
| U.S. federal | | $ | — |
| | $ | — |
| | $ | — |
| | $ | — |
| | $ | — |
| | $ | — |
|
| State | | 40 |
| | 34 |
| | — |
| | 21 |
| | 27 |
| | 40 |
|
| Total current | | 40 |
| | 34 |
| | — |
| | 21 |
| | 27 |
| | 40 |
|
| Deferred: | | | | | | | | | | | | |
| U.S. federal | | $ | 10 |
| | $ | 4 |
| | $ | 2 |
| | $ | 17 |
| | $ | 17 |
| | $ | 10 |
|
| State | | 1 |
| | 2 |
| | 3 |
| | 5 |
| | — |
| | 1 |
|
| Total deferred | | 11 |
| | 6 |
| | 5 |
| | 22 |
| | 17 |
| | 11 |
|
| Provision for income taxes | | $ | 51 |
| | $ | 40 |
| | $ | 5 |
| | $ | 43 |
| | $ | 44 |
| | $ | 51 |
|
The reconciliation of income tax expense computed at the U.S. federal statutory rate to the Company’s effective tax rate for the years ended December 31, 2014, 20132016, 2015 and 20122014 is as follows:
| | | | | 2014 | | 2013 | | 2012 | | 2016 | | 2015 | | 2014 |
| U.S. federal income tax rate | | 34.0 | % | | 34.0 | % | | 34.0 | % | | 34.0 | % | | 34.0 | % | | 34.0 | % |
| State income taxes, net of federal benefit | | (0.5 | )% | | 6.4 | % | | 5.7 | % | | 9.1 | % | | (1.3 | )% | | (0.5 | )% |
| Valuation allowance | | (20.1 | )% | | (39.7 | )% | | (39.1 | )% | | (41.0 | )% | | (29.7 | )% | | (20.1 | )% |
| Equity compensation | | (9.4 | )% | | (0.4 | )% | | — | % | |
| Stock-based compensation | | | 6.3 | % | | 15.6 | % | | (9.4 | )% |
| Research and development credits | | | 1.0 | % | | (16.4 | )% | | — | % |
| Internal Revenue Code Section 162(m) | | | (8.3 | )% | | — | % | | — | % |
| Other | | (4.4 | )% | | (0.4 | )% | | (0.6 | )% | | (1.7 | )% | | (1.8 | )% | | (4.4 | )% |
| Effective income tax rate | | (0.4 | )% | | (0.1 | )% | | 0.0 | % | | (0.6 | )% | | 0.4 | % | | (0.4 | )% |
Significant components of the Company’s deferred tax assets and liabilities as of December 31, 20142016 and 20132015 are as follows:
| | | | | 2014 | | 2013 | | 2016 | | 2015 |
| Deferred tax assets: | | | | | | | | |
| Current: | | | | | |
| Deferred revenue | | $ | 35,477 |
| | $ | 32,643 |
| | $ | 27,239 |
| | $ | 34,177 |
|
| Noncurrent: | | | | | |
| Intangibles - other | | 11,275 |
| | 12,138 |
| | 9,210 |
| | 10,088 |
|
| Net operating loss carryforwards | | 48,433 |
| | 39,757 |
| | 62,033 |
| | 50,885 |
|
| Stock-based compensation | | 3,773 |
| | 1,999 |
| | 8,529 |
| | 5,301 |
|
| Research and development credits | | | 2,864 |
| | 2,556 |
|
| Other | | 4,930 |
| | 4,337 |
| | 5,341 |
| | 3,756 |
|
| Total deferred tax assets | | 103,888 |
| | 90,874 |
| | 115,216 |
| | 106,763 |
|
| Valuation allowance | | (89,271 | ) | | (87,006 | ) | | (89,854 | ) | | (84,035 | ) |
| Total net deferred tax assets | | 14,617 |
| | 3,868 |
| | 25,362 |
| | 22,728 |
|
| | | | | | | | | |
| Deferred tax liabilities: | | | | | | | | |
| Current: | | | | | |
| Prepaid expenses | | $ | (4,806 | ) | | $ | (3,923 | ) | | $ | (4,022 | ) | | $ | (3,853 | ) |
| Noncurrent: | | | | | |
| Property, equipment and software | | (9,811 | ) | | 55 |
| | (21,340 | ) | | (18,875 | ) |
| Goodwill | | (181 | ) | | (169 | ) | | (220 | ) | | (198 | ) |
| Total net deferred tax liabilities | | (14,798 | ) | | (4,037 | ) | | (25,582 | ) | | (22,926 | ) |
| Total net deferred tax liability | | $ | (181 | ) | | $ | (169 | ) | | $ | (220 | ) | | $ | (198 | ) |
As of December 31, 2014,2016, the Company had net operating loss carryforwards for federal and state income tax purposes of approximately $128,328$159,329 and $158,856,$210,891, respectively. These net operating losses include an unrealized benefit of approximately $6,056 related to share-based compensation that will be recorded in equity when realized. The net operating loss carryforwards will expire in future years, primarily beginning in 2027. The net operating losses may be subject to annual limitations of use under Internal Revenue Code Section 382. The Company files income tax returns in the U.S. federal jurisdiction and in various state jurisdictions. Income tax returns for the short year ended December 31, 2010 to present are open for examination in the federal jurisdiction and in significant state jurisdictions.
A valuation allowance is provided when it is more likely than not that some portion of the deferred tax asset will not be realized. The Company does not benefit from its deferred tax assets based on the deferred tax liabilities related to goodwill that are not expected to reverse during the carryforward period. As this deferred tax liability would not reverse until some future indefinite period when the intangibles are either sold or impaired, any resulting temporary differences cannot be considered a source of future taxable income to support realization of the deferred tax assets.
At December 31, 20142016 and 2013,2015, the Company did not have any material unrecognized income tax benefits recorded in its consolidated balance sheets.
14. Related-Party Transactions
Henry Amalgamated
In November 2012, the Company completed the purchase of its headquarters facilities (the “properties”), which were owned by Henry Amalgamated, LLC and Henry Amalgamated II, LLC, Indiana limited liability companies (together, “Henry Amalgamated”), for an aggregate purchase price of $6,250, excluding fees and other charges. In connection with its acquisition of the properties, the Company’s leases for its headquarters facilities were terminated.
William S. Oesterle, the Company’s Chief Executive Officer and member of the Company’s board of directors, owned a 70% interest in Henry Amalgamated at the time of the transaction described above. As the transaction constitutes a related-party transaction at the direction of the board of directors (the “board”), the audit committee of the Company’s board reviewed and negotiated the Company’s acquisition of the property. With the audit committee’s recommendation and after a full board review, the board approved this transaction.
Prior to the acquisition, the Company leased the properties purchased from Henry Amalgamated. In addition to the primary acquisition costs of $6,250, the Company paid $178 to Henry Amalgamated for other charges incurred to prepare the properties for use, of which $150 was capitalized with the purchase of the properties. Rent expense to Henry Amalgamated was $11 and $977 for 2013 and 2012, respectively. The Company did not make any payments to Henry Amalgamated during 2014, nor did the Company owe Henry Amalgamated any amounts as of December 31, 2014 or 2013.
DocuSign
During 2012, the Company entered into a contract with DocuSign Inc. ("DocuSign") for the provision of electronic signature technology and digital transaction management services to facilitate electronic exchanges of contracts and signed documents. The original contract expired in 2014, and a new contract was subsequently executed with a term extending to 2017. Keith J. Krach, who retired as the Chairman of the board in May 2014, currently serves as the Chief Executive Officer, President and Chairman of the board of directors of DocuSign. The Company's contract with DocuSign thereby represents a related-party transaction. Payments made by the Company to DocuSign for 2014, 2013 and 2012 were $134, $106 and $69, respectively. The Company did not owe DocuSign any amounts as of December 31, 2014 or 2013.
15.14. Quarterly Financial Information (Unaudited)
The tabletables below setsset forth selected quarterly financial data for each of the last two fiscal years (dollars in thousands, except per share data).years.
| | | | | Fiscal Year Ended December 31, 2014 | | Fiscal Year Ended December 31, 2016 |
| | | First Quarter | | Second Quarter | | Third Quarter | | Fourth Quarter | | First Quarter | | Second Quarter | | Third Quarter | | Fourth Quarter |
| | | (unaudited) | | (unaudited) | | (unaudited) | | (unaudited) | | (unaudited) | | (unaudited) | | (unaudited) | | (unaudited) |
| Total revenue | | $ | 72,657 |
| | $ | 78,896 |
| | $ | 81,306 |
| | $ | 82,152 |
| | $ | 83,856 |
| | $ | 83,060 |
| | $ | 79,745 |
| | $ | 76,668 |
|
| Operating income (loss) | | (3,307 | ) | | (18,223 | ) | | (4,734 | ) | | 15,902 |
| | (4,019 | ) | | 6,015 |
| | (15,380 | ) | | 10,290 |
|
| Net income (loss) | | (3,783 | ) | | (18,356 | ) | | (5,207 | ) | | 15,272 |
| | (4,642 | ) | | 4,657 |
| | (16,820 | ) | | 8,948 |
|
| Net income (loss) per common share - basic and diluted | | $ | (0.06 | ) | | $ | (0.31 | ) | | $ | (0.09 | ) | | $ | 0.26 |
| |
| Net income (loss) per common share — basic | | | (0.08 | ) | | 0.08 |
| | (0.29 | ) | | 0.15 |
|
| Net income (loss) per common share — diluted | | | (0.08 | ) | | 0.08 |
| | (0.29 | ) | | 0.15 |
|
| | | | | Fiscal Year Ended December 31, 2013 | | Fiscal Year Ended December 31, 2015 |
| | | First Quarter | | Second Quarter | | Third Quarter | | Fourth Quarter | | First Quarter | | Second Quarter | | Third Quarter | | Fourth Quarter |
| | | (unaudited) | | (unaudited) | | (unaudited) | | (unaudited) | | (unaudited) | | (unaudited) | | (unaudited) | | (unaudited) |
| Total revenue | | $ | 52,171 |
| | $ | 59,215 |
| | $ | 65,500 |
| | $ | 68,756 |
| | $ | 83,543 |
| | $ | 87,335 |
| | $ | 86,992 |
| | $ | 86,255 |
|
| Operating income (loss) | | (7,469 | ) | | (13,855 | ) | | (13,028 | ) | | 3,271 |
| | 5,282 |
| | (7,556 | ) | | 775 |
| | 14,757 |
|
| Net income (loss) | | (7,947 | ) | | (14,334 | ) | | (13,511 | ) | | 2,803 |
| | 4,360 |
| | (8,349 | ) | | 82 |
| | 14,150 |
|
| Net income (loss) per common share - basic and diluted | | $ | (0.14 | ) | | $ | (0.25 | ) | | $ | (0.23 | ) | | $ | 0.05 |
| |
| Net income (loss) per common share — basic | | | 0.07 |
| | (0.14 | ) | | 0.00 |
| | 0.24 |
|
| Net income (loss) per common share — diluted | | | 0.07 |
| | (0.14 | ) | | 0.00 |
| | 0.24 |
|
Information in any one quarterly period should not be considered indicative of annual results due to the effects of seasonality on the Company’s business.
The first quarter of 2016 included a $3,500 charge to general and administrative expense related to a contingent legal liability recorded in connection with the Moore litigation and related cases. This contingent liability was subsequently reduced during the fourth quarter of 2016, yielding a benefit of $671 to fourth quarter general and administrative expense.
In connection with the Company’s early adoption of ASU 2016-09 during the third quarter of 2016, the Company was required to record a modified retrospective transition adjustment at the time of adoption to reflect an increase in stock-based compensation expense for 2016 related to the Company’s forfeitures election under this new standard. Although this adjustment was recorded during the third quarter, given the modified retrospective nature of the adjustment, the Company was precluded from presenting the full amount of the adjustment in the consolidated financial statements for the quarter ended September 30, 2016 and was instead required to update amounts previously reported, yielding retrospective increases to general and administrative expense of $638 and $140 for the quarters ended March 31, 2016 and June 30, 2016, respectively. As a result, the operating income (loss), net income (loss) and corresponding per share figures presented in the table above for the first and second quarters of 2016 differ from amounts previously reported.
For the third quarter of 2016, the Company’s basic and diluted weighted-average number of common shares outstanding was 58,883,623, and basic and diluted net loss per common share was $(0.29), as reflected in the table above. These amounts were previously incorrectly reported as 59,495,592 and $(0.28), respectively. The Company does not believe this correction is material to these consolidated financial statements or any previously issued consolidated financial statements.
The second quarter of 2015 included a $686 charge to general and administrative expense for the recognition of a non-cash long-lived asset impairment related to the Company’s decision not to pursue its Indianapolis campus expansion plan.
The fourth quarter of 2014 includes a $1,7782015 included an $892 charge to product and technology expense for the recognition of a one-time, non-cash long-lived asset impairment related to the abandonment of certain capitalized website and software development assets.
The third quarter of 2014 includes a $458 non-operating loss on debt extinguishment, inclusive of the prepayment penalties, additional interest and other fees and expenses associated with the prepayment of the Company's previous loan and security agreement as well as the amounts written off for the remaining deferred financing fees and warrant interest expense under the prior debt facility.
The fourth quarter of 2013 includes a $4,000 charge to general and administrative expense reflective of an estimate for settlement of pending litigation.
ITEM 9. CHANGES IN AND DISAGREEMENTS WITH ACCOUNTANTS ON ACCOUNTING AND FINANCIAL DISCLOSURE
None.
ITEM 9A. CONTROLS AND PROCEDURES
Evaluation of Disclosure Controls and Procedures
We maintain “disclosure controls and procedures,” as such term is defined in Rule 13a-15(e) and Rule 15d-15(e) under the Securities Exchange Act of 1934, as amended (the Exchange Act)“Exchange Act”), that are designed to ensure that information required to be disclosed by us in reports that we file or submit under the Exchange Act is recorded, processed, summarized and reported within the time periods specified in SECU.S. Securities and Exchange Commission rules and forms, and that such information is accumulated and communicated to our management, including our Chief Executive Officer and Chief Financial Officer, as appropriate, to allow timely decisions regarding required disclosure.
Based on their evaluation as of the end of the period covered by this Annual Report on Form 10-K, our Chief Executive Officer and Chief Financial Officer have concluded that, as of such date, our disclosure controls and procedures are effective at the reasonable assurance level.
Management’s Report on Internal Control Over Financial Reporting
Our management is responsible for establishing and maintaining adequate internal control over financial reporting, as defined in Rule 13(a)-15(f)13a-15(f) of the Exchange Act, to provide reasonable assurance regarding the reliability of our financial reporting and the preparation of financial statements for external purposes in accordance with U.S. generally accepted accounting principles.
Our management conducted an evaluation of the effectiveness of our internal control over financial reporting as of December 31, 20142016 based on the criteria set forth in the Internal Control — Integrated Framework issued by the Committee of Sponsoring Organizations of the Treadway Commission (2013 Framework). Based on this evaluation, management concluded that our internal control over financial reporting was effective as of December 31, 2014.2016. Management reviewed the results of its evaluation with our Audit Committee.audit committee.
The effectiveness of our internal control over financial reporting was audited by Ernst & Young, LLP, an independent registered public accounting firm, as of December 31, 2014,2016, and an attestation report on our internal control over financial reporting was issued by them and is included in this Annual Report on Form 10-K.
Changes in Internal Control overOver Financial Reporting
There was no change in our internal control over financial reporting identified in connection with the evaluation required by RuleRules 13a-15(d) and 15d-15(d) of the Exchange Act that occurred during the three months ended December 31, 2014fourth quarter of 2016 that has materially affected, or is reasonably likely to materially affect, our internal control over financial reporting.
Limitations on Effectiveness of Controls and Procedures
In designing and evaluating our disclosure controls and procedures, management recognizes that disclosure controls and procedures, no matter how well conceived and operated, can provide only reasonable, not absolute, assurance that the objectives of the disclosure controls and procedures are met. Additionally, in designing disclosure controls and procedures, our management was required to apply its judgment in evaluating the cost-benefit relationship of possible disclosure controls and procedures.
Report of Independent Registered Public Accounting Firm
The Board of Directors and Stockholders of Angie’s List, Inc.
We have audited Angie’s List, Inc.’s internal control over financial reporting as of December 31, 2014,2016, based on criteria established in Internal Control—Control — Integrated Framework issued by the Committee of Sponsoring Organizations of the Treadway Commission "(2013(2013 Framework)" (the COSO criteria). Angie’s List, Inc.’s management is responsible for maintaining effective internal control over financial reporting, and for its assessment of the effectiveness of internal control over financial reporting included in the accompanying Management’s Report on Internal Control over Financial Reporting. Our responsibility is to express an opinion on the company’s internal control over financial reporting based on our audit.
We conducted our audit in accordance with the standards of the Public Company Accounting Oversight Board (United States). Those standards require that we plan and perform the audit to obtain reasonable assurance about whether effective internal control over financial reporting was maintained in all material respects. Our audit included obtaining an understanding of internal control over financial reporting, assessing the risk that a material weakness exists, testing and evaluating the design and operating effectiveness of internal control based on the assessed risk, and performing such other procedures as we considered necessary in the circumstances. We believe that our audit provides a reasonable basis for our opinion.
A company’s internal control over financial reporting is a process designed to provide reasonable assurance regarding the reliability of financial reporting and the preparation of financial statements for external purposes in accordance with generally accepted accounting principles. A company’s internal control over financial reporting includes those policies and procedures that (1) pertain to the maintenance of records that, in reasonable detail, accurately and fairly reflect the transactions and dispositions of the assets of the company; (2) provide reasonable assurance that transactions are recorded as necessary to permit preparation of financial statements in accordance with generally accepted accounting principles, and that receipts and expenditures of the company are being made only in accordance with authorizations of management and directors of the company; and (3) provide reasonable assurance regarding prevention or timely detection of unauthorized acquisition, use, or disposition of the company’s assets that could have a material effect on the financial statements.
Because of its inherent limitations, internal control over financial reporting may not prevent or detect misstatements. Also, projections of any evaluation of effectiveness to future periods are subject to the risk that controls may become inadequate because of changes in conditions, or that the degree of compliance with the policies or procedures may deteriorate.
In our opinion, Angie’s List, Inc. maintained, in all material respects, effective internal control over financial reporting as of December 31, 2014,2016, based on the COSO criteria.
We also have audited, in accordance with the standards of the Public Company Accounting Oversight Board (United States), the consolidated balance sheets of Angie’s List, Inc. as of December 31, 20142016 and 2013,2015, and the related consolidated statements of operations, stockholders’ equity (deficit) and cash flows for each of the three years in the period ended December 31, 20142016 of Angie’s List, Inc. and our report dated February 25, 201521, 2017 expressed an unqualified opinion thereon.
/s/ Ernst & Young LLP
Indianapolis, Indiana
February 25, 201521, 2017
ITEM 9B. OTHER INFORMATION
None.
PART III
ITEM 10. DIRECTORS, EXECUTIVE OFFICERS AND CORPORATE GOVERNANCE
Angie’s ListWe adopted a code of business conduct and ethics for directors, officers (including Angie’s List’sour Chief Executive Officer and Chief Financial Officer) and employees, known as the Code of Business Conduct and Ethics. The Code of Business Conduct and Ethics is available on our “Investor Relations” website at investor.angieslist.com in the Corporate Governance section. Stockholders may request a free copy of the Code of Business Conduct and Ethics by sending an email request to investor@angieslist.com.
The other information required by this item will be contained in our definitive proxy statement (the “Proxy Statement”) to be filed with the Securities and Exchange Commission in connection with our 2015 annual meeting2017 Annual Meeting of stockholders,Stockholders, which is expected to be filed no later than 120 days after the end of our fiscal year ended December 31, 20142016 and is incorporated in this report by reference. Specifically, information required by this item regarding our directors and executive officers is incorporated by reference to the sections of the Proxy Statement entitled "Executive Officers"“Executive Officers” and "Information“Information Regarding the Board of Directors and its Committees."” Information required by this item regarding our corporate governance, including our audit committee, is incorporated by reference to the section of the Proxy Statement entitled "Information“Information Regarding the Board of Directors and its Committees."” Information required by this item regarding compliance with Section 16(a) of the Exchange Act is incorporated by reference to the section of the Proxy Statement entitled "Section“Section 16(a) Beneficial Ownership Reporting Compliance."”
ITEM 11. EXECUTIVE COMPENSATION
Information required by this item is incorporated by reference to the sections of the Proxy Statement entitled “Executive Compensation,” “Director Compensation,” “Information Regarding the Board of Directors and its Committees —Compensation— Compensation Committee Interlocks and Insider Participation” and “Compensation Committee Report.”
ITEM 12. SECURITY OWNERSHIP OF CERTAIN BENEFICIAL OWNERS AND MANAGEMENT AND RELATED STOCKHOLDER MATTERS
Information regarding security ownership of certain beneficial owners and management is incorporated by reference to the section of the Proxy Statement entitled “Security Ownership of Certain Beneficial Owners and Management.”
Information regarding our stockholder approved and non-approved equity compensation plans is incorporated by reference to the section of the Proxy Statement entitled “Executive Compensation — Equity Compensation Plan Information.”
ITEM 13. CERTAIN RELATIONSHIPS AND RELATED TRANSACTIONS, AND DIRECTOR INDEPENDENCE
Information required by this item is incorporated by reference to the sections of the Proxy Statement entitled “Certain Relationships and Related Party Transactions” and “Information Regarding the Board of Directors and its Committees —Independence of the Board of Directors.”
ITEM 14. PRINCIPAL ACCOUNTANT FEES AND SERVICES
Information required by this item is incorporated by reference to the section of the Proxy Statement entitled “Proposal No. 2 Ratification“Ratification of Appointment of Independent Registered Public Accounting Firm.”
PART IV
ITEM 15. EXHIBITS AND FINANCIAL STATEMENT SCHEDULES
(a) The following documents are included as part of this Annual Report on Form 10-K
(1) Index to Financial Statements
(2) Financial Statement Schedules
All other schedules arewere omitted as the information required is either inapplicable or the information is presented in the consolidated financial statements or the related notes.notes thereto.
(3) Exhibits
The documents set forth below are filed herewith or incorporated by reference to the location indicated.
|
| | | | | | |
| | | Incorporated by Reference | |
Exhibit No. | Exhibit Description | Form | File No. | Exhibit | Filing Date | Filed Herewith |
| 3.01 | Amended and Restated Certificate of Incorporation | S-1/A | 333-176503 | 3.1 | 10/31/2011 | |
| 3.02 | Amended and Restated Bylaws | S-1/A | 333-176503 | 3.2 | 10/31/2011 | |
| 4.01 | Form of Common Stock Certificate | S-1/A | 333-176503 | 4.1 | 10/31/2011 | |
| 4.02 | Amended and Restated Investor Rights Agreement, by and among Angie’s List, Inc. and the investors listed on Schedule A thereto, dated March 15, 2011, as amended | S-1 | 333-176503 | 4.2 | 8/25/2011 | |
| 10.01† | Amended and Restated Omnibus Incentive Plan and form of award agreements under the Amended and Restated Omnibus Incentive Plan | S-8 | 333-191884 | 99.1 | 10/24/2013 | |
| 10.02† | Employment Agreement, dated July 10, 2006, by and between Brownstone Publishing, LLC and Michael D. Rutz | S-1 | 333-176503 | 10.15 | 8/25/2011 | |
| 10.03† | Form of Indemnification Agreement by and between Angie’s List, Inc. and each of its executive officers and its directors not affiliated with an investment fund | S-1/A | 333-176503 | 10.18 | 9/29/2011 | |
| 10.04† | Form of Indemnification Agreement by and between Angie’s List, Inc. and each of its directors affiliated with an investment fund | S-1/A | 333-176503 | 10.19 | 9/29/2011 | |
| 10.05 | Loan and Security Agreement, dated August 31, 2011, by and between ORIX Venture Finance LLC, Bridge Bank National Association and Angie’s List, Inc. | S-1/A | 333-176503 | 10.20 | 9/29/2011 | |
| 10.06 | Project Agreement by and between Angie’s List, Inc. and the Consolidated City of Indianapolis, dated October 21, 2011 | S-1/A | 333-176503 | 10.22 | 11/2/2011 | |
| 10.07 | Purchase and sale agreement by and among Angie’s List, Inc. and Henry Amalgamated, LLC and Henry Amalgamated II, LLC | 8-K | 001-35339 | 10.1 | 11/9/2012 | |
| 10.08† | Offer Letter Agreement, dated December 20, 2012, by and between Angie's List, Inc. and J. Mark Howell | 8-K | 001-35339 | 10.1 | 1/17/2013 | |
| 10.09† | Offer Letter Agreement, dated May 14, 2013, by and between Angie's List, Inc. and Patrick Brady | 10-Q | 001-35339 | 10.1 | 7/25/2013 | |
| 10.10† | Offer Letter Agreement, dated August 20, 2013, by and between Angie's List, Inc. and Thomas R. Fox | 8-K | 001-35339 | 10.1 | 8/21/2013 | |
|
| | | | | | |
| | | Incorporated by Reference | |
Exhibit No. | Exhibit Description | Form | File No. | Exhibit | Filing Date | Filed Herewith |
| 10.11† | Amended Incentive Stock Option Grant Agreement under the Amended and Restated Omnibus Incentive Plan - Executive Officer | 10-Q | 001-35339 | 10.01 | 7/24/2014 | |
| 10.12† | Amended Nonqualified Stock Option Grant Agreement under the Amended and Restated Omnibus Incentive Plan - Executive Officer | 10-Q | 001-35339 | 10.02 | 7/24/2014 | |
| 10.13† | Amended Nonqualified Stock Option Grant Agreement under the Amended and Restated Omnibus Incentive Plan - Non-Employee Director | 10-Q | 001-35339 | 10.03 | 7/24/2014 | |
| 10.14 | Financing Agreement, dated as of September 26, 2014, by and among Angie's List, Inc., other subsidiaries of Angie's List, Inc. joined after in such capacity as Borrowers, certain subsidiaries of Angie's List, Inc. as Guarantors, the lenders from time to time party thereto as Lenders and TCW Asset Management Company as Collateral Agent and Administrative Agent ^ | 10-Q | 001-35339 | 10.01 | 10/22/2014 | |
| 10.15 | Pledge and Security Agreement, dated as of September 26, 2014, by and among Angie's List, Inc., AL Campus Kids, LLC and AL BV Investments, Inc. as Grantors and TCW Asset Management Company as Collateral Agent | 10-Q | 001-35339 | 10.02 | 10/22/2014 | |
| 10.16† | Restricted Stock Unit Agreement under the Amended and Restated Omnibus Incentive Plan - Executive Officer & Vice President | | | | | X |
| 10.17† | Restricted Stock Unit Agreement under the Amended and Restated Omnibus Incentive Plan - Other Employees | | | | | X |
| 21.01 | Subsidiaries of the Registrant | S-1 | 333-176503 | 21.1 | 8/25/2011 | |
| 23.01 | Consent of Independent Registered Public Accounting Firm | | | | | X |
| 24.01 | Power of Attorney (included on signature page of this Annual Report on Form 10-K) | | | | | X |
| 31.01 | Certification of the Principal Executive Officer Pursuant to Section 302 of the Sarbanes-Oxley Act | | | | | X |
| 31.02 | Certification of the Principal Financial Officer Pursuant to Section 302 of the Sarbanes-Oxley Act | | | | | X |
| 32.01 | Certification of the Principal Executive Officer Pursuant to Section 906 of the Sarbanes-Oxley Act* | | | | | X |
| 32.02 | Certification of the Principal Financial Officer Pursuant to Section 906 of the Sarbanes-Oxley Act* | | | | | X |
| 101.INS | XBRL Instance Document | | | | | X |
| 101.SCH | XBRL Taxonomy Extension Schema Document | | | | | X |
| 101.CAL | XBRL Taxonomy Extension Calculation Linkbase Document | | | | | X |
| 101.DEF | XBRL Taxonomy Extension Definition Linkbase Document | | | | | X |
| 101.LAB | XBRL Taxonomy Extension Label Linkbase Document | | | | | X |
| 101.PRE | XBRL Taxonomy Extension Presentation Linkbase Document | | | | | X |
† Indicates management contract or compensatory plan.
^ A request for confidential treatment was filed for certain portions of the indicated document. Confidential portions were omitted and filed separately with the Commission as required by Rule 24b-2.
* Furnished, not filed.
SIGNATURES
Pursuant to the requirements of the Securities Exchange Act of 1934, the Registrant has duly caused this report to be signed on its behalf by the undersigned, thereunto duly authorized on February 25, 2015.
|
| | |
| ANGIE’S LIST, INC. |
| | |
| By: | /s/ WILLIAM S. OESTERLE |
| Name: | William S. Oesterle |
| Title: | Chief Executive Officer and Director
(Principal Executive Officer)
|
POWER OF ATTORNEY
KNOW ALL MEN BY THESE PRESENTS, that each person whose signature appears below hereby constitutes and appoints William S. Oesterle, Thomas R. Fox and Shannon Shaw and each of them, his or her true and lawful attorneys-in-fact and agents, with full power to act separately and full power of substitution and resubstitution, for him or her and in his or her name, place and stead, in any and all capacities, to sign any and all amendments to this Annual Report on Form 10-K and to file the same, with all exhibits thereto, and all other documents in connection therewith, with the Securities and Exchange Commission, granting unto each said attorney-in-fact and agent full power and authority to do and perform each and every act in person, hereby ratifying and confirming all that said attorneys-in-fact and agents or either of them or his or her or their substitute or substitutes may lawfully do or cause to be done by virtue hereof.
Pursuant to the requirements of the Securities Act of 1934, as amended, this report has been signed by the following persons in the capacities and on the dates indicated. |
| | | | | | |
| | | Incorporated by Reference | |
Exhibit No. | Exhibit Description | Form | File No. | Exhibit | Filing Date | Filed Herewith |
| 3.01 | Third Amended and Restated Certificate of Incorporation | S-1/A | 333-176503 | 3.1 | 10/31/2011 | |
| 3.02 | Amended and Restated Bylaws | S-1/A | 333-176503 | 3.2 | 10/31/2011 | |
| 4.01 | Form of Common Stock Certificate | 10-K | 001-35339 | 4.01 | 3/8/2016 |
|
| 4.02 | Amended and Restated Investor Rights Agreement, by and among Angie’s List, Inc. and the investors listed on Schedule A thereto, dated March 15, 2011, as amended | S-1 | 333-176503 | 4.2 | 8/25/2011 | |
| 4.03 | Amendment No. 1 to Amended and Restated Investors’ Rights Agreement, by and between Angie’s List, Inc. and TRI Investments, LLC, dated as of November 1, 2016 | 10-Q | 001-35339 | 4.03 | 11/2/2016 | |
| 10.01† | Amended and Restated Omnibus Incentive Plan and form of award agreements under the Amended and Restated Omnibus Incentive Plan | S-8 | 333-191884 | 99.1 | 10/24/2013 | |
| 10.02† | Form of Indemnification Agreement by and between Angie’s List, Inc. and each of its executive officers and its directors not affiliated with an investment fund | S-1/A | 333-176503 | 10.18 | 9/29/2011 | |
| 10.03† | Form of Indemnification Agreement by and between Angie’s List, Inc. and each of its directors affiliated with an investment fund | S-1/A | 333-176503 | 10.19 | 9/29/2011 | |
| 10.04 | Project Agreement by and between Angie’s List, Inc. and the Consolidated City of Indianapolis, dated October 21, 2011 | S-1/A | 333-176503 | 10.22 | 11/2/2011 | |
| 10.05 | Purchase and sale agreement by and among Angie’s List, Inc. and Henry Amalgamated, LLC and Henry Amalgamated II, LLC, dated November 8, 2012 | 8-K | 001-35339 | 10.1 | 11/9/2012 | |
| 10.06† | Offer Letter Agreement, dated December 20, 2012, by and between Angie's List, Inc. and J. Mark Howell | 8-K | 001-35339 | 10.1 | 1/17/2013 | |
| 10.07† | Offer Letter Agreement, dated August 20, 2013, by and between Angie's List, Inc. and Thomas R. Fox | 8-K | 001-35339 | 10.1 | 8/21/2013 | |
| 10.08† | Amended Incentive Stock Option Grant Agreement under the Amended and Restated Omnibus Incentive Plan - Executive Officer | 10-Q | 001-35339 | 10.01 | 7/24/2014 | |
| 10.09† | Amended Nonqualified Stock Option Grant Agreement under the Amended and Restated Omnibus Incentive Plan - Executive Officer | 10-Q | 001-35339 | 10.02 | 7/24/2014 | |
|
| | | | |
Signature | | Title | | Date |
| | | | |
/S/ WILLIAM S. OESTERLE | | Chief Executive Officer and Director (Principal Executive Officer) | | February 23, 2015 |
William S. Oesterle | | | | |
| | | | |
/S/ THOMAS R. FOX | | Chief Financial Officer
(Principal Financial Officer)
| | February 19, 2015 |
Thomas R. Fox | | | | |
| | | | |
/S/ JOHN W. BIDDINGER | | Director | | February 19, 2015 |
John W. Biddinger | | | | |
| | | | |
/S/ MARK BRITTO | | Director | | February 19, 2015 |
Mark Britto | | | | |
| | | | |
/S/ JOHN H. CHUANG | | Director | | February 22, 2015 |
John H. Chuang | | | | |
| | | | |
/S/ STEVEN M. KAPNER | | Director | | February 19, 2015 |
Steven M. Kapner | | | | |
| | | | |
/S/ MICHAEL S. MAURER | | Director | | February 20, 2015 |
Michael S. Maurer | | | | |
| | | | |
/S/ DAVID B. MULLEN | | Director | | February 19, 2015 |
David B. Mullen | | | | |
| | | | |
/S/ SUSAN THRONSON | | Director | | February 19, 2015 |
Susan Thronson | | | | |
| | | | |
/S/ ANGELA R. HICKS BOWMAN | | Director | | February 24, 2015 |
Angela R. Hicks Bowman | | | | |
|
| | | | | | |
| | | Incorporated by Reference | |
Exhibit No. | Exhibit Description | Form | File No. | Exhibit | Filing Date | Filed Herewith |
| 10.10† | Amended Nonqualified Stock Option Grant Agreement under the Amended and Restated Omnibus Incentive Plan - Non-Employee Director | 10-Q | 001-35339 | 10.03 | 7/24/2014 | |
| 10.11 | Financing Agreement, dated as of September 26, 2014, by and among Angie's List, Inc., other subsidiaries of Angie's List, Inc. joined after in such capacity as Borrowers, certain subsidiaries of Angie's List, Inc. as Guarantors, the lenders from time to time party thereto as Lenders and TCW Asset Management Company as Collateral Agent and Administrative Agent | 10-Q/A | 001-35339 | 10.01 | 2/26/2015 | |
| 10.12 | Pledge and Security Agreement, dated as of September 26, 2014, by and among Angie's List, Inc., AL Campus Kids, LLC and AL BV Investments, Inc. as Grantors and TCW Asset Management Company as Collateral Agent | 10-Q | 001-35339 | 10.02 | 10/22/2014 | |
| 10.13† | Restricted Stock Unit Agreement under the Amended and Restated Omnibus Incentive Plan - Director, Executive Officer, Vice President | 10-K | 001-35339 | 10.16 | 2/25/2015 | |
| 10.14† | Restricted Stock Unit Agreement under the Amended and Restated Omnibus Incentive Plan - Other Employees | 10-K | 001-35339 | 10.17 | 2/25/2015 | |
| 10.15† | Employment Agreement, dated September 4, 2015, by and between Angie's List, Inc. and Scott A. Durchslag | 8-K | 001-35339 | 10.1 | 9/8/2015 | |
| 10.16† | Nonqualified Stock Option Agreement under the Amended and Restated Omnibus Incentive Plan, dated September 8, 2015, by and between Angie's List, Inc. and Scott A. Durchslag | 10-Q | 001-35339 | 10.04 | 10/22/2015 | |
| 10.17† | Restricted Stock Unit Agreement under the Amended and Restated Omnibus Incentive Plan, dated September 8, 2015, by and between Angie's List, Inc. and Scott A. Durchslag | 10-Q | 001-35339 | 10.05 | 10/22/2015 | |
| 10.18† | Performance Award Attributable to Restricted Stock Unit Agreement under the Amended and Restated Omnibus Incentive Plan, dated September 8, 2015, by and between Angie's List, Inc. and Scott A. Durchslag | 10-Q | 001-35339 | 10.06 | 10/22/2015 | |
| 10.19 | Settlement Agreement, dated February 29, 2016, by and among Angie's List. Inc. and Eric Semler and TCS Capital Management, LLC | 8-K | 001-35339 | 10.1 | 3/1/2016 | |
| 10.20† | Form of Performance Award Grant Agreement under the Amended and Restated Omnibus Incentive Plan for Executive Officer - Stock Options | 10-K | 001-35339 | 10.23 | 3/8/2016 |
|
| 10.21 | First Amendment to Financing Agreement, dated as of June 10, 2016, by and among Angie's List, Inc., subsidiaries of Angie's List, Inc., the lenders party thereto and TCW Asset Management Company as Collateral Agent and Administrative Agent | 8-K | 001-35339 | 10.01 | 6/15/2016 | |
| 10.22 | Mortgage, Assignment of Leases and Rents, Security Agreement and Fixture Filing, dated as of June 10, 2016, by AL Real Estate Holdings, LLC to and for the benefit of TCW Asset Management Company | 8-K | 001-35339 | 10.02 | 6/15/2016 | |
| 10.23† | Employment Agreement, dated December 10, 2015, by and between Angie's List, Inc. and Darin E. Brown | 10-Q | 001-35339 | 10.03 | 7/28/2016 | |
| 10.24† | Employment Agreement, dated February 18, 2016, by and between Angie's List, Inc. and Shannon M. Shaw | 10-Q | 001-35339 | 10.04 | 7/28/2016 | |
| 10.25† | Form of Performance Award Attributable to Restricted Stock Unit Agreement under the Amended and Restated Omnibus Incentive Plan for Executive Officer - Long-Term Incentive Plan | 10-Q | 001-35339 | 10.05 | 7/28/2016 | |
| 10.26 | Second Amendment to Financing Agreement, dated as of November 1, 2016, by and among Angie's List, Inc., subsidiaries of Angie's List, Inc., the lenders party thereto and TCW Asset Management Company as Collateral Agent and Administrative Agent | 10-Q | 001-35339 | 10.01 | 11/2/2016 | |
| 14 | Code of Business Conduct and Ethics, as amended March 15, 2016 | 8-K | 001-35339 | 14 | 3/17/2016 | |
| 21.01 | Subsidiaries of the Registrant | | | | | X |
| 23.01 | Consent of Independent Registered Public Accounting Firm | | | | | X |
| 24.01 | Power of Attorney | | | | | X |
| 31.01 | Certification of the Chief Executive Officer Pursuant to Section 302 of the Sarbanes-Oxley Act | | | | | X |
EXHIBIT INDEX
|
| | | | | | |
| | | Incorporated by Reference | |
Exhibit No. | Exhibit Description | Form | File No. | Exhibit | Filing Date | Filed Herewith |
| 3.01 | Amended and Restated Certificate of Incorporation | S-1/A | 333-176503 | 3.1 | 10/31/2011 | |
| 3.02 | Amended and Restated Bylaws | S-1/A | 333-176503 | 3.2 | 10/31/2011 | |
| 4.01 | Form of Common Stock Certificate | S-1/A | 333-176503 | 4.1 | 10/31/2011 | |
| 4.02 | Amended and Restated Investor Rights Agreement, by and among Angie’s List, Inc. and the investors listed on Schedule A thereto, dated March 15, 2011, as amended | S-1 | 333-176503 | 4.2 | 8/25/2011 | |
| 10.01† | Amended and Restated Omnibus Incentive Plan and form of award agreements under the Amended and Restated Omnibus Incentive Plan | S-8 | 333-191884 | 99.1 | 10/24/2013 | |
| 10.02† | Employment Agreement, dated July 10, 2006, by and between Brownstone Publishing, LLC and Michael D. Rutz | S-1 | 333-176503 | 10.15 | 8/25/2011 | |
| 10.03† | Form of Indemnification Agreement by and between Angie’s List, Inc. and each of its executive officers and its directors not affiliated with an investment fund | S-1/A | 333-176503 | 10.18 | 9/29/2011 | |
| 10.04† | Form of Indemnification Agreement by and between Angie’s List, Inc. and each of its directors affiliated with an investment fund | S-1/A | 333-176503 | 10.19 | 9/29/2011 | |
| 10.05 | Loan and Security Agreement, dated August 31, 2011, by and between ORIX Venture Finance LLC, Bridge Bank National Association and Angie’s List, Inc. | S-1/A | 333-176503 | 10.20 | 9/29/2011 | |
| 10.06 | Project Agreement by and between Angie’s List, Inc. and the Consolidated City of Indianapolis, dated October 21, 2011 | S-1/A | 333-176503 | 10.22 | 11/2/2011 | |
| 10.07 | Purchase and sale agreement by and among Angie’s List, Inc. and Henry Amalgamated, LLC and Henry Amalgamated II, LLC | 8-K | 001-35339 | 10.1 | 11/9/2012 | |
| 10.08† | Offer Letter Agreement, dated December 20, 2012, by and between Angie's List, Inc. and J. Mark Howell | 8-K | 001-35339 | 10.1 | 1/17/2013 | |
| 10.09† | Offer Letter Agreement, dated May 14, 2013, by and between Angie's List, Inc. and Patrick Brady | 10-Q | 001-35339 | 10.1 | 7/25/2013 | |
| 10.10† | Offer Letter Agreement, dated August 20, 2013, by and between Angie's List, Inc. and Thomas R. Fox | 8-K | 001-35339 | 10.1 | 8/21/2013 | |
| 10.11† | Amended Incentive Stock Option Grant Agreement under the Amended and Restated Omnibus Incentive Plan - Executive Officer | 10-Q | 001-35339 | 10.01 | 7/24/2014 | |
| 10.12† | Amended Nonqualified Stock Option Grant Agreement under the Amended and Restated Omnibus Incentive Plan - Executive Officer | 10-Q | 001-35339 | 10.02 | 7/24/2014 | |
| 10.13† | Amended Nonqualified Stock Option Grant Agreement under the Amended and Restated Omnibus Incentive Plan - Non-Employee Director | 10-Q | 001-35339 | 10.03 | 7/24/2014 | |
| 10.14 | Financing Agreement, dated as of September 26, 2014, by and among Angie's List, Inc., other subsidiaries of Angie's List, Inc. joined after in such capacity as Borrowers, certain subsidiaries of Angie's List, Inc. as Guarantors, the lenders from time to time party thereto as Lenders and TCW Asset Management Company as Collateral Agent and Administrative Agent ^ | 10-Q | 001-35339 | 10.01 | 10/22/2014 | |
| 10.15 | Pledge and Security Agreement, dated as of September 26, 2014, by and among Angie's List, Inc., AL Campus Kids, LLC and AL BV Investments, Inc. as Grantors and TCW Asset Management Company as Collateral Agent | 10-Q | 001-35339 | 10.02 | 10/22/2014 | |
| 10.16† | Restricted Stock Unit Agreement under the Amended and Restated Omnibus Incentive Plan - Executive Officer & Vice President | | | | | X |
| 10.17† | Restricted Stock Unit Agreement under the Amended and Restated Omnibus Incentive Plan - Other Employees | | | | | X |
| 21.01 | Subsidiaries of the Registrant | S-1 | 333-176503 | 21.1 | 8/25/2011 | |
| 23.01 | Consent of Independent Registered Public Accounting Firm | | | | | X |
| 24.01 | Power of Attorney (included on signature page of this Annual Report on Form 10-K) | | | | | X |
|
| | | | | | |
| | Incorporated by Reference | |
Exhibit
No.
| Exhibit Description | Form | File No. | Exhibit | Filing
Date
| Filed
Herewith
|
31.01 | Certification of the Principal Executive Officer Pursuant to Section 302 of the Sarbanes-Oxley Act | | | | | X |
| 31.02 | Certification of the PrincipalChief Financial Officer Pursuant to Section 302 of the Sarbanes-Oxley Act | | | | | X |
| 32.01 | Certification of the PrincipalChief Executive Officer Pursuant to Section 906 of the Sarbanes-Oxley Act* | | | | | X |
| 32.02 | Certification of the PrincipalChief Financial Officer Pursuant to Section 906 of the Sarbanes-Oxley Act* | | | | | X |
| 101.INS | XBRL Instance Document | | | | | X |
| 101.SCH | XBRL Taxonomy Extension Schema Document | | | | | X |
| 101.CAL | XBRL Taxonomy Extension Calculation Linkbase Document | | | | | X |
| 101.DEF | XBRL Taxonomy Extension Definition Linkbase Document | | | | | X |
| 101.LAB | XBRL Taxonomy Extension Label Linkbase Document | | | | | X |
| 101.PRE | XBRL Taxonomy Extension Presentation Linkbase Document | | | | | X |
† Indicates management contract or compensatory plan.
^ A request for confidential treatment was filed for certain portions* Furnished, not filed.
ITEM 16. FORM 10-K SUMMARY
None.
SIGNATURES
Pursuant to the requirements of Section 13 or 15(d) of the indicated document. Confidential portions were omittedSecurities Exchange Act of 1934, the registrant has duly caused this report to be signed on its behalf by the undersigned, thereunto duly authorized.
|
| | |
| ANGIE’S LIST, INC. |
| | |
| Date: February 21, 2017 | By: | /s/ SCOTT A. DURCHSLAG |
| Name: | Scott A. Durchslag |
| Title: | Chief Executive Officer and Director (Principal Executive Officer) |
Pursuant to the requirements of the Securities Exchange Act of 1934, this report has been signed below by the following persons on behalf of the registrant and filed separately within the Commission as required by Rule 24b-2.capacities and on the dates indicated.
|
| | | | |
| Signature | | Title | | Date |
| | | | |
| /S/ SCOTT A. DURCHSLAG | | | | February 21, 2017 |
| Scott A. Durchslag | | Chief Executive Officer and Director
(Principal Executive Officer) | | |
| | | | |
| /S/ THOMAS R. FOX | | | | February 21, 2017 |
| Thomas R. Fox | | Chief Financial Officer
(Principal Financial Officer) | | |
| | | | |
| /S/ CHARLES HUNDT | | | | February 21, 2017 |
| Charles Hundt | | Chief Accounting Officer
(Principal Accounting Officer) | | |
| | | | |
| * | | | | February 21, 2017 |
| George D. Bell | | Director
| | |
| | | | |
| * | | | | February 21, 2017 |
| Mark Britto | | Director
| | |
| | | | |
| * | | | | February 21, 2017 |
| Thomas R. Evans | | Director
| | |
| | | | |
| * | | | | February 21, 2017 |
| Angela R. Hicks Bowman | | Director
| | |
| | | | |
| * | | | | February 21, 2017 |
| Michael S. Maurer | | Director
| | |
| | | | |
| * | | | | February 21, 2017 |
| David B. Mullen | | Director
| | |
| | | | |
| * | | | | February 21, 2017 |
| Michael D. Sands | | Director
| | |
| | | | |
| * | | | | February 21, 2017 |
| H. Eric Semler | | Director
| | |
| | | | |
| * | | | | February 21, 2017 |
| Susan E. Thronson | | Director
| | |
|
|
| /s/ SCOTT A. DURCHSLAG |
| By: Scott A. Durchslag, Attorney-in-Fact |
EXHIBIT INDEX
|
| | | | | | |
| | | Incorporated by Reference | |
Exhibit No. | Exhibit Description | Form | File No. | Exhibit | Filing Date | Filed Herewith |
| 3.01 | Third Amended and Restated Certificate of Incorporation | S-1/A | 333-176503 | 3.1 | 10/31/2011 | |
| 3.02 | Amended and Restated Bylaws | S-1/A | 333-176503 | 3.2 | 10/31/2011 | |
| 4.01 | Form of Common Stock Certificate | 10-K | 001-35339 | 4.01 | 3/8/2016 |
|
| 4.02 | Amended and Restated Investor Rights Agreement, by and among Angie’s List, Inc. and the investors listed on Schedule A thereto, dated March 15, 2011, as amended | S-1 | 333-176503 | 4.2 | 8/25/2011 | |
| 4.03 | Amendment No. 1 to Amended and Restated Investors’ Rights Agreement, by and between Angie’s List, Inc. and TRI Investments, LLC, dated as of November 1, 2016 | 10-Q | 001-35339 | 4.03 | 11/2/2016 | |
| 10.01† | Amended and Restated Omnibus Incentive Plan and form of award agreements under the Amended and Restated Omnibus Incentive Plan | S-8 | 333-191884 | 99.1 | 10/24/2013 | |
| 10.02† | Form of Indemnification Agreement by and between Angie’s List, Inc. and each of its executive officers and its directors not affiliated with an investment fund | S-1/A | 333-176503 | 10.18 | 9/29/2011 | |
| 10.03† | Form of Indemnification Agreement by and between Angie’s List, Inc. and each of its directors affiliated with an investment fund | S-1/A | 333-176503 | 10.19 | 9/29/2011 | |
| 10.04 | Project Agreement by and between Angie’s List, Inc. and the Consolidated City of Indianapolis, dated October 21, 2011 | S-1/A | 333-176503 | 10.22 | 11/2/2011 | |
| 10.05 | Purchase and sale agreement by and among Angie’s List, Inc. and Henry Amalgamated, LLC and Henry Amalgamated II, LLC, dated November 8, 2012 | 8-K | 001-35339 | 10.1 | 11/9/2012 | |
| 10.06† | Offer Letter Agreement, dated December 20, 2012, by and between Angie's List, Inc. and J. Mark Howell | 8-K | 001-35339 | 10.1 | 1/17/2013 | |
| 10.07† | Offer Letter Agreement, dated August 20, 2013, by and between Angie's List, Inc. and Thomas R. Fox | 8-K | 001-35339 | 10.1 | 8/21/2013 | |
| 10.08† | Amended Incentive Stock Option Grant Agreement under the Amended and Restated Omnibus Incentive Plan - Executive Officer | 10-Q | 001-35339 | 10.01 | 7/24/2014 | |
| 10.09† | Amended Nonqualified Stock Option Grant Agreement under the Amended and Restated Omnibus Incentive Plan - Executive Officer | 10-Q | 001-35339 | 10.02 | 7/24/2014 | |
| 10.10† | Amended Nonqualified Stock Option Grant Agreement under the Amended and Restated Omnibus Incentive Plan - Non-Employee Director | 10-Q | 001-35339 | 10.03 | 7/24/2014 | |
| 10.11 | Financing Agreement, dated as of September 26, 2014, by and among Angie's List, Inc., other subsidiaries of Angie's List, Inc. joined after in such capacity as Borrowers, certain subsidiaries of Angie's List, Inc. as Guarantors, the lenders from time to time party thereto as Lenders and TCW Asset Management Company as Collateral Agent and Administrative Agent | 10-Q/A | 001-35339 | 10.01 | 2/26/2015 | |
| 10.12 | Pledge and Security Agreement, dated as of September 26, 2014, by and among Angie's List, Inc., AL Campus Kids, LLC and AL BV Investments, Inc. as Grantors and TCW Asset Management Company as Collateral Agent | 10-Q | 001-35339 | 10.02 | 10/22/2014 | |
| 10.13† | Restricted Stock Unit Agreement under the Amended and Restated Omnibus Incentive Plan - Director, Executive Officer, Vice President | 10-K | 001-35339 | 10.16 | 2/25/2015 | |
| 10.14† | Restricted Stock Unit Agreement under the Amended and Restated Omnibus Incentive Plan - Other Employees | 10-K | 001-35339 | 10.17 | 2/25/2015 | |
| 10.15† | Employment Agreement, dated September 4, 2015, by and between Angie's List, Inc. and Scott A. Durchslag | 8-K | 001-35339 | 10.1 | 9/8/2015 | |
| 10.16† | Nonqualified Stock Option Agreement under the Amended and Restated Omnibus Incentive Plan, dated September 8, 2015, by and between Angie's List, Inc. and Scott A. Durchslag | 10-Q | 001-35339 | 10.04 | 10/22/2015 | |
| 10.17† | Restricted Stock Unit Agreement under the Amended and Restated Omnibus Incentive Plan, dated September 8, 2015, by and between Angie's List, Inc. and Scott A. Durchslag | 10-Q | 001-35339 | 10.05 | 10/22/2015 | |
|
| | | | | | |
| | | Incorporated by Reference | |
Exhibit No. | Exhibit Description | Form | File No. | Exhibit | Filing Date | Filed Herewith |
| 10.18† | Performance Award Attributable to Restricted Stock Unit Agreement under the Amended and Restated Omnibus Incentive Plan, dated September 8, 2015, by and between Angie's List, Inc. and Scott A. Durchslag | 10-Q | 001-35339 | 10.06 | 10/22/2015 | |
| 10.19 | Settlement Agreement, dated February 29, 2016, by and among Angie's List. Inc. and Eric Semler and TCS Capital Management, LLC | 8-K | 001-35339 | 10.1 | 3/1/2016 | |
| 10.20† | Form of Performance Award Grant Agreement under the Amended and Restated Omnibus Incentive Plan for Executive Officer - Stock Options | 10-K | 001-35339 | 10.23 | 3/8/2016 |
|
| 10.21 | First Amendment to Financing Agreement, dated as of June 10, 2016, by and among Angie's List, Inc., subsidiaries of Angie's List, Inc., the lenders party thereto and TCW Asset Management Company as Collateral Agent and Administrative Agent | 8-K | 001-35339 | 10.01 | 6/15/2016 | |
| 10.22 | Mortgage, Assignment of Leases and Rents, Security Agreement and Fixture Filing, dated as of June 10, 2016, by AL Real Estate Holdings, LLC to and for the benefit of TCW Asset Management Company | 8-K | 001-35339 | 10.02 | 6/15/2016 | |
| 10.23† | Employment Agreement, dated December 10, 2015, by and between Angie's List, Inc. and Darin E. Brown | 10-Q | 001-35339 | 10.03 | 7/28/2016 | |
| 10.24† | Employment Agreement, dated February 18, 2016, by and between Angie's List, Inc. and Shannon M. Shaw | 10-Q | 001-35339 | 10.04 | 7/28/2016 | |
| 10.25† | Form of Performance Award Attributable to Restricted Stock Unit Agreement under the Amended and Restated Omnibus Incentive Plan for Executive Officer - Long-Term Incentive Plan | 10-Q | 001-35339 | 10.05 | 7/28/2016 | |
| 10.26 | Second Amendment to Financing Agreement, dated as of November 1, 2016, by and among Angie's List, Inc., subsidiaries of Angie's List, Inc., the lenders party thereto and TCW Asset Management Company as Collateral Agent and Administrative Agent | 10-Q | 001-35339 | 10.01 | 11/2/2016 | |
| 14 | Code of Business Conduct and Ethics, as amended March 15, 2016 | 8-K | 001-35339 | 14 | 3/17/2016 | |
| 21.01 | Subsidiaries of the Registrant | | | | | X |
| 23.01 | Consent of Independent Registered Public Accounting Firm | | | | | X |
| 24.01 | Power of Attorney | | | | | X |
| 31.01 | Certification of the Chief Executive Officer Pursuant to Section 302 of the Sarbanes-Oxley Act | | | | | X |
| 31.02 | Certification of the Chief Financial Officer Pursuant to Section 302 of the Sarbanes-Oxley Act | | | | | X |
| 32.01 | Certification of the Chief Executive Officer Pursuant to Section 906 of the Sarbanes-Oxley Act* | | | | | X |
| 32.02 | Certification of the Chief Financial Officer Pursuant to Section 906 of the Sarbanes-Oxley Act* | | | | | X |
| 101.INS | XBRL Instance Document | | | | | X |
| 101.SCH | XBRL Taxonomy Extension Schema Document | | | | | X |
| 101.CAL | XBRL Taxonomy Extension Calculation Linkbase Document | | | | | X |
| 101.DEF | XBRL Taxonomy Extension Definition Linkbase Document | | | | | X |
| 101.LAB | XBRL Taxonomy Extension Label Linkbase Document | | | | | X |
| 101.PRE | XBRL Taxonomy Extension Presentation Linkbase Document | | | | | X |
† Indicates management contract or compensatory plan.
* Furnished, not filed.