UNITED STATES
SECURITIES AND EXCHANGE COMMISSION
Washington, D.C. 20549
FORM 10-K
| [X] | ANNUAL REPORT PURSUANT TO SECTION 13 OR 15(d) OF THE SECURITIES EXCHANGE ACT OF 1934 |
For the fiscal year ended December 31, 20152017
OR
| [ ] | TRANSITION REPORT PURSUANT TO SECTION 13 OR 15(d) OF THE SECURITIES EXCHANGE ACT OF 1934 |
For the Transition Period from ______ to ______
Commission File Number: 000-33167
KIWA BIO-TECH PRODUCTS GROUP CORPORATION
(Exact name of registrant as specified in its charter)
| 77-0632186 | ||
(State or other jurisdiction of incorporation or organization) | (I.R.S. Employer Identification No.) | |
3200 Guasti Road, Suite #100, Ontario, California | 91761 | |
| ( | (Zip Code) |
310 N. Indian Hill Blvd., #702(909) 456-8828
Claremont, California 91711
(Address of principal executive offices)
(626) 715-5855
(Registrant’s telephone number, including area code)
| ||
3200 Guasti Road, Suite #100
Indicate by check mark if the registrant is a well-known seasoned issuer, as defined in Rule 405 of the Securities Act. [ ] Yes [X] NoOntario, CA 91761
Indicate by check mark if the registrant is not required to file reports pursuant to Section 13 or Section 15(d) of the Act. [ ] Yes [X] No(Former address)
Indicate by check mark whether the Registrantregistrant (1) has filed all reports required to be filed by Section 13 or 15(d) of the Securities Exchange Act of 1934 during the preceding 12 months (or for such shorter period that the registrant was required to file such reports), and (2) has been subject to such filing requirements for the past 90 days. Yes [X] YesNo [ ] No
Indicate by check mark whether the registrant has submitted electronically and posted on its corporate Web site, if any, every Interactive Data File required to be submitted and posted pursuant to Rule 405 of Regulation S-T (§ 232.405 of this chapter) during the preceding 12 months (or for such shorter period that the registrant was required to submit and post such files). [X] Yes [ ] No
Indicate by check mark if disclosure of delinquent filers pursuant to Item 405 of Regulation S-K is not contained herein, and will not be contained, to the best of registrant’s knowledge, in definitive proxy or information statements incorporated by reference in Part III of this Form 10-K or any amendment to this Form 10-K. [ ] Yes [X] No [ ]
Indicate by check mark whether the Registrantregistrant is a large accelerated filer, an accelerated filer, a non-accelerated filer, or a smaller reporting company. See the definitions of “large accelerated filer,” “accelerated filer” and “smaller reporting company” in Rule 12b-2 of the Exchange Act.
| Large accelerated filer [ ] | Accelerated filer [ ] |
| Non-accelerated filer [ ] | Smaller reporting company [X] |
| (Do not check if a smaller reporting company) | Emerging growth company [ ] |
Indicate by check mark whether the registrant is a shell company (as defined in Rule 12b-2 of the Exchange Act). Yes [ ] YesNo [X] No
The aggregate market valueAs of voting and non-votingMarch 30, 2018, the Company had 16,120,465 shares of common stock, held by non-affiliates of the registrant, based upon the closing bid quotation for the registrant’s common stock, as reported on the OTC Markets Group, Inc. Pink Limited Information Tier, as of June 30, 2015, the last business day of the registrant’s most recently completed second fiscal quarter, was approximately $309,000.
The number of shares of registrant’s common stock outstanding as of April 10, 2016 was 5,141,226.$0.001 par value, issued and outstanding.
Annual Report on Form 10-K
For the Fiscal Year Ended December 31, 2015
INDEX
TABLE OF CONTENTS
| 2 |
Special Note Regarding Forward-Looking Statements
On one or more occasions, we may make forward-looking statements in this Annual Report on Form 10-K regarding our assumptions, projections, expectations, targets, intentions or beliefs about future events. Words or phrases such as “anticipates,” “may,” “will,” “should,” “believes,” “estimates,” “expects,” “intends,” “plans,” “predicts,” “projects,” “targets,” “will likely result,” “will continue” or similar expressions identify forward-looking statements. These forward-looking statements are only our predictions and involve numerous assumptions, risks and uncertainties, including, but not limited to those listed below and those business risks and factors described elsewhere in this report and our other Securities and Exchange Commission filings.
We undertake no obligation to publicly update or revise any forward-looking statements, whether as a result of new information, future events or otherwise. However, your attention is directed to any further disclosures made on related subjects in our subsequent annual and periodic reports filed with the Securities and Exchange Commission on Forms 10-K, 10-Q and 8-K and Proxy Statements on Schedule 14A.
References herein to “we,” “us,” “our” or “the Company” refer to Kiwa Bio-Tech Products Group Corporation and its wholly-owned and majority-owned subsidiaries unless the context specifically states or implies otherwise.
The Company
1. Organizational History
We are the result of a share exchange transaction completed in March 2004 between the shareholders of Tintic Gold Mining Company (“Tintic”), a corporation originally incorporated in the state of Utah on June 14, 1933 to perform mining operations in Utah, and the shareholders of Kiwa Bio-Tech Products Group Ltd. (“Kiwa BVI”), a company originally organized under the laws of the British Virgin Islands on June 5, 2002. The share exchange resulted in a change of control of Tintic, with former Kiwa BVI stockholders owning approximately 89% of Tintic on a fully diluted basis and Kiwa BVI surviving as a wholly-owned subsidiary of Tintic. Subsequent to the share exchange transaction, Tintic changed its name to Kiwa Bio-Tech Products Group Corporation. On July 21, 2004, we completed our reincorporation in the State of Delaware. On March 8, 2017, we completed our reincorporation in the State of Nevada.
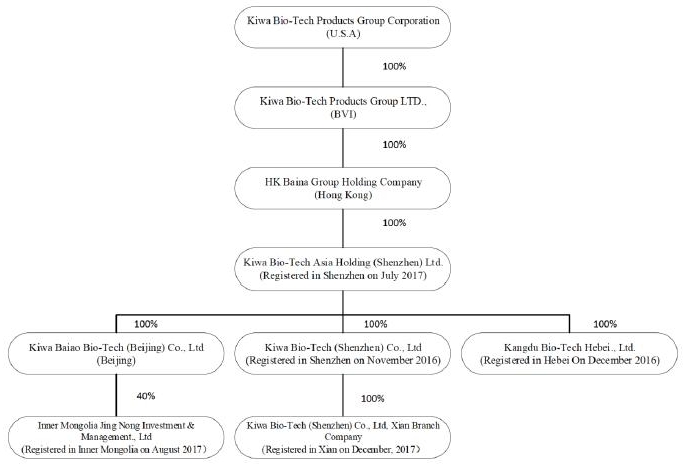
We established our subsidiaryThe Company operates through a series of subsidiaries in the Peoples Republic of China as detailed in the following Organizational Chart. The Company had previously operated its business through its subsidiaries Kiwa Bio-Tech Products (Shandong) Co., Ltd. (“Kiwa Shandong”) in 2002 and Tianjin Kiwa Feed Co., Ltd. (“Kiwa Tianjin”Tianjin “). Kiwa Tianjin has been dissolved since July, 11, 2012. On February 11, 2017, the Company entered an Equity Transfer Agreement with Dian Shi Cheng Jing (Beijing) Technology Co. (“Transferee”) to transfer all of shareholders’ right, title, interest and liabilities in Kiwa Shandong to the Transferee for RMB 1.00. On April 12, 2017, the government processing of transfer has been completed. Currently, the Company mainly operates its business through its subsidiaries Kiwa Baiao Bio-Tech (Beijing) Co., Ltd, which was acquired in January 2016 and rename to Kiwa Baiao Bio-Tech (Beijing) Co., Ltd. from Oriental Baina Co., Ltd. in June, 2016; Kiwa Bio-Tech Products (Shenzhen) Co., Ltd, which was incorporated in China in November, 2016 and Kiwa Bio-Tech Products (Hebei) Co., Ltd., which was incorporated in December, 2016. In July, 2017, the Company established Kiwa Bio-Tech Asia Holding (Shenzhen) Ltd. (“Kiwa Asia”) to be the direct holding company of Kiwa Beijing, Kiwa Shenzhen and Kiwa Hebei. The Company established Inner Mongolia Jing Nong Investment & Management, Ltd. (“Kiwa Jing Nong”) in July 2006. Effective on July 11, 2012, theAugust 2017. The Company dissolvedestablished Kiwa Tianjin.Bio-Tech Asia Holding (Shenzhen) Ltd., Xian Branch Company in December 2017.
| 3 |
2. Overview of Business
We develop, manufacture, distribute and market innovative, cost-effective and environmentally safe bio-technological products for agriculture. Our products are designed to enhance the quality of human life by increasing the value, quality and productivity of crops and decreasing the negative environmental impact of chemicals and other wastes.
Bio-fertilizersOur Products
We have developed a number of bio-fertilizers and are continuing to develop new products in this area. In 2002, Kiwa BVI chartered Kiwa Shandong, a wholly-owned subsidiary organized under the laws of the PRC, as its offshore fertilizer manufacturing base to capitalize on low cost, high quality manufacturing advantages available in China. In October 2003, Kiwa Shandong completed the first phase of construction of its manufacturing facility in Shandong Province, China. In November 2003, Kiwa Shandong began shipping its bio-fertilizer products to the agricultural market in China. Since then, we have been devoted to expanding our market share.
In June 2008, Kiwa Shandong received approval from the Ministry of Commerce of the PRC to sell fertilizer products of other manufacturers on a wholesale basis, including chemical fertilizers, complex fertilizers, and compound fertilizers. Based on applicable tax laws in China, these products will be exempt from value-added tax.
During the last three years, the Company did not produce any products, had no market and failed to generate any revenue of material importance.
We have developed six bio-fertilizer products with bacillus sppspecies (“bacillus spp”) and/or photosynthetic bacteria as core ingredients. For the year ended December 31, 2017, we are currently generating revenues from two of our three bio-fertilizer products: 1) Biological Organic Fertilizer and 2) Compound Microbial Fertilizer. We expect to add one more bio-fertilizer product, 3) Bio-Water Soluble Fertilizer, to our revenue sources in 2018 and it is expecting to launch sometime in the third quarter of 2018.
Some of our products contain ingredients of both photosynthesis and bacillus bacteria. Bacillus spp is a species of bacteria that interacts with plants and promotes biological processes. It is highly effective for promoting plant growth, enhancing yield, improving quality and elevating resistances. Photosynthetic bacteria are a group of green and purple bacteria. Bacterial photosynthesis differs from green plant photosynthesis in that bacterial photosynthesis occurs in an anaerobic environment and does not produce oxygen. Photosynthetic bacteria can enhance the photosynthetic capacity of green plants by increasing the utilization of sunlight, which helps keep the photosynthetic process at a vigorous level, enhances the capacity of plants to transform inorganic materials to organic products, and boosts overall plant health and productivity.
| 4 |
Intellectual Property
Our bacillus bacteria based fertilizers are protected by patents. In 2004, we acquired patent no. ZL 93101635.5 entitled “Highly Effective Composite Bacteria for Enhancing Yield and the Related Methodology for Manufacturing” from China Agricultural University (“CAU”) for the aggregate purchase of $480,411, consisting of $60,411 in cash and 5,000 shares of our common stock, valued at $84.00 per share (aggregate value of $420,000). Our photosynthetic bacteria based fertilizers are also protected by trade secret laws.
The patent acquired from CAU covers six different species of bacillus which have been tested as bio-fertilizers to enhance yield and plant health. The production methods of the six species are also patented. The patent has expired on February 19, 2013.There are no limitations under this agreement on our exclusive use of the patent. Pursuant to our agreement with CAU, the University agreed to provide research and technology support services at no additional cost to us in the event we decide to use the patent to produce commercial products. These research and technology support services include: (1) furnishing faculty or graduate-level researchers to help bacteria culturing, sampling, testing, trial production and production formula adjustment; (2) providing production technology and procedures to turn the products into powder form while keeping live required bacteria in the products; (3) establishing quality standards and quality control systems; (4) providing testing and research support for us to obtain necessary sale permits from the Chinese government; and (5) cooperation in developing derivative products.
On January 5, 2011, the State Intellectual Property Office of the PRC (“Intellectual Property Office”) granted Kiwa Shandong two Certificates of Patent of Invention for (1) “A cucumber dedicated composite anti-continuous cropping effect probiotics and their specific strains with related application” with patent number of “ZL 2008 1 0144492.6”; and (2) “Cotton dedicated composite anti-continuous cropping effect probiotics and their special strains with related application” with patent number of “ZL 2008 1 0144491.1” These two patents have been developed by Kiwa-CAU R&D Center. These two patents will expire on August 5, 2028. These two patents can be used to develop specific environment-friendly bio-fertilizer.
We have obtained fivethree fertilizer registration certificates from the Chinese government - fourtwo covering our bacillus bacteria fertilizer and one covering our photosynthetic bacteria fertilizer. The five registration certificates are: (1) Microorganism Microbial InoculumBiological Organic Fertilizer Registration Certificate issued by the PRC Ministry of Agriculture; (2) Photosynthetic BacteriaCompound Microbial Fertilizer Registration Certificate issued by the PRC Ministry of Agriculture; (3) Amino Acid Foliar FomularCompound Microbial Water Soluble Fertilizer Registration Certificate issued by the PRC Ministry of Agriculture; (4) Organic Fertilizer Registration Certificate issued by Agriculture Department of Shandong Province; and (5) Organic Matter-Decomposing Inoculants Registration Certificate issued by the PRC Ministry of Agriculture on February 16, 2008.Agriculture. Protected by these fivethree fertilizer registration certificates and five trademarks under the names of “KANGTAN” (Chinese translation name for Kiwa), “ZHIGUANGYOU,” “PUGUANGFU,” “JINWA” and “KANGGUAN,” we have developed sixthree series of bio-fertilizer products with bacillus spp and/or photosynthetic bacteria as core ingredients. Valid period of fertilizer registration certificates is five years and may be extended for another five years upon application from the owner of fertilizer registration certificates. The Company has determined to re-apply the Fertilizer Registration Certificate issued by the PRC Ministry of Agriculture.
Our Customers
For the year ended December 31, 2017, three customers accounted for 46%, 26%, 17% of the Company’s sales.
1. Qingdao Lanhai Hanrui Bio-Tech Ltd. (46% of sales)
2. Wofu (Tianjing) Agriculture Development Ltd. (26% of sales)
3. Deluke Agriculture Bio-Tech (Shenzhen) Ltd. (17% of sales)
Should we lose any of these large scale customers in the future and are unable to obtain additional customers, our revenues and operation results might be adversely affected.
Our Suppliers
For the year ended December 31, 2017, two suppliers accounted for 49% and 47% of the Company’s total purchases, respectively. One of our supplier is named Weifang Deluke Fertilizer Co., Ltd. (“Weifang Deluke”), which is our subcontractor that purchase raw materials and produce our bio-fertilizer products. Prior to May 2017, all raw materials used to produce our bio-fertilizer were contributed by Weifang Deluke. Starting from May, 2017, we began making raw materials purchase orders from Shenzhen San Kang Life Agriculture Development Ltd. Co. (“Shenzhen San Kang”), who specializes in the supply chain business of agriculture industry. For the year ended December 31, 2017, Weifang Deluke was contributing approximately 49% of total purchases including raw materials and finished goods, and Shenzhen San Kang was contributing approximately 47% of total purchase which only included raw materials for producing our bio-fertilizer. Starting from 2018, Weifang Deluke was expected to contributing approximately 30%-40% raw materials for producing our bio-fertilizer, and Shenzhen San Kang was expected to contributing approximately 60%-70% raw materials for producing our bio-fertilizer.
| 5 |
Our Competition
We compete primarily on the basis of quality, technological innovation and price. Some of our competitors have achieved greater market penetration but with less sophisticated technological innovation than our products as there were in the transition period from being the chemical bio-fertilizer producers to the organically bio-fertilizer producers. We believe that we have a better competitive advantage over them as we are the pioneer within our markets. Some of our competitors competed within our markets have lesser financial and other resources than us as they have established their companies a few years behind us. If we are unable to compete successfully in our markets, our relative market share and profits could be reduced.
Our main competitors include China Green Agriculture, Inc., Genliduo Biotechnology Ltd., Shenzhen Baitan Ecotypic Engineering Co. Ltd., Hunan Taigu Biotechnology Co. Ltd. and Shanxi A.K. Quantum Agricultural Technology Corporation.
Kiwa-CAU Research and Development Center
In July 2006, we established a new research center with CAU through our subsidiary, Kiwa Shandong,China Agricultural University (“CAU”) which is known as Kiwa-CAU Bio-Tech Research & Development Center (the “Kiwa-CAU R&D Center”). Pursuant to an agreement between CAU and Kiwa Shandong dated November 14, 2006, Kiwa Shandong agreed to contribute RMB 1 million (approximately $160,000) each year to fund research at Kiwa-CAU R&D Center. The term of this agreement was ten years starting from July 1, 2006. Prof. Qi Wang, who became one of our directors in July 2007, has acted as the Director of Kiwa-CAU R&D Center since July 2006. Under the above agreement, the Kiwa-CAU R&D Center is responsible for fulfilling the overall research-and-development functions of Kiwa Shandong, including: (1) development of new technologies and new products (which will be shared by Kiwa and CAU); (2) subsequent perfection of existing product-related technologies; and (3) training quality-control personnel and technicians and technical support for marketing activities. The Company has spent $178,388 and $162,715 for its research and development activities during the years ended December 31, 2015 and 2014, respectively. The costs incurred by Company’s research and development activities are not borne directly by customers.
During fiscal 2014, Kiwa-CAU R&D Center had successfully isolated several strains of endophytic bacillus from plants. A number of strains had been observed to have the capability of boosting crop yield and dispelling chemical pesticide residual from soil. These strains could be used for developing not only new biological preparation but also environmental protection preparation.
Pursuant to The Company terminated its cooperation with CAU when the agreement expired on joint incorporation of the research and development center between CAU and Kiwa Shandong dated November 14, 2006, Kiwa Shandong agrees to invest RMB 1 million (approximately $160,000) each year to fund research at the R&D Center. The term of this agreement is ten years starting from July 1, 2006. Prof. Qi Wang, who became one of our directors in July 2007, has acted as2016. All the Director ofliabilities owed to Kiwa-CAU R&D Center since July 2006.
Other
According towere assumed by the Project Agreement with Zoucheng Municipal Government in 2002, we have committed to investing approximately $18 million to $24 million for developingTransferee of Kiwa Shandong when the manufacturing and research facilities in Zoucheng,Company disposed Kiwa Shandong Province. As of December 31, 2015, we had invested approximately $1.91 million for the project.on Feb 11, 2017.
On November 5, 2015, the Company signed a strategic cooperation agreement (the “Agreement”) with China Academy of Agricultural Science (“CAAS”)’s Institute of Agricultural Resources & Regional Planning (“IARRP”) and Institute of Agricultural Economy & Development (“IAED”). Pursuant to the Agreement, the Company will form a strategic partnership with the two institutes and establish an “International Cooperation Platform for Internet and Safe Agricultural Products”. To fund the cooperation platform’s R&D activities, the Company will provide RMB 1 million (approximately $160,000) per year to the Spatial Agriculture Planning Method & Applications Innovation Team that belongs to the Institutes.Institute. The term of the Agreement is for three years beginning November 20, 2015. However, the Company is only liable for the annual funds to be provided to the extent of the contract obligations performed by CAAS IARRP and IAED, and the agreement is terminable before the three years’ commitment date based on negotiations of both parties. Prof. Yong Chang Wu, the authorized representative of IARRP, CAAS, is also one of the Company’s directors effective since November 20, 2015.2015 until March 13, 2017.
| 6 |
On February 23, 2017, the Company agreed to a strategic relationship with ETS (Tianjin) Biological Science and Technology Development Co., Ltd. (“ETS”). The partnership will include the deployment and strategic use of ETS biotechnology to produce of bio-fertilizers for use in both China and internationally. Kiwa and ETS, together with the certain Chinese government departments, will work together to enhance China’s microbial fertilizer industry standards and China’s food safety industry chain standards. The parties will work together on the development of microbial technology and products in agriculture, environmental protection, soil management and other fields. Relying on the Chinese Academy of Sciences, ETS Environmental and Agricultural Microbial Technology Research Center and biotechnology project research results, Kiwa has introduced the ETS core technology to complete bio-fertilizer upgrading, transformation and to develop new product lines. In order to meet the growing global consumer demand to increase food supply and develop sustainable farming we are applying sustainable use of biotechnology and the use of biotechnology products to replace chemical products, which will strengthen environmental protection and promote international cooperation. As a result of strict management of many agricultural chemicals, such chemicals will continue to be abandoned, resulting is a growing demand for bio-fertilizers. It has been widely accepted that the application of ETS biotechnology facilitates agricultural sustainability and helps to protect the soil and improve grain output. The technology focuses on keeping soil healthy by restoring healthy microbes that are naturally present in healthy soils. As the technology gains worldwide recognition, it is imperative to popularize bio-fertilizer in developing countries to fulfill the needs of growing populations and promote environmentally friendly agriculture. Through the cooperation of Kiwa and ETS, the parties aim to enhance the usage of the bio-fertilizers in China. The cooperation will bring technological transformation and support for Kiwa to improve its existing manufacturing techniques. Kiwa and ETS will also collaborate to establish a comprehensive platform for producing, supplying, and marketing in China. Ultimately, Kiwa would look to introduce these products to the international market, including the United States.
Other
On November 30, 2015, we entered into an acquisition agreement (the “Agreement”) with the shareholders of Caber Holdings LTD, whose Chinese name is Hong Kong Baina Group Co., Ltd, located in Hong Kong (“Baina Hong Kong”), and Oriental Baina Co. Ltd. (hereinafter referred to as “Baina Beijing”), Baina Hong Kong’s wholly-owned subsidiary in Beijing, China. WhenAs a result of this acquisition is completed,Agreement, Kiwa will renamerenamed Baina Beijing to Kiwa Baiao Bio-Tech (Beijing) Co., Ltd. Kiwa Baiao Co. Ltd will replace Kiwa’s current subsidiary in China -, which replaced Kiwa Bio-Tech (Shandong) Co., Ltd (“Kiwa Shandong”) - to operate Kiwa’s bio-fertilizer market expansion and become Kiwa’s platform for future acquisitions of new agricultural-related projects in China. In accordance with the terms of the Agreement, Kiwa agreed to pay US$30,000approximately HKD 1.00 to the Baina Hong Kong Shareholders, a group of unrelated third parties, for the acquisition of 100% of the equity of Baina Hong Kong. As of December 31, 2015, the Company has paid RMB 220,000 (approximately $34,000) for the acquisition. The acquisition was completed on January 7, 2016. Both Baina Hong Kong and Baina Beijing had no activities before the acquisition date and had no assets and liabilities. The purpose of this acquisition was to acquire Baina Hong Kong’s corporation registration in Hong Kong and in China.
Thereafter, Baina Beijing formed four new subsidiaries—Kiwa Bio-Tech (Shenzhen) Co., Ltd (Registered in Shenzhen on November 2016); Kangdu Bio-Tech Hebei Co., Ltd. (Registered in Hebei on December 2016) , Kiwa Bio-Tech Asia Holding (Shenzhen) Ltd. (Registered in Shenzhen on July, 2017) and Inner Mongolia Jing Nong Investment & Management, Ltd. (Registered in Shenzhen on July, 2017).
On December 17, 2015, we entered into a distribution agreement (the “Agreement”) with Kangtan Gerui (Beijing) Bio-Tech Co., Ltd. (“Gerui”) and formally awarded Gerui a right to sell and distribute the Company’s fertilizer products in 3 major agricultural regions of China--China— Hainan Province, Hunan Province and Xinjiang Autonomous Region. The Company’s Research and Development department has been conducting application experiments in Hainan and Hunan Provinces since August 2015, in accordance with the market requirements. The experiment data indicates that the Company’s fertilizer products have fulfillfulfilled the requirements of reduction of content of heavy metals in soil and improveimproved crop yield. Gerui was founded in Beijing in April 2015 and relies on the sales network of China’s Supply and Marketing Cooperatives system. Currently, the Company and Gerui do not hold any interest in each other; however, a collaboration and integration may take place in the future. The term of the Agreement is for a period of three years commencing December 17, 2015. In September 2016, Kiwa Baiao Bio-Tech (Beijing) Co., Ltd obtained a fertilizer sales permit from the Chinese government and began to sale the products directly to customers in those 3 major agricultural regions. In September 2016, Kiwa Baiao Bio-Tech (Beijing) Co., Ltd obtained a fertilizer sales permit from the Chinese government and began to sale the products directly to customers in those 3 major agricultural regions.
| 7 |
On February 27, 2017, the Company signed a strategic cooperation agreement with the Beijing Zhongpin Agricultural Science and Technology Development Center (“Zhongpin Center”). Zhongpin Center is the Chinese Agricultural Science and Technology Innovation and Development Committee’s executive implementation agency (referred to as the Agricultural Science and Technology Commission). The Agricultural Science and Technology Commission is set up by the Chinese Central Government for the construction of the National Ecological Security Agriculture Industrial Chain standardization system. This includes the establishment of National Ecology Safe Agricultural Industrial Parks to build China’s Ecological Security and Agricultural Industrial in an orderly business environment, including completion of the National Soil Remediation Program and governance of the various government functions of the institutions. Through the guidance and support by the Zhongpin Center, Kiwa will participate and be involved in China’s National Soil Remediation Program and construction of the National Ecological Security Agriculture Industrial Chain Standardization System’s operation and process.
Employees
As of December 31, 2017, we employed 82 full-time employees. The following table sets forth the number of our full-time employees by function as of December 31, 2017.
Employees and their Functions
| Management & Administrative Staff | 33 | 40.24 | % | |||||
| Sales | 13 | 15.85 | % | |||||
| Technical & Engineering Staff | 36 | 43.90 | % | |||||
| Total | 82 | 100.00 | % |
As required by applicable PRC law, we have entered into employment contracts with all our officers, managers and employees. We believe that we maintain a satisfactory working relationship with our employees and we have not experienced any significant labor disputes or any difficulty in recruiting staff.
In addition, we are required by PRC law to cover employees in China with various types of social insurance and believe that we are in material compliance with the relevant laws.
Insurance
We believe our insurance coverage is customary and standard for companies of comparable size in comparable industries in China.
Smaller reporting companies are not required to provide the information required by this item.
ITEM 1B. Unresolved Staff Comments
None.
In June 2002, Kiwa Shandong entered into an agreement with Zoucheng Municipal Government granting us the use of at least 15.7 acres in Shandong Province, China at no cost for 10 years to construct a manufacturing facility. Under the agreement, we have the option to pay a fee of approximately RMB 480,000 (approximately $78,155) per acre for the land use right at the expiration of the 10-year period. We may not transfer or pledge the temporary land use right. In the same agreement, we have also committed to invest approximately $18 million to $24 million for developing the manufacturing and research facilities in Zoucheng, Shandong Province. AsOn February 11, 2017 Kiwa Bio-Tech Products (Shandong) entered an Equity Transfer Agreement with Dian Shi Cheng Jing (Beijing) Technology Co. (“Transferee”) to transfer all of December 31, 2015, we had invested approximately $1.91 million in plantshareholders’ right, title, interest and equipment for the project. The Company is in negotiation with Zoucheng Municipal Government to renew the agreement. However, there is no assurance that the Company will successfully renew the agreement with Zoucheng Municipal Government. In the future, the Company may consider moving the primary location of Kiwa Shandong’s operation to other locations in China.
From January 1, 2007, China central government adopted a series of policies to strengthen land management, including doubling the tenure tax to $3,320 per acre. In February 2008, the Ministry of Land and Resources of China issued “Controlling Indexes of Construction Land Use for Industrial Projects,” which requires that the building coverage be not less than 30%. Up to now, the current situationliabilities in Kiwa Shandong does not meet this requirement. Asto the Transferee for RMB $1.00. The completion of transfer was completed on April 12, 2017.
| 8 |
(a) On March 1, 2017, Kiwa Bio-Tech (Shenzhen) Co., Ltd, a company operating ag-biotech business, the building coverage may differ from thatnewly established subsidiary entered an office lease agreement with one-year term. Monthly lease payment is RMB 29,000 or approximately of typical manufacturers in other industries. However, there is no assurance that local authorities would not take back a portion of the land granted to us.USD $4,320. This lease was terminated on August 31, 2017.
The core ingredient(b) On June 20, 2017, Kiwa Bio-Tech (Shenzhen) Co., Ltd, a newly established subsidiary entered an office lease agreement with two-year term. Monthly lease payment is RMB 117,221 or approximately of our bio-fertilizer productsUSD $17,213 for the first year and RMB 124,254 or approximately of USD $18,245 for the second year. And the previous lease agreement terminated automatically since the landlord is bacillus spp. Photosynthetic bacteria is one of the ingredients used in some of our products. However, the upgrade of bio-fertilizer production facilities was not fully completed due to capital shortage.same one.
The Company leases its principal(c) On May 5, 2017, Kiwa Bio-Tech Products Group Corporation entered an office from a related party at the rent of $1,000 per month. This lease expired in January 2015.agreement with 13 months term. Monthly lease payment totaled USD $781.15.
(d) On July 1, 2017, Kiwa Bio-Tech Products Group Corporation entered an office lease agreement with one-year term. Monthly lease payment totaled USD $1,087.
None.
ITEM 4. Mine Safety Disclosures
Not applicable.
ITEM 5. Market for Registrants’ Common Equity, Related Stockholder Matters and Issuer Purchasers of Equity Securities
Market Information
The Company’s common stock has been quoted on the OTC Pink Sheets under the symbol “KWBT” since March 30, 2004. Our shares are currently traded on the OTCQB.
The following table sets forth the high and low bid quotations per share of our common stock as reported on the OTC Pink SheetsOTCQB for the periods indicated. The high and low bid quotations reflect inter-dealer prices, without retail mark-up, mark-down or commission and may not necessarily represent actual transactions. All prices are adjusted to reflect the Company’s one for 200 reverse split which went effective January 28, 2016.
| Fiscal Year 2015 | High | Low | ||||||||||||||
| Fiscal Year 2017 | High | Low | ||||||||||||||
| First Quarter | $ | 1.47 | $ | 0.12 | $ | 1.49 | $ | 1.44 | ||||||||
| Second Quarter | $ | 0.44 | $ | 0.02 | $ | 2.61 | $ | 2.48 | ||||||||
| Third Quarter | $ | 0.32 | $ | 0.12 | $ | 2.52 | $ | 2.31 | ||||||||
| Fourth Quarter | $ | 0.70 | $ | 0.12 | $ | 1.92 | $ | 1.83 | ||||||||
| Fiscal Year 2014 | High | Low | ||||||||||||||
| Fiscal Year 2016 | High | Low | ||||||||||||||
| First Quarter | $ | 1.16 | $ | 0.22 | $ | 2.24 | $ | 0.20 | ||||||||
| Second Quarter | $ | 0.70 | $ | 0.20 | $ | 1.98 | $ | 1.30 | ||||||||
| Third Quarter | $ | 0.70 | $ | 0.22 | $ | 1.65 | $ | 0.62 | ||||||||
| Fourth Quarter | $ | 0.34 | $ | 0.22 | $ | 1.43 | $ | 0.80 | ||||||||
Holders
As of December 31, 2015,2017, there were approximately 435495 shareholders of record of our common shares.
| 9 |
Dividend Policy
We have not paid any dividends on our common shares since our inception and do not anticipate that dividends will be paid at any time in the immediate future.
Equity Compensation Plan Information
The information required by Item 5 regarding securities authorized for issuance under equity compensation plans is included in Item 12 of this report.
Recent Sales of Unregistered Securities
BelowThe following is a list of securities sold by usissued for cash or converted with debentures or as stock compensation to consultants during the period from January 1, 20152017 through April 10, 2016March 30, 2018, which were not registered under the Securities ActAct:
| Name of Purchaser | Issue Date | Security | Shares | Consideration | ||||||
| 3/ | Common | |||||||||
| 3/ | Common | |||||||||
| 3/ | Common | 70,000 | Consultant Fees | |||||||
| HAIPING LIU | 6/13/17 | Common | 19,380 | Consultant Fees | ||||||
| YANG YANG | 6/13/17 | Common | 96,900 | Stock Purchase | ||||||
| YUAN ZENG | 6/30/17 | Common | 21,100 | Stock Purchase | ||||||
| BAOYU OUYANG | 6/30/17 | Common | 17,000 | Stock Purchase | ||||||
| HONGHUA ZHANG | 6/30/17 | Common | 15,000 | Stock Purchase | ||||||
| WEIQIANG XU | 6/30/17 | Common | 10,000 | Stock Purchase | ||||||
| JIALIN XIONG | 6/30/17 | Common | 3,750 | Stock Purchase | ||||||
| KUN WEI | 6/30/17 | Common | 3,000 | Stock Purchase | ||||||
| YANYU GUO | 6/30/17 | Common | 2,000 | Stock Purchase | ||||||
| YANJIAO GUO | 6/30/17 | Common | 1,000 | |||||||
| MENGSHA YUAN | 6/30/17 | Common | 10,000 | Stock Purchase | ||||||
| MO HAN | 6/30/17 | Common | 15,000 | Stock Purchase | ||||||
| HEBE HAN | 6/30/17 | Common | 15,108 | Consultant Fees | ||||||
| QUANZHEN SHEN | 8/1/17 | Common | 98,000 | Stock Purchase | ||||||
| QUANZHEN SHEN | 8/1/17 | Common | 49,000 | Consultant Fees | ||||||
| YUAN WANG | 8/1/17 | Common | 39,000 | Consultant Fees | ||||||
| JUNWEI ZHENG | 8/1/17 | Common | 245,000 | Stock Purchase | ||||||
| YANWU ZHU | 8/18/17 | Common | 67,500 | Consultant Fees | ||||||
| ZHEN LIN | 8/18/17 | Common | 50,000 | Consultant Fees | ||||||
| HAIPENG LIU | 8/18/17 | Common | 50,000 | Consultant Fees | ||||||
| YANAN FU | 8/18/17 | Common | 206,000 | Consultant Fees | ||||||
| XIAOCHUN ZHANG | 8/18/17 | Common | 100,000 | Consultant Fees | ||||||
| YUEFENG SU | 8/18/17 | Common | 135,000 | Stock Purchase | ||||||
| ZHEN LIN | 8/18/17 | Common | 50,000 | Stock Purchase | ||||||
| HAIPENG LIU | 8/18/17 | Common | 50,000 | Stock Purchase | ||||||
| FIRSTTRUST GROUP, INC. | 10/19/17 | Common | 14,151 | Conversion of Note | ||||||
| DONGQING ZHAO | 10/24/17 | Common | 50,000 | Consultant Fees | ||||||
| LIYA WANG | 10/24/17 | Common | 50,000 | Consultant Fees | ||||||
| MING JI | 10/24/17 | Common | 50,000 | Consultant Fees | ||||||
| SHUMIN E | 10/24/17 | Common | 50,000 | Consultant Fees | ||||||
| XIUFANG GAO | 10/24/17 | Common | 50,000 | Consultant Fees | ||||||
| YUFANG YANG | 10/24/17 | Common | 50,000 | Consultant Fees | ||||||
| GENG LIU | 10/24/17 | Common | 500,000 | Consultant Fees | ||||||
| XUAN ZHANG | 10/24/17 | Common | 500,000 | Consultant Fees | ||||||
| HAIRONG CHEN | 10/24/17 | Common | 38,000 | Consultant Fees | ||||||
| ERLI WEI | 10/24/17 | Common | 38,000 | Stock Purchase | ||||||
| FIRSTTRUSTGROUP, INC. | 12/27/17 | Common | 105,095 | Conversion of Note | ||||||
| Wei Li | 12/28/17 | Ser. B Preferred | 811,148 | Debt Cancellation | ||||||
| YONGTAO YU | 12/29/17 | Common | 1,000,000 | Stock Purchase | ||||||
| TIANAO ZHANG | 12/29/17 | Common | 1,540,000 | Stock Purchase | ||||||
| WSMG ADVISORS | 1/11/18 | Common | 180,000 | Consultant Fees | ||||||
| ACORN MANAGEMENT PARTNERS, LLC. | 1/11/18 | Common | 187,500 | Consultant Fees | ||||||
| TING LI | 1/11/18 | Common | 400,000 | Consultant Fees | ||||||
| JIANPING GUO | 3/9/18 | Common | 100,000 | Consultant Fees | ||||||
| GUOHUI YU | 3/16/18 | Common | 50,000 | Consultant Fees | ||||||
| Total: | 8,202,632 | |||||||||
| 10 |
ITEM 6. Selected Financial Data
Not required.
ITEM 7. Management’s Discussion and Analysis of Financial Condition and Results of Operations
This Annual Report on Form 10-K for the fiscal year ended December 31, 20152017 contains “forward-looking” statements within the meaning of Section 21E of the Securities and Exchange Act of 1934, as amended, including statements that include the words “believes,” “expects,” “anticipates,” or similar expressions. These forward-looking statements include, among others, statements concerning our expectations regarding our working capital requirements, financing requirements, business, growth prospects, competition and results of operations, and other statements of expectations, beliefs, future plans and strategies, anticipated events or trends, and similar expressions concerning matters that are not historical facts. The forward-looking statements in this Annual Report on Form 10-K for the fiscal year ended December 31, 20152017 involve known and unknown risks, uncertainties and other factors (described in “Business-Risk Factors” under Item 1) that could cause our actual results, performance or achievements to differ materially from those expressed in or implied by the forward-looking statements contained herein.
Overview
The Company took its present corporate form in March 2004 when the shareholders of Kiwa Bio-Tech Products Group Ltd. (“Kiwa BVI”), a company originally organized under the laws of the British Virgin Islands on June 5, 2002 and Tintic Gold Mining Company a Utah public corporation (“Tintic”), a corporation originally incorporated in the state of Utah on June 14, 1933 to perform mining operations in Utah, entered into a share exchange transaction. The share exchange transaction with the shareholders of Kiwa BVI, a privately-held British Virgin Islands corporation that left the shareholders of Kiwa BVI owning a majority of Tintic and Kiwa BVI a wholly-owned subsidiary of Tintic, see “Business - The Company” under Item 1.Tintic. For accounting purposes this transaction was treated as an acquisition of Tintic Gold Mining Company by Kiwa BVI in the form of a reverse triangular merger and a recapitalization of Kiwa BVI and its wholly owned subsidiary, Kiwa Shandong.Bio-Tech Products (Shandong) Co., Ltd. (“Kiwa Shandong”). On July 21, 2004, we completed our reincorporation in the State of Delaware. On March 8, 2017, we completed our reincorporation in the State of Nevada.
On November 30, 2015, we entered into an acquisition agreement (the “Agreement”) with the shareholders of Caber Holdings LTD, whose Chinese name is Hong Kong Baina Group Co., Ltd, located in Hong Kong (“Baina Hong Kong”), and Oriental Baina Co. Ltd. (hereinafter referred to as “Baina Beijing”), Baina Hong Kong’s wholly-owned subsidiary in Beijing, China. Kiwa will rename Baina Beijing to Kiwa Baiao Co. Ltd. Kiwa Baiao Co. Ltd will replace Kiwa’s current subsidiary in China - Kiwa Bio-Tech (Shandong) Co., Ltd (“Kiwa Shandong”) - to operate Kiwa’s bio-fertilizer market expansion and become Kiwa’s platform for future acquisitions of new agricultural-related projects in China. In accordance with the terms of the Agreement, Kiwa agreed to pay approximately $34,000 (RMB 220,000) to the Baina Hong Kong Shareholders, a group of unrelated third parties, for the acquisition of 100% of the equity of Baina Hong Kong. The acquisition was completed on January 7, 2016. Both Baina Hong Kong and Baina Beijing had no activities before the acquisition date and had no assets and liabilities. The purpose of this acquisition was to acquire Baina Hong Kong’s corporation registration in Hong Kong and in China.
We havepreviously established a subsidiary in China, Kiwa Shandong in 2002, a wholly-owned subsidiary.subsidiary, engaging in the bio-fertilizer business. Formerly, our subsidiary Tianjin Kiwa Feed Co., Ltd. (“Kiwa Tianjin”), was engaged in the bio-enhanced feed business. At the end of 2009, our former subsidiary, Kiwa Tianjin discontinuedcould no longer use its business operations, because it lost possession of its primary assets including machinery and inventory necessary to its business operations due to an unsettled dispute. As a result, the Company has classified the bio-enhanced feed business as discontinued operations. Effective on July 11, 2012, the Company formally dissolved Kiwa Tianjin.
We generated no revenue in fiscal years 2015 and 2014. We incurred a net loss of $677,358 and $707,556 during fiscal 2015 and 2014, respectively.
Due to our limited revenues, we have relied on the proceeds from loans from both unrelated and related parties to provide the resources necessary to fund the development of our business plan and operations. Our financing activities generated $148,009 and $144,194 during fiscal 2015 and 2014, respectively. These funds are insufficient to execute our business plan as currently contemplated, which may result in the risks described in “Risk Factors” under Item 1 - Business.
Going Concern
The consolidated financial statements have been prepared assuming that the Company will continue as a going concern, which contemplates the realization of assets and the satisfaction of liabilities in the normal course of business.operations. Kiwa Tianjin has been dissolved since July 11, 2012. On February 11, 2017, the Company entered an Equity Transfer Agreement with Dian Shi Cheng Jing (Beijing) Technology Co. (“Transferee”) to transfer all of shareholders’ right, title, interest and liabilities in Kiwa Shandong to the Transferee for RMB1.00. On April 12, 2017, the government processing of transfer has been completed.
| 11 |
Principal Factors Affecting Our Financial Performance
AsWe believe that the following factors that would affect our financial performance:
| ● | Change in the Chinese Government Policy on agricultural industry. The Chinese Government is continuously to promote green environment and implement quality standards and environmentally sensitive policies in the Agricultural industry. Below are a list of government policies issued by the Chinese Government to promote green environment and these policies are either directly or indirectly to encourage the end users of the bio-fertilizer to use more organic related products. Unfavorable changes to these policies could affect demand of our products that we produce and could materially and adversely affect the results of operations. Although we have generally benefited from these policies by using our bio-fertilizer to enhances the capacity of plants to transform inorganic materials to organic products, to boost overall plant health and productivity and not to deteriorate landfall soil. |
| ○ | In April 2008, the Ministry of Finance of PRC issued Circular No. 2008-56 to tax-exempt value-added taxes on all organically fertilizer related products effectively from June 1, 2008. | |
| ○ | In January 2016, the PRC State Council official website issued statements to fasten the agricultural modernization process. | |
| ○ | In June 2016, the PRC State Council issued Circular No. 2016-31 to prevent further deterioration of landfall soil action plan. | |
| ○ | In February 2017, the PRC State Council official website issued statements to promote agricultural structural reform on accelerating the cultivation in the agricultural development. | |
| ○ | In February 2017, the Ministry of Agriculture of PRC issued Circular No. 2017-02 to carry out replacement of chemical bio-fertilizers by organically bio-fertilizers action plan on vegetables, fruits and teas planting. | |
| ○ | In April 2017, the Ministry of Agriculture of PRC issued Circular No. 2017-06 to implementing five major action plans on agriculture green development with one of the action plan of replacing chemical bio-fertilizers by organically bio-fertilizers on vegetables, fruits and teas planting under action plan No. 2-2. |
| ● | Innovation Efforts. We strive to produce the most technically and scientifically advanced products for our customers and maintained close relationships with institutes in the PRC. |
| ○ | We signed a strategic cooperation agreement with China Academy of Agricultural Science’s Institute of Agricultural Resources & Regional Planning and Institute of Agricultural Economy & Development. Pursuant to the Agreement, we will form a strategic partnership with the two institutes and establish an “International Cooperation Platform for Internet and Safe Agricultural Products”. To fund the cooperation platform’s R&D activities, we will provide RMB 1 million (approximately $160,000) per year to the Spatial Agriculture Planning Method & Applications Innovation Team that belongs to the Institutes. The term of the Agreement is for three years beginning November 20, 2015 and will expire on November 19, 2018. | |
| ○ | Meanwhile, on February 23, 2017, the Company entered a strategic relationship with ETS (Tianjin) Biological Science and Technology Development Co., Ltd. (“ETS”). ETS technology was first established in the U.S., and commercialized and improved in Japan for nearly 30 years. In 2013, the ETS technology was introduced into Mainland China. It has been widely accepted that the application of ETS biotechnology facilitates agricultural sustainability and helps to protect the soil and improve grain output. The technology focuses on keeping soil healthy by restoring healthy microbes that are naturally present in healthy soils. As the technology gains worldwide recognition, it is imperative to popularize bio-fertilizer in developing countries to fulfill the needs of growing populations and promote environmentally friendly agriculture. The cooperation will include the deployment and strategic use of ETS biotechnology to produce of bio-fertilizers for use in both China and internationally. The cooperation will bring technological transformation and support for Kiwa to improve its existing manufacturing techniques. Kiwa and ETS will also collaborate to establish a comprehensive platform for producing, supplying, and marketing in China. Ultimately, Kiwa would look to introduce these products to the international market, including the United States. |
| 12 |
| ● | Experienced Management. Management’s technical knowledge and business relationships give us the ability to secure more sales orders with our customers. If there were to be any significant turnover in our senior management, it could deplete the institutional knowledge held by our existing senior management team. | |
| ● | Large Scale Customer Relationship. We have contracts with major customers that are distributors of our products. Our sales efforts focus on these distributors which place large recurring orders and present less credit risk to us. For the year ended December 31, 2017, three customers accounted for approximately 46%, 26%, and 17% of our sales. Should we lose any of these large scale customers in the future and are unable to obtain additional customers, our revenues and operation results may be adversely affected. | |
| ● | Competition. Our competition includes a number of publicly traded companies in the PRC and privately-held PRC-based companies that produce and sell products similar to ours. We compete primarily on the basis of quality, technological innovation and price. Some of our competitors have achieved greater market penetration but with less sophisticated technological innovation than our products as there were in the transition period from being the chemical bio-fertilizer producers to the organically bio-fertilizer producers. We believe that we have a better competitive advantage over them as we are the pioneer within our markets. Some of our competitors competed within our markets have lesser financial and other resources than us as they have established their companies a few years behind us. If we are unable to compete successfully in our markets, our relative market share and profits could be reduced. |
Results of Operations for the Year ended December 31, 2015,2017 and December 31, 2016
The following table summarizes the Company’s current liabilities substantially exceeded its current assets by $9,330,130. The Company had no sales duringresults of our operations for the years ended December 31, 20152017 and 2014, had an accumulated deficitDecember 31, 2016, respectively, and provides information regarding the dollar and percentage increase or (decrease) during such periods.
(All amounts, other than percentages, in thousands of $20,324,812U.S. dollars)
| Year Ended December 31, | Amount Increase | Percentage Increase | ||||||||||||||
| Statement of Operations Data: | 2017 | 2016 | (Decrease) | (Decrease) | ||||||||||||
| Revenues | $ | 17,270 | $ | 9,621 | $ | 7,649 | 80 | % | ||||||||
| Cost of goods sold | (11,846 | ) | (7,200 | ) | (4,646 | ) | 65 | % | ||||||||
| Gross profit | 5,424 | 2,421 | 3,003 | 124 | % | |||||||||||
| Operating expenses | ||||||||||||||||
| Research and development expense | 148 | 149 | (1 | ) | (1 | )% | ||||||||||
| Selling expenses | 483 | 530 | (47 | ) | (9 | )% | ||||||||||
| General and administrative expenses | 2,997 | 869 | 2,128 | 245 | % | |||||||||||
| Total operating expenses | 3,628 | 1,548 | 2,080 | 134 | % | |||||||||||
| Operating Income | 1,796 | 873 | 923 | 106 | % | |||||||||||
| Other income/(expense), net | ||||||||||||||||
| Trademark license income-related party | - | 786 | (786 | ) | (100 | )% | ||||||||||
| Change in fair value of derivative liabilities | 322 | - | 322 | 100 | % | |||||||||||
| Interest expenses | (524 | ) | (191 | ) | (333 | ) | 175 | % | ||||||||
| Other income/(expense) | 382 | (2 | ) | 384 | (18,375 | )% | ||||||||||
| Exchange loss | (59 | ) | - | (59 | ) | 100 | % | |||||||||
| Total other income/(expense), net | 121 | 593 | (472 | ) | (80 | )% | ||||||||||
| Income from continuing operations before income taxes | 1,917 | 1,466 | 451 | 31 | % | |||||||||||
| Income taxes | (1,103 | ) | (425 | ) | (678 | ) | 160 | % | ||||||||
| Income from continuing operations | $ | 814 | $ | 1,041 | $ | (227 | ) | (22 | )% | |||||||
| Income (loss) from discontinued operations, net of taxes | 4,495 | (150 | ) | 4,645 | (3,088 | )% | ||||||||||
| Net Income | $ | 5,309 | $ | 891 | $ | 4,418 | 496 | % | ||||||||
| 13 |
Revenue
Revenue increased by approximately $7.6 million or 80%, to approximately $17.3 million in the year ended December 31, 2017 from approximately $9.6 million in the year ended December 31, 2016. In August 2016, Kiwa Baiao Bio-Tech (Beijing) Co., Ltd obtained a fertilizer sales permit from the Chinese government and stockholders’ deficiencybegan to sell the products directly to customers in Northern areas of $11,100,454.China. Due to the good quality of our products, we have gained more reputation in the agricultural industry and were able to attract more customers. In addition, we established Kiwa Bio-Tech Products (Shenzhen) Co., Ltd. in November 2016 to support sales in Southern areas of China. Our strategy on the expansion of our business was to gain market share in the bio-fertilizer market, thereby, we have extended credit to our customers. Our current payment terms on these customers are ranging from 60 days to 9 months after receipts of the goods depending on the creditworthiness of these customers. These circumstances, among others, raise substantial doubt aboutcustomers are mainly agricultural cooperative company and distributors who then resell our products to individual farmers. Because the Company’scrop growing cycle usually takes approximately 3 to 9 months in the agricultural industry, it will take approximately similar time frame of 3 to 9 months for farmers to harvest crops and to realize profits to repay our distributors. As a result, for the sales contracts with these customers, the collectability of payment is highly dependent on the successful harvest of corps and the customers’ ability to continue as a going concern.collect money from farmers. The financial statements doCompany deemed the collectability of payment may not include any adjustmentsbe reasonably assured until after the Company is paid. For those sales contracts that might resultthe Company has shipped its products but the payment is contingent on collections of payments from the outcomedownstream customers, the Company considers the revenue recognition criteria are not met and therefore defers the revenue and cost of this uncertainty. The financial statements also do not include any adjustments relatinggoods sold until payments are collected. We have sold, shipped and collected our accounts receivable approximately $17.3 million of our products during the year ended December 31, 2017. As a result, our revenue increased accordingly for the year ended December 31, 2017 as compared to the recoverabilitysame period in 2016.
We currently realized revenue in two major product categories of Biological Organic Fertilizer and classificationCompound Microbial Fertilizer. Biological Organic Fertilizer is the first product category we launched into market in September 2016. Compound Microbial Fertilizer are our new products with higher effectiveness on the productivity of recorded asset amounts,crops and increasing the value and quality of the crops harvested, which was firstly introduced in March 2017. We sold and shipped Compound Microbial Fertilizer in the third quarter of 2017. We plan to launch another product category of Bio-Water Soluble Fertilizer in the third quarter of 2018. Our revenues from our major product categories are summarized as follows:
| For the year ended December 31, 2017 | For the year ended December 31, 2016 | Change | Change (%) | |||||||||||||
| Biological Organic Fertilizer | ||||||||||||||||
| Sold and shipped in USD | $ | 9,219,453 | $ | 9,620,929 | $ | (401,476 | ) | (4.2 | )% | |||||||
| Quantity sold in tons | 51,877 | 53,250 | (1,373 | ) | (2.6 | )% | ||||||||||
| Average selling price | $ | 177.72 | $ | 180.66 | $ | (2.94 | ) | (1.6 | )% | |||||||
| Compound Microbial Fertilizer | ||||||||||||||||
| Sold and shipped in USD | $ | 8,050,616 | $ | - | $ | 8,050,616 | 100.0 | % | ||||||||
| Quantity sold in tons | 24,781 | - | 24,781 | 100.0 | % | |||||||||||
| Average selling price | $ | 324.87 | $ | - | $ | 324.87 | 100.0 | % | ||||||||
Revenue from Biological Organic Fertilizer decreased by approximately $0.4 million or amounts4.2%, to approximately $9.2 million in the year ended December 31, 2017 from approximately $9.6 million in the year ended December 31, 2016. The decrease of revenue from Biological Organic Fertilizer mainly due to the combination of decrease of quantity sold and classificationsdecrease in average selling price for the year ended December 31, 2017 as compared to the same period in 2016. Quantity sold decreased by 1,373 tons or 2.6% mainly due to management’s revenue generating focus was toward the higher unit profit margin product, Compound Microbial Fertilizer, which was firstly introduced in March 2017. Average selling prices decreased by $2.94 or 1.6% during the year ended December 31, 2017 as compared to the year ended December 31, 2016 was mainly due to the appreciation of liabilitiesRenminbi against U.S. Dollar of approximately 1.7%. Average selling prices for both periods remained stable in Renminbi.
| 14 |
Because the Chinese Government is continuously to promote green environment and implement quality standards and environmentally sensitive policies in the Agricultural industry, we expect our revenues from our innovated and highly effective products, Compound Microbial Fertilizer and Bio-Water Soluble Fertilizer, will continue to grow in a higher rate than that might be necessary shouldfrom Biological Organic Fertilizer. Our Compound Microbial Fertilizer and Bio-Water Soluble Fertilizer generally have a higher effectiveness on the Company be unableproductivity of crops that are suitable for promoting green environment. In addition, our marketing team is expanding to the Western areas of China and Hainan province and we expect our revenues will continue to grow in 2018. Meanwhile, we expect to continue asto gain more market shares in our existing sales channel bases in the Northern and the Southern areas of China due to the good quality of the products and better reputation in the industry.
Compound Microbial Fertilizer is adding appropriate amount of nitrogen, phosphorus, potassium and other nutrients into Biological Organic Fertilizer. Through the action of organic matter and beneficial microorganisms, the utilization rate of nitrogen, phosphorus, potassium can be significantly improved. The Bio-Water Soluble Fertilizer is mainly another form of the biological fertilizer. It is in the form of powder which has high water solubility, and it is convenient for the farmers to use during the drop irrigation. Compound Microbial Fertilizer and Bio-Water Soluble Fertilizer generally contain more bacteria and have a going concern.higher effectiveness on the productivity of crops and increasing the value and quality of the crops harvested than Biological Organic Fertilizer. As a result, our Compound Microbial Fertilizer and Bio-Water Soluble Fertilizer generally have a higher average selling price.
The companysold and shipped amount of Compound Microbial Fertilizer increased by approximately $8.1 million or 100.0% in the year ended December 31, 2017 as we did not sell this product category during the year ended December 31, 2016.
Cost of Revenue
Our cost of revenues from our major product categories are summarized as follows:
| For the year ended December 31, 2017 | For the year ended December 31, 2016 | Change | Change (%) | |||||||||||||
| Biological Organic Fertilizer | ||||||||||||||||
| Cost of sold and shipped in USD | $ | 6,196,511 | $ | 7,199,888 | $ | (1,003,377 | ) | (13.9 | )% | |||||||
| Quantity sold and shipped in tons | 51,877 | 53,250 | (1,373 | ) | (2.6 | )% | ||||||||||
| Average unit cost | $ | 119.45 | $ | 135.21 | $ | (15.76 | ) | (11.7 | )% | |||||||
| Compound Microbial Fertilizer | ||||||||||||||||
| Cost of sold and shipped in USD | $ | 5,649,363 | $ | - | $ | 5,649,363 | 100.0 | % | ||||||||
| Quantity sold and shipped in tons | 24,781 | - | 24,781 | 100.0 | % | |||||||||||
| Average unit cost | $ | 227.97 | $ | - | $ | 227.97 | 100.0 | % | ||||||||
Cost of revenue from Biological Organic Fertilizer decreased by approximately $1.0 million or 13.9%, to approximately $6.2 million in the year ended December 31, 2017 from approximately $7.2 million in the year ended December 31, 2016. The decrease is mainly due to the combination of decrease in quantity sold and the decrease of average unit production cost. The decrease of $15.76 or 11.7% of average unit production cost is mainly due to the combination of decrease of price for raw materials (mainly includes nitrogen, phosphorus and potassium) used in the year ended December 31, 2017 and the appreciation of Renminbi against U.S. Dollar of approximately 1.7%.
Cost of sold and shipped from Compound Microbial Fertilizer increased by approximately $5.7 million or 100.0%. The increase was in line with the increase in the selling amount of Compound Microbial Fertilizer.
| 15 |
Gross Profit
Our gross profit from our major product categories are summarized as follows:
| For the year ended December 31, 2017 | For the year ended December 31, 2016 | Change | Change (%) | |||||||||||||
| Biological Organic Fertilizer | ||||||||||||||||
| Gross Profit | $ | 3,022,943 | $ | 2,421,041 | $ | 601,902 | 24.9 | % | ||||||||
| Gross Profit Percentage | 32.8 | % | 25.2 | % | 7.6 | % | 30.2 | % | ||||||||
| Compound Microbial Fertilizer | ||||||||||||||||
| Gross Profit | $ | 2,401,252 | $ | - | $ | 2,401,252 | 100.0 | % | ||||||||
| Gross Profit Percentage | 29.8 | % | - | 29.8 | % | 100.0 | % | |||||||||
Gross profit percentage for Biological Organic Fertilizer increased from 25.2% for the year ended December 31, 2016 to 32.8% for the year ended December 31, 2017 mainly due to the decrease in raw materials price in our unit production cost of our products for the reason as discussed above.
Research and Development Expenses
Research and development expenses was approximately $148,000 (RMB 1,000,000) for the year ended December 31, 2017, keeping the same as the prior comparable period of approximately $149,000 (RMB 1,000,000) for the year ended December 31, 2016. On November 20, 2015, the Company signed a strategic cooperation agreement (the “Agreement”) with China Academy of Agricultural Science (“CAAS”)’s Institute of Agricultural Resources & Regional Planning (“IARRP”) and Institute of Agricultural Economy & Development (“IAED”). Pursuant to the Agreement, the Company will form a strategic partnership with the two institutes and establish an “International Cooperation Platform for Internet and Safe Agricultural Products”. To fund the cooperation platform’s R&D activities, the Company will provide RMB 1 million (approximately $148,000) per year to the Spatial Agriculture Planning Method & Applications Innovation Team that belongs to the Institutes. The term of the Agreement is for three years beginning November 20, 2015 and will expire on November 19, 2018. However, the Company is only liable for the annual funds to be provided to the extent of the contract obligations performed by CAAS IARRP and IAED, and the agreement is terminable before the three years’ commitment date based on negotiations of both parties. The Company contributed approximately $148,000 (RMB 1,000,000) for the year ended December 31, 2017 and approximately $149,000 (RMB 1,000,000) for the year ended December 31, 2016. The Company plans to relycontribute the same R&D expense in quarterly installments in 2018 until the date of the Agreement expires on November 19, 2018.
Selling Expense
Selling expenses for the years ended December 31, 2017 and 2016 were approximately $483,000 and $530,000, respectively. Selling expenses include salaries of sales personnel, sales commission, travel and entertainment as well as freight out expenses. The decrease in selling expenses is mainly due to the decrease of freight out expenses of approximately $0.5 million offset by the increase in salary expenses of approximately $0.3 million and increase in promotional expenses of approximately $0.1 million in 2017. During the year ended December 31, 2016, we were responsible for freight out expenses while during the year ended December 31, 2017, our demand of the products was on a rise and our customers are willing to pay for the freight out expenses on their own. The increase in salary expenses is mainly because we have started hiring sales managers in the fourth quarter of 2016 for the marketing of our products in 2017. Prior to September 2016, there was no designated sales personnel since Kiwa Beijing just obtained the permit to sell bio-fertilizer in September 2016. With business expansion, we have hired more sales managers in Kiwa Beijing and in Kiwa Shenzhen to manage our sales activities in different regions of China from October 2016 and throughout 2017. In addition, we have incurred a lot of promotion and marketing activities in 2017 which also attributable to the increase of promotional expenses.
| 16 |
General and Administration
General and administrative (“G&A”) expenses increased by approximately $2.1 million or 245% from approximately $0.9 million in the year ended December 31, 2016 to approximately $3.0 million in the same period in 2017. General and administrative expenses include professional fees, officers’ compensation, depreciation and amortization, salaries, travel and entertainment, rent, office expense and telephone expense and the like. The increase in general and administrative expenses is mainly attributed to business expansion and the establishment of Kiwa Shenzhen in November 2016, Kiwa Hebei in December 2016 and Kiwa Asia in July 2017, which contributed approximately $1.0 million increase. In addition, approximately $0.6 million increase of G&A expenses are attributable to the increase of professional fees, such as attorneys, auditors, financial consultants, IT consultants, and business strategic and development consultants.
Right-to-use Trademark Income
Trademark license income totaled $0 for the year ended December 31, 2017, compared with $786,329 for the same period of 2016, reflecting a decrease of 100% from the same period of last year. Income was generated from licensing our trademark to Gerui. We signed the license agreement with Gerui to allow Gerui to sell fertilizer using our trademark in December 2015. We charged Gerui 10% of net sales of fertilizers bearing Kiwa trademark for using our trademark. Gerui began to sell fertilizers bearing Kiwa trademark in 2016. In August 2016, we obtained the government approval of selling fertilizers in China. As a result, we ceased the licensing arrangement cooperation with Gerui and started to sell our own bio-fertilizers from September 2016.
Other Income
Other income increased by approximately $0.4 million from $0 for the year ended December 31, 2016 to approximately $0.4 million in the same period in 2017. The increase is mainly attributable the accrued professional fees which were unclaimed for more than ten years and we have evaluated and reached the decision to discharge these liabilities.
Interest Expenses
Net interest expense was $ 524,333 and $ 190,552 for the year ended December 31, 2017 and 2016, respectively, representing an increase of $333,781 or 175%. Interest expense included accrued interest on convertible note and other note payable, and the amortization of the convertible note discount for the year ended December 31, 2017 and 2016. The increase in interest expenses is mainly attributed to newly issuance of two 15% convertible notes for the year ended December 31, 2017.
Income (Loss) from discontinued operations, net of taxes
Income from discontinued operations, net of taxes was $4,495,333 for the year ended December 31, 2017 and loss from discontinued operations, net of taxes was $150,471 for the year ended December 31, 2016, which results an increase of $4,645,804 gain from discontinued operations, net of taxes for the years ended December 31, 2017 and 2016. Due to suffering from losses for several years, on February 11, 2017, the Company executed an Equity Transfer Agreement with Dian Shi Cheng Jing (Beijing) Technology Co. (“Transferee”) whereby the Company transferred all of its right, title and interest in Kiwa Bio-Tech Products (Shandong) Co., Ltd. (“Shandong”) to the Transferee for RMB 1.00. The government processing of the transaction was completed on April 12, 2017. Therefore, it’s resulted in the increase of income from discontinued operations, net of taxes.
Net Income
During the fiscal year 2017, net income was $5,309,036, compared with $891,030 for the same period of 2016, representing an increase of $4,418,006 or 496%. Such change was the result of the combination of the changes as discussed above.
| 17 |
Critical Accounting Policies and Estimates
We prepared our consolidated financial statements in accordance with accounting principles generally accepted in the United States of America. The preparation of these financial statements requires the use of estimates and assumptions that affect the reported amounts of assets and liabilities and the disclosure of contingent assets and liabilities at the date of the financial statements and the reported amount of revenues and expenses during the reporting period. Management periodically evaluates the estimates and judgments made. Management bases its estimates and judgments on historical experience and on various factors that are believed to be reasonable under current circumstances. Actual results may differ from these estimates as a result of different assumptions or conditions.
The following critical accounting policies affect the more significant judgments and estimates used in the preparation of our consolidated financial statements. In addition, you should refer to our accompanying consolidated balance sheets as of December 31, 2017 and 2016, and the consolidated statements of operations and comprehensive income (loss), changes in shareholders’ equity (deficiency) and cash flows for the fiscal years ended December 31, 2017 and 2016, and the related notes thereto, for further discussion of our accounting policies.
Revenue Recognition
The Company applies paragraph 605-10-S99-1 of the FASB Accounting Standards Codification for revenue recognition. The Company recognizes revenue when it is realized or realizable and earned. The Company considers revenue realized or realizable and earned when all of the following criteria are met: (i) persuasive evidence of an arrangement exists, (ii) the product has been shipped or the services have been rendered to the customer, (iii) the sales price is fixed or determinable, and (iv) collectability is reasonably assured.
The Company’s current payment terms on credits to its customers are ranging from 60 days to 9 months after receipts of the goods depending on the proceedscreditworthiness of its customers. The Company’s customers are mainly agricultural cooperative company and distributors who then resell the Company’s products to individual farmers. Because the crop growing cycle usually takes approximately 3 to 9 months in the agricultural industry for some of these Co-ops and distributors, will take approximately similar time frame of 3 to 9 months for farmers to harvest crops and to realize profits to repay the resellers. As a result, for the sales contracts with these customers, the collectability of payment is highly dependent on the successful harvest of corps and the customers’ ability to collect money from farmers. The Company deemed the collectability of payment may not be reasonably assured until after the Company get paid. For those sales contracts that the Company has shipped its products but the payment is contingent on collections of payments from the downstream customers, the Company considers the revenue recognition criteria are not met and therefore defers the revenue and cost of goods sold until payments are collected. These revenue and cost of goods sold are classified in the captioned “Deferred revenue” and “Deferred cost of goods sold” in the accompanying consolidated balance sheets. For other customers whose repayment is within normal business course and not highly dependent on the succession of corps being harvested, the Company recognized revenue when title and ownership of the goods are transferred upon shipment to the customer by the Company.
Accounts receivable and allowance for doubtful accounts
Accounts receivable represent customer accounts receivables. The Company provides an allowance for doubtful accounts equal to the estimated uncollectible amounts. The Company’s estimate is based on historical collection experience, the economic environment trends in the microbial fertilizer industry, and a review of the current status of trade accounts receivable. Management reviews its accounts receivable each reporting period to determine if the allowance for doubtful accounts is adequate. Such allowances, if any, would be recorded in the period the impairment is identified. It is reasonably possible that the Company’s estimate of the allowance for doubtful accounts will change. Uncollectible accounts receivables are charged against the allowance for doubtful accounts when all reasonable efforts to collect the amounts due have been exhausted.
Impairment of Long-Lived Assets
The Company’s long-lived assets consist of property and equipment. The Company evaluates its investment in long-lived assets for recoverability whenever events or changes in circumstances indicate the net carrying amount may not be recoverable. It is possible that these assets could become impaired as a result of legal factors, market conditions, operational performance indicators, technological or other industry changes. If circumstances require a long-lived asset or asset group to be tested for possible impairment, the Company first compares undiscounted cash flows expected to be generated by that asset or asset group to its carrying value. If the carrying value of the long-lived asset or asset group is not recoverable on an undiscounted cash flow basis, an impairment is recognized to the extent that the carrying value exceeds its fair value. Fair value is determined through various valuation techniques, including discounted cash flow models, quoted market values and third-party independent appraisals, as considered necessary.
| 18 |
Related Parties
The Company follows subtopic 850-10 of the FASB Accounting Standards Codification for the identification of related parties and disclosure of related party transactions. Pursuant to Section 850-10-20 the related parties include: a) affiliates of the Company; b) entities for which investments in their equity securities would be required, absent the election of the fair value option under the Fair Value Option Subsection of Section 825–10–15, to be accounted for by the equity method by the investing entity; c) trusts for the benefit of employees, such as pension and profit-sharing trusts that are managed by or under the trusteeship of management; d) principal owners of the Company; e) management of the Company; f) other parties with which the Company may deal if one party controls or can significantly influence the management or operating policies of the other to an extent that one of the transacting parties might be prevented from fully pursuing its own separate interests; and g) other parties that can significantly influence the management or operating policies of the transacting parties or that have an ownership interest in one of the transacting parties and can significantly Influence the other to an extent that one or more of the transacting parties might be prevented from fully pursuing its own separate interests.
The disclosures shall include: a. the nature of the relationship(s) involved; b. a description of the transactions, including transactions to which no amounts or nominal amounts were ascribed, for each of the periods for which income statements are presented, and such other information deemed necessary to an understanding of the effects of the transactions on the consolidated financial statements; c. the dollar amounts of transactions for each of the periods for which income statements are presented and the effects of any change in the method of establishing the terms from that used in the preceding period; and d. amounts due from or to related parties as of the date of each balance sheet presented and, if not otherwise apparent, the terms and manner of settlement.
Income Taxes
The Company accounts for income taxes under the provisions of FASB ASC Topic 740, “Income Tax,” which requires recognition of deferred tax assets and liabilities for the expected future tax consequences of events that have been included in the consolidated financial statements or tax returns. Deferred tax assets and liabilities are recognized for the future tax consequence attributable to the difference between the tax bases of assets and liabilities and their reported amounts in the financial statements. Deferred tax assets and liabilities are measured using the enacted tax rate expected to apply to taxable income in the years in which those temporary differences are expected to be recovered or settled. The effect on deferred tax assets and liabilities of a change in tax rates is recognized in income in the period that includes the enactment date. The Company establishes a valuation when it is more likely than not that the assets will not be recovered.
ASC Topic 740-10, “Accounting for Uncertainty in Income Taxes,” defines uncertainty in income taxes and the evaluation of a tax position as a two-step process. The first step is to determine whether it is more likely than not that a tax position will be sustained upon examination, including the resolution of any related appeals or litigation based on the technical merits of that position. The second step is to measure a tax position that meets the more-likely-than-not threshold to determine the amount of benefit to be recognized in the financial statements. A tax position is measured at the largest amount of benefit that is greater than 50 percent likelihood of being realized upon ultimate settlement. Tax positions that previously failed to meet the more-likely-than-not recognition threshold should be recognized in the first subsequent period in which the threshold is met. Previously recognized tax positions that no longer meet the more-likely-than-not criteria should be de-recognized in the first subsequent financial reporting period in which the threshold is no longer met. Penalties and interest incurred related to underpayment of income tax are classified as income tax expense in the period incurred.
| 19 |
Liquidity and Capital Resources
In assessing our liquidity, we monitor and analyze our cash on-hand and our operating and capital expenditure commitments. Our liquidity needs is to meet our working capital requirements, operating expenses and capital expenditure obligations.
We engage in the business for organically bio-fertilizer and our customers are mainly agricultural cooperative company and distributors who then resell our products to individual farmers. Because the crop growing cycle usually takes approximately 3 to 9 months in the agricultural industry, it will take approximately similar time frame of 3 to 9 months for farmers to harvest crops and to realize profits to repay our distributors. Our current payment terms on these customers are ranging from 60 days to 9 months after receipts of the goods depending on the creditworthiness of these customers. As a result, our accounts receivable turnover ratio is normally low due to the nature of our business. In addition, our business is capital intensive as we need to make advance payment to our suppliers to secure timely delivery and current market price of raw materials. Debt financing in the form of notes payable and loans from both unrelated and related parties have been utilized to providefinance our working capital requirements. As of December 31, 2017, our working capital was approximately $10.2 million and we had cash of approximately $1.1 million, with remaining current assets mainly composed of advance to suppliers.
Although management believes that we can realize our current assets in the resources necessarynormal course of business, our ability to fundrepay our current obligations will depend on the developmentfuture realization of our business plancurrent assets and operations.the future operating revenues generated from our products. Because the Chinese Government is continuously to promote green environment and implement quality standards and environmentally sensitive policies in the Agricultural industry, we expect our revenues from our innovated and highly effective products, Compound Microbial Fertilizer and Bio-Water Soluble Fertilizer, will continue to grow in its business. In addition, our marketing team is expanding to the Western areas of China and Hainan province and we expect our revenues will continue to grow in 2018. Meanwhile, our management expects to continue to gain market shares in our existing sales channel bases in the Northern and the Southern areas of China due to the good quality of our products and better reputation in the industry. Our management believes these factors will enable us sufficiently to support our working capital needs for the next twelve months.
Our management has considered our historical experience, the economic environment, trends in the Agricultural industry, the realization of the advance to suppliers as of December 31, 2017. We expects to realize the balance of its current assets within the normal operating cycle of a twelve month period. If we are unable to realize its current assets within the normal operating cycle of a twelve month period, we may have to consider supplementing its available sources of funds through the following sources:
| ● | in addition to the issuance of our common stock of approximately $6.3 million in 2017, we will continuously seeking additional equity financing to support our working capital; |
| ● | other available sources of financing from PRC banks and other financial institutions; |
| ● | factoring our accounts receivable from our sales starting in the second quarter of 2018; and |
| ● | financial support and credit guarantee commitments from our major shareholder |
Based on the above considerations, our management is of the opinion that we have sufficient funds to meet our working capital requirements and debt obligations as they become due one year from the date of this report. However, there is no assurance that management will be successful in their plans. There are a number of factors that could potentially arise that could undermine our plans, such as changes in the demand for the Company’s products, PRC government policy, economic conditions, and competitive pricing in the Agricultural industry.
The following table set forth summary of our cash flows for the periods indicated:
| Years Ended December 31, | ||||||||
| 2017 | 2016 | |||||||
| Net cash used in operating activities | $ | (5,649,151 | ) | $ | (908,727 | ) | ||
| Net cash used in investing activities | (815,126 | ) | (79,083 | ) | ||||
| Net cash provided by financing activities | 7,534,356 | 1,009,582 | ||||||
| Effect of exchange rate changes on cash | (9 | ) | (8,779 | ) | ||||
| Net increase (decrease) in cash | 1,070,070 | 12,993 | ||||||
| Cash, beginning of year | 13,469 | 476 | ||||||
| Cash, end of year | $ | 1,083,539 | $ | 13,469 | ||||
| 20 |
Operating Activities
Net cash used operating activities was approximately $5.6 million for the year ended December 31, 2017, compared to cash used in operating activities of approximately $0.9 million for the same period in 2016. The increase in net cash used in operating activities was primarily attributable to 1) increase of approximately $10.3 million of advance to suppliers as we need to secure current market price of raw materials purchases as we are anticipating the raw materials price is on the rise in the near future; 2) increase of approximately $2.7 million of inventory as we need to stock up our inventory for the anticipated sales in 2018 offset by 3) net income from our continuing operations of approximately $0.8 million and non-cash reconciliation of operating items of approximately $0.9 million, 4) decrease of approximately of $1.1 million accounts receivables as we have improved our collection effort during 2017 5) decrease of approximately $1.5 million due from related parties – non trade as our related parties has repaid us during 2017 6) increase of approximately $0.6 million of accounts payable as we incurred more payables in our operations 7) increase of approximately $0.9 million of other payables and accruals as we have incurred additional R&D payable and received additional subscription receivable in advances 8) increase of approximately $0.5 million of advance from customers as we received more deposits for our sales orders and 9) increase of approximately $0.7 million of income taxes payable as we have generated more income in 2017 which incurred additional income tax payable.
Investing Activities
Net cash used in investing activities was approximately $0.8 million in the year ended December 31, 2017, and net cash used in investing activities was approximately $80,000 for the year ended December 31, 2016. The net cash used in investing activities was mainly attributable to deposit of investment. The Company also plansentered an equity purchase agreement with the shareholders of Yantai Peng Hao New Materials Technology Co. Ltd. (“Peng Hao”) to raise fundsacquire 100% interest in Peng Hao on June 8, 2017. As of December 31, 2017, the Company has made deposit payment of RMB 5,000,000 (approximately $768,000).
Financing Activities
Net cash provided by financing activities was approximately $7.5 million for the year ended December 31, 2017 and net cash provided by financing activities was approximately $1.0 million for the year ended December 31, 2016. The cash inflow for the year ended December 31, 2017 was mainly resulted from domesticsale of common stocks of approximately $6.3 million, from issuing of our convertible note of approximately $1.0 million and foreign banks and/or financial institutions to increaseapproximately $0.2 million which we borrowed from our related parties for working capital in order to meet capital demands.purpose.
Trends and Uncertainties in Regulation and Government Policy in China
Foreign Exchange Policy Changes
China is considering allowing its currency to be freely exchangeable for other major currencies. This change will result in greater liquidity for revenues generated in Renminbi (“RMB”). We would benefit by having easier access to and greater flexibility with capital generated in and held in the form of RMB. The majority of our assets are located in China and most of our earnings are currently generated in China, and are therefore denominated in RMB. Changes in the RMB-U.S. Dollar exchange rate will impact our reported results of operations and financial condition. In the event that RMB appreciates over the next year as compared to the U.S. Dollar, our earnings will benefit from the appreciation of the RMB. However, if we have to use U.S. Dollars to invest in our Chinese operations, we will suffer from the depreciation of U.S. Dollars against the RMB. On the other hand, if the value of the RMB were to depreciate compared to the U.S. Dollar, then our reported earnings and financial condition would be adversely affected when converted to U.S. Dollars.
On July 21, 2005, the People’s Bank of China announced it would appreciate the RMB, increasing the RMB-U.S. Dollar exchange rate from approximately US$1.00 = RMB 8.28 to approximately US$1.00 = RMB 8.11. So far the trend of such appreciation continues. The exchange rate of U.S. Dollar against RMB on December 31, 20152017 was US$1.00 = RMB 6.4857.6.50979.
| 21 |
Critical Accounting Policies and Estimates
We prepared our consolidated financial statements in accordance with accounting principles generally accepted in the United States of America. The preparation of these financial statements requires the use of estimates and assumptions that affect the reported amounts of assets and liabilities and the disclosure of contingent assets and liabilities at the date of the financial statements and the reported amount of revenues and expenses during the reporting period. Management periodically evaluates the estimates and judgments made. Management bases its estimates and judgments on historical experience and on various factors that are believed to be reasonable under current circumstances. Actual results may differ from these estimates as a result of different assumptions or conditions.
The following critical accounting policies affect the more significant judgments and estimates used in the preparation of our consolidated financial statements. In addition, you should refer to our accompanying audited balance sheets as of December 31, 2015 and 2014, and the audited statements of comprehensive loss, equity movement and cash flows for the fiscal years ended December 31, 2015 and 2014, and the related notes thereto, for further discussion of our accounting policies.
Fair value of warrants and options
We have adopted ASC Topic 815, “Accounting for Derivative Instruments and Hedging Activities” to recognize warrants relating to loans and warrants issued to consultants as compensation as derivative instruments in our consolidated financial statements.
We also adopted ASC Topic 718, “Share Based Payment” to recognize options granted to employees as derivative instruments in our consolidated financial statements.
We calculate the fair value of the warrants and options using the Black-Scholes Model.
Income Taxes
The Company accounts for income taxes under the provisions of FASB ASC Topic 740, “Income Tax,” which requires recognition of deferred tax assets and liabilities for the expected future tax consequences of events that have been included in the consolidated financial statements or tax returns. Deferred tax assets and liabilities are recognized for the future tax consequence attributable to the difference between the tax bases of assets and liabilities and their reported amounts in the financial statements. Deferred tax assets and liabilities are measured using the enacted tax rate expected to apply to taxable income in the years in which those temporary differences are expected to be recovered or settled. The effect on deferred tax assets and liabilities of a change in tax rates is recognized in income in the period that includes the enactment date. The Company establishes a valuation when it is more likely than not that the assets will not be recovered.
ASC Topic 740.10.30 clarifies the accounting for uncertainty in income taxes recognized in an enterprise’s financial statements and prescribes a recognition threshold and measurement attribute for the financial statement recognition and measurement of a tax position taken or expected to be taken in a tax return. ASC Topic 740.10.40 provides guidance on derecognition, classification, interest and penalties, accounting in interim periods, disclosure, and transition. We have no material uncertain tax positions for any of the reporting periods presented.
Major Customers and Suppliers.Risk
Bio-fertilizer productsCredit Risk
Credit risk is one of the most significant risks for our business.
Financial instruments that potentially subject us to significant concentrations of credit risk consist primarily of cash and accounts receivable. Cash held at major financial institutions located in the PRC are not insured by the government. While management believes that these financial institutions are of high credit quality, it also continually monitors their credit worthiness.
Accounts receivable are typically unsecured and derived from revenue (or deferred revenue) earned from customers, thereby exposed to credit risk. Credit risk is controlled by the application of credit approvals, limits and monitoring procedures. We manages credit risk through in-house research and analysis of the Chinese economy and the underlying obligors and transaction structures. To minimize credit risk, we normally require certain prepayment from the customers prior to begin production or delivery products. We identifies credit risk collectively based on industry, geography and customer type. This information is monitored regularly by management.
In measuring the credit risk of our sales to our customers, we mainly reflects the “probability of default” by the customer on its contractual obligations and considers the current financial position of the customer and the exposures to the customer and its likely future development.
Liquidity Risk
During 2015We are also exposed to liquidity risk which is risk that it is unable to provide sufficient capital resources and 2014,liquidity to meet its commitments and business needs. Liquidity risk is controlled by the application of financial position analysis and monitoring procedures. When necessary, we will turn to other financial institutions or related parties to obtain short-term funding to meet the liquidity shortage.
Inflation Risk
We are also exposed to inflation risk Inflationary factors, such as increases in raw material and overhead costs, could impair our principal business didoperating results. Although we do not generate anybelieve that inflation has had a material impact on our financial position or results of operations to date, a high rate of inflation in the future may have an adverse effect on our ability to maintain current levels of gross margin and operating expenses as a percentage of sales revenue thus we had no customers.
During 2015 and 2014, we didif the selling prices of our products do not purchase any raw materials; hence we had no suppliers for 2015 and 2014.increase with such increased costs.
Results of OperationsCommitments and Contingencies
Net Sales
Net sales were $nil forSee Note 17 to the years ended December 31, 2015 and 2014, respectively.
Cost of Sales
Cost of sales was $nil for the years ended December 31, 2015 and 2014, respectively.
Gross Profit/Loss
Gross profit for fiscal 2015 and 2014 was $nil, the Company had not been able to recognize any sales revenue during 2015 and 2014.
General and Administrative
General and administrative expenses were $313,589 and $364,843 for the years ended December 31, 2015 and 2014, respectively, a decrease of $51,254 or 14%. General and administrative expenses include professional fees, officers’ compensation, depreciation and amortization, salaries, travel and entertainment, rent, office expense and telephone expense etc. The decrease mainly resulted from the reduction of our operating activities, which led to a decrease in rent, salaries, travel expenses and office expenses.
Research and Development
Research and development expenses increased significantly by $16,273 or 10% to $178,988 for the year ended December 31, 2015, compared to $162,715 for the prior comparable period. Research and development expense mainly consists of the expenses of maintaining Kiwa-CAU R&D Center, which began operation in July 2006 (see “Business-Intellectual Property and Product Lines- Kiwa-CAU R&D Center”Consolidated Financial Statements under Item 18 in Part I). On November 5, 2015, the Company signed a strategic cooperation agreement (the “Agreement”) with China Academy of Agricultural Science (“CAAS”)’s Institute of Agricultural Resources & Regional Planning (“IARRP”) and Institute of Agricultural Economy & Development (“IAED”). Pursuant to the Agreement, the Company will form a strategic partnership with the two institutes and establish an “International Cooperation Platform for Internet and Safe Agricultural Products”. To fund the cooperation platform’s R&D activities, the Company will provide RMB 1 million (approximately $160,000) per year to the Spatial Agriculture Planning Method & Applications Innovation Team that belongs to the Institutes. During the year ended December 31, 2015, the Company accrued $18,425 for research and development expenses related to this agreement.
Penalty Expense
We charged $72,152 and $66,602 of liquidated damages in connection with the 6% Notes and 2% Notes to penalty expenses during the years ended December 31, 2015 and 2014, respectively. The increase of penalty expense was mainly due to accrued and unpaid interest on the 6% Notes.
Interest Expenses
Net interest expense was $112,629 and $113,396 in the fiscal years of 2015 and 2014, respectively, representing a decrease of $767 or 0.7%.
Net Loss
During the fiscal year 2015, net loss was $677,358, comparing with $707,556 for the same period of 2014, representing a decrease of $30,198 or 4.3%. The decrease is mainly because of decrease in general and administrative expenses especially salary and rent, partially offset by increase of research and development expense and penalty expense described above.
Comprehensive Loss
Comprehensive loss decreased by $337,004 or 57.1% from $590,297 for fiscal 2014, as compared to $253,293 for the comparable year of 2015. This decrease in comprehensive loss resulted from increase in foreign currency translation adjustments of $306,806, in addition to the decrease in net loss described above.
Liquidity and Capital Resources
Since inception of our ag-biotech business in 2002, we have relied on the proceeds from the sale of our equity securities and loans from both unrelated and related parties to provide the resources necessary to fund our operations and the execution of our business plan. During fiscal 2015 and 2014, we raised $148,009 and $144,194 in total from related parties. To some extent, these advances improved our short-term liquidity. However, as of December 31, 2015, our current liabilities substantially exceeded current assets by $9,330,130, reflecting a current ratio of 0.0051, whereas current liabilities exceeded current assets by $9,983,397, reflecting a current ratio of 0.0017 as of December 31, 2014. During the years ended December 31, 2015 and 2014, we did not issue any shares resulting from the conversion of principal of the 6% Notes and 2% Notes into our common stock.
As of December 31, 2015 and 2014, we had cash of $721 and $2,963, respectively. The change is outlined as follows:
During the fiscal year of 2015, net cash used in our operating activities was $150,208, compared to $143,255 for the comparable period of 2014. Such cash was mainly used for maintaining operations of a public company and working capital for our bio-fertilizer business.
During the fiscal years of 2015 and 2014, we did not invest in acquiring property, plant and equipment.
During the year ended December 31, 2015, we generated cash inflow of $148,009 from financing activities. During the year ended December 31, 2014, we generated cash inflow of $144,194 from financing activities.
As of December 31, 2015, we had an accumulated deficit of $20,324,812, which was made up in part of a net loss of $677,358 during 2015 and net loss of $707,556 during 2014.
Currently we have insufficient cash resources to accomplish our objectives. We will need to seek additional funding to sustain our operations. In the next year, we intend to raise additional capital through the issuance of debt or equity securities to fund the development of our planned business operations, although there can be no assurance that we will be successful in obtaining this financing. Various factors listed below significantly harm our ability to obtain this financing.
Given the facts that:
| |
To the extent that we are unable to successfully raise capital necessary to fund our future cash requirements on a timely basis and under acceptable terms and conditions, we will not have sufficient cash resources to maintain operations, and may have to curtail operations and consider a formal or informal restructuring or reorganization.
Contractual Obligations
Pursuant to the agreement on joint incorporation of the research and development center between CAU and Kiwa Shandong dated November 14, 2006, Kiwa Shandong agrees to invest RMB 1 million (approximately $160,000) each year to fund research at the R&D Center. The term of this agreement is ten years starting from July 1, 2006. Prof. Qi Wang, who became one of our directors in July 2007, has acted as the Director of Kiwa-CAU R&D Center since July 2006.
According to the Project Agreement with Zoucheng Municipal Government in 2002, we have committed to investing approximately $18 million to $24 million for developing the manufacturing and research facilities in Zoucheng, Shandong Province. As of December 31, 2015, we had invested approximately $1.91 million for the project.
On November 5, 2015, the Company signed a strategic cooperation agreement (the “Agreement”) with China Academy of Agricultural Science (“CAAS”)’s Institute of Agricultural Resources & Regional Planning (“IARRP”) and Institute of Agricultural Economy & Development (“IAED”). Pursuant to the Agreement, the Company will form a strategic partnership with the two institutes and establish an “International Cooperation Platform for Internet and Safe Agricultural Products”. To fund the cooperation platform’s R&D activities, the Company will provide RMB 1 million (approximately $160,000) per year to the Spatial Agriculture Planning Method & Applications Innovation Team that belongs to the Institutes. The term of the Agreement is for three years beginning November 20, 2015. Prof. Yong Chang Wu, the authorized representative of IARRP, CAAS, is also one of the Company’s directors effective since November 20, 2015.
On November 30, 2015, we entered into an acquisition agreement (the “Agreement”) with the shareholders of Caber Holdings LTD, whose Chinese name is Hong Kong Baina Group Co., Ltd, located in Hong Kong (“Baina Hong Kong”), and Oriental Baina Co. Ltd. (hereinafter referred to as “Baina Beijing”), Baina Hong Kong’s wholly-owned subsidiary in Beijing, China. When this acquisition is completed, Kiwa will rename Baina Beijing to Kiwa Baiao Co. Ltd. Kiwa Baiao Co. Ltd will replace Kiwa’s current subsidiary in China - Kiwa Bio-Tech (Shandong) Co., Ltd (“Kiwa Shandong”) - to operate Kiwa’s bio-fertilizer market expansion and become Kiwa’s platform for future acquisitions of new agricultural-related projects in China. In accordance with the terms of the Agreement, Kiwa agreed to pay US$30,000 to the Baina Hong Kong Shareholders for the acquisition of 100% of the equity of Baina Hong Kong. As of December 31, 2015, the Company has paid RMB 220,000 (approximately $34,000) for the acquisition. The acquisition was completed on January 7, 2016. Both Baina Hong Kong and Baina Beijing had no activities before the acquisition date and had no assets and liabilities.
On December 17, 2015, Kiwa Bio-Tech Products Group Corporation (the “Company”) entered into a distribution agreement (the “Agreement”) with Kangtan Gerui (Beijing) Bio-Tech Co., Ltd. (“Gerui”) and formally awarded Gerui a right to sell and distribute the Company’s fertilizer products in 3 major agricultural regions of China’s Hainan Province, Hunan Province and Xinjiang Autonomous Region. The Company’s Research and Development department has been conducting application experiments in Hainan and Hunan Provinces since August 2015, in accordance with the market requirements. The experiment data indicates that the Company’s fertilizer products have fulfill the requirements of reduction of content of heavy metals in soil and improve crop yield. Gerui was founded in Beijing in April 2015 and relies on the sales network of China’s Supply and Marketing Cooperatives system. Currently, the Company and Gerui do not hold any interest in each other; however, a collaboration and integration may take place in the future. The term of the Agreement is for a period of three years commencing December 17, 2015.II.
Off-Balance Sheet Arrangements
At December 31, 2015,2017, we did not have any relationships with unconsolidated entities or financial partnerships, such as entities often referred to as structured finance or special purpose entities, established for the purpose of facilitating off-balance sheet arrangements or other contractually narrow or limited purposes. As such, we are not exposed to any financing, liquidity, market or credit risk that could arise if we had we engaged in such relationships.
Recent Accounting Pronouncements
See Note 2 to the Consolidated Financial Statements under Item 8, Part II.
ITEM 7A. Quantitative and Qualitative Disclosures about Market Risk
Not required.
| 22 |
ITEM 8. Financial Statements and Supplementary Data
The full text of our audited consolidated financial statements as of December 31, 20152017 and 20142016 begins on page F-1 of this annual report.
ITEM 9. Changes in and Disagreements with Accountants on Accounting and Financial Disclosure
None.On February 15, 2017, the Board of Directors of Kiwa Bio-Tech Products Group Corporation (“Kiwa” or “Company”) decided to engage DYH & Co. as independent principal accountant and auditor to report on the Company’s financial statements for the fiscal year ended December 31, 2016, including performing the required quarterly reviews.
In conjunction with the new engagement, the Company has dismissed its former accountant, Paritz & Co., P.A., Hackensack, NJ (“Paritz”), as the Company’s principal accountant effective February 22, 2017.
On October 5, 2017, management concluded that the Company’s previously issued consolidated financial statements: (i) for the year ended December 31, 2016 (the “Annual Financial Statement”) included in the Company’s Annual Report on Form 10-K for the year then ended (the “Annual Report”); and (ii) for the three months ended March 31, 2017 and the three and six months ended June 30, 2017 (collectively, the “Quarterly Financial Statements”) included in the Company’s Quarterly Reports on Form 10-Q for the quarters ended March 31, 2017 and June 30, 2017, respectively (the “Quarterly Reports”) should no longer be relied upon. The Company stated at the time that it would file with the Securities and Exchange Commission amendments to the aforementioned Annual Report and Quarterly Reports to revise its Annual Financial Statement and its Quarterly Financial Statements.
On October 9, 2017, Kiwa’s Board of Directors decided to engage Friedman LLP as the Company’s new independent registered public accounting firm to report on the Company’s financial statements for the fiscal year ended December 31, 2017, including performing the required quarterly reviews for the period commencing September 30, 2017. In conjunction with the new engagement, the Company has dismissed DYH & Co., Brea, CA (“DYH”) as the Company’s independent auditors effective October 9, 2017. In connection with the engagement of Friedman LLP, the Company agreed that Friedman LLP would re-audit the Company’s financial statements for the fiscal year ended December 31, 2016, including performing the required quarterly reviews for the period commencing January 1, 2017 (and reviewing the amendments to the previously-filed Quarterly Reports for the periods ended March 31, 2017 and June 30, 2017).
ITEM 9A. Controls and Procedures
(a) Evaluation of Disclosure Controls and Procedures
Disclosure Controls and Procedures
Our management, under the supervision and with the participation of our Chief Executive Officer (“CEO”) and Chief Financial Officer (“CFO”), has evaluated the effectiveness of ourWe are required to maintain disclosure controls and procedures as defined in SEC Rules 13a-15(e) and 15d-15(e) as of the end of the period covered by this Annual Report. Our disclosure controls and proceduresthat are designed to ensure that information required to be disclosed in our reports filed under the reports we file or submitSecurities Exchange Act of 1934, as amended, is recorded, processed, summarized and reported within the time periods specified in the Securities and Exchange Commission’s rules and forms, and that such information is accumulated and communicated to our management, including our chief executive officer (also our principal executive officer) and our chief financial officer (also our principal financial and accounting officer) to allow for timely decisions regarding required disclosure.
Pursuant to Rule 13a-15(b) under the Securities Exchange Act of 1934 (“Exchange Act”), the Company’s management, including the Company’s Chief Executive Officer (“CEO”) (the Company’s principal executive officer) and Chief Financial Officer (“CFO”) (the Company’s principal financial and accounting officer), has evaluated the effectiveness of the Company’s disclosure controls and procedures (as defined under Rule 13a-15(e) under the Exchange Act) as of the end of the period covered by this report. Based upon that evaluation the Company’s CEO and CFO concluded that the Company’s disclosure controls and procedures were not effective as of December 31, 2017 to ensure that information required to be disclosed by the Company in the reports that the Company files or submits under the Exchange Act, is recorded, processed, summarized and reported, within the time periods specified in the SEC’s rules and forms, and that such information is accumulated and communicated to ourthe Company’s management, including ourthe Company’s CEO and CFO, as appropriate, to allow timely decisions regarding required disclosures. Based on their evaluation,disclosure. The principal basis for this conclusion is the lack of segregation of duties within our CEOfinancial function and CFO have concluded that, asthe lack of December 31, 2015, our disclosure controls and procedures were ineffective.an operating Audit Committee.
| 23 |
Management(b) Management’s Report on Internal Control over Financial Reporting
Our management is responsible for establishing and maintaining adequate internal control over financial reporting, as such term is defined in Exchange Act Rules 13a-15(f) and 15d-15(f). Our internal control over financial reporting was designed to provide reasonable assurance to the Company’s management and board of directors regarding the preparation and fair presentation of published consolidated financial statements.reporting. Internal control over financial reporting is defined in Rule 13a-15(f) or 15d-15(f) promulgated under the Securities Exchange Act of 1934 as a process designed by, or under the supervision of, the Company’scompany’s principal executive and principal financial officers and effected by the Company’scompany’s board of directors, management and other personnel, to provide reasonable assurance regarding the reliability of financial reporting and the preparation of financial statements for external purposes in accordance with accounting principles generally accepted accounting principles. Internalin the United States of America and includes those policies and procedures that:
| ● | Pertain to the maintenance of records that in reasonable detail accurately and fairly reflect the transactions and dispositions of the assets of the company; |
| ● | Provide reasonable assurance that transactions are recorded as necessary to permit preparation of financial statements in accordance with accounting principles generally accepted in the United States of America and that receipts and expenditures of the company are being made only in accordance with authorizations of management and directors of the company; and |
| ● | Provide reasonable assurance regarding prevention or timely detection of unauthorized acquisition, use or disposition of the company’s assets that could have a material effect on the financial statements. |
Because of its inherent limitations, internal control over financial reporting no matter how well designed, has inherent limitations and may not prevent or detect misstatements. Projections of any evaluation of effectiveness to future periods are subject to the risk that controls may become inadequate because of changes in conditions, or that the degree of compliance with the policies or procedures may deteriorate. All internal control systems, no matter how well designed, have inherent limitations. Therefore, even those systems determined to be effective internal control over financial reporting can provide only provide reasonable assurance with respect to the financial statement preparation and presentation. Because of the inherent limitations of internal control, there is a risk that material misstatements may not be prevented or detected on a timely basis by internal control over financial reporting. However, these inherent limitations are known features of the financial reporting process. Therefore, it is possible to design into the process safeguards to reduce, though not eliminate, this risk.
Our management has conducted,We carried out an assessment, under the supervision and with the participation of our management, including our CEO and CFO, an assessment, including testing of the effectiveness of the design and operation of our internal controlcontrols over financial reporting, as defined in Rules 13a-15(e) and 15d-15(e) of the Securities Exchange Act of 1934, as of December 31, 2015. Management’s2017. In making this assessment, of internal control over financial reporting was conducted usingmanagement used the criteria in Internal Control over Financial Reporting - Guidance for Smaller Public Companies issuedset forth by the Committee of Sponsoring Organizations of the Treadway Commission (“COSO”)inInternal Control — Integrated Framework (2013). Based on such evaluation, management identified deficiencies that were determined to be a material weakness.
A material weakness is a deficiency, or a combination of deficiencies, in internal control over financial reporting, such that there is a reasonable possibility that a material misstatement of the company’s annual or interim financial statements will not be prevented or detectedassessment and on a timely basis. Because of the material weakness described below, managementthose criteria, our CEO and CFO concluded that our internal control over financial reporting was ineffectivenot effective as of December 31, 2015.2017. The principal basis for this conclusion is (i) failure to engage sufficient resources in regards to our accounting and reporting obligations and (ii) failure to fully document our internal control policies and procedures.
Remediation
The specific material weakness identified byOur management has dedicated resources to correcting the Company’s management ascontrol deficiencies and to ensuring that we take proper steps to improve our internal control over financial reporting in the area of December 31, 2015 is described as follows:financial statement preparation and disclosure.
We have taken a number of remediation actions that we believe will improve the effectiveness of our internal control over financial reporting, including the following:
| ● | ||
| ● | ||
Remediation Initiative
In addition to the above executed remediation plans, we are planning to hire a full-time CFO to release the CFO duties off Yvonne Wang, our current Acting President, CEO and CFO and Director.
Conclusion
Despite the material weakness and deficiencies reported above, the Company’s management believes that its consolidated financial statements included in this report fairly present in all material respects the Company’s financial condition, results of operations and cash flows for the periods presented and that this report does not contain any untrue statement of a material fact or omit to state a material fact necessary to make the statements made, in light of the circumstances under which such statements were made, not misleading with respect to the period covered by this report.
This Annual Reportannual report does not include an attestation report of the Company’sour registered public accounting firm regarding internal control over financial reporting. Management’s report was not subject to attestation by the Company’sour registered public accounting firm pursuant to temporary rules of the SEC that permit the Companyus to provide only the management’s report in this Annual Report.annual report.
(c) Changes in Internal Control over Financial Reporting
There were noWe plan to adopt the new revenue recognition standard in the first quarter of 2018. We plan to enhance our internal controls over financial reporting related to this new adoption to ensure all related accounting policy and disclosures to reflect this change.
Except as disclosed in the aforementioned remediation plans, there have not been any other changes in ourthe Company’s internal control over financial reporting (as such term is defined in Rules 13a-15(f) under the Exchange Act) during the fiscal yearcurrent quarter ended December 31, 2015 that2017, to have materially affected or are reasonably likely to materially affect, ourthe Company’s internal control over financial reporting.
None.
ITEM 10. Directors, Executive Officers and Corporate Governance
Directors and Executive Officers
Set forth below are the names of our directors and executive officers, their ages, their offices with us, if any, their principal occupations or employment for the past five years. The directors listed below will serve until the Company’s next annual meeting of the stockholders:shareholders:
| Name | Age | Position | Director Since | Age | Position | Director Since | ||||||
| Yvonne Wang | 37 | Chief Operating Officer and Director | 2015 | 39 | Acting President, CEO and CFO and Director | 2015 | ||||||
| Jimmy Ji Zhou | 48 | Chief Executive Officer, Chief Financial Officer and Director | 2015 | |||||||||
| Feng Li | 27 | Secretary and Director | 2015 | 28 | Secretary and Director | 2015 | ||||||
| Qi Wang | 48 | Vice President of Technology, Director | 2007 | 49 | Vice President of Technology, Director | 2007 | ||||||
| Yong Chang Wu | 45 | Director | 2015 | |||||||||
Yong Lin Song Xiao Qiang Yu | 50 39 | CTO, Director of Technology and Director Sales and Marketing Director | 2017 2016 | |||||||||
Yvonne Wang wasMs. Wang became our Chairman in November 2015. She served as corporate Secretary from September 2005 until November 20, 2015 and became our Chief Operating Officer and a Director into 2015. Prior to that,2005, she served as an executive assistant and a manager of the Company’s U.S. office between April 2003 and September 2005. She obtained her B.S. degree of Business Administration in July 2001 from University of Phoenix. She is also a California Realtor,
On August 11, 2106 became Company’s acting president, CEO and a certified Notary Public.CFO.
Jimmy Ji Zhoubecame our Chief Executive Officer on July 1, 2015. Mr. Zhou was employed by AXA Advisors LLC (“AXA”) in California as a financial advisor from 2000 to 2007. He became a Certified Estate Planner (CEP) and a Registered Financial Consultant (RFC) with AXA in 2005. From 2007 to 2008, Mr. Zhou was involved in investment banking projects between China and the United States and since 2008, Mr. Zhou has worked as an independent business consultant and as an offshore financial advisor to clients in China. Mr. Zhou graduated from Shanghai International Studies University in China in 1990.
Feng Libecame our Secretary and a Director in 2015. From 2011- 2012, Ms. Li has served as an assistant project manager for SCHSAsia, a boutique business consulting firm specializing in events and project management for overseas company wishing to expand into the Asia Pacific arena. From 2012 until 2014, Ms. Li served as a campaigner for WildAid China Office, a non-profit organization with focus on raising public awareness on wildlife and climate change related issues. Mr. Hu graduated with a bachelor degree in commerce and economics from the University of Toronto in 2011.
Qi Wang became our Vice President - Technical on July 19, 2005 and was elected as one of our directors of the Company on July 18, 2007. Prof. Wang has also acted as Director of Kiwa-CAU R&D Center since July 2006. Prof. Wang served as a Professor and Advisor for Ph.D. students in the Department of Plant Pathology, China Agricultural University (“CAU”) since January 2005. Prior to that, he served as an assistant professor and lecturer of CAU since June 1997. He obtained his master degree and Ph.D. in agricultural science from CAU in July 1994 and July 1997, respectively. Prof. Wang received his bachelor’s degree of science from Inner Mongolia Agricultural University in July 1989. He is a committee member of various scientific institutes in China, including the National Research and Application Center for Increasing-Yield Bacteria, Chinese Society of Plant Pathology, Chinese Association of Animal Science and Veterinary Medicine. Prof. Wang’s unique expertise in the field of agriculture offers significant knowledge and experience to the Board of Directors when making critical operational decisions.
| 25 |
Yong Chang WuLin Song became a directorour CTO and Director of Technology responsible for the Company’s R&D operations on March 2016 and as one of our directors of the Company in 2015.on March 2017. Mr. Song is a senior agronomist at the Institute of Agricultural Resources and Regional Planning, Chinese Academy of Agricultural Sciences. He has 29 years of experience in microbial R&D and technology promotion and has led many national agricultural projects. In 2001, he was responsible for technological achievement transformation and technology promotion of Agricultural Resources and Regional Planning, Chinese Academy of Agricultural Sciences. In 2009, he served in positions foras deputy secretary general of the Doctor of Agriculture, Ministry of Science and rural information, the National Agricultural Science and Technology Park and the National Sustainable Development Experimental Zone, Hainan Technology 110 senior government adviser, Chinese Society of Plant Nutrition and Fertilizer Science.
Xiao Qiang Yu became our Sales and Marketing Director on June 2016 and is responsible for Sustainable Developmentmanaging the overall marketing strategy of sustainable agriculture Professional Committee of the Secretary-General and China Agricultural Research Association. Mr. Wu has undertaken positions in sustainable agriculture and rural development (Sustainable Agriculture and Rural Development, SARD), food security and food safety, farming systems and other expert systems design and development work, research focuses on urban and ruralKiwa, which includes brand expansion, sale targets, strategic planning and rural information technology projects.corporate communications. Mr. WuYu participated in Chinese fertilizer market since 1999. Mr. Yu has presided over 16 items15 years of marketing, management and strategy experience from two major national scientific and technological cooperation, research, support, “Spark Program” topics, won 4 of the provincial awards and provided design for over 20 of the modern agricultural park and regional development planning.fertilizer companies in China.
Family Relationships
There are no family relationships among our directors or executive officers.
Involvement in Certain Legal Proceedings
None of our directors or executive officers has, during the past ten years:
| (a) | Had any bankruptcy petition filed by or against any business of which such person was a general partner or executive officer either at the time of the bankruptcy or within two years prior to that time; |
| (b) | Been convicted in a criminal proceeding or subject to a pending criminal proceeding; |
| (c) | Been subject to any order, judgment, or decree, not subsequently reversed, suspended or vacated, of any court of competent jurisdiction or any federal or state authority, permanently or temporarily enjoining, barring, suspending or otherwise limiting his involvement in any type of business, securities, futures, commodities or banking activities; and |
| (d) | Been found by a court of competent jurisdiction (in a civil action), the Securities and Exchange Commission or the Commodity Futures Trading Commission to have violated a federal or state securities or commodities law, and the judgment has not been reversed, suspended, or vacated. |
Section 16(a) Beneficial Ownership Compliance
Section 16(a) of the Securities Exchange Act of 1934 requires our officers, directors and certain persons holding more than 10 percent of a registered class of our common stock to file with the SEC initial reports of ownership and reports of changes in ownership of our common stock. Officers, directors and certain other shareholders are required by the SEC to furnish the Company with copies of all Section 16(a) forms they file. To the best of the Company’s knowledge, based solely upon a review of the copies of such reports, the Company believes that all Section 16(a) filing requirements applicable to its officers, directors and certain other shareholders were complied with during the fiscal year ended December 31, 2015.2017.
Code of Ethics
We have adopted a Code of Business Conduct and Ethics (the “Code”) that is applicable to all employees, consultants and members of the Board of Directors, including the Chief Executive Officer, Chief Financial Officer and Secretary. This Code embodies our commitment to conduct business in accordance with the highest ethical standards and applicable laws, rules and regulations. We will provide any person a copy of the Code, without charge, upon written request to the Company’s Secretary. Requests should be addressed in writing to Ms. Yvonne Wang; 310 N. Indian Hill Blvd., #702 Claremont,3200 Guasti Road, Ste. 100, California 91711.91761.
Director Nominees Recommended by Stockholders
| 26 |
We have not implemented any changes to the procedures by which stockholders may recommend nominees to our board of directors since we last disclosed those procedures in our most recent proxy statement filed with the SEC on October 15, 2015.
Board Composition; Audit Committee and Financial Expert
Our Board of Directors is currently composed of fivefour members: Yvonne Wang, Jimmy Ji Zhou, Feng Li, Qi Wang and Yong Chang Wu.Lin Song. All board actions require the approval of a majority of the directors in attendance at a meeting at which a quorum is present. Yong Chang Wu is our only “independent” director as set forth in Rule 4200(a)(15) of the Market Place Rules of the Nasdaq Stock Market, which is the independence standard under which we have chosen to report.
We currently do not have an audit committee. We intend, however, to establish an audit committee of the board of directors as soon as practicable. We envision that the audit committee will be primarily responsible for reviewing the services performed by our independent auditors, evaluating our accounting policies and our system of internal controls. Currently such functions are performed by our Board of Directors.
The Board does not have a “financial expert” as defined by SEC rules implementing Section 407 of the Sarbanes-Oxley Act.
Board meetings and committees; annual meeting attendance.
During fiscal year 2015, theThe Board of Directors either met or took action by unanimous consent ten (10) times during fiscal year 2017. No Committee Meetings were held during fiscal year 2017. The Company did not have meeting. All membersan Annual Meeting of the Board of Directors are required to attend the annual meetings of securities holders.Shareholders in 2017.
ITEM 11. Executive Compensation
We currently have no Compensation Committee. The Board of Directors is currently performing the duties and responsibilities of Compensation Committee. In addition, we have no formal compensation policy. We decide on our executives’ compensation based on average compensation levels of similar companies in the U.S. or China, depending on consideration of many factors such as where the executive works. Our Chief Executive Officer’s compensation is approved by the Board of Directors. Other named executive officers’ compensation are proposed by our Chief Executive Officer and approved by the Board of Directors.
Our Stock Incentive Plan is administered by the Board of Directors. Any amendment to our Stock Incentive Plan requires majority approval of the stockholdersshareholders of the Company.
The Company had no officers or directors whose total compensation during either 20152017 or 20142016 exceeded $100,000.
Currently, the main forms of compensation provided to each of our executive officers are: (1) annual salary; (2) non-equity Incentive Plan; and (3) the granting of incentive stock options subject to approval by our Board of Directors.
| 27 |
Summary Compensation Table
Summary Compensation Table
| Name and principal position | Year | Salary ($) | Bonus ($) | Stock Awards ($) | Option Awards ($) | Non-Equity Incentive Plan Compensation ($) | Nonqualified Deferred Compensation Earnings ($) | All Other Compensation ($) | Total ($) | |||||||||||||||||||||||||||
| (a) | (b) | (c) | (d) | (e) | (f) | (g) | (h) | (i) | (j) | |||||||||||||||||||||||||||
| Yvonne Wang, | 2017 | 84,000 | -0- | -0- | -0- | -0- | -0- | -0- | 84,000 | |||||||||||||||||||||||||||
| Acting President, CEO and CFO | 2016 | 84,000 | -0- | -0- | -0- | -0- | -0- | -0- | 84,000 | |||||||||||||||||||||||||||
| Yong Lin Song, | 2017 | 62,295 | -0- | -0- | -0- | -0- | -0- | -0- | 62,295 | |||||||||||||||||||||||||||
| CTO, Director of Technology | 2016 | 29,828 | -0- | -0- | -0- | -0- | -0- | -0- | 29,828 | |||||||||||||||||||||||||||
| Xiao Qiang Yu, | 2017 | 59,927 | -0- | -0- | -0- | -0- | -0- | -0- | 59,927 | |||||||||||||||||||||||||||
| Sales and Marketing Director | 2016 | 30,259 | -0- | -0- | -0- | -0- | -0- | -0- | 30,259 | |||||||||||||||||||||||||||
Employment Contracts and Termination of Employment and Change of Control Arrangements
There are no compensatory plans or arrangements with respect to a named executive officer that would result in payments or installments in excess of $100,000 upon the resignation, retirement or other termination of such executive officer’s employment with us or from a change-in-control.
Stock Incentive Plan and Option Grants
2004 Stock Incentive Plan2017 Stock-based Compensation
On May 10, 2004, ourMarch 15, 2017, the Board of Directors approved equitya new stock option plan with ten years’ term. As of December 31, 2017, the Company has not granted any incentive awards to our certain directors, officers and employees and/or consultants and adopted, subject to stockholder approval, our 2004 Stock Incentive Plan (the “Plan”). Our stockholders approved the Plan on June 3, 2004, and an amendment to the Plan on September 12, 2006. There are 15,240 shares (on a post-split basis) reserved for issuance of options and other stock awardscompensation under the Plan. The number of shares that may be granted to any participant in a fiscal year is 500,000. Options issued under the Plan will expire not more than ten years from the date of grant.
The Plan is a key aspect of our compensation program, designed to attract, retain, and motivate the highly qualified individuals required for our long-term success.
Stock Option Grants
On December 12, 2006, our Board of Directors granted 10,000 options (on a post-reverse split basis) under the Plan, of which 4,119 (on a post-reverse split basis) shares were granted to the current executive officers and directors. The exercise price was $0.175, equal to the closing price of our common stock on December 12, 2006. Pursuant to the approval of Board of Directors, after each of the first and second anniversaries of the grant date, 33% percent of the options will become exercisable. After the third anniversary of the grant date, 34% of the options will become exercisable.this plan.
No options were granted under the Plan during 2015.2017.
Outstanding Equity Awards at 2015 Fiscal Year-End
The following table sets forth the status of all outstanding equity awards of the Company as of December 31, 2015.
Outstanding Equity Awards at Fiscal Year-End
| Option Awards | Stock Awards | |||||||||||||||||||||||
| Name | Number of Securities Underlying Unexercised Options (#) Exercisable | Number of Securities Underlying Unexercised Options (#) Unexercisable | Equity Incentive Plan Awards: Number of Securities Underlying Unexercised Unearned Options (#) | Option Exercise Price ($) | Option Expiration Date | Number of Shares or Units of Stock That Have Not Vested (#) | Value of Shares or Units of Stock That Have Not Vested ($) | Equity Incentive Plan Awards: Number of Unearned Shares, Units or Other Rights That Have Not Vested (#) | Equity Incentive Plan Awards: Market or Payout Value of Unearned Shares, Units or Other Rights That Have Not Vested (#) | |||||||||||||||
| (a) | (b) | (c) | (d) | (e) | (f) | (g) | (h) | (i) | (j) | |||||||||||||||
Wei Li (1) | 914 | Nil | 914 | 0.175 | 12/04/16 | Nil | Nil | Nil | Nil | |||||||||||||||
Yvonne Wang (1) | 626 | Nil | 626 | 0.175 | 12/04/16 | Nil | Nil | Nil | Nil | |||||||||||||||
Option Exercises and Stock Vested
No stock options were exercised by any officers or directors during 20152017 and 2014.2016. We did not adjust or amend the exercise price of any stock options previously awarded to any named executive officers during 20152017 and 2014.2016.
Option Exercises and Stock Vested
|
|
|
|
| ||||
|
|
| ||||||
|
|
| ||||||
|
|
| ||||||
|
|
|
| |||||
Director Compensation for 20152017
We currently have no policy in effect for providing compensation to our directors for their services on our Board of Directors, and did not compensate our directors in 20152017 for services performed as directors.
ITEM 12. Security Ownership of Certain Beneficial Owners and Management and Related Stockholder Matters
The following table sets forth as of April 10, 2016March 30, 2018 certain information with respect to the beneficial ownership of our common stock by (i) each of our executive officers, (ii) each person who is known by us to beneficially own more than 5% of our outstanding common stock, and (iii) all of our directors and executive officers as a group. Percentage ownership is calculated based on 5,141,22616,120,465 shares of our common stock and 500,000 shares of our Series A Preferred Stock, and 811,148 shares of our Series B Preferred Stock outstanding as of April 10, 2016.March 30, 2018 . None of the shares listed below are issuable pursuant to stock options or warrants of the Company.
| Title of class | Name and Address of Beneficial Ownership | Amount and Nature of Beneficial Owner (1) | Percentage of class | |||||||
| Common Stock | Jimmy Ji Zhou | - | - | |||||||
| Common Stock | Yvonne Wang | 240,000 | 4.67 | % | ||||||
| Common Stock | Feng Li (2) (3) | 2,965,324 | 57.68 | % | ||||||
| Common Stock | Qi Wang | - | - | |||||||
| Common Stock | Yong Chang Wu | - | - | |||||||
| Ser. A Pref. Stock | Yvonne Wang | 250,000 | 50.00 | % | ||||||
| Ser. A Pref. Stock | Feng Li | 250,000 | 50.00 | % | ||||||
| Common Stock | All officers and directors as a group | 3,205,324 | 62.35 | % | ||||||
| Ser. A Pref. Stock | All officers and directors as a group | 500,000 | 100.00 | % | ||||||
| Common Stock | Wei Li (4) (5) | 2,965,324 | 57.68 | % | ||||||
| 28 |
| Title of class | Name and Address of Beneficial Ownership(1) | Amount and Nature of Beneficial Owner (2) | Percentage of class | |||||||
| Common Stock | Yvonne Wang | 240,000 | 1.58 | % | ||||||
| Common Stock | Feng Li (3) | 1,965,326 | 12.93 | % | ||||||
| Common Stock | Qi Wang | - | - | |||||||
| Common Stock | Yong Lin Song | - | - | |||||||
| Common Stock | All officers and directors as a group | 2,205,326 | 14.10 | % | ||||||
| Ser. A Pref. Stock | Yvonne Wang | 250,000 | 50.00 | % | ||||||
| Ser. A Pref. Stock | Feng Li | 250,000 | 50.00 | % | ||||||
| Ser. A Pref. Stock | All officers and directors as a group | 500,000 | 100.00 | % | ||||||
| Ser. B Preferred | Wei Li | 811,148 | 100.00 | % | ||||||
| 5% Holders: | ||||||||||
| Common Stock | Wei Li (3) | 1,903,542 | 12.52 | % | ||||||
| Common Stock | Tianao Zhang | 1,540,000 | 10.13 | % | ||||||
| Common Stock | Zheng JunWei | 1,165,000 | 7.66 | % | ||||||
| Common Stock | Yongtao Yu | 1,000,000 | 6.58 | % | ||||||
| Common Stock | Troniya Industrial Incubator Co LTD | 1,000,000 | 6.58 | % | ||||||
| (1) | The address for all holders is 3200 Guasti Road, Ste. 100, California 91761. | |
| (2) | In determining beneficial ownership of our Common Stock and Series A Preferred Stock, the number of shares shown includes shares which the beneficial owner may acquire upon exercise of debentures, warrants and options which may be acquired within 60 days. Unless otherwise stated, each beneficial owner has sole power to vote and dispose of its shares. | |
| (3) | Includes 61,784 shares of common stock held by All Star Technology, Inc., a British Virgin Islands international business company. Feng Li’s father, Wei Li, exercises voting and investment control over the shares held by All Star Technology, Inc. Wei Li is a principal | |
Equity Compensation Plan Information
The following table sets forth certain information as of December 31, 2015 about our equity compensation plans under which our equity securities are authorized for issuance.
Equity Compensation Plan Information
| Plan category | Number of securities to be issued upon exercise of outstanding options, warrants and rights | Weighted-average exercise price of outstanding options, warrants and rights | Number of securities remaining available for future issuance under equity compensation plans (excluding securities reflected in column (a)) | |||||||||
| (a) | (b) | (c) | ||||||||||
| Equity compensation plans approved by security holders (1) | 6,163 | $ | 35 | 3,837 | ||||||||
| Equity compensation plans not approved by security holders (1) | - | - | ||||||||||
| Total | 6,163 | 35 | 3,837 | |||||||||
(1)The number of shares are adjusted to reflect post-split shares.
Change in Control
None.
ITEM 13. Certain Relationships and Related Transactions, and Director Independence
For description of transactions with related parties, see Note 67 to Consolidated Financial Statements under Item 8 in Part II.
Under the independence standard set forth in Rule 4200(a) (15) of the Market Place Rules of the Nasdaq Stock Market, which is the independence standard that we have chosen to report under, one of the members of the Board of Directors (Yong Chang Wu) is independent.under.
The relationships between our directors and the Company are as follows:
Prof. Qi Wang is the Director of Kiwa-CAU R&D center and also Vice President of the Company.
ITEM 14. Principal Accountant Fees and Services
Fees Paid to Independent Public Accountants for 20152017 and 2014.2016.
| 29 |
Audit Fees
All of the services described below were approved by our board of directors prior to performance of such services. The board of directors has determined that the payments made to its independent accountants for these services are compatible with maintaining such auditor’s independence.
The aggregate audit fees for 2015 and 20142017 paid and payable to DYH & Company and Friedman LLP were approximately $144,000, of which, $9,000 paid to DYH & Company and $135,000 paid and payable to Friedman, LLP. The aggregate audit fees for 2016 paid to Paritz & Company, P.A, DYH & Company and Friedman, LLP were approximately $113,000, of which, $20,500 paid to Paritz & Company, P.A. were approximately $30,500, $42,500 paid to DYH & Company, and $29,000, respectively. $50,000 paid to Friedman, LLP.
The amounts include: (1) fees for professional services rendered by DYH & Company, Friedman LLP and Paritz & Company, P.A. in connection with the audit and re-audit of our consolidated financial statements; (2) reviews of our quarterly reports on the Form 10-Q.
Audit-Related Fees
Audit-related fees for 20152017 and 20142016 were $nil.$0.
Tax Fees
Tax service fees billed by Paritz & Co., P.A. as tax consultant for 20152017 and 20152016 were $2,750$6,500 and $2,750,$3,400, respectively.
All Other Fees
None.
Policy on Audit Committee Pre-Approval of Audit and Permissible Non-Audit Services of Independent Auditors
Since we did not have a formal audit committee, our board of directors served as our audit committee. We have not adopted pre-approval policies and procedures with respect to our accountants in 2015.2017. All of the services provided and fees charged by our independent registered accounting firms in 20152016 were approved by the board of directors.
| 30 |
ITEM 15. Exhibits and Financial Statement Schedules
Exhibit No. | Description | |
| 31.1 | Certification of Chief Executive Officer pursuant to Rule 13a-14(a)/15d-14(a) of the Securities Exchange Act of 1934 | |
| 31.2 | Certification of Chief Financial Officer pursuant to Rule 13a-14(a)/15d-14(a) of the Securities Exchange Act of 1934 | |
| 32.1 | Certification of Chief Executive Officer, pursuant to 18 U.S.C. 1350, as adopted pursuant to Section 906 of the Sarbanes-Oxley Act of 2002 | |
| 32.2 | Certification of Chief Financial Officer, pursuant to 18 U.S.C. 1350, as adopted pursuant to Section 906 of the Sarbanes-Oxley Act of 2002 | |
| 101.INS | XBRL Instance Document | |
| 101.SCH | XBRL Taxonomy Extension Schema Document | |
| 101.CAL | XBRL Taxonomy Extension Calculation Linkbase Document | |
| 101.DEF | XBRL Taxonomy Extension Definition Linkbase Document | |
| 101.LAB | XBRL Taxonomy Extension Label Linkbase Document | |
| 101.PRE | XBRL Taxonomy Extension Presentation Linkbase Document |
| 31 |
Kiwa Bio-Tech Products Group Corporation
Pursuant to the requirements of Section 13 or 15(d) of the Exchange Act of 1934, the registrant has duly caused this report to be signed on its behalf by the undersigned, thereunto duly authorized.
Date: April 14, 2016March 30, 2018
| KIWA BIO-TECH PRODUCTS GROUP CORPORATION. | ||
| By: | /s/ | |
Chief Executive Officer (Principal Executive Officer) | ||
| By: | /s/ | |
Chief Financial Officer (Principal Financial and Accounting Officer) | ||
Pursuant to the requirements of Section 13 or 15(d) of the Exchange Act of 1934, the registrant has duly caused this report to be signed on its behalf of the registrant and in the capacities and on the dates indicated.
| /s/ | Chief Executive Officer and Director | |||
| (Principal Executive | ||||
| /s/ Yvonne Wang | Chief | |||
| Yvonne Wang | (Principal Financial and Accounting Officer) | |||
| /s/ Feng Li | Secretary and Director | |||
| Feng Li | ||||
| /s/ Qi Wang | Vice President of Technology and Director | |||
| Qi Wang | ||||
| /s/ Yong | CTO, Director of Technology and Director | |||
| Yong |
| 32 |
Kiwa Bio-Tech Products Group Corporation
Index to Consolidated Financial Statements
REPORT OF INDEPENDENT REGISTERED PUBLIC ACCOUNTING FIRM
To the Board of Directors and the Stockholders of
Kiwa Bio-Tech Products Group Corporation
Opinion on the Financial Statements
We have audited the accompanying consolidated balance sheets of Kiwa Bio-Tech Products Group CorporationsCorporation and its subsidiaries (collectively, the “Company”) as of December 31, 20152017 and 20142016, and the related consolidated statements of income and comprehensive loss,income, changes in stockholders’ deficiencyequity (deficiency), and cash flowsforeach of the two years in the period ended December 31, 2017, and the related notes (collectively referred to as the “consolidated financial statements”). In our opinion, the consolidated financial statements present fairly, in all material respects, the financial position of the Company as of December 31, 2017, and the results of its operations and its cash flows for each of the two years then ended. in the period ended December 31, 2017, in conformity with accounting principles generally accepted in the United States of America.
Basis for Opinion
These consolidated financial statements are the responsibility of the Company'sCompany’s management. Our responsibility is to express an opinion on thesethe Company’s consolidated financial statements based on our audits.
We conducted our audit in accordanceare a public accounting firm registered with standards of the Public Company Accounting Oversight Board (United States). (“PCAOB”) and are required to be independent with respect to the Company in accordance with the U.S. federal securities laws and the applicable rules and regulations of the Securities and Exchange Commission and the PCAOB.
We conducted our audits in accordance with the standards of the PCAOB. Those standards require that we plan and perform the auditaudits to obtain reasonable assurance about whether the consolidated financial statements are free of material misstatement.misstatement, whether due to error or fraud. The Company is not required to have, nor were we engaged to perform, an audit of its internal control over financial reporting. Our audit included considerationAs part of our audits we are required to obtain an understanding of internal control over financial reporting, as a basis for designing audit procedures that are appropriate in the circumstances, but not for the purpose of expressing an opinion on the effectiveness of the Company’s internal control over financial reporting. Accordingly, we express no such opinion. An audit includes
Our audits included performing procedures to assess the risks of material misstatement of the financial statements, whether due to error or fraud, and performing procedures that respond to those risks. Such procedures included examining, on a test basis, evidence supportingregarding the amounts and disclosures in the consolidated financial statements, assessingstatements. Our audits also included evaluating the accounting principles used and significant estimates made by management, as well as evaluating the overall presentation of the consolidated financial statement presentation.statement. We believe that our audit providesaudits provide a reasonable basis for our opinion.
In our opinion, the consolidated financial statements referred to above present fairly, in all material respects, the financial position of Kiwa Bio-Tech Products Group Corporation as of December 31, 2015 and 2014, and the results of its operations and its cash flows for the years then ended, in conformity with accounting principles generally accepted in the United States of America./s/ Friedman LLP
The consolidated financial statementsWe have served as of and for the year ended December 31, 2014 have been restated to correct a misstatement as discussed in Note 15.Company’s auditor since 2017.
The accompanying financial statements have been prepared assuming that the Company will continue as a going concern. As discussed in Note 3 to the consolidated financial statements, the Company’s current liabilities substantially exceeded its current assets by $9,330,130 at December 31, 2015. The Company had no sales during the years ended December 31, 2015 and 2014, had an accumulated deficit of $20,324,812 and stockholders’ deficiency of $11,100,454 as of December 31, 2015. These circumstances, among others, raise substantial doubt about the Company’s ability to continue as a going concern. Management’s plans in regard to these matters are described in note 3. The financial statements do not include any adjustments that might result from the outcome of this uncertainty.New York, New York
March 30, 2018
| F-1 |
/s/ Paritz & Company, P.A.
Hackensack, New Jersey
April 14, 2016
KIWA BIO-TECH PRODUCTS GROUP CORPORATION AND SUBSIDIARIES
| December 31, 2015 | December 31, 2014 | |||||||
| (Restated) | ||||||||
| ASSETS | ||||||||
| Current assets | ||||||||
| Cash and cash equivalents | $ | 721 | $ | 2,963 | ||||
| Deposits and other receivables | 47,453 | 14,280 | ||||||
| Total current assets | 48,174 | 17,243 | ||||||
| Property, plant and equipment - net | 2,807 | 7,372 | ||||||
| Total assets | $ | 50,981 | $ | 24,615 | ||||
| LIABILITIES AND STOCKHOLDERS’ DEFICIENCY | ||||||||
| Current liabilities | ||||||||
| Accounts payable | $ | 300,247 | $ | 316,842 | ||||
| Advances from customers | 13,800 | 14,562 | ||||||
| Construction costs payable | 273,722 | 288,851 | ||||||
| Due to related parties - trade | 1,143,978 | 1,025,057 | ||||||
| Due to related parties - non-trade | 3,166,198 | 4,190,315 | ||||||
| Convertible notes payable | 150,250 | 150,250 | ||||||
| Notes payable | 360,000 | 360,000 | ||||||
| Salary payable | 1,632,881 | 1,538,266 | ||||||
| Taxes payable | 478,209 | 440,885 | ||||||
| Penalty payable | 404,752 | 332,600 | ||||||
| Interest payable | 930,062 | 817,524 | ||||||
| Other payables and accrued expenses | 524,205 | 525,488 | ||||||
| Total current liabilities | 9,378,304 | 10,000,640 | ||||||
| Unsecured loans payable | 1,773,131 | 1,871,136 | ||||||
| Total long-term liabilities | 1,773,131 | 1,871,136 | ||||||
| Total liabilities | 11,151,435 | 11,871,776 | ||||||
| Stockholders’ deficiency | ||||||||
| Common stock - $0.001 par value. Authorized 100,000,000 shares. Issued and outstanding 2,000,000 shares at December 31, 2015 and 2014 | 2,000 | 2,000 | ||||||
| Preferred stock - $0.001 par value. Authorized 20,000,000 shares. Issued and outstanding 500,000 and 0 shares at December 31, 2015 and 2014, respectively | 500 | - | ||||||
| Additional paid-in capital | 9,490,837 | 8,491,337 | ||||||
| Accumulated deficit | (20,324,812 | ) | (19,647,454 | ) | ||||
| Accumulated other comprehensive loss | (268,979 | ) | (693,044 | ) | ||||
| Total stockholders’ deficiency | (11,100,454 | ) | (11,847,161 | ) | ||||
| Total liabilities and stockholders’ deficiency | $ | 50,981 | $ | 24,615 | ||||
| December 31, 2017 | December 31, 2016 | |||||||
| ASSETS | ||||||||
| Current assets | ||||||||
| Cash and cash equivalents | $ | 1,083,539 | $ | 13,469 | ||||
| Accounts receivable | 28,620 | 1,122,754 | ||||||
| Prepaid expenses | 2,474,272 | 1,417,554 | ||||||
| Rent deposits and other receivables | 44,423 | 38,897 | ||||||
| Advance to suppliers | 12,660,793 | 1,880,044 | ||||||
| Due from related parties - non-trade | 19,017 | - | ||||||
| Inventory | 2,745,991 | - | ||||||
| Deferred cost of goods sold | 16,726 | - | ||||||
| Total current assets | 19,073,381 | 4,472,718 | ||||||
| Property, plant and equipment - net | 90,500 | 55,319 | ||||||
| Rent deposits-non current | 72,631 | 34,519 | ||||||
| Due from related party – non-trade | - | 1,522,434 | ||||||
| Deposit for Long-Term Investment | 768,074 | - | ||||||
| Total non-current assets | 931,205 | 1,612,272 | ||||||
| Total assets | $ | 20,004,586 | $ | 6,084,990 | ||||
| LIABILITIES ANDstockholders’ EQUITY (DEFICIENCY) | ||||||||
| Current liabilities | ||||||||
| Accounts payable | $ | 1,800,614 | $ | 1,073,094 | ||||
| Advances from customers | 543,581 | - | ||||||
| Due to related parties | 320,199 | 261,259 | ||||||
| Convertible notes payable, net of discount of $1,977 at December 31, 2017 | 273,200 | 150,250 | ||||||
| Derivative liabilities | 247,933 | - | ||||||
| Notes payable | 360,000 | 360,000 | ||||||
| Salary payable | 291,401 | 1,154,921 | ||||||
| Income Taxes payable | 1,142,973 | 414,970 | ||||||
| Interest payable | 1,756,275 | 1,524,988 | ||||||
| Other payables and accruals | 2,108,873 | 924,875 | ||||||
| Deferred revenue | 28,620 | - | ||||||
| Current liabilities of discontinued operation | - | 4,464,685 | ||||||
| Total current liabilities | 8,873,669 | 10,329,042 | ||||||
| Convertible notes payable-non-current, net of discount of $ 384,799 at December 31, 2017 | 460,082 | - | ||||||
| Total liabilities | 9,333,751 | 10,329,042 | ||||||
| STOCKHOLDERS’ EQUITY (DEFICIENCY) | ||||||||
| Preferred stock - $0.001 par value, Authorized 20,000,000 shares. Series A - Issued and outstanding 500,000 and 500,000 shares at December 31, 2017 and December 31, 2016, respectively; Series B - Issued and outstanding 811,148 and 0 shares at December 31, 2017 and December 31, 2016, respectively. | 1,311 | 500 | ||||||
| Common stock - $0.001 per value. Authorized 100,000,000 shares. Issued and outstanding 15,202,965 and 8,728,981 shares at December 31, 2017 and 2016, respectively. | 15,203 | 8,729 | ||||||
| Additional paid-in capital | 24,455,291 | 15,234,878 | ||||||
| Statutory Reserve | 458,334 | 127,473 | ||||||
| Accumulated deficit | (14,583,080 | ) | (19,561,255 | ) | ||||
| Accumulated other comprehensive gain (loss) | 323,776 | (54,377 | ) | |||||
| Total stockholders’ equity (deficiency) | 10,670,835 | (4,244,052 | ) | |||||
| Total liabilities and stockholder’s equity (deficiency) | $ | 20,004,586 | $ | 6,084,990 | ||||
The accompanying notes are an integral part of these consolidated financial statements.
| F-2 |
KIWA BIO-TECH PRODUCTS GROUP CORPORATION AND SUBSIDIARIES
CONSOLIDATED STATEMENTS OF INCOME AND COMPREHENSIVE LOSSINCOME
| Years Ended December 31, | ||||||||
| 2015 | 2014 | |||||||
| (Restated) | ||||||||
| Revenue | $ | - | $ | - | ||||
| Operating expenses | ||||||||
| General and administrative | 313,589 | 364,843 | ||||||
| Research and development | 178,988 | 162,715 | ||||||
| Total operating expenses | 492,577 | 527,558 | ||||||
| Operating loss | (492,577 | ) | (527,558 | ) | ||||
| Other expense | ||||||||
| Penalty expense | 72,152 | 66,602 | ||||||
| Interest expense | 112,629 | 113,396 | ||||||
| Total other expense | 184,781 | 179,998 | ||||||
| Net loss before income tax | (677,358 | ) | (707,556 | ) | ||||
| Income tax | - | - | ||||||
| Net loss | (677,358 | ) | (707,556 | ) | ||||
| Other comprehensive income | ||||||||
| Foreign currency translation adjustment | 424,065 | 117,259 | ||||||
| Total comprehensive loss | $ | (253,293 | ) | $ | (590,297 | ) | ||
| Net loss per common share - basic and diluted | $ | (0.34 | ) | $ | (0.35 | ) | ||
| Weighted average number of common shares outstanding - basic and diluted | 2,000,000 | 2,000,000 | ||||||
| Years Ended December 31, | ||||||||
| 2017 | 2016 | |||||||
| Revenue | $ | 17,270,069 | $ | 9,620,929 | ||||
| Cost of goods sold | (11,845,874 | ) | (7,199,888 | ) | ||||
| Gross profit | 5,424,195 | 2,421,041 | ||||||
| Operating expenses | ||||||||
| Research and development expenses | 147,992 | 149,176 | ||||||
| Selling expenses | 483,045 | 530,346 | ||||||
| General and administrative expenses | 2,997,027 | 868,793 | ||||||
| Total operating expenses | 3,628,064 | 1,548,315 | ||||||
| Operating Income | 1,796,131 | 872,726 | ||||||
| Other income/(expense), net | ||||||||
| Trademark license income – related party | - | 786,329 | ||||||
| Change in fair value of derivative liabilities | 321,851 | |||||||
| Interest expense | (524,333 | ) | (190,552 | ) | ||||
| Other income/(expense) | 382,126 | (2,091 | ) | |||||
| Exchange loss | (58,757 | ) | - | |||||
| Total other income/(expense), net | 120,887 | 593,686 | ||||||
| Income from continuing operations before income taxes | 1,917,018 | 1,466,412 | ||||||
| Income tax | (1,103,315 | ) | (424,911 | ) | ||||
| Income from continuing operations | 813,703 | 1,041,501 | ||||||
| Discontinued operations: | ||||||||
| Loss from discontinued operations, net of taxes | (16,849 | ) | (150,471 | ) | ||||
| Gain on disposal of discontinued operations, net of taxes | 4,512,182 | - | ||||||
| Income (loss) from discontinued operations, net of taxes | 4,495,333 | (150,471 | ) | |||||
| Net income | 5,309,036 | 891,030 | ||||||
| Other comprehensive income | ||||||||
| Foreign currency translation adjustment | 378,153 | 214,602 | ||||||
| Total comprehensive income | $ | 5,687,189 | $ | 1,105,632 | ||||
| Earnings per share - Basic: | ||||||||
| Income from continuing operations | 0.08 | 0.20 | ||||||
| Income from discontinued operations | 0.43 | (0.03 | ) | |||||
| Net income | 0.51 | 0.17 | ||||||
| Earnings per share - Diluted: | ||||||||
| Income from continuing operations | 0.07 | 0.10 | ||||||
| Income from discontinued operations | 0.36 | (0.01 | ) | |||||
| Net income | 0.43 | 0.09 | ||||||
| Weighted average number of common shares outstanding - basic | 10,471,725 | 5,162,394 | ||||||
| Weighted average number of common shares outstanding - diluted | 12,541,946 | 10,584,848 | ||||||
The accompanying notes are an integral part of these consolidated financial statements.
| F-3 |
KIWA BIO-TECH PRODUCTS GROUP CORPORATION AND SUBSIDIARIES
CONSOLIDATED STATEMENTS OF STOCKHOLDERS’ DEFICIENCYCHANGES IN STOCKHODERS’ EQUITY (DEFICIT)
| Preferred Stock | Common Stock | Additional Paid-in | Statutory | Accumulated | Accumulated Other Comprehensive | Total Stockholders’ | ||||||||||||||||||||||||||||||
| Shares | Amount | Shares | Amount | Capital | Reserve | Deficit | Gain/(Loss) | Equity (Deficiency) | ||||||||||||||||||||||||||||
| Balance, December 31, 2015 | 500,000 | $ | 500 | 2,000,000 | $ | 2,000 | $ | 9,490,837 | $ | - | $ | (20,324,812 | ) | $ | (268,979 | ) | $ | (11,100,454 | ) | |||||||||||||||||
| Issuance of common stock for Cash | - | - | 1,775,000 | 1,775 | 868,722 | - | — | - | 870,497 | |||||||||||||||||||||||||||
| Issuance of common stock for Liabilities settlement | - | - | 3,243,173 | 3,243 | 3,188,730 | - | - | - | 3,191,973 | |||||||||||||||||||||||||||
| Issuance of common stock for consulting service | - | - | 1,710,808 | 1,711 | 1,686,589 | - | - | - | 1,688,300 | |||||||||||||||||||||||||||
| Net income | - | - | - | - | - | 127,473 | 763,557 | - | 891,030 | |||||||||||||||||||||||||||
| Foreign currency translation adjustment | - | - | - | - | - | - | - | 214,602 | 214,602 | |||||||||||||||||||||||||||
| Balance, December 31, 2016 | 500,000 | 500 | 8,728,981 | 8,729 | 15,234,878 | 127,473 | (19,561,255 | ) | (54,377 | ) | (4,244,052 | ) | ||||||||||||||||||||||||
| Issuance of common stock for cash | - | - | 4,350,750 | 4,351 | 6,340,777 | - | - | - | 6,345,128 | |||||||||||||||||||||||||||
| Issuance of preferred stock for liabilities settlement | 811,148 | 811 | - | - | 1,053,681 | - | - | - | 1,054,492 | |||||||||||||||||||||||||||
| Issuance of common stock for consulting services | - | - | 2,003,988 | 2,004 | 1,687,893 | - | - | - | 1,689,897 | |||||||||||||||||||||||||||
| Fair value of beneficial conversion feature of convertible note | - | - | - | - | 45,094 | - | - | - | 45,094 | |||||||||||||||||||||||||||
| Conversion of convertible note | - | - | 119,246 | 119 | 92,968 | - | - | - | 93,087 | |||||||||||||||||||||||||||
| Net income | - | - | - | - | - | 330,861 | 4,978,175 | - | 5,309,036 | |||||||||||||||||||||||||||
| Foreign currency translation adjustments | - | - | - | - | - | - | - | 378,153 | 378,153 | |||||||||||||||||||||||||||
| Balance, December 31, 2017 | 1,311,148 | $ | 1,311 | 15,202,965 | $ | 15,203 | $ | 24,455,291 | $ | 458,334 | $ | (14,583,080 | ) | $ | 323,776 | $ | 10,670,835 | |||||||||||||||||||
| Common Stock | Preferred Stock | Additional Paid-in | Accumulated | Accumulated Other Comprehensive | Total Stockholders’ | |||||||||||||||||||||||||||
| Shares | Amount | Shares | Amount | Capital | Deficit | Loss | Deficiency | |||||||||||||||||||||||||
| Balance, December 31, 2013 (Restated) | 2,000,000 | $ | 2,000 | - | $ | - | $ | 8,491,337 | $ | (18,939,898 | ) | $ | (810,303 | ) | $ | (11,256,864 | ) | |||||||||||||||
| Net loss (Restated) | - | - | - | - | - | (707,556 | ) | - | (707,556 | ) | ||||||||||||||||||||||
| Foreign currency translation adjustment | - | - | - | - | - | - | 117,259 | 117,259 | ||||||||||||||||||||||||
| Balance, December 31, 2014 (Restated) | 2,000,000 | 2,000 | - | - | 8,491,337 | (19,647,454 | ) | (693,044 | ) | (11,847,161 | ) | |||||||||||||||||||||
| Issuance of 500,000 shares of preferred stock as debt cancellation on December 14, 2015 | - | - | 500,000 | 500 | 999,500 | - | - | 1,000,000 | ||||||||||||||||||||||||
| Net loss | - | - | - | - | - | (677,358 | ) | - | (677,358 | ) | ||||||||||||||||||||||
| Foreign currency translation adjustment | - | - | - | - | - | - | 424,065 | 424,065 | ||||||||||||||||||||||||
| Balance, December 31, 2015 | 2,000,000 | $ | 2,000 | 500,000 | $ | 500 | $ | 9,490,837 | $ | (20,324,812 | ) | $ | (268,979 | ) | $ | (11,100,454 | ) | |||||||||||||||
The accompanying notes are an integral part of these consolidated financial statements.
| F-4 |
KIWA BIO-TECH PRODUCTS GROUP CORPORATION AND SUBSIDIARIES
CONSOLIDATED STATEMENTS OF CASH FLOWS
| Years Ended December 31, | ||||||||
| 2015 | 2014 | |||||||
| (Restated) | ||||||||
| Cash flows from operating activities: | ||||||||
| Net loss | $ | (677,358 | ) | $ | (707,556 | ) | ||
| Adjustments to reconcile net loss to net cash used in operating activities: | ||||||||
| Depreciation and amortization | 4,352 | 4,401 | ||||||
| Provision for penalty payable | 72,152 | 66,602 | ||||||
| Accrued interest on convertible notes and note payable | 112,538 | 112,538 | ||||||
| Changes in operating assets and liabilities: | ||||||||
| Deposit and other receivables | (33,921 | ) | (8 | ) | ||||
| Salary payable | 125,924 | 202,790 | ||||||
| Taxes payable | 62,915 | 63,759 | ||||||
| Due to related parties - trade | 178,988 | 162,715 | ||||||
| Other payables and accrued expenses | 4,202 | (48,496 | ) | |||||
| Net cash used in operating activities | (150,208 | ) | (143,255 | ) | ||||
| Cash flows from financing activities: | ||||||||
| Proceeds from related parties, net of payments to related parties | 148,009 | 144,194 | ||||||
| Net cash provided by financing activities | 148,009 | 144,194 | ||||||
| Effect of exchange rate change | (43 | ) | (15 | ) | ||||
| Cash and cash equivalents: | ||||||||
| Net increase (decrease) | (2,242 | ) | 924 | |||||
| Balance at beginning of year | 2,963 | 2,039 | ||||||
| Balance at end of year | $ | 721 | $ | 2,963 | ||||
| Non-cash financing activities: | ||||||||
| Issuance of 500,000 shares of preferred stock as debt cancellation | $ | 1,000,000 | $ | - | ||||
| Supplemental Disclosures of Cash flow Information: | ||||||||
| Cash paid for interest | $ | - | $ | - | ||||
| Cash paid for income taxes | $ | - | $ | - | ||||
| Years Ended December 31, | ||||||||
| 2017 | 2016 | |||||||
| Cash flow from continuing operating activities: | ||||||||
| Net income | $ | 5,309,036 | $ | 891,030 | ||||
| (Income) loss from discontinued operations, net of taxes | (4,495,333 | ) | 150,471 | |||||
| Net Income from continuing operations | 813,703 | 1,041,501 | ||||||
| Adjustments to reconcile net income to net cash used in continuing operating activities: | ||||||||
| Depreciation | 46,491 | 21,246 | ||||||
| Bad debt | - | 55,240 | ||||||
| Accrued interest | 524,333 | 190,552 | ||||||
| Stock compensation for consulting services | 697,673 | 288,250 | ||||||
| Gain on derivative liabilities | (321,851 | ) | - | |||||
| Changes in continuing operating assets and liabilities: | ||||||||
| Accounts receivable | 1,126,584 | (1,229,249 | ) | |||||
| Prepaid expenses | (66,315 | ) | 15,846 | |||||
| Rent deposits and other receivables | (37,412 | ) | (63,783 | ) | ||||
| Advance to suppliers | (10,264,884 | ) | (1,962,446 | ) | ||||
| Due from related parties-non-trade | 1,546,691 | (1,591,935 | ) | |||||
| Inventory | (2,645,053 | ) | - | |||||
| Deferred cost of goods sold | (16,112 | ) | - | |||||
| Accounts payable | 631,324 | 1,122,082 | ||||||
| Due to related parties-trade | - | 142,036 | ||||||
| Salary payable | 102,469 | 93,860 | ||||||
| Taxes payable | 674,414 | 433,914 | ||||||
| Advances from customers | 523,600 | - | ||||||
| Other payables and accruals | 987,626 | 533,914 | ||||||
| Deferred revenue | 27,568 | - | ||||||
| Net cash used in continuing operating activities | (5,649,151 | ) | (908,972 | ) | ||||
| Net cash provided by discontinued operations | - | 245 | ||||||
| Net cash used in operating activities | (5,649,151 | ) | (908,727 | ) | ||||
| Cash flows from investing activities: | ||||||||
| Payment of deposit for Long-term investment | (739,841 | ) | - | |||||
| Purchase of property, plant and equipment | (75,285 | ) | (79,083 | ) | ||||
| Net cash used in investing activities | (815,126 | ) | (79,083 | ) | ||||
| Cash flows from financing activities: | ||||||||
| Working capital borrowed from related parties, net of payments to related parties | 219,420 | 139,085 | ||||||
| Proceeds from sale of common stock | 6,345,128 | 870,497 | ||||||
| Proceeds from convertible note | 969,808 | - | ||||||
| Net cash provided by financing activities | 7,534,356 | 1,009,582 | ||||||
| Effect of exchange rate change | (9 | ) | (8,779 | ) | ||||
| Cash and cash equivalents: | ||||||||
| Net increase | 1,070,070 | 12,993 | ||||||
| Balance at beginning of year | 13,469 | 476 | ||||||
| Balance at end of year | $ | 1,083,539 | $ | 13,469 | ||||
| SUPPLEMENTARY DISCLOSURES OF CASH FLOW FOR NON-CASH TRANSACTION: | ||||||||
| Issuance of preferred stock for debt settlement | $ | 1,054,492 | $ | 3,191,974 | ||||
| Issuance of common stock for consulting services | $ | 1,689,896 | $ | 1,688,300 | ||||
| Issuance of common stock for financing related services | $ | 1,433,156 | $ | - | ||||
| Conversion of convertible note | $ | 93,088 | $ | - | ||||
| SUPPLEMENTARY DISCLOSURE: | ||||||||
| Cash paid for interest | $ | - | $ | - | ||||
| Cash paid for income taxes | $ | 460,853 | $ | - | ||||
The accompanying notes are an integral part of these consolidated financial statements.
| F-5 |
KIWA BIO-TECH PRODUCTS GROUP CORPORATION AND SUBSIDIARIES
NOTES TO CONSOLIDATED FINANCIAL STATEMENTS
DECEMBER 31, 20152017
1.Description of Business and Organization
Organization–
Kiwa Bio-Tech Products Group Corporation (“the Company”) is the result of a share exchange transaction accomplished on March 12, 2004 between the shareholders of Kiwa Bio-Tech Products Group Ltd. (“Kiwa BVI”), a company originally organized under the laws of the British Virgin Islands on June 5, 2002 and Tintic Gold Mining Company (“Tintic”), a corporation originally incorporated in the state of Utah on June 14, 1933 to perform mining operations in Utah. The share exchange resulted in a change of control of Tintic, with former Kiwa BVI stockholders owning approximately 89% of Tintic on a fully diluted basis and Kiwa BVI surviving as a wholly-owned subsidiary of Tintic. Subsequent to the share exchange transaction, Tintic changed its name to Kiwa Bio-Tech Products Group Corporation. On July 21, 2004, the Company completed its reincorporation in the State of Delaware. On March 8, 2017, we completed our reincorporation in the State of Nevada.
The Company establishedoperates through a subsidiaryseries of subsidiaries in the Peoples Republic of China as detailed in the following Organizational Chart. The Company had previously operated its business through its subsidiaries Kiwa Bio-Tech Products (Shandong) Co., Ltd. (“Kiwa Shandong”) and Tianjin Kiwa Feed Co., Ltd. (“Kiwa Tianjin”). Kiwa Tianjin has been dissolved since July, 11, 2012. On February 11, 2017, the Company entered an Equity Transfer Agreement with Dian Shi Cheng Jing (Beijing) Technology Co. (“Transferee”) to transfer all of shareholders’ right, title and interest in 2002.Kiwa Shandong to the Transferee for RMB1.00. On April 12, 2017, the government processing of transfer has been completed. Currently, the Company mainly operates its business through its subsidiaries Kiwa Baiao Bio-Tech (Beijing) Co., Ltd. (“Kiwa Beijing”), Kiwa Bio-Tech Products (Shenzhen) Co., Ltd. (“Kiwa Shenzhen”), which was incorporated in China in November 2016, Kiwa Bio-Tech Products (Hebei) Co., Ltd. (“Kiwa Hebei”), which was incorporated in China in December 2016, and Kiwa Bio-Tech Products (Shenzhen) Co., Ltd. Xian Branch Company, (“Kiwa Xian”), which was incorporated in China in December 2017. Kiwa Beijing was acquired from a group of unrelated third parties in January 2016 together with its holding company HK Baina Group Holding Company for approximately $34,000 (RMB 220,000) and renamed to Kiwa Baiao Bio-Tech (Beijing) Co., Ltd. from Oriental Baina Co., Ltd. in February 2016. HK Baina Group Holding Company and Oriental Baina Co., Ltd. have no operations prior to the acquisition and the purchase price was initially recorded as goodwill and fully impaired at the year end of 2016. In July 2017, the Company established Kiwa Bio-Tech Asia Holding (Shenzhen) Ltd. (“Kiwa Asia”) to be the direct holding company of Kiwa Beijing, Kiwa Shenzhen, Kiwa Xian and Kiwa Hebei. The following chart summarizes the Company’s organizational and ownership structure.Company established Inner Mongolia Jing Nong Investment & Management, Ltd. (“Kiwa Jing Nong”) in August 2017.
| F-6 |
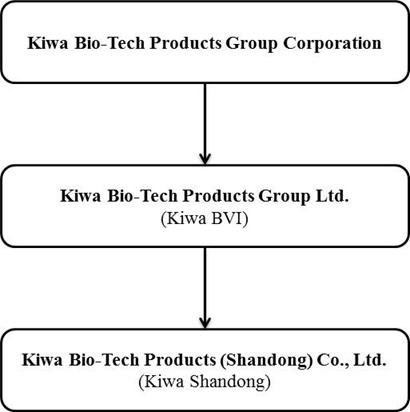
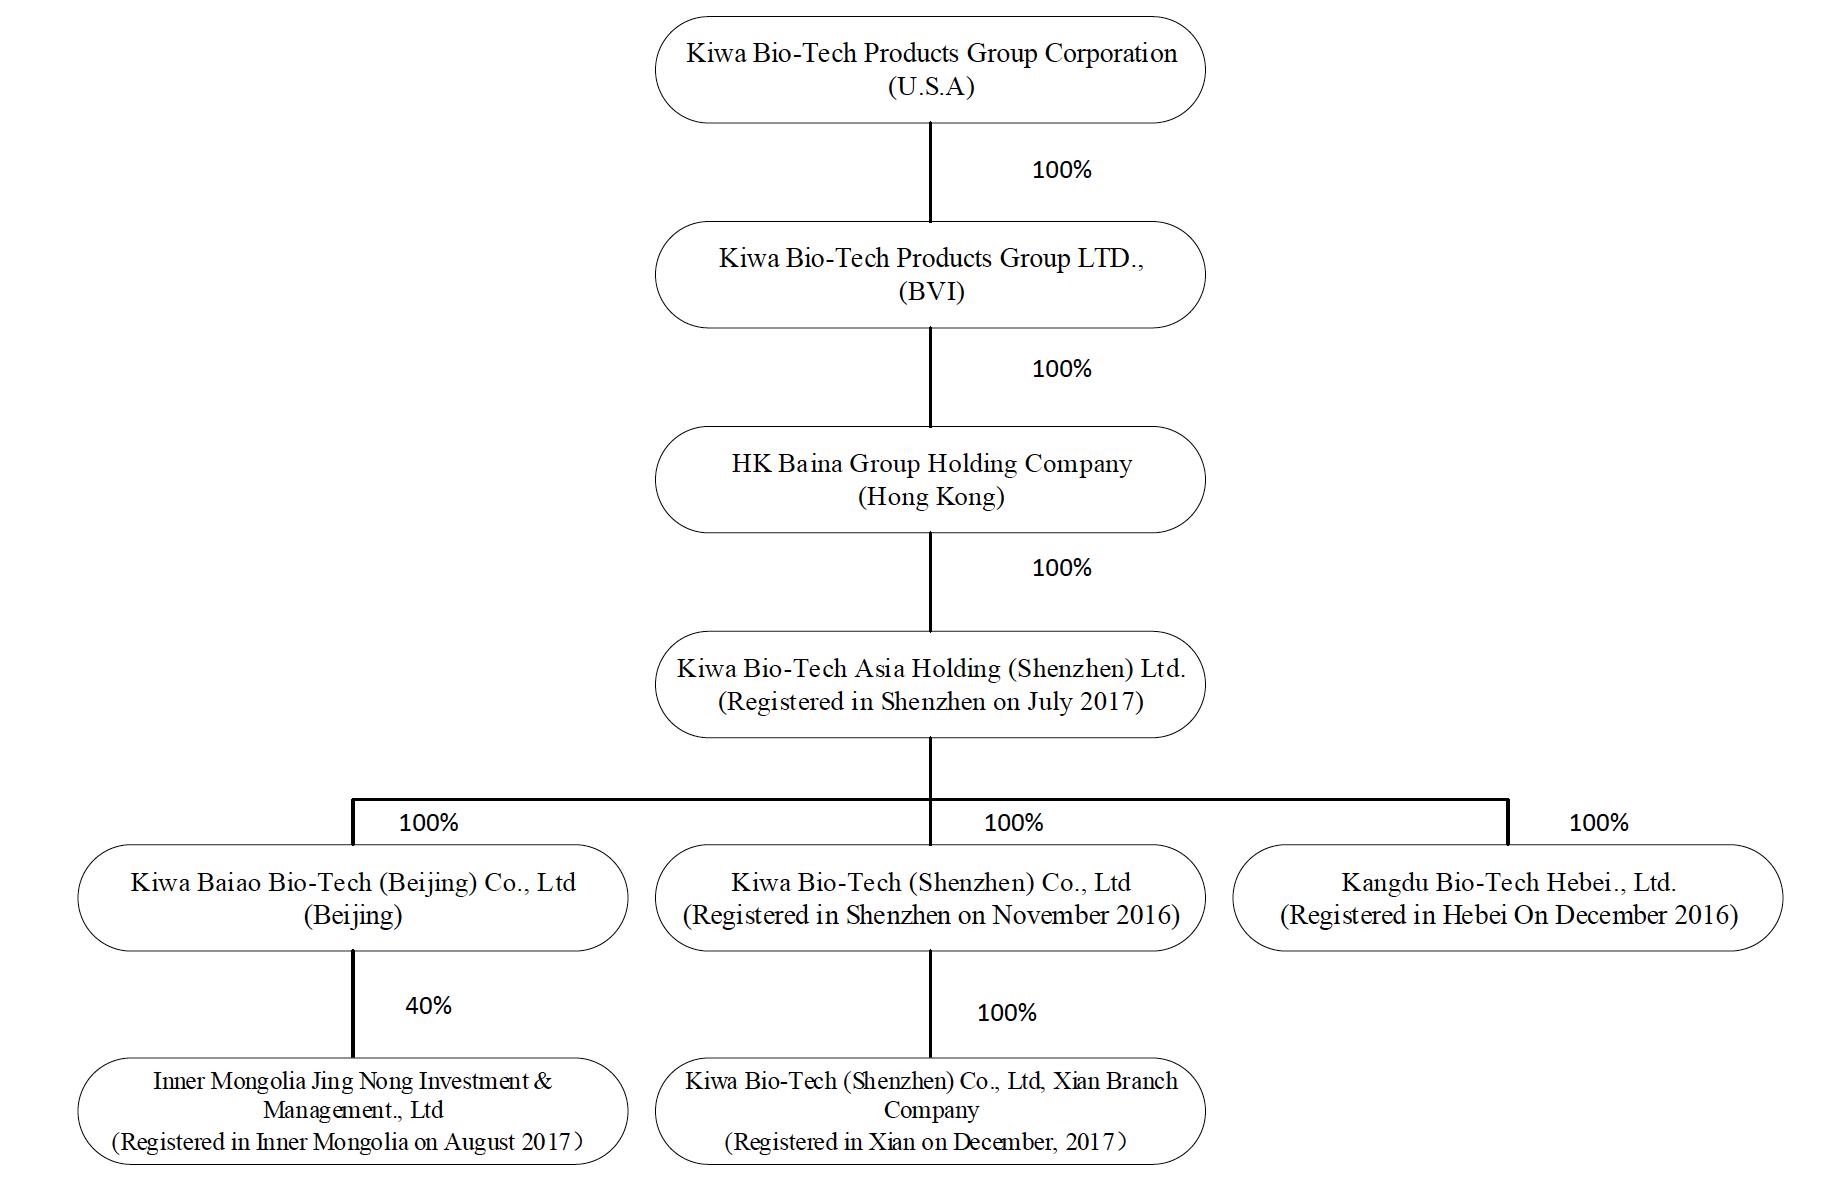
Business–
The Company’s business plan is to develop, manufacture, distributeCompany develops, manufactures, distributes and marketmarkets innovative, cost-effective and environmentally safe bio-technological products for agriculture markets located primarilyagricultural use. Our products are designed to enhance the quality of human life by increasing the value, quality and productivity of crops and decreasing the negative environmental impact of chemicals and other wastes.
Prior to August 2016, the Company did not have any license to sell its bio-technological fertilizer products in China.China and could not generate direct sales on its own. Instead the Company had been licensing its trademark to Kangtan Gerui (Beijing) Bio-Tech Co., Ltd. (“Gerui”), a related party (see Note 10), in China to sell fertilizers. The Company has acquired technologiescharged Gerui 10% of net sales of fertilizers bearing the Company’s trademark. The trademark license income was recorded in the captioned “Trademark license income-related party” in the accompanying consolidated statements of operations and comprehensive income. In August 2016, the Company obtained a fertilizer sales permit from the Chinese government. As a result, the Company ceased its cooperation with Gerui and began to produce and market bio-fertilizer.sell products directly to customers on its own.
Liquidity
In assessing the Company’s liquidity, the Company monitors and analyzes its cash on-hand and its operating and capital expenditure commitments. The Company’s liquidity needs are to meet its working capital requirements, operating expenses and capital expenditure obligations.
| F-7 |
The Company engages in the business for organically bio-fertilizer and its customers are mainly agricultural cooperative company and distributors who then resell its products to individual farmers. Because the crop growing cycle usually takes approximately 3 to 9 months in the agricultural industry, it will take approximately similar time frame of 3 to 9 months for farmers to harvest crops and to realize profits to repay the Company’s distributors.The Company’s current payment terms on these customers are ranging from 60 days to 9 months after receipts of the goods depending on the creditworthiness of these customers.As a result, the Company’s accounts receivable turnover ratio is normally low due to the nature of the Company’s business. In addition, the Company’s business is capital intensive as the Company needs to make advance payment to its suppliers to secure timely delivery and current market price of raw materials. Debt financing in the form of notes payable and loans from related parties have been utilized to finance the working capital requirements of the Company. As of December 31, 2017, the Company’s working capital was approximately $10.2 million and the Company had cash of approximately $1.1 million, with remaining current assets mainly composed of advance to suppliers.
Although the Company believes that it can realize its current assets in the normal course of business, the Company’s ability to repay its current obligations will depend on the future realization of its current assets and the future operating revenues generated from its products. Because the Chinese Government is continuously to promote green environment and implement quality standards and environmentally sensitive policies in the Agricultural industry, the Company expects its revenues from its innovated and highly effective products, Compound Microbial Fertilizer and Bio-Water Soluble Fertilizer, will continue to grow in its business. In addition, the Company’s marketing team is expanding to the Western areas of China and Hainan province and it expects its revenues will continue to grow in 2018. Meanwhile, the Company expects to continue to gain market shares in its existing sales channel bases in the Northern and the Southern areas of China due to the good quality of the products and better reputation in the industry. The Company believes these factors will enable it sufficiently to support its working capital needs for the next twelve months.
Management has considered its historical experience, the economic environment, trends in the Agricultural industry, the realization of the advance to suppliers as of December 31, 2017. The Company expects to realize the balance of its current assets within the normal operating cycle of a twelve month period. If the Company is unable to realize its current assets within the normal operating cycle of a twelve month period, the Company may have to consider supplementing its available sources of funds through the following sources:
| ● | in addition to the issuance of the Company’s common stock of approximately $6.3 million in 2017, the Company will continuously seeking additional equity financing to support its working capital; | |
| ● | other available sources of financing from PRC banks and other financial institutions; | |
| ● | factoring the Company’s accounts receivable from the Company’s sales to be generated starting in the second quarter of 2018; and | |
| ● | financial support and credit guarantee commitments from the Company’s major shareholder. |
Based on the above considerations, the Company’s management is of the opinion that it has sufficient funds to meet the Company’s working capital requirements and debt obligations as they become due one year from the date of this report. However, there is no assurance that management will be successful in their plans. There are a number of factors that could potentially arise that could undermine the Company’s plans, such as changes in the demand for the Company’s products, PRC government policy, economic conditions, and competitive pricing in the Agricultural industry.
2. SummarySummaries of Significant Accounting Policies
Basic of presentation
The accompanying consolidated financial statements have been prepared in accordance with accounting principles generally accepted in the United States of America (“U.S. GAAP”) for information pursuant to the rules and regulations of the Securities Exchange Commission (“SEC”).
Principle of Consolidation -
These consolidated financial statements include the financial statements of the Company and its wholly-owned subsidiaries, Kiwa BVI, Hong Kong Baina Group Holding Company, Kiwa Beijing, Kiwa Shandong, Kiwa Shenzhen, Kiwa Hebei, Kiwa Xian, Kiwa Asia and Kiwa Bio-Tech Products (Shandong) Co., Ltd. (“Kiwa Shandong”).Jing Nong. All significant inter-company balances or transactions are eliminated on consolidation.
| F-8 |
Reverse Split - On January 14, 2016, the Company filed a CertificateUse of Amendment of its Certificate of Incorporation with the State of Delaware with reference to a 1-for-200 reverse stock split with respect to its Common Stock with effective date of January 28, 2016. In connection with the reverse split, the Company’s authorized capital was amended to be 120,000,000 shares, comprising 100,000,000 shares of Common Stock par value $0.001 and 20,000,000 shares of Preferred Stock par value $0.001. All relevant information relating to numbers of shares, options and per share information have been retrospectively adjusted to reflect the reverse stock split for all periods presented.Estimates
Use of Estimates - The preparation of financial statements in conformity with US GAAP requires management to make estimates and assumptions that affect the reported amounts of assets and liabilities, disclosure of contingent assets and liabilities at the date of the consolidated financial statements, and the reported amounts of revenues and expenses during the reporting period. Actual results could differ from those estimates. Significant accounting estimates include the valuation of securities issued, derivative liabilities, deferred tax assets and related valuation allowance.
Certain of our estimates, including evaluating the collectability of accounts receivable and the fair market value of long-lived assets, could be affected by external conditions, including those unique to our industry, and general economic conditions. It is possible that these external factors could have an effect on our estimates that could cause actual results to differ from our estimates. We re-evaluate all of our accounting estimates annually based on these conditions and record adjustments when necessary.
Cash -and Cash includes cash in handEquivalents
Cash and cash in time deposits, certificatesequivalents consist of depositsall cash balances and all highly liquid debt instrumentsinvestments with an original maturitiesmaturity of three months or less. Because of the short maturity of these investments, the carrying amounts approximate their fair value. Restricted cash is excluded from cash and cash equivalents.
The Company maintains cash with financial institutions in the People’s Republic of China (“PRC”) which are not insured or otherwise protected. Should any of these institutions holding the Company’s cash become insolvent, or if the Company is unable to withdraw fundsAccounts receivable and allowance for any reason, the Company could lose the cash on deposit with that institution.doubtful accounts
Accounts Receivables -Accounts receivablesreceivable represent customer accounts receivables. The Company provides an allowance for doubtful accounts equal to the estimated uncollectible amounts. The Company’s estimate is based on historical collection experience, the economic environment, trends in the microbial fertilizer industry, and a review of the current status of trade accounts receivable. Management reviews its accounts receivable each reporting period to determine if the allowance for doubtful accounts is based on a combinationadequate. Such allowances, if any, would be recorded in the period the impairment is identified. It is reasonably possible that the Company’s estimate of current sales, historical charge offs and specificthe allowance for doubtful accounts identified as high risk.will change. Uncollectible accounts receivable are charged against the allowance for doubtful accounts when all reasonable efforts to collect the amounts due have been exhausted. Such allowances, if any, would be recorded in the period the impairment is identified.
Inventories -Inventory
Inventories are stated at the lower of cost, determined on the weighted average method, and net realizable value. Work in progress and finished goods are composed of direct material,materials, direct labor and a portion of manufacturing overhead. Net realizable value is the estimated based on selling price in the ordinary course of business, less estimated costs to complete and dispose.
Property, plant and equipment -
Property, plant and equipment are stated at cost less accumulated depreciation and accumulated impairment losses, if any. Gains or losses on disposals are reflected as gain or loss in the year of disposal. The cost of improvements that extend the life of property, plant and equipment are capitalized. These capitalized costs may include structural improvements, equipment and fixtures. All ordinary repair and maintenance costs are expensed as incurred. Depreciation for financial reporting purposes is provided using the straight-line method over the estimated useful lives of the assets as follows:
| Useful Life | ||||
| (In years) | ||||
| Buildings | 30 - 35 | |||
| Machinery and equipment | 5 - 10 | |||
| Automobiles | 8 | |||
| Office equipment | 2 - 5 | |||
| Computer software | 3 | |||
| Leasehold improvement | The shorter of the lease term and useful life | |||
| F-9 |
Impairment of Long-Lived Assets -
The Company’s long-lived assets consist of property, equipmentplant and intangible assets.equipment. The Company evaluates its investment in long-lived assets, including property and equipment, for recoverability whenever events or changes in circumstances indicate the net carrying amount may not be recoverable. Judgments regarding potential impairment are based onIt is possible that these assets could become impaired as a result of legal factors, market conditions, and operational performance indicators, among others. In assessing thetechnological or other industry changes. If circumstances require a long-lived asset or asset group to be tested for possible impairment, of property and equipment, the Company makes assumptions regarding the estimated futurefirst compares undiscounted cash flows expected to be generated by that asset or asset group to its carrying value. If the carrying value of the long-lived asset or asset group is not recoverable on an undiscounted cash flow basis, an impairment is recognized to the extent that the carrying value exceeds its fair value. Fair value is determined through various valuation techniques, including discounted cash flow models, quoted market values and other factorsthird-party independent appraisals, as considered necessary.
Financial Instruments
The Company analyzes all financial instruments with features of both liabilities and equity under FASB Accounting Standards Codification (“ASC”) Topic 480 “Distinguishing Liabilities from Equity” and FASB ASC Topic 815 “Derivatives and Hedging”.
Embedded conversion features of convertible debentures not considered to be derivative instruments
The embedded conversion features of convertible debentures not considered to be derivative instruments provide for a rate of conversion that is below market value. Such feature is normally characterized as a “beneficial conversion feature” (“BCF”). The relative fair values of the BCF were recorded as discounts from the face amount of the respective debt instrument. The Company amortized the discount using the straight-line method which approximates the effective interest method through maturity of such instruments.
Embedded conversion features of convertible debentures that are classified as derivative liabilities
The embedded conversion features of convertible debentures that are classified as derivative liabilities are recorded at fair value as a discount from the face amount of the respective debt instrument. The discount is being amortized to interest expense over the life of the note using the straight-line method, which approximates the effective interest method. These instruments are accounted for as derivative liabilities and marked-to-market each reporting period. The change in the value of the derivative liabilities is charged against or credited to income in the captioned “change in fair value of derivative liabilities” in the accompanying consolidated statements of operations and comprehensive income.
Fair Value of Financial Instruments
The Company follows paragraph 825-10-50-10 of the FASB Accounting Standards Codification for disclosures about fair value of its financial instruments and paragraph 820-10-35-37 of the FASB Accounting Standards Codification (“Paragraph 820-10-35-37”) to measure the fair value of its financial instruments. Paragraph 820-10-35-37 establishes a framework for measuring fair value with U.S. GAAP, and expands disclosures about fair value measurements.
To increase consistency and comparability in fair value measurements and related disclosures, Paragraph 820-10-35-37 establishes a fair value hierarchy which prioritizes the inputs to valuation techniques used to measure fair value into three (3) broad levels. The fair value hierarchy gives the highest priority to quoted prices (unadjusted) in active markets for identical assets or liabilities and the lowest priority to unobservable inputs. The three (3) levels of fair value hierarchy defined by Paragraph 820-10-35-37 are described below:
| F-10 |
| ● | Level 1: quoted market prices available in active markets for identical assets or liabilities as of the reporting date. | |
| ● | Level 2: pricing inputs other than quoted prices in active markets included in Level 1, which are either directly or indirectly observable as of the reporting date. | |
| ● | Level 3: Pricing inputs that are generally observable inputs and not corroborated by market data. |
Financial assets are considered Level 3 when their fair values are determined using pricing models, discounted cash flow methodologies or similar techniques and at least one significant model assumption or input is unobservable.
The fair value hierarchy gives the highest priority to quoted prices (unadjusted) in active markets for identical assets or liabilities and the lowest priority to unobservable inputs. If the inputs used to measure the financial assets and liabilities fall within more than one level described above, the categorization is based on the lowest level input that is significant to the fair value measurement of the instrument.
The carrying amount of the Company’s financial assets and liabilities, such as cash and cash equivalent, prepaid expenses, accounts payable and accrued expenses, approximate their fair value because of the short maturity of those instruments. Derivative instruments are carried at fair value, estimated using the Black Scholes Merton model.
Transactions involving related parties cannot be presumed to be carried out on an arm’s-length basis, as the requisite conditions of competitive, free-market dealings may not exist. Representations about transactions with related parties, if made, shall not imply that the related party transactions were consummated on terms equivalent to those that prevail in arm’s-length transactions unless such representations can be substantiated.
It is not however practical to determine the fair value of the respective assets.advances from stockholders, if any, due to their related party nature.
Fair value of warrants and options -Revenue Recognition
The Company adopted ASC Topic 815, “Accounting for Derivative Instruments and Hedging Activities” to recognize warrants relating to loans and warrants issued to consultants as compensation as derivative instruments in our consolidated financial statements. The Company also adopted ASC Topic 718, “Share Based Payment” to recognize options granted to employees as derivative instruments in our consolidated financial statements. The Company calculates the fair valueapplies paragraph 605-10-S99-1 of the warrants and options using the Black-Scholes Model.
Revenue Recognition–FASB Accounting Standards Codification for revenue recognition. The Company recognizes revenue for our products in accordance with FASB ASC Topic 605, “Revenue Recognition.” Sales representwhen it is realized or realizable and earned. The Company considers revenue realized or realizable and earned when all of the invoiced valuefollowing criteria are met: (i) persuasive evidence of goods, net of value added tax, supplied to customers. Sales are recognized upon delivery of goods to customers when a formalan arrangement exists, (ii) the product has been shipped or the services have been rendered to the customer, (iii) the sales price is fixed or determinable, the delivery is completed, and no other significant obligations of the Company exist and(iv) collectability is reasonably assured. Payments received before all
The Company derives its revenues from sales contracts with its customers with revenues being recognized upon delivery of products. Persuasive evidence of an arrangement is demonstrated via sales contract and invoice; and the sales price to the customer is fixed upon acceptance of the relevant criteriasales contract and there is no separate sales rebate, discount, or volume incentive. The Company recognizes revenue when title and ownership of the goods are transferred upon shipment to the customer by the Company and collectability of payment is reasonably assured.
The Company’scustomers are mainly agricultural cooperative company and distributors who then resell the Company’s products to individual farmers. Because the crop growing cycle usually takes approximately 3 to 9 months in the agricultural industry, for some co-ops and distributors, it will take approximately similar time frame of 3 to 9 months for farmers to harvest crops and to realize profits to repay them. As a result, for the sales contracts with these customers, the collectability of payment is highly dependent on the successful harvest of corps and the customers’ ability to collect money from farmers. The Company deemed the collectability of payment may not be reasonably assured until after the Company get paid. For those sales contracts that the Company has shipped its products but the payment is contingent on collections of payments from the downstream customers, the Company considers the revenue recognition criteria are satisfiednot met and therefore defers the revenue and cost of goods sold until payments are recorded as advances from customers.collected. These revenue and cost of goods sold are classified in the captioned “Deferred revenue” and “Deferred cost of goods sold” in the accompanying consolidated balance sheets. For other customers whose repayment term is within normal business course and not dependent on the harvest of corps, the Company recognized revenue when title and ownership of the goods are transferred upon shipment to the customer by the Company.
| F-11 |
ShippingDeferred Revenue and Handling Costs -Substantially all costsDeferred Cost of shipping and handling of products to customers are included in selling. Shipping and handling costs for the years ended December 31, 2015 and 2014 were both $nil.Goods Sold
Deferred revenue and deferred cost of goods sold result from transactions where the Company has shipped product for which all revenue recognition criteria have not yet been met. Deferred cost of goods sold related to deferred product revenues includes direct inventory costs. Once all revenue recognition criteria have been met, the deferred revenues and associated cost of goods sold are recognized.
Income Taxes-
The Company accounts for income taxes under the provisions of FASB ASC Topic 740, “Income Tax,” which requires recognition of deferred tax assets and liabilities for the expected future tax consequences of events that have been included in the consolidated financial statements or tax returns. Deferred tax assets and liabilities are recognized for the future tax consequence attributable to the difference between the tax bases of assets and liabilities and their reported amounts in the financial statements. Deferred tax assets and liabilities are measured using the enacted tax rate expected to apply to taxable income in the years in which those temporary differences are expected to be recovered or settled. The effect on deferred tax assets and liabilities of a change in tax rates is recognized in income in the period that includes the enactment date. The Company establishes a valuation when it is more likely than not that the assets will not be recovered.
ASC Topic 740.10.30 clarifies the accounting740-10, “Accounting for Uncertainty in Income Taxes,” defines uncertainty in income taxes recognized in an enterprise’s financial statements and prescribes a recognition threshold and measurement attribute for the financial statement recognition and measurementevaluation of a tax position takenas a two-step process. The first step is to determine whether it is more likely than not that a tax position will be sustained upon examination, including the resolution of any related appeals or expectedlitigation based on the technical merits of that position. The second step is to measure a tax position that meets the more-likely-than-not threshold to determine the amount of benefit to be takenrecognized in athe financial statements. A tax return. ASC Topic 740.10.40 provides guidance on derecognition, classification, interest and penalties, accountingposition is measured at the largest amount of benefit that is greater than 50 percent likelihood of being realized upon ultimate settlement. Tax positions that previously failed to meet the more-likely-than-not recognition threshold should be recognized in interim periods, disclosure, and transition. We have no material uncertainthe first subsequent period in which the threshold is met. Previously recognized tax positions that no longer meet the more-likely-than-not criteria should be de-recognized in the first subsequent financial reporting period in which the threshold is no longer met. Penalties and interest incurred related to underpayment of income tax are classified as income tax expense in the period incurred. United States federal, state and local income tax returns prior to 2014 are not subject to examination by any applicable tax authorities. PRC tax returns filed for 2014, 2015 and 2016 are subject to examination by any of the reporting periods presented.applicable tax authorities.
Stock Based Compensation
The Company accounts for share-based compensation awards to employees in accordance with FASB ASC Topic 718, “Compensation – Stock Compensation”, which requires that share-based payment transactions with employees be measured based on the grant-date fair value of the equity instrument issued and recognized as compensation expense over the requisite service period. The Company records stock-based compensation expense at fair value on the grant date and recognizes the expense over the employee’s requisite service period. The Company’s expected volatility assumption is based on the historical volatility of Company’s stock. The expected life assumption is primarily based on historical exercise patterns and employee post-vesting termination behavior. The risk-free interest rate for the expected term of the option is based on the U.S. Treasury yield curve in effect at the time of grant. The expected dividend yield is based on the Company’s current and expected dividend policy.
The Company accounts for share-based compensation awards to non-employees in accordance with FASB ASC Topic 718 and FASB ASC Subtopic 505-50, “Equity-Based Payments to Non-employees”. Under FASB ASC Topic 718 and FASB ASC Subtopic 505-50, stock compensation granted to non-employees has been determined as the fair value of the consideration received or the fair value of equity instrument issued, whichever is more reliably measured and is recognized as an expense as the goods or services are received.
| F-12 |
Foreign Currency Translation and Other Comprehensive Income -
The Company uses United States dollars (“US Dollar” or “US$” or “$”) for financial reporting purposes. However, the Company maintains the books and records in its functional currency, Chinese Renminbi (“RMB”) and Hong Kong Dollar (“HKD”), being the primaryfunctional currency of the economic environment in which its operations are conducted. In general, the Company translates its assets and liabilities into U.S. dollars using the applicable exchange rates prevailing at the balance sheet date, and the statement of comprehensive loss and the statement of cash flow are translated at average exchange rates during the reporting period. Equity accounts are translated at historical rates. Adjustments resulting from the translation of the Company’s financial statements are recorded as accumulated other comprehensive income.
Other comprehensive income for the years ended December 31, 20152017 and 20142016 represented foreign currency translation adjustments and were included in the consolidated statements of operations and comprehensive loss.income.
The exchange rates used to translate amounts in RMB into U.S. Dollars for the purposes of preparing the consolidated financial statements were as follows:
| As of December 31, | ||||||||
| 2015 | 2014 | |||||||
| Balance sheet items, except for equity accounts | 6.4857 | 6.1460 | ||||||
| As of December 31, | ||||||||
| 2017 | 2016 | |||||||
| Balance sheet items, except for equity accounts | 6.5098 | 6.9472 | ||||||
| Years ended December 31, | ||||||||
| 2015 | 2014 | |||||||
| Items in the statements of comprehensive loss | 6.2281 | 6.1457 | ||||||
| Years ended December 31, | ||||||||
| 2017 | 2016 | |||||||
| Items in the statements of comprehensive loss | 6.7582 | 6.6418 | ||||||
Advertising Costs- The Company charges all advertising costsexchange rates used to expense as incurred. The totaltranslate amounts of advertising costs charged to selling, general and administrative expense were $nilin HKD into U.S. Dollars for the years ended December 31, 2015 and 2014, respectively.purposes of preparing the consolidated financial statements were as follows:
| As of December 31, | ||||||||
| 2017 | 2016 | |||||||
| Balance sheet items, except for equity accounts | 7.8149 | - | ||||||
| Years ended December 31, | ||||||||
| 2017 | 2016 | |||||||
| Items in the statements of comprehensive loss | 7.7921 | - | ||||||
Earnings Per Common Share
Research and Development Costs - Research and development costs are charged to expense as incurred. During the years ended December 31, 2015 and 2014, research and development costs were $178,988 and $162,715, respectively.
Net Loss Per Common Share - Basic lossincome per common share is calculatedcomputed pursuant to section 260-10-45 of the FASB Accounting Standards Codification. Basic net income per common share is computed by dividing net loss attributable to Kiwa stockholdersincome by the weighted-averageweighted average number of common shares outstanding during the period.
Diluted net income per common share is computed by dividing net income by the weighted average number of shares of common stock outstanding during the period. Diluted loss per common share includes dilutive effect of dilutive securities (stock options, warrants, convertible debt, stock subscription and other stock commitments issuable). These potentially dilutive securities were not included in the calculation of loss per share for the periods presented because the Company incurred a loss during such periods and thus the effect would have been anti-dilutive. Accordingly, basic and diluted loss per common share is the same for all periods presented. As of December 31, 2015 and 2014, potentially dilutive securities aggregated 126,440,833 (632,204 post-reverse split shares) and 387,082,626 (1,935,413 post-reverse split shares)outstanding shares of common stock respectively.during the period to reflect the potential dilution that could occur from common shares issuable through contingent shares issuance arrangement, stock options or warrants. Common stock equivalents having an anti-dilutive effect on earnings per share are excluded from the calculation of diluted earnings per share.
Fair value measurements
ASC Topic 820, Fair Value MeasurementCommitments and Disclosures, defines fair value as the exchange price that would be received for an asset or paid to transfer a liability (an exit price) in the principal or most advantageous market for the asset or liability in an orderly transaction between market participants on the measurement date. This topic also establishes a fair value hierarchy which requires classification based on observable and unobservable inputs when measuring fair value. There are three levels of inputs that may be used to measure fair value:
Level 1 - Quoted prices in active markets for identical assets or liabilities.
Level 2 - Observable inputs other than Level 1 prices such as quoted prices for similar assets or liabilities; quoted prices in markets that are not active; or other inputs that are observable or can be corroborated by observable market data for substantially the full term of the assets or liabilities.
Level 3 - Unobservable inputs that are supported by little or no market activity and that are significant to the fair value of the assets or liabilities.Contingencies
The carrying valuesCompany follows subtopic 450-20 of the FASB Accounting Standards Codification to report accounting for contingencies. Certain conditions may exist as of the date the consolidated financial statements are issued, which may result in a loss to the Company but which will only be resolved when one or more future events occur or fail to occur. The Company assesses such contingent liabilities, and such assessment inherently involves an exercise of judgment. In assessing loss contingencies related to legal proceedings that are pending against the Company or unassured claims that may result in such proceedings, the Company evaluates the perceived merits of any legal proceedings or unassured claims as well as the perceived merits of the amount of relief sought or expected to be sought therein.
| F-13 |
If the assessment of a contingency indicates that it is probable that a material loss has been incurred and the amount of the liability can be estimated, then the estimated liability would be accrued in the Company’s consolidated financial statements. If the assessment indicates that a potential material loss contingency is not probable but is reasonably possible, or is probable but cannot be estimated, then the nature of the contingent liability, and an estimate of the range of possible losses, if determinable and material, would be disclosed.
Loss contingencies considered remote are generally not disclosed unless they involve guarantees, in which case the guarantees would be disclosed. Management does not believe, based upon information available at this time that these matters will have a material adverse effect on the Company’s financial position, results of operations or cash flows.
Cash Flow Reporting
The Company adopted paragraph 230-10-45-24 of the FASB Accounting Standards Codification for cash flows reporting, classifies cash receipts and payments according to whether they stem from operating, investing, or financing activities and provides definitions of each category, and uses the indirect or reconciliation method (“Indirect method”) as defined by paragraph 230-10-45-25 of the FASB Accounting Standards Codification to report net cash flow from operating activities by adjusting net income to reconcile it to net cash flow from operating activities by removing the effects of :
(a) all deferrals of past operating cash receipts and payments and all accruals of expected future operating cash receipts and payments;
(b) all items that are included in net income that do not affect operating cash receipts and payments.
The Company reports the reporting currency equivalent of foreign currency cash flows, using the current exchange rate at the time of the cash flows and the effect of exchange rate changes on cash held in foreign currencies is reported as a separate item in the reconciliation of beginning and ending balances of cash and cash equivalents receivables and payables,separately provides information about investing and short-term debts approximate their fair values duefinancing activities not resulting in cash receipts or payments in the period pursuant to their short maturities.paragraph 830-230-45-1 of the FASB Accounting Standards Codification.
Recent Accounting Pronouncements
In May 2014, the Financial Accounting Standards Board (the “FASB”) issued Accounting Standards Update No. 2014-09 (ASU 2014-09), Revenue from Contracts with Customers. ASU 2014-09 will eliminate transaction- and industry-specific revenue recognition guidance under current GAAP and replace it with a principle based approach for determining revenue recognition. ASU 2014-09 will require that companies recognize revenue based on the value of transferred goods or services as they occur in the contract. ASU 2014-09 also will require additional disclosure about the nature, amount, timing and uncertainty of revenue and cash flows arising from customer contracts, including significant judgments and changes in judgments and assets recognized from costs incurred to obtain or fulfill a contract. Based on the FASB’s Exposure Draft Update issued on April 29, 2015, and approved in July 2015, Revenue from Contracts With Customers (Topic 606): Deferral of the Effective Date, ASU 2014-09 is now effective for reporting periods beginning after December 15, 2017, with early adoption permitted only as of annual reporting periods beginning after December 15, 2016, including interim reporting periods within that reporting period. Entities will be able to transition to the standard either retrospectively or as a cumulative-effect adjustment as of the date of adoption. While no significant impact is expected upon adoption of the new guidance, the Company will not be able to make that determination until the time of adoption based upon outstanding contracts at that time. In September 2017, the FASB issued Accounting Standards Update (ASU) No. 2017-13,Recent“Revenue Recognition (Topic 605), Revenue from Contracts with Customers (Topic 606), Leases (Topic 840), and Leases (Topic 842): Amendments to SEC Paragraphs Pursuant to the Staff Announcement at the July 20, 2017 EITF Meeting and Rescission of Prior SEC Staff Announcements and Observer Comments.” The amendments in ASU No. 2017-13 amends the early adoption date option for certain companies related to the adoption of ASU No. 2014-09. The effective date for the Company is the same as the effective date and transition requirements for the amendments for ASU 2014-09 beginning in January 1, 2018. The Company is in the initial stages of its evaluation of the impact of the new standard on its accounting pronouncements adoptedpolicies, and processes. The Company has assigned internal resources in addition to the engagement of third party service providers to assist in the evaluation. The Company believes that its current revenue recognition policies are generally consistent with the new revenue recognition standards set forth in ASU 2014-09 to the timing of recognition of its revenues.
| F-14 |
In November 2015,February 2016, the FASB issued Accounting Standards Update No. 2016-02 (ASU 2016-02), Leases (Topic 842). ASU 2015-17, “Balance Sheet Classification2016-02 requires a lessee to record a right-of-use asset and a corresponding lease liability, initially measured at the present value of Deferred Taxes.”the lease payments, on the balance sheet for all leases with terms longer than 12 months, as well as the disclosure of key information about leasing arrangements. ASU 2015-172016-02 requires that deferred tax liabilities and assets be classified as noncurrentrecognition in a classifiedthe statement of operations of a single lease cost, calculated so that the cost of the lease is allocated over the lease term. ASU 2016-02 requires classification of all cash payments within operating activities in the statement of cash flows. Disclosures are required to provide the amount, timing and uncertainty of cash flows arising from leases. A modified retrospective transition approach is required for lessees for capital and operating leases existing at, or entered into after, the beginning of the earliest comparative period presented in the financial position.statements, with certain practical expedients available. ASU 2015-172016-02 is effective for financial statements issued for fiscal years beginning after December 15, 2016,2018, including interim periods within those fiscal years. Early application is permitted. The Company has not yet evaluated the impact of the adoption of ASU 2016-02 on the Company’s consolidated financial statement presentation or disclosures.
In January 2017, the FASB issued ASU 2017-01, “Business Combinations (Topic 805): Clarifying the Definition of a Business.” The amendments in this guidance are clarifying the definition of a business to assist entities when determining whether an integrated set of assets and activities meets the definition of a business. The update provides that when substantially all the fair value of the assets acquired is concentrated in a single identifiable asset or a group of similar identifiable assets, the set is not a business. The guidance is effective for fiscal years beginning after December 15, 2017, including interim periods within those fiscal years. The adoption of this new guidance is not expected to have a material impact on our consolidated financial statements.
In January 2017, the FASB issued ASU 2017-04—Intangibles—Goodwill and Other (Topic 350): Simplifying the Test for Goodwill Impairment. The amendments in this guidance to eliminate the requirement to calculate the implied fair value of goodwill to measure goodwill impairment charge (Step 2). As a result, an impairment charge will equal the amount by which a reporting unit’s carrying amount exceeds its fair value, not to exceed the amount of goodwill allocated to the reporting unit. An entity still has the option to perform the qualitative assessment for a reporting unit to determine if the quantitative impairment test is necessary. The amendment should be applied on a prospective basis. The guidance is effective for goodwill impairment tests in fiscal years beginning after December 15, 2019. Early adoption is permitted for goodwill impairment tests performed after January 1, 2017. The impact of this guidance for the Company will depend on the outcomes of future goodwill impairment tests.
In May 2017, the FASB issued Accounting Standards Update No. 2017-09 (ASU 2017-09), Compensation — Stock Compensation (Topic 718) Scope of Modification Accounting. The amendments in ASU 2017-09 provide guidance about which changes to the terms or conditions of a share-based payment award require an entity to apply modification accounting in Topic 718. The adoption of ASU 2017-09 which will become effective for annual periods beginning after December 15, 2017 and for interim periods within those annual periods, is not expected to have any impact on the Company’s consolidated financial statement presentation or disclosures.
In July 2017, the FASB issued Accounting Standards Update No. 2017-11 (ASU 2017-11), Earnings Per Share (Topic 260); Distinguishing Liabilities from Equity (Topic 480); Derivatives and Hedging (Topic 815): (Part I) Accounting for Certain Financial Instruments with Down Round Features, (Part II) Replacement of the Indefinite Deferral for Mandatorily Redeemable Financial Instruments of Certain Nonpublic Entities and Certain Mandatorily Redeemable Noncontrolling Interests with a Scope Exception. The amendments in ASU 2017-11 change the classification analysis of certain equity-linked financial instruments (or embedded features) with down round features. When determining whether certain financial instruments should be classified as liabilities or equity instruments, a down round feature no longer precludes equity classification when assessing whether the instrument is indexed to an entity’s own stock. The adoption of ASU 2017-11 which will become effective for annual periods beginning after December 15, 2018 and for interim periods within those annual periods. The Company elected to early adopt ASU 2017-11 when preparing these consolidated financial statements for the year ended December 31, 2017.
Management does not expect these changes tobelieve that any other recently issued, but not yet effective, authoritative guidance, if currently adopted, would have a material impact on the Company’s consolidated financial statements.statement presentation or disclosures.
| F-15 |
In January3. Accounts Receivable, net
As of December 31, 2017 and December 31, 2016, Financial Accounting Standards Board (“FASB”) issued Accounting Standards Update (“ASU”) 2016-01, “Recognitionwe had approximately $29,000 and Measurement$1.1 million, respectively, of Financial Assets and Financial Liabilities.” ASU 2016-01 requires equity investmentsaccounts receivable from the Company’s customers.The Company’s current payment terms on these customers are ranging from 60 days to be measured at fair value with changes in fair value recognized in net income; simplifies9 months after receipts of the impairment assessment of equity investments without readily determinable fair values by requiring a qualitative assessment to identify impairment; Eliminates the requirement for public business entities to disclose the method(s) and significant assumptions used to estimate the fair value that is required to be disclosed for financial instruments measured at amortized costgoods depending on the balance sheet; requires public business entitiescreditworthiness of these customers.Thesecustomers are either agricultural cooperative company or distributors who then resell the Company’s products to useindividual farmers. The reason the exit price notion when measuringCompany decides to extend credit for up to 9 months is mainly because the fair value of financial instruments for disclosure purposes; requires an entitycrop growing cycle usually takes approximately 3 to present separately in other comprehensive income the portion of the total change9 months in the fair valueagricultural industry, it will take approximately similar time frame of a liability resulting from a change in the instrument-specific3 to 9 months for farmers to harvest crops and to realize profits to repay us. It is very common for cooperative farms and distributors to request longer sales credit risk when the entity has elected to measure the liability at fair value in accordance with the fair value option for financial instruments; requires separate presentation of financial assets and financial liabilities by measurement category and form of financial assets on the balance sheet or the accompanying notes to the financial statements and clarifies that an entity should evaluate the need for a valuation allowance on a deferred tax asset related to available-for-sale securities in combination with the entity’s other deferred tax assets. ASU 2016-01 is effective for financial statements issued for fiscal years beginning after December 15, 2017, and interim periods within those fiscal years. The Company does not expectunder these changes to have a material impact on the Company’s consolidated financial statements.
Other accounting standards that have been issued or proposed by the FASB or other standards-setting bodies that do not require adoption until a future date are not expected to have a material impact on the Company’s consolidated financial statements upon adoption.
3. Going Concerncircumstances.
The consolidated financial statements have been prepared assuming thatCompany’s provision on allowance for doubtful accounts is based on historical collection experience, the economic environment, trends in the microbial fertilizer industry, and a review of the current status of trade accounts receivable and come up with an aging allowance method. Currently, the Company will continueprovides a provision of 1%-6% of the allowance for doubtful accounts for accounts receivable balance that are more than 180 days old but less than one year old, 50% of the allowance for doubtful accounts for accounts receivable from one to one and half years old, 100% of the allowance for doubtful accounts for accounts receivable beyond one and half years old, plus additional amount as necessary, which the Company’s collection department had determined the collection of the full amount is remote with the approval from its management to provide a going concern, which contemplates100% provision allowance for doubtful accounts. The Company’s management has continued to evaluate the realizationreasonableness of assetsthe valuation allowance policy and update it if necessary.
Accounts receivable consisted of the satisfactionfollowing:
| December 31, 2017 | December 31, 2016 | |||||||
| Accounts receivable | $ | 83,860 | $ | 1,177,994 | ||||
| Less: Allowance for doubtful debt | (55,240 | ) | (55,240 | ) | ||||
| Accounts receivable, net | $ | 28,620 | $ | 1,122,754 | ||||
4. Prepaid Expenses
Prepaid expenses consisted of liabilities in the normal coursefollowing:
| Notes | December 31, 2017 | December 31, 2016 | ||||||||||
| Prepaid office rent | $ | 41,487 | $ | 12,504 | ||||||||
| Prepaid License Fee (for fertilizer) | 26,115 | - | ||||||||||
| Prepaid government filing expense | 5,000 | 5,000 | ||||||||||
| Prepaid consulting expenses | (1) | 2,392,273 | 1,400,050 | |||||||||
| Others | 9,397 | - | ||||||||||
| Total | $ | 2,474,272 | $ | 1,417,554 | ||||||||
(1) Prepaid consulting expense for issuance of business.common stock
As of December 31, 2015,2017, the Company’s current liabilities substantially exceeded its current assets by $9,330,130.Company issued a total of 2,863,916 shares of common stock to three consulting companies for investor relation consulting services, one individual for IT service, fourteen individuals for financing service and seven individuals for the marketing consulting service in China, which represents the amount of $3,378,196 based on quoted price at issuance. Pursuant to the indemnification terms of the services agreements, the Company has the rights to demand the full services being accomplished as scheduled during the service period and to enforce the consultants to pay pro-rata penalties if the consultants do not fulfill the contract services within the services periods. As of December 31, 2017, the Company evaluated the performance of the consultants and concluded all the contracts were on schedule of delivery. The Company had no sales duringrecorded the prepaid consulting expenses totaled $1,689,896 and $1,688,300 for the years ended December 31, 20152017 and 2014, had an accumulated deficit2016, respectively, and amortized the consulting fee over the service periods per agreements based on the progress of $20,324,812services delivered. For the years ended December 31, 2017 and stockholders’ deficiency2016, the amortization of $11,100,454. These circumstances, among others, raise substantial doubt aboutconsulting expense was $697,673 and $288,250, respectively.
| F-16 |
5. Advance to suppliers
Advance to suppliers are mainly funds deposited for future raw material purchases. As common practice in China agriculture industry, many of these vendors require a certain amount to be deposited with them as a guarantee that the Company will complete its purchases on a timely basis as well as securing the current agreed upon purchase price. Since the Company anticipates the price of raw materials is on the rise in 2018, it entered large amount of purchase agreements with its major raw materials supplier, and made prepayments in advance of securing a lower purchase price and delivery on a timely basis. As of December 31, 2017 and December 31, 2016, such advance to suppliers was $12,660,793 and $ 1,880,044, respectively. As of the date of this report, we have received approximately $12.4 million raw materials from the Company’s abilitysuppliers, approximately $10.0 million were utilized into production with the remaining balance to continue as a going concern. The financial statements do not include any adjustments that might result from the outcome of this uncertainty. The financial statements also do not include any adjustments relating to the recoverability and classification of recorded asset amounts, or amounts and classifications of liabilities that might be necessary should the Company be unable to continue as a going concern.utilized in April 2018.
The company plans to rely on the proceeds from loans from both unrelated and related parties to provide the resources necessary to fund the development of our business plan and operations. The Company also plans to raise funds from domestic and foreign banks and/or financial institutions to increase working capital in order to meet capital demands.
4.6. Property, Plant and Equipment
Property, plant and equipment, net consisted of the following:
| December 31, 2015 | December 31, 2014 | |||||||
| Property, Plant and Equipment | ||||||||
| Buildings | $ | 1,308,785 | $ | 1,381,123 | ||||
| Machinery and equipment | 595,623 | 628,544 | ||||||
| Automobiles | 85,769 | 90,510 | ||||||
| Office equipment | 104,843 | 110,638 | ||||||
| Computer software | 22,304 | 23,537 | ||||||
| Property, plant and equipment - total | $ | 2,117,324 | $ | 2,234,352 | ||||
| Less: accumulated depreciation | (762,791 | ) | (800,542 | ) | ||||
| Less: impairment on long-lived assets | (1,351,726 | ) | (1,426,438 | ) | ||||
| Property, plant and equipment - net | $ | 2,807 | $ | 7,372 | ||||
The building is on a piece of land the use right of which was granted to Kiwa Bio-Tech Products (Shandong) Co., Ltd. by local government free for 10 years and then for another 20 years on a fee calculated according to Kiwa Shandong’s net profit. Since Kiwa Shandong did not generate any net profit, no fee is payable.
| December 31, 2017 | December 31, 2016 | |||||||
| Property, Plant and Equipment | ||||||||
| Office equipment | $ | 15,899 | $ | 896 | ||||
| Furniture | 23,331 | 7,838 | ||||||
| Leasehold improvement | 91,609 | 66,896 | ||||||
| Construction in progress | 26,729 | - | ||||||
| Others | 1,106 | - | ||||||
| Property, plant and equipment - total | 158,674 | 75,630 | ||||||
| Less: accumulated depreciation | (68,174 | ) | (20,311 | ) | ||||
| Property, plant and equipment - net | $ | 90,500 | $ | 55,319 | ||||
Depreciation expense was $4,352$46,491 and $4,401$ 21,246 for the years ended December 31, 20152017 and 2014,2016, respectively.
Impairment on long-lived assets was $nil7. Deposit for Long-Term Investment
On June 8, 2017, Kiwa Hebei entered an equity purchase agreement with the years endedshareholders of Yantai Peng Hao New Materials Technology Co. Ltd. (“Peng Hao”) to acquire 100% interest in Peng Hao for approximately RMB 15,000,000 (approximately US$ 2.3 million). As of December 31, 20152017, Kiwa Hebei has made deposit payment of RMB 5,000,000 (approximately $0.8 million). Due to certain administrate approval process from the Chinese government, the closing of the equity purchase agreement has been delayed. RMB 6,500,000 (approximately $1.0 million) will be paid upon completion of the land use rights ownership transfer and 2014, respectively.RMB 3,500,000 (approximately $0.5 million) will be paid upon completion of the business licenses transfer. The Company estimated the completion of the transfer will be sometimes in August 2018.
All8. Salary payable
| December 31, 2017 | December 31, 2016 | |||||||
| Ms. Yvonne Wang (“Ms. Wang”) | $ | 175,000 | $ | 91,000 | ||||
| Mr. Wei Li (“Mr. Li”) | - | 1,054,492 | ||||||
| Other Employees | 116,401 | 9,429 | ||||||
| Total | $ | 291,401 | $ | 1,154,921 | ||||
Mr. Li was the Chairman of our property, plantthe Board until November 2015 and equipment have been heldwas the Chief Executive Officer of the Company until July 2015. On December 28, 2017, the company settled the payroll liability to Mr. Li of $1,054,492 by issuing 811,148 preferred shares to Mr. Li. Ms. Wang served as collateralChairman of the Board since November 2015 and served as CEO since August 2016. No salary was paid to secure the 6% Notes (see Note 8).Ms. Wang since December 2015. The Company expects to be in negotiations with Ms. Wang to settle these obligations.
| F-17 |
5. Construction Costs Payable9. Related Party Transactions
Construction costs payable represents remaining amounts to be paid forDue from related parties – non-trade
Amounts due from related parties consisted of the first phase of construction of bio-fertilizer facility in Shandong. The balance of construction costs payablefollowing as of December 31, 20152017 and 20142016:
| Item | Nature | Notes | December 31, 2017 | December 31, 2016 | ||||||||||||
| Kangtan Gerui (Beijing) Bio-Tech Co., Ltd. (“Gerui”) | Non-trade | (1) | - | 1,522,434 | ||||||||||||
| Wei Li | Non-trade | (2) | 19,017 | |||||||||||||
| Total | $ | 19,017 | $ | 1,522,434 | ||||||||||||
(1) Gerui
Ms. Feng Li, a member of the Company’s board of directors and shareholder of the Company (Ms. Li held approximately 20% of the Company’s Common Stock and 50% of the Company’s Series A Preferred Stock), is also a 23% shareholder of Gerui. According to the agreement between the Company and Gerui, all the balances will be paid off before June 30, 2018. During the year ended December 31, 2017, the Company collected $1,522,434 from Gerui and the remaining balance was $273,722$0 as at December 31, 2017. The management has determined that no allowance for doubtful debts was necessary.
(2) Mr. Li
During the year ended December 31, 2017, Mr. Wei Li, the former chairman and $288,851, respectively.CEO, founder and major shareholder of the Company, obtained cash advance from the Company for operational purpose. The balance was repaid in March 2018.
6. Related Party Transactions
Due to related parties
Amounts due to related parties consisted of the following as of December 31, 20152017 and 2014:2016:
| Item | Nature | Notes | December 31, 2017 | December 31, 2016 | ||||||||||||
| Ms. Yvonne Wang (“Ms. Wang”) | Non-trade | (1) | 320,199 | 100,798 | ||||||||||||
| CAAS IARRP and IAED Institutes | Trade | (2) | - | 160,461 | ||||||||||||
| Total amount due to related parties | $ | 320,199 | $ | 261,259 | ||||||||||||
(1) Ms. Wang
| Item | Nature | Notes | December 31, 2015 | December 31, 2014 | ||||||||
| Mr. Wei Li (“Mr. Li”) | Non-trade | (1) | $ | 2,879,307 | $ | 3,553,939 | ||||||
| Kangtai Xinnong Agriculture Tech (Beijing) Co., Ltd. (“Kangtai”) | Non-trade | (2) | (12,173 | ) | (13,624 | ) | ||||||
| Ms. Yvonne Wang (“Ms. Wang”) | Non-trade | (3) | 299,064 | 650,000 | ||||||||
| Subtotal | 3,166,198 | 4,190,315 | ||||||||||
| Kiwa-CAU R&D Center | Trade | (4) | 1,125,553 | 1,025,057 | ||||||||
| CAAS IARRP and IAED Institutes | Trade | (5) | 18,425 | - | ||||||||
| Subtotal | 1,143,978 | 1,025,057 | ||||||||||
| Total | $ | 4,310,176 | $ | 5,215,372 | ||||||||
(1) Mr. Li
Mr. Li was the Chairman of the Board until November 20, 2015 and was the Chief Executive Officer of the Company until July 1, 2015.
Advances and Loans
As of December 31, 2014, the balance due to Mr. Li for advances made was $3,553,939. On December 14, 2015, Mr. Li assigned $500,000 of obligation owed by the Company to his daughter, Feng Li. On the same day, Feng Li subscribed for the purchase of 250,000 shares of preferred stock for the aggregate amount of $500,000, and agreed to the concurrent cancellation of debt owed by the Company. As of December 31, 2015, the balance due to Mr. Li was $2,879,307. Mr. Li has agreed that the Company may repay the balance when its cash flow circumstance allows.
On March 24, 2016, the Company issued 2,900,000 shares of common stock to Mr. Li to repay the loan.
Guarantees for the Company
Mr. Li has pledged without any compensation from the Company all of his common stock of the Company as collateral for the Company’s obligations under the 6% Notes (see Note 8).
(2) Kangtai
Kangtai, formerly named China Star Investment Management Co., Ltd., Kangtai International Logistics (Beijing) Co., Ltd., is a private company, 64% owned by Mr. Li. Mr. Li is the Chairman of Kangtai.
On December 31, 2014, the amount due from Kangtai was $13,624. The balance due from Kangtai on December 31, 2015 was $12,173.
(3) Ms. Wang
Ms. Wang is the Secretary of the Company until November 20, 2015. Effective as of November 20, 2015, the Company appointed Ms. Wang as the Chairman of the Board. Effective asBoard and effective August 11, 2016, the Company’s Board of December 15, 2015, the Company appointedDirectors has assigned Ms. Wang as the Company’sadditional titles of Acting President, Acting Chief OperatingExecutive Officer and Acting Chief Financial Officer.
OnDuring the years ended December 31, 2014, the amount due to Ms. Wang was $650,000. During the fiscal 2015,2017 and 2016, Ms. Wang paid various expenses on behalf of the Company. On December 14, 2015, Ms. Wang subscribed for the purchase of 250,000 shares of preferred stock for the aggregate amount of $500,000, and agrees to the concurrent cancellation of debt owed by the Company. As of December 31, 2015,2017 and 2016, the amount due to Ms. Wang was $299,064. Ms. Wang has agreed that the Company may repay the balance when its cash flow circumstance allows.$320,199 and $100,798, respectively.
On March 24, 2016, the Company issued 240,000 shares of common stock to Ms Wang to pay off the loan balance of $240,000.
(4) Kiwa-CAU R&D Center
In November 2006, Kiwa and China Agricultural University (the “CAU”) agreed to jointly establish a new research and development center, named Kiwa-CAU R&D Center. The term of the agreement was ten years commencing July 1, 2006.
(5)(2) CAAS IARRP and IAED Institutes
On November 5, 2015, the Company signed a strategic cooperation agreement (the “Agreement”) with China Academy of Agricultural Science (“CAAS”)’s Institute of Agricultural Resources & Regional Planning (“IARRP”) and Institute of Agricultural Economy & Development (“IAED”). The term of the Agreement was three years commencingthat began on November 20, 2015.2015 and ends on November 19, 2018.
Pursuant to the agreement, Kiwa agree to invest RMB 1 million (approximately $160,000) each year to the Spatial Agriculture Planning Method & Applications Innovation Team that belongs to the Institutes. Professor Yong Chang Wu, the authorized representative of CAAS IARRP, is also one of the Company’s directors effective since November 20, 2015 until March 13, 2017.
During
The Company recorded $147,992 and $149,176 research and development expenses related to the institutes, for the years ended December 31, 20152017 and 2014, $178,988 and $162,715 was charged to research and development expenses under the agreements with Kiwa-CAU R&D Center and two institutes of CAAS. 2016, respectively.
The Company paid nil to Kiwa-CAU R&D Center and nilamount due to CAAS institutes inIARRP and IAED Institutes was reclassified to other payables and accruals at September 30, 2017 since Professor Yong Chang Wu is no longer the year 2015 and 2014.Company’s director from March 13, 2017. See note 12.
7. Unsecured Loans10. Convertible Notes Payable
Unsecured loansConvertible notes payable consisted of the following:
| Item | December 31, 2015 | December 31, 2014 | ||||||
| Unsecured loan payable to Zoucheng Municipal Government, non-interest bearing, becoming due within three years from Kiwa Shandong’s first profitable year on a formula basis, interest has not been imputed due to the undeterminable repayment date | $ | 1,387,668 | $ | 1,464,367 | ||||
| Unsecured loan payable to Zoucheng Science & Technology Bureau, non-interest bearing, it is due in Kiwa Shandong’s first profitable year, interest has not been imputed due to the undeterminable repayment date | 385,463 | 406,769 | ||||||
| Total | $ | 1,773,131 | $ | 1,871,136 | ||||
| December 31, 2017 | December 31, 2016 | |||||||
| 6% secured convertible notes – FirsTrust Group Inc. (1) | $ | 121,562 | $ | 150,250 | ||||
| 15% convertible notes- Mr. Geng Liu (1) | 153,615 | - | ||||||
| 15% convertible notes- Mr. Junwei Zheng (2) | 844,881 | - | ||||||
| Less: notes discount | (386,776 | ) | - | |||||
| Convertible notes payable - total | 733,282 | 150,250 | ||||||
| Non-current | (460,082 | ) | - | |||||
| Current | $ | 273,200 | $ | 150,250 | ||||
The Company qualifies for non-interest bearing loans under a Chinese government sponsored program to encourage economic development in certain industries and locations in China. To qualify for the favorable loan terms, a company must meet the following criteria: (1) be a technology company with innovative technology or product (as determined by the Science Bureau of the central Chinese government); (2) operate in specific industries that the Chinese government has determined are important to encourage development, such as agriculture, environmental, education, and others; and (3) be located in an undeveloped area such as Zoucheng, Shandong Province, where the manufacturing facility of the Company is located.
According to the Company’s project agreement, Zoucheng Municipal Government granted the Company use of at least 15.7 acres in Shandong Province, China at no cost for 10 years to construct a manufacturing facility. Under the agreement, the Company has the option to pay a fee of RMB 480,000 ($77,100) per acre for the land use right after the 10-year period until May 2012. The Company may not transfer or pledge the temporary land use right. The Company also committed to invest approximately $18 million to $24 million for developing the manufacturing and research facilities in Zoucheng, Shandong Province. As of December 31, 2015, the Company invested approximately $2 million for the property, plant and equipment of the project and these assets were impaired as of December 31, 2015.
8. Convertible Notes Payable - Current
Convertible notes payable - current consists of $121,562 of 6% secured convertible notes issued to FirsTrust Group Inc. on June 29, 2006. The2006 and $151,638 (face amount $153,615 net of discount of $1,977) of 15% convertible note issued to Mr. Geng Liu on January 17, 2017.
6% secured convertible notes beard interest at 6% and were due on– FirsTrust Group Inc.
On June 29, 2009. Once2006, the noteCompany entered into a securities purchase agreement (the “Purchase Agreement”) with six institutional investors (collectively, the “Purchasers”) for the issuance and sale of 6% secured convertible notes, due three years from the date of issuance, in the aggregate principal amount of $2,450,000 (the “6% Convertible Notes”), convertible into shares of the Company’s common stock.
On August 12, 2013, the Company, entered into a Settlement Agreement and Release (the “Release”) with the holders (the “Holders”) of the “6% Convertible Notes” in the aggregate principal amount of $2,000,000. Pursuant to the terms of the Release, the Company paid the Holders $75,000 for a full release, including the forgiveness of past defaults of unpaid principal amounts, interests and penalties. During the course of the time, certain notes had been converted as well. On March 18, 2008, FirsTrust Group, Inc. (“FirsTrust”) purchased the three remaining 6% Convertible Notes, totaling $168,000 ($59,100, $50,400 and $59,100 respectively), from Nite Capital, one of the six institutional investors which purchased a total of $300,000 of the Note in three tranches ($105,000, $90,000, $105,000 respectively), for a cash payment of $100,000. After the Release and conversion, FirsTrust is passthe only holder of the outstanding 6% Convertible Note with outstanding principal amount of $150,250.
On June 29, 2009, the 6% Notes were due. The Company informed the Purchasers of its inability to repay the outstanding balance on the due date. Therefore, the 6% Notes are in default and the default interest rate increased toof 15% per annum. Theannum is being charged on the 6% Notes.
On October 19, 2017, the Company accrued $22,538 and $22,538 interest expenseissued total 14,151 common shares at $1.04 per share price to FirsTrust Group, Inc. for the conversion of convertible note. According to the convertible note agreement, the conversion price is based on a 40% discount to the average of the lowest three days trading price of the Company’s common stock on the OTC Bulletin Board over a 20-day trading period per the convertible notes agreement. As the carrying value of the notes and the intrinsic value of that conversion feature equaled to the fair value of the 14,151 common shares at $2.25 per share, no gain or loss were recognized upon this conversion.
| F-19 |
On December 13, 2017, the Company issued total 105,095 common shares at $0.75 per share price to FirsTrust Group, Inc. for the years ended December 31, 2015conversion of convertible note. According to the convertible note agreement, the conversion price is based on a 40% discount to the average of the lowest three days trading price of the Company’s common stock on the OTC Bulletin Board over a 20-day trading period per the convertible notes agreement. As the carrying value of the notes and 2014, respectively.the intrinsic value of that conversion feature equaled to the fair value of the 105,095 common shares at $2.3 per share, no gain or loss were recognized upon this conversion.
The conversion price of the 6% Notes is based on a 40% discount to the average of the lowest three days trading price of the Company’s common stock on the OTC Bulletin Board over a 20-day trading period. The conversion price is also adjusted for certain subsequent issuances of equity securities of the Company at prices below the conversion price then in effect. The 6% Notes contain a volume limitation that prohibits the holder from further converting the 6% Notes if doing so would cause the holder and its affiliates to hold more than 4.99% of the Company’s outstanding common stock. In addition, the holder of the 6% Notes agrees that they may not convert more than their pro-rata share (based on original principal amount) of the greater of $120,000 principal amount of the 6% Notes per calendar month or the average daily dollar volume calculated during the 10 business days prior to a conversion, per conversion. This conversion limit has since been eliminated pursuant to an agreement by the Company and the Purchasers.
The Company has elected to early adopt the guidance in ASU 2017-11. As a result, the Company has concluded that the conversion feature of the Notes is indexed to its own stock and would be classified and recorded as equity. The Company retrospectively applied the guidance to the above Notes and determined that the impact of the conversion feature for the above Notes is immaterial.
The Company also incurs a financial penaltyliquidated damages in cash or shares at the option of the Company (equal to 2% of the outstanding amount of the Notes per month plus accrued and unpaid interest on the Notes, prorated for partial months) if it breaches this or otherany affirmative covenants in the Purchase Agreement, including a covenant to maintain a sufficient number of authorized shares under its Certificate of Incorporation to cover at least 110% of the stock issuable upon full conversion of the Notes .Notes. Pursuant to the relevant provisions for liquidated damages in the Purchase Agreement, the Company has accrued the penaltyamounts of $72,152$81,930 and $66,602$77,575 for liquidated damages for the years ended December 31, 20152017 and 2014,2016, respectively.
The 6% Notes requireCompany also accrued $21,897 and $22,977 for interest at the Company to procurerate of 15% per annum for the Purchaser’s consent prior to taking certain actions including the payment of dividends, repurchasing stock, incurring debt, guaranteeing obligations, merging or restructuring the Company, or selling significant assets.years ended December 31, 2017 and 2016, respectively. The total 15% interest accrued was $182,858 and $183,361 at December 31, 2017 and 2016, respectively. The total accrued liquidated damages were $522,257 and $482,327 at December 31, 2017 and 2016, respectively.
The Company’s obligations under the 6% Notes are secured by a first priority security interest in the Company’s intellectual property pursuant to an Intellectual Property Security Agreement with the Purchasers, and by a first priority security interest in all of the Company’s other assets pursuant to a Security Agreement with the Purchasers.Holders. In addition, Mr. Li, the Company’s former Chief Executive Officer, until July 1, 2015, has pledged all of his common stock of the Company as collateral for the Company’s obligations under the 6% Convertible Notes.
15% convertible notes- Mr. Geng Liu
On January 17, 2017, the Company entered a Convertible Note Agreement with Mr. Geng Liu with principal of RMB 3 million. The intellectual property pledged hadnote bears interest at 15% per annum and will mature on January 16, 2018. Before the maturity date, the Note holder has an option to convert partial or all of the outstanding principal to the Company’s common shares with a costconversion price of $592,901$0.90 per share. In January 2018, the Company has an oral agreement with Mr. Geng Liu that the maturity date will be extended and the Company is in the process of formalizing the term of the extension with Mr. Geng Liu before executing a written extension agreement.
As of December 31, 2017, the Company has received partial principal totaled RMB 1 million ($153,615 equivalent USD at December 31, 2017).
The notes are convertible into shares of the common stock, at conversion price is $0.90 which carryingis lower than the price of the Company’s common stock on the date of issue. Therefore, the conversion feature embedded in the convertible note meet the definition of beneficial conversion feature (“BCF”). The Company evaluated the intrinsic value of $179,897the BCF as $45,094 at the issue date. The relative fair values of the BCF were recorded into additional paid in capital, and the remainder proceeds of $99,850 from issuance of the convertible note was fully impaired duringallocated to convertible notes payable.
| F-20 |
For the year ended December 31, 2009.2017, the Company recorded interest expense of $43,117 on the note, including the amortization of the debt discount resulting from the value of beneficial conversion feature, and the carrying value of the note as at December 31, 2017 was $151,638.
(2) Convertible Notes Payable - Non-current and derivative liabilities
Convertible notes payable – non-current consists $844,881 of 15% convertible note issued to Mr. Junwei Zheng on May 9, 2017.
15% convertible notes- Mr. Junwei Zheng
On May 9, 2017, the Company entered a Convertible Note Agreement with Mr. Junwei Zheng with principal of RMB 30 million. The note bears interest at 15% per annum and will mature on May 8, 2019. Before the maturity date, the Note holder has an option to convert partial or all of the outstanding principal and accrued interest to the Company’s common shares with a conversion price of $3.5 per share. As of September 30, 2017, the Company has received partial principal totaled RMB 5.5 million ($844,881 equivalent USD at December 31, 2017) out of the RMB 30 million Convertible Note Agreement.
The notes are convertible into shares of the common stock, at conversion price is $3.5 which is higher than the price of the Company’s common stock on the date of issue, therefore the conversion feature embedded in the note did not meet the definition of BCF. The Company determined that conversion option embedded in the note meet the definition of a derivative instrument. Since the embedded conversion price of the conversion feature is denominated in U.S. dollar, a currency other than the convertible note payable currency. As a result, the embedded conversion feature is not considered indexed to the Company’s own stock due to the variable exchange rate between U.S. Dollar and RMB, and as such, the Company determined that the embedded conversion feature to be carried as a liability and remeasured at fair value at each financial reporting date until such time as the conversion feature is exercised or expired. The Company evaluated the fair value of the embedded conversion feature at the issue date and recorded the amount into as discount to convertible note payable. The discount to convertible note payable is being amortized to interest expense over the life of the note using the straight-line method, which approximates the effective interest method.
The fair value of embedded conversion feature were calculated using the BlackScholesMerton model based on the following variables at inception on May 9, 2017:
| ● | Strike price of $3.5, for the conversion options | |
| ● | Expected volatility of 260.8% calculated using the Company’s historical price of its common stock | |
| ● | Expected dividend yield of 0% | |
| ● | Risk-free interest rate of 1.37%, for the conversion options | |
| ● | Expected lives of 2.0 years | |
| ● | Market price at issuance date of $2.7 |
The fair value of embedded conversion feature were calculated using the BlackScholesMerton model based on the following variables on December 31, 2017:
| ● | Strike price of $3.5, for the conversion options | |
| ● | Expected volatility of 151.9% calculated using the Company’s historical price of its common stock | |
| ● | Expected dividend yield of 0% | |
| ● | Risk-free interest rate of 1.80%, for the conversion options | |
| ● | Expected lives of 1.33 years | |
| ● | Market price at remeasurement date of $2.0 |
| F-21 |
9.
On May 9, 2017, the Company recorded $569,784 as derivative liability for fair value of the conversion option. The initial carrying value of the Notes was $227,051. On December 31, 2017, the fair value of derivative liabilities was recalculated at $247,933. For the year ended December 31, 2017, the Company recognized a gain of $321,851, in change in fair value of derivative liabilities.
For the year ended December 31, 2017, the Company recorded interest expense of $184,985 on the note, including the amortization of the debt discount resulting from the value of the embedded conversion feature, and the carrying value of the note as of December 31, 2017 was $460,082.
11. Note payable
On May 29, 2007, the Company issued a $360,000 promissory note (the “Promissory Note”) to an unrelated individual.individual (the “Original Note holder”). This note bears interest at 18% per annum and was due on July 27, 2007. This note is currently in default and bears interest of 25% per annum (the “Default rate”) until paid in full. This note is secured by a pledge of 6,178,336 (post-reverse split 30,892) shares of the Company’s common stock owned by Investlink (China) Limited a British Virgin Island corporation.(the “Pledged Shares”). The Company accrued $90,000 and $90,000 interest expense on note payable for the years ended December 31, 20152017 and 2014,2016, respectively.
As of December 31, 2016, the Original Note holder informed the Company that all right, title and interests in the Promissory Note has been assigned and transferred to FirsTrust. As of December 31, 2017, all of $360,000 of Promissory Note to FirsTrust is still outstanding, and total accrued interest of the Promissory Note is $ 949,300. The Company has begun preliminary discussion with FirsTrust with regard to a potential settlement of the Note, but no agreement has been reached yet.
12. Other payable and accruals
Other payable consisted of the following:
| Notes | December 31, 2017 | December 31, 2016 | ||||||||||
| Stock subscription proceeds received in advance | (1) | $ | 1,718,642 | $ | 460,617 | |||||||
| Investment received in advance | (2) | - | 79,168 | |||||||||
| Accrued expenses | 36,240 | 385,090 | ||||||||||
| R&D expense payable | 309,555 | - | ||||||||||
| Others | 44,436 | - | ||||||||||
| $ | 2,108,873 | $ | 924,875 | |||||||||
(1). The Company received $460,617 (RMB 3.2 million, revalued as $491,567 as at December 31, 2017) in 2016 from two unrelated potential investors, and additionally received $1,227,075 (RMB 8 million) in 2017 from three unrelated potential investors pending for stock issuances. The Company is in the process of negotiating the issuance price per shares of these stock subscriptions with the investors.
(2). The Company received the investment funds in advance in 2016 from Mr. Geng Liu, which amount was approximately $79,168. Subsequently on January 17, 2017, the Company entered a Convertible Note Agreement with Mr. Geng. The note bears interest at 15% per annum and will mature on January 16, 2018. See Note 10.
| F-22 |
13. Stockholders’ deficiencyEquity (Deficiency)
Preferred stock
On December 14, 2015, the Company issued 500,000 shares of preferred stock series A for the aggregate amount of $1,000,000 as debt cancellation owed to two related party individuals (see Note 6).individuals.
11. Stock-based CompensationThese shares of Series A Preferred Stock shall have voting rights equal to aggregate of 75% of total shares entitled to vote by both (i) the holders of all of the then outstanding shares of Common Stock (whether or not such holders vote) and (ii) the holders of all of the then outstanding shares of the Company. The holders of preferred stock are entitled to receive noncumulative dividends, when and if declared by the board of directors. Dividends are not mandatory and shall not accrue. The Company shall have the right to redeem the Series A Preferred Stock, plus any accrued and unpaid dividends at a cash redemption price equal to the aggregate issuance price of $2.0 per share.
On December 12, 2006,28, 2017, the Company granted optionsissued 811,148 shares of preferred stock series B for 2,000,000the aggregate amount of $1,054,492 as debt cancellation owed to one related party individual.
These shares (10,000 post-reverse split shares)of Series B Preferred Stock has a liquidation preference which is same with the Company’s Series A Preferred Stock, and is entitled to vote on an as-converted basis as the holder of common stock, and is convertible into the Company’s common stock on a one-for-one basis at any time at the option of the holder. The holders of preferred stock are entitled to receive noncumulative dividends, when and if declared by the board of directors. Dividends are not mandatory and shall not accrue. The Company shall have the right to redeem the Series B Preferred Stock, plus any accrued and unpaid dividends at a cash redemption price equal to the aggregate issuance price of $1.3 per share.
Reverse Split
On January 14, 2016, the Company filed a Certificate of Amendment of its commonCertificate of Incorporation with the State of Delaware with reference to a 1-for-200 reverse stock undersplit with respect to its 2004Common Stock Incentive Plan. Summarywith effective date of options issuedJanuary 28, 2016. In connection with the reverse split, the Company’s authorized capital was amended to be 120,000,000 shares, comprising 100,000,000 shares of Common Stock par value $0.001 and outstanding at December 31, 201520,000,000 shares of Preferred Stock par value $0.001. All relevant information relating to numbers of shares and 2014 andper share information have been retrospectively adjusted to reflect the movements during the years then ended are as follows:reverse stock split for all periods presented.
Common stock
| Number of underlying shares | Weighted- Average Exercise Price Per Share | Aggregate Intrinsic Value (1) | Weighted- Average Contractual Life Remaining in Years | |||||||||||||
| Outstanding at December 31, 2013 | 6,163 | $ | 35 | $ | - | 3 | ||||||||||
| Exercised | - | - | - | |||||||||||||
| Expired | - | - | - | |||||||||||||
| Forfeited | - | - | - | |||||||||||||
| Outstanding at December 31, 2014 | 6,163 | $ | 35 | $ | - | 2 | ||||||||||
| Exercised | - | - | - | |||||||||||||
| Expired | - | - | - | |||||||||||||
| Forfeited | - | - | - | |||||||||||||
| Outstanding at December 31, 2015 | 6,163 | $ | 35 | $ | - | 1 | ||||||||||
| Exercisable at December 31, 2015 | 6,163 | $ | 35 | $ | - | 1 | ||||||||||
During the year ended December 31, 2017, the Company received $516,924 of stock subscription receivable in relation to the issuance of our common stock in 2016.
During the year ended December 31, 2017, the Company issued 4,252,900 common shares to nine individuals residing in China for net proceeds of $5,534,654.
On June 30, 2017, the Company issued 97,850 common shares to ten employees for cash at $1.95 per share for an aggregate price to $190,807. The difference $102,743 based on the calculation between stock price and employee purchase price was recognized as expense of employee benefits and accordingly, credited the same amount to APIC.
During the year ended December 31, 2017, the Company entered into nineteen consulting agreements and issued 2,003,988 shares of common stocks to consultants for financing, IT, and business development services based on market price of the shares at the transaction dates. The valuation of the shares are amounted to an average issuance price of $1.56 per share.
Conversion of convertible note
As disclosed in Note 11(1), on October 19, 2017, the Company issued total 14,151 common shares at $1.04 per share price to FirsTrust Group, Inc. for the conversion of convertible note. According to the convertible note agreement, the conversion price is based on a 40% discount to the average of the lowest three days trading price of the Company’s common stock on the OTC Bulletin Board over a 20-day trading period per the convertible notes agreement.
As disclosed in Note 11(1), on December 13, 2017, the Company issued total 105,095 common shares at $0.75 per share price to FirsTrust Group, Inc. for the conversion of convertible note. According to the convertible note agreement, the conversion price is based on a 40% discount to the average of the lowest three days trading price of the Company’s common stock on the OTC Bulletin Board over a 20-day trading period per the convertible notes agreement.
Additional paid-in-capital
As disclosed in Note 10(1), on January 17, 2017, the Company issued RMB 1 million ($144,944 equivalent). Convertible Note to Mr. Geng Liu with BCF embedded. The Company evaluated the intrinsic value of the BCF as $45,094 at the issue date and recorded the amount into additional paid in capital. All other amounts recorded in additional paid in capital are derived from issuance of preferred shares or common shares as disclosed in the above.
14. Stock-based Compensation
On March 15, 2017, the Board of Directors approved a new stock option plan with ten years’ term. As of December 31, 2017, the Company has not granted any incentive compensation under this plan.
15. Fair Value Measurements
The following table sets forth by level within the fair value hierarchy the Company’s financial assets and liabilities recorded at fair value on recurring basis that were accounted for at fair value as of:
December 31, 2017
| Recurring Fair Value Measures | Level 1 | Level 2 | Level 3 | Total | ||||||||||||
| Derivative liabilities | — | — | $ | 247,933 | $ | 247,933 | ||||||||||
| Total | — | — | $ | 247,933 | $ | 247,933 | ||||||||||
The following is a reconciliation of the beginning and ending balance of the assets and liabilities measured at fair value on a recurring basis for the years ended December 31, 2017 and 2016:
| Year ended December 31, 2017 | Year ended December 31, 2016 | |||||||
| Beginning balance | $ | - | $ | - | ||||
| Fair value of derivative liabilities at inception | 569,784 | - | ||||||
| Change in fair value of derivative liabilities | (321,851 | ) | - | |||||
| Ending balance | $ | 247,933 | $ | - | ||||
16. Income Tax
In accordance with the current tax laws in the U.S., the Company is subject to a corporate tax rate of 34% on its taxable income. No provision for taxes is made for U.S. income tax for the years ended December 31, 2017 and 2016 as it has no taxable income in the U.S.
On December 22, 2017, the “Tax Cuts and Jobs Act” (“The 2017 Tax Act”) was enacted in the United States. Under the provisions of the Act, the U.S. corporate tax rate decreased from 34% to 21%. Accordingly, we have remeasured our deferred tax assets on net operating loss carryforwards in the U.S at the lower enacted cooperated tax rate of 21%. However, this remeasurment has no effect on the Company’s income tax expenses as the Company has provided a 100% valuation allowance on its deferred tax assets previously.
Additionally, the 2017 Tax Act implemented a modified territorial tax system and imposing a tax on previously untaxed accumulated earnings and profits (“E&P”) of foreign subsidiaries (the “Toll Charge”). The Toll Charge is based in part on the amount of E&P held in cash and other specific assets as of December 31, 2017. The Toll Charge can be paid over an eight-year period, starting in 2018, and will not accrue interest. The 2017 Tax Act also imposed a global intangible low-taxed income tax (“GILTI”), which is a new tax on certain off-shore earnings at an effective rate of 10.5% for tax years beginning after December 31, 2017 (increasing to 13.125% for tax years beginning after December 31, 2025) with a partial offset for foreign tax credits. As a fiscal-year taxpayer, certain provisions of the 2017 Tax Act may impact the Company in fiscal 2018, including the Toll Charge, while other provisions, including the GILTI, will be effective starting at the beginning of fiscal 2018.
| F-24 |
On December 22, 2017, the Securities and Exchange Commission Staff issued Accounting Bulletin No. 118, Income Tax Accounting Implications of the Tax Cuts and Jobs Act (“SAB 118”), which provides guidance on accounting for the tax effects of the 2017 Tax Act. SAB 118 provides a measurement period that extends beyond one year from the 2017 Tax Act’s enactment date for registrants to complete the accounting under ASC 740. In accordance with SAB 118, a registrant must reflect the income tax effects of those aspects of the 2017 Tax Act for which the accounting under ASC 740 is complete. To the extent that a registrant’s accounting for certain income tax effects of the 2017 Tax Act is incomplete, but the registrant is able to determine a reasonable estimate, the registrant must record a provisional estimate to be included in its financial statements. If a registrant is unable to determine a reasonable estimate and record a provisional estimate, the registrant should continue to apply ASC 740 on the basis of the provision of the tax laws that were in effect immediately before the enactment of the 2017 Tax Act.
The Company has adopted ASC Topic 718 effectivedetermined that this one-time Toll Charge has no effect on the Company’s income tax expenses as of January 1, 2006. The fair value of the options granted at the grant date was determined to be $320,154 (approximately $0.16 per share), calculated pursuant to the Black-Scholes option pricing model. The calculated fair value is recognized as expense over the applicable vesting periods, using the straight-line attribution method. Unamortized fair value of stock options granted to those who separated from the Company has been chargedno undistributed foreign earnings prior to expense, whileDecember 31, 2017 which the options returned toCompany has cumulative foreign losses as of December 31, 2017.
The Company is in the Company. Duringprocess of evaluating the yearsimpact of GILTI for the year ended December 31, 20152018, which the Company believes that it will be imposed a minimum tax rate of 10.5% and 2014, $nil was charged to expense.
12. Income Taxthe extent foreign tax credits are available to reduce its US corporate tax, which may result in no additional US federal income tax being due.
In accordance with the current tax laws in China, Kiwa Shandong, Kiwa Beijing, Kiwa Shenzhen, Kiwa Xian, and Kiwa Hebei is subject to a corporate income tax rate of 25% on its taxable income. However, Kiwa Shandong has not provided for any corporate income taxes since it had no taxable income for the years ended December 31, 20152017 and 2014.
No provision2016. Kiwa Shenzhen, Kiwa Xian and Kiwa Hebei has not provided for other overseasany corporate income taxes is made as the Company hassince it had no taxable income infor the U.S. years ended December 31, 2017. For the year ended December 31, 2017, Kiwa Beijing recorded income tax provision for RMB 7,458,324 or approximately $1,103,595.
In accordance with the relevant tax laws in the British Virgin Islands, Kiwa BVI, as an International Business Company, is exempt from income taxes.
A reconciliation of the provision for income taxes from continuing operation determined at the local income tax rate to the Company’s effective income tax rate is as follows:
| Years ended December 31, | ||||||||
| 2017 | 2016 | |||||||
| Pre-tax income (loss) from continuing operation | $ | 1,917,018 | $ | 1,466,412 | ||||
| U.S. federal corporate income tax rate | 34 | % | 34 | % | ||||
| Income tax expense (benefit) computed at U.S. federal corporation income tax rate | 651,786 | 498,580 | ||||||
| Reconciling items: | ||||||||
| Rate differential for PRC earnings | (284,448 | ) | (152,968 | ) | ||||
| Change of valuation allowance | 707,416 | 275,767 | ||||||
| Effect of tax exempted income in BVI | 28,560 | (196,468 | ) | |||||
| Effective tax expenses (benefits) | $ | 1,103,314 | $ | 424,911 | ||||
| F-25 |
| Years ended December 31, | ||||||||
| 2015 | 2014 (Restated) | |||||||
| Pre-tax loss | $ | (677,358 | ) | $ | (707,556 | ) | ||
| U.S. federal corporate income tax rate | 34 | % | 34 | % | ||||
| Income tax computed at U.S. federal corporate income tax rate | (230,302 | ) | (240,569 | ) | ||||
| Reconciling items: | ||||||||
| Rate differential for PRC earnings | 22,439 | 29,775 | ||||||
| Change of valuation allowance | 171,993 | 169,994 | ||||||
| Non-deductible expenses | 35,870 | 40,800 | ||||||
| Effective tax expense | $ | - | $ | - | ||||
The Company had deferred tax assets from continuing operation as follows:
| December 31, 2015 | December 31, 2014 (Restated) | |||||||
| Net operating losses carried forward | $ | 3,398,402 | $ | 3,520,951 | ||||
| Less: Valuation allowance | (3,398,402 | ) | (3,520,951 | ) | ||||
| Net deferred tax assets | $ | - | $ | - | ||||
| December 31, 2017 | December 31, 2016 | |||||||
| Net operating losses carried forward by parent Company in the US | $ | 1,746,802 | $ | 2,555,064 | ||||
| Net operating losses carried forward by China Subsidiaries except for Kiwa Beijing | 311,925 | - | ||||||
| Less: Valuation allowance | (2,058,727 | ) | (2,555,064 | ) | ||||
| Net deferred tax assets | $ | - | $ | - | ||||
As of December 31, 20152017 and 2014,December 31, 2016, the Company had approximately $8$9.5 million and $8$7.5 million net operating loss carryforwards available to reduce future taxable income. Net operating loss of the parent Company could be carried forward and taken against any taxable income for a period of not more than twenty years from the year of the initial loss pursuant to Section 172 of the Internal Revenue Code of 1986, as amended. The net operating loss of Kiwa ShandongShenzhen could be carried forward for a period of not more than five years from the year of the initial loss pursuant to relevant PRC tax laws and regulations. It is more likely than not that the deferred tax assets cannot be utilized in the future because there will not be significant future earnings from the entity which generated the net operating loss. Therefore, the Company recorded a full valuation allowance on its deferred tax assets.
As of December 31, 20152017 and 2014,December 31, 2016, the Company has no material unrecognized tax benefits which would favorably affect the effective income tax rate in future periods and does not believe that there will be any significant increases or decreases of unrecognized tax benefits within the next twelve months. No interest or penalties relating to income tax matters have been imposed on the Company during the two years ended December 31, 20152017 and 2014,December 31, 2016, and no provision for interest and penalties is deemed necessary as of December 31, 20152017 and 2014.December 31, 2016.
According to the PRC Tax Administration and Collection Law, the statute of limitations is three years if the underpayment of taxes is due to computational errors made by the taxpayer or its withholding agent. The statute of limitations extends to five years under special circumstances, which are not clearly defined. In the case of a related party transaction, the statute of limitation is ten years. There is no statute of limitation in the case of tax evasion.
13.17. Commitments and Contingencies
The Company has the following material contractual obligations:
(1)Operation of Kiwa-CAU R&D Center
Pursuant to the agreement on joint incorporation of the research and development center between CAU and Kiwa Shandong dated November 14, 2006, Kiwa Shandong agrees to invest RMB 1 million (approximately $160,000) each year to fund research at the R&D Center. The term of this agreement is ten years starting from July 1, 2006. Prof. Qi Wang, who became one of our directors in July 2007, has acted as the Director of Kiwa-CAU R&D Center since July 2006.
(2)Investment in manufacturing and research facilities in Zoucheng,Penglai City, Shandong Province in China
AccordingAs disclosed in Note 7, on June 8, 2017, Kiwa Hebei entered an equity purchase agreement with the shareholders of Yantai Peng Hao New Materials Technology Co. Ltd. (“Peng Hao”) to the Project Agreement with Zoucheng Municipal Governmentacquire 100% interest in 2002, we have committed to investingPeng Hao for approximately $18 million to $24 million for developing the manufacturing and research facilities in Zoucheng, Shandong Province.RMB 15,000,000 (approximately US$ 2.3 million). As of December 31, 2015, we had invested approximately $1.91 million for2017, Kiwa Hebei has made deposit payment of RMB 5,000,000 (approximately $0.8 million) and is committed to pay the project.remaining RMB10,000,000 based on the payment milestone in the equity purchase agreement. RMB 6,500,000 (approximately $1.0 million) will be paid upon completion of the land use rights ownership transfer and RMB 3,500,000 (approximately $0.5 million) will be paid upon completion of the business licenses transfer.
(3)(2) Strategic cooperation with twothe institutes in China
On November 5, 2015, the Company signed a strategic cooperation agreement (the “Agreement”) with China Academy of Agricultural Science (“CAAS”)’s Institute of Agricultural Resources & Regional Planning (“IARRP”) and Institute of Agricultural Economy & Development (“IAED”). Pursuant to the Agreement, the Company will form a strategic partnership with the two institutes and establish an “International Cooperation Platform for Internet and Safe Agricultural Products”. To fund the cooperation platform’s R&D activities, the Company will provide RMB 1 million (approximately $160,000) per year to the Spatial Agriculture Planning Method & Applications Innovation Team that belongs to the Institutes. The term of the Agreement is for three years beginning November 20, 2015. Prof. Yong Chang Wu,2015 and will expire on November 19, 2018. However, the authorized representative of IARRP, CAAS,Company is also oneonly liable for the annual funds to be provided to the extent of the Company’s directors effective since November 20, 2015.contract obligations performed by CAAS IARRP and IAED, and the agreement is terminable before the three years’ commitment date based on negotiations of both parties.
(4)Acquisition of Caber Holdings LTD in China
| F-26 |
(3) Lease payments
On November 30, 2015, weThe Company entered into an acquisition agreement (the “Agreement”) withvarious lease agreements for business purpose. The future lease payments at December 31, 2017 are summarized below:
| 2018 | $ | 314,196 | ||
| 2019 | $ | 125,891 | ||
| 2020 | $ | 11,188 | ||
| Thereafter | $ | 2,304 | ||
| Total minimum lease payment | 453,579 |
18. Concentration of Risk
Credit risk
Financial instruments that potentially subject the shareholdersCompany to significant concentrations of Caber Holdings LTD, whose Chinese name is Hong Kong Baina Group Co., Ltd, located in Hong Kong (“Baina Hong Kong”),credit risk consist primarily of cash and Oriental Baina Co. Ltd. (hereinafter referred to as “Baina Beijing”), Baina Hong Kong’s wholly-owned subsidiary in Beijing, China. When this acquisition is completed, Kiwa will rename Baina Beijing to Kiwa Baiao Co. Ltd. Kiwa Baiao Co. Ltd will replace Kiwa’s current subsidiary in China - Kiwa Bio-Tech (Shandong) Co., Ltd (“Kiwa Shandong”) - to operate Kiwa’s bio-fertilizer market expansion and become Kiwa’s platform for future acquisitions of new agricultural-related projects in China. In accordance with the terms of the Agreement, Kiwa agreed to pay US$30,000 to the Baina Hong Kong Shareholders for the acquisition of 100% of the equity of Baina Hong Kong.accounts receivable. As of December 31, 2015,2017, and December 31, 2016, $1,108,839, and $13,469 were deposited with various major financial institutions located in the PRC, respectively. While management believes that these financial institutions are of high credit quality, it also continually monitors their credit worthiness.
Accounts receivable are typically unsecured and derived from revenue earned from customers, thereby exposed to credit risk. The risk is mitigated by the Company’s assessment of its customers’ creditworthiness and its ongoing monitoring of outstanding balances.
Customer and vendor concentration risk
For the year ended December 31, 2017, three customers accounted for 46%, 26%, 17% of the Company’s sales. For the year ended December 31, 2016, two customers accounted for 88% and 12% of the Company’s revenues.
As of December 31, 2017, three customers accounted for 52%, 22% and 14% of the Company’s accounts receivable. As of December 31, 2016, one customer accounted for 100% of the Company’s accounts receivable.
For the year ended December 31, 2017, two suppliers accounted for 49% and 47% of the Company’s total purchases. For the year ended December 31, 2016, one supplier accounted for 91% of the Company’s total purchases.
As of December 31, 2017, two suppliers accounted for 67% and 27% of the Company’s accounts payable. As of December 31, 2016, two suppliers accounted for 57% and 43% of the Company’s accounts payable.
19. Discontinued Operation
On February 11, 2017, the Company has paid RMB 220,000 (approximately $34,000)executed an Equity Transfer Agreement with Dian Shi Cheng Jing (Beijing) Technology Co. (“Transferee”) whereby the Company transferred all of its right, title and interest in Kiwa Bio-Tech Products (Shandong) Co., Ltd. (“Shandong”) to the Transferee for the acquisition.RMB 1.00. The acquisitiongovernment approval and processing of the transaction was completed on January 7, 2016. Both Baina Hong KongApril 12, 2017. This transaction was considered as completed and Baina Beijing had no activities before the acquisition date and had no assets and liabilities.effective on April 12, 2017.
(5)Distribution agreement with Kangtan Gerui Bio-Tech in China
| F-27 |
On December 17, 2015, Kiwa Bio-Tech Products Group Corporation (the “Company”) entered into a distribution agreement (the “Agreement”) with Kangtan Gerui (Beijing) Bio-Tech Co., Ltd. (“Gerui”) and formally awarded Gerui a right to sell and distribute the Company’s fertilizer products in 3 major agricultural regions of China— Hainan Province, Hunan Province and Xinjiang Autonomous Region. The Company’s Research and Development department has been conducting application experiments in Hainan and Hunan Provinces since August 2015, in accordance with the market requirements. The experiment data indicates that the Company’s fertilizer products have fulfill the requirements of reduction of content of heavy metals in soil and improve crop yield. Gerui was founded in Beijing in April 2015 and relies on the sales network of China’s Supply and Marketing Cooperatives system. Currently, the Company and Gerui do not hold any interest in each other; however, a collaboration and integration may take place in the future. The term of the Agreement is for a period of three years commencing December 17, 2015.
14. Subsequent Events
The Company has evaluatedfollowing table summarizes the existenceassets and liabilities of significant events subsequent to the balance sheet date through the date these financial statements were issueddiscontinued operation, excluding intercompany balances eliminated in consolidation, at April 12, 2017 and has determined that there were no subsequent events or transactions which would require recognition or disclosure in the financial statements, other than noted herein.December 31, 2016, respectively:
On January 14, 2016, the Company filed a Certificate of Amendment of its Certificate of Incorporation with the State of Delaware with reference to a 1-for-200 reverse stock split with respect to its Common Stock with effective date of January 28, 2016. In connection with the reverse split, the Company’s authorized capital was amended to be 120,000,000 shares, comprising 100,000,000 shares of Common Stock par value $0.001 and 20,000,000 shares of Preferred Stock par value $0.001. All relevant information relating to numbers of shares, options and per share information have been retrospectively adjusted to reflect the reverse stock split for all periods presented.
| April 12, 2017 | December 31, 2016 | |||||||
| Assets held for sale: | ||||||||
| Property, plant and equipment – Original cost | 2,117,324 | 2,117,324 | ||||||
| Less: accumulated depreciation | (765,598 | ) | (765,598 | ) | ||||
| Less: impairment | (1,351,726 | ) | (1,351,726 | ) | ||||
| Deferred tax assets | 1,013,365 | 1,013,365 | ||||||
| Less: Deferred tax assets allowance | (1,013,365 | ) | (1,013,365 | ) | ||||
| Total assets of business held for sale | $ | - | $ | - | ||||
| Liabilities of business held for sale: | ||||||||
| Accounts Payable | 253,208 | 251,466 | ||||||
| Advances from customers | 12,972 | 12,883 | ||||||
| Salary payable | 537,127 | 533,432 | ||||||
| Accrued expense | 29,035 | 28,835 | ||||||
| Other payable | 102,291 | 101,588 | ||||||
| Due to related party-trade | 1,130,534 | 1,122,754 | ||||||
| Loan payable | 1,666,813 | 1,655,343 | ||||||
| Construction cost payable | 257,309 | 255,539 | ||||||
| Tax payable | 522,893 | 502,845 | ||||||
| Total liabilities of business held for sale | $ | 4,512,182 | $ | 4,464,685 | ||||
On March 1, 2016, the Company executed a sales agreement with Joyvio Great Northern Wilderness Holding Company (“Joyvio”), for an initial purchase of 10,000 tons of Kiwa’s special organic fertilizer for rice formula. Based on the terms of the agreement, KIWA special fertilizer was delivered on March 15, 2016. The Company believes that initial sales under this agreement during calendar year 2016 will be approximately US$4 million.
On March 24, 2016, the Company issued 2,900,000 and 240,000 shares of common stock, respectively, to Mr. Wei Li and Ms. Yvonne Wang (both of whom are related parties) in lieu of the cancellation and repayment of an aggregate of $3,140,000 of the Company’s debt owed to these two individuals, the conversion price being calculated at a rate of $1.00 per share. On March 25, 2016, the Company issued 1,000 shares of common stock to Mark Crone for settlement of unpaid legal fees.
Note 15. Restatement
The management of the Company has concluded that our consolidated balance sheet as of December 31, 2014, consolidated statement of comprehensive loss and consolidated statement of cash flowsincome statements for the year ended December 31, 2014 should be restated to record2017 and 2016 reflected the Kiwa Shandong business segment as a promissory note payable and related accrued interest expense. discontinued operation. The following results of operations of Kiwa Shandong are presented as a loss from a discontinued operation in the consolidated statements of operations:
| Years ended December 31, | ||||||||
| 2017 | 2016 | |||||||
| Net sales | $ | - | $ | - | ||||
| Gross profit | - | - | ||||||
| Operating expense | 16,849 | 150,471 | ||||||
| Income tax | - | - | ||||||
| Loss from discontinued operations | $ | 16,849 | $ | 150,471 | ||||
The following is the calculation of the gain on the sale of Kiwa Shandong:
| Selling price | $ | - | ||
| Net assets (liabilities) transferred at the transaction date | $ | (4,512,182 | ) | |
| Gain on sale of discontinued operations | $ | 4,512,182 |
20. Subsequent Events
On May 29, 2007,January 11, 2018, the Company issued a promissory note180,000 common shares to an unrelated individualWSMG Advisors for $360,000 (See Note 9).their consulting service to assist the Company in investor relationship management. The proceeds from promissory notenumber of shares was used to make deposit to acquire land use right fordetermined based on the Company’s factory in Shandong. During the years ended December 31, 2008, 2009 and 2010, all long-lived assetsfair value of the factoryservice. The agreement has a one year term.
On January 11, 2018, the Company issued 187,500 common shares to Acorn Management Partners, L.L.C for their consulting service to assist the Company in Shandong were impaired.investor relationship management. The Companynumber of shares was not aware that this promissory note payable and accrued interest were not recordeddetermined based on the financial statements untilfair value of the note holder reached out to the company for repayment in April 2016.service. The note payable and accrued interest related to the note payable have not been recorded since the promissory note was issued.agreement has a six-month term.
On January 11, 2018, the Company issued 400,000 common shares to Ting Li for his consulting service to assist the Company in financing projects. The following tables reflect the correction for the unrecorded promissory note payable and accrued interest expensenumber of shares was determined based on the affected line itemsfair value of the service. The agreement has a one year term.
On March 9, 2018, the Company issued 100,000 common shares to Jianping Guo for her consulting service to assist the Company in financing projects. The number of shares was determined based on the previouslyfair value of the service. The agreement has a one year term.
On March 16, 2018, the Company issued financial statements as50,000 common shares to Guohui Yu for his consulting service to assist the Company in training system projects. The number of and forshares was determined based on the fair value of the service. The agreement has a one year ended December 31, 2014.term.
| F-28 |
Consolidated Balance Sheet as of December 31, 2014
| Previously Reported | Adjustments | As Restated | ||||||||||
| Note payable | $ | - | $ | 360,000 | $ | 360,000 | ||||||
| Interest payable | $ | 138,224 | $ | 679,300 | $ | 817,524 | ||||||
| Total current liabilities | $ | 8,961,340 | $ | 1,039,300 | $ | 10,000,640 | ||||||
| Total liabilities | $ | 10,832,476 | $ | 1,039,300 | $ | 11,871,776 | ||||||
| Accumulated deficit | $ | (18,608,154 | ) | $ | (1,039,300 | ) | $ | (19,647,454 | ) | |||
| Total stockholders’ deficiency | $ | (10,807,861 | ) | $ | (1,039,300 | ) | $ | (11,847,161 | ) | |||
Consolidated Statement of Comprehensive Loss for the year ended December 31, 2014
| Previously Reported | Adjustments | As Restated | ||||||||||
| Interest expense | $ | 23,396 | $ | 90,000 | $ | 113,396 | ||||||
| Total other expense | $ | 89,998 | $ | 90,000 | $ | 179,998 | ||||||
| Net loss before income tax | $ | (617,556 | ) | $ | (90,000 | ) | $ | (707,556 | ) | |||
| Net loss | $ | (617,556 | ) | $ | (90,000 | ) | $ | (707,556 | ) | |||
| Total comprehensive loss | $ | (500,297 | ) | $ | (90,000 | ) | $ | (590,297 | ) | |||
Consolidated Statement of Cashflows for the year ended December 31, 2014
| Previously Reported | Adjustments | As Restated | ||||||||||
| Net loss | $ | (617,556 | ) | $ | (90,000 | ) | $ | (707,556 | ) | |||
| Accrued interest on convertible notes and note payable | $ | 22,538 | $ | 90,000 | $ | 112,538 | ||||||