
UNITED STATES
SECURITIES AND EXCHANGE COMMISSION
Washington, D.C. 20549
FORM 10-K
| ☒ | ANNUAL REPORT UNDER TO SECTION 13 OR 15(d) OF THE SECURITIES EXCHANGE ACT OF 1934 |
For the fiscal year ended December 31, 20152021
or
| ☐ | TRANSITIONAL REPORT PURSUANT TO SECTION 13 OR 15(d) OF THE SECURITIES EXCHANGE ACT OF 1934 |
For the transitional period from _____________ to ______________
��
Commission file number 333-189731
| DIEGO PELLICER WORLDWIDE, INC. |
| (Exact name of registrant as specified in its charter) |
| Delaware | 33-1223037 | |
| (State or other jurisdiction of incorporation or organization) | (I.R.S. Employer Identification No.) |
3435 Ocean Park Blvd.6160 Plumas Street, #107-610, Santa Monica, CA 90405Suite 100, Reno, NV89519
(Address of principal executive offices) including zip code)(Zip Code)
(516) 900-3799
(Registrant’s telephone number, including area code: (516) 900-3799code)
Securities registered pursuant to Section 12(b) of the Act:
| Title of each class registered: | Trading Symbol(s): | Name of each exchange on which registered: | ||
| N/A |
Securities registered pursuant to section 12(g) of the Act:None
Common Shares, par value $0.00001 per share
Indicate by check mark if the registrant is a well-known seasoned issuer, as defined in Rule 405 of the Securities Act. Yes [ ] ☐ No [X] ☒
Indicate by check mark if the registrant is not required to file reports pursuant to Section 13 or 15(d) of the Act: Yes [ ] ☐ No [X] ☒
Indicate by check mark whether the registrant (1) has filed all reports required by Section 13 or 15(d) of the Securities Exchange Act of 1934 during the preceding 12 months (or for such shorter period that the registrant was required to file such reports), and (2) has been subject to such filing requirements for the past 90 day. Yes [ ] ☒ No [X]☐
Indicate by check mark whether the registrant has submitted electronically and posted on its corporate Web site, if any, every Interactive Data File required to be submitted and posted pursuant to Rule 405 of Regulation S-T (Section 232.405 of this chapter) during the preceding 12 months (or for such shorter period that the registrant was required to submit and post such files). Yes [X] ☒ No [ ]☐
Indicate by check mark if disclosure of delinquent filers pursuant to Item 405 of Regulations S-K is not contained herein, and will not be contained, to the best of registrant’s knowledge, in definitive proxy information statements incorporated by reference in Part III of this Form 10-K or any amendment to this Form 10-K. [ ]☐
Indicate by check mark whether the registrant is a large accelerated filer, an accelerated filer, a non-accelerated filer, or a smaller reporting company. See the definitions of “large accelerated filer,” “accelerated filer” anda “smaller reporting company”company,” and emerging growth company in Rule 12b-2 if the Exchange Act.
| Large Accelerated filer | Accelerated filer | ☐ | |||
| Non-accelerated filer | Smaller reporting company | ||||
| Emerging growth company | ☐ |
If an emerging growth company, indicate by check mark if the registrant has elected not to use the extended transition period for complying with any new or revised financial accounting standards provided pursuant to Section 13(a) of the Exchange Act. Indicate by check mark whether the registrant has filed a report on and attestation to its management’s assessment. ☐
Indicate by check mark whether the registrant is a shell company (as defined in Rule 12b-2 of the Act). Yes [ ] ☐ No [X] ☒
There was no active public trading market as
As of June 30, 2021, the last business day of the Company’s second fiscal quarter, so there was no aggregate market value of the shares of the registrant’s common equity held by non-affiliates was approximately $7,039,615, using the June 30, 2021 closing price of the Registrant’s common stock of $0.036/share. Shares of the registrant’s common stock held by non-affiliates.each executive officer and director and by each person who beneficially owns 10 percent or more of the registrant’s outstanding common stock have been excluded in that such persons may be deemed to be “affiliates” of the registrant for purposes of the above calculation. This determination of affiliate status is not a conclusive determination for other purposes.
As of April 18, 2016,8, 2022, the registrant had 41,572,082 shares issued and outstanding.
DOCUMENTS INCORPORATED BY REFERENCE
None.
None.
TABLE OF CONTENTS
1
CAUTIONARY NOTE REGARDING FORWARD LOOKING STATEMENTS
This Annual Report on Form 10-K (the “Annual Report”) contains “forward-looking statements” within the meaning of the Private Securities Litigation Reform Act of 1995, Section 27A of the Securities Act of 1933, as amended, or the Securities Act, and Section 21E of the Securities Exchange Act of 1934, as amended (the “Exchange Act”). Forward-looking statements discuss matters that are not historical facts. Because they discuss future events or conditions, forward-looking statements may include words such as “anticipate,” “believe,” “estimate,” “intend,” “could,” “should,” “would,” “may,” “seek,” “plan,” “might,” “will,” “expect,” “anticipate,” “predict,” “project,” “forecast,” “potential,” “continue” negatives thereof or similar expressions. Forward-looking statements speak only as of the date they are made, are based on various underlying assumptions and current expectations about the future and are not guarantees. Such statements involve known and unknown risks, uncertainties and other factors that may cause our actual results, level of activity, performance or achievement to be materially different from the results of operations or plans expressed or implied by such forward-looking statements.
We cannot predict all of the risks and uncertainties. Accordingly, such information should not be regarded as representations that the results or conditions described in such statements or that our objectives and plans will be achieved and we do not assume any responsibility for the accuracy or completeness of any of these forward-looking statements. These forward-looking statements are found at various places throughout this Annual Report on Form 10-K and include information concerning possible or assumed future results of our operations, including statements about potential acquisition or merger targets; business strategies; future cash flows; financing plans; plans and objectives of management; any other statements regarding future acquisitions, future cash needs, future operations, business plans and future financial results, and any other statements that are not historical facts.
These forward-looking statements represent our intentions, plans, expectations, assumptions and beliefs about future events and are subject to risks, uncertainties and other factors. Many of those factors are outside of our control and could cause actual results to differ materially from the results expressed or implied by those forward-looking statements. In light of these risks, uncertainties and assumptions, the events described in the forward-looking statements might not occur or might occur to a different extent or at a different time than we have described. You are cautioned not to place undue reliance on these forward-looking statements, which speak only as of the date of the Annual Report on Form 10-K. All subsequent written and oral forward-looking statements concerning other matters addressed in this Annual Report on Form 10-K and attributable to us or any person acting on our behalf are expressly qualified in their entirety by the cautionary statements contained or referred to in this Annual Report on Form 10-K.
Unless otherwise provided in this Annual Report, references to the “Company,” “Diego,” “we,” “us” and “our” refer to Diego Pellicer Worldwide, Inc.
2
PART I
Business Overview of the Market
The cannabis market has a multi-billion dollar potential. The industry is still in a development stage, and is being rapidly propelled towards its potential by the state legalization and the rush by suppliers to meet the pent-up demand. Most suppliers are small, unsophisticated but capable operators. The federal legal constraints provide an opportunity to those companies early to the market to gain a first mover advantage and to the successful ones, an opportunity to be a consolidator in the industry.
What is Diego’s Strategy, Phases One and Two?
Diego is a real estate and a consumer retail development company that is focused on high quality recurring revenues resulting from leasing real estate to licensed cannabis operators, and the management of operations for these and other third party cannabis operators deriving income from management and royalty fees. Diego provides a competitive advantage to these operators by developing “Diego Pellicer” as the world’s first “premium”premium marijuana brand and by adhering toestablishing the highest quality and standards for its facilities along with both cannabis and non-cannabis products.
The Company’s initial focusfirst phase strategy is to acquirelease and develop legally compliantthe most prominent and convenient real estate locations for the purposes of leasing them to state licensed companiesoperators in the cannabis industry. Diego does not grow or sell marijuana or marijuana infused products in the early stages of this plan.
Diego’s initialfirst phase revenues deriveresult from leasing real estate and selling non-cannabis related products; however, when it is federally legalaccessories to do so, Diego will be properly positioned to take advantage of pre-negotiated acquisition contracts with selected Diego tenants in marijuana retail and production facilities throughout the country. Diego’s business model will allow it to become a nationally branded marijuana retailer and producer, instantaneously, with the change of federal law.our tenants. The Company will not implement this business model until it becomes legal under federal law to sellhas developed a brand name strategy, providing training, design services, branded accessories, systems and produce marijuana.
To operate within the constraints set forth by the US government, the purpose of this business plan is to describe Diego; however, to better describe the future growth plan for the Company, we will also describe the grow and retail operations of other entities with which Diego has pre-negotiated acquisition contracts or plans to have pre-negotiated acquisition contracts in the future. At this time, we only have one pre-negotiated acquisition contract in place with Diego Pellicer, Inc. a Washington Corporation. These external operations are presented as DP Grow and DP Retail, and the results of these operations as presented will not directly benefit Diego until after Federal legalization.
Merger and Share Exchange Agreement
On March 13, 2015 (the “Closing Date”), Diego Pellicer Worldwide, Inc. (f/k/a Type 1 Media, Inc.) (the “Company” or “PubCo”) closed on a merger and share exchange agreement (the “Merger Agreement”) by and among (i) the Company, and (ii) Diego Pellicer World-wide 1, Inc., a Delaware corporation, (“Diego”), and (iii) Jonathan White, the majority shareholder of the Company (the “Majority Shareholder”). Pursuant to the terms of the Merger Agreement, Diego shall be merged with and into the Company, with the Company to continue as the surviving corporation (the “Surviving Corporation”) in the Merger, and the Company succeeding to and assuming all the rights, assets, liabilities, debts, and obligations of Diego (the “Merger”).
In connection with the closing of the Merger, on the Closing Date, Jonathan White and Thomas Baxter submitted to the Company a resignation letter pursuant to which they resigned from their positions as officers and members of the Board of Directors of the Company. Messrs. White and Baxter’s resignations were not a result of any disagreements relating to the Company’s operations, policies or practices. On the Closing Date, the board of directors of the Company (the “Board”) and the majority stockholders of the Company (the “Shareholders”) accepted the resignations of Messrs. White and Baxter and, contemporaneously appointed: (i) Philip Gay to serve as the Chief Executive Officer and member of the Board of Directors, (ii) Ron Throgmartin to act as Chief Operating Officer, (iii) Nick Roberts to act as Chief Financial Officer; and (iv) Alan Valdes, Douglas Anderson, and Stephen Norris to serve as members of the Board of Directors.
Subsequent to the Merger and Share Exchange Agreement, on May 22, 2015, Philip Gay resigned as the Chief Executive Officer and as a member of the board of directors, and Nick Roberts resigned as Chief Financial Officer. Mr. Gay and Mr. Roberts resignations were not the result of any disagreement with the Company on any matter relating to its operation, policies (including accounting or financial policies), or practices. The board of directors of the Company appointed Ron Throgmartin, the Company’s Chief Operating Officer as the Chief Executive Officer and David R. Wells as the Company’s Interim Chief Financial Officer.
On January 29, 2016, the Board of Directors accepted the resignation of David R. Wells as Chief Financial Officer of the Company. On January 29, 2016, the Board appointed Christopher Strachan, as the Company’s new Chief Financial Officer.
Our Corporate History and Background
Diego Pellicer Inc. was formed in the state of Washington of December 5, 2012, with the intent to produce and sell cannabis in the state of Washington. The Company determined that in order to be successful and avoid any potential violation of federal law, it would form a new corporation that would not produce or sell cannabis directly. Therefore, Diego Pellicer Worldwide, Inc. was formed as a Delaware corporation, on August 26, 2013. The Company was developed to position itself in such a way that if the cannabis industry were to federally legalize, then it would be in an advantageous position to quickly become one of the first luxury integrated brands in the industry. Currently, the Company’s focus is to acquire and develop legally compliant real estate locations for the purposes of leasing them to state licensed companies in the cannabis industry. Diego does not grow or sell marijuana or marijuana infused products at this time.
Mission
At this time, Diego Pellicer is a development stage company and is only in the early stages of implementing its business plan. In states where recreational and/or medical marijuana sales and cultivation is legal under State law, the Company plans to lease property to tenants who will grow and/or sell the highest quality of marijuana. As a tenant of Diego, these operators will have access to Diego’s world class management team with expertise in real estate, retail management, agriculture and USDA experts, legal, marketing and branding, product development and creative teams.
When the US and countries around the world legalize commerce of marijuana on a national and international platform, Diego hopes to be in a position to dominate the marijuana marketplace. Diego will accomplish this by positioning the Company, through its business model, to be the first fully integrated marijuana retail operation and premium brand, known for its beautifully designed user friendly retail stores offering the finest quality products at competitive prices, when the USsystems training, locational selection, and other countries legalize the sale of marijuana.
Philosophy
We believe that legalizing marijuana, regulating it and taxing it, will cause less harm and do more good than the prohibition environment. We believe marijuana should be elevatedadvisory services to its proper place among other legal recreational intoxicants such as fine wines, liquors, beers, cigars, etc. There is an overwhelming amount of scientific evidence that supports our philosophy, as well as a growing number of supporters ranging from high-ranking US and foreign politicians to prominent figures in the entertainment industry. In addition, we believe that legalization will help unlock the phenomenal power of cannabis as a medicinal treatment for numerous ailments from headaches to cancer.
Brand History
Diego Pellicer was a Spanish colonial vice governor of Cebu, a major island in the Philippine archipelago. He grew to become the largest grower of hemp in the world and is our name sake. He serves as an inspiration to our executive team, as well as distinctive brand befitting the quality of Diego Pellicer Worldwide.
Vision
Our vision is to continue to develop Diego Pellicer as a premium brand that is valued and positioned to appeal to a broad customer base.
In addition, Diego believes that in the very near future, the US and other countries will embrace the will of the people, and legalize the responsible adult use of marijuana. Legalizing national and international commerce of marijuana, will allow Diego to take its brand and unmatched quality standards to markets all around the globe.
Value Proposition
The initial value proposition of Diego consists of a standardized approach to the build-outs of real estate holdings, customized for premium marijuana grow and retail operations. The build-out model is optimized to maximize resources while minimizing costs and overhead. With each build-out, Diego pre-negotiates with select tenants, acquisition contracts with licensed DP Grow and DP Retail tenants, which, upon changes to federal law, introduces our second value proposition—ownership of operations from seed to sale in an industry that is projected to exceed $8 billion by 2018 and we hope will soon rival that of traditional markets such as tobacco and alcohol.
Market Size
The US state-sanctioned medical and recreational marijuana market generated a total revenue of $5.4 billion in 2015, boosted by an incredible growth in the recreational sector of sales, from $351M to $998M, an estimated increase of 184% over 2014. By comparison, the marijuana market is less than 3% of the US tobacco market, a $144 billion market that has no medicinal value, and less than 3% of the alcohol market, which valued at $113.5 billion in 2014 (Marijuana Business Daily 2016;2016 Statistic Brain Research Institute). As states legalize marijuana, and international markets develop, the emerging legalized marijuana industry will begin to rival that of tobacco and alcohol and could see $45B in revenues by 2020.
Target Geographies
Diego has entered a rapid growth and expansion stage in its evolution toward becoming an internationally recognized brand. The target geographies for Diego are all US states in which recreational or medicinal marijuana is legalized. This is a phased implementation that carefully pre-stages funding and materials to be first to market, as each state rules on legalization. In certain scenarios, Diego may choose to allow weak competitors to fail, making available prime real estate that otherwise would be inaccessible.
Target Consumers
There are an estimated 1.5 million medical marijuana patients in the US and more than 4,500 retailers. California and Washington have the largest number of marijuana patients at more than 775,000 for each state, followed by Michigan at 344,000 and Colorado with 107,534. (Marijuana Business Daily 2016).
The demographics for consumers that have tried marijuana at least once, range between ages 18 to 49, with the greatest numbers between the ages 26 and 34. These consumers are predominantly male and college educated.
Alaska has the fastest growing population of potential consumers, followed by Washington DC, Colorado, New Mexico and Hawaii, with Washington just a few points below. In 2012, Montana, Colorado, California, and Washington had the greatest increase in disposable income, thus increasing the breadth of target consumers.
Material Agreements
On April 19, 2014, the Company entered into a commercial agreement and merger agreement with Diego Pellicer, Inc., a Washington corporation (“Diego Washington”). Diego Washington agreed to making a capital contribution from its current investors of not less than $350,000 in the Company and that the Company agreed to offer to the holders of Series A Preferred Stock of Diego Washington and to current holders of convertible promissory notes convertible for shares of Diego Washington, the right to exchange that same number of shares to shares the Company.
On September 19, 2013, the Company entered into a Lease Agreement with M-P Properties whereby the Company agreed to lease the property located at 2215 4thAvenue, Seattle, Washington, for a term of five years with an option to renew. The Company agreed to pay $78,000 per year.
On March 1, 2014, the Company entered into a Sublease Agreement with Diego Pellicer, Inc., a Washington entity whereby the Company agreed to sublease the property located at 2215 4thAvenue, Seattle, Washington, for a term of four years.
On June 12, 2014, the Company entered into a Lease Agreement with Shamira, LLC whereby the Company agreed to lease the property located at 4242 Elizabeth Street, Denver, Colorado, for five years with an option to renew. The Company agreed to pay $360,000 per year for the first year of the agreement, with an increase of 3% for year subsequent year.
On August 14, 2014, the Company entered into a Commercial Sublease Agreement with DPCO, Inc., a Colorado corporation, whereby the Company subleased the property located at 4242 Elizabeth Street, Denver, Colorado for a term of five years.
On July 14, 2014, the Company entered into a Lease Agreement with 2949 W. Alameda Ave LLC whereby the Company agreed to lease the property located at 2949 W. Alameda Avenue, Denver, Colorado, for five years with an option to renew. The Company agreed to pay $20,000 per month in rent.
On August 14, 2014, the Company entered into a Sublease Agreement with DPCO, Inc., a Colorado corporation, whereby the Company agreed to sublease the property located at 2949 W. Alameda Avenue, Denver Colorado for a year of five years.
On August 13, 2014, the Company entered into a Sublease Agreement with M and S LLC whereby the Company agreed to lease the property located at 755 South Jason Street, Denver, Colorado, for four years. The Company agreed to pay $25,000 per month in rent.
On August 14, 2014, the Company entered into a Sublease Agreement with DPCO, Inc. a Colorado corporation, whereby the Company subleased the property located at 755 South Jason Street, Denver, Colorado for a term of four years.
Our Industry
their tenants. We are in a burgeoning industry, centered on the production and sales of medical and recreational marijuana. Diego Pellicer is focused on providing legally compliant retail and production facilities to State licensed operators. In addition, Diego Pellicer offers branding opportunities to state licensed producers and retailers that meet our stringent qualifications.
In addition to providing fully branded and built real estate to qualified tenants, Diego Pellicer offers non-cannabis infused products, apparel, and other tangible products at a wholesale rate. To become a qualified tenant, Diego requires its tenants to strictly adhere to testing and labeling requirements along with all state laws and federal guidelines to assure quality and consistency of marijuana products, ensuring safe sale and consumption. Table 7 provides a list of our current property portfolio.
Our Business Strategy
Market Definition and Roles
The marijuana market consists of medical and recreational regulators, producers, testers, processors, wholesalers, retailers, collectives, consumers and real estate holders. Since data pertaining to specific aspects of marijuana sales, such as processor revenues, is virtually non-existent for the marijuana market, the market is valued according to retail sales data provided by state and federal governing bodies. Below is a brief summary of each role:
Market Strategy
Our short-term strategy is to profit only from the lease payments of our real estate holdings and from the sale of branded, non-cannabis products. Diego will have pre-negotiated acquisition contracts with selected tenants that trigger only when it is legal, or not illegal, to conduct interstate commerce in marijuana. We intend to enter into branding agreements with our tenants going forward that will require our tenants to have certain quality controls and procedures to ensure our they comply with the law, safety and quality.tenants. In addition, part of the vetting process in finding the proper tenant is selecting a tenant that shares the Company’s values and strictly complies with respective state laws, follows strict safety and testing requirements and provides consistent, high-quality products. If the tenants do not comply, they will not be allowed to use the brand. At this time, we have one pre-negotiated acquisition contract in place with
The second phase of our strategy is to secure options to purchase the tenant’s operations. When mutually advantageous for Diego Pellicer Worldwide Washington and are in the process of negotiating additional pre-negotiatedtenant, Diego will negotiate acquisition contracts with selected Diego operators/tenants. When it becomes federally legal to do so, Diego will execute the acquisition contracts, consolidate our selected tenants and become a nationally branded marijuana retailer and producer concurrent with the change of federal law.
Diego Pellicer Management Company, a wholly owned subsidiary, will license the upscale Diego Pellicer (“DP”) brand to qualified operators and receive royalty payments, while providing expertise in retail, product and manufacturing from Diego’s management team.
Value Proposition
Value Proposition 1:
By providing branding, management experience, training, unique accessories, purchasing services, locational experience, standardized design, and experienced construction supervision, the tenant reduces his startup time, reduces cash drain, increases his efficiency, and builds his gross margin. Diego provides the capital for preopening lease costs and tenant improvements. This results in a turnkey retail location for the tenant. Thus, Diego’s real estate, management, consulting and accessory sales are positioned to deliver a premium return on our investment.
Value Proposition 2:
With each lease, Diego negotiates an acquisition contract with selected licensed tenants to acquire their operations. This contract will be executed at Diego’s option, and upon changes to federal law, introduces our second value proposition-ownership of operations.
Revenue Generation and Growth
Diego generates current revenue and stages future revenue streams through the following processes:
| ● | Acquire target properties to be improved for the growing, processing, distribution, and sale of medical and recreational marijuana, extracts and ancillary products. |
| ● | Build and lease turnkey Retail, Processing and/or Growing facilities. |
| ● | The Company may choose to secure management contracts with other retail and grow facilities to manage the business the “Diego Way.” This will generate additional revenue with which we can further expand our network of stores. |
| ● | Negotiate merger agreements with favored partners that will trigger when marijuana commerce becomes legal federally. |
| ● | Own DP Brands and other intellectual property. |
| ● | Charge reasonable rents and management fees to tenants or operators to recover all build-out, start-up investment plus profit margin, and management expertise over the lease term. |
3
| ● | Sell non-cannabis branded products lines such as apparel and edibles to Diego stores, other retail stores and for wholesale. |
| ● | Create an e-commerce platform selling non-cannabis branded merchandise |
| ● | Continue to build and market the brand utilizing all forms of media including traditional and digital media, social media, e-commerce, and strategic partners. |
Why We Believe this is a Winning Strategy
Should the United States and countries around the world legalize the commerce of marijuana, Diego is positioning itself to be a dominate player in the marijuana marketplace. Diego will accomplish this by being a fully integrated marijuana retail operation and premium brand, capitalizing on the beautifully designed retail stores offering the finest quality products at competitive prices.
Most industries evolve through the same business cycle. Many small independent companies initially operate in fragmented markets in the early stages. Then there is a consolidation of the industry, with the consolidators thriving and the independent companies dwindling. The larger companies have access to cheaper capital, lower costs, better merchandising, brand name recognition, and more efficient operations. This is what we offer our tenants when negotiating the lease: an agreement to acquire them when marijuana is legalized. This gives the tenant the ultimate opportunity to participate in the rapid consolidation that we believe will happen when marijuana is legalized. This consolidation will result in companies that have been unable to participate in the rapidly growing industry to be scrambling to enter the space. Diego and its tenants will already be established and consolidated. As an exit strategy, we want to position Diego to be a likely candidate for acquisition or a major player in the marketplace.
Recent Developments
2021 was a time of continued growth and a change of focus for the Company. An effective and experienced team was assembled from within our operators to develop our management company, and to complement the current executives with knowledge and experience in real estate operations, banking, site selection, branding, marketing, facility design, corporate finance, investor relations, store management, and grow expertise, Additional capital needed to be raised in order to have sufficient capital to help support our operators expand within their markets, and to begin the expansion into different markets in the US. Much of the Company’s debt is being renegotiated, and additional commitments were formalized for the expansion in the Colorado market. New markets had to be explored, new alliances forged, and opportunities prioritized.
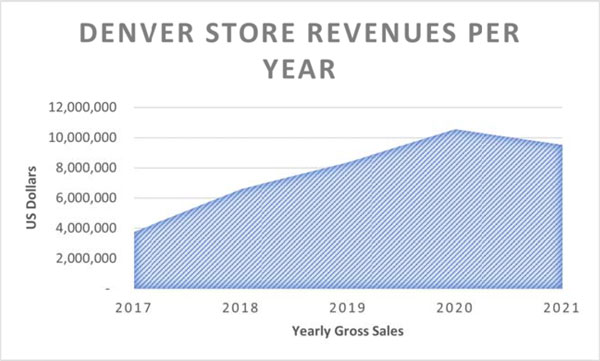
New markets were explored. Three facilities continued to see solid revenues, which lead to rental revenue cash-flow to the Company. In 2021, Diego focused on our Colorado operations in Denver. Diego received revenues from the Colorado facilities and received revenues from a divested leased property in 2020. Diego now has two facilities generating rent in 2021 and we have actively been expanding in the Colorado markets with potential acquisitions for our tenants, and our management company. Although our tenants continue to strengthen their presence in the marketplace, post COVID-19 sales have tapered off slightly as the general workforce returns to work. Diego worked with these tenants, partially forbearing on their rent so as to allow these operators to strengthen their position and become capable of paying full rents. The properties generating rents in 2021 are as follows:
Table 1: Property Portfolio
| Purpose | Size | City | State | |||
| Retail store (recreational and medical) | 3,300 sq. | Denver | CO | |||
| Cultivation warehouse | 14,800 sq. | Denver | CO |
Diego’s Denver Colorado tenant opened our first grow store in Seattle in October 2016. On October 21 2020, the Company entered into an agreement with a third party, to which the Company sold the Elizabeth Street leased location operation securing all the future premium rents due under the extended lease agreement The Colorado tenant opened the Diego Denver branded grow facility in February 2017. The retail facilities have shown steady growth in sales since their opening. The three Colorado properties were subleased to a single entity. The Company is currently exploring the acquisition of other tenants.entities to increase cash flow and value for the company.
4
Diego Pellicer Denver
Diego will continue this strategy in states where recreational or medical marijuana sales and cultivation is legal under state law. Our business model is recurring lease revenue, royalties, management fees, and is entirely scalable. Our success will dependent upon continuing to raise capital for expansion, continual improvement of our business model, standardizing store design, controlling costs, new store management opportunities, and continuing to develop the brand.
On February 8, 2022, the Company entered into an Equity Purchase Agreement (the “Purchase Agreement”), with Hemp Choice Distribution, LLC, a Colorado limited liability company (“HCD”), its owners (the “Sellers”), and Gabriela Vergara (the “Sellers’ Representative”), pursuant to which we have agreed to acquire all of the issued and outstanding equity interests of HCD (“Membership Interests”). The closing of the transaction is expected to occur within 90 days from the date of the Purchase Agreement (the “Closing”).
The purchase price for the Membership Interests shall be the aggregate amount of $4,400,000 payable at the Closing as follows: (i) $250,000 in cash by wire transfer of immediately available funds; (ii) the number of restricted shares of the Company’s common stock that is equal to $250,000 divided by the current market price at the time of Closing, but such price shall not be greater than $.05 per share or less than $.02 per share: and (iii) three pillarsmillion nine hundred thousand dollars ($3,900,000) in the form of 390,000 shares of redeemable preferred stock (with a stated value of $10.00 per share) of the Company. The terms of the redeemable preferred shares shall be specifically and fully set forth in a Certificate of Designations to be filed with the State of Delaware at the time of Closing. After the Closing, the Purchaser agrees to provide HCD with a line of credit or assist it in obtaining a line of credit from a third party of up to $1,000,000. In addition, the business of HCD shall continue to be managed by Sellers’ Representative subject to the conditions of an employment agreement to be entered into by the Company and Sellers’ Representative prior to the Closing.
What does our strategy are:premium branding accomplish?
A very important aspect of our marketing plan is to build Diego Pellicer as a luxury brand. This not only enables us to establish further and exploit Diego Pellicer as a premium brand, but also to generate significant revenues off of non-cannabisfrom non- cannabis products.
5

Market Size
The USCompany is establishing several levels of branding and will use these to appeal to the various segments of the marketplace depending upon the location, competition, legal constraints, and budget. Standard store templates are being developed, complimentary accessories selectively designed, and customer preferences and segments analyzed.
Our Denver stores have been met with enthusiastic demand and quickly growing revenues. This is proving the initial Diego concept.
6
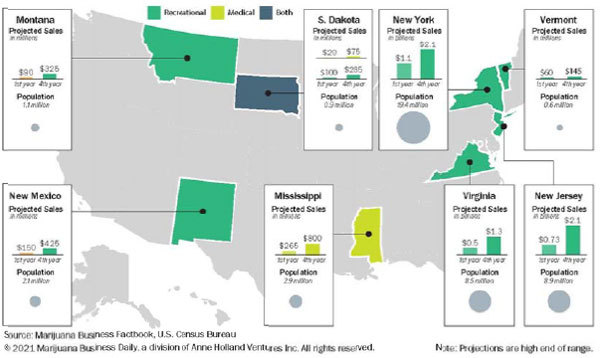
The Industry: Retail Sales Continue to Rise
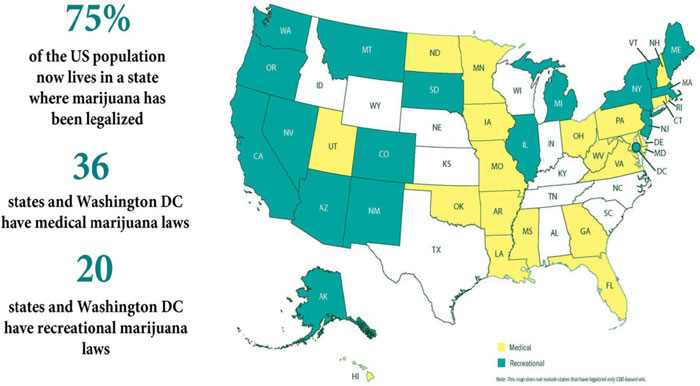
Legalization of marijuana is a very recent movement. California was the first to legalize in 1996 when medical marijuana was approved. Eleven states and the District of Columbia have legalized the drug for recreational purposes, according to the National Conference of State Legislatures. More than half the states (36) – plus the District of Columbia, Guam and Puerto Rico – have legalized it for medical purposes. The list of states that have legalized marijuana could expand this November. Marijuana remains illegal under U.S. federal law.
Source: 2021 Marijuana Business Daily, a division of Anne Holland Ventures Inc.
7
Source: 2021 Marijuana Business Daily, a division of Anne Holland Ventures Inc, National Institutes of Health,
New Leaf Data Services, LLC, Cigar Association of America, Inc.
The growth in public support for legal marijuana and hemp derived CBD comes as a growing number of states have legalized the drug for medical or recreational purposes in recent years.
About 7-in-10 Americans (74%) say the use of marijuana should be legalized, reflecting a steady increase over the past decade, according to a new Pew Research Center survey. The share of U.S. adults who support marijuana legalization has changed from about 2 years ago – when 62% favored it – but it is more than double what it was in 2000 (31%).
As in the past, there are wide generational and partisan differences in views of marijuana legalization. Majorities of Millennials (74%), Gen Xers (63%) and Baby Boomers (54%) say the use of marijuana should be legal. Members of the Silent Generation continue to be the least supportive of legalization (39%), but they have become more supportive in the past year.
Source: Pew Research Center
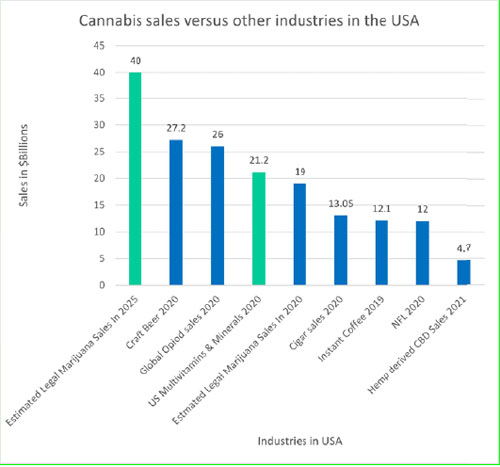
Annual cannabis retail sales continue to grow year-over-year as new markets emerge and more states legalize medical and recreational marijuana. Sales in 2024 are projected to increase to over $30 billion
By 2024, annual retail marijuana sales in the United States could top $40 billion, which would represent more than a 30% increase from 2019.
8
Source: 2021 Marijuana Business Daily, a division of Anne Holland Ventures Inc.
The retail and medical marijuana industry brought in an estimated $59.2 - $70 billion of economic impact in 2020 just in the USA. By 2025, we expect the potential for the industry to surpass $135 billion in annual economic benefit.
Estimates for economic impact are based on an impact multiplier of 3.5. This means that for every $1 consumers spend at dispensaries or recreational stores, another $2.50 in economic benefit will be created in the cities, states and ultimately the nation.
Here are some of the factors in this overall economic impact:
| ● | The launch of new businesses | |
| ● | Hundreds of millions of dollars in state and local taxes | |
| ● | Real estate investments | |
| ● | Visiting tourists spending money to legally consume | |
| ● | Marijuana employees circulating earnings back into the economy |
The marijuana labor market has experienced rapid, chaoticincreased about 38% over last year with marijuana industry supporting about 240,000-295,000 employees. A majority of this growth has come from other states legalizing marijuana use over the last few years including California, which is the next market Diego is focusing its attention on for acquisitions, and branding agreements. In 2019, marijuana employment surpassed that of the technology industry of web developers and is fast approaching the number of clergy in the USA.
The continued growth in recent years, whichthe cannabis market, including legalizing the growing and retailing of hemp based products, has boosted the rapid growth in employees and retail sales. The industry is setexpected to add more than 430,000 full-time jobs between now and 2024 with compounding annual growth rates of 22% and should lead to over 575,000 jobs by 2024.
9
Outside of California, however, sales are expected to continue beyondclimbing, bolstered by ongoing growth in mature markets like New Mexico and Arizona, increased patient access in Florida and new Medical Marijuana (MMJ) programs coming online in Maryland and Pennsylvania. The transition to fully regulated, state-licensed MMJ sales in Michigan has caused some short-term instability, but it remains one of the forecast targetlargest medical markets in the country and will likely continue to form the foundation of 2019 due primarilythe MMJ industry for years to regulatory misalignment between state and federal governments.come.
The marijuana secondary and tertiary markets have not yet been analyzed as sources of revenue; however, emerging secondary markets such as marijuana tourism could become a significant source of income for recreational legal states. As a point of comparison, Holland earns $48.55 billion per year in tourist dollars. Of the 10 million tourists, 5.5 million or 55% of tourists visit bars and cafes, generating a total of nearly $27 billion and 220,000 jobs (NBTC, 2009). This equals roughly 30% of all business revenue generated in Washington state in 2012 (Washington State Department of Revenue, 2014).
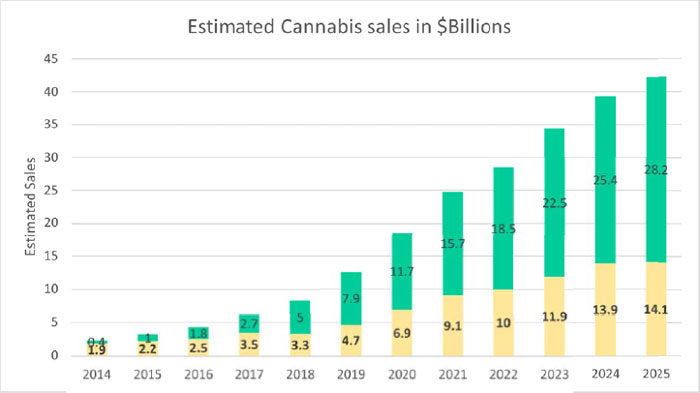
The US state-sanctionedmore states continue to legalize medical and recreational marijuana market generated a total revenuesales, an ever increasing number of $5.4adults are introduced, or re-introduced to the product. Continued research into the benefits of Cannabidiol (CBD) derived from both the Marijuana and hemp plants, has catapulted the cannabis industry into the mainstream media. Legal sales of recreational and medical marijuana reached about $25.2 billion in 2015, boosted by an incredible growthsales for 2021, about half that spent on tobacco cigarettes. It is estimated that total demand for cannabis including legally produced product is in excess of $50 - $60 billion
By 2025, we project total retail and medical marijuana sales in the recreational sectorUnited States will reach approximately $38.4-45.9 billion annually - more than a threefold increase from estimated annual sales in 2017. Our estimates account for the fact that more states will likely legalize medical or adult-use marijuana in the coming years - though it’s difficult to predict when that will happen and how big those markets will be. Using a range of estimates that incorporate several factors - such as the likelihood of a given state passing a legalization measure, the size of the customer/patient base and time frame for the launch of sales from $351M- helps account for this uncertainty. Our approach is refined over time as more information becomes available.
It’s important to $998M.=, an estimated increase of 184% over 2014. By comparison,point out that the marijuana market is less than 3%industry has a big and growing impact on the economy at large as the revenue it generates ripples across a community, city and/ or state - as well as the nation. To understand an industry’s economic impact, traditional macroeconomic multipliers can range anywhere from 10 to 20 times the original dollar spent. Based on new data from other industries, we’ve settled on a standard multiplier of 3.5 for the US tobacco market, a $144 billion market that has no medicinal value, and less than 3% of the alcohol market, which valued at $113.5 billion in 2014 (2016 Statistic Brain Research Institute). As states legalize marijuana, and international markets develop, the emerging legalized marijuana industry - a slight revision from last year’s multiplier of four.
In other words, for every $1 consumers/patients spend at dispensaries and rec stores, an additional $2.50 of economic value will begin to rival thatbe injected into the economy - much of tobacco and alcohol and could see $45B in revenues by 2020.it at the local level.
10
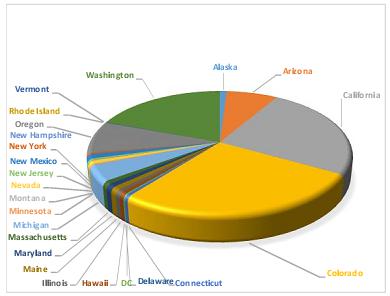
Marijuana has become a major issue in state elections as voters are seeking politicians that support legalization (Gutwillig, 2014). As states legalize marijuana, and international markets develop, the emerging legalized marijuana industry will begin to rival that of tobacco and alcohol. Table 1 summarizes 2016 estimated revenues generated by marijuana retail sales based on a number of sources, including state marijuana program reports.
Table 1: Projected US Marijuana Retail Sales, 2016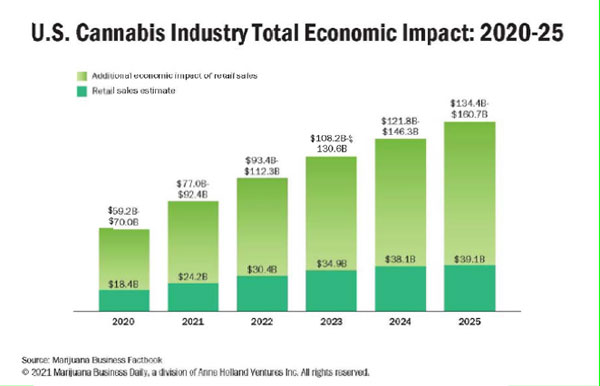
| State | 2016 | |||
| Alaska | $ | 40,000,000 | ||
| Arizona | $ | 300,000,000 | ||
| California | $ | 1,000,000,000 | ||
| Colorado | $ | 1,100,000,000 | ||
| Connecticut | $ | 18,000,000 | ||
| DC | $ | 8,000,000 | ||
| Delaware | $ | 2,000,000 | ||
| Hawaii | $ | 22,000,000 | ||
| Illinois | $ | 25,000,000 | ||
| Maine | $ | 35,000,000 | ||
| Maryland | $ | 35,000,000 | ||
| Massachusetts | $ | 32,000,000 | ||
| Michigan | $ | 170,000,000 | ||
| Minnesota | $ | 8,000,000 | ||
| Montana | $ | 4,000,000 | ||
| Nevada | $ | 32,000,000 | ||
| New Hampshire | $ | 4,000,000 | ||
| New Jersey | $ | 16,000,000 | ||
| New Mexico | $ | 47,000,000 | ||
| New York | $ | 13,000,000 | ||
| Oregon | $ | 340,000,000 | ||
| Rhode Island | $ | 24,000,009 | ||
| Vermont | $ | 5,000,000 | ||
| Washington | $ | 775,000,000 | ||
Source: (Marijuana Business Daily 2016; Illinois Cannabis Patients Association, 2010; Leal, 2014;2021 Marijuana Business Daily, 2013)a division of Anne Holland Ventures Inc. (Note that our goal is to provide conservative, realistic financial forecasts that reflect the high degree of uncertainty in the industry. Total cannabis sales in any given calendar year are highly dependent upon progress made - or not made - in each individual state. California is currently the big wild card, as the slow rollout of its statewide regulatory system makes it difficult to get a handle on the exact size of this enormous market. As more information comes to light over time, it could change our estimates for California and, therefore, the industry at large.)
Figure 2 illustratesWhere are the Greatest Market Opportunities?
All eyes are on California.
That’s the reality for nearly everyone involved in the global marijuana market. Companies around the world - from Europe to Canada to Israel and beyond - want a piece of the California market. But there are plenty of practical ramifications. No other state or federal government in the world has tried to implement such a wide-ranging regulatory system that affects tens of thousands of existing black- and gray-market businesses.
The bottom line: The sheer immensity of the California cannabis market structureis topped only by its complexity. And that complexity has led to major struggles and big wait times for entrepreneurs looking to tap the California market potential. California’s Marijuana (MJ) regulatory system covers a population of 40 million and includes incentives for existing businesses to transition to the licit tax-paying industry.
There are plenty of other hurdles for existing and future businesses as well, including local license caps from towns and counties that are hesitant to grant permits to any type of cannabis companies. As of early October 2018, only a fraction of local governments had opted to allow recreational use companies to set up shop within their borders, and state business permits are dependent on a company first obtaining local authorization of some sort. Plenty of companies are striving to play by the rules, but they’re often unable to stay in business while doing so because they haven’t been able to find locations that fit all the legal parameters for licensing.
The same is true for thousands of small-scale growers in California, as well as edibles makers, concentrate producers and estimated retail sales revenuesother plant-touching businesses. One option for 2016. Ofsuch companies, at least for now, is to focus on the 24 statesmedical marijuana market instead of recreational. Far more local governments allow limited medical companies than adult-use businesses. Obtaining such permits could be a stopgap move because, as time goes on, it’s likely that more and more local governments will decide to permit recreational use. Another option could be to pivot into an alternate cannabis sector, such as distribution or testing labs, given that there’s a dearth of both key business types in whichthe state.
Hemp and CBD
Hemp was once prized for making rope. Two hundred years later, the plant still has us tied in knots. From a patchwork of state hemp rules to confusion among cannabis entrepreneurs about the definition of hemp, uncertainty reigns in the hemp industry. Hemp has long been bedeviled by its conflation with marijuana, is legal, Colorado is expected to generatedand the most revenue at $51,100M, followed by California at $1,000M and Washington at $775M. Most States operatingControlled Substances Act banned its production for decades. That changed in 2014, experienced doublewhen the U.S. Farm Bill opened the door for a hemp revival in states willing to experiment (and control) the crop’s return to legal production. The federal government defines hemp as cannabis sativa with a THC content at or below 0.3%.
The Farm Bill set off an explosion of hemp production and triple digit growth into 2015, with the exceptionexperimentation and has given cannabis entrepreneurs new opportunities to California, which has leveled out.
Figure 1 Estimated US Marijuana Retail Sales, 2016
Various industry reports estimate thatgrow, sell and buy cannabis in a nonintoxicating form. The Farm Bill allows limited interstate commerce for hemp - something still off-limits to marijuana sales could generate as much as $8.7 billion in stateentrepreneurs. Hemp businesses report fewer banking and federal taxes; however, data to support that estimate is not yet available. (Marijuana Business Daily 2016)
Market Growthregulatory headaches.
The performanceU.S. hemp experiment is still unfolding. Market conditions vary widely. Though the laws vary from state to state, it is more or less legal to produce hemp in most American states. America is finally getting its staple agriculture back. This can greatly benefit America as it will revolutionize several of its key industries – textiles, biomass, natural gas, building materials among others.
11
Not all U.S. states use the federal THC guidelines to define hemp, and the 0.3% THC threshold has little basis in science, meaning that scientists don’t agree about how much THC a plant needs to produce a high when heated and consumed. Cannabis plants have more than 100 cannabinoids, of which THC is only one, and hemp products with no detectable THC can still be considered psychoactive if they contain cannabinoids that relieve anxiety or depression. At least one state, Iowa, explicitly dictates that cannabidiol is legal but high THC marijuana is not legal - then goes on to say it accepts cannabidiol with a THC limit 10 times higher than the federal threshold for legal hemp.
Still, the 0.3% THC threshold is a useful metric for dividing marijuana from hemp, and it is the standard used in the industry.
Longtime hemp prohibition in the United States has left the industry frozen in time. There is little modern agricultural equipment appropriate for hemp harvesting and processing, and the crop likely won’t match the market share it enjoyed before the Industrial Revolution, when hemp fibers were commonly used in commercial fabrics. Today, hemp’s value comes mostly from its flower, rich in cannabinoids beyond THC. The most valuable as of this report is forecastCBD, a cannabinoid with established therapeutic uses including pain relief and reducing muscle spasms associated with epilepsy or muscular sclerosis.
Hemp Industry Daily estimates that the U.S. market for hemp-derived CBD will hit approximately $4.7 billion in 2021, with the potential to accelerate, with an anticipated growth of an average of 27% overeclipse $6 billion annually by 2024 - a substantial increase in just a few years.
Expect hemp-derived cannabinoid products low in THC to take increasing market share (and media attention) in the next four years to an expected market value greater than $45 billion by the end of 2020. Table 2 and Figure 3 provide estimated market growth from 2011 to 2018. This growth assumes that no additional states legalize. If additional states legalize, growth estimates will likely increase significantly.overall cannabis industry.
Table 2: US Industry Estimates, 2013 to 2018
| 2011 | 2012 | 2013 | 2014 | 2015 | 2016 | 2017 | 2018 | |||||||||||||||||||||||||
| Medicinal | 1.5 | 1.2 | 1.6 | 1.9 | 2.3 | 2.9 | 3.5 | 4 | ||||||||||||||||||||||||
| Recreational | 0.07 | 1.4 | 2 | 2.5 | 4.2 | |||||||||||||||||||||||||||
| Total | 1.5 | 1.2 | 1.6 | 1.97 | 3.7 | 4.9 | 6 | 8.2 | ||||||||||||||||||||||||
Billions of Dollars, US
Source: (Brown and Resnick, 2013; California Department of Public Health, 2014b; CannaBusiness Media, 2014; Colorado Office of Research and Analysis, 2013a, 2013b, 2013d, 2013e, 2014; Fairchild, 2013a, 2013b; Galvin, 2013; Illinois Cannabis Patients Association, 2010; Leal, 2014;2021 Marijuana Business Daily, 2013; Officea division of Financial Management, 2012)Anne Holland Ventures Inc.

Figure 3: US Industry Estimates, 2011 to 2018
Market Distribution
Market distribution must be measured indirectly with registered medical consumers and dispensaries. As expected, California has the largest numberStatus of marijuana patients at more than 775,000, followed by Michigan at 179,000 and Colorado with 107,000. Washington is at 125,000 registered patients as listed in Table 3 and illustrated in Figure 4. There are currently an estimated 1.5 million medical marijuana patients in the US.
Table 3: Registered Medical Marijuana Patients 2015
Source: (Marijuana Business Daily 2016; Illinois Cannabis Patients Association, 2010; Leal, 2014; Marijuana Business Daily, 2013)

Figure 4: Registered Medical Marijuana Patients
Another indirect measure of market distribution is the number of medical marijuana dispensaries. Table 4 and Figure 5 provide the distribution of dispensaries across the US. The number of patients and dispensaries are mostly aligned; however, certain states such as Michigan have much higher ratio of patients to dispensaries than other states. This could be the result of inaccurate data.
Table 4: Registered Medical Marijuana Dispensaries
Source: (Marijuana Business Daily 2016; Illinois Cannabis Patients Association, 2010; Leal, 2014; Marijuana Business Daily, 2013)

Figure 5: Registered Medical Marijuana Dispensaries
Competitive Analysis and Benchmarking
Diego was one of the first to the market with a real estate holding and branding business model; however, other companies have since adopted similar strategies. Key differentiators between Diego and its competitors are superior branding, optimized build-out and turnkey grow and retail development, and, most importantly, pre-negotiated acquisition contracts. As with other marijuana-related financial data, collecting benchmark data on Diego competitors was especially challenging in that many of these companies fail to report or are unable to report the fundamentals of financial information. Table 5 provides a financial benchmark of Diego’s nearest competitors.
Table 5: 2013 Real Estate Holding and Branding Financial Benchmark-$000
| Market Cap | Rev | Cost of Rev | Gross Margin % | EBITDA Margin % | Net Profit | |||||||||||||||||||
| Medbox, Inc. (MDBX) | $ | 258,700 | $ | 5,203 | $ | 2,657 | 51.1 | % | -14.8 | % | $ | (660 | ) | |||||||||||
| Advanced Cannabis Solutions, Inc. (CANN) Grey Market (3 Qtrs) | $ | 59,600 | $ | 129 | $ | 23 | 82.2 | % | (542 | %) | $ | (1,277 | ) | |||||||||||
| Mountain High Acquisitions Corp. (MYHI) OTCQB | $ | 14,300 | - | - | - | $ | (1,336 | ) | ||||||||||||||||
| Agritek Holdings, Inc. (AGTK) | $ | 8,410 | $ | 79 | $ | 86 | 7.6 | % | (1189 | %) | $ | (1,453 | ) | |||||||||||
| Home Treasure Finders, Inc. (HMTF)(MJ real estate lessor) | $ | 4,160 | $ | 203 | $ | 0 | INF | (44 | %) | $ | (92 | ) | ||||||||||||
Source: Finance.yahoo.com and CNBC.com
Tourism Effect
The secondary and tertiary effects of the marijuana market have received little attention by market analyst; however, markets such as marijuana tourism could become a significant source of revenue for recreationally legal states. For example, The Netherlands earns $48.55 billion per year in tourist dollars. Of the 10M tourists, 5.5 million or 55% visit marijuana bars and cafes, generating a total of nearly $27 billion and 220,000 jobs. Likewise, Colorado reported note that marijuana tourism is responsible for 90% of all retail sales in resort towns (Weissmann, 2014).
Peak Sales and Product Segmentation
Peak marijuana sales occur during two calendar periods: December/January and July/August. Smokable Marijuana sales exceed other product categories representing 87% of the market, which is followed by concentrates at 7% and edibles at 4% while drinks, topicals, accessories and clones generate the least amount of revenue at less than 1% each. The top marijuana product according to an analysis of a market leading dispensary is Bruce Banner followed by 303 Kush.
Legalization by State
Support for medical and recreational marijuana use has increased significantly over the past 20 years. According to a recent CNN poll, greater than 50% of the US population supports marijuana legalization. Figure 6 illustrates a select set of CNN poll results.

Figure 6: CNN/ORC Poll Results on Marijuana Use in the US
Two states, Colorado and Washington, have passed legislation for recreational marijuana. As the popularity of recreational marijuana becomes more accepted by Americans, it is the Company’s belief that several of the States in which medical marijuana is currently legal will likely follow suit and legalize recreational marijuana. States are learning from one another, refining legislation and establishing realistic tax strategies. The Obama administration has pledged to end Federal raids on state-sanctioned dispensaries (Furlow, 2012). Similar movements are occurring in other democratic countries such as Australia in which several states have decriminalized possession (Thies, 2012). Table 6 lists recreational and medicinal marijuana legalization status by state.
Table 6: State Recreational Marijuana Laws
Source: (Marijuana Business Daily 2016; California State Board of Equalization, 2009; Gacek, 2014; ProCon.org, 2014; U.S. Office of National Drug Control Policy, 2014)
Target Geographies
Diego has entered a rapid growth and expansion stage in its evolution toward becoming an internationally recognized brand. The target geographies for Diego are all US states in which recreational or medicinal marijuana is legalized. This is a phased implementation that carefully pre-stages funding and materials to be first to market, as each state rules on legalization. In certain scenarios, Diego may choose to allow weak competitors to fail, making available prime real estate that otherwise would be inaccessible.
Target Consumers
There are an estimated 1.5M medical marijuana patients in the US and over 5,000 retailers. California has the largest number of marijuana patients at more than 775,000, followed by Colorado with 625,000 and Michigan at 179,000. Washington is a close 4th at 125,000 registered patients.
The demographics for consumers that have tried marijuana at least once, range between ages 18 to 49, with the greatest numbers between the ages 26 and 34. These consumers are predominantly male, and college educated.
Alaska has the fastest growing population of potential consumers, followed by Washington DC, Colorado, New Mexico and Hawaii, with Washington just a few points below. In 2012, Montana, Colorado, California, and Washington had the greatest increase in disposable income, thus increasing the breadth of target consumers.
Future Markets
Studies on marijuana use in The Netherlands have demonstrated that the availability of marijuana in café’s has had very little effect on increasing or decreasing marijuana use (MacCoun, 2011). As such, the next progression in the US market, following Federal legalization, is the establishment of café’s or other types of service centers for marijuana consumption. The number of café’s in The Netherlands has ranged between 700 and 800 over the past 15 years, and currently operates about 700 or 1 per 29,000 citizens, employing 4,000 workers and generating $832.2M annually (Monshouwer, Van Laar, and Vollebergh, 2011). Extrapolating this to the US market would indicate approximately 10,000 café’s and service centers where actual consumption of cannabis can take place.
Primary Service
Our primary service is fully branded and built real estate to qualified tenants. Our branding includes non-cannabis infused products, apparel, and other tangible products at a wholesale rate. To become a qualified tenant, Diego requires its tenants to strictly adhere to testing and labeling requirements along with all state laws and federal guidelines to assure quality and consistency of marijuana products, ensuring safe sale and consumption. Table 7 provides a list of our current property portfolio.
Table 7: Property Portfolio
Diego Pellicer creates a user friendly customer experience regardless of venue or form of media making it easy and safe for them to purchase. A major aspect of our marketing plan is to inform and educate consumers in a way that allows them to rely on DP as a trusted and valued brand. DP information and products will be available in all forms of media with a variety of different forms of content including videos, social media, online newsletters and blogs and TV.
This will give our brand, products and content the flexibility and portability that consumers demand. This digital syndication strategy will be executed through a series of revenue sharing deals with partners through viral seeding strategies and via paid media through specific targeted websites and venues.
Revenue Generation and Growth
Diego generates current revenue and stages future revenue streams through the following processes:
U.S. Federal Law
While marijuana is legal under the laws of several U.S. States, (with vastly differing restrictions), at the present time the concept of “medical marijuana” and “retail marijuana” do not exist under U.S. federal law. The United StatesFederal Controlled SubstancesSubstance Actclassifies “marijuana”marijuana as a Schedule I drug. UnderAs defined under U.S. federal law, a Schedule I drug or substance has a high potential for abuse, no accepted medical use in the United States, and a lack of safety for the use of the drug under medical supervision.
The United States Supreme Court has ruled in a number ofseveral cases that the federal government does not violate the federal constitution by regulating and criminalizing cannabis, even for medical purposes. Therefore, federal law criminalizing the use of marijuana pre-empts state laws that legalizes its use for medicinal and recreational purposes.
12
In a memorandum dated August 29, 2013 addressed
Attorney General Jeff Sessions’ January 2018 decision to “All United States Attorneys” from James M.rescind the Cole Memo raised some concerns in the marijuana industry that federal officials may try to interfere with legal cannabis. Those concerns, for the most part, haven’t materialized, but the scare did get many marijuana businesses thinking about the possibility of federal interference and what could be done about it.
The memo was drafted during the Obama administration by former U.S. Deputy Attorney General (“James Cole Memo”),in 2013 as a way to minimize the threat of federal crackdowns against legal marijuana businesses. The document essentially instructed federal law enforcement not to interfere with state-licensed marijuana businesses complying with state laws and certain conditions, such as not selling product to minors or into the black market.
While the Cole Memo clearly expressed an Obama administration policy of leaving legal marijuana businesses alone, it was not a legal change - which only Congress can do. Therefore, the Cole Memo technically allowed U.S. attorneys to go after marijuana businesses if they wanted. With the sending of the Cole Memo to the proverbial shredder, U.S. attorneys no longer have guidelines on how to deal with state-licensed marijuana businesses. But in an April 2018 conversation with Republican U.S. Sen. Cory Gardner, President Donald Trump pledged to keep the Department of Justice acknowledged that certain U.S. States had enactedfrom interfering with state cannabis laws relatingand, perhaps more significantly, support legislation protecting state-legal marijuana businesses. White House officials later confirmed the president’s policy stance.
As the Biden administration continues to dive deeper into its policy agenda, cannabis is a topic to watch. Though the administration has been focused on tackling immediate priorities, marijuana is likely to rise to the surface in the near term.
Several bills have been introduced to Congress seeking to reform federal marijuana laws in different ways, including the removal of cannabis from the list of controlled substances, allowing MJ companies to access traditional banking services and amending the IRS code to more fairly tax cannabis businesses. Similar bills have been introduced in previous sessions of Congress, but none have gained significant traction. This time, however, may be different, as marijuana reform has become a bipartisan issue that has the support of many prominent Democrats and Republicans.
The Current Landscape
President Biden’s views on marijuana legalization—as well as the Democratic Party’s—have evolved over time, as reflected in the 2020 Democratic Party Platform. In it, the party stated it would “decriminalize marijuana use and reschedule it through executive action on the federal level. [It would] support legalization of medical marijuana, and outlinedbelieve[d] states should be able to make their own decisions about recreational use.” Medical marijuana is legal in 36 states and, since February 2021, when New Jersey passed its own legalization bill, recreational cannabis is legal in 15 states. Additionally, some states such as Mississippi, where recreational use is not legal, have agreed to lessen the U.S.penalties for possession, while other states like Illinois are expunging arrests related to marijuana possession. New York Governor Andrew M. Cuomo has signed legislation (S.854-A/A.1248-A) legalizing adult-use cannabis, fulfilling a key component of his 2021 State of the State agenda
With Democrats controlling Congress and the White House, and with the cannabis industry growing ever larger, many expect Congress to soon take up the issue of cannabis in earnest. “Ending the federal government’s enforcement prioritiesmarijuana prohibition is necessary to right the wrongs of this failed [War on Drugs] and end decades of harm inflicted on communities of color across the country,” said Senate Majority Leader Chuck Schumer (D-NY), along with Cory Booker (D-NJ) and Ron Wyden (D-OR), in a February 2021 joint statement.
Bipartisan support is swelling. A December 2020 poll found that two-thirds of all Americans, including 51 percent of Republicans, supported a December 2020 bill to federally legalize marijuana. Although the House omitted marijuana legalization in its most recent COVID relief bill, there are three marijuana-related pieces of major legislation that could pass during this congressional term:
The SAFE Banking Act, which provides a path for the financial system with respect to cannabis.
The MORE Act, which addresses some of the societal injustices created by the War on Drugs.
The STATES Act, which protects individuals who comply with state laws regulating marijuana.
All three bills are expected to be re-addressed during this congressional term.
The Biden administration has yet to formally weigh in on or issue an executive order concerning marijuana notwithstandingreform. However, when asked at his confirmation hearing if he thought 2014 Financial Crimes Enforcement Network (FinCEN) guidance should be updated to “set expectation for financial institutions that provide services to cannabis-related industries” and what steps he would take, Deputy Secretary of Treasury nominee Adewale Adeyamo said that he planned to address the fact that certainissue if confirmed.
What This Means for Business
Organizations of all types should be mindful of the current landscape as it relates to cannabis, given the impact the pending legislation will have on law and rulemaking in the workplace. However, two sectors should pay particularly close attention to action in this space: the investment community and the financial services industry.
Investment Community
Descheduling and decriminalizing marijuana, as well as legalizing it to any degree, would open a larger window of opportunity to list cannabis-related stocks on U.S. Statesexchanges. While providing more legal oversight of the industry would offer the potential for more jobs and revenue by supplying incentive for more people and entities to dive into the industry, it would also open the door for fraud risk. New market entrants should be vetted, as the risk of counterfeit products is high. As they do when deciding to fund any new product or venture, investors should assess their safeguards and risk mitigation framework before diving in.
Financial Services Industry
Banks in particular have legalizedlong had a complicated relationship with marijuana-related businesses (MRBs). For the most part, MRBs do not have access to the banking industry. They are unable to accept credit cards, deposit revenues, access loans, or decriminalizedwrite checks to meet payroll or pay taxes, which makes them vulnerable. However, until cannabis is federally legal, financial services will continue to be handled by local providers, such as credit unions, which presents both opportunities and risks. Since regulations vary from state to state, bringing on a MRB client is complex and does not always align with prescribed risk. However, as the use, sale and manufacture of marijuana:$56 billion industry continues to grow, banks must continue to evaluate whether it makes financial sense to consider banking this contradictory industry.
13
ThereEven if the current administration makes banking MRBs more feasible, financial institutions should still evaluate clients on a case-by-case basis, ensuring compliance is no guaranteestrong at the core. Banks will need to ensure that MRBs—like other high-risk clients—are equipped with the right technology, ample compliance staff training, and clear parameters on risks and red flags. As compliance teams increasingly find their mandates growing and their resources stagnating or shrinking, looking to outsourced financial crimes risk management solutions can also provide some reprieve and support for managing this risk.
Despite movement on the federal marijuana front, organizations of all types should be mindful that the current presidential administration willlaw has not changed yet—and if change its stated policy regardingdoes occur at the low-priority enforcement of U.S. federal laws that conflictlevel, consulting with state laws. Additionally,legal counsel and third-party risk experts before engaging in any new U.S. federal government administration that follows could change this policy and decide to enforce the U.S. federal laws vigorously. Any such change in the U.S. federal government’s enforcement of current U.S. federal laws could cause adverse financial impact to the Company’s business. See“Risk Factors.”sector or product remains advisable.
In February 2014, FinCEN issued guidelines allowing banks to legally provide financial services to Licensed Operators that hold a valid License (“FinCEN Memo”). The rules re-iterated the guidance provided by the Cole Memo, stating that banks can do business with Licensed Operators and “may not” be prosecuted. The guidelines provide that “it is possible [for the banks] to provide financial services” to Licensed Operators and while remaining in compliance with federal anti-money laundering laws. The guidance falls short of the explicit legal authorization that banking industry officials anticipated and the outcome of the banks relying on this guidance in transacting with Licensed Operators is currently unclear. See“Risk Factors.”Source: K2 Integrity New York, NY
Employees
We presently have 5 full-time employees and 0 part-time employees. We consider our relationship with our employees to be excellent. We also had independent consultants under contract to provide financial management services, business development services, and sales management services. In addition to the diverse technical, intellectual property, legal, financial, marketing and business expertise of our professional team, from time to time we rely on advice from outside specialists to fulfill unique technology and other needs.
We are a smaller reporting company as defined by Rule 12b-2 of the Exchange Act and are not required to provide the information under this item.
Item 1B.Unresolved Staff Commentsitems
None.
Our principal executive office is located at 3435 Ocean Park Blvd.6160 Plumas St. Suite 100, Reno NV 89519.
The Company leases real estate to licensed marijuana operators.
The properties generating rents in 2021 and 2020 are as follows:
| Purpose | Size | City | State | |||
| Retail store (recreational and medical) | 3,300 sq. | Denver | CO | |||
| Cultivation warehouse – terminated October 2020 | 18,600 sq. | Denver | CO | |||
| Cultivation warehouse | 14,800 sq. | Denver | CO |
The Company’s three properties in Denver, CO (one terminated in October 2020) are leased to Royal Asset Management, LLC (“RAM”). RAM opened the Diego Denver branded flagship store in February 2017. This store is known as “Diego Colorado”. The retail facilities have shown steady growth in sales since opening. For the other two properties subleased (one terminated in October 2020), #107-610, Santa Monica, CA 90405,RAM uses these properties for its cultivation facilities in Denver, CO. Production at these facilities began in late 2016. The Company is currently in litigation with RAM regarding outstanding amounts due on the leases.
In October 2020, the master lease and sublease associated with the 18,600 sq. cultivation warehouse in Denver were terminated.
Our premises are suitable for our telephone number is (516) 900-3799.current operations.
On May 10, 2021, a lawsuit was filed against the Company, along with other defendants, by plaintiff Erin Turoff in the District Court, City and County of Denver, State of Colorado. The specific allegations against the Company include civil theft and civil conspiracy and the plaintiff is seeking actual and compensatory damages. No specific monetary amount was demanded in the lawsuit. On July 8, 2021, the Company filed an answer to the complaint, denying the allegations. The Company believes that the suit is without merit and that the Company will ultimately prevail in any litigation.
From time to time,
Other than as listed above. we may become involved in various lawsuits and legal proceedings which arise in the ordinary course of business. However, litigation is subject to inherent uncertainties and an adverse result in these or other matters may arise from time to time that may harm our business. We are currently not aware of any such legal proceedings or claims against the Company that we believe will have a material adverse effect on our business, financial condition or operating results.
Item 4. Mine Safety Disclosures
Not applicable.
14
Not applicable.
Item 5. Market for Registrant’s Common Equity, Related Stockholder Matters and Issuer Purchases of Equity Securities
The table below sets forth the range of quarterly high and low closing sales prices for its common stock for 2021 and 2020. The quotations below reflect inter-dealer prices, without retail mark-up, mark-down or commission and may not represent actual transactions:
| High | Low | |||||||
| Year ended December 31, 2021 | ||||||||
| First Quarter | $ | 0.18 | $ | 0.01 | ||||
| Second Quarter | $ | 0.07 | $ | 0.03 | ||||
| Third Quarter | $ | 0.04 | $ | 0.01 | ||||
| Fourth Quarter | $ | 0.02 | $ | 0.01 | ||||
| High | Low | |||||||
| Year ended December 31, 2020 | ||||||||
| First Quarter | $ | 0.01 | $ | 0.01 | ||||
| Second Quarter | $ | 0.02 | $ | 0.01 | ||||
| Third Quarter | $ | 0.02 | $ | 0.01 | ||||
| Fourth Quarter | $ | 0.01 | $ | 0.01 | ||||
There is no established public trading market for our Common Stock. As of the date of this Report, there are outstanding options and warrants to purchase 3,425,798 shares of Common Stock of the Registrant.
Record Holders
As of April 19, 2016,8, 2022, there were approximately 143205 shareholders of record holding a total of 41,572,082260,661,121 shares of Common Stock.common stock, including shares held in “street name” by banks, brokerage clearing houses, depositories or otherwise in unregistered form. The Company does not know the beneficial owners of such shares, or the number of beneficial holders of the Common Stock are entitled to one vote for each share held of record on all matters submitted to a vote of shareholders. Holders of the Common Stock have no preemptive rights and no right to convert their Common Stock into any other securities. There are no redemption or sinking fund provisions applicable to the Common Stock.such shares.
DividendsDividend Distributions
The RegistrantCompany has not declared any cash dividends since inception and does not anticipate paying any dividends in the foreseeable future. The payment of dividends is within the discretion of the Board of Directors and will depend on the Company’s earnings, capital requirements, financial condition, and other relevant factors. There are no restrictions thatWe currently limitexpect to use all available funds to finance the Registrant’s ability to payfuture development and expansion of our business and do not anticipate paying dividends on its Commonour common Stock in the foreseeable future.
Penny Stock
Our common stock is considered “penny stock” under the rules the Securities and Exchange Commission (the “SEC”) under the Securities Exchange Act of 1934. The SEC has adopted rules that regulate broker-dealer practices in connection with transactions in penny stocks. Penny stocks are generally equity securities with a price of less than $5.00, other than securities registered on certain national securities exchanges or quoted on the NASDAQ Stock Market System, provided that current price and volume information with respect to transactions in such securities is provided by the exchange or quotation system. The penny stock rules require a broker-dealer, prior to a transaction in a penny stock, to deliver a standardized risk disclosure document prepared by the Commission, that:
| - | contains a description of the nature and level of risks in the market for penny stocks in both public offerings and secondary trading; |
| - | contains a description of the broker's or dealer's duties to the customer and of the rights and remedies available to the customer with respect to a violation to such duties or other requirements of Securities' laws; contains a brief, clear, narrative description of a dealer market, including bid and ask prices for penny stocks and the significance of the spread between the bid and ask price; |
| - | contains a toll-free telephone number for inquiries on disciplinary actions; |
| - | defines significant terms in the disclosure document or in the conduct of trading in penny stocks; and |
| - | contains such other information and is in such form, including language, type, size and format, as the Commission shall require by rule or regulation. |
The broker-dealer also must provide, prior to effecting any transaction in a penny stock, the customer with:
| - | bid and offer quotations for the penny stock; |
| - | the compensation of the broker-dealer and its salesperson in the transaction; |
| - | the number of shares to which such bid and ask prices apply, or other comparable information relating to the depth and liquidity of the marker for such stock; and |
| - | monthly account statements showing the market value of each penny stock held in the customer's account. |
In addition, the penny stock rules that require that prior to a transaction in a penny stock not otherwise exempt from those generally imposed by applicable state law.rules; the broker-dealer must make a special written determination that the penny stock is a suitable investment for the purchaser and receive the purchaser’s written acknowledgement of the receipt of a risk disclosure statement, a written agreement to transactions involving penny stocks, and a signed and dated copy of a written suitably statement.
These disclosure requirements may have the effect of reducing the trading activity in the secondary market for our stock.
15
Unregistered Sale
Related Stockholder Matters
None.
Issuer Purchases of Equity Securities
In November 2015,We made no share repurchases during the Companyyear ended December 31, 2021.
Unregistered Sales of Equity Securities and Use of Proceeds
During 2021, we issued 1,100,0005,026,413 shares of common stock upon the conversion of $100,000 of notes and $6,256 of accrued interest.
During 2021, we issued 1,167,826 shares of common stock, valued at $17,915, for services.
During 2021, we issued 7,635,992 shares of common stock, valued at $172,283, for related party services.
On September 2, 2021, we issued 976,526 shares of common stock in exchange for 20,000 shares of Series C Convertible Preferred Shares to Geneva.
On September 8, 2021, we issued 2,512,077 shares of common stock in exchange for 50,000 shares of Series C Convertible Preferred Shares to Geneva.
On September 14, 2021, we issued 1,890,909 shares of common stock in exchange for 30,000 shares of Series C Convertible Preferred Shares to Geneva.
On September 22, 2021, we issued 2,915,888 shares of common stock in exchange for 30,000 shares of Series C Convertible Preferred Shares to Geneva.
On September 30, 2021, we issued 5,400,418 shares of common stock in exchange for 49,850 shares of Series C Convertible Preferred Shares to Geneva.
On October 7, 2021, we issued 4,378,947 shares of common stock in exchange for 40,000 shares of Series C Convertible Preferred Shares to Geneva.
On October 18, 2021, we issued 4,378,947 shares of common stock in exchange for 40,000 shares of Series C Convertible Preferred Shares to Geneva.
On October 19, 2021, we issued 3,705,684 shares of common stock in exchange for 33,850 shares of Series C Convertible Preferred Shares to Geneva.
In connection with the issuances of the foregoing securities, the Company relied on the exemptions from registration provided by Section 4(a) (2) of, and Rule 506 of Regulation D promulgated under, the Securities Act of 1933, as amended, for transactions not involving a public offering.
16
Item 6. [Reserved]
Item 7. Management’s Discussion and Analysis of Financial Condition and Results of Operations
The following discussion and analysis of the results of operations and financial condition for the years ended December 31, 2021 and 2020 should be read in conjunction with our consolidated financial statements and the notes to those consolidated financial statements that are included elsewhere in this Annual Report. Our discussion includes forward-looking statements based upon current expectations that involve risks and uncertainties, such as our plans, objectives, expectations and intentions. Actual results and the timing of events could differ materially from those anticipated in these forward-looking statements as a result of a number of factors. See “Forward-Looking Statements.”
COVID-19
On January 30, 2020, the World Health Organization (“WHO”) announced a global health emergency in response to a new strain of a coronavirus (the “COVID-19 outbreak”). In March 2020, the WHO classified the COVID-19 outbreak as a pandemic based on the rapid increase in exposure globally. The full impact of the COVID-19 outbreak continues to evolve as of the date of this report. Management is actively monitoring the global situation and its effects on the Company’s industry, financial condition, liquidity, and operations. Given the daily evolution of the COVID-19 outbreak and the global responses to curb its spread, the Company is not able to estimate the effects of the COVID-19 outbreak on its results of operations, financial condition, or liquidity for fiscal year 2022. However, if the pandemic continues, it may have a material adverse effect on the Company’s results of future operations, financial position, and liquidity in fiscal year 2022.
Overview
Diego Pellicer Worldwide, Inc. was established on August 26, 2013 to take advantage of growing market for legalized cannabis being made possible by the escalating legislation allowing for the legalization of cannabis operations in the majority of states:
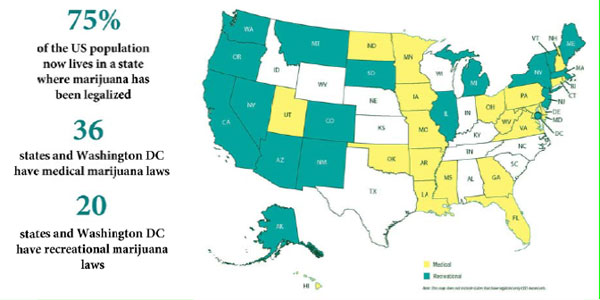
The industry is operating under stringent regulations within the various state jurisdictions. The Company’s primary business plan is twofold: First to lease various properties to licensed operators in these jurisdictions to grow, process and sell cannabis and related products, and the second the Diego Pellicer Management Company, will license the upscale Diego Pellicer brand to qualified operators and receive royalty payments, while providing expertise in retail, product and manufacturing from Diego’s management team. The Company will also provide educational training, compliance consultation, branding, and related accessories to their tenants. These leases and management agreements are expected to provide substantial streams of income. We believe that as laws evolve, it is possible that we will have the opportunity to participate directly in these operations. Accordingly, the Company will selectively negotiate an option on our tenants’ operating company.
Source: Headset & 2020 Marijuana Business Daily, a division of Anne Holland Ventures Inc.
The legalization taking place in other states such as California and Florida present opportunities many times that of Washington and Colorado. The Company is exploring opportunities in Oregon, California and Florida and is getting inquiries from other potential operators in other jurisdictions.
17
Summary
The Company’s primary business objective is to lease various properties to licensed operators to grow, process and retail cannabis and related products. By developing a premium brand name, building upscale facilities, and providing quality accessories to a market where financing is difficult to obtain, these subleases are designed to provide a substantial stream of income. We believe that as laws evolve, it is possible that we will have the opportunity to participate directly in these operations as well.
2019 was a time of continued growth and a change of focus for the Company. An effective and experienced team was assembled from within our operators to develop our newly formed management company, and to complement the current executives with knowledge and experience in real estate operations, banking, site selection, branding, facility design, corporate finance, investor relations, store management, and grow expertise, Additional capital needed to be raised in order to have sufficient capital to help support our operators expand within their markets, and to begin the expansion into different markets in the US. Much of the Company’s debt was renegotiated, and additional commitments were formalized for the expansion in the Colorado market. New markets had to be explored, new alliances forged, and opportunities prioritized. 2020 was a year of strategic alliances and developing a strong operating structure that would be used to compliment any new acquisition, and guiding our branded tenants. An effective and experienced team was developed from within our operators to develop our management company. The Company has been working diligently to renegotiate our debt and lower our convertible debt in anticipation of the merger and acquisition phase of the Company. The Company divested itself from a poor performing lease and secured all the potential future premium rents from our branded tenant, at the same time as securitizing deferred rents from this tenant in the form of a note with specific short term repayment functions. The Company has started numerous introductory discussions with potential acquisitions that would follow one of the key requirements at being additive to our consolidated financial statements.
2021 was a year where the Company took advantage of the changes in the continued advancement of cannabis legalization in the USA, and the growth in the hemp industry to mid year pivot the main focus of the Company to expand its branding and management businesses. The company actively searched for viable acquisitions in both the legal cannabis and hemp industries, that would be additive to our consolidated financial statements. The Company opened negotiations with a company in the hemp and CBD industry to acquire all their operations for a combination of company stock and cash.
Plans of Operation
Diego is currently exploring opportunities in California, Colorado, Nevada, Florida, Washington and other states. The Company will continue to raise capital to finance that expansion. This should result in increased revenues for the future and increased opportunities into new markets.
Recent Developments
On February 8, 2022, the Company entered into an Equity Purchase Agreement (the “Purchase Agreement”), with Hemp Choice Distribution, LLC, a Colorado limited liability company (“HCD”), its owners (the “Sellers”), and Gabriela Vergara (the “Sellers’ Representative”), pursuant to which the Company has agreed to acquire all of the issued and outstanding equity interests of HCD (“Membership Interests”). The closing of the transaction is expected to occur within 90 days from the date of the Purchase Agreement (the “Closing”).
The purchase price for the Membership Interests shall be the aggregate amount of $4,400,000 payable at the Closing as follows: (i) $250,000 in cash by wire transfer of immediately available funds; (ii) the number of restricted shares of the Company’s common stock that is equal to $250,000 divided by the current market price at the time of Closing, but such price shall not be greater than $.05 per share or less than $.02 per share: and (iii) three million nine hundred thousand dollars ($3,900,000) in the form of 390,000 shares of redeemable preferred stock (with a stated value of $10.00 per share) of the Company. The terms of the redeemable preferred shares shall be specifically and fully set forth in a Certificate of Designations to be filed with the State of Delaware at the time of Closing. After the Closing, the Company agrees to provide HCD with a line of credit or assist it in obtaining a line of credit from a third party for service renderedof up to $1,000,000. In addition, the business of HCD shall continue to be managed by Sellers’ Representative subject to the conditions of an employment agreement to be entered into by the Company and 3,381,251 sharesof common stock for cash received in amount of 1,014,374.Sellers’ Representative prior to the Closing.
18
RESULTS OF OPERATIONS
Year ended December 31, 2021 compared to year ended December 31, 2020
After rental expense the gross margins on the lease were as follows:
| Year Ended | Year Ended | Increase (Decrease) | ||||||||||||||
| December 31, 2021 | December 31, 2020 | $ | % | |||||||||||||
| Revenues | ||||||||||||||||
| Net rental revenue | $ | 768,516 | $ | 1,265,137 | $ | (496,621 | ) | -39 | % | |||||||
| Rental expense | (624,619 | ) | (1,006,581 | ) | 381,962 | 38 | % | |||||||||
| Gross profit | 143,897 | 258,556 | (114,659 | ) | -44 | % | ||||||||||
| General and administrative expenses | 857,260 | 1,029,185 | (171,925 | ) | -17 | % | ||||||||||
| Selling expense | 35,486 | 32,940 | 2,546 | 8 | % | |||||||||||
| Loss from operations | $ | (748,849 | ) | $ | (803,569 | ) | $ | 54,720 | 7 | % | ||||||
Revenues. For the year ended December 31, 2021 the Company leased two facilities to licensees in Colorado. For the year ended December 31, 2020, the company leased three facilities until October 2020. The year ended December 31, 2021 is the beginning of the fourth year of operations for these licensees. Diego, is no longer forbearing the premium rents contractually due from the tenant as a result of the cost of leasehold improvements, but is still forbearing the deferral of preopening rents. These will become recorded as revenue when the Company considers all the premium rents collectible considering the relative success of the tenant’s operations. In October 2020 one of the leases and the related sublease was terminated. As a result, total revenue for the year ended December 31, 2021 was $768,516, as compared to $1,265,137 for the year ended December 31, 2020, a decrease of $496,621. The cultivation warehouse lease was extended during 2021 through July 31, 2024.
Gross profit. Rental revenue for the period ended December 31, 2021 decreased over the prior year ended December 31, 2020, resulting in a gross profit of $143,897, a decrease of $114,659 from 2020 gross profit of $258,556.
General and administrative expense. Our general and administrative expenses for the year ended December 31, 2021 were $857,260, compared to $1,029,185 for the year ended December 31, 2020. The decrease of $171,925 was largely attributable to a reduction in stock based executive compensation and a decrease in professional fees.
Selling expense. Our selling expenses for the year ended December 31, 2021 were $35,486, compared to $32,940 for the year ended December 31, 2020. The increase of $2,546 was due to increased services used related to selling and marketing.
| Year Ended | Year Ended | Increase (Decrease) | ||||||||||||||
| December 31, 2021 | December 31, 2020 | $ | % | |||||||||||||
| Other income (expense) | ||||||||||||||||
| Interest income | $ | 85,341 | $ | 150,577 | $ | (65,236 | ) | -43 | % | |||||||
| Other income | 46,065 | 236,705 | (190,640 | ) | -81 | % | ||||||||||
| Forgiveness of debt income | 56,908 | — | 56,908 | 100 | % | |||||||||||
| Interest expense | (662,721 | ) | (1,994,199 | ) | 1,331,478 | 67 | % | |||||||||
| Lease termination payments | 137,434 | 33,851 | 103,583 | 306 | % | |||||||||||
| Gain on termination of lease | — | 55,256 | (55,256 | ) | -100 | % | ||||||||||
| Extinguishment of debt | 330,576 | (9,387 | ) | 339,963 | 3,622 | % | ||||||||||
| Change in derivative liabilities | 3,727,226 | (670,152 | ) | 4,397,378 | 656 | % | ||||||||||
| Change in value of warrants | 38 | 491 | (453 | ) | -92 | % | ||||||||||
| Total other income (loss) | $ | 3,720,867 | $ | (2,196,858 | ) | $ | 5,917,725 | 269 | % | |||||||
The increase in net other income resulted primarily from the effects that the changes in market value of the Company’s stock had on the derivative liability associated with our convertible debt and preferred stock, plus a decrease in interest expense and financing costs of debt incurred by the Company.
LIQUIDITY AND CAPITAL RESOURCES
| Year Ended | Year Ended | Increase (Decrease) | ||||||||||||||
| December 31, 2021 | December 31, 2020 | $ | % | |||||||||||||
| Net Cash used in operating activities | $ | (232,915 | ) | $ | (346,448 | ) | $ | 113,533 | 33 | % | ||||||
| Net Cash provided by investing activities | — | — | — | — | % | |||||||||||
| Net Cash provided (used) by financing activities | (45,800 | ) | 356,866 | (402,666 | ) | 113 | % | |||||||||
| Net Increase (Decrease) in Cash | (278,715 | ) | 10,418 | (289,133 | ) | -2,775 | % | |||||||||
| Cash - beginning of year | 327,864 | 317,446 | 10,418 | |||||||||||||
| Cash - end of year | $ | 49,149 | $ | 327,864 | $ | (278,715 | ) | -85 | % | |||||||
19
Item 6. Selected Financial Data
Operating Activities. For the year ended December 31, 2021, the net cash used of $232,915 was a decrease over the same period of the prior year of $113,533. The loss from operations after non-cash adjustments increased by $124,079 from the prior year.
Investing Activities. There were no investing activities for the years ended December 31, 2021 and 2020.
Financing Activities. During the year ended December 31, 2021, we loaned an aggregate of $124,000 to an entity and received repayments of principal of $11,200. We received $267,000 from the sale of preferred stock. Payments of convertible notes payable was $200,000. During the year ended December 31, 2020, we received $306,444 in proceeds from notes payable and convertible notes payable and $100,000 from the sale of preferred stock. Payments of convertible notes payable was $49,578.
Going Concern Qualification
The accompanying consolidated financial statements have been prepared assuming that the Company will continue as a going concern. The Company has incurred losses since inception, its current liabilities exceed its current assets by $8,372,169 at December 31, 2021, and it has an accumulated deficit of $52,137,982 at December 31, 2021. These factors raise substantial doubt about its ability to continue as a going concern over the next twelve months. The financial statements do not include any adjustments that might result from the outcome of this uncertainty.
Although the Company has been successful raising additional capital, there is no assurance that the company will sell additional shares of stock or borrow additional funds. The Company’s inability to raise additional cash could have a material adverse effect on its financial position, results of operations, and its ability to continue in existence. These financial statements do not include any adjustments that might result from the outcome of this uncertainty. Management believes that the Company’s future success is dependent upon its ability to achieve profitable operations, generate cash from operating activities and obtain additional financing. There is no assurance that the Company will be able to generate sufficient cash from operations, sell additional shares of stock or borrow additional funds. However, cash generated from lease revenues is currently exceeding lease costs, but is insufficient to cover operating expenses.
Critical Accounting Policies
Our critical accounting policies are included in Note 2 – “Summary of Significant Accounting Policies” of Notes to Consolidated Financial Statements included in this Annual Report.
Off-Balance Sheet Arrangements
We have no off-balance sheet arrangements.
Recently Issued Accounting Standards
Our recently issued accounting standards are included in Note 2 – “Summary of Significant Accounting Policies” of Notes to Consolidated Financial Statements included in this Annual Report.
Item 7A. Quantitative and Qualitative Disclosure about Market Risk.
We are a smaller reporting company as defined by Rule 12b-2 of the Exchange Act and are not required to provide the information under this item.
20
Item 8. Financial Statements and Supplementary Data.
Diego Pellicer Worldwide, Inc.
December 31, 20152021 and 20142020
Index to the Consolidated Financial Statements
REPORT OF INDEPENDENT REGISTERED PUBLIC ACCOUNTING FIRM
21
The
Report of Independent Registered Public Accounting Firm
Board of Directors and StockholdersShareholders
Diego Pellicer Worldwide, Inc.
Opinion on the Financial Statements
We have audited the accompanying consolidated balance sheet of Diego Pellicer Worldwide, Inc. (the “Company”) as of December 31, 2021 and 2020 and the related consolidated statements of operations, redeemable convertible preferred stock and stockholders’ deficit and cash flows for the years then ended, and the related notes (collectively referred to as the “consolidated financial statements”). In our opinion, the consolidated financial statements present fairly, in all material respects, the financial position of the Company as of December 31, 2021 and 2020, and the results of its operations and its cash flows for the years then ended in conformity with accounting principles generally accepted in the United States of America.
The Company’s Ability to Continue as a Going Concern
The accompanying consolidated financial statements have been prepared assuming the Company will continue as a going concern. As discussed in Note 3 to the accompanying consolidated financial statements, the Company has suffered recurring losses from operations, generated negative cash flows from operating activities, and has an accumulated deficit that raise substantial doubt about its ability to continue as a going concern. Management's plans in regard to these matters are described in Note 3. The consolidated financial statements do not include any adjustments that might result from the outcome of this uncertainty.
Basis for Opinion
These consolidated financial statements are the responsibility of the entity’s management. Our responsibility is to express an opinion on the entity’s consolidated financial statements based on our audit. We are a public accounting firm registered with the Public Company Accounting Oversight Board (United States) ("PCAOB") and are required to be independent with respect to Company in accordance with the U.S. federal securities laws and the applicable rules and regulations of the Securities and Exchange Commission and the PCAOB.
We conducted our audit in accordance with the standards of the PCAOB. Those standards require that we plan and perform the audit to obtain reasonable assurance about whether the financial statements are free of material misstatement, whether due to error or fraud. The Company is not required to have, nor were we engaged to perform, an audit of its internal control over financial reporting. As part of our audit we are required to obtain an understanding of internal control over financial reporting but not for the purpose of expressing an opinion on the effectiveness of the entity’s internal control over financial reporting. Accordingly, we express no such opinion.
Our audit included performing procedures to assess the risks of material misstatement of the consolidated financial statements, whether due to error or fraud, and performing procedures that respond to those risks. Such procedures included examining, on a test basis, evidence regarding the amounts and disclosures in the consolidated financial statements. Our audit also included evaluating the accounting principles used and significant estimates made by management, as well as evaluating the overall presentation of the consolidated financial statements. We believe that our audit provides a reasonable basis for our opinion.
Critical Audit Matters
The critical audit matters communicated below are matters arising from the current period audit of the consolidated financial statements that were communicated or required to be communicated to the audit committee and that: (1) relate to accounts or disclosures that are material to the financial statements and (2) involved our especially challenging, subjective, or complex judgments. The communication of critical audit matters does not alter in any way our opinion on the financial statements, taken as a whole, and we are not, by communicating the critical audit matters below, providing separate opinions on the critical audit matters or on the accounts or disclosures to which they relate.
F-1
| December 31, 2015 | December 31, 2014 | |||||||
| ASSETS | ||||||||
| Current Assets: | ||||||||
| Cash and equivalents | $ | 36,001 | $ | 33,101 | ||||
| Accounts receivable | 1,110 | - | ||||||
| Prepaid expenses | - | 8,946 | ||||||
| Inventory | 80,971 | - | ||||||
| Other receivable | 17,817 | - | ||||||
| Total current assets | 439,667 | 42,047 | ||||||
| Property and Equipment, net | 838,754 | 253,990 | ||||||
| Other Assets: | ||||||||
| Investments, at cost, net of impairment of $408,900 and $0 | 116,667 | 525,567 | ||||||
| Security deposits | 173,000 | 173,000 | ||||||
| Deposits - end of lease | 150,000 | 150,000 | ||||||
| Total other assets | 439,667 | 848,567 | ||||||
| Total assets | $ | 1,414,320 | $ | 1,144,604 | ||||
| Liabilities and Stockholder’s Deficiency | ||||||||
| Current liabilities: | ||||||||
| Accounts payable and accrued expense | $ | 585,997 | $ | 298,939 | ||||
| Accrued expenses - related party | 511,454 | 124,333 | ||||||
| Accrued compensation | 6,250 | 1,176,563 | ||||||
| Deferred rent | 120,234 | - | ||||||
| Deferred revenue | 53,000 | 53,000 | ||||||
| Note Payable | 846,628 | - | ||||||
| Convertible debt | 300,000 | - | ||||||
| Derivative Liabilities | 208,795 | - | ||||||
| Total current liabilities | 2,632,358 | 1,652,835 | ||||||
| Deferred Revenue | 370,000 | 424,000 | ||||||
| Total liabilities | 3,002,358 | 2,076,835 | ||||||
| Stockholder’s Deficiency | ||||||||
| Series A and B Preferred Stock, $0.0001 par value, 5,000,000 shares authorized, 0 and 5,036,769 shares issued and outstanding as of December 31, 2015 and 2014, respectively | - | 5 | ||||||
| Common Stock, $0.000001 par value, 95,000,000 shares authorized, 37,805,416 shares were issued and outstanding as of December 31, 2015, and 13,520,000 shares issued and outstanding as of December 31, 2014 | 38 | 14 | ||||||
| Treasury stock at cost, 0 and 58,200 shares as of December 31, 2015 and 2014, respectively | - | (87,300 | ) | |||||
| Additional paid-in capital | 20,111,077 | 4,335,816 | ||||||
| Accumulated deficit | (21,699,153 | ) | (5,180,766 | ) | ||||
| Total stockholder’s deficiency | (1,588,038 | ) | (932,231 | ) | ||||
| Total liabilities and stockholder’s equity | $ | 1,414,320 | $ | 1,144,604 | ||||
See accompanying notesValuation of derivative liabilities
Description of the Matter
As disclosed in Note 8 to the consolidated financial statements, The Company has issued several convertible notes which are outstanding. The note holders have the right to convert principal and accrued interest outstanding into shares of common stock at a discounted price to the market price of our common stock. The conversion feature is recognized as an embedded derivative and is valued using a Binomial Option Pricing Model. In addition, as disclosed in Note 9, the Company has issued shares of Series C Convertible Preferred Shares, with an annual accruing dividend, for cash. The preferred shares provide the holder with the opportunity to redeem the shares at various dates. The holders may convert the Series C Shares into Registrant’s common shares, commencing on the 6-month anniversary of the closing at a discount to the public market price. The Company values such liability based on the Binomial Option Pricing Model. Auditing the Company’s valuation of its derivatives is challenging as the Company uses complex valuation methodologies that incorporate significant assumptions which include the discount rate and forecasted volatility of the Company’s common stock price. The valuation includes assumptions about economic and market conditions with uncertain future outcomes.
Diego Pellicer Worldwide, Inc.How We Addressed the Matter in Our Audit
To test the valuation of the derivative liability, our audit procedures included, among others, evaluating the methodologies used in the valuation model and testing the significant assumptions. For example, we compared the forecasted volatility of the Company’s common stock price to its historical volatility. We also assessed the completeness and accuracy of the underlying data. We involved our external valuation specialists to assist in our evaluation of the significant assumptions and methodologies used by the Company. We also evaluated the Company’s financial statement disclosures related to these matters included in Note 8 and 9 to the Consolidated StatementsFinancial Statements.
Collectability of Comprehensive LossAmounts Due from Lessees
| For The Year Ended | For The Year Ended | |||||||
| December 31, 2015 | December 31, 2014 | |||||||
| REVENUES | ||||||||
| Rental income | $ | 1,059,631 | $ | 497,638 | ||||
| Licensing revenue | 54,000 | 48,567 | ||||||
| Provision for uncollectible rents | (809,101 | ) | (497,638 | ) | ||||
| Total Revenues | 304,530 | 48,567 | ||||||
| Cost of Good Sold | - | �� | - | |||||
| COSTS AND EXPENSES (other income) | ||||||||
| General and administrative expenses | 14,268,072 | 3,624,507 | ||||||
| Impairment of investment | 408,900 | - | ||||||
| Rent expense | 1,228,028 | 487,533 | ||||||
| Write-off credit line receivable (net of interest income) | 240,000 | 777,846 | ||||||
Change in fair value of derivative liabilities | (133,809 | ) | ||||||
Interest expense (income), net | 811,726 | (73,198 | ) | |||||
| Total Costs and Expenses | 16,822,917 | 4,816,688 | ||||||
| Loss before provision for taxes | (16,518,387 | ) | (4,768,121 | ) | ||||
| Provision for taxes | - | - | ||||||
| NET LOSS | $ | (16,518,387 | ) | $ | (4,768,121 | ) | ||
| Loss per share - basic and fully diluted | $ | (0.65 | ) | $ | (0.35 | ) | ||
| Weighted average common shares outstanding - basic and fully diluted | 25,485,231 | 13,520,000 | ||||||
See accompanying notesDescription of the Matter
As described in Note 4 to the consolidated financial statements, At December 31, 2021, the Company had amounts outstanding from its sublessee, and the Company subleases two properties in Colorado to Royal Asset Management at December 31, 2021. At December 31, 2021, the outstanding receivables from the subleases approximated $1,200,000 and during the year ended December 31, 2021, the Company’s subleases with RAM accounted for 100% of the Company’s revenues. ASC 842 requires the Company to assess the probability of collecting substantially all of the contractual lease payments. If collectability of substantially all of the lease payments through maturity is not probable, all or a portion of the straight-line rent receivable and other lease receivables may be written off, and the rental income recorded during the period would be limited to lesser of the income that would have been recognized if collection were probable, and the lease payments received. Auditing the Company's collectability assessment is complex due to the judgment involved in the Company’s determination of the collectability of future lease payments from its operators. The determination involves consideration of experience with the lessee, including the lessee’s payment history, if any, an assessment of the financial strength of the lessees, future contractual rents, and the timing of expected payments.
How We Addressed the Matter in Our Audit
To test the rental income recognized, we performed audit procedures that include, among others, confirming the amounts receivable balance, evaluating the data and assumptions used in determining whether substantially all of the future lease payments were probable based on the lessee’s payment history, underlying collateral and status of repayment. In addition, we tested the completeness and accuracy of the data used in management’s collectability analysis.

Macias Gini & O’Connell LLP
April 15, 2022
We have served as the Company’s auditor since 2019
Irvine, CA
F-2
Diego Pellicer Worldwide, Inc.
Consolidated Statement of Stockholders’ DeficitBalance Sheets
For the Year Ended December 31, 2015 and 2014
| December 31, 2021 | December 31, 2020 | |||||||
| Assets | ||||||||
| Current assets: | ||||||||
| Cash | $ | 49,149 | $ | 327,864 | ||||
| Accounts receivable | 598,667 | 523,958 | ||||||
| Notes receivable | 112,800 | — | ||||||
| Prepaid expenses | — | 11,275 | ||||||
| Total current assets | 760,616 | 863,097 | ||||||
| Other receivables, net | 620,781 | 1,030,422 | ||||||
| Security deposits | 90,000 | 90,000 | ||||||
| Right of use assets | 1,269,113 | 1,062,592 | ||||||
| Total assets | $ | 2,740,510 | $ | 3,046,111 | ||||
| Liabilities and deficiency in stockholders’ equity | ||||||||
| Current liabilities: | ||||||||
| Accounts payable | $ | 441,625 | $ | 526,377 | ||||
| Accrued payable - related parties | 1,210,275 | 1,332,756 | ||||||
| Accrued expenses | 1,144,521 | 931,825 | ||||||
| Notes payable - related party | 140,958 | 140,958 | ||||||
| Notes payable | 133,403 | 133,403 | ||||||
| Convertible notes | 2,941,274 | 3,239,274 | ||||||
| Derivative liabilities | 2,733,803 | 5,997,865 | ||||||
| Lease liabilities | 386,488 | 327,685 | ||||||
| Warrant liabilities | 438 | 476 | ||||||
| Total current liabilities | 9,132,785 | 12,630,619 | ||||||
| Notes payable - long term | 150,000 | 206,444 | ||||||
| Lease liabilities, net of current portion | 882,976 | 715,488 | ||||||
| Total liabilities | 10,165,761 | 13,552,551 | ||||||
| Redeemable convertible preferred stock, Series C, par value $ per share; shares authorized, shares issued and outstanding | — | — | ||||||
| Deficiency in stockholders’ equity: | ||||||||
| Preferred stock, Series A, par value $ per share; shares authorized, issued and outstanding | — | — | ||||||
| Common stock, par value $.000001 per share; | ||||||||
| shares authorized, and shares issued and outstanding, respectively | 256 | 216 | ||||||
| Additional paid-in capital | 44,681,028 | 44,554,119 | ||||||
| Stock to be issued | 31,447 | 49,225 | ||||||
| Accumulated deficit | (52,137,982 | ) | (55,110,000 | ) | ||||
| Total deficiency in stockholders’ equity | (7,425,251 | ) | (10,506,440 | ) | ||||
| Total liabilities and deficiency in stockholders’ equity | $ | 2,740,510 | $ | 3,046,111 | ||||
See Accompanying Notes to Consolidated Financial Statements.
| SHARES | $ | |||||||||||||||||||||||||||||||||||||||||||
| Common | Treasury | Preferred | Common | Treasury | Preferred | Additional | Accumulated | Common Stock | Subscription | |||||||||||||||||||||||||||||||||||
| Shares | Shares | Shares | Shares | Shares | Shares | Paid-in Capital | Deficit | to be issued | Receivable | Total | ||||||||||||||||||||||||||||||||||
| Balance - December 31, 2013 | 13,520,000 | - | 561,676 | 14 | - | 1 | 528,357 | (412,646 | ) | - | (1,352 | ) | 114,374 | |||||||||||||||||||||||||||||||
| Sale of Preferred stock and warrants | - | - | 4,475,093 | - | - | 4 | 3,807,460 | - | - | - | 3,807,464 | |||||||||||||||||||||||||||||||||
| Treasury shares acquired | - | (58,200 | ) | - | - | (87,300 | ) | - | - | - | - | - | (87,300 | ) | ||||||||||||||||||||||||||||||
| Subscription received | - | - | - | - | - | - | - | - | 1,352 | 1,352 | ||||||||||||||||||||||||||||||||||
| Net Loss | - | - | - | - | - | - | - | (4,768,120 | ) | - | - | (4,768,120 | ) | |||||||||||||||||||||||||||||||
| Balance - December 31, 2014 | 13,520,000 | (58,200 | ) | 5,036,769 | 14 | (87,300 | ) | 5 | 4,335,817 | (5,180,766 | ) | - | - | (932,230 | ) | |||||||||||||||||||||||||||||
| Sale of Preferred stock | - | - | 753,332 | - | - | 75 | 1,129,916 | - | - | - | 1,129,991 | |||||||||||||||||||||||||||||||||
| Sale of Common stock | 3,881,251 | - | - | 4 | 1,164,371 | 1,164,375 | ||||||||||||||||||||||||||||||||||||||
| Effect of reverse merger | 7,743,333 | - | 50,996 | 8 | - | - | - | - | - | - | 8 | |||||||||||||||||||||||||||||||||
| Cancellation of Treasury Shares | (58,200 | ) | 58,200 | - | - | 87,300 | - | (87,300 | ) | - | - | - | - | |||||||||||||||||||||||||||||||
| Conversion of Preferred shares to common | 5,841,097 | - | (5,841,097 | ) | 6 | - | (80 | ) | 74 | - | - | - | - | |||||||||||||||||||||||||||||||
| Issuance of common shares for consulting services | 4,699,355 | - | - | 3 | - | - | 9,523,905 | - | - | - | 9,523,908 | |||||||||||||||||||||||||||||||||
| Common stock issued for note payable | 126,000 | - | - | - | - | - | 84,000 | - | - | - | 84,000 | |||||||||||||||||||||||||||||||||
| Non-employee stock compensation | 2,052,580 | - | - | 3 | - | - | 3,069,561 | - | - | - | 3,069,564 | |||||||||||||||||||||||||||||||||
| Warrants issued for services | - | - | - | - | - | - | 574,250 | - | - | - | 574,250 | |||||||||||||||||||||||||||||||||
| Warrants issued for note | - | - | - | - | - | - | 316,483 | - | - | - | 316,483 | |||||||||||||||||||||||||||||||||
| Net Loss | - | - | - | - | - | - | - | (16,518,387 | ) | - | - | (16,745,350 | ) | |||||||||||||||||||||||||||||||
| Balance - December 31, 2015 | 37,805,416 | - | - | 38 | - | - | 20,111,077 | (21,699,153 | ) | - | - | (1,588,038 | ) | |||||||||||||||||||||||||||||||
See accompanying notes to the consolidated financial statements
Diego Pellicer Worldwide, Inc.
Consolidated Statements of Operations
| Year Ended December 31, 2021 | Year Ended December 31, 2020 | |||||||
| Revenues | ||||||||
| Net rental revenue | $ | 768,516 | $ | 1,265,137 | ||||
| Rental expense | (624,619 | ) | (1,006,581 | ) | ||||
| Gross profit | 143,897 | 258,556 | ||||||
| Operating expenses: | ||||||||
| General and administrative expenses | 857,260 | 1,029,185 | ||||||
| Selling expense | 35,486 | 32,940 | ||||||
| Loss from operations | (748,849 | ) | (803,569 | ) | ||||
| Other income (expense) | ||||||||
| Interest income | 85,341 | 150,577 | ||||||
| Other income | 46,065 | 236,705 | ||||||
| Forgiveness of debt income | 56,908 | — | ||||||
| Interest expense | (662,721 | ) | (1,994,199 | ) | ||||
| Lease termination payments | 137,434 | 33,851 | ||||||
| Gain on sale/termination of lease | — | 55,256 | ||||||
| Extinguishment of debt | 330,576 | (9,387 | ) | |||||
| Change in derivative liabilities | 3,727,226 | (670,152 | ) | |||||
| Change in value of warrants | 38 | 491 | ||||||
| Total other income (loss), net | 3,720,867 | (2,196,858 | ) | |||||
| Provision for taxes | — | — | ||||||
| Net income (loss) | 2,972,018 | (3,000,427 | ) | |||||
| Deemed dividend on preferred stock | (1,199,910 | ) | (140,671 | ) | ||||
| Net income (loss) attributable to common stockholders | $ | 1,772,108 | $ | (3,141,098 | ) | |||
| Income (loss) per share - basic | $ | 0.01 | $ | (0.02 | ) | |||
| Income (loss) per share - diluted | $ | (0.00 | ) | $ | (0.02 | ) | ||
| Weighted average common shares outstanding - basic | 230,016,288 | 150,896,077 | ||||||
| Weighted average common shares outstanding - diluted | 1,690,134,958 | 150,896,077 | ||||||
See Accompanying Notes to Consolidated Financial Statements.
DIEGO PELLICER WORLDWIDE, INC
Consolidated Statements of Stockholders’ Deficit
For the Years Ended December 31, 2021 and 2020
| Redeemable Convertible Preferred Stock Shares | Amount | Common Stock Shares | Amount | Preferred Stock Shares | Amount | Additional Paid-in Capital | Accumulated Deficit | Common Stock to be issued | Total | ||||||||||||||||||||||||||||
| Balance - December 31, 2019 | 140,000 | $ | 8,750 | 113,926,332 | $ | 114 | — | $ | — | $ | 43,478,139 | $ | (51,968,902 | ) | $ | 127,261 | $ | (8,363,388 | ) | ||||||||||||||||||
| Issuance of common shares for services | — | — | 4,000,000 | 4 | — | — | 51,196 | — | 2,719 | 53,919 | |||||||||||||||||||||||||||
| Issuance of common shares for services - related parties | — | — | 12,219,836 | 13 | — | — | 177,311 | — | (66,772 | ) | 110,552 | ||||||||||||||||||||||||||
| Common stock issued upon conversion of notes payable | — | — | 39,489,099 | 39 | — | — | 328,847 | — | (13,983 | ) | 314,903 | ||||||||||||||||||||||||||
| Series C preferred stock issued for cash, net of costs and discounts | 111,600 | — | — | — | — | — | — | — | — | — | |||||||||||||||||||||||||||
| Series C preferred stock converted to common stock | (251,600 | ) | (89,295 | ) | 47,636,228 | 46 | — | — | 432,020 | — | — | 432,066 | |||||||||||||||||||||||||
| Fair value of warrants and options granted for services | — | — | — | — | — | — | 86,606 | — | — | 86,606 | |||||||||||||||||||||||||||
| Accrued dividends and accretion of conversion feature on Series C preferred stock | — | 80,545 | — | — | — | — | — | (80,545 | ) | — | (80,545 | ) | |||||||||||||||||||||||||
| Deemed dividends related to conversion feature of Series C preferred stock | — | — | — | — | — | — | — | (60,126 | ) | — | (60,126 | ) | |||||||||||||||||||||||||
| Net loss | — | — | — | — | — | — | — | (3,000,427 | ) | — | (3,000,427 | ) | |||||||||||||||||||||||||
| Balance - December 31, 2020 | 0 | — | 217,271,495 | 216 | — | — | 44,554,119 | (55,110,000 | ) | 49,225 | (10,506,440 | ) | |||||||||||||||||||||||||
| Issuance of common shares for services | — | — | 1,167,826 | 1 | — | — | 17,914 | — | (8,000 | ) | 9,915 | ||||||||||||||||||||||||||
| Issuance of common shares for services - related parties | — | — | 7,635,992 | 8 | — | — | 172,275 | — | (9,778 | ) | 162,505 | ||||||||||||||||||||||||||
| Common stock issued upon conversion of notes payable and accrued interest | — | — | 5,026,413 | 5 | — | — | 705,630 | — | — | 705,635 | |||||||||||||||||||||||||||
| Series C preferred stock issued for cash, net of costs and discounts | 293,700 | — | — | — | — | — | — | — | — | — | |||||||||||||||||||||||||||
| Series C preferred stock converted to common stock | (293,700 | ) | (95,327 | ) | 26,159,396 | 26 | — | — | 431,000 | — | — | 431,026 | |||||||||||||||||||||||||
| Accrued dividends and accretion of conversion feature on Series C preferred stock | — | 95,327 | — | — | — | — | (95,327 | ) | — | — | (95,327 | ) | |||||||||||||||||||||||||
| Deemed dividends related to conversion feature of Series C preferred stock | — | — | — | — | — | — | (1,104,583 | ) | — | — | (1,104,583 | ) | |||||||||||||||||||||||||
| Net income | — | — | — | — | — | — | — | 2,972,018 | — | 2,972,018 | |||||||||||||||||||||||||||
| Balance - December 31, 2021 | 0 | — | 257,261,122 | $ | 256 | — | $ | — | $ | 44,681,028 | $ | (52,137,982 | ) | $ | 31,447 | $ | (7,425,251 | ) | |||||||||||||||||||
See Accompanying Notes to Consolidated Financial Statements.
Diego Pellicer Worldwide, Inc.
Consolidated Statements of Cash Flows
| Year Ended December 31, 2021 | Year Ended December 31, 2020 | |||||||
| Cash flows from operating activities: | ||||||||
| Net income (loss) | $ | 2,972,018 | $ | (3,000,427 | ) | |||
| Adjustments to reconcile net income (loss) to net cash used in | ||||||||
| operating activities | ||||||||
| Change in fair value of derivative liability | (3,727,226 | ) | 670,152 | |||||
| Change in value of warrants | (38 | ) | (491 | ) | ||||
| Amortization of debt related costs | — | 942,601 | ||||||
| Noncash finance cost | 2,000 | 100,000 | ||||||
| Expense related to additional derivative liability | 331,844 | 584,553 | ||||||
| Extinguishment of debt | (330,576 | ) | 9,387 | |||||
| Stock-based compensation | 172,420 | 192,475 | ||||||
| Common stock payable issued for services | — | 44,619 | ||||||
| Gain on sale/termination of lease | — | (55,256 | ) | |||||
| Forgiveness of debt | (56,908 | ) | — | |||||
| Changes in operating assets and liabilities: | ||||||||
| Accounts receivable | (74,709 | ) | (132,685 | ) | ||||
| Prepaid expenses | 11,275 | 836 | ||||||
| Other assets | 409,641 | (242,243 | ) | |||||
| Security deposits | — | 60,000 | ||||||
| Accounts payable | (84,752 | ) | 12,181 | |||||
| Accrued liability - related parties | (122,481 | ) | 39,518 | |||||
| Accrued expenses | 244,807 | 358,820 | ||||||
| Lease liabilities | 19,770 | 69,512 | ||||||
| Cash used in operating activities | (232,915 | ) | (346,448 | ) | ||||
| Cash flows from financing activities: | ||||||||
| Notes receivable | (124,000 | ) | — | |||||
| Repayments of notes receivable | 11,200 | — | ||||||
| Proceeds from notes payable | — | 206,444 | ||||||
| Proceeds from convertible notes payable | — | 100,000 | ||||||
| Repayments of convertible notes payable, net | (200,000 | ) | (49,578 | ) | ||||
| Proceeds from sale of preferred stock, net | 267,000 | 100,000 | ||||||
| Cash (used in) provided by financing activities | (45,800 | ) | 356,866 | |||||
| Net increase (decrease) in cash | (278,715 | ) | 10,418 | |||||
| Cash, beginning of period | 327,864 | 317,446 | ||||||
| Cash, end of period | $ | 49,149 | $ | 327,864 | ||||
| Cash paid for interest | $ | 70,000 | $ | — | ||||
| Cash paid for taxes | $ | — | $ | — | ||||
| Supplemental schedule of noncash financial activities: | ||||||||
| Notes converted to stock | $ | 100,000 | $ | 180,922 | ||||
| Conversion of Preferred Stock to Common Stock | $ | 305,449 | $ | 265,115 | ||||
| Derivative liability related to convertible Preferred C shares | $ | 1,374,113 | $ | — | ||||
| Accrued interest converted to stock | $ | 6,256 | $ | 14,702 | ||||
| Value of common stock issued for conversion of notes and accrued interest | $ | 705,635 | $ | — | ||||
| Value of common stock issued for conversion of preferred stock and dividends | $ | 431,026 | $ | — | ||||
| Value of derivative liability extinguished upon conversion and pay off of notes and accrued interest | $ | 904,565 | $ | 177,037 | ||||
| Value of derivative liability extinguished upon conversion of preferred stock and dividends | $ | 338,228 | $ | 353,005 | ||||
| Debt discount attributable to convertible notes and preferred stock | $ | 267,000 | $ | 214,600 | ||||
| Accrued interest extinguished with note payment | $ | 25,390 | $ | — | ||||
| Debt discount extinguished with note conversion | $ | — | $ | 53,567 | ||||
| Debt discount extinguished with note repayment | $ | — | $ | 21,075 | ||||
| Discount extinguished with preferred stock conversion | $ | 210,123 | $ | 175,820 | ||||
| Accrued dividends and accretion of conversion feature on Series C preferred stock | $ | 95,327 | $ | 80,545 | ||||
| Deemed dividends related to conversion feature of Series C preferred stock | $ | 1,104,583 | $ | 60,126 | ||||
| Lease liability related to termination of lease | $ | — | $ | 1,325,445 | ||||
See Accompanying Notes to Consolidated Financial Statements.
| For the Year Ended | For the Year Ended | |||||||
| December 31, 2015 | December 31, 2014 | |||||||
| Operating Activities | ||||||||
| Net Loss | $ | (16,518,387 | ) | $ | (4,768,121 | ) | ||
| Adjustments to reconcile Net Loss to net cash provided by Operations: | ||||||||
| Amortization of deferred revenue | (54,000 | ) | (48,567 | ) | ||||
| Amortization of debt discount | 400,483 | - | ||||||
| Interest Income | - | (70,596 | ) | |||||
| Accrued expenses - related party | 387,121 | 48,603 | ||||||
| Interest on convertible note | 342,604 | - | ||||||
| Change in derivative | (133,809 | ) | - | |||||
| Impairment of investment | 408,900 | - | ||||||
| Non-cash stock compensation | 13,167,772 | 1,176,563 | ||||||
| Write-off credit line receivable (includes interest income) | 200,000 | 777,846 | ||||||
| Changes in operating assets and liabilities: | ||||||||
| Prepaid Expenses | 8,946 | (1,140 | ) | |||||
| Deferred rent | 120,234 | - | ||||||
| Inventory | (80,971 | ) | - | |||||
| Other receivable | (17,817 | ) | - | |||||
| Accounts Receivable | (1,110 | ) | - | |||||
| Accrued compensation | (1,170,313 | ) | - | |||||
| Accounts Payable | 287,059 | 283,368 | ||||||
| Net cash used in operating activities | (2,653,338 | ) | (2,602,044 | ) | ||||
| Investing Activities | ||||||||
| (Advances to) repayment from related party | - | 54,341 | ||||||
| Acquisition of property and equipment | (584,764 | ) | (253,990 | ) | ||||
| Security deposits | - | (153,000 | ) | |||||
| Deposits - end of lease | - | (150,000 | ) | |||||
| Advances under line of credit | (200,000 | ) | (707,250 | ) | ||||
| Net cash used in investing activities | (784,764 | ) | (1,209,899 | ) | ||||
| Financing Activities | ||||||||
| Proceeds from sale of Preferred stock and warrants | 1,129,999 | 3,807,908 | ||||||
| Collection of subscriptions receivable | - | 1,352 | ||||||
| Proceeds from (repayment) of loan - related party | - | (17,000 | ) | |||||
| Acquisition of treasury stock | - | (87,300 | ) | |||||
| Proceed from note payable | 846,628 | - | ||||||
| Proceed from convertible note payable | 300,000 | - | ||||||
| Proceed from sale of common stock | 1,164,375 | - | ||||||
| Net cash provided by financing activities | 3,441,002 | 3,704,960 | ||||||
| Net Increase (Decrease) in Cash | 2,900 | (106,983 | ) | |||||
| Cash - beginning of period | 33,101 | 140,084 | ||||||
| Cash - end of the period | $ | 36,001 | $ | 33,101 | ||||
See accompanying notes to the consolidated financial statements
Diego Pellicer Worldwide, Inc.
December 31, 20152021 and 20142020
Notes to the Consolidated Financial Statements
Note 1 – Organization and Operations
History
On March 13, 2015, (“closing date”), Diego Pellicer Worldwide, Inc. (the Company) (f/k/a Type 1 Media, Inc.) (the “Company”) closed on a merger and share exchange agreement (the “Merger Agreement”) by and among (i) the Company, and (ii) Diego Pellicer World-wide 1, Inc., a Delaware corporation, (“Diego”), and (iii) Jonathan White, the majority shareholder of the Company (the “Majority Shareholder”). Pursuant to the terms of the Merger Agreement,Company. Diego was merged with and into the Company with the Company to continue as the surviving corporation (the “Surviving Corporation”) in the Merger, and the Company succeeding to and assuming all the rights, assets, liabilities, debts, and obligations of Diego (the “Merger”).merger.
Prior to the merger, Type 1 had 62,700,000 shares issued and outstanding. The principal owners of the company have agreed to transfer their 55,000,000 issued and outstanding shares to a third party in consideration for $169,000 and cancellation of their 55,000,000 shares. The remaining issued and outstanding shares are still available for trading in the marketplace. At the time of the merger, Type 1 had no assets or liabilities. Accordingly, the business conducted by Type 1 prior to the Merger is not being operated by the combined entity post-Merger.
At the closing of the Merger, Diego common stock issued and outstanding immediately prior to the closing of the Merger was exchanged for the right to receive 1 share of the surviving legal entity. An aggregate of 21,632,252 common shares of the surviving entity were issued to the holders of Diego in exchange for their common shares, representing approximately 74% of the combined entity.
The Merger has been accounted for as a reverse merger and recapitalization in which Diego is treated as the accounting acquirer and Diego Pellicer Worldwide, Inc. (f/k/a Type 1 Media, Inc.) is the surviving legal entity.
Business Operations
The Company leases real estate to licensed marijuana operators, including but not limited to, providing complete turnkey growing space, processing space, recreational and medical retail sales space and related facilities to licensed marijuana growers, processors, dispensary and recreational store operators. Additionally, the Company plans to explore ancillary opportunities in the regulated marijuana industry, as well as offering for wholesale distribution branded non-marijuana clothing and accessories.
The properties generating rents in 2021 and 2020 are as follows:
| Purpose | Size | City | State | |||
| Retail store (recreational and medical) | 3,300 sq. | Denver | CO | |||
| Cultivation warehouse – terminated October 2020 | 18,600 sq. | Denver | CO | |||
| Cultivation warehouse | 14,800 sq. | Denver | CO |
The Company’s three properties in Denver, CO (one terminated in October 2020) are leased to Royal Asset Management, LLC (“RAM”). RAM opened the Diego Denver branded flagship store in February 2017. This store is known as “Diego Colorado”. The retail facilities have shown steady growth in sales since opening. For the other two properties subleased (one terminated in October 2020), RAM uses these properties for its cultivation facilities in Denver, CO. Production at these facilities began in late 2016. On July 27, 2021, the Company does notfiled a lawsuit against Royal Asset Management, LLC (“RAM”) and will not, until such time as Federal law allows, grow, harvest, process, distribute or sell marijuana or any other substances that violateNeil Demers (“Demers”) in the lawsDistrict Court, City and County of Denver, State of Colorado, alleging breach of contract on four subleases for which RAM has failed to make the United States of America, or any other country.required payments to the Company pursuant to the respective sublease agreements (see Note 4).
In August 2021, the master lease and sublease associated with the 14,800 sq. cultivation warehouse were extended through July 31, 2024 (see Note 10).
In October 2020, the master lease and sublease associated with the 18,600 sq. cultivation warehouse were terminated (see Note 4).
Note 2 – Significant and Critical Accounting Policies and Practices
The Managementmanagement of the Company is responsible for the selection and use of appropriate accounting policies and for the appropriateness of accounting policies and their application. Critical accounting policies and practices are those that are both most important to the portrayal of the Company’s financial condition and results of operations and that require management’s most difficult, subjective, or complex judgments, often as a resultbecause of the need to make estimates about the effects of matters that are inherently uncertain. The Company’s significant and critical accounting policies and practices are disclosed below, as required by generally accepted accounting principles.
Basis of Presentation
The Company’saccompanying consolidated financial statements and related notes have been prepared pursuant to the rules and regulations of the Securities and Exchange Commission (the “SEC”) and presented in accordance with accounting principles generally accepted in the United States of America (“U.S. GAAP”)(US GAAP).
New accounting pronouncementsPrinciples of Consolidation
From time to time, new accounting pronouncements are issued byThe financial statements include the Financial Accounting Standards Board or other standard setting bodies that mayaccounts of Diego Pellicer Worldwide, Inc., and its wholly-owned subsidiary Diego Pellicer World-wide 1, Inc. Intercompany balances and transactions have an impact on the Company’s accounting and reporting. The Company believes that such recently issued accounting pronouncements and other authoritative guidance for which the effective date isbeen eliminated in the future either will not have an impact on its accounting or reporting or that such impact will not be material to its financial position, results of operations and cash flows when implemented.consolidation.
Use of Estimates
The preparation of the financial statements in conformity with GAAP requires management to make estimates and assumptions that affect the reported amounts of assets and liabilities and disclosure of contingent assets and liabilities at the dates of the financial statements and the reported amounts of revenue and expenses during the reporting periods. Actual results could differ from those estimates. These estimates and assumptions include valuing equity securities and derivative financial instruments issued in financing transactions and share based payment arrangements, determining the fair value of the warrants received for the licensing agreement, the collectability of accounts receivable and other receivables (see Note 4), valuation of right of use assets and lease liabilities and deferred taxes and related valuation allowances.
Certain of our estimates, including evaluating the collectability of accounts receivable, could be affected by external conditions, including those unique to our industry, and general economic conditions. It is possible that these external factors could have an effect oninfluence our estimates thatand could cause actual results to differ from our estimates. WeThe Company intends to re-evaluate all of ourits accounting estimates at least quarterly based on these conditions and record adjustments when necessary.
F-7
Derivative Financial Instruments
Accounts Receivable
Accounts receivable consist of rents receivable from the Company’s sublessee as disclosed in Note 4. Management periodically assesses the Company’s accounts receivable and, if necessary, establishes an allowance for estimated uncollectible amounts. Accounts determined to be uncollectible are charged to operations when that determination is made. The Company usually does not require collateral. We have not recorded an allowance for doubtful accounts as of December 31, 2021 and 2020.
Fair Value Measurements
The Company evaluates its financial instruments to determine if such instruments are derivatives or contain features that qualify as embedded derivatives. For derivative financial instruments that are accounted for as liabilities, the derivative instrument is initially recorded at its fair value and is then re-valued at each reporting date, with changes in the fair value reported in the condensed consolidated statements of operations. The classification of derivative instruments, including whether such instruments should be recorded as liabilities or as equity, is evaluated at the end of each reporting period. Derivative instrument liabilities are classified in the balance sheet as current or non-current based on whether or not net-cash settlement of the derivative instrument could be required within 12 months of the balance sheet date.
Fair valueValue of financial instrumentsFinancial Instruments
As required by the Fair Value Measurements and Disclosures Topic of the FASB ASC, fair value is measured based on a three-tier fair value hierarchy, which prioritizes the inputs used in measuring fair value as follows:
Level 1: Unadjusted quoted prices in active markets that are accessible at the measurement date for identical, unrestricted assets or liabilities;
Level 2: Quoted prices in markets that are not active, or inputs that are observable, either directly or indirectly, for substantially the full term of the asset or liability; and
Level 3: Prices or valuation techniques that require inputs that are both significant to the fair value measurement and unobservable (supported by little or no market activity).
Fair value estimates discussed herein are based upon certain market assumptions and pertinent information available to management as of December 31, 2021 and December 31, 2015 and December 31, 2014.2020. The respective carrying value of certain on-balance-sheet financial instruments approximated their fair values. These financial instruments include cash, accounts receivable, prepaid expenses, note receivable, accounts payable and accountsnotes payable. Fair values were assumed to approximate carrying values for cash, receivables, notes receivable, payables and payablesnotes payable because they are short term in nature and their carrying amounts approximate fair values or they are payable on demand.
The following table reflects assets and liabilities that are measured at fair value on a recurring basis (in thousands):
| As of December 31, 2021 | Fair Value Measurement Using | |||||||||||||||
| Level 1 | Level 2 | Level 3 | Total | |||||||||||||
| Derivative liabilities | $ | — | $ | — | $ | 2,734 | $ | 2,734 | ||||||||
| Stock warrant liabilities | — | — | 1 | 1 | ||||||||||||
| total | $ | — | $ | — | $ | 2,735 | $ | 2,735 | ||||||||
| As of December 31, 2020 | Fair Value Measurement Using | |||||||||||||||
| Level 1 | Level 2 | Level 3 | Total | |||||||||||||
| Derivative Liabilities | $ | — | $ | — | $ | 5,998 | $ | 5,998 | ||||||||
| Stock warrant Liabilities | — | — | 1 | 1 | ||||||||||||
| Total | $ | — | $ | — | $ | 5,999 | $ | 5,999 | ||||||||
CashDerivative liabilities and stock warrant liabilities were valued using the Binomial Option Pricing Model in calculating the embedded conversion features for the years ended December 31, 2021 and 2020.
Cash
The Company maintains cash balances at various financial institutions. Accounts at each institution are insured by the Federal Deposit Insurance Corporation, and the National Credit Union Share Insurance Fund, up to $250,000.$250,000. The Company’s accounts at these institutions may, at times, exceed the federal insured limits. The Company has not experienced any losses in such accounts. Uninsured balances were approximately $0 and $73,000 at December 31, 2021 and 2020, respectively.
Property and equipment and depreciation policyRevenue recognition
Property and equipment are stated at cost less accumulated depreciation. Depreciation is provided forIn accordance with ASC 842, Leases, the Company recognizes rent income on a straight-line basis over the useful lives oflease term to the assets. Expenditures for additions and improvements are capitalized; repairs and maintenance are expensedextent that collection is considered probable. As a result, the Company has been recognizing rents as incurred.they become payable.
The Company intends to take depreciation or amortization on a straight-line basis for all properties, beginning when they are put into service, usingDuring the following life expectancy:
Equipment – 5 years
Leasehold Improvements – 10 years, or theinitial term of the lease, whichever is shorter
Buildings – 20 years
Accounts Receivable and Allowance for Doubtful Accounts
Accounts receivable are presented at their face amount, less an allowance for doubtful accounts, on the balance sheets. Accounts receivable consistmanagement has a policy of revenue earned and currently due from sub lessee. We evaluate the collectability of accounts receivable based on a combination of factors. We recognize reserves for bad debts based on estimates developed using standard quantitative measures that incorporate historical write-offs and current economic conditions. As of December 31, 2015, the outstanding balance allowance for doubtful accounts is zero.
The policy for determining past due status is based on the contractual payment terms of each customer. Once collection efforts by the Company and its collection agency are exhausted, the determination for charging off uncollectible receivables is made.
Revenue recognition
The Company recognizes revenue frompartial rent tenant reimbursements, and other revenue sources once all of the following criteria are met in accordance with SEC Staff Accounting Bulletin 104,Revenue Recognition, (“SAB 104”): (a) the agreement has been fully executed and delivered; (b) services have been rendered; (c) the amount is fixed or determinable; and (d) the collectability of the amount is reasonably assured.
In accordance with ASC 840(“Leases”), as amended and interpreted, minimum annual rental revenue is recognized in rental revenues on a straight-line basis over the term of the related lease. Rental revenue recognition commencesforbearance when the tenant takes possession or controlsfirst opens the physical use of the leased space. In order forfacility to assure that the tenant has the opportunity for success. Management may be required to take possession, the leased space mustexercise considerable judgment in estimating revenue to be substantially ready for its intended use. To determine whether the leased space is substantially ready for its intended use, management evaluates whether the Company or the tenant is the owner of tenant improvements for accounting purposes. recognized.
When management concludes that the Company is the owner of tenant improvements, rental revenue recognition begins when the tenant takes possession of the finished space, which is when such tenant improvements are substantially complete. In certain instances, when management concludes that the Company is not the owner (the tenant is the owner) of tenant improvements, rental revenue recognition begins when the tenant takes possession of or controls the space.
When management concludes that the Company is the owner of tenant improvements, for accounting purposes, management records the cost to construct the tenant improvements as a capital asset. In addition, managementthe Company records the cost of certain tenant improvements paid for or reimbursed by tenants as capital assets when management concludes that the Company is the owner of such tenant improvements. For these tenant improvements, managementthe Company records the amount funded or reimbursed by tenants as deferred revenue, which is amortized as additional rental income over the term of the related lease. When management concludes that the tenant is the owner of tenant improvements for accounting purposes, management recordswe record the Company’s contribution towards those improvements as a lease incentive, which is amortized as a reduction to rental revenue on a straight-line basis over the term of the lease.
F-8
The Company analyzes its contracts to assess that they are within the scope and in accordance with ASC 606. In January 2014,determining the appropriate amount of revenue to be recognized as the Company entered into an agreement to license certain intellectual property to a third party. In consideration,fulfills its obligations under each of its agreements, whether for goods and services or licensing, the Company received warrantsperforms the following steps: (i) identification of the promised goods or services in the contract; (ii) determination of whether the promised goods or services are performance obligations including whether they are distinct in the context of the contract; (iii) measurement of the transaction price, including the constraint on variable consideration; (iv) allocation of the transaction price to purchase shares of common stock, which were valuedthe performance obligations based on an appraisalestimated selling prices; and (v) recognition of the warrants by an independent third party appraiser. The revenue from the licensing agreement, which is initially recorded as deferred revenue, is being amortized over the ten year term of the licensing agreement.
The Company records rents due from the tenants on a current basis. However, as part of the Line of Credit Agreement,when (or as) the Company has deferred collection of such rents untilsatisfies each performance obligation.
Advertising
During the tenants receive the proper governmental licenses to begin operation. It is anticipated that such licenses should be obtained prior to 3rd quarter 2016. Management has decided to take the approachyears ended December 31, 2021 and reserve these amounts due to the contingency factor2020, advertising expense was $35,486 and experience with typical delays in governmental action.$32,940, respectively.
Leases as lessor
The Company currently leases properties in locations that would be acceptable for regulatory purposes and acceptable to sub-lessees for the manufacturing and development of their products. The Company evaluates the lease to determine its appropriate classification as an operating or capital lease for financial reporting purposes. The Company currently has a number of leases, which are all classified as operating leases.
Minimum base rent for the Company’s operating leases, which generally have escalating rentals over the term of the lease, is recorded on a straight-line basis over the lease term. The initial rent term includes the build-out, or may include a short rent holiday period, for the Company’s leases, where no rent payments are typically due under the terms of the lease.
Leases
For lease agreements that provide for escalating rent payments or free-rent occupancy periods, the Company recognizes rent expense on a straight-line basis over the non-cancelable lease term and option renewal periods where failure to exercise such options would result in an economic penalty in such amount that renewal appears, at the inception of the lease, to be reasonably assured. The lease term commences on the date that the Company takes possession of or controls the physical use of the property. Deferred rent is presented on current liabilities section on the consolidated balance sheets.
Income Taxes
Income taxes are provided for using the liability method of accounting in accordance with the Income Taxes Topic of the FASB ASC. Deferred tax assets and liabilities are determined based on differences between the financial reporting and tax basis of assets and liabilities and are measured using the enacted tax rates and laws that will be in effect when the differences are expected to reverse. A valuation allowance is established when necessary to reduce deferred tax assets to the amount expected to be realized and when, in the opinion of management, it is more likely than not that some portion or all of the deferred tax assets will not be realized. The computation of limitations relating to the amount of such tax assets, and the determination of appropriate valuation allowances relating to the realizing of such assets, are inherently complex and require the exercise of judgment. As additional information becomes available, the Company continually assesses the carrying value of their net deferred tax assets.
Research and development costs
Research and development costs are charged to the statement of operations as incurred.
Preferred Stock
We apply the guidance enumerated in ASC 480 “Distinguishing Liabilities from Equity” when determining the classification and measurement of preferred stock. Preferred shares subject to mandatory redemption (if any) are classified as liability instruments and are measured at fair value. We classify conditionally redeemable preferred shares (if any), which includes preferred shares that feature redemption rights that are either within the control of the holder or subject to redemption upon the occurrence of uncertain events not solely within our control, as temporary equity. At all other times, we classified our preferred shares in stockholders’ equity. Our preferred shares do not feature any redemption rights within the holders’ control or conditional redemption features not within our control. Accordingly all issuances of preferred stock are presented as a component of consolidated stockholders’ equity (deficit).
Common Stock Purchase Warrants and Other Derivative Financial Instruments
We classifyThe Company classifies as equity any contracts that require physical settlement or net-share settlement or provide us a choice of net-cashnet cash settlement or settlement in our own shares (physical settlement or net-share settlement) provided that such contracts are indexed to our own stock as defined in ASC Topic 815-40 (“Contracts“Contracts in Entity’s Own Equity”). We classifyEquity.” The Company classifies as assets or liabilities any contracts that require net-cash settlement (includingincluding a requirement to net cash settle the contract if an event occurs and if that event is outside our control)control or give the counterparty a choice of net-cash settlement or settlement in shares (physical settlement or net-share settlement). We assessshares. The Company assesses classification of ourits common stock purchase warrants and other free standingfree-standing derivatives at each reporting date to determine whether a change in classification between assets and liabilities is required.
We recognizeThe Company recognizes compensation expense for stock-based compensation in accordance with ASC Topic 718. For employee stock-based awards, we calculateThe Company calculates the fair value of the award on the date of grant using the Black-Scholes method for stock options and the quoted price of our common stock for unrestrictedcommon shares; the expense is recognized over the service period for awards expected to vest. For non-employee stock-based awards, we calculate the fair value of the award on the date of grant in the same manner as employee awards, however, the awards are revalued at the end of each reporting period and the pro rata compensation expense is adjusted accordingly until such time the nonemployee award is fully vested, at which time the total compensation recognized to date equals the fair value of the stock-based award as calculated on the measurement date, which is the date at which the award recipient’s performance is complete. The estimation of stock-based awards that will ultimately vest requires judgment, and to the extent actual results or updated estimates differ from original estimates, such amounts are recorded as a cumulative adjustment in the period estimates are revised. We considerThe Company considers many factors when estimating expected forfeitures, including types of awards, employee class, and historical experience.
NetThe Company utilizes ASC 260, “Earnings per Share” for calculating the basic and diluted loss per share. In accordance with ASC 260, the basic and diluted loss per share is provided in accordance with ASC Subtopic 260-10. We present basic loss per share (“EPS”) and diluted EPS on the face of statements of operations. Basic EPS is computed by dividing reported lossesnet loss available to common stockholders by the weighted average shares outstanding. Loss per common share has been computed using the weighted average number of common shares outstanding duringoutstanding. Diluted net loss per share is computed similar to basic loss per share except that the year.denominator is adjusted for the potential dilution that could occur if stock options, warrants, and other convertible securities were exercised or converted into common stock. Potentially dilutive securities are not included in the calculation of the diluted loss per share if their effect would be anti-dilutive. The Company has and common stock equivalents at December 31, 2021 and 2020, respectively. For the year ended December 31, 2020, the 1,462,069,888 potential shares were excluded from the shares used to calculate diluted earnings per share as their inclusion would reduce net loss per share. There are 840,000,000 shares authorized resulting in 298,213,758 insufficient shares as of December 31, 2021.
| Year ended December 31, 2021 | ||||
| Net income attributable to common shareholders | $ | 1,772,108 | ||
| Income attributable to convertible instruments | (4,057,802 | ) | ||
| Expense and deemed dividend attributable to convertible instruments | 729,875 | |||
| Diluted loss attributable to common shareholders | $ | (1,555,819 | ) | |
| Basic shares outstanding | 230,016,288 | |||
| Convertible instruments | 1,460,118,670 | |||
| Diluted shares outstanding | 1,690,134,958 | |||
| Diluted loss per share | $ | (0.00 | ) | |
Legal and regulatory environment
The cannabis industry is subject to numerous laws and regulations of federal, state and local governments. These laws and regulations include, but are not limited to, matters such as licensure, accreditation, and different taxation between federal and state. Federal government activity may increase in the future with respect to companies involved in the cannabis industry concerning possible violations of federal statutes and regulations.
Management believes that the Company is in compliance with local, state and federal regulations and, while no regulatory inquiries have been made, compliance with such laws and regulations can be subject to future government review and interpretation, as well as regulatory actions unknown or unasserted at this time.
Recent accounting pronouncements.
The Company believes recently issued accounting pronouncements and other authoritative guidance for which the effective date is in the future either will not have an impact on its accounting or reporting or that such impact will not be material to its financial position, results of operations and cash flows when implemented.
Note 3 – Going Concern
The accompanying financial statements have been prepared in conformity with generally accepted accounting principles, which contemplate continuation ofassuming that the Company will continue as a going concern. The Company has incurred losses since inception, and its current liabilities exceed its current assets by $2,496,459,$8,372,169 at December 31, 2021, and it has an accumulated deficit of $21,699,153 and a total deficit of $1,414,320 as of$52,137,982 at December 31, 2015.2021. These factors raise substantial doubt about its ability to continue as a going concern over the next twelve months. The financial statements do not include any adjustments that might result from the outcome of this uncertainty.
The Company believes that it has sufficient cash on hand and cash generated by real estate leases to sustain operations provided that management and board members continue to agree to be paid company stock in exchange for accrued compensation. There are other future noncash charges in connection with financings such as a change in derivative liability that will affect income but have no effect on cash flow.
Although the Company has been successful raising additional capital, there is no assurance that the company will sell additional shares of stock or borrow additional funds. The Company’s inability to raise additional cash could have a material adverse effect on its financial position, results of operations, and its ability to continue in existence. These financial statements do not include any adjustments that might result from the outcome of this uncertainty. Management believes that the Company’s future success is dependent upon its ability to achieve profitable operations, generate cash from operating activities and obtain additional financing. There is no assurance that the Company will be able to generate sufficient cash from operations, sell additional shares of stock or borrow additional fundsfunds. However, cash generated from its stockholders. The Company’s inabilitylease revenues is currently exceeding lease costs, but is insufficient to obtain additional cash could have a material adverse effect on its financial position, results of operations, and its ability to continue in existence. These financial statements do not include any adjustments that might result from the outcome of this uncertainty.cover operating expenses.
The Company intends to continue to raise additional capital and assist the leaseholder in obtaining the proper licenses in order to conduct their business in growing, processing and retailing cannabis products. Once the licenses are granted, we believe that a steady stream of income will be achieved and the repayment of our advances would begin.
Note 4 – Revolving Credit LineAccounts Receivables and Other Receivables
A certain tenant who intends to operate out of three separate properties leased to him byAs disclosed in Note 1, the Company is requiredsubleases two properties in Colorado to obtain a state operating licenseRoyal Asset Management at December 31, 2021. At December 31, 2021 and 2020, the Company had outstanding receivables from the subleases totaling $598,667 and $523,958, respectively, and during the years ended December 31, 2021 and 2020 the Company’s subleases with RAM accounted for 100% of the Company’s revenues.
In addition to grow, process and sell cannabis products. Until the tenant receives such license,receivables from the subleases, the Company has agreed to provide RAM and affiliates of RAM up to an aggregate amount of $1,030,000 in financing. These notes accrue interest at the rates ranging from 12% to 18% per annum. As of December 31, 2021 and 2020, the outstanding balance of these notes receivable total $620,781 and $1,030,422, respectively, including accrued interest of $290,781 and $300,422, respectively. The notes are secured by a UCC filing and also $400,000 of the balance was personally guaranteed by the managing member of RAM. Our position was subordinate to the CEO’s note described in Note 6. We have recorded interest income of $84,129 and $146,913 during the years ended December 31, 2021 and 2020, respectively. In April 2021, we received a payment of $400,000 of note principal and $93,770 of related accrued interest.
On September 9, 2020, we closed on a Membership Interest Purchase Agreement dated September 4, 2020, and obtained the right to acquire a 15.13% membership interest in Blue Bronco, LLC. The purchase of the 15.13% interest in Blue Bronco LLC is subject to the approval of the Colorado Marijuana Enforcement Division. Necessary approval by governing authorities is expected to be received in the third or fourth quarter of 2022 pending the resolution of a lawsuit between the RAM and other parties related to the transaction. Accrued interest receivable of approximately $68,000 will be applied to the purchase of the membership interest upon approval of the purchase by the Colorado Marijuana Enforcement Division.
Lease Termination
On October 1, 2020, the master and sublease associated with the 18,600 sq. cultivation warehouse in Denver were terminated. In connection with that termination, we entered into a $2,500,000 revolving lineSublease Termination Agreement (“Termination Agreement”) with RAM and an affiliate of RAM Venture Product Consulting, LLC (“VPC”). Pursuant to this agreement, RAM acknowledged a debt of deferred rent to the Company in the amount of $1,418,480 and VPC acknowledged a debt of deferred rent to the Company in the amount of $64,344. RAM and VPC executed promissory notes for these amounts, respectively. The notes accrue interest on the unpaid balance at a rate equal to the Applicable Federal Rate for mid-term obligations as published by the Internal Revenue Service. No payment under the promissory notes will be due to the Company until the earlier of (i) the date on which RAM and the Company consummate a change of control event, which is defined as: the acquisition of RAM by the Company or an affiliated entity by means of any transaction or series of related transactions to which RAM is a party (including, without limitation, any membership interest acquisition, reorganization, merger or consolidation, (generally, a “Merger”), or, (ii) the date one (1) business day following the earlier of (x) at any time, receipt by the Company from RAM or VPC of a written notice stating such party no longer desires to pursue the Merger, or (y) beginning eighteen (18) months after the date of this Agreement, receipt by RAM or VPC from the Company of a written notice stating that the Company no longer desires to pursue the Merger (the “Maturity Date”).
We have recorded the promissory notes as long term notes receivable of $1,482,824 at December 31, 2021 and 2020. Due to the uncertainty of the collectability, we have also recorded a long term deferred credit in the same amount. We will record income under the deferred rent notes as payments are received or deemed collectible. This asset and related credit have been netted on the accompanying condensed consolidated balance sheet.
F-10
Additionally, in connection with the tenant. This linetermination of credit was establishedthe sublease, RAM will continue to provide fundingpay the remaining future sublease premium payments due to the tenant, consisting of two separate elements: (a) to fund operating costscompany on the Denver sublease (the “Future Rent Debt”) beginning on the termination date, and until the development is completed,earlier of the Maturity Date or June 30, 2024, notwithstanding the termination of the Subleases. However, no payment under the Future Rent Debt agreement will be due to the Company until the Maturity Date, at which time the entire Future Rent Debt shall be due and (b)payable in full, except for any month in which RAM earns $725,000 of gross sales revenue, including taxes, at its Alameda location, in which case RAM shall pay the Future Rent Debt for the following month to underwrite the rent dueCompany on or before the 5th day of the following month, and such amount will not accrue as a Future Rent Debt. RAM shall continue to accrue debt to the company, assessed on the sublease agreements. Interest is accruing atfirst day of each month, according to the annual rate of 20%schedule below:
| Monthly Payments Accrued | ||||
| October 1, 2020 to June 30, 2021 | $ | 11,284 | ||
| July 1, 2021 to June 30, 2022 | 11,622 | |||
| July 1, 2022 to June 30, 2023 | 11,971 | |||
| July 1, 2023 to June 30, 2024 | 12,330 | |||
We will record income pursuant to the Future Rent Debt as payments are received based on the average monthly amount due on this lineCompany’s analysis of credit.collectability including, but not limited to, the potential application toward the purchase price. During the years ended December 31, 2021 and 2020, we have recorded $137,434 and $33,851 as Lease Termination Payments in the Statement of Operations.
On September 7, 2015,Notes Receivable
During 2021, the Company entered into an agreement, and settled total amount owed for $200,000 cash. As of December 31, 2015 and December 31, 2014, the Company has advanced an aggregate of $907,250 and $707,250 respectively towards this line of credit, and has accrued interest of $206,523 and $70,596, respectively. The Company has recorded a reserve for the total advance and accrued interest.
Note 5 – Investment
In January 2014, the Company entered into an Agreement with Plandai Biotechnology, Inc. (a publicly traded company) to license to them certain intellectual property rights in exchange for warrants to purchase 3,333,334 shares of Plandai Biotechnology, Inc. (“Plandai”) common stock. This license agreement carries a 10-year termthree promissory notes with an exercise priceunrelated party, aggregating $124,000 (see Note 12). The notes all mature 11 months after issuance and have an effective interest rate of $0.01 per share. The Company is to obtain certain Trademark rights certified by8.33%. Payments of principal and interest are due monthly, beginning 30 days after the government (expected by 2nd quarter 2016). On October 10, 2014 the Company filed its Noticedate of Exercise to execute the warrants to acquire the sharesissuance. Principal repayments of Plandai, in which the shares have not yet been issued. The sale of such shares has a “leak out” restriction on them requiring that the sale of such shares must reach a certain traded price of $0.50 per share. The Company used a third party appraisal firm to ascertain the fair value of warrants held by the company, which was determined to be $525,567. With the Plandai shares currently trading at $.07 per share, the Company impaired $408,900$11,200 were received during the year ended December 31, 2015. The Company accounts for its investment under the cost method of accounting.2021.
Note 65 – Property And Equipment
The Company has incurred expenses in the build out of one of its leased properties and acquired a large POD equipment for use in growing operations by lessee. Since the facility and equipment have not yet been put into service, no amortization on the leasehold improvement nor depreciation on the equipment has been provided.
As of December 31, 2015 and 2014, Fixed Assets and the estimated lives used in the computation of depreciation are as follows:
| Estimated | December 31, | December 31, | ||||||||
| Useful Lives | 2015 | 2014 | ||||||||
| Machinery and equipment | 5 years | $ | 174,145 | $ | 39,145 | |||||
| Leasehold Improvements | 10 years | 664,609 | 214,845 | |||||||
| 838,754 | 253,990 | |||||||||
| Less: Accumulated depreciation and amortization | - | - | ||||||||
| Property and Equipment, net | $ | 838,754 | $ | 253,990 | ||||||
Note 7 – Other Assets
Security depositsdeposits:
These Security deposits reflect the deposits on various property leases, most of which call forrequire two monthsmonths’ rental expense in the form of rental.
Deposits – enda deposit. During 2020, upon termination of a lease,
These deposits represent an additional two months we received a refund of rent on various property leases that apply to the “end-of-lease” period.
Note 8 – Related Party
a security deposit of $60,000. As of December 31, 20152021 and December 31, 2014,2020, the remaining balances were $90,000.
Note 6 – Related Party Transactions
As of December 31, 2021 and 2020, the Company has unpaid consulting feesaccrued compensation to its CEO and director and to its CFO aggregating $263,289 and $289,897, respectively. As of December 31, 2021 and 2020, accrued payable due to former officers was $946,986 and $1,042,859, respectively. For the years ended December 31, 2021 and 2020, total cash-based compensation to related parties in the amount of $511,454was $360,000 and $124,333,$360,000, respectively. For the yearyears ended December 31, 20152021 and 2014, the consulting fees expensed were $870,000 and $605,989, respectively2020, total share-based compensation to related parties.parties was $162,505 and $192,474, respectively. These amounts are included in general and administrative expenses in the accompanying financial statements.
From 2017 to 2019, Mr. Gonfiantini, CEO, personally and through his Company, Crystal Bay Financial LLC, loaned an aggregate amount of $1,020,000 to Royal Asset Management. These notes accrue interest at 17% - 18% per annum, and require monthly payment approximately from $5,000 to $20,000. These notes are personally guaranteed by the managing member of Royal Asset Management, and are secured by certain equipment and other tangible properties of Royal Asset Management. Among these notes, $500,000 is also secured by the medical marijuana licenses held by Royal Asset Management. As of October 20, 2021 these notes were fully paid by Royal Asset Management and the security was released.
At December 31, 2021 and 2020, the Company owed Mr. Throgmartin, former CEO (See Note 911), $140,958 pursuant to a promissory note dated August 12, 2016. This note accrues interest at the rate of 8% per annum and was past the maturity date, however the Company has not yet received a default notice. The balance of related party note was $140,958 at December 31, 2021 and December 31, 2020 and accrued interest on the note was $60,677 and $49,401 at December 31, 2021 and 2020, respectively.
The Company leases its office space from an entity controlled by its CEO. The lease may be terminated by either party with 30 days’ notice. Rent expense pursuant to the lease was $18,000 for each of the years ended December 31, 2021 and 2020.
Note 7 – NoteNotes Payable
On May 20,August 31, 2015, the Company entered into notesissued a note in totalthe amount of $450,000 with$126,000 to a third partiesparty for use as operating capital. The notes payable agreements require the Companynote was amended to repay the principal, together with 10% annualinclude accrued interest byon October 31, 2016 and extend the maturity date of November 17, 2015 or the date the Company raises capital whether through the issuance of debt, equity or any other securities. The Company will not effect a Financing unless either (a) the proceeds of such Financing are being directed at the closing of such Financing to irrevocably repay this Note in full, or (b) Investor consents to an alternative use of proceeds from such Financing. The Company received a waiver from investor for the convertible note entered into May 29, 2015 (see Note 10)October 31, 2018. As of December 31, 2015, the outstanding principle balance of the note is $450,000.
On July 8, 2015, the Company entered into notes in total amount of $135,628 with third parties for use as operating capital. The notes payable agreements require the Company to repay the principal, together with 10% annual interest by the maturity date of October 6, 2015 or the date the Company raises capital whether through the issuance of debt, equity or any other securities, the Company will not effect a Financing unless either (a) the proceeds of such Financing are being directed at the closing of such Financing to irrevocably repay this Note in full, or (b) Investor consents to an alternative use of proceeds from such Financing. As of December 31, 2015,2021 and 2020 the outstanding principal balance of the note is $135,628. In connection with the issuance of these notes, the Company issued warrants to purchase its common stock. The Company allocated the proceeds of the noteswas $133,403, and warrants basedaccrued interest on the relative fair valuenote was $76,772 and $70,101 at inception. The Company allocated $90,563 to the warrantsDecember 31, 2021 and 45,065 to the debt. The difference between the face value of the notes and the allocated value will be accreted to interest expense over the life of the loan.2020, respectively. As of December 31, 2015, the outstanding principle balance of2021 the note is $135,628 and $90,563 has been accreted to interest expense for the year ended December 31, 2015.
On August 31, 2015, the Company entered into notes in total amount of $126,000 with third parties for use as operating capital. The notes payable agreements require the Company to repay the principal, together with 5% annual interest bywas past the maturity date, however the Company has not yet received a default notice.
On April 22, 2020, the Company was granted a loan from Numerica Credit Union, in the aggregate amount of October 31, 2015 or$56,444, pursuant to the closingPaycheck Protection Program, (the “PPP”) under Division A, Title I of the CARES Act. The loan, which was in the form of a financing wherebynote dated April 22, 2020 issued by the company receivesBorrower, was scheduled to mature on April 22, 2022 and bore interest at a minimumrate of $126,000. As of December 31, 2015,1.0% per annum, payable monthly commencing October 22, 2020. There have not been any payments made towards this loan, as the outstanding principal balancefull amount of the note is $126,000. In connection with the issuance of these notes,loan and accrued interest was forgiven in full during February 2021 and the Company recorded income of $56,908.
On June 30, 2020, the Company was granted a loan from the Small Business Association, in the aggregate amount of $150,000, pursuant to the Economic Injury Disaster Loan, (the “EIDL”) under Division A, Title I of the CARES Act. The loan, which is in the form of a note dated June 30, 2020 issued 126,000 sharesby the Borrower, matures on June 30, 2050 and bears interest at a rate of common stock. 3.75% per annum, payable monthly commencing July 1, 2023.
Note 8 – Convertible Notes Payable
The Company allocated the proceeds of the notes and warrants based on the relative fair value at inception. The Company allocated $84,000 to the common stock and $42,000 to the debt. The difference between the face value of the notes and the allocated value will be accreted to interest expense over the life of the loan. As of December 31, 2015, the outstanding principal balance of the note is $126,000 and $84,000 has been accreted to interest expense for the year ended December 31, 2015.
On November 27, 2015, the Company entered into notes in total amount of $135,000 with third parties for purchasing a fixed asset. The notes payable agreements require the Company to repay the principal, together with $15,000 interest by the maturity date of January 26, 2016. As of December 31, 2015, the outstanding principle balance of the note is $135,000.
Note 10 – Convertible Note Payable
On May 29, 2015, the Company entered intoissued several convertible notes in total amount of $300,000 with third parties for use as operating capital.which are outstanding. The convertible notes require the Company to repay the principal, together with 10% annual interest by the maturity date of November 26, 2015. In the event that the Note is not paid on the maturity date and the common stock price has a set price below $1.50, then the note holder shallholders have the right to convert the amountprincipal and accrued interest outstanding into shares of common stock at a discounted price to the market price of ninety percent of the lowest trade VWAP (Volume Weighted Average Price) of twenty days prior to conversion. The Company evaluated the conversion feature embedded in the notes in amount of $342,604 on default. In connection with the issuance of these notes, the Company issued warrants to purchase itsour common stock. The Company allocated the proceeds of the notes and warrants based on the relative fair value at inception. The Company allocated $225,920 to the warrants and 74,080 to the convertible debt. The difference between the face value of the notes and the allocated value will be accreted to interest expense over the life of the loan. On November 26, 2015, pursuant to the original terms of the note, the holder received the rights to convert the principal balance into common shares of the Company. The conversion feature wasfeatures were recognized as an embedded derivativederivatives and wasare valued using a Black Scholes modelBinomial Option Pricing Model that resulted in a derivative liability of $342,604 as$2,733,803 and $5,997,865 at December 31, 2021 and 2020, respectively. All notes accrue interest at 10% and the majority of the measurement date.notes had matured at December 31, 2021. In connection with the issuance of certain of these notes, the Company also issued warrants to purchase its common stock.
F-11
Several convertible note holders elected to convert their notes to stock during the years ended December 31, 2021 and 2020. The table below provides the note payable activity for the years ended December 31, 2021 and 2020, and also a reconciliation of the beginning and ending balances for the derivative liabilities measured using fair significant unobservable inputs (Level 3) for the years ended December 31, 2021 and 2020:
| Convertible Notes | Discount | Convertible Notes, Net of Discount | Derivative Liabilities | |||||||||||||
| Balance, December 31, 2020 | $ | 3,239,274 | $ | — | $ | 3,239,274 | $ | 5,997,865 | ||||||||
| Issuance of convertible notes | 2,000 | — | 2,000 | 317,896 | ||||||||||||
| Conversion of convertible notes | (100,000 | ) | — | (100,000 | ) | (661,087 | ) | |||||||||
| Repayment of convertible notes | (200,000 | ) | — | (200,000 | ) | (243,478 | ) | |||||||||
| Change in fair value of derivatives | — | — | — | (2,677,393 | ) | |||||||||||
| Amortization | — | — | — | — | ||||||||||||
| Balance December 31, 2021 | $ | 2,941,274 | $ | — | $ | 2,941,274 | $ | 2,733,803 | ||||||||
| Convertible Notes | Discount | Convertible Notes, Net of Discount | Derivative Liabilities | |||||||||||||
| Balance, December 31, 2019 | $ | 3,266,775 | $ | 914,245 | $ | 2,352,530 | $ | 4,834,190 | ||||||||
| Issuance of convertible notes | 103,000 | 103,000 | — | 518,678 | ||||||||||||
| Extensions of convertible notes | 100,000 | — | 100,000 | 149,500 | ||||||||||||
| Conversion of convertible notes | (180,922 | ) | (53,567 | ) | (127,355 | ) | (177,037 | ) | ||||||||
| Repayment of convertible notes | (49,579 | ) | (21,075 | ) | (28,504 | ) | (28,930 | ) | ||||||||
| Change in fair value of derivatives | — | — | — | 701,464 | ||||||||||||
| Amortization | — | (942,603 | ) | 942,603 | — | |||||||||||
| Balance December 31, 2020 | $ | 3,239,274 | $ | — | $ | 3,239,274 | $ | 5,997,865 | ||||||||
During the year ended December 31, 2021, $100,000 of notes were converted into shares of common stock with a value of $697,779. A gain on changeextinguishment of debt of $59,999 and reduction of derivative liabilities of $657,778 have been recorded related to these conversions.
During year ended December 31, 2021, $ of accrued interest was converted into shares of common stock with a value of $7,856. A gain on extinguishment of debt of $1,709 and reduction of derivative liabilities of $3,309 have been recorded related to these conversions.
During the year ended December 31, 2021, we repaid an aggregate of $200,000 of note principal. A gain on extinguishment of debt of $118,142 and reduction of derivative liabilities of $118,142 have been recorded related to these payments.
During the year ended December 31, 2021, we paid an aggregate of $70,000 in settlement of accrued interest in the valueamount of $95,390. A gain on extinguishment of debt of $150,726 and reduction of derivative liabilities of $125,336 have been recorded related to these payments.
During the derivative liability upon subsequent re-measurement as ofyear ended December 31, 2015 was $133,809. 2021, we recorded noncash additions to convertible notes aggregating $2,000.
As of December 31, 2015,2021, convertible notes in the aggregate principal amount of $2,941,274 were past their maturity dates; however the Company has not yet received any default notices. No default or penalty was paid or required to be paid.
During 2020, the Company entered into a convertible note in an aggregate amount of $103,000 with a twelve month maturity, bearing 12% interest per year. The note is convertible at a 35% discount to the average of the two lowest Volume Weighted Average Prices (VWAPs) during the previous ten trading days to the date of a Conversion Notice. This note was partially converted to common stock in the amount of $60,922 during 2020 along with accrued interest in the amount of $1,884, for a total of shares issued upon conversion, with a value of $98,080. A loss on extinguishment of debt of $11,761, extinguishment of debt discount of $28,190 and reduction of derivative liabilities of $51,703 have been recorded related to the conversion. The remaining balance on this convertible loan of $42,078 was paid in cash along with accrued interest in the amount of $6,736. A loss on extinguishment of debt of $21,460, extinguishment of debt discount of $21,075 and reduction of derivative liabilities of $18,551 have been recorded related to the payment of $67,750.
During 2020, an additional $120,000 of notes and $12,818 of accrued interest and fees was converted into shares of common stock with a value of $230,807. A gain on extinguishment of debt of $1,968, extinguishment of debt discount of $25,377 and reduction of derivative liabilities of $125,334 have been recorded related to these conversions.
During 2020, an additional $7,500 of note principal and $819 of accrued interest were repaid to debt holders. We recorded gain on extinguishment of debt of $3,925.
During 2020, we recorded noncash additions to convertible notes aggregating $100,000 as a result of extensions to the maturity dates.
The following assumptions were used in the Binomial Option Pricing Model in calculating the embedded conversion features and current liabilities for the years ended December 31, 2021 and 2020:
| December 31, 2021 | December 31, 2020 | |||||
| Risk-free interest rates | 0.02 - 0.09 | % | 0.08 - 1.58 | % | ||
| Expected life (years) | 0.25 | 0.25 – 1.0 | ||||
| Expected dividends | 0 | % | 0 | % | ||
| Expected volatility | 133 -544 | % | 140 - 214 | % |
Note 9 – Stockholders’ Equity (Deficit)
Series C Preferred Stock
On February 24, 2021, the Company sold of its Series C Convertible Preferred Shares, with an annual accruing dividend of 8%, to Geneva Roth Remark Holdings, Inc. (“Geneva”), for $163,500 pursuant to a Series C Preferred Purchase Agreement with Geneva. The Company may redeem the Series C Shares at various increased prices at time intervals up to the 6-month anniversary of the closing and must redeem any outstanding principle balanceshares on the 24-month anniversary. Geneva may convert the Series C Shares into our common shares, commencing on the 6-month anniversary of the closing at a 25% discount to the public market price. The Company recorded a derivative liability associated with Series C Preferred Shares of $1,208,971, valued using a Binomial Option Pricing Model. On March 16, 2021, the Company sold an additional shares for $103,500 and recorded a derivative of $165,142. The Series C Preferred Stock is classified as temporary equity due to the fact that the shares are redeemable at the option of the holder. The holder converted the entire amount of $293,700 of the February and March preferred shares plus accrued dividends of $11,748 into shares of common stock during the year ended December 31, 2021. As of December 31, 2021, there were no shares outstanding related to this issuance.
On December 16, 2019, the Company sold of its Series C Convertible Preferred Shares, with an annual accruing dividend of 10%, to Geneva for $130,000 pursuant to a Series C Preferred Purchase Agreement with Geneva. To accommodate this and future transactions, The Company’s Board of Directors approved and filed a certain Certificate of Designations with the Secretary of State of Delaware, designating of its available preferred shares as Series C Preferred Convertible Stock, Stated Value of $1.00 per share, and with a par value of $0.0001 per share. This Certificate of Designation provides the Company with the opportunity to redeem the Series C Shares at various increased prices at time intervals up to the 6-month anniversary of the closing and mandates full redemption on the 24-month anniversary. Geneva may convert the Series C Shares into our common shares, commencing on the 6-month anniversary of the closing at a 30% discount to the public market price. The Company recorded a derivative liability associated with Series C Preferred Shares of $165,218, valued using a Binomial Option Pricing Model. On December 31, 2019, the fair value of the conversion feature associated with Series C Preferred Shares was a derivative liability of $190,131, valued using a Binomial Option Pricing Model. The Series C Preferred Stock is classified as temporary equity due to the fact that the shares are immediately convertible at the option of the note is $300,000holder. During the year ended December 31, 2019, we recorded $8,750 accretion of discount. As of December 31, 2019, there were shares outstanding and $225,920 has been accreteda discount of $131,250. For the year ended December 31, 2020, the holders converted shares of series C preferred stock along with related discount into shares of common stock per the terms of the Agreement. As of December 31, 2020, there were no shares outstanding related to interest expensethis issuance.
On March 3, 2020, the Company sold of its Series C Convertible Preferred Shares, with an annual accruing dividend of 10%, to Geneva for $50,000, pursuant to a Series C Preferred Purchase Agreement with Geneva. The Company recorded a derivative liability associated with Series C Preferred Shares of $88,868, valued using a Binomial Option Pricing Model. During the year ended December 31, 2020, the holder converted shares of series C preferred stock along with related discount into shares of common stock per the terms of the Agreement. As of December 31, 2020, there were no shares outstanding related to this issuance. The Series C Preferred Stock was classified as temporary equity due to that the shares are immediately convertible at the option of the note holder.
On April 14, 2020, the Company sold of its Series C Convertible Preferred Shares, with an annual accruing dividend of 10%, to Geneva for $, pursuant to a Series C Preferred Purchase Agreement with Geneva. The Company recorded a derivative liability associated with Series C Preferred Shares of $82,028 valued using a Binomial Option Pricing Model. During the year ended December 31, 2020, the holder converted 55,800 shares of series C preferred stock along with related discount into shares of common stock per the terms of the Agreement. As of December 31, 2020, there were no shares outstanding related to this issuance. The Series C Preferred Stock was classified as temporary equity due to that the shares are immediately convertible at the option of the note holder.
The tables below provide the preferred stock activity for the year ended December 31, 2015.2021 and 2020, and also a reconciliation of the beginning and ending balances for the derivative liabilities measured using Level 3 fair value inputs for the year ended December 31, 2021 and 2020
| Preferred Stock and Accrued Dividends | Discount | Preferred Stock and Accrued Dividends, Net of Discount | Derivative Liabilities | |||||||||||||
| Balance , January 1, 2020 | $ | 140,000 | $ | 131,250 | $ | 8,750 | $ | 190,131 | ||||||||
| Issuance of Series C Preferred shares | 111,600 | 111,600 | — | 170,896 | ||||||||||||
| Conversion of Series C Preferred shares and accrued dividend | (265,115 | ) | (175,820 | ) | (89,295 | ) | (353,005 | ) | ||||||||
| Accretion of discount | (67,030 | ) | 67,030 | — | ||||||||||||
| Accretion of conversion feature on Series C preferred stock | 13,515 | — | 13,515 | 23,290 | ||||||||||||
| Change in fair value of derivatives | — | — | — | (31,312 | ) | |||||||||||
| Balance, December 31, 2020 | — | — | — | — | ||||||||||||
| Issuance of Series C Preferred shares | 293,700 | 293,700 | — | 1,374,113 | ||||||||||||
| Conversion of Series C Preferred shares and accrued dividend | (305,448 | ) | (210,121 | ) | (95,327 | ) | (338,228 | ) | ||||||||
| Accretion of discount | — | (83,579 | ) | 83,579 | — | |||||||||||
| Accretion of dividend on Series C preferred stock | 11,748 | — | 11,748 | 13,948 | ||||||||||||
| Change in fair value of derivatives | — | — | — | (1,049,833 | ) | |||||||||||
| Balance December 31, 2021 | $ | — | $ | — | $ | — | $ | — | ||||||||
The following assumptions were used in the Binomial Option Pricing Model in calculating the embedded conversion features and current liabilities for the years ended December 31, 2021 and 2020:
| 2021 | 2020 | |||
| Risk-free interest rates | – % | – % | ||
| Expected life (years) | – | – | ||
| Expected dividends | % | % | ||
| Expected volatility | – % | - % |
Common Stock
2021 Transactions
During the year ended December 31, 2021, $100,000 of notes and $ of accrued interest and fees were converted into shares of common stock with a value of $705,635.
During the year ended December 31, 2021, shares of common stock, valued at $, were accrued for related party services, and shares of common stock, valued at $172,283, were issued. At December 31, 2021 and 2020, shares to be issued for related party services were and , respectively, and the value of shares to be issued at December 31, 2021 and 2020 was $ and $, respectively.
During the year ended December 31, 2021, shares of common stock, valued at $, were accrued for services, and shares of common stock, valued at $, were issued. At December 31, 2021 and 2020, shares to be issued for services were and , respectively, and the value of shares to be issued at December 31, 2021 and 2020 was $6,000 and $14,000, respectively.
At December 31, 2021 and 2020, shares to be issued for debt conversions were , and the value of shares to be issued was $.
During the year ended December 31, 2021, shares of common stock were issued as a result of the conversion of shares of Series C Preferred stock and $11,748 of related accrued dividends.
During the year ended December 31, 2021, we issued shares of common stock, valued at $1,915, for consulting services.
2020 Transactions
During the year ended December 31, 2020, $180,922 of notes and $ of accrued interest and fees were converted into shares of common stock with a value of $328,887. A loss on extinguishment of debt of $5,835, extinguishment of debt discount of $53,567 and reduction of derivative liabilities of $180,995 have been recorded related to these conversions.
During the year ended December 31, 2020, shares of common stock, valued at $, were accrued for related party services. We issued shares of common stock, valued at $ during 2020, and these shares have been removed from shares to be issued at December 31, 2020. Additionally, we reversed the over accrual of common shares, valued at $6,914, and reduced shares to be issued at December 31, 2020.
During the year ended December 31, 2020, shares of common stock, valued at $, were accrued for services. We issued no shares during 2020 for this accrual. We reversed the over accrual of common shares, valued at $5,601 and reduced shares to be issued at December 31, 2020.
During the year ended December 31, 2020, we reversed the over accrual of common shares, valued at $, related to notes payable that were converted in prior years, and reduced shares to be issued at December 31, 2020. We recorded the reversal of the value of the shares as gain on extinguishment of debt.
During the year ended December 31, 2020, we issued shares of common stock, valued at $, for legal services.
During the year ended December 31, 2020, shares of common stock were issued as a result of the conversion of 251,600 shares of Series C Preferred shares.
Common stock warrant activity:
The Company has determined that certain of its warrants are subject to derivative accounting. The table below provides a reconciliation of the beginning and ending balances for the warrant liabilities measured using fair significant unobservable inputs (Level 3): for the years ended December 31, 2020 and 2019:
| Balance at January 1, 2015 | $ | - | ||
| Issuance of embedded conversion features on convertible note | 342,604 | |||
| Change in fair value during period | (133,809 | ) | ||
| Balance at December 31, 2015 | $ | 208,795 |
| Year ended December 31, | ||||||||
| 2021 | 2020 | |||||||
| Balance at beginning of year | $ | 476 | $ | 967 | ||||
| Additions to derivative instruments | — | — | ||||||
| Loss (gain) on change in fair value of derivative liability | (38 | ) | (491 | ) | ||||
| Balance at end of year | $ | 438 | $ | 476 | ||||
The following assumptions were used in calculations of the Black Scholes modelBinomial Option Pricing Model in calculating the embedded conversion features and current liabilities for the year ended December 31, 2015 and 2014
| Year ended December 31, | ||||||||
| 2015 | 2014 | |||||||
| Risk-free interest rates | 0.52-0.65 | % | - | |||||
| Expected life | 1 year | - | ||||||
| Expected dividends | 0 | % | - | |||||
| Expected volatility | 345-348 | % | - | |||||
| Diego Pellicer Worldwide, Inc. Common Stock fair value | $0.75 -$1.24 | - | ||||||
NOTE 11 – Stockholders’ Equity
The Company has authority to issue up to 100,000,000 shares, of which 5,000,000 shares reserved as Preferred shares and 95,000,000 are designated as Common shares. As of December 31, 2015, there were 29,498,165 common shares exchanged for the common shares held by the former shareholders of Diego Pellicer Worldwide 1 Inc. (“Diego”), 4,304,317 shares of common stock issued for services provided, 3,881,251 share issued for $1,164,375 and 126,000 shares of common stock issued in connection with $126,000 promissory note (see Note 9). For the year ended December 31, 2015, 753,333 Preferred shares were issued and subsequently converted to common shares in the reverse merger. As of December 31, 2015, there were no Preferred shares outstanding. The common shares and the preferred shares, have a par value of $0.000001.
At the completion of the merger, 21,754,832 restricted common shares of the new Company were issued to the former Diego shareholders as follows:
For the years ended December 31, 2014 the Company sold 4,275,093 Series A Preferred shares for $3,507,907,2021 and 200,000 Series B Preferred shares for proceeds received in the amount of $300,000.2020:
| December 31, 2021 | December 31, 2020 | |||||
| Annual dividend yield | % | % | ||||
| Expected life (years) | – | – | ||||
| Risk-free interest rate | – | % | – | % | ||
| Expected volatility | - | % | - | % |
There are currently 1,901,426 warrants outstanding relating to the former Diego shareholders in varying amounts:
| ||
The following table presents our warrants and embedded conversion features which have no observable market data and are derived using Black-Scholes measured at fair value on a recurring basis, using Level 3 inputs, as ofsummarizes stock warrant activity for the years ended December 31, 20152021 and 2014:2020:
| ||||
| ||||
| ||||
| ||||
| Number of shares | Weighted- average exercise price | Weighted- average remaining contractual term (in years) | |||||||||||
| Outstanding at December 31, 2019 | 211,826 | $ | 10.08 | ||||||||||
| Granted | 0 | $ | 0 | ||||||||||
| Expired | (78,031 | ) | $ | 18.72 | |||||||||
| Outstanding at December 31, 2020 | 133,795 | $ | 5.04 | 4.4 | |||||||||
| Granted | 0 | $ | 0 | ||||||||||
| Expired | (31,295 | ) | $ | 6.23 | |||||||||
| Outstanding at December 31, 2021 | 102,500 | $ | 4.68 | 4.4 | |||||||||
| Exercisable at December 31, 2021 | 102,500 | $ | 4.68 | 4.4 | |||||||||
The following represents a summary of all commonCommon stock warrantoption activity:
| Number of Warrants | Weighted Average Exercise Price | Weighted Average Remaining Contractual Term | ||||||||||
| Balance outstanding, December 31, 2014 | 790,798 | $ | 0.26 | 4.03 | ||||||||
| Granted | 1,110,628 | 1.17 | 5.18 | |||||||||
| Exercised | - | - | - | |||||||||
| Forfeited | - | - | - | |||||||||
| Expired | - | - | - | |||||||||
| Balance outstanding, December 31, 2015 | 1,901,426 | $ | 1.21 | 4.40 | ||||||||
| Exercisable, December 31, 2015 | 1,901,426 | $ | 1.21 | 4.40 | ||||||||
The Company maintains an Equity Incentive Plan pursuant to which 2,480,000124,000 shares of Common Stockcommon stock are reserved for issuance thereunder. This Plan was established to award certain founding members, who were instrumental in the development of the Company, as well as key employees, directors and consultants, and to promote the success of the Company’s business. The terms allow for each option to vest immediately, with a term no greater than 10 years from the date of grant, at an exercise price equal to par value at date of the grant. As of December 31, 2015, 1,775,000 shares had been granted, with 200,000 of those shares granted with warrants attached.2021, 10,000 awards are outstanding pursuant to the plan. There remains 705,000remain 114,000 shares available for future grants.
During the years ended December 31, 2021 and 2020, the Company recorded total option expense of $0 and $86,606, respectively. There was no unamortized stock option expense at December 31, 2021. The aggregate intrinsic value of stock options outstanding at December 31, 2021 is $0.
| Number of shares | Weighted- average exercise price | Weighted- average remaining contractual term (in years) | |||||||||||
| Outstanding at December 31, 2019 | 172,480 | $ | 5.29 | ||||||||||
| Granted | — | $ | — | ||||||||||
| Expired | — | $ | — | ||||||||||
| Outstanding at December 31, 2020 | 172,480 | $ | 5.29 | 4.5 | |||||||||
| Granted | — | $ | — | ||||||||||
| Expired | (50,000 | ) | $ | 6.00 | |||||||||
| Outstanding at December 31, 2021 | 122,480 | $ | 5.00 | 5.1 | |||||||||
| Exercisable at December 31, 2021 | 122,480 | $ | 5.00 | 5.1 | |||||||||
NOTE 12Note 10 – COMMITMENTS AND CONTINGENCIES
Leases
The Company leases property under operating leases. Property leases include retail and warehouse space with fixed rent payments and lease terms ranging from three to five years. The Company is obligated to pay the lessor for maintenance, real estate taxes, insurance and other operating expenses on certain property leases. These expenses are variable and are not included in the measurement of the lease asset or lease liability. These expenses are recognized as variable lease expense when incurred.
In August 2021, the master lease and sublease associated with the 14,800 sq. cultivation warehouse were extended through July 31, 2024. Monthly base rent payments range from $20,000 to $21,118. Monthly sublease base rent payments range from $26,300 to $28,622.
The Company records the lease asset and lease liability at the present value of lease payments over the lease term. The leases typically do not provide an implicit rate; therefore, the Company uses its estimated incremental borrowing rate at the time of lease commencement to discount the present value of lease payments. The Company’s businessdiscount rate for operating leases at December 31, 2021 was 12%. Leases often include rental escalation clauses, renewal options and/or termination options that are factored into the determination of lease payments when appropriate. Lease expense is torecognized on a straight-line basis over the lease property in appropriate and desirable locations, and to make available such property for sub-lease to specifically assigned businesses that grow, process and sell certain productsterm to the general public. Currentlyextent that collection is considered probable. As a result the Company has five (4) separate properties underbeen recognizing rents as they become payable. Our weighted-average remaining lease in the states of Colorado and Washington.term is 2.91 years.
F-15
In Colorado, there are three properties leased in 2014 and 2015. Properties were leased for a three (3) to five (5) year period with an option for an additional five (5) years, and carry terms requiring triple net (NNN) conditions. Each of the properties, except for one, have fixed monthly rentals (exclusive of the triple net terms).
As of December 31, 2015, 2021, the maturities of operating leases liabilities are as follows (in thousands):
| Operating Leases | |||||
| 2022 | $ | 513 | |||
| 2023 | 520 | ||||
| 2024 | 419 | ||||
| 2025 | 45 | ||||
| Total | 1,497 | ||||
| Less: amount representing interest | (228 | ) | |||
| Present value of future minimum lease payments | 1,269 | ||||
| Less: current obligations under leases | 386 | ||||
| Long-term lease obligations | $ | 883 | |||
Rent expense is recognized on a straight-line basis over the life of the lease. Rent expense consists of the following:
| Year ended December 31, | ||||||||
| 2021 | 2020 | |||||||
| Operating lease costs | $ | 420,979 | $ | 610,374 | ||||
| Variable rent costs | 203,640 | 396,207 | ||||||
| Total rent expense | $ | 624,619 | $ | 1,006,581 | ||||
As of December 31, 2021, the aggregate remaining minimal annual lease payments under these operating leases plus NNN were as follows: (in thousands):
| 2016 | $ | 1,101,716 | ||
| 2017 | 1,020,000 | |||
| 2018 | 888,128 | |||
| 2019 | 346,566 | |||
| Total | $ | 3,356,410 |
| 2022 | $ | 386 | ||
| 2023 | 443 | |||
| 2024 | 395 | |||
| 2025 | 45 | |||
| Total | $ | 1,269 |
In Washington, thereOther information related to leases is only one (1) property leased in 2014. as follows:
| Year ended December 31, 2021 | Year ended December 31, 2020 | |||||||
| Other information: | ||||||||
| Cash paid for amounts included in the measurement of lease liabilities: | ||||||||
| Operating cash flows from operating leases | $ | 398,838 | $ | 606,870 | ||||
| Weighted-average remaining lease term - operating leases | 2.91 | yr | 3.54 | yr | ||||
| Weighted-average discount rate - operating leases | 12 | % | 12 | % | ||||
| Right of use assets obtained in exchange for lease liabilities: | ||||||||
| Operating lease asset | $ | 627,500 | $ | — | ||||
| Lease liability | $ | 625,129 | $ | — | ||||
The property was leased for a five (5)Company recognized sublease income of $768,516 and $1,265,137 during the years ended December 31, 2021 and 2020, respectively.
These two leases have 2.5 year periodand 3.1 year terms with an option for an additional five (5) years,optional extensions, expiration dates range from July 2024 to February 2025, and carry terms requiring triple net (NNN) conditions. The property has an escalating annual rental (exclusivemonthly base rent of the triple net terms). approximately $20,000-$22,500 plus variable NNN.
As of December 31, 2015, 2021, the aggregate remaining minimal annual lease payments due under these operating leases werematurities of expected base sublease income are as follows:follows (in thousands):
| Operating Leases | |||||
| 2022 | $ | 678 | |||
| 2023 | 693 | ||||
| 2024 | 555 | ||||
| 2025 | 59 | ||||
| Total | $ | 1,985 | |||
F-16
| 2016 | $ | 84,999 | ||
| 2017 | 87,723 | |||
| 2018 | 67,365 | |||
| Total | $ | 240,087 |
Legal Proceedings
Rent expense
On May 10, 2021, a lawsuit was filed against the Company, along with other defendants, by plaintiff Erin Turoff in the District Court, City and County of Denver, State of Colorado. The specific allegations against the Company include civil theft and civil conspiracy and the plaintiff is seeking actual and compensatory damages. No specific monetary amount was demanded in the lawsuit. On July 8, 2021, the Company filed an answer to the complaint, denying the allegations. The Company believes that the suit is without merit and that the Company will ultimately prevail in any litigation.
On July 27, 2021, the Company filed a lawsuit against Royal Asset Management, LLC (“RAM”) and Neil Demers (“Demers”) in the District Court, City and County of Denver, State of Colorado, alleging breach of contract on subleases for which RAM has failed to make the required payments to the Company pursuant to the respective sublease agreements. The alleged damages under the sublease terms and other ancillary agreements amount to $1,480,881, $377,568, $1,027,635, and $1,418,480, respectively. In addition, the lawsuit alleges that RAM failed to make payments pursuant to a promissory note (the “Note”) in which the Company and RAM entered into on April 3, 2018. The Note was for the principal amount of $330,000 with interest at 18% per annum. The Note had a maturity date of April 2, 2019. The lawsuit seeks payment from RAM and Demers for the total balance due on the Note of $330,000 plus the interest due therein. On October 8, 2021, RAM and Demers filed a joint answer to the lawsuit, and the parties are now engaged in the discovery process.
COVID-19
On January 30, 2020, the World Health Organization (“WHO”) announced a global health emergency in response to a new strain of a coronavirus (the “COVID-19 outbreak”). In March 2020, the WHO classified the COVID-19 outbreak as a pandemic based on the rapid increase in exposure globally. The full impact of the COVID-19 outbreak continues to evolve as of the date of this report. Management is actively monitoring the global situation and its effects on the Company’s operating leasesindustry, financial condition, liquidity, and operations. Given the daily evolution of the COVID-19 outbreak and the global responses to curb its spread, the Company is not able to estimate the effects of the COVID-19 outbreak on its results of operations, financial condition, or liquidity for fiscal year 2022. However, if the pandemic continues, it may have a material adverse effect on the Company’s results of future operations, financial position, and liquidity in fiscal year 2022.
Employment Agreements
As a condition of their employment, the Board of Directors approved employment agreements with three key executives. These agreements provided that additional shares will be granted each year over the term of the agreements should their shares as a percentage of the total shares outstanding fall below prescribed ownership percentages. Nello Gonfiantini III, who became the Company’s CEO in October 2019 receives an annual grant of additional shares each year to maintain his ownership percentage at 10% of the outstanding stock. The Company’s CFO received a similar grant each to maintain his ownership percentage at 2% of the outstanding stock. In addition, prior to his departure in October 2019, Ron Throgmartin, the Company’s previous CEO, would receive a grant of additional shares to maintain his ownership at 7.5% of the Company’s outstanding stock. During the year ended December 31, 20152021, the Company accrued compensation expense of approximately $163,000 on shares of common stock under these agreements. During the year ended December 31, 2020, the Company accrued compensation expense of approximately $118,000 on shares of common stock under these agreements. As of December 31, 2021 and 20142020, the ending balance of accrued compensation was $1,228,028$3,586 and $487,533,$13,364, respectively. The number of shares accrued to be issued was at December 31, 2021.
Departure of Executive Officer
On January 30, 2019, the Company executed a Separation Agreement and Release with David Thompson, its former Senior Vice President- Finance, finalizing his departure from the Company as an employee. Pursuant to its material terms, the Company agreed to pay Mr. Thompson aggregate cash payments of $206,250, based upon the Company’s receipt of certain gross sales receipts derived from its Alameda Store in Colorado, and certain stock grants based upon the Company’s outstanding common shares as of February 1, 2019, including a stock grant of restricted common shares for accrued salary and restricted common shares in exchange for his approximate of stock options. During the years ended December 31, 2021 and 2020, $ and $, respectively, were paid under this agreement. As of December 31, 2021, the outstanding balance was $126,389, and is included in Accrued payable – related party in the accompanying consolidated balance sheet.
On October 29, 2019, the Company accepted the resignation of Ron Throgmartin from his positions as CEO, President and Director. Mr. Throgmartin’s resignation was not the result of any disagreements with Registrant’s plan of operations, policies or management. On the same date, we appointed Christopher D. Strachan, our Chief Financial Officer, to membership on our Board of Directors and appointed Nello Gonfiantini III, our Chief Operations Officer, to the additional post of Chief Executive Officer.
Ron Throgmartin signed a 5-year term Separation Agreement which, among other matters, terminated his Employment Agreement, as amended. On the date of the Separation Agreement, the Company acknowledged it owed Mr. Throgmartin the amount of $517,252 in principal and accrued interest of note payable, salary and fees, accrued during the 5 years of his employment. In addition, the Corporation further acknowledged that it will pay Mr. Throgmartin fifty (50%) percent of his compensation due under the remaining Employment Agreement, or $614,583 under certain conditions, which the Company accrued in full as the date of Mr. Throgmartin’s separation. This agreement provides that the Registrant will pay him $5,000 monthly against his accrued salary/fees and 50% of future compensation due under his terminated Employment Agreement, with certain accelerated payments in the event Registrant’s financial results attain certain EBITA benchmarks. Registrant shall have the right to require Mr. Throgmartin to provide consulting services to Registrant for a per diem fee of $500. During the years ended December 31, 2021 and 2020, $ and $, respectively, were paid under this agreement. As of December 31, 2021, the outstanding balance was $820,597, and is included in Accrued payable – related party in the accompanying consolidated balance sheet.
F-17
Note 1311 – Deferred Tax Assets and Income Tax Provision
The reconciliation of income tax benefit at the U.S. statutory rate of 34%21% for the yearyears ended December 31, 20152021 and 2014 to the Company’s effective tax rate is as follows:
The reconciliation of income tax benefit at the U.S. statutory rate of 34% for the year ended December 31, 2015 and for the year ended December 31, 20142020 respectively to the Company’s effective tax rate is as follows:
| For the Year Ended | For the Year Ended | Year Ended | Year Ended | |||||||||||||
| December 31, 2015 | December 31, 2014 | December 31, 2021 | December 31, 2020 | |||||||||||||
| Statutory federal income tax rate | -34 | % | -34 | % | (21 | )% | (21 | )% | ||||||||
| State income tax, net of federal benefits | -6 | % | -6 | % | (5 | )% | (5 | )% | ||||||||
| Valuation Allowance | -40 | % | -40 | % | ||||||||||||
| Change in federal tax rate | 0 | % | 0 | % | ||||||||||||
| Change in valuation allowance | 26 | % | 26 | % | ||||||||||||
| Income tax provision (benefit) | -80 | % | -80 | % | 0 | % | 0 | % | ||||||||
The benefit for income tax is summarized as follows:
| Year Ended December 31, 2015 | Year Ended December 31, 2014 | Year Ended December 31, 2021 | Year Ended December 31, 2020 | |||||||||||||
| Federal | ||||||||||||||||
| Current | $ | - | $ | - | $ | — | $ | — | ||||||||
| Deferred | (5,720,000 | ) | (141,000 | ) | 71,000 | 79,000 | ||||||||||
| State | ||||||||||||||||
| Current | - | - | — | — | ||||||||||||
| Deferred | (1,009,000 | ) | (25,000 | ) | 16,000 | 17,000 | ||||||||||
| Change in valuation allowance | 6,729,000 | 166,000 | (87,000 | ) | (96,000 | ) | ||||||||||
| Income tax provision (benefit) | $ | - | $ | - | $ | — | $ | — | ||||||||
Deferred tax assets (liabilities) consist of the following:
| Year Ended | Year Ended | |||||||
| December 31, 2021 | December 31, 2020 | |||||||
| Net operating loss carry forwards | $ | (6,563,889 | ) | $ | (6,492,759 | ) | ||
| Warrants issued for services | 1,503,621 | 1,467,413 | ||||||
| Impairment of investment | 111,662 | 111,662 | ||||||
| Depreciation | 48,025 | 54,066 | ||||||
| Interest expense on convertible notes | 1,981,486 | 2,688,874 | ||||||
| Total gross deferred tax asset/liabilities | (2,913,095 | ) | (2,170,744 | ) | ||||
| Valuation allowance | (2,913,095 | ) | 2,170,744 | |||||
| Net deferred taxes | $ | — | $ | — | ||||
As of December 31, 2015,2021, the Company had accumulated Federal net operating loss carryovers (“NOLs”) of $6,895,000.$31,256,612. These NOLs begin to expire in 2033,can be carried forward indefinitely and the utilization of NOLs may be subject to limitation under the Internal Revenue Code Section 382 should there be a greater than 50%50% ownership change as determined under the regulations.
In assessing the realization of deferred tax assets, management considers whether it is more likely than not that some portion or all of the deferred tax assets will be realized. The ultimate realization of deferred tax assets is dependent upon the generation of future taxable income during the periods in which those temporary differences become deductible. Management considers the scheduled reversal of deferred tax liabilities, projected future taxable income and tax planning strategies in making this assessment. Based on the assessment, management has established a full valuation allowance against the entire deferred tax asset relating to NOLs for every period because it is more likely than not that all of the deferred tax asset will not be realized.
The Company files U.S. Federal and various State tax returns that are subject to audit by tax authorities beginning with the year ended December 31, 2013.2017. The Company’s policy is to classify assessments, if any, for tax and related interest and penalties as tax expense.
Note 12 – Subsequent Events
The Company evaluated subsequent events and transactions that occur after the balance sheet date up to the date that the consolidated financial statements are available to be issued. Any material events that occur between the balance sheet date and the date that the consolidated financial statements were available for issuance are disclosed as subsequent events, while the consolidated financial statements are adjusted to reflect any conditions that existed at the balance sheet date. Based upon this review, except as disclosed within the footnotes or as discussed below, the Company did not identify any recognized or non-recognized subsequent events that would have required adjustment or disclosure in the consolidated financial statements.
During the period from January 1, 2022 through April 15, 2022:
During January 2022, the Company loaned an additional $120,000 pursuant to a promissory note with the party described in Note 14 – Subsequent Events4. The note matures 11 months after issuance and has an effective interest rate of 8.33%. Payments of principal and interest are due monthly, beginning 30 days after the date of issuance (see below).
In April 2016,
The Company entered into two convertible promissory notes with an investor in the Company issued CEO 1,900,000aggregate amount of $330,000, and received aggregate proceeds of $310,000. The notes mature one year from issue and bear interest at 8% per year. Upon a default, the holder shall have the right from time to time, and at any time following an event of default, and ending on the date of payment of the default amount (as defined), to convert all or any part of the outstanding and unpaid principal, interest, penalties, and all other amounts under the notes into fully paid and non-assessable shares of common stock at a conversion price equal to 65% of the three lowest trading prices of the Company common stock for services rendered valued at $1,577,000 and issued an investor additional 1,866,666the 15 trading days immediately preceding the delivery of a notice of conversion resulting from such default. The Company agreed to issue a total of 3,400,000 shares of common stock for repricing original stock purchase agreementto the investor in amountconnection with the issuance of $700,000 from $1.50 per share to $0.30 per share.
Item 7.Management’s Discussion and Analysis of Financial Condition and Results of Operationsthe notes. These shares were issued in March, 2022.
The following provides information which management believes is relevant to an assessment and understanding of our results of operations and financial condition. The discussion should be read along with our financial statements and notes thereto. The following discussion and analysis contains forward-looking statements, which involve risks and uncertainties. Our actual results may differ significantly from the results, expectations and plans discussed in these forward-looking statements. See “Cautionary Note Regarding Forward Looking Statements.”
Diego Pellicer Worldwide, Inc. was established on August 26, 2013 to take advantage of legislation allowing for the legalization of cannabis operations in several states, currently including Colorado, Washington and Oregon, and with a number of other states giving consideration to this market as well. It is expected that the industry will operate under stringent regulations within the various state jurisdictions.
Our primary business plan is to lease various properties and develop them in a manner that would allow others to grow, process and retail cannabis and related products. These leases were designed to provide a substantial stream of income. We believe that as laws evolve, it is possible that we will have the opportunity to participate directly in these operations as well.
Results of Operations
Year ended December 31, 2015 compared to year ended December 31, 2014
| Year Ended | Year Ended | Increase (Decrease) | ||||||||||||||
| December 31, 2015 | December 31, 2014 | $ | % | |||||||||||||
| REVENUES | ||||||||||||||||
| Rental income | $ | 1,059,631 | $ | 497,638 | $ | 561,993 | 113 | % | ||||||||
| Licensing revenue | 54,000 | 48,567 | 5,433 | 11 | % | |||||||||||
| Provision for uncollectible rents | (809,101 | ) | (497,638 | ) | (311,463 | ) | 63 | % | ||||||||
| Total Revenues | $ | 304,530 | $ | 48,567 | $ | 255,963 | 527 | % | ||||||||
* Not divisible by zero
For the year ended December 31, 2014 and 2015, the Company had already leased five facilities in Colorado (3), in Washington (1) and in Oregon (1). Only the Colorado facilities have been sublet to date.
Total revenue for the year ended December 31, 2015 was $304,530, as compared to $48,567 for the year ended December 31, 2014, an increase of $255,963, and represents recognition of income on the Plandai Biotechnology license, rental income of 54,000 and a settlement income of $200,000. In January 2014,On February 8, 2022, the Company entered into an Equity Purchase Agreement (the “Purchase Agreement”), with Hemp Choice Distribution, LLC, a LicensingColorado limited liability company (“HCD”), its owners (the “Sellers”), and Gabriela Vergara (the “Sellers’ Representative”), pursuant to which Purchaser has agreed to acquire all of the issued and outstanding equity interests of HCD (“Membership Interests”). The closing of the transaction is expected to occur within 90 days from the date of the Purchase Agreement with Plandai Biotechnology, a publicly traded company,(the “Closing”).
The purchase price for the Membership Interests shall be the aggregate amount of $4,400,000 payable at the Closing as follows: (i) $250,000 in cash by wire transfer of immediately available funds; (ii) the number of restricted shares of the Company’s common stock that is equal to license their Diego Pellicer brand in exchange for 3,333,334 warrants with a 10-year term, to purchase Plandai’s common stock. At$250,000 divided by the current market price at the time of the Agreement, the publicly traded shares in Plandai were valued at $525,567. In October 2014, the Company filed a Notice of Exercise to obtain the shares, and have recorded their value as deferred income. For the year ended December 31, 2015 and 2014, $54,000 and $48,567 was recognized as licensing revenue.
For the year ended December 31, 2015 and 2014, rental income of $1,059,631 and $497,638 an derived from the Colorado sub-leases, $809,101 and $497,638 of which has been reserved as uncollectible from the tenant, pending the latter receiving final approval of licenses from the government to allow them to continue to progress on its growing, processing and retailing facilities.
| Year Ended | Year Ended | Increase (Decrease) | ||||||||||||||
| December 31, 2015 | December 31, 2014 | $ | % | |||||||||||||
| COSTS AND EXPENSES (other income) | ||||||||||||||||
| General and administrative expenses | $ | 14,268,072 | $ | 3,624,507 | $ | 10,643,565 | 294 | % | ||||||||
| Impairment of Investment | 408,900 | - | 408,900 | * | ||||||||||||
| Rent expense | 1,228,028 | 487,533 | 740,495 | 152 | % | |||||||||||
| Change in Derivative | (133,809 | ) | - | (133,809 | ) | * | ||||||||||
| Write-off of line of credit receivable | 240,000 | 777,846 | (537,846 | ) | -69 | % | ||||||||||
| Other income (interest) | 811,726 | (73,198 | ) | 884,924 | -1209 | % | ||||||||||
| Total costs and expenses | $ | 16,822,917 | $ | 4,816,688 | $ | 12,006,229 | 249.3 | % | ||||||||
* Not divisible by zero / being largely a development company in early 2014, the comparisons mayClosing, but such price shall not be meaningful.
Generalgreater than $.05 per share or less than $.02 per share: and administrative. Our general(iii) three million nine hundred thousand dollars ($3,900,000) in the form of 390,000 shares of redeemable preferred stock (with a stated value of $10.00 per share) of the Purchaser. The terms of the redeemable preferred shares shall be specifically and administrative expenses forfully set forth in a Certificate of Designations to be filed with the year ended December 31, 2015 were $14,268,072, comparedState of Delaware at the time of Closing. After the Closing, the Purchaser agrees to $3,624,507 for the year ended December 31, 2014. The increase of $10,643,565, which was mostly attributable to non-employee stock compensation and unusual high costs for professional fees (legal and accounting) related to the reverse merger transaction.
Rent expense. We incurred rent expense from five separate facilities leased during 2014 and 2015. The rent incurred from these properties during the year ended December 31, 2015 and 2014 was $1,228,028 and $487,533, because the leases started on the third quarter of 2014.
Bad debt expense.Bad debt expense for the year ended December 31, 2015 and 2014 was $240,000 and 777,846, respectively. In 2015, we settled all amount owed against 2.5Mprovide HCD with a line of credit for $200,000. We advanced funds for their operational costsor assist it in obtaining a line of credit from a third party of up to develop these specific properties, as$1,000,000. In addition, the tenant awaits final licensing frombusiness of HCD shall continue to be managed by Sellers’ Representative subject to the state in orderconditions of an employment agreement to begin full operations.
Impairment of Investment.With the Plandai shares currently trading at $.07 per share,be entered into by the Company impaired $408,900 during the year ended December 31, 2015.
LIQUIDITY AND CAPITAL RESOURCES
| Year Ended | Year Ended | Increase (Decrease) | ||||||||||||||
| December 31, 2015 | December 31, 2014 | $ | % | |||||||||||||
| Net cash used in operating activities | $ | (2,653,338 | ) | $ | (2,602,044 | ) | $ | (328,794 | ) | 12.6 | % | |||||
| Net cash used in investing activities | (784,764 | ) | (1,209,899 | ) | 702,635 | 58.1 | % | |||||||||
| Net cash provided by financing activities | 3,441,002 | 3,704,960 | (263,958 | ) | -7.1 | % | ||||||||||
| Net (Decrease) Increase in Cash | 2,900 | (106,983 | ) | 109,883 | 102.7 | % | ||||||||||
| Cash - beginning of period | 33,101 | 140,084 | (106,983 | ) | ||||||||||||
| Cash - end of year | $ | 36,001 | $ | 33,101 | $ | 2,900 | 8.8 | % | ||||||||
Operating Activities. The net cash used for the year ended in December 31, 2015 was $2,653,338, which is primarily attributableand Sellers’ Representative prior to the net loss of $16,518,387. For the year ended December 31, 2014, the net cash used of $2,602,044 was also dueClosing. The Company has made loans to a net loss of $4,768,121 and partially offset by an increaseHCD in the aggregate original amount of payables.$244,000, as described in Note 4 and above.
Investing Activities.The cash used for investing activities for the year ended December 31, 2015 of $784,764, includes $584,764 on acquisition of property and equipment, $200,000 advanced under line of credit. For the year ended December 31, 2014, cash used for investing activities amounted to $1,209,899, which includes $54,341 repayment from related party, $253,990 on acquisition of property and equipment, $15,300 on security deposit, $150,000 on Deposits on end of lease and $707,250 advanced under line of credit.
Financing Activities.Funds provided from financing activities for the year ended December 31, 2015, and December 31, 2014 of $3,441,002 and $3,704,960 respectively. During the year ended December 31, 2015, net cash proceed from sales of preferred stock and warrants is $1,129,999, proceeds form note payable is $846,628, $300,000 from convertible note payable and 1,164,375 from sale of common stock. During the year ended December 31, 2015, we received $3,807,908 from sales of preferred stock and warrants, $1,352 from collection of subscriptions receivable, spent $17,000 on repayment of related party loan, and $87,300 on acquisition of treasury stock.
Off-Balance Sheet Arrangements
We have no off-balance sheet arrangements.
Item 7A. Quantitative and Qualitative Disclosures About Market Risk.
We are a smaller reporting company as defined by Rule 12b-2 of the Exchange Act and are not required to provide the information under this item.
Item 8.Financial Statements and Supplementary Data.
The information required by this item appears beginning on page F-1 following the signature pages of this report and is incorporated herein by reference.
Item 9. Changes in and Disagreement with Accountants on Accounting and Financial DisclosureDisclosure..
None.On January 1, 2021, the audit practice of Hall & Company Certified Public Accountants and Consultants, Inc. (“Hall”), an independent registered public accounting firm, was combined with Macias Gini & O’Connell (“MGO”) in a transaction pursuant to which Hall combined its operations with MGO, and certain members of Hall joined MGO either as employees or partners of MGO. On January 7, 2021, Hall resigned as auditors of the Company, and with the approval of the Company’s Board of Directors, MGO was engaged as the Company’s independent registered public accounting firm.
Prior to engaging MGO, the Company did not consult with MGO regarding the application of accounting principles to a specific completed or proposed transaction or regarding the type of audit opinions that might be rendered by MGO on the Company’s financial statements, and MGO did not provide any written or oral advice that was an important factor considered by the Company in reaching a decision as to any such accounting, auditing or financial reporting issue
Item 9A. Controls and ProceduresProcedures..
(a) Disclosure Controls and Procedures
We carried out an evaluation required by Rule 13a-15 of the Securities Exchange Act of 1934, as amended (the “Exchange Act”) under the supervision and with the participation of our management, including our principal executive officer and principal financial officer, of the effectiveness of the design and operation of the Company’s “disclosure controls and procedures” and “internal control over financial reporting” as of the end of the period covered by this Annual Report.
Evaluation of Disclosure Controls and Procedures
We maintain disclosure controls and procedures as defined in Rules 13a-15(e) and 15d-15(e) of the Exchange Act that are designed to ensure that information required to be disclosed in our reports filed or submitted to the SEC under the Exchange Act is recorded, processed, summarized and reported within the time periods specified by the SEC’s rules and forms, and that information is accumulated and communicated to management, including the principal executive and financial officer as appropriate, to allow timely decisions regarding required disclosures. Our principal executive officer and principal financial officer evaluated the effectiveness of disclosure controls and procedures as of the end of the period covered by this Annual Report (the “Evaluation Date”), pursuant to Rule 13a-15(b)13a- 15(b) under the Exchange Act. Based on that evaluation, our principal executive officer and principal financial officer concluded that, as of the Evaluation Date, our disclosure controls and procedures were not effective to ensure that information required to be disclosed in our reports under the Exchange Act is recorded, processed, summarized, and reported within the time periods specified in the SEC’s rules and forms, and that such information is accumulated and communicated to management, including our principal executive officer and principal financial officer, as appropriate to allow timely decisions regarding required disclosure, due to material weaknesses in our control environment and financial reporting process.
Limitations on the Effectiveness of Controls
Our management, including our principal executive officer and principal financial officer, does not expect that our Disclosure Controls and internal controls will prevent all errors and all fraud. A control system, no matter how well conceived and operated, can provide only reasonable, not absolute, assurance that the objectives of the control system are met. Further, the design of a control system must reflect the fact that there are resource constraints, and the benefits of controls must be considered relative to their costs. Because of the inherent limitations in all control systems, no evaluation of controls can provide absolute assurance that all control issues and instances of fraud, if any, within the Company have been detected. These inherent limitations include the realities that judgments in decision-makingdecision- making can be faulty, and that breakdowns can occur because of a simple error or mistake. Additionally, controls can be circumvented by the individual acts of some persons, by collusion of two or more people, or by management or board override of the control.
The design of any system of controls also is based in part upon certain assumptions about the likelihood of future events, and there can be no assurance that any design will succeed in achieving its stated goals under all potential future conditions; over time, controls may become inadequate because of changes in conditions, or the degree of compliance with the policies or procedures may deteriorate.
Because of the inherent limitations in a cost-effective control system, misstatements due to error or fraud may occur and not be detected.
Management’s(b) Management's Annual Report on Internal Control over Financial Reporting
Our management is responsible for establishing and maintaining adequate internal control over financial reporting, as such term is defined in Exchange Act Rule 13a-15(f). Under the supervision and with the participation of our management, including our principal executive officer and principal financial officer, we conducted an evaluation ofIn evaluating the effectiveness of our internal control over financial reporting, based onour management used the framework Company to confirm what framework was usedcriteria set forth by the Committee of Sponsoring Organizations of the Treadway Commission (COSO) in connection with its evaluation of internal controls over financial reporting.Internal Control – Integrated Framework (2013). Internal control over financial reporting is a process designed to provide reasonable assurance regarding the reliability of financial reporting and the preparation of financial statements for external purposes in accordance with generally accepted accounting principles and includes those policies and procedures that (a) pertain to the maintenance of records that, in reasonable detail, accurately and fairly reflect the transactions and dispositions of the assets of the Company; (b) provide reasonable assurance that transactions are recorded as necessary to permit the preparation of financial statements in accordance with generally accepted accounting principles and that receipts and expenditures of the Company are being made only in accordance with authorizations of the our management and directors; and (c) provide reasonable assurance regarding prevention or timely detection of unauthorized acquisition, use or disposition of the Company’s assets that could have a material effect on the financial statements.
22
Based on our evaluation under the framework described above, as of December 31, 2021, our management concluded that we had “material weaknesses” (as such term is defined below) in our control environment and financial reporting process consisting of the following as of the Evaluation Date:
| 1) | lack of a functioning audit committee due to a lack of a majority of independent members and a lack of a majority of outside directors on our Board of Directors, resulting in ineffective oversight in the establishment and monitoring of required internal control and procedures; | |
| 2) | inadequate segregation of duties consistent with control objectives; | |
| 3) | ineffective controls over period end financial disclosure and reporting processes; and | |
| 4) | lack of accounting personnel with adequate experience and training. |
A “material weakness” is defined under SEC rules as a deficiency, or a combination of deficiencies, in internal control over financial reporting such that there is a reasonable possibility that a material misstatement of a company’s annual or interim financial statements will not be prevented or detected on a timely basis by the company’s internal controls.
As of the date of this Annual Report, the Company does not intend to remedy the foregoing and therefore such material weaknesses in our control environment and financial reporting process will continue.continue due to lack of available capital. A system of controls, no matter how well designed and operated, cannot provide absolute assurance that the objectives of the system of controls are met, and no evaluation of controls can provide absolute assurance that all control issues and instances of fraud, if any, within a company have been detected.
Attestation report of the registered public accounting firm
This Annual Report does not include an attestation report of the Company’s independent registered public accounting firm regarding internal control over financial reporting. Management’s report was not subject to attestation by the Company’s independent registered public accounting firm pursuant to temporary rules of the SEC that permit the Company to provide only management’s report on internal control in this Annual Report.
Changes(c) Change in Internal ControlsControl over Financial Reporting
There were no significant changes into our internal control over financial reporting (as defined in Rules 13a-15(f) and 15d-15(f) under the Exchange Act) during theour fourth fiscal year ended December 31, 2015quarter, that have affected,could materially affect, or are reasonably likely to materially affect, our internal control over financial reporting.
None.
Item 9C. Disclosure Regarding Foreign Jurisdictions that Prevent Inspections
None.Not applicable.
23
Item 10. Directors, Executive Officers and Corporate Governance
Directors and Executive Officers
The following table sets forth the namesname and ages of all of our directors and executive officers, and key employees; and alltheir positions and offices heldwith us, as of the date of this Report. The directors will hold such office until the next annual meeting of shareholders and until his or her successor has been elected and qualified.filing:
| Name | Age | Position | ||
| Chief Executive Officer, Director | ||||
| Christopher Strachan | Chief Financial Officer, | |||
| Director |
Business Experience
The following summarizes the occupation and business experience during the past five years for our officers, directors and key employees as of the date of this Report:
Officers and Directors
Ron ThrogmartinNello Gonfiantini joined the Company as CEOa consultant in 2016. In February 1, 2017, he was appointed as Vice President of Diego Pellicer Worldwide Inc. in August 2013. In May 2010 Mr. Throgmartin began servingReal Estate. He was elected as an independent consultant for a medical marijuana company in Colorado where he managed State licensing, compliance, retail operations and production. From 2003-2008 Mr. Throgmartin was involved with the largest privately owned cattle producers in the United States with operations that encompassed 11 states. In 1989, Mr. Throgmartin started his own commercial development company, where over a span of 20 years he developed over 3 million square feet of commercial projects, working with somedirector of the top rated retailersCompany in March 2018, and was appointed as the country, including Lowes, Home Depot, HH Gregg, Staples, McDonalds, Steak-n-Shake. From 1981-1989 Mr. Throgmartin worked for his family business HH Gregg, where he servedChief Executive Officer in many roles including Operations and new and store development. Today HH Gregg (HHG) is a publicly owned and operated appliance and electronics retailer covering 16 states, and over $2.4 billion in annual sales. Mr. Throgmartin is a graduateOctober 2019. He has more than forty years of Ball State University with a Bachelor of Science degree. We believe that Mr. Throgmartin should serve as a member of the board of directors due to the perspective and experience he brings as our COO and his experience in the medical marijuana industry.real estate and financial sector, including President and Chairman of the Board of Home Federal Saving Bank of Nevada which was later purchased by American Federal Savings Bank. He also formed Specialty Mortgage Trust, Inc., a real estate investment trust. In 2015 he founded Crystal Bay Financial to assist corporate and real estate clients find solutions to complex and multifaceted financial challenges.
Christopher Strachanjoined the Company as CFO of Diego Pellicer Worldwide Inc.Chief Financial Officer in January 2016.2016, and was appointed a director of the Company in October 2019. Mr. Strachan is an accomplished CFO, CEO, and managerprofessional with 30thirty years of experience in corporate operations, marketing, securities and finance, and 20twenty years of experience in executive management experience. He has worked largely with developing and startup corporations, where he has honed his skills.management. For the past five years, Mr. Strachan has served as the President of Helisports LLC, a business development consulting company. In addition, he served as the CEOChief Executive Officer of Rhodes Architectural Stone from 2011 to 2012, the Director of Marketing and Sales of Glasair Aviation from 2012 to 2014 and the Director of Flight Operations and R&D at RotorWay Helicopters from 2009 to 2011.
Alan Valdeshas operated as Chairman of the Company since inception Mr. Valdes has over 35 years’ experience on Wall Street. He appears regularly on television giving market comments on such networks as CNN, CNBC, CCTV and many other domestic and foreign media outlets. Since 2013, Mr. Valdes has worked as a senior partner at SilverBear Capital Inc., where he is in charge investment and development projects in the United States and Canada. Additionally, Mr. Valdes is currently a partner at Wall Street Capital Partners, a boutique Wall Street consultant that assists clients in accomplishing what the best and largest firms do within a fraction of the cost and time. He is also a co-founder and partner of the Louisiana International Gulf Terminal project, a $1.5 billion port project, the largest in the United States. He is also currently a board member of the World Air League and the Strang Cancer Prevention Center. Mr. Valdes is a graduate on Seton Hall University, New York University and Harvard University. We believe that Mr. Valdes should serve as a member of the board of directors due to his experience working for the Company since inception and the with early stage corporations, like the Company.
Steve Norriswas elected a director of the Company in October 2015. Currently serving as Chairman of Stephen Norris Capital Partners, LLC, Mr. Norris has substantial expertise in structuring, negotiating and implementing leveraged buy-outs, cash-flow-based investments and financing strategies in the public and private capital markets. Mr. Norris is one of five co-founders of the Carlyle Group, a major merchant bank based in Washington, D.C. From 1988-1997, Mr. Norris served as Carlyle’s President. He was a principal participant and key advisor in Carlyle’s numerous investments in various public and private companies. While at Carlyle, Mr. Norris, along with other senior members of the Carlyle team, participated in the acquisition, disposition, strategic focusing and financing (in public and private markets) of numerous companies involving several billion dollars of equity capital. Carlyle invested in leveraged buyouts (LBOs), venture capital (particularly telecommunications and wireless companies in the pre-Internet days), and real estate. Today, Carlyle is one of the largest and most successful private equity firms in the world. Prior to co-founding Carlyle, Mr. Norris was a Corporate Vice President of Marriott Corporation in Washington, D.C. He was a principal strategist and advisor for Marriott’s substantial public and private financings, limited partnerships, acquisitions and divestitures from 1981 to mid-1987. In 1992, Mr. Norris was appointed by President George Bush, and confirmed by the U.S. Senate, as one of the five board members of the approximately (at the time) $68 billion Federal Retirement Thrift Investment Board. During his tenure (1992-1995), Mr. Norris successfully advocated for the right of Federal employees to allocate a greater portion of their savings into public equities. Until late 1996, Mr. Norris served on the Advisory Committee of SEAG, Inc. which advises the Saudi Government on economic development and diversification within the Kingdom of Saudi Arabia. Mr. Norris was a Fellow at Yale Law School (1977) and received a B.S. and J.D. (1972, 1975) with honors from the University of Alabama, and an L.L.M. from New York University (1976). Management believes that Mr. Norris’ past experience qualifies him for his position with the Company.
Family Relationships
No family relationship has ever existed between any director, executive officer of the Company, and any person contemplated to become such.
CommitteesBoard Composition and Role in Risk Oversight
Our Board is currently comprised of two directors. The Board assesses on an ongoing basis the risks faced by the Company. These risks include financial, technological, competitive, and operational risks. The Board dedicates time at each of its meetings to review and consider the relevant risks faced by the Company at that time. In addition, since the Company does not have an Audit Committee, the Board is also responsible for the assessment and oversight of the Company’s financial risk exposures.
Committees
The board of directors has no standing committees. However, the Company intends to implement a comprehensive corporate governance program, including establishing various board committees and adopting a
Code of Ethics inand Business of Conduct
The Company has not yet formally adopted a written code of ethics and business conduct to be applied to the future.Company’s principal executive officer, principal financial officer, principal accounting officer or controller, or persons performing similar functions. Based on its small size, limited financial and human resources, the Company has not adopted written code of ethics.
24
Involvement in Certain Legal Proceedings
To the best of the registrant’s knowledge, during the past five years, no director, executive officer, promoter or control person of the Company:
| (1) | has filed a petition under the federal bankruptcy laws or any state insolvency law, nor had a receiver, fiscal agent or similar officer appointed by a court for the business or present of such a person, or any partnership in which he was a general partner at or within two years before the time of such filing, or any corporation or business association of which he was an executive officer within two years before the time of such filing; |
| (2) | were convicted in a criminal proceeding or named subject to a pending criminal proceeding (excluding traffic violations and other minor offenses); |
| (3) | were the subject to any order, judgment or decree, not subsequently reversed, suspended or vacated, of any court of competent jurisdiction, permanently or temporarily enjoining, barring, suspending or otherwise limiting his involvement in any type of the following activities: |
| (i) | acting as a futures commission merchant, introducing broker, commodity trading advisor, commodity pool operator, floor broker, leverage transaction merchant, associated person of any of the foregoing, or as an investment advisor, underwriter, broker or dealer in securities, or as an affiliated person, director of any investment company, or engaging in or continuing any conduct or practice in connection with such activity; |
| (ii) | engaging in any type of business practice; |
| (iii) | engaging in any activity in connection with the purchase or sale of any security or commodity or in connection with any violation of federal or state securities laws or federal commodity laws. |
| (4) | were the subject of any order, judgment or decree, not subsequently reversed, suspended or vacated, of any federal or state authority barring, suspending or otherwise limiting for more than 60 days the right of such person to engage in any activity described above under this Item, or to be associated with persons engaged in any such activity; |
| (5) | were found by a court of competent jurisdiction in a civil action or by the Securities and Exchange Commission to have violated any federal or state securities law and the judgment in such civil finding or find by the Securities and Exchange Commission has not been subsequently reversed, suspended or vacated; |
| (6) | were found by a court of competent jurisdiction in a civil action or by the Commodity Futures Trading Commission to have violated any federal commodities law, and the judgment in such civil action or finding by the Commodity Futures Trading Commission has not been subsequently reversed, suspended or vacated. |
Compliance with Section 16(A) of the Exchange Act
Section 16(a) of the Securities Exchange Act requires the Company’s directors, executive officers and persons who beneficially own 10% or more of 1934
Asa class of securities registered under Section 12 of the dateExchange Act to file reports of this report, webeneficial ownership and changes in beneficial ownership with the Securities and Exchange Commission. Directors, executive officers and greater than 10% stockholders are not subjectrequired by the rules and regulations of the Securities and Exchange Commission to furnish the Company with copies of all reports filed by them in compliance with Section 16(a).
Based solely on our review of certain reports filed with the Securities and Exchange Commission pursuant to Section 16(a) of the Securities Exchange Act of 1934.1934, as amended, the reports required to be filed with respect to transactions in our common stock by each person who, at any time during the 2021 fiscal year, was a director, officer, or beneficial owner of more than 10% of our common stock, were filed during the most recent fiscal year.
25
Item 11. Executive Compensation
Summary Compensation Table— Fiscal Years Ended December 31, 2021 and 2020
The following table shows for the period ended December 31, 2015, thesets forth information concerning all cash and non-cash compensation awarded (earned)to, earned by or paid byto the Company to its named persons for services rendered in all capacities during the noted periods. No other executive officers or actingreceived total annual salary and bonus compensation in a similar capacity as that term is defined in Item 402(a)(2)excess of Regulation S-K. There are no understandings or agreements regarding compensation that our management will receive after a business combination that is required to be included in this table, or otherwise.$100,000.
| Name and Principal Position | Fiscal Year | Salary ($) | Bonus | Option Awards | All Other Compensation | Total ($) | Fiscal Year | Salary ($) | Bonus | Option Awards | All Other Compensation (1) | Total ($) | ||||||||||||||||||||||||||||||||||||
| Ron Throgmartin - CEO | 2015 | Accrued | $ | 250,000 | - | - | - | 250,000 | ||||||||||||||||||||||||||||||||||||||||
| Nello Gonfiantini III – CEO/COO (2) (3) | 2021 | Accrued | $ | 240,000 | — | — | 135,565 | $ | 375,565 | |||||||||||||||||||||||||||||||||||||||
| Paid | $ | 129,414 | - | - | - | 129,414 | Paid | $ | 253,000 | — | — | — | $ | 253,000 | ||||||||||||||||||||||||||||||||||
| 2014 | Accrued | $ | 213,250 | - | - | - | 213,250 | 2020 | Accrued | $ | 240,000 | — | — | 95,697 | $ | 335,697 | ||||||||||||||||||||||||||||||||
| Paid | $ | 181,250 | - | - | - | 181,250 | Paid | $ | 114,167 | — | — | — | $ | 114,167 | ||||||||||||||||||||||||||||||||||
| Christopher Strachan - CFO | 2015 | Accrued | $ | - | - | - | - | - | 2021 | Accrued | $ | 120,000 | — | — | 26,940 | $ | 146,940 | |||||||||||||||||||||||||||||||
| Paid | $ | - | - | - | - | - | Paid | $ | 133,609 | — | — | — | $ | 133,609 | ||||||||||||||||||||||||||||||||||
| 2014 | Accrued | $ | - | - | - | - | - | 2020 | Accrued | $ | 120,000 | — | — | 22,190 | $ | 142,190 | ||||||||||||||||||||||||||||||||
| Paid | $ | - | - | - | - | - | Paid | $ | 111,777 | — | — | — | $ | 111,777 | ||||||||||||||||||||||||||||||||||
| (1) | Represents value of stock issuable pursuant to employment contracts. |
Employment and Director AgreementsContracts, Termination of Employment, Change-in-Control Arrangements
| (2) | On October 29, 2019, the Company appointed Christopher D. Strachan, Chief Financial Officer, to membership on the Company’s Board of Directors and appointed Nello Gonfiantini III, Chief Operations Officer, to the additional post of Chief Executive Officer. |
| (3) | On November 1, 2019, Nello Gonfiantini III entered into a restated agreement with the Company. The Company agreed to pay (i) a salary at a minimum rate of Two Hundred Forty Thousand Dollars ($240,000) per annum for the period beginning on the effective date through the October 31, 2024, (ii) an annual performance bonus to be determined by the corporation's board, (iii) a combination of stock grants and stock options so that the Executive shall have a beneficial stock ownership position equal to ten (10%) percent of the Corporation's outstanding common shares (the "Executive Ownership Position"). |
| (4) | On November 1, 2019, Christopher D. Strachan entered into a restated agreement with the Company. The Company agreed to pay (i) a salary at a minimum rate of One Hundred Twenty Thousand Dollars ($120,000) per annum for the period beginning on the effective date through the October 31, 2024, (ii) an annual performance bonus to be determined by the corporation’s board, (iii) a combination of stock grants and stock options so that the Executive shall have a beneficial stock ownership position equal to ten (2%) percent of the Corporation’s outstanding common shares (the “Executive Ownership Position”). |
Outstanding Equity Awards at Fiscal Year End
| Option awards | Stock awards | ||||||||
| Name | Number of securities underlying unexercised options (#) Exercisable | Number of securities underlying unexercised options (#) unexercisable | Equity incentive Plan awards: number of securities underlying unexercised unearned options (#) | Option exercise price ($) | Option expiration date | Number of shares or units of stock that have not vested (#) | Market value of shares or units of stock that have not vested ($) | Equity incentive plan awards: Number of unearned shares, units or other rights that have not vested (#) | Equity Incentive plan awards: market or of unearned shares, units or other rights that have not vested ($) |
| Nello Gonfiantini III | 61,240 | — | — | 5.00 | 2/1/2027 | ||||
| Nello Gonfiantini III | 61,240 | — | — | 5.00 | 2/1/2027 | ||||
The Company entered into a consulting agreement with Triple Enterprises and affiliates on August 26, 2014. In exchange for 200,000 warrants and a monthly fee of $35,000, Triple Enterprises agreed to act as a financial advisor, provide supervisory and advisory services and assist in the preparation of the Company’s public filings. Mr. Philip Gay is the Managing Director of Triple Enterprises and Mr. Nick Roberts is the Financial Manager of Triple Enterprises.
On September 17, 2014, the Company entered into a five year employment agreement with Doug C. Anderson as Vice Chairman and Vice President of Strategy and Vision. Beginning in 2014, Mr. Anderson began earning an annual salary of two hundred fifty thousand dollars ($250,000) per annum. Following the completion of an offering of the Company’s Series A Preferred stock, the Executive’s Base Salary shall automatically be increased to Two Hundred Eighty Thousand ($280,000) per annum. For each year thereafter, the Company’s Board (or compensation committee of the Company’s Board, or, at the discretion of the Company’s Board, by a committee composed of two or more members of the Company’s Board (for purposes of this Agreement, the “Committee”) shall review the Executive’s Base Salary and may provide for such increases therein as it may, in its discretion, deem appropriate. The employment agreement also allows for a performance bonus, to be determined by the Company’s Board at the discretion of the Company’s Board, and participation of any equity compensation plan of the Company.
If Mr. Anderson’s employment is terminated prior to the expiration of the term of his employment agreement, certain significant payments become due. The amount of such payments depends on the nature of the termination. In addition, the employment agreement contains a change of control provision that provides for the payment of three times the then current base salary and five times the average bonus paid to Mr. Anderson for the three full calendar years immediately prior to the change of control. The employment agreement also contains both a confidentiality and noninterference provision which are effective from the date of employment through one year from the date the employment agreement is terminated.
Mr. Ron Throgmartin and Mr. Alan Valdes entered into agreements with identical terms to that of Mr. Anderson, for the position of Chief Executive Officer and Chairman of the Board respectively. Following the Merger, Mr. Throgmartin’s position was changed to Chief Operating Officer. The other terms of his agreement remained in place.
In exchange for Mr. Norris’ service on the Board, he received 50,000 warrants with an exercise price of $0.0001. In addition, Mr. Norris currently receives $10,000 per month in exchange for his services on the Board.
Option Plan
The Company establishedmaintains an Equity Incentive Plan pursuant to provide additional incentivewhich 124,000 shares of common stock are reserved for issuance thereunder. This Plan was established to award certain founding members, who were instrumental in the development of the Company, as well as key employees, directors and consultants, and to promote the success of the Company’s business. The terms ofallow for each option shall beto vest immediately, with a term no moregreater than 10 years from the date of grant, at an exercise price equal to the Fair Market Value on thepar value at date of the grant. As of December 31, 2021, 10,000 awards are outstanding pursuant to the plan. There remain 114,000 shares available for future grants.
The following table sets forth our securities authorized for issuance under any equity compensation plans approved by our stockholders, as well as any equity compensation plans not approved by our stockholders, as of December 31, 2021:
| Number of securities to be issued upon exercise of outstanding options, warrants and rights | Weighted-average exercise price of outstanding options, warrants and rights | Number of securities remaining available for future issuance under equity compensation plans (excluding securities reflected in column (a)) | ||||||||||
| Plan Category | (a) | (b) | (c) | |||||||||
| Equity compensation plans approved by security holders | 10,000 | $ | 0.000001 | $ | 114,000 | |||||||
| Equity compensation plans not approved by security holders | — | $ | — | $ | — | |||||||
| Total | 10,000 | $ | 0.000001 | 114,000 | ||||||||
26
Director Compensation
The board has not implemented a plan to award options to any directors. There are no contractual arrangements with any member of the board of directors and our directors do not receive any compensation.
Item 12. Security Ownership of Certain Beneficial Owners and Management and Related Stockholder Matters
The following table sets forth certain information as of April 15, 2016,the date hereof with respect to the holdings of: (1)beneficial ownership of our ordinary shares, the sole outstanding class of our voting securities, by (i) each stockholder known to be the beneficial owner of 5% or more of the outstanding ordinary shares of the Company, (ii) each executive officer and director, and (iii) all executive officers and directors as a group. Beneficial ownership is determined in accordance with the rules of the Securities and Exchange Commission and generally includes voting or investment power with respect to securities. ordinary shares subject to options, warrants or convertible securities exercisable or convertible within 60 days as of the date hereof are deemed outstanding for computing the percentage of the person or entity holding such options, warrants or convertible securities but are not deemed outstanding for computing the percentage of any other person and is based on shares issued and outstanding as of April 8, 2022.
The following table provides the names and addresses of each person known to us to be the beneficial owner ofown more than 5% of our Common Stock; (2) eachoutstanding shares of ourcommon stock as of April 8, 2022 and by the officers and directors, nominees for directorindividually and named executive officers; and (3) all directors and executive officers as a group. ToExcept as otherwise indicated, all shares are owned directly and the best of our knowledge, each of the persons named in the table below as beneficially owning the shares set forth therein hasshareholders listed possesses sole voting power and sole investment power with respect to suchthe shares unless otherwise indicated.shown.
| Name of Beneficial Owner and Address (1) | Amount and Nature of Beneficial Ownership of Common Stock | Percent of Common Stock (2) | ||||||
| Douglas Anderson | 5,882,800 | 21.04 | % | |||||
| Alan Valdes (4) | 3,900,000 | 13.95 | % | |||||
| Stephen Norris | 59,000 | * | ||||||
| Ron Throgmartin (4) | 1,820,000 | 6.51 | % | |||||
| All directors and officers as a group (4 people) | 41.87 | % | ||||||
| 5% Shareholders | ||||||||
| TMK Holdings LLC (3) | 3,840,000 | 13.43 | % | |||||
| Wall Street Capital Partners LLC (4) | 7,020,000 | 25.12 | % | |||||
| Name of Beneficial Owner and Address (1) | Amount and Nature of Beneficial Ownership of Common Stock | Percent of Common Stock (2) | ||||||
| Nello Gonfiantini | 25,908,045 | (3) | 9.9 | % | ||||
| Christopher Strachan | 10,443,102 | (4) | 4.0 | % | ||||
| All directors and officers as a group (2 people) | 36,351,147 | 13.9 | % | |||||
| 5% Shareholders | ||||||||
| Chester Aldridge (7) | 152,701,189 | (5) | 36.9 | % | ||||
| 0851229 BC Ltd (8) | 690,518,408 | (6) | 72.6 | % | ||||
| (1) | Unless otherwise noted, the address of each beneficial owner is c/o |
| (2) | Based on |
| (3) | |
| (4) | Based on 260,661,121 shares of common stock issued and outstanding as of April 8, 2022. Includes 671,805 shares of our Common Stock issuable pursuant to the employment contract that are vested or vesting within 60 days from April 8, 2022. |
| (5) | Based on 260,661,121 shares of common stock issued and outstanding as of April 8, 2022. Includes 152,670,223 shares of our Common Stock issuable upon conversion of notes and accrued interest within 60 days from April 8, 2022 and 25,000 shares of our Common Stock issuable upon exercise of warrants within 60 days from April 8, 2022. |
| (6) | Based on 260,661,121 shares of common stock issued and outstanding as of April 8, 2022. Includes 690,402,709 shares of our Common Stock issuable upon conversion of notes and accrued interest within 60 days from April 8, 2022 and 50,000 shares of our Common Stock issuable upon exercise of warrants within 60 days from April 8, 2022. |
| (7) | 336 Bon Air Ctr # 418, Greenbrae, CA 94904-3017 |
| (8) | PO Box 3200, Abbotsford, BC Canada V2S 4P4 |
Item 13.Certain Relationships and Related Transactions, and Director Independence
Except as disclosed below, none of the following persons has any direct or indirect material interest in any transaction to which we are a party since our incorporation or in any proposed transaction to which we are proposed to be a party:
| (A) | Any of our directors or officers; |
| (B) | ||
| Any proposed nominee for election as our director; |
| (C) | ||
| Any person who beneficially owns, directly or indirectly, shares carrying more than 10% of the voting rights attached to our Common Stock; or |
| (D) | ||
| Any relative or spouse of any of the foregoing persons, or any relative of such spouse, who has the same house as such person or who is a director or officer of any parent or subsidiary of our |
27
As of December 31, 2021 and 2020, the Company has accrued compensation to its CEO and director and to its CFO aggregating $263,289 and $289,897, respectively. As of December 31, 2021 and 2020, accrued payable due to former officers was $946,986 and $1,042,859, respectively. For the years ended December 31, 2021 and 2020, total cash-based compensation to related parties was $360,000 and $360,000, respectively. For the years ended December 31, 2021 and 2020, total share-based compensation to related parties was $162,506 and $192,474, respectively. These amounts are included in general and administrative expenses in the accompanying financial statements.
Director Independence
Because our common stock is not currently listed on a national securities exchange, we have used the definition of “independence” of The NASDAQ Stock Market to make this determination. NASDAQ Listing Rule 5605(a)(2) provides that an “independent director” is a person other than an officer or employee of the Company or any other individual having a relationship which, in the opinion of the Company’s board of directors, would interfere with the exercise of independent judgment in carrying out the responsibilities of a director. The NASDAQ listing rules provide that a director cannot be considered independent if:
| ● | the director is, or at any time during the past three years was, an employee of the company; | |
| ● | the director or a family member of the director accepted any compensation from the company in excess of $120,000 during any period of 12 consecutive months within the three years preceding the independence determination (subject to certain exclusions, including, among other things, compensation for board or board committee service); | |
| ● | a family member of the director is, or at any time during the past three years was, an executive officer of the company; | |
| ● | the director or a family member of the director is a partner in, controlling stockholder of, or an executive officer of an entity to which the company made, or from which the company received, payments in the current or any of the past three fiscal years that exceed 5% of the recipient’s consolidated gross revenue for that year or $200,000, whichever is greater (subject to certain exclusions); | |
| ● | the director or a family member of the director is employed as an executive officer of an entity where, at any time during the past three years, any of the executive officers of the company served on the compensation committee of such other entity; or the director or a family member of the director is a current partner of the company’s outside auditor, or at any time during the past three years was a partner or employee of the company’s outside auditor, and who worked on the company’s audit. |
We do not have any independent directors. We do not have an audit committee, compensation committee or nominating committee. We currently do not have a code of ethics that applies to our officers, employees and director.
Item 14. Principal Accounting Fees and Services
Audit Fees
For the Company’s fiscal years ended December 31, 20152021 and 2014,2020, we were billed or expect to be billed approximately $15,000 $94,000 and $9,500$110,000, respectively, for professional services rendered for the audit and quarterly reviews of our financial statements.statements by MGO.
Audit Related Fees
None.There were no fees for audit related services rendered by our independent auditors for the years ended December 31, 2021 and 2020.
Tax Fees
None.For our fiscal years ended December 31, 2021 and 2020, there were no fees for professional services rendered by our independent auditors for tax compliance, tax advice, and tax planning.
All Other Fees
For our fiscal years ended December 31, 2021 and 2020, there were no other fees incurred.
Audit Committee Pre-Approval of Audit and Permissible Non-Audit Services of Independent Auditors
Given the small size of our Board as well as the limited activities of our Company, our Board acts as our Audit Committee. Our Board pre-approves all audit and permissible non-audit services. These services may include audit services, audit-related services, tax services, and other services. Our Board approves these services on a case-by-case basis.
28
None.
Item 15. Exhibits and Financial Statement Schedules
29
30
Reference is made to the Index to Consolidated Financial Statements of the Company under Item 8 of Part II.
SIGNATURES
All consolidated financial statement schedules are omitted because they are not applicable or the amounts are immaterial, not required, or the required information is presented in the financial statements and notes thereto in Item 8 of Part II above.
(1) Incorporated by reference to the Company’s Registration Statement on Form S-1 filed on July 1, 2013.
(2) Incorporated by reference to the Company’s Registration Statement on Form S-1 filed on August 12, 2013.
SIGNATURES
Pursuant to the requirements of Section 13 or 15(d) of the Securities Exchange Act of 1934, the registrant has duly caused this report to be signed on its behalf by the undersigned, thereunto duly authorized.
| DIEGO PELLICER WORLDWIDE, INC. | ||
| Date: April | By: | /s/ |
| Chief Executive Officer | ||
Pursuant to the requirements of the Securities Exchange Act of 1934, this report has been signed below by the following person on behalf of the Registrant and in the capacities and on the dates indicated.
| Signature | Title | Date | ||
| /s/ | Chief Executive Officer, Director | April | ||
| /s/ Christopher Strachan | Chief Financial Officer, Director | April | ||
Christopher Strachan |
31