
UNITED STATES
SECURITIES AND EXCHANGE COMMISSION
Washington, DC 20549
FORM 10-K
[X] ANNUAL REPORT PURSUANT TO SECTION 13 OR 15 (d) OF THE SECURITIES EXCHANGE ACT OF 1934
For the fiscal year endedSeptember 30, 2016
[ ] TRANSITION REPORT PURSUANT TO SECTION 13 OR 15(d) OF THE SECURITIES EXCHANGE ACT OF 1934
For the transition period ___________________ to ____________________
| [X] ANNUAL REPORT PURSUANT TO SECTION 13 OR 15 (d) OF THE SECURITIES EXCHANGE ACT OF 1934 |
| For the fiscal year ended September 30, 2017 |
| [ ] TRANSITION REPORT PURSUANT TO SECTION 13 OR 15(d) OF THE SECURITIES EXCHANGE ACT OF 1934 |
| For the transition period to |
Commission File Number:001-33177
MONMOUTH REAL ESTATE INVESTMENT CORPORATION
(Exact name of registrant as specified in its charter)
| Maryland | 22-1897375 | |
| (State or other jurisdiction of | (I.R.S. Employer | |
| incorporation or organization) | Identification No.) |
3499 Route 9 North, Suite 3-D, Freehold, NJ 07728
(Address of Principal Executive Offices) (Zip Code)
Registrant’s telephone number, including area code:(732)-577-9996
Securities registered pursuant to Section 12(b) of the Act:
Common Stock, $0.01 par value per share – New York Stock Exchange
7.875% Series B Cumulative Redeemable Preferred Stock, $0.01 par value per share, $25 liquidation value per share – New York Stock Exchange
6.125% Series C Cumulative Redeemable Preferred Stock, $0.01 par value per share, $25 liquidation value per share – New York Stock Exchange
Indicate by check mark if the registrant is a well-known seasoned issuer, as defined in Rule 405 of the Securities Act. [ ]X] Yes [X] No[No]
Indicate by check mark if the registrant is not required to file reports pursuant to Section 13 or Section 15(d) of the Act.
[ ]Yes [X] No
Indicate by check mark whether the registrant (1) has filed all reports required to be filed by Section 13 or 15(d) of the Securities Exchange Act of 1934 during the preceding 12 months (or for such shorter period that the registrant was required to file such reports), and (2) has been subject to such filing requirements for the past 90 days. [X] [X]Yes [ ] No
Indicate by check mark whether the registrant has submitted electronically and posted on its corporate Web site,Website, if any, every Interactive Data File required to be submitted and posted pursuant to Rule 405 of Regulation S-T (§ 232.405 of this chapter) during the preceding 12 months (or for such shorter period that the registrant was required to submit and post such files).
[X]Yes [ ] No
Indicate by check mark if disclosure of delinquent filers pursuant to Item 405 of Regulation S-K (Section (§229.405 of this chapter) is not contained herein, and will not be contained, to the best of registrant’s knowledge, in definitive proxy or information statements incorporated by reference in Part III of this Form 10-K or any amendment to this Form 10-K. [X][X]
Indicate by check mark whether the registrant is a large accelerated filer, an accelerated filer, a non-accelerated filer or a smaller reporting company. See the definitions of “large accelerated filer”, “accelerated filer” and “smaller reporting company” in Rule 12b-2 of the Exchange Act:
| Large accelerated filer | [X] | Accelerated filer | [ ] | ||
| Non-accelerated filer | [ ] | Smaller reporting company | [ ] | ||
| Emerging growth company | [ ] |
If an emerging growth company, indicate by check mark if the registrant has elected not to use the extended transition period for complying with any new or revised financial accounting standards provided pursuant to Section 13(a) of the Exchange Act. Yes [ ] No [ ]
Indicate by check mark whether the registrant is a shell company (as defined in Rule 12b-2 of the Act). [ ] Yes [X] No
The aggregate market value of the voting and non-voting common equity of the registrant held by non-affiliates of the registrant at March 31, 20162017 was approximately $715,934,000$980,786,000 (based on the $11.89$14.27 closing price per share of common stock on March 31, 2016)2017).
There were 69,902,49276,568,948 shares of Common Stockcommon stock outstanding as of November 15, 2016.2017.
Documents Incorporated by Reference: None.
| 2 |
General Development of the Business
In this 10-K, “we”, “us”, “our”, “MREIC” or “the Company”, refers to Monmouth Real Estate Investment Corporation, together with its predecessors and subsidiaries, unless the context requires otherwise.
The Company is a corporation operating as a qualified real estate investment trust (REIT) under Sections 856-860 of the Internal Revenue Code of 1986, as amended (the Code). The Company has been a REIT since 1969 and intends to maintain its qualification as a REIT in the future. As a qualified REIT, with limited exceptions, the Company will not be taxed under Federal and certain state income tax laws at the corporate level on taxable income that it distributes to its shareholders. For special tax provisions applicable to REITs, refer to Sections 856-860 of the Code.
The Company was established in 1968 as a New Jersey Business Trust (NJBT). In 1990, the NJBT merged into a newly formed Delaware corporation. On May 15, 2003, the Company changed its state of incorporation from Delaware to Maryland by merging with and into a Maryland corporation (the Reincorporation).
Narrative Description of Business
The Company’s primary business is the ownership of real estate. Its investment focus is to own well-located, modern, single tenant, industrial buildings, leased primarily to investment-grade tenants or their subsidiaries on long-term net leases. In addition, the Company owns a portfolio of REIT investment securities which the Company generally limits to no more than approximately 10% of its undepreciated assets (which is the Company’s total assets excluding accumulated depreciation).
At September 30, 2016,2017, the Company held investments in ninety-nine108 properties totaling approximately 16,010,00018,790,000 square feet with an occupancy rate of 99.6%99.3% (See Item 2 for a detailed description of the properties). These properties are located in thirty30 states: Alabama, Arizona, Colorado, Connecticut, Florida, Georgia, Illinois, Indiana, Iowa, Kansas, Kentucky, Louisiana, Maryland, Michigan, Minnesota, Mississippi, Missouri, Nebraska, New Jersey, New York, North Carolina, Ohio, Oklahoma, Pennsylvania, South Carolina, Tennessee, Texas, Virginia, Washington and Wisconsin. All of these properties are wholly-owned with the exception of the two properties in New Jersey in which the Company owns a majority interest. All properties in which the Company has investments are leased on a net basis except an industrial park in Monaca (Pittsburgh), Pennsylvania and the shopping center located in Somerset, New Jersey.
During fiscal 2016,2017, the Company purchased eight10 industrial properties totaling approximately 1,830,0002,784,000 square feet with net-leased terms ranging from tenseven to fifteen years resulting in a weighted average lease maturity of 12.313.4 years. Approximately 1,567,0001,840,000 square feet, or 86%66%, is leased to FedEx Ground Package System, Inc., a subsidiary of FedEx Corporation (FDX). The aggregate purchase price for the eight10 properties was approximately $210,747,000$286,521,000 and they are located in Colorado, Florida, Kansas, Kentucky, Louisiana,Michigan, North Carolina, PennsylvaniaNew York, Ohio, Oklahoma, South Carolina and Washington.Texas. These eight10 properties generate annualized rental income over the life of their leases of approximately $14,076,000. The funds for these eight acquisitions were provided by eight property level$18,953,000. In connection with the 10 properties acquired during the 2017 fiscal year, the Company entered into nine, fifteen-year, fully-amortizing mortgage loans totaling $141,586,000, draws onand one twelve-year, fully-amortizing loan. The 10 mortgage loans originally totaled $188,809,000 with an unsecured lineoriginal weighted average loan maturity of credit facility14.9 years and cash on hand. The eight mortgages have a weighted average interest rate of 3.85% and a weighted average maturity of 14.9 years.3.90%.
Subsequent to the fiscal yearend, on October 17, 2016,2, 2017, the Company’s Board of Directors approved a 6.25% increase in the Company’s quarterly common stock dividend, raising it to $0.17 per share from $0.16 per share. This represents an annualized dividend rate of $0.68 per share. The Company has maintained or increased its cash dividend for 26 consecutive years.
| 3 |
Subsequent to fiscal yearend, on November 2, 2017, the Company purchased a newly constructed 338,584121,683 square foot industrial building, situated on 16.2 acres, located in Hamburg, NY, which is in the Buffalo Metropolitan Statistical Area (MSA).Charleston, SC. The building is 100% net-leased to FedEx Ground Package System, Inc.FDX for fifteen15 years through March 2031.August 2032. The purchase price was $35,100,000.$21,872,170. The Company obtained a 15 year fully-amortizing mortgage loan of $23,500,000$14,200,000 at a fixed interest rate of 4.03%4.23%. Annual rental revenue over the remaining term of the lease averages approximately $2,308,000.$1,312,000.
In addition, subsequentSubsequent to the fiscal yearend, on OctoberNovember 1, 2016, a 50,7412017, the Company leased its previously vacant 36,270 square foot expansion of a building leased to FedEx Ground Package System, Inc.facility located in Edinburg, TX was substantially completedUrbandale (Des Moines), IA for a cost of approximately $4,988,000, resulting in a new 10 year lease which extended the prior lease expiration date from September 2021 through September 2026. In addition, the expansion resulted in an increase in annual rent effective from the date of completion of approximately $499,000 from approximately $598,000, or $5.27 per square foot, to approximately $1,097,000, or $6.68 per square foot.10.2 years.
On October 27, 2016, the Company sold its only vacant building, (which increased our occupancy rate from 99.6% to 100.0%), consisting of a 59,425 square foot industrial building situated on 4.78 acres located in White Bear Lake, MN for approximately $4,272,000, which is the Company’s approximate U.S. GAAP net book carrying value.
The industrial properties purchased, expandedleased and soldexpanded during fiscal 20172018 to date increased our current total leasable square feet to approximately 16,340,00018,912,000 and increased our occupancy rate to 100.0%99.5%.
In addition to the property purchased subsequent to the fiscal yearend, we haveas described above, the Company has entered into agreements to purchase eightthree new build-to-suit, industrial buildings that are currently being developed in Florida, Michigan, North Carolina, OhioGeorgia and South Carolina totalingOklahoma, consisting of approximately 2,099,0001,531,000 square feet, each with net-leased terms ranging between ten to fifteenof 10 years with a weighted average lease maturity of 13.3 years.each. The purchase price for these properties is approximately $117,437,000. Approximately 1,267,0001,132,000 square feet, or 60%74%, is leased to FDX andan investment grade tenant or its subsidiaries. The purchase price for the eight properties is approximately $212,373,000.subsidiary. Subject to satisfactory due diligence and other customary closing conditions and requirements, we anticipate closing these eight transactions during fiscal 2017 and fiscal 2018. In connection with five of the eightthree properties, the Company has entered into commitments to obtain fivethree mortgages totaling $101,204,000$72,400,000 at fixed rates ranging from 3.60%3.53% to 4.20%4.25%, with a weighted average interest rate of 3.83%. Each3.75% and with a weighted average maturity of these mortgages will be a fifteen year, fully-amortizing loan.13.2 years. The Company may make additional acquisitions in fiscal 20172018 and fiscal 2018,2019, and the funds for these acquisitions may come from funds generated from operations, mortgages, draws on our unsecured line of credit facility, cash on hand, sale of marketable securities, other bank borrowings, proceeds from the Dividend Reinvestment and Stock Purchase Plan (DRIP), proceeds from the At-The-Market Preferred Equity Program (Preferred Stock ATM Program), and proceeds from private placements and public offerings of additional common or preferred stock or other securities. To the extent that funds or appropriate properties are not available, fewer acquisitions will be made.
Currently, the Company derives its income primarily from real estate rental operations. Rental and Reimbursement Revenue (excluding Lease Termination Income in fiscal 2017, 2016 2015 and 20142015 of $-0-, $238,625$-0- and $1,182,890,$238,625, respectively) was $113,545,982, $94,916,110 $77,775,497 and $64,672,341$77,775,497 for the years ended September 30, 2017, 2016 2015 and 2014,2015, respectively. Total undepreciated assets (which is the Company’s total assets excluding accumulated depreciation) were $1,229,758,028$1,615,768,028 and $915,991,942$1,367,982,470 as of September 30, 20162017 and 2015,2016, respectively.
As of September 30, 2016,2017, the Company had approximately 16,010,00018,790,000 square feet of property, of which approximately 7,584,0009,391,000 square feet, or 47%50%, consisting of fifty-three58 separate stand-alone leases, were leased to FDX and its subsidiaries (6%(7% to FDX and 41%43% to FDX subsidiaries). These properties are located in twenty-four24 different states. As of September 30, 2016,2017, the only tenants that leased 5% or more of the Company’s total square footage were FDX and its subsidiaries and Milwaukee Electric Tool Corporation, which leased approximately 862,000 square feet, comprising approximately 5% of the Company’s rental space.
During fiscal 2016,2017, the only tenant that accounted for 5% or more of the Company’s rental and reimbursement revenue was FDX (including its subsidiaries). The Company’s rental and reimbursement revenue from FDX and its subsidiaries for the fiscal years ended September 30, 2017, 2016 2015 and 2014,2015, respectively, totaled approximately $68,151,000, $52,793,000 and $41,954,000, or 60% (7% from FDX and $35,007,000, or53% from FDX subsidiaries), 56% (7% from FDX and 49% from FDX subsidiaries), and 54% (8% from FDX and 46% from FDX subsidiaries) and 54% (10% from FDX and 44% from FDX subsidiaries), of total rent and reimbursement revenues.
| 4 |
FDX is a publicly-owned company and financial information related to this entity is available at the SEC’s website,www.sec.gov.FDX is rated “BBB” by S&P Global Ratings (www.standardandpoors.com) and is rated “Baa2” by Moody’s (www.moodys.com), which are both considered “Investment Grade” ratings. The references in this report to the SEC’s website, S&P Global Ratings’ website and Moody’s website are not intended to and do not include or incorporate by reference into this report the information of FDX, S&P Global Ratings or Moody’s on such websites.
In addition to real estate property holdings, the Company held $73,604,894$123,764,770 in marketable REIT securities at September 30, 2016,2017, representing 5.3%7.7% of the Company’s undepreciated assets (which is the Company’s total assets excluding accumulated depreciation). These liquid real estate holdings are not included in calculating the tenant concentration ratios above and therefore further enhance the Company’s diversification. As a result, theThe securities portfolio provides the Company with additional diversification, liquidity, diversification,and income, and serves as a proxy for real estate when more favorable risk adjusted returns are not available.
The Company’s weighted-average lease expiration was 7.47.9 and 7.27.4 years as of September 30, 20162017 and 2015,2016, respectively, and its average annualized rent per occupied square foot as of September 30, 2017 and 2016 was $5.93 and 2015 was $5.72, and $5.48, respectively. The Company’s occupancy rate as of September 30, 2017 and 2016 was 99.3% and 2015 was 99.6% and 97.7%, respectively. Subsequent to fiscal yearend, on October 27, 2016,November 1, 2017, the Company soldleased its onlypreviously vacant building36,270 square foot facility located in Urbandale (Des Moines), IA for $4,272,00010.2 years which increased our current occupancy rate to 100.0%99.5%. In addition, the Company is under contract to sell its only currently vacant building located in Ft. Myers, FL, for $6,400,000.
The Company competes with other investors in real estate for attractive investment opportunities. These investors include other equity real estate investment trusts, limited partnerships, syndications and private investors, among others. Competition in the market areas in which the Company operates is significant and affects the Company’s ability to acquire or expand properties, occupancy levels, rental rates, and operating expenses of certain properties. Management has built long-term relationships withwithin the merchant buildersbuilder community which have historically provided the Company with investment opportunities that fit the Company’s investment policy. The amount of new construction of industrial properties on the national level has been increasing the past fourfive years following several years of historically low levels of new supply. These levels of new supply, although increasing, continue to be below historical norms. Driven to a large extent by the rampantcontinued growth in ecommerce sales, demand for industrial space remains very strong, driving national occupancy rates to an all-time high of 95% currently. For further discussion of potential impact of competitive conditions on our business, see Item 1A: Risk Factors below.
The Company continues to invest in marketable securities of other REITs, which the Company generally limits to no more than approximately 10% of its undepreciated assets (which is the Company’s total assets excluding accumulated depreciation). The Company’s investments in equity securities of other REITs provides the Company with additional diversification, liquidity, and income, and serves as a proxy for real estate when more favorable risk adjusted returns are not available. The Company from time to time may purchase these securities on margin when the dividendinterest and interestdividend yields exceed the cost of funds. In general, the funds.Company may borrow up to 50% of the value of the marketable securities, which was $123,764,770 as of September 30, 2017. As of September 30, 2017, the Company had borrowings of $10,091,417 under its margin line, bearing interest at 2.05%. As of September 30, 2016, and 2015, there were no draws against the margin. The REIT securities portfolio, to the extent not pledged to secure borrowings, provides the Company with additional liquidity and additional income. Such securities are subject to risks arising from adverse changes in market rates and prices, primarily market price risk relating to equity securities and interest rate risk relating to debt securities and market price risk relating to equity securities. From time to time, the Company may use derivative instruments to mitigate interest rate risk, however, this has not occurred during any periods presented. At September 30, 20162017 and 2015,2016, the Company had $73,604,894$123,764,770 and $54,541,237,$73,604,894, respectively, of securities available for sale. The unrealized net gain (loss) on securities available for sale at September 30, 2017 and 2016 was $6,570,565 and 2015 was $12,942,267, and $(5,441,603), respectively, resulting in an increasea decrease for the fiscal year of $18,383,870.$6,371,702. For the fiscal years ended September 30, 2017, 2016 2015 and 2014,2015, the Company’s net realized gains from the sale of securities were $2,311,714, $4,398,599 $805,513 and $2,166,766,$805,513, respectively.
On September 13, 2016, the Company issued 5,400,000 shares of a 6.125% Series C Cumulative Redeemable Preferred Stock (Series C Preferred Stock) at an offering price of $25.00 per share in an underwritten public offering.
| 5 |
The Company received net proceeds from the offering, after deducting the underwriting discount and other estimated offering expenses, of approximately $130,543,000. On September 15, 2016, the Company used $45,000,000 of such net proceeds from the offering to reduce the amounts outstanding under its unsecured line of credit facility (the “Facility”) and on October 14, 2016, the Company used $53,493,750 of such net proceeds from the offering to redeemredeemed all of the 2,139,750 issued and outstanding shares of itsthe 7.625% Series A Cumulative Redeemable Preferred Stock, $0.01 par value per share (7.625% Series A Preferred Stock). In addition, on October 14, 2016, the Company used $498,540 of such net proceeds from the offering to pay all dividends, accrued and unpaid, to and including the redemption date of the 7.625% Series A Preferred Stock. The Company intends to use the remaining proceeds to reduce the amounts outstanding under its Facility and to purchase properties and fund expansions of its existing properties in the ordinary course of business and for general corporate purposes.
On September 14, 2016, the Company announced that it intended to redeem all 2,139,750 issued and outstanding shares of its 7.625% Series A Preferred Stock. As discussed above, the Company redeemed the 7.625% Series A Preferred Stock, on October 14, 2016, at a redemption price of $25.00 per share, totaling $53,493,750, plus all dividends, in the amount of $498,540, which were accrued and unpaid, up to and including the redemption date, in an amount equal to $0.23299 per share. As of September 30, 2016,date. The redemption price for the outstanding 7.625% Series A Preferred Stock, has been reclassified outincluding its related accumulated and unpaid dividends, was paid with a portion of stockholder’s equitythe net proceeds from the Company’s issuance on September 13, 2016 of 5,400,000 shares of its 6.125% Series C Cumulative Redeemable Preferred Stock, $0.01 par value per share (6.125% Preferred Stock) at an offering price and is reflected as a liability at redemption value and hasliquidation preference of $25.00 per share in an underwritten public offering. The Company recognized a deemed dividend of $2,942,149 on the Company’s consolidated statementConsolidated Statement of incomeIncome for the fiscal year ended September 30, 2016, which represents the difference between redemption value and carrying value net of original deferred issuance costs.
The Company redeemed all of the 2,300,000 outstanding shares of the 7.875% Series B Cumulative Redeemable Preferred Stock, $0.01 par value per share (7.875% Series B Preferred Stock) on June 7, 2017, at a redemption price of $25.00 per share, totaling $57,500,000, plus accumulated and unpaid dividends for the period from June 1, 2017 up to and not including, the redemption date, in an amount equal to $0.0328125, totaling $75,469, for a total cash payment of $25.0328125 per share, totaling $57,575,469. The Company recognized a deemed dividend of $2,467,165 on the Consolidated Statement of Income for the fiscal year ended September 30, 2017, which represents the difference between redemption value and carrying value net of original deferred issuance costs.
On March 9, 2017, the Company issued an additional 3,000,000 shares of its 6.125% Series C Preferred Stock at a public offering price of $24.50 per share, for gross proceeds of $73,500,000 before deducting the underwriting discount and offering expenses. Net proceeds from the offering, after deducting underwriting discounts and other offering expenses, were approximately $71,003,000. On June 7, 2017, the Company used a portion of the net proceeds from this offering to redeem all of the outstanding shares of its 7.875% Series B Preferred Stock, including its related accumulated and unpaid dividends, as discussed above. The remaining proceeds were used to purchase properties in the ordinary course of business and for general corporate purposes.
On June 29, 2017, the Company entered into the Preferred Stock ATM Program with FBR Capital Markets & Co. in which the Company may, from time to time, offer and sell additional shares of its 6.125% Series C Preferred Stock, with a liquidation preference of $25.00 per share, having an aggregate sales price of up to $100,000,000. The Company began selling shares through the Preferred Stock ATM Program on July 3, 2017. As of September 30, 2017, the Company sold 1,439,445 shares under its Preferred Stock ATM Program at a weighted average price of $25.31 per share, and generated net proceeds, after offering expenses, of approximately $35,730,000.
As of September 30, 2017, 9,839,445 shares of the 6.125% Series C Preferred Stock were issued and outstanding.
Subsequent to fiscal yearend to date, the Company sold 820,290 shares under its Preferred Stock ATM Program at a weighted average price of $25.14 per share, and generated net proceeds, after offering expenses, of approximately $20,296,000.
Investment and Other Policies
The Company’s investment policy is to concentrate its investments in well-located, modern, single tenant,single-tenant, industrial buildings, leased primarily to investment-grade tenants or their subsidiaries on long-term net leases. The Company’s strategy is to obtain a favorable yield spread between the income from the net-leased industrial properties and interest costs. In addition, management believes that investments in well-located, modern industrial properties provide a potential for long-term capital appreciation. There is the risk that, upon expiration of leases, the properties will become vacant or will be re-leased at lower rents. The results obtained by the Company byfrom re-leasing the properties will depend on the market for industrial properties at that time.
In fiscal 2017, approximately 10% of our gross leasable area, representing 13 leases totaling 1,539,526 square feet, was set to expire. The Company has renewed all three12 of these 13 leases or 100%that were set to expire. One of the gross leasable area12 leases, (which is with FedEx Ground Package System, Inc. for a property located in Ft. Myers, FL), renewed for only eight months because the tenant moved its operations from our 87,500 square foot facility to our newly constructed facility, which is also located in Ft. Myers, FL. The Company purchased the new facility, consisting of 213,672 square feet on December 30, 2016 and this new facility is leased for 10 years. On September 1, 2017, a parking lot expansion for this property was completed for a cost of approximately $862,000, resulting in a new 10 year lease which extended the prior lease expiration date from September 2026 to August 2027. The original Ft. Myers, FL facility is under contract to sell for approximately $6,400,000, which is approximately $2,400,000 above the Company’s U.S. GAAP net book carrying value.
| 6 |
Excluding the eight-month lease renewal at the original Ft. Myers, FL location, the 11 leases that was scheduled to expirehave renewed during fiscal 2016 at an increase2017 represent 1,415,756 square feet, or 92% of the expiring square footage and represent 5.7% of the space up for renewal in fiscal 2017. These 11 lease renewals resulted in a weighted average term of 6.8 years and a U.S. GAAP straight-line weighted average lease rate of $5.70 per square foot. The weighted average initial cash rent per square foot is $5.59. This compares to the former weighted average rent of $5.73 per square foot on a U.S. GAAP straight-line basis and the former weighted average cash rent of $5.82 per square foot, representing a decrease in the weighted average lease rate of 5.3%0.5% on a U.S. GAAP straight-line basis and a decrease in the weighted average lease rate of 2.2%4.0% on a cash basis.
The one property subject to a lease that expired in fiscal 2017 and was not renewed was our 36,270 square foot facility located in Urbandale (Des Moines), IA. Effective November 1, 2017, the Company entered into a 10.2 year lease agreement with a new tenant for this facility. The lease agreement provides for two months of free rent, after which initial annual rent of $159,588, representing $4.40 per square foot, will commence, with 2.0% annual increases thereafter, resulting in a straight-line annualized rent of approximately $172,000, representing $4.74 per square foot over the life of the lease. This compares to the former average straight-lined rent of $3.56 per square foot on a U.S. GAAP straight-line basis and the former cash rent of $3.88 per square foot, representing an increase in the average lease rate of 33.1% on a U.S. GAAP straight-line basis and an increase in the lease rate of 13.4% on a cash basis.
The Company seeks to invest in well-located, modern, single tenant, industrial buildings, leased primarily to investment-grade tenants or their subsidiaries on long-term net leases. In management’s opinion, the newly built facilities meet these criteria. The Company has a concentration of properties leased to FDX and FDX subsidiaries. This is a risk factor that shareholders should consider. FDX is a publicly-owned corporationcompany and financial information related to FDXthis entity is available at the SEC’s website,www.sec.gov. FDX is rated “BBB” by S&P Global Ratings (www.standardandpoors.com) and is rated “Baa2” by Moody’s (www.moodys.com), which are both considered “Investment Grade” ratings. The referencereferences in this report to the SEC’s website, isS&P Global Ratings’ website and Moody’s website are not intended to and doesdo not include or incorporate by reference into this report the information of FDX, S&P Global Ratings or Moody’s on this website.such websites.
The Company may issue securities for property; however, this has not occurred to date. The Company may repurchase or reacquire its shares from time to time if, in the opinion of the Board of Directors, such acquisition is advantageous to the Company. No shares were repurchased or reacquired during fiscal 20162017 and, as of September 30, 2016,2017, the Company does not own any of its own shares.
��
Property Management
Currently, all ninety-nine108 properties owned by the Company, with the exception of twothree properties that are located in Stow, Ohio, Streetsboro, Ohio and Carlstadt, New Jersey, are self-managed by the Company.
The Company paid fees directly to local property management subagents in the amount of $393,622, $356,316 $306,487 and $264,811$306,487 for fiscal years ended September 30, 2017, 2016 and 2015, and 2014, respectively.
Until October 31, 2014, the Company’s two industrial properties in Olive Branch, Mississippi, were managed by Industrial Developments International (IDI). Management fees paid to IDI for the fiscal years ended September 30, 2016, 2015 and 2014 were $-0-, $8,274 and $49,476, respectively. These management fees were reimbursed to the Company by the tenants. Effective November 1, 2014, the Company began to self-manage these properties.
The Company’s industrial propertyproperties in Stow, Ohio and Streetsboro, Ohio isare managed by GEIS Companies (GEIS). Management fees paid to GEIS for the fiscal years ended September 30, 2017, 2016 and 2015 were $52,358, $50,082 and 2014 were $50,082, $50,112, and $50,138, respectively. These management fees were reimbursed to the Company by the tenants.
The Company’s industrial property in Carlstadt, New Jersey is owned by Palmer Terrace Realty Associates, LLC. The Company owns 51% of Palmer Terrace Realty Associates, LLC. This property is managed by Marcus Associates, an entity affiliated with the owner of the 49% non-controlling interest. Management fees paid by Palmer Terrace Realty Associates, LLC to Marcus Associates were $15,804 for each of the fiscal years ended September 30, 2017, 2016 2015 and 2014.2015.
| 7 |
Environmental Matters
Under various federal, state and local environmental laws, statutes, ordinances, rules and regulations, an owner of real property may be liable for the costs of removal or remediation of certain hazardous or toxic substances at, on, in or under such property as well as certain other potential costs relating to hazardous or toxic substances. These liabilities may include government fines and penalties and damages for injuries to persons and adjacent property. Such laws often impose liability without regard to whether the owner knew of, or was responsible for, the presence or disposal of such substances. Although generally our tenants are primarily responsible for any environmental damages and claims related to the leased premises, in the event of the bankruptcy or inability of a tenant of such premises to satisfy any obligations with respect to such environmental liability, the Company may be required to satisfy such obligations. In addition, as the owner of such properties, the Company may be held directly liable for any such damages or claims irrespective of the provisions of any lease.
From time to time, in connection with managing the properties or upon acquisition of a property, the Company authorizes the preparation of Phase I and, when necessary, Phase II environmental reports with respect to its properties. Based upon such environmental reports and the Company’s ongoing review of its properties, as of the date of this Annual Report, the Company is not aware of any environmental condition with respect to any of its properties which it believes would be reasonably likely to have a material adverse effect on its financial condition and/or results of operations. There can be no assurance, however, that (1) the discovery of environmental conditions, the existence or severity of which were previously unknown; (2) changes in law; (3) the conduct of tenants; or (4) activities relating to properties in the vicinity of our properties, will not expose the Company to material liability in the future.
Contact Information
Additional information about the Company can be found on the Company’s website which is located at www.mreic.reit. Information contained on or hyperlinked from our Web siteWebsite is not incorporated by reference into and should not be considered part of this Annual Report on Form 10-K or our other filings with the Securities and Exchange Commission (SEC). The Company makes available, free of charge, on or through its website, annual reports on Form 10-K, quarterly reports on Form 10-Q, current reports on Form 8-K and amendments to those reports filed or furnished pursuant to Section 13(a) or 15(d) of the Securities Exchange Act of 1934, as amended, as soon as reasonably practicable after we electronically file such material with, or furnish it to, the SEC.You can also read and copy any materials the Company files with the SEC at its Public Reference Room at 100 F Street, NE, Washington, DC 20549. You may obtain information on the operation of the Public Reference Room by calling the SEC at 1-800-SEC-0330. The SEC maintains an Internet site (http://www.sec.gov) that contains reports, proxy and information statements, and other information regarding issuers that file electronically with the SEC.
Segment Reporting & Financial Information
The Company’s primary business is the ownership and management of real estate properties. The Company invests in well-located, modern, single tenant, industrial buildings leased primarily to investment gradeinvestment-grade tenants or their subsidiaries on long-term net leases. The Company reviews operating and financial information for each property on an individual basis and, therefore, each property represents an individual operating segment. The Company evaluates financial performance using Net Operating Income (“NOI”)(NOI) from property operations. NOI is defineda non-GAAP financial measure, which we define as recurring Rental and Reimbursement Revenue, less Real Estate Taxes and Operating Expenses, such as insurance, utilities and repairs and maintenance. The Company has aggregated the properties into one reportable segment as the properties share similar long-term economic characteristics and have other similarities, including the fact that they are operated as industrial properties subject to long-term net leases primarily to investment gradeinvestment-grade tenants or their subsidiaries.For required financial information related to our operations and assets, please refer to our consolidated financial statements, including the notes thereto, included in Item 8 “Financial Statements and Supplementary Data” in this Annual Report.
| 8 |
The following risk factors address the material risks concerning our business. If any of the risks discussed in this report were to occur, our business, prospects, financial condition, results of operation and our ability to service our debt and make distributions to our shareholders could be materially and adversely affected and the market price per share of our stock could decline significantly. Some statements in this report, including statements in the following risk factors, constitute forward-looking statements. Please refer to the section entitled “Cautionary Statement Regarding Forward-Looking Statements.”
Real Estate Industry Risks
Our business and financial results are affected by local real estate conditions in areas where we own properties.We may be affected adversely by general economic conditions and local real estate conditions. For example, an oversupply of industrial properties in a local area or a decline in the attractiveness of our properties to tenants and potential tenants could have a negative effect on us.
Other factors that may affect general economic conditions or local real estate conditions include but are not limited to:
| ● | population and demographic trends; | |
| ● | employment and personal income trends; | |
| ● | zoning, use and other regulatory restrictions; | |
| ● | income tax laws; | |
| ● | changes in interest rates and availability and costs of financing; and | |
| ● | competition from other available real estate. |
We may be unable to compete with our larger competitors and other alternatives available to tenants or potential tenants of our properties. The real estate business is highly competitive. We compete for properties with other real estate investors and purchasers, including other real estate investment trusts, limited partnerships, syndications and private investors, some of whom may have greater financial resources, revenues and geographical diversity than we have. Furthermore, we compete for tenants with other property owners. All of our industrial properties are subject to significant local competition. We also compete with a wide variety of institutions and other investors for capital funds necessary to support our investment activities and asset growth. To the extent that we are unable to effectively compete in the marketplace, our business may be adversely affected.
We are subject to significant regulation that inhibits our activities and may increase our costs. Local zoning and use laws, environmental statutes and other governmental requirements may restrict expansion, rehabilitation and reconstruction activities. These regulations may prevent us from taking advantage of economic opportunities. Legislation such as the Americans with Disabilities Act may require us to modify our properties at a substantial cost and noncompliance could result in the imposition of fines or an award of damages to private litigants. Future legislation may impose additional requirements. We may incur additional costs to comply with any future requirements.
Our investments are concentrated in the industrial distribution sector and our business would be adversely affected by an economic downturn in that sector. Our investments in real estate assets are primarily concentrated in the industrial distribution sector. This concentration may expose us to the risk of economic downturns in this sector to a greater extent than if our business activities included a more significant portion of other sectors of the real estate industry.
| 9 |
Risks Associated with Our Properties
We may be unable to renew or extend leases or re-let space as leases expire. While we seek to invest in well-located, modern, single tenant, industrial buildings, leased to investment-grade tenants or their subsidiaries on long-term net leases, a number of our properties are subject to short-term leases. When a lease expires, a tenant may elect not to renew or extend it. We may not be able to re-let the property on similar terms, if we are able to re-let the property at all. The terms of renewal, extension or re-lease (including the cost of required renovations and/or concessions to tenants) may be less favorable to us than the prior lease. If we are unable to re-let all or a substantial portion of our properties, or if the rental rates upon such re-letting are significantly lower than expected rates, our cash generated before debt repayments and capital expenditures and our ability to make expected distributions, may be adversely affected. We have established an annual budget for renovation and re-letting expenses that we believe is reasonable in light of each property’s operating history and local market characteristics. However, this budget may not be sufficient to cover these expenses.
Our business is substantially dependent on FedEx Corporation. FDX, together with its subsidiaries, is our largest tenant, consisting of fifty-three58 separate stand-alone leases located in twenty-four24 different states as of September 30, 2016.2017. As of September 30, 2016,2017, the Company had approximately 16,010,00018,790,000 square feet of property, of which approximately 7,584,0009,391,000 square feet, or 47%50%, were leased to FDX and its subsidiaries (6%(7% from FDX and 41%43% from FDX subsidiaries). Rental and reimbursement revenue from FDX and its subsidiaries is approximately 56%60% (7% from FDX and 49%53% from FDX subsidiaries) of total rental and reimbursement revenue for fiscal 2016.2017. No other tenant accounted for 5% or more of the Company’s total Rental and Reimbursement revenue for fiscal 2016.2017. As a result of this concentration, our business, financial condition and results of operations, including the amount of cash available for distribution to our stockholders, could be adversely affected if we are unable to do business with FDX or FDX reduces its business with us or FDX and its subsidiaries were to become unable to make lease payments because of a downturn in its business or otherwise.
FDX is a publicly-owned company and financial information related to this entity is available at the SEC’s website,www.sec.gov.FDX is rated “BBB” by S&P Global Ratings (www.standardandpoors.com) and is rated “Baa2” by Moody’s (www.moodys.com), which are both considered “Investment Grade” ratings. The references in this report to the SEC’s website, S&P Global Ratings’ website and Moody’s website are not intended to and do not include or incorporate by reference into this report the information of FDX, S&P Global Ratings or Moody’s on such websites.
We are subject to risks involved in single tenant leases..We focus our acquisition activities on real properties that are net-leased to single tenants. Therefore, the financial failure of, or other default by, a single tenant under its lease is likely to cause a significant reduction in the operating cash flow generated by the property leased to that tenant and might decrease the value of that property. In addition, we will be responsible for 100% of the operating costs following a vacancy at a single tenant building.
We may be affected negatively by tenant financial difficulties and leasing delays. At any time, a tenant may experience a downturn in its business that may weaken its financial condition. Similarly, a general decline in the economy may result in a decline in the demand for space at our industrial properties. As a result, our tenants may delay lease commencement, fail to make rental payments when due, or declare bankruptcy. Any such event could result in the termination of that tenant’s lease and losses to us.
We receive a substantial portion of our income as rents under long-term leases. If tenants are unable to comply with the terms of their leases because of rising costs or falling revenues, we, in our sole discretion, may deem it advisable to modify lease terms to allow tenants to pay a lower rental rate or a smaller share of operating costs, taxes and insurance. If a tenant becomes insolvent or bankrupt, we cannot be sure that we could recover the premises from the tenant promptly or from a trustee or debtor-in-possession in any bankruptcy proceeding relating to the tenant. We also cannot be sure that we would receive rent in the proceeding sufficient to cover our expenses with respect to the premises. If a tenant becomes bankrupt, the federal bankruptcy code will apply and, in some instances, may restrict the amount and recoverability of our claims against the tenant. A tenant’s default on its obligations to us for any reason could adversely affect our financial condition and the cash we have available for distribution.
| 10 |
We may be unable to sell properties when appropriate because real estate investments are illiquid.Real estate investments generally cannot be sold quickly and, therefore, will tend to limit our ability to vary our property portfolio promptly in response to changes in economic or other conditions. In addition, the Code may limit our ability to sell our properties. The inability to respond promptly to changes in the performance of our property portfolio could adversely affect our financial condition and ability to service debt and make distributions to our shareholders.
Environmental liabilities could affect our profitability. We face possible environmental liabilities. Environmental laws today can impose liability on a previous owner or operator of a property that owned or operated the property at a time when hazardous or toxic substances were disposed on, or released from, the property. A conveyance of the property, therefore, does not relieve the owner or operator from liability. As a current or former owner and operator of real estate, we may be required by law to investigate and clean up hazardous substances released at or from the properties we currently own or operate or have in the past owned or operated. We may also be liablebeliable to the government or to third parties for property damage, investigation costs and cleanup costs. In addition, some environmental laws create a lien on the contaminated site in favor of the government for damages and costs the government incurs in connection with the contamination. Contamination may adversely affect our ability to sell or lease real estate or to borrow using the real estate as collateral. We are not aware of any environmental liabilities relating to our investment properties which would have a material adverse effect on our business, assets, or results of operations. However, we cannot assure you that environmental liabilities will not arise in the future and that such liabilities will not have a material adverse effect on our business, assets or results of operation.
Actions by our competitors may decrease or prevent increases in the occupancy and rental rates of our properties. We compete with other owners and operators of real estate, some of which own properties similar to ours in the same submarkets in which our properties are located. If our competitors offer space at rental rates below current market rates or below the rental rates we currently charge our tenants, we may lose potential tenants, and we may be pressured to reduce our rental rates below those we currently charge in order to retain tenants when our tenants’ leases expire. As a result, our financial condition, cash flow and cash available for distribution, the market price of our preferred and common stock and our ability to satisfy our debt service obligations could be materially and adversely affected.
Coverage under our existing insurance policies may be inadequate to cover losses. Weather conditions and natural disasters such as hurricanes, tornados,tornadoes, earthquakes, floods, droughts, fires and other environmental conditions can harm our business operations. We generally maintain insurance policies related to our business, including casualty, general liability and other policies, covering our business operations, employees and assets. However, we would be required to bear all losses that are not adequately covered by insurance. In addition, there are certain losses that are not generally insured because it is not economically feasible to insure against them, including losses due to riots or acts of war. If an uninsured loss or a loss in excess of insured limits were to occur with respect to one or more of our properties, then we could lose the capital we invested in the properties, as well as the anticipated future revenue from the properties and, in the case of debt, which is with recourse to us, we would remain obligated for any mortgage debt or other financial obligations related to the properties. Although we believe that our insurance programs are adequate, we cannot assure you that we will not incur losses in excess of our insurance coverage, or that we will be able to obtain insurance in the future at acceptable levels and reasonable costs.
We may be unable to acquire properties on advantageous terms or acquisitions may not perform as we expect. We have acquired individual properties and intend to continue to do so. However, we may be unable to acquire any of the properties that we may identify as potential acquisition opportunities in the future. Our acquisition activities and their success are subject to the following risks:
| ● | when we are able to locate a desired property, competition from other real estate investors may significantly increase the purchase price; | |
| ● | acquired properties may fail to perform as expected; | |
| ● | the actual costs of repositioning or redeveloping acquired properties may be higher than our estimates; | |
| ● | acquired properties may be located in new markets where we face risks associated with an incomplete knowledge or understanding of the local market, a limited number of established business relationships in the area and a relative unfamiliarity with local governmental and permitting procedures; | |
| ● | we may be unable to quickly and efficiently integrate new acquisitions, particularly acquisitions of portfolios of properties, into our existing operations, and as a result, our results of operations and financial condition could be adversely affected; and | |
| ● | we may acquire properties subject to liabilities and without any recourse, or with only limited recourse, to the seller. As a result, if a claim were asserted against us based upon ownership of those properties, we might have to pay substantial sums to resolve it, which could adversely affect our cash flow and financial condition. |
| 11 |
Financing Risks
We face inherent risks associated with our debt incurrence. We finance a portion of our investments in properties and marketable securities through the incurrence of debt. We are subject to the risks normally associated with debt financing, including the risk that our cash flow will be insufficient to meet required payments of principal and interest. In addition, debt creates other risks, including:
| ● | rising interest rates on our variable rate debt; | |
| ● | inability to repay or refinance existing debt as it matures, which may result in forced disposition of assets on disadvantageous terms; | |
| ● | one or more lenders under our $200 million unsecured line of credit could refuse to fund their financing commitment to us or could fail, and we may not be able to replace the financing commitment of any such lenders on favorable terms, or at all; | |
| ● | refinancing terms that are less favorable than the terms of existing debt; and | |
| ● | inability to meet required payments of principal and/or interest. |
We mortgage our properties, which subjects us to the risk of foreclosure in the event of non-payment.We mortgage many of our properties to secure payment of indebtedness and, if we are unable to meet mortgage payments, the property could be foreclosed upon or transferred to the mortgagee with a consequent loss of income and asset value. A foreclosure of one or more of our properties could adversely affect our financial condition, results of operations, cash flow, and ability to service debt and make distributions and the market price of our preferred and common stock.
We face risks related to “balloon payments” and refinancings. Certain mortgages will have significant outstanding principal balances on their maturity dates, commonly known as “balloon payments.” There can be no assurance that we will have the funds available to fund the balloon payment or that we will be able to refinance the debt on favorable terms or at all. To the extent we cannot either pay off or refinance this debt on favorable terms or at all, we may be forced to dispose of properties on disadvantageous terms or pay higher interest rates, either of which could have an adverse impact on our financial performance and ability to service debt and make distributions.
We face risks associated with our dependence on external sources of capital. In order to qualify as a REIT, we are required each year to distribute to our shareholders at least 90% of our REIT taxable income, and we are subject to tax on our income to the extent it is not distributed. Because of this distribution requirement, we may not be able to fund all future capital needs from cash retained from operations. As a result, to fund capital needs, we rely on third-party sources of capital, which we may not be able to obtain on favorable terms, if at all. Our access to third-party sources of capital depends upon a number of factors, including (i) general market conditions; (ii) the market’s perception of our growth potential; (iii) our current and potential future earnings and cash distributions; and (iv) the market price of our capital stock. Additional debt financing may substantially increase our debt-to-total capitalization ratio. Additional equity issuances may dilute the holdings of our current shareholders.
| 12 |
We may become more highly leveraged, resulting in increased risk of default on our obligations and an increase in debt service requirements which could adversely affect our financial condition and results of operations and our ability to pay distributions.We have incurred, and may continue to incur, indebtedness in furtherance of our activities. Our governing documents do not limit the amount of indebtedness we may incur. Accordingly, our Board of Directors may authorize us to incur additional debt and would do so, for example, if it were necessary to maintain our status as a REIT. We could therefore become more highly leveraged, resulting in an increased risk of default on our obligations and an increase in debt service requirements which could adversely affect our financial condition and results of operations and our ability to pay distributions to shareholders.
Fluctuations in interest rates could materially affect our financial results.Because a portion of our debt bears interest at variable rates, increases in interest rates could materially increase our interest expense. If the United States Federal Reserve increases short-term interest rates, this may have a significant upward impact on shorter-term interest rates, including the interest rates that our variable rate debt is based upon. Potential future increases in interest rates and credit spreads may increase our interest expense and therefore negatively affect our financial condition and results of operations, and reduce our access to the debt or equity capital markets.
Covenants in our loan documents could limit our flexibility and adversely affect our financial condition. The terms of our various credit agreements and other indebtedness require us to comply with a number of customary financial and other covenants, such as maintaining debt service coverage and leverage ratios and maintaining insurance coverage. These covenants may limit our flexibility in our operations, and breaches of these covenants could result in defaults under the instruments governing the applicable indebtedness even if we had satisfied our payment obligations. If we were to default under credit agreements or other debt instruments, our financial condition could be adversely affected.
Risks Related to our Status as a REIT
If our leases are not respected as true leases for federal income tax purposes, we would fail to qualify as a REIT.To qualify as a REIT, we must, among other things, satisfy two gross income tests, under which specified percentages of our gross income must be passive income, such as rent. For the rent paid pursuant to our leases to qualify for purposes of the gross income tests, the leases must be respected as true leases for federal income tax purposes and not be treated as service contracts, joint ventures or some other type of arrangement. The determination of whether a lease is a true lease depends upon an analysis of all the surrounding facts and circumstances. We believe that our leases will be respected as true leases for federal income tax purposes. However, there can be no assurance that the Internal Revenue Service (IRS) will agree with this view. If the leases are not respected as true leases for federal income tax purposes, we would not be able to satisfy either of the two gross income tests applicable to REITs, and we could lose our REIT status.
Failure to make required distributions would subject us to additional tax.In order to qualify as a REIT, we must, among other requirements, distribute, each year, to our shareholders at least 90 percent of our taxable income, excluding net capital gains. To the extent that we satisfy the 90 percent distribution requirement, but distribute less than 100 percent of our taxable income, we will be subject to federal corporate income tax on our undistributed income. In addition, we will incur a 4 percent nondeductible excise tax on the amount, if any, by which our distributions (or deemed distributions) and the amounts of income retained on which we have paid corporate income tax in any year are less than the sum of:
| ● | 85 percent of our ordinary income for that year; | |
| ● | 95 percent of our capital gain net earnings for that year; and | |
| ● | 100 percent of our undistributed taxable income from prior years. |
To the extent we pay out in excess of 100 percent of our taxable income for any tax year, we may be able to carry forward such excess to subsequent years to reduce our required distributions for purposes of the 4 percent excise tax in such subsequent years. We intend to pay out our income to our shareholders in a manner intended to satisfy the 90 percent distribution requirement. Differences in timing between the recognition of income and the related cash receipts, the effects of non-deductible capital expenditures, the creation of reserves or the effect of required debt amortization payments could require us to borrow money or sell assets (potentially during unfavorable market conditions) to pay out enough of our taxable income to satisfy the 90 percent distribution requirement and to avoid corporate income tax.
| 13 |
We may not have sufficient cash available from operations to pay distributions, and, therefore, distributions may be made from borrowings.The actual amount and timing of distributions will be determined by our Board of Directors in its discretion and typically will depend on the amount of cash available for distribution, which will depend on items such as current and projected cash requirements, limitations on distributions imposed by law or our financing arrangements and tax considerations. As a result, we may not have sufficient cash available from operations to pay distributions as required to maintain our status as a REIT. Therefore, we may need to borrow funds to make sufficient cash distributions in order to maintain our status as a REIT, which may cause us to incur additional interest expense as a result of an increase in borrowed funds for the purpose of paying distributions.
We may be required to pay a penalty tax upon the sale of a property.The federal income tax provisions applicable to REITs provide that any gain realized by a REIT on the sale of property, other than foreclosure property, held as inventory or other property held primarily for sale to customers in the ordinary course of business is treated as income from a “prohibited transaction” that is subject to a 100 percent penalty tax. Under current law, unless a sale of real property qualifies for a safe harbor, the question of whether the sale of real estate or other property constitutes the sale of property held primarily for sale to customers is generally a question of the facts and circumstances regarding a particular transaction. It is our intent that we and our subsidiaries will hold the interests in the real estate for investment with a view to long-term appreciation, engage in the business of acquiring and owning real estate, and make occasional sales as are consistent with our investment objectives. We do not intend to engage in prohibited transactions. We cannot assure you, however, that we will only make sales that satisfy the requirements of the safe harbors or that the IRS will not successfully assert that one or more of such sales are prohibited transactions. The 100% tax will not apply to gains from the sale of property that is held through a taxable REIT subsidiary or other taxable corporation, although such income will be subject to tax in the hands of the corporation at regular U.S. federal income tax rates.
We may be adversely affected if we fail to qualify as a REIT.If we fail to qualify as a REIT, we will not be allowed to deduct distributions to shareholders in computing our taxable income and will be subject to federal income tax, including any applicable alternative minimum tax, at regular corporate rates.rates and possibly increased state and local taxes. In addition, we might be barred from qualification as a REIT for the four years following disqualification. The additional tax incurred at regular corporate rates would reduce significantly the cash flow available for distribution to shareholders and for debt service. Furthermore, we would no longer be required to make any distributions to our shareholders as a condition to REIT qualification. Any distributions to shareholders would be taxable as ordinary income to the extent of our current and accumulated earnings and profits, although such dividend distributions would be subject to a top federal income tax rate of 20% (and potentially a Medicare tax of 3.8%)., provided applicable requirements of the Internal Revenue Code are satisfied. Corporate distributees, however, may be eligible for the dividends received deduction on the distributions, subject to limitations under the Code.
To qualify as a REIT, we must comply with certain highly technical and complex requirements. We cannot be certain we have complied, and will always be able to comply, with the requirements to qualify as a REIT because there are few judicial and administrative interpretations of these provisions. In addition, facts and circumstances that may be beyond our control may affect our ability to continue to qualify as a REIT. We cannot assure you that new legislation, regulations, administrative interpretations or court decisions will not change the tax laws significantly with respect to our qualification as a REIT or with respect to the federal income tax consequences of qualification. We believe that we have qualified as a REIT since our inception and intend to continue to qualify as a REIT. However, we cannot assure you that we are qualified or will remain qualified.
There is a risk of changes in the tax law applicable to real estate investment trusts. Because the IRS, the United States Treasury Department and Congress frequently review federal income tax legislation, we cannot predict whether, when or to what extent new federal tax laws, regulations, interpretations or rulings will be adopted. Any of such legislative action may prospectively or retroactively modify our tax treatment and, therefore, may adversely affect taxation of us and/or our investors. You are urged to consult with your tax advisor with respect to the status of legislative, regulatory, judicial or administrative developments and proposals and their potential effect on an investment in our securities.
| 14 |
We may be unable to comply with the strict income distribution requirement applicable to REITs. As noted above, to maintain qualification as a REIT under the Code, a REIT must annually distribute to its shareholders at least 90% of its REIT taxable income, excluding the dividends paid deduction and net capital gains. This requirement limits our ability to accumulate capital. We may not have sufficient cash or other liquid assets to meet the 90% distribution requirements. Difficulties in meeting the 90% distribution requirement might arise due to competing demands for our funds or to timing differences between tax reporting and cash receipts and disbursements, because income may have to be reported before cash is received, because expenses may have to be paid before a deduction is allowed, because deductions may be disallowed or limited or because the IRS may make a determination that adjusts reported income. In those situations, we might be required to borrow funds or sell properties on adverse terms in order to meet the 90% distribution requirement and interest and penalties could apply which could adversely affect our financial condition. If we fail to satisfy the 90% distribution requirement, we would cease to be taxed as a REIT.
Notwithstanding our status as a REIT, we are subject to various federal, state and local taxes on our income and property. For example, we will be taxed at regular corporate rates on any undistributed taxable income, including undistributed net capital gains; provided, however, that properly designated undistributed capital gains will effectively avoid taxation at the shareholder level. We may be subject to other federal income taxes and may also have to pay some state income or franchise taxes because not all states treat REITs in the same manner as they are treated for federal income tax purposes. In addition, any taxable REIT subsidiary that we may form will be subject to regular corporate federal, state and local taxes. Any of these taxes would decrease cash available for distributions to stockholders.
Other Risks
We may not be able to access adequate cash to fund our business.Our business requires access to adequate cash to finance our operations, distributions, capital expenditures, debt service obligations, development and redevelopment costs and property acquisition costs, if any. We expect to generate the cash to be used for these purposes primarily with operating cash flow, borrowings under secured and unsecured term loans, proceeds from sales of strategically identified assets and, when market conditions permit, through the issuance of debt and equity securities from time to time. We may not be able to generate sufficient cash to fund our business, particularly if we are unable to renew or extend leases, lease vacant space or re-lease space as leases expire according to expectations.
We are dependent on key personnel.Our executive and other senior officers have a significant role in our success. Our ability to retain our management group or to attract suitable replacements should any members of the management group leave is dependent on the competitive nature of the employment market. The loss of services from key members of the management group or a limitation in their availability could adversely affect our financial condition and cash flow. Further, such a loss could be negatively perceived in the capital markets.
We may amend our business policies without shareholder approval.Our Board of Directors determines our growth, investment, financing, capitalization, borrowing, operations and distributions policies. In addition, our charter provides that our Board of Directors may revoke or otherwise terminate our REIT election, without the approval of our shareholders, if it determines that it is no longer in our best interest to continue to qualify as a REIT. Although our Board of Directors has no present intention to amend or reverse any of these policies, they may be amended or revised without notice to shareholders. Accordingly, shareholders may not have control over changes in our policies. We cannot assure you that changes in our policies will serve fully the interests of all shareholders.
The market value of our preferred and common stock could decrease based on our performance and market perception and conditions.The market value of our preferred and common stock may be based primarily upon the market’s perception of our growth potential and current and future cash dividends, and may be secondarily based upon the real estate market value of our underlying assets. The market price of our preferred and common stock is influenced by their respective distributions relative to market interest rates. Rising interest rates may lead potential buyers of our stock to expect a higher distribution rate, which could adversely affect the market price of our stock. In addition, rising interest rates could result in increased expense, thereby adversely affecting cash flow and our ability to service our indebtedness and pay distributions.
| 15 |
There are restrictions on the ownership and transfer of our capital stock.To maintain our qualification as a REIT under the Code, no more than 50% in value of our outstanding capital stock may be owned, actually or by attribution, by five or fewer individuals, as defined in the Code to also include certain entities, during the last half of a taxable year. Accordingly, our charter contains provisions restricting the ownership and transfer of our capital stock. These restrictions may discourage a tender offer or other transaction, or a change in management or of control of us that might involve a premium price for our common stock or preferred stock or that our shareholders otherwise believe to be in their best interests, and may result in the transfer of shares acquired in excess of the restrictions to a trust for the benefit of a charitable beneficiary and, as a result, the forfeiture by the acquirer of the benefits of owning the additional shares.
Our earnings are dependent, in part, upon the performance of our investment portfolio.As permitted by the Code, we invest in and own marketable securities of other REITs, which we generally limit to no more than approximately 10% of our undepreciated assets (which is our total assets excluding accumulated depreciation). To the extent that the value of those investments declines or those investments do not provide an attractive return, our earnings and cash flow could be adversely affected.
We are subject to restrictions that may impede our ability to effect a change in control. Certain provisions contained in our charter and bylaws and certain provisions of Maryland law may have the effect of discouraging a third party from making an acquisition proposal for us and thereby inhibit a change in control. These provisions include the following:
| ● | Our charter provides for three classes of directors with the term of office of one class expiring each year, commonly referred to as a “staggered board.” By preventing common shareholders from voting on the election of more than one class of directors at any annual meeting of shareholders, this provision may have the effect of keeping the current members of our Board of Directors in control for a longer period of time than shareholders may desire. | |
| ● | Our charter generally limits any stockholder from acquiring more than 9.8% (in value or in number of shares, whichever is more restrictive) of our outstanding equity stock (defined as all of our classes of capital stock, except our excess stock). While this provision is intended to assist us in qualifying as a REIT for federal income tax purposes, the ownership limit may also limit the opportunity for shareholders to receive a premium for their shares of common stock that might otherwise exist if an investor was attempting to assemble a block of shares in excess of 9.8% of the outstanding shares of equity stock or otherwise effect a change in control. | |
| ● | The request of shareholders entitled to cast a majority of the votes entitled to be cast at such meeting is necessary for shareholders to call a special meeting. We also require advance notice from shareholders for the nomination of directors or proposals of business to be considered at a meeting of shareholders. | |
| ● | Our Board of Directors may authorize and cause us to issue securities without shareholder approval. Under our charter, our Board of Directors has the power to classify and reclassify any of our unissued shares of capital stock into shares of capital stock with such preferences, rights, powers and restrictions as the Board of Directors may determine. | |
| ● | “Business combination” provisions that provide that, unless exempted, a Maryland corporation may not engage in certain business combinations, including mergers, dispositions of 10 percent or more of its assets, certain issuances of shares of stock and other specified transactions, with an “interested shareholder” or an affiliate of an interested shareholder for five years after the most recent date on which the interested shareholder became an interested shareholder, and thereafter unless specified criteria are met. An interested shareholder is defined generally as any person who beneficially owns 10% or more of the voting power of our shares or an affiliate thereof or an affiliate or associate of ours who was the beneficial owner, directly or indirectly, of 10% or more of the voting power of our then outstanding voting stock at any time within the two-year period immediately prior to the date in question. In our charter, we have expressly elected that the Maryland Business Combination Act not govern or apply to any transaction with a related company, UMH Properties, Inc. | |
| ● | The duties of directors of a Maryland corporation do not require them to, among other things (a) accept, recommend or respond to any proposal by a person seeking to acquire control of the corporation, (b) authorize the corporation to redeem any rights under, or modify or render inapplicable, any shareholders rights plan, (c) make a determination under the Maryland Business Combination Act or the Maryland Control Share Acquisition Act to exempt any person or transaction from the requirements of those provisions, or (d) act or fail to act solely because of the effect of the act or failure to act may have on an acquisition or potential acquisition of control of the corporation or the amount or type of consideration that may be offered or paid to the shareholders in an acquisition. |
| 16 |
We cannot assure you that we will be able to pay distributions regularly.Our ability to pay distributions in the future is dependent on our ability to operate profitably and to generate cash from our operations and the operations of our subsidiaries and is subject to limitations under our financing arrangements and Maryland law. Under the Maryland General Corporation Law, or the MGCL, a Maryland corporation generally may not make a distribution if, after giving effect to the distribution, the corporation would not be able to pay its debts as the debts became due in the usual course of business, or the corporation’s total assets would be less than the sum of its total liabilities plus, unless the charter permits otherwise, the amount that would be needed if the corporation were to be dissolved at the time of the distribution to satisfy the preferential rights upon dissolution of stockholders whose preferential rights on dissolution are superior to those receiving the distribution. Accordingly, we cannot guarantee that we will be able to pay distributions on a regular quarterly basis in the future.
Future terrorist attacks and military conflicts could have a material adverse effect on general economic conditions, consumer confidence and market liquidity.Among other things, it is possible that interest rates may be affected by these events. An increase in interest rates may increase our costs of borrowing, leading to a reduction in our earnings. Terrorist acts could also result in significant damages to, or loss of, our properties.
We and our tenants may be unable to obtain adequate insurance coverage on acceptable economic terms for losses resulting from acts of terrorism. Our lenders may require that we carry terrorism insurance even if we do not believe this insurance is necessary or cost effective. We may also be prohibited under the applicable lease from passing all or a portion of the cost of such insurance through to the tenant. Should an act of terrorism result in an uninsured loss or a loss in excess of insured limits, we could lose capital invested in a property, as well as the anticipated future revenues from a property, while remaining obligated for any mortgage indebtedness or other financial obligations related to the property. Any loss of these types could adversely affect our financial condition.
Disruptions in the financial markets could affect our ability to obtain financing on reasonable terms and have other adverse effects on us and the market price of our capital stock.Over the last several years, the United States stock and credit markets have experienced significant price volatility, dislocations and liquidity disruptions, which have caused market prices of many stocks and debt securities to fluctuate substantially and the spreads on prospective debt financing to widen considerably. More recently, the financial crisis in Europe (including financial difficulties at several large European banks) has had a similar, although less pronounced, effect. Adding to the European credit crisis, in June 2016, voters in the United Kingdom elected to withdraw from the European Union in a national referendum. The referendum has created significant uncertainty about the future relationship between the United Kingdom and the European Union and has continued to have a material adverse effect on global economic conditions and the stability of global financial markets and could significantly reduce global market liquidity and restrict the ability of key market participants to operate in certain financial markets. Continued uncertainty in the stock and credit markets may negatively impact our ability to access additional financing at reasonable terms, which may negatively affect our ability to acquire properties and otherwise pursue our investment strategy. A prolonged downturn in the stock or credit markets may cause us to seek alternative sources of potentially less attractive financing, and may require us to adjust our investment strategy accordingly. These types of events in the stock and credit markets may make it more difficult or costly for us to raise capital through the issuance of the common stock, preferred stock or debt securities. The potential disruptions in the financial markets may have a material adverse effect on the market value of the common stock and preferred stock and the return we receive on our properties and investments, as well as other unknown adverse effects on us or the economy in general.
We are subject to risks arising from litigation.We may become involved in litigation. Litigation can be costly, and the results of litigation are often difficult to predict. We may not have adequate insurance coverage or contractual protection to cover costs and liability in the event we are sued, and to the extent we resort to litigation to enforce our rights, we may incur significant costs and ultimately be unsuccessful or unable to recover amounts we believe are owed to us. We may have little or no control of the timing of litigation, which presents challenges to our strategic planning.
Dividends on our capital stock do not qualify for the reduced tax rates available for some dividends.Income from “qualified dividends” payable to U.S. stockholders that are individuals, trusts and estates are generally subject to tax at preferential rates. Dividends payable by REITs, however, generally are not eligible for the preferential tax rates applicable to qualified dividend income. Although these rules do not adversely affect our taxation or the dividends payable by us, to the extent that the preferential rates continue to apply to regular corporate qualified dividends, investors who are individuals, trusts and estates may perceive an investment in us to be relatively less attractive than an investment in the stock of a non-REIT corporation that pays dividends, which could materially and adversely affect the value of the shares of, and per share trading price of, our capital stock.
ITEM 1B – UNRESOLVED STAFF COMMENTS
None.
| 17 |
The Company operates as a REIT. Our portfolio is primarily comprised of real estate holdings, some of which have been long-term holdings carried on our financial statements at depreciated cost. We believe that their current market values exceed both the original cost and the depreciated cost.
The following table sets forth certain information concerning the Company’s real estate investments as of September 30, 2016:2017:
| Mortgage | Mortgage | ||||||||||||||||||||||||||||||||
| Fiscal Year | Square | Balance | Fiscal Year | Square | Balance | ||||||||||||||||||||||||||||
| State | City (MSA) | Acquisition | Type | Footage | 9/30/2016 | City (MSA) | Acquisition | Type | Footage | 9/30/2017 | |||||||||||||||||||||||
| AL | Huntsville | 2005 | Industrial | 88,653 | $ | 795,594 | Huntsville | 2005 | Industrial | 88,653 | $ | 589,073 | |||||||||||||||||||||
| AZ | Tolleson (Phoenix) | 2003 | Industrial | 283,358 | 5,299,383 | Tolleson (Phoenix) | 2003 | Industrial | 283,358 | 4,525,118 | |||||||||||||||||||||||
| CO | Colorado Springs | 2006 | Industrial | 68,370 | 1,329,709 | Colorado Springs | 2006 | Industrial | 68,370 | 1,043,704 | |||||||||||||||||||||||
| CO | Colorado Springs | 2016 | Industrial | 225,362 | 18,576,282 | Colorado Springs | 2016 | Industrial | 225,362 | 17,632,728 | |||||||||||||||||||||||
| CO | Denver | 2005 | Industrial | 69,865 | 1,059,646 | Denver | 2005 | Industrial | 69,865 | 746,617 | |||||||||||||||||||||||
| CT | Newington (Hartford) | 2001 | Industrial | 54,812 | -0- | Newington (Hartford) | 2001 | Industrial | 54,812 | -0- | |||||||||||||||||||||||
| FL | Cocoa | 2008 | Industrial | 144,138 | -0- | ||||||||||||||||||||||||||||
| FL | Davenport (Orlando) | 2016 | Industrial | 310,922 | 25,077,642 | ||||||||||||||||||||||||||||
| FL | Cocoa | 2008 | Industrial | 144,138 | 5,063,864 | Ft. Myers (Vacant) | 2003 | Industrial | 87,500 | -0- | |||||||||||||||||||||||
| FL | Davenport (Orlando) | 2016 | Industrial | 310,922 | 26,400,000 | Ft. Myers (FDX Ground) | 2017 | Industrial | 213,672 | 14,021,964 | |||||||||||||||||||||||
| FL | Ft. Myers | 2003 | Industrial | 87,500 | -0- | Homestead (Miami) | 2017 | Industrial | 237,756 | 24,591,465 | |||||||||||||||||||||||
| FL | Jacksonville (FDX) | 1999 | Industrial | 95,883 | 1,384,194 | Jacksonville (FDX) | 1999 | Industrial | 95,883 | -0- | |||||||||||||||||||||||
| FL | Jacksonville (FDX Ground) | 2015 | Industrial | 297,579 | 18,453,112 | Jacksonville (FDX Ground) | 2015 | Industrial | 297,579 | 17,370,102 | |||||||||||||||||||||||
| FL | Lakeland | 2006 | Industrial | 32,105 | -0- | Lakeland | 2006 | Industrial | 32,105 | -0- | |||||||||||||||||||||||
| FL | Orlando | 2008 | Industrial | 110,638 | 4,342,604 | Orlando | 2008 | Industrial | 110,638 | 4,098,856 | |||||||||||||||||||||||
| FL | Punta Gorda | 2007 | Industrial | 34,624 | 1,990,764 | Punta Gorda | 2007 | Industrial | 34,624 | -0- | |||||||||||||||||||||||
| FL | Tampa (FDX Ground) | 2004 | Industrial | 170,779 | 6,633,049 | Tampa (FDX Ground) | 2004 | Industrial | 170,779 | 5,910,953 | |||||||||||||||||||||||
| FL | Tampa (FDX) | 2006 | Industrial | 95,662 | 3,900,447 | Tampa (FDX) | 2006 | Industrial | 95,662 | 3,654,913 | |||||||||||||||||||||||
| FL | Tampa (Tampa Bay Grand Prix) | 2005 | Industrial | 68,385 | -0- | Tampa (Tampa Bay Grand Prix) | 2005 | Industrial | 68,385 | -0- | |||||||||||||||||||||||
| GA | Augusta (FDX Ground) | 2005 | Industrial | 59,358 | 774,093 | Augusta (FDX Ground) | 2005 | Industrial | 59,358 | 562,454 | |||||||||||||||||||||||
| GA | Augusta (FDX) | 2006 | Industrial | 30,184 | -0- | Augusta (FDX) | 2006 | Industrial | 30,184 | -0- | |||||||||||||||||||||||
| GA | Griffin (Atlanta) | 2006 | Industrial | 218,120 | -0- | Griffin (Atlanta) | 2006 | Industrial | 218,120 | -0- | |||||||||||||||||||||||
| IA | Urbandale (Des Moines) | 1994 | Industrial | 36,270 | -0- | Urbandale (Des Moines) (Vacant) | 1994 | Industrial | 36,270 | -0- | |||||||||||||||||||||||
| IL | Burr Ridge (Chicago) | 1997 | Industrial | 12,500 | -0- | Burr Ridge (Chicago) | 1997 | Industrial | 12,500 | -0- | |||||||||||||||||||||||
| IL | Elgin (Chicago) | 2002 | Industrial | 89,052 | 349,658 | Elgin (Chicago) | 2002 | Industrial | 89,052 | -0- | |||||||||||||||||||||||
| IL | Granite City (St. Louis, MO) | 2001 | Industrial | 184,800 | -0- | Granite City (St. Louis, MO) | 2001 | Industrial | 184,800 | -0- | |||||||||||||||||||||||
| IL | Montgomery (Chicago) | 2004 | Industrial | 171,200 | -0- | Montgomery (Chicago) | 2004 | Industrial | 171,200 | -0- | |||||||||||||||||||||||
| IL | Rockford (B/E Aerospace, Inc.) | 2015 | Industrial | 38,833 | -0- | Rockford (Collins Aerospace Systems) | 2015 | Industrial | 38,833 | -0- | |||||||||||||||||||||||
| IL | Rockford (Sherwin-Williams Company) | 2011 | Industrial | 66,387 | -0- | Rockford (Sherwin-Williams Co.) | 2011 | Industrial | 66,387 | -0- | |||||||||||||||||||||||
| IL | Sauget (St. Louis, MO) | 2015 | Industrial | 198,773 | 9,701,419 | Sauget (St. Louis, MO) | 2015 | Industrial | 198,773 | 9,145,097 | |||||||||||||||||||||||
| IL | Schaumburg (Chicago) | 1997 | Industrial | 73,500 | -0- | Schaumburg (Chicago) | 1997 | Industrial | 73,500 | -0- | |||||||||||||||||||||||
| IL | Wheeling (Chicago) | 2003 | Industrial | 123,000 | -0- | Wheeling (Chicago) | 2003 | Industrial | 123,000 | -0- | |||||||||||||||||||||||
| IN | Greenwood (Indianapolis) | 2015 | Industrial | 671,354 | 22,760,488 | Greenwood (Indianapolis) | 2015 | Industrial | 671,354 | 21,485,141 | |||||||||||||||||||||||
| IN | Indianapolis | 2014 | Industrial | 327,822 | 12,289,676 | Indianapolis | 2014 | Industrial | 327,822 | 11,381,906 | |||||||||||||||||||||||
| KS | Edwardsville (Kansas City) (Carlisle Tire) | 2003 | Industrial | 179,280 | 397,513 | Edwardsville (Kansas City) (Carlisle Tire) | 2003 | Industrial | 179,280 | -0- | |||||||||||||||||||||||
| KS | Edwardsville (Kansas City) (International Paper) | 2014 | Industrial | 280,000 | 10,648,115 | Edwardsville (Kansas City) (International Paper) | 2014 | Industrial | 280,000 | 9,931,292 | |||||||||||||||||||||||
| KS | Olathe (Kansas City) | 2016 | Industrial | 313,763 | 22,215,000 | Olathe (Kansas City) | 2016 | Industrial | 313,763 | 21,108,249 | |||||||||||||||||||||||
| KS | Topeka | 2009 | Industrial | 40,000 | 1,363,023 | Topeka | 2009 | Industrial | 40,000 | 1,119,836 | |||||||||||||||||||||||
| KY | Buckner (Louisville) | 2014 | Industrial | 558,600 | 16,694,846 | Buckner (Louisville) | 2014 | Industrial | 558,600 | 16,014,719 | |||||||||||||||||||||||
| KY | Frankfort (Lexington) | 2015 | Industrial | 599,840 | 18,352,289 | Frankfort (Lexington) | 2015 | Industrial | 599,840 | 17,560,855 | |||||||||||||||||||||||
| KY | Louisville | 2016 | Industrial | 137,500 | 7,288,891 | Louisville | 2016 | Industrial | 137,500 | 6,914,142 | |||||||||||||||||||||||
| LA | Covington (New Orleans) | 2016 | Industrial | 175,315 | 12,468,713 | Covington (New Orleans) | 2016 | Industrial | 175,315 | 11,814,941 | |||||||||||||||||||||||
| MD | Beltsville (Washington, DC) | 2001 | Industrial | 144,523 | -0- | Beltsville (Washington, DC) | 2001 | Industrial | 148,881 | -0- | |||||||||||||||||||||||
| MI | Livonia (Detroit) | 2013 | Industrial | 172,005 | 7,503,400 | Livonia (Detroit) | 2013 | Industrial | 172,005 | 6,912,375 | |||||||||||||||||||||||
| MI | Orion | 2007 | Industrial | 245,633 | 8,580,058 | Orion | 2007 | Industrial | 245,633 | -0- | |||||||||||||||||||||||
| MI | Romulus (Detroit) | 1998 | Industrial | 71,933 | -0- | Romulus (Detroit) | 1998 | Industrial | 71,933 | -0- | |||||||||||||||||||||||
| MN | Stewartville (Rochester) (1) | 2013 | Industrial | 60,398 | 2,612,978 | ||||||||||||||||||||||||||||
| MI | Walker (Grand Rapids) | 2017 | Industrial | 343,483 | 20,530,135 | ||||||||||||||||||||||||||||
| MN | White Bear Lake (Minneapolis/St. Paul) (4) | 2001 | Industrial | 59,425 | -0- | Stewartville (Rochester)(1) | 2013 | Industrial | 60,398 | 2,369,334 | |||||||||||||||||||||||
| MO | Kansas City (Bunzl Distribution Midcentral, Inc.) | 2015 | Industrial | 158,417 | 6,958,091 | Kansas City (Bunzl Distribution Midcentral, Inc.) | 2015 | Industrial | 158,417 | 6,799,803 | |||||||||||||||||||||||
| MO | Kansas City (Kellogg Sales Co.) | 2007 | Industrial | 65,067 | -0- | ||||||||||||||||||||||||||||
| MO | Liberty (Kansas City) | 1998 | Industrial | 95,898 | -0- | ||||||||||||||||||||||||||||
| 18 |
| Mortgage | |||||||||||||||||||||||||||||
| Fiscal Year | Square | Mortgage Balance | Fiscal Year | Square | Balance | ||||||||||||||||||||||||
| State | City (MSA) | Acquisition | Type | Footage | 9/30/2016 | City (MSA) | Acquisition | Type | Footage | 9/30/2017 | |||||||||||||||||||
| MO | Kansas City (Kellogg Sales Company) | 2007 | Industrial | 65,067 | $ | 2,241,680 | |||||||||||||||||||||||
| MO | Liberty (Kansas City) | 1998 | Industrial | 95,898 | -0- | ||||||||||||||||||||||||
| MO | O’Fallon (St. Louis) | 1994 | Industrial | 102,135 | -0- | O’Fallon (St. Louis) | 1994 | Industrial | 102,135 | $ | -0- | ||||||||||||||||||
| MO | St. Joseph | 2001 | Industrial | 382,880 | -0- | St. Joseph | 2001 | Industrial | 382,880 | -0- | |||||||||||||||||||
| MS | Olive Branch (Memphis, TN) (Anda) | 2012 | Industrial | 234,660 | 8,750,368 | Olive Branch (Memphis, TN) (Anda Pharmaceuticals, Inc.) | 2012 | Industrial | 234,660 | 8,171,480 | |||||||||||||||||||
| MS | Olive Branch (Memphis, TN) (Milwaukee Tool) | 2013 | Industrial | 861,889 | 25,000,000 | Olive Branch (Memphis, TN) (Milwaukee Tool) | 2013 | Industrial | 861,889 | 23,461,936 | |||||||||||||||||||
| MS | Richland (Jackson) | 1994 | Industrial | 36,000 | -0- | Richland (Jackson) | 1994 | Industrial | 36,000 | -0- | |||||||||||||||||||
| MS | Ridgeland (Jackson) | 1993 | Industrial | 26,340 | -0- | Ridgeland (Jackson) | 1993 | Industrial | 26,340 | -0- | |||||||||||||||||||
| NC | Concord (Charlotte) | 2016 | Industrial | 330,717 | 20,001,944 | Concord (Charlotte) | 2016 | Industrial | 330,717 | 18,928,835 | |||||||||||||||||||
| NC | Fayetteville | 1997 | Industrial | 148,000 | -0- | Concord (Charlotte) | 2017 | Industrial | 354,482 | 26,184,000 | |||||||||||||||||||
| NC | Winston-Salem | 2002 | Industrial | 106,507 | -0- | Fayetteville | 1997 | Industrial | 148,000 | -0- | |||||||||||||||||||
| NC | Winston-Salem | 2002 | Industrial | 106,507 | -0- | ||||||||||||||||||||||||
| NE | Omaha | 1999 | Industrial | 89,115 | -0- | Omaha | 1999 | Industrial | 89,115 | -0- | |||||||||||||||||||
| NJ | Carlstadt (New York, NY) (2) | 2001 | Industrial | 60,400 | 1,898,198 | Carlstadt (New York, NY)(2) | 2001 | Industrial | 60,400 | 1,743,353 | |||||||||||||||||||
| NJ | Somerset (3) | 1970 | Shopping Center | 64,138 | -0- | Somerset(3) | 1970 | Shopping Center | 64,220 | -0- | |||||||||||||||||||
| NY | Cheektowaga (Buffalo) | 2000 | Industrial | 104,981 | -0- | ||||||||||||||||||||||||
| NY | Cheektowaga (Buffalo) | 2000 | Industrial | 104,981 | 343,548 | Halfmoon (Albany) | 2012 | Industrial | 75,000 | -0- | |||||||||||||||||||
| NY | Halfmoon (Albany) | 2012 | Industrial | 75,000 | 3,786,098 | Hamburg (Buffalo) | 2017 | Industrial | 338,584 | 22,532,881 | |||||||||||||||||||
| NY | Orangeburg (New York) | 1993 | Industrial | 50,400 | -0- | Orangeburg (New York) | 1993 | Industrial | 50,400 | -0- | |||||||||||||||||||
| OH | Bedford Heights (Cleveland) | 2007 | Industrial | 82,269 | 2,685,791 | Bedford Heights (Cleveland) | 2007 | Industrial | 82,269 | -0- | |||||||||||||||||||
| OH | Cincinnati | 2015 | Industrial | 63,840 | -0- | Cincinnati | 2015 | Industrial | 63,840 | -0- | |||||||||||||||||||
| OH | Lebanon (Cincinnati) | 2012 | Industrial | 51,130 | 2,592,182 | Kenton | 2017 | Industrial | 298,472 | 12,000,000 | |||||||||||||||||||
| OH | Monroe (Cincinnati) | 2015 | Industrial | 232,200 | 8,071,987 | Lebanon (Cincinnati) | 2012 | Industrial | 51,130 | -0- | |||||||||||||||||||
| OH | Richfield (Cleveland) | 2006 | Industrial | 131,152 | 3,078,731 | Monroe (Cincinnati) | 2015 | Industrial | 232,200 | 7,608,083 | |||||||||||||||||||
| OH | Streetsboro (Cleveland) | 2012 | Industrial | 368,060 | 10,446,469 | Richfield (Cleveland) | 2006 | Industrial | 131,152 | 2,724,856 | |||||||||||||||||||
| OH | West Chester Twp. (Cincinnati) | 1999 | Industrial | 103,818 | 2,071,107 | Stow | 2017 | Industrial | 219,765 | 12,700,000 | |||||||||||||||||||
| OH | Streetsboro (Cleveland) | 2012 | Industrial | 368,060 | 9,887,817 | ||||||||||||||||||||||||
| OH | West Chester Twp. (Cincinnati) | 1999 | Industrial | 103,818 | 1,820,753 | ||||||||||||||||||||||||
| OK | Oklahoma City (Bunzl Distribution Oklahoma, Inc.) | 2017 | Industrial | 110,361 | 5,935,346 | ||||||||||||||||||||||||
| OK | Oklahoma City | 2012 | Industrial | 158,340 | 4,401,832 | Oklahoma City (FDX Ground) | 2012 | Industrial | 158,340 | 3,919,663 | |||||||||||||||||||
| OK | Tulsa | 2014 | Industrial | 46,240 | 1,934,175 | Tulsa | 2014 | Industrial | 46,240 | 1,812,575 | |||||||||||||||||||
| PA | Altoona (1) | 2014 | Industrial | 122,522 | 4,017,147 | Altoona(1) | 2014 | Industrial | 122,522 | 3,642,839 | |||||||||||||||||||
| PA | Imperial (Pittsburgh) | 2016 | Industrial | 125,860 | 12,700,739 | Imperial (Pittsburgh) | 2016 | Industrial | 125,860 | 11,963,800 | |||||||||||||||||||
| PA | Monaca (Pittsburgh) | 1988 | Industrial | 255,658 | -0- | Monaca (Pittsburgh) | 1988 | Industrial | 255,658 | -0- | |||||||||||||||||||
| SC | Ft. Mill (Charlotte, NC) | 2010 | Industrial | 176,939 | 1,926,986 | Aiken (Augusta, GA) | 2017 | Industrial | 315,560 | 15,227,062 | |||||||||||||||||||
| SC | Hanahan (Charleston) (SAIC) | 2005 | Industrial | 302,400 | 5,605,514 | Ft. Mill (Charlotte, NC) | 2010 | Industrial | 176,939 | 1,346,845 | |||||||||||||||||||
| SC | Hanahan (Charleston) (FDX Ground) | 2005 | Industrial | 91,776 | 1,064,185 | Hanahan (Charleston) (SAIC) | 2005 | Industrial | 302,400 | -0- | |||||||||||||||||||
| SC | Hanahan (Charleston) (FDX Ground) | 2005 | Industrial | 91,776 | 773,234 | ||||||||||||||||||||||||
| TN | Chattanooga | 2007 | Industrial | 60,637 | 1,551,081 | Chattanooga | 2007 | Industrial | 60,637 | -0- | |||||||||||||||||||
| TN | Lebanon (Nashville) | 2011 | Industrial | 381,240 | 7,659,116 | Lebanon (Nashville) | 2011 | Industrial | 381,240 | 7,446,653 | |||||||||||||||||||
| TN | Memphis | 2010 | Industrial | 449,900 | 6,667,886 | Memphis | 2010 | Industrial | 449,900 | 5,882,668 | |||||||||||||||||||
| TN | Shelby County | 2007 | Land | N/A | -0- | Shelby County | 2007 | Land | N/A | -0- | |||||||||||||||||||
| TX | Carrollton (Dallas) | 2010 | Industrial | 184,317 | 7,233,486 | ||||||||||||||||||||||||
| TX | Carrollton (Dallas) | 2010 | Industrial | 184,317 | 7,960,781 | Corpus Christi | 2012 | Industrial | 46,253 | -0- | |||||||||||||||||||
| TX | Corpus Christi | 2012 | Industrial | 46,253 | -0- | Edinburg | 2011 | Industrial | 164,207 | -0- | |||||||||||||||||||
| TX | Edinburg | 2011 | Industrial | 113,582 | -0- | El Paso | 2006 | Industrial | 144,149 | -0- | |||||||||||||||||||
| TX | El Paso | 2006 | Industrial | 144,149 | 3,259,726 | Ft. Worth (Dallas) | 2015 | Industrial | 304,608 | 22,116,268 | |||||||||||||||||||
| TX | Fort Worth (Dallas) | 2015 | Industrial | 304,608 | 23,431,093 | Houston | 2010 | Industrial | 91,295 | 2,619,835 | |||||||||||||||||||
| TX | Houston | 2010 | Industrial | 91,295 | 3,124,904 | Lindale (Tyler) | 2015 | Industrial | 163,378 | 6,016,758 | |||||||||||||||||||
| TX | Lindale (Tyler) | 2015 | Industrial | 163,378 | 6,378,382 | Mesquite (Dallas) | 2017 | Industrial | 351,874 | 32,623,355 | |||||||||||||||||||
| TX | Spring (Houston) | 2014 | Industrial | 181,176 | 9,126,834 | Spring (Houston) | 2014 | Industrial | 181,176 | 8,537,878 | |||||||||||||||||||
| TX | Waco | 2012 | Industrial | 150,710 | 4,799,919 | Waco | 2012 | Industrial | 150,710 | 4,524,045 | |||||||||||||||||||
| VA | Charlottesville | 1999 | Industrial | 48,064 | -0- | Charlottesville | 1999 | Industrial | 48,064 | -0- | |||||||||||||||||||
| VA | Mechanicsville (Richmond) (FDX) | 2001 | Industrial | 112,799 | -0- | Mechanicsville (Richmond) | 2001 | Industrial | 112,799 | -0- | |||||||||||||||||||
| VA | Richmond (United Technologies) | 2004 | Industrial | 60,000 | -0- | Richmond | 2004 | Industrial | 60,000 | -0- | |||||||||||||||||||
| VA | Roanoke (CHEP) | 2007 | Industrial | 83,000 | 2,519,243 | Roanoke (CHEP USA) | 2007 | Industrial | 83,000 | -0- | |||||||||||||||||||
| VA | Roanoke (FDX Ground) | 2013 | Industrial | 103,402 | 5,321,390 | Roanoke (FDX Ground) | 2013 | Industrial | 103,402 | 4,867,194 | |||||||||||||||||||
| WA | Burlington (Seattle/Everett) | 2016 | Industrial | 210,445 | 19,881,817 | Burlington (Seattle/Everett) | 2016 | Industrial | 210,445 | 18,839,050 | |||||||||||||||||||
| WI | Cudahy (Milwaukee) | 2001 | Industrial | 139,564 | -0- | Cudahy (Milwaukee) | 2001 | Industrial | 139,564 | -0- | |||||||||||||||||||
| WI | Green Bay (1) | 2013 | Industrial | 99,102 | 3,260,401 | Green Bay(1) | 2013 | Industrial | 99,102 | 2,956,605 | |||||||||||||||||||
| 16,010,372 | $ | 483,748,153 | 18,790,021 | $ | 598,962,567 | ||||||||||||||||||||||||
(1) One loan is secured by the properties located in Green Bay, WI, Stewartville, MN and Altoona, PA.
(2) The Company owns a 51% controlling equity interest.
(3) The Company owns a 67% controlling equity interest.
| 19 |
The following table sets forth certain information concerning the principal tenants and leases for the Company’s properties shown above as of September 30, 2016:2017:
| State | City (MSA) | Tenant | Annualized Rent | Lease Expiration | City (MSA) | Tenant | Annualized Rent | Lease Expiration | ||||||||||||||||||
| AL | Huntsville | FedEx Ground Package System, Inc. | $ | 590,000 | 07/31/26 | (1) | Huntsville | FedEx Ground Package System, Inc. | $ | 605,000 | 07/31/26 | |||||||||||||||
| AZ | Tolleson (Phoenix) | Western Container Corp. (Coca-Cola) | 1,346,000 | 04/30/27 | (2) | Tolleson (Phoenix) | Western Container Corp. (Coca-Cola) | 1,352,000 | 04/30/27 | (1) | ||||||||||||||||
| CO | Colorado Springs | FedEx Ground Package System, Inc. | 644,000 | 09/30/18 | Colorado Springs | FedEx Ground Package System, Inc. | 644,000 | 09/30/18 | ||||||||||||||||||
| CO | Colorado Springs | FedEx Ground Package System, Inc. | 1,832,000 | 01/31/26 | Colorado Springs | FedEx Ground Package System, Inc. | 1,832,000 | 01/31/26 | ||||||||||||||||||
| CO | Denver | FedEx Ground Package System, Inc. | 564,000 | 07/31/18 | Denver | FedEx Ground Package System, Inc. | 564,000 | 07/31/18 | ||||||||||||||||||
| CT | Newington (Hartford) | Kellogg Sales Company | 329,000 | 02/29/20 | (2) | Newington (Hartford) | Kellogg Sales Company | 329,000 | 02/29/20 | (1) | ||||||||||||||||
| FL | Cocoa | FedEx Ground Package System, Inc. | 1,112,000 | 09/30/24 | ||||||||||||||||||||||
| FL | Davenport (Orlando) | FedEx Ground Package System, Inc. | 2,605,000 | 04/30/31 | ||||||||||||||||||||||
| FL | Cocoa | FedEx Ground Package System, Inc. | 1,112,000 | 09/30/24 | Ft. Myers (Vacant) | FedEx Ground Package System, Inc. | 325,000 | 06/30/17 | (1)(2) | |||||||||||||||||
| FL | Davenport (Orlando) | FedEx Ground Package System, Inc. | 2,604,000 | 04/30/31 | Ft. Myers | FedEx Ground Package System, Inc. | 1,415,000 | 08/31/27 | (3) | |||||||||||||||||
| FL | Ft. Myers | FedEx Ground Package System, Inc. | 433,000 | 06/30/17 | (2) | Homestead (Miami) | FedEx Ground Package System, Inc. | 2,282,000 | 03/31/32 | |||||||||||||||||
| FL | Jacksonville | FedEx Corporation | 518,000 | 05/31/19 | Jacksonville | FedEx Corporation | 518,000 | 05/31/19 | ||||||||||||||||||
| FL | Jacksonville | FedEx Ground Package System, Inc. | 1,992,000 | 12/31/29 | Jacksonville | FedEx Ground Package System, Inc. | 1,999,000 | 12/31/29 | ||||||||||||||||||
| FL | Lakeland | FedEx Corporation | 155,000 | 11/30/17 | Lakeland | FedEx Corporation | 155,000 | 11/30/17 | ||||||||||||||||||
| FL | Orlando | FedEx Corporation | 666,000 | 11/30/17 | Orlando | FedEx Corporation | 666,000 | 11/30/27 | (1) | |||||||||||||||||
| FL | Punta Gorda | FedEx Corporation | 304,000 | 06/30/17 | (3) | Punta Gorda | FedEx Corporation | 286,000 | 06/30/27 | (1) | ||||||||||||||||
| FL | Tampa | FedEx Ground Package System, Inc. | 1,614,000 | 07/31/26 | (4) | Tampa | FedEx Corporation | 603,000 | 11/30/27 | (1) | ||||||||||||||||
| FL | Tampa | FedEx Corporation | 603,000 | 09/30/17 | (3) | Tampa | FedEx Ground Package System, Inc. | 1,624,000 | 07/31/26 | |||||||||||||||||
| FL | Tampa | Tampa Bay Grand Prix | 289,000 | 09/30/20 | Tampa | Tampa Bay Grand Prix | 293,000 | 09/30/20 | ||||||||||||||||||
| GA | Augusta | FedEx Ground Package System, Inc. | 453,000 | 06/30/18 | Augusta | FedEx Ground Package System, Inc. | 453,000 | 06/30/18 | ||||||||||||||||||
| GA | Augusta | FedEx Corporation | 121,000 | 11/30/22 | Augusta | FedEx Corporation | 121,000 | 11/30/22 | ||||||||||||||||||
| GA | Griffin (Atlanta) | Caterpillar Logistics Services, Inc. | 1,169,000 | 11/30/16 | (3) | Griffin (Atlanta) | Caterpillar Logistics Services, Inc. | 1,169,000 | 12/31/17 | (4) | ||||||||||||||||
| IA | Urbandale (Des Moines) | Keystone Automotive Industries MN, Inc. | 140,000 | 03/31/17 | (3) | Urbandale (Des Moines) (Vacant) | Keystone Automotive Industries MN, Inc. | 94,000 | 05/31/17 | (5) | ||||||||||||||||
| IL | Burr Ridge (Chicago) | Sherwin-Williams Company | 160,000 | 10/31/21 | Burr Ridge (Chicago) | Sherwin-Williams Company | 161,000 | 10/31/21 | ||||||||||||||||||
| IL | Elgin (Chicago) | Joseph T. Ryerson and Son, Inc. | 506,000 | 01/31/20 | (2) | Elgin (Chicago) | Joseph T. Ryerson and Son, Inc. | 506,000 | 01/31/20 | (1) | ||||||||||||||||
| IL | Granite City (St. Louis, MO) | Anheuser-Busch, Inc. | 806,000 | 11/30/21 | (2) | Granite City (St. Louis, MO) | Anheuser-Busch, Inc. | 810,000 | 11/30/21 | |||||||||||||||||
| IL | Montgomery (Chicago) | Home Depot USA, Inc. | 978,000 | 06/30/20 | Montgomery (Chicago) | Home Depot USA, Inc. | 988,000 | 06/30/20 | ||||||||||||||||||
| IL | Rockford | B/E Aerospace, Inc. | 360,000 | 06/30/27 | Rockford | Collins Aerospace Systems (United Technologies) | 362,000 | 06/30/27 | (6) | |||||||||||||||||
| IL | Rockford | Sherwin-Williams Company | 477,000 | 12/31/23 | Rockford | Sherwin-Williams Company | 479,000 | 12/31/23 | ||||||||||||||||||
| IL | Sauget (St. Louis, MO) | FedEx Ground Package System, Inc. | 1,036,000 | 05/31/29 | Sauget (St. Louis, MO) | FedEx Ground Package System, Inc. | 1,036,000 | 05/31/29 | ||||||||||||||||||
| IL | Schaumburg (Chicago) | FedEx Corporation | 483,000 | 03/31/27 | (2) | Schaumburg (Chicago) | FedEx Corporation | 480,000 | 03/31/27 | (1) | ||||||||||||||||
| IL | Wheeling (Chicago) | FedEx Ground Package System, Inc. | 1,386,000 | 05/31/17 | (3) | Wheeling (Chicago) | FedEx Ground Package System, Inc. | 1,279,000 | 05/31/27 | (1) | ||||||||||||||||
| IN | Greenwood (Indianapolis) | ULTA, Inc. | 2,651,000 | 07/31/25 | Greenwood (Indianapolis) | ULTA, Inc. | 2,677,000 | 07/31/25 | ||||||||||||||||||
| IN | Indianapolis | FedEx Ground Package System, Inc. | 1,533,000 | 04/30/24 | Indianapolis | FedEx Ground Package System, Inc. | 1,533,000 | 04/30/24 | ||||||||||||||||||
| KS | Edwardsville (Kansas City) | Carlisle Tire & Wheel Company | 787,000 | 05/31/18 | Edwardsville (Kansas City) | Carlisle Tire & Wheel Company | 787,000 | 05/31/18 | ||||||||||||||||||
| KS | Edwardsville (Kansas City) | International Paper Company | 1,326,000 | 08/31/23 | Edwardsville (Kansas City) | International Paper Company | 1,337,000 | 08/31/23 | ||||||||||||||||||
| KS | Olathe (Kansas City) | FedEx Ground Package System, Inc. | 2,196,000 | 05/31/31 | Olathe (Kansas City) | FedEx Ground Package System, Inc. | 2,196,000 | 05/31/31 | ||||||||||||||||||
| KS | Topeka | The Coca-Cola Company | 332,000 | 09/30/21 | Topeka | Heartland Coca-Cola Bottling Co., LLC (Coca-Cola) | 332,000 | 09/30/21 | ||||||||||||||||||
| KY | Buckner (Louisville) | TreeHouse Private Brands, Inc. | 2,166,000 | 10/31/33 | Buckner (Louisville) | TreeHouse Private Brands, Inc. | 2,186,000 | 10/31/33 | ||||||||||||||||||
| KY | Frankfort (Lexington) | Jim Beam Brands Company | 2,013,000 | 01/31/25 | Frankfort (Lexington) | Jim Beam Brands Company | 2,032,000 | 01/31/25 | ||||||||||||||||||
| KY | Louisville | Challenger Lifts, Inc. (Snap-on Inc.) | 835,000 | 06/07/26 | Louisville | Challenger Lifts, Inc. (Snap-on Inc.) | 831,000 | 06/07/26 | ||||||||||||||||||
| LA | Covington (New Orleans) | FedEx Ground Package System, Inc. | 1,258,000 | 06/30/25 | Covington (New Orleans) | FedEx Ground Package System, Inc. | 1,260,000 | 06/30/25 | ||||||||||||||||||
| MD | Beltsville (Washington, DC) | FedEx Ground Package System, Inc. | 1,426,000 | 07/31/18 | Beltsville (Washington, DC) | FedEx Ground Package System, Inc. | 1,426,000 | 07/31/18 | ||||||||||||||||||
| MI | Livonia (Detroit) | FedEx Ground Package System, Inc. | 1,194,000 | 03/31/22 | Livonia (Detroit) | FedEx Ground Package System, Inc. | 1,194,000 | 03/31/22 | ||||||||||||||||||
| MI | Orion | FedEx Ground Package System, Inc. | 1,908,000 | 06/30/23 | Orion | FedEx Ground Package System, Inc. | 1,908,000 | 06/30/23 | ||||||||||||||||||
| MI | Romulus (Detroit) | FedEx Corporation | 370,000 | 05/31/21 | Romulus (Detroit) | FedEx Corporation | 370,000 | 05/31/21 | ||||||||||||||||||
| MN | Stewartville (Rochester) | FedEx Ground Package System, Inc. | 372,000 | 05/30/23 | ||||||||||||||||||||||
| MI | Walker (Grand Rapids) | FedEx Ground Package System, Inc. | 2,102,000 | 01/31/32 | ||||||||||||||||||||||
| MN | White Bear Lake (Minneapolis/St. Paul) | Vacant | -0- | N/A | (6) | Stewartville (Rochester) | FedEx Ground Package System, Inc. | 372,000 | 05/30/23 | |||||||||||||||||
| MO | Kansas City | Bunzl Distribution Midcentral, Inc. | 741,000 | 09/30/21 | Kansas City | Bunzl Distribution Midcentral, Inc. | 747,000 | 09/30/21 | ||||||||||||||||||
| MO | Kansas City | Kellogg Sales Company | 325,000 | 07/31/18 | Kansas City | Kellogg Sales Company | 325,000 | 07/31/18 | (2) | |||||||||||||||||
| MO | Liberty (Kansas City) | Holland 1916 Inc. | 341,000 | 06/30/19 | Liberty (Kansas City) | Holland 1916 Inc. | 345,000 | 06/30/19 | ||||||||||||||||||
| MO | O’Fallon (St. Louis) | Pittsburgh Glass Works LLC | 427,000 | 06/30/18 | (7) | O’Fallon (St. Louis) | Pittsburgh Glass Works, LLC | 427,000 | 06/30/18 | (7) | ||||||||||||||||
| MO | St. Joseph | Woodstream Corporation | 896,000 | 09/30/17 | (3)(5) | St. Joseph | Woodstream Corporation | 910,000 | 09/30/21 | (1)(8) | ||||||||||||||||
| MO | St. Joseph | Altec Industries, Inc. | 349,000 | 02/28/18 | (5) | St. Joseph | Altec Industries, Inc. | 367,000 | 02/28/23 | (1)(8) | ||||||||||||||||
| MS | Olive Branch (Memphis, TN) | Anda Pharmaceuticals, Inc. | 1,196,000 | 07/31/22 | Olive Branch (Memphis, TN) | Anda Pharmaceuticals, Inc. | 1,200,000 | 07/31/22 | ||||||||||||||||||
| MS | Olive Branch (Memphis, TN) | Milwaukee Electric Tool Corporation | 2,934,000 | 07/31/28 | (8) | |||||||||||||||||||||
| MS | Richland (Jackson) | FedEx Corporation | 120,000 | 03/31/24 | ||||||||||||||||||||||
| MS | Ridgeland (Jackson) | Graybar Electric Company | 109,000 | 07/31/19 | (9) | |||||||||||||||||||||
| NC | Concord (Charlotte) | FedEx Ground Package System, Inc. | 2,078,000 | 07/31/25 | ||||||||||||||||||||||
| NC | Fayetteville | Victory Packaging L.P. | 470,000 | 02/28/21 | ||||||||||||||||||||||
| 20 |
| State | City (MSA) | Tenant | Annualized Rent | Lease Expiration | ||||||||||
| NC | Winston-Salem | Style Crest, Inc. | $ | 361,000 | 03/31/21 | |||||||||
| NE | Omaha | FedEx Corporation | 446,000 | 10/31/23 | ||||||||||
| NJ | Carlstadt (New York, NY) | SOFIVE, Inc. | 537,000 | 01/31/25 | (10) | |||||||||
| NJ | Somerset | Various Tenants at Retail Shopping Center | 780,000 | Various | (11) | |||||||||
| NY | Cheektowaga (Buffalo) | FedEx Ground Package System, Inc. | 966,000 | 08/31/19 | ||||||||||
| NY | Halfmoon (Albany) | RGH Enterprises, Inc. (Cardinal Health) | 596,000 | 11/30/21 | ||||||||||
| NY | Orangeburg (New York) | Kellogg Sales Company | 328,000 | 02/28/18 | ||||||||||
| OH | Bedford Heights (Cleveland) | FedEx Corporation | 408,000 | 08/31/18 | ||||||||||
| OH | Cincinnati | The American Bottling Company (Dr Pepper Snapple) | 477,000 | 09/30/29 | ||||||||||
| OH | Lebanon (Cincinnati) | Siemens Real Estate | 473,000 | 04/30/19 | ||||||||||
| OH | Monroe (Cincinnati) | UGN, Inc. | 1,050,000 | 02/28/30 | ||||||||||
| OH | Richfield (Cleveland) | FedEx Ground Package System, Inc. | 1,493,000 | 09/30/24 | ||||||||||
| OH | Streetsboro (Cleveland) | Best Buy Warehousing Logistics, Inc. | 1,641,000 | 01/31/22 | ||||||||||
| OH | West Chester Twp. (Cincinnati) | FedEx Ground Package System, Inc. | 532,000 | 08/31/23 | ||||||||||
| OK | Oklahoma City | FedEx Ground Package System, Inc. | 1,048,000 | 06/30/25 | ||||||||||
| OK | Tulsa | The American Bottling Company (Dr Pepper Snapple) | 257,000 | 02/28/24 | ||||||||||
| PA | Altoona | FedEx Ground Package System, Inc. | 651,000 | 08/31/23 | ||||||||||
| PA | Imperial (Pittsburgh) | General Electric Company | 1,311,000 | 12/31/25 | ||||||||||
| PA | Monaca (Pittsburgh) | NF&M International, Inc. | 832,000 | 12/31/24 | (5) | |||||||||
| PA | Monaca (Pittsburgh) | Datatel Resources Corporation | 242,000 | 11/30/17 | (2)(5) | |||||||||
| SC | Ft. Mill (Charlotte, NC) | FedEx Ground Package System, Inc. | 1,415,000 | 10/31/23 | ||||||||||
| SC | Hanahan (Charleston) | Science Applications International Corporation | 1,462,000 | 04/30/19 | ||||||||||
| SC | Hanahan (Charleston) | FedEx Ground Package System, Inc. | 675,000 | 07/31/18 | ||||||||||
| TN | Chattanooga | FedEx Corporation | 311,000 | 10/31/17 | ||||||||||
| TN | Lebanon (Nashville) | CBOCS Distribution, Inc. (Cracker Barrel) | 1,420,000 | 06/30/24 | ||||||||||
| TN | Memphis | FedEx Supply Chain Services, Inc. | 1,327,000 | 05/31/19 | ||||||||||
| TN | Shelby County | N/A- Land | -0- | N/A | ||||||||||
| TX | Carrollton (Dallas) | United Technologies Corporation | 1,576,000 | 01/11/19 | ||||||||||
| TX | Corpus Christi | FedEx Ground Package System, Inc. | 463,000 | 08/31/21 | ||||||||||
| TX | Edinburg | FedEx Ground Package System, Inc. | 598,000 | 09/30/21 | (12) | |||||||||
| TX | El Paso | FedEx Ground Package System, Inc. | 1,345,000 | 09/30/23 | ||||||||||
| TX | Fort Worth (Dallas) | FedEx Ground Package System, Inc. | 2,362,000 | 04/30/30 | ||||||||||
| TX | Houston | National Oilwell Varco, Inc. | 746,000 | 09/30/22 | ||||||||||
| TX | Lindale (Tyler) | FedEx Ground Package System, Inc. | 725,000 | 06/30/24 | ||||||||||
| TX | Spring (Houston) | FedEx Ground Package System, Inc. | 1,581,000 | 09/30/24 | ||||||||||
| TX | Waco | FedEx Ground Package System, Inc. | 1,078,000 | 08/31/25 | ||||||||||
| VA | Charlottesville | FedEx Corporation | 329,000 | 08/31/17 | (3) | |||||||||
| VA | Mechanicsville (Richmond) | FedEx Corporation | 541,000 | 04/30/23 | ||||||||||
| VA | Richmond | United Technologies Corporation | 319,000 | 11/30/18 | (2) | |||||||||
| VA | Roanoke | CHEP USA, Inc. | 494,000 | 02/28/25 | (13) | |||||||||
| VA | Roanoke | FedEx Ground Package System, Inc. | 755,000 | 04/30/23 | ||||||||||
| WA | Burlington (Seattle/Everett) | FedEx Ground Package System, Inc. | 1,962,000 | 08/31/30 | ||||||||||
| WI | Cudahy (Milwaukee) | FedEx Ground Package System, Inc. | 901,000 | 06/30/17 | (3) | |||||||||
| WI | Green Bay | FedEx Ground Package System, Inc. | 468,000 | 05/30/23 | ||||||||||
| $ | 91,305,000 | |||||||||||||
| State | City (MSA) | Tenant | Annualized Rent | Lease Expiration | ||||||||
| MS | Olive Branch (Memphis, TN) | Milwaukee Electric Tool Corporation | $ | 3,010,000 | 07/31/28 | |||||||
| MS | Richland (Jackson) | FedEx Corporation | 120,000 | 03/31/24 | ||||||||
| MS | Ridgeland (Jackson) | Graybar Electric Company | 109,000 | 07/31/19 | (9) | |||||||
| NC | Concord (Charlotte) | FedEx Ground Package System, Inc. | 2,234,000 | 07/31/25 | ||||||||
| NC | Concord (Charlotte) | FedEx Ground Package System, Inc. | 2,537,000 | 05/31/32 | ||||||||
| NC | Fayetteville | Victory Packaging, L.P. | 496,000 | 02/28/21 | ||||||||
| NC | Winston-Salem | Style Crest, Inc. | 381,000 | 03/31/21 | ||||||||
| NE | Omaha | FedEx Corporation | 446,000 | 10/31/23 | ||||||||
| NJ | Carlstadt (New York, NY) | SOFIVE, Inc. | 548,000 | 01/31/25 | (10) | |||||||
| NJ | Somerset | Various Tenants at Retail Shopping Center | 792,000 | Various | (11) | |||||||
| NY | Cheektowaga (Buffalo) | FedEx Ground Package System, Inc. | 966,000 | 08/31/19 | ||||||||
| NY | Halfmoon (Albany) | RGH Enterprises, Inc. (Cardinal Health) | 601,000 | 11/30/21 | ||||||||
| NY | Hamburg (Buffalo) | FedEx Ground Package System, Inc. | 2,309,000 | 03/31/31 | ||||||||
| NY | Orangeburg (New York) | Kellogg Sales Company | 328,000 | 02/28/18 | (2) | |||||||
| OH | Bedford Heights (Cleveland) | FedEx Corporation | 408,000 | 08/31/18 | ||||||||
| OH | Cincinnati | The American Bottling Company (Dr Pepper Snapple) | 479,000 | 09/30/29 | ||||||||
| OH | Kenton | International Paper Company | 1,243,000 | 08/31/27 | ||||||||
| OH | Lebanon (Cincinnati) | Siemens Real Estate | 479,000 | 04/30/19 | ||||||||
| OH | Monroe (Cincinnati) | UGN, Inc. | 1,060,000 | 02/28/30 | ||||||||
| OH | Richfield (Cleveland) | FedEx Ground Package System, Inc. | 1,493,000 | 09/30/24 | ||||||||
| OH | Stow | Mickey Thompson (Cooper Tire) | 1,500,000 | 08/31/27 | ||||||||
| OH | Streetsboro (Cleveland) | Best Buy Warehousing Logistics, Inc. | 1,660,000 | 01/31/22 | ||||||||
| OH | West Chester Twp. (Cincinnati) | FedEx Ground Package System, Inc. | 537,000 | 08/31/23 | ||||||||
| OK | Oklahoma City | Bunzl Distribution Oklahoma, Inc. | 721,000 | 08/31/24 | ||||||||
| OK | Oklahoma City | FedEx Ground Package System, Inc. | 1,048,000 | 06/30/25 | ||||||||
| OK | Tulsa | The American Bottling Company (Dr Pepper Snapple) | 260,000 | 02/28/24 | ||||||||
| PA | Altoona | FedEx Ground Package System, Inc. | 651,000 | 08/31/23 | ||||||||
| PA | Imperial (Pittsburgh) | General Electric Company | 1,315,000 | 12/31/25 | ||||||||
| PA | Monaca (Pittsburgh) | NF&M International, Inc. | 833,000 | 12/31/24 | (8) | |||||||
| PA | Monaca (Pittsburgh) | Datatel Resources Corporation | 244,000 | 11/30/17 | (8) | |||||||
| SC | Aiken (Augusta, GA) | Autoneum North America, Inc. | 1,700,000 | 04/30/32 | ||||||||
| SC | Ft. Mill (Charlotte, NC) | FedEx Ground Package System, Inc. | 1,415,000 | 10/31/23 | ||||||||
| SC | Hanahan (Charleston) | FedEx Ground Package System, Inc. | 675,000 | 07/31/18 | ||||||||
| SC | Hanahan (Charleston) | Science Applications International Corporation | 1,476,000 | 04/30/19 | ||||||||
| TN | Chattanooga | FedEx Corporation | 317,000 | 10/31/22 | (1) | |||||||
| TN | Lebanon (Nashville) | CBOCS Distribution, Inc. (Cracker Barrel) | 1,433,000 | 06/30/24 | ||||||||
| TN | Memphis | FedEx Corporation | 1,327,000 | 05/31/19 | ||||||||
| TN | Shelby County | N/A- Land | -0- | N/A | ||||||||
| TX | Carrollton (Dallas) | United Technologies Corporation | 1,576,000 | 01/11/19 | ||||||||
| TX | Corpus Christi | FedEx Ground Package System, Inc. | 469,000 | 08/31/21 | ||||||||
| TX | Edinburg | FedEx Ground Package System, Inc. | 1,097,000 | 09/30/26 | (12) | |||||||
| TX | El Paso | FedEx Ground Package System, Inc. | 1,345,000 | 09/30/23 | ||||||||
| TX | Ft. Worth (Dallas) | FedEx Ground Package System, Inc. | 2,367,000 | 04/30/30 | ||||||||
| TX | Houston | National Oilwell Varco, Inc. | 750,000 | 09/30/22 | ||||||||
| TX | Lindale (Tyler) | FedEx Ground Package System, Inc. | 725,000 | 06/30/24 | ||||||||
| TX | Mesquite (Dallas) | FedEx Ground Package System, Inc. | 3,194,000 | 03/31/32 | ||||||||
| TX | Spring (Houston) | FedEx Ground Package System, Inc. | 1,581,000 | 09/30/24 | ||||||||
| TX | Waco | FedEx Ground Package System, Inc. | 1,078,000 | 08/31/25 | ||||||||
| VA | Charlottesville | FedEx Corporation | 329,000 | 08/31/27 | (1) | |||||||
| VA | Mechanicsville (Richmond) | FedEx Corporation | 541,000 | 04/30/23 | ||||||||
| VA | Richmond | Carrier Enterprise, LLC (United Technologies) | 320,000 | 11/30/18 | ||||||||
| VA | Roanoke | CHEP USA, Inc. | 497,000 | 02/28/25 | (13) | |||||||
| VA | Roanoke | FedEx Ground Package System, Inc. | 755,000 | 04/30/23 | ||||||||
| WA | Burlington (Seattle/Everett) | FedEx Ground Package System, Inc. | 1,962,000 | 08/31/30 | ||||||||
| WI | Cudahy (Milwaukee) | FedEx Ground Package System, Inc. | 832,000 | 06/30/27 | (1) | |||||||
| WI | Green Bay | FedEx Ground Package System, Inc. | 468,000 | 05/30/23 | ||||||||
| $ | 111,048,000 | |||||||||||
| 21 |
| (1) | Extension has been executed. See fiscal 2017 and fiscal 2018 renewal and extension chart. | |
| (2) | Property is under contract to sell. | |
| (3) | On | |
| (4) | ||
| 1/1/2018. | ||
| (5) | ||
| Entered into a new 10.2 year lease with FBM Gypsum Supply of Illinois, LLC, effective 11/1/2017. | ||
| (6) |
| Lease has an early termination option which may be exercised after | ||
| (7) | The lease has an early termination option which may be exercised | |
| (8) | ||
| two tenants. | ||
| (9) | Lease has an early termination option which may be exercised if tenant gives six months | |
| (10) | Estimated annual rent is the full annual rent per the lease. The Company consolidates the results of this property due to its 51% controlling equity interest. | |
| (11) | The Company owns a 67% controlling equity interest. Estimated annual rent reflects the Company’s proportionate share of the total rent. | |
| (12) | ||
| (13) | Lease has an early termination option which may be exercised after August 2021, on the condition that the Company is provided with six months |
All improved properties were 100% occupied at September 30, 20162017 except for one property consisting of a 59,42536,270 square feetfoot building situated on 4.78 acres located in White Bear Lake, MN.Urbandale (Des Moines), IA and one property consisting of an 87,500 square foot building located in Ft. Myers, FL. Subsequent to fiscal yearend, on October 27, 2016,November 1, 2017, the Company sold this propertyleased its previously vacant 36,270 square foot facility located in Urbandale (Des Moines), IA for $4,272,00010.2 years which increased our current occupancy rate from 99.6% to 100.0%99.5%. In addition, the Company is under contract to sell its only currently vacant building located in Ft. Myers, FL, for $6,400,000. We anticipate closing the sale of this building during fiscal 2018, subject to customary closing conditions and requirements.
The Company’s weighted-average lease expiration was 7.47.9 and 7.27.4 years as of September 30, 20162017 and 2015,2016, respectively.
Our average occupancy rates as of the years ended September 30, 2017, 2016, 2015, 2014 and 2013 and 2012 were 99.3%, 99.6%, 97.7%, 95.9%, and 96.0% and 95.2%, respectively. The average effective annualized rent per square foot for the years ended September 30, 2017, 2016, 2015, 2014 and 2013 and 2012 was $5.93, $5.72, $5.48, $5.51 $5.53 and $5.62,$5.53, respectively.
Completed expansions that have resulted in increased rents over the fiscal years ended September 30, 20152016 and 20162017
Ecommerce has been a major catalyst driving increased demand for the industrial property type, causing an ongoingtype. The shift from traditional brick and mortar retail shopping to shopping on-line.on-line has resulted in record occupancy rates for industrial real estate throughout the U.S. Due to the increased demand for industrial space, we have been experiencing an increase in expansion activity at our existing properties.
During December 2014, a 62,260 square foot expansion of a building leased to NF&M International, Inc. located in Monaca (Pittsburgh), PA was completed for a cost of approximately $4,503,000, resulting in a new 10 year lease which extended the prior lease expiration date from September 2018 through December 2024. In addition, the expansion resulted in an initial increase in annual rent effective January 1, 2015 from $381,805, or $3.39 per square foot, to $820,000, or $4.69 per square foot. Furthermore, annual rent will increase in year five of the lease effective January 1, 2020 to $841,600, or $4.81 per square foot, resulting in an annualized rent over the new ten year period of $830,800, or $4.75 per square foot.
During June 2015, a parking lot expansion of a building leased to FedEx Ground Package System, Inc. located in El Paso, TX was completed for a cost of approximately $2,472,000 resulting in an increase in annual rent effective July 1, 2015 from $1,045,610, or $7.25 per square foot to $1,345,289, or $9.33 per square foot. Prior to this parking lot expansion, during September 2013, a 51,765 square foot expansion of the building located at the same property was completed for a cost of approximately $3,800,000 resulting in an increase in annual rent effective October 1, 2013 from $667,584, or $7.27 per square foot, to $1,045,610, or $7.25 per square foot. In addition, the expansion resulted in a new 10 year lease which extended the prior lease expiration date from September 2015 through September 2023.
During June 2015, a 38,428 square foot expansion of a building leased to FedEx Ground Package System, Inc. located in Oklahoma City, OK was completed for a cost of approximately $3,332,000, resulting in a new 10 year lease which extended the prior lease expiration date from March 2022 through June 2025. In addition, the expansion resulted in an increase in annual rent effective August 1, 2015 from $712,532, or $5.94 per square foot, to $1,048,250, or $6.62 per square foot.
During August 2015, a 48,116 square foot expansion of a building leased to FedEx Ground Package System, Inc. located in Waco, TX was completed for a cost of approximately $4,125,000, resulting in a new 10 year lease which extended the prior lease expiration date from May 2022 through August 2025. In addition, the expansion resulted in an increase in annual rent effective August 15, 2015 from $659,324, or $6.43 per square foot, to $1,078,383, or $7.16 per square foot.
On July 29, 2016, a 246,434 square foot expansion of a building leased to Milwaukee Electric Tool Corporation (“Milwaukee Tool”)(Milwaukee Tool) located in Olive Branch, MS, which is located in the Memphis, TN MSA, was completed for a cost of approximately $9,785,000. This resulted in a new 12 year lease which extended the original lease expiration date from April 2023 throughto July 2028 and increased the building size from 615,455 to 861,889 square feet. In addition, the expansion resulted in an initial increase in annual rent effective on the date of completion of approximately $847,000 from approximately $1,943,000, or $3.16 per square foot, to approximately $2,790,000, or $3.24 per square foot. Furthermore, annual rent will increase each year by 1.5% resulting in an annualized rent over the new twelve12 year period of approximately $3,020,000, or $3.50 per square foot. In September 2016, in connection with the expansion, the Company refinanced its prior 3.76% interest rate mortgage with its existing lender of this property. At the time of the refinancing, the prior amortizing loan was approximately $13,158,000 and was set to mature in January 2023. The new loan is a 12 year fully-amortizing mortgage of $25,000,000 and will mature in October 2028. The interest rate of the new loan remained the same as the prior loan at a fixed interest rate of 3.76%.
| 22 |
On August 1, 2016, a parking lot expansion for a property leased to FedEx Ground Package System, Inc. located in Tampa, FL was completed for a cost of approximately $1,303,000, resulting in a new 10 year lease which extended the prior lease expiration date from June 2024 throughto July 2026. In addition, the expansion resulted in an increase in annual rent effective from the date of completion of approximately $131,000 from approximately $1,493,000, or $8.74 per square foot to approximately $1,624,000, or $9.51 per square foot.
On August 1, 2016, a 14,941 square foot expansion of a building leased to FedEx Ground Package System, Inc. located in Huntsville, AL was completed for a cost of approximately $1,925,000,$1,948,000, resulting in a new 10 year lease which extended the prior lease expiration date from August 2022 throughto July 2026. In addition, the expansion resulted in an increase in annual rent effective from the date of completion of approximately $193,000 from approximately $412,000, or $5.59 per square foot, to approximately $605,000 or $6.82 per square foot.
On October 1, 2016, a 50,74150,625 square foot expansion of the building leased to FedEx Ground Package System, Inc. located in Edinburg, TX was completed for a cost of approximately $4,988,000,$4,762,000, resulting in a new 10 year lease which extended the prior lease expiration date from September 2021 throughto September 2026. In addition, the expansion resulted in an increase in annual rent effective from the date of completion of approximately $499,000 from approximately $598,000, or $5.27$5.26 per square foot, to approximately $1,097,000, or $6.68 per square foot.
On September 1, 2017, a parking lot expansion for a property leased to FedEx Ground Package System, Inc. located in Ft. Myers, FL was completed for a cost of approximately $862,000, resulting in a new 10 year lease which extended the prior lease expiration date from September 2026 to August 2027. In addition, the expansion resulted in an increase in annual rent effective from the date of completion of approximately $53,000 from approximately $1,365,000, or $6.39 per square foot to approximately $1,418,000, or $6.64 per square foot.
Fiscal 2016 renewals2017 Renewals
Approximately 2%In fiscal 2017, approximately 10% of the Company’sour gross leasable area, consisting of threerepresenting 13 leases totaling 325,6561,539,526 square feet, was scheduledset to expire during fiscal 2016.expire. The Company has renewed all three12 of these 13 leases that were set to expire in fiscal 2017. One of the 12 leases (which is with FedEx Ground Package System, Inc. for a property located in Ft. Myers, FL), renewed for only eight months because the tenant moved its operations from our 87,500 square foot facility to our newly constructed facility, which is also located in Ft. Myers, FL. On December 30, 2016, we purchased this newly constructed 213,672 square foot industrial building which is leased for 10 years through September 2026. On September 1, 2017, a parking lot expansion for this property was completed, resulting in a 100% tenant retention ratenew 10 year lease which extended the prior lease expiration date from September 2026 to August 2027. The original 87,500 square foot Ft. Myers, FL facility is under contract to sell for approximately $6,400,000, which is approximately $2,400,000 above the Company’s U.S. GAAP net book carrying value, and is anticipated to close during fiscal 2016. The Company’s tenant retention rate in2018, subject to customary closing conditions and requirements.
Excluding the eight-month lease renewal at the original Ft. Myers, FL location, the 11 leases that have renewed during fiscal 2015 was also 100%. For two2017 represent 1,415,756 square feet, or 92% of the three leases that were scheduled to expire during fiscal 2016, the Company did not incur any tenant improvement costs or any leasing costs. For the otherexpiring square footage, and have a weighted average lease renewal, the Companyterm of 6.8 years. We have incurred or expectswe expect to incur tenant improvement costs of approximately $210,000$3,251,000 and leasing commission costs of approximately $133,000.$1,383,000 in connection with these 11 lease renewals. The table below summarizes the lease terms of the three11 leases which were renewed andrenewed. In addition, the table below includes both the tenant improvement costs and the leasing commission costs, which are presented on a per square foot (PSF) basis averaged over the renewal term.
| 23 |
| Property | Tenant | Square Feet | Former U.S. GAAP Straight- Line Rent PSF | Former Cash Rent PSF | Former Lease Expiration | Renewal U.S GAAP Straight- Line Rent PSF | Renewal Initial Cash Rent PSF | Renewal Lease Expiration | Renewal Term (years) | Tenant Improvement Cost PSF over Renewal Term (1) | Leasing Commission Cost PSF over Renewal Term (1) | |||||||||||||||||||||||||||
| Ft. Myers, FL (3) | FedEx Ground | 87,500 | $ | 4.95 | $ | 4.95 | 10/31/16 | $ | 4.95 | $ | 4.95 | 6/30/17 | 0.7 | $ | -0- | $ | -0- | |||||||||||||||||||||
| Griffin, GA | Caterpillar | 218,120 | $ | 5.36 | $ | 5.36 | 11/30/16 | $ | 5.36 | $ | 5.36 | 11/30/17 | 1.0 | $ | -0- | $ | 0.11 | |||||||||||||||||||||
| Elgin, IL | Joseph T. Ryerson | 89,052 | 5.68 | 5.68 | 1/31/17 | 5.68 | 5.68 | 1/31/20 | 3.0 | 0.17 | 0.17 | |||||||||||||||||||||||||||
| Newington, CT | Kellogg Sales Co. | 54,812 | 6.00 | 6.00 | 2/28/17 | 6.00 | 6.00 | 2/29/20 | 3.0 | 0.30 | 0.24 | |||||||||||||||||||||||||||
| Schaumburg, IL | FedEx Express | 73,500 | 6.88 | 7.00 | 3/31/17 | 6.50 | 6.50 | 3/31/27 | 10.0 | 0.24 | 0.13 | |||||||||||||||||||||||||||
| Tolleson, AZ | Western Container | 283,358 | 4.33 | 4.59 | 4/30/17 | 4.78 | 4.33 | 4/30/27 | 10.0 | 0.58 | 0.14 | |||||||||||||||||||||||||||
| Wheeling, IL | FedEx Ground | 123,000 | 11.26 | 11.26 | 5/31/17 | 10.34 | 10.34 | 5/31/27 | 10.0 | 0.41 | 0.21 | |||||||||||||||||||||||||||
| Punta Gorda, FL | FedEx Express | 34,624 | 8.78 | 8.78 | 6/30/17 | 8.21 | 8.21 | 6/30/27 | 10.0 | 0.08 | 0.16 | |||||||||||||||||||||||||||
| Cudahy, WI | FedEx Ground | 139,564 | 6.45 | 6.45 | 6/30/17 | 5.92 | 5.92 | 6/30/27 | 10.0 | 0.36 | 0.12 | |||||||||||||||||||||||||||
| Charlottesville, VA | FedEx Express | 48,064 | 6.85 | 6.85 | 8/31/17 | 6.85 | 6.85 | 8/31/27 | 10.0 | 0.29 | 0.14 | |||||||||||||||||||||||||||
| Tampa, FL | FedEx Express | 95,662 | 5.91 | 6.30 | 9/30/17 | 6.30 | 6.30 | 11/30/27 | 10.2 | 0.15 | 0.12 | |||||||||||||||||||||||||||
| St. Joseph, MO | Woodstream Corp. | 256,000 | 3.50 | 3.50 | 9/30/17 | 3.57 | 3.50 | 9/30/21 | 4.0 | 0.01 | 0.11 | |||||||||||||||||||||||||||
| Total (2) | 1,415,756 | |||||||||||||||||||||||||||||||||||||
| Weighted Average (2) | $ | 5.73 | $ | 5.82 | $ | 5.70 | $ | 5.59 | 6.8 | $ | 0.34 | $ | 0.14 | |||||||||||||||||||||||||
| (1) | Amount calculated based on the total cost divided by the square feet, divided by the renewal term. | |
| (2) | Total and Weighted Average amounts exclude the Ft. Myers, FL property. | |
| (3) | Renewed for only eight months because the tenant moved its operations from our 87,500 square foot facility to our newly constructed 213,672 square foot facility, which is also located in Ft. Myers, FL. The original 87,500 square foot location is under contract to sell for approximately $6,400,000, which is approximately $2,400,000 above the Company’s U.S. GAAP net book carrying value. |
Excluding the eight-month lease renewal at the original Ft. Myers, FL location, representing 6% of the space coming up for renewal in fiscal 2017, the remaining 11 lease renewals resulted in a weighted average term of 6.8 years and a U.S. GAAP straight-line weighted average lease rate of $5.70 per square foot. The renewed weighted average initial cash rent per square foot is $5.59. This compares to the former weighted average rent of $5.73 per square foot on a U.S. GAAP straight-line basis and the former weighted average cash rent of $5.82 per square foot, representing a decrease in the weighted average lease rate of 0.5% on a U.S. GAAP straight-line basis and a decrease in the weighted average lease rate of 4.0% on a cash basis.
Regarding the remaining lease that expired during fiscal 2017, we were informed by the tenant that they would not be renewing its lease. This tenant leased our 36,270 square feet facility in Urbandale (Des Moines), IA through May 31, 2017. This facility represents 2% of the space that was up for renewal in fiscal 2017. In July 2017, we entered into a 10.2 year lease agreement with FBM Gypsum Supply of Illinois, LLC through December 31, 2027 for this 36,270 square foot building located in Urbandale (Des Moines), IA. The new lease commenced on November 1, 2017, with two months of free rent, after which initial annual rent of $159,588, representing $4.40 per square foot, will commence, with 2.0% annual increases thereafter, resulting in a straight-line annualized rent of approximately $172,000, representing $4.74 per square foot over the life of the lease. This compares to the former average straight-lined rent of $3.56 per square foot on a U.S. GAAP straight-line basis and the former cash rent of $3.88 per square foot, representing an increase in the average lease rate of 33.1% on a U.S. GAAP straight-line basis and an increase in the lease rate of 13.4% on a cash basis. The tenant will have a one-time early termination option that may be exercised on December 31, 2025, provided that the tenant gives us six months notice and pays a termination fee equal to three months of rent, plus operating and other costs.
Fiscal 2018 Renewals
In fiscal 2018, approximately 8% of our gross leasable area, representing 16 leases totaling 1,546,637 square feet, is set to expire. As of the date of this Annual Report, 3 of the 16 leases have renewed. The three leases that have renewed thus far represent 298,155 square feet, or 19% of the expiring square footage, and have a weighted average lease term of 6.9 years.
| 24 |
| Property | Tenant | Square Feet | Former U.S. GAAP Straight- Line Rent PSF | Former Cash Rent PSF | Former Lease Expiration | Renewal U.S GAAP Straight- Line Rent PSF | Renewal Initial Cash Rent PSF | Renewal Lease Expiration | Renewal Term (years) | Tenant Improvement Cost PSF over Renewal Term (1) | Leasing Commissions Cost PSF over Renewal Term (1) | |||||||||||||||||||||||||||
| Monaca, PA | Datatel Resources | 80,856 | $ | 2.87 | $ | 2.87 | 11/30/15 | $ | 3.00 | $ | 3.00 | 11/30/17 | 2.0 | $ | -0- | $ | -0- | |||||||||||||||||||||
| Granite City , IL | Anheuser- Busch, Inc. | 184,800 | 4.16 | 4.32 | 5/31/16 | 4.36 | 4.10 | 11/30/21 | 5.5 | 0.21 | 0.13 | |||||||||||||||||||||||||||
| Richmond, VA | United Technologies | 60,000 | 4.99 | 5.24 | 5/31/16 | 5.33 | 5.24 | 11/30/18 | 2.5 | -0- | -0- | |||||||||||||||||||||||||||
| Total | 325,656 | |||||||||||||||||||||||||||||||||||||
| Weighted Average | $ | 3.99 | $ | 4.13 | $ | 4.20 | $ | 4.04 | 4.1 | $ | 0.16 | $ | 0.10 | |||||||||||||||||||||||||
We have incurred or we expect to incur tenant improvement costs of approximately $265,000 and leasing commission costs of approximately $249,000 in connection with these three lease renewals. The table below summarizes the lease terms of the three leases which were renewed. In addition, the table below includes both the tenant improvement costs and the leasing commission costs, which are presented on a per square foot (PSF) basis averaged over the renewal term.
| Property | Tenant | Square Feet | Former U.S. GAAP Straight- Line Rent PSF | Former Cash Rent PSF | Former Lease Expiration | Renewal U.S GAAP Straight- Line Rent PSF | Renewal Initial Cash Rent PSF | Renewal Lease Expiration | Renewal Term (years) | Tenant Improvement Cost PSF over Renewal Term (1) | Leasing Commission Cost PSF over Renewal Term (1) | |||||||||||||||||||||||||||
| Chattanooga, TN | FedEx Express | 60,637 | $ | 5.13 | $ | 5.13 | 10/31/17 | $ | 5.26 | $ | 5.26 | 10/31/22 | 5.0 | $ | 0.43 | $ | 0.11 | |||||||||||||||||||||
| Orlando, FL | FedEx Express | 110,638 | 5.69 | 6.02 | 11/30/17 | 6.02 | 6.02 | 11/30/27 | 10.0 | 0.12 | 0.12 | |||||||||||||||||||||||||||
| St. Joseph, MO | Altec Industries | 126,880 | 2.75 | 2.75 | 2/28/18 | 2.94 | 2.87 | 2/28/23 | 5.0 | 0.01 | 0.13 | |||||||||||||||||||||||||||
| Total | 298,155 | |||||||||||||||||||||||||||||||||||||
| Weighted Average | $ | 4.32 | $ | 4.45 | $ | 4.55 | $ | 4.52 | 6.9 | $ | 0.13 | $ | 0.12 | |||||||||||||||||||||||||
| (1) | Amount calculated based on the total cost divided by the square feet, divided by the renewal term. |
TheThese three lease renewals resultedresult in a weighted average term of 4.16.9 years and a U.S. GAAP straight-line weighted average lease rate of $4.20$4.55 per square foot. The renewed weighted average initial cash rent per square foot is $4.04.$4.52. This compares to the former weighted average rent of $3.99$4.32 per square foot on a U.S. GAAP straight-line basis and the former weighted average cash rent of $4.13$4.45 per square foot, representing an increase in the weighted average lease rate of 5.3% on a U.S. GAAP straight-line basis and a decrease in the weighted average lease rate of 2.2% on a cash basis.
During September 2015, the Company entered into a 5.25 year lease agreement for its previously vacant 148,000 square foot building located in Fayetteville, NC through February 28, 2021. The lease commenced December 1, 2015 and is with Victory Packaging, L.P., a wholly-owned subsidiary of KapStone Paper and Packaging Corporation, a publicly-owned company. The initial annual rent of $469,160, representing $3.17 per square foot, commenced on March 1, 2016 with 2.5% annual increases thereafter.
During October 2015, the Company entered into a 5.25 year lease agreement for its previously vacant 106,507 square foot building located in Winston-Salem, NC through March 31, 2021. The lease is with Style Crest, Inc. and commenced on January 1, 2016. Initial annual rent of $356,798, representing $3.35 per square foot, commenced on April 1, 2016 with 3.0% annual increases thereafter.
Fiscal 2017 renewals
In fiscal 2017, approximately 10% of our gross leasable area, representing thirteen leases totaling 1,539,526 square feet, is set to expire. As of the date of this Annual Report, five of the thirteen leases have renewed. One of the five leases, (which is with FedEx Ground Package System, Inc. for a property located in Ft. Myers, FL), has renewed for only eight months because the tenant plans to move its operations from our 87,500 square foot facility to a newly constructed facility, which is also located in Ft. Myers, FL. Once the construction is complete, the Company is under contract to purchase this new facility, consisting of approximately 213,500 square feet, subject to satisfactory completion of due diligence and other customary closing conditions and requirements. In addition, once the construction is complete, this brand new facility will be leased for 10 years. Excluding the eight month lease renewal at the Ft. Myers, FL location, the four leases that have renewed thus far represent 500,722 square feet, or 33% of the expiring square footage, and have a weighted average lease term of 8.0 years.
The Company has incurred or expects to incur tenant improvement costs of approximately $1,928,000 and leasing costs of approximately $587,000 in connection with four of the five lease renewals. The table below summarizes the lease terms of the five leases which were renewed and includes both the tenant improvement costs and the leasing costs, which are presented on a per square foot (PSF) basis averaged over the renewal term.
Property |
Tenant |
Square Feet | Forme U.S. GAAP Straight- Line Rent PSF | Former Cash Rent PSF | Former Lease Expiration | Renewal U.S GAAP Straight- Line Rent PSF | Renewal Initial Cash Rent PSF | Renewal Lease Expiration | Renewal Term (years) | Tenant Improvement Cost PSF over Renewal Term (1) | Leasing Commissions Cost PSF over Renewal Term (1) | |||||||||||||||||||||||||||
| Ft. Myers, FL | FedEx Ground | 87,500 | $4.95 | $4.95 | 10/31/16 | $4.95 | $4.95 | 6/30/17 | 0.7 | $0.00 | $0.00 | |||||||||||||||||||||||||||
| Elgin, IL | Joseph T. Ryerson | 89,052 | $ | 5.68 | $ | 5.68 | 1/31/17 | $ | 5.68 | $ | 5.68 | 1/31/20 | 3.0 | $ | 0.17 | $ | 0.17 | |||||||||||||||||||||
| Newington, CT | Kellogg Sales Co. | 54,812 | $ | 6.00 | $ | 6.00 | 2/28/17 | $ | 6.00 | $ | 6.00 | 2/29/20 | 3.0 | $ | 0.30 | $ | 0.24 | |||||||||||||||||||||
| Schaumburg, IL | FedEx Express | 73,500 | $ | 6.88 | $ | 7.00 | 3/31/17 | $ | 6.50 | $ | 6.50 | 3/31/27 | 10.0 | $ | 0.24 | $ | 0.13 | |||||||||||||||||||||
| Tolleson, AZ | Western Container | 283,358 | $ | 4.33 | $ | 4.59 | 4/30/17 | $ | 4.78 | $ | 4.33 | 4/30/27 | 10.0 | $ | 0.58 | $ | 0.14 | |||||||||||||||||||||
| Total (2) | 500,722 | |||||||||||||||||||||||||||||||||||||
| Weighted Average (2) | $ | 5.13 | $ | 5.29 | $ | 5.33 | $ | 5.07 | 8.0 | $ | 0.48 | $ | 0.15 | |||||||||||||||||||||||||
Excluding the eight-month lease renewal at the Ft. Myers, FL location, the remaining four lease renewals results in a weighted average term of 8.0 years and a U.S. GAAP straight-line weighted average lease rate of $5.33 per square foot. The renewed weighted average initial cash rent per square foot is $5.07. This compares to the former weighted average rent of $5.13 per square foot on a U.S. GAAP straight-line basis and the former weighted average cash rent of $5.29 per square foot, representing an increase in the weighted average lease rate of 3.9%1.6% on a cash basis.
Two of the remaining leases set to expire during fiscal 2018 are leased to Kellogg Sales Company (Kellogg) at our 65,067 square foot facility located in Kansas City, MO through July 31, 2018 and at our 50,400 square foot facility located in Orangeburg, NY through February 28, 2018. Kellogg has informed us that they will not be renewing their leases at these two properties. We have entered into separate agreements to sell these two properties and anticipate the sales will close during fiscal 2018, subject to customary closing conditions and requirements. We have entered into an agreement to sell the Kansas City, MO property for approximately $4,900,000, which is approximately $1,200,000 above the Company’s U.S. GAAP net book carrying value and we have entered into an agreement to sell the Orangeburg, NY property for approximately $6,170,000, which is approximately $4,700,000 above the Company’s U.S. GAAP net book carrying value. In conjunction with the sale of these two properties, we expect to enter into a lease termination agreement for each property whereby the Company will receive a termination fee from Kellogg in an amount equal to a percentage (95% for the Orangeburg, NY property and 75% for the Kansas City, MO property) of the then remaining rent due under each lease for the period from the closing date for the respective sale transactions (which will be the dates of the respective lease terminations) to the end of the respective lease terms.
Another remaining lease set to expire during fiscal 2018 is leased to Caterpillar Logistics Services, Inc. (Caterpillar) at our 218,120 square foot facility located in Griffin, GA through December 31, 2017. In September 2017, we entered into a three year lease agreement with Rinnai America Corporation through December 31, 2020 for this location. The new lease will commence on January 1, 2018, with initial annual rent of $807,044, representing $3.70 per square foot, with 3.0% annual increases thereafter, resulting in a straight-line annualized rent of $831,000, representing $3.81 per square foot over the life of the lease. This compares to the former U.S. GAAP straight-line and the former cash rent of $5.36 per square foot, representing a decrease in the average lease rate of 28.9% on a U.S. GAAP straight-line basis and a decrease in the weighted average lease rate of 4.2%31.0% on a cash basis.
One of our tenants that leases 80,856 square feet at our 255,658 square foot building located in Monaca (Pittsburg), PA has informed us that they will not be renewing their lease, which is set to expire on November 30, 2017.
The eight remaining nine leases that are still set to expire during fiscal 20172018 are currently under discussion.
| 25 |
On September 30, 2016,2017, the Company had a weighted average lease maturity of 7.47.9 years with weighted average gross annualized rent scheduled to expire each year of 8.0%7.5%.
The following table presents certain information as of September 30, 2016,2017, with respect to the Company’s leases expiring over the future fiscal years ended September 30th:
| Expiration of Fiscal Year Ended September 30th | Property Count | Total Area Expiring (square feet) | Annualized Rent $ | Percent of Gross Annualized Rent % | |||||||||||||
| Vacant (1) | 1 | 59,425 | $ | -0- | 0 | % | |||||||||||
| Shopping Center (2) | 1 | 64,138 | 780,000 | 1 | % | ||||||||||||
| 2017 | 9 | 1,038,804 | 6,161,000 | 7 | % | ||||||||||||
| 2018 | 15 | 1,324,159 | 7,760,000 | 8 | % | ||||||||||||
| 2019 | 9 | 1,370,849 | 7,091,000 | 8 | % | ||||||||||||
| 2020 | 4 | 383,449 | 2,102,000 | 2 | % | ||||||||||||
| 2021 | 7 | 684,692 | 3,335,000 | 4 | % | ||||||||||||
| 2022 | 7 | 1,138,320 | 6,339,000 | 7 | % | ||||||||||||
| 2023 | 10 | 1,302,007 | 8,019,000 | 9 | % | ||||||||||||
| 2024 | 11 | 1,743,587 | 10,579,000 | 12 | % | ||||||||||||
| 2025 | 9 | 2,404,478 | 11,989,000 | 13 | % | ||||||||||||
| 2026 | 5 | 748,154 | 6,182,000 | 7 | % | ||||||||||||
| 2027 | 3 | 395,691 | 2,189,000 | 2 | % | ||||||||||||
| 2028 | 1 | 861,889 | 2,934,000 | 3 | % | ||||||||||||
| 2029 | 2 | 262,613 | 1,513,000 | 2 | % | ||||||||||||
| 2030 | 4 | 1,044,832 | 7,366,000 | 8 | % | ||||||||||||
| 2031 | 2 | 624,685 | 4,800,000 | 5 | % | ||||||||||||
| 2033 | 1 | 558,600 | 2,166,000 | 2 | % | ||||||||||||
| Total (3) | 99 | 16,010,372 | $ | 91,305,000 | 100 | % | |||||||||||
| Expiration of Fiscal Year Ended September 30th | Property Count | Total Area Expiring (square feet) | Annualized Rent | Percent of Gross Annualized Rent | ||||||||||
| Vacant(1) | 2 | 123,770 | $ | 419,000 | 0 | % | ||||||||
| Shopping Center(2) | 1 | 64,220 | 792,000 | 1 | % | |||||||||
| 2018 | 13 | 1,248,482 | 7,605,000 | 7 | % | |||||||||
| 2019 | 9 | 1,370,849 | 7,116,000 | 6 | % | |||||||||
| 2020 | 4 | 383,449 | 2,116,000 | 2 | % | |||||||||
| 2021 | 7 | 827,110 | 3,705,000 | 3 | % | |||||||||
| 2022 | 7 | 1,138,320 | 6,376,000 | 6 | % | |||||||||
| 2023 | 12 | 1,489,524 | 8,719,000 | 8 | % | |||||||||
| 2024 | 12 | 1,853,948 | 11,318,000 | 10 | % | |||||||||
| 2025 | 9 | 2,404,478 | 12,207,000 | 11 | % | |||||||||
| 2026 | 6 | 912,361 | 7,304,000 | 7 | % | |||||||||
| 2027 | 10 | 1,472,852 | 9,078,000 | 8 | % | |||||||||
| 2028 | 3 | 1,068,189 | 4,279,000 | 4 | % | |||||||||
| 2029 | 2 | 262,613 | 1,515,000 | 1 | % | |||||||||
| 2030 | 4 | 1,044,832 | 7,388,000 | 7 | % | |||||||||
| 2031 | 3 | 963,269 | 7,110,000 | 6 | % | |||||||||
| 2032 | 5 | 1,603,155 | 11,815,000 | 11 | % | |||||||||
| 2033 | 1 | 558,600 | 2,186,000 | 2 | % | |||||||||
| Total(3) | 108 | 18,790,021 | $ | 111,048,000 | 100 | % | ||||||||
| (1) | “Vacant” represents | |
| (2) | “Shopping Center” represents a multi-tenanted property which has lease expirations ranging from month-to-month to 2029. |
| (3) | Included in 2018 is Datatel Resources and included in 2025 is NF&M International, which both occupy one property and therefore are counted as one property in the property count total. Included in |
None.
ITEM 4 – MINE SAFETY DISCLOSURES
None.
| 26 |
ITEM 5 - MARKET FOR REGISTRANT’S COMMON EQUITY, RELATED STOCKHOLDER MATTERS AND ISSUER PURCHASES OF EQUITY SECURITIES
Market Information
Since June 1, 2010, the common stock of Monmouth Real Estate Investment Corporation, $0.01 par value per share (common stock), has been traded on the New York Stock Exchange (NYSE), under the symbol “MNR”. Previously, the common stock was traded on the NASDAQ Global Select Market. The per share range of high and low market prices and distributions paid to common shareholders during each fiscal quarter of the last two fiscal years ended September 30th were as follows:
| Fiscal 2016 | Fiscal 2015 | |||||||||||||||||||||||||||||||||||||||||||||||||||
| Market Price | Market Price | |||||||||||||||||||||||||||||||||||||||||||||||||||
| Fiscal 2017 | Fiscal 2016 | |||||||||||||||||||||||||||||||||||||||||||||||||||
| Market Price | Market Price | |||||||||||||||||||||||||||||||||||||||||||||||||||
| Fiscal Qtr. | High | Low | Distrib. | Fiscal Qtr. | High | Low | Distrib. | High | Low | Distrib. | Fiscal Qtr. | High | Low | Distrib. | ||||||||||||||||||||||||||||||||||||||
| First | $ | 10.72 | $ | 9.50 | $ | 0.16 | First | $ | 11.62 | $ | 10.10 | $ | 0.15 | $ | 15.36 | $ | 12.89 | $ | 0.16 | First | $ | 10.72 | $ | 9.50 | $ | 0.16 | ||||||||||||||||||||||||||
| Second | 12.03 | 9.63 | 0.16 | Second | 12.07 | 10.64 | 0.15 | 15.35 | 13.68 | 0.16 | Second | 12.03 | 9.63 | 0.16 | ||||||||||||||||||||||||||||||||||||||
| Third | 13.26 | 11.22 | 0.16 | Third | 11.30 | 9.30 | 0.15 | 15.34 | 13.95 | 0.16 | Third | 13.26 | 11.22 | 0.16 | ||||||||||||||||||||||||||||||||||||||
| Fourth | 14.92 | 13.15 | 0.16 | Fourth | 10.09 | 9.02 | 0.15 | 16.56 | 14.44 | 0.16 | Fourth | 14.92 | 13.15 | 0.16 | ||||||||||||||||||||||||||||||||||||||
| $ | 0.64 | $ | 0.60 | $ | 0.64 | $ | 0.64 | |||||||||||||||||||||||||||||||||||||||||||||
On November 15, 2016,2017, the closing price of our common stock was $13.24.$17.07 per share.
Shareholder Information
As of November 15, 2016, there were 1,3592017, 1,317 shareholders of record who held shares of our common stock of the Company.stock.
Distributions and Dividends
On October 1, 2015,2, 2017, the Company’s Board of Directors approved a 6.7%6.25% increase in the Company’s quarterly common stock dividend, raising it to $0.16$0.17 per share from $0.15$0.16 per share. On October 3, 2016,2, 2017, the Company’s Board of Directors declaredapproved a cash dividend of $0.16$0.17 per share, to be paid on December 15, 2016,2017, to shareholders of record at the close of business on November 15, 2016.2017. This represents an annualized dividend rate of $0.64$0.68 per share. The Company has maintained or increased its cash dividend for twenty-five26 consecutive years. The Company paid the distributions from cash flows from operations. The Company’s common stock dividend policy is dependent upon the Company’s earnings, capital requirements, financial condition, availability and cost of bank financing and other factors considered relevant by the Board of Directors. It is the Company’s intention to continue making comparable quarterly distributions in the future and to grow its distributions over time.
Recent Sales of Unregistered Securities
None.
Purchases of Equity Securities
On January 19, 2016,17, 2017, the Board of Directors reaffirmed its Share Repurchase Program (the Repurchase(Repurchase Program) that authorizes the Company to purchase up to $10,000,000 in the aggregate of the Company’s common stock. The Repurchase Program was originally created on March 3, 2009 and is intended to be implemented through purchases made from time to time using a variety of methods, which may include open market purchases, privately negotiated transactions or block trades, or by any combination of such methods, in accordance with applicable insider trading and other securities laws and regulations. The size, scope and timing of any purchases will be based on business, market and other conditions and factors, including price, regulatory and contractual requirements or consents, and capital availability. The Repurchase Program does not require the Company to acquire any particular amount of common stock, and the program may be suspended, modified or discontinued at any time at the Company’s discretion without prior notice. As ofDuring the fiscal year ended September 30, 2016,2017, the Company did not reacquire any of its shares of Common Stock.common stock. The maximum dollar value that may be purchased under the Repurchase Program as of September 30, 20162017 is $10,000,000.
| 27 |
Equity Compensation Plan Information
The Company has a Stock OptionOn March 13, 2017, upon recommendation of the Compensation Committee of the Company’s Board of Directors, the Board approved the Amended and StockRestated 2007 Incentive Award Plan adopted in(the Plan), conditioned upon shareholder approval. At the Company’s Annual Meeting held on May 18, 2017, the Company’s common shareholders approved the Plan. The Plan constitutes an amendment and restatement of the 2007 and amended and restated in 2010 (thePlan, extends the term of the 2007 Plan) authorizing the grant to officers and key employees of options to purchase up to 1,500,000Plan for an additional 10 years, adds 1,600,000 shares of common stock including up to 100,000 sharesthe share reserve, expands the types of restricted stock awards in any one fiscal year.available for grant under the Plan and makes other improvements to the 2007 Plan. As of September 30, 2016,2017, there were 444,8781,753,042 shares available for grant as stock options, or restricted stock and other equity-based awards under the 2007 Plan. During fiscal 2016,2017, options to purchase 280,000 shares were granted with a weighted average exercise price of $14.43 and options to purchase 65,000 shares were granted withexercised at an exercise price of $10.37 and options to purchase 245,000 shares were exercised at a weighted average exercise price of $7.69$7.22 per share for total proceeds of $1,883,300.$469,300. In addition, during fiscal 2016, 40,0002017, 11,000 shares of restricted common stock were granted with a fair value on the grant date of $13.64$15.92 per share. In addition, during fiscal 2017, 836 unrestricted shares of common stock were granted with a fair value on the grant date of $15.92 per share. See Note 9 in the Notes to the Consolidated Financial Statements included in this Form 10-K for a description of the plan. See Item 12 – Security Ownership of Certain Beneficial Owners and Management and Related Stockholder Matters for a table of beneficial ownership of the Company’s common stock.
The following table summarizes information, as of September 30, 2016,2017, relating to the equity compensation plan of the Company (including individual compensation arrangements) pursuant to which equity securities of the Company are authorized for issuance:
| Number of Securities to be Issued Upon Exercise of Outstanding Options, Warrants and Rights | Weighted-Average Exercise Price of Outstanding Options, Warrants and Rights | Number of Securities Remaining Available for Future Issuance Under Equity Compensation Plan (excluding Securities reflected in column (a)) | Number of Securities to be Issued Upon Exercise of Outstanding Options, Warrants and Rights | Weighted-Average Exercise Price of Outstanding Options, Warrants and Rights | Number of Securities Remaining Available for Future Issuance Under Equity Compensation Plan (excluding Securities reflected in column (a)) | |||||||||||||||||||
| Plan Category | (a) | (b) | (c) | (a) | (b) | (c) | ||||||||||||||||||
| Equity Compensation Plan Approved by Security Holders | 455,000 | $ | 9.46 | 444,878 | 670,000 | $ | 11.75 | 1,753,042 | ||||||||||||||||
| Equity Compensation Plan not Approved by Security Holders | N/A | N/A | N/A | - | - | - | ||||||||||||||||||
| Total | 455,000 | $ | 9.46 | 444,878 | 670,000 | $ | 11.75 | 1,753,042 | ||||||||||||||||
| 28 |
Comparative Stock Performance
The following line graph compares the total return of the Company’s common stock for the last five fiscal years to the FTSE NAREIT Composite Index (US), published by the National Association of Real Estate Investment Trusts (NAREIT), and the S&P 500 Index for the same period. The graph assumes a $100 investment in our common stock and in each of the indexes listed below on September 30, 20112012 and the reinvestment of all dividends. The total return reflects stock price appreciation and dividend reinvestment for all three comparative indices. The information has been obtained from sources believed to be reliable, but neither its accuracy nor its completeness is guaranteed. Our stock performance shown in the graph below is not indicative of future stock performance.
| 29 |
ITEM 6 – SELECTED FINANCIAL DATA
The following table sets forth selected financial and other information foron the Company for the periods and as of the dates indicated. This table should be read in conjunction with management’s discussion and analysis of financial condition and results of operations and all of the financial statements and notes thereto included elsewhere herein.
| September 30, | ||||||||||||||||||||
| 2016 | 2015 | 2014 | 2013 | 2012 | ||||||||||||||||
| OPERATING DATA: | ||||||||||||||||||||
| Rental and Reimbursement Revenue | $ | 94,916,110 | $ | 77,775,497 | $ | 64,672,341 | $ | 54,607,086 | $ | 50,368,931 | ||||||||||
| Real Estate Taxes and Operating Expenses | (14,729,300 | ) | (12,490,019 | ) | (11,317,479 | ) | (9,228,610 | ) | (8,832,027 | ) | ||||||||||
| Net Operating Income - NOI | 80,186,810 | 65,285,478 | 53,354,862 | 45,378,476 | 41,536,904 | |||||||||||||||
| Lease Termination Income | -0- | 238,625 | 1,182,890 | 690,730 | 3,222,283 | |||||||||||||||
| Gain on Sale of Securities Transactions, net | 4,398,599 | 805,513 | 2,166,766 | 7,133,252 | 6,044,065 | |||||||||||||||
| Dividend and Interest Income | 5,616,392 | 3,723,867 | 3,882,597 | 3,885,920 | 3,358,674 | |||||||||||||||
| General & Administrative Expenses | (7,936,124 | ) | (6,305,928 | ) | (5,709,937 | ) | (4,982,945 | ) | (5,609,558 | ) | ||||||||||
| Acquisition Costs | (730,441 | ) | (1,546,088 | ) | (481,880 | ) | (514,699 | ) | (667,799 | ) | ||||||||||
| Interest Expense | (21,836,811 | ) | (18,558,150 | ) | (16,104,678 | ) | (14,956,954 | ) | (15,352,499 | ) | ||||||||||
| Depreciation & Amortization Expense | (27,203,918 | ) | (23,058,744 | ) | (18,445,326 | ) | (15,530,094 | ) | (13,832,305 | ) | ||||||||||
| Income from Continuing Operations | 32,494,507 | 20,584,573 | 19,845,294 | 21,103,686 | 18,699,765 | |||||||||||||||
| Gain on Sale of Real Estate Investment | -0- | 5,021,242 | -0- | -0- | -0- | |||||||||||||||
| Income (loss) from Discontinued Operations | -0- | -0- | -0- | 291,560 | (15,270 | ) | ||||||||||||||
| Net Income | 32,494,507 | 25,605,815 | 19,845,294 | 21,395,246 | 18,684,495 | |||||||||||||||
| Preferred Dividends | (9,020,470 | ) | (8,607,032 | ) | (8,607,032 | ) | (8,607,032 | ) | (5,513,126 | ) | ||||||||||
| Redemption of Preferred Stock | (2,942,149 | ) | -0- | -0- | -0- | -0- | ||||||||||||||
| Net Income Attributable to Common Shareholders | $ | 20,531,888 | $ | 16,998,783 | $ | 11,238,262 | $ | 12,788,214 | $ | 13,171,369 | ||||||||||
| Income from Continuing Operations Per Share | ||||||||||||||||||||
| Basic | $ | 0.50 | $ | 0.43 | $ | 0.40 | $ | 0.49 | $ | 0.47 | ||||||||||
| Diluted | 0.50 | 0.43 | 0.40 | 0.49 | 0.47 | |||||||||||||||
| Net Income Attributable to Common Shareholders Per Share | ||||||||||||||||||||
| Basic | 0.31 | 0.29 | 0.23 | 0.30 | 0.33 | |||||||||||||||
| Diluted | 0.31 | 0.29 | 0.23 | 0.30 | 0.33 | |||||||||||||||
| BALANCE SHEET DATA: | ||||||||||||||||||||
| Total Assets | $ | 1,229,758,028 | $ | 915,991,942 | $ | 743,756,700 | $ | 617,240,866 | $ | 574,507,702 | ||||||||||
| Real Estate Investments, Net | 1,022,483,326 | 816,111,266 | 636,710,590 | 536,770,636 | 467,865,198 | |||||||||||||||
| Mortgage Notes Payable | 483,748,153 | 373,991,174 | 287,796,006 | 250,093,382 | 237,943,911 | |||||||||||||||
| Loans Payable | 80,790,684 | 85,041,386 | 25,200,000 | 22,200,000 | 5,200,000 | |||||||||||||||
| Preferred Stock Called for Redemption | 53,493,750 | -0- | -0- | -0- | -0- | |||||||||||||||
| 8% Subordinated Convertible Debentures | -0- | -0- | -0- | -0- | 8,615,000 | |||||||||||||||
| 7.625% Series A Cumulative Redeemable Preferred Stock | -0- | 53,493,750 | 53,493,750 | 53,493,750 | 53,493,750 | |||||||||||||||
| 7.875% Series B Cumulative Redeemable Preferred Stock | 57,500,000 | 57,500,000 | 57,500,000 | 57,500,000 | 57,500,000 | |||||||||||||||
| 6.125% Series C Cumulative Redeemable Preferred Stock | 135,000,000 | -0- | -0- | -0- | -0- | |||||||||||||||
| Total Shareholders’ Equity | 597,858,098 | 446,010,640 | 420,631,082 | 335,914,971 | 315,687,139 | |||||||||||||||
| CASH FLOW DATA: | ||||||||||||||||||||
| Net Cash Provided (Used) By: | ||||||||||||||||||||
| Operating Activities | $ | 54,699,500 | $ | 38,062,285 | $ | 34,856,285 | $ | 27,463,529 | $ | 26,808,821 | ||||||||||
| Investing Activities | (227,845,089 | ) | (194,469,735 | ) | (131,809,697 | ) | (60,373,084 | ) | (80,640,038 | ) | ||||||||||
| Financing Activities | 256,821,188 | 148,006,698 | 105,023,561 | 20,663,209 | 72,105,267 | |||||||||||||||
| September 30, | ||||||||||||||||||||
| 2017 | 2016 | 2015 | 2014 | 2013 | ||||||||||||||||
| OPERATING DATA: | ||||||||||||||||||||
| Rental and Reimbursement Revenue | $ | 113,545,982 | $ | 94,916,110 | $ | 77,775,497 | $ | 64,672,341 | $ | 54,607,086 | ||||||||||
| Real Estate Taxes and Operating Expenses | (17,315,233 | ) | (14,729,300 | ) | (12,490,019 | ) | (11,317,479 | ) | (9,228,610 | ) | ||||||||||
| Net Operating Income - NOI | 96,230,749 | 80,186,810 | 65,285,478 | 53,354,862 | 45,378,476 | |||||||||||||||
| Lease Termination Income | -0- | -0- | 238,625 | 1,182,890 | 690,730 | |||||||||||||||
| Gain on Sale of Securities Transactions, net | 2,311,714 | 4,398,599 | 805,513 | 2,166,766 | 7,133,252 | |||||||||||||||
| Dividend and Interest Income | 6,930,564 | 5,616,392 | 3,723,867 | 3,882,597 | 3,885,920 | |||||||||||||||
| General and Administrative Expenses | (7,809,546 | ) | (7,936,124 | ) | (6,305,928 | ) | (5,709,937 | ) | (4,982,945 | ) | ||||||||||
| Acquisition Costs | (178,526 | ) | (730,441 | ) | (1,546,088 | ) | (481,880 | ) | (514,699 | ) | ||||||||||
| Interest Expense(1) | (25,754,121 | ) | (22,953,049 | ) | (19,844,166 | ) | (16,830,423 | ) | (15,604,066 | ) | ||||||||||
| Depreciation & Amortization Expense | (31,459,749 | ) | (26,087,680 | ) | (21,772,728 | ) | (17,719,581 | ) | (14,882,982 | ) | ||||||||||
| Income from Continuing Operations | 40,271,085 | 32,494,507 | 20,584,573 | 19,845,294 | 21,103,686 | |||||||||||||||
| Gain on Sale of Real Estate Investment | -0- | -0- | 5,021,242 | -0- | -0- | |||||||||||||||
| Income from Discontinued Operations | -0- | -0- | -0- | -0- | 291,560 | |||||||||||||||
| Net Income | 40,271,085 | 32,494,507 | 25,605,815 | 19,845,294 | 21,395,246 | |||||||||||||||
| Preferred Dividends | (14,861,686 | ) | (9,020,470 | ) | (8,607,032 | ) | (8,607,032 | ) | (8,607,032 | ) | ||||||||||
| Redemption of Preferred Stock | (2,467,165 | ) | (2,942,149 | ) | -0- | -0- | -0- | |||||||||||||
| Net Income Attributable to Common Shareholders | $ | 22,942,234 | $ | 20,531,888 | $ | 16,998,783 | $ | 11,238,262 | $ | 12,788,214 | ||||||||||
| Net Income Per Share Basic | $ | 0.56 | $ | 0.50 | $ | 0.43 | $ | 0.40 | $ | 0.49 | ||||||||||
| Diluted | 0.56 | 0.50 | 0.43 | 0.40 | 0.49 | |||||||||||||||
| Net Income Attributable to Common Shareholders Per Share | ||||||||||||||||||||
| Basic | 0.32 | 0.31 | 0.29 | 0.23 | 0.30 | |||||||||||||||
| Diluted | 0.32 | 0.31 | 0.29 | 0.23 | 0.30 | |||||||||||||||
| (1) Amortization expense related to Financing Costs are included in “Interest Expense”. |
| BALANCE SHEET DATA: | ||||||||||||||||||||
| Total Assets | $ | 1,443,037,755 | $ | 1,223,485,885 | $ | 910,905,721 | $ | 739,843,222 | $ | 613,801,975 | ||||||||||
| Real Estate Investments, Net | 1,266,390,733 | 1,013,103,314 | 806,465,906 | 627,068,988 | 526,776,988 | |||||||||||||||
| Fixed Rate Mortgage Notes Payable, net | 591,364,371 | 477,476,010 | 368,904,953 | 283,882,528 | 246,654,491 | |||||||||||||||
| Loans Payable | 120,091,417 | 80,790,684 | 85,041,386 | 25,200,000 | 22,200,000 | |||||||||||||||
| Preferred Stock Called for Redemption | -0- | 53,493,750 | -0- | -0- | -0- | |||||||||||||||
| 7.625% Series A Cumulative Redeemable Preferred Stock | -0- | -0- | 53,493,750 | 53,493,750 | 53,493,750 | |||||||||||||||
| 7.875% Series B Cumulative Redeemable Preferred Stock | -0- | 57,500,000 | 57,500,000 | 57,500,000 | 57,500,000 | |||||||||||||||
| 6.125% Series C Cumulative Redeemable Preferred Stock | 245,986,125 | 135,000,000 | -0- | -0- | -0- | |||||||||||||||
| Total Shareholders’ Equity | 712,865,696 | 597,858,098 | 446,010,640 | 420,631,082 | 335,914,971 | |||||||||||||||
| CASH FLOW DATA: | ||||||||||||||||||||
| Net Cash Provided (Used) By: | ||||||||||||||||||||
| Operating Activities | $ | 73,867,866 | $ | 54,699,500 | $ | 38,062,285 | $ | 34,856,285 | $ | 27,463,529 | ||||||||||
| Investing Activities | (339,071,013 | ) | (227,845,089 | ) | (194,469,735 | ) | (131,809,697 | ) | (60,373,084 | ) | ||||||||||
| Financing Activities | 179,679,685 | 256,821,188 | 148,006,698 | 105,023,561 | 20,663,209 |
| September 30, | September 30, | |||||||||||||||||||||||||||||||||||||||
| OTHER INFORMATION: | 2016 | 2015 | 2014 | 2013 | 2012 | 2017 | 2016 | 2015 | 2014 | 2013 | ||||||||||||||||||||||||||||||
| Average Number of Common Shares Outstanding | ||||||||||||||||||||||||||||||||||||||||
| Basic | 65,468,564 | 59,085,888 | 49,829,924 | 42,275,555 | 39,660,692 | 72,114,078 | 65,468,564 | 59,085,888 | 49,829,924 | 42,275,555 | ||||||||||||||||||||||||||||||
| Diluted | 65,558,284 | 59,201,296 | 49,925,036 | 42,432,354 | 39,819,621 | 72,249,691 | 65,558,284 | 59,201,296 | 49,925,036 | 42,432,354 | ||||||||||||||||||||||||||||||
| Funds From Operations* | $ | 46,598,043 | $ | 33,730,447 | $ | 29,000,443 | $ | 27,338,245 | $ | 26,459,005 | $ | 54,442,611 | $ | 46,598,043 | $ | 33,730,447 | $ | 29,000,443 | $ | 27,338,245 | ||||||||||||||||||||
| Core Funds From Operations* | $ | 50,270,633 | $ | 35,276,535 | $ | 29,482,323 | $ | 27,852,944 | $ | 27,126,804 | $ | 57,088,302 | $ | 50,270,633 | $ | 35,276,535 | $ | 29,482,323 | $ | 27,852,944 | ||||||||||||||||||||
| Adjusted Funds From Operations* | $ | 45,865,343 | $ | 33,976,958 | $ | 25,843,710 | $ | 19,521,972 | $ | 17,685,624 | $ | 54,880,438 | $ | 45,865,343 | $ | 33,976,958 | $ | 25,843,710 | $ | 19,521,972 | ||||||||||||||||||||
| Cash Dividends per Common Share | $ | 0.64 | $ | 0.60 | $ | 0.60 | $ | 0.60 | $ | 0.60 | $ | 0.64 | $ | 0.64 | $ | 0.60 | $ | 0.60 | $ | 0.60 | ||||||||||||||||||||
| 30 |
* We assess and measure our overall operating results based upon an industry performance measure referred to as Funds From Operations (FFO), which management believes is a useful indicator of our operating performance. FFO is used by industry analysts and investors as a supplemental operating performance measure of a REIT. FFO, as defined by the National Association of Real Estate Investment Trusts (NAREIT), represents net income (loss) attributableNet Income Attributable to common shareholders,Common Shareholders, as defined by accounting principles generally accepted in the United States of America (U.S. GAAP), excluding extraordinary items, as defined under U.S. GAAP, gains or losses from sales of previously depreciated real estate assets, impairment charges related to depreciable real estate assets, plus certain non-cash items such as real estate asset depreciation and amortization. NAREIT created FFO as a non-U.S. GAAP supplemental measure of REIT operating performance. We define Core Funds From Operations (Core FFO) as FFO, excluding acquisition costs and costs associated with the Redemption of Preferred Stock. We define Adjusted Funds from Operations (AFFO) as Core FFO, excluding stock based compensation expense, depreciation of corporate office tenant improvements, amortization of deferred financing costs, lease termination income, net gain or loss on sale of securities transactions, effect of non-cash U.S. GAAP straight-line rent adjustments, non-recurring other expenses and less recurring capital expenditures. We define recurring capital expenditures as all capital expenditures, excluding capital expenditures related to expansions at our current locations or capital expenditures that are incurred in conjunction with obtaining a new lease or a lease renewal. We believe that, as widely recognized measures of performance used by other REITs, FFO, Core FFO and AFFO may be considered by investors as supplemental measures to compare our operating performance to those of other REITs. FFO, Core FFO and AFFO exclude historical cost depreciation as an expense and may facilitate the comparison of REITs which have a different cost basis. However, other REITs may use different methodologies to calculate FFO, Core FFO and AFFO and, accordingly, our FFO, Core FFO and AFFO may not be comparable to all other REITs. The items excluded from FFO, Core FFO and AFFO are significant components in understanding the Company’s financial performance.
FFO, Core FFO and AFFO (i) do not represent Cash Flow from Operations as defined by U.S. GAAP; (ii) should not be considered as an alternative to Net Income or Net Income Attributable to Common Shareholders as a measure of operating performance or to Cash Flows from Operating, Investing and Financing Activities; and (iii) are not an alternative to cash flowCash Flows from Operating, Investing and Financing Activities as a measure of liquidity. FFO, Core FFO and AFFO, as calculated by the Company, may not be comparable to similarly titled measures reported by other REITs.
The following is a reconciliation of the Company’s U.S. GAAP Net Income to the Company’s FFO, Core FFO and AFFO for the fiscal years ended September 30th:
| 2016 | 2015 | 2014 | 2013 | 2012 | 2017 | 2016 | 2015 | 2014 | 2013 | |||||||||||||||||||||||||||||||
| Net Income Attributable to Common Shareholders | $ | 20,531,888 | $ | 16,998,783 | $ | 11,238,262 | $ | 12,788,214 | $ | 13,171,369 | $ | 22,942,234 | $ | 20,531,888 | $ | 16,998,783 | $ | 11,238,262 | $ | 12,788,214 | ||||||||||||||||||||
| Plus: Depreciation Expense (including Discontinued Operations & excluding Corporate Office) | 23,931,530 | 19,625,748 | 15,908,769 | 12,877,385 | 11,471,070 | 29,478,322 | 23,931,530 | 19,625,748 | 15,908,769 | 12,877,385 | ||||||||||||||||||||||||||||||
| Plus: Amortization of Intangible Assets | 1,178,744 | 1,370,654 | 1,347,936 | 1,543,298 | 1,477,356 | 1,071,719 | 1,178,744 | 1,370,654 | 1,347,936 | 1,543,298 | ||||||||||||||||||||||||||||||
| Plus: Amortization of Capitalized Lease Costs | 955,881 | 756,504 | 505,476 | 475,142 | 330,990 | 855,000 | 955,881 | 756,504 | 505,476 | 475,142 | ||||||||||||||||||||||||||||||
| (Gain) Loss on Sale of Depreciable Assets | -0- | (5,021,242 | ) | -0- | (345,794 | ) | 8,220 | |||||||||||||||||||||||||||||||||
| (Gain) Loss on Sale of Real Estate Investment | 95,336 | -0- | (5,021,242 | ) | -0- | (345,794 | ) | |||||||||||||||||||||||||||||||||
| FFO Attributable to Common Shareholders | 46,598,043 | 33,730,447 | 29,000,443 | 27,338,245 | 26,459,005 | 54,442,611 | 46,598,043 | 33,730,447 | 29,000,443 | 27,338,245 | ||||||||||||||||||||||||||||||
| Plus: Acquisition Costs | 730,441 | 1,546,088 | 481,880 | 514,699 | 667,799 | 178,526 | 730,441 | 1,546,088 | 481,880 | 514,699 | ||||||||||||||||||||||||||||||
| Plus: Redemption of Preferred Stock | 2,942,149 | -0- | -0- | -0- | -0- | 2,467,165 | 2,942,149 | -0- | -0- | -0- | ||||||||||||||||||||||||||||||
| Core FFO Attributable to Common Shareholders | 50,270,633 | 35,276,535 | 29,482,323 | 27,852,944 | 27,126,804 | 57,088,302 | 50,270,633 | 35,276,535 | 29,482,323 | 27,852,944 | ||||||||||||||||||||||||||||||
| Plus: Stock Compensation Expense | 926,465 | 448,895 | 347,002 | 329,148 | 593,811 | 624,706 | 926,465 | 448,895 | 347,002 | 329,148 | ||||||||||||||||||||||||||||||
| Plus: Depreciation of Corporate Office Tenant Improvements | 123,492 | 79,572 | -0- | -0- | -0- | |||||||||||||||||||||||||||||||||||
| Plus: Depreciation of Corporate Office Capitalized Costs | 156,676 | 123,492 | 79,572 | -0- | -0- | |||||||||||||||||||||||||||||||||||
| Plus: Amortization of Financing Costs | 1,116,238 | 1,286,016 | 725,745 | 647,112 | 630,969 | 1,234,259 | 1,116,238 | 1,286,016 | 725,745 | 647,112 | ||||||||||||||||||||||||||||||
| Plus: Non-recurring Other Expense (1) | 500,000 | -0- | -0- | -0- | -0- | -0- | 500,000 | -0- | -0- | -0- | ||||||||||||||||||||||||||||||
| Less: Lease Termination Income | -0- | (238,625 | ) | (1,182,890 | ) | (690,730 | ) | (3,222,283 | ) | -0- | -0- | (238,625 | ) | (1,182,890 | ) | (690,730 | ) | |||||||||||||||||||||||
| Less: Gain on Sale of Securities Transactions, net | (4,398,599 | ) | (805,513 | ) | (2,166,766 | ) | (7,133,252 | ) | (6,044,065 | ) | (2,311,714 | ) | (4,398,599 | ) | (805,513 | ) | (2,166,766 | ) | (7,133,252 | ) | ||||||||||||||||||||
| Less: U.S. GAAP Straight-line Rent Adjustment | (1,709,821 | ) | (1,446,264 | ) | (600,745 | ) | (943,785 | ) | (553,474 | ) | ||||||||||||||||||||||||||||||
| Less: Effect of non-cash U.S. GAAP Straight-line Rent Adjustment | (1,027,927 | ) | (1,709,821 | ) | (1,446,264 | ) | (600,745 | ) | (943,785 | ) | ||||||||||||||||||||||||||||||
| Less: Recurring Capital Expenditures | (963,065 | ) | (623,658 | ) | (760,959 | ) | (539,465 | ) | (846,138 | ) | (883,864 | ) | (963,065 | ) | (623,658 | ) | (760,959 | ) | (539,465 | ) | ||||||||||||||||||||
| AFFO Attributable to Common Shareholders | $ | 45,865,343 | $ | 33,976,958 | $ | 25,843,710 | $ | 19,521,972 | $ | 17,685,624 | $ | 54,880,438 | $ | 45,865,343 | $ | 33,976,958 | $ | 25,843,710 | $ | 19,521,972 | ||||||||||||||||||||
| (1) | Consists of one-time payroll |
.
| 31 |
ITEM 7 - MANAGEMENT’S DISCUSSION AND ANALYSIS OF FINANCIAL CONDITION AND RESULTS OF OPERATION
Cautionary Statement Regarding Forward-Looking Statements
Statements contained in this Form 10-K that are not historical facts are forward-looking statements within the meaning of Section 27A of the Securities Act of 1933, as amended (the “Securities Act”)(Securities Act), and Section 21E of the Securities Exchange Act of 1934, as amended (the “Exchange Act”)(Exchange Act). Forward-looking statements provide the Company’s current expectations or forecasts of future events. Forward-looking statements include statements about the Company’s expectations, beliefs, intentions, plans, objectives, goals, strategies, future events, performance and underlying assumptions and other statements that are not historical facts. Forward-looking statements can be identified by their use of forward-looking words, such as “may,” “will,” “anticipate,” “expect,” “believe,” “intend,” “plan,” “should,” “seek” or comparable terms, or the negative use of those words, but the absence of these words does not necessarily mean that a statement is not forward-looking.
The forward-looking statements are based on the Company’s beliefs, assumptions and expectations of its future performance, taking into account all information currently available to the Company. Forward-looking statements are not predictions of future events. These beliefs, assumptions and expectations can change as a result of many possible events or factors, not all of which are known to the Company. Some of these factors are described below and under the headings “Business”, “Risk Factors” and “Management’s Discussion and Analysis of Financial Condition and Results of Operations”. These and other risks, uncertainties and factors could cause the Company’s actual results to differ materially from those included in any forward-looking statements the Company makes. Any forward-looking statement speaks only as of the date on which it is made. New risks and uncertainties arise over time, and it is not possible for the Company to predict those events or how they may affect the Company. Except as required by law, the Company is not obligated to, and does not intend to, update or revise any forward-looking statements, whether as a result of new information, future events or otherwise. Important factors that could cause actual results to differ materially from the Company’s expectations include, among others:
| ● | the ability of the Company’s tenants to make payments under their respective | |
| ● | the Company’s reliance on certain major | |
| ● | the Company’s ability to re-lease properties that are currently vacant or that become vacant; | |
| ● | the Company’s ability to obtain suitable tenants for its properties; | |
| ● | changes in real estate market conditions, economic conditions in the industrial sector and the market in which the Company’s properties are located and general economic conditions; | |
| ● | the inherent risks associated with owning real estate, including local real estate market conditions, governing laws and regulations and illiquidity of real estate investments; | |
| ● | the Company’s ability to acquire, finance and sell properties on attractive terms; | |
| ● | the Company’s ability to repay debt financing obligations; | |
| ● | the Company’s ability to refinance amounts outstanding under its mortgages and credit facilities at maturity on terms favorable to us, or at all; | |
| ● | the loss of any member of the Company’s management team; | |
| ● | the Company’s ability to comply with debt covenants; | |
| ● | the Company’s ability to integrate acquired properties and operations into existing operations; | |
| ● | continued availability of proceeds from issuances of the Company’s debt or equity securities; | |
| ● | the availability of other debt and equity financing alternatives; | |
| ● | market conditions affecting the Company’s investment in marketable securities of other REIT’s; |
| 32 |
| ● | changes in interest rates under the Company’s current credit facility and under any additional variable rate debt arrangements that the Company may enter into in the future; | |
| ● | the Company’s ability to successfully implement the Company’s selective acquisition strategy; | |
| ● | the Company’s ability to maintain internal controls and procedures to ensure all transactions are accounted for properly, all relevant disclosures and filings are timely made in accordance with all rules and regulations, and any potential fraud or embezzlement is thwarted or detected; | |
| ● | changes in federal or state tax rules or regulations that could have adverse tax consequences; | |
| ● | declines in the market prices of the Company’s investment securities; and | |
| ● | the Company’s ability to qualify as a REIT for federal income tax purposes. |
You should not place undue reliance on these forward-looking statements, as events described or implied in such statements may not occur. The Company undertakes no obligation to update or revise any forward-looking statements as a result of new information, future events or otherwise.
The following discussion should be read in conjunction with the financial statements and notes thereto included elsewhere herein.
Overview
Monmouth Real Estate Investment Corporation, founded in 1968, is one of the oldest public equity REITs in the U.S. The Company is a self-administered and self-managed REIT. The CompanyREIT that seeks to invest in well-located, modern, single tenant, industrial buildings, leased primarily to investment-grade tenants or their subsidiaries on long-term net leases. At September 30, 2016,2017, the Company held investments in ninety-nine108 properties totaling approximately 16,010,00018,790,000 square feet. Total real estate investments were $1,171,313,495$1,439,121,006 at September 30, 2016.2017. These properties are located in thirty30 states: Alabama, Arizona, Colorado, Connecticut, Florida, Georgia, Illinois, Indiana, Iowa, Kansas, Kentucky, Louisiana, Maryland, Michigan, Minnesota, Mississippi, Missouri, Nebraska, New Jersey, New York, North Carolina, Ohio, Oklahoma, Pennsylvania, South Carolina, Tennessee, Texas, Virginia, Washington and Wisconsin. All of these properties are wholly-owned, with the exception of an industrial property in New Jersey, in which the Company owns a 51% controlling equity interest, and thea shopping center in New Jersey, in which the Company holdsowns a 67% controlling equity interest.
The Company’s weighted-average lease expiration was 7.47.9 and 7.27.4 years as of September 30, 20162017 and 2015,2016, respectively, and its average annualized rent per occupied square foot as of September 30, 2017 and 2016 was $5.93 and 2015 was $5.72, and $5.48, respectively. At September 30, 20162017 and 2015,2016, the Company’s occupancy was 99.6%99.3% and 97.7%99.6%, respectively.
Subsequent to fiscal yearend, on October 27, 2016,November 1, 2017, the Company soldleased its onlypreviously vacant building36,270 square foot facility located in Urbandale (Des Moines), IA for $4,272,00010.2 years which increased our current occupancy rate to 100.0%99.5%. DuringThe Company is under contract to sell its only currently vacant building located in Ft. Myers, FL, for $6,400,000, which is approximately $2,400,000 above the Company’s U.S. GAAP net book carrying value. We anticipate closing the sale of this building during fiscal 2016, the Company acquired eight industrial properties totaling approximately 1,830,000 square feet for approximately $210,747,000.2018, subject to customary closing conditions and requirements.
The Company has a concentration of properties leased to FedEx Corporation (FDX). As of September 30, 2016,2017, the Company had approximately 16,010,00018,790,000 square feet of property, of which approximately 7,584,0009,391,000 square feet, or 47%50%, consisting of fifty-three58 separate stand-alone leases, were leased to FDX and its subsidiaries (6%(7% to FDX and 41%43% to FDX subsidiaries). These properties are located in twenty-four24 different states. The percentage of rental and reimbursement revenue from FDX and its subsidiaries was 56%60% for the year ended September 30, 2016,2017, consisting of 7% leased to FDX and 49%53% leased to FDX subsidiaries. No other tenant accounted for 5% or more of the Company’s total Rental and Reimbursement revenue for fiscal 2016.2017.
| 33 |
In addition to real estate property holdings, the Company held $73,604,894$123,764,770 in marketable REIT securities at September 30, 2016,2017, representing 5.3%7.7% of the Company’s undepreciated assets (which is the Company’s total assets excluding accumulated depreciation). These liquid real estate holdings are not included in calculating the tenant concentration ratios above and therefore further enhance the Company’s diversification. As a result, theThe securities portfolio provides the Company with additional diversification, liquidity, diversification,and income, and serves as a proxy for real estate when more favorable risk adjusted returns are not available.
The Company’s revenue primarily consists of rental and reimbursement revenue from the ownership of industrial rental property. Rental and Reimbursement Revenue increased $17,140,613,$18,629,872, or 22%20%, for the year ended September 30, 20162017 as compared to the year ended September 30, 2015.2016. Total expenses (excluding other income and expense) increased $7,368,782,$7,279,509, or 17%15%, for the year ended September 30, 20162017 as compared to the year ended September 30, 2015.2016. The increases were due mainly to the revenue and expenses relating to the property acquisitions made during fiscal 20152016 and 2017.
The Company’s Net Income Attributable to Common Shareholders increased $2,410,346, or 12%, for the fiscal year ended September 30, 2017 as compared to the fiscal year ended September 30, 2016 and increased $3,533,105, or 21%, for the fiscal year ended September 30, 2016 as compared to the fiscal year ended September 30, 2015. The increases were due to the purchase of additional properties in fiscal 2017 and 2016.
The Company evaluates its financial performance using Net Operating Income (NOI) from property operations, (NOI)which is defineda non-GAAP financial measure that the Company defines as Net Income Attributable to Common Shareholders plus Redemption of Preferred Stock, Preferred Dividends, General and Administrative Expenses, Acquisitions Costs, Depreciation, Amortization of Capitalized Lease Costs and Intangible Assets, Interest Expense, including Amortization of Financing Costs, less Dividend and Interest Income, Gain on Sale of Securities Transactions, Lease Termination Income and Gain on Sale of Real Estate Investment. The components of NOI are recurring Rental and Reimbursement Revenue, less Real Estate Taxes and Operating Expenses, such as insurance, utilities and repairs and maintenance. Other REITs may use different methodologies to calculate NOI and, accordingly, our NOI may not be comparable to all other REITs. NOI increased $16,043,939, or 20%, for the fiscal year ended September 30, 2017 as compared to the fiscal year ended September 30, 2016 and increased $14,901,332, or 23%, for the fiscal year ended September 30, 2016 as compared to the fiscal year ended September 30, 2015 and increased $11,930,616, or 22%, for the2015. The increase from fiscal year ended September 30, 2015 as compared2016 to 2017 was due to the additional income related to ten industrial properties purchased during fiscal year ended September 30, 2014.2017 and the purchase of eight industrial properties during fiscal 2016. The increase from fiscal year 2015 to 2016 was due to the additional income related to eight industrial properties purchased during fiscal 2016 and the purchase of ten industrial properties during fiscal 2015. The increase from fiscal year 2014 to 2015 was due to the additional income related to ten industrial properties purchased during fiscal 2015.
The following is a reconciliation of the Company’s Net Income Attributable to Common Shareholders to the Company’s NOI for the fiscal years ended September 30, 2017, 2016 and 2015:
| 2017 | 2016 | 2015 | ||||||||||
| Net Income Attributable to Common Shareholders | $ | 22,942,234 | $ | 20,531,888 | $ | 16,998,783 | ||||||
| Plus: Redemption of Preferred Stock | 2,467,165 | 2,942,149 | -0- | |||||||||
| Plus: Preferred Dividends | 14,861,686 | 9,020,470 | 8,607,032 | |||||||||
| Plus: General and Administrative Expenses | 7,809,546 | 7,936,124 | 6,305,928 | |||||||||
| Plus: Acquisition Costs | 178,526 | 730,441 | 1,546,088 | |||||||||
| Plus: Depreciation | 29,634,998 | 24,055,022 | 19,705,320 | |||||||||
| Plus: Amortization of Capitalized Lease Costs and Intangible Assets | 1,824,751 | 2,032,658 | 2,067,408 | |||||||||
| Plus: Interest Expense, including Amortization of Financing Costs | 25,754,121 | 22,953,049 | 19,844,166 | |||||||||
| Less: Dividend and Interest Income | (6,930,564 | ) | (5,616,392 | ) | (3,723,867 | ) | ||||||
| Less: Gain on Sale of Securities Transactions, net | (2,311,714 | ) | (4,398,599 | ) | (805,513 | ) | ||||||
| Less: Lease Termination Income | -0- | -0- | (238,625 | ) | ||||||||
| Less: Gain on Sale of Real Estate Investment | -0- | -0- | (5,021,242 | ) | ||||||||
| Net Operating Income – NOI | $ | 96,230,749 | $ | 80,186,810 | $ | 65,285,478 | ||||||
| 34 |
The components of the Company’s NOI for the fiscal years ended September 30, 2017, 2016 and 2015 and 2014 isare calculated as follows:
| 2016 | 2015 | 2014 | 2017 | 2016 | 2015 | |||||||||||||||||||
| Rental Revenue | $ | 81,592,429 | $ | 67,059,385 | $ | 55,512,165 | $ | 97,659,778 | $ | 81,592,429 | $ | 67,059,385 | ||||||||||||
| Reimbursement Revenue | 13,323,681 | 10,716,112 | 9,160,176 | 15,886,204 | 13,323,681 | 10,716,112 | ||||||||||||||||||
| Total Rental and Reimbursement Revenue | 94,916,110 | 77,775,497 | 64,672,341 | 113,545,982 | 94,916,110 | 77,775,497 | ||||||||||||||||||
| Real Estate Taxes | (10,455,401 | ) | (8,362,135 | ) | (7,605,611 | ) | (12,427,311 | ) | (10,455,401 | ) | (8,362,135 | ) | ||||||||||||
| Operating Expense | (4,273,899 | ) | (4,127,884 | ) | (3,711,868 | ) | (4,887,922 | ) | (4,273,899 | ) | (4,127,884 | ) | ||||||||||||
| NOI | $ | 80,186,810 | $ | 65,285,478 | $ | 53,354,862 | $ | 96,230,749 | $ | 80,186,810 | $ | 65,285,478 | ||||||||||||
For the fiscal years ended September 30, 2017, 2016 2015 and 2014,2015, gross revenue, which includes Rental Revenue, Reimbursement Revenue and Dividend and Interest Income totaled $120,476,546, $100,532,502 $81,499,364 and $68,554,938,$81,499,364, respectively.
Subsequent to the fiscal yearend, on October 17, 2016,November 2, 2017, the Company purchased a newly constructed 338,584121,683 square foot industrial building, situated on 16.2 acres, located in Hamburg, NY, which is in the Buffalo MSA.Charleston, SC. The building is 100% net-leased to FedEx Ground Package System, Inc.FDX for fifteen15 years through March 2031.August 2032. The purchase price was $35,100,000.$21,872,170. The Company obtained a 15 year fully-amortizing mortgage loan of $23,500,000$14,200,000 at a fixed interest rate of 4.03%4.23%. Annual rental revenue over the remaining term of the lease averages approximately $2,308,000.$1,312,000.
In addition, subsequent to the fiscal yearend, on October 1, 2016, a 50,741 square foot expansion of a building leased to FedEx Ground Package System, Inc. located in Edinburg, TX was substantially completed for a cost of approximately $4,988,000, resulting in a new 10 year lease which extended the prior lease expiration date from September 2021 through September 2026. In addition, the expansion resulted in an increase in annual rent effective from the date of completion of approximately $499,000 from approximately $598,000, or $5.27 per square foot, to approximately $1,097,000, or $6.68 per square foot.
On October 27, 2016, the Company sold its only vacant building, (which increased our occupancy rate from 99.6% to 100.0%), consisting of a 59,425 square foot industrial building situated on 4.78 acres located in White Bear Lake, MN for approximately $4,272,000, which is the Company’s approximate U.S. GAAP net book carrying value.
The industrial properties purchased, expandedleased and soldexpanded during fiscal 20172018 to date increased our current total leasable square feet to approximately 16,340,00018,912,000 and increased our occupancy rate to 100.0%99.5%.
In addition to the property purchased subsequent to the fiscal yearend, we haveas described above, the Company has entered into agreements to purchase eightthree new build-to-suit, industrial buildings that are currently being developed in Florida, Michigan, North Carolina, OhioGeorgia and South Carolina totalingOklahoma, consisting of approximately 2,099,0001,531,000 square feet, each with net-leased terms ranging between ten to fifteenof 10 years with a weighted average lease maturity of 13.3 years.each. The purchase price for these properties is approximately $117,437,000. Approximately 1,267,0001,132,000 square feet, or 60%74%, is leased to FDX andan investment grade tenant or its subsidiaries. The purchase price for the eight properties is approximately $212,373,000.subsidiary. Subject to satisfactory due diligence and other customary closing conditions and requirements, we anticipate closing these eight transactions during fiscal 2017 and fiscal 2018. In connection with five of the eightthree properties, the Company has entered into commitments to obtain fivethree mortgages totaling $101,204,000$72,400,000 at fixed rates ranging from 3.60%3.53% to 4.20%4.25%, with a weighted average interest rate of 3.83%. Each3.75% and with a weighted average maturity of these mortgages will be a fifteen year, fully-amortizing loan.13.2 years. The Company may make additional acquisitions in fiscal 20172018 and fiscal 20182019, and the funds for these acquisitions may come from funds generated from operations, mortgages, draws on our unsecured line of credit facility, cash on hand, sale of marketable securities, other bank borrowings, proceeds from the Dividend ReinvestmentDRIP, proceeds from the Preferred Stock ATM Program, and Stock Purchase Plan (DRIP),proceeds from private placements and public offerings of additional common or preferred stock or other securities. To the extent that funds or appropriate properties are not available, fewer acquisitions will be made.
During the fiscal years ended September 30, 2017, 2016 2015 and 2014,2015, the Company completed fifteena total of nine property expansions, at thirteen of its locations, consisting of tensix building expansions and fivethree parking lot expansions. Two of the parking lot expansions included the purchase of additional land. The tensix building expansions resulted in approximately 699,000461,000 additional square feet. Total costs for all fifteennine property expansions were approximately $52,474,000$33,092,000 and resulted in total increased annual rent of approximately $5,180,000. Fourteen$3,226,000. Eight completed expansions resulted in a new ten year lease extensionextensions for each property that wasthe expanded properties and one completed expansion resulted in a new twelve year lease extension. The weighted average lease extension for these nine property expansions is 10.6 years.
| 35 |
Revenues also include dividendDividend and interest incomeInterest Income and net realized gainGain on securities transactions.Sale of Securities Transactions, net. The Company holds a portfolio of marketable securities of other REITs with a fair value of $73,604,894$123,764,770 as of September 30, 2016,2017, representing 5.3%7.7% of the Company’s undepreciated assets (which is the Company’s total assets excluding accumulated depreciation). The Company generally limits its marketable securities investments to no more than approximately 10% of its undepreciated assets. The Company invests in REIT securities and, from time to time, may use margin debt when an adequate yield spread can be obtained. As of September 30, 2017 and 2016, there was $10,091,417 and 2015, there were no draws against$-0- outstanding on the margin.margin loan, respectively. The REIT securities portfolio provides the Company with additional diversification, liquidity, and additional income, and serves as a proxy for real estate when more favorable risk adjusted returns are not available. As of September 30, 2016,2017, the Company’s portfolio consisted primarily of 81%90% REIT common stocks and 19%10% REIT preferred stocks, all of which are listed on a national securities exchange. The Company’s weighted-average yield on the securities portfolio for fiscal 20162017 was approximately 8.0%7.7%. Dividend and Interest income for fiscal 20162017 was $6,930,564 compared to $5,616,392 and was $3,723,867 for fiscal 2015.2016. During fiscal 2016,2017, the Company realized $4,398,599$2,311,714 in gains on salessale of securities transactions. The Company has unrealized gains of $12,942,267$6,570,565 in its REIT securities portfolio as of September 30, 2016.2017. The dividends received from our securities investments continue to meet our expectations. The Company intends to hold these securities for investment on a long-term basis.
The Company had $95,749,508$10,226,046 in cashCash and cash equivalentsCash Equivalents and $73,604,894$123,764,770 in REIT securities as of September 30, 2016.2017. The Company believes that funds generated from operations, the DRIP, themortgages, draws on our unsecured line of credit facility, together withcash on hand, sale of marketable securities, other bank borrowings, proceeds from the ability to financeDRIP, proceeds from the Preferred Stock ATM Program, and refinance its properties,proceeds from private placements and public offerings of additional common or preferred stock or other securities, will provide sufficient funds to adequately meet its obligations over the next several years.
The Company has a Dividend Reinvestment and Stock Purchase Plan (DRIP),DRIP, in which participants can purchase stock from the Company at a price of approximately 95% of market value. Amounts received in connection with the DRIP (including dividend reinvestments of $10,125,894, $8,369,146 $8,489,169 and $7,624,528$8,489,169 for fiscal years ended 2017, 2016 and 2015, respectively) were $91,931,831, $72,175,797 and 2014, respectively), were $72,175,797, $48,404,556 and $38,090,334 for fiscal years ended 2017, 2016 2015 and 2014,2015, respectively.
On June 29, 2017, the Company entered into the Preferred Stock ATM Program with FBR Capital Markets & Co. in which the Company may, from time to time, offer and sell additional shares of its 6.125% Series C Preferred Stock, with a liquidation preference of $25.00 per share, having an aggregate sales price of up to $100,000,000. The Company began selling shares through the Preferred Stock ATM Program on July 3, 2017. As of September 30, 2017, the Company sold 1,439,445 shares under its Preferred Stock ATM Program at a weighted average price of $25.31 per share, and generated net proceeds, after offering expenses, of approximately $35,730,000.
Subsequent to fiscal yearend to date, the Company sold 820,290 shares under its Preferred Stock ATM Program at a weighted average price of $25.14 per share, and generated net proceeds, after offering expenses, of approximately $20,296,000.
Industrial space demand is very closely correlated to Gross Domestic Product (GDP) growth. Despite seveneight years of unprecedented monetary stimulus, real annual GDP growth has averaged less than 2.0% over this period. However, there has been significant demand for industrial space and national occupancy rates have continued to increase. The most significant demand driver for modern industrial real estate continues to be ecommerce. Every year, since the turn of the century, the percentage of goods purchased on-line has increased at a 15% annual growth rate. Today, approximately 10% of retail sales have migrated from traditional store sales to on-line sales. Thissales and this growth in market share is expected to continue. These favorable trendtrends for the industrial real estate sector isare expected to be a leading demand driver for the foreseeable future, as consumers continue to embrace the added efficiencies of on-line consumption. New home construction and sales of existing homes has also continued to strengthen. Housing demand typically translates into greater demand for warehouse space. Additionally, automotive sales remain at historic highs and low energy costs have resulted in increased domestic manufacturing. These catalysts have resulted inalso contributed to rising rental rates in most major industrial markets. The strong financial position of our tenants, together with the long duration of our leases, should enable the Company to continue to perform well despite the slow growth macro-economic environment.
| 36 |
The Company intends to continue to increase its real estate investments in fiscal 20172018 and 20182019 through acquisitions and expansions of properties. The growth of the real estate portfolio depends on the availability of suitable properties which meet the Company’s investment criteria and appropriate financing. Competition in the market areas in which the Company operates is significant and affects acquisitions, occupancy levels, rental rates and operating expenses of certain properties. Transaction costs, such as broker fees, transfer taxes, legal, valuation, and other professional fees related to acquisitions are expensed as incurred.
See PART I, Item 1 – Business and Item 1A – Risk Factors for a more complete discussion of the economic and industry-wide factors relevant to the Company and the opportunities and challenges, and risks on which the Company is focused.
Significant Accounting Policies and Estimates
The discussion and analysis of the Company’s financial condition and results of operation are based upon the Company’s consolidated financial statements, which have been prepared in accordance with U.S. GAAP. The preparation of these consolidated financial statements requires management to make estimates and judgments that affect the reported amounts of assets and liabilities, revenues and expenses, and related disclosure of contingent assets and liabilities at the date of the Company’s consolidated financial statements. Actual results may differ from these estimates under different assumptions or conditions.
Significant accounting policies are defined as those that involve significant judgment and potentially could result in materially different results under different assumptions and conditions. Management believes the following significant accounting policies are affected by our more significant judgments and estimates used in the preparation of the Company’s consolidated financial statements. For a detailed description of these and other accounting policies, see Note 1 in the Notes to the Company’s Consolidated Financial Statements included in this Form 10-K.
Real Estate Investments
The Company applies Financial Accounting Standards Board (FASB) Accounting Standards Codification (ASC) 360-10, Property, Plant & Equipment (ASC 360-10) to measure impairment in real estate investments. Rental properties are individually evaluated for impairment when conditions exist which may indicate that it is probable that the sum of expected future cash flows (on an undiscounted basis without interest) from a rental property is less than its historical net cost basis. These expected future cash flows consider factors such as future operating income, trends and prospects as well as the effects of leasing demand, competition and other factors. Upon determination that an other than temporary impairment has occurred, rental properties are reduced to their fair value. For properties to be disposed of, an impairment loss is recognized when the fair value of the property, less the estimated cost to sell, is less than the carrying amount of the property measured at the time there is a commitment to sell the property and/or it is actively being marketed for sale. A property to be disposed of is reported at the lower of its carrying amount or its estimated fair value, less its cost to sell. Subsequent to the date that a property is held for disposition, depreciation expense is not recorded.
Upon acquisition of a property, the Company allocates the purchase price of the property based upon the fair value of the assets acquired, which generally consist of land, buildings and intangible assets, including above and below market leases and in-place leases. The Company allocates the purchase price to the fair value of the tangible assets of an acquired property generally determined by third party appraisal of the property obtained in conjunction with the purchase. Transaction costs, such as broker fees, transfer taxes, legal, accounting, valuation, and other professional and consulting fees, related to acquisitions are expensed as incurred.
The purchase price is further allocated to acquired above and below market leases based on the present value of the difference between prevailing market rates and the in-place lease rates over the remaining term. In addition, any remaining amounts of the purchase price are applied to in-place lease values based on management’s evaluation of the specific characteristics of each tenant’s lease. In-place leases that may have a customer relationship intangible value, including (but not limited to) the nature and extent of the existing relationship with the tenant, the tenant’s credit quality and expectations of lease renewals are also considered. Acquired above and below market leases are amortized to rental revenue over the remaining non-cancelable terms of the respective leases. The value of in-place lease intangibles is amortized to amortization expense over the remaining lease term. If a tenant terminates its lease early, the unamortized portion of the tenant improvements, leasing commissions, deferred rent, and the in-place lease value is charged to expense whenproviding the following: (i) there is a signed termination agreement, (ii) all of the conditions of the termination agreement are met, (iii) the tenant is no longer occupying the property and (iv) the termination consideration, if any, is probable of collection.
| 37 |
In January 2017, the FASB issued Accounting Standards Update (ASU) 2017-01, “Business Combinations (Topic 805): Clarifying the Definition of a Business” (ASU 2017-01). ASU 2017-01 provides revised guidance to determine when an acquisition meets the definition of a business or should be accounted for as an asset acquisition, likely resulting in more acquisitions being accounted for as asset acquisitions as opposed to business combinations. Transaction costs are capitalized for asset acquisitions while they are expensed as incurred for business combinations. ASU 2017-01 requires that, when substantially all of the fair value of an acquisition is concentrated in a single identifiable asset or a group of similar identifiable assets, the asset or group of similar identifiable assets does not meet the definition of a business. ASU 2017-01 also revises the definition of a business to include, at a minimum, an input and a substantive process that together significantly contribute to the ability to create an output. ASU 2017-01 will be effective, on a prospective basis, for annual and interim reporting periods beginning after December 15, 2017, with early adoption permitted. The Company adopted ASU 2017-01 as of April 1, 2017, as permitted under the standard. As a result of the implementation of this update, the Company’s property acquisitions, which under previous guidance were accounted for as business combinations, are now accounted for as acquisitions of assets. In an acquisition of assets, certain acquisition costs are capitalized as opposed to expensed under accounting for business combinations. For the period April 1, 2017 through September 30, 2017, the Company acquired eight properties, for each of which, it was concluded that substantially all of the fair value of the assets acquired with each property acquisition was concentrated in a single identifiable asset and did not meet the definition of a business combination under ASU 2017-01. Therefore, acquisition transaction costs, such as broker fees, transfer taxes, legal, accounting, valuation, and other professional and consulting fees associated with these property acquisitions were capitalized to real estate investments as part of the purchase price and transaction costs incurred related to acquisitions completed prior to April 1, 2017 were expensed as incurred.
The Company conducted a comprehensive review of all real estate asset classes in accordance with ASC Topic 360,360-10, which indicates that asset values should be analyzed whenever events or changes in circumstances indicate that the carrying value of a property may not be fully recoverable.
The following are examples of such events or changes in circumstances that would indicate to management that there may be an impairment of a property:
| ● | A non-renewal of a lease and subsequent move out by the tenant; | |
| ● | A renewal of a lease at a significantly lower rent than a previous lease; | |
| ● | A significant decrease in the market value of a property; | |
| ● | A significant adverse change in the extent or manner in which a property is being used or in its physical condition; | |
| ● | A significant adverse change in legal factors or in the business climate that could affect the value of a property, including an adverse action or assessment by a regulator; | |
| ● | An accumulation of costs significantly in excess of the amount originally expected for the acquisition or construction of a property; | |
| ● | A current-period operating or cash flow loss combined with a history of operating or cash flow losses or a projection or forecast that demonstrates continuing losses associated with the use of a property; or | |
| ● | A current expectation that, more likely than not, a property will be sold or otherwise disposed of significantly before the end of its previously estimated useful life. |
| 38 |
The process entails the analysis of property for instances where the net book value exceeds the estimated fair value. In accordance with ASC Topic 360,360-10, an impairment loss shall be recognized if the carrying amount of a long-lived asset is not recoverable and exceeds its fair value. The Company utilizes the experience and knowledge of its internal valuation team to derive certain assumptions used to determine an operating property’s cash flow. Such assumptions include re-leasing and renewal probabilities upon future lease expirations, vacancy factors, rental growth rates, and capital expenditures.
As part of our review of our property portfolio, we evaluated the onetwo industrial properties that were vacant industrial property in our portfolioat September 30, 2017 and evaluateevaluated that the sum of the discounted cash flows expected for a potential lease of this property exceeded its historical net cost basis. Management considers on a quarterly basis whether the marketed rent (advertised) or the market rent has decreased or if any additional indicators are present which would indicate a significant decrease in net cash flows. Management typically willmay obtain an independent appraisal to assist in evaluating a potential impairment for a property that if it has been vacant for several years. We have also considered the properties which had lease renewals at rental rates lower than the previous rental rates and noted that the sum of the new discounted cash flows expected for the renewed leases exceeded these properties’ historical net cost basis. On October 27, 2016,
Subsequent to fiscal yearend, on November 1, 2017, the Company soldleased its previously vacant 36,270 square foot facility located in Urbandale (Des Moines), IA for 10.2 years which increased our current occupancy rate to 99.5%. In addition, the Company is under contract to sell its only currently vacant building consisting of a 59,425 square foot industrial building situated on 4.78 acres located in White Bear Lake, MNFt. Myers, FL, for approximately $4,272,000,$6,400,000, which is approximately $2,400,000 above the Company’s approximate U.S. GAAP net book carrying value. As a result ofvalue, and anticipates closing this disposition, our occupancy increased from 99.6%sale during fiscal 2018, subject to 100%.customary conditions and requirements.
The Company reviewed its operating properties in light of the requirements of ASC Topic 360-10 and determined that, as of September 30, 2016,2017, the undiscounted cash flows over the holding period for these properties were in excess of their carrying values and, therefore, no impairment charges were required.
Securities Available for Sale
Investments in non-real estate assets consist primarily of marketable securities, which the Company generally limits to no more than approximately 10% of its undepreciated assets (which is the Company’s total assets excluding accumulated depreciation). Management individually reviews and evaluates our marketable securities for impairment on a quarterly basis, or when events or circumstances occur. Management considers, among other things, credit aspects of the issuer, amount of decline in fair value over cost and length of time in a continuous loss position. If a decline in fair value is determined to be other than temporary, a non-cash impairment charge is recognized in earnings and the cost basis of the individual security is written down to fair value as the new cost basis.
The Company classifies its securities among three categories: Held-to-maturity,held-to-maturity, trading, and available-for-sale. The Company’s securities at September 30, 20162017 and 20152016 are all classified as available-for-sale and are carried at fair value based on quoted market prices. Gains or losses on the sale of securities are calculated based on the average cost method and are accounted for on a trade date basis. Unrealized holding gains and losses are excluded from earnings and reported as a separate component of Shareholders’ Equity until realized. The change in net unrealized holding gains (losses) is reflected as comprehensive income (loss).
Revenue Recognition and Estimates
Rental revenue from tenants with leases having scheduled rental increases are recognized on a straight-line basis over the term of the lease. Tenant recoveries related to the reimbursement of real estate taxes, insurance, repairs and maintenance, and other operating expenses are recognized as revenue in the period the expenses are incurred. The reimbursements are recognized and presented gross, as the Company is generally the primary obligor and, with respect to purchasing goods and services from third-party suppliers, has discretion in selecting the supplier and bears the associated credit risk. These occupancy charges are recognized as earned. In addition, an estimate is made with respect to whether a provision for allowance for doubtful tenant and other receivables is necessary. The allowance for doubtful accounts reflects management’s estimate of the amounts of the recorded tenant and other receivables at the balance sheet date that will not be realized from cash receipts in subsequent periods. If cash receipts in subsequent periods vary from our estimates, or if the Company’s tenants’ financial condition deteriorates as a result of operating difficulties, additional changes to the allowance may be required. The Company did not have an allowance for doubtful accounts as of September 30, 20162017 or 2015.2016.
| 39 |
Lease Termination Income
Lease Termination Income is recognized in operating revenues whenproviding the following: (i) there is a signed termination agreement, (ii) all of the conditions of the termination agreement have beenare met, (iii) the tenant is no longer occupying the property and (iv) the termination consideration, if any, is probable of collection. Lease termination amounts are paid by tenants who want to terminate their lease obligations before the end of the contractual term of the lease by agreement with the Company.
During the fiscal year ended September 30, 2015, the Company entered into a lease termination agreement with its tenant, Norton McNaughton of Squire, Inc. (Norton), whereby the Company received a lease termination fee of $238,625 in December 2014, terminating the lease effective January 31, 2015. Prior to the lease termination, Norton leased the Company’s 302,400 square foot building located in its Hanahan (Charleston), SC location through April 29, 2015 at an annualized rent of approximately $1,389,000, or $4.54 per square foot. Additionally, prior to the lease termination, Norton sub-leased the Company’s space to Science Applications International Corporation (SAIC). In conjunction with the lease termination, the Company simultaneously entered into a lease agreement for four years and three months with SAIC from February 1, 2015 through April 30, 2019 at an initial annualized rent of approximately $1,406,000, or $4.65 per square foot, with 2% increases each year.
Lease Termination Income for the fiscal year ended September 30, 2014 consisted of $1,182,890 from the Company’s former tenant at its 83,000 square foot building located in Roanoke, VA. Lease Termination Income for the fiscal year ended September 30, 2013 consisted of $113,784 from the Company’s former tenant at its 388,671 square foot building located in St. Joseph, MO and $576,946 from the Company’s former tenant at its 160,000 square foot building located in Monroe, NC. Two of the properties associated with these lease termination fees are currently being leased to new tenants and the remaining property was subsequently leased to a new tenant then sold to that tenant. The Company is currently leasing its property located in St. Joseph, MO to two tenants, one tenant through September 30, 2017 and one tenant through February 28, 2018. The Company was leasing its building in Monroe, NC to a single tenant through September 18, 2015, at which time the Company sold the property to the tenant realizing a gain of approximately $5,021,000. In addition, as further described below, the Company is currently leasing its 83,000 square foot building in Roanoke, VA to a single tenant through January 31, 2025.
Of the Company’s ninety-nine108 properties, only threefive leases representing 1.3% of the Company’s gross leasable area, contain an early termination provision, whichprovision. The Company’s leases with early termination provisions are as follows: the Company’s lease with its tenant at its 26,340 square foot location in Ridgeland (Jackson), MS, the Company’s38,833 square foot location in Rockford, IL, the recently executed lease with its tenant at itsfor the 36,270 square feet location in Urbandale (Des Moines), IA, the 83,000 square foot location in Roanoke, VA and the Company’s lease with its tenant at its 102,135 square foot location in O’Fallon (St. Louis), MO. Each lease termination provision contains certain requirements that must be met in order to exercise each termination provision. These requirements include: date termination can be exercised, the time frame that notice must be given by the tenant to the Company and the termination fee that would be required to be paid by the tenant to the Company. The total potential termination fee to be paid to the Company from the five leases with termination provisions amounts to approximately $1,756,000.
Results of Operations
Occupancy and Rent per Occupied Square Foot
The Company’s weighted-average lease expiration was 7.47.9 and 7.27.4 years as of September 30, 20162017 and 2015,2016, respectively, and its average annualized rent per occupied square foot as of September 30, 2017 and 2016 was $5.93 and 2015 was $5.72, and $5.48, respectively. At September 30, 20162017 and 2015,2016, the Company’s occupancy was 99.6%99.3% and 97.7%99.6%, respectively.
All improved properties were 100% occupied at September 30, 20162017 except for one property consisting of a 59,42536,270 square feetfoot building situated on 4.78 acres located in White Bear Lake, MN.Urbandale (Des Moines), IA and one property consisting of an 87,500 square foot building located in Ft. Myers, FL. Subsequent to fiscal yearend, on October 27, 2016,November 1, 2017, the Company soldleased its onlypreviously vacant building36,270 square foot facility located in Urbandale (Des Moines), IA for $4,272,00010.2 years which increased our current occupancy rate to 100.0%99.5%. In addition, the Company is under contract to sell its only currently vacant building located in Ft. Myers, FL, for $6,400,000, which is approximately $2,400,000 above the Company’s U.S. GAAP net book carrying value.
Fiscal 2017 Renewals
In fiscal 2017, approximately 10% of our gross leasable area, representing 13 leases totaling 1,539,526 square feet, was set to expire. The Company has renewed 12 of these 13 leases that were set to expire in fiscal 2017. One of the 12 leases (which is with FedEx Ground Package System, Inc. for a property located in Ft. Myers, FL), renewed for only eight months because the tenant moved its operations from our 87,500 square foot facility to our newly constructed facility, which is also located in Ft. Myers, FL. On December 30, 2016, we purchased this newly constructed 213,672 square foot industrial building which is leased for 10 years through September 2026. On September 1, 2017, a parking lot expansion for this property was completed resulting in a new 10 year lease which extended the prior lease expiration date from September 2026 to August 2027. The original 87,500 square foot Ft. Myers, FL facility is under contract to sell for approximately $6,400,000, which is approximately $2,400,000 above the Company’s U.S. GAAP net book carrying value, and is anticipated to close during fiscal 2018, subject to customary closing conditions and requirements.
| 40 |
Fiscal 2016 renewals
Approximately 2%Excluding the eight-month lease renewal at the original Ft. Myers, FL location, the 11 leases that have renewed during fiscal 2017 represent 1,415,756 square feet, or 92% of the Company’s gross leasable area, consistingexpiring square footage, and have a weighted average lease term of three leases totaling 325,656 square feet, was scheduled to expire during fiscal 2016. The Company has renewed all three leases, resulting in a 100% tenant retention rate for fiscal 2016. The Company’s tenant retention rate in fiscal 2015 was also 100%. For two of the three leases that were scheduled to expire during fiscal 2016, the Company did not incur any tenant improvement costs or any leasing costs. For the other lease renewal, the Company6.8 years. We have incurred or expectswe expect to incur tenant improvement costs of approximately $210,000$3,251,000 and leasing commission costs of approximately $133,000.$1,383,000 in connection with these 11 lease renewals. The table below summarizes the lease terms of the three11 leases which were renewed andrenewed. In addition, the table below includes both the tenant improvement costs and the leasing commission costs, which are presented on a per square foot (PSF) basis averaged over the renewal term.
| Property | Tenant | Square Feet | Former U.S. GAAP Straight- Line Rent PSF | Former Cash Rent PSF | Former Lease Expiration | Renewal U.S GAAP Straight- Line Rent PSF | Renewal Initial Cash Rent PSF | Renewal Lease Expiration | Renewal Term (years) | Tenant Improvement Cost PSF over Renewal Term (1) | Leasing Commissions Cost PSF over Renewal Term (1) | |||||||||||||||||||||||||||
| Monaca, PA | Datatel Resources | 80,856 | $ | 2.87 | $ | 2.87 | 11/30/15 | $ | 3.00 | $ | 3.00 | 11/30/17 | 2.0 | $ | -0- | $ | -0- | |||||||||||||||||||||
| Granite City, IL | Anheuser- Busch, Inc. | 184,800 | 4.16 | 4.32 | 5/31/16 | 4.36 | 4.10 | 11/30/21 | 5.5 | 0.21 | 0.13 | |||||||||||||||||||||||||||
| Richmond, VA | United Technologies | 60,000 | 4.99 | 5.24 | 5/31/16 | 5.33 | 5.24 | 11/30/18 | 2.5 | -0- | -0- | |||||||||||||||||||||||||||
| Total | 325,656 | |||||||||||||||||||||||||||||||||||||
| Weighted Average | $ | 3.99 | $ | 4.13 | $ | 4.20 | $ | 4.04 | 4.1 | $ | 0.16 | $ | 0.10 | |||||||||||||||||||||||||
The three lease renewals resulted in a weighted average term of 4.1 years and a U.S. GAAP straight-line weighted average lease rate of $4.20 per square foot. The renewed weighted average initial cash rent per square foot is $4.04. This compares to the former weighted average rent of $3.99 per square foot on a U.S. GAAP straight-line basis and the former weighted average cash rent of $4.13 per square foot, representing an increase in the weighted average lease rate of 5.3% on a U.S. GAAP straight-line basis and a decrease in the weighted average lease rate of 2.2% on a cash basis.
During September 2015, the Company entered into a 5.25 year lease agreement for its previously vacant 148,000 square foot building located in Fayetteville, NC through February 28, 2021. The lease commenced December 1, 2015 and is with Victory Packaging, L.P., a wholly-owned subsidiary of KapStone Paper and Packaging Corporation, a publicly-owned company. The initial annual rent of $469,160, representing $3.17 per square foot, commenced on March 1, 2016 with 2.5% annual increases thereafter.
During October 2015, the Company entered into a 5.25 year lease agreement for its previously vacant 106,507 square foot building located in Winston-Salem, NC through March 31, 2021. The lease is with Style Crest, Inc. and commenced on January 1, 2016. Initial annual rent of $356,798, representing $3.35 per square foot, commenced on April 1, 2016 with 3.0% annual increases thereafter.
Fiscal 2017 renewals
In fiscal 2017, approximately 10% of our gross leasable area, representing thirteen leases totaling 1,539,526 square feet, is set to expire. As of the date of this Annual Report, five of the thirteen leases have renewed. One of the five leases, (which is with FedEx Ground Package System, Inc. for a property located in Ft. Myers, FL), has renewed for only eight months because the tenant plans to move its operations from our 87,500 square foot facility to a newly constructed facility, which is also located in Ft. Myers, FL. Once the construction is complete, the Company is under contract to purchase this new facility, consisting of approximately 213,500 square feet, subject to satisfactory completion of due diligence and other customary closing conditions and requirements. In addition, once the construction is complete, this brand new facility will be leased for 10 years. Excluding the eight month lease renewal at the Ft. Myers, FL location, the four leases that have renewed thus far represent 500,722 square feet, or 33% of the expiring square footage, and have a weighted average lease term of 8.0 years.
The Company has incurred or expects to incur tenant improvement costs of approximately $1,928,000 and leasing costs of approximately $587,000 in connection with four of the five lease renewals. The table below summarizes the lease terms of the five leases which were renewed and includes both the tenant improvement costs and the leasing costs, which are presented on a per square foot (PSF) basis averaged over the renewal term.
| Property | Tenant | Square Feet | Former U.S. GAAP Straight- Line Rent PSF | Former Cash Rent PSF | Former Lease Expiration | Renewal U.S GAAP Straight- Line Rent PSF | Renewal Initial Cash Rent PSF | Renewal Lease Expiration | Tenant Improvement Cost PSF over Renewal Term (1) | Leasing Commissions Cost PSF over Renewal Term (1) | Tenant | Square Feet | Former U.S. GAAP Straight- Line Rent PSF | Former Cash Rent PSF | Former Lease Expiration | Renewal U.S GAAP Straight- Line Rent PSF | Renewal Initial Cash Rent PSF | Renewal Lease Expiration | Renewal Term (years) | Tenant Improvement Cost PSF over Renewal Term(1) | Leasing Commission Cost PSF over Renewal Term(1) | |||||||||||||||||||||||||||||||||||||||||||||||||||||||||||
| Ft. Myers, FL | FedEx Ground | 87,500 | $ | 4.95 | $ | 4.95 | 10/31/16 | $ | 4.95 | $ | 4.95 | 6/30/17 | 0.7 | $ | 0.00 | $ | 0.00 | FedEx Ground | 87,500 | $ | 4.95 | $ | 4.95 | 10/31/16 | $ | 4.95 | $ | 4.95 | 6/30/17 | 0.7 | $ | -0- | $ | -0- | ||||||||||||||||||||||||||||||||||||||||||||||
| Griffin, GA | Caterpillar | 218,120 | $ | 5.36 | $ | 5.36 | 11/30/16 | $ | 5.36 | $ | 5.36 | 11/30/17 | 1.0 | $ | -0- | $ | 0.11 | |||||||||||||||||||||||||||||||||||||||||||||||||||||||||||||||
| Elgin, IL | Joseph T. Ryerson | 89,052 | $ | 5.68 | $ | 5.68 | 1/31/17 | $ | 5.68 | $ | 5.68 | 1/31/20 | 3.0 | $ | 0.17 | $ | 0.17 | Joseph T. Ryerson | 89,052 | 5.68 | 5.68 | 1/31/17 | 5.68 | 5.68 | 1/31/20 | 3.0 | 0.17 | 0.17 | ||||||||||||||||||||||||||||||||||||||||||||||||||||
| Newington, CT | Kellogg Sales Co. | 54,812 | $ | 6.00 | $ | 6.00 | 2/28/17 | $ | 6.00 | $ | 6.00 | 2/29/20 | 3.0 | $ | 0.30 | $ | 0.24 | Kellogg Sales Co. | 54,812 | 6.00 | 6.00 | 2/28/17 | 6.00 | 6.00 | 2/29/20 | 3.0 | 0.30 | 0.24 | ||||||||||||||||||||||||||||||||||||||||||||||||||||
| Schaumburg, IL | FedEx Express | 73,500 | $ | 6.88 | $ | 7.00 | 3/31/17 | $ | 6.50 | $ | 6.50 | 3/31/27 | 10.0 | $ | 0.24 | $ | 0.13 | FedEx Express | 73,500 | 6.88 | 7.00 | 3/31/17 | 6.50 | 6.50 | 3/31/27 | 10.0 | 0.24 | 0.13 | ||||||||||||||||||||||||||||||||||||||||||||||||||||
| Tolleson, AZ | Western Container | 283,358 | $ | 4.33 | $ | 4.59 | 4/30/17 | $ | 4.78 | $ | 4.33 | 4/30/27 | 10.0 | $ | 0.58 | $ | 0.14 | Western Container | 283,358 | 4.33 | 4.59 | 4/30/17 | 4.78 | 4.33 | 4/30/27 | 10.0 | 0.58 | 0.14 | ||||||||||||||||||||||||||||||||||||||||||||||||||||
| Wheeling, IL | FedEx Ground | 123,000 | 11.26 | 11.26 | 5/31/17 | 10.34 | 10.34 | 5/31/27 | 10.0 | 0.41 | 0.21 | |||||||||||||||||||||||||||||||||||||||||||||||||||||||||||||||||||||
| Punta Gorda, FL | FedEx Express | 34,624 | 8.78 | 8.78 | 6/30/17 | 8.21 | 8.21 | 6/30/27 | 10.0 | 0.08 | 0.16 | |||||||||||||||||||||||||||||||||||||||||||||||||||||||||||||||||||||
| Cudahy, WI | FedEx Ground | 139,564 | 6.45 | 6.45 | 6/30/17 | 5.92 | 5.92 | 6/30/27 | 10.0 | 0.36 | 0.12 | |||||||||||||||||||||||||||||||||||||||||||||||||||||||||||||||||||||
| Charlottesville, VA | FedEx Express | 48,064 | 6.85 | 6.85 | 8/31/17 | 6.85 | 6.85 | 8/31/27 | 10.0 | 0.29 | 0.14 | |||||||||||||||||||||||||||||||||||||||||||||||||||||||||||||||||||||
| Tampa, FL | FedEx Express | 95,662 | 5.91 | 6.30 | 9/30/17 | 6.30 | 6.30 | 11/30/27 | 10.2 | 0.15 | 0.12 | |||||||||||||||||||||||||||||||||||||||||||||||||||||||||||||||||||||
| St. Joseph, MO | Woodstream Corp. | 256,000 | 3.50 | 3.50 | 9/30/17 | 3.57 | 3.50 | 9/30/21 | 4.0 | 0.01 | 0.11 | |||||||||||||||||||||||||||||||||||||||||||||||||||||||||||||||||||||
| Total (2) | 500,722 | Total(2) | 1,415,756 | |||||||||||||||||||||||||||||||||||||||||||||||||||||||||||||||||||||||||||||
| Weighted Average (2) | $ | 5.13 | $ | 5.29 | $ | 5.33 | $ | 5.07 | 8.0 | $ | 0.48 | $ | 0.15 | $ | 5.73 | $ | 5.82 | $ | 5.70 | $ | 5.59 | 6.8 | $ | 0.34 | $ | 0.14 | ||||||||||||||||||||||||||||||||||||||||||||||||||||||
| (1) | Amount calculated based on the total cost divided by the square feet, divided by the renewal term. | |
| (2) | Total and Weighted Average amounts exclude the Ft. Myers, FL property. | |
| (3) | Renewed for only eight months because the tenant moved its operations from our 87,500 square foot facility to our newly constructed 213,672 square foot facility, which is also located in Ft. Myers, FL. The original 87,500 square foot location is under contract to sell for approximately $6,400,000, which is approximately $2,400,000 above the Company’s U.S. GAAP net book carrying value. |
Excluding the eight-month lease renewal at the original Ft. Myers, FL location, representing 6% of the space coming up for renewal in fiscal 2017, the remaining four11 lease renewals resultsresulted in a weighted average term of 8.06.8 years and a U.S. GAAP straight-line weighted average lease rate of $5.33$5.70 per square foot. The renewed weighted average initial cash rent per square foot is $5.07.$5.59. This compares to the former weighted average rent of $5.13$5.73 per square foot on a U.S. GAAP straight-line basis and the former weighted average cash rent of $5.29$5.82 per square foot, representing an increasea decrease in the weighted average lease rate of 3.9%0.5% on a U.S. GAAP straight-line basis and a decrease in the weighted average lease rate of 4.2%4.0% on a cash basis.
Regarding the remaining lease that expired during fiscal 2017, we were informed by the tenant that they would not be renewing its lease. This tenant leased our 36,270 square feet facility in Urbandale (Des Moines), IA through May 31, 2017. This facility represents 2% of the space that was up for renewal in fiscal 2017. In July 2017, we entered into a 10.2 year lease agreement with FBM Gypsum Supply of Illinois, LLC through December 31, 2027 for this 36,270 square foot building located in Urbandale (Des Moines), IA. The new lease commenced on November 1, 2017, with two months of free rent, after which initial annual rent of $159,588, representing $4.40 per square foot, will commence, with 2.0% annual increases thereafter, resulting in a straight-line annualized rent of approximately $172,000, representing $4.74 per square foot over the life of the lease. This compares to the former average straight-lined rent of $3.56 per square foot on a U.S. GAAP straight-line basis and the former cash rent of $3.88 per square foot, representing an increase in the average lease rate of 33.1% on a U.S. GAAP straight-line basis and an increase in the lease rate of 13.4% on a cash basis. The eighttenant will have a one-time early termination option that may be exercised on December 31, 2025, provided that the tenant gives us six months notice and pays a termination fee equal to three months of rent, plus operating and other costs.
| 41 |
Fiscal 2018 Renewals
In fiscal 2018, approximately 8% of our gross leasable area, representing 16 leases totaling 1,546,637 square feet, is set to expire. As of the date of this Annual Report, 3 of the 16 leases have renewed. The three leases that have renewed thus far represent 298,155 square feet, or 19% of the expiring square footage, and have a weighted average lease term of 6.9 years.
We have incurred or we expect to incur tenant improvement costs of approximately $265,000 and leasing commission costs of approximately $249,000 in connection with these three lease renewals. The table below summarizes the lease terms of the three leases which were renewed. In addition, the table below includes both the tenant improvement costs and the leasing commission costs, which are presented on a per square foot (PSF) basis averaged over the renewal term.
| Property | Tenant | Square Feet | Former U.S. GAAP Straight- Line Rent PSF | Former Cash Rent PSF | Former Lease Expiration | Renewal U.S GAAP Straight- Line Rent PSF | Renewal Initial Cash Rent PSF | Renewal Lease Expiration | Renewal Term (years) | Tenant Improvement Cost PSF over Renewal Term(1) | Leasing Commission Cost PSF over Renewal Term(1) | |||||||||||||||||||||||||||||||
| Chattanooga, TN | FedEx Express | 60,637 | $ | 5.13 | $ | 5.13 | 10/31/17 | $ | 5.26 | $ | 5.26 | 10/31/22 | 5.0 | $ | 0.43 | $ | 0.11 | |||||||||||||||||||||||||
| Orlando, FL | FedEx Express | 110,638 | 5.69 | 6.02 | 11/30/17 | 6.02 | 6.02 | 11/30/27 | 10.0 | 0.12 | 0.12 | |||||||||||||||||||||||||||||||
| St. Joseph, MO | Altec Industries | 126,880 | 2.75 | 2.75 | 2/28/18 | 2.94 | 2.87 | 2/28/23 | 5.0 | 0.01 | 0.13 | |||||||||||||||||||||||||||||||
| Total | 298,155 | |||||||||||||||||||||||||||||||||||||||||
| Weighted Average | $ | 4.32 | $ | 4.45 | $ | 4.55 | $ | 4.52 | 6.9 | $ | 0.13 | $ | 0.12 | |||||||||||||||||||||||||||||
| (1) | Amount calculated based on the total cost divided by the square feet, divided by the renewal term. |
These three lease renewals result in a weighted average term of 6.9 years and a U.S. GAAP straight-line weighted average lease rate of $4.55 per square foot. The renewed weighted average initial cash rent per square foot is $4.52. This compares to the former weighted average rent of $4.32 per square foot on a U.S. GAAP straight-line basis and the former weighted average cash rent of $4.45 per square foot, representing an increase in the weighted average lease rate of 5.3% on a U.S. GAAP straight-line basis and an increase in the weighted average lease rate of 1.6% on a cash basis.
Two of the remaining leases that are set to expire during fiscal 2018 are leased to Kellogg Sales Company (Kellogg) at our 65,067 square foot facility located in Kansas City, MO through July 31, 2018 and at our 50,400 square foot facility located in Orangeburg, NY through February 28, 2018. Kellogg has informed us that they will not be renewing their leases at these two properties. We have entered into separate agreements to sell these two properties and anticipate the sales will close during fiscal 2018, subject to customary closing conditions and requirements. We have entered into an agreement to sell the Kansas City, MO property for approximately $4,900,000, which is approximately $1,200,000 above the Company’s U.S. GAAP net book carrying value and we have entered into an agreement to sell the Orangeburg, NY property for approximately $6,170,000, which is approximately $4,700,000 above the Company’s U.S. GAAP net book carrying value. In conjunction with the sale of these two properties, we expect to enter into a lease termination agreement for each property whereby the Company will receive a termination fee from Kellogg in an amount equal to a percentage (95% for the Orangeburg, NY property and 75% for the Kansas City, MO property) of the then remaining rent due under each lease for the period from the closing date for the respective sale transactions (which will be the dates of the respective lease terminations) to the end of the respective lease terms.
Another remaining lease set to expire during fiscal 2018 is leased to Caterpillar Logistics Services, Inc. (Caterpillar) at our 218,120 square foot facility located in Griffin, GA through December 31, 2017. In September 2017, we entered into a three year lease agreement with Rinnai America Corporation through December 31, 2020 for this location. The new lease will commence on January 1, 2018, with initial annual rent of $807,044, representing $3.70 per square foot, with 3.0% annual increases thereafter, resulting in a straight-line annualized rent of $831,000, representing $3.81 per square foot over the life of the lease. This compares to the former U.S. GAAP straight-line and the former cash rent of $5.36 per square foot, representing a decrease in the average lease rate of 28.9% on a U.S. GAAP straight-line basis and a decrease in the lease rate of 31.0% on a cash basis.
| 42 |
One of our tenants that leases 80,856 square feet at our 255,658 square foot building located in Monaca (Pittsburg), PA has informed us that they will not be renewing their lease, which is set to expire on November 30, 2017.
The remaining nine leases that are still set to expire during fiscal 2018 are currently under discussion.
On September 30, 2017, the Company had a weighted average lease maturity of 7.9 years with weighted average gross annualized rent scheduled to expire each year of 7.5%.
Acquisitions and Expansions During Fiscal 20162017
Acquisitions accounted for as business combinations
On November 13, 2015,October 17, 2016, the Company purchased a newly constructed 330,717338,584 square foot industrial building located in Concord, NC,Hamburg, NY, which is in the Charlotte MSA.Buffalo Metropolitan Statistical Area (MSA). The building is 100% net-leased to FedEx Ground Package System, Inc. for ten15 years through July 2025.March 2031. The purchase price was $31,975,897.$35,100,000. The Company obtained a 15 year fully-amortizing mortgage loan of $20,780,000$23,500,000 at a fixed interest rate of 3.87%4.03%. Annual rental revenue over the remaining term of the lease averages approximately $2,078,000. In connection with the acquisition, the Company completed its evaluation of the acquired lease. As a result of its evaluation, the Company has not allocated any amount to an Intangible Asset.
On December 2, 2015, the Company purchased a newly constructed 175,315 square foot industrial building located in Covington, LA, which is in the New Orleans MSA. The building is 100% net-leased to FedEx Ground Package System, Inc. for ten years through June 2025. The purchase price was $18,410,000. The Company obtained a 15 year fully-amortizing mortgage of $12,890,000 at a fixed interest rate of 4.08%. Annual rental revenue over the remaining term of the lease averages approximately $1,258,000. In connection with the acquisition, the Company completed its evaluation of the acquired lease. As a result of its evaluation, the Company has not allocated any amount to an Intangible Asset.
On March 8, 2016, the Company purchased a newly constructed 125,860 square foot industrial building located in Imperial, PA, which is in the Pittsburgh MSA. The building is 100% net-leased to General Electric Company (GE) for ten years through December 2025. The purchase price was $20,032,864. The Company obtained a 14 year fully-amortizing mortgage of $13,000,000 at a fixed interest rate of 3.63%. Annual rental revenue over the remaining term of the lease averages approximately $1,311,000.$2,309,000. In connection with the acquisition, the Company completed its evaluation of the acquired lease. As a result of its evaluation, the Company allocated $82,864$250,000 to an Intangible Asset associated with the lease in-place.
On April 8,December 30, 2016, the Company purchased a newly constructed 210,445213,672 square foot industrial building located in Burlington, WA, which is in the Seattle/Everett MSA.Ft. Myers, FL. The building is 100% net-leased to FedEx Ground Package System, Inc. for fifteen10 years through August 2030.September 2026. The purchase price was $30,662,080.$21,001,538. The Company obtained a 15 year fully-amortizing mortgage loan of $20,221,000$14,500,000 at a fixed interest rate of 3.67%3.97%. Annual rental revenue over the remaining term of the lease averages approximately $1,962,000.$1,365,000. In connection with the acquisition, the Company completed its evaluation of the acquired lease. As a result of its evaluation, the Company allocated $451,400$201,538 to an Intangible Asset associated with the lease in-place.
On June 9, 2016, the Company purchasedSeptember 1, 2017, a newly constructed 225,362 square foot industrial building located in Colorado Springs, CO. The building is 100% net-leased to FedEx Ground Package System, Inc.parking lot expansion for ten years through January 2026. The purchase price was $28,845,500. The Company obtained a 15 year fully-amortizing mortgage of $18,730,000 at a fixed interest rate of 3.90%. Annual rental revenue over the remaining term of the lease averages approximately $1,832,000. In connection with the acquisition, the Company completed its evaluation of the acquired lease. As a result of its evaluation, the Company allocated $345,500 to an Intangible Asset associated with the lease in-place.
On June 30, 2016, the Company purchased a newly constructed 137,500 square foot industrial building located in Louisville, KY. The building is 100% net-leased to Challenger Lifts, Inc., a subsidiary of Snap-on Incorporated (“Snap-on”), for ten years through June 2026. The lease is guaranteed by Snap-on. The purchase price was $11,304,000. The Company obtained a 15 year fully-amortizing mortgage of $7,350,000 at a fixed interest rate of 3.74%. Annual rental revenue over the remaining term of the lease averages approximately $835,000. In connection with the acquisition, the Company completed its evaluation of the acquired lease. As a result of its evaluation, the Company has not allocated any amount to an Intangible Asset.
On August 19, 2016, the Company purchased a newly constructed 310,922 square foot industrial building located in Davenport, FL, which is in the Orlando MSA. The building is 100% net-leased to FedEx Ground Package System, Inc. for fifteen years through April 2031. The purchase price was $37,780,000. The Company obtained a 15 year fully-amortizing mortgage loan of $26,400,000 at a fixed interest rate of 3.89%. Annual rental revenue over the remaining term of the lease averages approximately $2,604,000. In connection with the acquisition, the Company completed its evaluation of the acquired lease. As a result of its evaluation, the Company has not allocated any amount to an Intangible Asset.
On August 26, 2016, the Company purchased a newly constructed 313,763 square foot industrial building located in Olathe, KS, which is in the Kansas City MSA. The building is 100% net-leased to FedEx Ground Package System, Inc. for fifteen years through May 2031. The purchase price was $31,737,000. The Company obtained a 15 year fully-amortizing mortgage loan of $22,215,000 at a fixed interest rate of 3.96%. Annual rental revenue over the remaining term of the lease averages approximately $2,196,000. In connection with the acquisition, the Company completed its evaluation of the acquired lease. As a result of its evaluation, the Company has not allocated any amount to an Intangible Asset.
Expansions
On July 29, 2016, a 246,434 square foot expansion of a building leased to Milwaukee Electric Tool Corporation (“Milwaukee Tool”) located in Olive Branch, MS, which is located in the Memphis, TN MSA,this property was completed for a cost of approximately $9,785,000. This resulted in a new 12 year lease which extended the original lease expiration date from April 2023 through July 2028 and increased the building size from 615,455 to 861,889 square feet. In addition, the expansion resulted in an initial increase in annual rent effective on the date of completion of approximately $847,000 from approximately $1,943,000, or $3.16 per square foot, to approximately $2,790,000, or $3.24 per square foot. Furthermore, annual rent will increase each year by 1.5% resulting in an annualized rent over the new twelve year period of approximately $3,020,000, or $3.50 per square foot. In September 2016, in connection with the expansion, the Company refinanced its prior 3.76% interest rate mortgage with its existing lender of this property. At the time of the refinancing, the prior amortizing loan was approximately $13,158,000 and was set to mature in January 2023. The new loan is a 12 year fully-amortizing mortgage of $25,000,000 and will mature in October 2028. The interest rate of the new loan remained the same as the prior loan at a fixed interest rate of 3.76%.
On August 1, 2016, a parking lot expansion for a property leased to FedEx Ground Package System, Inc. located in Tampa, FL was completed for a cost of approximately $1,303,000,$862,000, resulting in a new 10 year lease which extended the prior lease expiration date from September 2026 to August 2027. In addition, the expansion resulted in an increase in annual rent effective from the date of completion of approximately $53,000 from approximately $1,365,000, or $6.39 per square foot to approximately $1,418,000, or $6.64 per square foot.
Acquisitions accounted for as asset acquisitions
On April 5, 2017, the Company purchased a newly constructed 343,483 square foot industrial building located in Walker, MI, which is in the Grand Rapids MSA. The building is 100% net-leased to FedEx Ground Package System, Inc. for 15 years through January 2032. The purchase price was $32,120,000. The Company obtained a 15 year fully-amortizing mortgage loan of $20,875,000 at a fixed interest rate of 3.86%. Annual rental revenue over the remaining term of the lease averages approximately $2,102,000.
On June 202423, 2017, the Company purchased a newly constructed 351,874 square foot industrial building located in Mesquite, TX, which is in the Dallas MSA. The building is 100% net-leased to FedEx Ground Package System, Inc. for 15 years through JulyMarch 2032. The purchase price was $50,621,072. The Company obtained a 15 year fully-amortizing mortgage loan of $32,900,000 at a fixed interest rate of 3.60%. Annual rental revenue over the remaining term of the lease averages approximately $3,194,000.
| 43 |
On June 27, 2017, the Company purchased a newly constructed 315,560 square foot industrial building located in Aiken, SC, which is in the Augusta, GA MSA. The building is 100% net-leased to Autoneum North America, Inc. for 15 years through April 2032. The purchase price was $21,933,000. The Company obtained a 15 year fully-amortizing mortgage loan of $15,350,000 at a fixed interest rate of 4.20%. Annual rental revenue over the remaining term of the lease averages approximately $1,700,000.
On June 28, 2017, the Company purchased a newly-constructed 237,756 square foot industrial building located in Homestead, FL, which is in the Miami MSA. The building is 100% net leased to FedEx Ground Package System, Inc. for 15 years through March 2032. The purchase price was $38,347,933. The Company obtained a 15 year fully-amortizing mortgage loan of $24,800,000 at a fixed interest rate of 3.60%. Annual rental revenue over the remaining term of the lease averages approximately $2,282,000.
On June 29, 2017, the Company purchased a newly constructed 110,361 square foot industrial building located in Oklahoma City, OK. The building is 100% net-leased to Bunzl Distribution Oklahoma, Inc. for seven years through August 2024. The purchase price was $9,000,000. The Company obtained a 12 year fully-amortizing mortgage loan of $6,000,000 at a fixed interest rate of 4.125%. Annual rental revenue over the remaining term of the lease averages approximately $721,000.
On August 3, 2017, the Company purchased a newly constructed 354,482 square foot industrial building located in Concord, NC which is in the Charlotte MSA. The building is 100% net leased to FedEx Ground Package System, Inc. for 15 years through May 2032. The purchase price was $40,598,446. The Company obtained a 15 year fully-amortizing mortgage loan of $26,184,000 at a fixed interest rate of 3.80%. Annual rental revenue over the remaining term of the lease averages approximately $2,537,000.
On September 19, 2017, the Company purchased a newly constructed 298,472 square foot industrial building located in Kenton, OH. The building is 100% net leased to International Paper Company for 10 years through August 2027. The purchase price was $18,299,032. The Company obtained a 15 year fully-amortizing mortgage loan of $12,000,000 at a fixed interest rate of 4.45%. Annual rental revenue over the remaining term of the lease averages approximately $1,243,000.
On September 29, 2017, the Company purchased a newly constructed 219,765 square foot industrial building located in Stow, OH. The building is 100% net leased to Mickey Thompson Performance Tires and Wheels for 10 years through August 2027. The purchase price was $19,500,000. The Company obtained a 15 year fully-amortizing mortgage loan of $12,700,000 at a fixed interest rate of 4.17%. Annual rental revenue over the remaining term of the lease averages approximately $1,500,000.
Expansions
On October 1, 2016, a 50,625 square foot expansion of the building leased to FedEx Ground Package System, Inc. located in Edinburg, TX was completed for a cost of approximately $4,762,000, resulting in a new 10 year lease, which extended the prior lease expiration date from September 2021 to September 2026. In addition, the expansion resulted in an increase in annual rent effective from the date of completion of approximately $131,000$499,000 from approximately $1,493,000,$598,000, or $8.74$5.26 per square foot, to approximately $1,624,000,$1,097,000, or $9.51$6.68 per square foot.
On AugustAs discussed above, on September 1, 2016,2017, a 14,941 square footparking lot expansion offor a buildingproperty leased to FedEx Ground Package System, Inc. located in Huntsville, ALFt. Myers, FL was completed for a cost of approximately $1,925,000,$862,000, resulting in a new 10 year lease which extended the prior lease expiration date from September 2026 to August 2022 through July 2026.2027. In addition, the expansion resulted in an increase in annual rent effective from the date of completion of approximately $193,000$53,000 from approximately $412,000,$1,365,000, or $5.59$6.39 per square foot to approximately $605,000$1,418,000, or $6.82$6.64 per square foot.
| 44 |
Comparison of Year Ended September 30, 2017 to Year Ended September 30, 2016
The following tables summarize the Company’s rental revenue, reimbursement revenue, real estate taxes, operating expenses, and depreciation expense by category. For the purposes of the following discussion, same properties are properties owned as of October 1, 2015 that have not been subsequently expanded or sold.
Acquired Properties are properties that were acquired subsequent to September 30, 2015. Eighteen properties were acquired during fiscal 2017 and fiscal 2016. Acquired properties include the properties located in Concord (Charlotte), NC; Covington (New Orleans), LA; Imperial (Pittsburgh), PA; Burlington (Seattle/Everett), WA; Colorado Springs, CO; Louisville, KY; Davenport (Orlando), FL and Olathe (Kansas City), KS (all acquired in fiscal 2016) and Hamburg (Buffalo), NY; Ft. Myers, FL; Walker (Grand Rapids), MI; Mesquite (Dallas), TX; Aiken (Augusta, GA), SC; Homestead (Miami), FL; Oklahoma City, OK; Concord (Charlotte), NC; Kenton, OH and Stow, OH (all acquired in fiscal 2017).
During fiscal 2017 and 2016, there were five property expansions completed at the properties located in Olive Branch (Memphis, TN), MS; Huntsville, AL; Tampa, FL (FedEx Ground); Edinburg, TX and Ft. Myers, FL. Expanded Properties include these properties that were expanded subsequent to September 30, 2015, with the exception of the property located in Ft. Myers, FL. Since this property was acquired in fiscal 2017 and subsequently expanded, it is therefore included in Acquired Properties instead of being included in Expanded Properties.
Sold property consists of one property located in White Bear Lake (Minneapolis/St. Paul), MN that was sold on October 27, 2016.
As of September 30, 2017 and 2016, the occupancy rates of the Company’s total property portfolio were 99.3% and 99.6%, respectively. Subsequent to fiscal yearend, on November 1, 2017, the Company leased its previously vacant 36,270 square foot facility located in Urbandale (Des Moines), IA for 10.2 years which increased our current occupancy rate to 99.5%. In addition, the Company is under contract to sell its only currently vacant building located in Ft. Myers, FL, for $6,400,000.
| Rental Revenues | 2017 | 2016 | $ Change | % Change | ||||||||||||
| Same Properties | $ | 70,047,915 | $ | 70,082,404 | $ | (34,489 | ) | (0 | )% | |||||||
| Acquired Properties | 21,360,523 | 6,573,225 | 14,787,298 | 225 | % | |||||||||||
| Expanded Properties | 6,251,340 | 4,936,800 | 1,314,540 | 27 | % | |||||||||||
| Sold Property | -0- | -0- | -0- | 0 | % | |||||||||||
| Total | $ | 97,659,778 | $ | 81,592,429 | $ | 16,067,349 | 20 | % | ||||||||
The increase in rental revenues is mainly due to the increase from the newly acquired properties and expanded properties.
| Reimbursement Revenues | 2017 | 2016 | $ Change | % Change | ||||||||||||
| Same Properties | $ | 13,012,654 | $ | 12,151,466 | $ | 861,188 | 7 | % | ||||||||
| Acquired Properties | 1,828,702 | 215,438 | 1,613,264 | 749 | % | |||||||||||
| Expanded Properties | 1,017,657 | 956,777 | 60,880 | 6 | % | |||||||||||
| Sold Property | 27,191 | -0- | 27,191 | - | ||||||||||||
| Total | $ | 15,886,204 | $ | 13,323,681 | $ | 2,562,523 | 19 | % | ||||||||
Our single tenant properties are subject to net leases, which require the tenants to absorb the real estate taxes, insurance and the majority of the repairs and maintenance. As such, the Company is reimbursed by the tenants for these expenses. Therefore, the increase in reimbursement revenues is offset by the increase in Real Estate Taxes and the increase in Operating Expenses, which includes insurance, repairs and maintenance and other operating expenses. In addition, the increase in reimbursement revenues is mainly due to the increase from the newly acquired properties.
| 45 |
| Real Estate Taxes | 2017 | 2016 | $ Change | % Change | ||||||||||||
| Same Properties | $ | 10,301,781 | $ | 9,521,967 | $ | 779,814 | 8 | % | ||||||||
| Acquired Properties | 1,442,973 | 157,350 | 1,285,623 | 817 | % | |||||||||||
| Expanded Properties | 673,702 | 660,994 | 12,708 | 2 | % | |||||||||||
| Sold Property | 8,855 | 115,090 | (106,235 | ) | (92 | )% | ||||||||||
| Total | $ | 12,427,311 | $ | 10,455,401 | $ | 1,971,910 | 19 | % | ||||||||
The increase in real estate taxes is mainly due to the newly acquired properties. The increase from same properties is mainly due to an increase in assessment values.
| Operating Expenses | 2017 | 2016 | $ Change | % Change | ||||||||||||
| Same Properties | $ | 3,900,093 | $ | 3,795,817 | $ | 104,276 | 3 | % | ||||||||
| Acquired Properties | 506,964 | 92,184 | 414,780 | 450 | % | |||||||||||
| Expanded Properties | 348,491 | 343,029 | 5,462 | 2 | % | |||||||||||
| Sold Property | 132,374 | 42,869 | 89,505 | 209 | % | |||||||||||
| Total | $ | 4,887,922 | $ | 4,273,899 | $ | 614,023 | 14 | % | ||||||||
The increase in operating expenses is mainly due to the newly acquired properties.
| Net Operating Income (NOI)* | 2017 | 2016 | $ Change | % Change | ||||||||||||
| Same Properties | $ | 68,858,695 | $ | 68,916,086 | $ | (57,391 | ) | (0 | )% | |||||||
| Acquired Properties | 21,239,288 | 6,539,129 | 14,700,159 | 225 | % | |||||||||||
| Expanded Properties | 6,246,804 | 4,889,554 | 1,357,250 | 28 | % | |||||||||||
| Sold Property | (114,038 | ) | (157,959 | ) | 43,921 | 28 | % | |||||||||
| Total | $ | 96,230,749 | $ | 80,186,810 | $ | 16,043,939 | 20 | % | ||||||||
The increase in NOI is mainly due to the newly acquired properties and expanded properties.
* The revenue and expense items related to property operations discussed above are components of NOI which are recurring Rental and Reimbursement Revenue, less Real Estate Taxes and Operating Expenses. NOI is a non-GAAP performance measure. See “Item 7 – Management’s Discussion and Analysis of Financial Condition and Results of Operation – Overview” for a reconciliation of our Net Operating Income to our Net Income Attributable to Common Shareholders.
| Depreciation | 2017 | 2016 | $ Change | % Change | ||||||||||||
| Same Properties | $ | 20,846,253 | $ | 20,554,181 | $ | 292,072 | 1 | % | ||||||||
| Acquired Properties | 7,076,142 | 2,078,557 | 4,997,585 | 240 | % | |||||||||||
| Expanded Properties | 1,704,597 | 1,326,210 | 378,387 | 29 | % | |||||||||||
| Sold Property | 8,006 | 96,074 | (88,068 | ) | (92 | )% | ||||||||||
| Total | $ | 29,634,998 | $ | 24,055,022 | $ | 5,579,976 | 23 | % | ||||||||
The increase in depreciation expense is mainly due to the newly acquired and expanded properties.
| Interest Expense, excluding Amortization of Financing Costs | 2017 | 2016 | $ Change | % Change | ||||||||||||
| Same Properties | $ | 13,264,189 | $ | 16,408,865 | $ | (3,144,676 | ) | (19 | )% | |||||||
| Acquired Properties | 7,406,520 | 1,805,226 | 5,601,294 | 310 | % | |||||||||||
| Expanded Properties | 1,250,107 | 991,826 | 258,281 | 26 | % | |||||||||||
| Sold Property | -0- | -0- | -0- | 0 | % | |||||||||||
| Loans Payable | 2,599,046 | 2,630,894 | (31,848 | ) | (1 | )% | ||||||||||
| Total | $ | 24,519,862 | $ | 21,836,811 | $ | 2,683,051 | 12 | % | ||||||||
| 46 |
The increase in interest expense is mainly due to the acquisition of new properties. Interest expense for same properties decreased mainly due to the reduction in the outstanding fixed rate mortgage balance related to these properties. The outstanding fixed rate mortgage balance related to these properties was reduced mainly due to the payoff of 16 fixed rate mortgage loans totaling approximately $40,037,000 and regularly scheduled principal amortization payments made during fiscal 2017. In addition, the weighted average interest rate on the Company’s fixed rate debt decreased from 4.48% as of September 30, 2016 to 4.18% as of September 30, 2017.
Acquisition Costs
Acquisition costs that were expensed in the Consolidated Statement of Income decreased $551,915, or 76% during fiscal 2017 as compared to fiscal 2016. As a result of adopting ASU 2017-01, effective as of April 1, 2017, as permitted under the standard, the Company no longer accounts for its property acquisitions as business combinations and instead accounts for its property acquisitions as acquisitions of assets. In an acquisition of assets, certain acquisition costs are capitalized to real estate investments as part of the purchase price as opposed to being expensed as Acquisition Costs under the accounting treatment for business combinations previously used. Therefore, as of April 1, 2017, the Company no longer is required to expense its Acquisition Costs. Two properties totaling approximately $56,102,000 were acquired during the first half of fiscal 2017, prior to April 1, 2017 and eight properties totaling approximately $210,747,000 were acquired during fiscal 2016.
General and Administrative Expenses
General and administrative expenses decreased $126,578, or 2%, during fiscal 2017 as compared to fiscal 2016. The decrease in fiscal 2017 was partially due to a one-time $400,000 cash signing bonus granted to the President and Chief Executive Officer in accordance with his amended employment agreement during fiscal 2016 and due to a one-time $100,000 severance payment made to a former employee during fiscal 2016. Additionally, during fiscal 2016, the Founder and Chairman of the Board was granted a discretionary award of 40,000 shares of restricted stock which vest in equal annual installments over the next five years and has a grant date fair value of $13.64 per share, for a total grant date fair value of $545,600. Since the Founder and Chairman of the Board is of retirement age, the entire fair value of the grant was fully expensed on the grant date during fiscal 2016. These one-time fiscal 2016 expenses were partially offset by increases in all employees’ wage rates and professional fees incurred during fiscal 2017. General and administrative expenses, as a percentage of gross revenue, (which includes Rental Revenue, Reimbursement Revenue and Dividend and Interest Income), decreased to 6% for fiscal year 2017 from 8% for fiscal year 2016. General and administrative expenses, as a percentage of undepreciated assets (which is the Company’s total assets excluding accumulated depreciation), decreased to 48 basis points from 58 basis points for the fiscal years 2017 and 2016, respectively.
Dividend and Interest Income
Dividend and Interest Income increased $1,314,172, or 23%, during fiscal 2017 as compared to fiscal 2016. This is mainly due to the higher average carrying value of the REIT securities portfolio during the fiscal year ended September 30, 2017 as compared to during the fiscal year ended September 30, 2016. The REIT securities portfolio weighted average yield for fiscal 2017 was approximately 7.7% as compared to 8.0% for fiscal 2016.
Realized Gain on Sales of Securities Transactions, net
Realized gain on sales of securities transactions, net consisted of the following:
| 2017 | 2016 | |||||||
| Gross realized gains | $ | 2,320,561 | $ | 4,403,724 | ||||
| Gross realized losses | (8,847 | ) | (5,125 | ) | ||||
| Total Realized Gain on Sales of Securities Transactions, net | $ | 2,311,714 | $ | 4,398,599 | ||||
The Company had an accumulated net unrealized gain on its securities portfolio of $6,570,565 as of September 30, 2017.
| 47 |
Comparison of Year Ended September 30, 2016 to Year Ended September 30, 2015
The following tables summarize the Company’s rental revenue, reimbursement revenue, real estate taxes, operating expenses, and depreciation expense by category. For the purposes of the following discussion, same properties are properties owned as of October 1, 2014 that have not been subsequently expanded or sold.
Acquired properties are properties that were acquired subsequent to September 30, 2014. Eighteen properties were acquired during fiscal 2016 and fiscal 2015. Acquired properties include the properties located in Lindale (Tyler), TX; Sauget (St. Louis, MO), IL; Rockford, IL; Kansas City, MO; Frankfort (Lexington), KY; Jacksonville, FL; Monroe (Cincinnati), OH; Greenwood (Indianapolis), IN; FortFt. Worth (Dallas), TX and Cincinnati, OH (all acquired in fiscal 2015) and Concord (Charlotte), NC; Covington (New Orleans), LA; Imperial (Pittsburgh), PA; Burlington (Seattle/Everett), WA; Colorado Springs, CO; Louisville, KY; Davenport (Orlando), FL and Olathe (Kansas City), KS (all acquired in fiscal 2016).
Seven property expansions were completed during fiscal 2016 and fiscal 2015. Expanded properties include the properties located in El Paso, TX; Huntsville, AL; Monaca (Pittsburgh), PA (NF&M); Oklahoma City, OK; El Paso, TX; Waco, TX; Olive Branch (Memphis, TN), MS; Huntsville, AL and Tampa, FL (FedEx Ground); and Waco, TX..
Sold property consists of one property located in Monroe, NC that was sold on September 18, 2015.
As of September 30, 2016 and 2015, the occupancy rates of the Company’s total property portfolio were 99.6% and 97.7%, respectively. Subsequent to fiscal yearend, on October 27, 2016, the Company sold its only vacant building for $4,272,000 which increased our occupancy rate to 100.0%.
| Rental Revenues | 2016 | 2015 | $ Change | % Change | ||||||||||||
| Same Properties | $ | 52,789,077 | $ | 51,436,618 | $ | 1,352,459 | 3 | % | ||||||||
| Acquired Properties | 19,930,994 | 7,702,716 | 12,228,278 | 159 | % | |||||||||||
| Expanded Properties | 8,872,358 | 7,378,811 | 1,493,547 | 20 | % | |||||||||||
| Sold Property | -0- | 541,240 | (541,240 | ) | (100 | )% | ||||||||||
| Total | $ | 81,592,429 | $ | 67,059,385 | $ | 14,533,044 | 22 | % | ||||||||
The increase in rental revenues is mainly due to the increase from the newly acquired properties and expanded properties. Rental revenue from same properties increased due to the increase in same properties occupancy which increased 280 basis points from 96.6% as of September 30, 2015 to 99.4% as of September 30, 2016. In addition, the rental revenue from same properties increased due to an increase in rental rates for the renewed leases as described in the lease renewals and extensions table during fiscal 2016.
| Reimbursement Revenues | 2016 | 2015 | $ Change | % Change | ||||||||||||
| Same Properties | $ | 9,809,086 | $ | 8,432,694 | $ | 1,376,392 | 16 | % | ||||||||
| Acquired Properties | 1,860,929 | 419,056 | 1,441,873 | 344 | % | |||||||||||
| Expanded Properties | 1,653,666 | 1,834,352 | (180,686 | ) | (10 | )% | ||||||||||
| Sold Property | -0- | 30,010 | (30,010 | ) | (100 | )% | ||||||||||
| Total | $ | 13,323,681 | $ | 10,716,112 | $ | 2,607,569 | 24 | % | ||||||||
Our single tenant properties are subject to net leases which require the tenants to absorb the real estate taxes, insurance and the majority of the repairs and maintenance. As such, the Company is reimbursed by the tenants for these expenses. Therefore, the total increase in reimbursement revenues is partially offset by the increase in real estate taxes, increase in insurance expense and increase in operating expenses. In addition, the increase in reimbursement revenues for same properties is partially due to the increase in same properties occupancy which enabled us to be reimbursed by our tenants for these expenses on properties that were previously vacant. Same properties occupancy increased 280 basis points from 96.6% as of September 30, 2015 to 99.4% as of September 30, 2016. The increase in reimbursement revenues is mainly due to increases in real estate taxes, insurance expenses and operating expenses from the newly acquired properties.
| 48 |
| Real Estate Taxes | 2016 | 2015 | $ Change | % Change | ||||||||||||
| Same Properties | $ | 7,785,127 | $ | 6,756,066 | $ | 1,029,061 | 15 | % | ||||||||
| Acquired Properties | 1,302,240 | 203,630 | 1,098,610 | 540 | % | |||||||||||
| Expanded Properties | 1,368,034 | 1,328,715 | 39,319 | 3 | % | |||||||||||
| Sold Property | -0- | 73,724 | (73,724 | ) | (100 | )% | ||||||||||
| Total | $ | 10,455,401 | $ | 8,362,135 | $ | 2,093,266 | 25 | % | ||||||||
The increase in real estate taxes is mainly due to the newly acquired properties as well as increased assessment values on expanded properties.
| Operating Expenses | 2016 | 2015 | $ Change | % Change | ||||||||||||
| Same Properties | $ | 3,180,529 | $ | 3,410,422 | $ | (229,893 | ) | (7 | )% | |||||||
| Acquired Properties | 656,576 | 265,964 | 390,612 | 147 | % | |||||||||||
| Expanded Properties | 436,794 | 418,517 | 18,277 | 4 | % | |||||||||||
| Sold Property | -0- | 32,981 | (32,981 | ) | (100 | )% | ||||||||||
| Total | $ | 4,273,899 | $ | 4,127,884 | $ | 146,015 | 4 | % | ||||||||
The increase in operating expenses is mainly due to the newly acquired properties.
| Net Operating Income (“NOI”) | 2016 | 2015 | $ Change | % Change | ||||||||||||||||||||||||||||
| Net Operating Income (NOI)* | 2016 | 2015 | $ Change | % Change | ||||||||||||||||||||||||||||
| Same Properties | $ | 51,632,507 | $ | 49,702,824 | $ | 1,929,683 | 4 | % | $ | 51,632,507 | $ | 49,702,824 | $ | 1,929,683 | 4 | % | ||||||||||||||||
| Acquired Properties | 19,833,107 | 7,652,178 | 12,180,929 | 159 | % | 19,833,107 | 7,652,178 | 12,180,929 | 159 | % | ||||||||||||||||||||||
| Expanded Properties | 8,721,196 | 7,465,931 | 1,255,265 | 17 | % | 8,721,196 | 7,465,931 | 1,255,265 | 17 | % | ||||||||||||||||||||||
| Sold Property | -0- | 464,545 | (464,545 | ) | (100 | )% | -0- | 464,545 | (464,545 | ) | (100 | )% | ||||||||||||||||||||
| Total | $ | 80,186,810 | $ | 65,285,478 | $ | 14,901,332 | 23 | % | $ | 80,186,810 | $ | 65,285,478 | $ | 14,901,332 | 23 | % | ||||||||||||||||
The increase in NOI is mainly due to the newly acquired properties and expanded properties.
* The revenue and expense items related to property operations discussed above are components of NOI which are recurring Rental and Reimbursement Revenue, less Real Estate Taxes and Operating Expenses. NOI is a non-GAAP performance measure. See “Item 7 – Management’s Discussion and Analysis of Financial Condition and Results of Operation – Overview” for a reconciliation of our Net Operating Income to our Net Income Attributable to Common Shareholders.
| Depreciation | 2016 | 2015 | $ Change | % Change | ||||||||||||
| Same Properties | $ | 15,404,749 | $ | 15,012,514 | $ | 392,235 | 3 | % | ||||||||
| Acquired Properties | 6,338,685 | 2,554,254 | 3,784,431 | 148 | % | |||||||||||
| Expanded Properties | 2,311,588 | 2,007,934 | 303,654 | 15 | % | |||||||||||
| Sold Property | -0- | 130,618 | (130,618 | ) | (100 | )% | ||||||||||
| Total | $ | 24,055,022 | $ | 19,705,320 | $ | 4,349,702 | 22 | % | ||||||||
The increase in depreciation expense is mainly due to the newly acquired properties. Depreciation expense from same properties and expanded properties increased mainly due to additional tenantcapital improvements being depreciated within fiscal 2016.
| Interest Expense | 2016 | 2015 | $ Change | % Change | ||||||||||||
| Same Properties | $ | 10,928,101 | $ | 12,654,443 | $ | (1,726,342 | ) | (14 | )% | |||||||
| Acquired Properties | 6,658,906 | 2,619,581 | 4,039,325 | 154 | % | |||||||||||
| Expanded Properties | 1,618,910 | 1,753,903 | (134,993 | ) | (8 | )% | ||||||||||
| Sold Property | -0- | 71,287 | (71,287 | ) | (100 | )% | ||||||||||
| Loans Payable | 2,630,894 | 1,458,936 | 1,171,958 | 80 | % | |||||||||||
| Total | $ | 21,836,811 | $ | 18,558,150 | $ | 3,278,661 | 18 | % | ||||||||
| 49 |
| Interest Expense, excluding Amortization of Financing Costs | 2016 | 2015 | $ Change | % Change | ||||||||||||
| Same Properties | $ | 10,928,101 | $ | 12,654,443 | �� | $ | (1,726,342 | ) | (14 | %) | ||||||
| Acquired Properties | 6,658,906 | 2,619,581 | 4,039,325 | 154 | % | |||||||||||
| Expanded Properties | 1,618,910 | 1,753,903 | (134,993 | ) | (8 | )% | ||||||||||
| Sold Property | -0- | 71,287 | (71,287 | ) | (100 | )% | ||||||||||
| Loans Payable | 2,630,894 | 1,458,936 | 1,171,958 | 80 | % | |||||||||||
| Total | $ | 21,836,811 | $ | 18,558,150 | $ | 3,278,661 | 18 | % | ||||||||
The increase in interest expense is mainly due to the acquisition of new properties. Interest expense for same properties decreased mainly due to the decrease in the outstanding balances of the mortgages and the reduction in the weighted average interest rate. The reduction in the outstanding mortgages balance is due to the payoff of four loans during fiscal 2016 totaling $14,739,654 and regularly scheduled principal amortization payments made during fiscal 2016. The weighted average interest rate on the Company’s fixed rate debt as of September 30, 2016 was 4.48% as compared to 4.85% as of September 30, 2015. Loans payable interest expense increased due to the higher weighted average Loans Payable balance maintained during fiscal 2016 as compared to fiscal 2015.
Acquisition Costs
Acquisition costs that were expensed in the Consolidated Statement of Income decreased $815,647, or 53% during fiscal 2016 as compared to fiscal 2015. Eight properties totaling approximately $210,747,000 were acquired during fiscal 2016 as compared to ten properties totaling approximately $191,985,000 that were acquired during fiscal 2015. The decrease in Acquisition Costs during fiscal 2016 was primarily due to a broker fee of approximately $373,600 incurred for the purchase of one acquisition acquired during fiscal 2015 and also due to the higher number of properties acquired during fiscal 2015 as compared to the number of properties purchased during fiscal 2016.
General and Administrative Expenses
General and administrative expenses increased $1,630,196, or 26%, during fiscal 2016 as compared to fiscal 2015. The increase in fiscal 2016 was partially due to a one-time $400,000 cash signing bonus granted to the President and Chief Executive Officer in accordance with his amended employment agreement during fiscal 2016 and due to a one-time $100,000 severance payment made to a former employee during fiscal 2016. Additionally, during fiscal 2016, the Founder and Chairman of the Board was granted a discretionary award of 40,000 shares of restricted stock which will vest in equal annual installments over the next five years and has a grant date fair value of $13.64 per share, for a total grant date fair value of $545,600. Since the Founder and Chairman of the Board is of retirement age, the entire fair value of the grant was fully expensed aton the grant date. Furthermore, the amended employment agreements for the Founder and Chairman of the Board, as well as for the President and Chief Executive Officer, each includes certain performance goals that, once met, entitle them to receive annual cash bonuses. Certain levels of each performance goal were met during fiscal 2016, resulting in $345,000 of bonuses being accrued and expensed as of September 30, 2016. The remaining increase was primarily due to an increase in all employees’ wage rates. General and administrative expenses, as a percentage of gross revenue (which includes Rental Revenue, Reimbursement Revenue and Dividend and Interest Income), remainsremained in-line, at 8% for fiscal years 2016 and 2015. General and administrative expenses, as a percentage of undepreciated assets (which is the Company’s total assets excluding accumulated depreciation), remains in-line, atdecreased to 58 basis points andfrom 61 basis points for the fiscal years 2016 and 2015, respectively.
Amortization of Financing Costs
Amortization of financing costs decreased $169,778, or 13%, during fiscal 2016 as compared to fiscal 2015. During fiscal 2016, unamortized deferred loan costs were written off totaling $167,531 of which $160,124 was associated with one loan that was refinanced and $7,407 was associated with two loans that were paid off prior to maturity. This compares with unamortized deferred loan costs that were written off during fiscal 2015 totaling $479,674 of which $152,050 was associated with three loans that were repaid prior to maturity and $327,624 was associated with the repayment of the former line of credit facility prior to its maturity. The decrease in deferred loan costs written off in fiscal 2016 was partially offset by the increase in normal amortization expensed during fiscal 2016.
| 50 |
Dividend and Interest Income
Dividend and Interest Income increased $1,892,525, or 51%, during fiscal 2016 as compared to fiscal 2015. This is mainly due to the higher average carrying value of the REIT securities portfolio during the fiscal year ended September 30, 2016 compared to during the fiscal year ended September 30, 2015. The REIT securities portfolio weighted average yield for fiscal 2016 was approximately 8.0% as compared to 7.6% for fiscal 2015.
Gain on Sale of Real Estate Investment
Gain on sale of real estate investment for fiscal 2015 represents the gain recognized from the sale of the Company’s 160,000 square foot industrial building located in Monroe, NC for $9,000,000, with net sale proceeds to the Company of approximately $8,847,000. The property was sold to Charlotte Pipe and Foundry Company, the tenant that was leasing the property from the Company through July 31, 2017 at an annual rental rate of approximately $571,000. The Company purchased this property in 2001 and it had a historic cost basis of approximately $5,557,000 and a net book value (net of accumulated depreciation) of approximately $3,825,000. Under U.S. GAAP, the sale resulted in a realized gain of $5,021,242, representing a 131% gain over the depreciated U.S. GAAP basis and a realized gain on a historic cost of approximately $3,290,000, representing a 59% gain over the Company’s historic cost basis. There were no sales of real estate investments during fiscal 2016.
Realized Gain on Sales of Securities Transactions, net
Realized gain on sales of securities transactions, net consisted of the following:
| 2016 | 2015 | |||||||
| Gross realized gains | $ | 4,403,724 | $ | 880,424 | ||||
| Gross realized losses | (5,125 | ) | (74,911 | ) | ||||
| Total Realized Gain on Sales of Securities Transactions, net | $ | 4,398,599 | $ | 805,513 | ||||
The Company had an accumulated net unrealized gain on its securities portfolio of $12,942,267 as of September 30, 2016.
Comparison of Year Ended September 30, 2015 to Year Ended September 30, 2014
The following tables summarize the Company’s rental revenue, reimbursement revenue, real estate taxes, operating expenses, and depreciation expense by category. For the purposes of the following discussion, same properties are properties owned as of October 1, 2013 that have not been subsequently expanded or sold.
Acquired properties are properties that were acquired subsequent to September 30, 2013. Sixteen properties were acquired during fiscal 2015 and fiscal 2014. Acquired properties include the properties located in Buckner (Louisville), KY; Edwardsville (Kansas City), KS; Spring (Houston), TX; Altoona, PA; Tulsa, OK and Indianapolis, IN, (all acquired in fiscal 2014) and Lindale (Tyler), TX; Sauget (St. Louis, MO), IL; Rockford, IL; Kansas City, MO; Frankfort (Lexington), KY; Jacksonville, FL; Monroe (Cincinnati), OH; Greenwood (Indianapolis), IN; Fort Worth (Dallas), TX and Cincinnati, OH (all acquired in fiscal 2015).
Nine property expansions were completed during fiscal 2015 and fiscal 2014. Expanded properties include the properties located in Ft. Mill (Charlotte, NC), SC; Richfield (Cleveland), OH; El Paso, TX; Tampa, FL (FedEx Ground); Cocoa, FL, Monaca (Pittsburgh), PA (NF&M); Oklahoma City, OK and Waco, TX. In addition, the property located in Spring (Houston), TX was expanded, however its activity is included in Acquired properties.
Sold property consists of one property located in Monroe, NC that was sold on September 18, 2015.
As of September 30, 2015 and 2014, the occupancy rates of the Company’s total property portfolio were 97.7% and 95.9%, respectively.
| Rental Revenues | 2015 | 2014 | $ Change | % Change | ||||||||||||
| Same Properties | $ | 42,414,601 | $ | 42,109,581 | $ | 305,020 | 1 | % | ||||||||
| Acquired Properties | 15,118,514 | 5,542,626 | 9,575,888 | 173 | % | |||||||||||
| Expanded Properties | 8,985,030 | 7,766,625 | 1,218,405 | 16 | % | |||||||||||
| Sold Property | 541,240 | 93,333 | 447,907 | 480 | % | |||||||||||
| Total | $ | 67,059,385 | $ | 55,512,165 | $ | 11,547,220 | 21 | % | ||||||||
The increase in rental revenues is mainly due to the increase from the newly acquired properties and expanded properties. Rental revenue from same properties increased due to the increase in same properties occupancy which increased 160 basis points from 94.5% as of September 30, 2014 to 96.1% as of September 30, 2015. In addition, the rental revenue from same properties increased due to an increase in rental rates for the renewed leases as described in the lease renewals and extensions table during fiscal 2015. The rental revenue from the sold property increased because the property was vacant prior to August 2014.
| Reimbursement Revenues | 2015 | 2014 | $ Change | % Change | ||||||||||||
| Same Properties | $ | 7,950,687 | $ | 7,366,341 | $ | 584,346 | 8 | % | ||||||||
| Acquired Properties | 960,793 | 183,274 | 777,519 | 424 | % | |||||||||||
| Expanded Properties | 1,774,622 | 1,607,230 | 167,392 | 10 | % | |||||||||||
| Sold Property | 30,010 | 3,331 | 26,679 | 801 | % | |||||||||||
| Total | $ | 10,716,112 | $ | 9,160,176 | $ | 1,555,936 | 17 | % | ||||||||
Our single tenant properties are subject to net leases which require the tenants to absorb the real estate taxes, insurance and the majority of the repairs and maintenance. As such, the Company is reimbursed by the tenants for these expenses. Therefore, the total increase in reimbursement revenues is partially offset by the increase in real estate taxes, increase in insurance expense and increase in operating expenses. In addition, the increase in reimbursement revenues for same properties is partially due to the increase in same properties occupancy which enabled us to be reimbursed by our tenants for these expenses on properties that were previously vacant. Same properties occupancy increased 160 basis points from 94.5% as of September 30, 2014 to 96.1% as of September 30, 2015. The increase in reimbursement revenues is mainly due to increases in real estate taxes, insurance expenses and operating expenses from the newly acquired properties.
| Real Estate Taxes | 2015 | 2014 | $ Change | % Change | ||||||||||||
| Same Properties | $ | 6,180,550 | $ | 6,164,615 | $ | 15,935 | 0 | % | ||||||||
| Acquired Properties | 667,355 | 99,470 | 567,885 | 571 | % | |||||||||||
| Expanded Properties | 1,440,506 | 1,263,916 | 176,590 | 14 | % | |||||||||||
| Sold Property | 73,724 | 77,610 | (3,886 | ) | (5 | )% | ||||||||||
| Total | $ | 8,362,135 | $ | 7,605,611 | $ | 756,524 | 10 | % | ||||||||
The increase in real estate taxes is mainly due to the newly acquired properties as well as increased assessment values on expanded properties.
| Operating Expenses | 2015 | 2014 | $ Change | % Change | ||||||||||||
| Same Properties | $ | 3,159,415 | $ | 3,027,025 | $ | 132,390 | 4 | % | ||||||||
| Acquired Properties | 426,706 | 123,855 | 302,851 | 245 | % | |||||||||||
| Expanded Properties | 508,782 | 469,243 | 39,539 | 8 | % | |||||||||||
| Sold Property | 32,981 | 91,745 | (58,764 | ) | (64 | )% | ||||||||||
| Total | $ | 4,127,884 | $ | 3,711,868 | $ | 416,016 | 11 | % | ||||||||
The increase in operating expenses is mainly due to the newly acquired properties.
| Net Operating Income (“NOI”) | 2015 | 2014 | $ Change | % Change | ||||||||||||
| Same Properties | $ | 41,025,323 | $ | 40,284,282 | $ | 741,041 | 2 | % | ||||||||
| Acquired Properties | 14,985,246 | 5,502,575 | 9,482,671 | 172 | % | |||||||||||
| Expanded Properties | 8,810,364 | 7,640,696 | 1,169,668 | 15 | % | |||||||||||
| Sold Property | 464,545 | (72,691 | ) | 537,236 | (739 | )% | ||||||||||
| Total | $ | 65,285,478 | $ | 53,354,862 | $ | 11,930,616 | 22 | % | ||||||||
The increase in NOI is mainly due to the newly acquired properties and expanded properties.
| Depreciation | 2015 | 2014 | $ Change | % Change | ||||||||||||
| Same Properties | $ | 12,467,619 | $ | 12,226,797 | $ | 240,822 | 2 | % | ||||||||
| Acquired Properties | 4,823,387 | 1,563,716 | 3,259,671 | 208 | % | |||||||||||
| Expanded Properties | 2,283,696 | 1,988,244 | 295,452 | 15 | % | |||||||||||
| Sold Property | 130,618 | 130,012 | 606 | 0 | % | |||||||||||
| Total | $ | 19,705,320 | $ | 15,908,769 | $ | 3,796,551 | 24 | % | ||||||||
The increase in depreciation expense is mainly due to the newly acquired properties. Depreciation expense from same properties and expanded properties increased mainly due to additional tenant improvements being depreciated within fiscal 2015.
| Interest Expense | 2015 | 2014 | $ Change | % Change | ||||||||||||
| Same Properties | $ | 10,183,806 | $ | 11,398,877 | $ | (1,215,071 | ) | (11 | )% | |||||||
| Acquired Properties | 4,985,596 | 1,614,254 | 3,371,342 | 209 | % | |||||||||||
| Expanded Properties | 1,858,525 | 2,009,346 | (150,821 | ) | (8 | )% | ||||||||||
| Sold Property | 71,287 | 65,876 | 5,411 | 8 | % | |||||||||||
| Loans Payable | 1,458,936 | 1,016,325 | 442,611 | 44 | % | |||||||||||
| Total | $ | 18,558,150 | $ | 16,104,678 | $ | 2,453,472 | 15 | % | ||||||||
The increase in interest expense is mainly due to the acquisition of new properties. Interest expense for same properties decreased mainly due to the decrease in the outstanding balances of the mortgages and the reduction in the weighted average interest rate. The reduction in the outstanding mortgages balance is due to the payoff of five loans during fiscal 2015 totaling $11,176,087 and regularly scheduled principal amortization payments made during fiscal 2015. The weighted average interest rate on the Company’s fixed rate debt as of September 30, 2015 was 4.85% as compared to 5.24% as of September 30, 2014. Loans payable interest expense increased due to the higher weighted average Loans Payable balance maintained during fiscal 2015 as compared to fiscal 2014.
Acquisition Costs
Acquisition costs that were expensed in the Consolidated Statement of Income increased $1,064,208, or 221% during fiscal 2015 as compared to fiscal 2014. The increase is due to the increase in acquisitions during fiscal 2015. Ten properties totaling approximately $191,985,000 were acquired during fiscal 2015 as compared to six properties totaling approximately $97,807,000 that were acquired during fiscal 2014.
General and Administrative Expenses
General and administrative expenses increased $595,991, or 10%, during fiscal 2015 as compared to fiscal 2014. The increase is mainly due to an increase in compensation expense and additional personnel.
Amortization of Financing Costs
Amortization of financing costs increased $560,271, or 77%, during fiscal 2015 as compared to fiscal 2014. The increase is mainly due to the write off of the unamortized deferred loan costs totaling $479,674, of which $152,050 was associated with three loans that were repaid prior to maturity and $327,624 was associated with the repayment of the former line of credit facility prior to its maturity.
Dividend and Interest Income
Dividend and Interest Income for fiscal 2015 was $3,723,867 which is in-line with Dividend and Interest Income of $3,882,597 for fiscal 2014. This is mainly due to the relatively same average carrying value of the REIT securities portfolio during the fiscal year ended September 30, 2015 compared to during the fiscal year September 30, 2014. The REIT securities portfolio weighted average yield for fiscal 2015 was approximately 7.6% as compared to 7.4% for fiscal 2014.
Gain on Sale of Real Estate Investment
Gain on sale of real estate investment for fiscal 2015 represents the gain recognized from the sale of the Company’s 160,000 square foot industrial building located in Monroe, NC for $9,000,000, with net sale proceeds to the Company of approximately $8,847,000. The property was sold to Charlotte Pipe and Foundry Company, the tenant that was leasing the property from the Company through July 31, 2017 at an annual rental rate of approximately $571,000. The Company purchased this property in 2001 and it had a historic cost basis of approximately $5,557,000 and a net book value (net of accumulated depreciation) of approximately $3,825,000. Under U.S. GAAP, the sale resulted in a realized gain of $5,021,242, representing a 131% gain over the depreciated U.S. GAAP basis and a realized gain on a historic cost of approximately $3,290,000, representing a 59% gain over the Company’s historic cost basis. There were no sales of real estate investments during fiscal 2014.
Realized Gain on Sales of Securities Transactions, net
Realized gain on sales of securities transactions, net consisted of the following:
| 2015 | 2014 | |||||||
| Gross realized gains | $ | 880,424 | $ | 2,222,424 | ||||
| Gross realized losses | (74,911 | ) | (55,658 | ) | ||||
| Total Realized Gain on Sales of Securities Transactions, net | $ | 805,513 | $ | 2,166,766 | ||||
The Company had an accumulated net unrealized loss on its securities portfolio of $5,441,603 as of September 30, 2015.
Off-Balance Sheet Arrangements
The Company has not entered into any off-balance sheet arrangements.
Contractual Obligations
The following is a summary of the Company’s contractual obligations as of September 30, 2016:2017:
| Contractual Obligations | Total | Less than one year | 1-3 years | 3-5 years | More than 5 years | Total | Less than one year | 1-3 years | 3-5 years | More than 5 years | ||||||||||||||||||||||||||||||
| Mortgage Notes Payable | $ | 483,748,153 | $ | 57,791,871 | $ | 91,344,821 | $ | 58,064,350 | $ | 276,547,111 | $ | 598,962,567 | $ | 47,115,220 | $ | 95,323,957 | $ | 102,544,414 | $ | 353,978,976 | ||||||||||||||||||||
| Interest on Mortgage Notes Payable | 124,269,946 | 20,485,724 | 32,655,248 | 25,349,490 | 45,779,484 | 158,030,015 | 23,952,986 | 40,932,697 | 32,977,431 | 60,166,901 | ||||||||||||||||||||||||||||||
| Loans Payable | 80,790,684 | 4,790,684 | -0- | 76,000,000 | -0- | 120,091,417 | 10,091,417 | 110,000,000 | -0- | -0- | ||||||||||||||||||||||||||||||
| Interest on Loans Payable | 7,614,201 | 1,959,801 | 3,769,600 | 1,884,800 | -0- | 9,908,874 | 3,440,874 | 6,468,000 | -0- | -0- | ||||||||||||||||||||||||||||||
| Purchase of Properties | 247,472,964 | 188,825,599 | 58,647,365 | -0- | -0- | 139,309,139 | 139,309,139 | -0- | -0- | -0- | ||||||||||||||||||||||||||||||
| Expansions of Existing Properties | 1,002,491 | 1,002,491 | -0- | -0- | -0- | 2,065,755 | 2,065,755 | -0- | -0- | -0- | ||||||||||||||||||||||||||||||
| Operating Lease Obligation | 425,290 | 99,400 | 199,865 | 126,025 | -0- | |||||||||||||||||||||||||||||||||||
| Retirement Benefits | 700,000 | 50,000 | 100,000 | 50,000 | 500,000 | 650,000 | 50,000 | 100,000 | -0- | 500,000 | ||||||||||||||||||||||||||||||
| Total | $ | 945,598,439 | $ | 274,906,170 | $ | 186,517,034 | $ | 161,348,640 | $ | 322,826,595 | $ | 1,029,443,057 | $ | 226,124,791 | $ | 253,024,519 | $ | 135,647,870 | $ | 414,645,877 | ||||||||||||||||||||
| 51 |
Mortgage notes payable represents the principal amounts outstanding by scheduled maturity as of September 30, 2016.2017. Interest is payable on these mortgages at fixed rates ranging from 3.45% to 7.60%, with a weighted average interest rate of 4.48%4.18%. As of September 30, 2016,2017, the weighted average loan maturity of the mortgage notes payable is 10.511.6 years. This compares to a weighted average interest rate of 4.85%4.48% as of September 30, 20152016 and a weighted average loan maturity of the mortgage notes payable of 9.010.5 years as of September 30, 2015.2016. The Mortgage Notes Payable in the above table does not include a fifteen15 year, fully-amortizing mortgage loan of $23,500,000$14,200,000 at a fixed interest rate of 4.23%, which was obtained in connection with the purchase of one property for $35,100,000$21,872,170 subsequent to the fiscal yearend. The cost of this acquisition, purchased subsequent to yearend, at a fixed interest rateis included in the Purchase of 4.03%.Properties in the above table. In addition, the Mortgage Notes Payable in the above table does not include commitments the Company has entered into to obtain five mortgage loansthree mortgages totaling $101,204,000$72,400,000 at fixed interest rates ranging from 3.60%3.53% to 4.20%4.25%, with a weighted average interest rate of 3.83%. Each3.75% and with a weighted average maturity of these five mortgage loan commitments are in connection with commitments to purchase five properties, currently under construction, totaling approximately $153,726,000. Each of these five mortgages will be a fifteen year, fully-amortizing loan.13.2 years.
Loans Payable represents a $2,284,633 term loan at an annual interest rate of 4.90%, which was paid in full on October 28, 2016, a $2,506,051 term loan at a variable annual interest rate of prime plus 0.75% with a floor of 4.50%, maturing on March 9, 2017, and the draw on our Facility of $76,000,000 asAs of September 30, 2016. The interest rate2017, Loans Payable represented the amount drawn down on the $2,506,051 term loan was 4.50% asCompany’s $200,000,000 unsecured line of September 30, 2016.
On September 30, 2016,credit facility (the Facility) in the Company entered into a first amendment toamount of $110,000,000 and the amount drawn down on the Company’s margin line of credit on its existing $130,000,000marketable securities in the amount of $10,091,417. The Facility to exercise its existing $70,000,000 accordion feature (the Amendment), increasing the Facility to $200,000,000. The Amendment also adds an additional $100,000,000 accordion feature, bringing the total potential availability up to $300,000,000, subject to certain conditions. In addition, the amendment extended the maturity date, which was set to mature in August 2019 to now maturematures in September 2020 and haswith a one-year extension option, at the Company’s option of(subject to various conditions as specified in the loan agreement). During the 12 months ended September 30, 2017, the Company subject to certain conditions.had net draws of $34,000,000 under the Facility. Availability under the Facility through December 31, 2016, is limited to 70% of the value of the borrowing base properties, and is limited to 60% of the value of the borrowing base properties thereafter.properties. The value of the borrowing base properties is determined by applying a 7.0% capitalization rate to the net operating incomeNOI generated by the Company’s unencumbered, wholly-owned industrial properties. Borrowings under the Facility, up to the first 60% of the value of the borrowing base properties, will, at the Company’s election, either i) bear interest at LIBOR plus 140 basis points to 220 basis points, depending on the Company’s leverage ratio, or ii) bear interest at BMO’sBMO Capital Markets’ (BMO) prime lending rate plus 40 basis points to 120 basis points, depending on the Company’s leverage ratio. The Company’s borrowings as of September 30, 2016 were less than 60% of the value of the borrowing base properties and2017, based on the Company’sCompany's leverage ratio as of September 30, 2016, borrowings under the Facility2017, bear interest at LIBOR plus 150170 basis points, which was at an interest rate of 2.03%2.94% as of September 30, 2016.2017. In addition, the Company has a $100,000,000 accordion feature, bringing the total potential availability under the Facility (subject to various conditions as specified in the loan agreement) up to $300,000,000.
The Company also invests in equity securities of other REITs which provides the Company with additional diversification, liquidity, and income, and serves as a proxy for real estate when more favorable risk adjusted returns are not available. The Company from time to time may purchase these securities on margin when the interest and dividend yields exceed the cost of funds. In general, the Company may borrow up to 50% of the value of the marketable securities, which was $123,764,770 as of September 30, 2017. As of September 30, 2016, $76,000,000 was drawn down.2017, the Company had borrowings of $10,091,417 under its margin line, bearing interest at 2.05%.
The contractual obligation for interestthe Interest on Loans Payable amount is determined using an interest rate of 4.50% for the $2,506,051 term loan, 4.90% for the $2,284,633 term loan and 2.03%2.94% on the $76,000,000amount drawn down on the unsecured line of credit facility. In addition,facility and is determined using an interest rate of 2.05% for interest on the above table does not includeamount drawn down on the Company’s obligation under its available margin loan, for which no amount was outstanding as of September 30, 2016.loan.
Purchase of properties represents commitments the Company hashad entered into as of September 30, 2017 to purchase ninefour industrial properties totaling approximately 2,438,0001,653,000 square feet. One acquisitionof the four properties, amounting to $35,100,000$21,872,170 and totaling approximately 339,000121,683 square feet, was completedacquired subsequent to the fiscal yearend. The Company expects to close on the remaining eight properties, amounting to approximately $212,373,000$117,437,000 and totaling approximately 2,099,0001,531,000 square feet, during the remainder of fiscal 2017 and 2018, subject to satisfactory completion of due diligence and other customary closing conditions and requirements.
| 52 |
Expansions of existing properties represents the remaining costs expected to be incurred as of September 30, 20162017 in connection with a 50,741 square foot expansion of a buildingtwo parking lot expansions for properties leased to FedEx Ground Package System, Inc. located in Edinburg, TX thatFt. Myers, FL and Indianapolis, IN. The expansion at the property located in Ft. Myers, FL was substantially completed on OctoberSeptember 1, 20162017 for a total project cost of approximately $4,988,000,$862,000, resulting in a new 10 year lease which extended the prior lease expiration date from September 2021 through September 2026.2026 to August 2027. In addition, the expansion resulted in an increase in annual rent effective from the date of completion of approximately $499,000$53,000 from approximately $598,000,$1,365,000, or $5.27$6.39 per square foot to approximately $1,097,000,$1,418,000, or $6.68$6.64 per square foot. The expansion at the property located in Indianapolis, IN was completed on November 1, 2017 for a total project cost of approximately $1,840,000, resulting in a new 10 year lease which extended the prior lease expiration date from April 2024 to October 2027. In addition, the expansion resulted in an increase in annual rent effective from the date of completion of approximately $184,000 from approximately $1,533,000, or $4.67 per square foot, to approximately $1,717,000, or $5.24 per square foot.
Operating lease obligation represents a lease for the Company’s corporate office. Rent for the Company’s corporate office space is at an annual rate of $99,400 or $17.50 per square foot through December 2019 and $100,820 or $17.75 per square foot from January 2020 to December 2021. The Company is also responsible for its proportionate share of real estate taxes and common area maintenance. Mr. Eugene W. Landy, the Founder and Chairman of the Board of the Company, owns a 24% interest in the entity that is the landlord of the property where the Company’s corporate office space is located. Management believes that the aforesaid rent is no more than what the Company would pay for comparable space elsewhere.
Retirement Benefits of $700,000$650,000 represent the total future amount to be paid, on an undiscounted basis, relating to one executive officer, Mr. Eugene W. Landy, the Founder and Chairman of the Board of the Company. These benefits are based upon a specific employment agreement. The agreement does not require the Company to separately fund the obligation and therefore these amounts will be paid from the general assets of the Company. The Company has accrued these benefits on a present value basis over the term of the employment agreement.
Liquidity and Capital Resources
The Company operates as a real estate investment trustREIT deriving its income primarily from real estate rental operations. The Company’s shareholders’ equity increased from $446,010,640 as of September 30, 2015 to $597,858,098 as of September 30, 2016 to $712,865,696 as of September 30, 2017, due the issuance of 6,515,7506,632,713 shares of common stock in the amount of $72,175,797$91,931,831 through the DRIP, stock compensation expense of $926,465,$624,706, exercise of stock options consisting of 245,00065,000 shares for total proceeds of $1,883,300, net income attributable$469,300, Net Income Attributable to common shareholders of $20,531,888,$22,942,234, the issuance of 5,400,0003,000,000 shares issued in connection with an underwritten public offering of its 6.125% Series C Cumulative Redeemable Preferred Stock, net of offering costs in the amount of $130,543,422$71,003,093 and the issuance of 1,439,445 shares issued in connection with the Preferred Stock ATM Program of its 6.125% Series C Cumulative Redeemable Preferred Stock, net changeof offering costs in unrealized gain on investmentsthe amount of $18,383,870.approximately $35,730,000. The increases were partially offset by payments of cash distributions paid to common shareholders of $42,034,183$46,289,248, the net decrease in unrealized gain on investments of $6,371,702 and by the reclassification from shareholders’ equity to a liabilityredemption of the Company’s 7.625%7.875% Series AB Cumulative Redeemable Preferred Stock, that was called forat a redemption and was redeemed on October 14, 2016 in the amount, netprice of redemption costs, of $50,563,101.$25.00 per share, totaling $57,500,000. See further discussion below.
The Company’s ability to generate cash adequate to meet its needs is dependent primarily on income from its real estate investments and its securities portfolio, the sale of real estate investments and securities, refinancing of mortgage debt, leveraging of real estate investments, availability of bank borrowings, proceeds from the DRIP, proceeds from the Preferred Stock ATM Program, proceeds from public offerings and private placements of additional common or preferred stock or other securities, and access to the capital markets. Purchases of new properties, payments of expenses related to real estate operations, capital improvement programs, debt service, general and administrative expenses, and distribution requirements place demands on the Company’s liquidity.
The Company intends to operate its properties from the cash flows generated by the properties. However, the Company’s expenses are affected by various factors, including inflation. Increases in operating expenses are predominantly bornborne by the tenant. To the extent that these increases cannot be passed on through rent reimbursements, these increases will reduce the amount of available cash flow which can adversely affect the market value of the property.
| 53 |
As of September 30, 2016,2017, the Company had $95,749,508$10,226,046 in cashCash and cash equivalentsCash Equivalents and $73,604,894$123,764,770 in marketable securities subject to term loans of $4,790,684.securities. In addition, as of September 30, 2016,2017, the Company also had $124,000,000$90,000,000 available on its Facility. The Facility provides for up to $200,000,000 in available borrowings with a $100,000,000 accordion feature, bringing the total potential availability up to $300,000,000, subject to certain conditions.
The Company has been raising equity capital through its DRIP, Preferred Stock ATM Program, registered direct placements, and the public sale of common and preferred stock and investingthrough its free cash flow generated from its investments in net-leased industrial properties. The Company believes that funds generated from operations, the DRIP, the Preferred Stock ATM Program and bank borrowings, together with the ability to finance and refinance its properties, will provide sufficient funds to adequately meet its obligations over the next few years.
As of September 30, 2016,2017, the Company owned ninety-nine108 properties of which sixty-four59 are subject to mortgages. On August 27, 2015, the Company replaced its prior $60,000,000 unsecured revolving line of credit with the Facility. The Facility is syndicated with three banks led by BMO, Capital Markets (“BMO”), as sole lead arranger, sole book runner, and Bank of Montreal as administrative agent, and includes JPMorgan Chase Bank, N.A. (“J.P. Morgan”)(J.P. Morgan) and RBC Capital Markets (“RBC”)(RBC) as co-syndication agents. The Facility provided for up to $130,000,000 in available borrowings with a $70,000,000 accordion feature, bringing the total potential availability up to $200,000,000, subject to certain conditions. The Facility was set to mature in August 2019 and had a one-year extension option, at the option of the Company. On September 30, 2016, the Company entered into an amendment to the AmendmentFacility (the Amendment), pursuant to which the Company exercised the $70,000,000 accordion feature under the Facility, bringing the maximum availability under the Facility to $200,000,000, and amended the Facility to provide an additional $100,000,000 accordion feature, bringing the total potential availability up to $300,000,000, subject to certain conditions, including, without limitation, obtaining commitments from additional lenders. In addition, the Amendment extended the maturity date of the Facility from August 27, 2019 to September 30, 2020, with a one-year extension option, at the option of the Company, subject to certain conditions. Availability under the Facility through December 31, 2016, is limited to 70% of the value of the borrowing base properties, and is limited to 60% of the value of the borrowing base properties thereafter.properties. The value of the borrowing base properties is determined by applying a 7.0% capitalization rate to the net operating incomeNOI generated by the Company’s unencumbered, wholly-owned industrial properties. Borrowings under the Facility, up to the first 60% of the value of the borrowing base properties, will, at the Company’s election, either i) bear interest at LIBOR plus 140 basis points to 220 basis points, depending on the Company’s leverage ratio, or ii) bear interest at BMO’s prime lending rate plus 40 basis points to 120 basis points, depending on the Company’s leverage ratio. The Company’s borrowings as of September 30, 2016 were less than 60% of the value of the borrowing base properties, and2017, based on the Company’sCompany's leverage ratio as of September 30, 2016, borrowings under the Facility2017, bear interest at LIBOR plus 150170 basis points, which was at an interest rate of 2.03%2.94% as of September 30, 2016.2017. As of September 30, 2016, $76,000,0002017, $110,000,000 was drawn down under the Facility.
In addition, as of September 30, 2016, the Company had Loans Payable of $4,790,684, which consisted of a $2,506,051 term loan at a variable annual interest rate of prime plus 0.75% with a floor of 4.50%, maturing on March 9, 2017 which is secured by 500,000 shares of UMH common stock from The Bank of Princeton and a $2,284,633 term loan at an annual interest rate of 4.90% which is secured by 200,000 shares UMH 8.25% Series A preferred stock from Two River Community Bank. The Two River Community Bank term loan was paid in full on October 28, 2016.
The Company also uses margin loans from time to time for purchasing securities, for temporary funding of acquisitions, and for working capital purposes. The interest rate charged on the margin loans is the bank’s margin rate and was 2.05% and 2.00% as of September 30, 2017 and 2016, and 2015.respectively. The margin loans are due on demand and are collateralized by the Company’s securities portfolio. The Company must maintain a coverage ratio of approximately 50%. At September 30, 2017 and 2016, there was $10,091,417 and 2015, there were no amounts$-0- outstanding under the margin loans.loans, respectively.
The Company’s focus is on real estate investments. The Company has historically financed purchases of real estate primarily through long-term, fixed rate mortgages.
During fiscal 2016,2017, the Company purchased eight10 industrial properties totaling approximately 1,830,0002,784,000 square feet with net-leased terms ranging from tenseven to fifteen years, resulting in a weighted average lease maturity of 12.313.4 years. Approximately 1,567,0001,840,000 square feet, or 86%66%, is leased to FedEx Ground Package System, Inc., a subsidiary of FedEx Corporation (FDX). The aggregate purchase price for the eight10 properties was approximately $210,747,000$286,521,000 and they are located in Colorado, Florida, Kansas, Kentucky, Louisiana,Michigan, New York, North Carolina, PennsylvaniaOhio, Oklahoma, South Carolina and Washington.Texas. These eight10 properties generate annualized rental income over the life of their leases of approximately $14,076,000.$18,953,000. The funds for these eight10 acquisitions were provided by eight10 property level mortgage loans totaling $141,586,000,$188,809,000, draws from the Facility and cash on hand. The eight10 mortgages have a weighted average interest rate of 3.85%3.90% and a weighted average maturity of 14.9 years.
Subsequent to the fiscal yearend, on October 17, 2016,November 2, 2017, the Company purchased a newly constructed 338,584121,683 square foot industrial building, situated on 16.2 acres, located in Hamburg, NY, which is in the Buffalo MSA.Charleston, SC. The building is 100% net-leased to FedEx Ground Package System, Inc.FDX for fifteen15 years through March 2031.August 2032. The purchase price was $35,100,000.$21,872,170. The Company obtained a 15 year fully-amortizing mortgage loan of $23,500,000$14,200,000 at a fixed interest rate of 4.03%4.23%. Annual rental revenue over the remaining term of the lease averages approximately $2,308,000.$1,312,000.
In addition, subsequent to the fiscal yearend, on October 1, 2016, a 50,741 square foot expansion of a building leased to FedEx Ground Package System, Inc. located in Edinburg, TX was substantially completed for a cost of approximately $4,988,000, resulting in a new 10 year lease which extended the prior lease expiration date from September 2021 through September 2026. In addition, the expansion resulted in an increase in annual rent effective from the date of completion of approximately $499,000 from approximately $598,000, or $5.27 per square foot, to approximately $1,097,000, or $6.68 per square foot.
| 54 |
On October 27, 2016, the Company sold its only vacant building (which increased our occupancy rate from 99.6% to 100.0%) consisting of a 59,425 square foot industrial building situated on 4.78 acres located in White Bear Lake, MN for approximately $4,272,000, which is the Company’s approximate U.S. GAAP net book carrying value.
The industrial properties purchased, expandedleased and soldexpanded during fiscal 20172018 to date increased our current total leasable square feet to approximately 16,340,00018,912,000 and increased our occupancy rate to 100.0%99.5%.
In addition to the property purchased subsequent to the fiscal yearend, we haveas described above, the Company has entered into agreements to purchase eightthree new build-to-suit, industrial buildings that are currently being developed in Florida, Michigan, North Carolina, OhioGeorgia and South Carolina totalingOklahoma, consisting of approximately 2,099,0001,531,000 square feet, each with net-leased terms ranging between ten to fifteenof 10 years with a weighted average lease maturity of 13.3 years.each. The purchase price for these properties is approximately $117,437,000. Approximately 1,267,0001,132,000 square feet, or 60%74%, is leased to FDX andan investment grade tenant or its subsidiaries. The purchase price for the eight properties is approximately $212,373,000.subsidiary. Subject to satisfactory due diligence and other customary closing conditions and requirements, we anticipate closing these eight transactions during fiscal 2017 and fiscal 2018. In connection with five of the eightthree properties, the Company has entered into commitments to obtain fivethree mortgages totaling $101,204,000$72,400,000 at fixed rates ranging from 3.60%3.53% to 4.20%4.25%, with a weighted average interest rate of 3.83%. Each3.75% and with a weighted average maturity of these mortgages will be a fifteen year, fully-amortizing loan.13.2 years. The Company may make additional acquisitions in fiscal 20172018 and fiscal 20182019, and the funds for these acquisitions may come from funds generated from operations, mortgages, draws on our unsecured line of credit facility, cash on hand, sale of marketable securities, other bank borrowings, proceeds from the Dividend ReinvestmentDRIP, proceeds from the Preferred Stock ATM Program and proceeds from private placements and public offerings of additional common or preferred stock or other securities. To the extent that funds or appropriate properties are not available, fewer acquisitions will be made.
In addition to the two properties purchased subsequent to the fiscal yearend, as described above, the Company has entered into agreements to purchase two new build-to-suit, industrial buildings that are currently being developed in Florida and Georgia, consisting of approximately 1,231,000 square feet, with net-leased terms of 10 years. The purchase price for these properties is approximately $87,187,000. Approximately 832,000 square feet, or 68%, is leased to an investment grade tenant or its subsidiary. Subject to satisfactory due diligence and other customary closing conditions and requirements, we anticipate closing these transactions during fiscal 2018. In connection with the two properties, the Company has entered into commitments to obtain two mortgages totaling $52,800,000 at fixed rates ranging from 3.53% to 4.25%, with a weighted average interest rate of 3.80% and with a weighted average maturity of 14.4 years. One of these mortgages will be a 15 year, fully-amortizing loan and one will be a 14 year, fully-amortizing loan. The Company may make additional acquisitions in fiscal 2018 and fiscal 2019, and the funds for these acquisitions may come from funds generated from operations, mortgages, draws on our unsecured line of credit facility, cash on hand, sale of marketable securities, other bank borrowings, proceeds from the DRIP, proceeds from the Preferred Stock Purchase Plan (DRIP),ATM Program and proceeds from private placements and public offerings of additional common or preferred stock or other securities. To the extent that funds or appropriate properties are not available, fewer acquisitions will be made.
The Company also invests in marketable securities of other REITs as a proxy for real estate when more favorable risk adjusted returns are not available, for liquidity, and for additional income. The Company generally limits its marketable securities investments to no more than approximately 10% of its undepreciated assets (which is the Company’s total assets excluding accumulated depreciation). The Company from time to time may purchase these securities on margin when there is an adequate yield spread. During fiscal 2016,2017, the Company’s securities portfolio increased $19,063,657,$50,159,876, due to purchases of $71,494,810 offset by the increasedecrease in the net unrealized gain of $18,383,870$6,371,702 and purchases of $19,055,956 offset by the sale of securities with a cost of $18,376,169.$14,963,232. The Company recognized gains on sales of securities of $4,398,599$2,311,714 in addition to earning Dividend and Interest Income of $5,616,392$6,930,564 during fiscal 2016. There2017. In general, the Company may borrow up to 50% of the value of the marketable securities, which was no margin loan balance$123,764,770 as of September 30, 2016 and 2015, respectively.2017. As of September 30, 2017, the Company had borrowings of $10,091,417 under its margin line, bearing interest at 2.05%.
Cash flows provided by operating activities were $73,867,866, $54,699,500 $38,062,285 and $34,856,285$38,062,285 for fiscal years ended September 30, 2017, 2016 2015 and 2014,2015, respectively. The increase in cash flows provided from operating activities from fiscal 2016 to fiscal 2017 and from fiscal 2015 to fiscal 2016 and from fiscal 2014 to fiscal 2015 is primarily due to the increased income generated from acquisitions of properties and expanded operations.
Cash flows used in investing activities were $339,071,013, $227,845,089 $194,469,735 and $131,809,697$194,469,735 for fiscal years ended September 30, 2017, 2016 and 2015, respectively. Cash flows used in investing activities in fiscal 2017 increased as compared to 2016 due mainly to an increase in the purchase of real estate and 2014, respectively.purchase of securities available for sale. Cash flows used in investing activities in fiscal 2016 increased as compared to 2015 due mainly to an increase in the purchase of real estate and capital and land site improvements. Cash flows used in investing activities in fiscal 2015 increased as compared to 2014 due mainly to an increase in purchase of real estate.
| 55 |
Cash flows provided by financing activities were $179,679,685, $256,821,188 $148,006,698 and $105,023,561$148,006,698 for fiscal years ended September 30, 2017, 2016 and 2015, respectively. Cash flows from financing activities decreased in fiscal 2017 as compared to 2016 due mainly to the redemption of 7.625% Series A Preferred Stock and 2014, respectively.7.875% Series B Preferred Stock in the amount of $110,993,750 and the payoff of 16 mortgage notes payable in the amount of $40,037,099. This decrease was offset by an increase in proceeds from mortgage loans in the amount of $35,380,515, the proceeds from the issuance of 4,439,445 shares of the 6.125% Series C Preferred Stock with net proceeds of $106,736,978 and net draws from the Facility of $34,000,000. Cash flows from financing activities increased in fiscal 2016 as compared to 2015 due mainly to an increase in proceeds from mortgage loans in the amount of $44,412,942$31,255,427 and the proceeds from the issuance of 5,400,000 shares of the 6.125% Series C Cumulative Redeemable Preferred Stock (Series C Preferred Stock) with net proceeds of $130,543,422. Cash flows from financing activities increased in fiscal 2015 as compared to 2014 due mainly to an increase in proceeds from mortgage loans in the amount of $59,268,058 and net draws on the line of credit facility of $60,000,000. In addition, the Company paid cash dividends (net of reinvestments), of $36,163,355, $33,665,037 $27,032,958 and $21,906,902$27,032,958 for fiscal 2017, 2016 2015 and 2014,2015, respectively.
As of September 30, 2016,2017, the Company had total assets of $1,229,758,028$1,443,037,755 and liabilities of $631,899,930.$730,172,059. The Company’s total debt to total market capitalization as of September 30, 20162017 and 20152016 was approximately 34%33% and 39%34%, respectively. The Company’s net debt (net of cash and cash equivalents) to total market capitalization as of September 30, 20162017 and 20152016 was approximately 29%32% and 38%29%, respectively. The Company’s net debt, less securities (net of cash and cash equivalents and net of securities) to total market capitalization as of September 30, 20162017 and 20152016 was approximately 25%26% and 33%25%, respectively. The Company believes that it has the ability to meet its obligations and to generate funds for new investments.
The Company has a Dividend Reinvestment and Stock Purchase Plan (DRIP),DRIP, in which participants can purchase stock from the Company at a price of approximately 95% of market value. Amounts received in connection with the DRIP, (including dividend reinvestments of $10,125,894, $8,369,146 $8,489,169 and $7,624,528$8,489,169 for the fiscal years ended September 30, 2017, 2016 and 2015, respectively) were $91,931,831, $72,175,797 and 2014, respectively), were $72,175,797, $48,404,556 and $38,090,334 for the fiscal years ended September 30, 2017, 2016 2015 and 2014,2015, respectively.
During fiscal 2016,2017, the Company paid total distributions to holders of common stock of $42,034,183,$46,289,248, or $0.64 per common share. Of the dividends paid, $8,369,146$10,125,894 was reinvested pursuant to the terms of the DRIP. On October 1, 2015, the Company’s Board of Directors approved a 6.7% increase in the Company’s quarterly common stock dividend, raising it to $0.16 per share from $0.15 per share. This represented an annualized dividend rate of $0.64 per share. On October 2, 2017, the Company’s Board of Directors approved a 6.25% increase in the Company’s quarterly common stock dividend, raising it to $0.17 per share from $0.16 per share. This represents an annualized dividend rate of $0.64$0.68 per share. The Company has maintained or increased its cash dividend for twenty-five26 consecutive years. The Company paid the distributions from cash flows from operations. Management anticipates maintaining the annual dividend rate of $0.64$0.68 per common share although no assurances can be given since various economic factors may reduce the amount of cash flow available to the Company for common dividends. All decisions with respect to the payment of dividends are made by the Company’s Board of Directors.Directors, subject to limitations under our financing arrangements and Maryland law.
During fiscal 2016,2017, the Company paid $8,607,032$14,500,474 in preferred stock dividends and accrued $413,438$361,212 of preferred stock dividends.
On September 13, 2016, the Company issued 5,400,000 shares of 6.125% Series C Preferred Stock at an offering price of $25.00 per share in an underwritten public offering. The Company received net proceeds from the offering, after deducting the underwriting discount and other estimated offering expenses, of approximately $130,543,000. On September 15, 2016, the Company used $45,000,000 of such net proceeds from the offering to reduce the amounts outstanding under its Facility and on October 14, 2016, the Company used $53,493,750 of suchthe net proceeds from the offering to redeem all of the 2,139,750 issued and outstanding shares of its 7.625% Series A Preferred Stock. In addition, on October 14, 2016, the Company used $498,540 of such net proceeds from the offering to pay all dividends, accrued and unpaid, up to and including the redemption date of the 7.625% Series A Preferred Stock. The
On March 9, 2017, the Company intends to use the remaining proceeds to reduce the amounts outstanding under its Facility and to purchase properties and fund expansionsissued an additional 3,000,000 shares of its existing properties in6.125% Series C Preferred Stock, liquidation preference of $25.00 per share, at a public offering price of $24.50 per share, for gross proceeds of $73,500,000, before deducting the ordinary courseunderwriting discount and offering expenses. Net proceeds from the offering, after deducting underwriting discounts and other offering expenses were approximately $71,003,000. On June 7, 2017, the Company used $57,500,000 of businessthe net proceeds from the offering to redeem all of the 2,300,000 issued and for general corporate purposes.outstanding shares of its 7.875% Series B Preferred Stock. In addition, the Company used $75,469 of such net proceeds from the offering to pay all dividends, accrued and unpaid, up to and not including the redemption date of the 7.875% Series B Preferred Stock.
| 56 |
On September 14, 2016,June 29, 2017, the Company announced that it intendedentered into a Preferred Stock ATM Program with FBR Capital Markets & Co. in which the Company may, from time to redeem all 2,139,750 issuedtime, offer and outstandingsell additional shares of its 7.625%6.125% Series A Preferred Stock. As discussed above, the Company redeemed the 7.625% Series AC Preferred Stock, on October 14, 2016 atwith a redemption priceliquidation preference of $25.00 per share, plus all dividends accrued and unpaidhaving an aggregate sales price of up to and including$100,000,000. The Company began selling shares through the redemption date, in an amount equal to $0.23299 per share.Preferred Stock ATM Program on July 3, 2017. As of September 30, 2016,2017, the outstanding 7.625% Series ACompany sold 1,439,445 shares under its Preferred Stock has been reclassified outATM Program at a weighted average price of stockholder's equity$25.31 per share, and is reflected as a liability at redemption value andgenerated net proceeds, after offering expenses, of approximately $35,730,000.
Subsequent to fiscal yearend to date, the Company has recognizedsold 820,290 shares under its Preferred Stock ATM Program at a deemed dividendweighted average price of $2,942,149 on the Consolidated Statement$25.14 per share, and generated net proceeds, after offering expenses, of Income for the fiscal year ended September 30, 2016, which represents the difference between redemption value and carrying value net of original deferred issuance costs.approximately $20,296,000.
The Company is required to pay cumulative dividends on its 7.875% Series B Cumulative Redeemable Preferred Stock (Series B Preferred Stock) in the amount of $1.96875 per share per year, which is equivalent to 7.875% of the $25.00 liquidation value per share. As of September 30, 2016, the Company has a total of 2,300,000 shares of Series B Preferred Stock outstanding, representing an aggregate liquidation preference of $57,500,000.
The Company is required to pay cumulative dividends on the6.125% Series C Preferred Stock in the amount of $1.53125 per share per year, which is equivalent to 6.125% of the $25.00 liquidation value per share. As of September 30, 2016,2017, the Company has a total of 5,400,0009,839,445 shares of 6.125% Series C Preferred Stock outstanding, representing an aggregate liquidation preference of $135,000,000.$245,986,125.
During the year ended September 30, 2016,2017, stock options to purchase 245,00065,000 shares were exercised at a weighted averagean exercise price of $7.69$7.22 per share for total proceeds of $1,883,300.$469,300.
On an ongoing basis, the Company funds capital expenditures primarily to maintain its properties. These expenditures may also include expansions as requested by tenants, or various tenant improvements on properties which are re-tenanted. The amounts of these expenditures can vary from year to year depending on the age of the properties, tenant negotiations, market conditions and lease turnover.
During the fiscal years ended September 30, 2017, 2016 2015 and 2014,2015, the Company completed fifteennine property expansions, at thirteen of its locations, consisting of tensix building expansions and fivethree parking lot expansions. Two of the parking lot expansions included the purchase of additional land. The tensix building expansions resulted in approximately 699,000461,000 additional square feet. Total costs for all fifteennine property expansions were approximately $52,474,000$33,092,000 and resulted in total increased annual rent of approximately $5,180,000. Fourteen$3,226,000. Eight completed expansions resulted in a new ten10 year lease extension for each property that was expanded and one completed expansion resulted in a new twelve12 year lease extension. The weighted average lease extension for these nine property expansions is 10.6 years. In addition, subsequent to the fiscal yearend, on OctoberNovember 1, 2016,2017, a 50,741 square footparking lot expansion of a building was completed for a cost of approximately $4,988,000,$1,840,000, resulting in a new 10 year lease which extended the prior lease expiration date from September 2021 through September 2026.April 2024 to October 2027. In addition, the expansion resulted in an increase in annual rent effective from the date of completion of approximately $499,000$184,000 from approximately $598,000,$1,533,000 to approximately $1,097,000.$1,717,000.
New Accounting Pronouncements
In January 2017, the FASB issued ASU 2017-01, which provides revised guidance to determine when an acquisition meets the definition of a business or should be accounted for as an asset acquisition, likely resulting in more acquisitions being accounted for as asset acquisitions as opposed to business combinations. Transaction costs are capitalized for asset acquisitions while they are expensed as incurred for business combinations. ASU 2017-01 requires that, when substantially all of the fair value of an acquisition is concentrated in a single identifiable asset or a group of similar identifiable assets, the asset or group of similar identifiable assets does not meet the definition of a business. ASU 2017-01 also revises the definition of a business to include, at a minimum, an input and a substantive process that together significantly contribute to the ability to create an output. ASU 2017-01 will be effective, on a prospective basis, for annual and interim reporting periods beginning after December 15, 2017, with early adoption permitted. We adopted ASU 2017-01 as of April 1, 2017, as permitted under the standard. As a result of the implementation of this update, our property acquisitions, which under previous guidance were accounted for as business combinations, are now accounted for as acquisitions of assets. In an acquisition of assets, certain acquisition costs are capitalized as opposed to expensed under accounting for business combinations. For the period April 1, 2017 through September 30, 2017, the Company acquired eight properties, for each of which it was concluded that substantially all of the fair value of the assets acquired with each property acquisition was concentrated in a single identifiable asset and did not meet the definition of a business combination under ASU 2017-01. Therefore, acquisition transaction costs associated with these property acquisitions were capitalized to real estate investments as part of the purchase price.
| 57 |
In August 2016, the Financial Accounting Standards Board (“FASB”)FASB issued Accounting Standards Update (“ASU”)ASU 2016-15, “Statement of Cash Flows (Topic 230), Classification of Certain Cash Receipts and Cash Payments.”Payments” (ASU 2016-15). ASU 2016-15 will make eight targeted changes to how cash receipts and cash payments are presented and classified in the statement of cash flows. ASU 2016-15 is effective for annual reporting periods, including interim reporting periods within those periods, beginning after December 15, 2017. Early adoption is permitted. The Company is currently evaluating the potential impact this standard may have on the consolidated financial statements and the timing of adoption.
In March 2016, the FASB issued ASU 2016-09 “Compensation – Stock Compensation: Improvements to Employee Share-Based Payment Accounting” (ASU 2016-09), which relates to the accounting for employee share-based payments. ASU 2016-09 addresses several aspects of the accounting for share-based payment award transactions, including: (a) income tax consequences; (b) classification of awards as either equity or liabilities; and (c) classification on the statement of cash flows. This standard will be effective for fiscal years beginning after December 15, 2016, including interim periods within those fiscal years. The Company is currently evaluating the potential impact this standard may have on the consolidated financial statements and the timing of adoption.statements.
In February 2016, the FASB issued ASU 2016-02, “Leases” (ASU 2016-02). ASU 2016-02 amends the existing accounting standards for lease accounting, including requiring lessees to recognize most leases on their balance sheets and making targeted changes to lessor accounting. The standard requires a modified retrospective transition approach for all leases existing at, or entered into after, the date of initial application, with an option to use certain transition relief. ASU 2016-02 will be effective for annual reporting periods beginning after December 15, 2018. Early adoption is permitted. The Company is currently evaluating the potential impact this standard may have on the consolidated financial statements and the timing of adoption.
In January 2016, the FASB issued ASU 2016-01, “Financial"Financial Instruments -– Overall: Recognition and Measurement of Financial Assets and Financial Liabilities”Liabilities" (ASU 2016-01). ASU 2016-01 requires equity investments (except those accounted for under the equity method of accounting, or those that result in consolidation of the investee) to be measured at fair value with changes in fair value recognized in net income, requires public business entities to use the exit price notion when measuring the fair value of financial instruments for disclosure purposes, requires separate presentation of financial assets and financial liabilities by measurement category and form of financial asset, and eliminates the requirement for public business entities to disclose the method(s) and significant assumptions used to estimate the fair value that is required to be disclosed for financial instruments measured at amortized cost. These changes become effective for the Company’sCompany's fiscal year beginning October 1, 2018. The Company is currently in the process of evaluating the impact of the adoption on its consolidated financial statements and has not determined the effects of this update on the Company’sCompany's financial position, results of operations or cash flows and disclosures at this time.
In September 2015, the FASB issued ASU 2015-16, “Simplifying the Accounting for Measurement-Period Adjustments”. ASU 2015-16 eliminates the requirement to restate prior period financial statements for measurement period adjustments. The new guidance requires that the cumulative impact of a measurement period adjustment (including the impact on prior periods) be recognized in the reporting period in which the adjustment is identified. ASU 2015-16 is effective for interim and annual periods beginning after December 15, 2015. Early adoption is permitted. The Company does not expect the adoption of ASU 2015-16 to have a material effect on the Company’s consolidated financial statements.
In April 2015, the FASB issued ASU 2015-03, “Interest - Imputation of Interest (Topic 835): Simplifying the Presentation of Debt Issuance Costs” (ASU 2015-03). ASU 2015-03 requires that debt issuance costs related to a recognized debt liability to be presented in the balance sheet as a direct deduction from the carrying amount of thatthe debt liability, consistent with debt discounts. The recognition and measurement guidance for debt issuance costs are not affected by the amendments in this update. The amendments in ASU 2015-03 are effective for fiscal years beginning after December 15, 2015. Early adoption is permitted.liability. In August 2015, the FASB issued ASU 2015-15, “Presentation and Subsequent Measurement of Debt Issuance Costs Associated with Line-of-Credit Arrangements” (Subtopic 835-30), providing guidance regarding the presentation and subsequent measurement ofwhich clarified that debt issuance costs related to line-of-credit arrangements. Given the absence of authoritative guidance on this matter, the SEC staff would not object to an entity deferring and presenting debt issuance costsarrangements may be presented as an asset and subsequently amortizing the deferred debt issuance costs ratablyamortized over the term of the line-of-credit arrangement regardless of whether there are any outstanding borrowings on thatthe line-of-credit arrangement. The Company is currentlyadopted these standards effective October 1, 2016. As a result, debt issuance costs related to debt liabilities that are not line-of-credit arrangements are included as a direct deduction from the related debt liability and those related to line-of-credit arrangements continue to be included as an asset on the accompanying Consolidated Balance Sheets. The effects of this standard were applied retrospectively to all prior periods presented. The effect of the change in accounting principle was the reduction in the processamount of evaluating$6,272,143 of the impactFixed Rate Mortgage Notes Payable liability and a corresponding reduction of the adoptionFinancing Costs asset as of ASU 2015-03September 30, 2016 and ASU 2015-15 will have ona reclassification of Amortization of Financing Costs of $1,116,238 and $1,286,016 for the Company’s financial position or resultsfiscal years ended September 30, 2016 and 2015, respectively, to Interest Expense, including Amortization of operations.Financing Costs in our Consolidated Statement of Income.
| 58 |
In February 2015,May 2014, the FASB issued ASU 2015-02, “Consolidation (Topic 810): Amendments2014-09, “Revenue from Contracts with Customers” (ASU 2014-09), which requires an entity to recognize the Consolidation Analysis”. ASU 2015-02 focusesamount of revenue to minimize situations under previously existingwhich it expects to be entitled for the transfer of promised goods or services to customers. The FASB issued further guidance in which a reporting entityASU 2016-12, “Revenue from Contracts with Customers (Topic 606): Narrow-Scope Improvements and Practical Expedients”, that provides clarifying guidance in certain narrow areas and adds some practical expedients. ASU 2014-09 will replace most existing revenue recognition guidance in U.S. GAAP when it becomes effective. The effective date of ASU 2014-09 was required to consolidate another legal entity in which that reporting entity did not have: (1) the ability through contractual rights to act primarily on its own behalf; (2) ownershipextended by one year by ASU 2015-14, “Revenue from Contracts with Customers (Topic 606): Deferral of the majority ofEffective Date”. The new standard is effective for the legal entity’s voting rights; or (3) the exposure to a majority of the legal entity’s economic benefits. ASU 2015-02 affectsfirst interim period within annual reporting entities that are required to evaluate whether they should consolidate certain legal entities. All legal entities are subject to reevaluation under the revised consolidation model. ASU 2015-02 will be effective for periods beginning after December 15, 2015. Early adoption2017. Therefore, the Company expects to adopt the standard effective October 1, 2018. The standard permits the use of either the retrospective or cumulative effect transition method, and the Company is permitted, including adoptionevaluating which transition method it will elect. The Company is also in an interim period.the process of evaluating the effect that ASU 2014-09 will have on its consolidated financial statements and related disclosures. The Company does not expect the adoption of ASU 2015-02this standard to have a material effectsignificant impact on the Company’sits consolidated financial statements.statements and related disclosures.
Management does not believe that any other recently issued, but not yet effective accounting pronouncements, if adopted, would have a material effect on the accompanying Consolidated Financial Statements.
ITEM 7A – QUANTITATIVE AND QUALITATIVE DISCLOSURES ABOUT MARKET RISK
Market risk includes risks that arise from changes in interest rates, foreign currency exchange rates, commodity prices, equity prices and other market changes that affect market-sensitive instruments. The primary market risk to which management believes the Company is exposed to is interest rate risk. The Company’s future income, cash flows and fair values relevant to financial instruments are dependent upon prevalent market interest rates. Many factors, including governmental monetary and tax policies, domestic and international economic and political considerations and other factors that are beyond the Company’s control contribute to interest rate risk.
The Company is exposed to interest rate changes primarily as a result of its unsecured line of credit facility, margin loans and long-term debt used to maintain liquidity and fund capital expenditures and acquisitions of the Company’s real estate investment portfolio. The Company’s interest rate risk management objectives are to limit the impact of interest rate changes on earnings and cash flows and to lower its overall borrowing costs. To achieve its objectives, the Company matches its assets, which are properties secured by long-term leases, with its liabilities, which are long termlong-term fixed rate loans.
Approximately $486,033,000$598,963,000 of the Company’sCompany's long-term debt as of September 30, 20162017 bears a fixed weighted average interest rate of 4.49%4.18%. Therefore, changes in market interest rates affect the fair value of these instruments. Based on the $76,000,000$110,000,000 drawn down on the Facility and the $10,091,417 drawn down on the margin line of credit as of September 30, 2016,2017, if market rates of interest on the Company’sCompany's variable rate debt increased or decreased by 1%, then the annual increase or decrease in interest costs on the Company’sCompany's variable rate debt would be approximately $760,000$1,200,000 and the increase or decrease in the fair value of the Company’sCompany's fixed rate debt as of September 30, 20162017 would be approximately $19,000,000.$26,000,000.
| 59 |
The following table sets forth information as of September 30, 2016,2017, concerning the Company’s long-term debt obligations, including principal payments by scheduled maturity, weighted average interest rates and estimated fair value:
| Mortgage Notes Payable | Loans Payable | Mortgage Notes Payable | Loans Payable | |||||||||||||||||||||||||||||||||||||||||||||
| Weighted | Weighted | Weighted | Weighted | |||||||||||||||||||||||||||||||||||||||||||||
| Fiscal Year | Average | Average | Average | Average | ||||||||||||||||||||||||||||||||||||||||||||
| Ending September 30, | Carrying Value | Interest Rate | Fair Value | Carrying Value | Interest Rate | Fair Value | Carrying Value | Interest Rate | Fair Value | Carrying Value | Interest Rate | Fair Value | ||||||||||||||||||||||||||||||||||||
| 2017 | $ | 28,574,458 | 6.41 | % | $ | 4,790,684 | 4.69 | % | ||||||||||||||||||||||||||||||||||||||||
| 2018 | 16,448,460 | 6.01 | % | -0- | $ | 8,200,522 | 5.76 | % | $ | 10,091,417 | 2.05 | % | ||||||||||||||||||||||||||||||||||||
| 2019 | 21,226,951 | 6.64 | % | -0- | 17,456,462 | 6.81 | % | -0- | ||||||||||||||||||||||||||||||||||||||||
| 2020 | 5,620,505 | 6.13 | % | 76,000,000 | 2.03 | % | 4,018,223 | 6.12 | % | 110,000,000 | 2.94 | % | ||||||||||||||||||||||||||||||||||||
| 2021 | 2,692,733 | 5.96 | % | -0- | 2,163,540 | 5.97 | % | -0- | ||||||||||||||||||||||||||||||||||||||||
| 2022 | 32,002,980 | 5.26 | % | -0- | ||||||||||||||||||||||||||||||||||||||||||||
| Thereafter | 409,185,046 | 4.14 | % | -0- | 535,120,840 | 3.98 | % | -0- | ||||||||||||||||||||||||||||||||||||||||
| Total | $ | 483,748,153 | 4.48 | % | $ | 493,675,000 | $ | 80,790,684 | 2.19 | % | $ | 80,800,000 | $ | 598,962,567 | 4.18 | % | $ | 608,245,000 | $ | 120,091,417 | 2.87 | % | $ | 120,091,417 | ||||||||||||||||||||||||
On August 27, 2015, the Company replaced its prior $60,000,000 unsecured revolving line of credit with the Facility. The Facility is syndicated with three banks led by BMO, as sole lead arranger, sole book runner, and Bank of Montreal as administrative agent, and includes J.P. Morgan and RBC as co-syndication agents. The Facility provided for up to $130,000,000 in available borrowings with a $70,000,000 accordion feature, bringing the total potential availability up to $200,000,000, subject to certain conditions. The Facility was set to mature in August 2019 and had a one-year extension option, at the option of the Company. On September 30, 2016, the Company entered into the Amendment, pursuant to which the Company exercised the $70,000,000 accordion feature under the Facility, bringing the maximum availability under the Facility to $200,000,000, and amended the Facility to provide an additional $100,000,000 accordion feature, bringing the total potential availability up to $300,000,000, subject to certain conditions, without limitation, obtaining commitments from additional lenders. In addition, the Amendment extended the maturity date of the Facility from August 27, 2019 to September 30, 2020, with a one-year extension option, at the option of the Company. Availability under the Facility through December 31, 2016, is limited to 70% of the value of the borrowing base properties, and is limited to 60% of the value of the borrowing base properties thereafter.properties. The value of the borrowing base properties is determined by applying a 7.0% capitalization rate to the net operating incomeNOI generated by the Company’s unencumbered, wholly-owned industrial properties. Borrowings under the Facility, up to the first 60% of the value of the borrowing base properties, will, at the Company’s election, either i) bear interest at LIBOR plus 140 basis points to 220 basis points, depending on the Company’s leverage ratio, or ii) bear interest at BMO’s prime lending rate plus 40 basis points to 120 basis points, depending on the Company’s leverage ratio. The Company’s current borrowings are less than 60%as of the value of the borrowing base properties andSeptember 30, 2017, based on the Company’s currentCompany's leverage ratio borrowings under the Facilityas of September 30, 2017, bear interest at LIBOR plus 150170 basis points, which was at an interest rate of 2.03%2.94% as of September 30, 2016.2017. As of September 30, 2016, $76,000,0002017, $110,000,000 was drawn down under the Facility.
As of September 30, 2016, the Company had two loans totaling $4,790,684 consisting of a $2,284,633 term loan, (which was paid in full on October 28, 2016) at an annual interest rate of 4.90% and a $2,506,051 term loan maturing on March 9, 2017. Interest on this variable rate term loan accrues at prime plus 0.75% with a floor of 4.50% and the interest rate at September 30, 2016 was 4.50%.
The Company also invests in marketable securities of other REITs and is primarily exposed to market price risk from adverse changes in market rates and conditions. The Company generally limits its marketable securities investments to no more than approximately 10% of its undepreciated assets (which is the Company’s total assets excluding accumulated depreciation). All securities are classified as available for sale and are carried at fair value.
The Company obtains margin loans from time to time, which are secured by its marketable securities. There was no balance$10,091,417 and $-0- outstanding on the margin loan as of September 30, 2017 and 2016, and 2015.respectively. The interest rate on the margin account is the bank’s margin rate and was 2.05% and 2.00% as of September 30, 2017 and 2016, and 2015.respectively. In general, the Company may borrow up to 50% of the value of the marketable securities. The value of the marketable securities was $73,604,894$123,764,770 as of September 30, 2016,2017, representing 5.3%7.7% of the Company’s undepreciated assets (which is the Company’s total assets excluding accumulated depreciation).
| 60 |
ITEM 8 - FINANCIAL STATEMENTS AND SUPPLEMENTARY DATA
The financial statements and supplementary data listed in Part IV, Item 15 (a) (1) are incorporated herein by reference and filed as part of this report.
The following is the Unaudited Selected Quarterly Financial Data:
SELECTED QUARTERLY FINANCIAL DATA (UNAUDITED)
THREE MONTHS ENDED
| FISCAL 2016 | 12/31/15 | 3/31/16 | 6/30/16 | 9/30/16 | ||||||||||||
| Rental and Reimbursement Revenue | $ | 22,259,362 | $ | 22,966,838 | $ | 24,113,999 | $ | 25,575,911 | ||||||||
| Total Expenses | 11,167,093 | 12,537,914 | 11,835,546 | 13,942,992 | ||||||||||||
| Other Income (Expense) | (4,153,614 | ) | (3,296,977 | ) | (4,047,158 | ) | (1,440,309 | ) | ||||||||
| Net Income | 6,938,655 | 7,131,947 | 8,231,295 | 10,192,610 | ||||||||||||
| Net Income Attributable to Common Shareholders | 4,786,897 | 4,980,189 | 6,079,537 | 4,685,265 | ||||||||||||
| Net Income Attributable to Common Shareholders per diluted share | $ | 0.08 | $ | 0.08 | $ | 0.09 | $ | 0.07 | ||||||||
| FISCAL 2015 | 12/31/14 | 3/31/15 | 6/30/15 | 9/30/15 | ||||||||||||
| Rental and Reimbursement Revenue | $ | 17,677,530 | $ | 18,858,596 | $ | 20,672,282 | $ | 20,567,089 | ||||||||
| Lease Termination Income | 238,625 | -0- | -0- | -0- | ||||||||||||
| Total Expenses | 9,582,908 | 10,305,673 | 11,351,102 | 10,875,080 | ||||||||||||
| Other Income (Expense) | (2,909,595 | ) | (3,734,243 | ) | (4,145,322 | ) | (4,525,626 | ) | ||||||||
| Gain on Sale of Real Estate Investment | -0- | -0- | -0- | 5,021,242 | ||||||||||||
| Net Income | 5,423,652 | 4,818,680 | 5,175,858 | 10,187,625 | ||||||||||||
| Net Income Attributable to Common Shareholders | 3,271,894 | 2,666,922 | 3,024,100 | 8,035,867 | ||||||||||||
| Net Income Attributable to Common Shareholders per diluted share | $ | 0.06 | $ | 0.04 | $ | 0.05 | $ | 0.14 | ||||||||
Certain amounts in the Selected Quarterly Financial Data for the prior quarters have been reclassified to conform to the financial statement presentation for the current year.
| FISCAL 2017 | 12/31/16 | 3/31/17 | 6/30/17 | 9/30/17 | ||||||||||||
| Rental and Reimbursement Revenue | $ | 27,181,611 | $ | 27,308,191 | $ | 28,609,096 | $ | 30,447,084 | ||||||||
| Total Expenses | 13,262,730 | 13,785,498 | 14,130,508 | 15,584,318 | ||||||||||||
| Other Income (Expense) | (4,064,960 | ) | (5,098,082 | ) | (2,748,225 | ) | (4,600,576 | ) | ||||||||
| Net Income | 9,853,921 | 8,424,611 | 11,730,363 | 10,262,190 | ||||||||||||
| Net Income Attributable to Common Shareholders | 6,156,161 | 4,842,575 | 5,217,411 | 6,726,087 | ||||||||||||
| Net Income Attributable to Common Shareholders per diluted share | $ | 0.09 | $ | 0.07 | $ | 0.07 | $ | 0.09 | ||||||||
| FISCAL 2016 | 12/31/15 | 3/31/16 | 6/30/16 | 9/30/16 | ||||||||||||
| Rental and Reimbursement Revenue | $ | 22,259,362 | $ | 22,966,838 | $ | 24,113,999 | $ | 25,575,911 | ||||||||
| Total Expenses | 11,167,093 | 12,537,914 | 11,835,546 | 13,942,992 | ||||||||||||
| Other Income (Expense) | (4,153,614 | ) | (3,296,977 | ) | (4,047,158 | ) | (1,440,309 | ) | ||||||||
| Net Income | 6,938,655 | 7,131,947 | 8,231,295 | 10,192,610 | ||||||||||||
| Net Income Attributable to Common Shareholders | 4,786,897 | 4,980,189 | 6,079,537 | 4,685,265 | ||||||||||||
| Net Income Attributable to Common Shareholders per diluted share | $ | 0.08 | $ | 0.08 | $ | 0.09 | $ | 0.07 | ||||||||
| 61 |
ITEM 9 - CHANGES IN AND DISAGREEMENTS WITH ACCOUNTANTS ON ACCOUNTING AND FINANCIAL DISCLOSURE
There were no changes in, or any disagreements with, the Company’s independent registered public accounting firm on accounting principles and practices or financial disclosure during the years ended September 30, 20162017 and 2015.2016.
ITEM 9A- CONTROLS AND PROCEDURES
(a) Disclosure Controls and Procedures
Management, with the participation of our Chief Executive Officer and our Chief Financial and Accounting Officer, evaluated the effectiveness of the design and operation of our disclosure controls and procedures (as defined in Securities Exchange Act of 1934 Rule 13a-15(e) and 15d-15(e)) as of the end of the period covered by this report. Based upon that evaluation, our Chief Executive Officer and our Chief Financial and Accounting Officer concluded that our disclosure controls and procedures were effective as of September 30, 2016.2017.
(b) Management’s Report on Internal Control Over Financial Reporting
Management of the Company is responsible for establishing and maintaining effective internal control over financial reporting (as defined in Rules 13a-15(f) and 15d-15(f) under the Exchange Act).
Management assessed the Company’s internal control over financial reporting as of September 30, 2016.2017. This assessment was based on criteria for effective internal control over financial reporting established inInternal Control — Integrated Frameworkissued by the Committee of Sponsoring Organizations of the Treadway Commission (“COSO”)(COSO) (2013 framework). Based on this assessment, management has concluded that the Company’s internal control over financial reporting was effective as of September 30, 2016.2017.
PKF O’Connor Davies, LLP, the Company’s independent registered public accounting firm, has issued their report on their audit of the Company’s internal control over financial reporting, a copy of which is included herein.
(c) Report of Independent Registered Public Accounting Firm
Report of Independent Registered Public Accounting Firm
The Board of Directors and Shareholders
Monmouth Real Estate Investment Corporation
We have audited Monmouth Real Estate Investment Corporation’s internal control over financial reporting as of September 30, 2016,2017, based on criteria established in Internal ControlIntegratedControl-Integrated Framework issued by the Committee of Sponsoring Organizations of the Treadway Commission (“COSO”)(COSO) (2013 framework). Monmouth Real Estate Investment Corporation’s management is responsible for maintaining effective internal control over financial reporting and for its assessment of the effectiveness of internal control over financial reporting, included in the accompanying Management’s Report on Internal Control Over Financial Reporting. Our responsibility is to express an opinion on the Company’s internal control over financial reporting based on our audit.
We conducted our audit in accordance with the standards of the Public Company Accounting Oversight Board (United States). Those standards require that we plan and perform the audit to obtain reasonable assurance about whether effective internal control over financial reporting was maintained in all material respects. Our audit included obtaining an understanding of internal control over financial reporting, assessing the risk that a material weakness exists, testing and evaluating the design and operating effectiveness of internal control based upon the assessed risk and performing such other procedures as we considered necessary in the circumstances. We believe that our audit provides a reasonable basis for our opinion.
| 62 |
A company’s internal control over financial reporting is a process designed to provide reasonable assurance regarding the reliability of financial reporting and the preparation of financial statements for external purposes in accordance with generally accepted accounting principles. A company’s internal control over financial reporting includes those policies and procedures that (1) pertain to the maintenance of records that, in reasonable detail, accurately and fairly reflect the transactions and dispositions of the assets of the company; (2) provide reasonable assurance that transactions are recorded as necessary to permit preparation of financial statements in accordance with generally accepted accounting principles,principles; (3) receipts and expenditures of the company are being made only in accordance with authorizations of management and directors of the company; and (4) provide reasonable assurance regarding prevention or timely detection of unauthorized acquisition, use or disposition of the company’s assets that could have a material effect on the consolidated financial statements.
Because of its inherent limitations, internal control over financial reporting may not prevent or detect misstatements. Also, projections of any evaluation of effectiveness to future periods are subject to the risk that controls may become inadequate because of changes in conditions, or that the degree of compliance with the policies or procedures may deteriorate.
In our opinion, Monmouth Real Estate Investment Corporation maintained in all material respects, effective internal control over financial reporting as of September 30, 20162017 based on criteria established in Internal Control-Integrated Framework issued by COSO (2013 framework).
We also have audited, in accordance with the standards of the Public Company Accounting Oversight Board (United States), the consolidated balance sheets of Monmouth Real Estate Investment Corporation as of September 30, 20162017 and 2015,2016, and the related consolidated statements of income, comprehensive income, shareholders’ equity and cash flows for each of the three years in the period ended September 30, 20162017 and our report dated November 25, 201628, 2017 expressed an unqualified opinion thereon.
/s/ PKF O’Connor Davies, LLP
New York, New York
November 28, 2017
(d) Changes in Internal Control over Financial Reporting
There have been no changes to our internal controls over financial reporting during the Company’s fourth fiscal quarter ended September 30, 20162017 that have materially affected, or are reasonably likely to materially affect, our internal controls over financial reporting.
None.
| 63 |
ITEM 10 – DIRECTORS, EXECUTIVE OFFICERS AND CORPORATE GOVERNANCE
The following are the Directors and Executive Officers of the Company as of September 30, 2016:2017:
Name |
Age | Present Position with the Company; Business Experience During Past Five Years; Other Directorships |
Director | Class Type (1) | Age | Present Position with the Company; Business Experience During Past Five Years; Other Directorships | Director Since | Class (1) | ||||||||||||
| Anna T. Chew | 58 | Director.Interim Chief Financial Officer (March 2012 to July 2012). Chief Financial Officer (1991 to 2010).
For UMH Properties, Inc., a related company, Vice President and Chief Financial Officer (1995 to present) and Director (1995 to present).
Ms. Chew is a Certified Public Accountant. Ms. Chew’s extensive public accounting, finance and real estate industry experience is the primary reason, among others, why Ms. Chew was selected to serve on our Board. | 2007 | I | ||||||||||||||||
| Daniel D. ronheim | 62 | Director.Attorney at Law (1979 to present). Certified Property Manager (2010 to present). President (2000 to present) of David Cronheim Mortgage Company, a privately-owned real estate investment banker. Executive Vice President (1997 to present) of Cronheim Management Services, Inc., a real estate management firm. Executive Vice President (1989 to present) and General Counsel (1983 to present) of David Cronheim Company, a real estate brokerage firm. Executive Committee (2012 to present), Secretary-Treasurer (2013 to 2015), Vice-President (2015 to 2016) and President (2016 to present) of The Institute of Real Estate Management (IREM) Chapter One (New Jersey). Member and instructor (2014 to present) of the New Jersey State Bar Association Land Use Committee. Member (1986 to 1993) and Chairman (1994 to present) of Borough of Watchung Zoning Board. Mr. Cronheim’s extensive experience in real estate management and the mortgage industry is the primary reason, among others, why Mr. Cronheim was selected to serve on our Board. | 1989 | I | ||||||||||||||||
| Daniel D. Cronheim | 63 | Director.Attorney at Law. Certified Property Manager. President (2000 to present) of David Cronheim Mortgage Company, a privately-owned real estate investment bank. Executive Vice President (1997 to present) of Cronheim Management Services, Inc., a real estate management firm. Executive Vice President (1989 to present) and General Counsel (1983 to present) of David Cronheim Company, a real estate brokerage firm. Executive Committee (2012 to present), Secretary-Treasurer (2013 to 2015), Vice-President (2015 to 2016) and President (2016 to present) of The Institute of Real Estate Management (IREM) Chapter One (New Jersey). Member and instructor (2014 to present) of the New Jersey State Bar Association Land Use Committee. Member (1986 to 1993) and Chairman (1994 to present) of Borough of Watchung Zoning Board. Mr. Cronheim’s extensive experience in real estate management and the mortgage industry is the primary reason, among others, why Mr. Cronheim was selected to serve on our Board. | 1989 | I | ||||||||||||||||
| Catherine B. Elflein | 55 | Independent Director (2).Certified Public Accountant. Senior Director – Risk Management (2006 to present) at Celgene Corporation, a biopharmaceutical company; Controller of Captive Insurance Companies (2004 to 2006) and Director – Treasury Operations (1998 to 2004) at Celanese Corporation. Ms. Elflein’s extensive experience in accounting, finance and risk management is the primary reason, among others, why Ms. Elflein was selected to serve on our Board. | 2007 | III | 56 | Independent Director.(2)Certified Public Accountant. Senior Director – Risk Management (2006 to present) at Celgene Corporation, a biopharmaceutical company; Controller of Captive Insurance Companies (2004 to 2006) and Director – Treasury Operations (1998 to 2004) at Celanese Corporation. Ms. Elflein’s extensive experience in accounting, finance and risk management is the primary reason, among others, why Ms. Elflein was selected to serve on our Board. | 2007 | III | ||||||||||||
| Brian H. Haimm | 48 | Independent Director.(2)Chief Financial Officer and Chief Operating Officer (2006 to present) of Ascend Capital Group International, LLC, a private equity firm. Mr. Haimm’s extensive experience in accounting, finance and the real estate industry is the primary reason, among others, why Mr. Haimm was selected to serve on our Board. | 2013 | II | ||||||||||||||||
| Neal Herstik | 58 | Independent Director.(2)Attorney at Law, Gross, Truss & Herstik, PC (1997 to present). Mr. Herstik’s extensive legal experience and experience in the real estate industry is the primary reason, among others, why Mr. Herstik was selected to serve on our Board. | 2004 | II | ||||||||||||||||
| 64 |
| Name | Age | Present Position with the Company; Business Experience During Past Five Years; Other Directorships | Director Since | Class Type (1) | ||||||||
| Brian H. Haimm | 47 | Independent Director (2).Chief Financial Officer and Chief Operating Officer (2006 to present) of Ascend Capital, a private equity firm. Mr. Haimm’s extensive experience in accounting, finance and the real estate industry is the primary reason, among others, why Mr. Haimm was selected to serve on our Board. | 2013 | II | ||||||||
| Neal Herstik | 57 | Independent Director (2).Attorney at Law, Gross, Truss & Herstik, PC (1997 to present). Mr. Herstik’s extensive legal experience and experience in the real estate industry is the primary reason, among others, why Mr. Herstik was selected to serve on our Board. | 2004 | II | ||||||||
| Matthew I. Hirsch | 57 | Independent Director (2).Attorney at Law (1985 to present) Law Office of Matthew I. Hirsch; Adjunct Professor of Law, Delaware Law School of Widener University (1993 to present).
For UMH Properties, Inc., a related company, Director (2013 to present).
Mr. Hirsch’s experience with real estate transactions, legal issues relating to real estate and the real estate industry is the primary reason, among others, why Mr. Hirsch was selected to serve on our Board. | 2000 | II | ||||||||
| Eugene W. Landy | 82 | Founder and Chairman of the Board (1968 to present), President and Chief Executive Officer (1968 to April 2013) and Director.Attorney at Law. Partner of the Law Firm of Landy & Landy; Chairman of the Board (1995 to present).
For UMH Properties, Inc., a related company, Founder and Chairman of the Board, Director (1969 to present) and President (1969 to 1995).
As our Founder and Chairman, Mr. Landy’s unparalleled experience in real estate investing is the primary reason, among others, why Mr. Landy was selected to serve on our Board. | 1968 | III | ||||||||
| Name | Age | Present Position with the Company; Business Experience During Past Five Years; Other Directorships | Director Since | Class (1) | ||||
| Matthew I. Hirsch | 58 | Independent Director.(2)Attorney at Law (1985 to present), Law Office of Matthew I. Hirsch; Adjunct Professor of Law, Delaware Law School of Widener University (1993 to present).
For UMH Properties, Inc. (UMH), a related company, Director (2013 to present).
Mr. Hirsch’s experience with real estate transactions, legal issues relating to real estate and the real estate industry is the primary reason, among others, why Mr. Hirsch was selected to serve on our Board.
| 2000 | II | ||||
| Eugene W. Landy | 83 | Founder and Chairman of the Board (1968 to present), President and Chief Executive Officer (1968 to April 2013) and Director.Attorney at Law. Chairman of the Board (1995 to present).
For UMH Properties, Inc., a related company, Founder and Chairman of the Board, Director (1969 to present) and President (1969 to 1995).
As our Founder and Chairman, Mr. Landy’s unparalleled experience in real estate investing is the primary reason, among others, why Mr. Landy was selected to serve on our Board. | 1968
| III | ||||
| Michael P. Landy | 55 | President and Chief Executive Officer (April 2013 to present) and Director. Chief Operating Officer (2011 to April 2013), Executive Vice President (2009 to 2010), Executive Vice President-Investments (2006 to 2009), and Vice President-Investments (2001 to 2006). Member of New York University’s REIT Center Board of Advisors (2013 to present).
For UMH Properties, Inc., a related company, Director (2011 to present) and Executive Vice President (2010 to 2012).
Mr. Landy’s role as our President and Chief Executive Officer and extensive experience in real estate finance, investment, capital markets and operations management are the primary reasons, among others, why Mr. Landy was selected to serve on our Board. | 2007 | III |
| 65 |
| Name | Age | Present Position with the Company; Business Experience During Past Five Years; Other Directorships |
Director Since | Class Type (1) | Age | Present Position with the Company; Business Experience During Past Five Years; Other Directorships | Director Since | Class (1) | ||||||||||||
| Michael P. Landy | 54 | President and Chief Executive Officer (April 2013 to present) and Director.Chief Operating Officer (2011 to April 2013), Executive Vice President (2009 to 2010), Executive Vice President-Investments (2006 to 2009), and Vice President-Investments (2001 to 2006). Member of New York University’s REIT Center Board of Advisors (2013 to present).
For UMH Properties, Inc., a related company, Director (2011 to present), Executive Vice President (2010 to 2012) and Vice President-Investments (2001 to 2010).
Mr. Landy’s role as our President and Chief Executive Officer and extensive experience in real estate finance, investment, capital markets and operations management are the primary reasons, among others, why Mr. Landy was selected to serve on our Board. | 2007 | III | ||||||||||||||||
| Samuel A. Landy | 56 | Director. Attorney at Law (1985 to present), Partner of the Law firm of Landy & Landy.
For UMH Properties, Inc., a related company, President and Chief Executive Officer (1995 to present), Vice President (1991 to 1995) and Director (1992 to present).
Mr. Landy’s extensive experience in real estate investment and REIT leadership is the primary reason, among others, why Mr. Landy was selected to serve on our Board. | 1989 | III | 57 | Director.Attorney at Law.
For UMH Properties, Inc., a related company, President and Chief Executive Officer (1995 to present), Vice President (1991 to 1995) and Director (1992 to present).
Mr. Landy’s extensive experience in real estate investment and REIT leadership is the primary reason, among others, why Mr. Landy was selected to serve on our Board. | 1989 | III | ||||||||||||
| Kevin S. Miller | 47 | Chief Financial Officer (July 2012 to present) and Chief Accounting Officer (May 2012 to present).Certified Public Accountant. Assistant Controller and Assistant Vice-President (2005 to May 2012) of Forest City Ratner, a real estate developer, owner and operator and a wholly-owned subsidiary of a publicly-held company, Forest City Realty Trust, Inc. | N/A | N/A | 48 | Chief Financial Officer (July 2012 to present) and Chief Accounting Officer (May 2012 to present) and Director. Certified Public Accountant. Assistant Controller and Assistant Vice-President (2005 to May 2012) of Forest City Ratner, a real estate developer, owner and operator and a wholly-owned subsidiary of a publicly-held company, Forest City Realty Trust, Inc. Mr. Miller’s extensive experience in accounting, finance and the real estate industry is the primary reason, among others, why Mr. Miller was selected to serve on our Board. | 2017 | I | ||||||||||||
| Allison Nagelberg | 51 | General Counsel (2000 to present).Attorney at Law (1989 to present). Ms. Nagelberg also has a Master of Business Administration in Finance.
For UMH Properties, Inc., a related company, General Counsel (2000 to 2013). | N/A | N/A | 52 | General Counsel (2000 to present).Attorney at Law. Ms. Nagelberg also has a Master of Business Administration in Finance.
For UMH Properties, Inc., a related company, General Counsel (2000 to 2013). | N/A | N/A | ||||||||||||
| Gregory T. Otto | 29 | Independent Director.(2)Maritime Professional (2011 to present) with experiences in commerce, maritime security, and intermodal logistics. Consultant for Paul F. Richardson & Associates (2014 to present), focused on maritime business services. Deck Officer for Maersk Line Limited (2011 to 2013). Lieutenant in the U.S. Naval Reserves (2011 to present), specialty in maritime intelligence and select Active Duty experiences (2017 and 2014). Member of the American Society of Transportation & Logistics (2011 to present), the Center for International Maritime Security (2015 to present), and a member of the Washington International Trade Association (2016 to present). Mr. Otto is also an honors Graduate of the U.S. Merchant Marine Academy and holds an unlimited tonnage U.S. Merchant Marine Deck license. Mr. Otto’s extensive experience in logistics, transportation, trade and global markets is the primary reason, among others, why Mr. Otto was selected to serve on our Board. | 2017 | I | ||||||||||||||||
| 66 |
Name |
Age | Present Position with the Company; Business Experience During Past Five Years; Other Directorships |
Director | Class Type (1) | Age | Present Position with the Company; Business Experience During Past Five Years; Other Directorships | Director Since | Class (1) | ||||||||||||
| Scott Robinson | 46 | Independent Director (2). Managing Director, Oberon Securities (2013 to Present); Clinical Professor of Finance and Director of the The REIT Center at New York University (2008 to Present); Managing Partner, Cadence Capital Group (2009 to 2013); Vice President, Citigroup (2006 to 2008); Senior REIT and CMBS analyst (1998 to 2006), Standard & Poor’s. Mr. Robinson’s extensive experience in real estate finance and investment is the primary reason, among others, why Mr. Robinson was selected to serve on our Board. | 2005 | I | ||||||||||||||||
| Scott L. Robinson | 47 | Independent Director.(2)Managing Director, Oberon Securities (2013 to Present); Clinical Professor of Finance and Director of The REIT Center at New York University (2008 to Present); Managing Partner, Cadence Capital Group (2009 to 2013); Vice President, Citigroup (2006 to 2008); Senior REIT and CMBS analyst (1998 to 2006), Standard & Poor’s. Mr. Robinson’s extensive experience in real estate finance and investment is the primary reason, among others, why Mr. Robinson was selected to serve on our Board. | 2005 | I | ||||||||||||||||
| Stephen B. Wolgin | 62 | Lead Independent Director (2).Managing Director of U.S. Real Estate Advisors, Inc. (2000 to present), a real estate advisory services group based in New Jersey. Partner with the Logan Asset Backed Fund, LP (2007 to present). Prior affiliations with J.P. Morgan, Odyssey Associates, The Prudential Realty Group, Standard & Poor’s Corporation, and Grubb and Ellis.
For UMH Properties, Inc., a related company, Director (2007 to present).
Mr. Wolgin’s extensive experience as a real estate and finance consultant and experience in the real estate industry are the primary reasons, among others, why Mr. Wolgin was selected to serve on our Board. | 2003 | II | 63 | Lead Independent Director.(2)Managing Director of U.S. Real Estate Advisors, Inc. (2000 to present), a real estate advisory services group based in New Jersey. Prior Partner with the Logan Asset Backed Fund, LP (2007 to 2017). Prior affiliations with J.P. Morgan, Odyssey Associates, The Prudential Realty Group, Standard & Poor’s Corporation, and Grubb and Ellis.
For UMH Properties, Inc., a related company, Director (2007 to present).
Mr. Wolgin’s extensive experience as a real estate and finance consultant and experience in the real estate industry are the primary reasons, among others, why Mr. Wolgin was selected to serve on our Board. | 2003 | II | ||||||||||||
| (1) | Class I, II, and III Directors have terms expiring at the annual meetings of the Company’s shareholders to be held in 2019, | |
| (2) | Independent within the meaning of applicable New York Stock Exchange listing standards and SEC rules. |
All officers serve at the pleasure of the Board of Directors, subject to the rights, if any, of any officer under any employment contract. Officers are elected by the Board of Directors annually and as may be appropriate to fill a vacancy in an office.
Family Relationships
There are no family relationships between any of the directors or executive officers, with the exception of Samuel A. Landy and Michael P. Landy who are the sons of the Company’s Founder, Eugene W. Landy, who is the Chairman of the Board and a Director of the Company.
| 67 |
Audit Committee
The Company has a separately-designated standing audit committee established in accordance with Section 3 (a)(58)(A) of the Exchange Act (15 U.S.C. 78c(a)(58)(A)). The members of the audit committee are Brian H. Haimm (Chairman), Catherine B. Elflein, Stephen B. Wolgin, Matthew I. Hirsch and Scott L. Robinson. The Company’s Board has determined that Brian H. Haimm, Catherine B. Elflein, Scott L. Robinson and Stephen B. Wolgin are audit committee financial experts and that all members of the audit committee are independent as required by the listing standards of the NYSE. The audit committee operates under the Audit Committee Charter which can be found at the Company’s website at www.mreic.reit. The charter is reviewed annually for adequacy.
Compensation Committee
The Company has a separately-designated standing compensation committee, consisting of three of our independent directors: Stephen B. Wolgin (Chairman), Brian H. Haimm, and Matthew I. Hirsch. The Company’s Board has determined that all members of the Compensation Committee are independent as required by the listing standards of the NYSE. The Compensation Committee operates under the Compensation Committee Charter which can be found at the Company’s website at www.mreic.reit. The charter is reviewed annually for adequacy. The role of the Compensation Committee is discussed in greater detail below in the section on Executive Compensation.
Nominating and Corporate Governance Committee
The Company has a separately-designated standing nominating and corporate governance committee, consisting of two of our independent directors: Matthew I Hirsch (Chairman) and Stephen B. Wolgin. The Company’s Board has determined that all members of the Nominating and Corporate Governance Committee are independent as required by the listing standards of the NYSE. The Nominating and Corporate Governance Committee operates under the Nominating and Corporate Governance Committee Charter which can be found at the Company’s website at www.mreic.reit. The charter is reviewed annually for adequacy. Among its other responsibilities, the Nominating and Corporate Governance Committee identifies and evaluates candidates to be nominated as directors, which may include candidates put forward by shareholders. Qualifications for directors include, but are not limited to, a candidate’s judgment, skill, experience with businesses and organizations comparable to the Company, the interplay of the candidate’s experience with the experience of other Board members, the candidate’s independence according to the rules of the New York Stock Exchange, diversity, and the extent to which the candidate would be a desirable addition to the Board and any of its committees.
Section 16(a) Beneficial Ownership Reporting Compliance
There have been no delinquent filersfilings pursuant to Item 405 of regulation S-K, to the best of management’s knowledge.
Code of Ethics
The Company has adopted the Code of Business Conduct and Ethics applicable to its Chief Executive Officer and Chief Financial Officer, as well as the Company’s other officers, directors and employees (the “Code(Code of Ethics”)Ethics). The Code of Ethics can be found at the Company’s website at www.mreic.reit. The Code of Ethics is also available in print to any person without charge who requests a copy by writing or telephoning us at the following address and telephone number: Monmouth Real Estate Investment Corporation, Attention: Stockholder Relations, 3499 Route 9 North, Suite 3-D, Juniper Business Plaza, Freehold, New Jersey 07728, (732) 577-9996. The Company will satisfy any disclosure requirements under Item 5.05(c) of Form 8-K regarding a waiver from any provision of the Code of Ethics for principal officers or directors by disclosing the nature of such amendment of waiver on our website.
| 68 |
Corporate Governance Materials
Our Corporate Governance Guidelines and Code of Business Conduct and Ethics and the charters for the Audit Committee, Compensation Committee and Nominating and Corporate Governance Committee are published on the Corporate Governance page of the Investor Relations section on our website atwww.mreic.reit. (We are not including the other information contained on, or available through, our website as a part of, or incorporating such information by reference into, this 10-K.)
ITEM 11 - EXECUTIVE COMPENSATION
The following table highlights important aspects of our executive compensation program, which promote good governance and serve the interests of our shareholders.
| Highlights | ||
| Cash bonus program for Chairman and CEO tied to objective financial performance goals | ||
| Total executive compensation for our Named Executive Officers is below the 25th percentile in the REIT industry based upon the 2017 NAREIT Compensation Survey. | ||
| Clawback policy effective October 1, 2017 | ||
| Robust stock ownership guidelines: | ||
● | CEO: 6x base salary (effective September 17, 2015) | |
| ● | Other Named Executive Officers: 2x base salary (effective October 1, 2017) | |
| ● | Directors: 3x annual cash fee (effective September 12, 2017) | |
| ● | Named Executive Officers retain (for a minimum of 24 months) at least 50% of the shares received upon vesting of restricted stock or the exercise of stock options (net of any shares sold or forfeited for payment of exercise price, tax or withholding) (effective October 1, 2017) | |
| Annual say-on-pay vote | ||
| Compensation Committee works with an independent compensation consultant | ||
| No excessive perquisites or other benefits | ||
| No repricing or buyout of stock options | ||
| No excise tax gross-ups | ||
| Average total Director compensation is approximately half of the average total director compensation of Comparable REITs (as defined below) | ||
Compensation Discussion and Analysis
Overview of Compensation Program
The Compensation Committee (for purposes of this analysis,Compensation Discussion and Analysis, the “Committee”) of the Board has been appointed to implement and exercise the Board’s responsibilities relating to the compensation of the Company’s executive officers.officers and directors. The Committee has the overall responsibility for approving and evaluating the executive officer compensation plan, policies and programs of the Company.Company, and does not delegate this responsibility to any other person(s). The Committee’s primary objectives include serving as an independent and objective party to review such compensation plan, policies and programs. The CompensationTo assist in the process, the Committee has not retained or obtained the advice of a compensation committee consultant for determining or recommendingas outlined below in the amountsection entitled Engagement of executive or director compensation.Compensation Consultant.
Throughout this report, the individuals who served as the Company’s Chairman of the Board and the President and Chief Executive Officer and other Officers during fiscal 2016officers included in the Summary Compensation Table presented below in(within this Item 1111) of this report, are sometimes referred to in this report as the named executive officers.Named Executive Officers.
| 69 |
Since 1968, Monmouth has delivered consistent and reliable returns for its shareholders. Over the last 10 years, Monmouth has outperformed the MSCI US REIT Index by a wide margin of over three times. Our total shareholder return (TSR) over the last 10 fiscal years through September 30, 2017 was 273% as compared to 76% for the MSCI US REIT Index during the same period. TSR includes both dividends reinvested and stock price appreciation. Historically, REIT dividends have accounted for approximately 65% of total shareholder return. The Company believes that it is essential that dividends be factored into evaluating a REIT’s economic performance. Our dividend has proven to be very reliable because our industrial properties are predominantly subject to long-term net leases to investment-grade tenants or their subsidiaries. In view of the substantial progress made by the Company during fiscal year 2017, on October 2, 2017, the Company’s Board of Directors approved a 6.25% increase in the Company’s quarterly common stock dividend, raising it to $0.17 per share from $0.16 per share. This represents an annualized dividend rate of $0.68 per share. We have maintained or increased our dividend for 26 consecutive years. We are one of the few REITs that maintained its dividend throughout the Global Financial Crisis. We are also one of the few REITs that is paying out a higher per share dividend today than prior to the Global Financial Crisis.
The following charts illustrate the Company’s outperformance over 1 and 10-year periods as compared to the S&P 500 Index and the MSCI US REIT Index for the same periods:
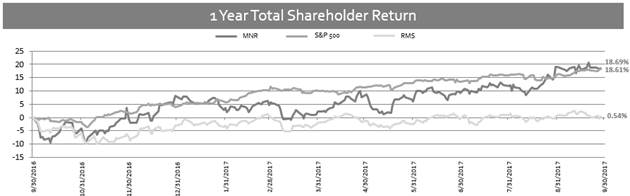
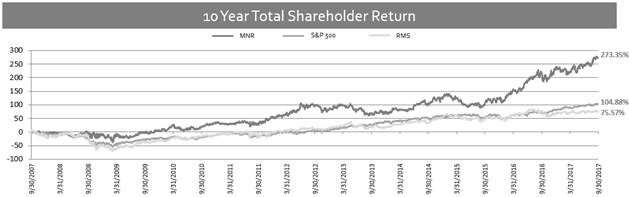
| 70 |
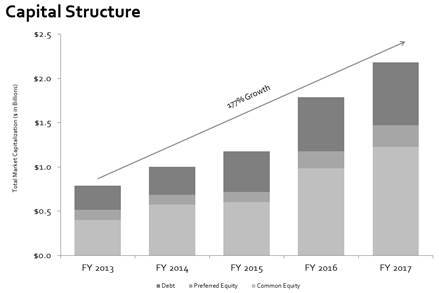
Compensation Philosophy and Objectives
The Committee believes that a well-designed compensation program should align the goalsinterests of the President and ChiefNamed Executive OfficerOfficers with the goalsinterests of the shareholders, and that a significant part of the executives’ compensation, over the long term, should be dependent upon the value created for shareholders. In addition, all executives should be held accountable through their compensation for the performance of the Company, and compensation levels should also reflect the executives’ individual performance in an effort to encourage increased individual contributions to the Company’s performance. TheThis compensation philosophy, as reflected in the Company’s employment agreements with its executives and the overall compensation program, is designed to motivate executives to focus on operating results and create long-term shareholder value by:
| ● | establishing a | |
| ● | rewarding executives for individual accomplishments and achievements; | |
| ● | linking a portion of each executive’s compensation to the achievement of the Company’s business plan by using measurements of the Company’s operating results and shareholder return; and | |
| ● | building a pay-for-performance |
The salaries and bonuses in the Company’s recently executed executive employment agreements are consistent with the Committee’s philosophy and objectives.
The Committee believes that each of the above factors is important when determining compensation levels for named executive officers.Named Executive Officers. The Committee reviews and approves the employment contracts for the Chairman of the Board, and the President and Chief Executive Officer and the other named executive officers, includingNamed Executive Officers, and reviews and approves the performance goals and objectives.objectives applicable to their performance-based compensation. The Committee annually evaluates performance of the executive officersNamed Executive Officers in light of those goals and objectives. The Committee considers the Company’s performance, relative shareholder return, the total compensation provided to comparable officers at similarly-situated companies, and compensation given toearned by the named executive officersNamed Executive Officers in prior years. The Company uses the annual Compensation Survey published by NAREIT (the “Survey”) as a guide to setting compensation levels. Participant company data is not presented in a manner that specifically identifies any named individual or company. This Survey details compensation by position type and company size with statistical salary and bonus information for each position. The sub-sets presented in the Survey used by the Committee for comparison are the industrial property sector, entities with less than $1.5 billion in equity market capitalization and entities with less than 75 full-time employees. The Compensation Committee compares the Company’s salary and bonus amounts to the ranges presented for reasonableness.
The Committee believes executive compensation packages provided by the Company to its executive officersNamed Executive Officers should include both base salaries and annual bonus awards that reward corporate and individual performance, as well as give incentives to executives to meet or exceed established goals. As a result, an important portion of the Company’s compensation program is comprised of discretionary bonuses and equity awards as determined by the Committee in recognition of individual accomplishments and achievements.achievements, as well as overall company performance.
| 71 |
Historically, the Committee has used the annual Compensation Survey published by NAREIT (Survey) as a guide to setting compensation levels. Total executive compensation paid by the Company fell below the lowest range (25th percentile) within the REIT industry based upon the 2017 Compensation Survey published by NAREIT. Participant company data is not presented within the Survey in a manner that specifically identifies any named individual or company. This Survey details compensation by position type and company size with statistical salary and bonus information for each position. The subsets presented in the Survey which the Committee also uses for comparison purposes are the industrial property sector, entities with a total market capitalization between $1.5 billion and $3.0 billion and entities with less than 75 full-time employees. The Committee compares the Company’s salary and bonus amounts to the ranges presented in this Survey for reasonableness.
During the last quarter of fiscal 2017, the Committee engaged FPL Associates (FPL), a nationally recognized compensation consulting firm specializing in the REIT industry, to provide market-based compensation data and to advise the Committee on industry trends and best practices. As a result of the compensation analysis, the Committee is exploring the possibility of providing for a greater percentage of total compensation for our Named Executive Officers to be paid in the form of performance-based equity.
Role of Executive Officers in Compensation Decisions
The Committee makes all final compensation decisions forwith respect to the Company’s named executive officers.Named Executive Officers. The Chairman of the Board and the President and Chief Executive Officer review the performance of the other named executive officersNamed Executive Officers and then present their conclusions and recommendations to the Committee with respect to base salary adjustments, and annual cash bonusbonuses and stock optionoptions or restricted stock awards. The Committee exercises its own discretion in modifying and implementing any recommended adjustments or awards, but does consider the recommendations from management who work closely with the other named executive officers.Named Executive Officers.
Role of Grants of Stock Options and Restricted Stock in Compensation Analysis
The Committee views the grant of stock options and restricted stock awards as a form of long-term compensation. The Committee believes that such grants promote the Company’s goal of retaining key employees, and align the key employees’ interests with those of the Company’s shareholders from a long-term perspective. The number of options or shares of restricted stock granted to each employee, and the performance or time-based vesting criteria associated with each grant, is determined by consideration of various factors including but not limited to the employees’employee’s contribution, title, responsibilities, and years of service. The Committee takes outstanding awards of stock options and restricted stock into account in making its compensation determinations.
Role of Employment Agreements in Determining Executive Compensation
Each of the Company’s currently employed named executive officersNamed Executive Officers is a party to an employment agreement. These agreements provide forestablish the base salaries, bonuses and customary fringe benefits.benefits for each Named Executive Officer. The key elementsemployment agreements also provide for certain severance benefits in the event the Named Executive Officer’s employment is terminated. Such severance benefits are designed to alleviate the financial impact of the Company’s compensation program for the named executive officers aretermination of employment through base salary bonuses, stock options and other benefits,including those providedhealth benefit continuation, with the intent of providing for under the employment agreements and additional discretionary bonuses awarded by the Committee in recognition of individual accomplishments and achievements.Each of these is addressed separately below.a stable work environment. In determining initial compensation, as incorporated into the employment agreements, the Committee considers all elements of a named executive officer’sNamed Executive Officer’s total compensation package in comparison to current market practices and other benefits. In reviewing and setting compensation for the Named Executive Officers, the Committee takes the terms of the employment agreements into consideration.
Shareholder Advisory Vote
One way to determine if the Company’s compensation program reflects the interests of shareholders is through their non-binding vote.advisory vote on our executive compensation practices. At the Annual Meeting of Shareholders held on May 13, 2014, the Company’s shareholders approved by their advisory vote the18, 2017, approximately 85% of votes cast (excluding broker non-votes) were voted in favor of our Say-On-Pay proposal, which we believe affirms our shareholders’ support of our approach to our executive compensation of the named executive officers.program.
| 72 |
We provide our shareholders with the opportunity to vote annually on the advisory approval of the compensation of our Named Executive Officers (Say-on-Pay proposal). The Committee will continue to consider the outcome of our Say-on-Pay proposals when making future compensation decisions for our Named Executive Officers.
Engagement of Compensation Consultant
Pursuant to its charter, the Committee is authorized to retain the services of an executive compensation advisor, in its discretion, to assist with the establishment and review of our compensation programs and related policies. The Committee did not retain a compensation consultant for prior years because the Committee determined that the Survey and other information available to it provided comprehensive information regarding executive compensation levels and structure. In August 2017, the Committee engaged FPL to provide additional market-based compensation data and to advise on industry trends and best practices. In order to help our shareholders fairly evaluate the Company’s executive compensation in light of our relative economic performance, FPL has prepared for the Committee, a peer group of REITs with similar total capitalization, ranging between $1.4 million and $4.0 billion (approximately 0.7x-2.0x Monmouth’s total capitalization), and/or REITs that operate within the industrial REIT sector and with whom we compete for executive employees.
The peer group of comparable REITs (Comparable REITS) identified by FPL are as follows:
| Agree Realty Corporation | |
| EastGroup Properties* | |
| Getty Realty Corporation | |
| Hersha Hospitality Trust | |
| LTC Properties, Inc. | |
| Rexford Industrial Realty, Inc.* | |
| STAG Industrial, Inc.* | |
| Terreno Realty Corporation* | |
| TIER REIT, Inc. | |
| Urstadt Biddle PropertiesInc. |
*Denotes a peer that is in the Industrial sector
The Committee intends to use this data as one tool in considering compensation for our Named Executive Officers for compensation decisions beginning in fiscal 2018. Information about peers includes but is not limited to: base salaries, annual bonuses, long-term equity incentives, composition ranges by position, governance practices, market trends and industry performance. The peer group compensation analyses prepared by FPL will be utilized by the Compensation Committee for informational purposes only and has not been, and will not be utilized for benchmarking purposes as we do not have formal benchmarking policies for comparing to our peers or the market. FPL was engaged in the latter part of fiscal 2017, after all determinations with respect to 2017 compensation of Named Executive Officers was completed; therefore, the impact of FPL’s advice on 2018 compensation decisions has not yet been determined. The Compensation Committee’s executive compensation determinations are subjective and the result of the Compensation Committee’s business judgment, which is informed by peer group data provided by FPL, and will continue to be informed by the experiences of the members of the Compensation Committee. The Compensation Committee ultimately uses its own judgment in making final decisions regarding the compensation paid to our executive officers.
Other than advising the Committee as described above, FPL did not provide any other services to the Company. The Committee has sole authority to hire, terminate and set the terms of engagement with FPL. The Committee has considered the independence of FPL, consistent with the requirements of NYSE, and has determined that FPL is independent. Further, pursuant to SEC rules, the Committee conducted a conflicts of interest assessment and determined that there are no conflicts of interest resulting from retaining FPL. FPL does not provide any services to the Company’s management and has no prior relationship with Company management prior to its engagement by the Committee. The Committee intends to reassess the independence of FPL or any other compensation consultant retained by the Committee at least annually.
| 73 |
Elements of Executive Officer Compensation
In addition to its determination of the executives’ individual performance levels for fiscal 2017, the Committee compared the executives’ total compensation for fiscal 2017 to that of similarly-situated personnel of other comparably sized REITs. Furthermore, the Committee compared the executives’ total compensation for 2017 to that within the REIT industry in the Survey described above. For fiscal 2017, the Company’s total compensation fell below the lowest range (25th percentile) within the REIT industry in the Survey described above.
Our executive compensation structure includes the following objectives and core features:
Base Salaries
Base salaries are the principal fixed component of a Named Executive Officer’s compensation, and are paid for performance of ongoing performanceday-to-day job responsibilities throughout the year. In order to compete for and retain talented executives who are critical to the Company’s long-term success, the Committee has determined that the base salaries of named executive officersNamed Executive Officers should approximate those of executives of other equity REITs that compete with the Company for employees, investors and business, while also taking into account the named executive officers’Named Executive Officers’ performance and tenure, and the Company’s performance relative to the performance reported for companies in the industrial property sector, entities with less than $1.5 billion in equity market capitalization and entities with less than 75 full-time employees within the REIT industry in the Survey described above.
Bonuses
Performance-based Cash Bonus Awards
In addition to the provisions for base salaries under the terms of their employment agreements and discretionary cash bonuses awarded by the Committee in recognition of individual accomplishments and achievements, the Chairman of the Board and the President and Chief Executive Officer are entitled to receive annual cash bonuses for each year during the terms of each respective employment agreement provided certain performance goals set by the Committee as described below are achieved.
For the Chairman of the Board:
| Growth in market cap | 7.5 | % | 12.5 | % | 20 | % | ||||||
| Bonus | $ | 20,000 | $ | 45,000 | $ | 90,000 | ||||||
| Growth in FFO/share | 7.5 | % | 12.5 | % | 20 | % | ||||||
| Bonus | $ | 20,000 | $ | 45,000 | $ | 90,000 | ||||||
| Growth in dividend/share | 5 | % | 10 | % | 15 | % | ||||||
| Bonus | $ | 30,000 | $ | 60,000 | $ | 120,000 | ||||||
| Maximum Bonus Potential | $ | 300,000 |
For the President and Chief Executive Officer (effective through September 30, 2016):
| Growth in market cap | 10 | % | 15 | % | 20 | % | ||||||
| Bonus | $ | 20,000 | $ | 40,000 | $ | 60,000 | ||||||
| Growth in AFFO/share | 15 | % | 20 | % | 25 | % | ||||||
| Bonus (1) | $ | 20,000 | $ | 45,000 | $ | 90,000 | ||||||
| Growth in dividend/share | 5 | % | 10 | % | 15 | % | ||||||
| Bonus | $ | 30,000 | $ | 60,000 | $ | 120,000 | ||||||
| Maximum Bonus Potential | $ | 270,000 |
| 74 |
For the President and Chief Executive Officer (effective October 1, 2016):Officer:
| Growth in market cap | 10 | % | 15 | % | 20 | % | ||||||||||
| Bonus | $ | 40,000 | $ | 60,000 | $ | 80,000 | ||||||||||
| Growth in AFFO/share | 5 | % | 10 | % | 15 | % | 20 | % | ||||||||
| Bonus (2) | $ | 50,000 | $ | 75,000 | $ | 100,000 | $ | 150,000 | ||||||||
| Growth in dividend/share | 5 | % | 10 | % | 15 | % | ||||||||||
| Bonus | $ | 150,000 | $ | 200,000 | $ | 250,000 | ||||||||||
| Maximum Bonus Potential | $ | 480,000 | ||||||||||||||
| Growth in market cap | 10 | % | 15 | % | 20 | % | ||||||||||
| Bonus | $ | 40,000 | $ | 60,000 | $ | 80,000 | ||||||||||
| Growth in AFFO/share | 5 | % | 10 | % | 15 | % | 20 | % | ||||||||
| Bonus(1) | $ | 50,000 | $ | 75,000 | $ | 100,000 | $ | 150,000 | ||||||||
| Growth in dividend/share | 5 | % | 10 | % | 15 | % | ||||||||||
| Bonus | $ | 150,000 | $ | 200,000 | $ | 250,000 | ||||||||||
| Maximum Bonus Potential | $ | 480,000 |
Based on meeting(1) Provided that FFO is equal to or in excess of the performance targets set forth above, a $210,000 cash bonus for thedividend
Our Chairman of the Board was accrued as of September 30, 2016, which was paid in October 2016 andearned a $90,000 cash bonus for fiscal 2017 based on meeting the performance targets set forth above, a $135,000 cash bonus was accrued for theCompany’s growth in market cap, and our President and Chief Executive Officer as of September 30, 2016, which was paidearned a $130,000 cash bonus for fiscal 2017 based on the Company’s growth in October 2016.market cap and growth in AFFO/share.
In addition to its determination of the executives’ individual performance levels for 2016, the Committee compared the executives’ total compensation for 2016 to that of similarly-situated personnel of other comparably sized REIT’s. Furthermore, the Committee compared the executives’ total compensation for 2016 to that within the REIT industry in the Survey described above. For fiscal 2016, the Company’s total compensation fell in the lowest range (25th percentile) within the REIT industry in the Survey described above.Discretionary Cash Bonus Awards
The Committee considers and approves discretionary cash bonuses to be awarded tofor the Chairman of the Board and the President and Chief Executive Officer.Officer annually. Discretionary cash bonuses awarded to the other named executive officersNamed Executive Officers are recommendedbased on recommendations made annually by the Chairman of the Board and the President and Chief Executive Officer, which are then considered and are approved by the Committee.Committee in its discretion. The Committee believes that short-term rewards in the form of discretionary cash bonuses to senior executives generally should reflect short-term results and should take into consideration both the profitability and performance of the Company and the performance of the individual, which may include comparing such individual’s performance to the preceding year, reviewing the breadth and nature of the senior executives’ responsibilities and valuing special contributions by each such individual. In evaluating the performance of the Company annually for purposes of discretionary cash bonuses, the Committee considers a variety of factors, including, among others, Funds From Operations (FFO), Adjusted Funds From Operations (AFFO), net income, growth in asset size, amount of space under lease and total return to shareholders. The Company considers FFO to be an important measure of an equity REIT’s operating performance and has adopted the definition suggested by NAREIT, which defines FFO to mean net income computed in accordance with U.S. GAAP, excluding gains or losses from sales of property, plus real estate related depreciation and amortization. The Company defines AFFO as FFO plus acquisition costs and costs associated with the Redemption of Preferred Stock less recurring capital expenditures and excluding the following: lease termination income, gains or losses on securities transactions, stock based compensation expense, amortization of financing and leasing commission costs, depreciation of corporate office tenant improvements, straight-line rent adjustments and non-recurring other expense. The Company considers FFO and AFFO to be meaningful additional measures of operating performance, primarily because they exclude the assumption that the value of its real estate assets diminishes predictably over time and because industry analysts have accepted these as performance measures.
Other factors considered include the employee’s title and years of service. The employee’s title generally reflects the employee’s responsibilities and the employee’s years of service may be considered in determining the level of discretionary cash bonus in comparison to base salary. The Committee has declined in the past to use specific performance formulas with respect to the cash bonuses awarded to the other named executive officers,Named Executive Officers, believing that with respect to Company performance, such formulas do not adequately account for many factors, including, among others, the relative performance of the Company compared to its competitors during variations in the economic cycle, and that with respect to individual performance, such formulas are not a substitute for the subjective evaluation by the Committee of a wide range of management and leadership skills of each of the senior executives.
In setting discretionary bonuses for fiscal 2016,2017, the Committee considered the performance of the Chairman of the Board and the President and Chief Executive Officer and received the recommendations from the Chairman of the Board and the President and Chief Executive Officer for the discretionary cash bonuses to be awarded to the other named executive officers.Named Executive Officers. The factors that wereCommittee also considered management’s report on the Company’s progress toward its fiscal 2017 achievements in awardingfinancial performance and strategic growth, and the discretionary cash bonuses included the following progress that was made by the Company due to the effortsrole of management:each Named Executive Officer in delivering these achievements:
| 75 |
Financial Performance
| ● | |||
| ● | Growth in Total Shareholder Return: Achieved | ||
| ● | Growth in Gross Leasable Area: Achieved | ||
| ● | |||
| ● | Growth in AFFO per Diluted Share*: Generated 9% year over year growth in adjusted funds from operation (AFFO) per diluted share for fiscal 2017. |
Strategic Growth
| ● | |||
| ● | |||
| ● | |||
| ● | |||
| ● | Follow-On Preferred Stock Offering: On | ||
| ● | |||
| ● | |||
| ● | Tenant Occupancy: Achieved | ||
| ● | |||
| Administrative Expense: Managed |
| 76 |
*AFFO is a non-GAAP performance measure. See Financial Information for a discussion of our non-GAAP performance measures.
After considering the Company’s progress towards its fiscal 2017 financial performance and strategic growth achievements, as outlined above, as well as the individual performance of the Chairman of the Board, and the President and Chief Executive Officer and the other Named Executive Officers, and the recommendations of the Chairman of the Board and the President and Chief Executive Officer as to the other named executive officers,Named Executive Officers, the Committee allocatedestablished the individual discretionary cash bonus tobonuses for the named executive officersNamed Executive Officers based on the named executive officers’Company’s overall performance and the Named Executive Officers’ individual contributions to these accomplishments. Other factors considered in this allocationdetermining individual bonus amounts included the named executive officers’Named Executive Officers’ responsibilities and years of service. During fiscal 2016,2017, the Chairman of the Board received a discretionary cash bonus of $65,769. During fiscal 2016,$66,558, the President and Chief Executive Officer received a discretionary cash bonusesbonus of $501,202 which includes$105,000, the Chief Financial and Accounting Officer received a $400,000discretionary cash signing bonus in accordance with his amendedof $81,000 and restated Employment Agreement entered into on January 11, 2016.the General Counsel received a discretionary cash bonus of $63,125.
Long-Term Equity Incentive Compensation
In part based on market-based compensation data and information on industry trends and best practices received from FPL, the Committee is considering providing for a greater percentage of total compensation for our Named Executive Officers to be paid in the form of performance-based equity and is exploring the possibility of developing a long-term performance-based equity compensation plan. All grants of equity will be made pursuant to the Company’s Amended and Restated 2007 Incentive Award Plan, which was approved by the Company’s shareholders on May 18, 2017.
Stock Options and Restricted Stock
The employment agreement for the Chairman of the Board states that he will receive stock options to purchase 65,000 shares of stock annually. The employment agreement for the President and Chief Executive Officer states that he will be entitled to equity awards of up to 25,000 shares of restricted stock each year based on achievement of performance objectives as determined by the Compensation Committee.Committee including, but not limited to, AFFO per share growth, acquisitions and total return performance. In addition, the Compensation Committee has the discretion to make additional awards of stock options and restricted stock for outstanding performance. In recognition of Mr. Eugene Landy’s extraordinary contributions to the Company over the last five decades and, in particular, over the last year, on September 14, 2016, the Compensation Committee approved and granted a discretionary award of 40,000 shares of restricted common stock. The stock, which will vest in equal annual instalments over the next five years, has a grant date fair value of $13.64 per share, for a total grant date fair value of $545,600. When awarding these shares of restricted stock, the Compensation Committee took into account Mr. Eugene Landy’s recent contributions towards the progress that the Company made considered by the Committee in awarding discretionary cash bonuses, as further detailed above, under the heading “Bonuses”.
For the other senior executives,Named Executive Officers, the Chairman of the Board and the President and Chief Executive Officer make a recommendation to the Committee offor specific stock optionoptions or restricted stock grants. In making its decisions, the Committee does not use an established formula or focus on a specific performance target. The Committee recognizes that often outside forces beyond the control of management, such as economic conditions, changing leasing and real estate markets and other factors, may contribute to less favorable near termnear-term results even when sound strategic decisions have been made by the senior executives to position the Company for longer term profitability. Thus, the Committee also attempts to identify whether the senior executives are exercising the kind of judgment and making the types of decisions that will lead to future growth and enhanced asset value, even if the same are difficult to measure on a current basis. For example, in determining appropriate stock option and restricted stock awards, the Committee considers, among other matters, whether the senior executives have executed strategies that will provide adequate funding or appropriate borrowing capacity for future growth, whether acquisition and leasing strategies have been developed to ensure a future stream of reliable and increasing revenues for the Company, whether the selection of properties, tenants and tenant mix evidence appropriate risk management, including risks associated with real estate markets and tenant credit, and whether the administration of staff size and compensation appropriately balances the current and projected operating requirements of the Company with the need to effectively control overhead costs, while continuing to grow the enterprise. NoOther than the equity awards required to be paid to our Chairman of the Board pursuant to his employment agreement and amounts awarded to Named Executive Officers who are also directors as part of the Company’s Director Compensation Plan , no equity awards were made to other named executive officersNamed Executive Officers during fiscal 2016.2017.
| 77 |
Other Personal Benefits
The Company’s employment agreements provide the named executive officersNamed Executive Officers with other personal benefits that the Company and the Committee believe are reasonable and consistent with its overall compensation program to better enable the Company to attract and retain superior employees for key positions. The Committee periodically reviews the levels of other personal benefits provided to the named executive officers.Named Executive Officers.
The named executive officersNamed Executive Officers are provided the following benefits under the terms of their employment agreements: an allotted number of paid vacation weeks; eligibility for the executive, as well as spouse and dependents where applicable, in all Company sponsored employee benefits plans, including 401(k) plan, group health, accident, and life insurance, on terms no less favorable than applicable to any other executive; and supplemental disability insurance, at the Company’s cost, as agreed to by the Company and the named executive officer.cost. Attributed costs of the personal benefits described above for the named executive officersNamed Executive Officers for the fiscal year ended September 30, 2016,2017, are included in “All Other Compensation” of the Summary Compensation Table provided below under Item 11 of this report.
Payments upon Termination or Change in Control
In addition, the named executive officers’Named Executive Officers’ employment agreements each contain provisions relating to change in control events. The employment agreements also contain severance or continuation of salary payments upon any termination of the named executive officers’Named Executive Officers’ employment, except in the case of Mr. Miller or Ms. Nagelberg, whose severance payments are for eventsonly upon a termination other than for cause (as defined under the terms of the employment agreements). These change in control and severance terms have been deemed reasonable by the Compensation Committee.Committee based on the tenure and performance of each Named Executive Officer. Information regarding these provisions is included in “Employment Agreements” provided below in this Annual Report. There are no other agreements or arrangements governing change in control payments.
Evaluation
Mr. Eugene Landy is employed under an Amended Employment Agreement with the Company. In January 2016, based on the Committee’s evaluation of his performance, his base compensation under his amended contract was increased from $410,000 to $430,500 per year.
In evaluating Mr. Eugene W. Landy’s and Mr. Michael P. Landy’s eligibility for an annual bonus,cash bonuses, the Committee used the bonus schedule included in Mr. Eugene Landy’stheir respective Amended Employment AgreementAgreements as a guide.
In recognition of Mr. Eugene Landy’s extraordinary contributions to the Company over the last five decadesguide and, in particular, overconsidering discretionary cash bonuses for all Named Executive Officers, considered the last year, as well as his contributions toward the Company’s progress as furtherfactors detailed above under the heading “Bonuses”, on September 14, 2016, the Compensation Committee determined to grant to Mr. Landy 40,000 shares of restricted common stock. The restricted stock, which will vest in equal annual installments over the next five years, has a grant date fair value of $13.64 per share, for a total grant date fair value of $545,600. In evaluating Mr. Eugene Landy’s eligibility for an annual bonus, the Compensation Committee used the bonus schedule included in Mr. Eugene Landy’s employment agreement as a guide and, in addition, considered the factors as further detailed above, under the heading “Bonuses” in considering Mr. Eugene Landy’s eligibility for a discretionary cash bonus.“Bonuses.”
The Compensation Committee also reviewed the progress made by Mr. Michael P. Landy, President and Chief Executive Officer, as well as his contributions toward the progress that the Company has made that enabled the Company to reach the milestones as further detailed above,discussed under the heading “Bonuses”. above. Mr. Michael Landy is employed under an employment agreement with the Company. His base compensation under this contract was $551,250 for fiscal 2016. Effectiveincreased effective October 1, 2016 Mr. Landy’s annual base compensation was increased to $750,000 from $551,250 and will increase by 5% each year through fiscal 2021. The amended employment agreement has an initial term of five years, and is renewed automatically for a new five-year term on the first day of each calendar quarter after the effective date unless otherwise terminated, and contains provisions for continuation of salary payments through the expiration of the term of the agreement upon any termination of the Mr. Landy’s employment. Upon execution of the amended employment agreement in January 2016, Mr. Landy received a cash signing bonus of $400,000 in recognition of the substantial progress that the Company has made under his leadership. In considering the new employment agreement, and signing bonus, the Compensation Committee took into account the transformative changes that Company has enjoyedexperienced over the past several years, which include the Company’s total market capitalization growing more than three-foldfour-fold since fiscal 2010, and the company’s total assets nearly tripling as well since that time, while the Company’s general and administrativeG&A expenses only doubled over this period. In evaluating Mr. Michael Landy’s eligibility for
| 78 |
Effective January 1, 2017, the Company and Ms. Allison Nagelberg entered into a new three-year employment agreement, under which Ms. Nagelberg receives an annual bonus,base salary of $358,313 for calendar year 2017, $376,228 for calendar year 2018, and $395,040 for calendar year 2019, plus bonuses and customary fringe benefits. Under the Compensation Committee used the bonus schedule included in Mr. Michael Landy’s employment agreement, Ms. Nagelberg is also entitled to four weeks’ vacation, annually. The Company reimburses Ms. Nagelberg for the cost of a disability insurance policy such that, in the event of Ms. Nagelberg’s disability for a period of more than 90 days, Ms. Nagelberg will receive benefits up to 60% of her then-current salary. In the event of a merger, sale or change of voting control of the Company, excluding transactions between the Company and UMH, Ms. Nagelberg will have the right to extend and renew this employment agreement so that the expiration date will be three years from the date of merger, sale or change of voting control, or Ms. Nagelberg may terminate the employment agreement and be entitled to receive one year’s compensation in accordance with the agreement. If there is a termination of employment by the Company or Ms. Nagelberg for any reason, either involuntary or voluntary, including the death of the employee, other than a termination for cause as a guidedefined by the agreement, Ms. Nagelberg shall be entitled to the greater of the base salary due under the remaining term of the agreement or one year’s compensation at the date of termination, paid monthly over the remaining term or life of the agreement.
All Named Executive Officers were awarded their respective compensation based on their respective Employment Agreements and in addition, considered the factors discussedmany contributions that they have made towards the Company’s progress, as further detailed above, under the heading “Bonuses” in considering Mr. Michael Landy’s eligibility for a discretionary cash bonus.
. The Committee has also approvedconsidered the recommendations of the Chairman of the Board and the President and Chief Executive Officer concerning the other named executive officers’Named Executive Officers’ annual salaries, bonuses, and fringe benefits.
Effective January 1, 2016, Mr. Miller’s annual baseClawback Policy
In October 2017, the Committee adopted a clawback policy that provides that in the event of a material restatement of the Company’s financial results, other than a restatement caused by a change in applicable accounting rules or interpretations, the Committee will review the performance-based compensation was increasedof the Company’s Named Executive Officers, as defined in the Company’s Proxy Statement from $242,550year to $360,000year, for the calendar year ending December 31, 2016,three years prior to such material restatement. If the Committee determines that the amount of any performance-based compensation actually paid or awarded to a Named Executive Officer (Awarded Compensation) would have been lower if it had been calculated based on such restated financial statements (Actual Compensation) and will increase by 5% each calendar year through December 31, 2018. Mr. Miller’s employment agreement was also amendedthat such executive officer engaged in actual fraud or willful unlawful misconduct that materially contributed to provide that, upon a change of controlthe need for the restatement, then the Committee may direct the Company to recoup the after-tax portion of the Company, Mr. Miller may extenddifference between the Awarded Compensation and renew the amended employment agreementActual Compensation for three years from the dateNamed Executive Officers. The Committee has absolute discretion to administer and interpret this policy in the best interests of the changeCompany.
Ownership Guidelines
In order to encourage our directors and Named Executive Officers to retain investments in the Company and help further align their interests with the interests of control,our stockholders, the Committee has adopted stock ownership guidelines applicable to our directors, our Chief Executive Officer and our other Named Executive Officers, recommending that they hold the following amounts of our stock:
| Position | Stock Ownership Guideline | |
| Chief Executive Officer | 6x base salary | |
| Other NEOs | 2x base salary | |
| Director | 3x annual cash fee | |
| All NEOs | 50% of net shares received upon exercise/vesting of equity awards (24 month holding period) |
For purposes of determining compliance with these ownership guidelines (other than the holding period for vested equity compensation), the value of each director’s or alternatively, terminateofficer’s stock holdings will be calculated based on the amended employment agreement and receive the greaterclosing price of a share of the Company’s common stock on the last trading day of the Company’s fiscal year, which was $16.19 on September 29, 2017. Shares owned by a director or officer include: shares owned outright by the director or officer or by his or her immediate family members residing in the same household; shares held in trust or under a similar arrangement for the economic benefit of the director or officer; restricted or unrestricted stock issued as part of the director or officer’s compensation, whether or not vested; shares acquired upon option exercise that the director or executive officer continues to own; and shares held for the director or executive officer’s account in a 401(k) or other retirement plan.
| 79 |
Our Chief Executive Officer Stock Ownership Policy was adopted in September 2015. As of September 30, 2017, Mr. Michael P. Landy, our President and Chief Executive Officer, owned stock valued at more than 13x his base salary due under the remaining term of the agreement or one year’s base salary at the date of termination. Mr. Miller was awarded his new amended employment agreement because of the many contributions he has made towardsand which is also approximately 2.0x the Company’s progress, as further detailed above, under the heading “Bonuses”.CEO stock ownership requirement. Our Director Stock Ownership policy was adopted effective September 12, 2017, and our other stock ownership policies were adopted effective October 1, 2017.
The aggregate stock ownership of Company directors and officers represents approximately 4.6% of the Company’s outstanding common stock, which currently represents the third largest block of shareholders behind two institutional investors and helps align our management’s interests with our shareholders’ interests.
Compensation Committee Report
The Compensation Committee of the CompanyCompany’s Board of Directors has reviewed and discussed the Compensation Discussion and Analysis required by Item 402(b) of Regulation S-K with management and, based on such review and discussions, the Compensation Committee recommended to the boardCompany’s Board of Directors that the Compensation Discussion and Analysis be included in this report.
| Compensation Committee: | |
| Stephen B. Wolgin (Chairman) | |
| Brian H. Haimm | |
| Matthew I. Hirsch |
| 80 |
Summary Compensation Table
The following Summary Compensation Table shows compensation paid or accrued by the Company for services rendered during the fiscal years ended September 30, 2017, 2016, 2015, and 20142015 to the named executive officers.Named Executive Officers. There were no other executive officers whose aggregate compensation allocated to the Company for fiscal 20162017 exceeded $100,000.
Name and Principal Position | Fiscal Year | Salary ($) | Bonus ($) | Restricted Stock Awards (4) | Option Awards ($) (5) | Non-Equity Incentive Plan Compensation ($) | Change in PensionValue And Nonqualified Deferred Compensation Earnings ($) | All Other Compensation ($) | Total ($) | Fiscal Year | Salary ($) | Bonus ($) | Restricted and Unrestricted Stock Awards $ (4) | Option Awards ($) (5) | Non-Equity Incentive Plan Compensation ($) | Change in Pension Value And Nonqualified Deferred Compensation Earnings ($) | All Other Compensation ($) | Total ($) | ||||||||||||||||||||||||||||||||||||||||||||||||||
| Eugene W. Landy | 2016 | $ | 425,375 | $ | 65,769 | $ | 545,600 | $ | 48,340 | $ | 210,000 | $ | 16,601 (1) | $ | 49,500 (2) | $ | 1,361,185 | 2017 | $ | 430,500 | $ | 66,558 | $ | 17,130 | $ | 104,650 | $ | 90,000 | $ | 13,929 | (1) | $ | 58,750 | (2) | $ | 781,517 | ||||||||||||||||||||||||||||||||
| Chairman of the Board | 2015 | 403,750 | 24,808 | 59,320 | 60,315 | -0- | 19,075 (1) | 47,000 (2) | 614,268 | 2016 | 425,375 | 65,769 | 545,600 | 48,100 | 210,000 | 16,601 | (1) | 49,500 | (2) | 1,360,945 | ||||||||||||||||||||||||||||||||||||||||||||||||
| 2014 | 357,500 | 27,500 | -0- | 34,549 | 90,000 | 30,625 (1) | 42,000 (2) | 582,174 | 2015 | 403,750 | 24,808 | 59,320 | 60,315 | -0- | 19,075 | (1) | 47,000 | (2) | 614,268 | |||||||||||||||||||||||||||||||||||||||||||||||||
| Michael P. Landy | 2016 | $ | 551,250 | $ | 501,202 | $ | -0- | $ | -0- | $ | 135,000 | $ | -0- | $ | 63,100 (3) | $ | 1,250,552 | 2017 | $ | 750,000 | $ | 105,000 | $ | 17,130 | $ | -0- | $ | 130,000 | $ | -0- | $ | 73,130 | (3) | $ | 1,075,260 | |||||||||||||||||||||||||||||||||
| President and Chief | 2015 | 525,000 | 100,192 | 158,920 | -0- | -0- | -0- | 60,400 (3) | 844,512 | 2016 | 551,250 | 501,202 | -0- | -0- | 135,000 | -0- | 63,100 | (3) | 1,250,552 | |||||||||||||||||||||||||||||||||||||||||||||||||
| Executive Officer | 2014 | 500,000 | 82,500 | -0- | -0- | 60,000 | -0- | 55,200 (3) | 697,700 | 2015 | 525,000 | 100,192 | 158,920 | -0- | -0- | -0- | 60,400 | (3) | 844,512 | |||||||||||||||||||||||||||||||||||||||||||||||||
| Kevin S. Miller | 2016 | $ | 330,637 | $ | 74,329 | $ | -0- | $ | -0- | $ | -0- | $ | -0- | $ | 10,600 (7) | $ | 415,567 | 2017 | $ | 373,846 | $ | 81,000 | $ | 17,130 | $ | 58,000 | $ | -0- | $ | -0- | $ | 28,616 | (6) | $ | 558,592 | |||||||||||||||||||||||||||||||||
| Chief Financial and | 2015 | 239,663 | 73,885 | 99,600 | -0- | $ | -0- | -0- | 10,400 (7) | 423,548 | 2016 | 330,637 | 74,329 | -0- | -0- | -0- | -0- | 10,600 | (7) | 415,566 | ||||||||||||||||||||||||||||||||||||||||||||||||
| Accounting Officer | 2014 | 228,250 | 67,500 | 101,900 | -0- | -0- | -0- | 9,460 (7) | 407,110 | 2015 | 239,663 | 73,885 | 99,600 | -0- | -0- | -0- | 10,400 | (7) | 423,548 | |||||||||||||||||||||||||||||||||||||||||||||||||
| Allison Nagelberg | 2016 | $ | 337,188 | $ | 62,500 | $ | -0- | $ | -0- | $ | -0- | $ | -0- | $ | 10,600 (7) | $ | 410,288 | 2017 | $ | 354,375 | $ | 63,125 | $ | -0- | $ | 43,500 | $ | -0- | $ | -0- | $ | 10,600 | (7) | $ | 471,600 | |||||||||||||||||||||||||||||||||
| General Counsel | 2015 | 312,656 | 60,601 | 49,800 | -0- | -0- | -0- | 10,400 (7) | 433,457 | 2016 | 337,188 | 62,500 | -0- | -0- | -0- | -0- | 10,600 | (7) | 410,288 | |||||||||||||||||||||||||||||||||||||||||||||||||
| 2014 | 252,656 (6) | 52,500 | -0- | -0- | -0- | -0- | 7,140 (7) | 312,296 | 2015 | 312,656 | 60,601 | 49,800 | -0- | -0- | -0- | 10,400 | (7) | 433,457 | ||||||||||||||||||||||||||||||||||||||||||||||||||
Notes:
| (1) | Accrual for pension and other benefits of $13,929, $16,601 | |
| (2) | Represents | |
| (3) | Represents | |
| (4) | The restricted stock values were established based on the number of shares granted as follows, for fiscal | |
| Mr. Miller in the form of 76 unrestricted shares of common stock valued at $15.92 per share. | ||
| (5) | The fair value of the stock option grant was based on the Black-Scholes valuation model. See | |
| (6) | ||
| reimbursement of a disability policy. | ||
| (7) | Consists of fringe benefits and discretionary contributions by the Company to the Company’s 401(k) Plan allocated to an account of the |
| 81 |
Equity Compensation Plan Information
On July 26,March 13, 2017, upon recommendation of the Committee, the Board approved the Amended and Restated 2007 Incentive Award Plan (the Plan), conditioned upon shareholder approval. At the 2007Company’s Annual Meeting held on May 18, 2017, the Company’s common shareholders approved the Plan. The Plan constitutes an amendment and restatement of the Stock Option and Stock Award Plan (the 2007 Plan) was approved by, extends the Company’s shareholders authorizingterm of the grant to officers, directors and key employees, of options to purchase up to 1,500,000Plan for an additional 10 years through March 12, 2027, adds 1,600,000 shares of common stock. On May 6, 2010,stock to the Company’s shareholders approved an amendmentshare reserve, expands the types of awards available for grant under the Plan and restatement ofmakes other improvements to the 2007 Plan. The amendment and restatement made two significant changes: (1) the inclusion of directors as participants in the 2007 Plan and (2) the ability to grant restricted stock to Directors, officers and key employees. The amendment and restatement also made other conforming, technical and other minor changes. The amendment also makes certain modifications and clarifications, including concerning administration and compliance with applicable tax rules, such as Section 162(m) of the Internal Revenue Code.
Options to purchase 65,000280,000 shares were granted in 2016fiscal 2017 and options to purchase 245,00065,000 shares were exercised during fiscal 2016.2017. In addition, during fiscal 2016, 40,0002017, 11,000 shares of restricted common stock and 836 shares of unrestricted common stock were granted at a grant date fair value of $13.64$15.92 per share. As of September 30, 2016,2017, the number of shares remaining for future grant under the Plan is 1,753,042.
The Committee, in its capacity as Plan Administrator shall determine, among other things: the recipients of stockawards; the type and number of awards participants will receive; the terms, conditions and forms of the awards; the times and conditions subject to which awards may be exercised or become vested, deliverable or exercisable, or as to which any restrictions may apply or lapse; and may amend or modify the terms and conditions of an award, except that repricing of options or restrictedStock Appreciation Rights (SAR) is not permitted without shareholder approval.
No participant may receive awards during any calendar year covering more than 200,000 shares of common stock or more than $1,500,000 in cash. Regular annual awards granted to non-employee directors as compensation for services as non-employee directors during any fiscal year of the Company may not exceed $100,000 in value of the date of grant, and the grant date value of any special or one-time award upon election or appointment to the Board of Directors may not exceed $200,000.
Awards granted pursuant to the Plan generally may not vest until the first anniversary of the date the award was granted, provided, however, that up to 5% of the Common Shares available under the 2007Plan may be awarded to any one or more Eligible Individuals without the minimum vesting period.
If an award made under the Plan is 444,878.forfeited, expires or is converted into shares of another entity in connection with a recapitalization, reorganization, merger, consolidation, split-up, spin-off, combination, exchange of shares or other similar event, or the award is settled in cash, the shares associated with the forfeited, expired, converted or settled award will become available for additional awards under the Plan.
OptionsThe term of any stock option or SAR generally may not be granted under the 2007 Plan any time as determined by the Compensation Committee up through March 26, 2017. No option granted under the 2007 Plan shall be available for exercise beyond ten years. All options are exercisable after one yearmore than 10 years from the date of grant. The optionexercise price per common share under the 2007 Plan generally may not be below 100% of the fair market value of a common share at the date of grant. Canceled or expired options are added back to the “pool” of shares available under the 2007 Plan.
Under the 2007 Plan, the Compensation Committee determines the recipients of restricted stock awards; the number of restricted shares to be awarded; the length of the restricted period of the award; the restrictions applicable to the award including, without limitation, the employment or retirement status of the participant; rules governing forfeiture and restrictions applicable to any sale, assignment, transfer, pledge or other encumbrance of the restricted stock during the restricted period; and the eligibility to share in dividends and other distributions paid to the Company’s shareholders during the restricted period. The maximum number of shares underlying restricted stock awards that may be granted in any one fiscal year to a participant is 100,000.
| 82 |
Grants of Plan-Based Awards
All restricted stock awards granted during fiscal year 20162017 vest 1/5th per year over a five year period and all dividends paid on unvested shares are reinvested in additional shares of restricted stock.stock subject to the same vesting schedule. The following table sets forth, for the executive officers named in the Summary Compensation Table, information regarding individual grants of restricted stock and individual grants of stock options made under the 2007 Plan during the fiscal year ended September 30, 2016:2017:
| Name | Grant Date | Number of Shares of Restricted Stock | Number of Shares Underlying Options | Exercise Price of Option Award or Fair Value Per Share at Grant Date of Restricted Stock Award | Grant Date Fair Value | Grant Date | Number of Shares of Restricted Stock(1) | Number of Shares of Unrestricted Stock(2) | Number of Shares Underlying Options(3) | Exercise Price of Option Award or Fair Value Per Share at Grant Date of Restricted Stock Award | Grant Date Fair Value | |||||||||||||||||||||||||||||
| Eugene W. Landy | 01/05/16 | -0- | 65,000 | (1) | $ | 10.37 | $ | 48,100 | (2) | 1/4/17 | -0- | -0- | 65,000 | $ | 15.04 | $104,650 | (4) | |||||||||||||||||||||||
| Eugene W. Landy | 09/14/16 | 40,000 | -0- | 13.64 | 545,600 | 9/12/17 | 1,000 | 76 | -0- | 15.92 | 17,130 | |||||||||||||||||||||||||||||
| Michael P. Landy | 9/12/17 | 1,000 | 76 | -0- | 15.92 | 17,130 | ||||||||||||||||||||||||||||||||||
| Kevin S. Miller | 9/12/17 | 1,000 | 76 | -0- | 15.92 | 17,130 | ||||||||||||||||||||||||||||||||||
| Kevin S. Miller | 12/9/2016 | -0- | -0- | 40,000 | 14.24 | 58,000 | (5) | |||||||||||||||||||||||||||||||||
| Allison Nagelberg | 12/9/2016 | -0- | -0- | 30,000 | 14.24 | 43,500 | (5) | |||||||||||||||||||||||||||||||||
| (1) | Represents restricted common stock which vests 1/5th every September 14th over the next five years, granted as compensation for service as a director. Fair value on the date of grant was $15.92 per share. | |
| (2) | Comprises one quarter of an annual directors’ fee paid to Mr. Eugene W. Landy, Mr. Michael P. Landy and Mr. Miller in the form of 76 unrestricted shares of common stock valued at $15.92 per share. | |
| (3) | These options expire 8 years from grant date and are exercisable 1 year after grant date. | |
| This value was established using the Black-Scholes stock option valuation model. The following weighted-average assumptions were used in the model: expected volatility of | ||
| (5) | This value was established using the Black-Scholes stock option valuation model. The following weighted-average assumptions were used in the model: expected volatility of 18.88%; risk-free interest rate of 2.26%; dividend yield of 4.49%; expected life of options of 8 years; and -0- estimated forfeitures. The fair value per share granted was $1.45. The actual value of the options will depend upon the performance of the Company during the period of time the options are outstanding and the price of the Company’s common stock on the date of exercise. |
Narrative Disclosure to Summary Compensation Table and Grants of Plan-Based Awards Table
Our executive compensation policies and practices, pursuant to which the compensation set forth in the Summary Compensation Table and the Grants of Plan-Based Awards Table was paid or awarded to our named executive officers,Named Executive Officers, are described above under “Compensation Discussion and Analysis” and below under “Employment Agreements.”
| 83 |
Option Exercises and Stock Vested
The following table sets forth summary information concerning option exercisesoptions exercised and vesting of restricted stock awards for each of the named executive officersNamed Executive Officers during the fiscal year ended September 30, 2016:2017:
| Fiscal Year Ended September 30, 2016 | ||||||||||||||||||||||||||||||||
| Fiscal Year Ended September 30, 2017 | Fiscal Year Ended September 30, 2017 | |||||||||||||||||||||||||||||||
| Option Awards | Restricted Stock Awards | Option Awards | Stock Awards | |||||||||||||||||||||||||||||
| Name | Number of Shares Acquired on Exercise (#) | Value Realized on Exercise (1) ($) | Number of Shares Acquired on Vesting (#) | Value realized on Vesting ($) | Number of Shares Acquired on Exercise (#) | Value Realized on Exercise(1) ($) | Number of Shares Acquired on Vesting (#) | Value realized on Vesting ($) | ||||||||||||||||||||||||
| Eugene W. Landy | 130,000 | $ | 570,050 | 11,003 | $ | 153,058 | (2) | 65,000 | $ | 585,650 | 14,696 | $ | 236,918 | (2) | ||||||||||||||||||
| Michael P. Landy | 50,000 | 131,250 | 9,250 | 127,270 | (3) | -0- | -0- | 6,647 | 103,846 | (3) | ||||||||||||||||||||||
| Kevin S. Miller | -0- | -0- | 6,805 | 91,255 | (4) | -0- | -0- | 7,209 | 109,632 | (4) | ||||||||||||||||||||||
| Allison Nagelberg | -0- | -0- | 5,106 | 70,844 | (5) | -0- | -0- | 3,193 | 50,217 | (5) | ||||||||||||||||||||||
| (1) | Value realized based on the difference between the closing price of the shares on the NYSE as of the date of exercise less the exercise price of the stock option. | |
| (2) | Value realized based on the closing price of the shares on the NYSE as of the date of vesting made up of | |
| (3) | Value realized based on the closing price of the shares on the NYSE as of the date of vesting made up of | |
| (4) | Value realized based on the closing price of the shares on the NYSE as of the date of vesting made up of | |
| (5) | Value realized based on the closing price of the shares on the NYSE as of the date of vesting made up of |
Outstanding Equity Awards at Fiscal Year End
The following table sets forth for the executive officers named in the Summary Compensation Table, information regarding stock options and restricted stock outstanding at September 30, 2016:2017:
| Fiscal Year Ended September 30, 2016 | ||||||||||||||||||||||||||||||||||||||||||||
| Fiscal Year Ended September 30, 2017 | Fiscal Year Ended September 30, 2017 | |||||||||||||||||||||||||||||||||||||||||||
| Option Awards | Restricted Stock Awards | Option Awards | Restricted Stock Awards | |||||||||||||||||||||||||||||||||||||||||
| Name | Number of Securities Underlying Unexercised Options Exercisable | Number of Securities Underlying Unexercised Options Unexercisable | Option exercise price ($) | Option expiration date | Number of Shares That Have Not Vested | Market Value Of Shares that Have Not Vested (2) | Number of Securities Underlying Unexercised Options Exercisable | Number of Securities Underlying Unexercised Options Unexercisable | Option exercise price ($) | Option expiration date | Number of Shares That Have Not Vested | Market Value Of Shares that Have Not Vested(3) | ||||||||||||||||||||||||||||||||
| Eugene W. Landy | 49,989 | (3) | $ | 713,343 | 38,618 | (4) | $ | 625,225 | ||||||||||||||||||||||||||||||||||||
| (1) | -0- | 65,000 | $ | 10.37 | 01/05/24 | |||||||||||||||||||||||||||||||||||||||
| -0- | 65,000 | (1) | $ | 15.04 | 01/04/25 | |||||||||||||||||||||||||||||||||||||||
| 65,000 | -0- | 11.16 | 01/05/23 | 65,000 | -0- | 10.37 | 01/05/24 | |||||||||||||||||||||||||||||||||||||
| 65,000 | -0- | 8.94 | 01/03/22 | 65,000 | -0- | 11.16 | 01/05/23 | |||||||||||||||||||||||||||||||||||||
| 65,000 | -0- | 10.46 | 01/03/21 | 65,000 | -0- | 8.94 | 01/03/22 | |||||||||||||||||||||||||||||||||||||
| 65,000 | -0- | 9.33 | 01/03/20 | 65,000 | -0- | 10.46 | 01/03/21 | |||||||||||||||||||||||||||||||||||||
| 65,000 | -0- | 8.72 | 01/03/19 | 65,000 | -0- | 9.33 | 01/03/20 | |||||||||||||||||||||||||||||||||||||
| 65,000 | -0- | 7.22 | 01/05/18 | 65,000 | -0- | 8.72 | 01/03/19 | |||||||||||||||||||||||||||||||||||||
| Michael P. Landy | -0- | -0- | $ | -0- | - | 16,675 | (4) | $ | 237,952 | -0- | -0- | $ | -0- | - | 11,809 | (5) | $ | 191,188 | ||||||||||||||||||||||||||
| Kevin S. Miller | -0- | -0- | $ | -0- | - | 20,374 | (5) | $ | 290,737 | -0- | 40,000 | (2) | $ | 14.24 | 12/09/24 | 15,109 | (6) | $ | 244,615 | |||||||||||||||||||||||||
| Allison Nagelberg | -0- | -0- | $ | -0- | - | 6,315 | (6) | $ | 90,115 | -0- | 30,000 | (2) | $ | 14.24 | 12/09/24 | 3,380 | (7) | $ | 54,722 | |||||||||||||||||||||||||
| (1) | These options will become exercisable on January | |
| (2) | These options will become exercisable on December 9, 2017. | |
| Based on the closing price of our common stock on September 30, | ||
| (4) | ||
| (5) | ||
| (6) | 2,563 shares vest on July 5, 2018; 4,786 shares vest 1/2 on July | |
| (7) | ||
| 84 |
Employment Agreements
Eugene W. Landy, the Company’s Chairman of the Board, executed an Employment Agreement on December 9, 1994, which was amended on June 26, 1997 (the “First Amendment”)(First Amendment), on November 5, 2003 (the “Second Amendment”)(Second Amendment), on April 1, 2008 (the “Third Amendment”)(Third Amendment), on July 1, 2010 (the “Fourth Amendment”)(Fourth Amendment), on April 25, 2013 (the “Fifth Amendment”)(Fifth Amendment), on December 20, 2013 (the “Sixth Amendment”)(Sixth Amendment), on December 18, 2014 (the “Seventh Amendment”)(Seventh Amendment) and on January 12, 2016 (the “Eighth Amendment”)(Eighth Amendment) – collectively, the “Amended Employment Agreement”. Pursuant to the Amended Employment Agreement, Mr. Eugene Landy’s base salary was $410,000 per year, effective January 1, 2015, and was increased pursuant to the Eighth Amendment to $430,500 per year, effective January 1, 2016. He is entitled to receive pension payments of $50,000 per year through 2020; in fiscal 2015,2017, the Company accrued $19,075$13,929 in additional compensation expense related to the pension benefits. Mr. Eugene Landy’s incentive bonus schedule is detailed in the Fourth Amendment and is based on progress toward achieving certain target levels of growth in market capitalization, funds from operations and dividends per share. Pursuant to the Amended Employment Agreement, Mr. Eugene Landy will receive each year an option to purchase 65,000 shares of the Company’s common stock.Common Shares. Mr. Eugene Landy is entitled to five weeks paid vacation annually, and he is entitled to participate in the Company’s employee benefit plans.
The Amended Employment Agreement provides for aggregate severance payments of $500,000, payable to Mr. Eugene Landy upon the termination of his employment for any reason in increments of $100,000 per year for five years. He is entitled to disability payments in the event of his disability (as defined in the Amended Employment Agreement) for a period of three years equal to his base salary. The Amended Employment Agreement provides for a death benefit of $500,000, payable to Mr. Eugene Landy’s designated beneficiary. Upon the termination of Mr. Eugene Landy’s employment, following, or as a result of, certain types of transactions that lead to a significant increase in the Company’s market capitalization, the Amended Employment Agreement provides that Mr. Eugene Landy will receive a grant of 35,000 to 65,000 shares of the Company’s common stock,Common Shares, depending on the amount of the increase in the Company’s market capitalization, all of his outstanding options to purchase shares of the Company common stockCommon Shares will become immediately vested, and he will be entitled to continue to receive benefits under the Company’s health insurance and similar plans for one year. In the event of a change in control of the Company, Mr. Eugene W. Landy shall receive a lump sum payment of $2,500,000, provided that the sale price of the Company is at least $10 per share of common stock. A change of control is defined as the consummation of a reorganization, merger, share exchange, consolidation, or sale or disposition of all or substantially all of the assets of the Company. This change of control provision will not apply to any combination between the Company and UMH. Payment will be made simultaneously with the closing of the transaction, and only in the event that the transaction closes. The Amended Employment Agreement is terminable by the Company’s Board of Directors at any time by reason of Mr. Eugene Landy’s death or disability or for cause, which is defined in the Amended Employment Agreement as a termination of the agreement if the Company’s Board of Directors determines in good faith that Mr. Eugene Landy failed to substantially perform his duties to the Company (other than due to his death or disability), or has engaged in conduct the consequences of which are materially adverse to the Company, monetarily or otherwise. Upon termination of the Amended Employment Agreement, Mr. Eugene Landy will remain entitled to the disability, severance, death and pension benefits provided for in the Amended Employment Agreement.
| 85 |
Effective April 9, 2013, Michael P. Landy was appointed President and Chief Executive Officer. Prior to April 9, 2013, Mr. Michael Landy was the Chief Operating Officer. Effective October 1, 2013, the Company and Michael P. Landy entered into a three-year employment agreement, under which Mr. Michael Landy received an annual base salary of $500,000 for fiscal year 2014 with increases of 5% for each of fiscal years 2015 and 2016, plus bonuses and customary fringe benefits. Mr. Landy’s incentive bonus schedule is based on progress toward achieving certain target levels of growth in market capitalization, adjusted funds from operations and dividends per share. Mr. Landy also receives four weeks’ vacation, annually. The Company reimburses Mr. Landy for the cost of a disability insurance policy such that, in the event of Mr. Landy’s disability for a period of more than 90 days, Mr. Landy will receive benefits up to 60% of his then-current salary. In the event of a merger, sale or change of voting control of the Company, excluding transactions between the Company and UMH, Mr. Landy will have the right to extend and renew this employment agreement so that the expiration date will be three years from the date of merger, sale or change of voting control, or Mr. Landy may terminate the employment agreement and be entitled to receive one year’s compensation in accordance with the agreement. If there is a termination of employment by the Company or by Mr. Landy for any reason, either involuntary or voluntary, including the death of the employee, other than a termination for cause as defined by the agreement, Mr. Landy shall be entitled to the greater of the base salary due under the remaining term of the agreement or two years’ compensation at the date of termination, paid monthly over the remaining term or life of the agreement.
On January 11, 2016, the Company entered into an amended and restated Employment Agreement (“Employment Agreement”)(Employment Agreement) with Mr. Michael P. Landy, which became effective October 1, 2016. Upon signing the Employment Agreement, Mr. Michael Landy received a signing bonus of $400,000 in recognition of the substantial progress that the Company has made under his leadership. Effective October 1, 2016, Mr. Michael Landy receives an annual base salary of $750,000 for fiscal year 2017 with increases of 5% for each of fiscal years 2018, 2019, 2020 and 2021, plus targeted bonuses and customary fringe benefits. The Employment Agreement has an initial term of five years, and is renewed automatically for a new five-year term on the first day of each calendar quarter after the effective date unless otherwise terminated. For fiscal years after 2021, Mr. Michael Landy’s base salary shall be set by the Compensation Committee of the Company’s Board of Directors but will be no less than his base salary for the preceding year. Mr. Michael Landy will receive annual cash bonuses based on the Company’s achievement of certain performance objectives as determined by the Compensation Committee: a) Growth in Market Cap of 10%, 15% or 20%, Mr. Michael Landy will receive $40,000, $60,000 or $80,000, respectively; b) Growth in AFFO per share of 5%, 10%, 15%, or 20%, Mr. Michael Landy will receive $50,000, $75,000, $100,000 or $150,000, respectively; and c) Growth in Dividend per Share of 5%, 10% or 15%, Mr. Michael Landy will receive $150,000, $200,000 or $250,000, respectively. Mr. Michael Landy will also be entitled to equity awards of up to 25,000 shares of restricted stock each year based on achievement of performance objectives as determined by the Compensation Committee. Mr. Michael Landy also receives four weeks’ vacation annually and he is entitled to customary fringe benefits including life insurance, health benefits and the right to participate in the Company’s 401(k) retirement plan. The Company reimburses Mr. Michael Landy for the cost of a disability insurance policy such that, in the event of Mr. Michael Landy’s disability for a period of more than 90 days, Mr. Michael Landy will receive benefits up to 60% of his then-current salary. Under the Employment Agreement, if Mr. Michael Landy’s employment is terminated for any reason, either voluntarily or involuntarily, including the death of Mr. Michael Landy or termination for cause, Mr. Michael Landy shall be entitled to the base salary plus base target bonuses due under the Employment Agreement for the remaining term of the Employment Agreement (as it has been renewed). The Employment Agreement also provides that, upon a change of control of the Company (as defined below), the Employment Agreement will automatically renew for five years from the date of the change in control and Mr. Michael Landy shall have the right to terminate the Employment Agreement and continue to receive the base salary plus base target bonuses and restricted stock awards he would have been entitled to receive during the remaining term of the Employment Agreement. In addition, provided that Mr. Michael Landy is actively employed by the Company as of the consummation of a change of control, Mr. Michael Landy shall be entitled to a transaction bonus consistent with the terms of any applicable transaction bonus plan that the Company may adopt. The term “Change of Control” under Mr. Michael Landy’s amended employment agreement means (i) a sale of substantially all of the Company’s assets, not in the ordinary course, to an unaffiliated third party, (ii) the transfer, in one transaction or a series of transactions, to an unaffiliated third party, of outstanding shares of the Company’s capital stock representing a majority of the then outstanding voting stock, (iii) a majority of the Company’s Directors ceasing to be individuals who either were members of the Board immediately following the Company’s 2014 Annual Meeting of Shareholders, or whose election as a director was approved by a majority of such incumbent directors or their approved successors, (iv) a merger or consolidation having the same effect as item (i), (ii) or (iii) above or (iv) any other event of a nature that would be required to be reported as a change of control in item 5.01 of Form 8-K under the Securities Exchange Act of 1934, as amended (or any successor provision thereto).
Effective January 1, 2013, the Company and Kevin S. Miller, Chief Financial and Accounting Officer, entered into a three-year employment agreement, under which Mr. Miller received an annual base salary of $220,000 for calendar year 2013 with increases of 5% for each of calendar years 2014 and 2015, plus bonuses and customary fringe benefits. Mr. Miller also received four weeks’ vacation, annually. The Company reimbursed Mr. Miller for the cost of a disability insurance policy such that, in the event of Mr. Miller’s disability for a period of more than 90 days, Mr. Miller will receive benefits up to 60% of his then-current salary. In the event of a merger, sale or change of voting control of the Company, excluding transactions between the Company and UMH, Mr. Miller would have had the right to extend and renew this employment agreement so that the expiration date would have been three years from the date of merger, sale or change of voting control, or Mr. Miller could terminate the employment agreement and be entitled to receive one year’s compensation in accordance with the agreement. If there were a termination of employment by the Company or by Mr. Miller for any reason, either involuntary or voluntary, including the death of the employee, other than a termination for cause as defined by the agreement, Mr. Miller was entitled to one year’s base salary at the date of termination, paid monthly over the remaining term or life of the agreement.
Effective January 1, 2016, the Company and Kevin S. Miller, entered into a new three-year employment agreement, under which Mr. Miller will receive an annual base salary of $360,000 for calendar year 2016 with increases of 5% for each of calendar years 2017 and 2018, plus bonuses and customary fringe benefits. Mr. Miller also receives four weeks’ vacation, annually. The Company reimburses Mr. Miller for the cost of a disability insurance policy such that, in the event of Mr. Miller’s disability for a period of more than 90 days, Mr. Miller will receive benefits up to 60% of his then-current salary. In the event of a merger, sale or change of voting control of the Company, excluding transactions between the Company and UMH, Mr. Miller will have the right to extend and renew the employment agreement so that the expiration date will be three years from the date of merger, sale or change of voting control, or Mr. Miller may terminate the employment agreement and be entitled to receive the greater of the base salary due under the remaining term of the agreement or one year’s base salary at the date of termination, paid monthly over the remaining term or life of the agreement. If there is a termination of employment by the Company or by Mr. Miller for any reason, either involuntary or voluntary, including the death of the employee, other than a termination for cause as defined by the agreement, Mr. Miller shall be entitled to the greater of the base salary due under the remaining term of the agreement or one year’s base salary at the date of termination, paid monthly over the remaining term or life of the agreement.
| 86 |
Effective January 1, 2014, the Company and Allison Nagelberg, General Counsel, entered into a three-year employment agreement, under which Ms. Nagelberg receivesreceived an annual base salary of $275,625 for calendar year 2014, $325,000 for calendar year 2015, and $341,250 for calendar year 2016, plus bonuses and customary fringe benefits. Ms. Nagelberg also received four weeks’ vacation, annually. The Company reimbursed Ms. Nagelberg for the cost of a disability insurance policy such that, in the event of Ms. Nagelberg’s disability for a period of more than 90 days, Ms. Nagelberg would receive benefits up to 60% of her then-current salary. In the event of a merger, sale or change of voting control of the Company, excluding transactions between the Company and UMH, Ms. Nagelberg had the right to extend and renew this employment agreement so that the expiration date would be three years from the date of merger, sale or change of voting control, or Ms. Nagelberg could terminate the employment agreement and be entitled to receive one year’s compensation in accordance with the agreement. If there was a termination of employment by the Company or Ms. Nagelberg for any reason, either involuntary or voluntary, including the death of the employee, other than a termination for cause as defined by the agreement, Ms. Nagelberg would be entitled to the greater of the base salary due under the remaining term of the agreement or one year’s compensation at the date of termination, paid monthly over the remaining term or life of the agreement.
Effective January 1, 2017, the Company and Ms. Allison Nagelberg entered into a new three-year employment agreement, under which Ms. Nagelberg receives an annual base salary of $358,313 for calendar year 2017, $376,228 for calendar year 2018, and $395,040 for calendar year 2019, plus bonuses and customary fringe benefits. Under the employment agreement, Ms. Nagelberg receives the following benefits: Ms. Nagelberg receives four weeks’ vacation, annually. The Company reimburses Ms. Nagelberg for the cost of a disability insurance policy such that, in the event of Ms. Nagelberg’s disability for a period of more than 90 days, Ms. Nagelberg will receive benefits up to 60% of her then-current salary. In the event of a merger, sale or change of voting control of the Company, excluding transactions between the Company and UMH, Ms. Nagelberg will have the right to extend and renew this employment agreement so that the expiration date will be three years from the date of merger, sale or change of voting control, or Ms. Nagelberg may terminate the employment agreement and be entitled to receive one year’s compensation in accordance with the agreement. If there is a termination of employment by the Company or Ms. Nagelberg for any reason, either involuntary or voluntary, including the death of the employee, other than a termination for cause as defined by the agreement, Ms. Nagelberg shall be entitled to the greater of the base salary due under the remaining term of the agreement or one year’s compensation at the date of termination, paid monthly over the remaining term or life of the agreement.
Potential Payments upon Termination of Employment or Change-in-Control
Under the employment agreements with our President and Chief Executive Officer and the other named executive officersNamed Executive Officers listed below, our President and Chief Executive Officer and such other named executive officersNamed Executive Officers are entitled to receive the following estimated payments and benefits upon a termination of employment or voluntary resignation (with or without a change-in-control). These disclosed amounts are estimates only and do not necessarily reflect the actual amounts that would be paid to the named executive officers,Named Executive Officers, which would only be known at the time that they become eligible for payment and would only be payable if a termination of employment, or voluntary resignation, were to occur. The table below reflects the amount that could be payable under the various arrangements assuming that the termination of employment had occurred at September 30, 2016.2017. Each of the employees named in the table below have restricted stock awards and/or stock option awards which are listed in the “Outstanding Equity Awards at Fiscal Year End” table previously disclosed. Restricted Stock Awards vest upon the termination of an employee due to death or disability. In addition, restricted stock awards vest on the date of an involuntary termination of employment with the Company or if the employee retires. If the termination of employment is for any other reason, including voluntary resignation, termination not for cause or good reason resignation, termination for cause, or termination not for cause or good reason (after a change in control), the restricted stock awards are forfeited. Regarding the stock option awards, if the termination is for any reason other than a termination for cause, the stock option awards may be exercised until three months after the termination of employment. If the termination is for cause, the stock option awards are forfeited.
| 87 |
| Voluntary Resignation on 9/30/16 | Termination Not for Cause Or Good Reason Resignation on 9/30/16 | Termination For Cause on 9/30/16 | Termination Not for Cause or Good Reason Resignation (After a Change-in-Control) on 9/30/16 | Disability/ Death on 9/30/16 | Voluntary Resignation on 9/30/17 | Termination Not for Cause Or Good Reason Resignation on 9/30/17 |
Termination For Cause on 9/30/17 |
Termination Not for Cause or Good Reason Resignation (After a Change- on 9/30/17 |
Disability/ Death 9/30/17 | |||||||||||||||||||||||||||||||
| Eugene W. Landy | $ | 527,958 | (3) | $ | 527,958 | (3) | $ | 508,279 | (2) | $ | 3,027,959 | (4) | $ | 1,819,459 | (5) | $ | 529,097 | (3) | $ | 529,097 | (3) | $ | 508,279 | (2) | $ | 3,029,097 | (4) | $ | 1,820,597 | (5) | ||||||||||
| Michael P. Landy | 4,144,217 | (6) | 4,144,217 | (6) | 4,144,217 | (6) | 4,144,217 | (6) | 4,144,217 | (6) | 4,305,853 | (6) | 4,305,853 | (6) | 4,305,853 | (6) | 4,305,853 | (6) | 4,305,853 | (6) | ||||||||||||||||||||
| Kevin S. Miller | 864,900 | (7) | 864,900 | (7) | 6,923 | (1) | 864,900 | (7) | 864,900 | (7) | 491,400 | (7) | 491,400 | (7) | 7,269 | (1) | 491,400 | (7) | 491,400 | (7) | ||||||||||||||||||||
| Allison Nagelberg | 341,250 | (8) | 341,250 | (8) | 6,563 | (1) | 341,250 | (8) | 341,250 | (8) | 860,846 | (8) | 860,846 | (8) | 6,891 | (1) | 860,846 | (8) | 860,846 | (8) | ||||||||||||||||||||
| (1) | Consists of accrued vacation time, which would be payable in a lump sum payment. | |
| (2) | Consists of severance payments of $500,000, payable $100,000 per year for 5 years, and $8,279 of accrued vacation, which would be payable in a lump sum payment. | |
| (3) | Consists of severance payments of $500,000, payable $100,000 per year for 5 years, plus the | |
| (4) | Mr. Eugene W. Landy shall receive a lump-sum payment of $2,500,000 in the event of a change in control, provided that the sale price of the Company is at least $10 per share of common stock. In addition, if Mr. Eugene W. Landy’s employment agreement is terminated, he receives severance payments of $500,000, which would be payable $100,000 per year for 5 years, continuation of benefits for one year following termination and accrued vacation. | |
| (5) | In the event of a disability, as defined in the agreement, Mr. Eugene W. Landy shall receive disability payments equal to his base salary for a period of three years, continuation of benefits for one year following termination and accrued vacation. He has a death benefit of $500,000 payable in a lump sum to Mr. Eugene W. Landy’s beneficiary. | |
| (6) | Payments are calculated based on Mr. Michael P. Landy’s amended and restated employment agreement, which became effective October 1, 2016, which is the base salary due under the remaining term of the agreement. | |
| (7) | Payments are calculated based on Mr. Kevin S. Miller’s employment agreement, which is the greater of the base salary due under the remaining term of the agreement or one year’s base salary at the date of termination. | |
| (8) | Payments are calculated based on Ms. Allison Nagelberg’s employment agreement which is the greater of the base salary due under the remaining term of the agreement or one year’s compensation at the date of termination. |
The Company retains the discretion to compensate any officer upon any future termination of employment or a change-in-control. Compensation Risk
The Compensation Committee has assessed our compensation program for the purpose of viewing and considering any risks presented by our compensation policies and practices that are likely to have a material adverse effect on us. As part of that assessment, management reviewed the primary elements of our compensation program, including base salary, annual bonus opportunities, equity compensation and severance arrangements. Management’s risk assessment included a review of the overall design of each primary element of our compensation program, and an analysis of the various design features, controls and approval rights in place with respect to compensation paid to management and other employees that mitigate potential risks to us that could arise from our compensation program. Following the assessment, management determined that our compensation policies and practices did not create risks that were reasonably likely to have a material adverse effect on us and reported the results of the assessment to the Compensation Committee.
Director Compensation
Effective September 1, 2013,12, 2017, the annual cash directors’ fee increased from $41,000 to $48,000, plus an additional amount to be paid in the Company’s unrestricted common stock valued at $4,800 for a total annual directors’ fee of $52,800. This annual directors’ fee will be paid quarterly. In addition, on September 12, 2017, the Directors (with the exception of Gregory Otto, whose election to the Board was announced on September 12, 2017) received a one-time bonus of 1,000 shares of the Company’s restricted stock, which vests over five years. Effective with the Company’s 2018 fiscal year, Directors will receive an increase in their meeting attendance fee offrom $4,000 to $5,000 for each Board meeting attended in person, and they will continue to receive $500 for each telephonic Board telephone meeting attended, and an additional fixed annual fee of $26,000 payable quarterly.attended. Directors appointed to boardBoard committees will continue to receive $1,200 for each committee meeting attended. Effective January 1, 2015, the Directors annual fee increased from $26,000 to $31,000. Effective September 12, 2016, the Directors annual fee increased from $31,000 to $41,000. All other fees remained the same.
| 88 |
The table below sets forth a summary of director compensation for the fiscal year ended September 30, 2016:2017:
| Annual Board Cash | Meeting | Committee | Total Fees Earned or Paid | Annual Board Cash | Meeting | Committee | Restricted Stock | Unrestricted Stock | Total | |||||||||||||||||||||||||||||||
| Director | Retainer | Fees | Fees | in Cash | Retainer | Fees | Fees | Awards (8) | Awards (9) | Fees | ||||||||||||||||||||||||||||||
| Anna T. Chew | $ | 33,500 | $ | 16,000 | $ | -0- | $ | 49,500 | $ | 30,750 | $ | 12,000 | $ | -0- | $ | -0- | $ | -0- | $ | 42,750 | ||||||||||||||||||||
| Daniel D. Cronheim | 33,500 | 16,000 | -0- | 49,500 | 42,750 | 16,000 | -0- | 15,920 | 1,210 | 75,880 | ||||||||||||||||||||||||||||||
| Catherine B. Elflein | 33,500 | 16,000 | 4,800 | 54,300 | 42,750 | 16,000 | 4,800 | 15,920 | 1,210 | 80,680 | ||||||||||||||||||||||||||||||
| Brian H. Haimm (2)(3)(4) | 33,500 | 16,000 | 6,500 | 56,000 | 42,750 | 16,000 | 7,000 | 15,920 | 1,210 | 82,880 | ||||||||||||||||||||||||||||||
| Neal Herstik | 33,500 | 16,000 | -0- | 49,500 | 42,750 | 16,000 | 1,700 | 15,920 | 1,210 | 77,580 | ||||||||||||||||||||||||||||||
| Matthew I. Hirsch (2)(3)(4)(5) | 33,500 | 16,000 | 6,000 | 55,500 | 42,750 | 16,000 | 8,200 | 15,920 | 1,210 | 84,080 | ||||||||||||||||||||||||||||||
| Charles Kaempffer (1) | 15,500 | 8,000 | 2,400 | 25,900 | ||||||||||||||||||||||||||||||||||||
| Samuel A. Landy | 33,500 | 16,000 | -0- | 49,500 | 42,750 | 16,000 | -0- | 15,920 | 1,210 | 75,880 | ||||||||||||||||||||||||||||||
| Gregory T. Otto (6) | -0- | 4,000 | -0- | -0- | -0- | 4,000 | ||||||||||||||||||||||||||||||||||
| Scott L. Robinson | 33,500 | 16,000 | 4,800 | 54,300 | 42,750 | 16,000 | 4,800 | 15,920 | 1,210 | 80,680 | ||||||||||||||||||||||||||||||
| Eugene Rothenberg (1) | 15,500 | 8,000 | -0- | 23,500 | ||||||||||||||||||||||||||||||||||||
| Stephen B. Wolgin (2)(3)(4)(5)(6) | 33,500 | 16,000 | 6,000 | 55,500 | ||||||||||||||||||||||||||||||||||||
| Stephen B. Wolgin (2)(3)(4)(5)(7) | 42,750 | 16,000 | 8,200 | 15,920 | 1,210 | 84,080 | ||||||||||||||||||||||||||||||||||
| Total | $ | 332,500 | $ | 160,000 | $ | 30,500 | $ | 523,000 | $ | 372,750 | $ | 144,000 | $ | 34,700 | $ | 127,360 | $ | 9,680 | $ | 688,490 | ||||||||||||||||||||
Mr. Eugene W. Landy, and Mr. Michael P. Landy and Mr. Kevin S. Miller are named executive employeesNamed Executive Officers of the Company. As such, their director compensation is included in the Summary Compensation Table.
| (1) | ||
| (2) | ||
| The Audit Committee for | ||
| (3) | These directors acted as chairs of the Board’s Audit, Compensation and Nominating Committees. | |
| (4) | Mr. Haimm, Mr. Hirsch and Mr. Wolgin (Chairman) are members of the Compensation Committee. | |
| (5) | ||
| (6) | Effective September 12, 2017, Mr. Otto was elected to the Company’s Board as an independent director. | |
| Mr. Wolgin is the Lead Independent Director whose role is to preside over the executive sessions of the non-management directors. | ||
| (8) | Represents a grant of 1,000 shares of restricted common stock issued on September 12, 2017 which vests 1/5th every September 14th over the next five years. Fair value on the date of grant was $15.92 per share. | |
| (9) | Represents a grant of 76 shares of common stock issued on September 12, 2017. Fair value on the date of grant was $15.92 per share. |
Pension Benefits and Nonqualified Deferred Compensation Plans
Except as provided in the specific employment agreement for Mr. Eugene W. Landy, as described above, the Company does not have pension or other post-retirementpost-employment plans in effect for officers, directors or employees or a nonqualified deferred compensation plan. The present value of accumulated benefit of contractual pension benefits for Mr. Eugene W. Landy is $618,974$582,903 as of September 30, 2016.2017. Payments made during the 20162017 fiscal year were $50,000. He is entitled to receive pension payments of $50,000 per year through 2020. The Company’s employees may elect to participate in the 401(k) plan of UMH Properties, Inc.
| 89 |
Other Information
Daniel D. Cronheim is a director of the Company and Executive Vice President of David Cronheim Company (Cronheim) and Cronheim Management Services, Inc. (CMSI). Daniel Cronheim received $75,880, $49,500 $47,000 and $42,000$56,520 for director’s fees in fiscal 2017, 2016 2015 and 2014,2015, respectively. The Company paid fees to The David Cronheim Mortgage Corporation, an affiliated company of CMSI, of $-0-, $196,000$-0- and $140,000$196,000 in mortgage brokerage commissions in fiscal years 2017, 2016 2015 and 2014,2015, respectively.
Compensation Committee Interlocks and Insider Participation
During fiscal 2016,2017, the Compensation Committee consisted of Messrs. Haimm, Hirsch and Wolgin.Wolgin (Chairman). No member of the Compensation Committee is a current or former officer or employee of the Company. In fiscal 2016,2017, none of our executive officers served on the compensation committee of any entity, or board of directors of any entity that did not have a compensation committee, that had one or more of its executive officers serving on our Compensation Committee. The members of the Compensation Committee did not otherwise have any relationships requiring related-party disclosure in the Company’s Proxy Statement.Annual Report.
ITEM 12 - SECURITY OWNERSHIP OF CERTAIN BENEFICIAL OWNERS AND MANAGEMENT AND RELATED STOCKHOLDER MATTERS
The following table lists information with respect to the beneficial ownership of the Company’s common stock (the Common Shares) as of September 30, 20162017 by:
| ● | each person known by the Company to beneficially own more than five percent of the Company’s outstanding Common Shares; | |
| ● | the Company’s directors; | |
| ● | the Company’s executive officers; and | |
| ● | all of the Company’s executive officers and directors as a group. |
Unless otherwise indicated, the address of the person or persons named below is c/o Monmouth Real Estate Investment Corporation, Juniper Business Plaza, 3499 Route 9 North, Suite 3-D, Freehold, New Jersey 07728. In determining the number and percentage of Shares beneficially owned by each person, Shares that may be acquired by that person under options exercisable within sixty (60) days of September 30, 20162017 are deemed beneficially owned by that person and are deemed outstanding for purposes of determining the total number of outstanding Common Shares for that person and are not deemed outstanding for that purpose for all other shareholders.
Name and Address | Amount and Nature Ownership (1) | Percentage of Common Shares Outstanding(2) | ||||||
| The Vanguard Group, Inc. 100 Vanguard Boulevard Malvern, PA 19355 | 7,324,264 | (3) | 10.63 | % | ||||
BlackRock Inc. 40 East 52ndStreet New York, NY 10022 | 4,272,124 | (4) | 6.20 | % | ||||
| Anna T. Chew | 362,411 | (5) | * | |||||
| Daniel D. Cronheim | 170,950 | (6) | * | |||||
| Catherine B. Elflein | 10,686 | (7) | * | |||||
| Brian H. Haimm | 11,560 | (8) | * | |||||
| Neal Herstik | 16,312 | (9) | * | |||||
| Matthew I. Hirsch | 74,165 | (10) | * | |||||
| Eugene W. Landy | 1,980,805 | (11) | 2.86 | % | ||||
| Michael P. Landy | 580,781 | (12) | * | |||||
| Samuel A. Landy | 343,821 | (13) | * | |||||
| Kevin S. Miller | 38,133 | (14) | * | |||||
| Allison Nagelberg | 70,203 | (15) | * | |||||
| Scott Robinson | 6,857 | (16) | * | |||||
| Katie Rytter | 8,129 | (17) | * | |||||
| Stephen B. Wolgin | 60,570 | (18) | * | |||||
| Directors and Executive Officers as a group | 3,735,383 | 5.39 | % | |||||
*Less than 1%.
| 90 |
| Name and Address | Amount and Nature of Beneficial Ownership (1) | Percentage of Common Shares Outstanding (2) | ||||||
| The Vanguard Group, Inc. 100 Vanguard Boulevard Malvern, PA 19355 | 8,148,283 | (3) | 10.77 | % | ||||
BlackRock Inc. 40 East 52nd Street New York, NY 10022 | 5,632,369 | (4) | 7.45 | % | ||||
| Daniel D. Cronheim | 172,615 | (5) | * | |||||
| Catherine B. Elflein | 11,934 | (6) | * | |||||
| Brian H. Haimm | 12,678 | (7) | * | |||||
| Neal Herstik | 18,442 | (8) | * | |||||
| Matthew I. Hirsch | 78,230 | (9) | * | |||||
| Eugene W. Landy | 2,019,031 | (10) | 2.66 | % | ||||
| Michael P. Landy | 604,205 | (11) | * | |||||
| Samuel A. Landy | 348,469 | (12) | * | |||||
| Kevin S. Miller | 42,132 | (13) | * | |||||
| Allison Nagelberg | 76,476 | (14) | * | |||||
| Gregory T. Otto | 100 | * | ||||||
| Scott L. Robinson | 8,105 | (15) | * | |||||
| Katie Rytter | 8,759 | (16) | * | |||||
| Stephen B. Wolgin | 71,601 | (17) | * | |||||
| Directors and Executive Officers as a group | 3,472,777 | 4.57 | % | |||||
*Less than 1%.
| (1) | Except as indicated in the footnotes to this table and pursuant to applicable community property laws, the Company believes that the persons named in the table have sole voting and investment power with respect to all Common Shares listed. | |
| (2) | Based on the number of Common Shares outstanding on September 30, | |
| (3) | Based on Schedule 13F filed with the SEC, The Vanguard Group, Inc. owns | |
| (4) | Based on Schedule 13F filed with the SEC, BlackRock Inc. owns | |
| (5) | Includes (a) | |
| Includes (a) | ||
| Includes | ||
| Includes (a) | ||
| Includes |
| 91 |
| Includes (a) | ||
| Includes (a) | ||
| Includes (a) | ||
| Includes (a) | ||
| Includes (a) |
| Includes | ||
| Includes (a) | ||
| Includes (a) |
ITEM 13 - CERTAIN RELATIONSHIPS AND RELATED TRANSACTIONS AND DIRECTOR DEPENDENCEINDEPENDENCE
There are no family relationships between any of the directors or executive officers of the Company, except that Samuel A. Landy, a director of the Company, and Michael P. Landy, President, Chief Executive Officer, and a director of the Company, are the sons of Eugene W. Landy, the Chairman of the Board and a director of the Company.
Daniel D. Cronheim is a director of the Company and Executive Vice President of David Cronheim Company (Cronheim) and Cronheim Management Services, Inc. (CMSI). Daniel Cronheim received $75,880, $49,500 $47,000 and $42,000$56,520 for director’s fees in fiscal 2017, 2016 2015 and 2014,2015, respectively. The David Cronheim Mortgage Corporation, an affiliated company of CMSI, received $-0-, $196,000$-0- and $140,000$196,000 in mortgage brokerage commissions in fiscal 2017, 2016 2015 and 2014,2015, respectively, from the Company.
SixFive of the 12 directors of the Company are also directors and shareholders of UMH. The Company holds common and preferred stock of UMH in its securities portfolio. See Note 6 of the Notes to the Consolidated Financial Statements included in this Form 10-K for current holdings. During fiscal 2016,2017, the Company made total purchases of 77,456138,989 common shares of UMH for a total cost of $777,588,$1,926,166, or a weighted average cost of $10.04$13.86 per share, of which 67,456125,989 shares were purchased through UMH’s Dividend Reinvestment and Stock Purchase Plan. In addition, the Company made total purchases 100,000 shares of UMH’s 8.00% Series B Cumulative Redeemable Preferred Stock at a total cost of $2,500,000. During fiscal 2016,2017, UMH made total purchases of 120,098102,103 common shares of the Company through the Company’s DRIP for a total cost of $1,348,141,$1,437,355, or a weighted average cost of $11.23$14.08 per share.
The Company currently has thirteenfourteen full-time employees and one part-time employee. One of the Company’s employees (Director of Investor Relations, promoted to Vice President of Investor Relations in June 2015) was shared with UMH through September 30, 2015. Through September 30, 2015, the Vice President of Investor Relations’ salary was allocated 70% to the Company and 30% to UMH based on the time she worked for each entity. Effective October 1, 2015, the Vice President of Investor Relations began working solely for the Company at which point the Company no longer allocates any portion of her salary to UMH. In addition, theThe Company’s Chairman of the Board is also the Chairman of the Board of UMH. Effective as of October 1, 2015, otherOther than the Company’s Chairman of the Board, the Company does not share any employees with UMH.UMH since the beginning of fiscal 2016.
| 92 |
On August 22, 2014,
Effective January 12, 2015, the Company entered into a seven-year lease agreement to occupy 5,680 square feet for the Company’sits corporate office space. The corporate office space is located in a new separate suite located in the same building as the Company’s former corporate office space. The lease became effective January 12, 2015, at which time, the Company ceased to share rent expense with UMH. Rent for the Company’s corporate office space is at an annual rate of $99,400 or $17.50 per square foot for years one through five and an annual rate of $100,820 or $17.75 per square foot for years six and seven. The Company is also responsible for its proportionate share of real estate taxes and common area maintenance. Mr. Eugene W. Landy, the Founder and Chairman of the Board of the Company, owns a 24% interest in the entity that is the landlord of the property where the Company’s corporate office space is located. Management believes that the aforesaid rent is no more than what the Company would pay for comparable space elsewhere.
No director, executive officer, or any immediate family member of such director or executive officer may enter into any transaction or arrangement with the Company without the prior approval of the Board of Directors. If any such transaction or arrangement is proposed, the Board of Directors will appoint a Business Judgment Committee consisting of independent directors who are also independent of the transaction or arrangement. This Committee will recommend to the Board of Directors approval or disapproval of the transaction or arrangement. In determining whether to approve such a transaction or arrangement, the Business Judgment Committee will take into account, among other factors, whether the transaction was on terms no less favorable to the Company than terms generally available to third parties and the extent of the executive officer’s or director’s involvement in such transaction or arrangement. While the Company does not have specific written standards for approving such related party transactions, such transactions are only approved if it is in the best interest of the Company and its shareholders. Additionally, the Company’s Code of Business Conduct and Ethics requires all directors, officers and employees who may have a potential or apparent conflict of interest to immediately notify the Company’s General Counsel. Further, to identify related party transactions, the Company submits and requires our directors and executive officers to complete director and officer questionnaires identifying any transactions with the Company in which the director, executive officer or their immediate family members have an interest.
See identification and other information relating to independent directors under Item 10.
ITEM 14 - PRINCIPAL ACCOUNTINGACCOUNTANT FEES AND SERVICES
PKF O’Connor Davies, LLP served as the Company’s independent registered public accountants for the years ended September 30, 20162017 and 2015.2016. A representative from PKF O’Connor Davies, LLP is expected to be present at the annual shareholders’ meeting in order to be available to respond to possible inquiries from shareholders’.
The following are fees billed by and accrued to PKF O’Connor Davies, LLP in connection with services rendered for the fiscal years ended September 30, 20162017 and 2015:2016:
| 2016 | 2015 | 2017 | 2016 | |||||||||||||
| Audit Fees | $ | 210,400 | $ | 203,450 | $ | 217,000 | $ | 210,400 | ||||||||
| Audit Related Fees | 32,100 | 4,200 | 40,300 | 32,100 | ||||||||||||
| Tax Fees | 54,400 | 47,500 | 49,500 | 54,400 | ||||||||||||
| All Other Fees | -0- | -0- | -0- | -0- | ||||||||||||
| Total Fees | $ | 296,900 | $ | 255,150 | $ | 306,800 | $ | 296,900 | ||||||||
Audit fees include professional services rendered for the audit of the Company’s annual financial statements, management’s assessment of internal controls, and reviews of financial statements included in the Company’s quarterly reports on Form 10-Q.
Audit related fees include services that are normally provided by the Company’s independent auditors in connection with statutory and regulatory filings, such as consents and assistance with and review of documents filed with the Securities and Exchange Commission.
Tax fees include professional services rendered for the preparation of the Company’s federal and state corporate tax returns and supporting schedules as may be required by the Internal Revenue Service and applicable state taxing authorities. Tax fees also include other work directly affecting or supporting the payment of taxes, including planning and research of various tax issues.
| 93 |
All of the services performed by PKF O’Connor Davies, LLP for the Company during fiscal 20162017 were either expressly pre-approved by the Audit Committee or were pre-approved in accordance with the Audit Committee Pre-Approval Policy, and the Audit Committee was provided with regular updates as to the nature of such services and fees paid for such services.
Audit Committee Pre-Approval Policy
The Audit Committee has adopted a policy for the pre-approval of audit and permitted non-audit services provided by the Company’s principal independent accountants. The policy requires that all services provided by our independent registered public accountants to the Company, including audit services, audit-related services, tax services and other services, must be pre-approved by the Audit Committee, and all have been so approved. The pre-approval requirements do not prohibit day-to-day normal tax consulting services, which matters will not exceed $10,000 in the aggregate.
The Audit Committee has determined that the provision of the non-audit services described above is compatible with maintaining PKF O’Connor Davies, LLP’s independence.
| 94 |
ITEM 15 - EXHIBITS, FINANCIAL STATEMENT SCHEDULES
| PAGE(S) | |||
| (a) | (1) | The following Financial Statements are filed as part of this report: | |
| (i) | Report of Independent Registered Public Accounting Firm | ||
| (ii) | Consolidated Balance Sheets as of September 30, | ||
| (iii) | Consolidated Statements of Income for the years ended September 30, 2017, 2016 | ||
| (iv) | |||
| (v) | |||
| (vi) | Consolidated Statements of Cash Flows for the years ended September 30, 2017, 2016 | ||
| (vii) | Notes to the Consolidated Financial Statements | ||
| (a) | (2) | The following Financial Statement Schedule is filed as part of this report: | |
| (i) | Schedule III - Real Estate and Accumulated Depreciation as of September 30, |
All other schedules are omitted for the reason that they are not required, are not applicable, or the required information is set forth in the Consolidated Financial Statements or Notes hereto.
| 95 |
ITEM 15 - EXHIBITS, FINANCIAL STATEMENT SCHEDULES (CONT’D)
| (a)(3) | Exhibits | |
| (2) | Plan of Acquisition, Reorganization, Arrangement, Liquidation, or Succession | |
| 2.1 |
| |
| Agreement and Plan of Merger Among Monmouth Capital Corporation, Monmouth Real Estate Investment Corporation, and Route 9 Acquisition, Inc., dated as of March 26, 2007 (incorporated by reference Annex A to the Proxy Statement filed by the Registrant with the Securities and Exchange Commission on June 8, 2007, Registration No. 001-33177). | ||
| (3) | Articles of Incorporation and By-Laws | |
| 3.1 |
| |
| 3.2 |
| |
| Articles of Amendment, effective April 21, 2010 (incorporated by reference to Exhibit 3 to the Registrant’s Current Report on Form 8-K, filed by the Registrant with the Securities and Exchange Commission, on April 19, 2010, Registration No. 001-33177). | ||
| Articles of Amendment, effective March 7, 2011 (incorporated by reference to Exhibit 3 to the Registrant’s Current Report on Form 8-K, filed by the Registrant with the Securities and Exchange Commission on March 3, 2011, Registration No. 001-33177). | ||
| Articles of Amendment, effective January 26, 2012 (incorporated by reference to Exhibit 3 to the Registrant’s Current Report on Form 8-K, filed | ||
| ||
| 3.5 |
3.6
| 96 |
| (4) | Instruments Defining the Rights of Security Holders, Including Indentures | |
| 4.1 | ||
| 4.2 |
| (10) | Material Contracts | ||
| 10.1 | + | Employment Agreement | |
| 10.2 | + | ||
| 10.3 | + | Second Amendment to Employment Agreement | |
| 10.4 | + | ||
| 10.5 | + | ||
| 10.6 | + |
|
| 10.7 | + |
| |
| 10.8 | + |
| |
| 10.9 | + |
| |
| 10.10 | + |
| |
| 97 |
| + |
| ||
| |||
| + |
| ||
10.13 | + | ||
10.14 | Monmouth Real Estate Investment Corporation’s 2007 Stock Option Plan, Amended and Restated (incorporated by reference to Appendix A to the Proxy Statement filed by the Registrant with the Securities and Exchange Committee on March 26, 2010, Registration No.001-33177).
| ||
10.15 | Monmouth Real Estate Investment Corporation’s 2007 Stock Option Plan, Amended and Restated (incorporated by reference to Appendix A to the Proxy Statement filed by the Registrant with the Securities and Exchange Committee on March 31, 2017, Registration No.001-33177). | ||
| 10.16 | + | Form of Restricted Stock Award Agreement | |
| and Stock Option Agreement (incorporated by reference to Exhibit 10.1 and 10.2 to the Form 10-Q filed by the Registrant with the Securities and Exchange Commission on August 9, 2017, Registration No. 001-33177) | |||
| 10.17 | + |
| |
| 10.18 | Dividend Reinvestment and Stock Purchase Plan of Monmouth Real Estate Investment Corporation (incorporated by reference to Form S-3D filed by the Registrant with the Securities and Exchange Commission on
| ||
| 10.19 |
|
| 10.20 | |||
| 10.21 | |||
| (12) | * | Statement of Computation of Ratios. | |
| (21) | * | Subsidiaries of the Registrant. |
| 98 |
| 101.INS | ++ | XBRL Instance Document |
| 101.SCH | ++ | XBRL Taxonomy Extension Schema Document |
| 101.CAL | ++ | XBRL Taxonomy Extension Calculation Document |
| 101.LAB | ++ | XBRL Taxonomy Extension Label Linkbase Document |
| 101.PRE | ++ | XBRL Taxonomy Extension Presentation Linkbase Document |
| 101.DEF | ++ | XBRL Taxonomy Extension Definition Linkbase Document |
| * | Filed herewith. |
| + | Denotes a management contract or compensatory plan or arrangement. |
| ++ | Pursuant to Rule 406T of Regulation S-T, this interactive date file is deemed not “filed” or part of a registration statement or prospectus for purposes of Section 11 or 12 of the Securities Act, is deemed not “filed” for purposes of Section 18 of the Exchange Act, and otherwise is not subject to liability under these sections. |
| 99 |
Report of Independent Registered Public Accounting Firm
The Board of Directors and Shareholders
Monmouth Real Estate Investment Corporation
We have audited the accompanying consolidated balance sheets of Monmouth Real Estate Investment Corporation (the “Company”)(Company) as of September 30, 20162017 and 20152016 and the related consolidated statements of income, comprehensive income, shareholders’ equity, and cash flows for each of the three years in the period ended September 30, 2016.2017. Our audit also included the financial statement schedule listed in the Index at Item 15(a)(2)(i). These consolidated financial statements and schedule are the responsibility of the Company’s management. Our responsibility is to express an opinion on these consolidated financial statements and schedule based on our audits.
We conducted our audits in accordance with the standards of the Public Company Accounting Oversight Board (United States). Those standards require that we plan and perform the audit to obtain reasonable assurance about whether the financial statements are free of material misstatement. An audit includes examining, on a test basis, evidence supporting the amounts and disclosures in the financial statements. An audit also includes assessing the accounting principles used and significant estimates made by management, as well as evaluating the overall financial statement presentation. We believe that our audits provide a reasonable basis for our opinion.
In our opinion, the consolidated financial statements referred to above present fairly, in all material respects, the consolidated financial position of Monmouth Real Estate Investment Corporation at September 30, 20162017 and 2015,2016, and the consolidated results of its operations and its cash flows for each of the three years in the period ended September 30, 2016,2017, in conformity with accounting principles generally accepted in the United States of America. Also, in our opinion, the related financial statement schedule, when considered in relation to the basic consolidated financial statements taken as a whole, presents fairly in all material respects the information set forth therein.
We also have audited, in accordance with the standards of the Public Company Accounting Oversight Board (United States), the Company’s internal control over financial reporting as of September 30, 20162017, based on criteria established in Internal Control-Integrated Framework issued by the Committee of Sponsoring Organizations of the Treadway Commission (2013 framework), and our report dated November 25, 201628, 2017, expressed an unqualified opinion thereon.
| /s/ PKF O’Connor Davies, LLP | |
| New York, New York | |
| November |
* * *
| 100 |
MONMOUTH REAL ESTATE INVESTMENT CORPORATION AND SUBSIDIARIES
AS OF SEPTEMBER 30,
| 2017 | 2016 | |||||||||||||||
| 2016 | 2015 | |||||||||||||||
| ASSETS | ||||||||||||||||
| Real Estate Investments: | ||||||||||||||||
| Land | $ | 165,375,315 | $ | 133,500,315 | $ | 188,494,819 | $ | 162,110,595 | ||||||||
| Buildings and Improvements | 1,005,938,180 | 807,509,590 | 1,250,626,187 | 995,489,304 | ||||||||||||
| Total Real Estate Investments | 1,171,313,495 | 941,009,905 | 1,439,121,006 | 1,157,599,899 | ||||||||||||
| Accumulated Depreciation | (148,830,169 | ) | (124,898,639 | ) | (172,730,273 | ) | (144,496,585 | ) | ||||||||
| Net Real Estate Investments | 1,022,483,326 | 816,111,266 | ||||||||||||||
| Real Estate Investments | 1,266,390,733 | 1,013,103,314 | ||||||||||||||
| Real Estate Held for Sale | 9,071,351 | 9,380,012 | ||||||||||||||
| Cash and Cash Equivalents | 95,749,508 | 12,073,909 | 10,226,046 | 95,749,508 | ||||||||||||
| Securities Available for Sale at Fair Value | 73,604,894 | 54,541,237 | 123,764,770 | 73,604,894 | ||||||||||||
| Tenant and Other Receivables | 1,444,824 | 783,052 | 1,753,054 | 1,444,824 | ||||||||||||
| Deferred Rent Receivable | 6,917,431 | 5,205,295 | 8,049,275 | 6,917,431 | ||||||||||||
| Prepaid Expenses | 4,830,987 | 3,931,616 | 5,434,874 | 4,830,987 | ||||||||||||
| Financing Costs, net of Accumulated Amortization of $3,399,232 and $3,247,014, respectively | 7,518,066 | 5,987,911 | ||||||||||||||
| Capitalized Lease Costs, net of Accumulated Amortization of $3,238,516 and $2,534,521, respectively | 4,165,268 | 3,407,432 | ||||||||||||||
| Intangible Assets, net of Accumulated Amortization of $12,332,599 and $11,153,855, respectively | 5,816,153 | 6,115,134 | ||||||||||||||
| Intangible Assets, net of Accumulated Amortization of $13,404,318 and $12,332,599, respectively | 10,010,165 | 5,816,153 | ||||||||||||||
| Capitalized Lease Costs, net of Accumulated Amortization of $3,393,187 and $3,238,516, respectively | 4,180,907 | 4,165,268 | ||||||||||||||
| Financing Costs, net of Accumulated Amortization of $619,555 and $246,678, respectively | 875,709 | 1,245,923 | ||||||||||||||
| Other Assets | 7,227,571 | 7,835,090 | 3,280,871 | 7,227,571 | ||||||||||||
| TOTAL ASSETS | $ | 1,229,758,028 | $ | 915,991,942 | $ | 1,443,037,755 | $ | 1,223,485,885 | ||||||||
See Accompanying Notes to the Consolidated Financial Statements
| 101 |
MONMOUTH REAL ESTATE INVESTMENT CORPORATION AND SUBSIDIARIES
CONSOLIDATED BALANCE SHEETS (CONT’D)
AS OF SEPTEMBER 30,
| 2017 | 2016 | |||||||||||||||
| 2016 | 2015 | |||||||||||||||
| LIABILITIES AND SHAREHOLDERS’ EQUITY | ||||||||||||||||
| Liabilities: | ||||||||||||||||
| Mortgage Notes Payable | $ | 483,748,153 | $ | 373,991,174 | ||||||||||||
| Fixed Rate Mortgage Notes Payable, net of Unamortized Debt Issuance Costs | $ | 591,364,371 | $ | 477,476,010 | ||||||||||||
| Loans Payable | 80,790,684 | 85,041,386 | 120,091,417 | 80,790,684 | ||||||||||||
| Preferred Stock Called for Redemption | 53,493,750 | -0- | ||||||||||||||
| Accounts Payable and Accrued Expenses | 3,998,771 | 3,113,274 | 4,450,753 | 3,998,771 | ||||||||||||
| Other Liabilities | 9,868,572 | 7,835,468 | 14,265,518 | 9,868,572 | ||||||||||||
| Preferred Stock Called for Redemption | -0- | 53,493,750 | ||||||||||||||
| Total Liabilities | 631,899,930 | 469,981,302 | 730,172,059 | 625,627,787 | ||||||||||||
| COMMITMENTS AND CONTINGENCIES | ||||||||||||||||
| Shareholders’ Equity: | ||||||||||||||||
| 7.625% Series A Cumulative Redeemable Preferred Stock, $0.01 Par Value Per Share: -0- and 2,139,750 Shares Authorized, Issued and Outstanding as of September 30, 2016 and 2015, respectively | -0- | 53,493,750 | ||||||||||||||
| 7.875% Series B Cumulative Redeemable Preferred Stock, $0.01 Par Value Per Share: 2,300,000 Shares Authorized, Issued and Outstanding as of September 30, 2016 and 2015 | 57,500,000 | 57,500,000 | ||||||||||||||
| 6.125% Series C Cumulative Redeemable Preferred Stock, $0.01 Par Value Per Share: 5,400,000 and -0- Shares Authorized, Issued and Outstanding as of September 30, 2016 and 2015, respectively | 135,000,000 | -0- | ||||||||||||||
| Common Stock - $0.01 Par Value Per Share: 194,600,000 and 200,000,000 Shares Authorized as of September 30, 2016 and 2015, respectively; 68,920,972 and 62,123,454 Shares Issued and Outstanding as of September 30, 2016 and 2015, respectively | 689,210 | 621,235 | ||||||||||||||
| Excess Stock - $0.01 Par Value Per Share: 200,000,000 Shares Authorized as of September 30, 2016 and 2015; No Shares Issued or Outstanding as of September 30, 2016 and 2015 | -0- | -0- | ||||||||||||||
| 7.875% Series B Cumulative Redeemable Preferred Stock, $0.01 Par Value Per Share: -0- and 2,300,000 Shares Authorized, Issued and Outstanding as of September 30, 2017 and 2016, respectively | -0- | 57,500,000 | ||||||||||||||
| 6.125% Series C Cumulative Redeemable Preferred Stock, $0.01 Par Value Per Share: 12,400,000 and 5,400,000 Shares Authorized as of September 30, 2017 and 2016, respectively; 9,839,445 and 5,400,000 Shares Issued and Outstanding as of September 30, 2017 and 2016, respectively | 245,986,125 | 135,000,000 | ||||||||||||||
| Common Stock, $0.01 Par Value Per Share: 192,039,750 and 194,600,000 Shares Authorized as of September 30, 2017 and 2016, respectively; 75,630,521 and 68,920,972 Shares Issued and Outstanding as of September 30, 2017 and 2016, respectively | 756,305 | 689,210 | ||||||||||||||
| Excess Stock, $0.01 Par Value Per Share: 200,000,000 Shares Authorized as of September 30, 2017 and 2016; No Shares Issued or Outstanding as of September 30, 2017 and 2016 | -0- | -0- | ||||||||||||||
| Additional Paid-In Capital | 391,726,621 | 339,837,258 | 459,552,701 | 391,726,621 | ||||||||||||
| Accumulated Other Comprehensive Income (Loss) | 12,942,267 | (5,441,603 | ) | |||||||||||||
| Accumulated Other Comprehensive Income | 6,570,565 | 12,942,267 | ||||||||||||||
| Undistributed Income | -0- | -0- | -0- | -0- | ||||||||||||
| Total Shareholders’ Equity | 597,858,098 | 446,010,640 | 712,865,696 | 597,858,098 | ||||||||||||
| TOTAL LIABILITIES & SHAREHOLDERS’ EQUITY | $ | 1,229,758,028 | $ | 915,991,942 | $ | 1,443,037,755 | $ | 1,223,485,885 | ||||||||
See Accompanying Notes to the Consolidated Financial Statements
| 102 |
MONMOUTH REAL ESTATE INVESTMENT CORPORATION AND SUBSIDIARIES
CONSOLIDATED STATEMENTS OF INCOME
FOR THE YEARS ENDED SEPTEMBER 30,
| 2016 | 2015 | 2014 | 2017 | 2016 | 2015 | |||||||||||||||||||
| INCOME: | ||||||||||||||||||||||||
| Rental Revenue | $ | 81,592,429 | $ | 67,059,385 | $ | 55,512,165 | $ | 97,659,778 | $ | 81,592,429 | $ | 67,059,385 | ||||||||||||
| Reimbursement Revenue | 13,323,681 | 10,716,112 | 9,160,176 | 15,886,204 | 13,323,681 | 10,716,112 | ||||||||||||||||||
| Lease Termination Income | -0- | 238,625 | 1,182,890 | -0- | -0- | 238,625 | ||||||||||||||||||
| TOTAL INCOME | 94,916,110 | 78,014,122 | 65,855,231 | 113,545,982 | 94,916,110 | 78,014,122 | ||||||||||||||||||
| EXPENSES: | ||||||||||||||||||||||||
| Real Estate Taxes | 10,455,401 | 8,362,135 | 7,605,611 | 12,427,311 | 10,455,401 | 8,362,135 | ||||||||||||||||||
| Operating Expenses | 4,273,899 | 4,127,884 | 3,711,868 | 4,887,922 | 4,273,899 | 4,127,884 | ||||||||||||||||||
| General & Administrative Expenses | 7,936,124 | 6,305,928 | 5,709,937 | |||||||||||||||||||||
| General and Administrative Expenses | 7,809,546 | 7,936,124 | 6,305,928 | |||||||||||||||||||||
| Acquisition Costs | 730,441 | 1,546,088 | 481,880 | 178,526 | 730,441 | 1,546,088 | ||||||||||||||||||
| Depreciation | 24,055,022 | 19,705,320 | 15,908,769 | 29,634,998 | 24,055,022 | 19,705,320 | ||||||||||||||||||
| Amortization of Capitalized Lease Costs and Intangible Assets | 2,032,658 | 2,067,408 | 1,810,812 | 1,824,751 | 2,032,658 | 2,067,408 | ||||||||||||||||||
| TOTAL EXPENSES | 49,483,545 | 42,114,763 | 35,228,877 | 56,763,054 | 49,483,545 | 42,114,763 | ||||||||||||||||||
| OTHER INCOME (EXPENSE): | ||||||||||||||||||||||||
| Dividend and Interest Income | 5,616,392 | 3,723,867 | 3,882,597 | 6,930,564 | 5,616,392 | 3,723,867 | ||||||||||||||||||
| Gain on Sale of Securities Transactions, net | 4,398,599 | 805,513 | 2,166,766 | 2,311,714 | 4,398,599 | 805,513 | ||||||||||||||||||
| Interest Expense | (21,836,811 | ) | (18,558,150 | ) | (16,104,678 | ) | ||||||||||||||||||
| Amortization of Financing Costs | (1,116,238 | ) | (1,286,016 | ) | (725,745 | ) | ||||||||||||||||||
| Interest Expense, including Amortization of Financing Costs | (25,754,121 | ) | (22,953,049 | ) | (19,844,166 | ) | ||||||||||||||||||
| TOTAL OTHER INCOME (EXPENSE) | (12,938,058 | ) | (15,314,786 | ) | (10,781,060 | ) | (16,511,843 | ) | (12,938,058 | ) | (15,314,786 | ) | ||||||||||||
| INCOME FROM CONTINUING OPERATIONS | 32,494,507 | 20,584,573 | 19,845,294 | 40,271,085 | 32,494,507 | 20,584,573 | ||||||||||||||||||
| Gain on Sale of Real Estate Investment | -0- | 5,021,242 | -0- | -0- | -0- | 5,021,242 | ||||||||||||||||||
| NET INCOME | 32,494,507 | 25,605,815 | 19,845,294 | 40,271,085 | 32,494,507 | 25,605,815 | ||||||||||||||||||
| Less: Preferred Dividends | 9,020,470 | 8,607,032 | 8,607,032 | 14,861,686 | 9,020,470 | 8,607,032 | ||||||||||||||||||
| Less: Redemption of Preferred Stock | 2,942,149 | -0- | -0- | 2,467,165 | 2,942,149 | -0- | ||||||||||||||||||
| NET INCOME ATTRIBUTABLE TO COMMON SHAREHOLDERS | $ | 20,531,888 | $ | 16,998,783 | $ | 11,238,262 | $ | 22,942,234 | $ | 20,531,888 | $ | 16,998,783 | ||||||||||||
See Accompanying Notes to the Consolidated Financial Statements
| 103 |
MONMOUTH REAL ESTATE INVESTMENT CORPORATION AND SUBSIDIARIES
CONSOLIDATED STATEMENTS OF INCOME
FOR THE YEARS ENDED SEPTEMBER 30,
| 2016 | 2015 | 2014 | 2017 | 2016 | 2015 | |||||||||||||||||||
| BASIC INCOME – PER SHARE | ||||||||||||||||||||||||
| Net Income | 0.50 | 0.43 | 0.40 | $ | 0.56 | $ | 0.50 | $ | 0.43 | |||||||||||||||
| Less: Preferred Dividends | (0.14 | ) | (0.14 | ) | (0.17 | ) | (0.21 | ) | (0.14 | ) | (0.14 | ) | ||||||||||||
| Less: Redemption of Preferred Stock | (0.05 | ) | -0- | -0- | (0.03 | ) | (0.05 | ) | -0- | |||||||||||||||
| Net Income Attributable to Common Shareholders – Basic | $ | 0.31 | $ | 0.29 | $ | 0.23 | $ | 0.32 | $ | 0.31 | $ | 0.29 | ||||||||||||
| DILUTED INCOME – PER SHARE | ||||||||||||||||||||||||
| Net Income | 0.50 | 0.43 | 0.40 | $ | 0.56 | $ | 0.50 | $ | 0.43 | |||||||||||||||
| Less: Preferred Dividends | (0.14 | ) | (0.14 | ) | (0.17 | ) | (0.21 | ) | (0.14 | ) | (0.14 | ) | ||||||||||||
| Less: Redemption of Preferred Stock | (0.05 | ) | -0- | -0- | (0.03 | ) | (0.05 | ) | -0- | |||||||||||||||
| Net Income Attributable to Common Shareholders – Diluted | $ | 0.31 | $ | 0.29 | $ | 0.23 | $ | 0.32 | $ | 0.31 | $ | 0.29 | ||||||||||||
| WEIGHTED AVERAGE SHARES OUTSTANDING | ||||||||||||||||||||||||
| WEIGHTED AVERAGE COMMON SHARES OUTSTANDING | ||||||||||||||||||||||||
| Basic | 65,468,564 | 59,085,888 | 49,829,924 | 72,114,078 | 65,468,564 | 59,085,888 | ||||||||||||||||||
| Diluted | 65,558,284 | 59,201,296 | 49,925,036 | 72,249,691 | 65,558,284 | 59,201,296 | ||||||||||||||||||
See Accompanying Notes to the Consolidated Financial Statements
| 104 |
MONMOUTH REAL ESTATE INVESTMENT CORPORATION AND SUBSIDIARIES
CONSOLIDATED STATEMENTS OF COMPREHENSIVE INCOME
FOR THE YEARS ENDED SEPTEMBER 30,
| 2016 | 2015 | 2014 | 2017 | 2016 | 2015 | |||||||||||||||||||
| Net Income | $ | 32,494,507 | $ | 25,605,815 | $ | 19,845,294 | $ | 40,271,085 | $ | 32,494,507 | $ | 25,605,815 | ||||||||||||
| Other Comprehensive Income: | ||||||||||||||||||||||||
| Unrealized Holding Gains (Losses) Arising During the Period | 22,782,469 | (4,757,446 | ) | 298,854 | (4,059,988 | ) | 22,782,469 | (4,757,446 | ) | |||||||||||||||
| Reclassification Adjustment for Net Gains of Sales of Securities Transactions Realized in Income | (4,398,599 | ) | (805,513 | ) | (2,166,766 | ) | (2,311,714 | ) | (4,398,599 | ) | (805,513 | ) | ||||||||||||
| Total Comprehensive Income | 50,878,377 | 20,042,856 | 17,977,382 | 33,899,383 | 50,878,377 | 20,042,856 | ||||||||||||||||||
| Less: Preferred Dividends | 9,020,470 | 8,607,032 | 8,607,032 | 14,861,686 | 9,020,470 | 8,607,032 | ||||||||||||||||||
| Less: Redemption of Preferred Stock | 2,942,149 | -0- | -0- | 2,467,165 | 2,942,149 | -0- | ||||||||||||||||||
| Comprehensive Income Attributable to Common Shareholders | $ | 38,915,758 | $ | 11,435,824 | $ | 9,370,350 | $ | 16,570,532 | $ | 38,915,758 | $ | 11,435,824 | ||||||||||||
See Accompanying Notes to the Consolidated Financial Statements
| 105 |
MONMOUTH REAL ESTATE INVESTMENT CORPORATION AND SUBSIDIARIES
CONSOLIDATED STATEMENTS OF SHAREHOLDERS’ EQUITY
FOR THE YEARS ENDED SEPTEMBER 30, 2017, 2016, 2015, AND 20142015
| Common Stock | Preferred Stock Series A | Preferred Stock Series B | Preferred Stock Series C | Additional Paid in Capital | Common Stock | Preferred Stock Series A | Preferred Stock Series B | Preferred Stock Series C | Additional Paid in Capital | |||||||||||||||||||||||||||||||
| Balance September 30, 2013 | $ | 444,885 | $ | 53,493,750 | $ | 57,500,000 | $ | -0- | $ | 222,487,068 | ||||||||||||||||||||||||||||||
| Shares Issued in Connection with the DRIP (1) | 42,961 | -0- | -0- | -0- | 38,047,373 | |||||||||||||||||||||||||||||||||||
| Shares Issued in Connection with Underwritten Public Offering of Common Stock, net of offering costs | 80,500 | -0- | -0- | -0- | 65,032,186 | |||||||||||||||||||||||||||||||||||
| Shares Issued Through the Exercise of Stock Options | 1,642 | -0- | -0- | -0- | 1,325,527 | |||||||||||||||||||||||||||||||||||
| Shares Issued Through Restricted Stock Awards | 100 | -0- | -0- | -0- | (100 | ) | ||||||||||||||||||||||||||||||||||
| Stock Compensation Expense | -0- | -0- | -0- | -0- | 347,002 | |||||||||||||||||||||||||||||||||||
| Distributions To Common Shareholders | -0- | -0- | -0- | -0- | (18,293,168 | ) | ||||||||||||||||||||||||||||||||||
| Net Income | -0- | -0- | -0- | -0- | -0- | |||||||||||||||||||||||||||||||||||
| Preferred Dividends | -0- | -0- | -0- | -0- | -0- | |||||||||||||||||||||||||||||||||||
| Unrealized Net Holding Loss on Securities Availablefor Sale, Net of Reclassification Adjustment | -0- | -0- | -0- | -0- | -0- | |||||||||||||||||||||||||||||||||||
| Balance September 30, 2014 | 570,088 | 53,493,750 | 57,500,000 | -0- | 308,945,888 | $ | 570,088 | $ | 53,493,750 | $ | 57,500,000 | $ | -0- | $ | 308,945,888 | |||||||||||||||||||||||||
| Shares Issued in Connection with the DRIP (1) | 49,755 | -0- | -0- | -0- | 48,354,801 | 49,755 | -0- | -0- | -0- | 48,354,801 | ||||||||||||||||||||||||||||||
| Shares Issued Through the Exercise of Stock Options | 812 | -0- | -0- | -0- | 611,598 | 812 | -0- | -0- | -0- | 611,598 | ||||||||||||||||||||||||||||||
| Shares Issued Through Restricted Stock Awards | 580 | -0- | -0- | -0- | (580 | ) | 580 | -0- | -0- | -0- | (580 | ) | ||||||||||||||||||||||||||||
| Stock Compensation Expense | -0- | -0- | -0- | -0- | 448,895 | -0- | -0- | -0- | -0- | 448,895 | ||||||||||||||||||||||||||||||
| Distributions To Common Shareholders | -0- | -0- | -0- | -0- | (18,523,344 | ) | -0- | -0- | -0- | -0- | (18,523,344 | ) | ||||||||||||||||||||||||||||
| Net Income | -0- | -0- | -0- | -0- | -0- | -0- | -0- | -0- | -0- | -0- | ||||||||||||||||||||||||||||||
| Preferred Dividends | -0- | -0- | -0- | -0- | -0- | -0- | -0- | -0- | -0- | -0- | ||||||||||||||||||||||||||||||
| Unrealized Net Holding Loss on Securities Availablefor Sale, Net of Reclassification Adjustment | -0- | -0- | -0- | -0- | -0- | |||||||||||||||||||||||||||||||||||
| Change in Unrealized Net Holding Gain (Loss) on Securities Available for Sale, Net of Reclassification Adjustment | -0- | -0- | -0- | -0- | -0- | |||||||||||||||||||||||||||||||||||
| Balance September 30, 2015 | 621,235 | 53,493,750 | 57,500,000 | -0- | 339,837,258 | 621,235 | 53,493,750 | 57,500,000 | -0- | 339,837,258 | ||||||||||||||||||||||||||||||
| Shares Issued in Connection with the DRIP (1) | 65,157 | -0- | -0- | -0- | 72,110,640 | 65,157 | -0- | -0- | -0- | 72,110,640 | ||||||||||||||||||||||||||||||
| Shares Issued in Connection with Underwritten Public Offering of Series C Preferred Stock, net of offering costs | -0- | -0- | -0- | 135,000,000 | (4,456,578 | ) | ||||||||||||||||||||||||||||||||||
| Shares Issued in Connection with Underwritten Public Offering of 6.125% Series C Preferred Stock, net of offering costs | -0- | -0- | -0- | 135,000,000 | (4,456,578 | ) | ||||||||||||||||||||||||||||||||||
| Preferred Stock Called for Redemption | -0- | (53,493,750 | ) | -0- | -0- | 2,930,649 | -0- | (53,493,750 | ) | -0- | -0- | 2,930,649 | ||||||||||||||||||||||||||||
| Shares Issued Through the Exercise of Stock Options | 2,450 | -0- | -0- | -0- | 1,880,850 | 2,450 | -0- | -0- | -0- | 1,880,850 | ||||||||||||||||||||||||||||||
| Shares Issued Through Restricted Stock Awards | 400 | -0- | -0- | -0- | (400 | ) | 400 | -0- | -0- | -0- | (400 | ) | ||||||||||||||||||||||||||||
| Cancellation of Shares Related to Forfeiture of Restricted Stock Awards | (32 | ) | -0- | -0- | -0- | 32 | (32 | ) | -0- | -0- | -0- | 32 | ||||||||||||||||||||||||||||
| Stock Compensation Expense | -0- | -0- | -0- | -0- | 926,465 | -0- | -0- | -0- | -0- | 926,465 | ||||||||||||||||||||||||||||||
| Distributions To Common Shareholders | -0- | -0- | -0- | -0- | (21,502,295 | ) | -0- | -0- | -0- | -0- | (21,502,295 | ) | ||||||||||||||||||||||||||||
| Net Income | -0- | -0- | -0- | -0- | -0- | -0- | -0- | -0- | -0- | -0- | ||||||||||||||||||||||||||||||
| Preferred Dividends | -0- | -0- | -0- | -0- | -0- | -0- | -0- | -0- | -0- | -0- | ||||||||||||||||||||||||||||||
| Unrealized Net Holding Gain on Securities Availablefor Sale, Net of Reclassification Adjustment | -0- | -0- | -0- | -0- | -0- | |||||||||||||||||||||||||||||||||||
| Change in Unrealized Net Holding Gain on Securities Available for Sale, Net of Reclassification Adjustment | -0- | -0- | -0- | -0- | -0- | |||||||||||||||||||||||||||||||||||
| Balance September 30, 2016 | $ | 689,210 | $ | -0- | $ | 57,500,000 | $ | 135,000,000 | $ | 391,726,621 | 689,210 | -0- | 57,500,000 | 135,000,000 | 391,726,621 | |||||||||||||||||||||||||
| Shares Issued in Connection with the DRIP (1) | 66,327 | -0- | -0- | -0- | 91,865,504 | |||||||||||||||||||||||||||||||||||
| Shares Issued in Connection with Underwritten Public Offering of 6.125% Series C Preferred Stock, net of offering costs | -0- | -0- | -0- | 75,000,000 | (3,996,907 | ) | ||||||||||||||||||||||||||||||||||
| Shares Issued in Connection with At-The-Market Offerings of 6.125% Series C Preferred Stock, net of offering costs | -0- | -0- | -0- | 35,986,125 | (255,906 | ) | ||||||||||||||||||||||||||||||||||
| Preferred Stock Called for Redemption | -0- | -0- | (57,500,000 | ) | -0- | 2,467,165 | ||||||||||||||||||||||||||||||||||
| Shares Issued Through the Exercise of Stock Options | 650 | -0- | -0- | -0- | 468,650 | |||||||||||||||||||||||||||||||||||
| Shares Issued Through Restricted Stock Awards | 110 | -0- | -0- | -0- | (110 | ) | ||||||||||||||||||||||||||||||||||
| Stock Compensation Expense | 8 | -0- | -0- | -0- | 624,698 | |||||||||||||||||||||||||||||||||||
| Distributions To Common Shareholders | -0- | -0- | -0- | -0- | (23,347,014 | ) | ||||||||||||||||||||||||||||||||||
| Net Income | -0- | -0- | -0- | -0- | -0- | |||||||||||||||||||||||||||||||||||
| Preferred Dividends | -0- | -0- | -0- | -0- | -0- | |||||||||||||||||||||||||||||||||||
| Change in Unrealized Net Holding Gain on Securities Available for Sale, Net of Reclassification Adjustment | -0- | -0- | -0- | -0- | -0- | |||||||||||||||||||||||||||||||||||
| Balance September 30, 2017 | $ | 756,305 | $ | -0- | $ | -0- | $ | 245,986,125 | $ | 459,552,701 | ||||||||||||||||||||||||||||||
| (1) | Dividend Reinvestment and Stock Purchase Plan |
See Accompanying Notes to the Consolidated Financial Statements
| 106 |
MONMOUTH REAL ESTATE INVESTMENT CORPORATION AND SUBSIDIARIES
CONSOLIDATED STATEMENTS OF SHAREHOLDERS’ EQUITY
FOR THE YEARS ENDED SEPTEMBER 30, 2017, 2016 2015 AND 2014,2015, CONT’D.
| Undistributed Income (Loss) | Accumulated Other Comprehensive Income (Loss) | Total Shareholders’ Equity | Undistributed Income (Loss) | Accumulated Other Comprehensive Income (Loss) | Total Shareholders’ Equity | |||||||||||||||||||
| Balance September 30, 2013 | $ | -0- | $ | 1,989,268 | $ | 335,914,971 | ||||||||||||||||||
| Shares Issued in Connection with the DRIP (1) | -0- | -0- | 38,090,334 | |||||||||||||||||||||
| Shares Issued in Connection with Underwritten PublicOffering of Common Stock, net of offering costs | -0- | -0- | 65,112,686 | |||||||||||||||||||||
| Shares Issued Through the Exercise of Stock Options | -0- | -0- | 1,327,169 | |||||||||||||||||||||
| Shares Issued Through Restricted Stock Awards | -0- | -0- | -0- | |||||||||||||||||||||
| Stock Compensation Expense | -0- | -0- | 347,002 | |||||||||||||||||||||
| Distributions To Common Shareholders | (11,238,262 | ) | -0- | (29,531,430 | ) | |||||||||||||||||||
| Net Income | 19,845,294 | -0- | 19,845,294 | |||||||||||||||||||||
| Preferred Dividends | (8,607,032 | ) | -0- | (8,607,032 | ) | |||||||||||||||||||
| Unrealized Net Holding Loss on Securities Available for Sale, Net of Reclassification Adjustment | -0- | (1,867,912 | ) | (1,867,912 | ) | |||||||||||||||||||
| Balance September 30, 2014 | -0- | 121,356 | 420,631,082 | $ | -0- | $ | 121,356 | $ | 420,631,082 | |||||||||||||||
| Shares Issued in Connection with the DRIP (1) | -0- | -0- | 48,404,556 | -0- | -0- | 48,404,556 | ||||||||||||||||||
| Shares Issued Through the Exercise of Stock Options | -0- | -0- | 612,410 | -0- | -0- | 612,410 | ||||||||||||||||||
| Shares Issued Through Restricted Stock Awards | -0- | -0- | -0- | -0- | -0- | -0- | ||||||||||||||||||
| Stock Compensation Expense | -0- | -0- | 448,895 | -0- | -0- | 448,895 | ||||||||||||||||||
| Distributions To Common Shareholders | (16,998,783 | ) | -0- | (35,522,127 | ) | (16,998,783 | ) | -0- | (35,522,127 | ) | ||||||||||||||
| Net Income | 25,605,815 | -0- | 25,605,815 | 25,605,815 | -0- | 25,605,815 | ||||||||||||||||||
| Preferred Dividends | (8,607,032 | ) | -0- | (8,607,032 | ) | (8,607,032 | ) | -0- | (8,607,032 | ) | ||||||||||||||
| Unrealized Net Holding Loss on Securities Available for Sale, Net of Reclassification Adjustment | -0- | (5,562,959 | ) | (5,562,959 | ) | |||||||||||||||||||
| Change in Unrealized Net Holding Gain (Loss) on Securities Available for Sale, Net of Reclassification Adjustment | -0- | (5,562,959 | ) | (5,562,959 | ) | |||||||||||||||||||
| Balance September 30, 2015 | -0- | (5,441,603 | ) | 446,010,640 | -0- | (5,441,603 | ) | 446,010,640 | ||||||||||||||||
| Shares Issued in Connection with the DRIP (1) | -0- | -0- | 72,175,797 | -0- | -0- | 72,175,797 | ||||||||||||||||||
| Shares Issued in Connection with Underwritten Public Offering of Series C Preferred Stock, net of offering costs | -0- | -0- | 130,543,422 | |||||||||||||||||||||
| Shares Issued in Connection with Underwritten Public Offering of 6.125% Series C Preferred Stock, net of offering costs | -0- | -0- | 130,543,422 | |||||||||||||||||||||
| Preferred Stock Called for Redemption | (2,942,149 | ) | -0- | (53,505,250 | ) | (2,942,149 | ) | -0- | (53,505,250 | ) | ||||||||||||||
| Shares Issued Through the Exercise of Stock Options | -0- | -0- | 1,883,300 | -0- | -0- | 1,883,300 | ||||||||||||||||||
| Shares Issued Through Restricted Stock Awards | -0- | -0- | -0- | -0- | -0- | -0- | ||||||||||||||||||
| Cancellation of Shares Related to Forfeiture of Restricted Stock Awards | -0- | -0- | -0- | -0- | -0- | -0- | ||||||||||||||||||
| Stock Compensation Expense | -0- | -0- | 926,465 | -0- | -0- | 926,465 | ||||||||||||||||||
| Distributions To Common Shareholders | (20,531,888 | ) | -0- | (42,034,183 | ) | (20,531,888 | ) | -0- | (42,034,183 | ) | ||||||||||||||
| Net Income | 32,494,507 | -0- | 32,494,507 | 32,494,507 | -0- | 32,494,507 | ||||||||||||||||||
| Preferred Dividends | (9,020,470 | ) | -0- | (9,020,470 | ) | (9,020,470 | ) | -0- | (9,020,470 | ) | ||||||||||||||
| Unrealized Net Holding Gain on Securities Available for Sale, Net of Reclassification Adjustment | -0- | 18,383,870 | 18,383,870 | |||||||||||||||||||||
| Change in Unrealized Net Holding Gain on Securities Available for Sale, Net of Reclassification Adjustment | -0- | 18,383,870 | 18,383,870 | |||||||||||||||||||||
| Balance September 30, 2016 | $ | -0- | $ | 12,942,267 | $ | 597,858,098 | -0- | 12,942,267 | 597,858,098 | |||||||||||||||
| Shares Issued in Connection with the DRIP (1) | -0- | -0- | 91,931,831 | |||||||||||||||||||||
| Shares Issued in Connection with Underwritten Public Offering of 6.125% Series C Preferred Stock, net of offering costs | -0- | -0- | 71,003,093 | |||||||||||||||||||||
| Shares Issued in Connection with At-The-Market Offerings of 6.125% Series C Preferred Stock, net of offering costs | -0- | -0- | 35,730,219 | |||||||||||||||||||||
| Preferred Stock Called for Redemption | (2,467,165 | ) | -0- | (57,500,000 | ) | |||||||||||||||||||
| Shares Issued Through the Exercise of Stock Options | -0- | -0- | 469,300 | |||||||||||||||||||||
| Shares Issued Through Restricted Stock Awards | -0- | -0- | -0- | |||||||||||||||||||||
| Stock Compensation Expense | -0- | -0- | 624,706 | |||||||||||||||||||||
| Distributions To Common Shareholders | (22,942,234 | ) | -0- | (46,289,248 | ) | |||||||||||||||||||
| Net Income | 40,271,085 | -0- | 40,271,085 | |||||||||||||||||||||
| Preferred Dividends | (14,861,686 | ) | -0- | (14,861,686 | ) | |||||||||||||||||||
| Change in Unrealized Net Holding Gain on Securities Available for Sale, Net of Reclassification Adjustment | -0- | (6,371,702 | ) | (6,371,702 | ) | |||||||||||||||||||
| Balance September 30, 2017 | $ | -0- | $ | 6,570,565 | $ | 712,865,696 | ||||||||||||||||||
| (1) | Dividend Reinvestment and Stock Purchase Plan |
See Accompanying Notes to the Consolidated Financial Statements
| 107 |
MONMOUTH REAL ESTATE INVESTMENT CORPORATION AND SUBSIDIARIES
CONSOLIDATED STATEMENTS OF CASH FLOWS
FOR THE YEARS ENDED SEPTEMBER 30,
| 2016 | 2015 | 2014 | 2017 | 2016 | 2015 | |||||||||||||||||||
| CASH FLOWS FROM OPERATING ACTIVITIES | ||||||||||||||||||||||||
| Net Income | $ | 32,494,507 | $ | 25,605,815 | $ | 19,845,294 | $ | 40,271,085 | $ | 32,494,507 | $ | 25,605,815 | ||||||||||||
| Noncash Items Included in Net Income: | ||||||||||||||||||||||||
| Depreciation & Amortization | 27,203,918 | 23,058,744 | 18,445,326 | 32,694,009 | 27,203,918 | 23,058,744 | ||||||||||||||||||
| Stock Compensation Expense | 926,465 | 448,895 | 347,002 | 624,706 | 926,465 | 448,895 | ||||||||||||||||||
| Deferred Straight Line Rent | (463,842 | ) | (1,080,699 | ) | (1,446,264 | ) | ||||||||||||||||||
| Gain on Sale of Securities Transactions, net | (4,398,599 | ) | (805,513 | ) | (2,166,766 | ) | (2,311,714 | ) | (4,398,599 | ) | (805,513 | ) | ||||||||||||
| Gain on Sale of Real Estate Investments | -0- | (5,021,242 | ) | -0- | ||||||||||||||||||||
| Loss (Gain) on Sale of Real Estate Investments | 95,336 | -0- | (5,021,242 | ) | ||||||||||||||||||||
| Changes in: | ||||||||||||||||||||||||
| Tenant, Deferred Rent & Other Receivables | (1,640,504 | ) | (800,203 | ) | (922,107 | ) | ||||||||||||||||||
| Tenant & Other Receivables | (206,262 | ) | (559,805 | ) | 646,061 | |||||||||||||||||||
| Prepaid Expenses | (899,371 | ) | (1,166,821 | ) | (563,525 | ) | (603,887 | ) | (899,371 | ) | (1,166,821 | ) | ||||||||||||
| Other Assets and Capitalized Lease Costs | (1,814,638 | ) | (2,359,895 | ) | (1,086,846 | ) | ||||||||||||||||||
| Other Assets & Capitalized Lease Costs | 15,353 | (1,814,638 | ) | (2,359,895 | ) | |||||||||||||||||||
| Accounts Payable, Accrued Expenses & Other Liabilities | 2,827,722 | (897,495 | ) | 957,907 | 3,753,082 | 2,827,722 | (897,495 | ) | ||||||||||||||||
| NET CASH PROVIDED BY OPERATING ACTIVITIES | 54,699,500 | 38,062,285 | 34,856,285 | 73,867,866 | 54,699,500 | 38,062,285 | ||||||||||||||||||
| CASH FLOWS FROM INVESTING ACTIVITIES | ||||||||||||||||||||||||
| Purchase of Real Estate & Intangible Assets | (210,747,340 | ) | (192,187,485 | ) | (97,374,760 | ) | (286,951,980 | ) | (210,747,340 | ) | (192,187,485 | ) | ||||||||||||
| Capital and Land Site Improvements | (21,566,561 | ) | (10,541,656 | ) | (19,674,128 | ) | ||||||||||||||||||
| Capital Improvements | (4,974,988 | ) | (21,566,561 | ) | (10,541,656 | ) | ||||||||||||||||||
| Proceeds on Sale of Real Estate | -0- | 8,846,686 | -0- | 4,125,819 | -0- | 8,846,686 | ||||||||||||||||||
| Return of Deposits on Real Estate | 2,950,000 | 3,100,000 | 2,050,000 | 3,400,000 | 2,950,000 | 3,100,000 | ||||||||||||||||||
| Deposits Paid on Acquisitions of Real Estate | (2,200,000 | ) | (3,700,000 | ) | (3,250,000 | ) | (450,000 | ) | (2,200,000 | ) | (3,700,000 | ) | ||||||||||||
| Proceeds from Sale of Securities Available for Sale | 17,274,946 | 22,774,768 | 16,201,480 | |||||||||||||||||||||
| Purchase of Securities Available for Sale | (19,055,956 | ) | (16,188,760 | ) | (27,840,200 | ) | (71,494,810 | ) | (19,055,956 | ) | (16,188,760 | ) | ||||||||||||
| Proceeds from Sale of Securities Available for Sale | 22,774,768 | 16,201,480 | 14,279,391 | |||||||||||||||||||||
| NET CASH USED IN INVESTING ACTIVITIES | (227,845,089 | ) | (194,469,735 | ) | (131,809,697 | ) | (339,071,013 | ) | (227,845,089 | ) | (194,469,735 | ) | ||||||||||||
| CASH FLOWS FROM FINANCING ACTIVITIES | ||||||||||||||||||||||||
| Proceeds from Mortgage Notes Payable | 153,428,485 | 122,173,058 | 62,905,000 | |||||||||||||||||||||
| Principal Payments on Mortgage Notes Payable | (43,671,506 | ) | (35,977,890 | ) | (25,202,376 | ) | ||||||||||||||||||
| Net (Repayments) Proceeds from Loans Payable | (4,250,702 | ) | 59,841,386 | 3,000,000 | ||||||||||||||||||||
| Proceeds from Fixed Rate Mortgage Notes Payable | 188,809,000 | 153,428,485 | 122,173,058 | |||||||||||||||||||||
| Principal Payments on Fixed Rate Mortgage Notes Payable | (73,594,586 | ) | (43,671,506 | ) | (35,977,890 | ) | ||||||||||||||||||
| Net Proceeds (Repayments) from Loans Payable | 39,300,733 | (4,250,702 | ) | 59,841,386 | ||||||||||||||||||||
| Financing Costs Paid on Debt | (2,646,393 | ) | (2,917,663 | ) | (2,070,790 | ) | (2,190,098 | ) | (2,646,393 | ) | (2,917,663 | ) | ||||||||||||
| Proceeds from Underwritten Public Offering of Preferred Stock, net of offering costs | 130,543,422 | -0- | -0- | |||||||||||||||||||||
| Proceeds from Underwritten Public Offering of CommonStock, net of offering costs | -0- | -0- | 65,112,686 | |||||||||||||||||||||
| Proceeds from Issuance of Common Stock in the DRIP, netof Dividend Reinvestments | 63,806,651 | 39,915,387 | 30,465,806 | |||||||||||||||||||||
| Redemption of 7.625% Series A Preferred Stock | (53,493,750 | ) | -0- | -0- | ||||||||||||||||||||
| Redemption of 7.875% Series B Preferred Stock | (57,500,000 | ) | -0- | -0- | ||||||||||||||||||||
| Proceeds from Underwritten Public Offering of 6.125% Series C Preferred Stock, net of offering costs | 71,003,093 | 130,543,422 | -0- | |||||||||||||||||||||
| Proceeds from At-The-Market Preferred Equity Program, net of offering costs | 35,733,885 | -0- | -0- | |||||||||||||||||||||
| Proceeds from Issuance of Common Stock in the DRIP, net of Dividend Reinvestments | 81,805,937 | 63,806,651 | 39,915,387 | |||||||||||||||||||||
| Proceeds from the Exercise of Stock Options | 1,883,300 | 612,410 | 1,327,169 | 469,300 | 1,883,300 | 612,410 | ||||||||||||||||||
| Preferred Dividends Paid | (8,607,032 | ) | (8,607,032 | ) | (8,607,032 | ) | (14,500,474 | ) | (8,607,032 | ) | (8,607,032 | ) | ||||||||||||
| Common Dividends Paid, net of Reinvestments | (33,665,037 | ) | (27,032,958 | ) | (21,906,902 | ) | (36,163,355 | ) | (33,665,037 | ) | (27,032,958 | ) | ||||||||||||
| NET CASH PROVIDED BY FINANCING ACTIVITIES | 256,821,188 | 148,006,698 | 105,023,561 | 179,679,685 | 256,821,188 | 148,006,698 | ||||||||||||||||||
| Net Increase (Decrease) in Cash and Cash Equivalents | 83,675,599 | (8,400,752 | ) | 8,070,149 | (85,523,462 | ) | 83,675,599 | (8,400,752 | ) | |||||||||||||||
| Cash and Cash Equivalents at Beginning of Year | 12,073,909 | 20,474,661 | 12,404,512 | 95,749,508 | 12,073,909 | 20,474,661 | ||||||||||||||||||
| CASH AND CASH EQUIVALENTS AT END OF YEAR | $ | 95,749,508 | $ | 12,073,909 | $ | 20,474,661 | $ | 10,226,046 | $ | 95,749,508 | $ | 12,073,909 | ||||||||||||
See Accompanying Notes to the Consolidated Financial Statements
| 108 |
MONMOUTH REAL ESTATE INVESTMENT CORPORATION AND SUBSIDIARIES
NOTES TO THE CONSOLIDATED FINANCIAL STATEMENTS
SEPTEMBER 30, 20162017
NOTE 1 – ORGANIZATION AND SUMMARY OF SIGNIFICANT ACCOUNTING POLICIES
Description of the Business
Monmouth Real Estate Investment Corporation (a Maryland corporation) and its subsidiaries (the Company) operate as a real estate investment trust (REIT), deriving its income primarily from real estate rental operations. As of September 30, 20162017 and 2015,2016, rental properties consisted of ninety-nine108 and ninety-one99 property holdings, respectively. These properties are located in thirty30 states: Alabama, Arizona, Colorado, Connecticut, Florida, Georgia, Illinois, Indiana, Iowa, Kansas, Kentucky, Louisiana, Maryland, Michigan, Minnesota, Mississippi, Missouri, Nebraska, New Jersey, New York, North Carolina, Ohio, Oklahoma, Pennsylvania, South Carolina, Tennessee, Texas, Virginia, Washington and Wisconsin. In addition, the Company holdsowns a portfolio of REIT securities which the Company generally limits to no more than approximately 10% of its undepreciated assets (which is the Company’s total assets excluding accumulated depreciation).
Management views the Company as a single segment based on its method of internal reporting in addition to its allocation of capital and resources.Segment Reporting & Financial Information
The Company’s primary business is the ownership and management of real estate properties. The Company invests in well-located, modern, single tenant, industrial buildings leased primarily to investment-grade tenants or their subsidiaries on long-term net leases. The Company reviews operating and financial information for each property on an individual basis and, therefore, each property represents an individual operating segment. The Company evaluates financial performance using Net Operating Income (NOI) from property operations. NOI is a non-GAAP financial measure, which we define as recurring Rental and Reimbursement Revenue, less Real Estate Taxes and Operating Expenses, such as insurance, utilities and repairs and maintenance. The Company has aggregated the properties into one reportable segment as the properties share similar long-term economic characteristics and have other similarities, including the fact that they are operated as industrial properties subject to long-term net leases primarily to investment-grade tenants or their subsidiaries.For required financial information related to our operations and assets, please refer to our consolidated financial statements, including the notes thereto in this Annual Report.
Use of Estimates
In preparing the financial statements in accordance with accounting principles generally accepted in the United States of America (“U.S. GAAP”)(U.S. GAAP), management is required to make certain estimates and assumptions that affect the reported amounts of assets and liabilities at the date of the financial statements and the reported amounts of revenues and expenses during the reporting periods. Actual results could differ from these estimates.
Principles of Consolidation and Non-controlling Interest
The consolidated financial statements include the Company and its wholly-owned subsidiaries. In 2005, the Company formed MREIC Financial, Inc., a taxable REIT subsidiary which has had no activity since inception. In 2007, the Company merged with Monmouth Capital Corporation (Monmouth Capital), with Monmouth Capital surviving as a wholly-owned subsidiary of the Company. All intercompany transactions and balances have been eliminated in consolidation.
At September 30, 2016,2017, Monmouth Capital owns a 51% majority interest in Palmer Terrace Realty Associates, LLC (a New Jersey limited liability company) (Palmer Terrace). The Company consolidates the results of operations of Palmer Terrace. Non-controlling interest represents 49% of the members’ equity in Palmer Terrace and is included in Other Liabilities in the accompanying Consolidated Balance Sheet.
| 109 |
Buildings and Improvements
Buildings and improvements are stated at the lower of depreciated cost or net realizable value. Depreciation is computed based on the straight-line method over the estimated useful lives of the assets. These lives are 39 years for buildings and range from 5 to 39 years for improvements.
The Company applies Financial Accounting Standards Board (FASB) Accounting Standards Codification (ASC) 360-10, Property, Plant & Equipment (ASC 360-10) to measure impairment in real estate investments. Rental properties are individually evaluated for impairment when conditions exist which may indicate that it is probable that the sum of expected future cash flows (on an undiscounted basis without interest) from a rental property is less than its historical net cost basis. These expected future cash flows consider factors such as future operating income, trends and prospects as well as the effects of leasing demand, competition and other factors. Upon determination that an other-than-temporary impairment has occurred, rental properties are reduced to their fair value. For properties to be disposed of, an impairment loss is recognized when the fair value of the property, less the estimated cost to sell, is less than the carrying amount of the property measured at the time there is a commitment to sell the property and/or it is actively being marketed for sale. A property to be disposed of is reported at the lower of its carrying amount or its estimated fair value, less its cost to sell. Subsequent to the date that a property is held for disposition, depreciation expense is not recorded.
Gains (Losses) on Sale of Real Estate
Gains (losses) on the sale of real estate investments are recognized when the profit (loss) on a given sale is determinable, and the seller is not obliged to perform significant activities after the sale to earn such profit.profit (loss).
Acquisitions
The Company accounts for acquisitions in accordance withPrior to the provisionsadoption of ASC 805, Business Combinations (ASC 805) which requires transaction costs, such as broker fees, transfer taxes, legal, accounting, valuation, and other professional and consulting fees, related to acquisitions are expensed as incurred.
UponASU 2017-01, upon acquisition of a property, the Company allocatesallocated the purchase price of the property based upon the fair value of the assets acquired, as if vacant, which generally consistconsisted of land, buildings and intangible assets, including above and below market leases and in-place leases. The Company allocatesallocated the purchase price to the fair value of the tangible assets of an acquired property generally determined by third party appraisal of the property obtained in conjunction with the purchase.
The purchase price iswas further allocated to acquired above and below market leases based on the present value of the difference between prevailing market rates and the in-place lease rates over the remaining term. In addition, any remaining amounts of the purchase price arewere applied to in-place lease values based on management’s evaluation of the specific characteristics of each tenant’s lease. In-place leases that may have a customer relationship intangible value, including (but not limited to) the nature and extent of the existing relationshipsrelationship with the tenant, the tenant’s credit quality and expectations of lease renewals arewere also considered. Acquired above and below market leases arewere amortized to rental revenue over the remaining non-cancelable terms of the respective leases. The value of in-place lease intangibles (including customer relationships) iswas amortized to amortization expense over the remaining lease term. If a tenant terminatesterminated its lease early, the unamortized portion of the tenant improvements, leasing commissions, deferred rent, and the in-place lease value iswas charged to expense.expense when there was a signed termination agreement, all of the conditions of the termination agreement were met, the tenant is no longer occupying the property and the termination consideration, if any, is probable of collection.
As a result of the adoption of Accounting Standards Update (ASU) 2017-01, (as further described herein under “New Accounting Pronouncements”), effective April 1, 2017 the Company no longer accounts for its property acquisitions as business combinations and instead accounts for its property acquisitions as acquisitions of assets. In an acquisition of assets, certain acquisition costs are capitalized to real estate investments as part of the purchase price as opposed to being expensed as Acquisition Costs under the previous accounting treatment for business combinations. Therefore, as of April 1, 2017, the Company no longer is required to expense its Acquisition Costs. Accordingly, the Company accounted for the properties purchased in Walker (Grand Rapids), MI; Mesquite (Dallas), TX; Aiken (Augusta, GA), SC; Homestead (Miami), FL; Oklahoma City, OK; Concord (Charlotte), NC; Kenton, OH and Stow, OH as asset acquisitions and allocated the total cash consideration, including transaction costs, to the individual assets acquired on a relative fair value basis. There were no liabilities assumed in these acquisitions.
Marketable Securities
Investments in securities available for sale primarily consist of marketable common and preferred stock securities of other REITs, which the Company generally limits to no more than approximately 10% of its undepreciated assets (which is the Company’s total assets excluding accumulated depreciation). These marketable securities are all publicly-traded and purchased on the open market, through private transactions or through dividend reinvestment plans. These securities may be classified among three categories: held-to-maturity, trading, and available-for-sale. The Company normally holds REIT securities on a long termlong-term basis and has the ability and intent to hold securities to recovery, thereforerecovery. Therefore as of September 30, 20162017 and 2015,2016, the Company’s securities are all classified as available-for-sale and are carried at fair value based upon quoted market prices in active markets. Gains or losses on the sale of securities are based on average cost and are accounted for on a trade date basis. Unrealized holding gains and losses are excluded from earnings and reported as a separate component of Shareholders’ Equity until realized. The change in the unrealized net holding gains (losses) is reflected as Comprehensive Income (Loss).
The Company individually reviews and evaluates its marketable securities for impairment on a quarterly basis or when events or circumstances occur. The Company considers, among other things, credit aspects of the issuer, amount of decline in fair value over cost and length of time in a continuous loss position. The Company has developed a general policy of evaluating whether an unrealized loss is other than temporary. On a quarterly basis, the Company makes an initial review of every individual security in its portfolio. If the security is impaired, the Company first determines its intent and ability to hold this investment for a period of time sufficient to allow for any anticipated recovery in market value. Next, the Company determines the length of time and the extent of the impairment. Barring other factors, including the downgrading of the security or the cessation of dividends, if the fair value of the security is below cost by less than 20% for less than 6 months and the Company has the intent and ability to hold the security, the security is deemed to be temporarily impaired. Otherwise, the Company reviews additional information to determine whether the impairment is other than temporary. The Company discusses and analyzes any relevant information known about the security, such as:
| a. | Whether the decline is attributable to adverse conditions related to the security or to specific conditions in an industry or in a geographic area. | |
| b. | Any downgrading of the security by a rating agency. | |
| c. | Whether the financial condition of the issuer has deteriorated. | |
| d. | Status of dividends – Whether dividends have been reduced or eliminated, or scheduled interest payments have not been made. | |
| e. | Analysis of the underlying assets (including NAV analysis) using independent analysis or recent transactions. |
The Company normally holds REIT securities on a long termlong-term basis and has the ability and intent to hold securities to recovery. If a decline in fair value is determined to be other than temporary, an impairment charge is recognized in earnings and the cost basis of the individual security is written down to fair value as the new cost basis.
Cash and Cash Equivalents
Cash and cash equivalents include all cash and investments with an original maturity of three months or less. The Company maintains its cash in bank accounts in amounts that may exceed federally insured limits. The Company has not experienced any losses in these accounts in the past. The fair value of cash and cash equivalents approximates their current carrying amounts since all such items are short-term in nature.
Intangible Assets, Capitalized Lease Costs and Financing Costs
Intangible assets, consisting primarily of the value of in-place leases, are amortized to expense over the remaining terms of the respective leases. Upon termination of a lease, the unamortized portion is charged to expense. The weighted-average amortization period upon acquisition for intangible assets recorded during 2017, 2016 and 2015 and 2014 was 13 years, 12 years and 13 years, and 14 years, respectively.
| 110 |
Costs incurred in connection with the execution of leases are capitalized and amortized over the term of the respective leases. Unamortized lease costs are charged to expense upon cancellation of leases prior to the expiration of lease terms. Costs incurred in connection with obtaining mortgages and other financings and refinancings are deferred and are amortized over the term of the related obligations using the effective interest method. Unamortized costs are charged to expense upon prepayment of the obligation. Amortization expense related to these deferred leasing and financing costs were $2,089,259, $2,072,120 $2,042,520 and $1,231,222$2,042,520 for the years ended September 30, 2017, 2016 2015 and 2014,2015, respectively. The Company estimates that aggregate amortization expense for existing assets will be approximately $1,936,000, $1,743,000, $1,550,000, $1,009,000$1,913,000, $1,719,000, $1,365,000, $1,145,000 and $931,000$1,065,000 for the fiscal years 2017, 2018, 2019, 2020, 2021 and 2021,2022, respectively.
Revenue Recognition
Rental revenue from tenants with leases having scheduled rental increases are recognized on a straight-line basis over the term of the lease. Tenant recoveries related to the reimbursement of real estate taxes, insurance, repairs and maintenance, and other operating expenses are recognized as revenue in the period the expenses are incurred. The reimbursements are recognized and presented gross, as the Company is generally the primary obligor and, with respect to purchasing goods and services from third-party suppliers, has discretion in selecting the supplier and bears the associated credit risk. These occupancy charges are recognized as earned.
The Company provides an allowance for doubtful accounts against the portion of tenant and other receivables and deferred rent receivable which are estimated to be uncollectible. For accounts receivable the Company deems uncollectible, the Company uses the direct write-off method. The Company did not have an allowance for doubtful accounts as of September 30, 20162017 and 2015.2016.
Lease Termination Income
Lease Termination Income is recognized in operating revenues when there is a signed termination agreement, all of the conditions of the agreement have been met, the tenant is no longer occupying the property and the termination consideration is probable of collection. Lease termination amounts are paid by tenants who want to terminate their lease obligations before the end of the contractual term of the lease by agreement with the Company.
Of the Company’s ninety-nine108 properties, only threefive leases representing 1.3% of the Company’s gross leasable area, contain an early termination provision, whichprovision. The Company’s leases with early termination provisions are as follows: the Company’s lease with its tenant at its 26,340 square foot location in Ridgeland (Jackson), MS, the Company’s38,833 square foot location in Rockford, IL, the recently executed lease with its tenant at itsfor the 36,270 square feet location in Urbandale (Des Moines), IA, the 83,000 square foot location in Roanoke, VA and the Company’s lease with its tenant at its 102,135 square foot location in O’Fallon (St. Louis), MO. Each lease termination provision contains certain requirements that must be met in order to exercise each termination provision. These requirements include: date termination can be exercised, the time frame that notice must be given by the tenant to the Company and the termination fee that would be required to be paid by the tenant to the Company. The total potential termination fee to be paid to the Company from the five leases with termination provisions amounts to approximately $1,756,000.
Net Income Per Share
Basic Net Income per Share is calculated by dividing Net Income Attributable to Common Shareholders by the weighted-average number of common shares outstanding during the period. Diluted Net Income per Common Share is calculated by dividing Net Income attributableAttributable to Common Shareholders by the weighted-average number of common shares outstanding plus the weighted-average number of net shares that would be issued upon exercise of stock options pursuant to the treasury stock method.
In addition, common stock equivalents of 135,613, 89,720 115,408 and 95,112115,408 shares are included in the diluted weighted average shares outstanding for fiscal years 2017, 2016 2015 and 2014,2015, respectively. As of September 30, 2017, 2016 2015 and 2014,2015, options to purchase 65,000, -0-, 65,000 and 65,000 shares, respectively, were antidilutive.
| 111 |
Stock Compensation Plan
The Company accounts for awards of stock options and restricted stock in accordance with ASC 718-10, Compensation-Stock Compensation. ASC 718-10 requires that compensation cost for all stock awards be calculated and amortized over the service period (generally equal to the vesting period). The compensation cost for stock option grants is determined using option pricing models, intended to estimate the fair value of the awards at the grant date less estimated forfeitures. The compensation expense for restricted stock is recognized based on the fair value of the restricted stock awards less estimated forfeitures. The fair value of restricted stock awards is equal to the fair value of the Company’s stock on the grant date. Compensation costs of $624,706, $926,465 $448,895 and $347,002$448,895 have been recognized in 2017, 2016 2015 and 2014,2015, respectively. Included in Note 9 to these consolidated financial statements are the assumptions and methodology used to calculate the fair value of stock options and restricted shares.
Income Tax
The Company has elected to be taxed as a REIT under Sections 856-860 of the Internal Revenue Code. The Company will not be taxed on the portion of its income which is distributed to shareholders, provided it distributes at least 90% of its taxable income, has at least 75% of its assets in real estate investments, and meets certain other requirements for qualification as a REIT. The Company is subject to franchise taxes in several of the states in which the Company owns property.
The Company follows the provisions of ASC Topic 740, Income Taxes, that, among other things, defines a recognition threshold and measurement attribute for the financial statement recognition and measurement of a tax position taken or expected to be taken in a tax return. ASC Topic 740 also provides guidance on de-recognition, classification, interest and penalties, accounting in interim periods, disclosure, and transition. Based on its evaluation, the Company determined that it has no uncertain tax positions and no unrecognized tax benefits as of September 30, 2016.2017. The Company records interest and penalties relating to unrecognized tax benefits, if any, as interest expense. As of September 30, 2016,2017, the fiscal tax years 20132014 through and including 20162017 remain open to examination by the Internal Revenue Service. There are currently no federal tax examinations in progress.
Comprehensive Income
Comprehensive income is comprised of net income and other comprehensive income (loss).income. Other comprehensive income (loss) consists of unrealized holding gains or losses arising during the period on securities available for sale, less any reclassification adjustments for net gains of sales of securities transactions realized in income.
Reclassifications
Certain amounts in the consolidated financial statements for the prior years have been reclassified to conform to the financial statement presentation for the current year.
New Accounting Pronouncements
In January 2017, the FASB issued ASU 2017-01, “Business Combinations (Topic 805): Clarifying the Definition of a Business” (ASU 2017-01). ASU 2017-01 provides revised guidance to determine when an acquisition meets the definition of a business or should be accounted for as an asset acquisition, likely resulting in more acquisitions being accounted for as asset acquisitions as opposed to business combinations. Transaction costs are capitalized for asset acquisitions while they are expensed as incurred for business combinations. ASU 2017-01 requires that, when substantially all of the fair value of an acquisition is concentrated in a single identifiable asset or a group of similar identifiable assets, the asset or group of similar identifiable assets does not meet the definition of a business. ASU 2017-01 also revises the definition of a business to include, at a minimum, an input and a substantive process that together significantly contribute to the ability to create an output. ASU 2017-01 will be effective, on a prospective basis, for annual and interim reporting periods beginning after December 15, 2017, with early adoption permitted. We adopted ASU 2017-01 as of April 1, 2017, as permitted under the standard. As a result of the implementation of this update, our property acquisitions, which under previous guidance were accounted for as business combinations, are now accounted for as acquisitions of assets. In an acquisition of assets, certain acquisition costs are capitalized as opposed to expensed under accounting for business combinations. For the period April 1, 2017 through September 30, 2017, the Company acquired eight properties, for each of which it was concluded that substantially all of the fair value of the assets acquired with each property acquisition was concentrated in a single identifiable asset and did not meet the definition of a business combination under ASU 2017-01. Therefore, acquisition transaction costs associated with these property acquisitions were capitalized to real estate investments as part of the purchase price.
| 112 |
In August 2016, the Financial Accounting Standards Board (“FASB”)FASB issued Accounting Standards Update (“ASU”)ASU 2016-15, “Statement of Cash Flows (Topic 230), Classification of Certain Cash Receipts and Cash Payments.”Payments” (ASU 2016-15). ASU 2016-15 will make eight targeted changes to how cash receipts and cash payments are presented and classified in the statement of cash flows. ASU 2016-15 is effective for annual reporting periods, including interim reporting periods within those periods, beginning after December 15, 2017. Early adoption is permitted. The Company is currently evaluating the potential impact this standard may have on the consolidated financial statements and the timing of adoption.
In March 2016, the FASB issued ASU 2016-09 “Compensation – Stock Compensation: Improvements to Employee Share-Based Payment Accounting,Accounting” (ASU 2016-09), which relates to the accounting for employee share-based payments”.payments. ASU 2016-09 addresses several aspects of the accounting for share-based payment award transactions, including: (a) income tax consequences; (b) classification of awards as either equity or liabilities; and (c) classification on the statement of cash flows. This standard will be effective for fiscal years beginning after December 15, 2016, including interim periods within those fiscal years. The Company is currently evaluating the potential impact this standard may have on the consolidated financial statements and the timing of adoption.statements.
In February 2016, the FASB issued ASU 2016-02, “Leases” (ASU 2016-02). ASU 2016-02 amends the existing accounting standards for lease accounting, including requiring lessees to recognize most leases on their balance sheets and making targeted changes to lessor accounting. The standard requires a modified retrospective transition approach for all leases existing at, or entered into after, the date of initial application, with an option to use certain transition relief. ASU 2016-02 will be effective for annual reporting periods beginning after December 15, 2018. Early adoption is permitted. The Company is currently evaluating the potential impact this standard may have on the consolidated financial statements and the timing of adoption.
In January 2016, the FASB issued ASU 2016-01, “Financial Instruments – Overall: Recognition and Measurement of Financial Assets and Financial Liabilities” (ASU 2016-01). ASU 2016-01 requires equity investments (except those accounted for under the equity method of accounting, or those that result in consolidation of the investee) to be measured at fair value with changes in fair value recognized in net income, requires public business entities to use the exit price notion when measuring the fair value of financial instruments for disclosure purposes, requires separate presentation of financial assets and financial liabilities by measurement category and form of financial asset, and eliminates the requirement for public business entities to disclose the method(s) and significant assumptions used to estimate the fair value that is required to be disclosed for financial instruments measured at amortized cost. These changes become effective for the Company’s fiscal year beginning October 1, 2018. The Company is currently in the process of evaluating the impact of the adoption on its consolidated financial statements and has not determined the effects of this update on the Company’s financial position, results of operations or cash flows and disclosures at this time.
In September 2015, the FASB issued ASU 2015-16, “Simplifying the Accounting for Measurement-Period Adjustments”. ASU 2015-16 eliminates the requirement to restate prior period financial statements for measurement period adjustments. The new guidance requires that the cumulative impact of a measurement period adjustment (including the impact on prior periods) be recognized in the reporting period in which the adjustment is identified. ASU 2015-16 is effective for interim and annual periods beginning after December 15, 2015. Early adoption is permitted. The Company does not expect the adoption of ASU 2015-16 to have a material effect on the Company’s consolidated financial statements.
In April 2015, the FASB issued ASU 2015-03, “Interest - Imputation of Interest (Topic 835): Simplifying the Presentation of Debt Issuance Costs” (ASU 2015-03). ASU 2015-03 requires that debt issuance costs related to a recognized debt liability to be presented in the balance sheet as a direct deduction from the carrying amount of thatthe debt liability, consistent with debt discounts. The recognition and measurement guidance for debt issuance costs are not affected by the amendments in this update. The amendments in ASU 2015-03 are effective for fiscal years beginning after December 15, 2015. Early adoption is permitted.liability. In August 2015, the FASB issued ASU 2015-15, “Presentation and Subsequent Measurement of Debt Issuance Costs Associated with Line-of-Credit Arrangements” providing guidance regarding the presentation and subsequent measurement of(Subtopic 835-30), which clarified that debt issuance costs related to line-of-credit arrangements. Given the absence of authoritative guidance on this matter, the SEC staff would not object to an entity deferring and presenting debt issuance costsarrangements may be presented as an asset and subsequently amortizing the deferred debt issuance costs ratablyamortized over the term of the line-of-credit arrangement regardless of whether there are any outstanding borrowings on thatthe line-of-credit arrangement. The Company adopted these standards effective October 1, 2016. As a result, debt issuance costs related to debt liabilities that are not line-of-credit arrangements are included as a direct deduction from the related debt liability and those related to line-of-credit arrangements continue to be included as an asset on the accompanying Consolidated Balance Sheets. The effects of this standard were applied retrospectively to all prior periods presented. The effect of the change in accounting principle was the reduction in the amount of $6,272,143 of the Fixed Rate Mortgage Notes Payable liability and a corresponding reduction of the Financing Costs asset as of September 30, 2016 and a reclassification of Amortization of Financing Costs of $1,116,238 and $1,286,016 for the fiscal years ended September 30, 2016 and 2015, respectively, to Interest Expense, including Amortization of Financing Costs in our Consolidated Statement of Income.
| 113 |
In May 2014, the FASB issued ASU 2014-09, “Revenue from Contracts with Customers,” (ASU 2014-09) which requires an entity to recognize the amount of revenue to which it expects to be entitled for the transfer of promised goods or services to customers. The FASB issued further guidance in ASU 2016-12, “Revenue from Contracts with Customers (Topic 606): Narrow-Scope Improvements and Practical Expedients”, that provides clarifying guidance in certain narrow areas and adds some practical expedients. ASU 2014-09 will replace most existing revenue recognition guidance in U.S. GAAP when it becomes effective. The effective date of ASU 2014-09 was extended by one year by ASU 2015-14, “Revenue from Contracts with Customers (Topic 606): Deferral of the Effective Date”. The new standard is currentlyeffective for the first interim period within annual reporting periods beginning after December 15, 2017. Therefore, the Company expects to adopt the standard effective October 1, 2018. The standard permits the use of either the retrospective or cumulative effect transition method, and the Company is evaluating which transition method it will elect. The Company is also in the process of evaluating the impact the adoption ofeffect that ASU 2015-03 and ASU 2015-152014-09 will have on the Company’sits consolidated financial position or results of operations.
In February 2015, the FASB issued ASU 2015-02, Consolidation (Topic 810), “Amendments to the Consolidation Analysis”. ASU 2015-02 focuses to minimize situations under previously existing guidance in which a reporting entity was required to consolidate another legal entity in which that reporting entity did not have: (1) the ability through contractual rights to act primarily on its own behalf; (2) ownership of the majority of the legal entity’s voting rights; or (3) the exposure to a majority of the legal entity’s economic benefits. ASU 2015-02 affects reporting entities that are required to evaluate whether they should consolidate certain legal entities. All legal entities are subject to reevaluation under the revised consolidation model. ASU 2015-02 will be effective for periods beginning after December 15, 2015. Early adoption is permitted, including adoption in an interim period.statements and related disclosures. The Company does not expect the adoption of ASU 2015-02this standard to have a material effectsignificant impact on the Company’sits consolidated financial statements.statements and related disclosures.
Management does not believe that any other recently issued, but not yet effective accounting pronouncements, if adopted, would have a material effect on the accompanying Consolidated Financial Statements.
NOTE 2 – REAL ESTATE INVESTMENTS
The following is a summary of the cost and accumulated depreciation of the Company’s land, buildings and improvements at September 30, 20162017 and 2015:2016:
| SEPTEMBER 30, 2016 | Property | Buildings & | Accumulated | Net Book | ||||||||||||||
| Type | Land | Improvements | Depreciation | Value | ||||||||||||||
| Alabama: | ||||||||||||||||||
| Huntsville | Industrial | $ | 748,115 | $ | 5,857,016 | $ | 936,862 | $ | 5,668,269 | |||||||||
| Arizona: | ||||||||||||||||||
| Tolleson (Phoenix) | Industrial | 1,316,075 | 15,508,151 | 5,115,610 | 11,708,616 | |||||||||||||
| Colorado: | ||||||||||||||||||
| Colorado Springs | Industrial | 1,270,000 | 5,934,472 | 1,490,351 | 5,714,121 | |||||||||||||
| Colorado Springs | Industrial | 2,150,000 | 26,350,000 | 225,214 | 28,274,786 | |||||||||||||
| Denver | Industrial | 1,150,000 | 5,204,051 | 1,437,516 | 4,916,535 | |||||||||||||
| Connecticut: | ||||||||||||||||||
| Newington (Hartford) | Industrial | 410,000 | 3,053,824 | 1,207,938 | 2,255,886 | |||||||||||||
| Florida: | ||||||||||||||||||
| Cocoa | Industrial | 1,881,316 | 12,246,133 | 2,113,243 | 12,014,206 | |||||||||||||
| Davenport (Orlando) | Industrial | 7,060,000 | 30,720,000 | 131,282 | 37,648,718 | |||||||||||||
| Ft. Myers | Industrial | 1,910,000 | 3,107,447 | 991,678 | 4,025,769 | |||||||||||||
| Jacksonville (FDX) | Industrial | 1,165,000 | 5,081,404 | 2,295,680 | 3,950,724 | |||||||||||||
| Jacksonville (FDX Ground) | Industrial | 6,000,000 | 24,645,954 | 1,053,246 | 29,592,708 | |||||||||||||
| Lakeland | Industrial | 261,000 | 1,721,532 | 466,240 | 1,516,292 | |||||||||||||
| Orlando | Industrial | 2,200,000 | 6,354,432 | 1,471,814 | 7,082,618 | |||||||||||||
| Punta Gorda | Industrial | -0- | 4,113,265 | 833,789 | 3,279,476 | |||||||||||||
| Tampa (FDX Ground) | Industrial | 5,000,000 | 14,696,102 | 4,161,734 | 15,534,368 | |||||||||||||
| Tampa (FDX) | Industrial | 2,830,000 | 4,762,861 | 1,258,519 | 6,334,342 | |||||||||||||
| Tampa (Tampa Bay Grand Prix) | Industrial | 1,867,000 | 3,810,982 | 941,848 | 4,736,134 | |||||||||||||
| Georgia: | ||||||||||||||||||
| Augusta (FDX Ground) | Industrial | 614,406 | 4,739,628 | 1,258,944 | 4,095,090 | |||||||||||||
| Augusta (FDX) | Industrial | 380,000 | 1,591,732 | 367,357 | 1,604,375 | |||||||||||||
| Griffin (Atlanta) | Industrial | 760,000 | 14,108,857 | 3,767,103 | 11,101,754 | |||||||||||||
| Illinois: | ||||||||||||||||||
| Burr Ridge (Chicago) | Industrial | 270,000 | 1,422,901 | 656,159 | 1,036,742 | |||||||||||||
| Elgin (Chicago) | Industrial | 1,280,000 | 5,652,916 | 2,124,899 | 4,808,017 | |||||||||||||
| Granite City (St. Louis, MO) | Industrial | 340,000 | 12,202,814 | 4,485,359 | 8,057,455 | |||||||||||||
| Montgomery (Chicago) | Industrial | 2,000,000 | 9,298,367 | 2,282,887 | 9,015,480 | |||||||||||||
| Rockford (B/E Aerospace) | Industrial | 480,000 | 4,620,000 | 236,923 | 4,863,077 | |||||||||||||
| Rockford (Sherwin-Williams) | Industrial | 1,100,000 | 4,451,227 | 628,612 | 4,922,615 | |||||||||||||
| Sauget (St. Louis, MO) | Industrial | 1,890,000 | 13,314,950 | 682,605 | 14,522,345 | |||||||||||||
| Schaumburg (Chicago) | Industrial | 1,039,800 | 3,941,614 | 2,037,309 | 2,944,105 | |||||||||||||
| Wheeling (Chicago) | Industrial | 5,112,120 | 13,425,532 | 3,735,969 | 14,801,683 | |||||||||||||
| Indiana: | ||||||||||||||||||
| Greenwood (Indianapolis) | Industrial | 2,250,000 | 35,250,391 | 1,280,020 | 36,220,371 | |||||||||||||
| Indianapolis | Industrial | 3,500,000 | 20,446,000 | 1,132,868 | 22,813,132 | |||||||||||||
| Iowa: | ||||||||||||||||||
| Urbandale (Des Moines) | Industrial | 310,000 | 1,851,895 | 1,094,293 | 1,067,602 | |||||||||||||
| Kansas: | ||||||||||||||||||
| Edwardsville (Kansas City)(Carlisle Tire) | Industrial | 1,185,000 | 6,040,401 | 2,158,091 | 5,067,310 | |||||||||||||
| Edwardsville (Kansas City)(International Paper) | Industrial | 2,750,000 | 15,544,108 | 1,172,549 | 17,121,559 | |||||||||||||
| Olathe (Kansas City) | Industrial | 2,350,000 | 29,387,000 | 125,585 | 31,611,415 | |||||||||||||
| Topeka | Industrial | -0- | 3,679,843 | 707,765 | 2,972,078 | |||||||||||||
| Kentucky: | ||||||||||||||||||
| Buckner (Louisville) | Industrial | 2,280,000 | 24,487,852 | 1,834,166 | 24,933,686 | |||||||||||||
| Frankfort (Lexington) | Industrial | 1,850,000 | 26,150,000 | 1,229,274 | 26,770,726 | |||||||||||||
| Louisville | Industrial | 1,590,000 | 9,714,000 | 83,026 | 11,220,974 | |||||||||||||
| Louisiana: | ||||||||||||||||||
| Covington (New Orleans) | Industrial | 2,720,000 | 15,690,000 | 335,256 | 18,074,744 | |||||||||||||
| Property | Buildings & | Accumulated | Net Book | |||||||||||||||||
| SEPTEMBER 30, 2017 | Type | Land | Improvements | Depreciation | Value | |||||||||||||||
| Alabama: | ||||||||||||||||||||
| Huntsville | Industrial | $ | 748,115 | $ | 5,913,696 | $ | 1,092,730 | $ | 5,569,081 | |||||||||||
| Arizona: | ||||||||||||||||||||
| Tolleson (Phoenix) | Industrial | 1,316,075 | 15,508,151 | 5,634,312 | 11,189,914 | |||||||||||||||
| Colorado: | ||||||||||||||||||||
| Colorado Springs | Industrial | 1,270,000 | 5,934,472 | 1,644,190 | 5,560,282 | |||||||||||||||
| Colorado Springs | Industrial | 2,150,000 | 26,350,000 | 900,855 | 27,599,145 | |||||||||||||||
| Denver | Industrial | 1,150,000 | 5,204,051 | 1,570,819 | 4,783,232 | |||||||||||||||
| Connecticut: | ||||||||||||||||||||
| Newington (Hartford) | Industrial | 410,000 | 3,084,108 | 1,288,391 | 2,205,717 | |||||||||||||||
| Florida: | ||||||||||||||||||||
| Cocoa | Industrial | 1,881,316 | 12,246,133 | 2,435,695 | 11,691,754 | |||||||||||||||
| Davenport (Orlando) | Industrial | 7,060,000 | 30,720,000 | 918,974 | 36,861,026 | |||||||||||||||
| Ft. Myers (Vacant) (1) | Industrial | 1,910,000 | 3,107,448 | 1,057,915 | 3,959,533 | |||||||||||||||
| Ft. Myers (FDX Ground) | Industrial | 2,400,000 | 19,223,000 | 353,846 | 21,269,154 | |||||||||||||||
| Homestead (Miami) | Industrial | 4,426,727 | 33,446,393 | 214,400 | 37,658,720 | |||||||||||||||
| Jacksonville (FDX) | Industrial | 1,165,000 | 5,164,784 | 2,450,615 | 3,879,169 | |||||||||||||||
| Jacksonville (FDX Ground) | Industrial | 6,000,000 | 24,732,090 | 1,688,236 | 29,043,854 | |||||||||||||||
| Lakeland | Industrial | 261,000 | 1,721,532 | 525,151 | 1,457,381 | |||||||||||||||
| Orlando | Industrial | 2,200,000 | 6,354,432 | 1,636,085 | 6,918,347 | |||||||||||||||
| Punta Gorda | Industrial | -0- | 4,133,510 | 945,236 | 3,188,274 | |||||||||||||||
| Tampa (FDX Ground) | Industrial | 5,000,000 | 14,696,227 | 4,544,868 | 15,151,359 | |||||||||||||||
| Tampa (FDX) | Industrial | 2,830,000 | 4,789,924 | 1,383,938 | 6,235,986 | |||||||||||||||
| Tampa (Tampa Bay Grand Prix) | Industrial | 1,867,000 | 3,810,982 | 1,043,048 | 4,634,934 | |||||||||||||||
| Georgia: | ||||||||||||||||||||
| Augusta (FDX Ground) | Industrial | 614,406 | 4,748,899 | 1,385,556 | 3,977,749 | |||||||||||||||
| Augusta (FDX) | Industrial | 380,000 | 1,597,779 | 415,251 | 1,562,528 | |||||||||||||||
| Griffin (Atlanta) | Industrial | 760,000 | 14,108,857 | 4,128,872 | 10,739,985 | |||||||||||||||
| 114 |
| SEPTEMBER 30, 2016 (cont’d) | Property | Buildings & | Accumulated | Net Book | ||||||||||||||
| Type | Land | Improvements | Depreciation | Value | ||||||||||||||
| Maryland: | ||||||||||||||||||
| Beltsville (Washington, DC) | Industrial | $ | 3,200,000 | $ | 11,312,355 | $ | 3,536,076 | $ | 10,976,279 | |||||||||
| Michigan: | ||||||||||||||||||
| Livonia (Detroit) | Industrial | 320,000 | 13,442,030 | 1,350,345 | 12,411,685 | |||||||||||||
| Orion | Industrial | 4,649,971 | 18,235,665 | 3,549,648 | 19,335,988 | |||||||||||||
| Romulus (Detroit) | Industrial | 531,000 | 4,069,532 | 1,804,248 | 2,796,284 | |||||||||||||
| Minnesota: | ||||||||||||||||||
| Stewartville (Rochester) | Industrial | 900,000 | 4,320,000 | 332,308 | 4,887,692 | |||||||||||||
| White Bear Lake (Minneapolis/St. Paul) | Industrial | 1,393,000 | 3,764,126 | 927,965 | 4,229,161 | |||||||||||||
| Mississippi: | ||||||||||||||||||
| Olive Branch (Memphis, TN)(Anda Distribution) | Industrial | 800,000 | 13,750,000 | 1,498,397 | 13,051,603 | |||||||||||||
| Olive Branch (Memphis, TN)(Milwaukee Tool) | Industrial | 2,550,000 | 34,364,917 | 2,275,368 | 34,639,549 | |||||||||||||
| Richland (Jackson) | Industrial | 211,000 | 1,689,691 | 826,199 | 1,074,492 | |||||||||||||
| Ridgeland (Jackson) | Industrial | 218,000 | 1,640,591 | 1,177,386 | 681,205 | |||||||||||||
| Missouri: | ||||||||||||||||||
| Kansas City (Bunzl) | Industrial | 1,000,000 | 8,600,000 | 422,650 | 9,177,350 | |||||||||||||
| Kansas City (Kellogg) | Industrial | 660,000 | 4,140,474 | 1,022,653 | 3,777,821 | |||||||||||||
| Liberty (Kansas City) | Industrial | 723,000 | 6,674,881 | 3,152,489 | 4,245,392 | |||||||||||||
| O’Fallon (St. Louis) | Industrial | 264,000 | 3,981,913 | 2,096,073 | 2,149,840 | |||||||||||||
| St. Joseph | Industrial | 800,000 | 12,433,706 | 4,756,910 | 8,476,796 | |||||||||||||
| Nebraska: | ||||||||||||||||||
| Omaha | Industrial | 1,170,000 | 4,774,691 | 2,109,230 | 3,835,461 | |||||||||||||
| New Jersey: | ||||||||||||||||||
| Carlstadt (New York, NY) | Industrial | 1,194,000 | 3,709,589 | 849,584 | 4,054,005 | |||||||||||||
| Somerset | Shopping Center | 34,316 | 3,038,565 | 1,399,343 | 1,673,538 | |||||||||||||
| New York: | ||||||||||||||||||
| Cheektowaga (Buffalo) | Industrial | 4,796,765 | 6,164,058 | 1,531,509 | 9,429,314 | |||||||||||||
| Halfmoon (Albany) | Industrial | 1,190,000 | 4,335,600 | 500,262 | 5,025,338 | |||||||||||||
| Orangeburg (New York) | Industrial | 694,720 | 3,200,955 | 2,319,253 | 1,576,422 | |||||||||||||
| North Carolina: | ||||||||||||||||||
| Concord (Charlotte) | Industrial | 4,305,000 | 27,670,897 | 650,384 | 31,325,513 | |||||||||||||
| Fayetteville | Industrial | 172,000 | 5,269,876 | 2,458,876 | 2,983,000 | |||||||||||||
| Winston-Salem | Industrial | 980,000 | 6,258,613 | 2,185,430 | 5,053,183 | |||||||||||||
| Ohio: | ||||||||||||||||||
| Bedford Heights (Cleveland) | Industrial | 990,000 | 5,873,879 | 1,521,396 | 5,342,483 | |||||||||||||
| Cincinnati | Industrial | 800,000 | 5,950,000 | 165,278 | 6,584,722 | |||||||||||||
| Lebanon (Cincinnati) | Industrial | 240,000 | 4,212,425 | 485,114 | 3,967,311 | |||||||||||||
| Monroe (Cincinnati) | Industrial | 1,800,000 | 11,137,000 | 452,143 | 12,484,857 | |||||||||||||
| Richfield (Cleveland) | Industrial | 2,676,848 | 13,758,630 | 2,373,693 | 14,061,785 | |||||||||||||
| Streetsboro (Cleveland) | Industrial | 1,760,000 | 17,840,000 | 2,058,462 | 17,541,538 | |||||||||||||
| West Chester Twp. (Cincinnati) | Industrial | 695,000 | 5,033,690 | 1,947,128 | 3,781,562 | |||||||||||||
| Oklahoma: | ||||||||||||||||||
| Oklahoma City | Industrial | 1,410,000 | 11,170,262 | 1,014,638 | 11,565,624 | |||||||||||||
| Tulsa | Industrial | 790,000 | 2,958,031 | 227,268 | 3,520,763 | |||||||||||||
| Pennsylvania: | ||||||||||||||||||
| Altoona | Industrial | 1,200,000 | 7,808,650 | 583,052 | 8,425,598 | |||||||||||||
| Imperial (Pittsburgh) | Industrial | 3,700,000 | 16,250,000 | 243,056 | 19,706,944 | |||||||||||||
| Monaca (Pittsburgh) | Industrial | 401,716 | 7,404,507 | 2,331,288 | 5,474,935 | |||||||||||||
| South Carolina: | ||||||||||||||||||
| Ft. Mill (Charlotte, NC) | Industrial | 1,670,000 | 13,743,307 | 1,949,873 | 13,463,434 | |||||||||||||
| Hanahan (Charleston)(SAIC) | Industrial | 1,129,000 | 12,211,592 | 3,577,226 | 9,763,366 | |||||||||||||
| Hanahan (Charleston)(FDX Ground) | Industrial | 930,000 | 6,684,653 | 1,724,191 | 5,890,462 | |||||||||||||
| Tennessee: | ||||||||||||||||||
| Chattanooga | Industrial | 300,000 | 4,712,203 | 1,131,706 | 3,880,497 | |||||||||||||
| Lebanon (Nashville) | Industrial | 2,230,000 | 11,985,126 | 1,536,542 | 12,678,584 | |||||||||||||
| Property | Buildings & | Accumulated | Net Book | |||||||||||||||
| SEPTEMBER 30, 2017 (cont’d) | Type | Land | Improvements | Depreciation | Value | |||||||||||||
| Illinois: | ||||||||||||||||||
| Burr Ridge (Chicago) | Industrial | $ | 270,000 | $ | 1,422,901 | $ | 698,725 | $ | 994,176 | |||||||||
| Elgin (Chicago) | Industrial | 1,280,000 | 5,697,442 | 2,284,344 | 4,693,098 | |||||||||||||
| Granite City (St. Louis, MO) | Industrial | 340,000 | 12,357,848 | 4,834,280 | 7,863,568 | |||||||||||||
| Montgomery (Chicago) | Industrial | 2,000,000 | 9,298,367 | 2,522,213 | 8,776,154 | |||||||||||||
| Rockford (Collins Aerospace Systems-United Technologies) | Industrial | 480,000 | 4,620,000 | 355,385 | 4,744,615 | |||||||||||||
| Rockford (Sherwin-Williams Co.) | Industrial | 1,100,000 | 4,451,227 | 744,286 | 4,806,941 | |||||||||||||
| Sauget (St. Louis, MO) | Industrial | 1,890,000 | 13,314,950 | 1,024,382 | 14,180,568 | |||||||||||||
| Schaumburg (Chicago) | Industrial | 1,039,800 | 4,138,140 | 2,159,563 | 3,018,377 | |||||||||||||
| Wheeling (Chicago) | Industrial | 5,112,120 | 13,425,532 | 4,079,587 | 14,458,065 | |||||||||||||
| Indiana: | ||||||||||||||||||
| Greenwood (Indianapolis) | Industrial | 2,250,000 | 35,262,071 | 2,186,221 | 35,325,850 | |||||||||||||
| Indianapolis | Industrial | 3,739,030 | 21,267,342 | 1,657,124 | 23,349,248 | |||||||||||||
| Iowa: | ||||||||||||||||||
| Urbandale (Des Moines)(Vacant) | Industrial | 310,000 | 1,946,613 | 1,144,794 | 1,111,819 | |||||||||||||
| Kansas: | ||||||||||||||||||
| Edwardsville (Kansas City) (Carlisle Tire) | Industrial | 1,185,000 | 6,047,986 | 2,358,818 | 4,874,168 | |||||||||||||
| Edwardsville (Kansas City) (International Paper) | Industrial | 2,750,000 | 15,544,108 | 1,587,164 | 16,706,944 | |||||||||||||
| Olathe (Kansas City) | Industrial | 2,350,000 | 29,387,000 | 879,098 | 30,857,902 | |||||||||||||
| Topeka | Industrial | -0- | 3,679,843 | 802,124 | 2,877,719 | |||||||||||||
| Kentucky: | ||||||||||||||||||
| Buckner (Louisville) | Industrial | 2,280,000 | 24,527,852 | 2,472,411 | 24,335,441 | |||||||||||||
| Frankfort (Lexington) | Industrial | 1,850,000 | 26,150,000 | 1,899,786 | 26,100,214 | |||||||||||||
| Louisville | Industrial | 1,590,000 | 9,714,000 | 332,103 | 10,971,897 | |||||||||||||
| Louisiana: | ||||||||||||||||||
| Covington (New Orleans) | Industrial | 2,720,000 | 15,690,000 | 737,564 | 17,672,436 | |||||||||||||
| Maryland: | ||||||||||||||||||
| Beltsville (Washington, DC) | Industrial | 3,200,000 | 11,312,355 | 3,843,707 | 10,668,648 | |||||||||||||
| Michigan: | ||||||||||||||||||
| Walker (Grand Rapids) | Industrial | 4,034,363 | 27,620,623 | 354,111 | 31,300,875 | |||||||||||||
| Livonia (Detroit) | Industrial | 320,000 | 13,442,030 | 1,698,607 | 12,063,423 | |||||||||||||
| Orion | Industrial | 4,649,971 | 18,235,665 | 4,019,239 | 18,866,397 | |||||||||||||
| Romulus (Detroit) | Industrial | 531,000 | 4,136,506 | 1,922,903 | 2,744,603 | |||||||||||||
| Minnesota: | ||||||||||||||||||
| Stewartville (Rochester) | Industrial | 900,000 | 4,320,000 | 443,077 | 4,776,923 | |||||||||||||
| Mississippi: | ||||||||||||||||||
| Olive Branch (Memphis, TN)(Anda Pharmaceuticals, Inc.) | Industrial | 800,000 | 13,750,000 | 1,850,962 | 12,699,038 | |||||||||||||
| Olive Branch (Memphis, TN)(Milwaukee Tool) | Industrial | 2,550,000 | 34,364,917 | 3,159,783 | 33,755,134 | |||||||||||||
| Richland (Jackson) | Industrial | 211,000 | 1,689,691 | 904,133 | 996,558 | |||||||||||||
| Ridgeland (Jackson) | Industrial | 218,000 | 1,640,591 | 1,246,001 | 612,590 | |||||||||||||
| Missouri: | ||||||||||||||||||
| Kansas City (Bunzl) | Industrial | 1,000,000 | 8,651,226 | 646,520 | 9,004,706 | |||||||||||||
| Kansas City (Kellogg) (1) | Industrial | 660,000 | 4,140,474 | 1,147,694 | 3,652,780 | |||||||||||||
| Liberty (Kansas City) | Industrial | 723,000 | 6,674,881 | 3,325,236 | 4,072,645 | |||||||||||||
| O’Fallon (St. Louis) | Industrial | 264,000 | 3,981,913 | 2,228,921 | 2,016,992 | |||||||||||||
| St. Joseph | Industrial | 800,000 | 12,489,270 | 5,101,907 | 8,187,363 | |||||||||||||
| Nebraska: | ||||||||||||||||||
| Omaha | Industrial | 1,170,000 | 4,774,691 | 2,233,901 | 3,710,790 | |||||||||||||
| New Jersey: | ||||||||||||||||||
| Carlstadt (New York, NY) | Industrial | 1,194,000 | 3,709,589 | 939,584 | 3,964,005 | |||||||||||||
| Somerset | Shopping Center | 34,317 | 3,038,573 | 1,494,297 | 1,578,593 | |||||||||||||
| 115 |
| SEPTEMBER 30, 2016 (cont’d) | Property | Buildings & | Accumulated | Net Book | ||||||||||||||
| Type | Land | Improvements | Depreciation | Value | ||||||||||||||
| Memphis | Industrial | $ | 1,240,887 | $ | 13,380,000 | $ | 2,230,008 | $ | 12,390,879 | |||||||||
| Shelby County | Vacant Land | 11,065 | -0- | -0- | 11,065 | |||||||||||||
| Texas: | ||||||||||||||||||
| Carrollton (Dallas) | Industrial | 1,500,000 | 16,269,106 | 2,708,020 | 15,061,086 | |||||||||||||
| Corpus Christi | Industrial | -0- | 4,764,500 | 549,750 | 4,214,750 | |||||||||||||
| Edinburg | Industrial | 1,000,000 | 10,423,872 | 907,803 | 10,516,069 | |||||||||||||
| El Paso | Industrial | 3,225,195 | 9,205,997 | 1,442,146 | 10,989,046 | |||||||||||||
| Fort Worth (Dallas) | Industrial | 8,200,000 | 27,100,832 | 810,709 | 34,490,123 | |||||||||||||
| Houston | Industrial | 1,730,000 | 6,353,107 | 1,080,294 | 7,002,813 | |||||||||||||
| Lindale (Tyler) | Industrial | 540,000 | 9,390,000 | 481,538 | 9,448,462 | |||||||||||||
| Spring (Houston) | Industrial | 1,890,000 | 17,393,798 | 1,183,663 | 18,100,135 | |||||||||||||
| Waco | Industrial | 1,350,000 | 11,196,157 | 923,263 | 11,622,894 | |||||||||||||
| Virginia: | ||||||||||||||||||
| Charlottesville | Industrial | 1,170,000 | 3,178,499 | 1,393,226 | 2,955,273 | |||||||||||||
| Mechanicsville (Richmond) (FDX) | Industrial | 1,160,000 | 6,598,181 | 2,644,156 | 5,114,025 | |||||||||||||
| Richmond (United Technologies) | Industrial | 446,000 | 4,322,309 | 1,229,737 | 3,538,572 | |||||||||||||
| Roanoke (CHEP) | Industrial | 1,853,000 | 5,552,447 | 1,329,033 | 6,076,414 | |||||||||||||
| Roanoke (FDX Ground) | Industrial | 1,740,000 | 8,460,000 | 714,038 | 9,485,962 | |||||||||||||
| Washington: | ||||||||||||||||||
| Burlington (Seattle/Everett) | Industrial | 8,000,000 | 22,210,680 | 284,752 | 29,925,928 | |||||||||||||
| Wisconsin: | ||||||||||||||||||
| Cudahy (Milwaukee) | Industrial | 980,000 | 8,402,361 | 2,853,810 | 6,528,551 | |||||||||||||
| Green Bay | Industrial | 590,000 | 5,980,000 | 460,000 | 6,110,000 | |||||||||||||
| Total as of September 30, 2016 | $ | 165,375,315 | $ | 1,005,938,180 | $ | 148,830,169 | $ | 1,022,483,326 | ||||||||||
| SEPTEMBER 30, 2015 | Property | Buildings & | Accumulated | Net Book | ||||||||||||||
| Type | Land | Improvements | Depreciation | Value | ||||||||||||||
| Alabama: | ||||||||||||||||||
| Huntsville | Industrial | $ | 748,115 | $ | 4,003,626 | $ | 821,527 | $ | 3,930,214 | |||||||||
| Arizona: | ||||||||||||||||||
| Tolleson (Phoenix) | Industrial | 1,316,075 | 13,852,511 | 4,669,262 | 10,499,324 | |||||||||||||
| Colorado: | ||||||||||||||||||
| Colorado Springs | Industrial | 1,270,000 | 5,925,115 | 1,336,829 | 5,858,286 | |||||||||||||
| Denver | Industrial | 1,150,000 | 5,204,051 | 1,304,213 | 5,049,838 | |||||||||||||
| Connecticut: | ||||||||||||||||||
| Newington (Hartford) | Industrial | 410,000 | 3,053,824 | 1,129,167 | 2,334,657 | |||||||||||||
| Florida: | ||||||||||||||||||
| Cocoa | Industrial | 1,881,316 | 12,208,527 | 1,793,254 | 12,296,589 | |||||||||||||
| Ft. Myers | Industrial | 1,910,000 | 3,107,447 | 913,073 | 4,104,374 | |||||||||||||
| Jacksonville (FDX) | Industrial | 1,165,000 | 5,064,421 | 2,145,184 | 4,084,237 | |||||||||||||
| Jacksonville (FDX Ground) | Industrial | 6,000,000 | 24,645,954 | 421,298 | 30,224,656 | |||||||||||||
| Lakeland | Industrial | 261,000 | 1,705,211 | 406,472 | 1,559,739 | |||||||||||||
| Orlando | Industrial | 2,200,000 | 6,341,237 | 1,307,147 | 7,234,090 | |||||||||||||
| Punta Gorda | Industrial | -0- | 4,104,915 | 742,718 | 3,362,197 | |||||||||||||
| Tampa (FDX Ground) | Industrial | 5,000,000 | 13,448,962 | 3,799,846 | 14,649,116 | |||||||||||||
| Tampa (FDX) | Industrial | 2,830,000 | 4,735,717 | 1,135,794 | 6,429,923 | |||||||||||||
| Tampa (Tampa Bay Grand Prix) | Industrial | 1,867,000 | 3,784,066 | 841,103 | 4,809,963 | |||||||||||||
| Georgia: | ||||||||||||||||||
| Augusta (FDX Ground) | Industrial | 614,406 | 4,714,467 | 1,137,702 | 4,191,171 | |||||||||||||
| Augusta (FDX) | Industrial | 380,000 | 1,567,032 | 321,283 | 1,625,749 | |||||||||||||
| Griffin (Atlanta) | Industrial | 760,000 | 14,108,857 | 3,405,334 | 11,463,523 | |||||||||||||
| Property | Buildings & | Accumulated | Net Book | |||||||||||||||
| SEPTEMBER 30, 2017 (cont’d) | Type | Land | Improvements | Depreciation | Value | |||||||||||||
| New York: | ||||||||||||||||||
| Cheektowaga (Buffalo) | Industrial | $ | 4,796,765 | $ | 6,164,058 | $ | 1,692,362 | $ | 9,268,461 | |||||||||
| Halfmoon (Albany) | Industrial | 1,190,000 | 4,335,600 | 611,431 | 4,914,169 | |||||||||||||
| Hamburg (Buffalo) | Industrial | 1,700,000 | 33,150,000 | 850,000 | 34,000,000 | |||||||||||||
| Orangeburg (New York) (1) | Industrial | 694,720 | 3,200,955 | 2,436,637 | 1,459,038 | |||||||||||||
| North Carolina: | ||||||||||||||||||
| Concord (Charlotte) | Industrial | 4,305,000 | 28,739,797 | 1,471,238 | 31,573,559 | |||||||||||||
| Concord (Charlotte) | Industrial | 4,306,684 | 35,736,461 | 152,720 | 39,890,425 | |||||||||||||
| Fayetteville | Industrial | 172,000 | 5,279,629 | 2,698,223 | 2,753,406 | |||||||||||||
| Winston-Salem | Industrial | 980,000 | 6,258,613 | 2,401,589 | 4,837,024 | |||||||||||||
| Ohio: | ||||||||||||||||||
| Bedford Heights (Cleveland) | Industrial | 990,000 | 5,929,836 | 1,707,394 | 5,212,442 | |||||||||||||
| Cincinnati | Industrial | 800,000 | 5,950,000 | 317,842 | 6,432,158 | |||||||||||||
| Kenton | Industrial | 854,780 | 17,026,827 | 18,188 | 17,863,419 | |||||||||||||
| Lebanon (Cincinnati) | Industrial | 240,000 | 4,212,425 | 594,620 | 3,857,805 | |||||||||||||
| Monroe (Cincinnati) | Industrial | 1,800,000 | 11,137,000 | 737,707 | 12,199,293 | |||||||||||||
| Richfield (Cleveland) | Industrial | 2,676,848 | 13,758,630 | 2,728,544 | 13,706,934 | |||||||||||||
| Stow | Industrial | 1,429,715 | 17,504,350 | -0- | 18,934,065 | |||||||||||||
| Streetsboro (Cleveland) | Industrial | 1,760,000 | 17,840,000 | 2,515,897 | 17,084,103 | |||||||||||||
| West Chester Twp. (Cincinnati) | Industrial | 695,000 | 5,038,686 | 2,125,801 | 3,607,885 | |||||||||||||
| Oklahoma: | ||||||||||||||||||
| Oklahoma City (FDX Ground) | Industrial | 1,410,000 | 11,174,462 | 1,306,735 | 11,277,727 | |||||||||||||
| Oklahoma City (Bunzl) | Industrial | 844,688 | 7,883,751 | 50,537 | 8,677,902 | |||||||||||||
| Tulsa | Industrial | 790,000 | 2,958,031 | 309,194 | 3,438,837 | |||||||||||||
| Pennsylvania: | ||||||||||||||||||
| Altoona | Industrial | 1,200,000 | 7,808,650 | 784,660 | 8,223,990 | |||||||||||||
| Imperial (Pittsburgh) | Industrial | 3,700,000 | 16,250,000 | 659,722 | 19,290,278 | |||||||||||||
| Monaca (Pittsburgh) | Industrial | 401,716 | 7,484,125 | 2,642,181 | 5,243,660 | |||||||||||||
| South Carolina: | ||||||||||||||||||
| Aiken (Augusta, GA) | Industrial | 1,362,458 | 19,677,937 | 126,141 | 20,914,254 | |||||||||||||
| Ft. Mill (Charlotte, NC) | Industrial | 1,670,000 | 13,743,307 | 2,302,265 | 13,111,042 | |||||||||||||
| Hanahan (Charleston)(SAIC) | Industrial | 1,129,000 | 12,245,441 | 3,961,769 | 9,412,672 | |||||||||||||
| Hanahan (Charleston)(FDX Ground) | Industrial | 930,000 | 6,684,653 | 1,897,664 | 5,716,989 | |||||||||||||
| Tennessee: | ||||||||||||||||||
| Chattanooga | Industrial | 300,000 | 4,716,518 | 1,262,219 | 3,754,299 | |||||||||||||
| Lebanon (Nashville) | Industrial | 2,230,000 | 11,985,126 | 1,843,853 | 12,371,273 | |||||||||||||
| Memphis | Industrial | 1,240,887 | 13,381,050 | 2,573,085 | 12,048,852 | |||||||||||||
| Shelby County | Vacant Land | 11,065 | -0- | -0- | 11,065 | |||||||||||||
| Texas: | ||||||||||||||||||
| Carrollton (Dallas) | Industrial | 1,500,000 | 16,319,203 | 3,130,523 | 14,688,680 | |||||||||||||
| Corpus Christi | Industrial | -0- | 4,771,913 | 672,040 | 4,099,873 | |||||||||||||
| Edinburg | Industrial | 1,000,000 | 11,039,014 | 1,188,983 | 10,850,031 | |||||||||||||
| El Paso | Industrial | 3,225,195 | 9,205,997 | 1,709,714 | 10,721,478 | |||||||||||||
| Ft. Worth (Dallas) | Industrial | 8,200,000 | 27,100,832 | 1,505,602 | 33,795,230 | |||||||||||||
| Houston | Industrial | 1,661,120 | 6,487,338 | 1,248,713 | 6,899,745 | |||||||||||||
| Lindale (Tyler) | Industrial | 540,000 | 9,396,500 | 722,416 | 9,214,084 | |||||||||||||
| Mesquite (Dallas) | Industrial | 6,247,658 | 43,632,835 | 279,698 | 49,600,795 | |||||||||||||
| Spring (Houston) | Industrial | 1,890,000 | 17,393,798 | 1,629,658 | 17,654,140 | |||||||||||||
| Waco | Industrial | 1,350,000 | 11,201,368 | 1,210,344 | 11,341,024 | |||||||||||||
| Virginia: | ||||||||||||||||||
| Charlottesville | Industrial | 1,170,000 | 3,186,988 | 1,489,266 | 2,867,722 | |||||||||||||
| Mechanicsville (Richmond) | Industrial | 1,160,000 | 6,625,011 | 2,824,533 | 4,960,478 | |||||||||||||
| Richmond | Industrial | 446,000 | 4,322,309 | 1,409,820 | 3,358,489 | |||||||||||||
| Roanoke (CHEP USA) | Industrial | 1,853,000 | 5,552,447 | 1,516,288 | 5,889,159 | |||||||||||||
| Roanoke (FDX Ground) | Industrial | 1,740,000 | 8,460,000 | 930,962 | 9,269,038 | |||||||||||||
| 116 |
| SEPTEMBER 30, 2015 (cont’d) | Property | Buildings & | Accumulated | Net Book | ||||||||||||||
| Type | Land | Improvements | Depreciation | Value | ||||||||||||||
| Illinois: | ||||||||||||||||||
| Burr Ridge (Chicago) | Industrial | $ | 270,000 | $ | 1,414,201 | $ | 613,666 | $ | 1,070,535 | |||||||||
| Elgin (Chicago) | Industrial | 1,280,000 | 5,646,956 | 1,976,098 | 4,950,858 | |||||||||||||
| Granite City (St. Louis, MO) | Industrial | 340,000 | 12,046,675 | 4,171,237 | 8,215,438 | |||||||||||||
| Montgomery (Chicago) | Industrial | 2,000,000 | 9,298,367 | 2,043,560 | 9,254,807 | |||||||||||||
| Rockford (B/E Aerospace) | Industrial | 480,000 | 4,620,000 | 118,462 | 4,981,538 | |||||||||||||
| Rockford (Sherwin-Williams) | Industrial | 1,100,000 | 4,451,227 | 512,938 | 5,038,289 | |||||||||||||
| Sauget (St. Louis, MO) | Industrial | 1,890,000 | 13,310,000 | 341,282 | 14,858,718 | |||||||||||||
| Schaumburg (Chicago) | Industrial | 1,039,800 | 3,927,839 | 1,932,902 | 3,034,737 | |||||||||||||
| Wheeling (Chicago) | Industrial | 5,112,120 | 13,425,532 | 3,392,350 | 15,145,302 | |||||||||||||
| Indiana: | ||||||||||||||||||
| Greenwood (Indianapolis) | Industrial | 2,250,000 | 35,234,574 | 376,438 | 37,108,136 | |||||||||||||
| Indianapolis | Industrial | 3,500,000 | 20,446,000 | 608,611 | 23,337,389 | |||||||||||||
| Iowa: | ||||||||||||||||||
| Urbandale (Des Moines) | Industrial | 310,000 | 1,851,895 | 1,042,050 | 1,119,845 | |||||||||||||
| Kansas: | ||||||||||||||||||
| Edwardsville (Kansas City)(Carlisle Tire) | Industrial | 1,185,000 | 6,040,401 | 1,957,985 | 5,267,416 | |||||||||||||
| Edwardsville (Kansas City)(International Paper) | Industrial | 2,750,000 | 15,538,753 | 757,934 | 17,530,819 | |||||||||||||
| Topeka | Industrial | -0- | 3,679,843 | 613,406 | 3,066,437 | |||||||||||||
| Kentucky: | ||||||||||||||||||
| Buckner (Louisville) | Industrial | 2,280,000 | 24,439,716 | 1,199,729 | 25,519,987 | |||||||||||||
| Frankfort (Lexington) | Industrial | 1,850,000 | 26,150,000 | 558,761 | 27,441,239 | |||||||||||||
| Maryland: | ||||||||||||||||||
| Beltsville (Washington, DC) | Industrial | 3,200,000 | 11,267,755 | 3,230,319 | 11,237,436 | |||||||||||||
| Michigan: | ||||||||||||||||||
| Livonia (Detroit) | Industrial | 320,000 | 13,410,533 | 1,002,083 | 12,728,450 | |||||||||||||
| Orion | Industrial | 4,649,971 | 18,229,798 | 3,080,057 | 19,799,712 | |||||||||||||
| Romulus (Detroit) | Industrial | 531,000 | 4,069,532 | 1,691,732 | 2,908,800 | |||||||||||||
| Minnesota: | ||||||||||||||||||
| Stewartville (Rochester) | Industrial | 900,000 | 4,320,000 | 221,538 | 4,998,462 | |||||||||||||
| White Bear Lake (Minneapolis/St. Paul) | Industrial | 1,393,000 | 3,764,126 | 831,891 | 4,325,235 | |||||||||||||
| Mississippi: | ||||||||||||||||||
| Olive Branch (Memphis, TN)(Anda Distribution) | Industrial | 800,000 | 13,750,000 | 1,145,833 | 13,404,167 | |||||||||||||
| Olive Branch (Memphis, TN)(Milwaukee Tool) | Industrial | 2,550,000 | 24,952,797 | 1,592,066 | 25,910,731 | |||||||||||||
| Richland (Jackson) | Industrial | 211,000 | 1,689,691 | 748,265 | 1,152,426 | |||||||||||||
| Ridgeland (Jackson) | Industrial | 218,000 | 1,632,794 | 1,109,322 | 741,472 | |||||||||||||
| Missouri: | ||||||||||||||||||
| Kansas City (Bunzl) | Industrial | 1,000,000 | 8,600,000 | 202,137 | 9,397,863 | |||||||||||||
| Kansas City (Kellogg) | Industrial | 660,000 | 4,088,374 | 901,195 | 3,847,179 | |||||||||||||
| Liberty (Kansas City) | Industrial | 723,000 | 6,650,618 | 2,973,407 | 4,400,211 | |||||||||||||
| O’Fallon (St. Louis) | Industrial | 264,000 | 3,981,913 | 1,963,226 | 2,282,687 | |||||||||||||
| St. Joseph | Industrial | 800,000 | 12,382,772 | 4,423,009 | 8,759,763 | |||||||||||||
| Nebraska: | ||||||||||||||||||
| Omaha | Industrial | 1,170,000 | 4,767,281 | 1,984,805 | 3,952,476 | |||||||||||||
| New Jersey: | ||||||||||||||||||
| Carlstadt (New York, NY) | Industrial | 1,194,000 | 3,695,712 | 767,084 | 4,122,628 | |||||||||||||
| Somerset | Shopping Center | 34,316 | 2,660,928 | 1,318,964 | 1,376,280 | |||||||||||||
| New York: | ||||||||||||||||||
| Cheektowaga (Buffalo) | Industrial | 4,796,765 | 6,164,058 | 1,370,655 | 9,590,168 | |||||||||||||
| Halfmoon (Albany) | Industrial | 1,190,000 | 4,335,600 | 389,092 | 5,136,508 | |||||||||||||
| Orangeburg (New York) | Industrial | 694,720 | 3,200,955 | 2,201,868 | 1,693,807 | |||||||||||||
| North Carolina: | ||||||||||||||||||
| Fayetteville | Industrial | 172,000 | 4,712,522 | 2,229,107 | 2,655,415 | |||||||||||||
| Property | Buildings & | Accumulated | Net Book | |||||||||||||||||
| SEPTEMBER 30, 2017 (cont’d) | Type | Land | Improvements | Depreciation | Value | |||||||||||||||
| Washington: | ||||||||||||||||||||
| Burlington (Seattle/Everett) | Industrial | $ | 8,000,000 | $ | 22,228,547 | $ | 855,500 | $ | 29,373,047 | |||||||||||
| Wisconsin: | ||||||||||||||||||||
| Cudahy (Milwaukee) | Industrial | 980,000 | 8,402,361 | 3,075,370 | 6,306,991 | |||||||||||||||
| Green Bay | Industrial | 590,000 | 5,980,000 | 613,333 | 5,956,667 | |||||||||||||||
| Total as of September 30, 2017 | $ | 191,759,539 | $ | 1,261,075,064 | $ | 177,372,519 | $ | 1,275,462,084 | ||||||||||||
| (1) | Classified as Real Estate Held for Sale. |
| Property | Buildings & | Accumulated | Net Book | |||||||||||||||||
| SEPTEMBER 30, 2016 | Type | Land | Improvements | Depreciation | Value | |||||||||||||||
| Alabama: | ||||||||||||||||||||
| Huntsville | Industrial | $ | 748,115 | $ | 5,857,016 | $ | 936,862 | $ | 5,668,269 | |||||||||||
| Arizona: | ||||||||||||||||||||
| Tolleson (Phoenix) | Industrial | 1,316,075 | 15,508,151 | 5,115,610 | 11,708,616 | |||||||||||||||
| Colorado: | ||||||||||||||||||||
| Colorado Springs | Industrial | 1,270,000 | 5,934,472 | 1,490,351 | 5,714,121 | |||||||||||||||
| Colorado Springs | Industrial | 2,150,000 | 26,350,000 | 225,214 | 28,274,786 | |||||||||||||||
| Denver | Industrial | 1,150,000 | 5,204,051 | 1,437,516 | 4,916,535 | |||||||||||||||
| Connecticut: | ||||||||||||||||||||
| Newington (Hartford) | Industrial | 410,000 | 3,053,824 | 1,207,938 | 2,255,886 | |||||||||||||||
| Florida: | ||||||||||||||||||||
| Cocoa | Industrial | 1,881,316 | 12,246,133 | 2,113,243 | 12,014,206 | |||||||||||||||
| Davenport (Orlando) | Industrial | 7,060,000 | 30,720,000 | 131,282 | 37,648,718 | |||||||||||||||
| Ft. Myers (1) | Industrial | 1,910,000 | 3,107,447 | 991,678 | 4,025,769 | |||||||||||||||
| Jacksonville (FDX) | Industrial | 1,165,000 | 5,081,404 | 2,295,680 | 3,950,724 | |||||||||||||||
| Jacksonville (FDX Ground) | Industrial | 6,000,000 | 24,645,954 | 1,053,246 | 29,592,708 | |||||||||||||||
| Lakeland | Industrial | 261,000 | 1,721,532 | 466,240 | 1,516,292 | |||||||||||||||
| Orlando | Industrial | 2,200,000 | 6,354,432 | 1,471,814 | 7,082,618 | |||||||||||||||
| Punta Gorda | Industrial | -0- | 4,113,265 | 833,789 | 3,279,476 | |||||||||||||||
| Tampa (FDX Ground) | Industrial | 5,000,000 | 14,696,102 | 4,161,734 | 15,534,368 | |||||||||||||||
| Tampa (FDX) | Industrial | 2,830,000 | 4,762,861 | 1,258,519 | 6,334,342 | |||||||||||||||
| Tampa (Tampa Bay Grand Prix) | Industrial | 1,867,000 | 3,810,982 | 941,848 | 4,736,134 | |||||||||||||||
| Georgia: | ||||||||||||||||||||
| Augusta (FDX Ground) | Industrial | 614,406 | 4,739,628 | 1,258,944 | 4,095,090 | |||||||||||||||
| Augusta (FDX) | Industrial | 380,000 | 1,591,732 | 367,357 | 1,604,375 | |||||||||||||||
| Griffin (Atlanta) | Industrial | 760,000 | 14,108,857 | 3,767,103 | 11,101,754 | |||||||||||||||
| Illinois: | ||||||||||||||||||||
| Burr Ridge (Chicago) | Industrial | 270,000 | 1,422,901 | 656,159 | 1,036,742 | |||||||||||||||
| Elgin (Chicago) | Industrial | 1,280,000 | 5,652,916 | 2,124,899 | 4,808,017 | |||||||||||||||
| Granite City (St. Louis, MO) | Industrial | 340,000 | 12,202,814 | 4,485,359 | 8,057,455 | |||||||||||||||
| Montgomery (Chicago) | Industrial | 2,000,000 | 9,298,367 | 2,282,887 | 9,015,480 | |||||||||||||||
| Rockford (Collins Aerospace Systems) | Industrial | 480,000 | 4,620,000 | 236,923 | 4,863,077 | |||||||||||||||
| Rockford (Sherwin-Williams Co.) | Industrial | 1,100,000 | 4,451,227 | 628,612 | 4,922,615 | |||||||||||||||
| Sauget (St. Louis, MO) | Industrial | 1,890,000 | 13,314,950 | 682,605 | 14,522,345 | |||||||||||||||
| Schaumburg (Chicago) | Industrial | 1,039,800 | 3,941,614 | 2,037,309 | 2,944,105 | |||||||||||||||
| Wheeling (Chicago) | Industrial | 5,112,120 | 13,425,532 | 3,735,969 | 14,801,683 | |||||||||||||||
| Indiana: | ||||||||||||||||||||
| Greenwood (Indianapolis) | Industrial | 2,250,000 | 35,250,391 | 1,280,020 | 36,220,371 | |||||||||||||||
| Indianapolis | Industrial | 3,500,000 | 20,446,000 | 1,132,868 | 22,813,132 | |||||||||||||||
| Iowa: | ||||||||||||||||||||
| Urbandale (Des Moines) | Industrial | 310,000 | 1,851,895 | 1,094,293 | 1,067,602 | |||||||||||||||
| 117 |
| SEPTEMBER 30, 2015 (cont’d) | Property | Buildings & | Accumulated | Net Book | ||||||||||||||
| Type | Land | Improvements | Depreciation | Value | ||||||||||||||
| Winston-Salem | Industrial | $ | 980,000 | $ | 5,942,086 | $ | 1,980,737 | $ | 4,941,349 | |||||||||
| Ohio: | ||||||||||||||||||
| Bedford Heights (Cleveland) | Industrial | 990,000 | 5,789,591 | 1,337,898 | 5,441,693 | |||||||||||||
| Cincinnati | Industrial | 800,000 | 5,950,000 | 12,714 | 6,737,286 | |||||||||||||
| Lebanon (Cincinnati) | Industrial | 240,000 | 4,212,425 | 375,609 | 4,076,816 | |||||||||||||
| Monroe (Cincinnati) | Industrial | 1,800,000 | 11,137,000 | 166,579 | 12,770,421 | |||||||||||||
| Richfield (Cleveland) | Industrial | 2,676,848 | 13,758,630 | 2,016,458 | 14,419,020 | |||||||||||||
| Streetsboro (Cleveland) | Industrial | 1,760,000 | 17,840,000 | 1,601,026 | 17,998,974 | |||||||||||||
| West Chester Twp. (Cincinnati) | Industrial | 695,000 | 5,033,690 | 1,768,517 | 3,960,173 | |||||||||||||
| Oklahoma: | ||||||||||||||||||
| Oklahoma City | Industrial | 1,410,000 | 11,183,873 | 723,874 | 11,869,999 | |||||||||||||
| Tulsa | Industrial | 790,000 | 2,958,031 | 145,342 | 3,602,689 | |||||||||||||
| Pennsylvania: | ||||||||||||||||||
| Altoona | Industrial | 1,200,000 | 7,790,000 | 382,842 | 8,607,158 | |||||||||||||
| Monaca (Pittsburgh) | Industrial | 401,716 | 7,367,252 | 2,023,850 | 5,745,118 | |||||||||||||
| South Carolina: | ||||||||||||||||||
| Ft. Mill (Charlotte, NC) | Industrial | 1,670,000 | 13,743,307 | 1,597,480 | 13,815,827 | |||||||||||||
| Hanahan (Charleston) (SAIC) | Industrial | 1,129,000 | 12,171,592 | 3,199,452 | 10,101,140 | |||||||||||||
| Hanahan (Charleston) (FDX Ground) | Industrial | 930,000 | 6,684,653 | 1,550,717 | 6,063,936 | |||||||||||||
| Tennessee: | ||||||||||||||||||
| Chattanooga | Industrial | 300,000 | 4,671,161 | 1,003,292 | 3,967,869 | |||||||||||||
| Lebanon (Nashville) | Industrial | 2,230,000 | 11,985,126 | 1,229,231 | 12,985,895 | |||||||||||||
| Memphis | Industrial | 1,240,887 | 13,380,000 | 1,886,931 | 12,733,956 | |||||||||||||
| Shelby County | Vacant Land | 11,065 | -0- | -0- | 11,065 | |||||||||||||
| Texas: | ||||||||||||||||||
| Carrollton (Dallas) | Industrial | 1,500,000 | 16,244,300 | 2,290,543 | 15,453,757 | |||||||||||||
| Corpus Christi | Industrial | -0- | 4,764,500 | 427,583 | 4,336,917 | |||||||||||||
| Edinburg | Industrial | 1,000,000 | 6,438,483 | 742,117 | 6,696,366 | |||||||||||||
| El Paso | Industrial | 3,225,195 | 9,205,997 | 1,176,363 | 11,254,829 | |||||||||||||
| Fort Worth (Dallas) | Industrial | 8,200,000 | 27,100,832 | 115,816 | 35,185,016 | |||||||||||||
| Houston | Industrial | 1,730,000 | 6,353,107 | 913,317 | 7,169,790 | |||||||||||||
| Lindale (Tyler) | Industrial | 540,000 | 9,390,000 | 240,769 | 9,689,231 | |||||||||||||
| Spring (Houston) | Industrial | 1,890,000 | 17,337,523 | 738,390 | 18,489,133 | |||||||||||||
| Waco | Industrial | 1,350,000 | 11,196,157 | 636,182 | 11,909,975 | |||||||||||||
| Virginia: | ||||||||||||||||||
| Charlottesville | Industrial | 1,170,000 | 3,174,037 | 1,295,758 | 3,048,279 | |||||||||||||
| Mechanicsville (Richmond) (FDX) | Industrial | 1,160,000 | 6,579,671 | 2,465,144 | 5,274,527 | |||||||||||||
| Richmond (United Technologies) | Industrial | 446,000 | 4,314,769 | 1,049,842 | 3,710,927 | |||||||||||||
| Roanoke (CHEP) | Industrial | 1,853,000 | 5,552,447 | 1,140,757 | 6,264,690 | |||||||||||||
| Roanoke (FDX Ground) | Industrial | 1,740,000 | 8,460,000 | 497,115 | 9,702,885 | |||||||||||||
| Wisconsin: | ||||||||||||||||||
| Cudahy (Milwaukee) | Industrial | 980,000 | 8,393,672 | 2,633,457 | 6,740,215 | |||||||||||||
| Green Bay | Industrial | 590,000 | 5,980,000 | 306,667 | 6,263,333 | |||||||||||||
| Total as of September 30, 2015 | $ | 133,500,315 | $ | 807,509,590 | $ | 124,898,639 | $ | 816,111,266 | ||||||||||
| Property | Buildings & | Accumulated | Net Book | |||||||||||||||
| SEPTEMBER 30, 2016 (cont’d) | Type | Land | Improvements | Depreciation | Value | |||||||||||||
| Kansas: | ||||||||||||||||||
| Edwardsville (Kansas City)(Carlisle Tire) | Industrial | $ | 1,185,000 | $ | 6,040,401 | $ | 2,158,091 | $ | 5,067,310 | |||||||||
| Edwardsville (Kansas City)(International Paper) | Industrial | 2,750,000 | 15,544,108 | 1,172,549 | 17,121,559 | |||||||||||||
| Olathe (Kansas City) | Industrial | 2,350,000 | 29,387,000 | 125,585 | 31,611,415 | |||||||||||||
| Topeka | Industrial | -0- | 3,679,843 | 707,765 | 2,972,078 | |||||||||||||
| Kentucky: | ||||||||||||||||||
| Buckner (Louisville) | Industrial | 2,280,000 | 24,487,852 | 1,834,166 | 24,933,686 | |||||||||||||
| Frankfort (Lexington) | Industrial | 1,850,000 | 26,150,000 | 1,229,274 | 26,770,726 | |||||||||||||
| Louisville | Industrial | 1,590,000 | 9,714,000 | 83,026 | 11,220,974 | |||||||||||||
| Louisiana: | ||||||||||||||||||
| Covington (New Orleans) | Industrial | 2,720,000 | 15,690,000 | 335,256 | 18,074,744 | |||||||||||||
| Maryland: | ||||||||||||||||||
| Beltsville (Washington, DC) | Industrial | 3,200,000 | 11,312,355 | 3,536,076 | 10,976,279 | |||||||||||||
| Michigan: | ||||||||||||||||||
| Livonia (Detroit) | Industrial | 320,000 | 13,442,030 | 1,350,345 | 12,411,685 | |||||||||||||
| Orion | Industrial | 4,649,971 | 18,235,665 | 3,549,648 | 19,335,988 | |||||||||||||
| Romulus (Detroit) | Industrial | 531,000 | 4,069,532 | 1,804,248 | 2,796,284 | |||||||||||||
| Minnesota: | ||||||||||||||||||
| Stewartville (Rochester) | Industrial | 900,000 | 4,320,000 | 332,308 | 4,887,692 | |||||||||||||
| White Bear Lake (Minneapolis/St. Paul) | Industrial | 1,393,000 | 3,764,126 | 927,965 | 4,229,161 | |||||||||||||
| Mississippi: | ||||||||||||||||||
| Olive Branch (Memphis, TN)( Anda Pharmaceuticals, Inc.) | Industrial | 800,000 | 13,750,000 | 1,498,397 | 13,051,603 | |||||||||||||
| Olive Branch (Memphis, TN)(Milwaukee Tool) | Industrial | 2,550,000 | 34,364,917 | 2,275,368 | 34,639,549 | |||||||||||||
| Richland (Jackson) | Industrial | 211,000 | 1,689,691 | 826,199 | 1,074,492 | |||||||||||||
| Ridgeland (Jackson) | Industrial | 218,000 | 1,640,591 | 1,177,386 | 681,205 | |||||||||||||
| Missouri: | ||||||||||||||||||
| Kansas City (Bunzl) | Industrial | 1,000,000 | 8,600,000 | 422,650 | 9,177,350 | |||||||||||||
| Kansas City (Kellogg) (1) | Industrial | 660,000 | 4,140,474 | 1,022,653 | 3,777,821 | |||||||||||||
| Liberty (Kansas City) | Industrial | 723,000 | 6,674,881 | 3,152,489 | 4,245,392 | |||||||||||||
| O’Fallon (St. Louis) | Industrial | 264,000 | 3,981,913 | 2,096,073 | 2,149,840 | |||||||||||||
| St. Joseph | Industrial | 800,000 | 12,433,706 | 4,756,910 | 8,476,796 | |||||||||||||
| Nebraska: | ||||||||||||||||||
| Omaha | Industrial | 1,170,000 | 4,774,691 | 2,109,230 | 3,835,461 | |||||||||||||
| New Jersey: | ||||||||||||||||||
| Carlstadt (New York, NY) | Industrial | 1,194,000 | 3,709,589 | 849,584 | 4,054,005 | |||||||||||||
| Somerset | Shopping Center | 34,316 | 3,038,565 | 1,399,343 | 1,673,538 | |||||||||||||
| New York: | ||||||||||||||||||
| Cheektowaga (Buffalo) | Industrial | 4,796,765 | 6,164,058 | 1,531,509 | 9,429,314 | |||||||||||||
| Halfmoon (Albany) | Industrial | 1,190,000 | 4,335,600 | 500,262 | 5,025,338 | |||||||||||||
| Orangeburg (New York) (1) | Industrial | 694,720 | 3,200,955 | 2,319,253 | 1,576,422 | |||||||||||||
| North Carolina: | ||||||||||||||||||
| Concord (Charlotte) | Industrial | 4,305,000 | 27,670,897 | 650,384 | 31,325,513 | |||||||||||||
| Fayetteville | Industrial | 172,000 | 5,269,876 | 2,458,876 | 2,983,000 | |||||||||||||
| Winston-Salem | Industrial | 980,000 | 6,258,613 | 2,185,430 | 5,053,183 | |||||||||||||
| Ohio: | ||||||||||||||||||
| Bedford Heights (Cleveland) | Industrial | 990,000 | 5,873,879 | 1,521,396 | 5,342,483 | |||||||||||||
| Cincinnati | Industrial | 800,000 | 5,950,000 | 165,278 | 6,584,722 | |||||||||||||
| Lebanon (Cincinnati) | Industrial | 240,000 | 4,212,425 | 485,114 | 3,967,311 | |||||||||||||
| Monroe (Cincinnati) | Industrial | 1,800,000 | 11,137,000 | 452,143 | 12,484,857 | |||||||||||||
| Richfield (Cleveland) | Industrial | 2,676,848 | 13,758,630 | 2,373,693 | 14,061,785 | |||||||||||||
| Streetsboro (Cleveland) | Industrial | 1,760,000 | 17,840,000 | 2,058,462 | 17,541,538 | |||||||||||||
| West Chester Twp. (Cincinnati) | Industrial | 695,000 | 5,033,690 | 1,947,128 | 3,781,562 | |||||||||||||
| Oklahoma: | ||||||||||||||||||
| Oklahoma City (FDX Ground) | Industrial | 1,410,000 | 11,170,262 | 1,014,638 | 11,565,624 | |||||||||||||
| Tulsa | Industrial | 790,000 | 2,958,031 | 227,268 | 3,520,763 | |||||||||||||
| 118 |
| Property | Buildings & | Accumulated | Net Book | |||||||||||||||
| SEPTEMBER 30, 2016 (cont’d) | Type | Land | Improvements | Depreciation | Value | |||||||||||||
| Pennsylvania: | ||||||||||||||||||
| Altoona | Industrial | $ | 1,200,000 | $ | 7,808,650 | $ | 583,052 | $ | 8,425,598 | |||||||||
| Imperial (Pittsburgh) | Industrial | 3,700,000 | 16,250,000 | 243,056 | 19,706,944 | |||||||||||||
| Monaca (Pittsburgh) | Industrial | 401,716 | 7,404,507 | 2,331,288 | 5,474,935 | |||||||||||||
| South Carolina: | ||||||||||||||||||
| Ft. Mill (Charlotte, NC) | Industrial | 1,670,000 | 13,743,307 | 1,949,873 | 13,463,434 | |||||||||||||
| Hanahan (Charleston)(SAIC) | Industrial | 1,129,000 | 12,211,592 | 3,577,226 | 9,763,366 | |||||||||||||
| Hanahan (Charleston)(FDX Ground) | Industrial | 930,000 | 6,684,653 | 1,724,191 | 5,890,462 | |||||||||||||
| Tennessee: | ||||||||||||||||||
| Chattanooga | Industrial | 300,000 | 4,712,203 | 1,131,706 | 3,880,497 | |||||||||||||
| Lebanon (Nashville) | Industrial | 2,230,000 | 11,985,126 | 1,536,542 | 12,678,584 | |||||||||||||
| Memphis | Industrial | 1,240,887 | 13,380,000 | 2,230,008 | 12,390,879 | |||||||||||||
| Shelby County | Vacant Land | 11,065 | -0- | -0- | 11,065 | |||||||||||||
| Texas: | ||||||||||||||||||
| Carrollton (Dallas) | Industrial | 1,500,000 | 16,269,106 | 2,708,020 | 15,061,086 | |||||||||||||
| Corpus Christi | Industrial | -0- | 4,764,500 | 549,750 | 4,214,750 | |||||||||||||
| Edinburg | Industrial | 1,000,000 | 10,423,872 | 907,803 | 10,516,069 | |||||||||||||
| El Paso | Industrial | 3,225,195 | 9,205,997 | 1,442,146 | 10,989,046 | |||||||||||||
| Ft. Worth (Dallas) | Industrial | 8,200,000 | 27,100,832 | 810,709 | 34,490,123 | |||||||||||||
| Houston | Industrial | 1,730,000 | 6,353,107 | 1,080,294 | 7,002,813 | |||||||||||||
| Lindale (Tyler) | Industrial | 540,000 | 9,390,000 | 481,538 | 9,448,462 | |||||||||||||
| Spring (Houston) | Industrial | 1,890,000 | 17,393,798 | 1,183,663 | 18,100,135 | |||||||||||||
| Waco | Industrial | 1,350,000 | 11,196,157 | 923,263 | 11,622,894 | |||||||||||||
| Virginia: | ||||||||||||||||||
| Charlottesville | Industrial | 1,170,000 | 3,178,499 | 1,393,226 | 2,955,273 | |||||||||||||
| Mechanicsville (Richmond) | Industrial | 1,160,000 | 6,598,181 | 2,644,156 | 5,114,025 | |||||||||||||
| Richmond | Industrial | 446,000 | 4,322,309 | 1,229,737 | 3,538,572 | |||||||||||||
| Roanoke (CHEP USA) | Industrial | 1,853,000 | 5,552,447 | 1,329,033 | 6,076,414 | |||||||||||||
| Roanoke (FDX Ground) | Industrial | 1,740,000 | 8,460,000 | 714,038 | 9,485,962 | |||||||||||||
| Washington: | ||||||||||||||||||
| Burlington (Seattle/Everett) | Industrial | 8,000,000 | 22,210,680 | 284,752 | 29,925,928 | |||||||||||||
| Wisconsin: | ||||||||||||||||||
| Cudahy (Milwaukee) | Industrial | 980,000 | 8,402,361 | 2,853,810 | 6,528,551 | |||||||||||||
| Green Bay | Industrial | 590,000 | 5,980,000 | 460,000 | 6,110,000 | |||||||||||||
| Total as of September 30, 2016 | $ | 165,375,315 | $ | 1,005,938,180 | $ | 148,830,169 | $ | 1,022,483,326 | ||||||||||
| (1) | Classified as Real Estate Held for Sale. |
NOTE 3 – ACQUISITIONS, EXPANSIONS AND DISPOSITION
Fiscal 2017
Acquisitions accounted for as business combinations
On October 17, 2016, the Company purchased a newly constructed 338,584 square foot industrial building located in Hamburg, NY, which is in the Buffalo Metropolitan Statistical Area (MSA). The building is 100% net-leased to FedEx Ground Package System, Inc. for 15 years through March 2031. The purchase price was $35,100,000. The Company obtained a 15 year fully-amortizing mortgage loan of $23,500,000 at a fixed interest rate of 4.03%. Annual rental revenue over the remaining term of the lease averages approximately $2,309,000. In connection with the acquisition, the Company completed its evaluation of the acquired lease. As a result of its evaluation, the Company allocated $250,000 to an Intangible Asset associated with the lease in-place.
On December 30, 2016, the Company purchased a newly constructed 213,672 square foot industrial building located in Ft. Myers, FL. The building is 100% net-leased to FedEx Ground Package System, Inc. for 10 years through September 2026. The purchase price was $21,001,538. The Company obtained a 15 year fully-amortizing mortgage loan of $14,500,000 at a fixed interest rate of 3.97%. Annual rental revenue over the remaining term of the lease averages approximately $1,365,000. In connection with the acquisition, the Company completed its evaluation of the acquired lease. As a result of its evaluation, the Company allocated $201,538 to an Intangible Asset associated with the lease in-place. On September 1, 2017, a parking lot expansion for this property was completed for a cost of approximately $862,000, resulting in a new 10 year lease which extended the prior lease expiration date from September 2026 to August 2027. In addition, the expansion resulted in an increase in annual rent effective from the date of completion of approximately $53,000 from approximately $1,365,000 to approximately $1,418,000.
| 119 |
Acquisitions accounted for as asset acquisitions
On April 5, 2017, the Company purchased a newly constructed 343,483 square foot industrial building located in Walker, MI, which is in the Grand Rapids MSA. The building is 100% net-leased to FedEx Ground Package System, Inc. for 15 years through January 2032. The purchase price was $32,120,000. The Company obtained a 15 year fully-amortizing mortgage loan of $20,875,000 at a fixed interest rate of 3.86%. Annual rental revenue over the remaining term of the lease averages approximately $2,102,000.
On June 23, 2017, the Company purchased a newly constructed 351,874 square foot industrial building located in Mesquite, TX, which is in the Dallas MSA. The building is 100% net-leased to FedEx Ground Package System, Inc. for 15 years through March 2032. The purchase price was $50,621,072. The Company obtained a 15 year fully-amortizing mortgage loan of $32,900,000 at a fixed interest rate of 3.60%. Annual rental revenue over the remaining term of the lease averages approximately $3,194,000.
On June 27, 2017, the Company purchased a newly constructed 315,560 square foot industrial building located in Aiken, SC, which is in the Augusta, GA MSA. The building is 100% net-leased to Autoneum North America, Inc. for 15 years through April 2032. The purchase price was $21,933,000. The Company obtained a 15 year fully-amortizing mortgage loan of $15,350,000 at a fixed interest rate of 4.20%. Annual rental revenue over the remaining term of the lease averages approximately $1,700,000.
On June 28, 2017, the Company purchased a newly-constructed 237,756 square foot industrial building located in Homestead, FL, which is in the Miami MSA. The building is 100% net leased to FedEx Ground Package System, Inc. for 15 years through March 2032. The purchase price was $38,347,933. The Company obtained a 15 year fully-amortizing mortgage loan of $24,800,000 at a fixed interest rate of 3.60%. Annual rental revenue over the remaining term of the lease averages approximately $2,282,000.
On June 29, 2017, the Company purchased a newly constructed 110,361 square foot industrial building located in Oklahoma City, OK. The building is 100% net-leased to Bunzl Distribution Oklahoma, Inc. for seven years through August 2024. The purchase price was $9,000,000. The Company obtained a 12 year fully-amortizing mortgage loan of $6,000,000 at a fixed interest rate of 4.125%. Annual rental revenue over the remaining term of the lease averages approximately $721,000.
On August 3, 2017, the Company purchased a newly constructed 354,482 square foot industrial building located in Concord, NC which is in the Charlotte MSA. The building is 100% net leased to FedEx Ground Package System, Inc. for 15 years through May 2032. The purchase price was $40,598,446. The Company obtained a 15 year fully-amortizing mortgage loan of $26,184,000 at a fixed interest rate of 3.80%. Annual rental revenue over the remaining term of the lease averages approximately $2,537,000.
On September 19, 2017, the Company purchased a newly constructed 298,472 square foot industrial building located in Kenton, OH. The building is 100% net leased to International Paper Company for 10 years through August 2027. The purchase price was $18,299,032. The Company obtained a 15 year fully-amortizing mortgage loan of $12,000,000 at a fixed interest rate of 4.45%. Annual rental revenue over the remaining term of the lease averages approximately $1,243,000.
On September 29, 2017, the Company purchased a newly constructed 219,765 square foot industrial building located in Stow, OH. The building is 100% net leased to Mickey Thompson Performance Tires and Wheels for 10 years through August 2027. The purchase price was $19,500,000. The Company obtained a 15 year fully-amortizing mortgage loan of $12,700,000 at a fixed interest rate of 4.17%. Annual rental revenue over the remaining term of the lease averages approximately $1,500,000.
| 120 |
The Company evaluated the property acquisitions which took place subsequent to March 31, 2017, under the new framework for determining whether an integrated set of assets and activities meets the definition of a business, pursuant to ASU 2017-01, which the Company early-adopted effective April 1, 2017. Acquisitions that do not meet the definition of a business are accounted for as asset acquisitions (see Note 1). Accordingly, the Company accounted for the properties purchased in Walker (Grand Rapids), MI; Mesquite (Dallas), TX; Aiken (Augusta, GA), SC; Homestead (Miami), FL; Oklahoma City, OK; Concord (Charlotte), NC; Kenton, OH and Stow, OH as asset acquisitions and allocated the total cash consideration, including transaction costs, to the individual assets acquired on a relative fair value basis. There were no liabilities assumed in these acquisitions. The financial information set forth below summarizes the Company’s purchase price allocation for these eight properties acquired during the year ended September 30, 2017 that are accounted for as asset acquisitions:
| Land | $ | 23,507,073 | ||
| Building | 202,529,177 | |||
| In-Place Leases | 4,814,192 |
The following table summarizes the operating results included in the Company’s consolidated statements of income for the year ended September 30, 2017 for the properties acquired during the year ended September 30, 2017:
| Year Ended 9/30/2017 | ||||
| Rental Revenues | $ | 7,086,464 | ||
| Net Income | 2,156,885 | |||
FedEx Ground Package System, Inc.’s ultimate parent, FedEx Corporation, International Paper Company and Mickey Thompson Performance Tires and Wheels ultimate parent, Cooper Tire & Rubber Company are publicly-owned companies and financial information related to these entities is available at the SEC’s website,www.sec.gov. Autoneum North America, Inc.’s ultimate parent, Autoneum Holding AG is a publicly-owned company and financial information related to this entity is available at the Swiss Exchange’s website, https://www.six-swiss-exchange.com/index.html and Bunzl Distribution Oklahoma, Inc.’s ultimate parent, Bunzl plc is a publicly-owned company and financial information related to this entity is available at the U.K. government’s website, https://www.gov.uk/government/organisations/companies-house. The references in this report to the SEC’s website, the Swiss Exchange’s website and the U.K. government’s website are not intended to and do not include or incorporate by reference into this report the information on those websites.
Expansions
On October 1, 2016, a 50,625 square foot expansion of the building leased to FedEx Ground Package System, Inc. located in Edinburg, TX was completed for a cost of approximately $4,762,000, resulting in a new 10 year lease, which extended the prior lease expiration date from September 2021 to September 2026. In addition, the expansion resulted in an increase in annual rent effective from the date of completion of approximately $499,000 from approximately $598,000, or $5.26 per square foot, to approximately $1,097,000, or $6.68 per square foot.
As discussed above, on September 1, 2017, a parking lot expansion for a property leased to FedEx Ground Package System, Inc. located in Ft. Myers, FL was completed for a cost of approximately $862,000, resulting in a new 10 year lease which extended the prior lease expiration date from September 2026 to August 2027. In addition, the expansion resulted in an increase in annual rent effective from the date of completion of approximately $53,000 from approximately $1,365,000, or $6.39 per square foot to approximately $1,418,000, or $6.64 per square foot.
| 121 |
Disposition and Real Estate classified as Held for Sale
On October 27, 2016, the Company sold its 59,425 square foot industrial building situated on 4.78 acres located in White Bear Lake (Minneapolis/St. Paul), MN for net proceeds of approximately $4,126,000.
Real Estate Held for Sale at September 30, 2017 consists of three properties that the Company has entered into agreements to sell. The three properties consist of a 65,067 square foot facility located in Kansas City, MO that is leased to Kellogg Sales Company (Kellogg) through July 31, 2018; a 50,400 square foot facility located in Orangeburg, NY leased to Kellogg through February 28, 2018 and an 87,500 square foot facility located in Ft. Myers, FL, which is currently vacant.
Kellogg has informed the Company that they will not be renewing their leases at these two locations. The Company has entered into an agreement to sell the Kansas City, MO property for approximately $4,900,000, which is approximately $1,200,000 above the Company’s U.S. GAAP net book carrying value and we have entered into an agreement to sell the Orangeburg, NY property for approximately $6,170,000, which is approximately $4,700,000 above the Company’s U.S. GAAP net book carrying value, and the Company anticipates the sales will close during fiscal 2018, subject to customary conditions and requirements. In conjunction with the sale of these two properties, we expect to enter into a lease termination agreement for each property whereby the Company will receive a termination fee from Kellogg in an amount equal to a percentage (95% for the Orangeburg, NY property and 75% for the Kansas City, MO property) of the then remaining rent due under each lease for the period from the closing date for the respective sale transactions (which will be the dates of the respective lease terminations) to the end of the respective lease terms. The Ft. Myers, FL location was leased to FedEx Ground Package System, Inc. through June 30, 2017 at which time the property became vacant because the tenant moved its operations from our 87,500 square foot facility to our newly constructed 213,672 square foot facility, which is also located in Ft. Myers, FL. The currently vacant 87,500 square facility is under contract to sell for approximately $6,400,000, which is approximately $2,400,000 above the Company’s U.S. GAAP net book carrying value, and the Company anticipates the sale will close during fiscal 2018, subject to customary closing conditions and requirements.
Since the sale of the property located in White Bear Lake, MN and the future sale of these three properties will not represent a strategic shift that has a major effect on the Company’s operations and financial results, the operations generated from these properties are not included in Discontinued Operations.
The following table summarizes the operations that are included in the accompanying Consolidated Statements of Income for the three fiscal years ended September 30, 2017 for the Company’s 160,000 square foot industrial building located in Monroe, NC prior to its sale on September 18, 2015; the Company’s 59,425 square foot industrial building located in White Bear Lake (Minneapolis/St. Paul), MN prior to its sale on October 27, 2016 and the three properties that are classified as Real Estate Held for Sale in the accompanying Consolidated Balance Sheets:
| 2017 | 2016 | 2015 | ||||||||||
| Rental and Reimbursement Revenue | $ | 1,296,127 | $ | 1,409,342 | $ | 2,021,143 | ||||||
| Real Estate Taxes | (277,837 | ) | (382,246 | ) | (459,610 | ) | ||||||
| Operating Expenses | (111,425 | ) | (129,357 | ) | (227,190 | ) | ||||||
| Depreciation & Amortization | (343,920 | ) | (441,417 | ) | (659,150 | ) | ||||||
| Interest Expense | (78,595 | ) | (141,651 | ) | (221,230 | ) | ||||||
| Income from Operations | 484,350 | 314,671 | 453,963 | |||||||||
| Gain (Loss) on Sale of Real Estate Investment | (95,336 | ) | -0- | 5,021,242 | ||||||||
| Net Income | $ | 389,014 | $ | 314,671 | $ | 5,475,205 | ||||||
Fiscal 2016
Acquisitions
On November 13, 2015, the Company purchased a newly constructed 330,717 square foot industrial building located in Concord, NC, which is in the Charlotte Metropolitan Statistical Area (MSA).MSA. The building is 100% net-leased to FedEx Ground Package System, Inc. for ten10 years through July 2025. The purchase price was $31,975,897. The Company obtained a 15 year fully-amortizing mortgage of $20,780,000 at a fixed interest rate of 3.87%. Annual rental revenue over the remaining term of the lease averages approximately $2,078,000. In connection with the acquisition, the Company completed its evaluation of the acquired lease. As a result of its evaluation, the Company has not allocated any amount to an Intangible Asset.
| 122 |
On December 2, 2015, the Company purchased a newly constructed 175,315 square foot industrial building located in Covington, LA, which is in the New Orleans MSA. The building is 100% net-leased to FedEx Ground Package System, Inc. for ten10 years through June 2025. The purchase price was $18,410,000. The Company obtained a 15 year fully-amortizing mortgage of $12,890,000 at a fixed interest rate of 4.08%. Annual rental revenue over the remaining term of the lease averages approximately $1,258,000. In connection with the acquisition, the Company completed its evaluation of the acquired lease. As a result of its evaluation, the Company has not allocated any amount to an Intangible Asset.
On March 8, 2016, the Company purchased a newly constructed 125,860 square foot industrial building located in Imperial, PA, which is in the Pittsburgh MSA. The building is 100% net-leased to General Electric Company (GE) for ten10 years through December 2025. The purchase price was $20,032,864. The Company obtained a 14 year fully-amortizing mortgage of $13,000,000 at a fixed interest rate of 3.63%. Annual rental revenue over the remaining term of the lease averages approximately $1,311,000. In connection with the acquisition, the Company completed its evaluation of the acquired lease. As a result of its evaluation, the Company allocated $82,864 to an Intangible Asset associated with the lease in-place.
On April 8, 2016, the Company purchased a newly constructed 210,445 square foot industrial building located in Burlington, WA, which is in the Seattle/Everett MSA. The building is 100% net-leased to FedEx Ground Package System, Inc. for fifteen15 years through August 2030. The purchase price was $30,662,080. The Company obtained a 15 year fully-amortizing mortgage of $20,221,000 at a fixed interest rate of 3.67%. Annual rental revenue over the remaining term of the lease averages approximately $1,962,000. In connection with the acquisition, the Company completed its evaluation of the acquired lease. As a result of its evaluation, the Company allocated $451,400 to an Intangible Asset associated with the lease in-place.
On June 9, 2016, the Company purchased a newly constructed 225,362 square foot industrial building located in Colorado Springs, CO. The building is 100% net-leased to FedEx Ground Package System, Inc. for ten10 years through January 2026. The purchase price was $28,845,500. The Company obtained a 15 year fully-amortizing mortgage of $18,730,000 at a fixed interest rate of 3.90%. Annual rental revenue over the remaining term of the lease averages approximately $1,832,000. In connection with the acquisition, the Company completed its evaluation of the acquired lease. As a result of its evaluation, the Company allocated $345,500 to an Intangible Asset associated with the lease in-place.
On June 30, 2016, the Company purchased a newly constructed 137,500 square foot industrial building located in Louisville, KY. The building is 100% net-leased to Challenger Lifts, Inc., a subsidiary of Snap-on Incorporated (“Snap-on”)(Snap-on), for ten10 years through June 2026. The lease is guaranteed by Snap-on. The purchase price was $11,304,000. The Company obtained a 15 year fully-amortizing mortgage of $7,350,000 at a fixed interest rate of 3.74%. Annual rental revenue over the remaining term of the lease averages approximately $835,000. In connection with the acquisition, the Company completed its evaluation of the acquired lease. As a result of its evaluation, the Company has not allocated any amount to an Intangible Asset.
On August 19, 2016, the Company purchased a newly constructed 310,922 square foot industrial building located in Davenport, FL, which is in the Orlando MSA. The building is 100% net-leased to FedEx Ground Package System, Inc. for fifteen15 years through April 2031. The purchase price was $37,780,000. The Company obtained a 15 year fully-amortizing mortgage loan of $26,400,000 at a fixed interest rate of 3.89%. Annual rental revenue over the remaining term of the lease averages approximately $2,604,000. In connection with the acquisition, the Company completed its evaluation of the acquired lease. As a result of its evaluation, the Company has not allocated any amount to an Intangible Asset.
On August 26, 2016, the Company purchased a newly constructed 313,763 square foot industrial building located in Olathe, KS, which is in the Kansas City MSA. The building is 100% net-leased to FedEx Ground Package System, Inc. for fifteen15 years through May 2031. The purchase price was $31,737,000. The Company obtained a 15 year fully-amortizing mortgage loan of $22,215,000 at a fixed interest rate of 3.96%. Annual rental revenue over the remaining term of the lease averages approximately $2,196,000. In connection with the acquisition, the Company completed its evaluation of the acquired lease. As a result of its evaluation, the Company has not allocated any amount to an Intangible Asset.
| 123 |
FedEx Ground Package System, Inc.’s ultimate parent, FedEx Corporation, General Electric CompanyGE and Challenger Lifts, Inc.’s ultimate parent, Snap-on, Incorporated are publicly-owned companies and financial information related to these entities is available at the SEC’s website,www.sec.govwww.sec.gov.. The references in this report to the SEC’s website are not intended to and do not include or incorporate by reference into this report the information on those websites.
Expansions
On July 29, 2016, a 246,434 square foot expansion of a building leased to Milwaukee Electric Tool Corporation (“Milwaukee Tool”)(Milwaukee Tool) located in Olive Branch, MS, which is located in the Memphis, TN MSA, was completed for a cost of approximately $9,785,000. This resulted in a new 12 year lease which extended the original lease expiration date from April 2023 throughto July 2028 and increased the building size from 615,455 to 861,889 square feet. In addition, the expansion resulted in an initial increase in annual rent effective on the date of completion of approximately $847,000 from approximately $1,943,000, or $3.16 per square foot, to approximately $2,790,000, or $3.24 per square foot. Furthermore, annual rent will increase each year by 1.5% resulting in an annualized rent over the new twelve year period of approximately $3,020,000, or $3.50 per square foot. In September 2016, in connection with the expansion, the Company refinanced its prior 3.76% interest rate mortgage with its existing lender of this property. At the time of the refinancing, the prior amortizing loan was approximately $13,158,000 and was set to mature in January 2023. The new loan is a 12 year fully-amortizing mortgage of $25,000,000 and will mature in October 2028. The interest rate of the new loan remained the same as the prior loan at a fixed interest rate of 3.76%.
On August 1, 2016, a parking lot expansion for a property leased to FedEx Ground Package System, Inc. located in Tampa, FL was completed for a cost of approximately $1,303,000, resulting in a new 10 year lease which extended the prior lease expiration date from June 2024 throughto July 2026. In addition, the expansion resulted in an increase in annual rent effective from the date of completion of approximately $131,000 from approximately $1,493,000, or $8.74 per square foot to approximately $1,624,000, or $9.51 per square foot.
On August 1, 2016, a 14,941 square foot expansion of a building leased to FedEx Ground Package System, Inc. located in Huntsville, AL was completed for a cost of approximately $1,925,000,$1,948,000, resulting in a new 10 year lease which extended the prior lease expiration date from August 2022 throughto July 2026. In addition, the expansion resulted in an increase in annual rent effective from the date of completion of approximately $193,000 from approximately $412,000, or $5.59 per square foot, to approximately $605,000 or $6.82 per square foot.
Fiscal 2015
Acquisitions
On October 3, 2014, the Company purchased a newly constructed 163,378 square foot industrial building located in Lindale, TX, which is in the Tyler MSA. The building is 100% net-leased to FedEx Ground Package System, Inc. for ten years through June 2024. The purchase price was $10,271,355. The Company obtained a 15 year fully-amortizing mortgage of $7,000,000 at a fixed interest rate of 4.57%. Annual rental revenue over the remaining term of the lease is approximately $725,000. In connection with the acquisition, the Company completed its evaluation of the acquired lease. As a result of its evaluation, the Company allocated $341,355 to an Intangible Asset associated with the lease in-place.
On October 10, 2014, the Company purchased a newly constructed 198,773 square foot industrial building located in Sauget, IL, which is in the St. Louis, MO MSA. The building is 100% net-leased to FedEx Ground Package System, Inc. for fifteen years through May 2029. The purchase price was $15,231,000. The Company obtained a 15 year fully-amortizing mortgage of $10,660,000 at a fixed interest rate of 4.40%. Annual rental revenue over the remaining term of the lease is approximately $1,036,000. In connection with the acquisition, the Company completed its evaluation of the acquired lease. As a result of its evaluation, the Company allocated $31,000 to an Intangible Asset associated with the lease in-place.
On October 14, 2014, the Company purchased a 38,833 square foot industrial building located in Rockford, IL, which was constructed in 2012. The building is 100% net-leased to B/E Aerospace, Inc. for fifteen years through June 2027. The property was acquired, all-cash, for a purchase price of $5,200,000. Annual rental revenue over the remaining term of the lease is approximately $359,000. In connection with the acquisition, the Company completed its evaluation of the acquired lease. As a result of its evaluation, the Company allocated $100,000 to an Intangible Asset associated with the lease in-place.
On November 25, 2014, the Company purchased a newly constructed 158,417 square foot industrial building located in Kansas City, MO. The building is 100% net-leased to Bunzl Distribution Midcentral, Inc. for seven years through September 2021. The purchase price was $9,635,770. The Company obtained a 7 year mortgage, of $7,226,828, amortizing over 25 years at a fixed interest rate of 5.18%. Annual rental revenue over the remaining term of the lease is approximately $736,000. In connection with the acquisition, the Company completed its evaluation of the acquired lease. As a result of its evaluation, the Company allocated $35,770 to an Intangible Asset associated with the lease in-place.
On December 12, 2014, the Company purchased a newly constructed 599,840 square foot industrial building located in Frankfort, KY, which is in the Lexington MSA. The building is 100% net-leased to Jim Beam Brands Company for ten years through January 2025. The purchase price was $28,000,000. The Company obtained a 10 year mortgage, of $19,600,000 at a fixed interest rate of 4.84% with an amortization schedule as follows: amortizing over 18 years during the first 30 months, amortizing over 14 years during the next 30 months, amortizing over 11 years during the next 30 months and amortizing over 8 years during the final 30 months. Annual rental revenue over the remaining term of the lease is approximately $1,989,000. In connection with the acquisition, the Company completed its evaluation of the acquired lease. As a result of its evaluation, the Company has not allocated any amount to an Intangible Asset.
On February 26, 2015, the Company purchased a newly constructed 297,579 square foot industrial building located in Jacksonville, FL. The building is 100% net-leased to FedEx Ground Package System, Inc. for fifteen years through December 2029. The purchase price was $30,645,954. The Company obtained a 15 year fully-amortizing mortgage of $20,000,000 at a fixed interest rate of 3.93%. Annual rental revenue over the remaining term of the lease is approximately $1,992,000. In connection with the acquisition, the Company completed its evaluation of the acquired lease. As a result of its evaluation, the Company has not allocated any amount to an Intangible Asset.
On March 13, 2015, the Company purchased a newly constructed 232,200 square foot industrial building located in Monroe, OH, which is in the Cincinnati MSA. The building is 100% net-leased to UGN, Inc. for fifteen years through February 2030. The purchase price was $13,416,000. The Company obtained a 15 year fully-amortizing mortgage of $8,700,000 at a fixed interest rate of 3.77%. Annual rental revenue over the remaining term of the lease is approximately $1,045,000. In connection with the acquisition, the Company completed its evaluation of the acquired lease. As a result of its evaluation, the Company allocated $479,000 to an Intangible Asset associated with the lease in-place.
On May 7, 2015, the Company purchased a newly constructed 671,354 square foot industrial building located in Greenwood, IN, which is in the Indianapolis MSA. The building is 100% net-leased to ULTA, Inc. for ten years through July 2025. The purchase price was $37,484,574. The Company obtained a 15 year fully-amortizing mortgage of $24,286,230 at a fixed interest rate of 3.91%. Annual rental revenue over the remaining term of the lease is approximately $2,644,000. In connection with the acquisition, the Company completed its evaluation of the acquired lease. As a result of its evaluation, the Company has not allocated any amount to an Intangible Asset.
On August 14, 2015, the Company purchased a newly constructed 304,608 square foot industrial building located in Fort Worth, TX, in the Fort Worth Alliance Airport, which is in the Dallas MSA. The building is 100% net-leased to FedEx Ground Package System, Inc. for fifteen years through April 2030. The purchase price was $35,300,832. The Company obtained a 15 year fully-amortizing mortgage of $24,700,000 at a fixed interest rate of 3.56%. Annual rental revenue over the remaining term of the lease is approximately $2,362,000. In connection with the acquisition, the Company completed its evaluation of the acquired lease. As a result of its evaluation, the Company has not allocated any amount to an Intangible Asset.
On September 25, 2015, the Company purchased a 63,840 square foot industrial building located in Cincinnati, OH, which was constructed in 2014. The building is 100% net-leased to The American Bottling Company for fifteen years through August 2029. The lease is guaranteed by the parent company, Dr Pepper Snapple Group, Inc. The property was acquired, all-cash, for a purchase price of $6,800,000. Annual rental revenue over the remaining term of the lease is approximately $480,000. In connection with the acquisition, the Company completed its evaluation of the acquired lease. As a result of its evaluation, the Company allocated $50,000 to an Intangible Asset associated with the lease in-place.
FedEx Ground Package System, Inc.’s ultimate parent, FedEx Corporation, B/E Aerospace, Inc., ULTA Inc.’s ultimate parent, Ulta Salon, Cosmetics & Fragrance, Inc. and The American Bottling Company’s ultimate parent, Dr Pepper Snapple Group, Inc. are publicly-owned companies and financial information related to these entities is available at the SEC’s website,www.sec.gov. Jim Beam Brands Company’s ultimate parent, Suntory Beverage & Food Limited is a publicly-owned company and financial information related to this entity is available at the Tokyo Stock Exchange’s website,www.jpx.co.jp/englishand Bunzl Distribution Midcentral, Inc.’s ultimate parent, Bunzl plc is a publicly-owned company and financial information related to this entity is available at the U.K. government’s website,https://www.gov.uk/government/organisations/companies-house. The references in this report to the SEC’s website, the Tokyo Stock Exchange’s website and the U.K. government’s website are not intended to and do not include or incorporate by reference into this report the information on those websites.
Expansions
In September 2013, a 51,765 square foot expansion of a building leased to FedEx Ground Package System, Inc. located in El Paso, TX was completed for a cost of approximately $3,800,000 resulting in an increase in annual rent effective October 1, 2013 from $667,584, or $7.27 per square foot, to $1,045,610, or $7.25 per square foot. In addition, the expansion resulted in a new 10 year lease which extended the prior lease expiration date from September 2015 through September 2023. During June 2015, a parking lot expansion for the same property was completed for a cost of approximately $2,472,000 resulting in an increase in annual rent effective July 1, 2015 to $1,345,289, or $9.33 per square foot.
During December 2014, a 62,260 square foot expansion of a building leased to NF&M International, Inc. located in Monaca (Pittsburgh), PA was completed for a cost of approximately $4,503,000, resulting in a new 10 year lease which extended the prior lease expiration date from September 2018 through December 2024. In addition, the expansion resulted in an initial increase in annual rent effective January 1, 2015 from $381,805, or $3.39 per square foot, to $820,000, or $4.69 per square foot. Furthermore, annual rent will increase in year five of the lease effective January 1, 2020 to $841,600, or $4.81 per square foot, resulting in an annualized rent over the new ten year period of $830,800, or $4.75 per square foot.
During June 2015, a 38,428 square foot expansion of a building leased to FedEx Ground Package System, Inc. located in Oklahoma City, OK was completed for a cost of approximately $3,332,000, resulting in a new 10 year lease which extended the prior lease expiration date from March 2022 through June 2025. In addition, the expansion resulted in an increase in annual rent effective August 1, 2015 from $712,532, or $5.94 per square foot, to $1,048,250, or $6.62 per square foot.
During August 2015, a 48,116 square foot expansion of a building leased to FedEx Ground Package System, Inc. located in Waco, TX was completed for a cost of approximately $4,125,000, resulting in a new 10 year lease which extended the prior lease expiration date from May 2022 through August 2025. In addition, the expansion resulted in an increase in annual rent effective August 15, 2015 from $659,324, or $6.43 per square foot, to $1,078,383, or $7.16 per square foot.
Disposition
On September 18, 2015, the Company sold its 160,000 square foot industrial building located in Monroe, NC for $9,000,000, with net sale proceeds to the Company of approximately $8,847,000. The property was sold to Charlotte Pipe and Foundry Company, the tenant that was leasing the property from the Company through July 31, 2017 at an annual rental rate of approximately $571,000. The Company purchased this property in 2001 and it had a historic cost basis of approximately $5,557,000 and a net book value (net of accumulated depreciation) of approximately $3,825,000. The sale resulted in a realized gain of approximately $5,021,000, representing a 131% gain over the depreciated U.S. GAAP basis and a realized gain on a historic cost of approximately $3,290,000, representing a 59% gain over the Company’s historic cost basis.
Subsequent to the yearend, on October 27, 2016, the Company sold its only vacant building, (which increased our occupancy rate from 99.6% to 100.0%), consisting of a 59,425 square foot industrial building situated on 4.78 acres located in White Bear Lake, MN for approximately $4,272,000, which is the Company’s approximate U.S. GAAP net book carrying value.
Since the sale of these properties do not represent a strategic shift that has (or will have) a major effect on the Company’s operations and financial results, the operations generated from these properties are not included in Discontinued Operations.
The following table summarizes the operations of the Company’s 160,000 square foot industrial building located in Monroe, NC prior to its sale on September 18, 2015 and the 59,425 square foot industrial building located in White Bear Lake, MN prior to its sale on October 27, 2016 which are included in the accompanying Consolidated Statements of Income for the fiscal year ended September 30:
| 2016 | 2015 | 2014 | ||||||||||
| Rental and Reimbursement Revenue | $ | -0- | $ | 571,250 | $ | 96,664 | ||||||
| Lease Termination Income | -0- | -0- | -0- | |||||||||
| Real Estate Taxes | (115,090 | ) | (192,121 | ) | (204,729 | ) | ||||||
| Operating Expenses | (42,869 | ) | (133,776 | ) | (192,006 | ) | ||||||
| Depreciation & Amortization | (97,074 | ) | (336,939 | ) | (235,501 | ) | ||||||
| Interest Expense | -0- | (71,287 | ) | (65,876 | ) | |||||||
| Income (Loss) from Operations | (255,033 | ) | (162,873 | ) | (601,448 | ) | ||||||
| Gain on Sale of Real Estate Investment | -0- | 5,021,242 | -0- | |||||||||
| Net Income (Loss) | $ | (255,033 | ) | $ | 4,858,369 | $ | (601,448 | ) | ||||
Pro forma information (unaudited)
The following unaudited pro forma condensed financial information has been prepared utilizing the historical financial statements of the Company and the effect of additional revenue and expenses generated from the properties acquired and expanded subsequent to the fiscal yearend (see Note 17), and from the properties acquired and expanded during fiscal 2016years 2017 and 20152016, assuming that these acquisitions and these completed expansions had occurred as of October 1, 2014,2015, after giving effect to certain adjustments includingincluding: (a) Rental Revenue adjustments resulting from the straight-lining of scheduled rent increases, (b) Interest Expense resulting from the assumed increase in Fixed Rate Mortgage Notes Payable and Loans Payable related to the new acquisitions, and (c) Depreciation Expense related to the new acquisitions. As further described in Note 13, the net proceeds raised from the issuance of the 6.125% Series C Cumulative Redeemable Preferred Stock less the redemptions of the Company’s 7.625% Series A Cumulative Redeemable Preferred Stock and the Company’s 7.875% Series B Cumulative Redeemable Preferred Stock were used to help fund property acquisitions and, therefore, the pro forma preferred dividend expense has been adjusted to account for its effect on Net Income Attributable to Common Shareholders as if all the preferred stock issuances and redemptions had occurred on October 1, 2015. In addition, Net Income Attributable to Common Shareholders excludes the operating expenses incurred during fiscal 20152017 and 2016 for the one vacant property located in White Bear Lake, MN, that was sold during the first quarter of fiscal 2017, on October 27, 2016. Additionally, Net Income Attributable to Common Shareholders2016 and excludes the income generated from the one property sold in fiscal 2015three properties classified as well as the Gain on Sale of Real Estate Investment recognized from this sale during the fiscal year ended September 30, 2015.Held for Sale. Furthermore, the proceeds raised from the Dividend Reinvestment and Stock Purchase Plan (the DRIP) were used to fund property acquisitions and expansions and therefore, the weighted average shares outstanding used in calculating the Basic and Diluted Net Income per Share Attributable to Common Shareholders has been adjusted to account for the increase in shares raised through the DRIP, as if all the shares raised had occurred on October 1, 2014.2015. The unaudited pro forma condensed financial information is not indicative of the results of operations that would have been achieved had the acquisitions and expansions reflected herein been consummated on the dates indicated or that will be achieved in the future.
| Fiscal Year 2016 | Fiscal Year 2015 | |||||||
| Rental Revenues | $ | 93,397,700 | $ | 91,599,000 | ||||
| Net Income Attributable to Common Shareholders | 24,074,000 | 20,181,500 | ||||||
| Basic and Diluted Net Income per Share Attributable to Common Shareholders | $ | 0.35 | $ | 0.29 | ||||
| 124 |
Fiscal Year 2017 | Fiscal Year 2016 | |||||||
| Rental Revenues | $ | 109,953,500 | $ | 109,374,800 | ||||
| Net Income Attributable to Common Shareholders | 24,856,400 | 21,775,700 | ||||||
| Basic Net Income per Share Attributable to Common Shareholders | $ | 0.33 | $ | 0.29 | ||||
| Diluted Net Income per Share Attributable to Common Shareholders | $ | 0.33 | $ | 0.28 | ||||
NOTE 4 – INTANGIBLE ASSETS
Net intangible assets consist of the estimated value of the acquired in-place leases in-placeand the acquired above market rent leases at acquisition for the following properties and are amortized over the remaining term of the lease:
| September 30, 2016 | September 30, 2015 | September 30,2017 | September 30,2016 | |||||||||||||
| Richfield, OH (Cleveland) | $ | 11,622 | $ | 51,472 | $ | -0- | $ | 11,622 | ||||||||
| Colorado Springs, CO | -0- | 3,729 | ||||||||||||||
| Griffin, GA (Atlanta) | 19,815 | 84,665 | -0- | 19,815 | ||||||||||||
| Roanoke, VA (CHEP) | -0- | 32,217 | ||||||||||||||
| Wheeling, IL (Chicago) | -0- | 125,060 | ||||||||||||||
| Orion, MI | 19,994 | 72,976 | -0- | 19,994 | ||||||||||||
| Topeka, KS | 170,700 | 204,243 | 137,156 | 170,700 | ||||||||||||
| Carrollton, TX (Dallas) | 15,697 | 22,260 | 9,134 | 15,697 | ||||||||||||
| Ft. Mill, SC (Charlotte, NC) | 270,656 | 358,121 | 183,191 | 270,656 | ||||||||||||
| Lebanon, TN (Nashville) | 161,385 | 181,988 | 140,783 | 161,385 | ||||||||||||
| Rockford, IL | 144,817 | 164,284 | ||||||||||||||
| Rockford, IL (Sherwin-Williams Co.) | 125,349 | 144,817 | ||||||||||||||
| Edinburg, TX | 279,120 | 335,162 | 223,078 | 279,120 | ||||||||||||
| Corpus Christi, TX | 112,794 | 135,735 | 89,853 | 112,794 | ||||||||||||
| Halfmoon, NY (Albany) | 255,620 | 303,901 | 207,339 | 255,620 | ||||||||||||
| Lebanon, OH (Cincinnati) | 240,939 | 334,215 | 147,663 | 240,939 | ||||||||||||
| Olive Branch, MS (Memphis, TN)(Anda Distribution) | 1,078,458 | 1,270,266 | ||||||||||||||
| Olive Branch, MS (Memphis, TN)(Anda Pharmaceuticals, Inc.) | 886,650 | 1,078,458 | ||||||||||||||
| Livonia, MI (Detroit) | 376,306 | 444,730 | 307,882 | 376,306 | ||||||||||||
| Stewartville (Rochester), MN | 31,271 | 35,847 | ||||||||||||||
| Stewartville, MN (Rochester) | 26,695 | 31,271 | ||||||||||||||
| Buckner, KY (Louisville) | 373,690 | 395,565 | 351,816 | 373,690 | ||||||||||||
| Edwardsville, KS (Kansas City)(International Paper) | 515,819 | 590,395 | 441,243 | 515,819 | ||||||||||||
| Lindale, TX (Tyler) | 271,334 | 306,344 | 236,323 | 271,334 | ||||||||||||
| Sauget, IL (St. Louis, MO) | 26,773 | 28,886 | 24,659 | 26,773 | ||||||||||||
| Rockford, IL (B/E Aerospace) | 84,106 | 92,053 | ||||||||||||||
| Rockford, IL (Collins Aerospace Systems-United Technologies) | 76,159 | 84,106 | ||||||||||||||
| Kansas City, KS (Bunzl) | 25,546 | 30,658 | 20,434 | 25,546 | ||||||||||||
| Monroe, OH (Cincinnati) | 428,411 | 460,362 | 396,460 | 428,411 | ||||||||||||
| Cincinnati, OH | 46,407 | 50,000 | 42,814 | 46,407 | ||||||||||||
| Pittsburgh, PA | 78,615 | -0- | ||||||||||||||
| Burlington (Seattle/Everett), WA | 436,518 | -0- | ||||||||||||||
| Imperial, PA (Pittsburgh) | 70,116 | 78,615 | ||||||||||||||
| Burlington, WA (Seattle/Everett) | 406,756 | 436,518 | ||||||||||||||
| Colorado Springs, CO | 339,740 | -0- | 316,703 | 339,740 | ||||||||||||
| Total Intangible Assets, net | $ | 5,816,153 | $ | 6,115,134 | ||||||||||||
| Hamburg, NY | 232,759 | -0- | ||||||||||||||
| Ft. Myers, FL (FDX Ground) | 194,209 | -0- | ||||||||||||||
| Walker, MI (Grand Rapids) | 482,498 | -0- | ||||||||||||||
| Aiken, SC (Augusta, GA) | 916,969 | -0- | ||||||||||||||
| Mesquite, TX (Dallas) | 792,486 | -0- | ||||||||||||||
| Homestead, FL (Miami) | 551,216 | -0- | ||||||||||||||
September 30,2017 | September 30,2016 | |||||||
| Oklahoma City, OK (Bunzl Distribution Oklahoma, Inc.) | 281,110 | -0- | ||||||
| Concord, NC (Charlotte) | 623,890 | -0- | ||||||
| Kenton, OH | 487,160 | -0- | ||||||
| Stow, OH | 579,612 | -0- | ||||||
| Total Intangible Assets, net of Accumulated Amortization | $ | 10,010,165 | $ | 5,816,153 | ||||
| 125 |
Amortization expense related to thesethe intangible assets attributable to acquired in-place leases was $969,751, $1,076,776 $1,310,904 and $1,305,336$1,310,904 for the years ended September 30, 2017, 2016 2015 and 2014,2015, respectively. The Company estimates that the aggregate amortization expense for these existing intangible assets will be approximately $1,229,000, $1,186,000, $1,037,000, $1,031,000, and $880,000 for each of the fiscal years 2018, 2019, 2020, 2021 and 2022, respectively. The amount that is being amortized into rental revenue related to the intangible assets attributable to acquired above market leases was $101,968 for each of the years ended September 30, 2017, 2016 and 2015, respectively. The Company estimates that the aggregate amount that will be amortized into rental revenue for existing intangible assets will be approximately $960,000, $909,000, $866,000, $730,000 and $718,000$103,000 for each of the fiscal years 2017, 2018, 2019, 2020 and 2021 respectively.and will be approximately $34,000 for the fiscal year 2022.
NOTE 5 – SIGNIFICANT CONCENTRATIONS OF CREDIT RISK
As of September 30, 2016,2017, the Company had approximately 16,010,00018,790,000 square feet of property, of which approximately 7,584,0009,391,000 square feet, or 47%50%, consisting of fifty-three58 separate stand-alone leases, were leased to FedEx Corporation (FDX) and its subsidiaries, (6%(7% to FDX and 41%43% to FDX subsidiaries). These properties are located in twenty-four24 different states. As of September 30, 2016,2017, the only tenants that leased 5% or more of the Company’s total square footage were FDX and its subsidiaries and Milwaukee Electric Tool Corporation, which leased approximately 862,000 square feet, comprising approximately 5% of the Company’s rental space. The tenants that leased more than 5% of total rentable square footage as of September 30, 2017, 2016, 2015, and 20142015 were as follows:
| 2016 | 2015 | 2014 | 2017 | 2016 | 2015 | |||||||||||||||||||
| FDX and Subsidiaries | 47 | % | 43 | % | 44 | % | 50 | % | 47 | % | 43 | % | ||||||||||||
| Milwaukee Electric Tool Corporation (lease commenced fiscal 2013, expanded fiscal 2016) | 5 | % | N/A | 5 | % | 5 | % | 5 | % | N/A | ||||||||||||||
| ULTA, Inc. (lease commenced fiscal 2015) | N/A | 5 | % | N/A | N/A | N/A | 5 | % | ||||||||||||||||
| TreeHouse Private Brands, Inc. (lease commenced fiscal 2014) | N/A | N/A | 5 | % | ||||||||||||||||||||
During fiscal 2016,2017, the only tenant that accounted for 5% or more of our rental and reimbursement revenue was FDX (including its subsidiaries). Our rental and reimbursement revenue from FDX and its subsidiaries for the fiscal years ended September 30, 2017, 2016 2015 and 2014,2015, respectively, totaled approximately $68,151,000, $52,793,000 and $41,954,000, or 60% (7% from FDX and $35,007,000, or53% from FDX subsidiaries), 56% (7% from FDX and 49% from FDX subsidiaries), and 54% (8% from FDX and 46% from FDX subsidiaries) and 54% (10% from FDX and 44% from FDX subsidiaries), of total rent and reimbursement revenues. No other tenant accounted for 5% or more of the Company’s total Rental and Reimbursement revenue for the fiscal years ended September 30, 2017, 2016 2015 and 2014.2015.
In addition to real estate property holdings, the Company held $73,604,894$123,764,770 in marketable REIT securities at September 30, 2016,2017, representing 5.3%7.7% of the Company’s undepreciated assets (which is the Company’s total assets excluding accumulated depreciation). These liquid real estate holdings are not included in calculating the tenant concentration ratios above and therefore further enhance the Company’s diversification. As a result, theThe securities portfolio provides the Company with additional diversification, liquidity, diversification,and income, and serves as a proxy for real estate when more favorable risk adjusted returns are not available.
NOTE 6 – SECURITIES AVAILABLE FOR SALE
The Company’s securities available for sale consist primarily consist of marketable common and preferred stock securities of other REITs. The Company generally limits its investment in marketable securities to be no more than approximately 10% of its undepreciated assets (which is the Company’s total assets excluding accumulated depreciation). The Company does not own more than 10% of the outstanding shares of any of these issuers, nor does it have a controlling financial interest.
| 126 |
The Company normally holds REIT securities long termlong-term and has the ability and intent to hold these securities to recovery. The Company had total net unrealized gains on its securities portfolio of $12,942,267$6,570,565 as of September 30, 2016.2017.
The Company did not have anyheld three securities that the Company determined were temporarily impaired investments as of September 30, 2016.2017. The Company considers many factors in determining whether a security is other than temporarily impaired, including the nature of the security and the cause, severity and duration of the impairment. The following is a summary of temporarily impaired securities at September 30, 2017:
| Less than 12 Months | 12 Months or Longer | |||||||||||||||
| Unrealized | Unrealized | |||||||||||||||
| Description of Securities | Fair Value | Losses | Fair Value | Losses | ||||||||||||
| Preferred stock | $ | -0- | $ | -0- | $ | -0- | $ | -0- | ||||||||
| Common stock | 42,403,200 | (3,340,735 | ) | -0- | -0- | |||||||||||
| Total | $ | 42,403,200 | $ | (3,340,735 | ) | $ | -0- | $ | -0- | |||||||
The following is a summary of the range of losses:
| Number of Individual Securities | Fair Value | Unrealized Losses | % Loss | |||||||||
| 1 | $ | 15,585,200 | $ | (382,490 | ) | 2 | % | |||||
| 1 | 4,165,000 | (263,175 | ) | 6 | % | |||||||
| 1 | 22,653,000 | (2,695,070 | ) | 11 | % | |||||||
| 3 | $ | 42,403,200 | $ | (3,340,735 | ) | |||||||
The Company did not have anyhad $10,091,417 and $-0- margin loan balance as of September 30, 20162017 and 2015.2016. The margin loan balance if any, would beis collateralized by the securities portfolio.
Dividend income for the fiscal years ended September 30, 2017, 2016 and 2015 totaled $6,919,973, $5,607,403, and 2014 totaled $5,607,403, $3,707,498, and $3,863,136, respectively. Interest income for the fiscal years ended September 30, 2017, 2016 and 2015 totaled $10,591, $8,989 and 2014 totaled $8,989, $16,369, and $19,461, respectively.
The Company received proceeds of $17,274,946, $22,774,768 $16,201,480 and $14,279,391$16,201,480 on sales or redemptions of securities available for sale during fiscal years 2017, 2016 2015 and 2014,2015, respectively. The Company recorded the following realized Gain on Sale of Securities Transactions, net:net for the fiscal years ended September 30:
| 2016 | 2015 | 2014 | 2017 | 2016 | 2015 | |||||||||||||||||||
| Gross realized gains | $ | 4,403,724 | $ | 880,424 | $ | 2,222,424 | $ | 2,320,561 | $ | 4,403,724 | $ | 880,424 | ||||||||||||
| Gross realized losses | (5,125 | ) | (74,911 | ) | (55,658 | ) | (8,847 | ) | (5,125 | ) | (74,911 | ) | ||||||||||||
| Gains on Sale of Securities Transactions, net | $ | 4,398,599 | $ | 805,513 | $ | 2,166,766 | $ | 2,311,714 | $ | 4,398,599 | $ | 805,513 | ||||||||||||
| 127 |
The following is a listing of investments in securities at September 30, 2016:2017:
Interest Rate/ | Number of | Estimated Market | Interest Rate/ | Number of | Estimated Market | |||||||||||||||||||||||||||||||||||
| Description | Series | Dividend | Shares | Cost | Value | Series | Dividend | Shares | Cost | Value | ||||||||||||||||||||||||||||||
| Equity Securities - Preferred Stock: | ||||||||||||||||||||||||||||||||||||||||
| CBL & Associates Properties, Inc. | D | 7.375 | % | 30,000 | $ | 745,840 | $ | 750,300 | D | 7.375 | % | 200,000 | $ | 4,807,782 | $ | 4,888,000 | ||||||||||||||||||||||||
| Cedar Realty Trust, Inc. | B | 7.25 | % | 30,600 | 718,317 | 786,417 | B | 7.25 | % | 13,153 | 308,759 | 332,508 | ||||||||||||||||||||||||||||
| Chesapeake Lodging Trust | A | 7.75 | % | 20,000 | 500,000 | 518,050 | ||||||||||||||||||||||||||||||||||
| Dynex Capital, Inc. | A | 8.50 | % | 10,000 | 250,000 | 252,850 | A | 8.50 | % | 10,000 | 250,000 | 252,500 | ||||||||||||||||||||||||||||
| Investors Real Estate Trust | B | 7.95 | % | 20,000 | 500,000 | 516,000 | B | 7.95 | % | 20,000 | 500,000 | 501,796 | ||||||||||||||||||||||||||||
| iStar Financial, Inc. | D | 8.00 | % | 3,468 | 71,502 | 84,688 | D | 8.00 | % | 3,468 | 71,502 | 87,744 | ||||||||||||||||||||||||||||
| iStar Financial, Inc. | E | 7.875 | % | 3,400 | 54,116 | 83,300 | E | 7.875 | % | 3,400 | 54,116 | 85,510 | ||||||||||||||||||||||||||||
| iStar Financial, Inc. | F | 8.00 | % | 20,000 | 429,846 | 487,400 | F | 8.00 | % | 20,000 | 429,846 | 503,200 | ||||||||||||||||||||||||||||
| iStar Financial, Inc. | I | 7.50 | % | 41,383 | 872,236 | 1,005,607 | I | 7.50 | % | 41,383 | 872,236 | 1,038,713 | ||||||||||||||||||||||||||||
| Pennsylvania Real Estate Investment Trust | A | 8.25 | % | 44,000 | 1,100,885 | 1,128,380 | A | 8.25 | % | 44,000 | 1,100,885 | 1,107,040 | ||||||||||||||||||||||||||||
| Summit Hotel Properties, Inc. | B | 7.875 | % | 10,000 | 250,000 | 263,081 | B | 7.875 | % | 10,000 | 250,000 | 255,617 | ||||||||||||||||||||||||||||
| UMH Properties, Inc. (1) | A | 8.25 | % | 200,000 | 5,000,000 | 5,138,000 | B | 8.00 | % | 100,000 | 2,500,000 | 2,766,000 | ||||||||||||||||||||||||||||
| UMH Properties, Inc. (1) | B | 8.00 | % | 100,000 | 2,500,000 | 2,755,000 | ||||||||||||||||||||||||||||||||||
| Total Equity Securities - Preferred Stock | $ | 12,992,742 | $ | 13,769,073 | $ | 11,145,126 | $ | 11,818,628 | ||||||||||||||||||||||||||||||||
Number of | Estimated Market | Number of | Estimated Market | |||||||||||||||||||||||||
| Description | Shares | Cost | Value | Shares | Cost | Value | ||||||||||||||||||||||
| Equity Securities - Common Stock: | ||||||||||||||||||||||||||||
| Gladstone Commercial Corporation | 65,000 | $ | 1,102,608 | $ | 1,210,950 | |||||||||||||||||||||||
| CBL & Associates | 2,700,000 | $ | 25,348,070 | $ | 22,653,000 | |||||||||||||||||||||||
| Franklin Street Properties | 250,000 | 2,511,460 | 2,655,000 | |||||||||||||||||||||||||
| Government Properties Income Trust | 700,000 | 12,585,316 | 15,834,000 | 1,070,000 | 19,295,940 | 20,083,900 | ||||||||||||||||||||||
| Pennsylvania Real Estate Investment Trust | 100,000 | 1,028,213 | 1,049,000 | |||||||||||||||||||||||||
| Select Income REIT | 586,500 | 13,112,908 | 15,776,850 | 620,000 | 13,907,816 | 14,520,400 | ||||||||||||||||||||||
| Senior Housing Property Trust | 670,000 | 11,558,116 | 15,215,700 | 700,000 | 12,325,801 | 13,685,000 | ||||||||||||||||||||||
| VEREIT, Inc. | 1,880,000 | 15,967,690 | 15,585,200 | |||||||||||||||||||||||||
| Washington Prime Group, Inc. | 500,000 | 4,428,175 | 4,165,000 | |||||||||||||||||||||||||
| UMH Properties, Inc. (1) | 989,326 | 9,305,685 | 11,792,771 | 1,128,315 | 11,231,851 | 17,545,306 | ||||||||||||||||||||||
| Total Equity Securities - Common Stock | $ | 47,664,633 | $ | 59,830,271 | $ | 106,045,016 | $ | 111,941,806 | ||||||||||||||||||||
Interest Rate/ | Number of | Estimated Market | ||||||||||||||||||||||||||
| Dividend | Shares | Cost | Value | |||||||||||||||||||||||||
| Modified Pass-Through Mortgage-Backed Securities: | ||||||||||||||||||||||||||||
| Government National Mortgage Association (GNMA) | 6.50 | % | 500,000 | $ | 5,252 | $ | 5,550 | |||||||||||||||||||||
| Total Securities Available for Sale | $ | 60,662,627 | $ | 73,604,894 | ||||||||||||||||||||||||
| Interest Rate/ | Number of | Estimated Market | ||||||||||||||
| Dividend | Shares | Cost | Value | |||||||||||||
| Modified Pass-Through Mortgage-Backed Securities: | ||||||||||||||||
| Government National Mortgage Association (GNMA) | 6.50 | % | 500,000 | $ | 4,063 | $ | 4,336 | |||||||||
| Total Securities Available for Sale | $ | 117,194,205 | $ | 123,764,770 | ||||||||||||
(1) Investment is in a related company. See Note No. 11 for further discussion.
| 128 |
The following is a listing of investments in securities at September 30, 2015:2016:
Interest Rate/ | Number of | Estimated Market | ||||||||||||||||||||||||||||||||||||||
| Description | Series | Dividend | Shares | Cost | Value | Series | Interest Rate/ Dividend | Number Of Shares | Cost | Estimated Market Value | ||||||||||||||||||||||||||||||
| Equity Securities - Preferred Stock: | ||||||||||||||||||||||||||||||||||||||||
| Campus Crest Communities, Inc. | A | 8.00 | % | 10,000 | $ | 250,000 | $ | 243,300 | ||||||||||||||||||||||||||||||||
| CBL & Associates Properties, Inc. | D | 7.375 | % | 30,000 | 745,840 | 750,900 | D | 7.375 | % | 30,000 | $ | 745,840 | $ | 750,300 | ||||||||||||||||||||||||||
| Cedar Realty Trust, Inc. | B | 7.25 | % | 30,600 | 718,317 | 727,975 | B | 7.25 | % | 30,600 | 718,317 | 786,417 | ||||||||||||||||||||||||||||
| Chesapeake Lodging Trust | A | 7.75 | % | 20,000 | 500,000 | 520,000 | A | 7.75 | % | 20,000 | 500,000 | 518,050 | ||||||||||||||||||||||||||||
| Condor Hospitality | A | 8.00 | % | 17,000 | 170,005 | 108,800 | ||||||||||||||||||||||||||||||||||
| Corporate Office Properties Trust | L | 7.375 | % | 26,688 | 658,957 | 680,544 | ||||||||||||||||||||||||||||||||||
| Dynex Capital, Inc. | A | 8.50 | % | 10,000 | 250,000 | 241,000 | A | 8.50 | % | 10,000 | 250,000 | 252,850 | ||||||||||||||||||||||||||||
| EPR Properties | F | 6.625 | % | 15,000 | 352,908 | 369,750 | ||||||||||||||||||||||||||||||||||
| General Growth Properties, Inc. | A | 6.375 | % | 4,636 | 107,852 | 112,469 | ||||||||||||||||||||||||||||||||||
| Grace Acquisitions I | B | 8.75 | % | 29,000 | 3,480 | 696,000 | ||||||||||||||||||||||||||||||||||
| Investors Real Estate Trust | B | 7.95 | % | 20,000 | 500,000 | 515,200 | B | 7.95 | % | 20,000 | 500,000 | 516,000 | ||||||||||||||||||||||||||||
| iStar Financial, Inc. | D | 8.00 | % | 3,468 | 71,502 | 83,406 | D | 8.00 | % | 3,468 | 71,502 | 84,688 | ||||||||||||||||||||||||||||
| iStar Financial, Inc. | E | 7.875 | % | 3,400 | 54,116 | 80,410 | E | 7.875 | % | 3,400 | 54,116 | 83,300 | ||||||||||||||||||||||||||||
| iStar Financial, Inc. | F | 8.00 | % | 20,000 | 429,846 | 470,200 | F | 8.00 | % | 20,000 | 429,846 | 487,400 | ||||||||||||||||||||||||||||
| iStar Financial, Inc. | I | 7.50 | % | 41,383 | 872,236 | 953,464 | I | 7.50 | % | 41,383 | 872,236 | 1,005,607 | ||||||||||||||||||||||||||||
| Kilroy Realty Corporation | H | 6.375 | % | 23,016 | 547,953 | 575,142 | ||||||||||||||||||||||||||||||||||
| Pennsylvania Real Estate Investment Trust | A | 8.25 | % | 44,000 | 1,100,885 | 1,150,600 | ||||||||||||||||||||||||||||||||||
| Pennsylvania Real Estate Investment Trust | B | 7.375 | % | 30,455 | 760,911 | 772,034 | A | 8.25 | % | 44,000 | 1,100,885 | 1,128,380 | ||||||||||||||||||||||||||||
| Summit Hotel Properties, Inc. | B | 7.875 | % | 10,000 | 250,000 | 260,000 | B | 7.875 | % | 10,000 | 250,000 | 263,081 | ||||||||||||||||||||||||||||
| Sun Communities, Inc. | A | 7.125 | % | 20,000 | 500,000 | 514,800 | ||||||||||||||||||||||||||||||||||
| UMH Properties, Inc. (1) | A | 8.25 | % | 200,000 | 5,000,000 | 5,138,000 | ||||||||||||||||||||||||||||||||||
| UMH Properties, Inc. (1) | A | 8.25 | % | 200,000 | 5,000,000 | 5,136,000 | B | 8.00 | % | 100,000 | 2,500,000 | 2,755,000 | ||||||||||||||||||||||||||||
| Total Equity Securities - Preferred Stock | $ | 13,844,808 | $ | 14,961,994 | $ | 12,992,742 | $ | 13,769,073 | ||||||||||||||||||||||||||||||||
Number of | Estimated Market | |||||||||||||||||||||||||||
| Description | Shares | Cost | Value | Number Shares | Cost | Estimated
| ||||||||||||||||||||||
| Equity Securities - Common Stock: | ||||||||||||||||||||||||||||
| Getty Realty Corporation | 50,000 | $ | 997,632 | $ | 790,000 | |||||||||||||||||||||||
| Gladstone Commercial Corporation | 65,000 | 1,102,608 | 917,150 | 65,000 | $ | 1,102,608 | $ | 1,210,950 | ||||||||||||||||||||
| Government Properties Income Trust | 579,000 | 11,572,547 | 9,264,000 | 700,000 | 12,585,316 | 15,834,000 | ||||||||||||||||||||||
| Mack-Cali Realty Corporation | 130,000 | 3,039,545 | 2,454,400 | |||||||||||||||||||||||||
| Select Income REIT | 586,500 | 13,247,860 | 11,149,365 | 586,500 | 13,112,908 | 15,776,850 | ||||||||||||||||||||||
| Senior Housing Property Trust | 402,300 | 7,643,503 | 6,517,260 | 670,000 | 11,558,116 | 15,215,700 | ||||||||||||||||||||||
| UMH Properties, Inc. (1) | 911,871 | 8,528,097 | 8,480,399 | 989,326 | 9,305,685 | 11,792,771 | ||||||||||||||||||||||
| Total Equity Securities - Common Stock | $ | 46,131,792 | $ | 39,572,574 | $ | 47,664,633 | $ | 59,830,271 | ||||||||||||||||||||
Interest Rate/ | Number of | Estimated Market | ||||||||||||||||||||||||||
| Dividend | Shares | Cost | Value | |||||||||||||||||||||||||
| Modified Pass-Through Mortgage-Backed Securities: | ||||||||||||||||||||||||||||
| Government National Mortgage Association (GNMA) | 6.50 | % | 500,000 | $ | 6,240 | $ | 6,669 | |||||||||||||||||||||
| Total Securities Available for Sale | $ | 59,982,840 | $ | 54,541,237 | ||||||||||||||||||||||||
Interest Rate/ Dividend | Number Shares | Cost | Estimated Market Value | |||||||||||||
| Modified Pass-Through Mortgage-Backed Securities: | ||||||||||||||||
| Government National Mortgage Association (GNMA) | 6.50 | % | 500,000 | $ | 5,252 | $ | 5,550 | |||||||||
| Total Securities Available for Sale | $ | 60,662,627 | $ | 73,604,894 | ||||||||||||
(1) Investment is in a related company. See Note No. 11 for further discussion.
| (1) | Investment is in a related company. See Note No. 11 for further discussion. |
| 129 |
NOTE 7- MORTGAGE NOTES AND LOANS PAYABLE
Mortgage Notes Payable:
Mortgage Notes Payable represents the principal amounts outstanding as of September 30, 2016.2017. Interest is payable on these mortgages at fixed rates ranging from 3.45% to 7.60%, with a weighted average interest rate of 4.48%4.18%. This compares to a weighted average interest rate of 4.85%4.48% as of September 30, 2015.2016. As of September 30, 2016,2017, the weighted average loan maturity of the Mortgage Notes Payable was 10.511.6 years. This compares to a weighted average loan maturity of the Mortgage Notes Payable of 9.010.5 years as of September 30, 2015.2016.
As described in Note 3, during fiscal year ended September 30, 2016,2017, the Company entered into eight10 mortgages totaling $141,586,000$188,809,000 in connection with the acquisitions of properties in Hamburg (Buffalo), NY; Ft. Myers, FL; Walker (Grand Rapids), MI; Mesquite (Dallas), TX; Aiken (Augusta, GA), SC; Homestead (Miami), FL; Oklahoma City, OK; Concord (Charlotte), NC, Covington (New Orleans), LA, Imperial (Pittsburgh), PA, Burlington (Seattle/Everett), WA, Colorado Springs, CO, Louisville, KY, Davenport (Orlando), FLNC; Kenton, OH and Olathe (Kansas City), KS. In addition, also described in Note 3, in connection with the 246,434 square foot expansion of the Company’s property located in Olive Branch, MS (Memphis, TN), the Company refinanced its prior 3.76% interest rate mortgage with its existing lender of this property. At the time of the refinancing, the prior amortizing loan was approximately $13,158,000 and was set to mature in January 2023. The new loan is a 12 year fully-amortizing mortgage of $25,000,000 and will mature in October 2028. The interest rate of the new loan remained the same as the prior loan at a fixed interest rate of 3.76%.Stow, OH.
During the fiscal year ended September 30, 2016, the Company repaid the mortgages on Beltsville, MD; Granite City, IL; Griffin, GA and Wheeling, IL amounting to $14,739,654 at the time they were repaid. In addition,2017, the Company fully repaid 16 mortgage loans associated with 15 of its fully amortized mortgage on its propertyproperties located in St. Joseph, MO.Jacksonville, FL; El Paso, TX; Lebanon (Cincinnati), OH; Halfmoon (Albany), NY; Bedford Heights (Cleveland), OH; Hanahan (Charleston), SC; Elgin (Chicago), IL; Kansas City, MO; Chattanooga, TN; Roanoke, VA; Orion, MI; Edwardsville, KS; Punta Gorda, FL; Cheektowaga (Buffalo), NY and Cocoa, FL, totaling approximately $40,037,000.
The following is a summary of our Fixed Rate Mortgage Notes Payable as of September 30, 2017 and 2016:
| 9/30/2017 | 9/30/2016 | |||||||||||||||
| Amount | Weighted Average Interest Rate(1) | Amount | Weighted Average Interest Rate (1) | |||||||||||||
| Fixed Rate Mortgage Notes Payable | $ | 598,962,567 | 4.18 | % | $ | 483,748,153 | 4.48 | % | ||||||||
| Debt Issuance Costs | $ | 10,597,083 | $ | 9,424,697 | ||||||||||||
| Accumulated Amortization of Debt Issuance Costs | (2,998,887 | ) | (3,152,554 | ) | ||||||||||||
| Unamortized Debt Issuance Costs | $ | 7,598,196 | $ | 6,272,143 | ||||||||||||
| Fixed Rate Mortgage Notes Payable, net of Unamortized Debt Issuance Costs | $ | 591,364,371 | $ | 477,476,010 | ||||||||||||
| (1) | Weighted average interest rate excludes amortization of debt issuance costs. |
| 130 |
The following is a summary of mortgage notes payable by property at September 30, 20162017 and 2015:2016:
Property | Fixed Rate | Maturity Date | Balance 9/30/16 | Balance 9/30/15 | ||||||||||||
| St. Joseph, MO | 8.12 | % | 03/01/16 | $ | -0- | $ | 417,435 | |||||||||
| Beltsville, MD (Washington, DC) | 7.53 | % | 05/01/16 | -0- | 419,505 | |||||||||||
| Beltsville, MD (Washington, DC) | 5.25 | % | 05/01/16 | -0- | 4,745,219 | |||||||||||
| Wheeling, IL (Chicago) | 5.68 | % | 09/05/16 | -0- | 3,457,456 | |||||||||||
| Griffin, GA (Atlanta) | 6.37 | % | 10/01/16 | -0- | 7,026,763 | |||||||||||
| Granite City, IL (St. Louis, MO) | 7.11 | % | 11/01/16 | -0- | 1,151,798 | |||||||||||
| Jacksonville, FL (FDX) | (1) | 6.92 | % | 12/01/16 | 84,194 | 406,962 | ||||||||||
| Jacksonville, FL (FDX) | (1)(2) | 6.00 | % | 12/01/16 | 1,300,000 | 1,300,000 | ||||||||||
| El Paso, TX | 5.50 | % | 01/05/17 | 3,259,726 | 3,611,052 | |||||||||||
| Bedford Heights, OH (Cleveland) | 5.96 | % | 04/01/17 | 2,685,791 | 2,862,734 | |||||||||||
| Chattanooga, TN | 5.96 | % | 05/01/17 | 1,551,081 | 1,774,568 | |||||||||||
| Elgin, IL (Chicago) | 6.97 | % | 05/01/17 | 349,658 | 844,690 | |||||||||||
| Hanahan, SC (Charleston) (SAIC) | 7.36 | % | 05/01/17 | 5,605,514 | 5,939,583 | |||||||||||
| Roanoke, VA | 5.96 | % | 05/30/17 | 2,519,243 | 2,819,927 | |||||||||||
| Edwardsville, KS (Kansas City)(Carlisle Tire) | 7.38 | % | 07/01/17 | 397,513 | 894,552 | |||||||||||
| Kansas City, MO (Kellogg) | 6.11 | % | 08/01/17 | 2,241,680 | 2,381,917 | |||||||||||
| Orion, MI | 6.57 | % | 09/01/17 | 8,580,058 | 9,095,386 | |||||||||||
| Cheektowaga, NY (Buffalo) | 6.78 | % | 10/01/17 | 343,548 | 639,095 | |||||||||||
| Punta Gorda, FL | 6.29 | % | 10/01/17 | 1,990,764 | 2,111,294 | |||||||||||
| Cocoa, FL | 6.29 | % | 12/01/17 | 5,063,864 | 5,364,157 | |||||||||||
| Richfield, OH (Cleveland) | 5.22 | % | 01/01/18 | 3,078,731 | 3,414,645 | |||||||||||
| Tampa, FL (FDX) | 5.65 | % | 04/01/18 | 3,900,447 | 4,132,523 | |||||||||||
| West Chester Twp., OH (Cincinnati) | 6.80 | % | 06/01/18 | 2,071,107 | 2,305,050 | |||||||||||
| Orlando, FL | 6.56 | % | 10/01/18 | 4,342,604 | 4,570,915 | |||||||||||
| Tampa, FL (FDX Ground) | 6.00 | % | 03/01/19 | 6,633,049 | 7,313,195 | |||||||||||
| Lebanon, OH (Cincinnati) | (3) | 5.55 | % | 05/01/19 | 2,592,182 | 2,695,845 | ||||||||||
| Lebanon, TN (Nashville) | 7.60 | % | 07/10/19 | 7,659,116 | 7,856,077 | |||||||||||
Property | Fixed Rate | Maturity Date | Balance 9/30/17 | Balance 9/30/16 | ||||||||||||||||
| Jacksonville, FL (FDX) | 6.92 | % | 12/01/16 | $ | -0- | $ | 84,194 | |||||||||||||
| Jacksonville, FL (FDX) | 6.00 | % | 12/01/16 | -0- | 1,300,000 | |||||||||||||||
| El Paso, TX | 5.50 | % | 01/05/17 | -0- | 3,259,726 | |||||||||||||||
| Bedford Heights, OH (Cleveland) | 5.96 | % | 04/01/17 | -0- | 2,685,791 | |||||||||||||||
| Chattanooga, TN | 5.96 | % | 05/01/17 | -0- | 1,551,081 | |||||||||||||||
| Elgin, IL (Chicago) | 6.97 | % | 05/01/17 | -0- | 349,658 | |||||||||||||||
| Hanahan, SC (Charleston) (SAIC) | 7.36 | % | 05/01/17 | -0- | 5,605,514 | |||||||||||||||
| Roanoke, VA (CHEP USA) | 5.96 | % | 05/01/17 | -0- | 2,519,243 | |||||||||||||||
| Edwardsville, KS (Kansas City)(Carlisle Tire) | 7.38 | % | 07/01/17 | -0- | 397,513 | |||||||||||||||
| Kansas City, MO (Kellogg) | 6.11 | % | 08/01/17 | -0- | 2,241,680 | |||||||||||||||
| Orion, MI | 6.57 | % | 09/01/17 | -0- | 8,580,058 | |||||||||||||||
| Cheektowaga, NY (Buffalo) | (1 | ) | 6.78 | % | 10/01/17 | -0- | 343,548 | |||||||||||||
| Punta Gorda, FL | (1 | ) | 6.29 | % | 10/01/17 | -0- | 1,990,764 | |||||||||||||
| Cocoa, FL | (1 | ) | 6.29 | % | 12/01/17 | -0- | 5,063,864 | |||||||||||||
| Richfield, OH (Cleveland) | 5.22 | % | 01/01/18 | 2,724,856 | 3,078,731 | |||||||||||||||
| Tampa, FL (FDX) | 5.65 | % | 04/01/18 | 3,654,913 | 3,900,447 | |||||||||||||||
| West Chester Twp., OH (Cincinnati) | 6.80 | % | 06/01/18 | 1,820,753 | 2,071,107 | |||||||||||||||
| Orlando, FL | 6.56 | % | 10/01/18 | 4,098,856 | 4,342,604 | |||||||||||||||
| Tampa, FL (FDX Ground) | 6.00 | % | 03/01/19 | 5,910,953 | 6,633,049 | |||||||||||||||
| Lebanon, OH (Cincinnati) | (1 | ) | 5.55 | % | 05/01/19 | -0- | 2,592,182 | |||||||||||||
| Lebanon, TN (Nashville) | 7.60 | % | 07/10/19 | 7,446,653 | 7,659,116 | |||||||||||||||
| Ft. Mill, SC (Charlotte, NC) | 7.00 | % | 10/10/19 | 1,346,845 | 1,926,986 | |||||||||||||||
| Denver, CO | 6.07 | % | 11/01/19 | 746,617 | 1,059,646 | |||||||||||||||
| Hanahan, SC (Charleston)(FDX Ground) | 5.54 | % | 01/21/20 | 773,234 | 1,064,185 | |||||||||||||||
| Augusta, GA (FDX Ground) | 5.54 | % | 02/01/20 | 562,454 | 774,093 | |||||||||||||||
| Huntsville, AL | 5.50 | % | 03/01/20 | 589,073 | 795,594 | |||||||||||||||
| Colorado Springs, CO | 5.41 | % | 01/01/21 | 1,043,704 | 1,329,709 | |||||||||||||||
| Topeka, KS | 6.50 | % | 08/10/21 | 1,119,836 | 1,363,023 | |||||||||||||||
| Streetsboro, OH (Cleveland) | 5.50 | % | 11/01/21 | 9,887,817 | 10,446,469 | |||||||||||||||
| Kansas City, MO (Bunzl) | 5.18 | % | 12/01/21 | 6,799,803 | 6,958,091 | |||||||||||||||
| Olive Branch, MS (Memphis, TN)(Anda Pharmaceuticals, Inc.) | 4.80 | % | 04/01/22 | 8,171,480 | 8,750,368 | |||||||||||||||
| Waco, TX | 4.75 | % | 08/01/22 | 4,524,045 | 4,799,919 | |||||||||||||||
| Houston, TX | 6.88 | % | 09/10/22 | 2,619,835 | 3,124,904 | |||||||||||||||
| Tolleson, AZ (Phoenix) | 3.95 | % | 11/01/22 | 4,525,118 | 5,299,383 | |||||||||||||||
| Edwardsville, KS (Kansas City)(International Paper) | 3.45 | % | 11/01/23 | 9,931,292 | 10,648,115 | |||||||||||||||
| Spring, TX (Houston) | 4.01 | % | 12/01/23 | 8,537,878 | 9,126,834 | |||||||||||||||
| Memphis, TN | 4.50 | % | 01/01/24 | 5,882,668 | 6,667,886 | |||||||||||||||
| Oklahoma City, OK (FDX Ground) | 4.35 | % | 07/01/24 | 3,919,663 | 4,401,832 | |||||||||||||||
| Indianapolis, IN | 4.00 | % | 09/01/24 | 11,381,906 | 12,289,676 | |||||||||||||||
| Frankfort, KY (Lexington) | 4.84 | % | 12/15/24 | 17,560,855 | 18,352,289 | |||||||||||||||
| Carrollton, TX (Dallas) | 6.75 | % | 02/01/25 | 7,233,486 | 7,960,781 | |||||||||||||||
| Altoona, PA | (2 | ) | 4.00 | % | 10/01/25 | 3,642,839 | 4,017,147 | |||||||||||||
| Green Bay, WI | (2 | ) | 4.00 | % | 10/01/25 | 2,956,605 | 3,260,401 | |||||||||||||
| Stewartville, MN (Rochester) | (2 | ) | 4.00 | % | 10/01/25 | 2,369,334 | 2,612,978 | |||||||||||||
| Carlstadt, NJ (New York, NY) | 5.25 | % | 05/15/26 | 1,743,353 | 1,898,198 | |||||||||||||||
| Roanoke, VA (FDX Ground) | 3.84 | % | 07/01/26 | 4,867,194 | 5,321,390 | |||||||||||||||
| Livonia, MI (Detroit) | 4.45 | % | 12/01/26 | 6,912,375 | 7,503,400 | |||||||||||||||
| Olive Branch, MS (Memphis, TN)(Milwaukee Tool) | 3.76 | % | 10/01/28 | 23,461,936 | 25,000,000 | |||||||||||||||
| Tulsa, OK | 4.58 | % | 11/01/28 | 1,812,575 | 1,934,175 | |||||||||||||||
| Oklahoma City, OK (Bunzl) | 4.13 | % | 07/01/29 | 5,935,346 | -0- | |||||||||||||||
| Lindale, TX (Tyler) | 4.57 | % | 11/01/29 | 6,016,758 | 6,378,382 | |||||||||||||||
| Sauget, IL (St. Louis, MO) | 4.40 | % | 11/01/29 | 9,145,097 | 9,701,419 | |||||||||||||||
| Jacksonville, FL (FDX Ground) | 3.93 | % | 12/01/29 | 17,370,102 | 18,453,112 | |||||||||||||||
| Imperial, PA (Pittsburgh) | 3.63 | % | 04/01/30 | 11,963,800 | 12,700,739 | |||||||||||||||
| 131 |
Property | Fixed Rate | Maturity Date | Balance 9/30/16 | Balance 9/30/15 | ||||||||||||
| Ft. Mill, SC (Charlotte, NC) | 7.00 | % | 10/10/19 | $ | 1,926,986 | $ | 2,468,015 | |||||||||
| Denver, CO | 6.07 | % | 11/01/19 | 1,059,646 | 1,354,284 | |||||||||||
| Hanahan, SC (Charleston) (FDX Ground) | 5.54 | % | 01/21/20 | 1,064,185 | 1,339,490 | |||||||||||
| Augusta, GA (FDX Ground) | 5.54 | % | 02/01/20 | 774,093 | 974,351 | |||||||||||
| Huntsville, AL | 5.50 | % | 03/01/20 | 795,594 | 991,088 | |||||||||||
| Colorado Springs, CO | 5.41 | % | 01/01/21 | 1,329,709 | 1,600,686 | |||||||||||
| Topeka, KS | 6.50 | % | 08/10/21 | 1,363,023 | 1,590,945 | |||||||||||
| Streetsboro, OH (Cleveland) | 5.50 | % | 11/01/21 | 10,446,469 | 10,972,757 | |||||||||||
| Kansas City, MO (Bunzl) | 5.18 | % | 12/01/21 | 6,958,091 | 7,107,312 | |||||||||||
| Olive Branch, MS (Memphis, TN) (Anda Distribution) | 4.80 | % | 04/01/22 | 8,750,368 | 9,302,178 | |||||||||||
| Waco, TX | 4.75 | % | 08/01/22 | 4,799,919 | 5,063,021 | |||||||||||
| Houston, TX | 6.88 | % | 09/10/22 | 3,124,904 | 3,531,824 | |||||||||||
| Tolleson, AZ (Phoenix) | 3.95 | % | 11/01/22 | 5,299,383 | 6,043,710 | |||||||||||
| Edwardsville, KS (Kansas City) (International Paper) | 3.45 | % | 11/01/23 | 10,648,115 | 11,340,664 | |||||||||||
| Spring, TX (Houston) | 4.01 | % | 12/01/23 | 9,126,834 | 9,692,678 | |||||||||||
| Memphis, TN | 4.50 | % | 01/01/24 | 6,667,886 | 7,418,616 | |||||||||||
| Oklahoma City, OK | 4.35 | % | 07/01/24 | 4,401,832 | 4,863,512 | |||||||||||
| Indianapolis, IN | 4.00 | % | 09/01/24 | 12,289,676 | 13,161,911 | |||||||||||
| Frankfort, KY (Lexington) | 4.84 | % | 12/15/24 | 18,352,289 | 19,078,153 | |||||||||||
| Carrollton, TX (Dallas) | 6.75 | % | 02/01/25 | 7,960,781 | 8,640,732 | |||||||||||
| Altoona, PA | (4) | 4.00 | % | 10/01/25 | 4,017,147 | 4,376,801 | ||||||||||
| Green Bay, WI | (4) | 4.00 | % | 10/01/25 | 3,260,401 | 3,552,304 | ||||||||||
| Stewartville, MN (Rochester) | (4) | 4.00 | % | 10/01/25 | 2,612,978 | 2,846,710 | ||||||||||
| Carlstadt, NJ (New York, NY) | 5.25 | % | 05/15/26 | 1,898,198 | 2,045,141 | |||||||||||
| Roanoke, VA (FDX Ground) | 3.84 | % | 07/01/26 | 5,321,390 | 5,758,502 | |||||||||||
| Livonia, MI (Detroit) | 4.45 | % | 12/01/26 | 7,503,400 | 8,068,751 | |||||||||||
| Olive Branch, MS (Memphis, TN) (Milwaukee Tool) | (5) | 3.76 | % | 10/01/28 | 25,000,000 | 14,312,846 | ||||||||||
| Tulsa, OK | 4.58 | % | 11/01/28 | 1,934,175 | 2,050,342 | |||||||||||
| Lindale, TX (Tyler) | 4.57 | % | 11/01/29 | 6,378,382 | 6,723,881 | |||||||||||
| Sauget, IL (St. Louis, MO) | 4.40 | % | 11/01/29 | 9,701,419 | 10,233,837 | |||||||||||
| Jacksonville, FL (FDX Ground) | 3.93 | % | 12/01/29 | 18,453,112 | 19,494,453 | |||||||||||
| Imperial, PA (Pittsburgh) | 3.63 | % | 04/01/30 | 12,700,739 | -0- | |||||||||||
| Monroe, OH (Cincinnati) | 3.77 | % | 04/01/30 | 8,071,987 | 8,518,754 | |||||||||||
| Indianapolis, IN (Ulta) | 3.91 | % | 06/01/30 | 22,760,488 | 23,987,008 | |||||||||||
| Fort Worth, TX (Dallas) | 3.56 | % | 09/01/30 | 23,431,093 | 24,700,000 | |||||||||||
| Concord, NC (Charlotte) | 3.87 | % | 12/01/30 | 20,001,944 | -0- | |||||||||||
| Covington, LA (New Orleans) | 4.08 | % | 01/01/31 | 12,468,713 | -0- | |||||||||||
| Burlington, WA (Seattle/Everett) | 3.67 | % | 05/01/31 | 19,881,817 | -0- | |||||||||||
| Louisville, KY | 3.74 | % | 07/01/31 | 7,288,891 | -0- | |||||||||||
| Colorado Springs, CO | 3.90 | % | 07/01/31 | 18,576,282 | -0- | |||||||||||
| Davenport, FL (Orlando) | 3.89 | % | 09/01/31 | 26,400,000 | -0- | |||||||||||
| Olathe, KS (Kansas City) | 3.96 | % | 09/01/31 | 22,215,000 | -0- | |||||||||||
| Buckner, KY (Louisville) | 4.17 | % | 11/01/33 | 16,694,846 | 17,347,243 | |||||||||||
| Halfmoon, NY (Albany) | (6) | 5.25 | % | 01/13/37 | 3,786,098 | 3,886,331 | ||||||||||
| Total Mortgage Notes Payable | $ | 483,748,153 | $ | 373,991,174 | ||||||||||||
Property | Fixed | Maturity | Balance 9/30/17 | Balance 9/30/16 | |||||||||||||
| Monroe, OH (Cincinnati) | 3.77 | % | 04/01/30 | $ | 7,608,083 | $ | 8,071,987 | ||||||||||
| Greenwood, IN (Indianapolis) | 3.91 | % | 06/01/30 | 21,485,141 | 22,760,488 | ||||||||||||
| Ft. Worth, TX (Dallas) | 3.56 | % | 09/01/30 | 22,116,268 | 23,431,093 | ||||||||||||
| Concord, NC (Charlotte) | 3.87 | % | 12/01/30 | 18,928,835 | 20,001,944 | ||||||||||||
| Covington, LA (New Orleans) | 4.08 | % | 01/01/31 | 11,814,941 | 12,468,713 | ||||||||||||
| Burlington, WA (Seattle/Everett) | 3.67 | % | 05/01/31 | 18,839,050 | 19,881,817 | ||||||||||||
| Louisville, KY | 3.74 | % | 07/01/31 | 6,914,142 | 7,288,891 | ||||||||||||
| Colorado Springs, CO | 3.90 | % | 07/01/31 | 17,632,728 | 18,576,282 | ||||||||||||
| Davenport, FL (Orlando) | 3.89 | % | 09/01/31 | 25,077,642 | 26,400,000 | ||||||||||||
| Olathe, KS (Kansas City) | 3.96 | % | 09/01/31 | 21,108,249 | 22,215,000 | ||||||||||||
| Hamburg, NY (Buffalo) | 4.03 | % | 11/01/31 | 22,532,881 | -0- | ||||||||||||
| Ft. Myers, FL (FDX Ground) | 3.97 | % | 01/01/32 | 14,021,964 | -0- | ||||||||||||
| Walker, MI (Grand Rapids) | 3.86 | % | 05/01/32 | 20,530,135 | -0- | ||||||||||||
| Mesquite, TX (Dallas) | 3.60 | % | 07/01/32 | 32,623,355 | -0- | ||||||||||||
| Aiken, SC (Augusta, GA) | 4.20 | % | 07/01/32 | 15,227,062 | -0- | ||||||||||||
| Homestead, FL (Miami) | 3.60 | % | 07/01/32 | 24,591,465 | -0- | ||||||||||||
| Concord, NC (Charlotte) | 3.80 | % | 09/01/32 | 26,184,000 | -0- | ||||||||||||
| Kenton, OH | 4.45 | % | 10/01/32 | 12,000,000 | -0- | ||||||||||||
| Stow, OH | 4.17 | % | 10/01/32 | 12,700,000 | -0- | ||||||||||||
| Buckner, KY (Louisville) | 4.17 | % | 11/01/33 | 16,014,719 | 16,694,846 | ||||||||||||
| Halfmoon, NY (Albany) | (1) | 5.25 | % | 01/13/37 | -0- | 3,786,098 | |||||||||||
| Total Mortgage Notes Payable | $ | 598,962,567 | $ | 483,748,153 | |||||||||||||
(1) Loan was prepaid in full during fiscal 2017.
(2) One loan is secured by Altoona, PA, Green Bay, WI and Stewartville (Rochester), MN.
Principal on the foregoing debt at September 30, 20162017 is scheduled to be paid as follows:
| Year Ending September 30, | 2017 | $ | 57,791,871 | |||
| 2018 | 43,879,833 | |||||
| 2019 | 47,464,988 | |||||
| 2020 | 28,808,574 | |||||
| 2021 | 29,255,776 | |||||
| Thereafter | 276,547,111 | |||||
| $ | 483,748,153 |
| Year Ending September 30, | 2018 | $ | 47,115,220 | |||||
| 2019 | 55,601,883 | |||||||
| 2020 | 39,722,075 | |||||||
| 2021 | 40,598,551 | |||||||
| 2022 | 61,945,863 | |||||||
| Thereafter | 353,978,975 | |||||||
| $ | 598,962,567 |
The above table does not include a fifteen15 year, fully-amortizing mortgage loan of $23,500,000$14,200,000 at a fixed interest rate of 4.23%, which was obtained in connection with the purchase of one property for $35,100,000$21,872,170 subsequent to the fiscal yearend at a fixed interest rate of 4.03%.yearend. In addition, the above table does not include commitments the Company has entered into to obtain five mortgage loansthree mortgages totaling $101,204,000$72,400,000 at fixed interest rates ranging from 3.60%3.53% to 4.20%4.25%, with a weighted average interest rate of 3.83%. Each3.75% and with a weighted average maturity of these five mortgage loan commitments are in connection with commitments to purchase five properties, currently under construction, totaling approximately $153,726,000. Each of these five mortgages will have fifteen year terms and consist of fully-amortizing loans.13.2 years.
| 132 |
Loans Payable:
Loans Payable:
BMO Capital Markets
On August 27, 2015, the Company replaced its prior $60,000,000 unsecured revolving line of credit, with a new unsecured line of credit facility (the “Facility”)Facility). The Facility is syndicated with three banks led by BMO Capital Markets (“BMO”)(BMO), as sole lead arranger, sole book runner, and Bank of Montreal as administrative agent, and includes JPMorgan Chase Bank, N.A. (“J.P. Morgan”)(J.P. Morgan) and RBC Capital Markets (“RBC”)(RBC) as co-syndication agents. The Facility provided for up to $130,000,000 in available borrowings with a $70,000,000 accordion feature under the Facility, bringing the total potential availability up to $200,000,000, subject to certain conditions. The Facility was set to mature in August 2019 and had a one-year extension option, at the option of the Company. On September 30, 2016, the Company entered into a first amendment to the Facility (the “Amendment”)Amendment) pursuant to which the Company exercised the $70,000,000 accordion feature under the Facility, bringing the maximum availability under the Facility to $200,000,000, and amended the Facility to provide an additional $100,000,000 accordion feature, bringing the total potential availability up to $300,000,000, subject to certain conditions, including, without limitation, obtaining commitments from additional lenders. In addition, the Amendment extended the maturity date of the Facility from August 27, 2019 to September 30, 2020, with a one-year extension option, at the option of the Company, subject to certain conditions. Availability under the Facility through December 31, 2016, is limited to 70% of the value of the borrowing base properties, and is limited to 60% of the value of the borrowing base properties thereafter.properties. The value of the borrowing base properties is determined by applying a 7.0% capitalization rate to the net operating incomeNOI generated by the Company’s unencumbered, wholly-owned industrial properties. Borrowings under the Facility, up to the first 60% of the value of the borrowing base properties, will, at the Company’s election, either i) bear interest at LIBOR plus 140 basis points to 220 basis points, depending on the Company’s leverage ratio, or ii) bear interest at BMO’s prime lending rate plus 40 basis points to 120 basis points, depending on the Company’s leverage ratio. The Company’s current borrowings as of September 30, 2016 were less than 60% of the value of the borrowing base properties and2017, based on the Company’s leverage ratio as of September 30, 2016, borrowings under the Facility2017, bear interest at LIBOR plus 150170 basis points, which was at an interest rate of 2.03%2.94% as of September 30, 2016.2017. As of September 30, 2017 and 2016, $110,000,000 and $76,000,000, respectively, was drawn down under the Facility.
Two River Community Bank and The Bank of Princeton
TheAs of September 30, 2016, the Company hashad total loans payable of $4,790,684 consisting of a $2,284,633 term loan secured by 200,000 shares of UMH Properties, Inc. (UMH) 8.25% Series A preferred stock from Two River Community Bank at an annual interest rate of 4.90%, which was paid in full on October 28, 2016, and a $2,506,051 term loan secured by 500,000 shares of UMH common stock from The Bank of Princeton at a variable annual interest rate of prime plus 0.75% with a floor of 4.50%, maturingwhich was paid in full on March 9, 2017.December 1, 2016. The interest rate on the $2,506,051 term loan with The Bank of Princeton was 4.50% as of September 30, 2016.
Margin Loans
The Company from time to time uses a margin loan for purchasing securities, for temporary funding of acquisitions, and for working capital purposes. This loan is due on demand and is collateralized by the Company’s securities portfolio. The Company must maintain a coverage ratio of approximately 50%. The interest rate charged on the margin loan is the bank’s margin rate and was 2.05% and 2.00% as of September 30, 2017 and 2016, and 2015.respectively. At September 30, 2017 and 2016, there was $10,091,417 and 2015, there were no draws against$-0- outstanding on the margin loan.loan, respectively.
For the three fiscal years ended September 30, 2017, amortization of financing costs included in interest expense was $1,234,259, $1,116,238 and $1,286,016, respectively.
NOTE 8 - OTHER LIABILITIES
Other liabilities consist of the following as of September 30th:
| 9/30/16 | 9/30/15 | 9/30/17 | 9/30/16 | |||||||||||||
| Rent paid in advance | $ | 5,999,702 | $ | 5,081,537 | $ | 9,108,097 | $ | 6,631,139 | ||||||||
| Unearned reimbursement revenue | 2,407,717 | 2,037,018 | 3,996,340 | 2,407,717 | ||||||||||||
| Deferred rent payable | 631,437 | -0- | ||||||||||||||
| Tenant security deposits | 464,287 | 434,554 | 582,170 | 464,287 | ||||||||||||
| Other | 365,429 | 282,359 | 578,911 | 365,429 | ||||||||||||
| Total | $ | 9,868,572 | $ | 7,835,468 | $ | 14,265,518 | $ | 9,868,572 | ||||||||
| 133 |
NOTE 9 - STOCK COMPENSATION PLAN
On July 26,March 13, 2017, upon recommendation of the Compensation Committee of the Board, the Board approved the Amended and Restated 2007 the 2007 Stock Option and StockIncentive Award Plan (the 2007 Plan) was approved by the shareholders authorizing the grant to officers, directors and key employees, of options to purchase up to 1,500,000 shares of common stock. On May 6, 2010,, conditioned upon shareholder approval. At the Company’s Annual Meeting held on May 18, 2017, the Company’s common shareholders approved the Plan. The Plan constitutes an amendment and restatement of the 2007 Plan. The amendment and restatement made two significant changes: (1)Plan, extends the inclusionterm of directors as participants in the 2007 Plan and (2) the ability to grant restrictedfor an additional 10 years through March 12, 2027, adds 1,600,000 shares of common stock to directors, officers and key employees. The amendment and restatement also made other conforming, technical and other minor changes. The amendment also makes certain modifications and clarifications, including concerning administration and compliance with applicable tax rules, such as Section 162(m)the share reserve, expands the types of the Internal Revenue Code.
Options or restricted stock may be granted any time as determined by the Company’s Compensation Committee up through March 26, 2017. No option shall beawards available for exercise beyond ten years. All options are exercisable after one year fromgrant under the date of grant. The option price shall not be below the fair market value at date of grant. Canceled or expired options are added backPlan and makes other improvements to the “pool” of shares available under the 2007 Plan.
The Compensation Committee, determinesin its capacity as Plan Administrator, shall determine, among other things: the recipients of each restricted stock award;awards; the type and number of restricted shares to be awarded;awards participants will receive; the lengthterms, conditions and forms of the restricted period ofawards; the award; the restrictions applicabletimes and conditions subject to the award including, without limitation, the employment or retirement status of the participant; rules governing forfeiture and restrictions applicable to any sale, assignment, transfer, pledge or other encumbrance of the restricted stock during the restricted period; and the eligibility to share in dividends and other distributions paid to the Company’s shareholders during the restricted period. The maximum number of shares underlying restricted stockwhich awards that may be exercised or become vested, deliverable or exercisable, or as to which any restrictions may apply or lapse; and may amend or modify the terms and conditions of an award, except that repricing of options or Stock Appreciation Rights (SAR) is not permitted without shareholder approval.
No participant may receive awards during any calendar year covering more than 200,000 shares of common stock or more than $1,500,000 in cash. Regular annual awards granted into non-employee directors as compensation for services as non-employee directors during any one fiscal year to a participant shall be 100,000.
Unless otherwise provided for in an underlying restricted stock award agreement, if a participant’s status as an employee or director of the Company is terminated by reasonmay not exceed $100,000 in value on the date of deathgrant, and the grant date value of any special or disability,one-time award upon election or appointment to the restrictions will lapse on such date. Unless otherwise provided for in an underlying restricted stock award agreement,Board of Directors may not exceed $200,000.
Awards granted pursuant to the Plan providesgenerally may not vest until the first anniversary of the date the award was granted, provided, however, that ifup to 5% of the Common Shares available under the Plan may be awarded to any one or more Eligible Individuals without the minimum vesting period.
If an individual’s status as an employeeaward made under the Plan is forfeited, expires or director is terminated by reasonconverted into shares of retirement following an involuntary termination (other than for “cause” as definedanother entity in connection with a recapitalization, reorganization, merger, consolidation, split-up, spin-off, combination, exchange of shares or other similar event, or the Plan), the restrictions will generally lapse, unless the restricted stock award is intended to constitute “performance based” compensationsettled in cash, the shares associated with the forfeited, expired, converted or settled award will become available for purposesadditional awards under the Plan.
The term of Section 162(m)any stock option or SAR generally may not be more than 10 years from the date of grant. The exercise price per common share under the Plan generally may not be below 100% of the Internal Revenue Code. Iffair market value of a participant’s status as an employee or director terminates for any other reason,common share at the Plan provides that a participant will generally forfeit any outstanding restricted stock awards, unless otherwise indicated in the applicable award agreement. Sharesdate of restricted stock that are forfeited become available again for issuance under the Plan. The Compensation Committee has the authority to accelerate the time at which the restrictions may lapse whenever it considers that such action is in the best interests of the Company and of its shareholders, whether by reason of changes in tax laws, or a “change in control” as defined in the 2007 Plan or otherwise.grant.
The Company accounts for stock options and restricted stock in accordance with ASC 718-10, Compensation-Stock Compensation. ASC 718-10 requires that compensation cost for all stock awards be calculated and amortized over the service period (generally equal to the vesting period).
Stock Options
During fiscal 2017, eleven employees were granted options to purchase 280,000 shares. During fiscal 2016 2015 and 2014,2015, one employee was granted options to purchase 65,000 shares each fiscal year. The fair value of these options was $416,400, $48,100, $60,315, and $34,549$60,315 in fiscal 2017, 2016, 2015, and 2014,2015, respectively, based on the assumptions below and is being amortized over a one-year vesting period. For the fiscal years ended September 30, 2017, 2016 2015 and 2014,2015, amounts charged to compensation expense related to stock options totaled $350,364, $51,334 $53,873 and $35,910,$53,873, respectively. The remaining unamortized stock option expense was $12,085$78,121 as of September 30, 20162017 which will be expensed in fiscal 2017.2018.
| 134 |
The fair value of each option grant is estimated on the date of grant using the Black-Scholes option-pricing model with the following weighted-average assumptions used for grants in fiscal 2017, 2016 2015 and 2014:2015:
| 2016 | 2015 | 2014 | ||||||||||
| Dividend yield | 6.17 | % | 5.38 | % | 6.71 | % | ||||||
| Expected volatility | 20.20 | % | 19.78 | % | 19.07 | % | ||||||
| Risk-free interest rate | 2.09 | % | 1.97 | % | 2.45 | % | ||||||
| Expected lives (years) | 8 | 8 | 8 | |||||||||
| Estimated forfeitures | -0- | -0- | -0- | |||||||||
| 2017 | 2016 | 2015 | ||||||||||
| Dividend yield | 4.44 | % | 6.17 | % | 5.38 | % | ||||||
| Expected volatility | 18.84 | % | 20.20 | % | 19.78 | % | ||||||
| Risk-free interest rate | 2.26 | % | 2.09 | % | 1.97 | % | ||||||
| Expected lives (years) | 8 | 8 | 8 | |||||||||
| Estimated forfeitures | -0- | -0- | -0- | |||||||||
A summary of the status of the Company’s stock option plan as of September 30, 2017, 2016 2015 and 20142015 is as follows:
| 2016 | 2015 | 2014 | 2017 | 2016 | 2015 | |||||||||||||||||||||||||||||||||||||||||||
| 2016 Shares | Weighted Average Exercise Price | 2015 Shares | Weighted Average Exercise Price | 2014 Shares | Weighted Average Exercise Price | 2017 Shares | Weighted Average Exercise Price | 2016 Shares | Weighted Average Exercise Price | 2015 Shares | Weighted Average Exercise Price | |||||||||||||||||||||||||||||||||||||
| Outstanding at beginning of year | 635,000 | $ | 8.68 | 651,200 | $ | 8.29 | 750,370 | $ | 8.19 | 455,000 | $ | 9.46 | 635,000 | $ | 8.68 | 651,200 | $ | 8.29 | ||||||||||||||||||||||||||||||
| Granted | 65,000 | 10.37 | 65,000 | 11.16 | 65,000 | 8.94 | 280,000 | 14.43 | 65,000 | 10.37 | 65,000 | 11.16 | ||||||||||||||||||||||||||||||||||||
| Exercised | (245,000 | ) | 7.69 | (81,200 | ) | 7.54 | (164,170 | ) | 8.08 | (65,000 | ) | 7.22 | (245,000 | ) | 7.69 | (81,200 | ) | 7.54 | ||||||||||||||||||||||||||||||
| Expired/Forfeited | -0- | -0- | -0- | -0- | -0- | -0- | -0- | -0- | -0- | -0- | -0- | -0- | ||||||||||||||||||||||||||||||||||||
| Outstanding at end of year | 455,000 | 9.46 | 635,000 | 8.68 | 651,200 | 8.29 | 670,000 | 11.75 | 455,000 | 9.46 | 635,000 | 8.68 | ||||||||||||||||||||||||||||||||||||
| Exercisable at end of year | 390,000 | 570,000 | 586,200 | 390,000 | 390,000 | 570,000 | ||||||||||||||||||||||||||||||||||||||||||
| Weighted-average fair value of options granted during the year | $ | 0.74 | $ | 0.93 | $ | 0.53 | | | | | | $ | 1.49 | | | | | | | $ | 0.74 | | | | | | | $ | 0.93 | | ||||||||||||||||||
The following is a summary of stock options outstanding as of September 30, 2016:2017:
| Date of Grant | Number of Grants | Number of Shares | Option Price | Expiration Date | Number of Grants | Number of Shares | Option Price | Expiration Date | |||||||||||||||||||||
| 01/05/10 | 1 | 65,000 | 7.22 | 01/05/18 | |||||||||||||||||||||||||
| 01/03/11 | 1 | 65,000 | 8.72 | 01/03/19 | 1 | 65,000 | $ | 8.72 | 01/03/19 | ||||||||||||||||||||
| 01/03/12 | 1 | 65,000 | 9.33 | 01/03/20 | 1 | 65,000 | 9.33 | 01/03/20 | |||||||||||||||||||||
| 01/03/13 | 1 | 65,000 | 10.46 | 01/03/21 | 1 | 65,000 | 10.46 | 01/03/21 | |||||||||||||||||||||
| 01/03/14 | 1 | 65,000 | 8.94 | 01/03/22 | 1 | 65,000 | 8.94 | 01/03/22 | |||||||||||||||||||||
| 01/05/15 | 1 | 65,000 | 11.16 | 01/05/23 | 1 | 65,000 | 11.16 | 01/05/23 | |||||||||||||||||||||
| 01/05/16 | 1 | 65,000 | 10.37 | 01/05/24 | 1 | 65,000 | 10.37 | 01/05/24 | |||||||||||||||||||||
| 12/09/16 | 10 | 215,000 | 14.24 | 12/09/24 | |||||||||||||||||||||||||
| 01/04/17 | 1 | 65,000 | 15.04 | 01/04/25 | |||||||||||||||||||||||||
| 455,000 | 670,000 | ||||||||||||||||||||||||||||
The aggregate intrinsic value of options outstanding as of September 30, 2017, 2016 and 2015 was $2,974,400, $2,189,850 and 2014 was $2,189,850, $816,800, and $1,212,984, respectively. The intrinsic value of options exercised in fiscal years 2017, 2016 and 2015 was $585,650, $884,350, and 2014 was $884,350, $333,369, and $361,288, respectively. The weighted-average remaining contractual term of the above options was 5.1, 4.2 3.1 and 2.73.1 years as of September 30, 2017, 2016 2015 and 2014,2015, respectively.
| 135 |
Restricted Stock
In September 2017, the Company awarded 11,000 shares of restricted stock to eleven participants under the Plan. In September 2016, the Company awarded 40,000 shares of restricted stock to one participant under the 2007 Plan. In July 2015, the Company awarded 47,000 shares of restricted stock to twelve participants and in September 2015, the Company awarded 11,000 shares of restricted stock to eleven participants under the 2007 Plan. In July 2014, the Company awarded 10,000 shares of restricted stock to one participant under the 2007 Plan. The grant date fair value of restricted stock grants awarded to participants was $175,120, $545,600 $572,840 and $101,900$572,840 in fiscal 2017, 2016 2015 and 2014,2015, respectively. These grants vest in equal installments over five years. As of September 30, 2016,2017, there remained a total of $675,813$496,866 of unrecognized restricted stock compensation related to outstanding non-vested restricted stock grants awarded under the 2007 Plan and outstanding at that date. Restricted stock compensation is expected to be expensed over a remaining weighted average period of 3.03.4 years. For the fiscal years ended September 30, 2017, 2016 2015 and 2014,2015, amounts charged to compensation expense related to restricted stock grants totaled $261,033, $875,131 and $395,022, and $311,092, respectively.
A summary of the status of the Company’s non-vested restricted stock awards as of September 30, 2017, 2016 2015 and 20142015 are presented below:
| 2016 | 2015 | 2014 | 2017 | 2016 | 2015 | |||||||||||||||||||||||||||||||||||||||||||
| 2016 Shares | Weighted-Average Grant Date Fair Value | 2015 Shares | Weighted-Average Grant Date Fair Value | 2014 Shares | Weighted-Average Grant Date Fair Value | 2017 Shares | Weighted- Average | 2016 Shares | Weighted- Average | 2015 Shares | Weighted- Average | |||||||||||||||||||||||||||||||||||||
| Non-vested at beginning of year | 123,496 | $ | 10.08 | 108,200 | $ | 9.96 | 131,666 | $ | 9.85 | 117,897 | $ | 11.35 | 123,496 | $ | 10.08 | 108,200 | $ | 9.96 | ||||||||||||||||||||||||||||||
| Granted | 40,000 | 13.64 | 58,000 | 9.88 | 10,000 | 10.19 | 11,000 | 15.92 | 40,000 | 13.64 | 58,000 | 9.88 | ||||||||||||||||||||||||||||||||||||
| Dividend Reinvested Shares | 6,771 | 11.08 | 7,180 | 9.52 | 8,665 | 9.06 | 5,103 | 13.99 | 6,771 | 11.08 | 7,180 | 9.52 | ||||||||||||||||||||||||||||||||||||
| Vested | (49,136 | ) | (10.06 | ) | (49,884 | ) | (9.56 | ) | (42,131 | ) | (10.47 | ) | (44,286 | ) | (15.74 | ) | (49,136 | ) | (10.06 | ) | (49,884 | ) | (9.56 | ) | ||||||||||||||||||||||||
| Forfeited | (3,234 | ) | (11.38 | ) | -0- | -0- | -0- | -0- | -0- | -0- | (3,234 | ) | (11.38 | ) | -0- | -0- | ||||||||||||||||||||||||||||||||
| Non-vested at end of year | 117,897 | $ | 11.35 | 123,496 | $ | 10.08 | 108,200 | $ | 9.96 | 89,714 | $ | 12.15 | 117,897 | $ | 11.35 | 123,496 | $ | 10.08 | ||||||||||||||||||||||||||||||
As of September 30, 2016,2017, there were 444,8781,753,042 shares available for grant as stock options or restricted stock under the 2007 Plan.
NOTE 10 - INCOME FROM LEASES
The Company derives income primarily from operating leases on its commercial properties. In general, these leases are written for periods up to ten10 years or more with various provisions for renewal. These leases generally contain clauses for reimbursement (or direct payment) of real estate taxes, maintenance, insurance and certain other operating expenses of the properties. As of September 30, 2016,2017, the Company had a weighted average lease maturity of 7.47.9 years. MinimumApproximate minimum base rents due under non-cancellable leases as of September 30, 20162017 are approximately scheduled as follows:
| Fiscal Year | Amount | |||
| 2017 | $ | 87,518,000 | ||
| 2018 | 81,220,000 | |||
| 2019 | 73,506,000 | |||
| 2020 | 69,080,000 | |||
| 2021 | 67,604,000 | |||
| thereafter | 307,898,000 | |||
| Total | $ | 686,826,000 | ||
| Fiscal Year | Amount | |||
| 2018 | $ | 105,909,000 | ||
| 2019 | 98,254,000 | |||
| 2020 | 93,927,000 | |||
| 2021 | 92,636,000 | |||
| 2022 | 86,696,000 | |||
| thereafter | 426,351,000 | |||
| Total | $ | 903,773,000 | ||
NOTE 11 - RELATED PARTY TRANSACTIONS
There are six directorsFive of the Company whoCompany’s 12 directors are also directors and shareholders of UMH. The Company holds common and preferred stock of UMH in its securities portfolio. See Note 6 for current holdings. During fiscal 2016,2017, the Company made total purchases of 77,456138,989 common shares of UMH for a total cost of $777,588,$1,926,166, or a weighted average cost of $10.04$13.86 per share, of which 67,456125,989 shares were purchased through UMH’s Dividend Reinvestment and Stock Purchase Plan. In addition, the Company made total purchases 100,000 shares of UMH’s 8.00% Series B Cumulative Redeemable Preferred Stock at a total cost of $2,500,000. During fiscal 2016,2017, UMH made total purchases of 120,098102,103 common shares of the Company through the Company’s DRIP for a total cost of $1,348,141,$1,437,355, or a weighted average cost of $11.23$14.08 per share.
| 136 |
The Company currently has thirteenfourteen full-time employees and one part-time employee. One of the Company’s employees (Director of Investor Relations, promoted to Vice President of Investor Relations in June 2015) was shared with a related entity, UMH, through September 30, 2015. Through September 30, 2015, the Vice President of Investor Relations’ salary was allocated 70% to the Company and 30% to UMH based on the time she worked for each entity. Effective October 1, 2015, the Vice President of Investor Relations began working solely for the Company at which point the Company no longer allocatesallocated any portion of her salary to UMH. In addition, the Company’s Chairman of the Board is also the Chairman of the Board of UMH. Effective as of October 1, 2015, other than the Company’s Chairman of the Board, the Company does not share any employees with UMH.
Some general and administrative expenses are allocated between the Company and UMH based on use or services provided. These allocations are reviewed by our Audit Committee. Net shared expenses charged by UMH to the Company for the fiscal years ended September 30, 2017, 2016 and 2015 were $94,951, $113,515 and 2014 were $55,196, $158,727, and $394,927, respectively.
On August 22, 2014,Effective January 12, 2015, the Company entered into a seven-year lease agreement to occupy 5,680 square feet for the Company’s newits corporate office space. The new corporate office space is located in a new separate suite located in the same building as the Company’s former corporate office space. The lease became effective January 12, 2015, at which time, the Company ceased to share rent expense with UMH. Rent for the Company’s new corporate office space is at an annual rate of $99,400 or $17.50 per square foot for years one through five and an annual rate of $100,820 or $17.75 per square foot for years six and seven. The Company is also responsible for its proportionate share of real estate taxes and common area maintenance. Mr. Eugene W. Landy, the Founder and Chairman of the Board of the Company, owns a 24% interest in the entity that is the landlord of the property where the Company’s new corporate office space is located. Management believes that the aforesaid rent is no more than what the Company would pay for comparable space elsewhere.
Daniel D. Cronheim is a director of the Company and Executive Vice President of David Cronheim Company (Cronheim) and Cronheim Management Services, Inc. (CMSI). Daniel Cronheim received $75,880, $49,500 $47,000 and $42,000$56,520 for director’s fees in fiscal 2017, 2016 2015 and 2014,2015, respectively. The David Cronheim Mortgage Corporation, an affiliated company of CMSI, received $-0-, $196,000$-0- and $140,000$196,000 in mortgage brokerage commissions in fiscal 2017, 2016 2015 and 2014,2015, respectively.
The industrial property in Carlstadt, New Jersey is owned by Palmer Terrace Realty Associates, LLC. The Company owns 51% of Palmer Terrace Realty Associates, LLC. This property is managed by Marcus Associates, an entity affiliated with the 49% non-controlling interest. Annual management fees of $15,804 were paid to Marcus Associates for each of the fiscal years ended 2017, 2016 2015 and 2014.2015.
NOTE 12 - TAXES
Income Tax
The Company has elected to be taxed as a REIT under the applicable provisions of the Internal Revenue Code under Sections 856 to 860 and the comparable New Jersey Statutes. Under such provisions, the Company will not be taxed on that portion of its taxable income distributed currently to shareholders, provided that at least 90% of its taxable income is distributed. As the Company has and intends to continue to distribute all of its income currently, no provision has been made for income taxes. If the Company fails to qualify as a REIT in any taxable year, it will be subject to federal income taxes at regular corporate rates (including any applicable alternative minimum tax) and may not be able to qualify as a REIT for four subsequent taxable years. Even if the Company qualifies for taxation as a REIT, the Company may be subject to certain state and local taxes on its income and property, and to federal income and excise taxes on its undistributed taxable income. In addition, taxable income from non-REIT activities managed through taxable REIT subsidiaries is subject to federal, state, and local income taxes.
| 137 |
Federal Excise Tax
The Company does not have a Federal excise tax liability for the calendar years 2017, 2016 2015 and 2014,2015, since it intends to or has distributed all of its annual Federal taxable net income.
Reconciliation Between U.S. GAAP Net Income and Taxable Income
The following table reconciles net income attributableNet Income Attributable to common shares to taxable income for the years ended September 30, 2017, 2016 2015 and 2014:2015:
| 2016 Estimated | 2015 Actual | 2014 Actual | ||||||||||||||||||||||
| (unaudited) | 2017 Estimated (unaudited) | 2016 Actual | 2015 Actual | |||||||||||||||||||||
| Net income applicable to common shareholders | $ | 20,531,888 | $ | 16,998,783 | $ | 11,238,262 | $ | 22,942,234 | $ | 20,531,888 | $ | 16,998,783 | ||||||||||||
| Book / tax difference on gains realized from capital transactions | (4,398,599 | ) | (5,824,405 | ) | (2,166,766 | ) | (2,311,714 | ) | (4,398,599 | ) | (5,824,405 | ) | ||||||||||||
| Stock compensation expense | 926,465 | 448,895 | 347,002 | 624,706 | 926,465 | 448,895 | ||||||||||||||||||
| Deferred compensation | -0- | -0- | -0- | -0- | -0- | -0- | ||||||||||||||||||
| Other book / tax differences, net | (232,914 | ) | 2,342,751 | (150,831 | ) | 353,285 | 1,298,104 | 2,342,751 | ||||||||||||||||
| Taxable income before adjustments | 16,826,840 | 13,966,024 | 9,267,667 | 21,608,511 | 18,357,858 | 13,966,024 | ||||||||||||||||||
| Add: capital gains | 3,774,099 | 5,000,683 | 973,761 | 1,311,714 | 3,643,569 | 5,000,683 | ||||||||||||||||||
| Estimated taxable income subject to 90% dividend requirement | $ | 20,600,939 | $ | 18,966,707 | $ | 10,241,428 | $ | 22,920,225 | $ | 22,001,427 | $ | 18,966,707 | ||||||||||||
Reconciliation Between Cash Dividends Paid and Dividends Paid Deduction
The following table reconciles cash dividends paid with the dividends paid deduction for the years ended September 30, 2017, 2016 2015 and 2014:2015:
| 2016 Estimated | 2015 Actual | 2014 Actual | ||||||||||||||||||||||
| (unaudited) | 2017 | |||||||||||||||||||||||
Estimated (unaudited) | 2016 Actual | 2015 Actual | ||||||||||||||||||||||
| Cash dividends paid | $ | 42,034,183 | $ | 35,522,127 | $ | 29,531,430 | $ | 50,663,829 | $ | 42,034,183 | $ | 35,522,127 | ||||||||||||
| Less: Portion designated capital gains distribution | (3,774,099 | ) | (5,000,683 | ) | (973,761 | ) | (1,311,714 | ) | (3,643,569 | ) | (5,000,683 | ) | ||||||||||||
| Less: Return of capital | (9,470,625 | ) | (2,939,882 | ) | (9,856,777 | ) | (10,414,753 | ) | (7,828,595 | ) | (2,939,882 | ) | ||||||||||||
| Estimated dividends paid deduction | $ | 28,789,459 | $ | 27,581,562 | $ | 18,700,892 | $ | 38,937,362 | $ | 30,562,019 | $ | 27,581,562 | ||||||||||||
NOTE 13 - SHAREHOLDERS’ EQUITY
Common Stock
The Company implemented a Dividend Reinvestment and Stock Purchase Plan (the DRIP) effective December 15, 1987, as amended.1987. Under the terms of the DRIP, and subsequent amendments,as subsequently amended, shareholders who participate may reinvest all or part of their dividends in additional shares of the Company at a discounted price (approximately 95% of market value) directly from the Company, from authorized but unissued shares of the Company common stock. According to the terms of the DRIP, shareholdersShareholders may also purchase additional shares through the DRIP by making optional cash payments monthly.
Amounts received in connection with the DRIP and shares issued in connection with the DRIP for the fiscal years ended September 30, 2017, 2016 2015 and 20142015 were as follows:
| 2016 | 2015 | 2014 | 2017 | 2016 | 2015 | |||||||||||||||||||
| Amounts received | $ | 72,175,797 | $ | 48,404,556 | $ | 38,090,334 | $ | 91,931,831 | $ | 72,175,797 | $ | 48,404,556 | ||||||||||||
| Less: Dividend reinvestments | 8,369,146 | 8,489,169 | 7,624,528 | 10,125,894 | 8,369,146 | 8,489,169 | ||||||||||||||||||
| Amounts received, net | $ | 63,806,651 | $ | 39,915,387 | $ | 30,465,806 | $ | 81,805,937 | $ | 63,806,651 | $ | 39,915,387 | ||||||||||||
| Number of Shares Issued | 6,515,750 | 4,975,500 | 4,296,075 | 6,632,713 | 6,515,750 | 4,975,500 | ||||||||||||||||||
| 138 |
The following cash distributions were paid to common shareholders during the years ended September 30, 2017, 2016 2015 and 2014:2015:
| 2016 | 2015 | 2014 | 2017 | 2016 | 2015 | |||||||||||||||||||||||||||||||||||||||||||
| Quarter Ended | Amount | Per Share | Amount | Per Share | Amount | Per Share | Amount | Per Share | Amount | Per Share | Amount | Per Share | ||||||||||||||||||||||||||||||||||||
| December 31 | $ | 10,083,160 | $ | 0.16 | $ | 8,598,414 | $ | 0.15 | $ | 6,815,308 | $ | 0.15 | $ | 11,184,399 | $ | 0.16 | $ | 10,083,160 | $ | 0.16 | $ | 8,598,414 | $ | 0.15 | ||||||||||||||||||||||||
| March 31 | 10,384,295 | 0.16 | 8,765,446 | 0.15 | 7,030,326 | 0.15 | 11,428,917 | 0.16 | 10,384,295 | 0.16 | 8,765,446 | 0.15 | ||||||||||||||||||||||||||||||||||||
| June 30 | 10,647,332 | 0.16 | 8,952,767 | 0.15 | 7,182,521 | 0.15 | 11,697,727 | 0.16 | 10,647,332 | 0.16 | 8,952,767 | 0.15 | ||||||||||||||||||||||||||||||||||||
| September 30 | 10,919,396 | 0.16 | 9,205,500 | 0.15 | 8,503,275 | 0.15 | 11,978,205 | 0.16 | 10,919,396 | 0.16 | 9,205,500 | 0.15 | ||||||||||||||||||||||||||||||||||||
| $ | 42,034,183 | $ | 0.64 | $ | 35,522,127 | $ | 0.60 | $ | 29,531,430 | $ | 0.60 | $ | 46,289,248 | $ | 0.64 | $ | 42,034,183 | $ | 0.64 | $ | 35,522,127 | $ | 0.60 | |||||||||||||||||||||||||
On October 1, 2015, the Company’s Board of Directors approved a 6.7% increase in the Company’s quarterly common stock dividend, raising it to $0.16 per share from $0.15 per share. This represented an annualized dividend rate of $0.64 per share. On October 2, 2017, the Company’s Board of Directors approved a 6.25% increase in the Company’s quarterly common stock dividend, raising it to $0.17 per share from $0.16 per share. This represents an annualized dividend rate of $0.64$0.68 per share. The Company has maintained or increased its cash dividend for twenty-five26 consecutive years. On October 3, 2016,2, 2017, the Company’s Board of Directors declared a quarterly dividend of $0.16$0.17 per share of its common stock to be paid December 15, 20162017 to shareholders of record as of the close of business on November 15, 2016.2017.
On May 28, 2014, the Company completed a public offering of 8,050,000 shares of the Company’s CommonPreferred Stock (including the underwriters’ option to purchase 1,050,000 additional shares) at a price of $8.50 per share, before underwriting discounts. The Company received net proceeds from the offering, after deducting underwriting discounts and all other transaction costs, of approximately $65,113,000.
Preferred Stock
On September 13, 2016, the Company issued 5,400,000 shares of a 6.125% Series C Cumulative Redeemable Preferred Stock (Series C Preferred Stock) at an offering price of $25.00 per share in an underwritten public offering. The Company received net proceeds from the offering, after deducting the underwriting discount and other estimated offering expenses, of approximately $130,543,000. On September 15, 2016, the Company used $45,000,000 of such net proceeds from the offering to reduce the amounts outstanding under its Facility and on October 14, 2016, the Company used $53,493,750 of such net proceeds from the offering to redeem all of the 2,139,750 issued and outstanding shares of its 7.625% Series A Cumulative Redeemable Preferred Stock (7.625% Series A Preferred Stock). In addition, on October 14, 2016, the Company used $498,540 of such net proceeds from the offering to pay all dividends, accrued and unpaid, to and including the redemption date of the 7.625% Series A Preferred Stock. The Company intends to use the remaining proceeds to reduce the amounts outstanding under its Facility and to purchase properties and fund expansions of its existing properties in the ordinary course of business and for general corporate purposes.
On September 14, 2016, the Company announced that it intended to redeem all 2,139,750 issued and outstanding shares of its 7.625% Series A Cumulative Redeemable Preferred Stock. As discussed above, theStock, $0.01 par value per share (7.625% Series A Preferred Stock). The Company redeemed all of the 7.625% Series A Preferred Stock on October 14, 2016 at a redemption price of $25.00 per share, plus all dividends accrued and unpaid to and including the redemption date, in an amount equal to $0.23299 per share. As of September 30, 2016, the outstanding 7.625% Series A Preferred Stock has beenwas reclassified out of stockholder'sstockholder’s equity and iswas reflected as a liability at redemption value and the Company has recognized a deemed dividend of $2,942,149 on the Consolidated Statement of Income for the fiscal year ended September 30, 2016, which represents the difference between redemption value and carrying value net of original deferred issuance costs.
Prior to its redemption, the annual dividend of the 7.625% Series A Preferred Stock was $1.90625 per share, or 7.625%, of the $25.00 per share liquidation value and was payable quarterly in arrears on March 15, June 15, September 15, and December 15.
The Company’s Board of Directors have declaredhas authorized and the Company has paid the following dividends on the 7.625% Series A Preferred Stock for the fiscal years ended September 30, 2017, 2016 2015 and 2014:2015:
| Declaration Date | Record Date | Payment Date | Dividend | Dividend per Share | ||||||||
| 10/1/15 | 11/16/15 | 12/15/15 | $ | 1,019,725 | $ | 0.4765625 | ||||||
| 1/19/16 | 2/16/16 | 3/15/16 | 1,019,726 | 0.4765625 | ||||||||
| 4/5/16 | 5/16/16 | 6/15/16 | 1,019,725 | 0.4765625 | ||||||||
| 7/1/16 | 8/15/16 | 9/15/16 | 1,019,726 | 0.4765625 | ||||||||
| $ | 4,078,902 | $ | 1.90625 | |||||||||
| Declaration Date | Record Date | Payment Date | Dividend | Dividend per Share | ||||||||
| 10/1/14 | 11/17/14 | 12/15/14 | $ | 1,019,725 | $ | 0.4765625 | ||||||
| 1/21/15 | 2/17/15 | 3/16/15 | 1,019,726 | 0.4765625 | ||||||||
| 4/1/15 | 5/15/15 | 6/15/15 | 1,019,725 | 0.4765625 | ||||||||
| 7/1/15 | 8/17/15 | 9/15/15 | 1,019,726 | 0.4765625 | ||||||||
| $ | 4,078,902 | $ | 1.90625 | |||||||||
| Declaration Date | Record Date | Payment Date | Dividend | Dividend per Share | ||||||||
| 10/1/13 | 11/15/13 | 12/16/13 | $ | 1,019,725 | $ | 0.4765625 | ||||||
| 1/15/14 | 2/18/14 | 3/17/14 | 1,019,726 | 0.4765625 | ||||||||
| 4/1/14 | 5/15/14 | 6/16/14 | 1,019,725 | 0.4765625 | ||||||||
| 7/1/14 | 8/15/14 | 9/15/14 | 1,019,726 | 0.4765625 | ||||||||
| $ | 4,078,902 | $ | 1.90625 | |||||||||
| Declaration Date | Record Date | Payment Date | Dividend | Dividend per Share | ||||||||||
| (1) 9/14/16 | 10/14/16 | 10/14/16 | $ | 498,540 | $ | 0.23299 | ||||||||
As(1) Represents final dividend payment at time of September 30, 2016,redemption of the 7.625% Series A Preferred Stock
| Declaration Date | Record Date | Payment Date | Dividend | Dividend per Share | ||||||||
| 10/1/15 | 11/16/15 | 12/15/15 | $ | 1,019,725 | $ | 0.4765625 | ||||||
| 1/19/16 | 2/16/16 | 3/15/16 | 1,019,726 | 0.4765625 | ||||||||
| 4/5/16 | 5/16/16 | 6/15/16 | 1,019,725 | 0.4765625 | ||||||||
| 7/1/16 | 8/15/16 | 9/15/16 | 1,019,726 | 0.4765625 | ||||||||
| $ | 4,078,902 | $ | 1.9062500 | |||||||||
| 139 |
| Declaration Date | Record Date | Payment Date | Dividend | Dividend per Share | ||||||||
| 10/1/14 | 11/17/14 | 12/15/14 | $ | 1,019,725 | $ | 0.4765625 | ||||||
| 1/21/15 | 2/17/15 | 3/16/15 | 1,019,726 | 0.4765625 | ||||||||
| 4/1/15 | 5/15/15 | 6/15/15 | 1,019,725 | 0.4765625 | ||||||||
| 7/1/15 | 8/17/15 | 9/15/15 | 1,019,726 | 0.4765625 | ||||||||
| $ | 4,078,902 | $ | 1.9062500 | |||||||||
7.875% Series B Cumulative Redeemable Preferred Stock
On May 5, 2017, the Company has a totalannounced that it intended to redeem all 2,300,000 issued and outstanding shares of 2,300,000 shares ofits 7.875% Series B Cumulative Redeemable Preferred Stock, (Series$0.01 par value per share (7.875% Series B Preferred Stock). The Company redeemed all of the outstanding representingshares of the 7.875% Series B Preferred Stock on June 7, 2017, at a redemption price of $25.00 per share, totaling $57,500,000, plus accumulated and unpaid dividends for the period from June 1, 2017 up to and not including, the redemption date, in an aggregate liquidation preferenceamount equal to $0.0328125, totaling $75,469, for a total cash payment of $57,500,000.$25.0328125 per share, totaling $57,575,469. The Company recognized a deemed dividend of $2,467,165 on the Consolidated Statement of Income for the fiscal year ended September 30, 2017, which represents the difference between redemption value and carrying value net of original deferred issuance costs.
ThePrior to its redemption, the annual dividend of the 7.875% Series B Preferred Stock iswas $1.96875 per share, or 7.875%, of the $25.00 per share liquidation value and iswas payable quarterly in arrears on March 15, June 15, September 15, and December 15. The Series B Preferred Stock has no maturity and will remain outstanding indefinitely unless redeemed or otherwise repurchased. Except in limited circumstances relating to the Company’s qualification as a REIT, and as described below, the Series B Preferred Stock is not redeemable prior to June 7, 2017. On and after June 7, 2017, at any time and, from time to time, the Series B Preferred Stock will be redeemable in whole, or in part, at the Company’s option, at a cash redemption price of $25.00 per share, plus all accrued and unpaid dividends (whether or not declared) to the date of redemption.
Upon the occurrence of a Delisting Event, as defined in the Articles Supplementary (the “Series B Articles Supplementary”) classifying and designating the Series B Preferred Stock, the Company may, at its option and subject to certain conditions, redeem the Series B Preferred Stock, in whole or in part, within 90 days after the Delisting Event, for a cash redemption price per share of Series B Preferred Stock equal to $25.00 plus any accumulated and unpaid dividends thereon (whether or not declared), to, but not including, the redemption date.
Upon the occurrence of a Change of Control, as defined in the Series B Articles Supplementary, the Company may, at its option and subject to certain conditions, redeem the Series B Preferred Stock, in whole or in part, within 120 days after the first date on which such Change of Control occurred, for a cash redemption price per share of Series B Preferred Stock equal to $25.00 plus any accumulated and unpaid dividends thereon (whether or not declared) to, but not including, the redemption date.
The Company’s Board of Directors have declaredhas authorized and the Company has paid the following dividends on the Series B Preferred Stock for the year ended September 30, 2017, 2016 2015 and 2014:2015:
| Declaration Date | Record Date | Payment Date | Dividend | Dividend per Share | ||||||||
| 10/1/15 | 11/16/15 | 12/15/15 | $ | 1,132,032 | $ | 0.4921875 | ||||||
| 1/19/16 | 2/16/16 | 3/15/16 | 1,132,033 | 0.4921875 | ||||||||
| 4/5/16 | 5/16/16 | 6/15/16 | 1,132,032 | 0.4921875 | ||||||||
| 7/1/16 | 8/15/16 | 9/15/16 | 1,132,033 | 0.4921875 | ||||||||
| $ | 4,528,130 | $ | 1.96875 | |||||||||
| Declaration Date | Record Date | Payment Date | Dividend | Dividend per Share | |||||||||
| 10/3/16 | 11/15/16 | 12/15/16 | $ | 1,132,032 | $ | 0.4921875 | |||||||
| 1/17/17 | 2/15/17 | 3/15/17 | 1,132,033 | 0.4921875 | |||||||||
| 4/4/17 | 5/15/17 | 6/15/17 | 1,132,032 | 0.4921875 | |||||||||
| (1) 5/5/17 | 6/7/17 | 6/7/17 | 75,470 | 0.0328125 | |||||||||
| $ | 3,471,567 | $ | 1.5093750 | ||||||||||
| Declaration Date | Record Date | Payment Date | Dividend | Dividend per Share | ||||||||
| 10/1/14 | 11/17/14 | 12/15/14 | $ | 1,132,032 | $ | 0.4921875 | ||||||
| 1/21/15 | 2/17/15 | 3/16/15 | 1,132,033 | 0.4921875 | ||||||||
| 4/1/15 | 5/15/15 | 6/15/15 | 1,132,032 | 0.4921875 | ||||||||
| 7/1/15 | 8/17/15 | 9/15/15 | 1,132,033 | 0.4921875 | ||||||||
| $ | 4,528,130 | $ | 1.96875 | |||||||||
(1) Represents final dividend payment at time of redemption of the 7.875% Series B Preferred Stock
| Declaration Date | Record Date | Payment Date | Dividend | Dividend per Share | ||||||||
| 10/1/13 | 11/15/13 | 12/16/13 | $ | 1,132,032 | $ | 0.4921875 | ||||||
| 1/15/14 | 2/18/14 | 3/17/14 | 1,132,033 | 0.4921875 | ||||||||
| 4/1/14 | 5/15/14 | 6/16/14 | 1,132,032 | 0.4921875 | ||||||||
| 7/1/14 | 8/15/14 | 9/15/14 | 1,132,033 | 0.4921875 | ||||||||
| $ | 4,528,130 | $ | 1.96875 | |||||||||
| Declaration Date | Record Date | Payment Date | Dividend | Dividend per Share | ||||||||
| 10/1/15 | 11/16/15 | 12/15/15 | $ | 1,132,032 | $ | 0.4921875 | ||||||
| 1/19/16 | 2/16/16 | 3/15/16 | 1,132,033 | 0.4921875 | ||||||||
| 4/5/16 | 5/16/16 | 6/15/16 | 1,132,032 | 0.4921875 | ||||||||
| 7/1/16 | 8/15/16 | 9/15/16 | 1,132,033 | 0.4921875 | ||||||||
| $ | 4,528,130 | $ | 1.9687500 | |||||||||
| Declaration Date | Record Date | Payment Date | Dividend | Dividend per Share | ||||||||
| 10/1/14 | 11/17/14 | 12/15/14 | $ | 1,132,032 | $ | 0.4921875 | ||||||
| 1/21/15 | 2/17/15 | 3/16/15 | 1,132,033 | 0.4921875 | ||||||||
| 4/1/15 | 5/15/15 | 6/15/15 | 1,132,032 | 0.4921875 | ||||||||
| 7/1/15 | 8/17/15 | 9/15/15 | 1,132,033 | 0.4921875 | ||||||||
| $ | 4,528,130 | $ | 1.9687500 | |||||||||
| 140 |
6.125% Series C Cumulative Redeemable Preferred Stock
On October 3,September 13, 2016, the Company’s BoardCompany issued 5,400,000 shares of Directors declared a quarterly dividend of $0.49218756.125% Series C Cumulative Redeemable Preferred Stock, $0.01 par value per share to be paid December(6.125% Series C Preferred Stock) at an offering price of $25.00 per share in an underwritten public offering. The Company received net proceeds from the offering, after deducting the underwriting discount and other estimated offering expenses, of approximately $130,543,000. On September 15, 2016, the Company used $45,000,000 of such net proceeds from the offering to shareholdersreduce the amounts outstanding under its Facility and on October 14, 2016, and as discussed above, the Company used $53,493,750 of record assuch net proceeds from the offering to redeem all of the close2,139,750 issued and outstanding shares of its 7.625% Series A Preferred Stock. In addition, on October 14, 2016, the Company used $498,540 of such net proceeds from the offering to pay all dividends, accrued and unpaid, up to and including the redemption date of the 7.625% Series A Preferred Stock.
On March 9, 2017, the Company issued an additional 3,000,000 shares of its 6.125% Series C Preferred Stock, liquidation preference of $25.00 per share, at a public offering price of $24.50 per share, for gross proceeds of $73,500,000 before deducting the underwriting discount and offering expenses. Net proceeds from the offering, after deducting underwriting discounts and other offering expenses were approximately $71,003,000. As discussed above, the Company used the net proceeds from this offering to redeem all of the outstanding shares of its 7.875% Series B Preferred Stock. In addition, the Company used $75,469 of such net proceeds from the offering to pay all dividends, accrued and unpaid, up to and not including the redemption date of the 7.875% Series B Preferred Stock.
On June 29, 2017, the Company entered into an At-The-Market Preferred Equity Program (Preferred Stock ATM Program), with FBR Capital Markets & Co. in which the Company may, from time to time, offer and sell additional shares of its 6.125% Series C Preferred Stock, with a liquidation preference of $25.00 per share, having an aggregate sales price of up to $100,000,000. The Company began selling shares through the Preferred Stock ATM Program on July 3, 2017. As of September 30, 2017, the Company sold 1,439,445 shares under its Preferred Stock ATM Program at a weighted average price of $25.31 per share, and generated net proceeds, after offering expenses, of approximately $35,730,000.
The Company intends to use the proceeds raised through the Preferred Stock ATM Program to purchase properties and fund expansions of its existing properties in the ordinary course of business on November 15, 2016.and for general corporate purposes.
As of September 30, 2016,2017, the Company has a total of 5,400,0009,839,445 shares of 6.125% Series C Preferred Stock outstanding representing an aggregate liquidation preference of $135,000,000.$245,986,125.
The Company’s Board of Directors has authorized and the Company has paid the following dividends on the 6.125% Series C Preferred Stock for the year ended September 30, 2017, 2016 and 2015:
| Declaration Date | Record Date | Payment Date | Dividend | Dividend per Share | ||||||||
| 10/3/16 | 11/15/16 | 12/15/16 | $ | 1,791,563 | $ | 0.3317708 | ||||||
| 1/17/17 | 2/15/17 | 3/15/17 | 2,067,190 | 0.3828125 | ||||||||
| 4/4/17 | 5/15/17 | 6/15/17 | 3,215,629 | 0.3828125 | ||||||||
| 7/3/17 | 8/15/17 | 9/15/17 | 3,455,985 | 0.3828125 | ||||||||
| $ | 10,530,367 | $ | 1.4802083 | |||||||||
The annual dividend of the 6.125% Series C Preferred Stock is $1.53125 per share, or 6.125% of the $25.00 per share liquidation value and is payable quarterly in arrears on March 15, June 15, September 15, and December 15. The 6.125% Series C Preferred Stock has no maturity and will remain outstanding indefinitely unless redeemed or otherwise repurchased. Except in limited circumstances relating to the Company’s qualification as a REIT, and as described below, the 6.125% Series C Preferred Stock is not redeemable prior to September 15, 2021. On and after September 15, 2021, at any time and, from time to time, the 6.125% Series C Preferred Stock will be redeemable in whole, or in part, at the Company’s option, at a cash redemption price of $25.00 per share, plus all accrued and unpaid dividends (whether or not declared) to the date of redemption.
| 141 |
Upon the occurrence of a Delisting Event, as defined in the Articles Supplementary (the “Series(Series C Articles Supplementary”)Supplementary) classifying and designating the 6.125% Series C Preferred Stock, the Company may, at its option and subject to certain conditions, redeem the 6.125% Series C Preferred Stock, in whole or in part, within 90 days after the Delisting Event, for a cash redemption price per share of 6.125% Series C Preferred Stock equal to $25.00 plus any accumulated and unpaid dividends thereon (whether or not declared), to, but not including, the redemption date.
Upon the occurrence of a Change of Control, as defined in the Series C Articles Supplementary, the Company may, at its option and subject to certain conditions, redeem the 6.125% Series C Preferred Stock, in whole or in part, within 120 days after the first date on which such Change of Control occurred, for a cash redemption price per share of 6.125% Series C Preferred Stock equal to $25.00 plus any accumulated and unpaid dividends thereon (whether or not declared) to, but not including, the redemption date.
On October 3, 2016,2, 2017, the Company’s Board of Directors declared a quarterly dividend for the period September 13, 20161, 2017 through November 30, 2016,2017, of $0.3317708$0.3828125 per share to be paid December 15, 20162017 to shareholders of record as of the close of business on November 15, 2016.2017.
Repurchase of Stock
On January 19, 2016,17, 2017, the Board of Directors reaffirmed its Share Repurchase Program (the Repurchase(Repurchase Program) that authorizes the Company to purchase up to $10,000,000 in the aggregate of the Company’s common stock. The Repurchase Program was originally created on March 3, 2009 and is intended to be implemented through purchases made from time to time using a variety of methods, which may include open market purchases, privately negotiated transactions or block trades, or by any combination of such methods, in accordance with applicable insider trading and other securities laws and regulations. The size, scope and timing of any purchases will be based on business, market and other conditions and factors, including price, regulatory and contractual requirements or consents, and capital availability. The Repurchase Program does not require the Company to acquire any particular amount of common stock, and the program may be suspended, modified or discontinued at any time at the Company’s discretion without prior notice. The Company did not reacquire any of its shares of Common Stock during the fiscal year ended September 30, 2016,2017, nor does the Company possess any reacquired shares of Common Stock as of September 30, 2016.2017. The maximum dollar value that may be purchased under the Repurchase Program as of September 30, 20162017 is $10,000,000.
NOTE 14 - FAIR VALUE MEASUREMENTS
The Company follows ASC 825, Financial Instruments, for financial assets and liabilities recognized at fair value on a recurring basis. We measure certain financial assets and liabilities at fair value on a recurring basis, including securities available for sale. The Company’s financial assets consist mainly of marketable REIT securities. The fair value of these certain financial assets was determined using the following inputs at September 30, 20162017 and 2015:2016:
| Fair Value Measurements at Reporting Date Using | Fair Value Measurements at Reporting Date Using | |||||||||||||||||||||||||||||||
| Total | Quoted Prices in Active Markets for Identical Assets (Level 1) | Significant Other Observable Inputs (Level 2) | Significant Unobservable Inputs (Level 3) | Total | Quoted Prices in Active Markets for Identical Assets (Level 1) | Significant Other Observable Inputs (Level 2) | Significant Unobservable Inputs (Level 3) | |||||||||||||||||||||||||
| September 30, 2017: | ||||||||||||||||||||||||||||||||
| Securities available for sale | $ | 123,764,770 | $ | 123,764,770 | $ | -0- | $ | -0- | ||||||||||||||||||||||||
| September 30, 2016: | ||||||||||||||||||||||||||||||||
| Securities available for sale | $ | 73,604,894 | $ | 73,604,894 | $ | -0- | $ | -0- | $ | 73,604,894 | $ | 73,604,894 | $ | -0- | $ | -0- | ||||||||||||||||
| September 30, 2015: | ||||||||||||||||||||||||||||||||
| Securities available for sale | $ | 54,541,237 | $ | 54,541,237 | $ | -0- | $ | -0- | ||||||||||||||||||||||||
| 142 |
In addition to the Company’s investments in Securities Available for Sale at Fair Value, the Company is required to disclose certain information about fair values of its other financial instruments. Estimates of fair value are made at a specific point in time based upon, where available, relevant market prices and information about the financial instrument. Such estimates do not include any premium or discount that could result from offering for sale at one time the Company’s entire holdings of a particular financial instrument. For a portion of the Company’s other financial instruments, no quoted market value exists. Therefore, estimates of fair value are necessarily based on a number of significant assumptions (many of which involve events outside the control of management). Such assumptions include assessments of current economic conditions, perceived risks associated with these financial instruments and their counterparties; future expected loss experience and other factors. Given the uncertainties surrounding these assumptions, the reported fair values represent estimates only, and therefore cannot be compared to the historical accounting model. The use of different assumptions or methodologies is likely to result in significantly different fair value estimates.
The fair value of Cash and Cash Equivalents approximates their current carrying amounts since all such items are short-term in nature. The fair value of variable rate Loans Payable approximates their current carrying amounts since such amounts payable are at approximately a weighted-average current market rate of interest. The estimated fair value of fixed rate mortgage notes payable is based on discounting the future cash flows at a year-end risk adjusted borrowing rate currently available to the Company for issuance of debt with similar terms and remaining maturities. These fair value measurements fall within level 2 of the fair value hierarchy. At September 30, 2016,2017, the fixed rate Mortgage Notes Payable fair value (estimated based upon expected cash outflows discounted at current market rates) amounted to $493,675,000$608,245,000 and the carrying value amounted to $483,748,153. At September 30, 2016 the fixed rate Loans Payable fair value (estimated based upon expected cash outflows discounted at current market rates) amounted to $4,800,000 and the carrying value amounted to $4,790,684.$598,962,567. When the Company acquires a property that is accounted for as a business combination, it is required to fair value all of the assets and liabilities, including intangible assets and liabilities, relating to the properties acquired lease (See Note 3). Those fair value measurements are estimated based on independent third party appraisals and fall within level 3 of the fair value hierarchy.
NOTE 15 - CASH FLOW
During fiscal years 2017, 2016 2015 and 2014,2015, the Company paid cash for interest of $24,290,811, $21,967,741 $18,617,553 and $16,191,170,$18,617,553, respectively.
During fiscal years 2017, 2016 2015 and 2014,2015, the Company had $10,125,894, $8,369,146 $8,489,169 and $7,624,528,$8,489,169, respectively, of dividends which were reinvested that required no cash transfers.
NOTE 16 – CONTINGENCIES, COMMITMENTS AND COMMITMENTSLEGAL MATTERS
From time to time, the Company can be subject to claims and litigation in the ordinary course of business. Management does not believe that any such claim or litigation will have a material adverse effect on the consolidated balance sheet or results of operations.
In addition to the property purchased subsequent to the fiscal yearend, as described below in Note 17, we havethe Company has entered into agreements to purchase eightthree new build-to-suit, industrial buildings that are currently being developed in Florida, Michigan, North Carolina, OhioGeorgia and South Carolina totalingOklahoma, consisting of approximately 2,099,0001,531,000 square feet, each with net-leased terms ranging between ten to fifteenof 10 years with a weighted average lease maturity of 13.3 years.each. The purchase price for these properties is approximately $117,437,000. Approximately 1,267,0001,132,000 square feet, or 60%74%, is leased to FDX andan investment grade tenant or its subsidiaries. The purchase price for the eight properties is approximately $212,373,000.subsidiary. Subject to satisfactory due diligence and other customary closing conditions and requirements, we anticipate closing these eight transactions during fiscal 2017 and fiscal 2018. In connection with five of the eightthree properties, the Company has entered into commitments to obtain fivethree mortgages totaling $101,204,000$72,400,000 at fixed rates ranging from 3.60%3.53% to 4.20%4.25%, with a weighted average interest rate of 3.83%. Each3.75% and with a weighted average maturity of these mortgages will be a fifteen year, fully-amortizing loan.13.2 years.
NOTE 17 – SUBSEQUENT EVENTS
Material subsequent events have been evaluated and are disclosed herein.
| 143 |
On October 2, 2017, the Company’s Board of Directors approved a 6.25% increase in the Company’s quarterly common stock dividend, raising it to $0.17 per share from $0.16 per share. This represents an annualized dividend rate of $0.68 per share. The Company has maintained or increased its cash dividend for 26 consecutive years. On October 2, 2017, the Company’s Board of Directors declared a quarterly dividend of $0.17 per share of its common stock to be paid December 15, 2017 to shareholders of record as of the close of business on November 15, 2017.
On October 2, 2017, the Company’s Board of Directors authorized a quarterly dividend for the 6.125% Series C Preferred Stock for the period September 1, 2016,2017 through November 30, 2017, of $0.3828125 per share to be paid December 15, 2017 to shareholders of record as of the close of business on November 15, 2017.
On November 2, 2017, the Company purchased a 50,741newly constructed 121,683 square foot expansionindustrial building, situated on 16.2 acres, located in Charleston, SC. The building is 100% net-leased to FDX for 15 years through August 2032. The purchase price was $21,872,170. The Company obtained a 15 year fully-amortizing mortgage loan of $14,200,000 at a fixed interest rate of 4.23%. Annual rental revenue over the remaining term of the buildinglease averages approximately $1,312,000.
On November 1, 2017, a parking lot expansion for a property leased to FedEx Ground Package System, Inc. located in Edinburg, TXIndianapolis, IN was completed for a total project cost of approximately $4,988,000,$1,840,000, resulting in a new 10 year lease which extended the prior lease expiration date from September 2021 through September 2026.April 2024 to October 2027. In addition, the expansion resulted in an increase in annual rent effective from the date of completion of approximately $499,000$184,000 from approximately $598,000,$1,533,000, or $5.27$4.67 per square foot, to approximately $1,097,000,$1,717,000, or $6.68$5.24 per square foot.
On October 17, 2016, the Company purchased a newly constructed 338,584 square foot industrial building located in Hamburg, NY, which is in the Buffalo MSA. The building is 100% net-leased to FedEx Ground Package System, Inc. for fifteen years through March 2031. The purchase price was $35,100,000. The Company obtained a 15 year fully-amortizing mortgage loan of $23,500,000 at a fixed interest rate of 4.03%. Annual rental revenue over the remaining term of the lease averages approximately $2,308,000.
On October 27, 2016, the Company sold its only vacant building (which increased our occupancy rate from 99.6% to 100.0%) consisting of a 59,425 square foot industrial building situated on 4.78 acres located in White Bear Lake, MN for approximately $4,272,000, which is the Company’s approximate U.S. GAAP net book carrying value.
The industrial properties purchased, expanded and sold during fiscal 2017 to date increased our current total leasable square feet to approximately 16,340,000 and increased our occupancy rate to 100.0%.
On September 14, 2016, the Company announced that it intended to redeem all 2,139,750 issued and outstanding shares of its 7.625% Series A Preferred Stock. The Company redeemed the 7.625% Series A Preferred Stock on October 14, 2016 at a redemption price of $25.00 per share, totaling $53,493,750, plus all dividends accrued and unpaid to and including the redemption date, in an amount equal to $0.23299 per share, totaling $498,540, for a total cash payment of $25.23299 per share, totaling $53,992,290. As of September 30, 2016, the outstanding 7.625% Series A Preferred Stock has been reclassified out of stockholder's equity and is reflected as a liability at redemption value and the Company has recognized a deemed dividend of $2,942,149 on the Consolidated Statement of Income for the fiscal year ended September 30, 2016, which represents the difference between redemption value and carrying value net of original deferred issuance costs.
On October 3, 2016, the Company’s Board of Directors declared a quarterly dividend of $0.16 per share of its common stock to be paid December 15, 2016 to shareholders of record as of the close of business on November 15, 2016.
On October 3, 2016, the Company’s Board of Directors declared a quarterly dividend of $0.4921875 per share to be paid December 15, 2016 to shareholders of record as of the close of business on November 15, 2016.
On October 3, 2016, the Company’s Board of Directors declared a quarterly dividend for the period September 13, 2016 through November 30, 2016, of $0.3317708 per share to be paid December 15, 2016 to shareholders of record as of the close of business on November 15, 2016.
NOTE 18 – SELECTED QUARTERLY FINANCIAL DATA (UNAUDITED)
The following is the Unaudited Selected Quarterly Financial Data:
SELECTED QUARTERLY FINANCIAL DATA (UNAUDITED)
THREE MONTHS ENDED
| FISCAL 2016 | 12/31/15 | 3/31/16 | 6/30/16 | 9/30/16 | ||||||||||||||||||||||||||||
| FISCAL 2017 | 12/31/16 | 3/31/17 | 6/30/17 | 9/30/17 | ||||||||||||||||||||||||||||
| Rental and Reimbursement Revenue | $ | 22,259,362 | $ | 22,966,838 | $ | 24,113,999 | $ | 25,575,911 | $ | 27,181,611 | $ | 27,308,191 | $ | 28,609,096 | $ | 30,447,084 | ||||||||||||||||
| Total Expenses | 11,167,093 | 12,537,914 | 11,835,546 | 13,942,992 | 13,262,730 | 13,785,498 | 14,130,508 | 15,584,318 | ||||||||||||||||||||||||
| Other Income (Expense) | (4,153,614 | ) | (3,296,977 | ) | (4,047,158 | ) | (1,440,309 | ) | (4,064,960 | ) | (5,098,082 | ) | (2,748,225 | ) | (4,600,576 | ) | ||||||||||||||||
| Net Income | 6,938,655 | 7,131,947 | 8,231,295 | 10,192,610 | 9,853,921 | 8,424,611 | 11,730,363 | 10,262,190 | ||||||||||||||||||||||||
| Net Income Attributable to Common Shareholders | 4,786,897 | 4,980,189 | 6,079,537 | 4,685,265 | 6,156,161 | 4,842,575 | 5,217,411 | 6,726,087 | ||||||||||||||||||||||||
| Net Income Attributable to Common Shareholders per diluted share | $ | 0.08 | $ | 0.08 | $ | 0.09 | $ | 0.07 | $ | 0.09 | $ | 0.07 | $ | 0.07 | $ | 0.09 | ||||||||||||||||
| FISCAL 2015 | 12/31/14 | 3/31/15 | 6/30/15 | 9/30/15 | ||||||||||||||||||||||||||||
| Rental and Reimbursement Revenue | $ | 17,677,530 | $ | 18,858,596 | $ | 20,672,282 | $ | 20,567,089 | ||||||||||||||||||||||||
| Lease Termination Income | 238,625 | -0- | -0- | -0- | ||||||||||||||||||||||||||||
| Total Expenses | 9,582,908 | 10,305,673 | 11,351,102 | 10,875,080 | ||||||||||||||||||||||||||||
| Other Income (Expense) | (2,909,595 | ) | (3,734,243 | ) | (4,145,322 | ) | (4,525,626 | ) | ||||||||||||||||||||||||
| Gain on Sale of Real Estate Investment | -0- | -0- | -0- | 5,021,242 | ||||||||||||||||||||||||||||
| Net Income | 5,423,652 | 4,818,680 | 5,175,858 | 10,187,625 | ||||||||||||||||||||||||||||
| Net Income Attributable to Common Shareholders | 3,271,894 | 2,666,922 | 3,024,100 | 8,035,867 | ||||||||||||||||||||||||||||
| Net Income Attributable to Common Shareholders per diluted share | $ | 0.06 | $ | 0.04 | $ | 0.05 | $ | 0.14 | ||||||||||||||||||||||||
Certain amounts in the Selected Quarterly Financial Data for the prior quarters have been reclassified to conform to the financial statement presentation for the current year.
| FISCAL 2016 | 12/31/15 | 3/31/16 | 6/30/16 | 9/30/16 | ||||||||||||
| Rental and Reimbursement Revenue | $ | 22,259,362 | $ | 22,966,838 | $ | 24,113,999 | $ | 25,575,911 | ||||||||
| Total Expenses | 11,167,093 | 12,537,914 | 11,835,546 | 13,942,992 | ||||||||||||
| Other Income (Expense) | (4,153,614 | ) | (3,296,977 | ) | (4,047,158 | ) | (1,440,309 | ) | ||||||||
| Net Income | 6,938,655 | 7,131,947 | 8,231,295 | 10,192,610 | ||||||||||||
| Net Income Attributable to Common Shareholders | 4,786,897 | 4,980,189 | 6,079,537 | 4,685,265 | ||||||||||||
| Net Income Attributable to Common Shareholders per diluted share | $ | 0.08 | $ | 0.08 | $ | 0.09 | $ | 0.07 | ||||||||
| 144 |
MONMOUTH REAL ESTATE INVESTMENT CORPORATION
REAL ESTATE AND ACCUMULATED DEPRECIATION
SEPTEMBER 30, 20162017
| Column A | Column B | Column C | Column D | Column B | Column C | Column D | ||||||||||||||||||||||||||
| Capitalization | Capitalization | |||||||||||||||||||||||||||||||
| Buildings and | Subsequent to | Buildings and | Subsequent to | |||||||||||||||||||||||||||||
| Description | Encumbrances | Land | Improvements | Acquisition | Encumbrances | Land | Improvements | Acquisition | ||||||||||||||||||||||||
| Industrial Buildings | ||||||||||||||||||||||||||||||||
| Monaca (Pittsburgh), PA | $ | -0- | $ | 401,716 | $ | 878,081 | $ | 6,526,426 | $ | -0- | $ | 401,716 | $ | 878,081 | $ | 6,606,044 | ||||||||||||||||
| Orangeburg (New York), NY | -0- | 694,720 | 2,977,372 | 223,583 | ||||||||||||||||||||||||||||
| Ridgeland (Jackson), MS | -0- | 218,000 | 1,233,500 | 407,091 | -0- | 218,000 | 1,233,500 | 407,091 | ||||||||||||||||||||||||
| Urbandale (Des Moines),IA | -0- | 310,000 | 1,758,000 | 93,895 | ||||||||||||||||||||||||||||
| Urbandale (Des Moines), IA (Vacant) | -0- | 310,000 | 1,758,000 | 188,613 | ||||||||||||||||||||||||||||
| Richland (Jackson), MS | -0- | 211,000 | 1,195,000 | 494,691 | -0- | 211,000 | 1,195,000 | 494,691 | ||||||||||||||||||||||||
| O’Fallon (St. Louis), MO | -0- | 264,000 | 3,302,000 | 679,913 | -0- | 264,000 | 3,302,000 | 679,913 | ||||||||||||||||||||||||
| Fayetteville, NC | -0- | 172,000 | 4,467,885 | 801,991 | -0- | 172,000 | 4,467,885 | 811,744 | ||||||||||||||||||||||||
| Schaumburg (Chicago), IL | -0- | 1,039,800 | 3,694,320 | 247,294 | -0- | 1,039,800 | 3,694,320 | 443,820 | ||||||||||||||||||||||||
| Burr Ridge (Chicago), IL | -0- | 270,000 | 1,236,599 | 186,302 | -0- | 270,000 | 1,236,599 | 186,302 | ||||||||||||||||||||||||
| Romulus (Detroit), MI | -0- | 531,000 | 3,653,883 | 415,649 | -0- | 531,000 | 3,653,883 | 482,623 | ||||||||||||||||||||||||
| Liberty, (Kansas City), MO | -0- | 723,000 | 6,498,324 | 176,557 | ||||||||||||||||||||||||||||
| Liberty (Kansas City), MO | -0- | 723,000 | 6,498,324 | 176,557 | ||||||||||||||||||||||||||||
| Omaha, NE | -0- | 1,170,000 | 4,425,500 | 349,191 | -0- | 1,170,000 | 4,425,500 | 349,191 | ||||||||||||||||||||||||
| Charlottesville, VA | -0- | 1,170,000 | 2,845,000 | 333,499 | -0- | 1,170,000 | 2,845,000 | 341,988 | ||||||||||||||||||||||||
| Jacksonville, FL (FDX) | 1,384,194 | 1,165,000 | 4,668,080 | 413,324 | -0- | 1,165,000 | 4,668,080 | 496,704 | ||||||||||||||||||||||||
| West Chester Twp (Cincinnati), OH | 2,071,107 | 695,000 | 3,342,000 | 1,691,690 | ||||||||||||||||||||||||||||
| Richmond, VA (FDX) | -0- | 1,160,000 | 6,413,305 | 184,876 | ||||||||||||||||||||||||||||
| West Chester Twp. (Cincinnati), OH | 1,820,753 | 695,000 | 3,342,000 | 1,696,686 | ||||||||||||||||||||||||||||
| Mechanicsville (Richmond), VA | -0- | 1,160,000 | 6,413,305 | 211,706 | ||||||||||||||||||||||||||||
| St. Joseph, MO | -0- | 800,000 | 11,753,964 | 679,742 | -0- | 800,000 | 11,753,964 | 735,306 | ||||||||||||||||||||||||
| Newington (Hartford), CT | -0- | 410,000 | 2,961,000 | 92,824 | -0- | 410,000 | 2,961,000 | 123,108 | ||||||||||||||||||||||||
| Cudahy (Milwaukee), WI | -0- | 980,000 | 5,050,997 | 3,351,364 | -0- | 980,000 | 5,050,997 | 3,351,364 | ||||||||||||||||||||||||
| Beltsville (Washington DC), MD | -0- | 3,200,000 | 5,958,773 | 5,353,582 | ||||||||||||||||||||||||||||
| Beltsville (Washington, DC), MD | -0- | 3,200,000 | 5,958,773 | 5,353,582 | ||||||||||||||||||||||||||||
| Granite City (St. Louis, MO), IL | -0- | 340,000 | 12,046,675 | 156,139 | -0- | 340,000 | 12,046,675 | 311,173 | ||||||||||||||||||||||||
| Winston-Salem, NC | -0- | 980,000 | 5,610,000 | 648,613 | -0- | 980,000 | 5,610,000 | 648,613 | ||||||||||||||||||||||||
| Elgin (Chicago), IL | 349,658 | 1,280,000 | 5,529,488 | 123,428 | -0- | 1,280,000 | 5,529,488 | 167,954 | ||||||||||||||||||||||||
| Tolleson (Phoenix), AZ | 5,299,383 | 1,316,075 | 13,329,000 | 2,179,151 | 4,525,118 | 1,316,075 | 13,329,000 | 2,179,151 | ||||||||||||||||||||||||
| Ft. Myers, FL | -0- | 1,910,000 | 2,499,093 | 608,354 | ||||||||||||||||||||||||||||
| Edwardsville (Kansas City), KS (Carlisle) | 397,513 | 1,185,000 | 5,815,148 | 225,253 | ||||||||||||||||||||||||||||
| Edwardsville (Kansas City), KS (Carlisle Tire) | -0- | 1,185,000 | 5,815,148 | 232,838 | ||||||||||||||||||||||||||||
| Tampa, FL (FDX Ground) | 6,633,049 | 5,000,000 | 12,660,003 | 2,036,099 | 5,910,953 | 5,000,000 | 12,660,003 | 2,036,224 | ||||||||||||||||||||||||
| Denver, CO | 1,059,646 | 1,150,000 | 3,890,300 | 1,313,751 | 746,617 | 1,150,000 | 3,890,300 | 1,313,751 | ||||||||||||||||||||||||
| Hanahan (Charleston), SC (SAIC) | 5,605,514 | 1,129,000 | 11,831,321 | 380,271 | -0- | 1,129,000 | 11,831,321 | 414,120 | ||||||||||||||||||||||||
| Hanahan (Charleston), SC (FDX Ground) | 1,064,185 | 930,000 | 3,426,362 | 3,258,291 | 773,234 | 930,000 | 3,426,362 | 3,258,291 | ||||||||||||||||||||||||
| Augusta, GA (FDX Ground) | 774,093 | 614,406 | 3,026,409 | 1,713,219 | 562,454 | 614,406 | 3,026,409 | 1,722,490 | ||||||||||||||||||||||||
| Huntsville, AL | 795,594 | 748,115 | 2,724,418 | 3,132,598 | 589,073 | 748,115 | 2,724,418 | 3,189,278 | ||||||||||||||||||||||||
| Richfield (Cleveland), OH | 3,078,731 | 2,676,848 | 7,197,945 | 6,560,685 | 2,724,856 | 2,676,848 | 7,197,945 | 6,560,685 | ||||||||||||||||||||||||
| Colorado Springs, CO | 1,329,709 | 1,270,000 | 3,821,000 | 2,113,472 | 1,043,704 | 1,270,000 | 3,821,000 | 2,113,472 | ||||||||||||||||||||||||
| Tampa, FL (FDX) | 3,900,447 | 2,830,000 | 4,704,531 | 58,330 | 3,654,913 | 2,830,000 | 4,704,531 | 85,393 | ||||||||||||||||||||||||
| Griffin (Atlanta), GA | -0- | 760,000 | 13,692,115 | 416,742 | -0- | 760,000 | 13,692,115 | 416,742 | ||||||||||||||||||||||||
| Roanoke, VA (CHEP) | 2,519,243 | 1,853,000 | 4,817,298 | 735,149 | ||||||||||||||||||||||||||||
| Roanoke, VA (CHEP USA) | -0- | 1,853,000 | 4,817,298 | 735,149 | ||||||||||||||||||||||||||||
| Orion, MI | 8,580,058 | 4,649,971 | 13,053,289 | 5,182,376 | -0- | 4,649,971 | 13,053,289 | 5,182,376 | ||||||||||||||||||||||||
| Carlstadt, NJ (New York, NY) | 1,898,198 | 1,194,000 | 3,645,501 | 64,088 | ||||||||||||||||||||||||||||
| Carlstadt (New York, NY), NJ | 1,743,353 | 1,194,000 | 3,645,501 | 64,088 | ||||||||||||||||||||||||||||
| Wheeling (Chicago), IL | -0- | 5,112,120 | 9,186,606 | 4,238,926 | -0- | 5,112,120 | 9,186,606 | 4,238,926 | ||||||||||||||||||||||||
| White Bear Lake (Minneapolis/St. Paul), MN | -0- | 1,393,000 | 3,764,126 | -0- | ||||||||||||||||||||||||||||
| Cheektowaga (Buffalo),NY | 343,548 | 4,796,765 | 3,883,971 | 2,280,087 | ||||||||||||||||||||||||||||
| Richmond, VA (Carrier) | -0- | 446,000 | 3,910,500 | 411,809 | ||||||||||||||||||||||||||||
| Cheektowaga (Buffalo), NY | -0- | 4,796,765 | 3,883,971 | 2,280,087 | ||||||||||||||||||||||||||||
| Richmond, VA | -0- | 446,000 | 3,910,500 | 411,809 | ||||||||||||||||||||||||||||
| Montgomery (Chicago), IL | -0- | 2,000,000 | 9,225,683 | 72,684 | -0- | 2,000,000 | 9,225,683 | 72,684 | ||||||||||||||||||||||||
| Tampa, FL (TB Grand Prix) | -0- | 1,867,000 | 3,684,794 | 126,188 | ||||||||||||||||||||||||||||
| Tampa, FL (Tampa Bay Grand Prix) | -0- | 1,867,000 | 3,684,794 | 126,188 | ||||||||||||||||||||||||||||
| Augusta, GA (FDX) | -0- | 380,000 | 1,400,943 | 190,789 | -0- | 380,000 | 1,400,943 | 196,836 | ||||||||||||||||||||||||
| Lakeland, FL | -0- | 261,000 | 1,621,163 | 100,369 | -0- | 261,000 | 1,621,163 | 100,369 | ||||||||||||||||||||||||
| El Paso, TX | 3,259,726 | 3,225,195 | 4,514,427 | 4,691,570 | -0- | 3,225,195 | 4,514,427 | 4,691,570 | ||||||||||||||||||||||||
| Chattanooga, TN | 1,551,081 | 300,000 | 4,464,711 | 247,492 | -0- | 300,000 | 4,464,711 | 251,807 | ||||||||||||||||||||||||
| Bedford Heights (Cleveland), OH | 2,685,791 | 990,000 | 4,893,912 | 979,967 | -0- | 990,000 | 4,893,912 | 1,035,924 | ||||||||||||||||||||||||
| Kansas City, MO (Kellogg) | 2,241,680 | 660,000 | 4,049,832 | 90,642 | ||||||||||||||||||||||||||||
| Punta Gorda, FL | 1,990,764 | -0- | 4,104,915 | 8,350 | -0- | -0- | 4,104,915 | 28,595 | ||||||||||||||||||||||||
| Cocoa, FL | 5,063,864 | 1,881,316 | 8,623,564 | 3,622,569 | -0- | 1,881,316 | 8,623,564 | 3,622,569 | ||||||||||||||||||||||||
| Orlando, FL | 4,098,856 | 2,200,000 | 6,133,800 | 220,632 | ||||||||||||||||||||||||||||
| Topeka, KS | 1,119,836 | -0- | 3,679,843 | -0- | ||||||||||||||||||||||||||||
| Memphis, TN | 5,882,668 | 1,240,887 | 13,380,000 | 1,050 | ||||||||||||||||||||||||||||
| Houston, TX | 2,619,835 | 1,661,120 | 6,320,000 | 167,338 | ||||||||||||||||||||||||||||
| Carrollton (Dallas), TX | 7,233,486 | 1,500,000 | 16,240,000 | 79,203 | ||||||||||||||||||||||||||||
| Ft. Mill (Charlotte, NC), SC | 1,346,845 | 1,670,000 | 10,045,000 | 3,698,307 | ||||||||||||||||||||||||||||
| Lebanon (Nashville), TN | 7,446,653 | 2,230,000 | 11,985,126 | -0- | ||||||||||||||||||||||||||||
| Rockford, IL (Sherwin-Williams Co.) | -0- | 1,100,000 | 4,440,000 | 11,227 | ||||||||||||||||||||||||||||
| Edinburg, TX | -0- | 1,000,000 | 6,414,000 | 4,625,014 | ||||||||||||||||||||||||||||
| 145 |
MONMOUTH REAL ESTATE INVESTMENT CORPORATION
SCHEDULE III
REAL ESTATE AND ACCUMULATED DEPRECIATION
SEPTEMBER 30, 20162017
| Column A | Column B | Column C | Column D | Column B | Column C | Column D | ||||||||||||||||||||||||||
| Capitalization | Capitalization | |||||||||||||||||||||||||||||||
| Buildings and | Subsequent to | Buildings and | Subsequent to | |||||||||||||||||||||||||||||
| Description | Encumbrances | Land | Improvements | Acquisition | Encumbrances | Land | Improvements | Acquisition | ||||||||||||||||||||||||
| Orlando, FL | $ | 4,342,604 | $ | 2,200,000 | $ | 6,133,800 | $ | 220,632 | ||||||||||||||||||||||||
| Topeka, KS | 1,363,023 | -0- | 3,679,843 | -0- | ||||||||||||||||||||||||||||
| Memphis, TN | 6,667,886 | 1,240,887 | 13,380,000 | -0- | ||||||||||||||||||||||||||||
| Houston, TX | 3,124,904 | 1,730,000 | 6,320,000 | 33,107 | ||||||||||||||||||||||||||||
| Carrollton (Dallas), TX | 7,960,781 | 1,500,000 | 16,240,000 | 29,106 | ||||||||||||||||||||||||||||
| Ft. Mill (Charlotte, NC), SC | 1,926,986 | 1,670,000 | 10,045,000 | 3,698,307 | ||||||||||||||||||||||||||||
| Lebanon (Nashville), TN | 7,659,116 | 2,230,000 | 11,985,126 | -0- | ||||||||||||||||||||||||||||
| Rockford, IL (Sherwin-Williams) | -0- | 1,100,000 | 4,440,000 | 11,227 | ||||||||||||||||||||||||||||
| Edinburg, TX | -0- | 1,000,000 | 6,414,000 | 4,009,872 | ||||||||||||||||||||||||||||
| Streetsboro (Cleveland), OH | 10,446,469 | 1,760,000 | 17,840,000 | -0- | $ | 9,887,817 | $ | 1,760,000 | $ | 17,840,000 | $ | -0- | ||||||||||||||||||||
| Corpus Christi, TX | -0- | -0- | 4,764,500 | -0- | -0- | -0- | 4,764,500 | 7,413 | ||||||||||||||||||||||||
| Halfmoon (Albany), NY | 3,786,098 | 1,190,000 | 4,335,600 | -0- | -0- | 1,190,000 | 4,335,600 | -0- | ||||||||||||||||||||||||
| Lebanon (Cincinnati), OH | 2,592,182 | 240,000 | 4,176,000 | 36,425 | -0- | 240,000 | 4,176,000 | 36,425 | ||||||||||||||||||||||||
| Olive Branch, MS (Memphis, TN) (Anda) | 8,750,368 | 800,000 | 13,750,000 | -0- | ||||||||||||||||||||||||||||
| Oklahoma City, OK | 4,401,832 | 1,410,000 | 8,043,000 | 3,127,262 | ||||||||||||||||||||||||||||
| Olive Branch (Memphis, TN), MS (Anda) | 8,171,480 | 800,000 | 13,750,000 | -0- | ||||||||||||||||||||||||||||
| Oklahoma City, OK (FDX Ground) | 3,919,663 | 1,410,000 | 8,043,000 | 3,131,462 | ||||||||||||||||||||||||||||
| Waco, TX | 4,799,919 | 1,350,000 | 7,383,000 | 3,813,157 | 4,524,045 | 1,350,000 | 7,383,000 | 3,818,368 | ||||||||||||||||||||||||
| Livonia (Detroit), MI | 7,503,400 | 320,000 | 13,380,000 | 62,030 | 6,912,375 | 320,000 | 13,380,000 | 62,030 | ||||||||||||||||||||||||
| Olive Branch, MS (Memphis, TN) (Milwaukee Tool) | 25,000,000 | 2,550,000 | 24,818,816 | 9,546,101 | ||||||||||||||||||||||||||||
| Olive Branch (Memphis, TN), MS (Milwaukee Tool) | 23,461,936 | 2,550,000 | 24,818,816 | 9,546,101 | ||||||||||||||||||||||||||||
| Roanoke, VA (FDX Ground) | 5,321,390 | 1,740,000 | 8,460,000 | -0- | 4,867,194 | 1,740,000 | 8,460,000 | -0- | ||||||||||||||||||||||||
| Green Bay, WI | 3,260,401 | 590,000 | 5,980,000 | -0- | 2,956,605 | 590,000 | 5,980,000 | -0- | ||||||||||||||||||||||||
| Stewartville (Rochester), MN | 2,612,978 | 900,000 | 4,320,000 | -0- | 2,369,334 | 900,000 | 4,320,000 | -0- | ||||||||||||||||||||||||
| Tulsa, OK | 1,934,175 | 790,000 | 2,910,000 | 48,031 | 1,812,575 | 790,000 | 2,910,000 | 48,031 | ||||||||||||||||||||||||
| Buckner (Louisville), KY | 16,694,846 | 2,280,000 | 24,353,125 | 134,727 | 16,014,719 | 2,280,000 | 24,353,125 | 174,727 | ||||||||||||||||||||||||
| Edwardsville (Kansas City), KS (International Paper) | 10,648,115 | 2,750,000 | 15,335,492 | 208,616 | 9,931,292 | 2,750,000 | 15,335,492 | 208,616 | ||||||||||||||||||||||||
| Altoona, PA | 4,017,147 | 1,200,000 | 7,790,000 | 18,650 | 3,642,839 | 1,200,000 | 7,790,000 | 18,650 | ||||||||||||||||||||||||
| Spring (Houston), TX | 9,126,834 | 1,890,000 | 13,391,318 | 4,002,480 | 8,537,878 | 1,890,000 | 13,391,318 | 4,002,480 | ||||||||||||||||||||||||
| Indianapolis, IN (FDX Ground) | 12,289,676 | 3,500,000 | 20,446,000 | -0- | 11,381,906 | 3,739,030 | 20,446,000 | 821,342 | ||||||||||||||||||||||||
| Sauget (St. Louis, MO), IL | 9,701,419 | 1,890,000 | 13,310,000 | 4,950 | 9,145,097 | 1,890,000 | 13,310,000 | 4,950 | ||||||||||||||||||||||||
| Lindale (Tyler), TX | 6,378,382 | 540,000 | 9,390,000 | -0- | 6,016,758 | 540,000 | 9,390,000 | 6,500 | ||||||||||||||||||||||||
| Kansas City, MO (Bunzl) | 6,958,091 | 1,000,000 | 8,600,000 | -0- | 6,799,803 | 1,000,000 | 8,600,000 | 51,226 | ||||||||||||||||||||||||
| Frankfort (Lexington), KY | 18,352,289 | 1,850,000 | 26,150,000 | -0- | 17,560,855 | 1,850,000 | 26,150,000 | -0- | ||||||||||||||||||||||||
| Jacksonville, FL (FDX Ground) | 18,453,112 | 6,000,000 | 24,645,954 | -0- | 17,370,102 | 6,000,000 | 24,645,954 | 86,136 | ||||||||||||||||||||||||
| Monroe (Cincinnati), OH | 8,071,987 | 1,800,000 | 11,137,000 | -0- | 7,608,083 | 1,800,000 | 11,137,000 | -0- | ||||||||||||||||||||||||
| Greenwood (Indianapolis), IN | 22,760,488 | 2,250,000 | 35,234,574 | 15,817 | 21,485,141 | 2,250,000 | 35,234,574 | 27,497 | ||||||||||||||||||||||||
| Ft. Worth (Dallas), TX | 23,431,093 | 8,200,000 | 27,100,832 | -0- | 22,116,268 | 8,200,000 | 27,100,832 | -0- | ||||||||||||||||||||||||
| Cincinnati, OH | -0- | 800,000 | 5,950,000 | -0- | -0- | 800,000 | 5,950,000 | -0- | ||||||||||||||||||||||||
| Rockford, IL (B/E Aerospace) | -0- | 480,000 | 4,620,000 | -0- | ||||||||||||||||||||||||||||
| Rockford, IL (Collins Aerospace Systems) | -0- | 480,000 | 4,620,000 | -0- | ||||||||||||||||||||||||||||
| Concord (Charlotte), NC | 20,001,944 | 4,305,000 | 27,670,897 | -0- | 18,928,835 | 4,305,000 | 27,670,897 | 1,068,900 | ||||||||||||||||||||||||
| Covington (New Orleans), LA | 12,468,713 | 2,720,000 | 15,690,000 | -0- | 11,814,941 | 2,720,000 | 15,690,000 | -0- | ||||||||||||||||||||||||
| Imperial (Pittsburgh), PA | 12,700,739 | 3,700,000 | 16,250,000 | -0- | 11,963,800 | 3,700,000 | 16,250,000 | -0- | ||||||||||||||||||||||||
| Burlington (Seattle/Everett), WA | 19,881,817 | 8,000,000 | 22,210,680 | -0- | 18,839,050 | 8,000,000 | 22,210,680 | 17,867 | ||||||||||||||||||||||||
| Colorado Springs, CO | 18,576,282 | 2,150,000 | 26,350,000 | -0- | 17,632,728 | 2,150,000 | 26,350,000 | -0- | ||||||||||||||||||||||||
| Louisville, KY | 7,288,891 | 1,590,000 | 9,714,000 | -0- | 6,914,142 | 1,590,000 | 9,714,000 | -0- | ||||||||||||||||||||||||
| Davenport (Orlando), FL | 26,400,000 | 7,060,000 | 30,720,000 | -0- | 25,077,642 | 7,060,000 | 30,720,000 | -0- | ||||||||||||||||||||||||
| Olathe (Kansas City), KS | 22,215,000 | 2,350,000 | 29,387,000 | -0- | 21,108,249 | 2,350,000 | 29,387,000 | -0- | ||||||||||||||||||||||||
| Hamburg (Buffalo), NY | 22,532,881 | 1,700,000 | 33,150,000 | -0- | ||||||||||||||||||||||||||||
| Ft. Myers, FL (FDX Ground) | 14,021,964 | 2,400,000 | 18,400,000 | 823,000 | ||||||||||||||||||||||||||||
| Walker (Grand Rapids), MI | 20,530,135 | 4,034,363 | 27,620,623 | -0- | ||||||||||||||||||||||||||||
| Mesquite (Dallas), TX | 32,623,355 | 6,247,658 | 43,632,835 | -0- | ||||||||||||||||||||||||||||
| Aiken (Augusta, GA), SC | 15,227,062 | 1,362,458 | 19,677,937 | -0- | ||||||||||||||||||||||||||||
| Homestead (Miami), FL | 24,591,465 | 4,426,727 | 33,446,393 | -0- | ||||||||||||||||||||||||||||
| Oklahoma City, OK (Bunzl) | 5,935,346 | 844,688 | 7,883,751 | -0- | ||||||||||||||||||||||||||||
| Concord (Charlotte), NC | 26,184,000 | 4,306,684 | 35,736,461 | -0- | ||||||||||||||||||||||||||||
| Kenton, OH | 12,000,000 | 854,780 | 17,026,827 | -0- | ||||||||||||||||||||||||||||
| Stow, OH | 12,700,000 | 1,429,715 | 17,504,350 | -0- | ||||||||||||||||||||||||||||
| Shopping Center | ||||||||||||||||||||||||||||||||
| Somerset, NJ | -0- | 34,316 | 637,097 | 2,401,468 | -0- | 34,317 | 637,097 | 2,401,476 | ||||||||||||||||||||||||
| Vacant Land | ||||||||||||||||||||||||||||||||
| Shelby County, TN | -0- | 11,065 | -0- | -0- | -0- | 11,065 | -0- | -0- | ||||||||||||||||||||||||
| $ | 483,748,153 | $ | 165,375,315 | $ | 903,845,280 | $ | 102,092,900 | $ | 598,962,567 | $ | 188,494,819 | $ | 1,144,634,034 | $ | 105,992,153 | |||||||||||||||||
| Real Estate Held for Sale | ||||||||||||||||||||||||||||||||
| Orangeburg (New York), NY | -0- | 694,720 | 2,977,372 | 223,583 | ||||||||||||||||||||||||||||
| Ft. Myers, FL (Vacant) | -0- | 1,910,000 | 2,499,093 | 608,354 | ||||||||||||||||||||||||||||
| Kansas City, MO (Kellogg) | -0- | 660,000 | 4,049,832 | 90,642 | ||||||||||||||||||||||||||||
| $ | -0- | $ | 3,264,720 | $ | 9,526,297 | $ | 922,579 | |||||||||||||||||||||||||
| $ | 598,962,567 | $ | 191,759,539 | $ | 1,154,160,331 | $ | 106,914,732 | |||||||||||||||||||||||||
| 146 |
MONMOUTH REAL ESTATE INVESTMENT CORPORATION
SCHEDULE III
REAL ESTATE AND ACCUMULATED DEPRECIATION
SEPTEMBER 30, 20162017
| Column A | Column E (1) (2) | Column E (1) (2) | ||||||||||||||||||||||
| Gross Amount at Which Carried | Gross Amount at Which Carried | |||||||||||||||||||||||
| September 30, 2016 | September 30, 2017 | |||||||||||||||||||||||
| Description | Land | Bldg & Imp | Total | Land | Bldg & Imp | Total | ||||||||||||||||||
| Industrial Buildings | ||||||||||||||||||||||||
| Monaca (Pittsburgh), PA | $ | 401,716 | $ | 7,404,507 | $ | 7,806,223 | $ | 401,716 | $ | 7,484,125 | $ | 7,885,841 | ||||||||||||
| Orangeburg (New York), NY | 694,720 | 3,200,955 | 3,895,675 | |||||||||||||||||||||
| Ridgeland (Jackson), MS | 218,000 | 1,640,591 | 1,858,591 | 218,000 | 1,640,591 | 1,858,591 | ||||||||||||||||||
| Urbandale (Des Moines), IA | 310,000 | 1,851,895 | 2,161,895 | |||||||||||||||||||||
| Urbandale (Des Moines), IA (Vacant) | 310,000 | 1,946,613 | 2,256,613 | |||||||||||||||||||||
| Richland (Jackson), MS | 211,000 | 1,689,691 | 1,900,691 | 211,000 | 1,689,691 | 1,900,691 | ||||||||||||||||||
| O’Fallon (St. Louis), MO | 264,000 | 3,981,913 | 4,245,913 | 264,000 | 3,981,913 | 4,245,913 | ||||||||||||||||||
| Fayetteville, NC | 172,000 | 5,269,876 | 5,441,876 | 172,000 | 5,279,629 | 5,451,629 | ||||||||||||||||||
| Schaumburg (Chicago), IL | 1,039,800 | 3,941,614 | 4,981,414 | 1,039,800 | 4,138,140 | 5,177,940 | ||||||||||||||||||
| Burr Ridge (Chicago), IL | 270,000 | 1,422,901 | 1,692,901 | 270,000 | 1,422,901 | 1,692,901 | ||||||||||||||||||
| Romulus (Detroit), MI | 531,000 | 4,069,532 | 4,600,532 | 531,000 | 4,136,506 | 4,667,506 | ||||||||||||||||||
| Liberty (Kansas City), MO | 723,000 | 6,674,881 | 7,397,881 | 723,000 | 6,674,881 | 7,397,881 | ||||||||||||||||||
| Omaha, NE | 1,170,000 | 4,774,691 | 5,944,691 | 1,170,000 | 4,774,691 | 5,944,691 | ||||||||||||||||||
| Charlottesville, VA | 1,170,000 | 3,178,499 | 4,348,499 | 1,170,000 | 3,186,988 | 4,356,988 | ||||||||||||||||||
| Jacksonville, FL (FDX) | 1,165,000 | 5,081,404 | 6,246,404 | 1,165,000 | 5,164,784 | 6,329,784 | ||||||||||||||||||
| West Chester Twp (Cincinnati), OH | 695,000 | 5,033,690 | 5,728,690 | |||||||||||||||||||||
| Richmond, VA (FDX) | 1,160,000 | 6,598,181 | 7,758,181 | |||||||||||||||||||||
| West Chester Twp. (Cincinnati), OH | 695,000 | 5,038,686 | 5,733,686 | |||||||||||||||||||||
| Mechanicsville (Richmond), VA | 1,160,000 | 6,625,011 | 7,785,011 | |||||||||||||||||||||
| St. Joseph, MO | 800,000 | 12,433,706 | 13,233,706 | 800,000 | 12,489,270 | 13,289,270 | ||||||||||||||||||
| Newington (Hartford), CT | 410,000 | 3,053,824 | 3,463,824 | 410,000 | 3,084,108 | 3,494,108 | ||||||||||||||||||
| Cudahy (Milwaukee), WI | 980,000 | 8,402,361 | 9,382,361 | 980,000 | 8,402,361 | 9,382,361 | ||||||||||||||||||
| Beltsville (Washington, DC), MD | 3,200,000 | 11,312,355 | 14,512,355 | 3,200,000 | 11,312,355 | 14,512,355 | ||||||||||||||||||
| Granite City (St. Louis, MO), IL | 340,000 | 12,202,814 | 12,542,814 | 340,000 | 12,357,848 | 12,697,848 | ||||||||||||||||||
| Winston-Salem, NC | 980,000 | 6,258,613 | 7,238,613 | 980,000 | 6,258,613 | 7,238,613 | ||||||||||||||||||
| Elgin (Chicago), IL | 1,280,000 | 5,652,916 | 6,932,916 | 1,280,000 | 5,697,442 | 6,977,442 | ||||||||||||||||||
| Tolleson (Phoenix), AZ | 1,316,075 | 15,508,151 | 16,824,226 | 1,316,075 | 15,508,151 | 16,824,226 | ||||||||||||||||||
| Ft. Myers, FL | 1,910,000 | 3,107,447 | 5,017,447 | |||||||||||||||||||||
| Edwardsville (Kansas City), KS (Carlisle) | 1,185,000 | 6,040,401 | 7,225,401 | |||||||||||||||||||||
| Edwardsville (Kansas City), KS (Carlisle Tire) | 1,185,000 | 6,047,986 | 7,232,986 | |||||||||||||||||||||
| Tampa, FL (FDX Ground) | 5,000,000 | 14,696,102 | 19,696,102 | 5,000,000 | 14,696,227 | 19,696,227 | ||||||||||||||||||
| Denver, CO | 1,150,000 | 5,204,051 | 6,354,051 | 1,150,000 | 5,204,051 | 6,354,051 | ||||||||||||||||||
| Hanahan (Charleston), SC (SAIC) | 1,129,000 | 12,211,592 | 13,340,592 | 1,129,000 | 12,245,441 | 13,374,441 | ||||||||||||||||||
| Hanahan (Charleston), SC (FDX Ground) | 930,000 | 6,684,653 | 7,614,653 | 930,000 | 6,684,653 | 7,614,653 | ||||||||||||||||||
| Augusta, GA (FDX Ground) | 614,406 | 4,739,628 | 5,354,034 | 614,406 | 4,748,899 | 5,363,305 | ||||||||||||||||||
| Huntsville, AL | 748,115 | 5,857,016 | 6,605,131 | 748,115 | 5,913,696 | 6,661,811 | ||||||||||||||||||
| Richfield (Cleveland), OH | 2,676,848 | 13,758,630 | 16,435,478 | 2,676,848 | 13,758,630 | 16,435,478 | ||||||||||||||||||
| Colorado Springs, CO | 1,270,000 | 5,934,472 | 7,204,472 | 1,270,000 | 5,934,472 | 7,204,472 | ||||||||||||||||||
| Tampa, FL (FDX) | 2,830,000 | 4,762,861 | 7,592,861 | 2,830,000 | 4,789,924 | 7,619,924 | ||||||||||||||||||
| Griffin (Atlanta) , GA | 760,000 | 14,108,857 | 14,868,857 | |||||||||||||||||||||
| Roanoke, VA (DHL) | 1,853,000 | 5,552,447 | 7,405,447 | |||||||||||||||||||||
| Griffin (Atlanta), GA | 760,000 | 14,108,857 | 14,868,857 | |||||||||||||||||||||
| Roanoke, VA (CHEP USA) | 1,853,000 | 5,552,447 | 7,405,447 | |||||||||||||||||||||
| Orion, MI | 4,649,971 | 18,235,665 | 22,885,636 | 4,649,971 | 18,235,665 | 22,885,636 | ||||||||||||||||||
| Carlstadt, NJ (New York, NY) | 1,194,000 | 3,709,589 | 4,903,589 | |||||||||||||||||||||
| Carlstadt (New York, NY), NJ | 1,194,000 | 3,709,589 | 4,903,589 | |||||||||||||||||||||
| Wheeling (Chicago), IL | 5,112,120 | 13,425,532 | 18,537,652 | 5,112,120 | 13,425,532 | 18,537,652 | ||||||||||||||||||
| White Bear Lake (Minneapolis/St. Paul), MN | 1,393,000 | 3,764,126 | 5,157,126 | |||||||||||||||||||||
| Cheektowaga (Buffalo), NY | 4,796,765 | 6,164,058 | 10,960,823 | 4,796,765 | 6,164,058 | 10,960,823 | ||||||||||||||||||
| Richmond, VA (Carrier) | 446,000 | 4,322,309 | 4,768,309 | |||||||||||||||||||||
| Richmond, VA | 446,000 | 4,322,309 | 4,768,309 | |||||||||||||||||||||
| Montgomery (Chicago), IL | 2,000,000 | 9,298,367 | 11,298,367 | 2,000,000 | 9,298,367 | 11,298,367 | ||||||||||||||||||
| Tampa, FL (TB Grand Prix) | 1,867,000 | 3,810,982 | 5,677,982 | |||||||||||||||||||||
| Tampa, FL (Tampa Bay Grand Prix) | 1,867,000 | 3,810,982 | 5,677,982 | |||||||||||||||||||||
| Augusta, GA (FDX) | 380,000 | 1,591,732 | 1,971,732 | 380,000 | 1,597,779 | 1,977,779 | ||||||||||||||||||
| Lakeland, FL | 261,000 | 1,721,532 | 1,982,532 | 261,000 | 1,721,532 | 1,982,532 | ||||||||||||||||||
| El Paso, TX | 3,225,195 | 9,205,997 | 12,431,192 | 3,225,195 | 9,205,997 | 12,431,192 | ||||||||||||||||||
| Chattanooga, TN | 300,000 | 4,712,203 | 5,012,203 | 300,000 | 4,716,518 | 5,016,518 | ||||||||||||||||||
| Bedford Heights (Cleveland), OH | 990,000 | 5,873,879 | 6,863,879 | 990,000 | 5,929,836 | 6,919,836 | ||||||||||||||||||
| Kansas City, MO | 660,000 | 4,140,474 | 4,800,474 | |||||||||||||||||||||
| Punta Gorda, FL | -0- | 4,113,265 | 4,113,265 | -0- | 4,133,510 | 4,133,510 | ||||||||||||||||||
| Cocoa, FL | 1,881,316 | 12,246,133 | 14,127,449 | 1,881,316 | 12,246,133 | 14,127,449 | ||||||||||||||||||
| Orlando, FL | 2,200,000 | 6,354,432 | 8,554,432 | 2,200,000 | 6,354,432 | 8,554,432 | ||||||||||||||||||
| Topeka, KS | -0- | 3,679,843 | 3,679,843 | |||||||||||||||||||||
| Memphis, TN | 1,240,887 | 13,381,050 | 14,621,937 | |||||||||||||||||||||
| Houston, TX | 1,661,120 | 6,487,338 | 8,148,458 | |||||||||||||||||||||
| Carrollton (Dallas), TX | 1,500,000 | 16,319,203 | 17,819,203 | |||||||||||||||||||||
| Ft. Mill (Charlotte, NC), SC | 1,670,000 | 13,743,307 | 15,413,307 | |||||||||||||||||||||
| Lebanon (Nashville), TN | 2,230,000 | 11,985,126 | 14,215,126 | |||||||||||||||||||||
| Rockford, IL (Sherwin-Williams Co.) | 1,100,000 | 4,451,227 | 5,551,227 | |||||||||||||||||||||
| Edinburg, TX | 1,000,000 | 11,039,014 | 12,039,014 | |||||||||||||||||||||
| 147 |
MONMOUTH REAL ESTATE INVESTMENT CORPORATION
SCHEDULE III
REAL ESTATE AND ACCUMULATED DEPRECIATION
SEPTEMBER 30, 20162017
| Column A | Column E (1) (2) | Column E (1) (2) | ||||||||||||||||||||||
| Gross Amount at Which Carried | Gross Amount at Which Carried | |||||||||||||||||||||||
| September 30, 2016 | September 30, 2017 | |||||||||||||||||||||||
| Description | Land | Bldg & Imp | Total | Land | Bldg & Imp | Total | ||||||||||||||||||
| Topeka, KS | $ | -0- | $ | 3,679,843 | $ | 3,679,843 | ||||||||||||||||||
| Memphis, TN | 1,240,887 | 13,380,000 | 14,620,887 | |||||||||||||||||||||
| Houston, TX | 1,730,000 | 6,353,107 | 8,083,107 | |||||||||||||||||||||
| Carrollton (Dallas), TX | 1,500,000 | 16,269,106 | 17,769,106 | |||||||||||||||||||||
| Ft. Mill (Charlotte, NC), SC | 1,670,000 | 13,743,307 | 15,413,307 | |||||||||||||||||||||
| Lebanon (Nashville), TN | 2,230,000 | 11,985,126 | 14,215,126 | |||||||||||||||||||||
| Rockford, IL (Sherwin-Williams) | 1,100,000 | 4,451,227 | 5,551,227 | |||||||||||||||||||||
| Edinburg, TX | 1,000,000 | 10,423,872 | 11,423,872 | |||||||||||||||||||||
| Streetsboro (Cleveland), OH | 1,760,000 | 17,840,000 | 19,600,000 | $ | 1,760,000 | $ | 17,840,000 | $ | 19,600,000 | |||||||||||||||
| Corpus Christi, TX | -0- | 4,764,500 | 4,764,500 | -0- | 4,771,913 | 4,771,913 | ||||||||||||||||||
| Halfmoon (Albany), NY | 1,190,000 | 4,335,600 | 5,525,600 | 1,190,000 | 4,335,600 | 5,525,600 | ||||||||||||||||||
| Lebanon (Cincinnati), OH | 240,000 | 4,212,425 | 4,452,425 | 240,000 | 4,212,425 | 4,452,425 | ||||||||||||||||||
| Olive Branch, MS (Memphis, TN) (Anda) | 800,000 | 13,750,000 | 14,550,000 | |||||||||||||||||||||
| Oklahoma City, OK | 1,410,000 | 11,170,262 | 12,580,262 | |||||||||||||||||||||
| Olive Branch (Memphis, TN), MS (Anda Pharmaceuticals Inc.) | 800,000 | 13,750,000 | 14,550,000 | |||||||||||||||||||||
| Oklahoma City, OK (FDX Ground) | 1,410,000 | 11,174,462 | 12,584,462 | |||||||||||||||||||||
| Waco, TX | 1,350,000 | 11,196,157 | 12,546,157 | 1,350,000 | 11,201,368 | 12,551,368 | ||||||||||||||||||
| Livonia (Detroit), MI | 320,000 | 13,442,030 | 13,762,030 | 320,000 | 13,442,030 | 13,762,030 | ||||||||||||||||||
| Olive Branch, MS (Memphis, TN) (Milwaukee Tool) | 2,550,000 | 34,364,917 | 36,914,917 | |||||||||||||||||||||
| Olive Branch (Memphis, TN), MS (Milwaukee Tool) | 2,550,000 | 34,364,917 | 36,914,917 | |||||||||||||||||||||
| Roanoke, VA (FDX Ground) | 1,740,000 | 8,460,000 | 10,200,000 | 1,740,000 | 8,460,000 | 10,200,000 | ||||||||||||||||||
| Green Bay, WI | 590,000 | 5,980,000 | 6,570,000 | 590,000 | 5,980,000 | 6,570,000 | ||||||||||||||||||
| Stewartville (Rochester), MN | 900,000 | 4,320,000 | 5,220,000 | 900,000 | 4,320,000 | 5,220,000 | ||||||||||||||||||
| Tulsa, OK | 790,000 | 2,958,031 | 3,748,031 | 790,000 | 2,958,031 | 3,748,031 | ||||||||||||||||||
| Buckner (Louisville), KY | 2,280,000 | 24,487,852 | 26,767,852 | 2,280,000 | 24,527,852 | 26,807,852 | ||||||||||||||||||
| Edwardsville (Kansas City), KS (International Paper) | 2,750,000 | 15,544,108 | 18,294,108 | 2,750,000 | 15,544,108 | 18,294,108 | ||||||||||||||||||
| Altoona, PA | 1,200,000 | 7,808,650 | 9,008,650 | 1,200,000 | 7,808,650 | 9,008,650 | ||||||||||||||||||
| Spring (Houston), TX | 1,890,000 | 17,393,798 | 19,283,798 | 1,890,000 | 17,393,798 | 19,283,798 | ||||||||||||||||||
| Indianapolis, IN (FDX Ground) | 3,500,000 | 20,446,000 | 23,946,000 | 3,739,030 | 21,267,342 | 25,006,372 | ||||||||||||||||||
| Sauget (St. Louis, MO), IL | 1,890,000 | 13,314,950 | 15,204,950 | 1,890,000 | 13,314,950 | 15,204,950 | ||||||||||||||||||
| Lindale (Tyler), TX | 540,000 | 9,390,000 | 9,930,000 | 540,000 | 9,396,500 | 9,936,500 | ||||||||||||||||||
| Kansas City, MO (Bunzl) | 1,000,000 | 8,600,000 | 9,600,000 | 1,000,000 | 8,651,226 | 9,651,226 | ||||||||||||||||||
| Frankfort (Lexington), KY | 1,850,000 | 26,150,000 | 28,000,000 | 1,850,000 | 26,150,000 | 28,000,000 | ||||||||||||||||||
| Jacksonville, FL (FDX Ground) | 6,000,000 | 24,645,954 | 30,645,954 | 6,000,000 | 24,732,090 | 30,732,090 | ||||||||||||||||||
| Monroe (Cincinnati), OH | 1,800,000 | 11,137,000 | 12,937,000 | 1,800,000 | 11,137,000 | 12,937,000 | ||||||||||||||||||
| Greenwood (Indianapolis), IN | 2,250,000 | 35,250,391 | 37,500,391 | 2,250,000 | 35,262,071 | 37,512,071 | ||||||||||||||||||
| Ft. Worth (Dallas), TX | 8,200,000 | 27,100,832 | 35,300,832 | 8,200,000 | 27,100,832 | 35,300,832 | ||||||||||||||||||
| Cincinnati, OH | 800,000 | 5,950,000 | 6,750,000 | 800,000 | 5,950,000 | 6,750,000 | ||||||||||||||||||
| Rockford, IL (B/E Aerospace) | 480,000 | 4,620,000 | 5,100,000 | |||||||||||||||||||||
| Rockford, IL (Collins Aerospace Systems-United Technologies) | 480,000 | 4,620,000 | 5,100,000 | |||||||||||||||||||||
| Concord (Charlotte), NC | 4,305,000 | 27,670,897 | 31,975,897 | 4,305,000 | 28,739,797 | 33,044,797 | ||||||||||||||||||
| Covington (New Orleans), LA | 2,720,000 | 15,690,000 | 18,410,000 | 2,720,000 | 15,690,000 | 18,410,000 | ||||||||||||||||||
| Imperial (Pittsburgh), PA | 3,700,000 | 16,250,000 | 19,950,000 | 3,700,000 | 16,250,000 | 19,950,000 | ||||||||||||||||||
| Burlington (Seattle/Everett), WA | 8,000,000 | 22,210,680 | 30,210,680 | 8,000,000 | 22,228,547 | 30,228,547 | ||||||||||||||||||
| Colorado Springs, CO | 2,150,000 | 26,350,000 | 28,500,000 | 2,150,000 | 26,350,000 | 28,500,000 | ||||||||||||||||||
| Louisville, KY | 1,590,000 | 9,714,000 | 11,304,000 | 1,590,000 | 9,714,000 | 11,304,000 | ||||||||||||||||||
| Davenport (Orlando), FL | 7,060,000 | 30,720,000 | 37,780,000 | 7,060,000 | 30,720,000 | 37,780,000 | ||||||||||||||||||
| Olathe (Kansas City), KS | 2,350,000 | 29,387,000 | 31,737,000 | 2,350,000 | 29,387,000 | 31,737,000 | ||||||||||||||||||
| Hamburg (Buffalo), NY | 1,700,000 | 33,150,000 | 34,850,000 | |||||||||||||||||||||
| Ft. Myers, FL (FDX Ground) | 2,400,000 | 19,223,000 | 21,623,000 | |||||||||||||||||||||
| Walker (Grand Rapids), MI | 4,034,363 | 27,620,623 | 31,654,986 | |||||||||||||||||||||
| Mesquite (Dallas), TX | 6,247,658 | 43,632,835 | 49,880,493 | |||||||||||||||||||||
| Aiken (Augusta, GA), SC | 1,362,458 | 19,677,937 | 21,040,395 | |||||||||||||||||||||
| Homestead (Miami), FL | 4,426,727 | 33,446,393 | 37,873,120 | |||||||||||||||||||||
| Oklahoma City, OK (Bunzl) | 844,688 | 7,883,751 | 8,728,439 | |||||||||||||||||||||
| Concord (Charlotte), NC | 4,306,684 | 35,736,461 | 40,043,145 | |||||||||||||||||||||
| Kenton, OH | 854,780 | 17,026,827 | 17,881,607 | |||||||||||||||||||||
| Stow, OH | 1,429,715 | 17,504,350 | 18,934,065 | |||||||||||||||||||||
| Shopping Center | ||||||||||||||||||||||||
| Somerset, NJ | 34,316 | 3,038,565 | 3,072,881 | 34,317 | 3,038,573 | 3,072,890 | ||||||||||||||||||
| Vacant Land | ||||||||||||||||||||||||
| Shelby County, TN | 11,065 | -0- | 11,065 | 11,065 | -0- | 11,065 | ||||||||||||||||||
| $ | 165,375,315 | $ | 1,005,938,180 | $ | 1,171,313,495 | $ | 188,494,819 | $ | 1,250,626,187 | $ | 1,439,121,006 | |||||||||||||
| Real Estate Held for Sale | ||||||||||||||||||||||||
| Orangeburg (New York), NY | 694,720 | 3,200,955 | 3,895,675 | |||||||||||||||||||||
| Ft. Myers, FL (Vacant) | 1,910,000 | 3,107,447 | 5,017,447 | |||||||||||||||||||||
| Kansas City, MO (Kellogg) | 660,000 | 4,140,474 | 4,800,474 | |||||||||||||||||||||
| $ | 3,264,720 | $ | 10,448,876 | $ | 13,713,596 | |||||||||||||||||||
| $ | 191,759,539 | $ | 1,261,075,063 | $ | 1,452,834,602 | |||||||||||||||||||
(1) See pages 153-155 for reconciliation.
(2) The aggregate cost for Federal tax purposes approximates historical cost.
| 148 |
MONMOUTH REAL ESTATE INVESTMENT CORPORATION
SCHEDULE III
REAL ESTATE AND ACCUMULATED DEPRECIATION
SEPTEMBER 30, 20162017
| Column A | Column F | Column G | Column H | Column I | Column F | Column G | Column H | Column I | ||||||||||||||||||||||||
| Accumulated | Date of | Date | Depreciable | Accumulated | Date of | Date | Depreciable | |||||||||||||||||||||||||
| Description | Depreciation | Construction | Acquired | Life | Depreciation | Construction | Acquired | Life | ||||||||||||||||||||||||
| Industrial Buildings | ||||||||||||||||||||||||||||||||
| Monaca (Pittsburgh), PA | $ | 2,331,288 | 1977 | 1977 | 5-31.5 | 2,642,181 | 1977 | 1977 | (3 | ) | ||||||||||||||||||||||
| Orangeburg (New York), NY | 2,319,253 | 1990 | 1993 | 31.5 | ||||||||||||||||||||||||||||
| Ridgeland (Jackson), MS | 1,177,386 | 1988 | 1993 | 39 | 1,246,001 | 1988 | 1993 | (3 | ) | |||||||||||||||||||||||
| Urbandale (Des Moines), IA | 1,094,293 | 1985 | 1994 | 39 | ||||||||||||||||||||||||||||
| Urbandale (Des Moines), IA (Vacant) | 1,144,794 | 1985 | 1994 | (3 | ) | |||||||||||||||||||||||||||
| Richland (Jackson), MS | 826,199 | 1986 | 1994 | 39 | 904,133 | 1986 | 1994 | (3 | ) | |||||||||||||||||||||||
| O’Fallon (St. Louis), MO | 2,096,073 | 1989 | 1994 | 39 | 2,228,921 | 1989 | 1994 | (3 | ) | |||||||||||||||||||||||
| Fayetteville, NC | 2,458,876 | 1996 | 1997 | 39 | 2,698,223 | 1996 | 1997 | (3 | ) | |||||||||||||||||||||||
| Schaumburg (Chicago), IL | 2,037,309 | 1997 | 1997 | 39 | 2,159,563 | 1997 | 1997 | (3 | ) | |||||||||||||||||||||||
| Burr Ridge (Chicago), IL | 656,159 | 1997 | 1997 | 39 | 698,725 | 1997 | 1997 | (3 | ) | |||||||||||||||||||||||
| Romulus (Detroit), MI | 1,804,248 | 1998 | 1998 | 39 | 1,922,903 | 1998 | 1998 | (3 | ) | |||||||||||||||||||||||
| Liberty (Kansas City), MO | 3,152,489 | 1997 | 1998 | 39 | 3,325,236 | 1997 | 1998 | (3 | ) | |||||||||||||||||||||||
| Omaha, NE | 2,109,230 | 1999 | 1999 | 39 | 2,233,901 | 1999 | 1999 | (3 | ) | |||||||||||||||||||||||
| Charlottesville, VA | 1,393,226 | 1998 | 1999 | 39 | 1,489,266 | 1998 | 1999 | (3 | ) | |||||||||||||||||||||||
| Jacksonville, FL (FDX) | 2,295,680 | 1998 | 1999 | 39 | 2,450,615 | 1998 | 1999 | (3 | ) | |||||||||||||||||||||||
| West Chester Twp (Cincinnati), OH | 1,947,128 | 1999 | 2000 | 39 | ||||||||||||||||||||||||||||
| Richmond, VA (FDX) | 2,644,156 | 2000 | 2001 | 39 | ||||||||||||||||||||||||||||
| West Chester Twp. (Cincinnati), OH | 2,125,801 | 1999 | 2000 | (3 | ) | |||||||||||||||||||||||||||
| Mechanicsville (Richmond), VA | 2,824,533 | 2000 | 2001 | (3 | ) | |||||||||||||||||||||||||||
| St. Joseph, MO | 4,756,910 | 2000 | 2001 | 39 | 5,101,907 | 2000 | 2001 | (3 | ) | |||||||||||||||||||||||
| Newington (Hartford), CT | 1,207,938 | 2001 | 2001 | 39 | 1,288,391 | 2001 | 2001 | (3 | ) | |||||||||||||||||||||||
| Cudahy (Milwaukee), WI | 2,853,810 | 2001 | 2001 | 39 | 3,075,370 | 2001 | 2001 | (3 | ) | |||||||||||||||||||||||
| Beltsville (Washington, DC), MD | 3,536,076 | 2000 | 2001 | 39 | 3,843,707 | 2000 | 2001 | (3 | ) | |||||||||||||||||||||||
| Granite City (St. Louis, MO), IL | 4,485,359 | 2001 | 2001 | 39 | 4,834,280 | 2001 | 2001 | (3 | ) | |||||||||||||||||||||||
| Winston-Salem, NC | 2,185,430 | 2001 | 2002 | 39 | 2,401,589 | 2001 | 2002 | (3 | ) | |||||||||||||||||||||||
| Elgin (Chicago), IL | 2,124,899 | 2002 | 2002 | 39 | 2,284,344 | 2002 | 2002 | (3 | ) | |||||||||||||||||||||||
| Tolleson (Phoenix), AZ | 5,115,610 | 2002 | 2002 | 39 | 5,634,312 | 2002 | 2002 | (3 | ) | |||||||||||||||||||||||
| Ft. Myers, FL | 991,678 | 1974 | 2002 | 39 | ||||||||||||||||||||||||||||
| Edwardsville (Kansas City), KS (Carlisle) | 2,158,091 | 2002 | 2003 | 39 | ||||||||||||||||||||||||||||
| Edwardsville (Kansas City), KS (Carlisle Tire) | 2,358,818 | 2002 | 2003 | (3 | ) | |||||||||||||||||||||||||||
| Tampa, FL (FDX Ground) | 4,161,734 | 2004 | 2004 | 39 | 4,544,868 | 2004 | 2004 | (3 | ) | |||||||||||||||||||||||
| Denver, CO | 1,437,516 | 2005 | 2005 | 39 | 1,570,819 | 2005 | 2005 | (3 | ) | |||||||||||||||||||||||
| Hanahan (Charleston), SC (SAIC) | 3,577,226 | 2002 | 2005 | 39 | 3,961,769 | 2002 | 2005 | (3 | ) | |||||||||||||||||||||||
| Hanahan (Charleston), SC (FDX Ground) | 1,724,191 | 2005 | 2005 | 39 | 1,897,664 | 2005 | 2005 | (3 | ) | |||||||||||||||||||||||
| Augusta, GA (FDX Ground) | 1,258,944 | 2005 | 2005 | 39 | 1,385,556 | 2005 | 2005 | (3 | ) | |||||||||||||||||||||||
| Huntsville, AL | 936,862 | 2005 | 2005 | 39 | 1,092,730 | 2005 | 2005 | (3 | ) | |||||||||||||||||||||||
| Richfield (Cleveland), OH | 2,373,693 | 2006 | 2006 | 39 | 2,728,544 | 2006 | 2006 | (3 | ) | |||||||||||||||||||||||
| Colorado Springs, CO | 1,490,351 | 2006 | 2006 | 39 | 1,644,190 | 2006 | 2006 | (3 | ) | |||||||||||||||||||||||
| Tampa, FL (FDX) | 1,258,519 | 2006 | 2006 | 39 | 1,383,938 | 2006 | 2006 | (3 | ) | |||||||||||||||||||||||
| Griffin (Atlanta), GA | 3,767,103 | 2006 | 2006 | 39 | 4,128,872 | 2006 | 2006 | (3 | ) | |||||||||||||||||||||||
| Roanoke, VA (CHEP) | 1,329,033 | 1996 | 2007 | 39 | ||||||||||||||||||||||||||||
| Roanoke, VA (CHEP USA) | 1,516,288 | 1996 | 2007 | (3 | ) | |||||||||||||||||||||||||||
| Orion, MI | 3,549,648 | 2007 | 2007 | 39 | 4,019,239 | 2007 | 2007 | (3 | ) | |||||||||||||||||||||||
| Carlstadt, NJ (New York, NY) | 849,584 | 1977 | 2007 | 39 | ||||||||||||||||||||||||||||
| Carlstadt (New York, NY), NJ | 939,584 | 1977 | 2007 | (3 | ) | |||||||||||||||||||||||||||
| Wheeling (Chicago), IL | 3,735,969 | 2003 | 2007 | 39 | 4,079,587 | 2003 | 2007 | (3 | ) | |||||||||||||||||||||||
| White Bear Lake (Minneapolis/St. Paul), MN | 927,965 | 2001 | 2007 | 39 | ||||||||||||||||||||||||||||
| Cheektowaga (Buffalo), NY | 1,531,509 | 2002 | 2007 | 39 | 1,692,362 | 2002 | 2007 | (3 | ) | |||||||||||||||||||||||
| Richmond, VA (Carrier) | 1,229,737 | 2004 | 2007 | 39 | ||||||||||||||||||||||||||||
| Richmond, VA | 1,409,820 | 2004 | 2007 | (3 | ) | |||||||||||||||||||||||||||
| Montgomery (Chicago), IL | 2,282,887 | 2004 | 2007 | 39 | 2,522,213 | 2004 | 2007 | (3 | ) | |||||||||||||||||||||||
| Tampa, FL (TB Grand Prix) | 941,848 | 1989 | 2007 | 39 | ||||||||||||||||||||||||||||
| Tampa, FL (Tampa Bay Grand Prix) | 1,043,048 | 1989 | 2007 | (3 | ) | |||||||||||||||||||||||||||
| Augusta, GA (FDX) | 367,357 | 1993 | 2007 | 39 | 415,251 | 1993 | 2007 | (3 | ) | |||||||||||||||||||||||
| Lakeland, FL | 466,240 | 1993 | 2007 | 39 | 525,151 | 1993 | 2007 | (3 | ) | |||||||||||||||||||||||
| El Paso, TX | 1,442,146 | 2005 | 2007 | 39 | 1,709,714 | 2005 | 2007 | (3 | ) | |||||||||||||||||||||||
| Chattanooga, TN | 1,131,706 | 2002 | 2007 | 39 | 1,262,219 | 2002 | 2007 | (3 | ) | |||||||||||||||||||||||
| Bedford Heights (Cleveland), OH | 1,521,396 | 1998 | 2007 | 39 | 1,707,394 | 1998 | 2007 | (3 | ) | |||||||||||||||||||||||
| Punta Gorda, FL | 945,236 | 2007 | 2007 | (3 | ) | |||||||||||||||||||||||||||
| Cocoa, FL | 2,435,695 | 2006 | 2008 | (3 | ) | |||||||||||||||||||||||||||
| Orlando, FL | 1,636,085 | 1997 | 2008 | (3 | ) | |||||||||||||||||||||||||||
| Topeka, KS | 802,124 | 2006 | 2009 | (3 | ) | |||||||||||||||||||||||||||
| Memphis, TN | 2,573,085 | 1994 | 2010 | (3 | ) | |||||||||||||||||||||||||||
| Houston, TX | 1,248,713 | 2005 | 2010 | (3 | ) | |||||||||||||||||||||||||||
| Carrollton (Dallas), TX | 3,130,523 | 2009 | 2010 | (3 | ) | |||||||||||||||||||||||||||
| Ft. Mill (Charlotte, NC), SC | 2,302,265 | 2009 | 2010 | (3 | ) | |||||||||||||||||||||||||||
| Lebanon (Nashville), TN | 1,843,853 | 1993 | 2011 | (3 | ) | |||||||||||||||||||||||||||
| Rockford, IL (Sherwin-Williams Co.) | 744,286 | 1998-2008 | 2011 | (3 | ) | |||||||||||||||||||||||||||
| Edinburg, TX | 1,188,983 | 2011 | 2011 | (3 | ) | |||||||||||||||||||||||||||
| 149 |
MONMOUTH REAL ESTATE INVESTMENT CORPORATION
SCHEDULE III
REAL ESTATE AND ACCUMULATED DEPRECIATION
SEPTEMBER 30, 20162017
| Column A | Column F | Column G | Column H | Column I | Column F | Column G | Column H | Column I | ||||||||||||||||||||||||
| Accumulated | Date of | Date | Depreciable | Accumulated | Date of | Date | Depreciable | |||||||||||||||||||||||||
| Description | Depreciation | Construction | Acquired | Life | Depreciation | Construction | Acquired | Life | ||||||||||||||||||||||||
| Kansas City, MO (Kellogg) | $ | 1,022,653 | 2002 | 2007 | 39 | |||||||||||||||||||||||||||
| Punta Gorda, FL | 833,789 | 2007 | 2007 | 39 | ||||||||||||||||||||||||||||
| Cocoa, FL | 2,113,243 | 2006 | 2008 | 39 | ||||||||||||||||||||||||||||
| Orlando, FL | 1,471,814 | 1997 | 2008 | 39 | ||||||||||||||||||||||||||||
| Topeka, KS | 707,765 | 2006 | 2009 | 39 | ||||||||||||||||||||||||||||
| Memphis, TN | 2,230,008 | 1994 | 2010 | �� | 39 | |||||||||||||||||||||||||||
| Houston, TX | 1,080,294 | 2005 | 2010 | 39 | ||||||||||||||||||||||||||||
| Carrollton (Dallas), TX | 2,708,020 | 2009 | 2010 | 39 | ||||||||||||||||||||||||||||
| Ft. Mill (Charlotte, NC), SC | 1,949,873 | 2009 | 2010 | 39 | ||||||||||||||||||||||||||||
| Lebanon (Nashville), TN | 1,536,542 | 1993 | 2011 | 39 | ||||||||||||||||||||||||||||
| Rockford, IL (Sherwin-Williams) | 628,612 | 1998-2008 | 2011 | 39 | ||||||||||||||||||||||||||||
| Edinburg, TX | 907,803 | 2011 | 2011 | 39 | ||||||||||||||||||||||||||||
| Streetsboro (Cleveland), OH | 2,058,462 | 2012 | 2012 | 39 | 2,515,897 | 2012 | 2012 | (3 | ) | |||||||||||||||||||||||
| Corpus Christi, TX | 549,750 | 2012 | 2012 | 39 | 672,040 | 2012 | 2012 | (3 | ) | |||||||||||||||||||||||
| Halfmoon (Albany), NY | 500,262 | 2012 | 2012 | 39 | 611,431 | 2012 | 2012 | (3 | ) | |||||||||||||||||||||||
| Lebanon (Cincinnati), OH | 485,114 | 2012 | 2012 | 39 | 594,620 | 2012 | 2012 | (3 | ) | |||||||||||||||||||||||
| Olive Branch, MS (Memphis, TN) (Anda) | 1,498,397 | 2012 | 2012 | 39 | ||||||||||||||||||||||||||||
| Oklahoma City, OK | 1,014,638 | 2012 | 2012 | 39 | ||||||||||||||||||||||||||||
| Olive Branch (Memphis, TN), MS (Anda Pharmaceuticals Inc.) | 1,850,962 | 2012 | 2012 | (3 | ) | |||||||||||||||||||||||||||
| Oklahoma City, OK (FDX Ground) | 1,306,735 | 2012 | 2012 | (3 | ) | |||||||||||||||||||||||||||
| Waco, TX | 923,263 | 2012 | 2012 | 39 | 1,210,344 | 2012 | 2012 | (3 | ) | |||||||||||||||||||||||
| Livonia (Detroit), MI | 1,350,345 | 1999 | 2013 | 39 | 1,698,607 | 1999 | 2013 | (3 | ) | |||||||||||||||||||||||
| Olive Branch, MS (Memphis, TN) (Milwaukee Tool) | 2,275,368 | 2013 | 2013 | 39 | ||||||||||||||||||||||||||||
| Olive Branch (Memphis, TN), MS (Milwaukee Tool) | 3,159,783 | 2013 | 2013 | (3 | ) | |||||||||||||||||||||||||||
| Roanoke, VA (FDX Ground) | 714,038 | 2013 | 2013 | 39 | 930,962 | 2013 | 2013 | (3 | ) | |||||||||||||||||||||||
| Green Bay, WI | 460,000 | 2013 | 2013 | 39 | 613,333 | 2013 | 2013 | (3 | ) | |||||||||||||||||||||||
| Stewartville (Rochester), MN | 332,308 | 2013 | 2013 | 39 | 443,077 | 2013 | 2013 | (3 | ) | |||||||||||||||||||||||
| Tulsa, OK | 227,268 | 2009 | 2014 | 39 | 309,194 | 2009 | 2014 | (3 | ) | |||||||||||||||||||||||
| Buckner (Louisville), KY | 1,834,166 | 2014 | 2014 | 39 | 2,472,411 | 2014 | 2014 | (3 | ) | |||||||||||||||||||||||
| Edwardsville (Kansas City), KS (International Paper) | 1,172,549 | 2014 | 2014 | 39 | 1,587,164 | 2014 | 2014 | (3 | ) | |||||||||||||||||||||||
| Altoona, PA | 583,052 | 2014 | 2014 | 39 | 784,660 | 2014 | 2014 | (3 | ) | |||||||||||||||||||||||
| Spring (Houston), TX | 1,183,663 | 2014 | 2014 | 39 | 1,629,658 | 2014 | 2014 | (3 | ) | |||||||||||||||||||||||
| Indianapolis, IN (FDX Ground) | 1,132,868 | 2014 | 2014 | 39 | 1,657,124 | 2014 | 2014 | (3 | ) | |||||||||||||||||||||||
| Sauget (St. Louis, MO), IL | 682,605 | 2015 | 2015 | 39 | 1,024,382 | 2015 | 2015 | (3 | ) | |||||||||||||||||||||||
| Lindale (Tyler), TX | 481,538 | 2015 | 2015 | 39 | 722,416 | 2015 | 2015 | (3 | ) | |||||||||||||||||||||||
| Kansas City, MO (Bunzl) | 422,650 | 2015 | 2015 | 39 | 646,520 | 2015 | 2015 | (3 | ) | |||||||||||||||||||||||
| Frankfort (Lexington), KY | 1,229,274 | 2015 | 2015 | 39 | 1,899,786 | 2015 | 2015 | (3 | ) | |||||||||||||||||||||||
| Jacksonville, FL (FDX Ground) | 1,053,246 | 2015 | 2015 | 39 | 1,688,236 | 2015 | 2015 | (3 | ) | |||||||||||||||||||||||
| Monroe (Cincinnati), OH | 452,143 | 2015 | 2015 | 39 | 737,707 | 2015 | 2015 | (3 | ) | |||||||||||||||||||||||
| Greenwood (Indianapolis), IN | 1,280,020 | 2015 | 2015 | 39 | 2,186,221 | 2015 | 2015 | (3 | ) | |||||||||||||||||||||||
| Ft. Worth (Dallas), TX | 810,709 | 2015 | 2015 | 39 | 1,505,602 | 2015 | 2015 | (3 | ) | |||||||||||||||||||||||
| Cincinnati, OH | 165,278 | 2014 | 2015 | 39 | 317,842 | 2014 | 2015 | (3 | ) | |||||||||||||||||||||||
| Rockford, IL (B/E Aerospace) | 236,923 | 2012 | 2015 | 39 | ||||||||||||||||||||||||||||
| Rockford, IL (Collins Aerospace Systems - United Technologies ) | 355,385 | 2012 | 2015 | (3 | ) | |||||||||||||||||||||||||||
| Concord (Charlotte), NC | 650,384 | 2016 | 2016 | 39 | 1,471,238 | 2016 | 2016 | (3 | ) | |||||||||||||||||||||||
| Covington (New Orleans), LA | 335,256 | 2016 | 2016 | 39 | 737,564 | 2016 | 2016 | (3 | ) | |||||||||||||||||||||||
| Imperial (Pittsburgh), PA | 243,056 | 2016 | 2016 | 39 | 659,722 | 2016 | 2016 | (3 | ) | |||||||||||||||||||||||
| Burlington (Seattle/Everett), WA | 284,752 | 2016 | 2016 | 39 | 855,500 | 2016 | 2016 | (3 | ) | |||||||||||||||||||||||
| Colorado Springs, CO | 225,214 | 2016 | 2016 | 39 | 900,855 | 2016 | 2016 | (3 | ) | |||||||||||||||||||||||
| Louisville, KY | 83,026 | 2016 | 2016 | 39 | 332,103 | 2016 | 2016 | (3 | ) | |||||||||||||||||||||||
| Davenport (Orlando), FL | 131,282 | 2016 | 2016 | 39 | 918,974 | 2016 | 2016 | (3 | ) | |||||||||||||||||||||||
| Olathe (Kansas City), KS | 125,585 | 2016 | 2016 | 39 | 879,098 | 2016 | 2016 | (3 | ) | |||||||||||||||||||||||
| Hamburg (Buffalo), NY | 850,000 | 2017 | 2017 | (3 | ) | |||||||||||||||||||||||||||
| Ft. Myers, FL (FDX Ground) | 353,846 | 2017 | 2017 | (3 | ) | |||||||||||||||||||||||||||
| Walker (Grand Rapids), MI | 354,111 | 2017 | 2017 | (3 | ) | |||||||||||||||||||||||||||
| Mesquite (Dallas), TX | 279,698 | 2017 | 2017 | (3 | ) | |||||||||||||||||||||||||||
| Aiken (Augusta, GA), SC | 126,141 | 2017 | 2017 | (3 | ) | |||||||||||||||||||||||||||
| Homestead (Miami), FL | 214,400 | 2017 | 2017 | (3 | ) | |||||||||||||||||||||||||||
| Oklahoma City, OK (Bunzl) | 50,537 | 2017 | 2017 | (3 | ) | |||||||||||||||||||||||||||
| Concord (Charlotte), NC | 152,720 | 2017 | 2017 | (3 | ) | |||||||||||||||||||||||||||
| Kenton, OH | 18,188 | 2017 | 2017 | (3 | ) | |||||||||||||||||||||||||||
| Stow, OH | -0- | 2017 | 2017 | (3 | ) | |||||||||||||||||||||||||||
| Shopping Center | ||||||||||||||||||||||||||||||||
| Somerset, NJ | 1,399,343 | 1970 | 1970 | 10-33 | 1,494,297 | 1970 | 1970 | (3 | ) | |||||||||||||||||||||||
| Vacant Land | ||||||||||||||||||||||||||||||||
| Shelby County, TN | -0- | N/A | 2007 | N/A | -0- | N/A | 2007 | N/A | ||||||||||||||||||||||||
| $ | 148,830,169 | $ | 172,730,273 | |||||||||||||||||||||||||||||
| Real Estate Held for Sale | ||||||||||||||||||||||||||||||||
| Orangeburg (New York), NY | 2,436,637 | 1990 | 1993 | (3 | ) | |||||||||||||||||||||||||||
| Ft. Myers, FL (Vacant) | 1,057,915 | 1974 | 2002 | (3 | ) | |||||||||||||||||||||||||||
| Kansas City, MO (Kellogg) | 1,147,693 | 2002 | 2007 | (3 | ) | |||||||||||||||||||||||||||
| $ | 4,642,245 | |||||||||||||||||||||||||||||||
| $ | 177,372,518 | |||||||||||||||||||||||||||||||
(3) Depreciation is computed based upon the following estimated lives:
Building: 31.5 to 39 years; Building Improvements: 3 to 39 years; Tenant Improvements: Lease Term
| 150 |
MONMOUTH REAL ESTATE INVESTMENT CORPORATION
SCHEDULE III
REAL ESTATE AND ACCUMULATED DEPRECIATION
SEPTEMBER 30, 20162017
(1) Reconciliation
REAL ESTATE INVESTMENTS
| 9/30/2016 | 9/30/2015 | 9/30/2014 | 9/30/2017 | 9/30/2016 | 9/30/2015 | |||||||||||||||||||
| Balance-Beginning of Year | $ | 941,009,905 | $ | 743,714,774 | $ | 627,866,051 | $ | 1,157,599,899 | $ | 927,348,409 | $ | 730,053,278 | ||||||||||||
| Additions: | ||||||||||||||||||||||||
| Acquisitions | 209,867,577 | 190,948,360 | 96,433,935 | 282,509,249 | 209,867,577 | 190,948,360 | ||||||||||||||||||
| Improvements | 20,436,013 | 11,903,148 | 19,414,788 | 4,168,984 | 20,383,913 | 11,847,468 | ||||||||||||||||||
| Total Additions | 230,303,590 | 202,851,508 | 115,848,723 | 286,678,233 | 230,251,490 | 202,795,828 | ||||||||||||||||||
| Deletions: | ||||||||||||||||||||||||
| Sales | -0- | (5,556,377 | ) | -0- | (5,157,126 | ) | -0- | (5,500,697 | ) | |||||||||||||||
| Total Deletions | -0- | (5,556,377 | ) | -0- | (5,157,126 | ) | -0- | (5,500,697 | ) | |||||||||||||||
| Balance-End of Year | $ | 1,171,313,495 | $ | 941,009,905 | $ | 743,714,774 | $ | 1,439,121,006 | $ | 1,157,599,899 | $ | 927,348,409 | ||||||||||||
ACCUMULATED DEPRECIATION
| 9/30/2016 | 9/30/2015 | 9/30/2014 | 9/30/2017 | 9/30/2016 | 9/30/2015 | |||||||||||||||||||
| Balance-Beginning of Year | $ | 124,898,639 | $ | 107,004,184 | $ | 91,095,415 | $ | 144,496,585 | $ | 120,882,503 | $ | 102,988,048 | ||||||||||||
| Depreciation | 23,931,530 | 19,625,748 | 15,908,769 | 29,169,659 | 23,614,082 | 19,625,748 | ||||||||||||||||||
| Sales | -0- | (1,731,293 | ) | -0- | (935,971 | ) | -0- | (1,731,293 | ) | |||||||||||||||
| Balance-End of Year | $ | 148,830,169 | $ | 124,898,639 | $ | 107,004,184 | $ | 172,730,273 | $ | 144,496,585 | $ | 120,882,503 | ||||||||||||
| 151 |
MONMOUTH REAL ESTATE INVESTMENT CORPORATION AND SUBSIDIARIES
NOTES TO SCHEDULE III
SEPTEMBER 30, 2017
(1)Reconciliation
| (1) | Reconciliation |
| 2016 | 2015 | 2014 | 2017 | 2016 | 2015 | |||||||||||||||||||
| Balance – Beginning of Year | $ | 941,009,905 | $ | 743,714,774 | $ | 627,866,051 | $ | 1,157,599,899 | $ | 927,348,409 | $ | 730,053,278 | ||||||||||||
| Additions: | ||||||||||||||||||||||||
| Somerset, NJ | 377,637 | 182,573 | 1,136,454 | -0- | 377,637 | 182,573 | ||||||||||||||||||
| Monaca (Pittsburgh), PA | 37,255 | 1,907,292 | 2,707,529 | 79,618 | 37,255 | 1,907,292 | ||||||||||||||||||
| Orangeburg (New York), NY | -0- | 96,800 | 108,157 | -0- | -0- | 96,800 | ||||||||||||||||||
| Ridgeland (Jackson), MS | 7,797 | -0- | -0- | -0- | 7,797 | -0- | ||||||||||||||||||
| Urbandale (Des Moines), IA | -0- | -0- | -0- | |||||||||||||||||||||
| Urbandale (Des Moines), IA (Vacant) | 94,717 | -0- | -0- | |||||||||||||||||||||
| Richland (Jackson), MS | -0- | -0- | 422,691 | -0- | -0- | -0- | ||||||||||||||||||
| O’Fallon (St. Louis), MO | -0- | 317,457 | 20,744 | -0- | -0- | 317,457 | ||||||||||||||||||
| Fayetteville, NC | 557,354 | 13,773 | -0- | 9,753 | 557,354 | 13,773 | ||||||||||||||||||
| Schaumburg (Chicago), IL | 13,775 | -0- | -0- | 196,526 | 13,775 | -0- | ||||||||||||||||||
| Burr Ridge (Chicago), IL | 8,700 | -0- | 65,333 | -0- | 8,700 | -0- | ||||||||||||||||||
| Romulus (Detroit), MI | -0- | 116,919 | -0- | 66,974 | -0- | 116,919 | ||||||||||||||||||
| Liberty (Kansas City), MO | 24,263 | 2,500 | 26,620 | -0- | 24,263 | 2,500 | ||||||||||||||||||
| Omaha, NE | 7,410 | 7,391 | -0- | -0- | 7,410 | 7,391 | ||||||||||||||||||
| Charlottesville, VA | 4,462 | -0- | -0- | 8,489 | 4,462 | -0- | ||||||||||||||||||
| Jacksonville, FL (FDX) | 16,983 | -0- | �� | 73,921 | 83,383 | 16,983 | -0- | |||||||||||||||||
| West Chester Twp (Cincinnati), OH | -0- | -0- | 77,555 | |||||||||||||||||||||
| Richmond, VA (FDX) | 18,510 | 7,356 | 14,152 | |||||||||||||||||||||
| West Chester Twp. (Cincinnati), OH | 4,996 | -0- | -0- | |||||||||||||||||||||
| Mechanicsville (Richmond), VA (FDX) | 26,830 | 18,510 | 7,356 | |||||||||||||||||||||
| St. Joseph, MO | 50,934 | 53,922 | 11,980 | 55,564 | 50,934 | 53,922 | ||||||||||||||||||
| Newington (Hartford), CT | -0- | -0- | 18,000 | 30,284 | -0- | -0- | ||||||||||||||||||
| Cudahy (Milwaukee), WI | 8,689 | -0- | -0- | -0- | 8,689 | -0- | ||||||||||||||||||
| Beltsville (Washington, DC), MD | 44,600 | 9,271 | 71,700 | -0- | 44,600 | 9,271 | ||||||||||||||||||
| Granite City (St. Louis, MO), IL | 156,139 | -0- | -0- | 155,034 | 156,139 | -0- | ||||||||||||||||||
| Monroe, NC | -0- | 55,680 | 10,875 | |||||||||||||||||||||
| Winston Salem, NC | 316,527 | -0- | 8,101 | |||||||||||||||||||||
| Winston-Salem, NC | -0- | 316,527 | -0- | |||||||||||||||||||||
| Elgin (Chicago), IL | 5,960 | 30,312 | 29,048 | 44,526 | 5,960 | 30,312 | ||||||||||||||||||
| Tolleson (Phoenix), AZ | 1,655,640 | (3,925 | ) | 13,015 | -0- | 1,655,640 | (3,925 | ) | ||||||||||||||||
| Ft. Myers, FL | -0- | -0- | 13,321 | |||||||||||||||||||||
| Edwardsville (Kansas City), KS (Carlisle) | -0- | -0- | 200,000 | |||||||||||||||||||||
| Tampa, FL (FDX Ground) (A) | 1,247,140 | 6,147 | 688,990 | |||||||||||||||||||||
| Ft. Myers, FL (Vacant) | -0- | -0- | -0- | |||||||||||||||||||||
| Edwardsville (Kansas City), KS (Carlisle Tire) | 7,585 | -0- | -0- | |||||||||||||||||||||
| Tampa, FL (FDX Ground) | 125 | 1,247,140 | 6,147 | |||||||||||||||||||||
| Denver, CO | -0- | -0- | -0- | -0- | -0- | -0- | ||||||||||||||||||
| Hanahan (Charleston), SC (SAIC) | 40,000 | 328,118 | -0- | 33,849 | 40,000 | 328,118 | ||||||||||||||||||
| Hanahan (Charleston), SC (FDX Ground) | -0- | -0- | 7,983 | -0- | -0- | -0- | ||||||||||||||||||
| Augusta, GA (FDX Ground) | 25,161 | -0- | -0- | 9,270 | 25,161 | -0- | ||||||||||||||||||
| Huntsville, AL (B) | 1,853,390 | -0- | -0- | |||||||||||||||||||||
| Huntsville, AL | 56,688 | 1,853,390 | -0- | |||||||||||||||||||||
| Richfield (Cleveland), OH | -0- | (91,709 | ) | 4,655,309 | -0- | -0- | (91,709 | ) | ||||||||||||||||
| Colorado Springs, CO | 9,357 | -0- | -0- | -0- | 9,357 | -0- | ||||||||||||||||||
| Tampa, FL (FDX) | 27,144 | -0- | -0- | 27,063 | 27,144 | -0- | ||||||||||||||||||
| Griffin (Atlanta), GA | -0- | -0- | -0- | -0- | -0- | -0- | ||||||||||||||||||
| Roanoke, VA (CHEP) | -0- | (59,348 | ) | 649,101 | ||||||||||||||||||||
| Roanoke, VA (CHEP USA) | -0- | -0- | (59,348 | ) | ||||||||||||||||||||
| Orion, MI | 5,867 | 5,021 | 61,507 | -0- | 5,867 | 5,021 | ||||||||||||||||||
| Carlstadt, NJ (New York, NY) | 13,877 | 51,120 | -0- | |||||||||||||||||||||
| Carlstadt (New York, NY), NJ | -0- | 13,877 | 51,120 | |||||||||||||||||||||
| Wheeling (Chicago), IL | -0- | -0- | -0- | -0- | -0- | -0- | ||||||||||||||||||
| White Bear Lake (Minneapolis/St. Paul), MN | -0- | -0- | -0- | |||||||||||||||||||||
| Cheektowaga (Buffalo), NY | -0- | -0- | 28,766 | -0- | -0- | -0- | ||||||||||||||||||
| Richmond, VA (Carrier) | 7,540 | 19,764 | 29,964 | |||||||||||||||||||||
| Richmond, VA | -0- | 7,540 | 19,764 | |||||||||||||||||||||
| Montgomery (Chicago), IL | -0- | -0- | -0- | -0- | -0- | -0- | ||||||||||||||||||
| Tampa, FL (Tampa Bay Grand Prix) | 26,916 | -0- | 34,192 | -0- | 26,916 | -0- | ||||||||||||||||||
| Augusta, GA (FDX) | 24,700 | 6,850 | 13,250 | 6,047 | 24,700 | 6,850 | ||||||||||||||||||
| Lakeland, FL | 16,321 | -0- | 6,643 | -0- | 16,321 | -0- | ||||||||||||||||||
| El Paso, TX | -0- | 1,198,544 | 323,326 | -0- | -0- | 1,198,544 | ||||||||||||||||||
| Chattanooga, TN | 41,042 | -0- | -0- | 4,315 | 41,042 | -0- | ||||||||||||||||||
| Bedford Heights (Cleveland), OH | 84,288 | 4,450 | 58,309 | 55,957 | 84,288 | 4,450 | ||||||||||||||||||
| Kansas City, MO (Kellogg) | 52,100 | -0- | -0- | |||||||||||||||||||||
| Punta Gorda, FL | 8,350 | -0- | -0- | 20,245 | 8,350 | -0- | ||||||||||||||||||
| Cocoa, FL | 37,606 | 73,962 | 3,494,426 | -0- | 37,606 | 73,962 | ||||||||||||||||||
| Orlando, FL | 13,195 | -0- | 4,833 | -0- | 13,195 | -0- | ||||||||||||||||||
| Topeka, KS | -0- | -0- | -0- | -0- | -0- | -0- | ||||||||||||||||||
| Memphis, TN | 1,050 | -0- | -0- | |||||||||||||||||||||
| Houston, TX | 65,351 | -0- | 2,279 | |||||||||||||||||||||
| Carrollton (Dallas), TX | 50,097 | 24,806 | 4,300 | |||||||||||||||||||||
| Ft. Mill (Charlotte, NC), SC | -0- | -0- | -0- | |||||||||||||||||||||
| Lebanon (Nashville), TN | -0- | -0- | -0- | |||||||||||||||||||||
| Rockford, IL (Sherwin-Williams Co.) | -0- | -0- | 11,227 | |||||||||||||||||||||
| Edinburg, TX | 615,142 | 3,985,389 | -0- | |||||||||||||||||||||
| 152 |
MONMOUTH REAL ESTATE INVESTMENT CORPORATION AND SUBSIDIARIES
NOTES TO SCHEDULE III, (CONT’D)
SEPTEMBER 30, 2017
(1)Reconciliation (cont’d)
| 2016 | 2015 | 2014 | ||||||||||
| Memphis, TN | -0- | -0- | 20,887 | |||||||||
| Houston, TX | -0- | 2,279 | -0- | |||||||||
| Carrollton (Dallas), TX | 24,806 | 4,300 | -0- | |||||||||
| Ft. Mill (Charlotte, NC), SC | -0- | -0- | 338,833 | |||||||||
| Lebanon (Nashville), TN | -0- | -0- | -0- | |||||||||
| Rockford, IL (Sherwin-Williams) | -0- | 11,227 | -0- | |||||||||
| Edinburg, TX (C) | 3,985,389 | -0- | 24,483 | |||||||||
| Streetsboro (Cleveland), OH | -0- | -0- | -0- | |||||||||
| Corpus Christi, TX | -0- | -0- | -0- | |||||||||
| Halfmoon (Albany), NY | -0- | -0- | -0- | |||||||||
| Lebanon (Cincinnati), OH | -0- | 36,425 | -0- | |||||||||
| Olive Branch, MS (Memphis, TN) (Anda) | -0- | -0- | -0- | |||||||||
| Oklahoma City, OK (D) | (13,611 | ) | 2,989,708 | -0- | ||||||||
| Waco, TX | -0- | 3,813,157 | -0- | |||||||||
| Livonia (Detroit), MI | 31,497 | 30,533 | -0- | |||||||||
| Olive Branch, MS (Memphis, TN)(Milwaukee Tool) (E) | 9,412,120 | 133,981 | -0- | |||||||||
| Roanoke, VA (FDX Ground) | -0- | -0- | -0- | |||||||||
| Green Bay, WI | -0- | -0- | -0- | |||||||||
| Stewartville (Rochester), MN | -0- | -0- | -0- | |||||||||
| Tulsa, OK | -0- | 48,031 | 3,700,000 | |||||||||
| Buckner (Louisville), KY | 48,136 | 86,591 | 26,633,125 | |||||||||
| Edwardsville (Kansas City), KS (International Paper) | 5,355 | 203,261 | 18,085,492 | |||||||||
| Altoona, PA | 18,650 | -0- | 8,990,000 | |||||||||
| Spring (Houston), TX | 56,275 | 1,415 | 19,226,108 | |||||||||
| Indianapolis, IN (FDX Ground) | -0- | 202,000 | 23,744,000 | |||||||||
| Sauget (St. Louis, MO), IL | 4,950 | 15,200,000 | -0- | |||||||||
| Lindale (Tyler), TX | -0- | 9,930,000 | -0- | |||||||||
| Kansas City, MO (Bunzl) | -0- | 9,600,000 | -0- | |||||||||
| Frankfort (Lexington), KY | -0- | 28,000,000 | -0- | |||||||||
| Jacksonville, FL (FDX Ground) | -0- | 30,645,954 | -0- | |||||||||
| Monroe (Cincinnati), OH | -0- | 12,937,000 | -0- | |||||||||
| Greenwood (Indianapolis), IN | 15,817 | 37,484,574 | -0- | |||||||||
| Ft. Worth (Dallas), TX | -0- | 35,300,832 | -0- | |||||||||
| Cincinnati, OH | -0- | 6,750,000 | -0- | |||||||||
| Rockford, IL (B/E Aerospace) | -0- | 5,100,000 | -0- | |||||||||
| Concord (Charlotte), NC | 31,975,897 | -0- | -0- | |||||||||
| Covington (New Orleans), LA | 18,410,000 | -0- | -0- | |||||||||
| Imperial (Pittsburgh), PA | 19,950,000 | -0- | -0- | |||||||||
| Burlington (Seattle/Everett), WA | 30,210,680 | -0- | -0- | |||||||||
| Colorado Springs, CO | 28,500,000 | -0- | -0- | |||||||||
| Louisville, KY | 11,304,000 | -0- | -0- | |||||||||
| Davenport (Orlando), FL | 37,780,000 | -0- | -0- | |||||||||
| Olathe (Kansas City), KS | 31,737,000 | -0- | -0- | |||||||||
| Total Additions | 230,303,590 | 202,851,508 | 115,848,723 | |||||||||
| Total Disposals | -0- | (5,556,377 | ) | -0- | ||||||||
| Balance – End of Year | $ | 1,171,313,495 | $ | 941,009,905 | $ | 743,714,774 | ||||||
| 2017 | 2016 | 2015 | ||||||||||
| Streetsboro (Cleveland), OH | $ | -0- | $ | -0- | $ | -0- | ||||||
| Corpus Christi, TX | 7,413 | -0- | -0- | |||||||||
| Halfmoon (Albany), NY | -0- | -0- | -0- | |||||||||
| Lebanon (Cincinnati), OH | -0- | -0- | 36,425 | |||||||||
| Olive Branch (Memphis, TN), MS (Anda Pharmaceuticals) | -0- | -0- | -0- | |||||||||
| Oklahoma City, OK (FDX Ground) | 4,200 | (13,611 | ) | 2,989,708 | ||||||||
| Waco, TX | 5,210 | -0- | 3,813,157 | |||||||||
| Livonia (Detroit), MI | -0- | 31,497 | 30,533 | |||||||||
| Olive Branch (Memphis, TN), MS (Milwaukee Tool) | -0- | 9,412,120 | 133,981 | |||||||||
| Roanoke, VA (FDX Ground) | -0- | -0- | -0- | |||||||||
| Green Bay, WI | -0- | -0- | -0- | |||||||||
| Stewartville (Rochester), MN | -0- | -0- | -0- | |||||||||
| Tulsa, OK | -0- | -0- | 48,031 | |||||||||
| Buckner (Louisville), KY | 40,000 | 48,136 | 86,591 | |||||||||
| Edwardsville (Kansas City), KS (International Paper) | -0- | 5,355 | 203,261 | |||||||||
| Altoona, PA | -0- | 18,650 | -0- | |||||||||
| Spring (Houston), TX | -0- | 56,275 | 1,415 | |||||||||
| Indianapolis, IN (FDX Ground) | 1,060,372 | -0- | 202,000 | |||||||||
| Sauget (St. Louis, MO), IL | -0- | 4,950 | 15,200,000 | |||||||||
| Lindale (Tyler), TX | 6,500 | -0- | 9,930,000 | |||||||||
| Kansas City, MO (Bunzl) | 51,226 | -0- | 9,600,000 | |||||||||
| Frankfort (Lexington), KY | -0- | -0- | 28,000,000 | |||||||||
| Jacksonville, FL (FDX Ground) | 86,136 | -0- | 30,645,954 | |||||||||
| Monroe (Cincinnati), OH | -0- | -0- | 12,937,000 | |||||||||
| Greenwood (Indianapolis), IN | 11,680 | 15,817 | 37,484,574 | |||||||||
| Ft. Worth (Dallas), TX | -0- | -0- | 35,300,832 | |||||||||
| Cincinnati, OH | -0- | -0- | 6,750,000 | |||||||||
| Rockford, IL (Collins Aerospace Systems) | -0- | -0- | 5,100,000 | |||||||||
| Concord (Charlotte), NC | 1,068,900 | 31,975,897 | -0- | |||||||||
| Covington (New Orleans), LA | -0- | 18,410,000 | -0- | |||||||||
| Imperial (Pittsburgh), PA | -0- | 19,950,000 | -0- | |||||||||
| Burlington (Seattle/Everett), WA | 17,867 | 30,210,680 | -0- | |||||||||
| Colorado Springs, CO | -0- | 28,500,000 | -0- | |||||||||
| Louisville, KY | -0- | 11,304,000 | -0- | |||||||||
| Davenport (Orlando), FL | -0- | 37,780,000 | -0- | |||||||||
| Olathe (Kansas City), KS | -0- | 31,737,000 | -0- | |||||||||
| Hamburg (Buffalo), NY | 34,850,000 | -0- | -0- | |||||||||
| Ft. Myers, FL (FDX Ground) | 21,623,000 | -0- | -0- | |||||||||
| Walker (Grand Rapids), MI | 31,654,985 | -0- | -0- | |||||||||
| Mesquite (Dallas), TX | 49,880,493 | -0- | -0- | |||||||||
| Aiken (Augusta, GA), SC | 21,040,396 | -0- | -0- | |||||||||
| Homestead (Miami), FL | 37,873,120 | -0- | -0- | |||||||||
| Oklahoma City, OK (Bunzl) | 8,728,439 | -0- | -0- | |||||||||
| Concord (Charlotte), NC | 40,043,145 | -0- | -0- | |||||||||
| Kenton, OH | 17,881,608 | -0- | -0- | |||||||||
| Stow, OH | 18,934,065 | -0- | -0- | |||||||||
| Total Additions | $ | 286,678,233 | $ | 230,251,490 | $ | 202,795,828 | ||||||
| Total Disposals | (5,157,126 | ) | -0- | (5,500,697 | ) | |||||||
| Balance – End of Year | $ | 1,439,121,006 | $ | 1,157,599,899 | $ | 927,348,409 | ||||||
| 153 |
Pursuant to the requirements of Section 13 of 15 (d) of the Securities Exchange Act of 1934, the Registrant has duly caused this report to be signed on its behalf by the undersigned, thereunto duly authorized.
| MONMOUTH REAL ESTATE INVESTMENT | |||
| CORPORATION | |||
| (registrant) | |||
| Date: November 28, | By: | /s/ Michael P. Landy | |
| Michael P. Landy, President, Chief Executive | |||
| Officer and Director, its principal executive officer | |||
| Date: November 28, | By: | /s/ Kevin S. Miller | |
| Kevin S. Miller, Chief Financial Officer, its principal | |||
| financial officer and principal accounting officer |
Pursuant to the requirements of the Securities Exchange Act of 1934, this report has been signed by the following persons on behalf of the Registrant and in the capacities and on the dates indicated.
| Date: November 28, | By: | /s/ Eugene W. Landy | |
| Eugene W. Landy, Chairman of the Board and Director | |||
| Date: November 28, | By: | /s/ Michael P. Landy | |
| Michael P. Landy, President, Chief Executive Officer and Director | |||
| Date: November 28, | By: | /s/ Daniel D. Cronheim | |
| Daniel D. Cronheim, Director | |||
| Date: November 28, | By: | /s/ Catherine B. Elflein | |
| Catherine B. Elflein, Director | |||
| Date: November 28, | By: | /s/ Brian H. Haimm | |
| Brian H. Haimm, Director | |||
| Date: November 28, | By: | /s/ Neal Herstik | |
| Neal Herstik, Director | |||
| Date: November 28, | By: | /s/ Matthew I. Hirsch | |
| Matthew I. Hirsch, Director | |||
| Date: November 28, | By: | /s/ Samuel A. Landy | |
| Samuel A. Landy, Director |
| Date: November 28, 2017 | By: | /s/ Kevin S. Miller | |
| Kevin S. Miller, Director |
| Date: November 28, 2017 | By: | /s/ Gregory T. Otto | |
| Gregory T. Otto, Director | |||
| Date: November 28, | By: | /s/ Scott L. Robinson | |
| Scott L. Robinson, Director | |||
| Date: November 28, | By: | /s/ Stephen B. Wolgin | |
| Stephen B. Wolgin, Director |