PART I
ITEM 1.BUSINESS
We are a leading global chemical and ingredientsingredient distributor and provider of specialty services.value-added services to customers across a wide range of diverse industries. We purchase chemicals and ingredients from thousands of chemical producers worldwide andto warehouse, repackage, blend, dilute, transport and sell those chemicals to more than 100,000 customer locations across approximately 130 countries. Our specialized services include e-commerceWe operate an extensive worldwide chemical and digital marketingingredient distribution network, comprised of chemicals formore than 650 facilities and serviced by hundreds of tractors, railcars, tankers and trailers operating daily through our producers, chemical waste removalfacilities.
Chemical and ancillary services, on-site storage of chemicals for our customers, and support services for the agricultural and pest control industries. We derive competitive advantage from our scale, broad product offering, leading digital solutions, technical expertise, specialized services, long-standing relationships with leading chemical producers and our industry leading safety record.
The effects of market conditions on our operations are discussed in Part II, Item 7, “Management’s Discussion and Analysis of Financial Condition and Results of Operations.”
Recent Developments
On February 28, 2019, we generated $8.6 billionacquired Nexeo Solutions, Inc. (“Nexeo”), a leading global chemicals and plastics distributor. The acquisition expanded and strengthened our presence in netNorth America and provides expanded opportunities to create the largest North American sales net incomeforce in chemical and ingredients distribution coupled with a broad and deep product offering.
On March 29, 2019, we sold the plastics distribution business of $172.3 millionNexeo to an affiliate of One Rock Capital Partners, LLC and $640.4 million in Adjusted EBITDA. For a reconciliationon December 31, 2019, we sold our Environmental Sciences business to affiliates of Adjusted EBITDA to net income (loss), see “Selected Financial Data”AEA Investors LP.
See “Note 3: Business combinations” and “Note 4: Discontinued operations and dispositions” in Item 68 of this Annual Report on Form 10-K.
Our Segments
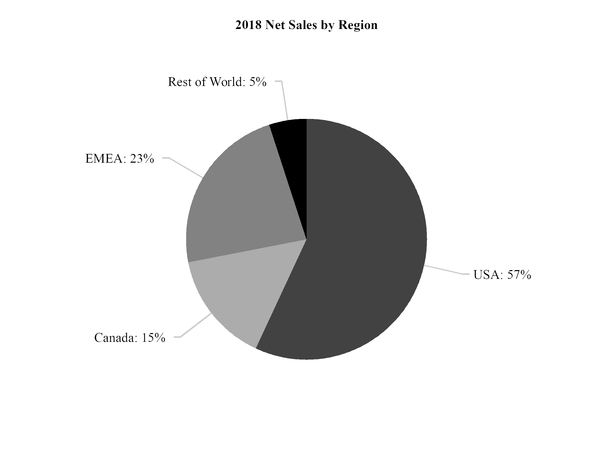
Our business is organized and managed in four geographical segments: Univar Solutions USA (“USA”), Univar Solutions Canada (“Canada”), Univar Solutions Europe and the Middle East and Africa (“EMEA”), and Rest of WorldUnivar Solutions Latin America (“Rest of World”LATAM”), which is predominantlyincludes developing businesses in Latin America.America (including Brazil and Mexico) and the Asia-Pacific region. For additional information on our geographical segments, see “Note 22:23: Segments” in Item 8 of this Annual Report on Form 10-K for additional information.
4
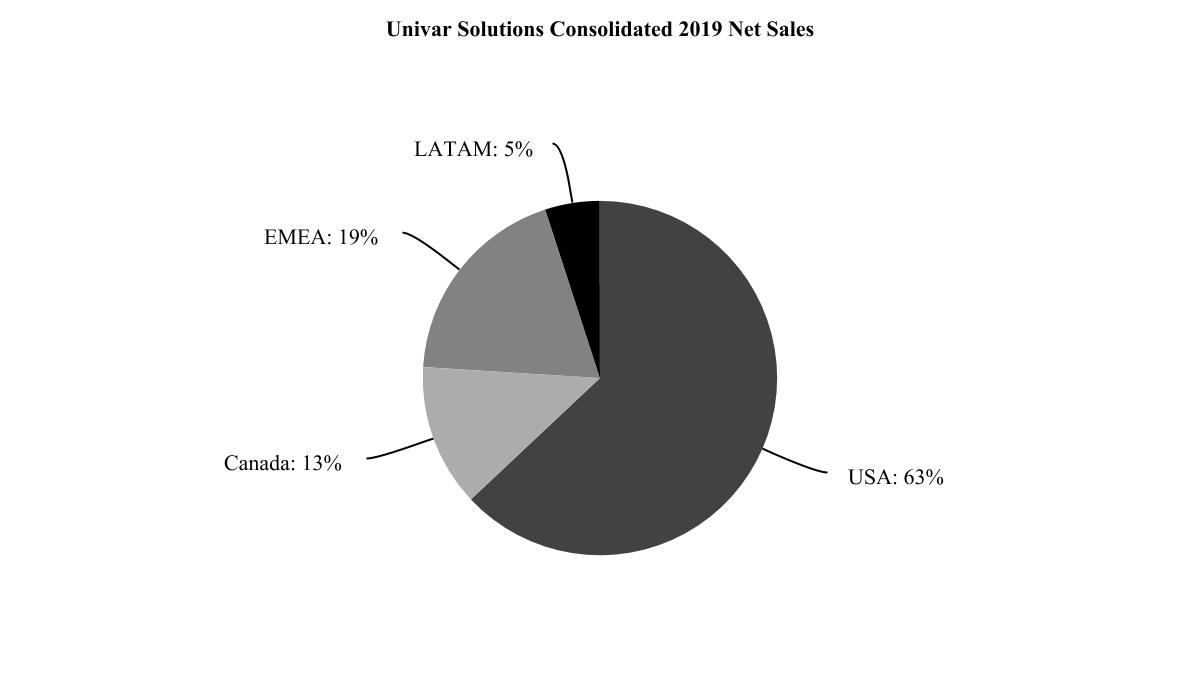
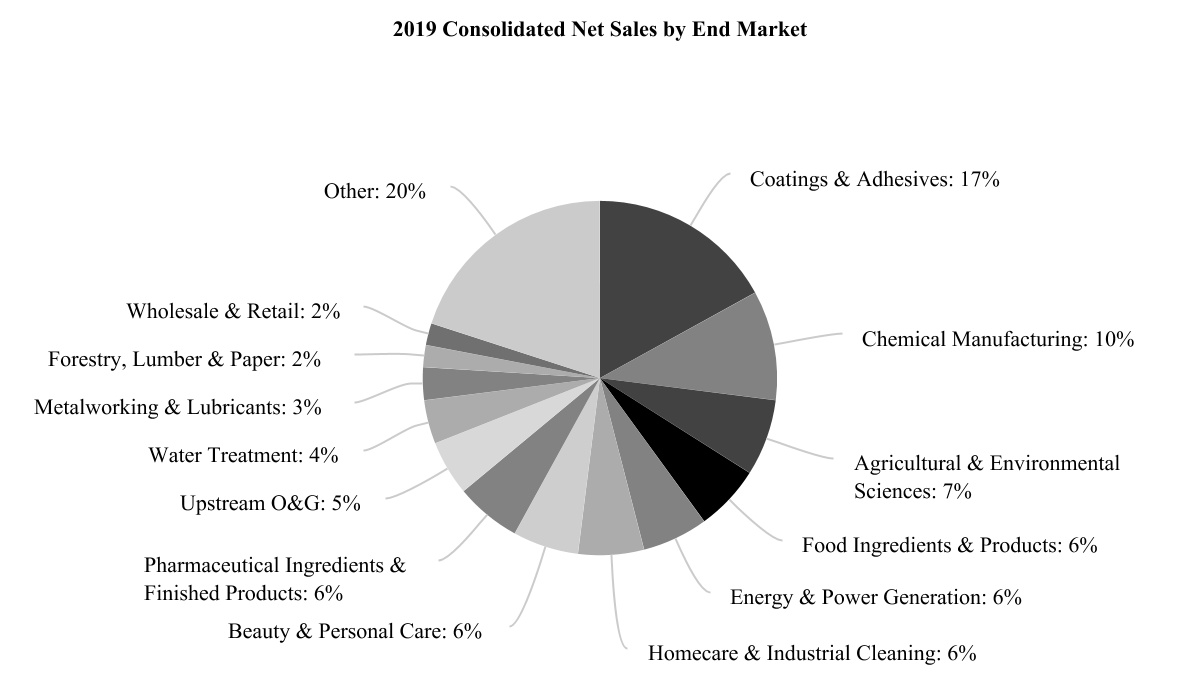
The following graph reflects the breakdown by segment of our 2019 consolidated net sales of $9.3 billion.
USA
We supply a broad offering of commodity and specialty chemicals and ingredients, as well as specialized services to a wide range of end markets, touching a majority of the manufacturing and industrial production sectors in the United States. OurWe believe our close proximity to customers, combined with our deep product knowledge and end market expertise, serves as a competitive advantage.
We repackage and blend bulk chemicals for shipment by our transportation fleet as well as common carriers. Our highly skilled salesforcesales force is deployed bythrough a geographic sales district model as well as by end-use market and industry e.g.(e.g., coatings and adhesives,adhesives), food ingredients and products, pharmaceutical ingredients and products, personal care, homecare and energy.industrial cleaning and energy (upstream, midstream and downstream).
Canada
Our Canadian operations are regionally focused, with a highly skilled salesforcesales force supplying a broad offering of commodity and specialty chemicals and specialized services. We sell into the industrial, agricultural and energy markets. In agriculture, we formulate and distribute inoculants, crop protection and fertilizer products to independent retailers and specialty applicators servicing the agricultural end markets in both Western Canada and Eastern Canada and we provide support services to agricultural chemical producers throughout the local customer base.country. In Eastern Canada, we primarily focus on industrial markets such as food ingredients, pharmaceutical ingredients, coatings and adhesives, and chemical manufacturing. We also service the cleaning and sanitation, personal care, mining, and energy markets. In Western Canada, we focus on forestry, chemical manufacturing, mining, and energy markets (e.g., midstream gas pipeline, oil sands processing and oil refining). Lastly, due to its
EMEA
We maintain a strong presence in the United Kingdom and Continentalcontinental Europe with sales offices in 2021 countries. We also have fourthree sales offices in the Middle East and Africa.
We execute primarily on a pan-European basis, leveraging centralized or shared information technology systems, raw materials procurement, logistics, route operations and the management of producer relationships where possible to benefit from economies of scale and improve cost efficiency. We have strong end market expertise and key account management capability across Europe to better support sales representatives in each country and for serving our key customer end markets, namelyin industrial production, pharmaceutical ingredients, and finished products, food ingredients, coating and adhesives and personal care.
We operateoffer generic and specialty chemicals and ingredients, as well as technical and market expertise, specialized services and key account management to a wide range of end markets including industrial production, personal care, coatings and adhesives, energy and agriculture through sales offices, Solution Centers and distribution sites in Mexico, Brazil, Colombia and
5
to a lesser extent the Asia-Pacific region. We continue to look for expansion opportunities throughout Latin America and opened a new sales center in Colombia, in 2018.
In addition to selling and distributing chemicals, we use our transportation and warehousing infrastructure, along with our broad knowledge of chemicals and hazardous materials handling to provide important distribution and specialized services for our producers and our customers.
We have state-of-the-art Solutions Centers at locations across the globe, consisting of formulation labs, development and research centers, and test kitchens, with specialized industry expertise and innovative technical capabilities to solve our customer's technical challenges and accelerate product development cycles.
Our key global end markets include:
•Agricultural. Within the agriculture industry we are a leading wholesale distributor of crop protection products to independent retailers and specialty applicators in Canada. To support this end market, we distribute herbicides, fungicides, insecticides, seed, seed treatments, inoculants, micronutrients, macronutrients, horticultural products and fertilizers among other products. In addition, we provide storage, packaging and logistics services for major crop protection companies.
•Beauty and Personal Care. We are a full-line distributor in the beauty and personal care industry providing a wide variety of specialty and basic chemicals and ingredients used in skin and hair care products.
•Chemical Manufacturing. We distribute a full suite of chemical products in support of the chemical manufacturing industry (organic, inorganic and polymer chemistries).
•Coatings and Adhesives. We sell resins, pigments, solvents, thickeners, dispersants and other additives used to make paints, inks, and coatings. Our product line includes epoxy resins, polyurethanes, titanium dioxide, fumed silica, esters, plasticizers, silicones and specialty amines.
•Energy (up, mid and downstream). We provide chemicals and service to midstream pipeline and downstream refinery operators primarily in the US and Canada, including oil sands production. We also service the upstream US shale hydraulic-fracturing sector, by providing bulk chemicals to drill sites.
•Food Ingredients and Products. We distribute a diverse portfolio of commodity and specialty products that are sold into the food industry. The major food and beverage markets we purchaseserve are meat processing, baked goods, dairy, grain mill products, processed foods, carbonated soft drinks, fruit drinks and alcoholic beverages.
•Forestry, Lumber, Paper.We serve the forest industry across Canada, supplying a complete range of chemical products for use at all stages of production, from sap stain prevention to pulp and paper manufacturing.
•Homecare & Industrial Cleaning. We offer an extensive range of quality ingredients for cleaners, detergents, and disinfectant products. We distribute chemicals manufactured by many of the industry’s leading producers of enzymes, surfactants, solvents, dispersants, thickeners, bleaching aides, builders, sealants, acids, alkalis and other chemicals that are used as ingredients and processing aids in bulk form,the manufacturing of cleaning and sanitation products.
•Metalworking & Lubricants. Our broad and diverse range of products include base stocks, performance-enhancing additives for both lubricants and metalworking fluids.
•Pharmaceutical Ingredients and Finished Products. Our portfolio includes products along the medicinal production chain, where we repackage them into various size containersoffer a broad portfolio of excipients, solvents, reactants, active pharmaceutical ingredients and intermediates to pharmaceutical ingredient producers.
•Water Treatment. We offer a broad portfolio of products for salewater treatment that includes pH adjusters, flocculants, coagulants, dechlorinators and distribution.disinfectants.
6
Commodity chemicals and ingredients represent the largest portion of our business by sales and volume. Our commodity portfolio includes acids and bases, surfactants, glycols, inorganic compounds, alcohols and general chemicals used extensively throughout most end markets. Our specialty chemicals and ingredient sales represent an important, high-value, higher-growth portion of the chemical distribution market. We typically sell specialty products in lower volumes, but at a higher profit than commodity products and our intent is to increase our presence in the specialty market. While many producers supply specialty products directly to customers, there is an increasing trend toward outsourcing the distribution of these specialized, lower volume products and ingredients. We believe that customers and producers value Univar’s ability to supply both commodity and specialty products, particularly as the markets continue to consolidate.
Services
In addition to selling and distributing chemicals, we use our transportation and warehousing infrastructure, along with our broad knowledge of chemicals and hazardous materials handling, to provide important distribution and specialized services for our producers and our customers. This intermediary role Univar plays is increasingly important, in particular due to the recent trend of increased outsourcing of distribution by chemical producers to satisfy their need for supply chain efficiency. These services include:
•Inventory Management. We manage our inventory in order to meet customer demands on short notice whenever possible. Our value as channel partners of chemical producers also enables us to obtain access to chemicals in times of short supply, when smaller chemical distributors may not be able to obtain or maintain stock. Further, our global distribution network permits us to stock products locally to enhance “just-in-time” delivery, providing outsourced inventory management to our customers in a variety of end markets.
•Mixing, Blending and Repackaging. We provide a full suite of blending and repackaging services for our customers across diverse industries. Additionally, we can fulfill small orders through our repackaging services, enabling customers to maintain smaller inventories.
•Specialized Formulation and Blending. Leveraging our technical expertise, we are able to utilize our blending and mixing capabilities to create specialty chemical formulations to meet specific customer performance demands for agriculture and energy products through our Future Group, Tagma,products.
Suppliers
We source materials from thousands of producers around the globe and Magnablend blending services.
7
Distribution Channels
Warehouse distribution
Our warehouse distribution channel is the core of our operations.operations and connects large producers with smaller volume customers whose consumption patterns tend to make them uneconomical to be served directly by producers. Thus, the core customer serviced via our warehouses is a small or medium-volume consumer of chemicals and ingredients. We purchase chemicals and ingredients in truck load or larger quantities from producers based on contracted demands of our customers and our estimates of anticipated customer purchases. Once received, products are stored in one or more of our distribution facilities for sale and distribution in smaller, less-than-truckload quantities to our customers. Our warehouses have various facilities for services such as repackaging, blending and mixing to create specialized solutions needed by our customers in ready-to-use formulations.
Direct distribution
Competition
The chemical and ingredient production, distribution and sales markets are highly competitive. Most of the products that we distribute are made to standard specifications and are either produced by or available from multiple sources.
Chemical and ingredient distribution itself is a fragmented market in which only a small number of competitors have substantial international operations. Our principal large international competitor is Brenntag, which has a particularly strong position in Europe.Europe due to its strong market position in Germany.
Many other chemical distributors operate on a regional, national or local basis and may have a strong relationship with local producers and customers that may give them a competitive advantage in their local market. Some of our competitors are either local or regional distributors with a broad product portfolio,market, while others are niche players which focus on a specific end market, either industry or product-based. In addition to Brenntag, some of our regional competitors in North America include Helm America, Hydrite Chemical, Azelis, IMCD and Maroon Group and some of our regional competitors in Europe include Azelis, Helm and IMCD.
Chemical and ingredient producers may also sell their products through a direct sales force or through multiple chemical distributors, limit their use of third party distributors, particularly with respect to higher margin products, or to partner with other chemical and ingredient producers for distribution. Each of which could increase our competition.
We compete on the basis of service, on-time delivery, product breadth and availability, product and market knowledge and insights, safety and environmental compliance, global reach, product price, as well as our ability to provide certain additional value-added services.
We operate in a number of jurisdictions and are subject to numerous foreign,international, federal, state and local laws and regulations related to the protection of the environment, human health and safety, including laws regulating discharges of hazardous substances into the soil, air and water, blending, managing, handling, storing, selling, transporting and disposing of hazardous substances, investigation and remediation of contaminated properties and protecting the safety of our employees and others. Some of these laws and regulations include the Comprehensive Environmental Response, Compensation and Liability Act (CERCLA or Superfund), the Toxic Substances Control Act (TSCA), the Resource Conservation and Recovery Act (RCRA), Registration, Evaluation, Authorization and Restriction of Chemicals (REACH), among others. Some of our operations are required to hold environmental permits and licenses to be compliant and certain of our services businesses are also impacted by these laws. The cost of complying with these
Information related to environmental health and safety laws, permits and licenses has, in some instances, been substantial.
We rely primarily on trademarks, copyrightsexpect that there will be a continued increase in demand for products, systems and trade secret lawsservices that meet growing customer sustainability standards, expectations and preferences. We recognize that our ability to establish and maintain our proprietary rights in our intellectual property including technology, creative works and products.continue to provide these
8
products and services including “ChemPoint.com,” “ChemCare,”requires our business to further advance environmentally and “PESTWEB.”socially responsible means of operating, reflecting the challenges and opportunities presented through increased legal requirements, climate parameters and market developments. We believe that our ability to meet these increased sustainability demands will be necessary to enhance our competitive position in the marketplace.
Patents, Licenses and Trademarks
We consider intellectual property, particularly trade secrets, proprietary technology and other similar intellectual property, as important to our success. We hold some patents and have registered numerous trademarks in multiple jurisdictions. Further, we have various patent and trademark applications pending in jurisdictions worldwide. Although we consider our patents, trademarks, trade secrets and licenses to constitute valuable assets, we do not regard any of our businesses as being materially dependent upon an individual patent, trademark, trade secret, or license.
Significant Customers
No single customer accounted for more than 10% of net sales in any of the years presented.
Employees
As of December 31, 2018,2019, we employed more than 8,500 personshad approximately 10,300 employees on a full-time equivalent basis worldwide.
Other
No material part of our business is subject to renegotiation of profits or termination of contracts or subcontracts at the election of any government.
Because we generally fill orders upon receipt, no segment has any significant order backlog.
Information about our Executive Officers
See Part III, Item 10, Directors, Executive Officers and Corporate Governance.
Available Information
We filemaintain a website at www.univarsolutions.com and make available free of charge at this website our Annual Report on Form 10-K, Quarterly Reportsquarterly reports on Form 10-Q, Current Reportscurrent reports on Form 8-K and anyall amendments to those reports as well as proxy statements and registration statements, with the Securities and Exchange Commission (the “SEC”). The SEC maintains a website at www.sec.gov that contains reports, proxy and information statements, and other information regarding issuers, including us, that file electronically. We make our Annual Reports on Form 10-K, Quarterly Reports on Form 10-Q, Current Reports on Form 8-K and amendments to these reports filed or furnished pursuant to Section 13(a) or 15(d) of the Exchange Act available free of charge on or through our website at www.univar.com as soon as reasonably practicable after we filethey are electronically filed with or furnish themfurnished to the SEC. The contents ofinformation on our website areis not, however,and will not be deemed to be, a part of this Annual Report on Form 10-K, or incorporated into any of our other filings with the SEC, filings.except where we expressly incorporated such information. If you wish to receive a paper copy of any exhibit to our reports filed with or furnished to the SEC, the exhibit may be obtained by writing to: Corporate Secretary, Univar Solutions Inc., 3075 Highland Parkway Suite 200, Downers Grove, Illinois 60515.
Item 1A. RISK FACTORS
We are affected by general economic conditions, particularly fluctuations in industrial production and consumption, and an economic downturn could adversely affect our operations and financial results.
We sell chemicals that are used in manufacturing processes and as components of or ingredients in other products. Our sales are correlated with and affected by fluctuations in the levels of industrial production, manufacturing output, and general economic activity. For example, demand for our oil, gas and mining products and services is affected by factors such as the level of exploration, drilling, development and production activity of, and the corresponding capital spending by, oil, gas and mining companies and oilfield service providers, and trends in oil, gas and mineral prices. Producers of commodity and specialty chemicals are likely to reduce their output in periods of significant contraction in industrial and consumer demand, while demand for the products we distribute depends largely on trends in demand in the end markets our customers serve. A majority of our sales are in North America and Europe and our business is therefore susceptible to downturns in those economies as well as, to a lesser extent, the economies in the rest of the world. Our profit margins, as well as overall demand for our products and services, could decline as a result of a large number of factors outside our control, including economic recessions, reduced customer demand (whether due to changes in production processes, consumer preferences, the industries in which the customer operates, laws and regulations affecting the chemicals industry and the manner in which they are enforced, or other factors), inflation, fluctuations in interest and currency exchange rates, and changes in the fiscal or monetary policies of governments in the regions in which we operate.
General economic conditions and macroeconomic trends, as well as the creditworthiness of our customers, could affect overall demand for chemicals. Any overall decline in the demand for chemicals could significantly reduce our sales and profitability. If the creditworthiness of our customers declines, we would face increased credit risk. In addition, volatility and
9
disruption in financial markets could adversely affect our sales and results of operations by limiting our customers’ ability to obtain financing necessary to maintain or expand their own operations.
A historical feature of past economic weakness has been significant destocking of inventories, including inventories of chemicals used in industrial and manufacturing processes. It is possible that an improvement in our net sales in a particular period may be attributable in part to restocking of inventories by our customers and represent a level of sales or sales growth that will not be sustainable over the longer term. Further economic weakness could lead to insolvencies among our customers or producers, as well as among financial institutions that are counterparties on financial instruments or accounts that we hold. Any of these developments could have a material adverse effect on our business, financial condition and results of operations.
Significant changes in the business strategies of producers could also disrupt our supply. Large chemical manufacturers may elect to sell certain products (or products in certain regions) directly to customers, instead of relying on distributors such as us. While we do not believe that our results depend materially on access to any individual producer’s products, a reversal of the trend toward more active use of distributors would likely result in increasing margin pressure or products becoming unavailable to us. Any
In addition, unpredictable events may have a significant impact on the industries in which many of these developmentsour customers operate, reducing demand for products that we normally distribute in significant volumes. Significant disruptions of supply and disruptions in customer industries could have a material adverse effect on our business, financial condition and results of operations.
The markets in which we operate are highly competitive.competitive and we may not be able to compete successfully.
The chemical distribution market is highly competitive. Chemicals can be purchased from a variety of sources, including traders, brokers, wholesalers and other distributors, as well as directly from producers. Many of the products we distribute or finish are essentially fungible with products offered by our competition, including emerging competitors. The competitive pressure we face is particularly strong in sectors and markets where local competitors have strong positions or where new competitors can easily enter. Increased competition from distributors of products similar to or competitive with ours could result in price reductions, reduced margins and a loss of market share.
We expect to continue to experience significant and increasing levels of competition in the future. We must also compete with smaller companies that have been able to develop strong local or regional customer bases. In certain countries, some of our competitors are more established, benefit from greater name recognition and have greater resources within those countries than we do.
Consolidation of our competitors in the markets in which we operate could place us at a competitive disadvantage and reduce our profitability.
We operate in an industry, which is highly fragmented on a global scale, but in which there has been a trend toward consolidation in recent years. ConsolidationsConsolidation of our competitors may also further enhance their financial position, provide them with the ability to offer more competitive prices to customers for whom we compete, and allow them to achieve increased efficiencies in their consolidated operations that enable them to more effectively compete for customers. This may jeopardize the strength of our positions in one or more of the markets in which we operate and any advantages we currently enjoy due to the comparative scale of our operations. Losing some of those advantages could adversely affect our business, financial condition and results of operations, as well as our growth potential.
We purchase and sell a wide variety of chemicals, the price and availability of which may fluctuate, and may be subject to large and significant price increases. Many of our contracts with producers include chemical prices that are not fixed or are tied to an index, which allows our producers to change the prices of the chemicals we purchase as the price of the chemicals fluctuates in the market. Changes in chemical prices affect our net sales and cost of goods sold, as well as our working capital requirements, levels of debt and financing costs. We might not always be able to reflect increases in our chemical costs, transportation costs and other costs in our own pricing. Any inability to pass cost increases onto customers may adversely affect our business, financial condition and results of operations.
10
In order to meet customer demand, we typically maintain significant inventories, and we are therefore subject to a number of risks associated with our inventory levels, including the following:
•declines in the prices of chemicals that are held by us;
•the need to maintain a significant inventory of chemicals that may be in limited supply and therefore difficult to procure;
•buying chemicals in bulk for the best pricing and thereby holding excess inventory;
•responding to the fluctuating demand for chemicals;
•cancellation of customer orders; and
•responding to customer requests for rapid delivery.
In order to manage our inventories successfully, we must estimate demand from our customers and purchase chemicals that substantially correspond to that demand. If we overestimate demand and purchase too much of a particular chemical, we face a risk that the price of that chemical will fall, leaving us with inventory that we cannot sell profitably or have to write down such inventory from its recorded value. If we underestimate demand and purchase insufficient quantities of a particular chemical and prices of that chemical rise, we could be forced to purchase that chemical at a higher price and forego profitability in order to meet customer demand. Our business, financial condition and results of operations could suffer a material adverse effect if either or both of these risks without substantial expense, delaysituations occur frequently or in large volumes.
Our indebtedness may adversely affect our business, financial condition and operating results.
As of December 31, 2019, we had $2,713.8 million of total debt. Our indebtedness may have material adverse effects on our business, financial condition and operating results. The amount of our debt, as well as any additional debt or other operational or financial problems.
•our ability to satisfy obligations to lenders or note holders may be impaired, resulting in possible defaults on and acceleration of management attention;our indebtedness;
•our assets that currently serve as collateral for regulatory reasons to dispose of a portion of our existingdebt may be insufficient, or acquired businesses); and
•a substantial portion of our cash flow from operations could be used to repay the principal and interest on acceptable termsour debt;
•we may be increasingly vulnerable to economic downturns and increases in interest rates;
•our flexibility in planning for and reacting to changes in our business and the markets in which we operate may be limited; and
•we may be placed at a competitive disadvantage relative to other companies in our industry with less debt or comparable debt at more favorable interest rates.
The agreements governing our indebtedness contain operating covenants and restrictions that limit our operations and could lead to adverse consequences if we fail to comply with them.
The agreements governing our indebtedness contain certain operating covenants and when required, particularly becauseother restrictions relating to, among other things, limitations on indebtedness (including guarantees of additional indebtedness) and liens, mergers, consolidations and dissolutions, sales of assets, investments and acquisitions, dividends and other restricted payments, repurchase of shares of capital stock and options to purchase shares of capital stock and certain transactions with affiliates. In addition, our current high leverageNorth American ABL Facility and Euro ABL Facility include certain financial covenants.
Failure to comply with these financial and operating covenants could result from, among other things, changes in our results of operations, the incurrence of additional indebtedness, the pricing of our products, our success at implementing cost reduction initiatives, our ability to successfully implement our overall business strategy or changes in general economic conditions, which may make it difficultbe beyond our control. The breach of any of these covenants or impossible for us to secure additional financing for acquisitions.
11
As a result of our current and past operations, we may becomeare subject to liabilities.
Previous operations, including those of acquired companies, have resulted in contamination at a number of current and former sites, which must be investigated and remediated. We have ongoing investigations and remediation activities, or are contributing to cleanup costs, at approximately 107 currently or formerly owned, operated or used sites or other sites impacted by CVC.our operations. We have spent substantial sums on such investigation and remediation and we expect to continue to incur such expenditures in the future. We may also recognize additional goodwill and intangible assetsincur losses in connection with future business acquisitions. Goodwillinvestigation and remediation obligations that exceed our environmental reserve. There is not amortized for book purposes. We test for impairment annually using a fair value based approach. We also test goodwill for impairment if an event occurs or circumstances changeno guarantee that indicateour estimates will be accurate, that the fair value of a reporting unit has more likely than not declined below its carrying value. The identification and measurement of impairment involves the estimation of the fair value of reporting units, which requires judgment and involves the use of significant estimates and assumptions by management. The estimates of fair value of reporting units are based on the best information available as of the date of the assessment and incorporate management assumptions about expected future cash flows and contemplate other valuation techniques. Our estimates of future cash flows may differ from actual cash flows that are subsequently realized due to many factors, including future worldwide economic conditions and the expected benefits of our initiatives, among other things. Intangible assets are amortized for book purposes over their respective useful lives and are tested for impairment if any event occurs or circumstances change that indicates that carrying value maynew contamination will not be recoverable. Although we currently do not expectdiscovered or that our goodwill and intangible assets will be further impaired, we cannot guarantee that a material impairmentnew environmental laws or regulations will not occur, particularly inrequire us to incur additional costs. Any such inaccuracies, discoveries or new laws or regulations, or the eventinterpretation of a substantial deterioration in our future prospects either in total or in a particular reporting unit. See “Note 13: Goodwillexisting laws and intangible assets” in Item 8 of this Annual Report on Form 10-K for a discussion of our 2018 impairment review. If our goodwill and intangible assets become impaired, itregulations, could have a material adverse effect on our business, financial condition and results of operations.
We could be held liable for the costs to investigate, remediate or otherwise address contamination at any real property we have ever owned, leased, operated or used or other sites impacted by our operations. Some environmental laws could impose on us the entire cost of cleanup of contamination present at a site even though we did not cause all of the contamination. These laws often identify parties who can be strictly and jointly and severally liable for remediation. The discovery of previously unknown contamination at current or former sites or the imposition of other environmental liabilities or obligations in the future, including additional investigation or remediation obligations with respect to contamination that has impacted other properties, could lead to additional costs or the need for additional reserves that have a material adverse effect on our business, financial condition and results of operations. In addition, we may be required to pay damages or civil judgments related to third party claims, including those relating to personal injury (including exposure to hazardous materials or chemicals we blend, handle, store, sell, transport or dispose of), product quality issues, property damage or contribution to remedial obligations. We have been identified as a potentially responsible party at certain third party sites at which we have arranged for the disposal of our hazardous wastes. We may be identified as a potentially responsible party at additional sites beyond those for which we currently have financial obligations. Such developments could have a material adverse effect on our business, financial condition and results of operations.
Societal concerns regarding the safety of chemicals in commerce and their potential impact on the environment have resulted in a growing trend towards increasing levels of product safety and environmental protection regulations. These concerns could influence public perceptions, impact the commercial viability of the products we sell and increase the costs to comply with increasingly complex regulations, which could have a negative impact on our business, financial condition and results of operations. Additional findings by government agencies that chemicals pose significant environmental, health or safety risks may lead to their prohibition in some or all of the jurisdictions in which we operate.
We may be unable to integrate the business of Nexeo successfully or realize the anticipated benefits of the acquisition.
We are required to devote significant management attention and resources to integrating the business practices and operations of Nexeo and the Company. Potential difficulties that we may encounter as part of the integration process include the following:
•the inability to successfully combine Nexeo and manage the combined business in a manner that permits us to achieve, on a timely basis, or at all, the enhanced revenue opportunities and cost savings and other benefits anticipated to result from the Nexeo acquisition; and
•complexities associated with managing the combined businesses, including difficulty addressing possible differences in corporate cultures and management philosophies and the challenge of integrating complex systems, technology, networks and other assets of each of the companies in a seamless manner that minimizes any adverse impact on customers, suppliers, employees and other constituencies.
12
These issues could adversely affect our ability to maintain relationships with customers, suppliers, employees and other constituencies or achieve the anticipated benefits of the acquisition, or could reduce our earnings or otherwise adversely affect our business and financial results following the acquisition.
Our business could be seriously impacted by business disruptions and security breaches, including cybersecurity incidents.
Business and/or supply chain disruptions, plant downtime, and/or power outages, and information technology system and/or network disruptions, regardless of cause, including acts of sabotage, employee error or other actions, geo-political activity, military actions, terrorism (including cyber-attacks), weather events, and natural disasters could seriously harm our operations as well as the operations of our customers and suppliers. Any such event could have a negative impact on our business, results of operations, financial condition, and cash flows.
Cyber-attacks or security breaches could compromise confidential, business critical information, cause a disruption in the Company’s operations or harm the Company’s reputation. While the Company has a comprehensive cyber-security program that is continuously reviewed, maintained and upgraded, there can be no assurance that such procedures, controls, and intelligence will be sufficient to prevent security breaches from occurring. If any security breaches were to occur, they could lead to losses of sensitive information, critical infrastructure or capabilities essential to our operations and could have a material adverse effect on our reputation, financial position, results of operations or cash flows, and could result in claims being brought against us.
We require significant working capital, and we expect our working capital needs to increase in the future, which could result in having lower cash available for, among other things, capital expenditures and acquisition financing.
We require significant working capital to purchase chemicals from chemical producers and distributors and sell those chemicals efficiently and profitably to our customers. Our working capital needs may increase if the price of products we purchase and inventory increase. Our working capital needs also increase at certain times of the year, as our customers’ requirements for chemicals increase. For example, our customers in the agricultural sector require significant deliveries of chemicals within a growing season that can be very short and depend on weather patterns in a given year. We need inventory on hand to have product available to ensure timely delivery to our customers. If our working capital requirements increase and we are unable to finance our working capital on terms and conditions acceptable to us, we may not be able to obtain chemicals to respond to customer demand, which could result in a loss of sales.
In addition, the amount of working capital we require to run our business is expected to increase in the future due to expansions in our business activities. If our working capital needs increase, the amount of free cash we have at our disposal to devote to other uses will decrease. A decrease in free cash could, among other things, limit our flexibility, including our ability to make capital expenditures and to acquire suitable acquisition targets that we have identified. If increases in our working capital occur and have the effect of decreasing our free cash, it could have a material adverse effect on our business, financial condition and results of operations.
We have a history of net losses and may not sustain profitability in the future.
Although we maintain a significant portfolio of owned and leased transportation assets, including trucks, trailers and railcars,rail cars, we also rely on transportation and warehousing provided by third parties (including common carriers and rail companies) to deliver products to our customers. Our access to third party transportation is not guaranteed, and we may be unable to transport chemicals at economically attractive rates in certain circumstances, particularly in cases of adverse market conditions or disruptions to transportation infrastructure. We are also subject to increased costs that we may not always be able to recover from our customers, including fuel prices, as well as charges imposed by common carriers, leasing companies and other third parties involved in transportation. In particular, our US operations rely to a significant extent on rail shipments, and we are therefore required to pay rail companies’ network access fees. We can also experience the availability of trucks and drivers tighten. We are also subject to the risks normally associated with product delivery, including inclement weather, disruptions in the transportation infrastructure, disruptions in our lease arrangements and the availability of fuel, as well as liabilities arising from accidents to the extent we are not adequately covered by insurance or misdelivery of products. Our failure to deliver products in a timely and accurate manner could harm our reputation and brand, which could adversely affect our business, financial condition and results of operations.
Accidents, safety failures, environmental damage, product quality issues, major or systemic delivery failures involving our distribution network or the products we carry, or adverse health effects or other harm related to hazardous materials we blend, manage, handle, store, sell, transport or dispose of could damage our reputation and result in substantial damages or remedial obligations.
Our business depends to a significant extent on our customers’ and producers’ trust in our reputation for reliability, quality, safety and environmental responsibility. Actual or alleged instances of safety deficiencies, mistaken or incorrect deliveries, inferior product quality, exposure to hazardous materials resulting in illness, injury or other harm to persons, property or natural resources, or of damage caused by us or our products, could damage our reputation and lead to customers and producers curtailing the volume of business they do with us. Also, there may be safety, personal injury or other environmental risks related to our products which are not known today. Any of these events, outcomes or allegations could also subject us to substantial legal claims, and we could incur substantial expenses, including legal fees and other costs, in defending such legal claims, which could materially impact our financial position and results of operations.
13
Actual or alleged accidents or other incidents at our facilities or that otherwise involve our personnel or operations could also subject us to claims for damages by third parties. Because many of the chemicals that we handle are dangerous, we are subject to the ongoing risk of hazards, including leaks, spills, releases, explosions and fires, which may cause property damage, illness, physical injury or death. We sell products used in hydraulic fracturing, a process that involves injecting water, sand and chemicals
into subsurface rock formations to release and capture oil and natural gas. The use of such hydraulic fracturing fluids by our customers may result in releases that could impact the environment and third parties. Several of our distribution facilities including our Los Angeles facility, one of our largest, are located near high-density population centers. If any such events occur, whether through our own fault, through preexisting conditions at our facilities, through the fault of a third party or through a natural disaster, terrorist incident or other event outside our control, our reputation could be damaged significantly. We could also become responsible, as a result of environmental or other laws or by court order, for substantial monetary damages or expensive investigative or remedial obligations related to such events, including but not limited to those resulting from third party lawsuits or environmental investigation and cleanup obligations on and off-site. The amount of any costs, including fines, damages and/or investigative and remedial obligations, that we may become obligated to pay under such circumstances could substantially exceed any insurance we have to cover such losses.
Any of these risks, if they materialize, could significantly harm our reputation, expose us to substantial liabilities and have a material adverse effect on our business, financial condition and results of operations.
Our business exposes us to potential product liability claims and recalls, which could adversely affect our financial condition and performance.
The repackaging, blending, mixing, manufacture, sale and distribution of chemical products by us, including products used in hydraulic fracturing operations and products produced with food ingredients or with pharmaceutical and nutritional supplement applications, involve an inherent risk of exposure to product liability claims, product recalls, product seizures and related adverse publicity, including, without limitation, claims for exposure to our products, spills or escape of our products, personal injuries, food related claims and property damage or environmental claims. A product liability claim, judgment or recall against our customers could also result in substantial and unexpected expenditures for us, affect consumer confidence in our products and divert management’s attention from other responsibilities. Although we maintain product liability insurance, there can be no assurance that the type or level of coverage is adequate or that we will be able to continue to maintain our existing insurance or obtain comparable insurance at a reasonable cost, if at all. A product recall or a partially or completely uninsured judgment against us could have a material adverse effect on our business, financial condition and results of operation.
Our business is subject to additional general regulatory requirements and tax requirements, which increase our cost of doing business, could result in regulatory, unclaimed property or tax claims and enforcement actions, and could restrict our business in the future.
Our general business operations are subject to a broad spectrum of general regulatory requirements,international, federal, state, and local laws and regulations, including, without limitation, those relating to antitrust, regulations, food and drug, regulations,labor and human resources, regulations, tax, regulations, unclaimed property, transportation, anti-bribery, banking and treasury, regulations,privacy and data protection (including the European Union's General Data Protection Regulation), hydraulic fracturing or other oil and gas production activities, among others. These laws and regulations add cost to our conduct of business and could, in some instances, result in claims or enforcement actions or could reduce our ability to pursue business opportunities. FutureAny changes could result in additional coststhe laws and restrictions to our business activities. We are currently undergoing a multi-state unclaimed property audit, the timing and outcome of which cannot be predicted; we will incur significant professional fees in connection with the audit and if we are found not to be in compliance the auditing states may seek significant remittances and other penalties and interest.
14
We are exposed to risks including, but not limited to, accidents, contamination and environmental damage, safety claims, natural disasters, terrorism, acts of war and civil unrest and other events that could potentially interrupt our business operations and/or result in significant costs. Although we attempt to cover these risks with insurance to the extent that we consider appropriate, we may incur losses that are not covered by insurance or exceed the maximum amounts covered by our insurance policies. Even if our insurance coverage is appropriate, our insurers may contest, and prevail in litigation regarding, and claims. We have incurred environmental risks and losses, often from our historic activities, for which we have no available or remaining insurance.
We are subject to the risk of litigation, other legal claims and proceedings, and regulatory enforcement actions in the ordinary course of our business. Also, there may be safety or personal injury risks related to our products which are not known today. The results of legal proceedings cannot be predicted with certainty. We cannot guarantee that the results of current or future legal proceedings against McKesson and a few claims asserted directly against Univar USA Inc. will not materially harm our business, reputation or brand, nor can we guarantee that we will not incur losses in connection with current or future legal proceedings that exceed any provisions we may have set aside in respect of such proceedings or that exceed any applicable insurance coverage. We also cannot guarantee that any tax assessment previously made against us by the Canada Revenue Agency will not result in a material tax liability or that the issues raised by Customs and Border Patrol will not result in a material liability. The occurrence of any of these events could have a material adverse effect on our business, financial condition or results of operations. See “Business—Legal Proceedings” in Item 1 of this Annual Report on Form 10-K.
Many of the products we sell have “long-tail” exposures, giving rise to liabilities many years after their sale and use. Insurance purchased at the time of sale may not be available when costs arise in the future and producers may no longer be available to provide indemnification.
In June 2016 the U.K. electorate voted in a referendum to voluntarily depart from the E.U., known as Brexit and in December 2019, the U.K. approved the Withdrawal Agreement and left the European Union (“Brexit”) on January 31, 2020.
The potential impact on our results of operations and liquidity resulting from Brexit remains unclear. The actual effects of Brexit will depend upon many factors and significant uncertainty remains with respect to the terms of the ultimate resolution of the Brexit negotiations. The final terms of the withdrawal may impact certain of our commercial and general business operations in the U.K. and the E.U. In addition, Brexit could lead to legal uncertainty and potentially divergent national laws and regulations, including tax and free trade agreements, supply chain logistics, environmental, health and safety laws and regulations and employment laws, as the U.K. determines which E.U. laws to replace or replicate. We cannot predict the direction Brexit-related developments will take nor the impact of those developments on our European operations and the economies of the markets where we operate. This may cause us to adjust our strategy in order to compete effectively in global markets and could adversely affect our business, financial condition, operating results and cash flows.
Our results of operations could suffer if we are unable to expand into new geographic markets or manage the various risks related to our international activities.
Our profitability and longer-term success may be adversely affected if we fail to continue to expand our penetration in certain foreign markets and to enter new and emerging foreign markets. The profitability of our international operations will largely depend on our continued success in the following areas:
•securing key producer relationships to help establish our presence in international markets;
•hiring and training personnel capable of supporting producers and our customers and managing operations in foreign countries;
•localizing our business processes to meet the specific needs and preferences of foreign producers and customers;
•building our reputation and awareness of our services among foreign producers and customers; and
•implementing new financial, management information and operational systems, procedures and controls to monitor our operations in new markets effectively, without causing undue disruptions to our operations and customer and producer relationships.
In addition, we are subject to risks associated with operating in foreign countries, including:
•varying and often unclear legal and regulatory requirements that may be subject to inconsistent or disparate enforcement, particularly regarding environmental, health and safety issues and security or other certification requirements, as well as other laws and business practices that favor local competitors, such as exposure to possible expropriation, nationalization, restrictions on investments by foreign companies or other governmental actions;
•less stable supply sources;
•competition from existing market participants that may have a longer history in and greater familiarity with the foreign markets where we operate;
•tariffs, export duties, quotas and other barriers to trade; as well as possible limitations on the conversion of foreign currencies into US dollars or remittance of dividends and other payments by our foreign subsidiaries;
•divergent labor regulations and cultural expectations regarding employment and agency;
•different cultural expectations regarding industrialization, international business and business relationships;
•foreign taxes and related regulations, including foreign taxes that we may not be able to offset against taxes imposed upon us in the United States, and foreign tax and other laws limiting our ability to repatriate earnings to the United States;
15
•extended payment terms and challenges in our ability to collect accounts receivable;
•changes in a specific country’s or region’s political or economic conditions;
•compliance with anti-bribery laws such as the US Foreign Corrupt Practices Act, the UK Bribery Act and similar anti-bribery laws in other jurisdictions, the violation of which could expose us to severe criminal or civil sanctions; and
•compliance with anti-boycott, privacy, economic sanctions, anti-dumping, antitrust, import and export laws and regulations by our employees or intermediaries acting on our behalf, the violation of which could expose us to significant fines, penalties or other sanctions.
Increases in interest rates would increase the cost of servicing our debt and could reduce our profitability.
Certain of our outstanding debt bears interest at variable rates. As a result, increases in interest rates would increase the cost of servicing our debt and could materially reduce our profitability and cash flows. Approximately $1.8 billion, or 67 percent of our debt is indexed to LIBOR as a benchmark for establishing the rate and we may hold other operational contracts, including leases, that are also indexed to LIBOR. The U.K. Financial Conduct Authority, which regulates LIBOR, has announced that it intends to phase out LIBOR by the end of 2021. If LIBOR ceases to exist, we may need to amend our debt and other certain agreements that use LIBOR as a benchmark and we cannot predict what alternative index or other amendments may be negotiated with our counterparties. As a result, our interest or operating expense could increase and our available cash flow for general corporate requirements may be adversely affected. For additional information on our indebtedness, debt service obligations and sensitivity to interest rate fluctuations, see “Qualitative and Quantitative Disclosures About Market Risk” in Item 7A of this Annual Report on Form 10-K.
We may have future capital needs and may not be able to obtain additional financing on acceptable terms, or at all.
We have historically relied on debt financing to fund our operations, capital expenditures and expansion. The macroeconomic conditions that affect the markets in which we operate and our credit ratings could have a material adverse effect on our ability to secure financing on acceptable terms, if at all. The terms of additional financing may limit our financial and operating flexibility, and if financing is not available when needed, or is not available on acceptable terms, we may be unable to take advantage of business opportunities or respond to competitive pressures, any of which could have a material adverse effect on our business, financial condition and results of operations.
If we raise additional funds through further issuances of equity, convertible debt securities or other securities convertible into equity, our existing stockholders could suffer significant dilution in their percentage ownership of our company, and any new securities we issue could have rights, preferences and privileges senior to those of holders of our common stock.
Fluctuations in currency exchange rates may adversely affect our results of operations.
We have sizable sales and operations in Canada, Europe, Middle East, Africa, Asia, and Latin America. We report our consolidated results in US dollars and the results of operations and the financial position of our local operations are generally reported in the relevant local currencies and then translated into US dollars at the applicable exchange rates. As a result, our financial performance is impacted by currency fluctuations. For additional details on our currency exposure and risk management practices, see “Quantitative and Qualitative Disclosures About Market Risk” in Item 7A of this Annual Report on Form 10-K.
The integration of our business systems may negatively impact our operations.
We are currently in the process of integrating our legacy business systems into the legacy Nexeo business systems (the “Systems Integration”). The Systems Integration is anticipated to be completed at the end of 2021. Since we will process and reconcile our information from multiple systems until the Systems Integration is complete, the chance of errors is greater. Inconsistencies in the information from multiple systems could adversely impact our ability to manage our business efficiently and may result in heightened risk to our ability to maintain our books and records and comply with regulatory requirements. Any disruptions, delays or deficiencies in the Systems Integration could adversely affect our ability to process orders, track inventory, ship products in a timely manner, prepare invoices to our customers, maintain regulatory compliance and otherwise carry on our business in the ordinary course. The Systems Integration involves numerous risks, including:
•diversion of management’s attention away from normal daily business operations;
•loss of, or delays in accessing, data;
•increased demand on our operations support personnel;
•initial dependence on unfamiliar systems while training personnel to use new systems; and
•increased operating expenses resulting from training, conversion and transition support activities.
Any of the foregoing or if we are unable to implement the Systems Integration successfully, could result in a material increase in information technology compliance or other related costs, and could have a negative impact on our business, financial condition and results of operations.
16
Our balance sheet includes significant goodwill and intangible assets, the impairment of which could affect our future operating results.
We carry significant goodwill and intangible assets on our balance sheet. As of December 31, 2019, our goodwill and intangible assets totaled approximately $2.3 billion and $0.3 billion, respectively. At least annually, the Company assesses goodwill for impairment. If testing indicates that goodwill is impaired, the carrying value is written down based on fair value with a charge against earnings. Where the Company utilizes a discounted cash flow methodology in determining fair value, weakened demand for a specific product line or business could result in an impairment. Intangible assets are amortized for book purposes over their respective useful lives and are tested for impairment if any event occurs or circumstances change that indicates that carrying value may not be recoverable. Accordingly, any determination requiring the write-off of a significant portion of goodwill or intangible assets could negatively impact the Company's financial condition and results of operations. See “Note 15: Goodwill and intangible assets” in Item 8 of this Annual Report on Form 10-K for a discussion of our 2019 impairment review.
We have in the past and may in the future make acquisitions, ventures and strategic investments, some of which may be significant in size and scope, which have involved in the past and will likely involve in the future numerous risks. We may not be able to address these risks without substantial expense, delay or other operational or financial problems.
Acquisitions or investments have involved in the past and will likely involve in the future various risks, such as:
•integrating the technologies, operations and personnel of any acquired business;
•the potential disruption of our ongoing business, including the diversion of management attention;
•the possible inability to obtain the desired financial and strategic benefits from the acquisition or investment;
•customer attrition arising from preferences to maintain redundant sources of supply;
•producer attrition arising from overlapping or competitive products;
•assumption of contingent or unanticipated liabilities or regulatory liabilities;
•dependence on the retention and performance of existing management and work force of acquired businesses for the future performance of these businesses;
•regulatory risks associated with acquired businesses (including the risk that we may be required for regulatory reasons to dispose of a portion of our existing or acquired businesses); and
•the risks inherent in entering geographic or product markets in which we have limited prior experience.
Future acquisitions and investments may need to be financed in part through additional financing from banks, through public offerings or private placements of debt or equity securities or through other arrangements, and could result in substantial cash expenditures. The necessary acquisition financing may not be available to us on acceptable terms if and when required, particularly if our debt leverage levels make it difficult or impossible for us to secure additional financing for acquisitions.
Negative developments affecting our pension and multi-employer pension plans in which we participate may occur.
We operate a number of pension and post-retirement plans for our employees and have obligations with respect to several multi-employer pension plans sponsored by labor unions in the United States. The terms of these plans vary from country to country. The recognition of costs and liabilities associated with the pension and postretirement plans is affected by assumptions made by management and used by actuaries engaged by us to calculate the benefit obligations and the expenses recognized for these plans. The inputs used in developing the required estimates are calculated using a number of assumptions, which represent management’s best estimate of the future. The assumptions that have the most significant impact on costs and liabilities are the discount rate, the estimated long-term return on plan assets for the funded plans, retirement rates, and mortality rates. Changes to the funded status of our pension plans as a result of updates to actuarial assumptions and actual experience that differs from our estimates are recognized as gains or losses in the period incurred under our “mark to market” accounting policy, and could result in a requirement for additional funding.
As of December 31, 2019, our pension plans were underfunded by $234.4 million and our unfunded postretirement plan liabilities were approximately $1.4 million. In recent years, declining interest rates have negatively impacted the funded status of our pension and postretirement plans. If the interest rates continue to decline, funding requirements for our pension plans may become more significant. If our cash flows and capital resources are insufficient to fund our obligations under these pension and postretirement plans, we could be forced to reduce or delay investments and capital expenditures, seek additional capital, or incur indebtedness.
The union sponsored multi-employer pension plans in which we participate are also underfunded, including the substantially underfunded New England Teamsters and Trucking Industry Pension Fund and Central States, Southeast and Southwest Areas Pension Plan, Riskwhich have liabilities that exceed its assets. Often, this requires us to make substantial withdrawal liability payments when we close a facility covered by one of these plans, which could hinder our ability to make otherwise appropriate management decisions to operate as efficiently as possible.
17
A portion of our workforce is unionized and labor disruptions could decrease our profitability.
As of December 31, 2019, approximately 22% of our labor force is covered by a collective bargaining agreement, including approximately 11%, 20%, and 46% of our labor force in the USA, Canada and Europe, respectively. Approximately 3% of our labor force is covered by a collective bargaining agreement that will expire within one year. These arrangements grant certain protections to employees and subject us to employment terms that are similar to collective bargaining agreements. We cannot guarantee that we will be able to negotiate these or other collective bargaining agreements or arrangements with works councils on the same or more favorable terms as the current agreements or arrangements, or at all, and without interruptions, including labor stoppages at the facility or facilities subject to any particular agreement or arrangement. A prolonged labor dispute, which could include a work stoppage, could have a material adverse effect on our business, financial condition and results of operations.
We depend on a limited number of key personnel who would be difficult to replace. If we lose the services of these individuals, or are unable to attract new talent, our business will be adversely affected.
We depend upon the ability and experience of a number of our executive management and other key personnel who have substantial experience with our operations, the chemicals and chemical distribution industries and the selected markets in which we operate. The loss of the services of one or a combination of our senior executives or key employees could have a material adverse effect on our results of operations. We also might suffer an additional impact on our business if one of our senior executives or key employees is hired by a competitor. Our success also depends on our ability to continue to attract, manage and retain other qualified management and technical and clerical personnel as we grow. We may not be able to continue to attract or retain such personnel in the future.
Anti-takeover provisions in our charter documents and Delaware law could discourage, delay or prevent a change in control of our company and may affect the trading price of our common stock.
Our Certificate of Incorporation and By-laws include a number of provisions that may discourage, delay or prevent a change in our management or control over us that stockholders may consider favorable. For example, our Certificate of Incorporation and By-laws currently:
•authorize the issuance of “blank check” preferred stock that could be issued by our Board of Directors to thwart a takeover attempt;
•limit the ability of stockholders to remove directors; and
•establish advance notice requirements for nominations for election to our Board of Directors or for proposing matters that can be acted upon by stockholders at stockholder meetings.
These provisions may prevent our stockholders from receiving the benefit from any premium to the market price of our common stock offered by a bidder in a takeover context. Even in the absence of a takeover attempt or before our Board becomes fully declassified, the existence of these provisions may adversely affect the prevailing market price of our common stock if the provisions are viewed as discouraging takeover attempts in the future. See “Description of Capital Stock—Anti-Takeover Effects of our Certificate of Incorporation and By-laws.” Our Certificate of Incorporation and By-laws may also make it difficult for stockholders to replace or remove our management. These provisions may facilitate management entrenchment that may delay, deter, render more difficult or prevent a change in our control, which may not be in the best interests of our stockholders.
ITEM 1B. UNRESOLVED STAFF COMMENTS.COMMENTS
None.
ITEM 2. PROPERTIES
Our principal executive office is located in Downers Grove, Illinois under a lease expiring in June 2024. As of December 31, 2018,2019, we had 278354 locations in the United States in 47 states. Of thesestates and 336 locations approximately 265 are warehouse facilities responsible for storing and shippingoutside of products and 13 are dedicated office space.the United States in 30 countries. Our warehouse facilities are nearly equally comprised of owned, leased and third party warehouses and our office space is generally leased. Our facilities focus on the storing, repackaging and blending of chemicals and ingredients for distribution. Such facilities do not require substantial investments in equipment, can be opened fairly quickly and replaced with little disruption. As such, we believe that none of our facilities on an individual basis is principalmaterial to the operation of our business. We select locations for our warehouses based on proximity to producers and our customers to maintain efficient distribution networks. We believe that our facilities are adequate and suitable for our current operations. We hold a relatively small number of surplus sites for potential disposition. In some instances, our larger owned sites have been mortgaged under our secured credit facilities.
ITEM 3. LEGAL PROCEEDINGS
ITEM 4. MINE SAFETY DISCLOSURES
Not applicable.
18
PART II
ITEM 5. MARKET FOR REGISTRANT’S COMMON EQUITY, RELATED STOCKHOLDER MATTERS AND ISSUER PURCHASES OF EQUITY SECURITIES
Market Information for Common Stock
Our common stock is listed on the New York Stock Exchange under the symbol “UNVR”.UNVR.
Holders of Record
As of December 31, 2018,2019, there were 2 stockholders of record12 holders of our common stock,Common Stock, as determined by counting our record holders and the closing pricenumber of participants reflected in a security position listing provided to us by the Equiniti Trust Company (EQ). Because such EQ participants are brokers and other institutions holding shares of our common stock was $17.74 per share as reportedCommon Stock on behalf of their customers, we do not know the New York Stock Exchange.actual number of unique shareholders represented by these record holders.
Stock Performance
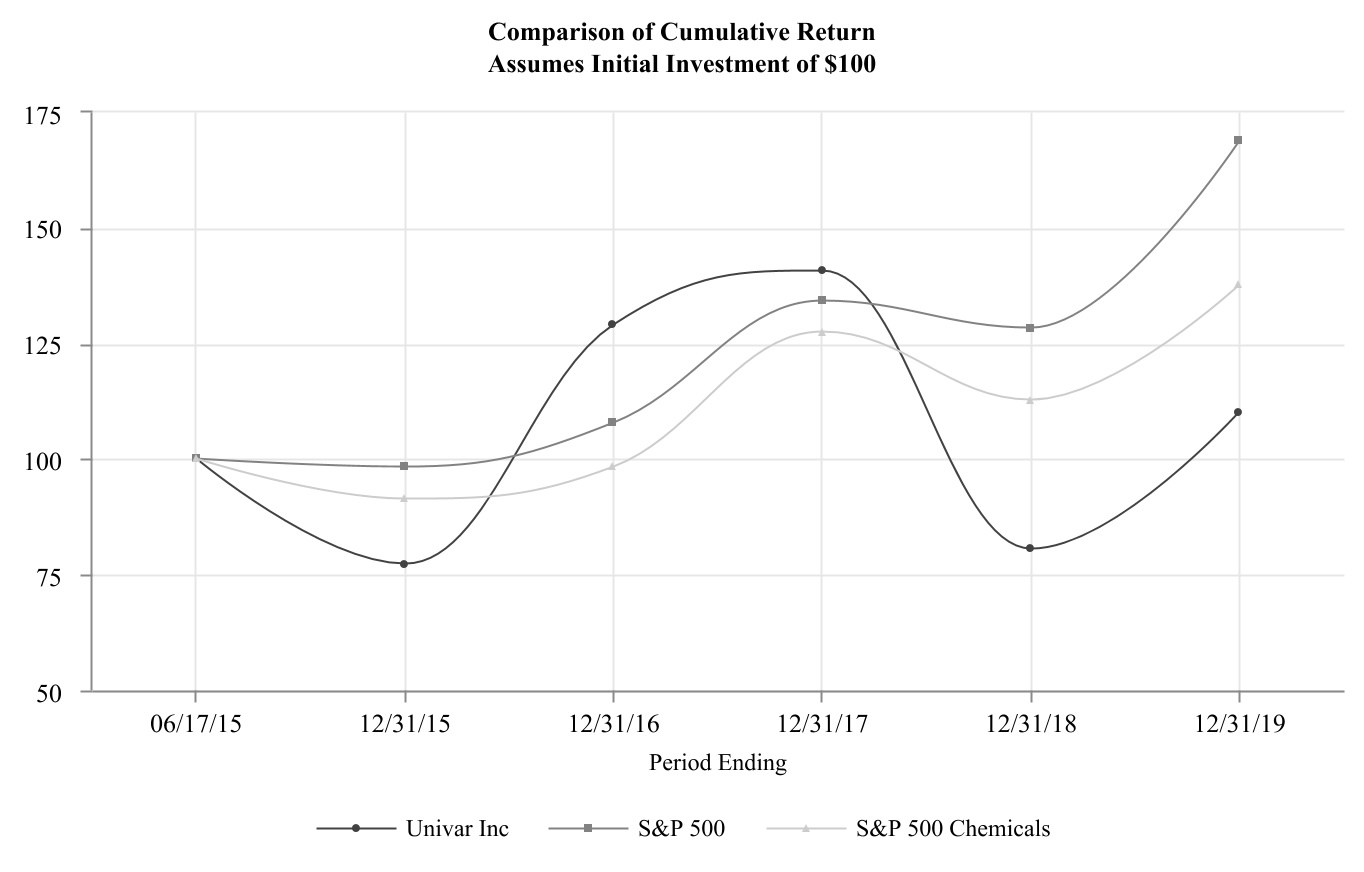
The following graph shows a comparison of cumulative total shareholder return, calculated on a dividend reinvested basis, for the Company, the S&P 500 and the S&P 500 Chemical Index for the period beginning on June 17, 2015 through year ended December 31, 2018.2019. The graph assumes $100 was invested in each of the Company's common stock, the S&P 500 and S&P 500 Chemical Index as of the market close on June 17, 2015. Note that historic stock price performance is not necessarily indicative of future stock price performance.
Dividend Policy
We have never declared or paid any cash dividend on our common stock. We currently intend to retain any future earnings and we have no current plans to pay dividends in future periods.the near future. In addition, our credit facilities contain restrictionslimitations on our ability to pay dividends.
19
ITEM 6. SELECTED FINANCIAL DATA
This “Selected Financial Data” should be read in conjunction with “Management’s Discussion and Analysis of Financial Condition and Results of Operations” in Item 7 of this Annual Report on Form 10-K and our audited consolidated financial statements and related notes included in Item 8 of this Annual Report on Form 10-K.
| Year ended December 31, | |||||||||||||||||||||||||||||||||||||||||||||||||||||
2019 (1) | 2018 | 2017 | 2016 | 2015 | |||||||||||||||||||||||||||||||||||||||||||||||||
| (in millions, except per share data) | |||||||||||||||||||||||||||||||||||||||||||||||||||||
| Consolidated Statements of Operations | |||||||||||||||||||||||||||||||||||||||||||||||||||||
| Net sales | $ | 9,286.9 | $ | 8,632.5 | $ | 8,253.7 | $ | 8,073.7 | $ | 8,981.8 | |||||||||||||||||||||||||||||||||||||||||||
Operating income (2) | 187.3 | 387.4 | 338.0 | 138.4 | 259.3 | ||||||||||||||||||||||||||||||||||||||||||||||||
| Net (loss) income from continuing operations | (105.6) | 172.3 | 119.8 | (68.4) | 16.5 | ||||||||||||||||||||||||||||||||||||||||||||||||
| Net (loss) income | (100.2) | 172.3 | 119.8 | (68.4) | 16.5 | ||||||||||||||||||||||||||||||||||||||||||||||||
| (Loss) income per common share from continuing operations– diluted | (0.64) | 1.21 | 0.85 | (0.50) | 0.14 | ||||||||||||||||||||||||||||||||||||||||||||||||
| (Loss) income per common share – diluted | (0.61) | 1.21 | 0.85 | (0.50) | 0.14 | ||||||||||||||||||||||||||||||||||||||||||||||||
| Consolidated Balance Sheet | |||||||||||||||||||||||||||||||||||||||||||||||||||||
| Cash and cash equivalents | $ | 330.3 | $ | 121.6 | $ | 467.0 | $ | 336.4 | $ | 188.1 | |||||||||||||||||||||||||||||||||||||||||||
| Total assets | 6,494.8 | 5,272.4 | 5,732.7 | 5,389.9 | 5,612.4 | ||||||||||||||||||||||||||||||||||||||||||||||||
| Long-term liabilities | 3,312.6 | 2,746.1 | 3,223.2 | 3,240.5 | 3,502.2 | ||||||||||||||||||||||||||||||||||||||||||||||||
| Stockholders’ equity | 1,732.8 | 1,191.7 | 1,090.1 | 809.9 | 816.7 | ||||||||||||||||||||||||||||||||||||||||||||||||
| Other Financial Data | |||||||||||||||||||||||||||||||||||||||||||||||||||||
Cash provided by operating activities (3) | $ | 363.9 | $ | 289.9 | $ | 282.6 | $ | 450.0 | $ | 356.0 | |||||||||||||||||||||||||||||||||||||||||||
| Cash used by investing activities | (433.1) | (99.0) | (79.1) | (136.0) | (294.4) | ||||||||||||||||||||||||||||||||||||||||||||||||
Cash provided (used) by financing activities (3) | 295.2 | (518.3) | (112.4) | (166.5) | (19.8) | ||||||||||||||||||||||||||||||||||||||||||||||||
| Capital expenditures | 122.5 | 94.6 | 82.7 | 90.1 | 145.0 | ||||||||||||||||||||||||||||||||||||||||||||||||
Adjusted EBITDA (2)(4) | 704.2 | 640.4 | 593.8 | 547.4 | 573.3 | ||||||||||||||||||||||||||||||||||||||||||||||||
Adjusted EBITDA margin (2)(4) | 7.6 | % | 7.4 | % | 7.2 | % | 6.8 | % | 6.4 | % | |||||||||||||||||||||||||||||||||||||||||||
| Fiscal year ended December 31, | |||||||||||||||||||
| 2018 | 2017 | 2016 | 2015 | 2014 | |||||||||||||||
| (in millions, except per share data) | |||||||||||||||||||
| Consolidated Statements of Operations | |||||||||||||||||||
| Net sales | $ | 8,632.5 | $ | 8,253.7 | $ | 8,073.7 | $ | 8,981.8 | $ | 10,373.9 | |||||||||
| Operating income | 387.4 | 338.0 | 138.4 | 259.3 | 315.7 | ||||||||||||||
| Net income (loss) | 172.3 | 119.8 | (68.4 | ) | 16.5 | (20.1 | ) | ||||||||||||
| Income (loss) per common share – diluted | 1.21 | 0.85 | (0.50 | ) | 0.14 | (0.20 | ) | ||||||||||||
| Consolidated Balance Sheet | |||||||||||||||||||
| Cash and cash equivalents | $ | 121.6 | $ | 467.0 | $ | 336.4 | $ | 188.1 | $ | 206.0 | |||||||||
| Total assets | 5,272.4 | 5,732.7 | 5,389.9 | 5,612.4 | 6,067.7 | ||||||||||||||
| Long-term liabilities | 2,746.1 | 3,223.2 | 3,240.5 | 3,502.2 | 4,300.7 | ||||||||||||||
| Stockholders’ equity | 1,191.7 | 1,090.1 | 809.9 | 816.7 | 248.1 | ||||||||||||||
| Other Financial Data | |||||||||||||||||||
| Cash provided by operating activities | $ | 289.9 | $ | 282.6 | $ | 450.0 | $ | 356.0 | $ | 126.3 | |||||||||
| Cash used by investing activities | (99.0 | ) | (79.1 | ) | (136.0 | ) | (294.4 | ) | (148.2 | ) | |||||||||
| Cash (used) provided by financing activities | (518.3 | ) | (112.4 | ) | (166.5 | ) | (19.8 | ) | 84.1 | ||||||||||
| Capital expenditures | 94.6 | 82.7 | 90.1 | 145.0 | 113.9 | ||||||||||||||
Adjusted EBITDA (1) | 640.4 | 593.8 | 547.4 | 573.3 | 624.8 | ||||||||||||||
Adjusted EBITDA margin (1) | 7.4 | % | 7.2 | % | 6.8 | % | 6.4 | % | 6.0 | % | |||||||||
(1)Effective January 1, 2019, the Company adopted new guidance on lease accounting. Prior year amounts have not been adjusted. Refer to “Note 2: Significant accounting policies” for more information. On February 28, 2019, the Company completed the Nexeo acquisition. See “Note 3: Business combinations.”
(3)Cash provided by operating activities and cash (used) provided by financing activities were restated for 2017 and prior to reflect the adoption of ASU 2016-15 “Statement of Cash Flows” (Topic 230) - “Classification of Certain Cash Receipts and Cash Payments” which the Company adopted on January 1, 2018.
(4)Non-GAAP financial measures. See “Management’s Discussion and Analysis of Financial Condition and Results of Operations” in Item 7 of this Annual Report on Form 10-K for further discussion and reconciliation to the most directly comparable GAAP financial performancemeasure. We define Adjusted EBITDA margin as Adjusted EBITDA divided by net sales.
ITEM 7. MANAGEMENT’S DISCUSSION AND ANALYSIS OF FINANCIAL CONDITION AND RESULTS OF OPERATIONS
This Management’s Discussion and Analysis of Financial Condition and Results of Operations (“MD&A”) is based on financial data derived from the financial statements prepared in accordance with the United States (“US”) generally accepted accounting principles (“GAAP”) and certain other financial data that is prepared using non-GAAP measures. For a reconciliation of each non-GAAP financial measure whichto its most comparable GAAP measure, see “Analysis of Segment Results” within this Item and “Note 23: Segments” to our consolidated financial statements in Item 8 of this Annual Report on Form 10-K. Refer to “Non-GAAP Financial Measures” within this Item for more information about our use of Non-GAAP financial measures.
Our MD&A is net income (loss):
| Fiscal year ended December 31, | |||||||||||||||||||
| (in millions) | 2018 | 2017 | 2016 | 2015 | 2014 | ||||||||||||||
| Net income (loss) | $ | 172.3 | $ | 119.8 | $ | (68.4 | ) | $ | 16.5 | $ | (20.1 | ) | |||||||
Impairment charges (1) | — | — | 133.9 | — | 0.3 | ||||||||||||||
| Pension mark to market loss | 34.2 | 3.8 | 68.6 | 21.1 | 117.8 | ||||||||||||||
| Pension curtailment and settlement gains | — | (9.7 | ) | (1.3 | ) | (4.0 | ) | — | |||||||||||
| Non-operating retirement benefits | (11.0 | ) | (9.9 | ) | (15.3 | ) | (26.8 | ) | (16.9 | ) | |||||||||
| Stock-based compensation expense | 20.7 | 19.7 | 10.4 | 7.5 | 12.1 | ||||||||||||||
| Business transformation costs | — | 23.4 | 5.4 | — | — | ||||||||||||||
| Restructuring charges | 4.8 | 5.5 | 6.5 | 33.8 | 46.2 | ||||||||||||||
| Other employee termination costs | 16.4 | 8.1 | 1.5 | — | — | ||||||||||||||
| Loss (gain) on sale of property, plant and equipment and other assets | 2.0 | (11.3 | ) | (0.7 | ) | (2.8 | ) | 3.4 | |||||||||||
| Acquisition and integration related expenses | 22.0 | 3.1 | 5.5 | 7.1 | 3.7 | ||||||||||||||
| Other operating expenses | 7.6 | 6.9 | 8.6 | 14.4 | 8.0 | ||||||||||||||
| Other non-operating items | 3.1 | 3.5 | 0.1 | 4.1 | 2.9 | ||||||||||||||
| Foreign currency transactions | 6.7 | 4.6 | 0.6 | 0.8 | 0.6 | ||||||||||||||
| Foreign currency denominated loans revaluation | 0.8 | 17.9 | 13.7 | (8.9 | ) | (8.3 | ) | ||||||||||||
| Undesignated foreign currency derivative instruments | (1.1 | ) | (0.3 | ) | 1.8 | 4.8 | 3.9 | ||||||||||||
| Undesignated interest rate swap contracts | — | 2.2 | (10.1 | ) | (2.0 | ) | — | ||||||||||||
| Ineffective portion of cash flow hedges | — | — | — | 0.4 | (0.2 | ) | |||||||||||||
| Loss due to discontinuance of cash flow hedges | — | — | — | 7.5 | — | ||||||||||||||
| Debt refinancing costs | — | 5.3 | — | 16.5 | — | ||||||||||||||
| Loss on extinguishment of debt | 0.1 | 3.8 | — | 12.1 | 1.2 | ||||||||||||||
| Advisory fees to CVC and CD&R | — | — | — | 2.8 | 5.9 | ||||||||||||||
| Contract termination fee to CVC and CD&R | — | — | — | 26.2 | — | ||||||||||||||
| Depreciation and amortization | 179.5 | 200.4 | 237.9 | 225.0 | 229.5 | ||||||||||||||
| Interest expense, net | 132.4 | 148.0 | 159.9 | 207.0 | 250.6 | ||||||||||||||
| Tax expense (benefit) | 49.9 | 49.0 | (11.2 | ) | 10.2 | (15.8 | ) | ||||||||||||
| Adjusted EBITDA | $ | 640.4 | $ | 593.8 | $ | 547.4 | $ | 573.3 | $ | 624.8 | |||||||||
20
| Fiscal year ended December 31, | |||||||||||||||||||
| (in millions) | 2018 | 2017 | 2016 | 2015 | 2014 | ||||||||||||||
| Service cost included in Adjusted EBITDA | $ | 2.7 | $ | 2.5 | $ | 2.5 | $ | 5.5 | $ | 7.1 | |||||||||
| Pension expense included in Adjusted EBITDA | $ | 2.7 | $ | 2.5 | $ | 2.5 | $ | 5.5 | $ | 7.1 | |||||||||
| Interest cost | $ | 42.7 | $ | 47.2 | $ | 50.4 | $ | 51.1 | $ | 55.2 | |||||||||
| Expected return on plan assets | (56.4 | ) | (56.9 | ) | (61.2 | ) | (66 | ) | (60.2 | ) | |||||||||
| Amortization of unrecognized prior service cost (credits) | 2.7 | (0.2 | ) | (4.5 | ) | (11.9 | ) | (11.9 | ) | ||||||||||
| Net pension benefit | $ | (11.0 | ) | $ | (9.9 | ) | $ | (15.3 | ) | $ | (26.8 | ) | $ | (16.9 | ) | ||||
| Mark to market loss (gain) due to difference in asset returns | $ | 116.0 | $ | (60.5 | ) | $ | (45.2 | ) | $ | 67.3 | $ | (76.3 | ) | ||||||
| Mark to market (gain) loss due to assumption changes | (81.2 | ) | 60.8 | 103.9 | (39.3 | ) | 196.5 | ||||||||||||
| Mark to market (gain) loss due to plan experience | (0.6 | ) | 3.5 | 9.9 | (6.9 | ) | (2.4 | ) | |||||||||||
| Mark to market loss | $ | 34.2 | $ | 3.8 | $ | 68.6 | $ | 21.1 | $ | 117.8 | |||||||||
| Settlement | $ | — | $ | (9.7 | ) | $ | — | $ | (1.4 | ) | $ | — | |||||||
| Curtailment | — | — | (1.3 | ) | (2.6 | ) | — | ||||||||||||
| Pension curtailment and settlement gains | $ | — | $ | (9.7 | ) | $ | (1.3 | ) | $ | (4.0 | ) | $ | — | ||||||
| Pension expense (income) excluded from Adjusted EBITDA | $ | 23.2 | $ | (15.8 | ) | $ | 52.0 | $ | (9.7 | ) | $ | 100.9 | |||||||
| Total pension expense (income) | $ | 25.9 | $ | (13.3 | ) | $ | 54.5 | $ | (4.2 | ) | $ | 108.0 | |||||||
Overview
Our operations are structured into four operatingreportable segments that represent the geographic areas under which we operate and manage our business. These segments are Univar Solutions USA (“USA”), Univar Solutions Canada (“Canada”), Univar Solutions Europe and the Middle East and Africa (“EMEA”), and Rest of World,Univar Solutions Latin America (“LATAM”), which includes developing businesses in Latin America (including Brazil and Mexico) and the Asia-Pacific region. Prior to its renaming in 2019, LATAM was previously referred to as “Rest of World.”
On February 28, 2019, we define as net sales less cost of goods sold (exclusive of depreciation), delivered gross profit, which we define as gross profit less outbound freight and handling expense, gross margin, which we define as gross profit divided by external net sales, delivered gross margin, which we define as delivered gross profit divided by external net sales as well as Adjusted EBITDA, which we define as our consolidated net income (loss), plus the sum of interest expense, net of interest income, income tax expense (benefit), depreciation, amortization, loss on
On December 31, 2019, we sold our Environmental Sciences business. The sale of the business did not meet the criteria to be classified as a discontinued operations in the Company's financial statements.
Market Conditions and 2016. Information includedOutlook
We sell chemicals that are used in this section for reported sales volumesmanufacturing processes and pricing utilize an average price at the consolidated level and respective reporting segment levels. In certain reporting segments we utilized country and revenue stream information to provide a more accurate representationas components of changes to the business. This discussion should be reador ingredients in conjunction with the consolidated financial statements, including the related notes, see Item 8 “Financial Statements” of this Annual Report on Form 10-K.
Certain of our end markets experience seasonal fluctuations, which also affect our net sales and results of operations. For example, our sales to the agricultural end market, particularly in Canada, tend to peak in the second quarter in each year, depending in part on weather-related variations in demand for agricultural chemicals. Sales to other end markets such as paints and coatings may also be affected by changing seasonal weather conditions, the construction industry and automotive production. Demand for our oil, gas and mining products and services is affected by factors such as the level of exploration, drilling, development and production activity of, and the corresponding capital spending by, oil, gas and mining companies and oilfield service providers, and trends in oil, gas and mineral prices.
Executive Summary
Management is focused, in the near and long term, on the following priorities:
•growth through our sales force, utilizing our realigned sales territories;
•delivering technical and application development excellence through our global network of Solutions Centers;
•investing in, and continued advancement, of our digital capabilities, bringing value to customers and suppliers as we work to attain our goal of being the easiest to do business with;
•network optimization, as we progress with the integration of Nexeo, continuing to realize synergy cost savings;
•continuing to successfully achieve important ERP migration milestones;
•delivering on our commitment to focus on our core chemical and ingredient businesses through strategic divestitures and acquisitions globally; and
•strengthening our balance sheet and pursuing ways to deleverage.
21
Constant Currency
Currency impacts on consolidated and segment results have been derived by translating current period financial results in local currency using the average exchange rate for the prior period to which the financial information is being compared. We believe providing constant currency information provides valuable supplemental information regarding our results of operations, consistent with how we evaluate our performance.
Results of Operations
Year Ended December 31, 2019 Compared to Year Ended December 31, 2018
| Year Ended | Favorable (unfavorable) | % Change | Impact of currency* | ||||||||||||||||||||||||||||||||||||||||||||||||||||||||
| (in millions) | December 31, 2019 | December 31, 2018 | |||||||||||||||||||||||||||||||||||||||||||||||||||||||||
| Net sales | $ | 9,286.9 | 100.0 | % | $ | 8,632.5 | 100.0 | % | $ | 654.4 | 7.6 | % | (1.7) | % | |||||||||||||||||||||||||||||||||||||||||||||
| Cost of goods sold (exclusive of depreciation) | 7,146.1 | 76.9 | % | 6,732.4 | 78.0 | % | (413.7) | 6.1 | % | 1.7 | % | ||||||||||||||||||||||||||||||||||||||||||||||||
| Operating expenses: | |||||||||||||||||||||||||||||||||||||||||||||||||||||||||||
| Outbound freight and handling | 364.8 | 3.9 | % | 328.3 | 3.8 | % | (36.5) | 11.1 | % | 1.4 | % | ||||||||||||||||||||||||||||||||||||||||||||||||
| Warehousing, selling and administrative | 1,068.8 | 11.5 | % | 931.4 | 10.8 | % | (137.4) | 14.8 | % | 14.5 | % | ||||||||||||||||||||||||||||||||||||||||||||||||
| Other operating expenses, net | 298.2 | 3.2 | % | 73.5 | 0.9 | % | (224.7) | 305.7 | % | 1.0 | % | ||||||||||||||||||||||||||||||||||||||||||||||||
| Depreciation | 155.0 | 1.7 | % | 125.2 | 1.5 | % | (29.8) | 23.8 | % | 1.3 | % | ||||||||||||||||||||||||||||||||||||||||||||||||
| Amortization | 59.7 | 0.6 | % | 54.3 | 0.6 | % | (5.4) | 9.9 | % | 1.3 | % | ||||||||||||||||||||||||||||||||||||||||||||||||
| Impairment charges | 7.0 | 0.1 | % | — | — | % | (7.0) | N/M | — | % | |||||||||||||||||||||||||||||||||||||||||||||||||
| Total operating expenses | $ | 1,953.5 | 21.0 | % | $ | 1,512.7 | 17.5 | % | $ | (440.8) | 29.1 | % | 1.6 | % | |||||||||||||||||||||||||||||||||||||||||||||
| Operating income | $ | 187.3 | 2.0 | % | $ | 387.4 | 4.5 | % | $ | (200.1) | (51.7) | % | (2.6) | % | |||||||||||||||||||||||||||||||||||||||||||||
| Other (expense) income: | |||||||||||||||||||||||||||||||||||||||||||||||||||||||||||
| Interest income | 7.7 | 0.1 | % | 3.2 | — | % | 4.5 | 140.6 | % | (12.5) | % | ||||||||||||||||||||||||||||||||||||||||||||||||
| Interest expense | (147.2) | (1.6) | % | (135.6) | (1.6) | % | (11.6) | 8.6 | % | 0.4 | % | ||||||||||||||||||||||||||||||||||||||||||||||||
| Gain on sale of business | 41.4 | 0.4 | % | — | — | % | 41.4 | N/M | — | % | |||||||||||||||||||||||||||||||||||||||||||||||||
| Loss on extinguishment of debt | (19.8) | (0.2) | % | (0.1) | — | % | (19.7) | N/M | — | % | |||||||||||||||||||||||||||||||||||||||||||||||||
| Other expense, net | (70.5) | (0.8) | % | (32.7) | (0.4) | % | (37.8) | 115.6 | % | 2.1 | % | ||||||||||||||||||||||||||||||||||||||||||||||||
| Total other expense | $ | (188.4) | (2.0) | % | $ | (165.2) | (1.9) | % | $ | (23.2) | 14.0 | % | 0.5 | % | |||||||||||||||||||||||||||||||||||||||||||||
| (Loss) income from continuing operations before income taxes | (1.1) | — | % | 222.2 | 2.6 | % | (223.3) | (100.5) | % | (4.1) | % | ||||||||||||||||||||||||||||||||||||||||||||||||
| Income tax expense from continuing operations | 104.5 | 1.1 | % | 49.9 | 0.6 | % | (54.6) | 109.4 | % | 4.4 | % | ||||||||||||||||||||||||||||||||||||||||||||||||
| Net (loss) income from continuing operations | $ | (105.6) | (1.1) | % | $ | 172.3 | 2.0 | % | $ | (277.9) | (161.3) | % | (4.0) | % | |||||||||||||||||||||||||||||||||||||||||||||
| Net income from discontinued operations | 5.4 | 0.1 | % | — | — | % | 5.4 | N/M | — | % | |||||||||||||||||||||||||||||||||||||||||||||||||
| Net (loss) income | $ | (100.2) | (1.1) | % | $ | 172.3 | 2.0 | % | $ | (272.5) | (158.2) | % | (4.1) | % | |||||||||||||||||||||||||||||||||||||||||||||
* Foreign currency translation is included in the percentage change. Unfavorable impacts from foreign currency translation are designated with parentheses.
Net sales
Net sales were $9,286.9 million in the year ended December 31, 2019, an increase of $654.4 million, or 7.6%, from the year ended December 31, 2018. On a constant currency basis, net sales increased from the February 2019 Nexeo acquisition in USA, Canada and LATAM and the May 2018 Earthoil acquisition in EMEA. The increase was partially offset by lower sales volumes primarily due to lower global demand and by unfavorable changes in sales pricing due to chemical price deflation in USA, Canada and LATAM. Refer to the “Analysis of Segment Results” for additional information.
22
Gross profit (exclusive of depreciation)
Gross profit (exclusive of depreciation) increased $240.7 million, or 12.7%, to $2,140.8 million for the year ended December 31, 2019. The increase in gross profit (exclusive of depreciation) is attributable to changes in market and product mix and sales force execution. The increase in gross profit (exclusive of depreciation) from acquisitions was attributable to the February 2019 Nexeo acquisition in USA, Canada and LATAM segments and the May 2018 Earthoil acquisition in EMEA. Included in gross profit (exclusive of depreciation) is a $5.3 million charge in USA related to the inventory fair value step-up adjustment resulting from our February 2019 Nexeo acquisition and a $9.7 million benefit in LATAM related to the Brazil VAT recovery. Excluding these impacts, gross profit (exclusive of depreciation) increased $236.3 million, or 12.4%, to $2,136.4 million for the year ended December 31, 2019. Refer to the “Analysis of Segment Results” for additional information.
Outbound freight and handling
Outbound freight and handling expenses increased $36.5 million, or 11.1%, to $364.8 million for the year ended December 31, 2019. On a constant currency basis, outbound freight and handling expenses increased $40.9 million, or 12.5%, primarily due to the February 2019 Nexeo acquisition partially offset by lower sales volumes. Refer to the “Analysis of Segment Results” for additional information.
Warehousing, selling and administrative
Warehousing, selling and administrative expenses increased $137.4 million, or 14.8%, to $1,068.8 million for the year ended December 31, 2019. On a constant currency basis, the $153.9 million increase is primarily due to incremental expenses from the February 2019 Nexeo acquisition. These costs were partially offset by cost containment efforts across all of our segments. Refer to the “Analysis of Segment Results” for additional information.
Other operating expenses, net
Other operating expenses, net increased $224.7 million, or 305.7%, to $298.2 million for the year ended December 31, 2019. The increase was primarily due to higher acquisition and integration related expenses, expenses related to the saccharin legal settlement, higher other facility exit costs and higher other employee termination costs in connection with the February 2019 Nexeo acquisition. Refer to “Note 6: Other operating expenses, net” in Item 8 of this Annual Report on Form 10-K for additional information.
Depreciation and amortization
Depreciation expense increased $29.8 million, or 23.8%, to $155.0 million for the year ended December 31, 2019. On a constant currency basis, the increase of $31.4 million, or 25.1%, was primarily due to the February 2019 Nexeo acquisition and accelerated depreciation of legacy software.
Amortization expense increased $5.4 million, or 9.9%, to $59.7 million for the year ended December 31, 2019. On a constant currency basis, the increase of $6.1 million was primarily attributable to the February 2019 Nexeo acquisition.
Impairment charges
Impairment charges of $7.0 million were recorded in the year ended December 31, 2019 related to property, plant and equipment in connection with the announced closure of certain production facilities. Refer to “Note 16: Impairment charges” in Item 8 of this Annual Report on Form 10-K for additional information.
Interest expense
Interest expense increased $11.6 million, or 8.6%, to $147.2 million for the year ended December 31, 2019 primarily due to higher average outstanding borrowings in connection with the February 2019 Nexeo acquisition. Refer to “Note 18: Debt” in Item 8 of this Annual Report on Form 10-K for additional information.
Gain on sale of business
A gain of $41.4 million was recorded in the year ended December 31, 2019 related to the sale of the Environmental Sciences business. Refer to “Note 4: Discontinued operations and dispositions” in Item 8 of this Annual Report on Form 10-K for additional information.
23
Loss on extinguishment of debt
Loss on extinguishment of debt of $19.8 million for the year ended December 31, 2019 was due to the February and November 2019 debt refinancing and repayment activities.
Other expense, net
Other expense, net increased $37.8 million, or 115.6%, to $70.5 million for the year ended December 31, 2019. The change was primarily related to the increase in pension mark to market loss, losses on undesignated foreign currency derivative instruments, losses on interest rate swaps as well as the reduction in non-operating pension income. The change was partially offset by foreign currency denominated loan revaluation gains. Refer to “Note 8: Other expense, net” in Item 8 of this Annual Report on Form 10-K for additional information.
Income tax expense from continuing operations
Income tax expense was $104.5 million for the year ended December 31, 2019, resulting in an effective income tax rate of (9500.0)%, compared to the US federal statutory rate of 21.0%. The Company’s effective income tax rate for the year ended December 31, 2019 was primarily driven by increased international tax impacts, including those related to US tax reform and transactions with foreign subsidiaries, tax gain in excess of book gain on the sale of the Environmental Sciences business, nondeductible expenses, including the Saccharin legal settlement, the Nexeo shareholder settlement and state taxes. These increases to the effective income tax rate are partially offset by the release of valuation allowances on certain tax attributes.
Income tax expense was $49.9 million for the year ended December 31, 2018, resulting in an effective income tax rate of 22.5%. The Company’s effective income tax rate for the year ended December 31, 2018 was higher than the US federal statutory rate of 21.0%, primarily due to international tax impacts, including those related to US tax reform and state income taxes. These increases to the effective income tax rate are partially offset by the release of valuation allowances on certain tax attributes.
Net income from discontinued operations
Net income from discontinued operations was $5.4 million for the year ended December 31, 2019. Discontinued operations for 2019 represents one month of the Nexeo plastics distribution business. Refer to “Note 4: Discontinued operations and dispositions” in Item 8 of this Annual Report on Form 10-K for additional information.
Results of Reportable Business Segments
The Company’s operations are structured into four reportable segments that represent the geographic areas under which we operate and manage our business. Management believes Adjusted EBITDA is an important measure of operating performance, which is used as the primary basis for the chief operating decision maker to evaluate the performance of each of our reportable segments. We believe certain other financial measures that are not calculated in accordance with US GAAP provide relevant and meaningful information concerning the ongoing operating results of the Company. These financial measures include gross profit (exclusive of depreciation), adjusted gross profit (exclusive of depreciation), gross margin and adjusted gross margin. Such non-GAAP financial measures are used from time to time herein but should not be viewed as a substitute for GAAP measures of performance. See “Note 23: Segments” in Item 8 of this Annual Report on Form 10-K and “Analysis of Segment Results” within this Item for additional information.
Analysis of Segment Results
USA
| Year ended December 31, | Favorable (unfavorable) | % Change | |||||||||||||||||||||||||||
| (in millions) | 2019 | 2018 | |||||||||||||||||||||||||||
| Net sales: | |||||||||||||||||||||||||||||
| External customers | $ | 5,828.5 | $ | 4,961.0 | $ | 867.5 | 17.5 | % | |||||||||||||||||||||
| Inter-segment | 100.2 | 126.6 | (26.4) | (20.9) | % | ||||||||||||||||||||||||
| Total net sales | $ | 5,928.7 | $ | 5,087.6 | $ | 841.1 | 16.5 | % | |||||||||||||||||||||
| Cost of goods sold (exclusive of depreciation) | 4,550.9 | 3,959.3 | (591.6) | 14.9 | % | ||||||||||||||||||||||||
Inventory step-up adjustment (1) | 5.3 | — | (5.3) | N/M | |||||||||||||||||||||||||
| Outbound freight and handling | 254.6 | 215.6 | (39.0) | 18.1 | % | ||||||||||||||||||||||||
| Warehousing, selling and administrative | 673.8 | 536.3 | (137.5) | 25.6 | % | ||||||||||||||||||||||||
| Adjusted EBITDA | $ | 454.7 | $ | 376.4 | $ | 78.3 | 20.8 | % | |||||||||||||||||||||
24
| Year ended December 31, | Favorable (unfavorable) | % Change | |||||||||||||||||||||||||||
| (in millions) | 2019 | 2018 | |||||||||||||||||||||||||||
| Gross profit (exclusive of depreciation): | |||||||||||||||||||||||||||||
| Net sales | $ | 5,928.7 | $ | 5,087.6 | $ | 841.1 | 16.5 | % | |||||||||||||||||||||
| Cost of goods sold (exclusive of depreciation) | 4,550.9 | 3,959.3 | (591.6) | 14.9 | % | ||||||||||||||||||||||||
| Gross profit (exclusive of depreciation) | $ | 1,377.8 | $ | 1,128.3 | $ | 249.5 | 22.1 | % | |||||||||||||||||||||
Inventory step-up adjustment (1) | 5.3 | — | (5.3) | N/M | |||||||||||||||||||||||||
Adjusted gross profit (exclusive of depreciation) (1) | $ | 1,383.1 | $ | 1,128.3 | $ | 254.8 | 22.6 | % | |||||||||||||||||||||
(1)See definition of adjusted gross profit (exclusive of depreciation) at the end of this Item under “Non-GAAP Financial Measures.” Adjusted gross profit (exclusive of depreciation) excludes the inventory fair value step-up adjustment resulting from our February 2019 Nexeo acquisition.
External sales in the USA segment were $5,828.5 million, an increase of $867.5 million, or 17.5%, in the year ended December 31, 2019. External sales increased primarily due to the February 2019 Nexeo acquisition, partially offset by lower sales volumes attributable to soft demand.
Gross profit (exclusive of depreciation) increased $249.5 million, or 22.1%, to $1,377.8 million in the year ended December 31, 2019. Gross profit (exclusive of depreciation) increased due to the February 2019 Nexeo acquisition and due to favorable changes in pricing and product mix, partially offset by lower sales volumes. Excluding the $5.3 million impact related to the inventory fair value step-up adjustment from the Nexeo acquisition, adjusted gross profit (exclusive of depreciation) increased $254.8 million, or 22.6%, to $1,383.1 million. Both gross margin and adjusted gross margin increased during the year ended December 31, 2019 due to the beneficial impact of product mix, sales force execution and margin management efforts.
Outbound freight and handling expenses increased $39.0 million, or 18.1%, to $254.6 million in the year ended December 31, 2019 primarily due to the February 2019 Nexeo acquisition partially offset by lower sales volumes.
Warehousing, selling and administrative expenses increased $137.5 million, or 25.6%, to $673.8 million in the year ended December 31, 2019 primarily due to incremental expenses from the February 2019 Nexeo acquisition. The increase was also attributable to higher environmental remediation expense partially offset by strong cost containment. Warehousing, selling and administrative expenses as a percentage of external sales increased from 10.8% in the year ended December 31, 2018 to 11.6% in the year ended December 31, 2019.
Adjusted EBITDA increased by $78.3 million, or 20.8%, to $454.7 million in the year ended December 31, 2019 primarily as a result of higher gross profit (exclusive of depreciation). Adjusted EBITDA margin increased from 7.6% in the year ended December 31, 2018 to 7.8% in the year ended December 31, 2019 primarily as a result of higher gross margin, partially offset by increased operating expenses as a percentage of sales.
Canada
| Year ended December 31, | Favorable (unfavorable) | % Change | |||||||||||||||||||||||||||
| (in millions) | 2019 | 2018 | |||||||||||||||||||||||||||
| Net sales: | |||||||||||||||||||||||||||||
| External customers | $ | 1,217.8 | $ | 1,302.3 | $ | (84.5) | (6.5) | % | |||||||||||||||||||||
| Inter-segment | 6.2 | 9.3 | (3.1) | (33.3) | % | ||||||||||||||||||||||||
| Total net sales | $ | 1,224.0 | $ | 1,311.6 | $ | (87.6) | (6.7) | % | |||||||||||||||||||||
| Cost of goods sold (exclusive of depreciation) | 990.3 | 1,080.1 | 89.8 | (8.3) | % | ||||||||||||||||||||||||
| Outbound freight and handling | 41.9 | 42.5 | 0.6 | (1.4) | % | ||||||||||||||||||||||||
| Warehousing, selling and administrative | 91.6 | 84.3 | (7.3) | 8.7 | % | ||||||||||||||||||||||||
| Adjusted EBITDA | $ | 100.2 | $ | 104.7 | $ | (4.5) | (4.3) | % | |||||||||||||||||||||
| Year ended December 31, | Favorable (unfavorable) | % Change | |||||||||||||||||||||||||||
| (in millions) | 2019 | 2018 | |||||||||||||||||||||||||||
| Gross profit (exclusive of depreciation): | |||||||||||||||||||||||||||||
| Net sales | $ | 1,224.0 | $ | 1,311.6 | $ | (87.6) | (6.7) | % | |||||||||||||||||||||
| Cost of goods sold (exclusive of depreciation) | 990.3 | 1,080.1 | 89.8 | (8.3) | % | ||||||||||||||||||||||||
| Gross profit (exclusive of depreciation) | $ | 233.7 | $ | 231.5 | $ | 2.2 | 1.0 | % | |||||||||||||||||||||
25
External sales in the Canada segment were $1,217.8 million, a decrease of $84.5 million, or 6.5%, in the year ended December 31, 2019. On a constant currency basis, external sales decreased $55.6 million, or 4.3%, primarily due to lower sales volumes attributable to the weather-impacted agriculture market as well as lower demand from Canada's energy sector. The decrease also resulted from lower average selling prices due to chemical price deflation and changes in market and product mix, partially offset by the increase due to the February 2019 Nexeo acquisition.
Gross profit (exclusive of depreciation) increased $2.2 million, or 1.0%, to $233.7 million in the year ended December 31, 2019. On a constant currency basis, gross profit (exclusive of depreciation) increased $7.7 million, or 3.3%, due to contributions from the February 2019 Nexeo acquisition, partially offset by lower sales volumes in agriculture. Gross margin increased from 17.8% in the year ended December 31, 2018 to 19.2% in the year ended December 31, 2019 as a result of higher margins on certain commodity chemicals.
Outbound freight and handling expenses decreased $0.6 million, or 1.4%, to $41.9 million in the year ended December 31, 2019 due to lower sales volumes.
Warehousing, selling and administrative expenses increased by $7.3 million, or 8.7%, to $91.6 million in the year ended December 31, 2019 primarily due to incremental expenses from the February 2019 Nexeo acquisition. Warehousing, selling and administrative expenses as a percentage of external sales increased from 6.5% in the year ended December 31, 2018 to 7.5% in the year ended December 31, 2019 due to higher bad debt charges and higher maintenance and repair expenses. On a constant currency basis, warehousing, selling and administrative expenses increased $9.4 million, or 11.2%.
Adjusted EBITDA decreased by $4.5 million, or 4.3%, to $100.2 million in the year ended December 31, 2019. On a constant currency basis, Adjusted EBITDA decreased $2.1 million, or 2.0%, primarily due to lower demand in the agriculture and energy sector. Adjusted EBITDA margin increased from 8.0% in the year ended December 31, 2018 to 8.2% in the year ended December 31, 2019, primarily as a result of higher margins on certain commodity chemicals.
EMEA
| Year ended December 31, | Favorable (unfavorable) | % Change | |||||||||||||||||||||||||||
| (in millions) | 2019 | 2018 | |||||||||||||||||||||||||||
| Net sales: | |||||||||||||||||||||||||||||
| External customers | $ | 1,785.5 | $ | 1,975.7 | $ | (190.2) | (9.6) | % | |||||||||||||||||||||
| Inter-segment | 3.3 | 4.0 | (0.7) | (17.5) | % | ||||||||||||||||||||||||
| Total net sales | $ | 1,788.8 | $ | 1,979.7 | $ | (190.9) | (9.6) | % | |||||||||||||||||||||
| Cost of goods sold (exclusive of depreciation) | 1,363.9 | 1,525.6 | 161.7 | (10.6) | % | ||||||||||||||||||||||||
| Outbound freight and handling | 59.1 | 62.4 | 3.3 | (5.3) | % | ||||||||||||||||||||||||
| Warehousing, selling and administrative | 222.5 | 240.5 | 18.0 | (7.5) | % | ||||||||||||||||||||||||
| Adjusted EBITDA | $ | 143.3 | $ | 151.2 | $ | (7.9) | (5.2) | % | |||||||||||||||||||||
| Year ended December 31, | Favorable (unfavorable) | % Change | |||||||||||||||||||||||||||
| (in millions) | 2019 | 2018 | |||||||||||||||||||||||||||
| Gross profit (exclusive of depreciation): | |||||||||||||||||||||||||||||
| Net sales | $ | 1,788.8 | $ | 1,979.7 | $ | (190.9) | (9.6) | % | |||||||||||||||||||||
| Cost of goods sold (exclusive of depreciation) | 1,363.9 | 1,525.6 | 161.7 | (10.6) | % | ||||||||||||||||||||||||
| Gross profit (exclusive of depreciation) | $ | 424.9 | $ | 454.1 | $ | (29.2) | (6.4) | % | |||||||||||||||||||||
External sales in the EMEA segment were $1,785.5 million, a decrease of $190.2 million, or 9.6%, in the year ended December 31, 2019. On a constant currency basis, external sales decreased $88.5 million, or 4.5%, primarily due to lower sales volumes attributable to soft demand, partially offset by incremental sales from the May 2018 Earthoil acquisition.
Gross profit (exclusive of depreciation) decreased $29.2 million, or 6.4%, to $424.9 million in the year ended December 31, 2019. On a constant currency basis, gross profit (exclusive of depreciation) decreased $5.5 million, or 1.2%, due to lower sales volumes and increased market pressure in the pharmaceutical finished goods product line. Gross margin increased from 23.0% in the year ended December 31, 2018 to 23.8% in the year ended December 31, 2019 primarily due to the favorable change in product mix and margin management initiatives.
Outbound freight and handling expenses decreased $3.3 million, or 5.3%, to $59.1 million. On a constant currency basis, outbound freight and handling expenses remained flat.
26
Warehousing, selling and administrative expenses decreased $18.0 million, or 7.5%, to $222.5 million in the year ended December 31, 2019, and increased as a percentage of external sales from 12.2% in the year ended December 31, 2018 to 12.5% in the year ended December 31, 2019. On a constant currency basis, operating expenses decreased $5.7 million, or 2.4%.
Adjusted EBITDA decreased by $7.9 million, or 5.2%, to $143.3 million in the year ended December 31, 2019. On a constant currency basis, Adjusted EBITDA increased $0.2 million, or 0.1%, primarily due effective cost containment partially offset by soft demand. In the year ended December 31, 2019, the pharmaceutical finished goods product line represented approximately 27% of Adjusted EBITDA in the EMEA segment, declining from approximately 30% in prior year due to increased market pressures. Adjusted EBITDA margin increased from 7.7% in the year ended December 31, 2018 to 8.0% in the year ended December 31, 2019.
LATAM
| Year ended December 31, | Favorable (unfavorable) | % Change | |||||||||||||||||||||||||||
| (in millions) | 2019 | 2018 | |||||||||||||||||||||||||||
| Net sales: | |||||||||||||||||||||||||||||
| External customers | $ | 455.1 | $ | 393.5 | $ | 61.6 | 15.7 | % | |||||||||||||||||||||
| Inter-segment | — | 0.2 | (0.2) | (100.0) | % | ||||||||||||||||||||||||
Total net sales (1) | $ | 455.1 | $ | 393.7 | $ | 61.4 | 15.6 | % | |||||||||||||||||||||
| Cost of goods sold (exclusive of depreciation) | 350.7 | 307.5 | (43.2) | 14.0 | % | ||||||||||||||||||||||||
| Outbound freight and handling | 9.2 | 7.8 | (1.4) | 17.9 | % | ||||||||||||||||||||||||
| Warehousing, selling and administrative | 50.8 | 45.1 | (5.7) | 12.6 | % | ||||||||||||||||||||||||
Brazil VAT recovery (1) | (8.3) | — | 8.3 | N/M | |||||||||||||||||||||||||
Adjusted EBITDA (1) | $ | 36.1 | $ | 33.3 | $ | 2.8 | 8.4 | % | |||||||||||||||||||||
| Year ended December 31, | Favorable (unfavorable) | % Change | |||||||||||||||||||||||||||
| (in millions) | 2019 | 2018 | |||||||||||||||||||||||||||
| Gross profit (exclusive of depreciation): | |||||||||||||||||||||||||||||
| Net sales | $ | 455.1 | $ | 393.7 | $ | 61.4 | 15.6 | % | |||||||||||||||||||||
| Cost of goods sold (exclusive of depreciation) | 350.7 | 307.5 | (43.2) | 14.0 | % | ||||||||||||||||||||||||
Gross profit (exclusive of depreciation) (1) | $ | 104.4 | $ | 86.2 | $ | 18.2 | 21.1 | % | |||||||||||||||||||||
Brazil VAT recovery (1) | (9.7) | — | 9.7 | N/M | |||||||||||||||||||||||||
| Adjusted gross profit (exclusive of depreciation) | $ | 94.7 | $ | 86.2 | $ | 8.5 | 9.9 | % | |||||||||||||||||||||
(1)Included in net sales and gross profit (exclusive of depreciation) is a $9.7 million benefit related to a Brazil VAT recovery. The benefit of $8.3 million, net of associated fees, is excluded from Adjusted EBITDA. See “Note 21: Commitments and contingencies” in Item 8 of this Annual Report on Form 10-K for further information regarding the Brazil VAT recovery for the year ended December 31, 2019.
External sales in the LATAM segment were $455.1 million, an increase of $61.6 million, or 15.7%, in the year ended December 31, 2019. On a constant currency basis, external sales increased $75.6 million, or 19.2%, which includes $9.7 million related to the Brazil VAT recovery. The increase was also due to the February 2019 Nexeo acquisition along with contributions from the Brazilian agriculture sector.
Gross profit (exclusive of depreciation) increased $18.2 million, or 21.1%, to $104.4 million in the year ended December 31, 2019. On a constant currency basis, gross profit (exclusive of depreciation) increased $22.5 million, or 26.1%, primarily due to the Brazil VAT recovery impact of $9.7 million and the February 2019 Nexeo acquisition. Excluding the $9.7 million impact related to the Brazil VAT recovery, adjusted gross profit (exclusive of depreciation) increased $8.5 million, or 9.9%, to $94.7 million. Gross margin inclusive of the Brazil VAT recovery increased from 21.9% to 22.9% and excluding the Brazil VAT recovery decreased from 21.9% to 21.3% in the year ended December 31, 2018 when compared to December 31, 2019.
Outbound freight and handling expenses increased $1.4 million, or 17.9%, to $9.2 million in the year ended December 31, 2019 primarily due to incremental expenses from the February 2019 Nexeo acquisition and higher sales volumes.
Warehousing, selling and administrative expenses increased $5.7 million, or 12.6%, to $50.8 million in the year ended December 31, 2019 and decreased as a percentage of external sales from 11.5% in the year ended December 31, 2018 to 11.2% in the year ended December 31, 2019. On constant currency basis, warehousing, selling and administrative expenses increased
27
$7.6 million, or 16.9%, primarily due to incremental expenses from the February 2019 Nexeo acquisition as well as from associated fees related to the Brazil VAT recovery, partially offset by strong cost control.
Adjusted EBITDA increased by $2.8 million, or 8.4%, to $36.1 million in the year ended December 31, 2019. On a constant currency basis, Adjusted EBITDA increased $5.0 million, or 15.0%, primarily as a result of higher gross profit (exclusive of depreciation). Adjusted EBITDA margin inclusive of the Brazil VAT recovery decreased from 8.5% to 7.9% and excluding the Brazil VAT recovery decreased from 8.5% to 8.1% in the year ended December 31, 2018 when compared to December 31, 2019.
Liquidity and Capital Resources
Our primary source of liquidity is cash generated from our operations as well as borrowings under our committed credit facilities. As of December 31, 2019, our total liquidity was approximately $931.2 million, comprised of $600.9 million available under our credit facilities and $330.3 million of cash and cash equivalents. Our primary liquidity and capital resource needs are to service our debt and to finance working capital, capital expenditures, other liabilities and general corporate purposes. We have significant working capital needs, although we have implemented several initiatives to improve our working capital and reduce the related financing requirements. The nature of our business, however, requires that we maintain inventories that enable us to deliver products to fill customer orders. As of December 31, 2019, we maintained inventories of $796.0 million, equivalent to approximately 43.6 days of sales.
Total debt as of December 31, 2019 was $2,714.5 million, consisting of senior term loans, asset backed loans, senior unsecured notes, finance lease obligations and short-term financing. We may from time to time repurchase our debt or take other steps to reduce our debt or interest cost. These actions may include open market repurchases, negotiated repurchases or opportunistic refinancing of debt. The amount of debt, if any, that may be repurchased or refinanced will depend on market conditions, trading levels of our debt, our cash position, compliance with debt covenants and other considerations. Refer to “Note 18: Debt” in Item 8 of this Annual Report on Form 10-K for further information.
Our defined benefit pension plans had an underfunded status of $234.4 million and $212.4 million as of December 31, 2019 and 2018, respectively. Based on current projections of minimum funding requirements, we expect to make cash contributions of $22.9 million to our defined benefit pension plans in 2020. The timing for any such requirement in future years is uncertain given the implicit uncertainty regarding the future developments of factors described in “Risk Factors” in Item 1A of this Annual Report on Form 10-K.
As a result of the 2017 US Tax Act, the Company recorded in 2017 a one-time Section 965 repatriation tax of $76.5 million. After offsetting allowable tax credits, we elected to pay the remaining balance of $14.9 million over eight years, of which $9.2 remains at December 31, 2019.
We expect our 2020 capital expenditures for maintenance, safety and cost improvements and investments in our digital capabilities to be approximately $120 million to $130 million. Interest payments for 2020 are expected to be $115 million to $130 million. We expect to fund our capital expenditures and our interest payments with cash from operations or cash on hand.
We believe funds provided by our primary sources of liquidity will be adequate to meet our liquidity and capital resource needs for at least the next 12 months under current operating conditions.
Cash Flows
The following table presents a summary of our cash flow activity:
| Year Ended December 31, | |||||||||||||||||||||||||||||
| (in millions) | 2019 | 2018 | 2017 | ||||||||||||||||||||||||||
| Net cash provided by operating activities | $ | 363.9 | $ | 289.9 | $ | 282.6 | |||||||||||||||||||||||
| Net cash used by investing activities | (433.1) | (99.0) | (79.1) | ||||||||||||||||||||||||||
| Net cash provided (used) by financing activities | 295.2 | (518.3) | (112.4) | ||||||||||||||||||||||||||
Year Ended December 31, 2019 Compared to Year Ended December 31, 2018
Cash Provided by Operating Activities
Cash provided by operating activities increased $74.0 million to $363.9 million for the year ended December 31, 2019 from $289.9 million for the year ended December 31, 2018. The increase is primarily due to changes in trade working capital and prepaid expenses and other current assets, partially offset by changes in net income, exclusive of non-cash items. The change in net income, exclusive of non-cash items, provided net cash outflows of $238.4 million related to reduced cash inflows when compared to the change in the prior year. Net income, exclusive of non-cash items, provided net cash inflows of $150.0 million and $388.4 million for the years ended December 31, 2019 and December 31, 2018, respectively.
28
The change in trade working capital, which includes trade accounts receivable, net, inventories, and trade accounts payable, provided net cash inflows of $233.5 million when compared to the change in the prior year. Trade working capital provided cash inflows of $195.1 million for the year end December 31, 2019 compared to cash outflows of $38.4 million for the year ended December 31, 2018. Cash inflows from trade accounts receivable, net is attributable to improvements in the timing of customer payments and reduced sales volumes, excluding acquisitions, during the current year. Inventory cash inflows on a year-over-year basis are primarily related to reductions in the USA segment inventories due to reduced sales volumes and favorable supplier partner pricing. The year-over-year cash outflows related to trade accounts payable are primarily attributable to decreased inventory purchases in the current year.
The change in prepaid expenses and other current assets is primarily due to payment timing differences and favorable changes in expected product returns from customers. The change in pension and other postretirement benefit liabilities is primarily due to unfavorable changes in actuarial valuations, partially offset by favorable changes in expected returns on plan assets.
Cash Used by Investing Activities
Cash used by investing activities increased $334.1 million to $433.1 million for the year ended December 31, 2019 from $99.0 million for the year ended December 31, 2018. The increase is primarily related to the acquisition of the Nexeo business in 2019, net of the proceeds received for the sale and dispositions of Nexeo Plastics and the Environmental Sciences business. In 2018, the Company acquired Earthoil and Kemetyl. Refer to “Note 3: Business combinations” and “Note 4: Discontinued operations and dispositions” in Item 8 of this Annual Report on Form 10-K for additional information related to the Company's acquisitions and dispositions.
Cash Provided (Used) by Financing Activities
Cash provided (used) by financing activities increased $813.5 million to cash provided of $295.2 million for the year ended December 31, 2019 from cash used of $518.3 million for the year ended December 31, 2018. The increase in financing cash flows is primarily due to raising additional debt to finance the February 2019 Nexeo acquisition and debt refinancing activities that occurred during the fourth quarter of 2019. The increase in financing activities were partially offset by increased debt repayments primarily due to the sale of Nexeo Plastics, where proceeds were used to pay down debt, and 2019 fourth quarter refinancing activities. Refer to “Note 18: Debt” in Item 8 of this Annual Report on Form 10-K for additional information related to the Company’s debt.
Contractual Obligations and Commitments
Our contractual obligations and commitments as of December 31, 2019 are as follows:
| Payment Due by Period | |||||||||||||||||||||||||||||||||||||||||||||||||||||
| (in millions) | Total | 2020 | 2021 - 2022 | 2023 - 2024 | Thereafter | ||||||||||||||||||||||||||||||||||||||||||||||||
Short-term financing (1) | $ | 0.7 | $ | 0.7 | $ | — | $ | — | $ | — | |||||||||||||||||||||||||||||||||||||||||||
| Finance leases | 74.6 | 22.6 | 34.6 | 11.1 | 6.3 | ||||||||||||||||||||||||||||||||||||||||||||||||
Long-term debt, including current maturities (1) | 2,668.9 | 4.0 | 138.9 | 1,646.0 | 880.0 | ||||||||||||||||||||||||||||||||||||||||||||||||
Interest (2) | 560.4 | 111.7 | 204.5 | 159.9 | 84.3 | ||||||||||||||||||||||||||||||||||||||||||||||||
| Minimum operating lease payments | 185.2 | 53.6 | 73.1 | 33.8 | 24.7 | ||||||||||||||||||||||||||||||||||||||||||||||||
Estimated environmental liability payments (3) | 84.3 | 25.0 | 19.1 | 12.9 | 27.3 | ||||||||||||||||||||||||||||||||||||||||||||||||
| 2017 US repatriation tax | 9.2 | — | 2.5 | 6.7 | — | ||||||||||||||||||||||||||||||||||||||||||||||||
Other (4) | 112.6 | 54.6 | 28.0 | 30.0 | — | ||||||||||||||||||||||||||||||||||||||||||||||||
Total (5) | $ | 3,695.9 | $ | 272.2 | $ | 500.7 | $ | 1,900.4 | $ | 1,022.6 | |||||||||||||||||||||||||||||||||||||||||||
(1)See “Note 18: Debt” in Item 8 of this Annual Report on Form 10-K for additional information.
(2)Interest payments on debt are calculated for future periods using interest rates in effect as of December 31, 2019 and obligations on that date. Projected interest payments include the related effects of interest rate swap agreements. Certain of these projected interest payments may differ in the future based on changes in floating interest rates, foreign currency fluctuations or other factors or events.
(3)Included in the less than one year category is $11.7 million related to environmental liabilities for which the timing is uncertain. The timing of payments is unknown and could differ based on future events. For more information see “Note 21: Commitments and contingencies” in Item 8 of this Annual Report on Form 10-K.
(4)Commitments related to capital expenditures and other contractual obligations.
(5)This table excludes our pension and postretirement medical benefit obligations. Based on current projections of minimum funding requirements, we expect to make cash contributions of $22.9 million to our defined benefit pension plans in the year ended December 31, 2020. The timing for any such requirement in future years is uncertain given the implicit uncertainty regarding the future developments of factors described in “Risk Factors” in Item 1A of this Annual Report on Form 10-K and “Note 11: Employee benefit plans” in Item 8 of this Annual Report on Form 10-K.
29
We expect that we will be able to fund our remaining obligations and commitments with cash flow from operations. To the extent we are unable to fund these obligations and commitments with cash flow from operations; we intend to fund these obligations and commitments with proceeds from available borrowing capacity under our New Senior ABL Facility or under future financings.
Off-Balance Sheet Arrangements
With the exception of letters of credit, we had no material off-balance sheet arrangements as of December 31, 2019.
Critical Accounting Estimates
Preparation of our financial statements requires management to make estimates and assumptions that affect the reported amounts of assets, liabilities, revenues and expenses. Actual results may differ from these estimates under different assumptions or conditions.
Our significant accounting policies are described in “Note 2: Significant accounting policies” in Item 8 of this Annual Report on Form 10-K. We consider an accounting estimate to be critical if that estimate requires that we make assumptions about matters that are highly uncertain at the time we make that estimate and if different estimates that we could reasonably have used or changes in accounting estimates that are reasonably likely to occur could materially affect our consolidated financial statements. Our critical accounting estimates are as follows:
Goodwill
We perform an annual impairment assessment of goodwill at the reporting unit level as of October 1 of each year, or more frequently if indicators of potential impairment exist. The analysis may include both qualitative and quantitative factors to assess the likelihood of an impairment. The reporting unit’s carrying value used in an impairment test represents the assignment of various assets and liabilities, excluding certain corporate assets and liabilities, such as cash, investments, and debt.
Qualitative factors include industry and market considerations, overall financial performance, and other relevant events and factors affecting the reporting unit. Additionally, as part of this assessment, we may perform a quantitative analysis to support the qualitative factors above by applying sensitivities to assumptions and inputs used in measuring a reporting unit’s fair value.
Our quantitative impairment test considers both the income approach and the market approach to estimate a reporting unit’s fair value. Significant estimates include forecasted EBITDA, market segment growth rates, estimated costs, and discount rates based on a reporting unit's weighted average cost of capital (“WACC”). The use of different assumptions, estimates or judgments could significantly impact the estimated fair value of a reporting unit, and therefore, impact the excess fair value above carrying value of the reporting unit.
We test the reasonableness of the inputs and outcomes of our discounted cash flow analysis against available market data. In the current year, the fair value of the Canada reporting unit, exceeded the carrying value by 11 percent. Key assumptions in our goodwill impairment test include an 11 percent estimated WACC for the Canada business and a residual growth rate of 2.5 percent. A 100 basis point change in the discount rate and a terminal growth assumption of zero would not have reduced the fair values of the Canada reporting unit below carrying value. The fair value for all other reporting units substantially exceeds their carrying value.
Business Combinations
We allocate the purchase price paid for assets acquired and liabilities assumed in connection with our acquisitions based on their estimated fair values at the time of acquisition. This allocation involves a number of assumptions, estimates, and judgments in determining the fair value, as of the acquisition date, of the following:
•intangible assets, including the valuation methodology, estimations of future cash flows, discount rates, recurring revenues attributed to customer relationships, and our assumed market segment share, as well as the estimated useful life of intangible assets;
•deferred tax assets and liabilities, uncertain tax positions, and tax-related valuation allowances;
•inventory; property, plant and equipment; pre-existing liabilities or legal claims; and
•goodwill as measured as the excess of consideration transferred over the net of the acquisition date fair values of the assets acquired and the liabilities assumed.
Our assumptions and estimates are based upon comparable market data and information obtained from our management and the management of the acquired companies. We allocate goodwill to the reporting units of the business that are expected to benefit from the business combination.
30
Purchase Accounting for the Nexeo Solutions Acquisition
Our acquisition of Nexeo Solutions in 2019 was accounted for with ASC Topic 805, Business Combinations, as amended. As of December 31, 2019, the allocation of the purchase price to the acquired assets and assumed liabilities was considered preliminary. See “Note 3: Business combinations” in Item 8 of this Annual Report on Form 10-K for additional information.
Determining the fair value of assets acquired and liabilities assumed requires management’s judgment, and we utilized an independent valuation expert in the valuation of the tangible and intangible assets. Critical estimates used in valuing tangible and intangible assets include, but are not limited to, future expected cash flows, discount rates, market prices and asset lives. The valuation of customer relationships utilized an income approach, using an excess earnings methodology. Additionally, the total recurring revenue attributable to the customer relationship was based upon the relative split between specialty and commodity chemicals. Key assumptions used in the business enterprise valuation include the forecasted cash flows discounted using the WACC, which reflects the macroeconomic, industry and geographic factors of the risk of achieving the forecasted cash flows, and ranged from 10.5 percent to 19.0 percent, depending on the country.
Environmental Liabilities
We recognize environmental liabilities for probable and reasonably estimable losses associated with environmental remediation. The estimated environmental liability includes incremental direct costs of investigations, remediation efforts and post-remediation monitoring. The total environmental reserve at December 31, 2019 and 2018 was $78.7 million and $83.5 million, respectively. See “Note 21: Commitments and contingencies” in Item 8 of this Annual Report on Form 10-K.
Our environmental reserves are subject to numerous uncertainties that affect our ability to estimate our costs, or our share of costs if multiple parties are responsible. These uncertainties involve the legal, regulatory and enforcement parameters governing environmental assessment and remediation, the nature and extent of contamination at these sites, the extent and cost of assessment and remediation efforts required, our insurance coverage for these sites and, in the case of sites with multiple responsible parties, the number and financial strength of those parties. In addition, our determination as to whether a loss is probable may change, particularly as new facts emerge as to the causes of contamination. We evaluate each environmental site as new information and facts become available and make adjustments to reserves based upon our assessment of these factors, using technical experts, legal counsel and other specialists.
Defined Benefit Pension and Other Postretirement Obligations
We sponsor defined benefit pension plans in the US and other countries. The accounting for these plans depends on assumptions made by management, which are used by actuaries we engage to calculate the projected and accumulated benefit obligations and the annual expense recognized for these plans. These assumptions include discount rates, expected return on assets, mortality and retirement rates and for certain plans, rates for compensation increases. Actual experience different from those estimated assumptions can result in the recognition of gains and losses in earnings as our accounting policy is to recognize changes in the fair value of plan assets and each plan’s projected benefit obligation in the fourth quarter of each year (the “mark to market” adjustment), unless an earlier remeasurement is required. For the year ended December 31, 2019 and 2018, we recorded a mark to market loss of $50.9 million and $34.9 million, respectively. See “Note 11: Employee benefit plans” in Item 8 of this Annual Report on Form 10-K for additional information.
Due to the phasing out of benefits under our postretirement plans, changes in assumptions have an immaterial effect on that obligation.
A change in the assumed discount rate and return on plan asset rate would have the following effects:
| Increase (decrease) in | |||||||||||||||||||||||
| (in millions) | Percentage Change | 2020 Net Benefit Cost | 2019 Pension Benefit Obligation | ||||||||||||||||||||
| Discount rate | 25 bps decrease | $ | (2.0) | $ | 51.4 | ||||||||||||||||||
| Discount rate | 25 bps increase | 1.8 | (48.4) | ||||||||||||||||||||
| Expected return on plan assets | 100 bps decrease | 10.4 | N/A | ||||||||||||||||||||
| Expected return on plan assets | 100 bps increase | (10.4) | N/A | ||||||||||||||||||||
Income Taxes
The Company is subject to income taxes in the jurisdictions in which it sells products and earn revenues. We record income taxes under the asset and liability method. Under this method, deferred tax assets and liabilities are recognized based on the future tax consequences to temporary differences between the financial statement carrying values of existing assets and liabilities and their respective tax bases. Deferred tax assets and liabilities are measured using enacted tax rates expected to
31
apply in the years in which the temporary differences are expected to be recovered or paid. A reduction of the carrying values of deferred tax assets by a valuation allowance is required if, based on the available evidence, it is more likely than not that such assets will not be realized. In evaluating the Company’s ability to realize its deferred tax assets, in full or in part, the Company considered all available positive and negative evidence, including its past operating results, forecasted and appropriate character of future taxable income, the duration of statutory carryforward periods, our experience with operating loss and tax credit carryforwards not expiring unused and feasible tax strategies. The Company has a valuation allowance on certain deferred tax assets, primarily related to foreign tax credits, net operating loss carry forwards and deferred interest.
Effective in 2018, the Company is subject to global intangible low tax income (“GILTI”), which is a tax on foreign income in excess of a deemed return on tangible assets of foreign corporations. We elect to treat taxes due on future US inclusions in taxable income related to GILTI as a current-period expense when incurred and during the year ended December 31, 2019 and 2018, we recorded $22.8 million and $19.9 million, respectively, due to the impact of GILTI.
Recently Issued Accounting Pronouncements
See “Note 2: Significant accounting policies” in Item 8 of this Annual Report on Form 10-K.
Our primary source of liquidity is cash generated from our operations as well as borrowings under our committed credit facilities. As of December 31, 2019, our total liquidity was approximately $931.2 million, comprised of $600.9 million available under our credit facilities and $330.3 million of cash and cash equivalents. Our primary liquidity and capital resource needs are to service our debt and to finance working capital, capital expenditures, other liabilities and general corporate purposes. We believehave significant working capital needs, although we have implemented several initiatives to improve our working capital and reduce the related financing requirements. The nature of our business, however, requires that certain financial measureswe maintain inventories that do not comply with US GAAP provide relevantenable us to deliver products to fill customer orders. As of December 31, 2019, we maintained inventories of $796.0 million, equivalent to approximately 43.6 days of sales.
Total debt as of December 31, 2019 was $2,714.5 million, consisting of senior term loans, asset backed loans, senior unsecured notes, finance lease obligations and meaningful information concerning the ongoing operating results of the Company. These financial measures include gross profit, gross margin, delivered gross profit and delivered gross margin (all exclusive of depreciation) and Adjusted EBITDA. Such non-GAAP financial measures are usedshort-term financing. We may from time to time herein but should notrepurchase our debt or take other steps to reduce our debt or interest cost. These actions may include open market repurchases, negotiated repurchases or opportunistic refinancing of debt. The amount of debt, if any, that may be viewedrepurchased or refinanced will depend on market conditions, trading levels of our debt, our cash position, compliance with debt covenants and other considerations. Refer to “Note 18: Debt” in Item 8 of this Annual Report on Form 10-K for further information.
Our defined benefit pension plans had an underfunded status of $234.4 million and $212.4 million as a substitute for GAAP measures of performance.
We expect our 2020 capital expenditures for maintenance, safety and lower demandcost improvements and investments in our digital capabilities to be approximately $120 million to $130 million. Interest payments for 2020 are expected to be $115 million to $130 million. We expect to fund our capital expenditures and our interest payments with cash from operations or cash on hand.
We believe funds provided by our primary sources of liquidity will be adequate to meet our liquidity and capital resource needs for at least the Canadian energy sector.next 12 months under current operating conditions.
Cash Flows
The following tables set forth, for the periods indicated, certain statementstable presents a summary of operations data first on the basis of reported data and then as a percentage of total net sales for the relevant period. The financial data set forth below is not necessarily indicative of the results of future operations and should be read in conjunction with our historical consolidated financial statements and accompanying notes included elsewhere herein.cash flow activity:
| Year Ended December 31, | |||||||||||||||||||||||||||||
| (in millions) | 2019 | 2018 | 2017 | ||||||||||||||||||||||||||
| Net cash provided by operating activities | $ | 363.9 | $ | 289.9 | $ | 282.6 | |||||||||||||||||||||||
| Net cash used by investing activities | (433.1) | (99.0) | (79.1) | ||||||||||||||||||||||||||
| Net cash provided (used) by financing activities | 295.2 | (518.3) | (112.4) | ||||||||||||||||||||||||||
Year Ended December 31, 20182019 Compared to Year Ended December 31, 20172018
Cash Provided by Operating Activities
| Year Ended | Favorable (unfavorable) | % Change | Impact of currency* | ||||||||||||||||||||
| (in millions) | December 31, 2018 | December 31, 2017 | |||||||||||||||||||||
| Net sales | $ | 8,632.5 | 100.0 | % | $ | 8,253.7 | 100.0 | % | $ | 378.8 | 4.6 | % | 0.5 | % | |||||||||
| Cost of goods sold (exclusive of depreciation) | 6,732.4 | 78.0 | % | 6,448.2 | 78.1 | % | (284.2 | ) | 4.4 | % | (0.4 | )% | |||||||||||
| Operating expenses: | |||||||||||||||||||||||
| Outbound freight and handling | 328.3 | 3.8 | % | 292.0 | 3.5 | % | (36.3 | ) | 12.4 | % | (0.7 | )% | |||||||||||
| Warehousing, selling and administrative | 931.4 | 10.8 | % | 919.7 | 11.1 | % | (11.7 | ) | 1.3 | % | (0.5 | )% | |||||||||||
| Other operating expenses, net | 73.5 | 0.9 | % | 55.4 | 0.7 | % | (18.1 | ) | 32.7 | % | (0.2 | )% | |||||||||||
| Depreciation | 125.2 | 1.5 | % | 135.0 | 1.6 | % | 9.8 | (7.3 | )% | (0.4 | )% | ||||||||||||
| Amortization | 54.3 | 0.6 | % | 65.4 | 0.8 | % | 11.1 | (17.0 | )% | 0.2 | % | ||||||||||||
| Total operating expenses | $ | 1,512.7 | 17.5 | % | $ | 1,467.5 | 17.8 | % | $ | (45.2 | ) | 3.1 | % | (0.5 | )% | ||||||||
| Operating income | $ | 387.4 | 4.5 | % | $ | 338.0 | 4.1 | % | $ | 49.4 | 14.6 | % | 0.3 | % | |||||||||
| Other (expense) income: | |||||||||||||||||||||||
| Interest income | 3.2 | — | % | 4.0 | — | % | (0.8 | ) | (20.0 | )% | (5.0 | )% | |||||||||||
| Interest expense | (135.6 | ) | (1.6 | )% | (152.0 | ) | (1.8 | )% | 16.4 | (10.8 | )% | 0.1 | % | ||||||||||
| Loss on extinguishment of debt | (0.1 | ) | — | % | (3.8 | ) | — | % | 3.7 | (97.4 | )% | — | % | ||||||||||
| Other expense, net | (32.7 | ) | (0.4 | )% | (17.4 | ) | (0.2 | )% | (15.3 | ) | 87.9 | % | 2.9 | % | |||||||||
| Total other expense | $ | (165.2 | ) | (1.9 | )% | $ | (169.2 | ) | (2.0 | )% | $ | 4.0 | (2.4 | )% | 0.3 | % | |||||||
| Income before income taxes | 222.2 | 2.6 | % | 168.8 | 2.0 | % | 53.4 | 31.6 | % | 0.9 | % | ||||||||||||
| Income tax expense | 49.9 | 0.6 | % | 49.0 | 0.6 | % | (0.9 | ) | 1.8 | % | 0.9 | % | |||||||||||
| Net income | $ | 172.3 | 2.0 | % | $ | 119.8 | 1.5 | % | $ | 52.5 | 43.8 | % | 1.6 | % | |||||||||
28
The change in trade working capital, which includes trade accounts receivable, net, inventories, and trade accounts payable, provided net cash inflows of $233.5 million when compared to the change in the prior year. Trade working capital provided cash inflows of $195.1 million for the year end December 31, 2019 compared to cash outflows of $38.4 million for the year ended December 31, 2018. Cash inflows from trade accounts receivable, net is attributable to improvements in the timing of customer payments and reduced sales volumes, excluding acquisitions, during the current year. Inventory cash inflows on a year-over-year basis are primarily related to reductions in the USA segment inventories due to reduced sales volumes and favorable supplier partner pricing. The year-over-year cash outflows related to trade accounts payable are primarily attributable to decreased inventory purchases in the current year.
The change in prepaid expenses and other current assets is primarily due to payment timing differences and favorable changes in expected product returns from customers. The change in pension and other postretirement benefit liabilities is primarily due to unfavorable changes in actuarial valuations, partially offset by favorable changes in expected returns on plan assets.
Cash Used by Investing Activities
Cash used by investing activities increased $334.1 million to $433.1 million for the year ended December 31, 2019 from $99.0 million for the year ended December 31, 2018. The increase is primarily related to the acquisition of the Nexeo business in 2019, net of the proceeds received for the sale and dispositions of Nexeo Plastics and the Environmental Sciences business. In 2018, the Company acquired Earthoil and Kemetyl. Refer to “Note 3: Business combinations” and “Note 4: Discontinued operations and dispositions” in Item 8 of this Annual Report on Form 10-K for additional information.information related to the Company's acquisitions and dispositions.
Cash Provided (Used) by Financing Activities
Contractual Obligations and Commitments
Our contractual obligations and commitments as of December 31, 2019 are as follows:
| Payment Due by Period | |||||||||||||||||||||||||||||||||||||||||||||||||||||
| (in millions) | Total | 2020 | 2021 - 2022 | 2023 - 2024 | Thereafter | ||||||||||||||||||||||||||||||||||||||||||||||||
Short-term financing (1) | $ | 0.7 | $ | 0.7 | $ | — | $ | — | $ | — | |||||||||||||||||||||||||||||||||||||||||||
| Finance leases | 74.6 | 22.6 | 34.6 | 11.1 | 6.3 | ||||||||||||||||||||||||||||||||||||||||||||||||
Long-term debt, including current maturities (1) | 2,668.9 | 4.0 | 138.9 | 1,646.0 | 880.0 | ||||||||||||||||||||||||||||||||||||||||||||||||
Interest (2) | 560.4 | 111.7 | 204.5 | 159.9 | 84.3 | ||||||||||||||||||||||||||||||||||||||||||||||||
| Minimum operating lease payments | 185.2 | 53.6 | 73.1 | 33.8 | 24.7 | ||||||||||||||||||||||||||||||||||||||||||||||||
Estimated environmental liability payments (3) | 84.3 | 25.0 | 19.1 | 12.9 | 27.3 | ||||||||||||||||||||||||||||||||||||||||||||||||
| 2017 US repatriation tax | 9.2 | — | 2.5 | 6.7 | — | ||||||||||||||||||||||||||||||||||||||||||||||||
Other (4) | 112.6 | 54.6 | 28.0 | 30.0 | — | ||||||||||||||||||||||||||||||||||||||||||||||||
Total (5) | $ | 3,695.9 | $ | 272.2 | $ | 500.7 | $ | 1,900.4 | $ | 1,022.6 | |||||||||||||||||||||||||||||||||||||||||||
(1)See “Note 18: Debt” in Item 8 of this Annual Report on Form 10-K for additional information.
(2)Interest payments on debt are calculated for future periods using interest rates in effect as of December 31, 2019 and obligations on that date. Projected interest payments include the September 2017 Tagma acquisitionrelated effects of interest rate swap agreements. Certain of these projected interest payments may differ in the Restfuture based on changes in floating interest rates, foreign currency fluctuations or other factors or events.
(3)Included in the less than one year category is $11.7 million related to environmental liabilities for which the timing is uncertain. The timing of World segment. Gross margin, whichpayments is unknown and could differ based on future events. For more information see “Note 21: Commitments and contingencies” in Item 8 of this Annual Report on Form 10-K.
(4)Commitments related to capital expenditures and other contractual obligations.
(5)This table excludes our pension and postretirement medical benefit obligations. Based on current projections of minimum funding requirements, we define as gross profit divided by external net sales, increasedexpect to 22.0%make cash contributions of $22.9 million to our defined benefit pension plans in the year ended December 31, 20182020. The timing for any such requirement in future years is uncertain given the implicit uncertainty regarding the future developments of factors described in “Risk Factors” in Item 1A of this Annual Report on Form 10-K and “Note 11: Employee benefit plans” in Item 8 of this Annual Report on Form 10-K.
29
We expect that we will be able to fund our remaining obligations and commitments with cash flow from 21.9%operations. To the extent we are unable to fund these obligations and commitments with cash flow from operations; we intend to fund these obligations and commitments with proceeds from available borrowing capacity under our New Senior ABL Facility or under future financings.
Off-Balance Sheet Arrangements
With the exception of letters of credit, we had no material off-balance sheet arrangements as of December 31, 2019.
Critical Accounting Estimates
Preparation of our financial statements requires management to make estimates and assumptions that affect the reported amounts of assets, liabilities, revenues and expenses. Actual results may differ from these estimates under different assumptions or conditions.
Our significant accounting policies are described in “Note 2: Significant accounting policies” in Item 8 of this Annual Report on Form 10-K. We consider an accounting estimate to be critical if that estimate requires that we make assumptions about matters that are highly uncertain at the time we make that estimate and if different estimates that we could reasonably have used or changes in accounting estimates that are reasonably likely to occur could materially affect our consolidated financial statements. Our critical accounting estimates are as follows:
Goodwill
We perform an annual impairment assessment of goodwill at the reporting unit level as of October 1 of each year, or more frequently if indicators of potential impairment exist. The analysis may include both qualitative and quantitative factors to assess the likelihood of an impairment. The reporting unit’s carrying value used in an impairment test represents the assignment of various assets and liabilities, excluding certain corporate assets and liabilities, such as cash, investments, and debt.
Qualitative factors include industry and market considerations, overall financial performance, and other relevant events and factors affecting the reporting unit. Additionally, as part of this assessment, we may perform a quantitative analysis to support the qualitative factors above by applying sensitivities to assumptions and inputs used in measuring a reporting unit’s fair value.
Our quantitative impairment test considers both the income approach and the market approach to estimate a reporting unit’s fair value. Significant estimates include forecasted EBITDA, market segment growth rates, estimated costs, and discount rates based on a reporting unit's weighted average cost of capital (“WACC”). The use of different assumptions, estimates or judgments could significantly impact the estimated fair value of a reporting unit, and therefore, impact the excess fair value above carrying value of the reporting unit.
We test the reasonableness of the inputs and outcomes of our discounted cash flow analysis against available market data. In the current year, the fair value of the Canada reporting unit, exceeded the carrying value by 11 percent. Key assumptions in our goodwill impairment test include an 11 percent estimated WACC for the Canada business and a residual growth rate of 2.5 percent. A 100 basis point change in the year ended December 31, 2017, primarily duediscount rate and a terminal growth assumption of zero would not have reduced the fair values of the Canada reporting unit below carrying value. The fair value for all other reporting units substantially exceeds their carrying value.
Business Combinations
We allocate the purchase price paid for assets acquired and liabilities assumed in connection with our acquisitions based on their estimated fair values at the time of acquisition. This allocation involves a number of assumptions, estimates, and judgments in determining the fair value, as of the acquisition date, of the following:
•intangible assets, including the valuation methodology, estimations of future cash flows, discount rates, recurring revenues attributed to favorable product mixcustomer relationships, and focused margin management efforts. Refer toour assumed market segment share, as well as the “Segment results” for the year ended December 31, 2018 discussion for additional information.estimated useful life of intangible assets;
•goodwill as measured as the reduction in costs incurred to supportexcess of consideration transferred over the transformationnet of the USacquisition date fair values of the assets acquired and the liabilities assumed.
Our assumptions and estimates are based upon comparable market data and information obtained from our management and the management of the acquired companies. We allocate goodwill to the reporting units of the business that are expected to benefit from the business combination.
30
Purchase Accounting for the Nexeo Solutions Acquisition
Our acquisition of Nexeo Solutions in 2019 was accounted for with ASC Topic 805, Business Combinations, as amended. As of December 31, 2019, the allocation of the purchase price to the acquired assets and lower restructuring charges. Refer toassumed liabilities was considered preliminary. See “Note 4: Other operating expenses, net”3: Business combinations” in Item 8 of this Annual Report on Form 10-K for additional information.
We recognize environmental liabilities for probable and reasonably estimable losses associated with environmental remediation. The estimated environmental liability includes incremental direct costs of investigations, remediation efforts and post-remediation monitoring. The total environmental reserve at December 31, 2019 and 2018 was $78.7 million and $83.5 million, respectively. See “Note 21: Commitments and contingencies” in Item 8 of this Annual Report on Form 10-K.
Our environmental reserves are subject to numerous uncertainties that affect our ability to estimate our costs, or our share of costs if multiple parties are responsible. These uncertainties involve the legal, regulatory and enforcement parameters governing environmental assessment and remediation, the nature and extent of contamination at these sites, the extent and cost of assessment and remediation efforts required, our insurance coverage for these sites and, in the case of sites with multiple responsible parties, the number and financial strength of those parties. In addition, our determination as to whether a loss is probable may change, particularly as new facts emerge as to the causes of contamination. We evaluate each environmental site as new information and facts become available and make adjustments to reserves based upon our assessment of these factors, using technical experts, legal counsel and other specialists.
Defined Benefit Pension and Other Postretirement Obligations
We sponsor defined benefit pension plans in the US and other countries. The accounting for these plans depends on assumptions made by management, which are used by actuaries we engage to calculate the projected and accumulated benefit obligations and the annual expense decreased $9.8 million, or 7.3%recognized for these plans. These assumptions include discount rates, expected return on assets, mortality and retirement rates and for certain plans, rates for compensation increases. Actual experience different from those estimated assumptions can result in the recognition of gains and losses in earnings as our accounting policy is to recognize changes in the fair value of plan assets and each plan’s projected benefit obligation in the fourth quarter of each year (the “mark to market” adjustment), to $125.2 million forunless an earlier remeasurement is required. For the year ended December 31, 2018. On2019 and 2018, we recorded a constant currency basis, the decrease of $10.4 million, or 7.7%, was primarily due to assets reaching the end of their useful lives.
A change in the assumed discount rate and return on plan asset rate would have the following effects:
| Increase (decrease) in | |||||||||||||||||||||||
| (in millions) | Percentage Change | 2020 Net Benefit Cost | 2019 Pension Benefit Obligation | ||||||||||||||||||||
| Discount rate | 25 bps decrease | $ | (2.0) | $ | 51.4 | ||||||||||||||||||
| Discount rate | 25 bps increase | 1.8 | (48.4) | ||||||||||||||||||||
| Expected return on plan assets | 100 bps decrease | 10.4 | N/A | ||||||||||||||||||||
| Expected return on plan assets | 100 bps increase | (10.4) | N/A | ||||||||||||||||||||
Income tax expense increased $0.9 million, or 1.8%,Taxes
The Company is subject to $49.9 millionincome taxes in the year ended December 31, 2018. The Company’s effectivejurisdictions in which it sells products and earn revenues. We record income taxes under the asset and liability method. Under this method, deferred tax rate forassets and liabilities are recognized based on the year ended December 31, 2018future tax consequences to temporary differences between the financial statement carrying values of 22.5% was higher than the recently reduced US federal statutory rate of 21.0%, primarily due to the addition of state taxesexisting assets and the higherliabilities and their respective tax bases. Deferred tax assets and liabilities are measured using enacted tax rates incurredexpected to
31
apply in the years in which the temporary differences are expected to be recovered or paid. A reduction of the carrying values of deferred tax assets by a valuation allowance is required if, based on the company’s earnings outsideavailable evidence, it is more likely than not that such assets will not be realized. In evaluating the US,Company’s ability to realize its deferred tax assets, in full or in part, the Company considered all available positive and negative evidence, including its past operating results, forecasted and appropriate character of future taxable income, the expected net impactduration of the 2017 US Tax Cutsstatutory carryforward periods, our experience with operating loss and Jobs Act (the “Tax Act”) on foreign net earnings. These increases in the effective tax rate were partially offset by the release of valuation allowances on certaincredit carryforwards not expiring unused and feasible tax attributes. Included in the $49.9 million of tax expense for year ended December 31, 2018 wasstrategies. The Company has a $15.3 million benefit related to the release of valuation allowance on certain deferred tax assets, primarily related to foreign tax attributes,credits, net operating loss carry forwards and deferred interest.
Effective in 2018, the Company is subject to global intangible low tax income (“GILTI”), which is a $2.7 million benefittax on foreign income in recognitionexcess of previously unrecognized tax benefitsa deemed return on tangible assets of foreign corporations. We elect to treat taxes due to the statute of limitation expiration, $6.8 million of adjustments to provisional amounts for certain enactment-date effects of the Tax Act, and a $1.6 million net benefiton future US inclusions in taxable income related to prior year estimates of the impact from the 2017 US Tax CutsGILTI as a current-period expense when incurred and Jobs Act.
| (in millions) | USA | Canada | EMEA | Rest of World | Other/ Elimin- ations(1) | Consolidated | |||||||||||||||||
| Year ended December 31, 2018 | |||||||||||||||||||||||
| Net sales: | |||||||||||||||||||||||
| External customers | $ | 4,961.0 | $ | 1,302.3 | $ | 1,975.7 | $ | 393.5 | $ | — | $ | 8,632.5 | |||||||||||
| Inter-segment | 126.6 | 9.3 | 4.0 | 0.2 | (140.1 | ) | — | ||||||||||||||||
| Total net sales | $ | 5,087.6 | $ | 1,311.6 | $ | 1,979.7 | $ | 393.7 | $ | (140.1 | ) | $ | 8,632.5 | ||||||||||
| Cost of goods sold (exclusive of depreciation) | 3,959.3 | 1,080.1 | 1,525.6 | 307.5 | (140.1 | ) | 6,732.4 | ||||||||||||||||
| Outbound freight and handling | 215.6 | 42.5 | 62.4 | 7.8 | — | 328.3 | |||||||||||||||||
| Warehousing, selling and administrative | 536.3 | 84.3 | 240.5 | 45.1 | 25.2 | 931.4 | |||||||||||||||||
| Adjusted EBITDA | $ | 376.4 | $ | 104.7 | $ | 151.2 | $ | 33.3 | $ | (25.2 | ) | $ | 640.4 | ||||||||||
| Other operating expenses, net | 73.5 | ||||||||||||||||||||||
| Depreciation | 125.2 | ||||||||||||||||||||||
| Amortization | 54.3 | ||||||||||||||||||||||
| Interest expense, net | 132.4 | ||||||||||||||||||||||
| Loss on extinguishment of debt | 0.1 | ||||||||||||||||||||||
| Other expense, net | 32.7 | ||||||||||||||||||||||
| Income tax expense | 49.9 | ||||||||||||||||||||||
| Net income | $ | 172.3 | |||||||||||||||||||||
| (in millions) | USA | Canada | EMEA | Rest of World | Other/ Elimin-ations(1) | Consolidated | |||||||||||||||||
| Year ended December 31, 2018 | |||||||||||||||||||||||
| Gross profit: | |||||||||||||||||||||||
| Net sales | $ | 5,087.6 | $ | 1,311.6 | $ | 1,979.7 | $ | 393.7 | $ | (140.1 | ) | $ | 8,632.5 | ||||||||||
| Cost of goods sold (exclusive of depreciation) | 3,959.3 | 1,080.1 | 1,525.6 | 307.5 | (140.1 | ) | 6,732.4 | ||||||||||||||||
| Gross profit (exclusive of depreciation) | $ | 1,128.3 | $ | 231.5 | $ | 454.1 | $ | 86.2 | $ | — | $ | 1,900.1 | |||||||||||
| (in millions) | USA | Canada | EMEA | Rest of World | Other/ Elimin- ations(1) | Consolidated | |||||||||||||||||
| Year ended December 31, 2017 | |||||||||||||||||||||||
| Net sales: | |||||||||||||||||||||||
| External customers | $ | 4,657.1 | $ | 1,371.5 | $ | 1,821.2 | $ | 403.9 | $ | — | $ | 8,253.7 | |||||||||||
| Inter-segment | 121.9 | 9.1 | 4.5 | 0.5 | (136.0 | ) | — | ||||||||||||||||
| Total net sales | $ | 4,779.0 | $ | 1,380.6 | $ | 1,825.7 | $ | 404.4 | $ | (136.0 | ) | $ | 8,253.7 | ||||||||||
| Cost of goods sold (exclusive of depreciation) | 3,706.8 | 1,143.0 | 1,411.7 | 322.7 | (136.0 | ) | 6,448.2 | ||||||||||||||||
| Outbound freight and handling | 192.8 | 37.3 | 55.7 | 6.2 | — | 292.0 | |||||||||||||||||
| Warehousing, selling and administrative | 529.4 | 86.2 | 229.1 | 46.8 | 28.2 | 919.7 | |||||||||||||||||
| Adjusted EBITDA | $ | 350.0 | $ | 114.1 | $ | 129.2 | $ | 28.7 | $ | (28.2 | ) | $ | 593.8 | ||||||||||
| Other operating expenses, net | 55.4 | ||||||||||||||||||||||
| Depreciation | 135.0 | ||||||||||||||||||||||
| Amortization | 65.4 | ||||||||||||||||||||||
| Interest expense, net | 148.0 | ||||||||||||||||||||||
| Loss on extinguishment of debt | 3.8 | ||||||||||||||||||||||
| Other expense, net | 17.4 | ||||||||||||||||||||||
| Income tax expense | 49.0 | ||||||||||||||||||||||
| Net income | $ | 119.8 | |||||||||||||||||||||
| (in millions) | USA | Canada | EMEA | Rest of World | Other/ Elimin-ations(1) | Consolidated | |||||||||||||||||
| Year ended December 31, 2017 | |||||||||||||||||||||||
| Gross profit: | |||||||||||||||||||||||
| Net sales | $ | 4,779.0 | $ | 1,380.6 | $ | 1,825.7 | $ | 404.4 | $ | (136.0 | ) | $ | 8,253.7 | ||||||||||
| Cost of goods sold (exclusive of depreciation) | 3,706.8 | 1,143.0 | 1,411.7 | 322.7 | (136.0 | ) | 6,448.2 | ||||||||||||||||
| Gross profit (exclusive of depreciation) | $ | 1,072.2 | $ | 237.6 | $ | 414.0 | $ | 81.7 | $ | — | $ | 1,805.5 | |||||||||||
| Net sales percentage change due to: | Gross profit percentage change due to: | |||||
| Reported sales volumes | 0.9 | % | Reported sales volumes | 0.9 | % | |
| Sales pricing and product mix | 5.6 | % | Sales pricing, product costs and other adjustments | 4.3 | % | |
| Total | 6.5 | % | Total | 5.2 | % | |
| Net sales percentage change due to: | Gross profit percentage change due to: | |||||
| Reported sales volumes | (8.9 | )% | Reported sales volumes | (6.4 | )% | |
| Sales pricing and product mix | 3.7 | % | Sales pricing, product costs and other adjustments | 3.7 | % | |
| Foreign currency translation | 0.2 | % | Foreign currency translation | 0.1 | % | |
| Total | (5.0 | )% | Total | (2.6 | )% | |
| Net sales percentage change due to: | Gross profit percentage change due to: | |||||
| Acquisitions | 2.3 | % | Acquisitions | 2.0 | % | |
| Reported sales volumes | (7.1 | )% | Reported sales volumes | (7.1 | )% | |
| Sales pricing and product mix | 10.2 | % | Sales pricing, product costs and other adjustments | 11.4 | % | |
| Foreign currency translation | 3.1 | % | Foreign currency translation | 3.4 | % | |
| Total | 8.5 | % | Total | 9.7 | % | |
| Net sales percentage change due to: | Gross profit percentage change due to: | |||||
| Acquisitions | 2.6 | % | Acquisitions | 6.0 | % | |
| Reported sales volumes | (18.5 | )% | Reported sales volumes | (17.0 | )% | |
| Sales pricing and product mix | 18.6 | % | Sales pricing, product costs and other adjustments | 24.0 | % | |
| Foreign currency translation | (5.3 | )% | Foreign currency translation | (7.5 | )% | |
| Total | (2.6 | )% | Total | 5.5 | % | |
| Year ended | Favorable (unfavorable) | % Change | Impact of currency* | ||||||||||||||||||||
| (in millions) | December 31, 2017 | December 31, 2016 | |||||||||||||||||||||
| Net sales | $ | 8,253.7 | 100.0 | % | $ | 8,073.7 | 100.0 | % | $ | 180.0 | 2.2 | % | 0.5 | % | |||||||||
| Cost of goods sold (exclusive of depreciation) | 6,448.2 | 78.1 | % | 6,346.6 | 78.6 | % | (101.6 | ) | 1.6 | % | (0.5 | )% | |||||||||||
| Operating expenses: | |||||||||||||||||||||||
| Outbound freight and handling | 292.0 | 3.5 | % | 286.6 | 3.5 | % | (5.4 | ) | 1.9 | % | (0.6 | )% | |||||||||||
| Warehousing, selling and administrative | 919.7 | 11.1 | % | 893.1 | 11.1 | % | (26.6 | ) | 3.0 | % | (0.6 | )% | |||||||||||
| Other operating expenses, net | 55.4 | 0.7 | % | 37.2 | 0.5 | % | (18.2 | ) | 48.9 | % | 0.8 | % | |||||||||||
| Depreciation | 135.0 | 1.6 | % | 152.3 | 1.9 | % | 17.3 | (11.4 | )% | (0.4 | )% | ||||||||||||
| Amortization | 65.4 | 0.8 | % | 85.6 | 1.1 | % | 20.2 | (23.6 | )% | (0.3 | )% | ||||||||||||
| Impairment charges | — | — | % | 133.9 | 1.7 | % | 133.9 | (100.0 | )% | — | % | ||||||||||||
| Total operating expenses | $ | 1,467.5 | 17.8 | % | $ | 1,588.7 | 19.7 | % | $ | 121.2 | (7.6 | )% | (0.5 | )% | |||||||||
| Operating income | $ | 338.0 | 4.1 | % | $ | 138.4 | 1.7 | % | $ | 199.6 | 144.2 | % | 1.7 | % | |||||||||
| Other (expense) income: | |||||||||||||||||||||||
| Interest income | 4.0 | — | % | 3.9 | — | % | 0.1 | 2.6 | % | 2.6 | % | ||||||||||||
| Interest expense | (152.0 | ) | (1.8 | )% | (163.8 | ) | (2.0 | )% | 11.8 | (7.2 | )% | 0.1 | % | ||||||||||
| Loss on extinguishment of debt | (3.8 | ) | — | % | — | — | % | (3.8 | ) | 100.0 | % | — | % | ||||||||||
| Other expense, net | (17.4 | ) | (0.2 | )% | (58.1 | ) | (0.7 | )% | 40.7 | (70.1 | )% | 0.9 | % | ||||||||||
| Total other expense | $ | (169.2 | ) | (2.0 | )% | $ | (218.0 | ) | (2.7 | )% | $ | 48.8 | (22.4 | )% | 0.4 | % | |||||||
| Income (loss) before income taxes | 168.8 | 2.0 | % | (79.6 | ) | (1.0 | )% | 248.4 | NM | 3.9 | % | ||||||||||||
| Income tax expense (benefit) | 49.0 | 0.6 | % | (11.2 | ) | (0.1 | )% | (60.2 | ) | NM | 0.9 | % | |||||||||||
| Net income (loss) | $ | 119.8 | 1.5 | % | $ | (68.4 | ) | (0.8 | )% | $ | 188.2 | NM | 4.7 | % | |||||||||
| (in millions) | USA | Canada | EMEA | Rest of World | Other/ Elimin- ations(1) | Consolidated | |||||||||||||||||
| Year ended December 31, 2017 | |||||||||||||||||||||||
| Net sales: | |||||||||||||||||||||||
| External customers | $ | 4,657.1 | $ | 1,371.5 | $ | 1,821.2 | $ | 403.9 | $ | — | $ | 8,253.7 | |||||||||||
| Inter-segment | 121.9 | 9.1 | 4.5 | 0.5 | (136.0 | ) | — | ||||||||||||||||
| Total net sales | $ | 4,779.0 | $ | 1,380.6 | $ | 1,825.7 | $ | 404.4 | $ | (136.0 | ) | $ | 8,253.7 | ||||||||||
| Cost of goods sold (exclusive of depreciation) | 3,706.8 | 1,143.0 | 1,411.7 | 322.7 | (136.0 | ) | 6,448.2 | ||||||||||||||||
| Outbound freight and handling | 192.8 | 37.3 | 55.7 | 6.2 | — | 292.0 | |||||||||||||||||
| Warehousing, selling and administrative | 529.4 | 86.2 | 229.1 | 46.8 | 28.2 | 919.7 | |||||||||||||||||
| Adjusted EBITDA | $ | 350.0 | $ | 114.1 | $ | 129.2 | $ | 28.7 | $ | (28.2 | ) | $ | 593.8 | ||||||||||
| Other operating expenses, net | 55.4 | ||||||||||||||||||||||
| Depreciation | 135.0 | ||||||||||||||||||||||
| Amortization | 65.4 | ||||||||||||||||||||||
| Interest expense, net | 148.0 | ||||||||||||||||||||||
| Loss on extinguishment of debt | 3.8 | ||||||||||||||||||||||
| Other expense, net | 17.4 | ||||||||||||||||||||||
| Income tax expense | 49.0 | ||||||||||||||||||||||
| Net income | $ | 119.8 | |||||||||||||||||||||
| (in millions) | USA | Canada | EMEA | Rest of World | Other/ Elimin-ations(1) | Consolidated | |||||||||||||||||
| Year ended December 31, 2017 | |||||||||||||||||||||||
| Gross profit: | |||||||||||||||||||||||
| Net sales | $ | 4,779.0 | $ | 1,380.6 | $ | 1,825.7 | $ | 404.4 | $ | (136.0 | ) | $ | 8,253.7 | ||||||||||
| Cost of goods sold (exclusive of depreciation) | 3,706.8 | 1,143.0 | 1,411.7 | 322.7 | (136.0 | ) | 6,448.2 | ||||||||||||||||
| Gross profit (exclusive of depreciation) | $ | 1,072.2 | $ | 237.6 | $ | 414.0 | $ | 81.7 | $ | — | $ | 1,805.5 | |||||||||||
| (in millions) | USA | Canada | EMEA | Rest of World | Other/ Elimin- ations(1) | Consolidated | |||||||||||||||||
| Year ended December 31, 2016 | |||||||||||||||||||||||
| Net sales: | |||||||||||||||||||||||
| External customers | $ | 4,706.7 | $ | 1,261.0 | $ | 1,704.2 | $ | 401.8 | $ | — | $ | 8,073.7 | |||||||||||
| Inter-segment | 104.4 | 8.3 | 4.5 | — | (117.2 | ) | — | ||||||||||||||||
| Total net sales | $ | 4,811.1 | $ | 1,269.3 | $ | 1,708.7 | $ | 401.8 | $ | (117.2 | ) | $ | 8,073.7 | ||||||||||
| Cost of goods sold (exclusive of depreciation) | 3,769.7 | 1,047.4 | 1,324.6 | 322.1 | (117.2 | ) | 6,346.6 | ||||||||||||||||
| Outbound freight and handling | 191.5 | 34.1 | 54.9 | 6.1 | — | 286.6 | |||||||||||||||||
| Warehousing, selling and administrative | 523.5 | 85.4 | 219.3 | 46.8 | 18.1 | 893.1 | |||||||||||||||||
| Adjusted EBITDA | $ | 326.4 | $ | 102.4 | $ | 109.9 | $ | 26.8 | $ | (18.1 | ) | $ | 547.4 | ||||||||||
| Other operating expenses, net | 37.2 | ||||||||||||||||||||||
| Depreciation | 152.3 | ||||||||||||||||||||||
| Amortization | 85.6 | ||||||||||||||||||||||
| Impairment charges | 133.9 | ||||||||||||||||||||||
| Interest expense, net | 159.9 | ||||||||||||||||||||||
| Other expense, net | 58.1 | ||||||||||||||||||||||
| Income tax benefit | (11.2 | ) | |||||||||||||||||||||
| Net loss | $ | (68.4 | ) | ||||||||||||||||||||
| (in millions) | USA | Canada | EMEA | Rest of World | Other/ Elimin-ations(1) | Consolidated | |||||||||||||||||
| Year ended December 31, 2016 | |||||||||||||||||||||||
| Gross profit: | |||||||||||||||||||||||
| Net sales | $ | 4,811.1 | $ | 1,269.3 | $ | 1,708.7 | $ | 401.8 | $ | (117.2 | ) | $ | 8,073.7 | ||||||||||
| Cost of goods sold (exclusive of depreciation) | 3,769.7 | 1,047.4 | 1,324.6 | 322.1 | (117.2 | ) | 6,346.6 | ||||||||||||||||
| Gross profit (exclusive of depreciation) | $ | 1,041.4 | $ | 221.9 | $ | 384.1 | $ | 79.7 | $ | — | $ | 1,727.1 | |||||||||||
| Net sales percentage change due to: | Gross profit percentage change due to: | |||||
| Acquisitions | 0.1 | % | Acquisitions | 0.1 | % | |
| Reported sales volumes | (7.1 | )% | Reported sales volumes | (7.1 | )% | |
| Sales pricing and product mix | 5.9 | % | Sales pricing, product costs and other adjustments | 10.0 | % | |
| Total | (1.1 | )% | Total | 3.0 | % | |
| Net sales percentage change due to: | Gross profit percentage change due to: | |||||
| Acquisitions | 0.3 | % | Acquisitions | 0.3 | % | |
| Reported sales volumes | 4.8 | % | Reported sales volumes | 4.8 | % | |
| Sales pricing and product mix | 1.5 | % | Sales pricing, product costs and other adjustments | (0.2 | )% | |
| Foreign currency translation | 2.2 | % | Foreign currency translation | 2.2 | % | |
| Total | 8.8 | % | Total | 7.1 | % | |
| Net sales percentage change due to: | Gross profit percentage change due to: | |||||
| Reported sales volumes | (5.4 | )% | Reported sales volumes | (5.4 | )% | |
| Sales pricing and product mix | 12.0 | % | Sales pricing, product costs and other adjustments | 12.5 | % | |
| Foreign currency translation | 0.3 | % | Foreign currency translation | 0.7 | % | |
| Total | 6.9 | % | Total | 7.8 | % | |
| Net sales percentage change due to: | Gross profit percentage change due to: | |||||
| Acquisitions | 1.0 | % | Acquisitions | 2.6 | % | |
| Reported sales volumes | (16.3 | )% | Reported sales volumes | (16.3 | )% | |
| Sales pricing and product mix | 13.9 | % | Sales pricing, product costs and other adjustments | 13.2 | % | |
| Foreign currency translation | 1.9 | % | Foreign currency translation | 3.0 | % | |
| Total | 0.5 | % | Total | 2.5 | % | |
Liquidity and Capital Resources
Our primary source of liquidity is cash generated from our operations as well as borrowings under our committed credit facilities. As of December 31, 2018,2019, our total liquidity was approximately $734.7$931.2 million, comprised of $613.1$600.9 million available under our credit facilities and $121.6$330.3 million of cash and cash equivalents. Our primary liquidity and capital resource needs are to service our debt and to finance working capital, capital expenditures, other liabilities cost of acquisitions and general corporate purposes. We believe that funds provided by these sources will be adequate to meet our liquidity and capital resource needs for at least the next 12 months under current operating conditions. We have significant working capital needs, although we have implemented several initiatives to improve our working capital and reduce the related financing requirements. The nature of our business, however, requires that we maintain inventories that enable us to deliver products to fill customer orders. As of December 31, 2018,2019, we maintained inventories of $803.3$796.0 million, equivalent to approximately 47.243.6 days of sales (which we calculate on the basissales.
Total debt as of cost of goods sold for the trailing 90-day period).
short-term financing. We may from time to time repurchase our debt or take other steps to reduce our debt.debt or interest cost. These actions may include open market repurchases, negotiated repurchases or opportunistic refinancing of debt. The amount of debt, if any, that may be repurchased or refinanced will depend on market conditions, trading levels of our debt, our cash position, compliance with debt covenants and other considerations. Our affiliates may also purchase our debt from time to time, through open market purchases or other transactions. During the years ended December 31, 2016 and December 31, 2017, we restructured a significant portion of our long-term debt obligations. These debt amendments extended our debt maturity profile and reduced our future interest payments. Refer to “Note 16:18: Debt” in Item 8 of this Annual Report on Form 10-K for further information.
As a result of the 2017 US Tax Act, the Company intendsrecorded in 2017 a one-time Section 965 repatriation tax of $76.5 million. After offsetting allowable tax credits, we elected to financepay the cash portionremaining balance of the transaction$14.9 million over eight years, of which $9.2 remains at December 31, 2019.
We expect our 2020 capital expenditures for maintenance, safety and refinance Nexeo’s existing debt with a combination of available cashcost improvements and debt financing,investments in our digital capabilities to be approximately $120 million to $130 million. Interest payments for which the Company has received commitments. The Company entered into a commitment letter, dated September 17, 2018, with Goldman Sachs Bank USA, pursuant2020 are expected to which Goldman committedbe $115 million to provide $1.3 billion of incremental term loans.
We believe funds provided by our primary sources of liquidity will be adequate to meet our liquidity and cash outflow and,capital resource needs for at least in the short term, increase our leverage ratio, the Company believes our increased revenues from the Nexeo Acquisition and any proceeds received from the
Cash Flows
The following table presents a summary of our cash flow activity for the periods set forth below:activity:
| Fiscal Year Ended December 31, | |||||||||||
| (in millions) | 2018 | 2017 | 2016 | ||||||||
| Net cash provided by operating activities | $ | 289.9 | $ | 282.6 | $ | 450.0 | |||||
| Net cash used by investing activities | (99.0 | ) | (79.1 | ) | (136.0 | ) | |||||
| Net cash used by financing activities | (518.3 | ) | (112.4 | ) | (166.5 | ) | |||||
| Year Ended December 31, | |||||||||||||||||||||||||||||
| (in millions) | 2019 | 2018 | 2017 | ||||||||||||||||||||||||||
| Net cash provided by operating activities | $ | 363.9 | $ | 289.9 | $ | 282.6 | |||||||||||||||||||||||
| Net cash used by investing activities | (433.1) | (99.0) | (79.1) | ||||||||||||||||||||||||||
| Net cash provided (used) by financing activities | 295.2 | (518.3) | (112.4) | ||||||||||||||||||||||||||
Year Ended December 31, 20182019 Compared to Year Ended December 31, 20172018
Cash Provided by Operating Activities
Cash provided by operating activities increased $7.3$74.0 million from $282.6to $363.9 million for the year ended December 31, 2017 to2019 from $289.9 million for the year ended December 31, 2018. The increase is primarily due to a net increasechanges in the changetrade working capital and prepaid expenses and other current assets, partially offset by changes in net working capital,income, exclusive of non-cash items. The change in net income, exclusive of non-cash items, and pensions and other postretirement benefit liabilities, partially offset by increasedprovided net cash outflows of $238.4 million related to other operating activities.
28
The change in trade working capital, which includes trade accounts receivable, net, inventories, and trade accounts payable, was aprovided net cash inflowinflows of $43.8$233.5 million (or awhen compared to the change in the prior year. Trade working capital provided cash inflowinflows of $14.2$195.1 million including the impacts of ASC 606) for the periodyear end December 31, 2019 compared to cash outflows of $38.4 million for the year ended December 31, 2018 compared2018. Cash inflows from trade accounts receivable, net is attributable to improvements in the period ended December 31, 2017.timing of customer payments and reduced sales volumes, excluding acquisitions, during the current year. Inventory cash inflows on a year-over-year basis are primarily related to prior yearreductions in the USA segment inventories due to reduced sales volumes and favorable supplier partner pricing. The year-over-year cash outflows that produced higher inventories as a result of drought conditions in Canada that led to a soft agriculture season. Cash inflows related to trade accounts receivable, netpayable are primarily dueattributable to prior year cash outflows as result of higher sales anddecreased inventory purchases in the timing of customer payments. The trade accounts payable cash outflows primarily related to prior year cash inflows due to higher purchases and timing of payments.current year.
The change in pensionsprepaid expenses and other current assets is primarily due to payment timing differences and favorable changes in expected product returns from customers. The change in pension and other postretirement benefit liabilities provided cash of $36.4 millionis primarily due to reductionsunfavorable changes in the returnactuarial valuations, partially offset by favorable changes in expected returns on plan assets and increases in actuarial losses when comparingassets.
Cash Used by Investing Activities
Cash used by investing activities increased $334.1 million to $433.1 million for the year ended December 31, 2018 to2019 from $99.0 million for the year ended December 31, 2017.2018. The increase is primarily related to the acquisition of the Nexeo business in 2019, net of the proceeds received for the sale and dispositions of Nexeo Plastics and the Environmental Sciences business. In 2018, the Company acquired Earthoil and Kemetyl. Refer to “Note 9: Employee benefit plans”3: Business combinations” and “Note 4: Discontinued operations and dispositions” in Item 8 of this Annual Report on Form 10-K for additional information.
Cash provided (used) by operatingfinancing activities decreased $167.4increased $813.5 million from $450.0to cash provided of $295.2 million for the year ended December 31, 2016 to $282.6 million for the year ended December 31, 2017.
Contractual Obligations and Commitments
Our contractual obligations and commitments as of December 31, 2019 are as follows:
| Payment Due by Period | |||||||||||||||||||||||||||||||||||||||||||||||||||||
| (in millions) | Total | 2020 | 2021 - 2022 | 2023 - 2024 | Thereafter | ||||||||||||||||||||||||||||||||||||||||||||||||
Short-term financing (1) | $ | 0.7 | $ | 0.7 | $ | — | $ | — | $ | — | |||||||||||||||||||||||||||||||||||||||||||
| Finance leases | 74.6 | 22.6 | 34.6 | 11.1 | 6.3 | ||||||||||||||||||||||||||||||||||||||||||||||||
Long-term debt, including current maturities (1) | 2,668.9 | 4.0 | 138.9 | 1,646.0 | 880.0 | ||||||||||||||||||||||||||||||||||||||||||||||||
Interest (2) | 560.4 | 111.7 | 204.5 | 159.9 | 84.3 | ||||||||||||||||||||||||||||||||||||||||||||||||
| Minimum operating lease payments | 185.2 | 53.6 | 73.1 | 33.8 | 24.7 | ||||||||||||||||||||||||||||||||||||||||||||||||
Estimated environmental liability payments (3) | 84.3 | 25.0 | 19.1 | 12.9 | 27.3 | ||||||||||||||||||||||||||||||||||||||||||||||||
| 2017 US repatriation tax | 9.2 | — | 2.5 | 6.7 | — | ||||||||||||||||||||||||||||||||||||||||||||||||
Other (4) | 112.6 | 54.6 | 28.0 | 30.0 | — | ||||||||||||||||||||||||||||||||||||||||||||||||
Total (5) | $ | 3,695.9 | $ | 272.2 | $ | 500.7 | $ | 1,900.4 | $ | 1,022.6 | |||||||||||||||||||||||||||||||||||||||||||
(1)See “Note 18: Debt” in Item 8 of this Annual Report on Form 10-K for additional information. Increased
(2)Interest payments on debt are calculated for future periods using interest rates in effect as of December 31, 2019 and obligations on that date. Projected interest payments include the related effects of interest rate swap agreements. Certain of these projected interest payments may differ in the future based on changes in floating interest rates, foreign currency fluctuations or other factors or events.
(3)Included in the less than one year category is $11.7 million related to environmental liabilities for which the timing is uncertain. The timing of payments is unknown and could differ based on future events. For more information see “Note 21: Commitments and contingencies” in Item 8 of this Annual Report on Form 10-K.
(4)Commitments related to capital leases resultedexpenditures and other contractual obligations.
(5)This table excludes our pension and postretirement medical benefit obligations. Based on current projections of minimum funding requirements, we expect to make cash contributions of $22.9 million to our defined benefit pension plans in increased cash usage due to financing activities of $3.1 million.
29
| Payment Due by Period | |||||||||||||||||||
| (in millions) | Total | 2019 | 2020 - 2021 | 2022 - 2023 | Thereafter | ||||||||||||||
Short-term financing (1) | $ | 8.1 | $ | 8.1 | $ | — | $ | — | $ | — | |||||||||
Capital leases (1) | 54.8 | 21.7 | 21.6 | 10.4 | 1.1 | ||||||||||||||
Long-term debt, including current maturities (1) | 2,340.5 | — | 134.7 | 458.0 | 1,747.8 | ||||||||||||||
Interest (2) | 581.3 | 110.3 | 220.8 | 209.0 | 41.2 | ||||||||||||||
| Minimum operating lease payments | 196.2 | 54.9 | 70.4 | 40.9 | 30.0 | ||||||||||||||
Estimated environmental liability payments (3) | 88.6 | 32.1 | 19.1 | 13.5 | 23.9 | ||||||||||||||
Total (4)(5) | $ | 3,269.5 | $ | 227.1 | $ | 466.6 | $ | 731.8 | $ | 1,844.0 | |||||||||
We expect that we will be able to fund our remaining obligations and commitments with cash flow from operations. To the extent we are unable to fund these obligations and commitments with cash flow from operations; we intend to fund these obligations and commitments with proceeds from available borrowing capacity under our New Senior ABL Facility or under future financings.
Off-Balance Sheet Arrangements
Critical Accounting Estimates
Preparation of our financial statements requires management to make estimates and some equipment leasing. Asassumptions that affect the reported amounts of January 1, 2019, operating leases will be recognized on the balance sheet due to the adoption of ASU 2016-02, refer toassets, liabilities, revenues and expenses. Actual results may differ from these estimates under different assumptions or conditions.
Our significant accounting policies are described in “Note 2: Significant accounting policies” in Item 8 of this Annual Report on Form 10-K. For additional information regarding operating leases, see “Note 20: Commitments and contingencies” in Item 8 of this Annual Report on Form 10-K. We do not use special purpose entities that would create off-balance sheet financing.
We consider an accounting estimate to be critical if that estimate requires that we make assumptions about matters that are highly uncertain at the time we make that estimate and if different estimates that we could reasonably have used or changes in accounting estimates that are reasonably likely to occur could materially affect our consolidated financial statements. We believe that the followingOur critical accounting estimates reflect ourare as follows:
Goodwill
We perform an annual impairment assessment of goodwill at the reporting unit level as of October 1 of each year, or more significant estimatesfrequently if indicators of potential impairment exist. The analysis may include both qualitative and assumptionsquantitative factors to assess the likelihood of an impairment. The reporting unit’s carrying value used in an impairment test represents the preparationassignment of our consolidatedvarious assets and liabilities, excluding certain corporate assets and liabilities, such as cash, investments, and debt.
Qualitative factors include industry and market considerations, overall financial statements. Our significant accounting policies are described in “Note 2: Significant accounting policies” in Item 8performance, and other relevant events and factors affecting the reporting unit. Additionally, as part of this Annual Report on Form 10-K.assessment, we may perform a quantitative analysis to support the qualitative factors above by applying sensitivities to assumptions and inputs used in measuring a reporting unit’s fair value.
We test the Company hasreasonableness of the option to perform eitherinputs and outcomes of our discounted cash flow analysis against available market data. In the step zero or the step one test.
We allocate the purchase price paid for assets acquired and liabilities assumed in connection with our acquisitions based on their estimated fair valuevalues at the time of each reporting unit with the reporting unit’s carrying value (including goodwill). Ifacquisition. This allocation involves a number of assumptions, estimates, and judgments in determining the fair value, as of the reporting unit is less than its carrying value,acquisition date, of the following:
•intangible assets, including the valuation methodology, estimations of future cash flows, discount rates, recurring revenues attributed to customer relationships, and our assumed market segment share, as well as the estimated useful life of intangible assets;
•deferred tax assets and liabilities, uncertain tax positions, and tax-related valuation allowances;
•inventory; property, plant and equipment; pre-existing liabilities or legal claims; and
•goodwill as measured as the excess of consideration transferred over the net of the acquisition date fair values of the assets acquired and the liabilities assumed.
Our assumptions and estimates are based upon comparable market data and information obtained from our management and the management of the acquired companies. We allocate goodwill to the reporting unit will recognize an impairmentunits of the business that are expected to benefit from the business combination.
30
Purchase Accounting for the lesserNexeo Solutions Acquisition
Our acquisition of eitherNexeo Solutions in 2019 was accounted for with ASC Topic 805, Business Combinations, as amended. As of December 31, 2019, the amount by which the reporting unit's carrying amount exceeds the fair valueallocation of the reporting unit orpurchase price to the reporting unit’s goodwill carrying value.acquired assets and assumed liabilities was considered preliminary. See “Note 13: Goodwill and intangible assets”3: Business combinations” in Item 8 of this Annual Report on Form 10-K for additional information related to goodwill.
Determining the fair value of a reporting unitassets acquired and liabilities assumed requires management’s judgment, and involveswe utilized an independent valuation expert in the usevaluation of significantthe tangible and intangible assets. Critical estimates used in valuing tangible and assumptions by management. The inputs that create the most sensitivity in our goodwill valuation modelintangible assets include, but are the discount rate, terminal growth rate, estimated cash flow projections and market multiples. We can provide no assurance that a material impairment charge will not occur in alimited to, future period. Our estimates of futureexpected cash flows, may differ from actualdiscount rates, market prices and asset lives. The valuation of customer relationships utilized an income approach, using an excess earnings methodology. Additionally, the total recurring revenue attributable to the customer relationship was based upon the relative split between specialty and commodity chemicals. Key assumptions used in the business enterprise valuation include the forecasted cash flows that are subsequently realized duediscounted using the WACC, which reflects the macroeconomic, industry and geographic factors of the risk of achieving the forecasted cash flows, and ranged from 10.5 percent to many factors, including future worldwide economic conditions and19.0 percent, depending on the expected benefits of our initiatives. Any of these potential factors, or other unexpected factors, may cause us to re-evaluate the carrying value of goodwill.country.
Environmental Liabilities
Our environmental reserves are subject to numerous uncertainties that affect our ability to accurately estimate our costs, or our share of costs if multiple parties are responsible. These uncertainties involve the legal, regulatory and enforcement parameters governing environmental assessment and remediation, the nature and extent of contamination at these sites, the extent and cost of assessment and remediation efforts required, the choice of remediationour insurance coverage for these sites and, in the case of sites with multiple responsible parties, the number and financial strength of other potentially responsiblethose parties. In addition, our determination as to whether a loss is probable may change, particularly as new facts emerge as to the nature or extentcauses of any non-compliance withcontamination. We evaluate each environmental lawssite as new information and the costsfacts become available and make adjustments to reserves based upon our assessment of assessmentthese factors, using technical experts, legal counsel and remediation. Our revisions to the environmental reserve estimates have ranged between $12.3 million to $12.6 million between 2017 and 2018.other specialists.
Defined Benefit Pension and Other Postretirement Obligations
For the year ended December 31, 2019 and 2018, we increased our average pension discount rate by 46 basis points, resultingrecorded a mark to market loss of $50.9 million and $34.9 million, respectively. See “Note 11: Employee benefit plans” in a decrease in our pension plan benefit obligationItem 8 of $81.1 million. For the year ended December 31, 2017, our average pension discount rate decreased by 42 basis points, resulting in an increase in our pension plan benefit obligation of $63.2 million. Our expected long-term rate of returnthis Annual Report on pension plan assets is 5.54% and 6.02%Form 10-K for 2018 and 2017, respectively. Actual returns can vary from the expected long-term rate each year. Actual (losses) returns for 2018 and 2017 were ($59.6) million, or (5.4)%, and $117.4 million or 11.7%, respectively. Our expected return on plan assets is calculated using the actual fair value of plan assets. additional information.
Due to the phasing out of benefits under our postretirement benefit plan,plans, changes in assumptions have an immaterial effect on that obligation.
| (in millions) | 2018 Pension Benefit Obligation | ||
| 25 basis point decrease in discount rate | $ | 40.8 | |
(in millions) | 2019 Net Benefit Cost (Credit) | ||
| 25 basis point decrease in assumed discount rate | $ | (1.3 | ) |
| 100 basis point decrease in expected return on plan assets | 9.0 | ||
| Increase (decrease) in | |||||||||||||||||||||||
| (in millions) | Percentage Change | 2020 Net Benefit Cost | 2019 Pension Benefit Obligation | ||||||||||||||||||||
| Discount rate | 25 bps decrease | $ | (2.0) | $ | 51.4 | ||||||||||||||||||
| Discount rate | 25 bps increase | 1.8 | (48.4) | ||||||||||||||||||||
| Expected return on plan assets | 100 bps decrease | 10.4 | N/A | ||||||||||||||||||||
| Expected return on plan assets | 100 bps increase | (10.4) | N/A | ||||||||||||||||||||
Income Taxes
The Company is subject to income taxes in the jurisdictions in which it sells products and earn revenues, includingrevenues. We record income taxes under the United States, Canadaasset and various Latin American, Asian-Pacificliability method. Under this method, deferred tax assets and European jurisdictions. Byliabilities are recognized based on the future tax consequences to temporary differences between the financial statement carrying values of existing assets and liabilities and their nature, a numberrespective tax bases. Deferred tax assets and liabilities are measured using enacted tax rates expected to
31
apply in the years in which the temporary differences are expected to be recovered or paid. A reduction of the Company'scarrying values of deferred tax positions require significant judgment in order to properly evaluate and quantify tax positions and to determineassets by a valuation allowance is required if, based on the provision for income taxes. GAAP sets forth a two-step approach to recognizing and measuring uncertain tax positions. The first step is to evaluate the tax position for recognition by determining if the weight of available evidence, indicates that it is more likely than not that the positionsuch assets will not be sustained upon examination, including resolution of related appeals or litigation processes, if any. The second step is to measure the tax benefit as the largest amount that is more than 50% likely of being realized upon settlement. GAAP specifically prohibits the use of a valuation allowance as a substitute for derecognition of tax positions and also requires expanded disclosures. See “Note 7: Income taxes” in Item 8 of this Annual Report on Form 10-K.
realized. In evaluating the Company’s ability to realize its deferred tax assets, in full or in part, the Company considered all available positive and negative evidence, including its past operating results, forecastforecasted and appropriate character of future market growth, forecasted earnings, future taxable income, the duration of statutory carryforward periods, our experience with operating loss and prudenttax credit carryforwards not expiring unused and feasible tax planning strategies. The Company has a valuation allowance on certain deferred tax assets, primarily related to foreign tax credits, net operating loss carry forwards and deferred interest.
Recently Issued and Adopted Accounting Pronouncements
See “Note 2: Significant accounting policies” in Item 8 of this Annual Report on Form 10-K.
We believe that other financial measures that do not comply with US GAAP provide relevant and meaningful information concerning the ongoing operating results of the Company. These financial measures include gross profit (exclusive of depreciation), adjusted gross profit (exclusive of depreciation), gross margin, adjusted gross margin and Adjusted EBITDA margin. We define these financial measures as follows:
•Gross profit (exclusive of depreciation): net sales less cost of goods sold (exclusive of depreciation);
•Adjusted gross profit (exclusive of depreciation): net sales less cost of goods sold (exclusive of depreciation) plus inventory step-up adjustment and Brazil VAT recovery;
•Gross margin: gross profit (exclusive of depreciation) divided by external sales on a segment level and by net sales on a consolidated level;
•Adjusted gross margin: adjusted gross profit (exclusive of depreciation) divided by external sales on a segment level and by net sales on a consolidated level; and
•Adjusted EBITDA margin: Adjusted EBITDA divided by external sales on a segment level and by net sales on a consolidated level.
Management believes Adjusted EBITDA, Adjusted EBITDA margin, gross profit (exclusive of depreciation), adjusted gross profit (exclusive of depreciation), gross margin and adjusted gross margin are important measures in assessing operating performance. The non-GAAP financial measures are included as a complement to results provided in accordance with GAAP because management believes these non-GAAP financial measures help investors’ ability to analyze underlying trends in the Company’s business, evaluate its performance relative to other companies in its industry and provide useful information to both management and investors by excluding certain items that may not be indicative of the Company’s core operating results. Additionally, the Company uses Adjusted EBITDA in setting performance incentive targets to align management compensation measurement with operational performance. Adjusted EBITDA, Adjusted EBITDA margin, gross profit (exclusive of depreciation), adjusted gross profit (exclusive of depreciation), gross margin and adjusted gross margin are not measures calculated in accordance with GAAP and should not be considered a substitute for net income or any other measure of financial performance presented in accordance with GAAP. Additionally, other companies may calculate Adjusted EBITDA differently than we do, limiting its usefulness as a comparative measure.
32
The following is a quantitative reconciliation of Adjusted EBITDA to the most directly comparable GAAP financial performance measure, which is net (loss) income:
| Year ended December 31, | |||||||||||||||||||||||||||||||||||||||||||||||||||||
| (in millions) | 2019 | 2018 | 2017 | 2016 | 2015 | ||||||||||||||||||||||||||||||||||||||||||||||||
| Net (loss) income | $ | (100.2) | $ | 172.3 | $ | 119.8 | $ | (68.4) | $ | 16.5 | |||||||||||||||||||||||||||||||||||||||||||
| Net (income) loss from discontinued operations | (5.4) | — | — | — | — | ||||||||||||||||||||||||||||||||||||||||||||||||
| Depreciation and amortization | 214.7 | 179.5 | 200.4 | 237.9 | 225.0 | ||||||||||||||||||||||||||||||||||||||||||||||||
| Interest expense, net | 139.5 | 132.4 | 148.0 | 159.9 | 207.0 | ||||||||||||||||||||||||||||||||||||||||||||||||
| Income tax expense (benefit) from continuing operations | 104.5 | 49.9 | 49.0 | (11.2) | 10.2 | ||||||||||||||||||||||||||||||||||||||||||||||||
| EBITDA | $ | 353.1 | $ | 534.1 | $ | 517.2 | $ | 318.2 | $ | 458.7 | |||||||||||||||||||||||||||||||||||||||||||
| Acquisition and integration related expenses | 152.1 | 22.0 | 3.1 | 5.5 | 7.1 | ||||||||||||||||||||||||||||||||||||||||||||||||
| Saccharin legal settlement | 62.5 | — | — | — | — | ||||||||||||||||||||||||||||||||||||||||||||||||
(Gain) loss on sale of business, property, plant and equipment and other assets (1) | (51.3) | 2.0 | (11.3) | (0.7) | (2.8) | ||||||||||||||||||||||||||||||||||||||||||||||||
Pension mark to market loss (2) | 50.4 | 34.2 | 3.8 | 68.6 | 21.1 | ||||||||||||||||||||||||||||||||||||||||||||||||
Pension curtailment and settlement gains (2) | (1.3) | — | (9.7) | (1.3) | (4.0) | ||||||||||||||||||||||||||||||||||||||||||||||||
Non-operating retirement benefits (2) | (2.2) | (11.0) | (9.9) | (15.3) | (26.8) | ||||||||||||||||||||||||||||||||||||||||||||||||
Restructuring, employee severance and other facility closure costs (3) | 40.9 | 21.2 | 13.6 | 8.0 | 33.8 | ||||||||||||||||||||||||||||||||||||||||||||||||
| Stock-based compensation expense | 25.1 | 20.7 | 19.7 | 10.4 | 7.5 | ||||||||||||||||||||||||||||||||||||||||||||||||
Loss (gain) on undesignated derivative contracts (6) | 26.7 | (1.1) | 1.9 | (8.3) | 10.7 | ||||||||||||||||||||||||||||||||||||||||||||||||
Loss on extinguishment of debt and debt refinancing costs (4) | 21.0 | 0.1 | 9.1 | — | 28.6 | ||||||||||||||||||||||||||||||||||||||||||||||||
| Brazil VAT recovery | (8.3) | — | — | — | — | ||||||||||||||||||||||||||||||||||||||||||||||||
Foreign currency (gains) losses (6) | (7.4) | 7.5 | 22.5 | 14.3 | (8.1) | ||||||||||||||||||||||||||||||||||||||||||||||||
Impairment charges (5) | 7.0 | — | — | 133.9 | — | ||||||||||||||||||||||||||||||||||||||||||||||||
| Inventory step-up adjustment | 5.3 | — | — | — | — | ||||||||||||||||||||||||||||||||||||||||||||||||
Other operating and non-operating expenses (3)(6) | 30.6 | 10.7 | 10.4 | 8.7 | 18.5 | ||||||||||||||||||||||||||||||||||||||||||||||||
| Business transformation costs | — | — | 23.4 | 5.4 | — | ||||||||||||||||||||||||||||||||||||||||||||||||
| Contract termination and advisory fees to CVC & CD&R | — | — | — | — | 29.0 | ||||||||||||||||||||||||||||||||||||||||||||||||
| Adjusted EBITDA | $ | 704.2 | $ | 640.4 | $ | 593.8 | $ | 547.4 | $ | 573.3 | |||||||||||||||||||||||||||||||||||||||||||
(1)Refer to the consolidated statement of operations and “Note 6: Other operating expenses, net” in Item 8 of this Annual Report on Form 10-K for more information.
(2)Represents charges or gains recorded for both the defined benefit pension and other postretirement benefit plans (“The Plans”). The Plans' mark to market loss is measured and recognized in its entirety within the statement of operations annually on December 31 and results from changes in actuarial assumptions and plan experience between the prior and current measurement dates, as well as the difference between the expected return on plan assets and the actual return on plan assets. For 2019, the pension mark to market loss of $50.4 million reflects a measurement loss of $169.1 million resulting from changes since the prior measurement date in actuarial assumptions and plan experience, offset by the difference between the expected and actual return on plan assets of $118.7 million attributable to the performance of plan assets during 2019. See “Note 11: Employee benefit plans” in Item 8 of this Annual Report on Form 10-K for additional information on pension mark to market loss, pension curtailment and settlement gains and non-operating retirement benefits.
(3)Refer to “Note 6: Other operating expenses, net” in Item 8 of this Annual Report on Form 10-K for more information.
(4)Refer to the consolidated statement of operations and “Note 8: Other expense, net” in Item 8 of this Annual Report on Form 10-K for more information.
(5)The 2016 impairment charges primarily related to the impairment of intangible assets and property, plant and equipment. See “Note 16: Impairment charges” in Item 8 on this Annual Report on Form 10-K for further information regarding the year ended December 31, 2019.
(6)Refer to “Note 8: Other expense, net” in Item 8 of this Annual Report on Form 10-K for more information.
ITEM 7A. QUANTITATIVE AND QUALITATIVE DISCLOSURES ABOUT MARKET RISK
Financial Risk Management Objectives and Policies
33
and manage these hedging positions. We do not hold or issue derivative or other financial instruments for speculative purposes, or to hedge translation risk.
Interest Rate Risk
Our exposure to market risk for changes in interest rates relates primarily to our long-term debt obligations. Under our hedging policy, we seek to maintain an appropriate amount of fixed-rate debt obligations, either directly or effectively through interest rate derivative contracts that fix the interest rate payable on all or a portion of our floating rate debt obligations. We assess the anticipated mix of the fixed versus floating amount of debt once a year, in connection with our annual budgeting process, with the purpose of hedging variability of interest expense and interest payments on our variable rate bank debt and maintaining a mix of both fixed and floating rate debt. As of December 31, 2018,2019, approximately 81% of our debt was fixed rate after consideration of interest rate swap contracts.
Below is a chart showing the sensitivity of both a 100 basis point and 200 basis point increase in interest rates (including the impact of derivatives), with other variables held constant on our earnings before tax.
| (in millions) | Year Ended December 31, 2018 | ||
| 100 basis point increase in variable interest rates | $ | 4.4 | |
| 200 basis point increase in variable interest rates | 9.0 | ||
| (in millions) | Year Ended December 31, 2019 | ||||
| 100 basis point increase in variable interest rates | $ | 5.2 | |||
| 200 basis point increase in variable interest rates | 10.4 | ||||
Foreign Currency Risk
Because we conduct our business on an international basis in multiple currencies, we may be adversely affected by foreign exchange rate fluctuations. Although we report financial results in US dollars, a substantial portion of our net sales and expenses are denominated in currencies other than the US dollar, particularly the euro, the Canadian dollar and European currencies other than the euro, including the British pound sterling. Fluctuations in exchange rates could therefore significantly affect our reported results from period to period as we translate results in local currencies into US dollars. We have not used derivative instruments to hedge the translation risk related to earnings of foreign subsidiaries.
Additionally, our investments in EMEA, Canada and Rest of WorldLATAM are subject to foreign currency risk. Currency fluctuations result in non-cash gains and losses that do not impact income before income taxes, but instead are recorded as accumulated other comprehensive loss in equity in our consolidated balance sheet. We do not hedge our investment in non-US entities because those investments are viewed as long-term in nature.
The majority of our currency risk arising on cash, accounts receivable, accounts payable and loan balances denominated in currencies other than those which we record the financial results for a business operation stem from exposures to the US dollar, euro or British pound sterling. The following table illustrates the sensitivity of our 20182019 consolidated earnings before income taxes (including the impact of foreign currency derivative instruments), to a 10% increase in the value of the US dollar, euro, and British pound sterling with all other variables held constant.
| (in millions) | Year ended December 31, 2019 | ||||
| 10% strengthening of US dollar | $ | 2.3 | |||
| 10% strengthening of Euro | (0.4) | ||||
| 10% strengthening of British pound | (0.3) | ||||
34
| (in millions) | Year ended December 31, 2018 | ||
| 10% strengthening of US dollar | $ | (1.8 | ) |
| 10% strengthening of Euro | 0.6 | ||
| 10% strengthening of British pound | (0.3 | ) | |
ITEM 8. FINANCIAL STATEMENTS AND SUPPLEMENTARY DATA
| Page | |||||
35
REPORT OF INDEPENDENT REGISTERED PUBLIC ACCOUNTING FIRM
To the Stockholders and the Board of Directors of Univar Solutions Inc.
Opinion on the Financial Statements
We have audited the accompanying consolidated balance sheets of Univar Solutions Inc. as of December 31, 20182019 and 2017,2018, and the related consolidated statements of operations, comprehensive income (loss), changes in stockholders' equity, and cash flows for each of the three years in the period ended December 31, 20182019 and the related notes and financial statement schedule listed in the Index at Item 15(a) (collectively referred to as the “consolidated financial statements”). In our opinion, the consolidated financial statements present fairly, in all material respects, the financial position of the Company at December 31, 20182019 and 2017,2018, and the consolidated results of its operations and its cash flows for each of the three years in the period ended December 31, 2018,2019, in conformity with U.S. generally accepted accounting principles.
We also have audited, in accordance with the standards of the Public Company Accounting Oversight Board (United States) (PCAOB), the Company’sCompany's internal control over financial reporting as of December 31, 2018,2019, based on criteria established in Internal Control-Integrated Framework issued by the Committee of Sponsoring Organizations of the Treadway Commission 2013 framework and our report dated February 21, 201925, 2020 expressed an unqualified opinion thereon.
Basis for Opinion
These financial statements are the responsibility of the Company’sCompany's management. Our responsibility is to express an opinion on the Company’s financial statements based on our audits. We are a public accounting firm registered with the PCAOB and are required to be independent with respect to the Company in accordance with the U.S. federal securities laws and the applicable rules and regulations of the Securities and Exchange Commission and the PCAOB.
We conducted our audits in accordance with the standards of the PCAOB. Those standards require that we plan and perform the audit to obtain reasonable assurance about whether the financial statements are free of material misstatement, whether due to error or fraud. Our audits included performing procedures to assess the risks of material misstatement of the financial statements, whether due to error or fraud, and performing procedures that respond to those risks. Such procedures included examining, on a test basis, evidence regarding the amounts and disclosures in the financial statements. Our audits also included evaluating the accounting principles used and significant estimates made by management, as well as evaluating the overall presentation of the financial statements. We believe that our audits provide a reasonable basis for our opinion.
Critical Audit Matters
The critical audit matters communicated below are matters arising from the current period audit of the financial statements that were communicated or required to be communicated to the audit committee and that: (1) relate to accounts or disclosures that are material to the financial statements and (2) involved our especially challenging, subjective or complex judgments. The communication of critical audit matters does not alter in any way our opinion on the consolidated financial statements, taken as a whole, and we are not, by communicating the critical audit matters below, providing separate opinions on the critical audit matters or on the accounts or disclosures to which they relate.
| Environmental Liabilities | |||||
| Description of the Matter | At December 31, 2019, the Company’s environmental liability balance was $78.7 million. As discussed in Note 21 of the financial statements, the Company is subject to various federal, state and local environmental laws and regulations that require environmental assessment or remediation efforts (collectively “environmental remediation work”) at approximately 130 locations. In determining the appropriate level of environmental reserves, the Company considers several factors such as information obtained from investigatory studies; required scope and estimated costs of remediation; the interpretation, application and enforcement of laws and regulations; the development of alternative cleanup technologies and methods; and the level of the Company’s responsibility for remediating at various sites. | ||||
| Auditing management’s accrual for environmental liabilities was especially challenging because it involves judgmental underlying assumptions, including remediation methods, remediation time horizon and remediation cost estimates. These assumptions have a significant effect on the accrual for environmental liabilities. | |||||
36
| How we addressed the Matter in Our Audit | We tested management’s controls that address the risks of material misstatement relating to the measurement and valuation of the environmental liabilities. For example, we tested controls over management’s review of the environmental liability calculations and, the significant assumptions and the data inputs provided to management’s specialists. | ||||
| To test the accrual for environmental liabilities, we involved our specialist to assist us in evaluating the reasonableness of the Company’s calculation and underlying assumptions. We performed audit procedures that included, among others, assessing key methodologies and testing the significant assumptions and the underlying data used by the management’s specialists. For example, we tested the site’s current remediation status and remediation strategy, which included an analysis of the site’s remediation timeline, regulatory requirements, remediation actions and related technologies and eligibility for discounting. In addition, we performed a search of various data sources for any unidentified environmental liabilities for which the Company may be a potential responsible party. | |||||
| Accounting for Nexeo Solutions Acquisition | |||||
| Description of the Matter | During 2019, the Company completed its acquisition of Nexeo Solutions, Inc (Nexeo) for net consideration of $1,814.8 million, as discussed in Note 3 to the consolidated financial statements. The Company accounted for the acquisition under the acquisition method of accounting for business combinations. Accordingly, the purchase price was allocated to the assets acquired and liabilities assumed based on their respective fair values. Assets acquired included intangible assets representing customer relationships of approximately $138.7 million. | ||||
| Auditing the Company’s accounting for its acquisition of Nexeo was complex due to the highly judgmental nature of the significant assumptions used to estimate the fair value of the intangible assets including the discount rates and certain assumptions that form the basis of the forecasted results such as sales growth rates, percentage of revenue attributable to customer relationships, customer attrition rates, and EBITDA margin. These significant assumptions are forward looking and could be affected by future economic and market conditions. | |||||
| How we addressed the Matter in Our Audit | We obtained an understanding, evaluated the design and tested the operating effectiveness of controls over the Company’s process for determining the fair value of the acquired intangible assets, including controls over management’s review of the significant assumptions described above. | ||||
| To test the estimated fair value of the acquired intangible assets, we performed audit procedures that included, among others, evaluating the Company’s use of the income approach which utilized the excess earnings method and testing the significant assumptions used in the model, including the completeness and accuracy of the underlying data. For example, we compared the significant assumptions to current industry, market and economic trends, to the assumptions used to value similar assets in other acquisitions, to the historical results of the acquired business and to other guidelines used by companies within the same industry. We compared the prospective financial information for consistency with other prospective financial information prepared by the Company. We involved our specialists to assist in our evaluation of the significant assumptions described above. | |||||
/s/ Ernst & Young LLP
We have served as the Company’s auditor since 2010.
Chicago, Illinois
February 21, 201925, 2020
37
REPORT OF INDEPENDENT REGISTERED PUBLIC ACCOUNTING FIRM
To the Stockholders and the Board of Directors of Univar Solutions Inc.
Opinion on Internal Control over Financial Reporting
We have audited Univar Solutions Inc.’s internal control over financial reporting as of December 31, 2018,2019, based on criteria established in Internal Control-IntegratedControl—Integrated Framework issued by the Committee of Sponsoring Organizations of the Treadway Commission (2013 framework) (the COSO criteria). In our opinion, Univar Inc. maintained, in all material respects, effective internal control over financial reporting as of December 31, 2018,2019, based on the COSO criteria.
As indicated in the accompanying Management’s Report on Internal Control over Financial Reporting, management’s assessment of and conclusion on the effectiveness of internal control over financial reporting did not include the internal controls of Nexeo Solutions, Inc., which is included in the 2019 consolidated financial statements of the Company and constituted 32.5% total assets, as of December 31, 2019 and 16% of revenues, for the year then ended. Our audit of internal control over financial reporting of the Company also did not include an evaluation of the internal control over financial reporting of Nexeo Solutions Inc.
We also have audited, in accordance with the standards of the Public Company Accounting Oversight Board (United States) (PCAOB), the 20182019 consolidated financial statements of Univar Solutions Inc. and our report dated February 21, 2019,25, 2020, expressed an unqualified opinion thereon.
Basis for Opinion
The Company’s management is responsible for maintaining effective internal control over financial reporting, and for its assessment of the effectiveness of internal control over financial reporting included in the accompanying Management’s Assessment ofReport on Internal Control over Financial Reporting. Our responsibility is to express an opinion on the company’s internal control over financial reporting based on our audit. We are a public accounting firm registered with the PCAOB and are required to be independent with respect to the Company in accordance with the U.S. federal securities laws and applicable rules and regulation of the Securities and Exchange Commission and the PCAOB.
We conducted our audit in accordance with the standards of the PCAOB. Those standards require that we plan and perform the audit to obtain reasonable assurance about whether effective internal control over financial reporting was maintained in all material respects.
Our audit included obtaining an understanding of internal control over financial reporting, assessing the risk that a material weakness exists, testing and evaluating the design and operating effectiveness of internal control based on the assessed risk, and performing such other procedures as we considered necessary in the circumstances. We believe that our audit provides a reasonable basis for our opinion.
Definition and Limitation of Internal Control Over Financial Reporting
A company’s internal control over financial reporting is a process designed to provide reasonable assurance regarding the reliability of financial reporting and the preparation of financial statements for external purposes in accordance with generally accepted accounting principles. A company’s internal control over financial reporting includes those policies and procedures that (1) pertain to the maintenance of records that, in reasonable detail, accurately and fairly reflect the transactions and dispositions of the assets of the company; (2) provide reasonable assurance that transactions are recorded as necessary to permit preparation of financial statements in accordance with generally accepted accounting principles, and that receipts and expenditures of the company are being made only in accordance with authorizations of management and directors of the company; and (3) provide reasonable assurance regarding prevention or timely detection of unauthorized acquisition, use, or disposition of the company’s assets that could have a material effect on the financial statements.
Because of its inherent limitations, internal control over financial reporting may not prevent or detect misstatements. Also, projections of any evaluation of effectiveness to future periods are subject to the risk that controls may become inadequate because of changes in conditions, or that the degree of compliance with the policies or procedures may deteriorate.
/s/ Ernst & Young LLP
Chicago, Illinois
February 21, 201925, 2020
38
UNIVAR SOLUTIONS INC.
CONSOLIDATED STATEMENTS OF OPERATIONS
| Year ended December 31, | |||||||||||||||||||||||||||||||||||
| (in millions, except per share data) | Note | 2019 | 2018 | 2017 | |||||||||||||||||||||||||||||||
| Net sales | $ | 9,286.9 | $ | 8,632.5 | $ | 8,253.7 | |||||||||||||||||||||||||||||
| Cost of goods sold (exclusive of depreciation) | 7,146.1 | 6,732.4 | 6,448.2 | ||||||||||||||||||||||||||||||||
| Operating expenses: | |||||||||||||||||||||||||||||||||||
| Outbound freight and handling | 364.8 | 328.3 | 292.0 | ||||||||||||||||||||||||||||||||
| Warehousing, selling and administrative | 1,068.8 | 931.4 | 919.7 | ||||||||||||||||||||||||||||||||
| Other operating expenses, net | 6 | 298.2 | 73.5 | 55.4 | |||||||||||||||||||||||||||||||
| Depreciation | 155.0 | 125.2 | 135.0 | ||||||||||||||||||||||||||||||||
| Amortization | 59.7 | 54.3 | 65.4 | ||||||||||||||||||||||||||||||||
| Impairment charges | 16 | 7.0 | — | — | |||||||||||||||||||||||||||||||
| Total operating expenses | $ | 1,953.5 | $ | 1,512.7 | $ | 1,467.5 | |||||||||||||||||||||||||||||
| Operating income | $ | 187.3 | $ | 387.4 | $ | 338.0 | |||||||||||||||||||||||||||||
| Other (expense) income: | |||||||||||||||||||||||||||||||||||
| Interest income | 7.7 | 3.2 | 4.0 | ||||||||||||||||||||||||||||||||
| Interest expense | (147.2) | (135.6) | (152.0) | ||||||||||||||||||||||||||||||||
| Gain on sale of business | 4 | 41.4 | — | — | |||||||||||||||||||||||||||||||
| Loss on extinguishment of debt | 18 | (19.8) | (0.1) | (3.8) | |||||||||||||||||||||||||||||||
| Other expense, net | 8 | (70.5) | (32.7) | (17.4) | |||||||||||||||||||||||||||||||
| Total other expense | $ | (188.4) | $ | (165.2) | $ | (169.2) | |||||||||||||||||||||||||||||
| (Loss) income before income taxes | (1.1) | 222.2 | 168.8 | ||||||||||||||||||||||||||||||||
| Income tax expense from continuing operations | 9 | 104.5 | 49.9 | 49.0 | |||||||||||||||||||||||||||||||
| Net (loss) income from continuing operations | $ | (105.6) | $ | 172.3 | $ | 119.8 | |||||||||||||||||||||||||||||
| Net income from discontinued operations | 4 | $ | 5.4 | $ | — | $ | — | ||||||||||||||||||||||||||||
| Net (loss) income | $ | (100.2) | $ | 172.3 | $ | 119.8 | |||||||||||||||||||||||||||||
| (Loss) income per common share: | |||||||||||||||||||||||||||||||||||
| Basic from continuing operations | 10 | $ | (0.64) | $ | 1.22 | $ | 0.85 | ||||||||||||||||||||||||||||
| Basic from discontinued operations | 10 | 0.03 | — | — | |||||||||||||||||||||||||||||||
| Basic (loss) income per common share | $ | (0.61) | $ | 1.22 | $ | 0.85 | |||||||||||||||||||||||||||||
| Diluted from continuing operations | 10 | $ | (0.64) | $ | 1.21 | $ | 0.85 | ||||||||||||||||||||||||||||
| Diluted from discontinued operations | 10 | 0.03 | — | — | |||||||||||||||||||||||||||||||
| Diluted (loss) income per common share | $ | (0.61) | $ | 1.21 | $ | 0.85 | |||||||||||||||||||||||||||||
| Weighted average common shares outstanding: | |||||||||||||||||||||||||||||||||||
| Basic | 10 | 164.1 | 141.2 | 140.2 | |||||||||||||||||||||||||||||||
| Diluted | 10 | 164.1 | 142.2 | 141.4 | |||||||||||||||||||||||||||||||
| Year ended December 31, | |||||||||||||
| (in millions, except per share data) | Note | 2018 | 2017 | 2016 | |||||||||
| Net sales | $ | 8,632.5 | $ | 8,253.7 | $ | 8,073.7 | |||||||
| Cost of goods sold (exclusive of depreciation) | 6,732.4 | 6,448.2 | 6,346.6 | ||||||||||
| Operating expenses: | |||||||||||||
| Outbound freight and handling | 328.3 | 292.0 | 286.6 | ||||||||||
| Warehousing, selling and administrative | 931.4 | 919.7 | 893.1 | ||||||||||
| Other operating expenses, net | 4 | 73.5 | 55.4 | 37.2 | |||||||||
| Depreciation | 125.2 | 135.0 | 152.3 | ||||||||||
| Amortization | 54.3 | 65.4 | 85.6 | ||||||||||
| Impairment charges | 14 | — | — | 133.9 | |||||||||
| Total operating expenses | $ | 1,512.7 | $ | 1,467.5 | $ | 1,588.7 | |||||||
| Operating income | $ | 387.4 | $ | 338.0 | $ | 138.4 | |||||||
| Other (expense) income: | |||||||||||||
| Interest income | 3.2 | 4.0 | 3.9 | ||||||||||
| Interest expense | (135.6 | ) | (152.0 | ) | (163.8 | ) | |||||||
| Loss on extinguishment of debt | 16 | (0.1 | ) | (3.8 | ) | — | |||||||
| Other expense, net | 6 | (32.7 | ) | (17.4 | ) | (58.1 | ) | ||||||
| Total other expense | $ | (165.2 | ) | $ | (169.2 | ) | $ | (218.0 | ) | ||||
| Income (loss) before income taxes | 222.2 | 168.8 | (79.6 | ) | |||||||||
| Income tax expense (benefit) | 7 | 49.9 | 49.0 | (11.2 | ) | ||||||||
| Net income (loss) | $ | 172.3 | $ | 119.8 | $ | (68.4 | ) | ||||||
| Income (loss) per common share: | |||||||||||||
| Basic | 8 | $ | 1.22 | $ | 0.85 | $ | (0.50 | ) | |||||
| Diluted | 8 | 1.21 | 0.85 | (0.50 | ) | ||||||||
| Weighted average common shares outstanding: | |||||||||||||
| Basic | 8 | 141.2 | 140.2 | 137.8 | |||||||||
| Diluted | 8 | 142.2 | 141.4 | 137.8 | |||||||||
The accompanying notes are an integral part of these consolidated financial statements.
39
UNIVAR SOLUTIONS INC.
CONSOLIDATED STATEMENTS OF COMPREHENSIVE (LOSS) INCOME (LOSS)
| Year ended December 31, | |||||||||||||||||||||||||||||||||||
| (in millions) | Note | 2019 | 2018 | 2017 | |||||||||||||||||||||||||||||||
| Net (loss) income | $ | (100.2) | $ | 172.3 | $ | 119.8 | |||||||||||||||||||||||||||||
| Other comprehensive (loss) income, net of tax: | |||||||||||||||||||||||||||||||||||
| Impact due to adoption of ASU 2018-02 | 2 | (3.2) | — | — | |||||||||||||||||||||||||||||||
Impact due to adoption of ASU 2017-12 (1) | — | 0.5 | — | ||||||||||||||||||||||||||||||||
| Foreign currency translation | 13 | 22.8 | (97.0) | 107.1 | |||||||||||||||||||||||||||||||
| Pension and other postretirement benefits adjustment | 13 | 0.1 | 0.1 | (2.4) | |||||||||||||||||||||||||||||||
| Derivative financial instruments | 13 | (25.8) | 1.7 | 6.7 | |||||||||||||||||||||||||||||||
| Total other comprehensive (loss) income, net of tax | $ | (6.1) | $ | (94.7) | $ | 111.4 | |||||||||||||||||||||||||||||
| Comprehensive (loss) income | $ | (106.3) | $ | 77.6 | $ | 231.2 | |||||||||||||||||||||||||||||
(1)Impact due to the adoption of Accounting Standards Update (“ASU”) 2017-12 “Targeted Improvements to Accounting for Hedging Activities” on January 1, 2018.
| Year ended December 31, | |||||||||||||
| (in millions) | Note | 2018 | 2017 | 2016 | |||||||||
| Net income (loss) | $ | 172.3 | $ | 119.8 | $ | (68.4 | ) | ||||||
| Other comprehensive income (loss), net of tax: | |||||||||||||
Impact due to adoption of ASU 2017-12 (1) | 0.5 | — | — | ||||||||||
| Foreign currency translation | 11 | (97.0 | ) | 107.1 | 36.3 | ||||||||
| Pension and other postretirement benefits adjustment | 11 | 0.1 | (2.4 | ) | (1.8 | ) | |||||||
| Derivative financial instruments | 11 | 1.7 | 6.7 | — | |||||||||
| Total other comprehensive (loss) income, net of tax | $ | (94.7 | ) | $ | 111.4 | $ | 34.5 | ||||||
| Comprehensive income (loss) | $ | 77.6 | $ | 231.2 | $ | (33.9 | ) | ||||||
The accompanying notes are an integral part of these consolidated financial statements.
40
UNIVAR SOLUTIONS INC.
CONSOLIDATED BALANCE SHEETS
| December 31, | |||||||||||||||||||||||
| (in millions, except per share data) | Note | 2019 | 2018 | ||||||||||||||||||||
| Assets | |||||||||||||||||||||||
| Current assets: | |||||||||||||||||||||||
| Cash and cash equivalents | $ | 330.3 | $ | 121.6 | |||||||||||||||||||
| Trade accounts receivable, net | 1,160.1 | 1,094.7 | |||||||||||||||||||||
| Inventories | 796.0 | 803.3 | |||||||||||||||||||||
| Prepaid expenses and other current assets | 167.2 | 169.1 | |||||||||||||||||||||
| Total current assets | $ | 2,453.6 | $ | 2,188.7 | |||||||||||||||||||
| Property, plant and equipment, net | 14 | 1,152.4 | 955.8 | ||||||||||||||||||||
| Goodwill | 15 | 2,280.8 | 1,780.7 | ||||||||||||||||||||
| Intangible assets, net | 15 | 320.2 | 238.1 | ||||||||||||||||||||
| Deferred tax assets | 9 | 21.3 | 24.8 | ||||||||||||||||||||
Other assets (1) | 266.5 | 84.3 | |||||||||||||||||||||
| Total assets | $ | 6,494.8 | $ | 5,272.4 | |||||||||||||||||||
| Liabilities and stockholders’ equity | |||||||||||||||||||||||
| Current liabilities: | |||||||||||||||||||||||
| Short-term financing | 18 | $ | 0.7 | $ | 8.1 | ||||||||||||||||||
| Trade accounts payable | 895.0 | 925.4 | |||||||||||||||||||||
| Current portion of long-term debt | 18 | 25.0 | 21.7 | ||||||||||||||||||||
| Accrued compensation | 103.6 | 93.6 | |||||||||||||||||||||
Other accrued expenses (1) | 17 | 425.1 | 285.8 | ||||||||||||||||||||
| Total current liabilities | $ | 1,449.4 | $ | 1,334.6 | |||||||||||||||||||
| Long-term debt | 18 | 2,688.8 | 2,350.4 | ||||||||||||||||||||
| Pension and other postretirement benefit liabilities | 11 | 295.6 | 254.4 | ||||||||||||||||||||
| Deferred tax liabilities | 9 | 56.3 | 42.9 | ||||||||||||||||||||
Other long-term liabilities (1) | 271.9 | 98.4 | |||||||||||||||||||||
| Total liabilities | $ | 4,762.0 | $ | 4,080.7 | |||||||||||||||||||
| Stockholders’ equity: | |||||||||||||||||||||||
| Preferred stock, 200.0 million shares authorized at $0.01 par value with 0 shares issued or outstanding as of December 31, 2019 and 2018, respectively | $ | — | $ | — | |||||||||||||||||||
| Common stock, 2.0 billion shares authorized at $0.01 par value with 168.7 million and 141.7 million shares issued and outstanding at December 31, 2019 and 2018, respectively | 1.7 | 1.4 | |||||||||||||||||||||
| Additional paid-in capital | 2,968.9 | 2,325.0 | |||||||||||||||||||||
| Accumulated deficit | (858.5) | (761.5) | |||||||||||||||||||||
| Accumulated other comprehensive loss | 13 | (379.3) | (373.2) | ||||||||||||||||||||
| Total stockholders’ equity | $ | 1,732.8 | $ | 1,191.7 | |||||||||||||||||||
| Total liabilities and stockholders’ equity | $ | 6,494.8 | $ | 5,272.4 | |||||||||||||||||||
(1)Operating lease assets and operating lease liabilities are included in other assets, other accrued expenses and other long-term liabilities in 2019. Refer to “Note 22: Leasing” for more information.
| December 31, | |||||||||
| (in millions, except per share data) | Note | 2018 | 2017 | ||||||
| Assets | |||||||||
| Current assets: | |||||||||
| Cash and cash equivalents | $ | 121.6 | $ | 467.0 | |||||
| Trade accounts receivable, net | 1,094.7 | 1,062.4 | |||||||
| Inventories | 803.3 | 839.5 | |||||||
| Prepaid expenses and other current assets | 169.1 | 149.6 | |||||||
| Total current assets | $ | 2,188.7 | $ | 2,518.5 | |||||
| Property, plant and equipment, net | 12 | 955.8 | 1,003.0 | ||||||
| Goodwill | 13 | 1,780.7 | 1,818.4 | ||||||
| Intangible assets, net | 13 | 238.1 | 287.7 | ||||||
| Deferred tax assets | 7 | 24.8 | 22.8 | ||||||
| Other assets | 84.3 | 82.3 | |||||||
| Total assets | $ | 5,272.4 | $ | 5,732.7 | |||||
| Liabilities and stockholders’ equity | |||||||||
| Current liabilities: | |||||||||
| Short-term financing | 16 | $ | 8.1 | $ | 13.4 | ||||
| Trade accounts payable | 925.4 | 941.7 | |||||||
| Current portion of long-term debt | 16 | 21.7 | 62.0 | ||||||
| Accrued compensation | 93.6 | 100.7 | |||||||
| Other accrued expenses | 15 | 285.8 | 301.6 | ||||||
| Total current liabilities | $ | 1,334.6 | $ | 1,419.4 | |||||
| Long-term debt | 16 | 2,350.4 | 2,820.0 | ||||||
| Pension and other postretirement benefit liabilities | 9 | 254.4 | 257.1 | ||||||
| Deferred tax liabilities | 7 | 42.9 | 35.4 | ||||||
| Other long-term liabilities | 98.4 | 110.7 | |||||||
| Total liabilities | $ | 4,080.7 | $ | 4,642.6 | |||||
| Stockholders’ equity: | |||||||||
| Preferred stock, 200.0 million shares authorized at $0.01 par value with no shares issued or outstanding as of December 31, 2018 and 2017 | — | — | |||||||
| Common stock, 2.0 billion shares authorized at $0.01 par value with 141.7 million and 141.1 million shares issued and outstanding at December 31, 2018 and December 31, 2017, respectively | 1.4 | 1.4 | |||||||
| Additional paid-in capital | 2,325.0 | 2,301.3 | |||||||
| Accumulated deficit | (761.5 | ) | (934.1 | ) | |||||
| Accumulated other comprehensive loss | 11 | (373.2 | ) | (278.5 | ) | ||||
| Total stockholders’ equity | $ | 1,191.7 | $ | 1,090.1 | |||||
| Total liabilities and stockholders’ equity | $ | 5,272.4 | $ | 5,732.7 | |||||
The accompanying notes are an integral part of these consolidated financial statements.
41
UNIVAR SOLUTIONS INC.
CONSOLIDATED STATEMENTS OF CASH FLOWS
| Year ended December 31, | Year ended December 31, | |||||||||||||||||||||||||||||||||||||||||||||||
| (in millions) | Note | 2018 | 2017 | 2016 | (in millions) | Note | 2019 | 2018 | 2017 | |||||||||||||||||||||||||||||||||||||||
| Operating activities: | Operating activities: | |||||||||||||||||||||||||||||||||||||||||||||||
| Net income (loss) | $ | 172.3 | $ | 119.8 | $ | (68.4 | ) | |||||||||||||||||||||||||||||||||||||||||
| Adjustments to reconcile net income (loss) to net cash provided by operating activities: | ||||||||||||||||||||||||||||||||||||||||||||||||
| Net (loss) income | Net (loss) income | $ | (100.2) | $ | 172.3 | $ | 119.8 | |||||||||||||||||||||||||||||||||||||||||
| Adjustments to reconcile net (loss) income to net cash provided by operating activities: | Adjustments to reconcile net (loss) income to net cash provided by operating activities: | |||||||||||||||||||||||||||||||||||||||||||||||
| Depreciation and amortization | 179.5 | 200.4 | 237.9 | Depreciation and amortization | 214.7 | 179.5 | 200.4 | |||||||||||||||||||||||||||||||||||||||||
| Impairment charges | 14 | — | — | 133.9 | Impairment charges | 16 | 7.0 | — | — | |||||||||||||||||||||||||||||||||||||||
| Amortization of deferred financing fees and debt discount | 7.6 | 7.9 | 7.9 | Amortization of deferred financing fees and debt discount | 8.9 | 7.6 | 7.9 | |||||||||||||||||||||||||||||||||||||||||
| Amortization of pension cost (credits) from accumulated other comprehensive loss | 9 | 2.7 | (0.2 | ) | (4.5 | ) | Amortization of pension cost (credits) from accumulated other comprehensive loss | 11 | 0.1 | 2.7 | (0.2) | |||||||||||||||||||||||||||||||||||||
| Gain on sale of business | Gain on sale of business | 4 | (41.4) | — | — | |||||||||||||||||||||||||||||||||||||||||||
| Loss on extinguishment of debt | 16 | 0.1 | 3.8 | — | Loss on extinguishment of debt | 18 | 13.1 | 0.1 | 3.8 | |||||||||||||||||||||||||||||||||||||||
| Loss (gain) on sale of property, plant and equipment and other assets | 4 | 2.0 | (11.3 | ) | (0.7 | ) | ||||||||||||||||||||||||||||||||||||||||||
| (Gain) loss on sale of property, plant and equipment and other assets | (Gain) loss on sale of property, plant and equipment and other assets | (9.9) | 2.0 | (11.3) | ||||||||||||||||||||||||||||||||||||||||||||
| Deferred income taxes | 7 | 2.8 | 11.7 | (31.6 | ) | Deferred income taxes | 9 | 24.3 | 2.8 | 11.7 | ||||||||||||||||||||||||||||||||||||||
| Stock-based compensation expense | 10 | 20.7 | 19.7 | 10.4 | Stock-based compensation expense | 12 | 25.1 | 20.7 | 19.7 | |||||||||||||||||||||||||||||||||||||||
| Charge for inventory step-up of acquired inventory | Charge for inventory step-up of acquired inventory | 5.3 | — | — | ||||||||||||||||||||||||||||||||||||||||||||
| Other | 0.7 | (0.7 | ) | (0.2 | ) | Other | 3.0 | 0.7 | (0.7) | |||||||||||||||||||||||||||||||||||||||
| Changes in operating assets and liabilities: | Changes in operating assets and liabilities: | |||||||||||||||||||||||||||||||||||||||||||||||
| Trade accounts receivable, net | (62.1 | ) | (58.5 | ) | 70.2 | Trade accounts receivable, net | 197.0 | (62.1) | (58.5) | |||||||||||||||||||||||||||||||||||||||
| Inventories | 14.4 | (47.7 | ) | 42.0 | Inventories | 69.0 | 14.4 | (47.7) | ||||||||||||||||||||||||||||||||||||||||
| Prepaid expenses and other current assets | (19.3 | ) | (8.7 | ) | 40.1 | Prepaid expenses and other current assets | 54.3 | (19.3) | (8.7) | |||||||||||||||||||||||||||||||||||||||
| Trade accounts payable | 9.3 | 53.6 | 12.0 | Trade accounts payable | (70.9) | 9.3 | 53.6 | |||||||||||||||||||||||||||||||||||||||||
| Pensions and other postretirement benefit liabilities | (15.4 | ) | (51.8 | ) | 26.9 | Pensions and other postretirement benefit liabilities | 21.9 | (15.4) | (51.8) | |||||||||||||||||||||||||||||||||||||||
| Other, net | (25.4 | ) | 44.6 | (25.9 | ) | Other, net | (57.4) | (25.4) | 44.6 | |||||||||||||||||||||||||||||||||||||||
| Net cash provided by operating activities | $ | 289.9 | $ | 282.6 | $ | 450.0 | Net cash provided by operating activities | $ | 363.9 | $ | 289.9 | $ | 282.6 | |||||||||||||||||||||||||||||||||||
| Investing activities: | Investing activities: | |||||||||||||||||||||||||||||||||||||||||||||||
| Purchases of property, plant and equipment | $ | (94.6 | ) | $ | (82.7 | ) | $ | (90.1 | ) | Purchases of property, plant and equipment | $ | (122.5) | $ | (94.6) | $ | (82.7) | ||||||||||||||||||||||||||||||||
| Proceeds from sale of property, plant and equipment and other assets | 14.5 | 29.2 | 9.4 | Proceeds from sale of property, plant and equipment and other assets | 54.8 | 14.5 | 29.2 | |||||||||||||||||||||||||||||||||||||||||
| Purchases of businesses, net of cash acquired | 19 | (18.6 | ) | (24.4 | ) | (53.6 | ) | Purchases of businesses, net of cash acquired | 3 | (1,201.0) | (18.6) | (24.4) | ||||||||||||||||||||||||||||||||||||
| Proceeds from sale of business | Proceeds from sale of business | 4 | 838.3 | — | — | |||||||||||||||||||||||||||||||||||||||||||
| Other | (0.3 | ) | (1.2 | ) | (1.7 | ) | Other | (2.7) | (0.3) | (1.2) | ||||||||||||||||||||||||||||||||||||||
| Net cash used by investing activities | $ | (99.0 | ) | $ | (79.1 | ) | $ | (136.0 | ) | Net cash used by investing activities | $ | (433.1) | $ | (99.0) | $ | (79.1) | ||||||||||||||||||||||||||||||||
| Financing activities: | Financing activities: | |||||||||||||||||||||||||||||||||||||||||||||||
| Proceeds from the issuance of long-term debt | 16 | $ | 41.7 | $ | 4,477.8 | $ | — | Proceeds from the issuance of long-term debt | 18 | $ | 1,845.8 | $ | — | $ | 4,477.8 | |||||||||||||||||||||||||||||||||
| Payments on long-term debt and capital lease obligations | 16 | (561.9 | ) | (4,585.7 | ) | (178.2 | ) | |||||||||||||||||||||||||||||||||||||||||
| Payments on long-term debt and finance lease obligations | Payments on long-term debt and finance lease obligations | 18 | (1,545.9) | (561.9) | (4,588.7) | |||||||||||||||||||||||||||||||||||||||||||
| Net proceeds under revolving credit facilities | Net proceeds under revolving credit facilities | 18 | 7.2 | 41.7 | 3.0 | |||||||||||||||||||||||||||||||||||||||||||
| Short-term financing, net | 16 | 0.5 | (22.2 | ) | (4.6 | ) | Short-term financing, net | 18 | (9.2) | 0.5 | (22.2) | |||||||||||||||||||||||||||||||||||||
| Financing fees paid | 16 | (1.1 | ) | (7.7 | ) | — | Financing fees paid | 18 | (7.9) | (1.1) | (7.7) | |||||||||||||||||||||||||||||||||||||
| Taxes paid related to net share settlements of stock-based compensation awards | (4.1 | ) | (8.5 | ) | — | Taxes paid related to net share settlements of stock-based compensation awards | (2.8) | (4.1) | (8.5) | |||||||||||||||||||||||||||||||||||||||
| Stock option exercises | 10 | 5.9 | 36.5 | 16.9 | Stock option exercises | 12 | 6.6 | 5.9 | 36.5 | |||||||||||||||||||||||||||||||||||||||
| Contingent consideration payments | (0.4 | ) | (3.7 | ) | (0.4 | ) | Contingent consideration payments | — | (0.4) | (3.7) | ||||||||||||||||||||||||||||||||||||||
| Other | 1.1 | 1.1 | (0.2 | ) | Other | 1.4 | 1.1 | 1.1 | ||||||||||||||||||||||||||||||||||||||||
| Net cash used by financing activities | $ | (518.3 | ) | $ | (112.4 | ) | $ | (166.5 | ) | |||||||||||||||||||||||||||||||||||||||
| Net cash provided (used) by financing activities | Net cash provided (used) by financing activities | $ | 295.2 | $ | (518.3) | $ | (112.4) | |||||||||||||||||||||||||||||||||||||||||
| Effect of exchange rate changes on cash and cash equivalents | $ | (18.0 | ) | $ | 39.5 | $ | 0.8 | Effect of exchange rate changes on cash and cash equivalents | $ | (17.3) | $ | (18.0) | $ | 39.5 | ||||||||||||||||||||||||||||||||||
| Net (decrease) increase in cash and cash equivalents | (345.4 | ) | 130.6 | 148.3 | ||||||||||||||||||||||||||||||||||||||||||||
| Net increase (decrease) in cash and cash equivalents | Net increase (decrease) in cash and cash equivalents | 208.7 | (345.4) | 130.6 | ||||||||||||||||||||||||||||||||||||||||||||
| Cash and cash equivalents at beginning of period | 467.0 | 336.4 | 188.1 | Cash and cash equivalents at beginning of period | 121.6 | 467.0 | 336.4 | |||||||||||||||||||||||||||||||||||||||||
| Cash and cash equivalents at end of period | $ | 121.6 | $ | 467.0 | $ | 336.4 | Cash and cash equivalents at end of period | $ | 330.3 | $ | 121.6 | $ | 467.0 | |||||||||||||||||||||||||||||||||||
| Supplemental disclosure of cash flow information: | Supplemental disclosure of cash flow information: | |||||||||||||||||||||||||||||||||||||||||||||||
| Cash paid during the period for: | Cash paid during the period for: | |||||||||||||||||||||||||||||||||||||||||||||||
| Income taxes | $ | 65.0 | $ | 29.9 | $ | 14.9 | Income taxes | $ | 42.5 | $ | 65.0 | $ | 29.9 | |||||||||||||||||||||||||||||||||||
| Interest, net of capitalized interest | 128.2 | 140.2 | 148.9 | Interest, net of capitalized interest | 146.1 | 128.2 | 140.2 | |||||||||||||||||||||||||||||||||||||||||
| Non-cash activities: | Non-cash activities: | |||||||||||||||||||||||||||||||||||||||||||||||
| Fair value of common stock issued for acquisition of business | Fair value of common stock issued for acquisition of business | 3 | $ | 613.8 | $ | — | $ | — | ||||||||||||||||||||||||||||||||||||||||
| Additions of property, plant and equipment included in trade accounts payable and other accrued expenses | $ | 14.6 | $ | 7.4 | $ | 11.5 | Additions of property, plant and equipment included in trade accounts payable and other accrued expenses | 9.8 | 14.6 | 7.4 | ||||||||||||||||||||||||||||||||||||||
| Additions of property, plant and equipment under a capital lease obligation | 23.6 | 19.9 | 29.6 | |||||||||||||||||||||||||||||||||||||||||||||
| Additions of property, plant and equipment under a finance lease obligation | Additions of property, plant and equipment under a finance lease obligation | 23.3 | 23.6 | 19.9 | ||||||||||||||||||||||||||||||||||||||||||||
| Additions of assets under an operating lease obligation | Additions of assets under an operating lease obligation | 25.5 | — | — | ||||||||||||||||||||||||||||||||||||||||||||
The accompanying notes are an integral part of these consolidated financial statements.
42
UNIVAR SOLUTIONS INC.
CONSOLIDATED STATEMENTS OF CHANGES IN STOCKHOLDERS’ EQUITY
| (in millions, except per share data) | Common stock (shares) | Common stock | Additional paid-in capital | Accumulated deficit | Accumulated other comprehensive income (loss) | Total | |||||||||||||||||||||||||||||
| Balance, January 1, 2017 | 138.8 | $ | 1.4 | $ | 2,251.8 | $ | (1,053.4) | $ | (389.9) | $ | 809.9 | ||||||||||||||||||||||||
Impact due to adoption of ASU, net of tax $0.2 (1) | — | — | 0.7 | (0.5) | — | 0.2 | |||||||||||||||||||||||||||||
| Net income | — | — | — | 119.8 | — | 119.8 | |||||||||||||||||||||||||||||
| Foreign currency translation adjustment, net of tax $(2.1) | — | — | — | — | 107.1 | 107.1 | |||||||||||||||||||||||||||||
| Pension and other postretirement benefits adjustment, net of tax $0.6 | — | — | — | — | (2.4) | (2.4) | |||||||||||||||||||||||||||||
| Derivative financial instruments, net of tax $(4.3) | — | — | — | — | 6.7 | 6.7 | |||||||||||||||||||||||||||||
| Restricted stock units vested | 0.8 | — | — | — | — | — | |||||||||||||||||||||||||||||
| Tax withholdings related to net share settlements of stock-based compensation awards | (0.3) | — | (8.5) | — | — | (8.5) | |||||||||||||||||||||||||||||
| Stock option exercises | 1.8 | — | 36.5 | — | — | 36.5 | |||||||||||||||||||||||||||||
| Employee stock purchase plan | — | — | 1.1 | — | — | 1.1 | |||||||||||||||||||||||||||||
| Stock-based compensation | — | — | 19.7 | — | — | 19.7 | |||||||||||||||||||||||||||||
| Balance, December 31, 2017 | 141.1 | $ | 1.4 | $ | 2,301.3 | $ | (934.1) | $ | (278.5) | $ | 1,090.1 | ||||||||||||||||||||||||
Impact due to adoption of ASU, net of tax $(0.3) (2) | — | — | — | 0.3 | 0.5 | 0.8 | |||||||||||||||||||||||||||||
| Net income | — | — | — | 172.3 | — | 172.3 | |||||||||||||||||||||||||||||
| Foreign currency translation adjustment, net of tax $2.4 | — | — | — | — | (97.0) | (97.0) | |||||||||||||||||||||||||||||
| Pension and other postretirement benefits adjustment, net of tax $(0.1) | — | — | — | — | 0.1 | 0.1 | |||||||||||||||||||||||||||||
| Derivative financial instruments, net of tax $(0.4) | — | — | — | — | 1.7 | 1.7 | |||||||||||||||||||||||||||||
| Restricted stock units vested | 0.4 | — | — | — | — | — | |||||||||||||||||||||||||||||
| Tax withholdings related to net share settlements of stock-based compensation awards | (0.1) | — | (4.1) | — | — | (4.1) | |||||||||||||||||||||||||||||
| Stock option exercises | 0.3 | — | 5.9 | — | — | 5.9 | |||||||||||||||||||||||||||||
| Employee stock purchase plan | — | — | 1.1 | — | — | 1.1 | |||||||||||||||||||||||||||||
| Stock-based compensation | — | — | 20.7 | — | — | 20.7 | |||||||||||||||||||||||||||||
| Other | — | — | 0.1 | — | — | 0.1 | |||||||||||||||||||||||||||||
| Balance, December 31, 2018 | 141.7 | $ | 1.4 | $ | 2,325.0 | $ | (761.5) | $ | (373.2) | $ | 1,191.7 | ||||||||||||||||||||||||
Impact due to adoption of ASU (3) | — | — | — | 3.2 | (3.2) | — | |||||||||||||||||||||||||||||
| Net loss | — | — | — | (100.2) | — | (100.2) | |||||||||||||||||||||||||||||
| Foreign currency translation adjustment, net of tax $4.9 | — | — | — | — | 22.8 | 22.8 | |||||||||||||||||||||||||||||
| Pension and other postretirement benefits adjustment | — | — | — | — | 0.1 | 0.1 | |||||||||||||||||||||||||||||
| Derivative financial instruments, net of tax $7.0 | — | — | — | — | (25.8) | (25.8) | |||||||||||||||||||||||||||||
Common stock issued for the Nexeo acquisition (4) | 27.9 | 0.3 | 649.0 | — | — | 649.3 | |||||||||||||||||||||||||||||
| Shares canceled | (1.5) | (35.5) | — | — | (35.5) | ||||||||||||||||||||||||||||||
| Restricted stock units vested | 0.4 | — | — | — | — | — | |||||||||||||||||||||||||||||
| Tax withholdings related to net share settlements of stock-based compensation awards | (0.2) | — | (2.8) | — | — | (2.8) | |||||||||||||||||||||||||||||
| Stock option exercises | 0.3 | — | 6.6 | — | — | 6.6 | |||||||||||||||||||||||||||||
| Employee stock purchase plan | 0.1 | — | 1.4 | — | — | 1.4 | |||||||||||||||||||||||||||||
| Stock-based compensation | — | — | 25.1 | — | — | 25.1 | |||||||||||||||||||||||||||||
| Other | — | — | 0.1 | — | — | 0.1 | |||||||||||||||||||||||||||||
| Balance, December 31, 2019 | 168.7 | $ | 1.7 | $ | 2,968.9 | $ | (858.5) | $ | (379.3) | $ | 1,732.8 | ||||||||||||||||||||||||
(1)Adjusted due to the adoption of ASU 2016-09 “Improvement to Employee Share-Based Payment Accounting” on January 1, 2017.
| (in millions, except per share data) | Common stock (shares) | Common stock | Additional paid-in capital | Accumulated deficit | Accumulated other comprehensive income (loss) | Total | ||||||||||||||||
| Balance, January 1, 2016 | 138.0 | $ | 1.4 | $ | 2,224.7 | $ | (985.0 | ) | $ | (424.4 | ) | $ | 816.7 | |||||||||
| Net loss | — | — | — | (68.4 | ) | — | (68.4 | ) | ||||||||||||||
| Foreign currency translation adjustment, net of tax $23.9 | — | — | — | — | 36.3 | 36.3 | ||||||||||||||||
| Pension and other postretirement benefits adjustment, net of tax $1.5 | — | — | — | — | (1.8 | ) | (1.8 | ) | ||||||||||||||
| Stock option exercises | 0.8 | — | 16.9 | — | — | 16.9 | ||||||||||||||||
| Stock-based compensation | — | — | 10.4 | — | — | 10.4 | ||||||||||||||||
| Other | — | — | (0.2 | ) | — | — | (0.2 | ) | ||||||||||||||
| Balance, December 31, 2016 | 138.8 | $ | 1.4 | $ | 2,251.8 | $ | (1,053.4 | ) | $ | (389.9 | ) | $ | 809.9 | |||||||||
| Impact due to adoption of ASU, net of tax $0.2 (1) | — | — | 0.7 | (0.5 | ) | — | 0.2 | |||||||||||||||
| Net income | — | — | — | 119.8 | — | 119.8 | ||||||||||||||||
| Foreign currency translation adjustment, net of tax ($2.1) | — | — | — | — | 107.1 | 107.1 | ||||||||||||||||
| Pension and other postretirement benefits adjustment, net of tax $0.6 | — | — | — | — | (2.4 | ) | (2.4 | ) | ||||||||||||||
| Derivative financial instruments, net of tax ($4.3) | — | — | — | — | 6.7 | 6.7 | ||||||||||||||||
| Restricted stock units vested | 0.8 | — | — | — | — | — | ||||||||||||||||
| Tax withholdings related to net share settlements of stock-based compensation awards | (0.3 | ) | — | (8.5 | ) | — | — | (8.5 | ) | |||||||||||||
| Stock option exercises | 1.8 | — | 36.5 | — | — | 36.5 | ||||||||||||||||
Employee stock purchase plan (2) | — | — | 1.1 | — | — | 1.1 | ||||||||||||||||
| Stock-based compensation | — | — | 19.7 | — | — | 19.7 | ||||||||||||||||
| Balance, December 31, 2017 | 141.1 | $ | 1.4 | $ | 2,301.3 | $ | (934.1 | ) | $ | (278.5 | ) | $ | 1,090.1 | |||||||||
Impact due to adoption of ASU, net of tax ($0.3) (3) | — | — | — | 0.3 | 0.5 | 0.8 | ||||||||||||||||
| Net income | — | — | — | 172.3 | — | 172.3 | ||||||||||||||||
| Foreign currency translation adjustment, net of tax $2.4 | — | — | — | — | (97.0 | ) | (97.0 | ) | ||||||||||||||
| Pension and other postretirement benefits adjustment, net of tax ($0.1) | — | — | — | — | 0.1 | 0.1 | ||||||||||||||||
| Derivative financial instruments, net of tax ($0.4) | — | — | — | — | 1.7 | 1.7 | ||||||||||||||||
| Restricted stock units vested | 0.4 | — | — | — | — | — | ||||||||||||||||
| Tax withholdings related to net share settlements of stock-based compensation awards | (0.1 | ) | — | (4.1 | ) | — | — | (4.1 | ) | |||||||||||||
| Stock option exercises | 0.3 | — | 5.9 | — | — | 5.9 | ||||||||||||||||
| Employee stock purchase plan | — | — | 1.1 | — | — | 1.1 | ||||||||||||||||
| Stock-based compensation | — | — | 20.7 | — | — | 20.7 | ||||||||||||||||
| Other | — | — | 0.1 | — | — | 0.1 | ||||||||||||||||
| Balance, December 31, 2018 | 141.7 | $ | 1.4 | $ | 2,325.0 | $ | (761.5 | ) | $ | (373.2 | ) | $ | 1,191.7 | |||||||||
(3)Refer to “Note 2: Significant accounting policies” for more information.
(4)Refer to “Note 3: Business combinations” for more information.
The accompanying notes are an integral part of these consolidated financial statements.
43
UNIVAR SOLUTIONS INC.
NOTES TO CONSOLIDATED FINANCIAL STATEMENTS
AS OF DECEMBER 31, 20182019 AND 20172018 AND
FOR THE YEARS ENDED DECEMBER 31, 2019, 2018 2017 AND 20162017
1. Nature of operations
Headquartered in Downers Grove, Illinois, Univar Solutions Inc. (“Company” or “Univar”“Univar Solutions”) is a leading global chemical and ingredients distributor and provider of specialty services. The Company’s operations are structured into four operating4 reportable segments that represent the geographic areas under which the Company manages its business:
•Univar Solutions USA (“USA”)
•Univar Solutions Canada (“Canada”)
•Univar Solutions Europe, the Middle East and Africa (“EMEA”)
In 2019, the World (“RestCompany renamed its “Rest of World”)
2. Significant accounting policies
Basis of consolidation and presentation
The consolidated financial statements include the financial statements of the Company and its majority-owned subsidiaries. Subsidiaries are consolidated if the Company has a controlling financial interest, which may exist based on ownership of a majority of the voting interest, or based on the Company’s determination that it is the primary beneficiary of a variable interest entity (“VIE”). The Company diddoes not have any material interests in VIEs during the years presented in these consolidated financial statements.VIEs. All intercompany balances and transactions are eliminated in consolidation. Unless otherwise indicated, all financial data presented in these consolidated financial statements are expressed in US dollars.
On our consolidated statements of cash flows for 2018 and 2017, the amounts included in “net proceeds under revolving credit facilities,” which were previously included in “proceeds from the issuance of long-term debt,” are now presented separately to conform to the current year presentation.
Use of estimates
The preparation of consolidated financial statements in conformity with US GAAP requires management to make estimates and assumptions affecting the amounts reported and disclosed in the financial statements and accompanying notes. Actual results could differ materially from these estimates.
Recently issued and adopted accounting pronouncements
| (in millions) | Balance at December 31, 2017 | Adjustments due to ASU 2014-09 | Adjustments due to ASU 2017-12 | Balance at January 1, 2018 | ||||||||||||
| Assets | ||||||||||||||||
| Trade accounts receivable, net | $ | 1,062.4 | $ | 41.3 | $ | — | $ | 1,103.7 | ||||||||
| Inventories | 839.5 | (2.1 | ) | — | 837.4 | |||||||||||
| Prepaid expenses and other current assets | 149.6 | 1.8 | — | 151.4 | ||||||||||||
| Liabilities | ||||||||||||||||
| Trade accounts payable | $ | 941.7 | $ | 7.0 | $ | — | $ | 948.7 | ||||||||
| Other accrued expenses | 301.6 | 33.2 | — | 334.8 | ||||||||||||
| Equity | ||||||||||||||||
| Accumulated deficit | $ | (934.1 | ) | $ | 0.8 | $ | (0.5 | ) | $ | (933.8 | ) | |||||
| Accumulated other comprehensive loss | (278.5 | ) | — | 0.5 | (278.0 | ) | ||||||||||
| Year ended December 31, 2018 | ||||||||||||
| (in millions) | As reported | Balances without adoption of ASC 606 | Effect of change higher/(lower) | |||||||||
| Net sales | $ | 8,632.5 | $ | 8,626.4 | $ | 6.1 | ||||||
| Cost of goods sold (exclusive of depreciation) | 6,732.4 | 6,726.7 | 5.7 | |||||||||
| Income tax expense | $ | 49.9 | $ | 49.8 | $ | 0.1 | ||||||
| Net income | 172.3 | 172.0 | 0.3 | |||||||||
| December 31, 2018 | ||||||||||||
| (in millions) | As reported | Balances without adoption of ASC 606 | Effect of change higher/(lower) | |||||||||
| Assets | ||||||||||||
| Trade accounts receivable, net | $ | 1,094.7 | $ | 1,047.8 | $ | 46.9 | ||||||
| Inventories | 803.3 | 814.4 | (11.1 | ) | ||||||||
| Prepaid expenses and other current assets | 169.1 | 163.9 | 5.2 | |||||||||
| Liabilities | ||||||||||||
| Trade accounts payable | $ | 925.4 | $ | 919.2 | $ | 6.2 | ||||||
| Other accrued expenses | 285.8 | 252.1 | 33.7 | |||||||||
| Equity | ||||||||||||
| Accumulated deficit | $ | (761.5 | ) | $ | (762.6 | ) | $ | 1.1 | ||||
| Year ended December 31, 2017 | ||||||||||||
| (in millions) | As revised | Previously reported | Effect of change higher/(lower) | |||||||||
| Warehousing, selling and administrative | $ | 919.7 | $ | 909.8 | $ | 9.9 | ||||||
| Other operating expenses, net | 55.4 | 49.5 | 5.9 | |||||||||
| Other expense, net | (17.4 | ) | (33.2 | ) | (15.8 | ) | ||||||
44
lease standard as an accounting policy electionadjustment to keepthe 2019 opening balance sheet and also includes adjustments related to previously unrecognized finance leases with an initial term of 12 months or less off ofas follows:
| (in millions) | Balance at December 31, 2018 | Adjustments due to ASU 2016-02 | Balance at January 1, 2019 | |||||||||||||||||
| Assets | ||||||||||||||||||||
| Property, plant and equipment, net | $ | 955.8 | $ | 5.4 | $ | 961.2 | ||||||||||||||
| Other assets | 84.3 | 166.8 | 251.1 | |||||||||||||||||
| Liabilities | ||||||||||||||||||||
| Current portion of long-term debt | $ | 21.7 | $ | (4.5) | $ | 17.2 | ||||||||||||||
| Other accrued expenses | 285.8 | 43.8 | 329.6 | |||||||||||||||||
| Long-term debt | 2,350.4 | 9.9 | 2,360.3 | |||||||||||||||||
| Other long-term liabilities | 98.4 | 123.0 | 221.4 | |||||||||||||||||
On January 1, 2019, the balance sheet. The Company will recognize those lease payments in the consolidated statements of operations on a straight-line basis over the lease term. The Company estimates the impact of the additional lease assets and liabilities to range from $140 million to $190 million.
Accounting pronouncements issued but not yet adopted
In June 2016, the FASB issued ASU 2016-13 “Financial Instruments - Credit Losses” (Topic 326) which requires the effectmeasurement and recognition of the Tax Cuts and Jobs Act is recognized, or in the period of adoption.expected credit losses for financial assets held at amortized cost. The Company mustwill adopt this guidance for fiscal years beginning
In August 2018, the FASB issued ASU 2018-13 “Fair Value Measurement” (Topic 820) - “Disclosure Framework - Changes to the Disclosure Requirements for Fair Value Measurement.” The ASU amendswhich modifies the requirements related to fair value disclosures to include new disclosure requirements and eliminates or modifies certain historic disclosures. The ASU amendment was part ofCompany will adopt this guidance effective January 1, 2020 and is finalizing the FASB’s disclosure framework projectimpacts that is designed to increase the effectiveness of companies’ disclosures to the users of the financial statements and footnotes. This guidance will be effective for fiscal years beginning after December 15, 2019, including interim periods within such fiscal years. Early adoption is permitted. The Company is currently determining the impact to the Company’s disclosure requirements, which will be reflected in the footnotefinancial statement disclosures, subsequentwhich are not expected to the ASU adoption on January 1, 2020.be material.
In August 2018, the FASB issued ASU 2018-14 “Compensation - Retirement Benefits - Defined Benefit Plans - General” (Subtopic 715-20) - “Disclosure Framework - Changes towhich amends the Disclosure Requirements for Defined Benefit Plans.” The ASU amends thedisclosure requirements related to defined benefit pension and other postretirement plan disclosures to include new disclosure requirements and eliminates or clarifies certain historic disclosures. The ASU amendment was part of the FASB’s disclosure framework project that is designed to increase the effectiveness of companies’ disclosures to the users of the financial statements and footnotes. This guidance will be effective for fiscal years beginning after December 15, 2020. Early adoption is permitted.plan. The Company will adopt this guidance effective January 1, 2021 and is currently determining the impact to the Company’s disclosure requirements, whichimpacts that will be reflected in financial statement disclosures.
In August 2018, the footnote disclosures subsequentFASB issued ASU 2018-15 “Intangibles - Goodwill and Other - Internal-Use Software” (Subtopic 350-40) - “Customer’s Accounting for Implementation Costs Incurred in a Cloud Computing Arrangement That Is a Service Contract” which aligns the requirements for capitalizing implementation costs incurred in a service contract hosting arrangement with those for capitalizing implementation costs incurred to the ASU adoption ondevelop or obtain internal-use software. The Company will adopt this guidance effective January 1, 2021.2020 and is finalizing the impacts which are not expected to be material.
In December 2019, the FASB issued ASU 2019-12 “Income Taxes” (Topic 740) – “Simplifying the Accounting for Income Taxes” which simplifies the accounting for income taxes. The Company has not yet adoptedwill adopt this guidance effective January 1, 2021 and is currently determining the following standards, noneimpacts of which is expected to have a material impact to the guidance on our consolidated financial statements or financial statement disclosures:
Cash and cash equivalents
Cash and cash equivalents include highly-liquid investments with an original maturity of three months or less that are readily convertible into known amounts of cash. Cash at banks earn interest at floating rates based on daily bank deposit rates.
Trade accounts receivable, net
Trade accounts receivable are stated at the invoiced amount, net of an allowance for doubtful accounts.
Inventories
Inventories consist primarily of products purchased for resale and are stated at the lower of cost or net realizable value. Inventory cost is determined based on the weighted average cost method. Inventory costmethod and includes purchase price from producers net of rebates received, inbound freight and handling, and direct labor and other costs incurred to blend and repackage product, andbut excludes depreciation expense. The Company recognized $1.9 million, $3.3 million and $6.6 million
45
Property, plant and equipment, net
Property, plant and equipment are carried at historical cost, net of accumulated depreciation. Expenditures for improvements that add functionality and/or extend useful life are capitalized. The Company capitalizes interest costs on significant capital projects, as an increase to property, plant and equipment. Repair and maintenance costs are expensed as incurred. Depreciation is recorded on a straight-line basis over the estimated useful life of each asset from the time the asset is ready for its intended purpose, with consideration of expected residual values. Depreciation expense is recorded to depreciation within the consolidated statement of operations.
| Buildings | 10-50 years | ||||
| Main components of tank farms | 5-40 years | ||||
| Containers | 2-15 years | ||||
| Machinery and equipment | 5-20 years | ||||
| Furniture, fixtures and others | 5-20 years | ||||
| Information technology | 3-10 years | ||||
The Company evaluates the useful life and carrying value of property, plant and equipment for impairment if an event occurs or circumstances change that would indicate the carrying value may not be recoverable. If an asset is tested for possible impairment, the Company compares the carrying amount of the related asset group to future undiscounted net cash flows expected to be generated by that asset group. If the carrying amount of the asset group is not recoverable on an undiscounted cash flow basis, an impairment loss is recognized to the extent that the asset group's carrying amount exceeds its estimated fair value.
Goodwill and intangible assets
Goodwill represents the excess of the aggregate purchase price over the fair value of the net assets acquired in business combinations.
Goodwill is tested for impairment annually on October 1, or between annual tests if an event occurs or circumstances change that would more likely than not reduce the fair value of a reporting unit below its carrying amount. Goodwill is tested for impairment at aThe Company’s reporting unit level using either a qualitative assessment, commonly referred to as a “step zero” test, or a quantitative assessment, commonly referred to as a “step one” test. units are USA, Canada, EMEA, Latin America and Asia-Pacific.
For each of the reporting units, the Company has the option to perform either the step zeroqualitative or the step onequantitative test. The Company’s reporting units are identical toIn the identified four operating segments: USA, Canada, EMEA, and Rest of World.
unit will recognize an impairment for the lesser of either the amount by which the reporting unit's carrying amount exceeds the fair value of the reporting unit or the reporting unit’s goodwill carrying value.
Short-term financing
Short-term financing includes bank overdrafts and short-term lines of credit. Refer to “Note 16: Debt” for further information.
Income taxes
Deferred tax assets and liabilities are determined based on differences between financial reporting and tax basis of assets and liabilities and are measured using enacted tax rates and laws that are expected to be in effect when the differences reverse. Deferred tax assets are also recognized for the estimated future effects of tax loss carryforwards. The effect on deferred taxes of changes in tax rates is recognized in the period in which the revised tax rate is enacted.
The Company records valuation allowances to reduce deferred tax assets to the extent it believes it is more likely than not that a portion of such assets will not be realized. In making such determinations, the Company considers all available positive and negative evidence, including scheduled reversals of deferred tax liabilities, projectedforecasted and appropriate character of future taxable income, tax planning strategies, our experience with operating loss and tax credit carryforwards not expiring unused, tax planning strategies and the ability to carry back losses to prior years. Realization
The Company is dependent upon generating sufficientsubject to the global intangible low tax income (“GILTI”), which is a tax on foreign income in excess of a deemed return on tangible assets of foreign corporations. The Company treats taxes due on future US inclusions in taxable income priorrelated to expiration of tax attribute carryforwards. Although realization is not assured, management believes it is more likely than not that all of the deferred tax assets will be realized, or if not,GILTI as a valuation allowance has been recorded. The Company continues to monitor the value of its deferred tax assets, as the amount of the deferred tax assets considered realizable, could be reduced in the near term if estimates of future taxable income during the carryforward periods are reduced, or current tax planning strategies are not implemented.
The Company recognizes interest and penalties related to unrecognized tax benefits within interest expense and warehousing, selling and administrative, respectively, in the accompanying consolidated statements of operations. Accrued interest and penalties are included within eitherin other accrued expenses orand other long-term liabilities in the consolidated balance sheets.
The Company sponsors several defined benefit and defined contribution plans. The Company’s contributions to defined contribution plans are charged to income during the period of the employee’s service.
46
The fair value of plan assets is used to calculate the expected return on assets component of the net periodic benefit cost.
At the commencement date of a lease, the Company recognizes a liability to “Note 9: Employee benefit plans” for further information.
Leases with an initial term of 12 months or less are classified as operating leases. Operatingshort-term leases and are not recorded on the consolidated balance sheets. The lease costs areexpense for short-term leases is recognized as an expense in the statement of operations on a straight-line basis over the lease term.
We expense related to the capital lease assets is included in depreciation expense in the consolidated statement of operations. Refer to “Note 12: Property, plant and equipment, net” for further information.
Environmental liabilities
Environmental contingenciesliabilities are recognized for probable and reasonably estimable losses associated with environmental remediation. Incremental direct costs of the investigation, remediation effort and post-remediation monitoring are included in the estimated environmental contingencies.liabilities. Expected cash outflows related to environmental remediation for the next 12 months and amounts for which the timing is uncertain are reported as current within other accrued expenses in the consolidated balance sheets. The long-term portion of environmental liabilities is reported within other long-term liabilities in the consolidated balance sheets on an undiscounted basis, except for sites for which the amount and timing of future cash payments are fixed or reliably determinable. Environmental remediation expenses are included within warehousing, selling and administrative expenses in the consolidated statements of operations, unless associated with disposed operations, in which case such expenses are included in other operating expenses, net.
Revenue recognition
| (in millions) | USA | Canada | EMEA | Rest of World | Consolidated | |||||||||||||||
| Year Ended December 31, 2018 | ||||||||||||||||||||
| Chemical Distribution | $ | 4,775.2 | $ | 877.6 | $ | 1,974.4 | $ | 383.8 | $ | 8,011.0 | ||||||||||
| Crop Sciences | — | 381.6 | — | — | 381.6 | |||||||||||||||
| Services | 185.8 | 43.1 | 1.3 | 9.7 | 239.9 | |||||||||||||||
| Total external customer net sales | $ | 4,961.0 | $ | 1,302.3 | $ | 1,975.7 | $ | 393.5 | $ | 8,632.5 | ||||||||||
Revenue for bill-and-hold arrangements is recognized if the Company has a substantive customer request, the materials are properly segregated and designated as belonging to the customer, materials are ready to be transferred to the customer and Univarthe Company is unable to direct the materials to service another customer. The Company has certain contractual relationships designated as an agency relationship, which requires the Company to recognize revenues on a net basis.
Chemical Distribution
Crop Sciences
The Company generates revenue when control for products is transferred to customers. The amount of consideration recorded varies due to price movements and rights granted to customers to return product. Customer payment terms often extend through a growing season, which may be up to six months.
Transaction prices may move during an agricultural growing season and changes mayare affected by special offers or volume discounts, which affect the amount of consideration the Company will receive. Transaction prices areCustomers also affected by special offers or volume discounts.may be provided rights to return eligible products. The Company estimates the expected returns and changes in the transaction price based on the combination of historical experience and the impact of weather on the current agriculture season. The adjustments to the transaction price are recognized as variable consideration and estimate of returns impacts revenues recognized.
Services
The Company generates revenue from services as they are performed and economic value is transferred to customers. Univar's servicesServices provided to customers are primarily related to waste management services and warehousing services. Waste management services
47
Foreign currency translation
Assets and liabilities of foreign subsidiaries are translated into US dollars at period-end exchange rates. Income and expense accounts of foreign subsidiaries are translated into US dollars at the average exchange rates for the period. The net exchange gains and losses arising on this translation are reflected as a component of currency translation within AOCI.
Transaction gains and losses are recognized in other expense, net in the consolidated statements of operations. Transaction gains and losses relating to intercompany borrowings that are an investment in a foreign subsidiary are reflected as a component of currency translation within AOCI in stockholders’ equity.
Stock-based compensation plans
The Company measures the total amount of employee stock-based compensation expense based on the grant date fair value of each award. Expense is recognized for each separately vesting tranche on a straight-line basis over the requisite service period, which is the shorter of the service period of the award or the period until the employees' retirement eligibility date. The Company recognizes forfeitures when incurred.
Fair value
Certain assets and liabilities are required to be recorded at fair value. The estimated fair values of those assets and liabilities have been determined using market information and valuation methodologies. Observable inputs reflect market data obtained from independent sources, while unobservable inputs reflect the Company’s market assumptions. There are three levels of inputs that may be used to measure fair value:
| Level 1 | Quoted prices for identical instruments in active markets. | |||||||
| Level 2 | Quoted prices for similar instruments in active markets; quoted prices for identical or similar instruments in markets that are not active; and model-derived valuation in which all significant inputs and significant value drivers are observable in active markets. | |||||||
| Level 3 | Valuations derived from valuation techniques in which one or more significant inputs or significant value drivers are unobservable. | |||||||
Derivatives
The Company uses derivative financial instruments to manage risks associated with foreign currency and interest rate fluctuations. We do not use derivative instruments for speculative trading purposes. The fair value of forward currency contracts is calculated by reference to current forward exchange rates for contracts with similar maturity profiles. The fair value of interest rate swaps is determined by estimating the net present value of amounts to be paid under the agreement offset by the net present value of the expected cash inflows based on market rates and associated yield curves. For derivative contracts with the same counterparty where the Company has a master netting arrangement with the counterparty, the fair value of the asset/liability is presented on a net basis within the consolidated balance sheets. Changes in the fair value of derivative financial instruments are recognized in the consolidated statements of operations within interest expense or other expense, net, unless specific hedge accounting criteria are met. Cash flows associated with derivative financial instruments are recognized in the operating section of the consolidated statements of cash flows.
For derivatives designated as cash flow hedges, changes in the fair value of the derivative are recorded to AOCI and are reclassified to earnings when the underlying forecasted transaction affects earnings. For contracts designated as cash flow hedges, we reassess the probability of the underlying forecasted transactions occurring on a quarterly basis. For derivatives not designated as hedging instruments, all changes in fair value are recorded to earnings in the current period.
Earnings per share
Basic earnings per share is based on the weighted average number of common shares outstanding during each period. Diluted earnings per share is based on the weighted average number of common shares and dilutive common share equivalents outstanding during each period. The Company reflects common share equivalents relating to stock options, non-vested restricted stock and non-vested restricted stock units in its computation of diluted weighted average shares outstanding, unless the effect of inclusion is anti-dilutive. The effect of dilutive securities is calculated using the treasury stock method.
We consider restricted stock awards to be participating securities, since holders of such shares have non-forfeitable dividend rights in the event the Company declares a common stock dividend.
48
3. Business combinations
Year ended December 31, 2019
Acquisition of Nexeo Solutions
On February 28, 2019, the Company completed an acquisition of 100% of the equity interest of Nexeo Solutions, Inc., a leading global chemicals and plastics distributor. The acquisition expands and strengthens Univar Solutions’ presence in North America and provides expanded opportunities to create the largest North American sales force in chemical and ingredients distribution and the broadest product offering.
The total purchase price of the acquisition was $1,814.8 million, composed of $1,201.0 million of cash paid (net of cash acquired of $46.8 million) and $613.8 million of newly issued shares of Univar Solutions common stock, which represented approximately 26.4 million shares, based on Univar Solutions’ closing stock price of $23.29 on February 27, 2019. The final 26.4 million shares issued include the cancellation of 1.5 million shares in connection with the appraisal litigation settlement, see “Note 21: Commitments and contingencies” for more information.
The cash portion of the purchase price, acquisition related costs and repayment of approximately $936.3 million of Nexeo’s debt and other long-term liabilities were funded using the proceeds from the issuance of Term B Loans, borrowings under the New Senior ABL Facility and the ABL Term Loan issued on February 28, 2019. Refer to “Note 18: Debt” for more information.
As of December 31, 2019, the Company updated the purchase price allocation to reflect fair value adjustments from the third-party valuation firm’s report valuing Nexeo’s tangible and intangible assets, working capital adjustments associated with the sale of the Nexeo plastics distribution business (“Nexeo Plastics”) as well as tax adjustments. The initial accounting for this acquisition is considered preliminary and is subject to adjustments on receipt of additional information relevant to the acquisition to complete the opening balances for deferred income taxes. The preliminary values and measurement period adjustments are shown below:
| (in millions) | At Acquisition Date | Measurement Period Adjustments | As Adjusted | |||||||||||||||||
| Trade accounts receivable, net | $ | 286.9 | $ | 9.4 | $ | 296.3 | ||||||||||||||
| Inventories | 149.0 | 1.2 | 150.2 | |||||||||||||||||
| Prepaid expenses and other current assets | 27.2 | 38.2 | 65.4 | |||||||||||||||||
| Assets held for sale | 1,030.9 | (142.7) | 888.2 | |||||||||||||||||
| Property, plant and equipment, net | 227.4 | 34.9 | 262.3 | |||||||||||||||||
| Goodwill | 682.2 | (126.5) | 555.7 | |||||||||||||||||
| Intangible assets, net | 173.9 | (35.2) | 138.7 | |||||||||||||||||
| Other assets | 37.0 | 0.4 | 37.4 | |||||||||||||||||
| Trade accounts payable | (133.7) | (4.0) | (137.7) | |||||||||||||||||
| Other accrued expenses | (94.9) | (50.9) | (145.8) | |||||||||||||||||
| Liabilities held for sale | (390.9) | 169.4 | (221.5) | |||||||||||||||||
| Deferred tax liabilities | (102.3) | 98.1 | (4.2) | |||||||||||||||||
| Other long-term liabilities | (77.9) | 7.7 | (70.2) | |||||||||||||||||
| Purchase consideration, net of cash | $ | 1,814.8 | $ | — | $ | 1,814.8 | ||||||||||||||
Assets and liabilities held for sale are related to the Nexeo plastics distribution business. Nexeo Plastics was not aligned with the Company’s strategic objectives and on March 29, 2019, the business was sold for total proceeds of $664.3 million, net of cash disposed. Refer to “Note 4: Discontinued operations and dispositions” for further information.
The Company recorded $555.7 million of goodwill, consisting of $540.1 million in the USA segment, $3.8 million in Canada and $11.8 million in LATAM. The goodwill is primarily attributable to expected synergies from combining operations. The Company expects approximately $108.3 million of goodwill to be deductible for income tax purposes.
The identified intangible assets were related to plant maintenance, environmental contracting, environmental consultingcustomer relationships which have a weighted-average amortization period of ten years.
The Company assumed 50.0 million warrants, equivalent to 25.0 million Nexeo shares, with an estimated aggregate fair value of $26.0 million at the February 28, 2019 closing date. The warrants were converted into the right to receive, upon
49
exercise, the merger consideration consisting of approximately 7.6 million shares of Univar Solutions common stock plus cash. The warrants have an exercise price of $27.80 and will expire on June 9, 2021. The warrants as other long-term liabilities within the consolidated balance sheets. Refer to “Note 19: Fair value measurements” for more information.
The amounts of net sales and net income from continuing operations related to the Nexeo chemical distribution business, included in the Company’s consolidated statements of operations from March 1, 2019 to December 31, 2019 are as follows:
| (in millions) | ||||||||
| Net sales | $ | 1,489.3 | ||||||
| Net loss from continuing operations | (12.1) | |||||||
The following unaudited pro forma financial information combines the unaudited results of operations as if the acquisition of Nexeo had occurred at the beginning of the periods presented below and exclude the results of operations related to Nexeo Plastics, as this divestiture was reflected as discontinued operations. Refer to “Note 4: Discontinued operations and dispositions” for additional information.
| Three months ended December 31, | Year ended December 31, | |||||||||||||||||||||||||||||||||||||
| (in millions) | 2019 | 2018 | 2019 | 2018 | ||||||||||||||||||||||||||||||||||
| Net sales | $ | 2,155.0 | $ | 2,437.4 | $ | 9,612.9 | $ | 10,685.5 | ||||||||||||||||||||||||||||||
| Net (loss) income from continuing operations | (54.8) | (72.9) | (94.3) | 154.8 | ||||||||||||||||||||||||||||||||||
The pro forma financial information is for comparative purposes only and is not indicative of the results of operations that would have been achieved if the acquisition had taken place on January 1, 2018.
The unaudited pro forma information is based upon accounting estimates and judgments the Company believes are reasonable and reflects adjustments directly attributed to the business combination including amortization on acquired intangible assets, interest expense, transaction and acquisition related costs, depreciation related to purchase accounting fair value adjustments and the collectionrelated tax effects.
Year ended December 31, 2018
In the year ended December 31, 2018, the Company completed 2 acquisitions. On January 4, 2018, the Company completed a $7.5 million acquisition of Kemetyl Norge Industri AS (“Kemetyl”) as well as a definitive asset purchase agreement with Kemetyl Aktiebolag, leading distributors of chemical products in the Nordic region which provide bulk and disposalspecialty chemicals. On May 31, 2018, the Company completed a $13.3 million acquisition of Earthoil Plantations Limited (“Earthoil”), a supplier of pure, organic, fair trade essential and cold-pressed vegetable seed oils. The accounting for both hazardousacquisitions was completed in 2019.
4. Discontinued operations and non-hazardous waste products. Warehousing servicesdispositions
Discontinued operations
On March 29, 2019, the Company completed the sale of the Nexeo Plastics to an affiliate of One Rock Capital Partners, LLC (“Buyer”) for total proceeds of $664.3 million (net of cash disposed of $2.4 million), including $26.7 million for a working capital adjustment. The Nexeo preliminary purchase price allocation is primarily inclusive of blending, warehousing, logisticsthese working capital adjustments. Refer to “Note 3: Business combinations” for more information.
In connection with the transaction, the Company entered into a Transition Services Agreement (TSA), a Warehouse Service Agreement (WSA) and Real Property Agreements with the Buyer which are designed to ensure and facilitate an orderly transfer of business operations and will terminate at various times, between six and twenty-four months and can be renewed with a maximum of 2 twelve-month periods. The income and expense for the services will be reported as other operating expenses, net in the consolidated statements of operations. The Real Property Agreements will have a maximum tenure of 3 years. These arrangements do not constitute significant continuing involvement in the plastics distribution servicesbusiness.
The following table summarizes the operating results of the Company’s discontinued operations related to the sale described above for customers. Waste management and warehousing services are recognized over timethe year ended December 31, 2019, as presented in “Net income from discontinued operations” on the performance obligations are satisfied.consolidated statements of operations.
50
| (in millions) | Year Ended December 31, 2019 | |||||||
| External sales | $ | 156.9 | ||||||
| Cost of goods sold (exclusive of depreciation) | 136.7 | |||||||
| Outbound freight and handling | 3.5 | |||||||
| Warehousing, selling and administrative | 7.9 | |||||||
| Other expenses | 1.4 | |||||||
| Income from discontinued operations before income taxes | $ | 7.4 | ||||||
| Income tax expense from discontinued operations | 2.0 | |||||||
| Net income from discontinued operations | $ | 5.4 | ||||||
There were no significant non-cash operating activities from the Company’s discontinued operations related to obtain or fulfill contracts with customersthe plastics distribution business.
On December 31, 2019, the Company completed the sale of the Environmental Sciences business to obtain contracts when the contract term and benefit period is expected to be one year or less. Contract costs where the contract term and benefit period is expected to be more than a year are capitalized and amortized over the performance obligation period. Capitalized contract costsAEA Investors LP for total cash proceeds of $1.2$174.0 million (net of cash disposed of $0.7 million and $5.9 million areof transaction expenses) plus a $5.0 million ($2.4 million present value) subordinated note receivable (the “Transaction”) and subject to a working capital adjustment. The Company recorded a $41.4 million gain on sale of this business in the consolidated statements of operations and was included in other current assetsthe USA and other assetsCanada segments. The sale of the business did not meet the criteria to be classified as a discontinued operation in the Company’s financial statements because the disposition did not represent a strategic shift, that has, or will have, a major effect on the Company's operations and financial results.
The following summarizes the income before income taxes attributable to the Environmental Sciences business:
| Year ended December 31, | ||||||||||||||||||||||||||||||||
| (in millions) | 2019 | 2018 | 2017 | |||||||||||||||||||||||||||||
| Income before income taxes | $ | 28.6 | $ | 28.2 | $ | 28.7 | ||||||||||||||||||||||||||
5. Revenue
The Company disaggregates revenues with customers by both geographic segments and revenue contract types. Geographic reportable segmentation is pertinent to understanding Univar Solutions’ revenues, as it aligns to how the Company reviews the financial performance of December 31, 2018.its operations. Revenue contract types are differentiated by the type of good or service since the contractual terms necessary for revenue recognition are unique to each of the identified revenue contract types.
| (in millions) | USA | Canada | EMEA | LATAM | Consolidated | |||||||||||||||||||||||||||||||||||||||||||||||||||
| Year Ended December 31, 2019 | ||||||||||||||||||||||||||||||||||||||||||||||||||||||||
| Chemical Distribution | $ | 5,507.2 | $ | 852.8 | $ | 1,784.2 | $ | 443.7 | $ | 8,587.9 | ||||||||||||||||||||||||||||||||||||||||||||||
| Crop Sciences | — | 318.0 | — | — | 318.0 | |||||||||||||||||||||||||||||||||||||||||||||||||||
| Services | 321.3 | 47.0 | 1.3 | 11.4 | 381.0 | |||||||||||||||||||||||||||||||||||||||||||||||||||
| Total external customer net sales | $ | 5,828.5 | $ | 1,217.8 | $ | 1,785.5 | $ | 455.1 | $ | 9,286.9 | ||||||||||||||||||||||||||||||||||||||||||||||
| (in millions) | USA | Canada | EMEA | LATAM | Consolidated | |||||||||||||||||||||||||||||||||||||||||||||||||||
| Year Ended December 31, 2018 | ||||||||||||||||||||||||||||||||||||||||||||||||||||||||
| Chemical Distribution | $ | 4,775.2 | $ | 877.6 | $ | 1,974.4 | $ | 383.8 | $ | 8,011.0 | ||||||||||||||||||||||||||||||||||||||||||||||
| Crop Sciences | — | 381.6 | — | — | 381.6 | |||||||||||||||||||||||||||||||||||||||||||||||||||
| Services | 185.8 | 43.1 | 1.3 | 9.7 | 239.9 | |||||||||||||||||||||||||||||||||||||||||||||||||||
| Total external customer net sales | $ | 4,961.0 | $ | 1,302.3 | $ | 1,975.7 | $ | 393.5 | $ | 8,632.5 | ||||||||||||||||||||||||||||||||||||||||||||||
51
Deferred revenue
Deferred revenues are recognized as a contract liability when customers provide Univar Solutions with consideration prior to the Company satisfying a performance obligation. The following table provides information pertaining to the deferred revenue balance and account activity:
| (in millions) | ||||
| Deferred revenue as of January 1, 2018 | $ | 100.9 | ||
| Deferred revenue as of December 31, 2018 | 45.6 | |||
| Revenue recognized that was included in the deferred revenue balance at the beginning of the period | 100.3 | |||
| (in millions) | ||||||||
| Deferred revenue as of January 1, 2019 | $ | 45.6 | ||||||
| Deferred revenue as of December 31, 2019 | 65.5 | |||||||
| Revenue recognized that was included in the deferred revenue balance at the beginning of the period | 44.5 | |||||||
The deferred revenue balances are all expected to have a duration of one year or less and are recorded within the other accrued expenses line item of the consolidated balance sheet.
Other operating expenses, net consisted of the following items:
| Year ended December 31, | |||||||||||||||||||||||||||||
| (in millions) | 2019 | 2018 | 2017 | ||||||||||||||||||||||||||
| Acquisition and integration related expenses | $ | 152.1 | $ | 22.0 | $ | 3.1 | |||||||||||||||||||||||
| Stock-based compensation expense | 25.1 | 20.7 | 19.7 | ||||||||||||||||||||||||||
| Restructuring charges | 2.6 | 4.8 | 5.5 | ||||||||||||||||||||||||||
| Other employee severance costs | 31.2 | 16.4 | 8.1 | ||||||||||||||||||||||||||
Other facility closure costs (1) | 7.1 | — | — | ||||||||||||||||||||||||||
| (Gain) loss on sale of property, plant and equipment and other assets | (9.9) | 2.0 | (11.3) | ||||||||||||||||||||||||||
| Saccharin legal settlement | 62.5 | — | — | ||||||||||||||||||||||||||
| Business transformation costs | — | — | 23.4 | ||||||||||||||||||||||||||
| Other | 27.5 | 7.6 | 6.9 | ||||||||||||||||||||||||||
| Total other operating expenses, net | $ | 298.2 | $ | 73.5 | $ | 55.4 | |||||||||||||||||||||||
(1)Other facility closure costs includes $3.6 million recorded as an estimated withdrawal liability associated with a multi-employer pension plan related to an announced facility closure.
| Year ended December 31, | |||||||||||
| (in millions) | 2018 | 2017 | 2016 | ||||||||
| Stock-based compensation expense | $ | 20.7 | $ | 19.7 | $ | 10.4 | |||||
| Business transformation costs | — | 23.4 | 5.4 | ||||||||
| Restructuring charges | 4.8 | 5.5 | 6.5 | ||||||||
| Other employee termination costs | 16.4 | 8.1 | 1.5 | ||||||||
| Loss (gain) on sale of property, plant and equipment and other assets | 2.0 | (11.3 | ) | (0.7 | ) | ||||||
| Acquisition and integration related expenses | 22.0 | 3.1 | 5.5 | ||||||||
| Other | 7.6 | 6.9 | 8.6 | ||||||||
| Total other operating expenses, net | $ | 73.5 | $ | 55.4 | $ | 37.2 | |||||
Restructuring charges relate to the implementation of several regional strategic initiatives aimed at streamlining the Company’s cost structure and improving its operations. These actions primarily resulted in workforce reductions, lease termination costs and other facility rationalization costs. Restructuring charges are recorded in other operating expenses, net in the consolidated statement of operations.
2018 Restructuring
During the year ended December 31, 2018, the Company recordedmanagement approved a plan to consolidate departments resulting in restructuring charges of $3.2 million in USA, consisting of $3.1 million in employee terminationseverance costs and $0.1 million in other exit costs for employees impacted by a decisionand in Other, the Company recorded $0.9 million, relating to consolidate departments. Additionally,severance costs. In 2019, under the same program the Company recorded restructuring charges of $0.9$2.4 million in USA and $0.3 million in Other relating to employee terminationconsisting of severance costs. The Company expects to incur approximately $4.7$0.4 million of additional employee termination and other exit costsseverance over the next two yearsyear and expects this program to be substantially completed by 2020.
Also during the year ended December 31, 2018, the Company recorded restructuring charges of $0.9 million in EMEA relating to employee termination costs. The Company does not expect to incur materialrecorded restructuring charges of $0.1 million in facility exit costs induring the future related toyear ended December 31, 2019 and reduced its estimate by $0.2 million within employee termination costs for this restructuring program. The actions associated with this program are expected to be completed by the endcomplete as of December 31, 2019.
52
2014 to 2017 Restructuring
Between 2014 through 2017, management implemented several regional strategic initiatives aimed at streamlining the Company’s cost structure and improving its operations. Total cumulative charges recorded through December 31, 2018 for USA related to these restructuring programs were $39.5 million, which included $16.5 million in employee termination costs, $21.3 million in facility exit costs, and $1.7 million in other exit costs. The Company did not record restructuring charges for the programs during 2018. The actions associated with the restructuring programs were completed as of June 30, 2018, although administratively cash payments will be made into the future. During the year ended December 31, 2018, the Company reduced its estimate in the amount of $0.9 million within facility exit costs relating to a favorable lease buyout for USA.
| (in millions) | USA | Canada | EMEA | LATAM | Other | Total | |||||||||||||||||||||||||||||
| Employee termination costs | $ | 16.5 | $ | 5.7 | $ | 22.5 | $ | 6.2 | $ | 5.8 | $ | 56.7 | |||||||||||||||||||||||
| Facility exit costs | 21.3 | — | 3.7 | 0.2 | — | 25.2 | |||||||||||||||||||||||||||||
| Other exit costs | 1.7 | — | 6.6 | — | 0.8 | 9.1 | |||||||||||||||||||||||||||||
| Total | $ | 39.5 | $ | 5.7 | $ | 32.8 | $ | 6.4 | $ | 6.6 | $ | 91.0 | |||||||||||||||||||||||
The following tables summarize activity related to accrued liabilities associated with redundancy and restructuring:the restructuring liability:
| (in millions) | January 1, 2018 | Charge to earnings | Cash paid | Non-cash and other | December 31, 2018 | (in millions) | January 1, 2019 | Charge to earnings | Cash paid | Non-cash and other | December 31, 2019 | |||||||||||||||||||||||||||||||||||||
| Employee termination costs | $ | 3.0 | $ | 5.3 | $ | (3.4 | ) | $ | (0.7 | ) | $ | 4.2 | Employee termination costs | $ | 4.2 | $ | 2.5 | $ | (3.0) | $ | — | $ | 3.7 | |||||||||||||||||||||||||
| Facility exit costs | 10.2 | (0.7 | ) | (4.4 | ) | (0.1 | ) | 5.0 | Facility exit costs | 5.0 | 0.1 | (3.2) | — | 1.9 | ||||||||||||||||||||||||||||||||||
| Other exit costs | (0.5 | ) | 0.2 | (0.1 | ) | 0.6 | 0.2 | Other exit costs | 0.2 | — | — | — | 0.2 | |||||||||||||||||||||||||||||||||||
| Total | $ | 12.7 | $ | 4.8 | $ | (7.9 | ) | $ | (0.2 | ) | $ | 9.4 | Total | $ | 9.4 | $ | 2.6 | $ | (6.2) | $ | — | $ | 5.8 | |||||||||||||||||||||||||
| (in millions) | January 1, 2018 | Charge to earnings | Cash paid | Non-cash and other | December 31, 2018 | ||||||||||||||||||||||||
| Employee termination costs | $ | 3.0 | $ | 5.3 | $ | (3.4) | $ | (0.7) | $ | 4.2 | |||||||||||||||||||
| Facility exit costs | 10.2 | (0.7) | (4.4) | (0.1) | 5.0 | ||||||||||||||||||||||||
| Other exit costs | (0.5) | 0.2 | (0.1) | 0.6 | 0.2 | ||||||||||||||||||||||||
| Total | $ | 12.7 | $ | 4.8 | $ | (7.9) | $ | (0.2) | $ | 9.4 | |||||||||||||||||||
| (in millions) | January 1, 2017 | Charge to earnings | Cash paid | Non-cash and other | December 31, 2017 | ||||||||||||||
| Employee termination costs | $ | 6.9 | $ | 2.9 | $ | (7.2 | ) | $ | 0.4 | $ | 3.0 | ||||||||
| Facility exit costs | 13.2 | 2.8 | (5.5 | ) | (0.3 | ) | 10.2 | ||||||||||||
| Other exit costs | — | (0.2 | ) | (0.3 | ) | — | (0.5 | ) | |||||||||||
| Total | $ | 20.1 | $ | 5.5 | $ | (13.0 | ) | $ | 0.1 | $ | 12.7 | ||||||||
Restructuring liabilities of $5.9$5.3 million and $5.8$5.9 million were classified as current in other accrued expenses in the consolidated balance sheets as of December 31, 2018 and 2017, respectively. The long-term portion of restructuring liabilities of $3.5$0.5 million and $6.9$3.5 million were recorded in other long-term liabilities in the consolidated balance sheets as of December 31, 2019 and 2018, and 2017, respectively andrespectively. The long-term portion primarily consists of facility exit costs that are expected to be paid within the next five years.
While the Company believes the recorded restructuring liabilities are adequate, revisions to current estimates may be recorded in future periods based on new information as it becomes available.
53
8. Other expense, net
Other expense, net consisted of the following (losses) gains:
| Year ended December 31, | |||||||||||
| (in millions) | 2018 | 2017 | 2016 | ||||||||
Pension mark to market loss (1)(2) | $ | (34.2 | ) | $ | (3.8 | ) | $ | (68.6 | ) | ||
Pension curtailment and settlement gains (1) | — | 9.7 | 1.3 | ||||||||
Non-operating retirement benefits (1) | 11.0 | 9.9 | 15.3 | ||||||||
| Foreign currency transactions | (6.7 | ) | (4.6 | ) | (0.6 | ) | |||||
| Foreign currency denominated loans revaluation | (0.8 | ) | (17.9 | ) | (13.7 | ) | |||||
Undesignated foreign currency derivative instruments (3) | 1.1 | 0.3 | (1.8 | ) | |||||||
Undesignated interest rate swap contracts (3) | — | (2.2 | ) | 10.1 | |||||||
Debt refinancing costs (4) | — | (5.3 | ) | — | |||||||
| Other | (3.1 | ) | (3.5 | ) | (0.1 | ) | |||||
| Total other expense, net | $ | (32.7 | ) | $ | (17.4 | ) | $ | (58.1 | ) | ||
| Year ended December 31, | |||||||||||||||||||||||||||||
| (in millions) | 2019 | 2018 | 2017 | ||||||||||||||||||||||||||
Pension mark to market loss (1)(2) | $ | (50.4) | $ | (34.2) | $ | (3.8) | |||||||||||||||||||||||
Pension curtailment and settlement gains (1) | 1.3 | — | 9.7 | ||||||||||||||||||||||||||
Non-operating retirement benefits (1)(2) | 2.2 | 11.0 | 9.9 | ||||||||||||||||||||||||||
| Foreign currency transactions | (10.1) | (6.7) | (4.6) | ||||||||||||||||||||||||||
| Foreign currency denominated loans revaluation | 17.5 | (0.8) | (17.9) | ||||||||||||||||||||||||||
Undesignated foreign currency derivative instruments (3) | (23.7) | 1.1 | 0.3 | ||||||||||||||||||||||||||
Undesignated interest rate swap contracts (3) | (3.0) | — | (2.2) | ||||||||||||||||||||||||||
Debt refinancing costs (4) | (1.2) | — | (5.3) | ||||||||||||||||||||||||||
| Other | (3.1) | (3.1) | (3.5) | ||||||||||||||||||||||||||
| Total other expense, net | $ | (70.5) | $ | (32.7) | $ | (17.4) | |||||||||||||||||||||||
(2)Represents mark to market loss and non-operating retirement benefits for both the defined benefit pension and other postretirement benefit plans.
(3)Refer to “Note 20: Derivatives” for more information.
(4)Refer to “Note 18: Debt” for more information.
9. Income taxes
For financial reporting purposes, (loss) income (loss) before income taxes includes the following components:
| Year ended December 31, | Year ended December 31, | |||||||||||||||||||||||||||||||||||||||
| (in millions) | 2018 | 2017 | 2016 | (in millions) | 2019 | 2018 | 2017 | |||||||||||||||||||||||||||||||||
| Income (loss) before income taxes | ||||||||||||||||||||||||||||||||||||||||
| (Loss) income before income taxes | (Loss) income before income taxes | |||||||||||||||||||||||||||||||||||||||
| United States | $ | 36.6 | $ | 1.5 | $ | (131.3 | ) | United States | $ | (194.5) | $ | 36.6 | $ | 1.5 | ||||||||||||||||||||||||||
| Foreign | 185.6 | 167.3 | 51.7 | Foreign | 193.4 | 185.6 | 167.3 | |||||||||||||||||||||||||||||||||
| Total income (loss) before income taxes | $ | 222.2 | $ | 168.8 | $ | (79.6 | ) | |||||||||||||||||||||||||||||||||
| Total (loss) income before income taxes | Total (loss) income before income taxes | $ | (1.1) | $ | 222.2 | $ | 168.8 | |||||||||||||||||||||||||||||||||
The expense (benefit) for income taxes is summarized as follows:
| Year ended December 31, | |||||||||||||||||||||||||||||
| (in millions) | 2019 | 2018 | 2017 | ||||||||||||||||||||||||||
| Current: | |||||||||||||||||||||||||||||
| Federal | $ | 33.9 | $ | 13.8 | $ | 6.8 | |||||||||||||||||||||||
| State | 7.1 | 2.1 | 2.0 | ||||||||||||||||||||||||||
| Foreign | 39.2 | 31.2 | 28.5 | ||||||||||||||||||||||||||
| Total current | $ | 80.2 | $ | 47.1 | $ | 37.3 | |||||||||||||||||||||||
| Deferred: | |||||||||||||||||||||||||||||
| Federal | $ | 12.2 | $ | 6.5 | $ | 26.5 | |||||||||||||||||||||||
| State | 3.4 | (0.5) | — | ||||||||||||||||||||||||||
| Foreign | 8.7 | (3.2) | (14.8) | ||||||||||||||||||||||||||
| Total deferred | $ | 24.3 | $ | 2.8 | $ | 11.7 | |||||||||||||||||||||||
| Total income tax expense from continuing operations | $ | 104.5 | $ | 49.9 | $ | 49.0 | |||||||||||||||||||||||
54
| Year ended December 31, | |||||||||||
| (in millions) | 2018 | 2017 | 2016 | ||||||||
| Current: | |||||||||||
| Federal | $ | 13.8 | $ | 6.8 | $ | (0.1 | ) | ||||
| State | 2.1 | 2.0 | 0.1 | ||||||||
| Foreign | 31.2 | 28.5 | 20.4 | ||||||||
| Total current | $ | 47.1 | $ | 37.3 | $ | 20.4 | |||||
| Deferred: | |||||||||||
| Federal | $ | 6.5 | $ | 26.5 | $ | (15.1 | ) | ||||
| State | (0.5 | ) | — | (3.0 | ) | ||||||
| Foreign | (3.2 | ) | (14.8 | ) | (13.5 | ) | |||||
| Total deferred | $ | 2.8 | $ | 11.7 | $ | (31.6 | ) | ||||
| Total income tax expense (benefit) | $ | 49.9 | $ | 49.0 | $ | (11.2 | ) | ||||
| Year ended December 31, | |||||||||||||||||||||||||||||
| (in millions) | 2019 | 2018 | 2017 | ||||||||||||||||||||||||||
| US federal statutory income tax (benefit) expense applied to (loss) income before income taxes | $ | (0.2) | $ | 46.7 | $ | 59.1 | |||||||||||||||||||||||
| State income taxes, net of federal benefit | 10.7 | 1.1 | 1.4 | ||||||||||||||||||||||||||
| Foreign tax rate differential | 8.7 | 8.1 | (18.0) | ||||||||||||||||||||||||||
| Effect of flow-through entities | 30.6 | (0.6) | 8.9 | ||||||||||||||||||||||||||
| Distributions from foreign subsidiaries | 31.9 | 9.0 | 17.6 | ||||||||||||||||||||||||||
| Global intangible low-taxed income | 22.8 | 19.9 | — | ||||||||||||||||||||||||||
| Gain on disposal | 12.9 | — | — | ||||||||||||||||||||||||||
| Change in valuation allowance, net | (18.8) | (11.6) | (18.1) | ||||||||||||||||||||||||||
| Foreign tax credit | (13.5) | (38.3) | (47.6) | ||||||||||||||||||||||||||
| Fines and penalties | 5.6 | — | 0.2 | ||||||||||||||||||||||||||
| Non-deductible employee expenses | 4.4 | 3.9 | 2.5 | ||||||||||||||||||||||||||
| Non-deductible acquisition costs | 3.5 | 0.3 | 0.2 | ||||||||||||||||||||||||||
| Shareholder settlements | 2.7 | — | — | ||||||||||||||||||||||||||
| Withholding and other taxes based on income | 1.7 | 0.5 | 0.5 | ||||||||||||||||||||||||||
| Warrants | 1.5 | — | — | ||||||||||||||||||||||||||
| Change in statutory income tax rates | (1.1) | — | (17.5) | ||||||||||||||||||||||||||
| Adjustment to prior year due to change in estimate | 1.0 | (0.8) | (0.5) | ||||||||||||||||||||||||||
| Net stock-based compensation | 0.6 | — | (3.7) | ||||||||||||||||||||||||||
| Foreign exchange rate remeasurement | (0.4) | (0.2) | 0.3 | ||||||||||||||||||||||||||
| Unrecognized tax benefits | (0.3) | (2.7) | (1.7) | ||||||||||||||||||||||||||
| Non-deductible expense | 0.3 | 0.6 | 0.4 | ||||||||||||||||||||||||||
| 2017 US repatriation tax | — | 13.0 | 76.5 | ||||||||||||||||||||||||||
| Non-taxable interest income | — | (0.7) | (11.4) | ||||||||||||||||||||||||||
| Expiration of tax attributes | — | — | 0.1 | ||||||||||||||||||||||||||
| Foreign losses not benefited | — | — | 0.7 | ||||||||||||||||||||||||||
| Non-deductible interest expense | — | — | 0.1 | ||||||||||||||||||||||||||
| Other | (0.1) | 1.7 | (1.0) | ||||||||||||||||||||||||||
| Total income tax expense from continuing operations | $ | 104.5 | $ | 49.9 | $ | 49.0 | |||||||||||||||||||||||
| Effective income tax rate | (9,500.0) | % | 22.5 | % | 29.0 | % | |||||||||||||||||||||||
55
| Year ended December 31, | |||||||||||
| (in millions) | 2018 | 2017 | 2016 | ||||||||
| US federal statutory income tax expense (benefit) applied to income (loss) before income taxes | $ | 46.7 | $ | 59.1 | $ | (27.8 | ) | ||||
| State income taxes, net of federal benefit | 1.1 | 1.4 | (2.9 | ) | |||||||
| Foreign tax rate differential | 8.1 | (18.0 | ) | (5.8 | ) | ||||||
| Non-taxable interest income | (0.7 | ) | (11.4 | ) | (10.8 | ) | |||||
| Valuation allowance, net | (11.6 | ) | (18.1 | ) | (24.7 | ) | |||||
| Expiration of tax attributes | — | 0.1 | 4.4 | ||||||||
| Foreign losses not benefited | — | 0.7 | 8.0 | ||||||||
| Effect of flow-through entities | (0.6 | ) | 8.9 | (9.0 | ) | ||||||
| Net stock-based compensation | — | (3.7 | ) | 1.7 | |||||||
| Non-deductible expense | 4.8 | 3.5 | 3.4 | ||||||||
| Unrecognized tax benefits | (2.7 | ) | (1.7 | ) | (1.4 | ) | |||||
| Change in statutory income tax rates | — | (17.5 | ) | 2.7 | |||||||
| Deemed dividends from foreign subsidiaries | 9.0 | 17.6 | 1.4 | ||||||||
| Global intangible low-taxed income | 19.9 | — | — | ||||||||
| Non-deductible interest expense | — | 0.1 | 2.6 | ||||||||
| Revaluation due to Section 987 tax law change | — | — | 45.0 | ||||||||
| Section 965 repatriation tax | 13.0 | 76.5 | — | ||||||||
| Foreign tax credit | (38.3 | ) | (47.6 | ) | — | ||||||
| Other | 1.2 | (0.9 | ) | 2.0 | |||||||
| Total income tax expense (benefit) | $ | 49.9 | $ | 49.0 | $ | (11.2 | ) | ||||
The consolidated deferred tax assets and liabilities are detailed as follows:
| December 31, | |||||||
| (in millions) | 2018 | 2017 | |||||
| Deferred tax assets: | |||||||
| Net operating loss carryforwards | $ | 49.4 | $ | 68.6 | |||
| Environmental reserves | 22.9 | 25.3 | |||||
| Interest | 25.9 | 35.7 | |||||
| Tax credit and capital loss carryforwards | 57.8 | 37.2 | |||||
| Pension | 66.3 | 68.2 | |||||
| Flow-through entities | 2.7 | 2.5 | |||||
| Compensation | 12.2 | 13.7 | |||||
| Inventory | 4.5 | 4.2 | |||||
| Property, plant and equipment, net | 4.8 | 3.3 | |||||
| Other temporary differences | 17.0 | 15.1 | |||||
| Gross deferred tax assets | $ | 263.5 | $ | 273.8 | |||
| Valuation allowance | (106.3 | ) | (117.2 | ) | |||
| Deferred tax assets, net of valuation allowance | $ | 157.2 | $ | 156.6 | |||
| Deferred tax liabilities: | |||||||
| Property, plant and equipment, net | $ | (102.3 | ) | $ | (98.7 | ) | |
| Intangible assets | (63.6 | ) | (64.6 | ) | |||
| Other temporary differences | (9.4 | ) | (5.9 | ) | |||
| Deferred tax liabilities | $ | (175.3 | ) | $ | (169.2 | ) | |
| Net deferred tax liability | $ | (18.1 | ) | $ | (12.6 | ) | |
| December 31, | |||||||
| (in millions) | 2018 | 2017 | |||||
| Beginning balance | $ | 117.2 | $ | 167.9 | |||
| Change related to current net operating losses generated | — | 0.7 | |||||
| Change related to current utilization of net operating loss carryforwards | (3.7 | ) | (12.3 | ) | |||
| Change related to future utilization of net operating loss carryforwards | (17.4 | ) | (17.8 | ) | |||
| Change related to generation/expiration of tax attributes | 21.3 | 29.9 | |||||
| Change related to foreign currency | (1.3 | ) | 7.1 | ||||
| Change related to utilization of deferred interest expense | (9.7 | ) | (26.3 | ) | |||
| Change related to tax rate change | 0.1 | (31.6 | ) | ||||
| Change related to other items | (0.2 | ) | (0.4 | ) | |||
| Ending balance | $ | 106.3 | $ | 117.2 | |||
| December 31, | |||||||||||||||||
| (in millions) | 2019 | 2018 | |||||||||||||||
| Deferred tax assets: | |||||||||||||||||
| Net operating loss carryforwards (“NOLs”) | $ | 39.1 | $ | 49.4 | |||||||||||||
| Environmental reserves | 20.9 | 22.9 | |||||||||||||||
| Interest | 17.3 | 25.9 | |||||||||||||||
| Tax credit and capital loss carryforwards | 60.1 | 57.8 | |||||||||||||||
| Pension | 79.6 | 66.3 | |||||||||||||||
| Flow-through entities | — | 2.7 | |||||||||||||||
| Compensation | 16.0 | 12.2 | |||||||||||||||
| Inventory | 5.4 | 4.5 | |||||||||||||||
| Property, plant and equipment, net | 1.2 | 4.8 | |||||||||||||||
| Other temporary differences | 20.9 | 17.0 | |||||||||||||||
| Gross deferred tax assets | $ | 260.5 | $ | 263.5 | |||||||||||||
| Valuation allowance | (87.5) | (106.3) | |||||||||||||||
| Deferred tax assets, net of valuation allowance | $ | 173.0 | $ | 157.2 | |||||||||||||
| Deferred tax liabilities: | |||||||||||||||||
| Property, plant and equipment, net | $ | (111.7) | $ | (102.3) | |||||||||||||
| Intangible assets | (78.3) | (63.6) | |||||||||||||||
| Other temporary differences | (18.0) | (9.4) | |||||||||||||||
| Deferred tax liabilities | $ | (208.0) | $ | (175.3) | |||||||||||||
| Net deferred tax liability | $ | (35.0) | $ | (18.1) | |||||||||||||
As of December 31, 2018,2019, the total remaining tax benefit of available federal, state and foreign net operating loss carryforwards recognized on the balance sheet amounted to $33.4Company has approximately $39.1 million (tax benefiteffected) of operating losses of $49.4 million reduced by a valuation allowance of $16.0 million). Total net operating losses at December 31, 2018 and 2017 amounted to $186.4 million and $261.9 million, respectively. If not utilized, $19.0NOLs. Approximately $2.4 million of the available loss carryforwards will expire between 2019 and 2023; subsequent to 2023, $0.1 million will expire. The remaining losses of $167.3 million have an unlimited life. As of December 31, 2018, the Company also has foreign tax credit carryforwards of $55.3 million that if not utilizedNOLs will expire in 2027.
Tax Contingencies
The changes in unrecognized tax benefits included in other long-term liabilities, excluding interest and penalties, are as follows:
| Year ended December 31, | |||||||||||||||||
| (in millions) | 2019 | 2018 | |||||||||||||||
| Beginning balance | $ | 0.4 | $ | 3.1 | |||||||||||||
| Increase for tax positions of prior years related to acquired business | 1.3 | — | |||||||||||||||
| Reductions due to the statute of limitations expiration | (0.1) | (2.7) | |||||||||||||||
| Foreign exchange | (0.5) | — | |||||||||||||||
| Ending balance | $ | 1.1 | $ | 0.4 | |||||||||||||
56
Year ended December 31, | |||||||
| (in millions) | 2018 | 2017 | |||||
| Beginning balance | $ | 3.1 | $ | 4.3 | |||
| Increase for tax positions of prior years | — | — | |||||
| Reductions due to the statute of limitations expiration | (2.7 | ) | (1.5 | ) | |||
| Foreign exchange | — | 0.3 | |||||
| Ending balance | $ | 0.4 | $ | 3.1 | |||
The total liability included in other long-term liabilities associated with the interest and penalties wasCompany recognized $0.5 million, $0.1 million and $0.4 million at December 31, 2018 and 2017, respectively. The Company recorded $0.1 million, $0.4 million and $0.3 millionof interest and/or penalties related to income tax matters in interest expense related to unrecognized tax benefits in the consolidated statements of operations for the years ended December 31, 2019, 2018 and 2017, and 2016, respectively.
The Company files income tax returnshad $1.3 million and $1.1 million of interest and penalties reflected in the US and various state and foreign jurisdictions. Asconsolidated balance sheets as of December 31, 2019 and 2018, the Company is subject to various local or foreign examinations by the tax authorities.respectively.
The following table presents the basic and diluted earnings per share computations:
| Year ended December 31, | |||||||||||||||||||||||||||||
| (in millions, except per share data) | 2019 | 2018 | 2017 | ||||||||||||||||||||||||||
| Basic: | |||||||||||||||||||||||||||||
| Net (loss) income from continuing operations | $ | (105.6) | $ | 172.3 | $ | 119.8 | |||||||||||||||||||||||
| Net income from discontinued operations | 5.4 | — | — | ||||||||||||||||||||||||||
| Net (loss) income | $ | (100.2) | $ | 172.3 | $ | 119.8 | |||||||||||||||||||||||
| Less: earnings allocated to participating securities | — | 0.3 | 0.2 | ||||||||||||||||||||||||||
| Earnings (loss) allocated to common shares outstanding | $ | (100.2) | $ | 172.0 | $ | 119.6 | |||||||||||||||||||||||
| Weighted average common shares outstanding | 164.1 | 141.2 | 140.2 | ||||||||||||||||||||||||||
| Basic (loss) income per common share from continuing operations | $ | (0.64) | $ | 1.22 | $ | 0.85 | |||||||||||||||||||||||
| Basic income per common share from discontinued operations | 0.03 | — | — | ||||||||||||||||||||||||||
| Basic (loss) income per common share | $ | (0.61) | $ | 1.22 | $ | 0.85 | |||||||||||||||||||||||
| Diluted: | |||||||||||||||||||||||||||||
| Net (loss) income from continuing operations | $ | (105.6) | $ | 172.3 | $ | 119.8 | |||||||||||||||||||||||
| Net income from discontinued operations | 5.4 | — | — | ||||||||||||||||||||||||||
| Net (loss) income | $ | (100.2) | $ | 172.3 | $ | 119.8 | |||||||||||||||||||||||
| Less: earnings allocated to participating securities | — | — | — | ||||||||||||||||||||||||||
| Earnings (loss) allocated to common shares outstanding | $ | (100.2) | $ | 172.3 | $ | 119.8 | |||||||||||||||||||||||
| Weighted average common shares outstanding | 164.1 | 141.2 | 140.2 | ||||||||||||||||||||||||||
Effect of dilutive securities: stock compensation plans (2) | — | 1.0 | 1.2 | ||||||||||||||||||||||||||
| Weighted average common shares outstanding – diluted | 164.1 | 142.2 | 141.4 | ||||||||||||||||||||||||||
| Diluted (loss) income per common share from continuing operations | $ | (0.64) | $ | 1.21 | $ | 0.85 | |||||||||||||||||||||||
| Diluted income per common share from discontinued operations | 0.03 | — | — | ||||||||||||||||||||||||||
| Diluted (loss) income per common share | $ | (0.61) | $ | 1.21 | $ | 0.85 | |||||||||||||||||||||||
(1)Stock options to purchase 3.0 million, 1.6 million, and 0.8 million shares of common stock were outstanding during the years ended December 31, 2019, 2018 and 2017, respectively and restricted stock of 0.8 million in 2019 and nil in both 2018 and 2017 were outstanding, but were not included in the calculation of diluted (loss) income per share as the impact of these stock options would have been anti-dilutive. Diluted shares outstanding also did not include 6.4 million shares of common stock issuable on the exercise of warrants because the warrants were out-of-the-money during the year ended December 31, 2019.
57
| Year ended December 31, | |||||||||||
| (in millions, except per share data) | 2018 | 2017 | 2016 | ||||||||
| Basic: | |||||||||||
| Net income (loss) | $ | 172.3 | $ | 119.8 | $ | (68.4 | ) | ||||
| Less: earnings allocated to participating securities | 0.3 | 0.2 | — | ||||||||
| Earnings allocated to common shares outstanding | $ | 172.0 | $ | 119.6 | $ | (68.4 | ) | ||||
| Weighted average common shares outstanding | 141.2 | 140.2 | 137.8 | ||||||||
| Basic income (loss) per common share | $ | 1.22 | $ | 0.85 | $ | (0.50 | ) | ||||
| Diluted: | |||||||||||
| Net income (loss) | $ | 172.3 | $ | 119.8 | $ | (68.4 | ) | ||||
| Less: earnings allocated to participating securities | — | — | — | ||||||||
| Earnings allocated to common shares outstanding | $ | 172.3 | $ | 119.8 | $ | (68.4 | ) | ||||
| Weighted average common shares outstanding | 141.2 | 140.2 | 137.8 | ||||||||
| Effect of dilutive securities: | |||||||||||
Stock compensation plans (1) | 1.0 | 1.2 | — | ||||||||
| Weighted average common shares outstanding – diluted | 142.2 | 141.4 | 137.8 | ||||||||
Diluted income (loss) per common share (2) | $ | 1.21 | $ | 0.85 | $ | (0.50 | ) | ||||
Defined benefit pension plans
The Company sponsors defined benefit plans that provide pension benefits for employees upon retirement in certain jurisdictions including the US, Canada, United Kingdom and several other European countries.
The US, Canada and United Kingdom defined benefit pension plans are closed to new entrants. On July 1, 2015, the accrual of future service credits ceased in Canada although future salary increases continue for remaining participants. Benefits accrued by participants in the United Kingdom plan were frozen as of December 1, 2010 and benefits accrued by participants in the US plans were frozen as of December 31, 2009. These amendments to freeze benefits were made in conjunction with a benefit plan review which provides for enhanced benefits under defined contribution plans available to all employees in the US, Canada and United Kingdom.
The following summarizes the Company’s defined benefit pension plans’ projected benefit obligations, plan assets and funded status:
| Domestic | Foreign | Total | Domestic | Foreign | Total | |||||||||||||||||||||||||||||||||||||||||||||||||||||||||||||||||||||||
Year ended December 31, | Year ended December 31, | Year ended December 31, | Year ended December 31, | Year ended December 31, | Year ended December 31, | |||||||||||||||||||||||||||||||||||||||||||||||||||||||||||||||||||||||
| (in millions) | 2018 | 2017 | 2018 | 2017 | 2018 | 2017 | (in millions) | 2019 | 2018 | 2019 | 2018 | 2019 | 2018 | |||||||||||||||||||||||||||||||||||||||||||||||||||||||||||||||
| Change in projected benefit obligations: | Change in projected benefit obligations: | |||||||||||||||||||||||||||||||||||||||||||||||||||||||||||||||||||||||||||
| Actuarial present value of benefit obligations at beginning of year | $ | 721.9 | $ | 719.7 | $ | 612.0 | $ | 555.5 | $ | 1,333.9 | $ | 1,275.2 | Actuarial present value of benefit obligations at beginning of year | $ | 625.7 | $ | 721.9 | $ | 537.5 | $ | 612.0 | $ | 1,163.2 | $ | 1,333.9 | |||||||||||||||||||||||||||||||||||||||||||||||||||
| Service cost | — | — | 2.7 | 2.5 | 2.7 | 2.5 | Service cost | — | — | 2.4 | 2.7 | 2.4 | 2.7 | |||||||||||||||||||||||||||||||||||||||||||||||||||||||||||||||
| Interest cost | 27.3 | 30.8 | 15.4 | 16.2 | 42.7 | 47.0 | Interest cost | 27.2 | 27.3 | 15.6 | 15.4 | 42.8 | 42.7 | |||||||||||||||||||||||||||||||||||||||||||||||||||||||||||||||
| Benefits paid | (37.5 | ) | (34.2 | ) | (26.7 | ) | (27.9 | ) | (64.2 | ) | (62.1 | ) | Benefits paid | (33.5) | (37.5) | (28.4) | (26.7) | (61.9) | (64.2) | |||||||||||||||||||||||||||||||||||||||||||||||||||||||||
| Plan amendments | — | — | 2.5 | 2.7 | 2.5 | 2.7 | Plan amendments | — | — | — | 2.5 | — | 2.5 | |||||||||||||||||||||||||||||||||||||||||||||||||||||||||||||||
| Settlement | (38.5 | ) | (44.3 | ) | — | — | (38.5 | ) | (44.3 | ) | Settlement | — | (38.5) | — | — | — | (38.5) | |||||||||||||||||||||||||||||||||||||||||||||||||||||||||||
| Actuarial (gain) loss | (47.5 | ) | 49.9 | (33.6 | ) | 13.3 | (81.1 | ) | 63.2 | |||||||||||||||||||||||||||||||||||||||||||||||||||||||||||||||||||
| Curtailment | Curtailment | — | — | (1.3) | — | (1.3) | — | |||||||||||||||||||||||||||||||||||||||||||||||||||||||||||||||||||||
| Actuarial loss (gain) | Actuarial loss (gain) | 103.0 | (47.5) | 66.6 | (33.6) | 169.6 | (81.1) | |||||||||||||||||||||||||||||||||||||||||||||||||||||||||||||||||||||
| Foreign exchange and other | — | — | (34.8 | ) | 49.7 | (34.8 | ) | 49.7 | Foreign exchange and other | — | — | 21.6 | (34.8) | 21.6 | (34.8) | |||||||||||||||||||||||||||||||||||||||||||||||||||||||||||||
| Actuarial present value of benefit obligations at end of year | $ | 625.7 | $ | 721.9 | $ | 537.5 | $ | 612.0 | $ | 1,163.2 | $ | 1,333.9 | Actuarial present value of benefit obligations at end of year | $ | 722.4 | $ | 625.7 | $ | 614.0 | $ | 537.5 | $ | 1,336.4 | $ | 1,163.2 | |||||||||||||||||||||||||||||||||||||||||||||||||||
| Change in the fair value of plan assets: | Change in the fair value of plan assets: | |||||||||||||||||||||||||||||||||||||||||||||||||||||||||||||||||||||||||||
| Plan assets at beginning of year | $ | 532.3 | $ | 509.1 | $ | 574.9 | $ | 494.3 | $ | 1,107.2 | $ | 1,003.4 | Plan assets at beginning of year | $ | 428.6 | $ | 532.3 | $ | 522.2 | $ | 574.9 | $ | 950.8 | $ | 1,107.2 | |||||||||||||||||||||||||||||||||||||||||||||||||||
| Actual (loss) return on plan assets | (39.9 | ) | 80.0 | (19.7 | ) | 37.4 | (59.6 | ) | 117.4 | |||||||||||||||||||||||||||||||||||||||||||||||||||||||||||||||||||
| Actual return (loss) on plan assets | Actual return (loss) on plan assets | 86.6 | (39.9) | 77.3 | (19.7) | 163.9 | (59.6) | |||||||||||||||||||||||||||||||||||||||||||||||||||||||||||||||||||||
| Contributions by employer | 12.2 | 12.1 | 26.5 | 26.1 | 38.7 | 38.2 | Contributions by employer | 13.5 | 12.2 | 13.8 | 26.5 | 27.3 | 38.7 | |||||||||||||||||||||||||||||||||||||||||||||||||||||||||||||||
| Benefits paid | (37.5 | ) | (34.2 | ) | (26.7 | ) | (27.9 | ) | (64.2 | ) | (62.1 | ) | Benefits paid | (33.5) | (37.5) | (28.4) | (26.7) | (61.9) | (64.2) | |||||||||||||||||||||||||||||||||||||||||||||||||||||||||
| Settlement | (38.5 | ) | (34.7 | ) | — | (1.3 | ) | (38.5 | ) | (36.0 | ) | Settlement | — | (38.5) | — | — | — | (38.5) | ||||||||||||||||||||||||||||||||||||||||||||||||||||||||||
| Foreign exchange and other | — | — | (32.8 | ) | 46.3 | (32.8 | ) | 46.3 | Foreign exchange and other | — | — | 21.9 | (32.8) | 21.9 | (32.8) | |||||||||||||||||||||||||||||||||||||||||||||||||||||||||||||
| Plan assets at end of year | $ | 428.6 | $ | 532.3 | $ | 522.2 | $ | 574.9 | $ | 950.8 | $ | 1,107.2 | Plan assets at end of year | $ | 495.2 | $ | 428.6 | $ | 606.8 | $ | 522.2 | $ | 1,102.0 | $ | 950.8 | |||||||||||||||||||||||||||||||||||||||||||||||||||
| Funded status at end of year | $ | (197.1 | ) | $ | (189.6 | ) | $ | (15.3 | ) | $ | (37.1 | ) | $ | (212.4 | ) | $ | (226.7 | ) | Funded status at end of year | $ | (227.2) | $ | (197.1) | $ | (7.2) | $ | (15.3) | $ | (234.4) | $ | (212.4) | |||||||||||||||||||||||||||||||||||||||||||||
Net amounts related to the Company’s defined benefit pension plans recognized in the consolidated balance sheets consist of:
| Domestic | Foreign | Total | |||||||||||||||||||||||||||||||||||||||||||||||||||
| December 31, | December 31, | December 31, | |||||||||||||||||||||||||||||||||||||||||||||||||||
| (in millions) | 2019 | 2018 | 2019 | 2018 | 2019 | 2018 | |||||||||||||||||||||||||||||||||||||||||||||||
| Overfunded net benefit obligation in other assets | $ | — | $ | — | $ | 65.4 | $ | 46.1 | $ | 65.4 | $ | 46.1 | |||||||||||||||||||||||||||||||||||||||||
| Current portion of net benefit obligation in other accrued expenses | (3.5) | (3.5) | (2.1) | (2.0) | (5.6) | (5.5) | |||||||||||||||||||||||||||||||||||||||||||||||
| Long-term portion of net benefit obligation in pension and other postretirement benefit liabilities | (223.7) | (193.6) | (70.5) | (59.4) | (294.2) | (253.0) | |||||||||||||||||||||||||||||||||||||||||||||||
| Net liability recognized at end of year | $ | (227.2) | $ | (197.1) | $ | (7.2) | $ | (15.3) | $ | (234.4) | $ | (212.4) | |||||||||||||||||||||||||||||||||||||||||
58
| Domestic | Foreign | Total | |||||||||||||||||||||
| December 31, | December 31, | December 31, | |||||||||||||||||||||
| (in millions) | 2018 | 2017 | 2018 | 2017 | 2018 | 2017 | |||||||||||||||||
| Overfunded net benefit obligation in other assets | $ | — | $ | — | $ | 46.1 | $ | 33.9 | $ | 46.1 | $ | 33.9 | |||||||||||
| Current portion of net benefit obligation in other accrued expenses | (3.5 | ) | (3.5 | ) | (2.0 | ) | (2.1 | ) | (5.5 | ) | (5.6 | ) | |||||||||||
| Long-term portion of net benefit obligation in pension and other postretirement benefit liabilities | (193.6 | ) | (186.1 | ) | (59.4 | ) | (68.9 | ) | (253.0 | ) | (255.0 | ) | |||||||||||
| Net liability recognized at end of year | $ | (197.1 | ) | $ | (189.6 | ) | $ | (15.3 | ) | $ | (37.1 | ) | $ | (212.4 | ) | $ | (226.7 | ) | |||||
The following table summarizes defined benefit pension plans with accumulated benefit obligations in excess of plan assets:
| Domestic | Foreign | Total | Domestic | Foreign | Total | |||||||||||||||||||||||||||||||||||||||||||||||||||||||||||||||||||||||
| December 31, | December 31, | December 31, | December 31, | December 31, | December 31, | |||||||||||||||||||||||||||||||||||||||||||||||||||||||||||||||||||||||
| (in millions) | 2018 | 2017 | 2018 | 2017 | 2018 | 2017 | (in millions) | 2019 | 2018 | 2019 | 2018 | 2019 | 2018 | |||||||||||||||||||||||||||||||||||||||||||||||||||||||||||||||
| Accumulated benefit obligation | $ | 625.7 | $ | 721.9 | $ | 187.7 | $ | 211.4 | $ | 813.4 | $ | 933.3 | Accumulated benefit obligation | $ | 722.4 | $ | 625.7 | $ | 202.0 | $ | 187.7 | $ | 924.4 | $ | 813.4 | |||||||||||||||||||||||||||||||||||||||||||||||||||
| Fair value of plan assets | 428.6 | 532.3 | 147.7 | 169.3 | 576.3 | 701.6 | Fair value of plan assets | 495.2 | 428.6 | 155.0 | 147.7 | 650.2 | 576.3 | |||||||||||||||||||||||||||||||||||||||||||||||||||||||||||||||
The following table summarizes defined benefit pension plans with projected benefit obligations in excess of plan assets:
| Domestic | Foreign | Total | |||||||||||||||||||||
| December 31, | December 31, | December 31, | |||||||||||||||||||||
| (in millions) | 2018 | 2017 | 2018 | 2017 | 2018 | 2017 | |||||||||||||||||
| Projected benefit obligation | $ | 625.7 | $ | 721.9 | $ | 209.1 | $ | 240.3 | $ | 834.8 | $ | 962.2 | |||||||||||
| Fair value of plan assets | 428.6 | 532.3 | 147.7 | 169.3 | 576.3 | 701.6 | |||||||||||||||||
| Domestic | Foreign | Total | |||||||||||||||||||||||||||||||||||||||||||||||||||
| December 31, | December 31, | December 31, | |||||||||||||||||||||||||||||||||||||||||||||||||||
| (in millions) | 2019 | 2018 | 2019 | 2018 | 2019 | 2018 | |||||||||||||||||||||||||||||||||||||||||||||||
| Projected benefit obligation | $ | 722.4 | $ | 625.7 | $ | 227.7 | $ | 209.1 | $ | 950.1 | $ | 834.8 | |||||||||||||||||||||||||||||||||||||||||
| Fair value of plan assets | 495.2 | 428.6 | 155.0 | 147.7 | 650.2 | 576.3 | |||||||||||||||||||||||||||||||||||||||||||||||
The following table summarizes the components of net periodic benefit cost (income) recognized in the consolidated statements of operations related to defined benefit pension plans:
| Domestic | Foreign | Total | |||||||||||||||||||||||||||||||||
| Year ended December 31, | Year ended December 31, | Year ended December 31, | |||||||||||||||||||||||||||||||||
| (in millions) | 2018 | 2017 | 2016 | 2018 | 2017 | 2016 | 2018 | 2017 | 2016 | ||||||||||||||||||||||||||
Service cost (1) | $ | — | $ | — | $ | — | $ | 2.7 | $ | 2.5 | $ | 2.5 | $ | 2.7 | $ | 2.5 | $ | 2.5 | |||||||||||||||||
Interest cost (2) | 27.3 | 30.8 | 32.0 | 15.4 | 16.2 | 18.3 | 42.7 | 47.0 | 50.3 | ||||||||||||||||||||||||||
Expected return on plan assets (2) | (31.3 | ) | (30.9 | ) | (32.5 | ) | (25.1 | ) | (26.0 | ) | (28.7 | ) | (56.4 | ) | (56.9 | ) | (61.2 | ) | |||||||||||||||||
Amortization of unrecognized prior service cost (credits) (2) | — | — | — | 2.7 | (0.2 | ) | — | 2.7 | (0.2 | ) | — | ||||||||||||||||||||||||
Settlement (3) | — | (9.7 | ) | — | — | — | — | — | (9.7 | ) | — | ||||||||||||||||||||||||
Curtailment (3) | — | — | — | — | — | (1.3 | ) | — | — | (1.3 | ) | ||||||||||||||||||||||||
Actuarial loss (2) | 23.7 | 0.8 | 20.3 | 11.2 | 3.2 | 48.5 | 34.9 | 4.0 | 68.8 | ||||||||||||||||||||||||||
| Net periodic benefit cost (income) | $ | 19.7 | $ | (9.0 | ) | $ | 19.8 | $ | 6.9 | $ | (4.3 | ) | $ | 39.3 | $ | 26.6 | $ | (13.3 | ) | $ | 59.1 | ||||||||||||||
| Domestic | Foreign | Total | |||||||||||||||||||||||||||||||||||||||||||||||||||||||||||||||||||||||||||||||||||||||
| Year ended December 31, | Year ended December 31, | Year ended December 31, | |||||||||||||||||||||||||||||||||||||||||||||||||||||||||||||||||||||||||||||||||||||||
| (in millions) | 2019 | 2018 | 2017 | 2019 | 2018 | 2017 | 2019 | 2018 | 2017 | ||||||||||||||||||||||||||||||||||||||||||||||||||||||||||||||||||||||||||||||||
Service cost (1) | $ | — | $ | — | $ | — | $ | 2.4 | $ | 2.7 | $ | 2.5 | $ | 2.4 | $ | 2.7 | $ | 2.5 | |||||||||||||||||||||||||||||||||||||||||||||||||||||||||||||||||||||||
Interest cost (2) | 27.2 | 27.3 | 30.8 | 15.6 | 15.4 | 16.2 | 42.8 | 42.7 | 47.0 | ||||||||||||||||||||||||||||||||||||||||||||||||||||||||||||||||||||||||||||||||
Expected return on plan assets (2) | (25.1) | (31.3) | (30.9) | (20.1) | (25.1) | (26.0) | (45.2) | (56.4) | (56.9) | ||||||||||||||||||||||||||||||||||||||||||||||||||||||||||||||||||||||||||||||||
Amortization of unrecognized prior service cost (credits) (2) | — | — | — | 0.1 | 2.7 | (0.2) | 0.1 | 2.7 | (0.2) | ||||||||||||||||||||||||||||||||||||||||||||||||||||||||||||||||||||||||||||||||
Settlement (3) | — | — | (9.7) | — | — | — | — | — | (9.7) | ||||||||||||||||||||||||||||||||||||||||||||||||||||||||||||||||||||||||||||||||
Curtailment (3) | — | — | — | (1.3) | — | — | (1.3) | — | — | ||||||||||||||||||||||||||||||||||||||||||||||||||||||||||||||||||||||||||||||||
Actuarial loss (4) | 41.5 | 23.7 | 0.8 | 9.4 | 11.2 | 3.2 | 50.9 | 34.9 | 4.0 | ||||||||||||||||||||||||||||||||||||||||||||||||||||||||||||||||||||||||||||||||
| Net periodic benefit cost (income) | $ | 43.6 | $ | 19.7 | $ | (9.0) | $ | 6.1 | $ | 6.9 | $ | (4.3) | $ | 49.7 | $ | 26.6 | $ | (13.3) | |||||||||||||||||||||||||||||||||||||||||||||||||||||||||||||||||||||||
(1)Service cost is included in warehouse, selling and administrative expenses.
(2)These amounts are included in other expense, net, and represent non-operating retirement benefits.
(3)In 2017, the settlement gain is related to a lump sum offering accepted by participants. Both settlements and curtailments are included in other expense, net.
(4)Actuarial loss, or mark to market, includes measurement gains and losses resulting from changes since the prior measurement date in assumptions and plan experience as well as the difference between the expected and actual return on plan assets. These amounts are recorded in other expense, net.
The following summarizes pre-tax amounts included in accumulated other comprehensive lossAOCI at December 31, 20182019 related to pension plan amendments:
| (in millions) | Defined benefit pension plans | ||
| Net prior service cost | $ | (1.2 | ) |
| (in millions) | Defined benefit pension plans | ||||
| Net prior service cost | $ | (1.1) | |||
The following table summarizes the amounts in accumulated other comprehensive lossAOCI at December 31, 20182019 that are expected to be amortized as components of net periodic benefit cost (income) during the next fiscal year related to pension amendments:
| (in millions) | Defined benefit pension plans | ||
| Prior service cost | $ | (0.1 | ) |
| (in millions) | Defined benefit pension plans | ||||
| Prior service cost | $ | (0.1) | |||
Other postretirement benefit plan
59
Other postretirement benefits | |||||||
| Year ended December 31, | |||||||
| (in millions) | 2018 | 2017 | |||||
| Change in accumulated postretirement benefit obligations: | |||||||
| Actuarial present value of benefit obligations at beginning of year | $ | 2.5 | $ | 2.8 | |||
| Service cost | — | — | |||||
| Interest cost | — | 0.2 | |||||
| Contributions by participants | 0.5 | 0.4 | |||||
| Benefits paid | (0.5 | ) | (0.7 | ) | |||
| Actuarial gain | (0.7 | ) | (0.2 | ) | |||
| Actuarial present value of benefit obligations at end of year | $ | 1.8 | $ | 2.5 | |||
| Change in the fair value of plan assets: | |||||||
| Plan assets at beginning of year | $ | — | $ | — | |||
| Contributions by employer | — | 0.3 | |||||
| Contributions by participants | 0.5 | 0.4 | |||||
| Benefits paid | (0.5 | ) | (0.7 | ) | |||
| Plan assets at end of year | $ | — | $ | — | |||
| Funded status at end of year | $ | (1.8 | ) | $ | (2.5 | ) | |
Other postretirement benefits | |||||||
| December 31, | |||||||
| (in millions) | 2018 | 2017 | |||||
| Current portion of net benefit obligation in other accrued expenses | $ | (0.4 | ) | $ | (0.4 | ) | |
| Long-term portion of net benefit obligation in pension and other postretirement benefit liabilities | (1.4 | ) | (2.1 | ) | |||
| Net liability recognized at end of year | $ | (1.8 | ) | $ | (2.5 | ) | |
Other postretirement benefits | |||||||||||
| Year ended December 31, | |||||||||||
| (in millions) | 2018 | 2017 | 2016 | ||||||||
Service cost (1) | $ | — | $ | — | $ | — | |||||
Interest cost (2) | — | 0.2 | 0.1 | ||||||||
Amortization of unrecognized prior service credits (2) | — | — | (4.5 | ) | |||||||
Actuarial gain (2) | (0.7 | ) | (0.2 | ) | (0.2 | ) | |||||
| Net periodic benefit income | $ | (0.7 | ) | $ | — | $ | (4.6 | ) | |||
Actuarial assumptions
Defined benefit pension plans
The significant weighted average actuarial assumptions used in determining the benefit obligations and net periodic benefit cost (income) for the Company’s defined benefit plans are as follows:
| Domestic | Foreign | ||||||||||||||||||||||||||||||||||
| December 31, | December 31, | ||||||||||||||||||||||||||||||||||
| 2019 | 2018 | 2019 | 2018 | ||||||||||||||||||||||||||||||||
| Actuarial assumptions used to determine benefit obligations at end of period: | |||||||||||||||||||||||||||||||||||
| Discount rate | 3.28 | % | 4.47 | % | 2.14 | % | 2.92 | % | |||||||||||||||||||||||||||
| Expected annual rate of compensation increase | N/A | N/A | 2.85 | % | 2.85 | % | |||||||||||||||||||||||||||||
| Domestic | Foreign | ||||||||||
| December 31, | December 31, | ||||||||||
| 2018 | 2017 | 2018 | 2017 | ||||||||
| Actuarial assumptions used to determine benefit obligations at end of period: | |||||||||||
| Discount rate | 4.47 | % | 3.87 | % | 2.92 | % | 2.61 | % | |||
| Expected annual rate of compensation increase | N/A | N/A | 2.85 | % | 2.87 | % | |||||
| Domestic | Foreign | Domestic | Foreign | |||||||||||||||||||||||||||||||||||||||||||||||||||||||||||||||||||||||||
| Year ended December 31, | Year ended December 31, | Year ended December 31, | Year ended December 31, | |||||||||||||||||||||||||||||||||||||||||||||||||||||||||||||||||||||||||
| 2018 | 2017 | 2016 | 2018 | 2017 | 2016 | 2019 | 2018 | 2017 | 2019 | 2018 | 2017 | |||||||||||||||||||||||||||||||||||||||||||||||||||||||||||||||||
| Actuarial assumptions used to determine net periodic benefit cost (income) for the period: | Actuarial assumptions used to determine net periodic benefit cost (income) for the period: | |||||||||||||||||||||||||||||||||||||||||||||||||||||||||||||||||||||||||||
| Discount rate | 3.87 | % | 4.39 | % | 4.74 | % | 2.61 | % | 2.84 | % | 3.65 | % | Discount rate | 4.47 | % | 3.87 | % | 4.39 | % | 2.92 | % | 2.61 | % | 2.84 | % | |||||||||||||||||||||||||||||||||||||||||||||||||||
| Expected rate of return on plan assets | 6.75 | % | 7.00 | % | 7.50 | % | 4.43 | % | 5.01 | % | 6.18 | % | Expected rate of return on plan assets | 6.75 | % | 6.75 | % | 7.00 | % | 3.83 | % | 4.43 | % | 5.01 | % | |||||||||||||||||||||||||||||||||||||||||||||||||||
| Expected annual rate of compensation increase | N/A | N/A | N/A | 2.87 | % | 2.87 | % | 2.86 | % | Expected annual rate of compensation increase | N/A | N/A | N/A | 2.85 | % | 2.87 | % | 2.87 | % | |||||||||||||||||||||||||||||||||||||||||||||||||||||||||
Discount rates are used to measure benefit obligations and the interest cost component of net periodic benefit cost (income). The Company selects its discount rates based on the consideration of equivalent yields on high-quality fixed income investments at each measurement date. Discount rates are based on a benefit cash flow-matching approach and represent the rates at which the Company’s benefit obligations could effectively be settled as of the measurement date.
For domestic defined benefit plans, the discount rates are based on a hypothetical bond portfolio approach. The hypothetical bond portfolio is constructed to comprise AA-rated corporate bonds whose cash flow from coupons and maturities match the expected future plan benefit payments.
The discount rate for the foreign defined benefit plans are based on a yield curve approach. For plans in countries with a sufficient corporate bond market, the expected future benefit payments are matched with a yield curve derived from AA-rated corporate bonds, subject to minimum amounts outstanding and meeting other selection criteria. For plans in countries without a sufficient corporate bond market, the yield curve is constructed based on prevailing government yields and an estimated credit spread to reflect a corporate risk premium.
The expected long-term rate of return on plan assets reflects management’s expectations on long-term average rates of return on funds invested to provide for benefits included in the benefit obligations. The long-term rate of return assumptions are based on the outlook for equity and fixed income returns, with consideration of historical returns, asset allocations, investment strategies and premiums for active management when appropriate. Assumptions reflect the expected rates of return at the beginning of the year.
Plan assets
Plan assets for defined benefit plans are invested in global equity and debt securities through professional investment managers with the objective to achieve targeted risk adjusted returns and to maintain liquidity sufficient to fund current benefit payments. Each funded defined benefit plan has an investment policy that is administered by plan trustees with the objective of meeting targeted asset allocations based on the circumstances of that particular plan. The investment strategy followed by the Company varies by country
depending on the circumstances of the underlying plan. Less mature plan benefit obligations are funded by using more equity securities as they are expected to achieve long-term growth while exceeding inflation. More mature plan benefit obligations are funded using a higher allocation of fixed income securities as they are expected to produce current income with limited volatility. The Company has adopted a dynamic investment strategy whereby as the plan funded status improves, the investment strategy is migrated to more liability matching assets, and return seeking assets are reduced. Risk management practices include the use of multiple asset classes for diversification purposes. Specific guidelines for each asset class and investment manager are implemented and monitored.
60
The weighted average target asset allocation for defined benefit pension plans in the year ended December 31, 20182019 is as follows:
| Domestic | Foreign | Domestic | Foreign | |||||||||||||
| Asset category: | Asset category: | |||||||||||||||
| Equity securities | 50.0 | % | 28.2 | % | Equity securities | 50.0 | % | 15.3 | % | |||||||
| Debt securities | 45.0 | % | 66.1 | % | Debt securities | 45.0 | % | 79.3 | % | |||||||
| Other | 5.0 | % | 5.7 | % | Other | 5.0 | % | 5.4 | % | |||||||
| Total | 100.0 | % | 100.0 | % | Total | 100.0 | % | 100.0 | % | |||||||
Plan asset valuation methodologies are described below:
| Fair value methodology | Description | ||||
| Cash | This represents cash at banks at fair value. | ||||
| Investment funds | Values are based on the net asset value of the units held at year end. The net asset values are based on the fair value of the underlying assets of the funds, minus their liabilities, and then divided by the number of units outstanding at the valuation date. The funds are traded on private markets that are not active; however, the unit price is based primarily on observable market data of the fund’s underlying assets. | ||||
| Insurance contracts | The fair value is based on the present value of the accrued benefit. | ||||
Domestic defined benefit plan assets
| December 31, 2019 | |||||||||||||||||||||||||||||
| (in millions) | Total | Level 1 | Level 2 | ||||||||||||||||||||||||||
| Cash | $ | 2.5 | $ | 2.5 | $ | — | |||||||||||||||||||||||
Investments funds (1) | 492.7 | — | 492.7 | ||||||||||||||||||||||||||
| Total | $ | 495.2 | $ | 2.5 | $ | 492.7 | |||||||||||||||||||||||
(1)This category includes investments in 30.2%in US equities, 19.7%in non-US equities, 45.0%in US corporate bonds and 5.1% in other investments.
| December 31, 2018 | |||||||||||||||||||||||||||||
| (in millions) | Total | Level 1 | Level 2 | ||||||||||||||||||||||||||
| Cash | $ | 2.4 | $ | 2.4 | $ | — | |||||||||||||||||||||||
Investments funds (1) | 426.2 | — | 426.2 | ||||||||||||||||||||||||||
| Total | $ | 428.6 | $ | 2.4 | $ | 426.2 | |||||||||||||||||||||||
| December 31, 2017 | |||||||||||
| (in millions) | Total | Level 1 | Level 2 | ||||||||
| Cash | $ | 2.6 | $ | 2.6 | $ | — | |||||
Investments funds (1) | 529.7 | — | 529.7 | ||||||||
| Total | $ | 532.3 | $ | 2.6 | $ | 529.7 | |||||
(1)This category includes investments in 29.6% in US equities, 19.4% in non-US equities, 46.3% in US corporate bonds and 4.7% in other investments.
Foreign defined benefit plan assets
| December 31, 2018 | |||||||||||||||
| (in millions) | Total | Level 1 | Level 2 | Level 3 | |||||||||||
| Cash | $ | 9.7 | $ | 9.7 | $ | — | $ | — | |||||||
| Investments: | |||||||||||||||
Investment funds (1) | 494.0 | — | 494.0 | — | |||||||||||
| Insurance contracts | 18.5 | — | — | 18.5 | |||||||||||
| Total investments | $ | 512.5 | $ | — | $ | 494.0 | $ | 18.5 | |||||||
| Total | $ | 522.2 | $ | 9.7 | $ | 494.0 | $ | 18.5 | |||||||
| (in millions) | Insurance contracts | ||
| Balance at January 1, 2018 | $ | 18.2 | |
| Actual return to plan assets: | |||
| Related to assets still held at year end | 0.7 | ||
| Purchases, sales and settlements, net | 0.4 | ||
| Foreign exchange | (0.8 | ) | |
| Balance at December 31, 2018 | $ | 18.5 | |
The following summarizes the fair value of foreign plan assets by asset category and level within the fair value hierarchy:
| December 31, 2019 | |||||||||||||||||||||||||||||||||||||||||
| (in millions) | Total | Level 1 | Level 2 | Level 3 | |||||||||||||||||||||||||||||||||||||
| Cash | $ | 3.4 | $ | 3.4 | $ | — | $ | — | |||||||||||||||||||||||||||||||||
| Investments: | |||||||||||||||||||||||||||||||||||||||||
Investment funds (1) | 581.2 | — | 581.2 | — | |||||||||||||||||||||||||||||||||||||
| Insurance contracts | 22.2 | — | — | 22.2 | |||||||||||||||||||||||||||||||||||||
| Total investments | $ | 603.4 | $ | — | $ | 581.2 | $ | 22.2 | |||||||||||||||||||||||||||||||||
| Total | $ | 606.8 | $ | 3.4 | $ | 581.2 | $ | 22.2 | |||||||||||||||||||||||||||||||||
(1)This category includes investments in 2.1% in US equities, 14.1% in non-US equities, 13.5% in non-US corporate bonds, 68.6% in non-US government bonds and 1.7% in other investments.
61
| December 31, 2017 | |||||||||||||||
| (in millions) | Total | Level 1 | Level 2 | Level 3 | |||||||||||
| Cash | $ | 4.0 | $ | 4.0 | $ | — | $ | — | |||||||
| Investments: | |||||||||||||||
Investment funds (1) | 552.7 | — | 552.7 | — | |||||||||||
| Insurance contracts | 18.2 | — | — | 18.2 | |||||||||||
| Total investments | $ | 570.9 | $ | — | $ | 552.7 | $ | 18.2 | |||||||
| Total | $ | 574.9 | $ | 4.0 | $ | 552.7 | $ | 18.2 | |||||||
| (in millions) | Insurance contracts | ||||
| Balance at January 1, 2019 | $ | 18.5 | |||
| Actual return to plan assets: | |||||
| Related to assets still held at year end | 3.6 | ||||
| Purchases, sales and settlements, net | 0.5 | ||||
| Foreign exchange | (0.4) | ||||
| Balance at December 31, 2019 | $ | 22.2 | |||
| (in millions) | Insurance contracts | ||
| Balance at January 1, 2017 | $ | 15.6 | |
| Actual return on plan assets: | |||
| Related to assets still held at year end | 0.1 | ||
| Purchases, sales and settlements, net | 0.3 | ||
| Foreign exchange | 2.2 | ||
| Balance at December 31, 2017 | $ | 18.2 | |
| December 31, 2018 | |||||||||||||||||||||||||||||||||||||||||
| (in millions) | Total | Level 1 | Level 2 | Level 3 | |||||||||||||||||||||||||||||||||||||
| Cash | $ | 9.7 | $ | 9.7 | $ | — | $ | — | |||||||||||||||||||||||||||||||||
| Investments: | |||||||||||||||||||||||||||||||||||||||||
Investment funds (1) | 494.0 | — | 494.0 | — | |||||||||||||||||||||||||||||||||||||
| Insurance contracts | 18.5 | — | — | 18.5 | |||||||||||||||||||||||||||||||||||||
| Total investments | $ | 512.5 | $ | — | $ | 494.0 | $ | 18.5 | |||||||||||||||||||||||||||||||||
| Total | $ | 522.2 | $ | 9.7 | $ | 494.0 | $ | 18.5 | |||||||||||||||||||||||||||||||||
(1)This category includes investments in 8.0% in US equities, 17.5% in non-US equities, 34.2% in non-US corporate bonds, 36.3% in non-US government bonds and 4.0% in other investments.
Changes in the foreign plan assets valued using significant unobservable inputs (Level 3):
| (in millions) | Insurance contracts | ||||
| Balance at January 1, 2018 | $ | 18.2 | |||
| Actual return on plan assets: | |||||
| Related to assets still held at year end | 0.7 | ||||
| Purchases, sales and settlements, net | 0.4 | ||||
| Foreign exchange | (0.8) | ||||
| Balance at December 31, 2018 | $ | 18.5 | |||
Contributions
The Company expects to contribute approximately $13.4$19.4 million and $14.9$3.5 million to its domestic and foreign defined benefit pension plan funds in 2019,2020, respectively, including direct payments to plan participants in unfunded plans. The Company does not plan on making any discretionary contributions in 2019. In many countries, local pension protection laws have been put in place, which have introduced minimum funding requirements for qualified pension plans. As a result, the Company’s required funding of contributions to its pension plans may vary in the future.
Benefit payments
| Defined benefit pension plans | Other postretirement benefits | Defined benefit pension plans | ||||||||||||||||||||||||||||||||||||||||||
| (in millions) | Domestic | Foreign | Total | (in millions) | Domestic | Foreign | Total | |||||||||||||||||||||||||||||||||||||
| 2019 | $ | 33.9 | $ | 16.2 | $ | 50.1 | $ | 0.5 | ||||||||||||||||||||||||||||||||||||
| 2020 | 35.0 | 16.4 | 51.4 | 0.1 | 2020 | $ | 35.6 | $ | 17.5 | $ | 53.1 | |||||||||||||||||||||||||||||||||
| 2021 | 35.9 | 17.3 | 53.2 | 0.1 | 2021 | 36.7 | 17.1 | 53.8 | ||||||||||||||||||||||||||||||||||||
| 2022 | 36.8 | 19.4 | 56.2 | 0.1 | 2022 | 37.6 | 19.5 | 57.1 | ||||||||||||||||||||||||||||||||||||
| 2023 | 37.8 | 19.7 | 57.5 | 0.1 | 2023 | 38.5 | 19.4 | 57.9 | ||||||||||||||||||||||||||||||||||||
| 2024 | 2024 | 39.2 | 21.3 | 60.5 | ||||||||||||||||||||||||||||||||||||||||
| 2024 through 2028 | 198.9 | 112.3 | 311.2 | 0.3 | 2024 through 2028 | 204.1 | 115.6 | 319.7 | ||||||||||||||||||||||||||||||||||||