0001496048srt:MaximumMemberggp:A200LaFayetteMemberggp:EquipmentAndFixturesMember2020-01-012020-12-31
UNITED STATES
SECURITIES AND EXCHANGE COMMISSION
Washington, D.C. 20549
FORM 10-K
|
| | | | | | | |
| (MARK ONE) | | |
ý☒ | | ANNUAL REPORT PURSUANT TO SECTION 13 OR 15(d) OF THE SECURITIES EXCHANGE ACT OF 1934 |
For the fiscal year ended December 31, 20182020
or
|
| | | | | | | |
o☐ | | TRANSITION REPORT PURSUANT TO SECTION 13 OR 15(d) OF THE SECURITIES EXCHANGE ACT OF 1934 |
For the transition period from to
COMMISSION FILE NUMBER 1-34948
Brookfield Property REIT Inc.
(Exact name of registrant as specified in its charter)
|
| | | | | | | | | | |
Delaware | | | 27-2963337 |
| (State or other jurisdiction of incorporation or organization) | | 27-2963337
| (I.R.S. Employer Identification Number) |
| | | |
250 Vesey Street, 15th Floor | New York | NY | 10281-1023 |
| (Address of principal executive offices) | | 10281-1023
| (Zip Code) |
(212) 417-7000
(Registrant's telephone number, including area code)
Securities Registered Pursuant to Section 12(b) of the Act:
|
| | | | | | | |
| | |
Title of Each Class A Stock: | Trading Symbol (s) | Name of Each Exchange on Which Registered: |
| Class A Stock, $.01 par value | BPYU | NASDAQNasdaq Global Select Market |
| 6.375% Series A Cumulative Perpetual Redeemable Preferred Stock, par value $0.01 per share | BPYUP | Nasdaq Global Select Market |
Securities Registered Pursuant to Section 12(g) of the Act: 6.375% Series A Cumulative Redeemable Preferred StockNone
Indicate by check mark if the registrant is a well-known seasoned issuer, as defined in Rule 405 of the Securities Act. Yes ý☒ No o☐
Indicate by check mark if the registrant is not required to file reports pursuant to Section 13 or Section 15(d) of the Act. Yes o☐ No ý☒
Indicate by check mark whether the registrant (1) has filed all reports required to be filed by Section 13 or 15(d) of the Securities Exchange Act of 1934 during the preceding 12 months (or for such shorter period that the registrant was required to file such reports), and (2) has been subject to such filing requirements for the past 90 days. Yes ý☒ No o☐
Indicate by check mark whether the registrant has submitted electronically every Interactive Data File required to be submitted pursuant to Rule 405 of Regulation S-T (§ 232.405 of this chapter) during the preceding 12 months (or for such shorter period that the registrant was required to submit such files). Yes ý☒ No o☐
Indicate by check mark if disclosure of delinquent filers pursuant to Item 405 of Regulation S-K (§ 229.405 of this chapter) is not contained herein, and will not be contained, to the best of registrant's knowledge, in definitive proxy or information statements incorporated by reference in Part III of this Form 10-K or any amendment to this Form 10-K. o
Indicate by check mark whether the registrant is a large accelerated filer, an accelerated filer, a non-accelerated filer, a smaller reporting company or an emerging growth company. See definition of "accelerated"large accelerated filer", "large accelerated"accelerated filer", "smaller reporting company" and "emerging growth company" in Rule 12b-2 of the Exchange Act. |
| | | | | | | | | | |
| ☐ | | | | | | | | |
Large accelerated filerý | ☒ | Accelerated filero |
| ☐ | | Non-accelerated filero
| ☐ | Smaller reporting companyo |
| | ☐ | Emerging growth companyo |
If an emerging growth company, indicate by check mark if the registrant has elected not to use the extended transition period for complying with any new or revised financial accounting standards provided pursuant to Section 13(a) of the Exchange Act. o☐
Indicate by check mark whether the registrant has filed a report on and attestation to its management's assessment of the effectiveness of its internal control over financial reporting under Section 404(b) of the Sarbanes-Oxley Act (15 U.S.C. 7262(b)) by the registered public accounting firm that prepared or issued its audit report. ☒
Indicate by check mark whether the registrant is a shell company (as defined in Rule 12b-2 of the Act). Yes o☐ No ý☒
As of February 27, 2019,24, 2021, there were 103,279,492 shareswere 38,440,545 shares of the registrant's Class A stock outstanding.
DOCUMENTS INCORPORATED BY REFERENCE
PortionsAs of June 30, 2020, the aggregate market value of the proxy statement forregistrant’s Class A stock held by non-affiliates was approximately $517.2 million based on the annual stockholders meetingclosing price of $9.96 as reported on the Nasdaq Global Select Market. For this computation, the registrant has excluded the market value of all shares of its Class A stock reported as beneficially owned by executive officers and directors of the registrant. Such exclusion shall not be deemed to be held on June 19, 2019 are incorporated by reference into Part III.
constitute an admission that any such person is an affiliate of the registrant.
Brookfield Property REIT Inc.
Annual Report on Form 10-K
December 31, 20182020
TABLE OF CONTENTS
PART I
ITEM 1. BUSINESS
The following discussion should be read in conjunction with the Consolidated Financial Statements of Brookfield Property REIT Inc., formerly known as GGP Inc. ("BPR"BPYU" or the "Company"), and related notes, as included in this Annual Report on Form 10-K (this "Annual Report"). The terms "we", "us" and "our" may also be used to refer to BPRBPYU and its subsidiaries. BPR,BPYU, a Delaware corporation, was organized in July 2010 and is an externally-managed real estate investment trust, referred to as a "REIT". BPRBPYU is a subsidiary of Brookfield Property Partners L.P. ("BPY").
As described in Note 1 to the Consolidated Financial Statements, onOn July 26, 2018, the Company’s stockholders approved a series of transactions (collectively, the "BPY Transaction") pursuant to which, among other things, (i) BPY would exchange all of its shares of the Company’s common stock owned by certain affiliates of BPY and any subsidiary of the Company for shares of a newly authorized series of preferred stock of the Company designated Series B Preferred Stock (the "Class B Exchange"), (ii) the Company’s certificate of incorporation would be amended and restated to, among other things, change the Company’s name from GGP Inc. to Brookfield Property REIT Inc. and authorize the issuance of Class A Stock, par value $0.01 per share ("Class A Stock"), Class B-1 Stock, par value $0.01 per share ("Class B-1 Stock") and Class C Stock, par value $0.01 per share ("Class C Stock") and to provide the terms governing the Series B Preferred Stock and Class B-1 Stock (collectively, "Class B Stock"),such stock, and (iii) a special dividend would be paid to all holders of record of the Company’s common stock (not including holders of restricted stock, but including certain holders of options who arewere deemed stockholders) following the Class B Exchange (the "Pre-Closing Dividend"). The Pre-Closing Dividend would consist of a distribution of up to $23.50 in cash or a choice of either one BPY limited partnership unit ("BPY unit") or one share of Class A Stock, subject to proration in each case, based on an aggregate cash consideration amount of $9.25 billion. Each share of Class A Stock would be intended to provide an economic return equivalent to one BPY unit, and would be exchangeable for one BPY unit or its cash equivalent (the form of payment to be determined by BP US REIT LLC ("BPUS"), an affiliate of BPY, in its sole discretion).equivalent. The BPY Transaction was completed on August 28, 2018. All references in this report to "BPR""BPYU" or the "Company" prior to such date refer to the Company prior to the effect of the BPY Transaction.
On January 4, 2021, Brookfield Asset Management Inc. ("Brookfield Asset Management" or "BAM") announced a proposal to BPY to acquire all of the limited partnership units of BPY ("BPY units") that it does not already own at a value of $16.50 per BPY unit, or $5.9 billion in total value (the "BAM Proposal"). Under the BAM Proposal, BPY unitholders would have the ability to elect to receive, per BPY unit, a combination of (i) 0.40 BAM Class A limited voting shares ("Brookfield Shares"), (ii) $16.50 in cash, and/or (iii) 0.66 of BPY preferred units with a liquidation preference of $25.00 per unit ("New Preferred Units"), subject in each case to pro-ration based on a maximum of $59.5 million Brookfield Shares (42% of the total value of BPY Units), maximum cash consideration of $2.95 billion (50% of the total value of BPY Units), and a maximum value of $500 million in New Preferred Units (8% of the total value of the Units. If unitholders collectively elect to receive in excess of $500 million in New Preferred Units, the amount of New Preferred Units can increase to a maximum of $1 billion, offset against the maximum amount of Brookfield Shares. The maximum amount of cash consideration would not be affected.
Under the BAM Proposal, holders of Class A stock would be entitled to receive the same per share consideration as BPY unitholders upon exchange of their shares into BPY units. It is also expected that the BPYU 6.375% Series A Cumulative Redeemable Preferred Stock would be redeemed at its par value of $25.00 per share in connection with the proposed transaction. The board of directors of the BPY General Partner has established a special committee to evaluate and respond to the BAM Proposal.
Our Company and Strategy
Our primary business is owning and operating best-in-class retail properties that provide an outstanding environment and experience for our communities, retailers, consumers and stockholders. BPR (NASDAQ: BPR)BPYU (Nasdaq: BPYU) is a subsidiary of BPY (NASDAQ:(Nasdaq: BPY; TSX: BPY.UN); one of the world’s largest commercial real estate companies, with approximately $87 $88 billion in total assets. BPR'sBPYU's Class A Stock was created as a public security that is intended to offer economic equivalence to an investment in BPY in the form of a U.S. REIT stock. BPY owns and operates iconic properties in the world’s major markets and its global portfolio includes office, retail, multifamily, logistics, hospitality, triple net lease, manufactured housing, mixed-use and student housing.
We ownAlthough BPYU only owns a subset of BPY’s portfolio, namely its Core Retail portfolio, shares of Class A Stock have been structured to provide an economic return equivalent to that of BPY units and therefore the market price of the Class A Stock will be significantly impacted by the combined business performance of BPY as a whole and the market price of the BPY units. In making an investment decision relating to BPYU’s securities, you should carefully consult the documents prepared by BPY. See "Available Information" and Item 5 "Market for Registrants Common Equity, Related Stockholder Matters and Insider Purchases of Equity Securities" for further information regarding BPY, including trading information with respect to BPY’s units.
BPYU directly owns a property portfolio comprised primarily of Class A retail properties (defined primarily by sales per square foot). As of December 31, 2018,2020, we own,owned, either entirely or with joint venture partners, 124121 retail properties located throughout the United States comprising approximately 121120 million square feet of gross leasable area ("GLA").
Our primary objective is to be an owner and operator of best-in-class retail properties that provide an outstanding environment and experience for our communities, retailers and consumers. We aim to operate our business to achieve this objective with a long term view and will continue to make decisions with that in mind, however, we will caution that in light of the novel coronavirus pandemic ("COVID-19" or "the global economic shutdown" or the "shutdown") and its impact on the global economy, we may be unable to achieve these objectives in the near term.
Our strategy includes:
•increasing the permanent occupancy of our regional mall portfolio by converting temporary leases to permanent leases and leasing vacant space;
•renewing or replacing expiring leases at greater rental rates;
•actively recycling capital through the disposition of assets, and investing in whole or partial interests in high-quality regional malls, anchor pads and our development pipeline and repaying debt; and
•continuing to execute on our existing redevelopment projects and seeking additional opportunities within our portfolio for redevelopment.
As of December 31, 2018,2020, our portfolio was 96.5%92.5% leased, compared to 96.7%96.4% leased at December 31, 2017.2019. On a suite-to-suite basis, the leases commencing in the trailing 12 months exhibited initial rents that were 10.6%1.1% higher than the final rents paid on expiring leases.
A portion of our portfolio is owned through joint venture, partnership or other arrangements with institutional partners. Prospectively, as we recycle capital, our preference is to sell down interests in assets to institutional partners and to continue to manage the assets on behalf of ourselves and the investors. We believe that this strategy enables us to enhance returns on our capital through associated fees, which represent an important area of growth.
Our redevelopment pipeline is a significant component of value of our business. We have redevelopment activities with an estimated cost to the company totaling approximately $449.0 million in the pipeline. We continue to evaluate a number of other redevelopment projects to further enhance the quality of our assets.
Segments
We operateBPYU operates in a single reportable segment, which includes the operation, development and management of retail and other rental properties. Our portfolio is targeted to a range of market sizes and consumer tastes. Each of our operating properties is considered a separate operating segment, as each property earns revenues and incurs expenses, individual property operating results are reviewed and discrete financial information is available. The Company's chief operating decision maker is comprised of a team of several members of executive management who use property operations in assessing segment operating performance. We do not distinguish or group our consolidated operations based on geography, size or type for purposes of making property operating decisions. Our operating properties have similar economic characteristics and provide similar products and services to our tenants. There are no individual operating segments that are greater than 10% of combined revenue or combined assets. When assessing segment operating performance, certain non-cash and non-comparable items such as straight-line rent, depreciation expense and intangible asset and liability amortization, are excluded from property operations, which are a result of our emergence, acquisition accounting and other capital contribution or restructuring events. Further, all material operations are within the United States and no customer or tenant comprises more than 10% of consolidated revenues. As a result, the Company's operating properties are aggregated into a single reportable segment.
Customers
For the year ended December 31, 2018,2020, our largest tenant, L Brands, Inc. (based on common parent ownership), accounted for approximately 3.8%4.1% of rents. Our three largest tenants, L Brands, Inc., Foot Locker, Inc., and The Gap, Inc.,LVMH, in aggregate, comprised approximately 9.2%10.1% of rents.
Competition
Competition within the retail property sector is strong. We compete for tenants and visitors to our malls with other malls in close proximity as well as online retailers. We believe the high-quality nature of our properties enables us to compete effectively for retailers and consumers. In order to maintain and increase our competitive position within a marketplace we:
•strategically locate tenants within each property to achieve a merchandising strategy that promotes traffic, cross-shopping and maximizes sales;
•introduce new concepts to the property which may include restaurants, theaters, grocery stores, first-to-market retailers, and e-commerce retailers;
•utilize our properties with the opportunities to add other potential uses such as residential, hospitality and office space to complement our retail experience;
•invest capital to provide the right environment for our tenants and consumers, including aesthetic, technological, and infrastructure improvements; and
•ensure our properties are clean, secure and comfortable.
Governmental Regulations
Compliance with various governmental regulations has an impact on the Company's business, including its capital expenditures, earnings and competitive position, which can be material. The Company incurs costs to monitor, and takes actions to comply with, governmental regulations that are applicable to its business, which include, among others, federal securities laws and regulations, applicable stock exchange requirements, REIT and other tax laws and regulations, environmental and health and safety laws and regulations, local zoning, usage and other regulations relating to real property, the Americans with Disabilities Act of 1990 and related laws and regulations.
See Item“Item 1A - "Risk Factors"Risk Factors” for additionala discussion of ourmaterial risks to the Company, including, to the extent material, to its competitive environment.
Environmental Matters
Under various federal, state or local laws, ordinancesposition, relating to governmental regulations, and regulations,see “Item 7. Management's Discussion and Analysis of Financial Condition and Results of Operation” together with the Company's Consolidated Financial Statements, including the related notes included therein, for a discussion of material information relevant to an owner of real estate may be liable for the costs of remediation of certain hazardous or toxic substances on such real estate. These laws may impose liability without regard to whether the owner knewassessment of the presence of such hazardous or toxic substances. The costs of remediation may be substantial and may adversely affect the owner's ability to sell or borrow against such real estate as collateral. In connection with the ownership and operation of our properties, we, or the relevant joint venture through which the property is owned, may be liable for such costs.
Substantially all of our properties have been subject to a Phase I environmental site assessment, which is intended to evaluate the environmental condition of the subject property and its surroundings. Phase I environmental assessments typically include a historical review, a public records review, a site visit and interviews, but do not include sampling or subsurface investigations.
As of December 31, 2018, the Phase I environmental site assessments have not revealed any environmental conditions that would have a material adverse effect on our overall business,Company's financial condition orand results of operations. However, it is possibleoperations, including, to the extent material, the effects that compliance with governmental regulations may have upon its capital expenditures and earnings.
these assessments do not reveal all potential environmental liabilities or that conditions have changed since the assessment was prepared (typically, at the time the property was purchased or developed).
See Risk Factors regarding additional discussion of environmental matters.
Seasonality
Although we haveBPYU has a year-long temporary leasing program, occupancies for short-term tenants and, therefore, rental income recognized, are higher during the fourth quarter of the year. In addition, the majority of our tenants have December or January lease years for purposes of calculating annual overage rent amounts. Accordingly, overage rent thresholds are most commonly achieved in the fourth quarter. As a result, revenue production is generally highest in the fourth quarter of each year.
EmployeesHuman Capital
While certain of our subsidiaries have employees, BPRBPYU does not have any employees. BPRBPYU has entered into a Master Services Agreement dated August 27, 2018, among Brookfield Asset Management, Inc. ("Brookfield Asset Management" or “BAM”), the Company and certain other parties thereto (the “Master"Master Services Agreement”Agreement") pursuant to which each service provider and certain other affiliates of Brookfield Asset Management provide, or arrange for other service providers to provide, day-to-day management and administrative services for our Company. See Exhibit 10.3710.16 for this Master Service Agreement.
Insurance
We haveBPYU has comprehensive liability, property and rental loss insurance with respect to our portfolio of properties. We believe that such insurance provides adequate coverage.
See Item 1A - "Risk Factors" for additional discussion of insurance matters.
Qualification as a REIT
BPYU intends to maintain REIT status, and therefore our operations generally will not be subject to federal income tax on real estate investment trust taxable income. A schedule detailing the taxability of dividends for 2018, 20172020, 2019 and 20162018 has been presented in Note 7.8.
Available Information
OurInformation regarding BPY can be accessed on its Internet website addressat bpy.brookfield.com and information regarding BPYU can be accessed on its Internet website at bpy.brookfield.com/bpyu. BPY is http://www.bpy.brookfield.com/bpr. Oursubject to the information and periodic reporting requirements of the Exchange Act and fulfills the obligations with respect to those requirements by filing reports with the Securities and Exchange Commission (the "SEC"). In addition, BPY is required to file documents with the securities regulatory authority in each of the provinces and territories in Canada. Annual Reports, on Form 10-K, Quarterly Reports, on Form 10-Q, Interactive Data Files and amendments to those reportsother SEC filings for both BPY and BPYU are available and may be accessed free of charge through the Investors section of ourtheir respective Internet websitewebsites under the "Reports & Filings" subsection, as soon as reasonably practicable after those documents are filed with, or furnished to, the SEC. OurBPY’s and BPYU’s Internet websitewebsites and included or linked information on the websitewebsites are not intended to be incorporated into this Annual Report. The SEC maintains an Internet site that contains reports, proxy and information statements, and other information regarding issuers that file electronically with the SEC, which can be accessed at http://www.sec.gov. In addition, BPY’s filings are electronically available from the Canadian System for Electronic Document Analysis and Retrieval (SEDAR), at www.sedar.com, the Canadian equivalent of the SEC electronic document gathering and retrieval system.
The information found on, or accessible through, the website set forth above is not incorporated into and does not form a part of this Form 10-K.
ITEM 1A. RISK FACTORS
You should carefully consider the following factors in addition to the other information set forth in this Form 10-K. If any of the following risks actually occur, our business, financial condition and results of operations and the value of the Class A Stock securities would likely suffer. Each share of Class A Stock has been structured with the intention of providing an economic return equivalent to one BPY unit. We therefore expect that the market price of the Class A Stock will be significantly impacted by the market price of the BPY units and the combined business performance of BPY as a whole. In addition to carefully considering the risks factors contained in this Annual Report relating to BPYU’s assets, organizational structure and securities, you should carefully consider the risk factors applicable to BPY’s business and an investment in BPY units, which are included in BPY’s Annual Report on Form 20-F. For additional information regarding BPY, see "Our Company and Strategy" and "Available Information".
Organization and Ownership Risks
Class A Stock may not trade at the same price as the BPY units.
Although the Class A Stock is intended to provide an economic return that is equivalent to BPY units, there can be no assurance
that the market price of Class A Stock will be equal to the market price of BPY units at any time. Factors that could cause differences in such market prices may include:
•perception and/or recommendations by analysts, investors and/or other third parties that these securities should be priced differently;
•actual or perceived differences in distributions to holders of Class A Stock versus BPY unitholders, including as a result of any legal prohibitions;
•business developments or financial performance or other events or conditions that may be specific to only BPYU or BPY; and
•difficulty in the exchange mechanics between Class A Stock and BPY units, including the potential expiration or termination of the Rights Agreement, dated as of April 27, 2018 by and between BAM and Wilmington Trust, National Association, in accordance with its terms.
Holders of Class A Stock may not receive the same distributions as holders of BPY units, and, accordingly, may not receive the intended economic equivalence of the securities.
BPYU intends to pay identical distributions in respect of the Class A Stock as BPY distributes to BPY unitholders. However, unforeseen circumstances (including legal prohibitions) may prevent the same distributions from being paid on each security. Accordingly, there can be no assurance that distributions will be identical for Class A Stock and BPY units in the future, which may impact the market price of these securities.
If a sufficient amount of Class A Stock is exchanged for BPY units, then Class A Stock may be de-listed.
Shares of Class A Stock began trading on Nasdaq following the consummation of the BPY Transaction. However, if a sufficient amount of Class A Stock is exchanged for BPY units, BPYU may fail to meet the minimum listing requirements on the Nasdaq and Nasdaq may take steps to de-list the Class A Stock. This, in turn, would have a significant adverse effect on the liquidity of the Class A Stock, and holders thereof may not be able to exit their investments on favorable terms, or at all.
Additionally, if the market capitalization of Class A Stock (i.e., if the price per share of Class A Stock, multiplied by the number of shares of Class A Stock outstanding) averages less than $1,000,000,000 over any period of thirty (30) consecutive trading days, the Company's Board of Directors will have the right to liquidate BPYU’s assets and wind up BPYU’s operations, which we refer to as a market capitalization liquidation event. Upon any market capitalization liquidation event, and subject to the prior rights of holders of the BPYU Series A Preferred Stock and after the payment in full to any holder of BPYU Class A Stock that has exercised its exchange rights, the holders of Class A Stock shall be entitled to a cash amount, for each share of Class A Stock, equal to the dollar volume-weighted average price of one BPY unit over the ten (10) trading days immediately following the public announcement of such market capitalization liquidation event, plus all declared and unpaid dividends. If, upon any such market capitalization liquidation event, the assets of BPYU are insufficient to make such payment in full, then the assets of BPYU will be distributed among the holders of Class A Stock ratably in proportion to the full amounts to which they would otherwise be respectively entitled to receive. Notwithstanding the foregoing, upon any market capitalization liquidation event, BPY or an affiliate of BPY may elect to exchange all of the outstanding shares of Class A Stock for BPY units on a one-for-one basis. This initial one-for-one conversion factor is subject to adjustment in the event of certain dilutive or other capital events by BPY or BPYU. Such a forced exchange of the Class A Stock for cash or BPY units could have a negative impact on the BPYU stockholder’s investment, including adverse tax consequences.
The market price of Class A Stock and BPY units may be volatile, and holders of Class A Stock could lose a significant portion of their investment due to drops in the market price of Class A Stock.
The market price of shares of Class A Stock and BPY units may be volatile, and holders of Class A Stock may not be able to resell their shares at or above the implied price at which they acquired such securities due to fluctuations in the market price of Class A Stock, including changes in market price caused by factors unrelated to BPYU or BPY’s operating performance or prospects. Specific factors that may have a significant effect on the market price of Class A Stock include, among others, the following:
•changes in stock market analyst recommendations or earnings estimates regarding the Class A Stock and/or BPY units,
other companies comparable to BPYU or BPY or companies in the industries they serve;
•changes in the market price of BPY units;
•actual or anticipated fluctuations in BPY’s or BPYU’s operating results or future prospects;
•reactions to public announcements by BPY and BPYU;
•strategic actions taken by BPY, BPYU and/or their competitors;
•adverse conditions in the financial market or general U.S. or international economic conditions, including those resulting from war, incidents of terrorism, pandemics/epidemics and responses to such events; and
•sales of such securities by BPY, BPYU and/or members of their management team or significant stockholders.
Investors in Class A Stock will be affected by BPY’s performance, including the performance of assets of BPY that are not assets of BPYU. There can be no assurance that BPY will be able to continue paying distributions equal to the level currently paid by BPY, or that BPYU will be able to pay all of the distributions intended to be payable on the Class A Stock.
Each share of Class A Stock is intended to provide an economic return equivalent to one BPY unit, and at any time from and after the date of the issuance of the Class A Stock, such stockholder may cause BPYU to redeem a share of Class A Stock for an amount of cash equivalent to the value of a BPY unit or such share shall be exchanged for a BPY unit. Therefore, investors in Class A Stock will be affected by BPY's performance, including the performance of assets of BPY that are not assets of BPYU. BPY and its business may be affected by a wide variety of factors, and we can provide no assurance that BPY's future performance will be comparable to its performance in the past.
In addition, distributions on BPY units may not be equivalent to the level currently paid by BPY for various reasons, including, but not limited to, the following:
•BPY may not have enough unrestricted funds to pay such distributions due to changes in BPY’s cash requirements, capital spending plans, cash flow or financial position;
•decisions on whether, when and in which amounts to make any future distributions will be dependent on then-existing conditions, including BPY and BPYU’s financial condition, earnings, legal requirements, including limitations under Bermuda law, restrictions in BPY’s borrowing agreements that limit its ability to pay dividends to unitholders and other factors BPY deems relevant; and
•BPY may desire to retain cash to improve its credit profile or for other reasons.
An active trading market for Class A Stock may not be sustained.
Although shares of our Class A Stock are listed on the Nasdaq, an active trading market for our Class A Stock may not be sustained and we cannot assure you as to the liquidity of markets for Class A Stock or to your ability to sell Class A Stock or the price at which you would be able to sell Class A Stock. Class A Stock could trade at prices that may be lower than market prices for BPY units. A number of factors, principally factors relating to BPY but also including factors specific to BPYU and its business, financial condition and liquidity, economic and financial market conditions, interest rates, unavailability of capital and financing sources, volatility levels and other factors could lead to a decline in the value of Class A Stock and a lack of liquidity in any market for Class A Stock.
General market conditions and unpredictable factors could adversely affect market prices of the BPYU series A preferred stock.
There can be no assurance about the market prices of BPYU series A preferred stock. Several factors, many of which are beyond the control of BPYU and BPY, could influence the market prices of BPYU series A preferred stock, including:
•whether BPYU declares or fails to declare dividends on the BPYU series A preferred stock from time to time;
•real or anticipated changes in the credit ratings assigned to BPYU or BPY securities;
•BPYU’s and BPY’s creditworthiness and credit profile;
•interest rates;
•developments in the securities, credit markets, and developments with respect to financial institutions
generally;
•the market for similar securities; and
•economic, corporate, securities market, geopolitical, regulatory or judicial events that affect BPYU and BPY, the asset
management or real estate industries or the financial markets generally.
Shares of all classes of BPYU's outstanding stock, including the Class A Stock and Series A Preferred Stock, will rank junior to all indebtedness of, and other non-equity claims on, BPYU with respect to assets available to satisfy such claims.
Business Risks
Our revenues and available cash are subject to conditions affecting the retail sectorsector.
Our real property investments are influenced by the retail sector, which may be negatively impacted by increased unemployment, changes in international, national, regional, and local economic conditions, as a result of global events such as international trade disputes, a foreign debt crisis, foreign currency volatility, natural disasters, pandemics, war, civil unrest and terrorism, as well as from domestic issues, such as government policies and regulations, tariffs, energy prices, market dynamics, rising interest rates and limited growth in consumer income, increased federal income and payroll taxes, increased health care costs, increased state and local taxes, increased real estate taxes, industry slowdowns, lack of availability of consumer credit, weak income growth, increased levels of consumer debt, decreased levels of consumer spending, changes in consumer confidence, fluctuations in seasonal spending in the United States, poor housing market conditions, adverse weather conditions, natural disasters, plant closings, and other factors. Similarly, local real estate conditions, such as an oversupply of, or a reduction in demand for, retail space or retail goods, and the supply and creditworthiness of current and prospective tenants may negatively impact our properties.
Given these economic conditions, we believe there is a risk that the sales at stores operating in our properties may be adversely affected, which may cause tenants to be unable to pay their rental obligations. Because substantially all of our income is derived from rentals of real property, our income and available cash would be adversely affected if a significant number of tenants are unable to meet their obligations.
Our business has been and is expected to continue to be adversely affected by the COVID-19 pandemic and the preventive measures taken to curb the spread of the virus, as well as the potential for future outbreaks of other highly infectious or contagious diseases.
As a result of the rapid spread of COVID-19, many companies and various governments have imposed restrictions on business activity and travel which may continue and could expand. Business has slowed significantly around the globe, including in our retail business, and there can be no assurance that strategies to address potential disruptions in operations will mitigate the adverse impacts related to the pandemic. Given the ongoing and dynamic nature of the circumstances surrounding COVID-19, it is difficult to predict how significant the impact of this pandemic, including any responses to it, will be on the global economy, our company and our business or for how long disruptions are likely to continue. The extent of such impact will depend on future developments, which are highly uncertain, rapidly evolving and cannot be predicted, including new information which may emerge concerning the severity and transmissibility of this coronavirus and actions taken to contain it including the pace, availability, distribution and acceptance of effective vaccines, among others. Such developments, depending on their nature, duration, and intensity, could have a material adverse effect on our business, financial position, results of operations or cash flows.
We operate in industries or geographies impacted by COVID-19. Many of these are facing financial and operational hardships
due to COVID-19 and responses to it. Adverse impacts on our business may include:
•a complete or partial closure of, or other operational issues at, one or more of our properties resulting from government or tenant action;
•a slowdown in business activity that may severely impact our tenants' businesses, financial condition and liquidity and may cause one or more of our tenants to be unable to fund their business operations, meet their obligations to us in full, or at all, or to otherwise seek modifications of such obligations;
•an increase in re-leasing timelines, potential delays in lease-up of vacant space and the market rates at which such lease will be executed;
•reduced economic activity resulting in a prolonged recession, which could negatively impact consumer discretionary spending and demand; and
•expected completion dates for our development and redevelopment projects may be subject to delay as a result of local economic conditions that may continue to be disrupted as a result of the COVID-19 pandemic.
If these and potential other disruptions caused by COVID-19 continue, our business could continue to be adversely affected.
We may be unable to lease space in our properties on favorable terms or at allall.
Our results of operations depend on our ability to continue to lease space in our properties, including vacant space and re-leasing space in properties where leases are expiring, optimizing our tenant mix, or leasing properties on economically favorable terms. Because approximately 7% to 12% of our total leases expire annually based on expiring GLA, we are continually focused on leasing our properties. Similarly, we are pursuing a strategy of replacing expiring short-term leases with long-term leases. There can be no assurance that our leases will be renewed or that vacant space will be re-let at rates equal to or above the current average net effective rental rates or that substantial rent abatements, tenant improvements, early termination rights or below market renewal options will not be offered to attract new tenants or retain existing tenants. If the rental rates decrease, if our existing tenants do not renew their leases or if we do not re-let a significant portion of our available space and space for which leases will expire, our financial condition and results of operations could be adversely affected.
Certain of our properties have had excess space available for prospective tenants, and those properties may continue to experience, and other properties may commence experiencing, such oversupply in the future. Among other causes, there has been an increased number of bankruptcies of national retailers, as well as store closures. There is downward pressure on our rental rates and occupancy levels, and the increased bargaining power of creditworthy retail tenants may result in us having to increase our spend on tenant improvements and potentially make other lease modifications, any of which, in the aggregate, could have an adverse effect on our financial condition and results of operations.
Due to the pandemic, we may experience an increase in re-leasing timelines, potential delays in lease-up of vacant space and the market rates at which such leases will be executed could be impacted. The longer-term impact of the shutdown and resulting economic downturn could reduce demand for retail space.
The bankruptcy or store closures of national tenants, which are tenants with chains of stores in many of our properties, may adversely affect our revenuesrevenues.
Our leases generally contain provisions designed to ensure the creditworthiness of the tenant. However, companies in the retail industry, including some of our tenants, have declared bankruptcy, or from time to time, have voluntarily closed certain ofceased their stores.operations, downsized their brick and mortar presence or failed to comply with their contractual obligations to us and to others. We may be unable to re-lease such space or to re-lease it on comparable or more favorable terms. Tenants declaring bankruptcy may also seek protection under the bankruptcy laws from their creditors, including us as lessor. If one of our tenants files for bankruptcy, we may not be able to collect amounts owed by that party prior to filing for bankruptcy. In addition, after filing for bankruptcy, a tenant may terminate any or all of its leases with us, in which event we would have a general unsecured claim against such tenant that would likely be worth less than the full amount owed to us for the remainder of the lease term. As a result, the bankruptcy or closure of a national tenant may adversely affect our revenues. In addition, such closings may allow other tenants to modify their leases to terms that are less favorable for us, also adversely impacting our revenues. For example, certain of our lease agreements include a co-tenancy provision that allows the tenant to pay a reduced rent amount and, in certain instances, terminate the lease, if we fail to maintain certain occupancy levels or if specific anchor tenants are no longer at the property. Therefore, if occupancy or tenancy falls below certain thresholds, rents we are entitled to receive from our retail tenants could be reduced.
The recent COVID-19 related global economic shutdown has increased the risk in the near-term of our tenants’ ability to fulfill lease commitments, which has been materially impacted by retail store closures, quarantines and stay-at-home orders. Many of our tenants could declare bankruptcy or become insolvent and cease business operations as a result of prolonged mitigation efforts.
It may be difficult to sell real estate quickly, and transfer restrictions apply to some of our propertiesproperties.
Real estate investments are relatively illiquid, which may limit our ability to strategically change our portfolio promptly in response to changes in economic or other conditions. If revenues from a property decline but the related expenses do not, the income and cash available to us would be adversely affected. If it becomes necessary or desirable for us to dispose of one or more of our mortgaged properties, we may not be able to obtain a release of the lien on the mortgaged property without payment of the associated debt. The foreclosure of a mortgage on a property or inability to sell a property could adversely affect the level of cash available to us. Moreover, there are some limitations under federal income tax laws applicable to REITs that limit our ability to sell assets.
Real estate may be even more illiquid in the context of an economic downturn that may result from the global economic shutdown. Such illiquidity may limit our ability to vary our portfolio promptly in response to changing economic or investment conditions. Also, financial difficulties of other property owners resulting in distressed sales could depress real estate values in the markets in which we operate.
Our business is dependent on perceptions by retailers and shoppers of the convenience and attractiveness of our retail properties, and our inability to maintain a positive perception may adversely affect our revenuesrevenues.
We are dependent on perceptions by retailers or shoppers of the safety, convenience and attractiveness of our retail properties. If retailers and shoppers perceive competing retail properties and other retailing options such as the Internet to be more convenient or of a higher quality, our revenues may be adversely affected.
We develop, expand and acquire properties and these activities are subject to risks due to economic factorsfactors.
Capital investment to expand or develop properties is anticipated to be an ongoing part of our strategy. In connection with such projects, we will be subject to various risks, which may result in lower than expected returns or a loss. These risks include the following:
•we may not have sufficient capital to proceed with planned expansion or development activities;
•acquisition or construction costs of a project may exceed original estimates;
•we may not be able to obtain zoning, occupancy or other required governmental permits and authorizations;
•income from completed projects may not meet projections; and
•we may not be able to obtain anchor store, mortgage lender and property partner approvals, if applicable, for expansion or development activities.
Newly acquired properties may not perform as expected, such as not realizing expected occupancy and rental rates. In addition, we may have unexpected costs and may be unable to finance or refinance the new properties at acceptable terms. If an acquisition is not successful, we may have a loss on our investment in the property. Furthermore, if we elect to pursue "mixed use" development, we expose ourselves to risks associated with each non-retail use (e.g., office, residential, hotel and entertainment).
The impact of the pandemic and associated restrictions that have been put in place by local governments may cause delays in construction and may impact our ability to progress pre-leasing efforts.
We are in a competitive businessbusiness.
There are numerous retail formats that compete with our properties in attracting retailers to lease space. In addition, retailers at our properties face continued competition from retailers at other malls, lifestyle and power centers, outlet malls and other discount shopping centers, discount shopping clubs, Internet sales, catalog companies, and telemarketing. Competition of these types could adversely affect our revenues and cash flows.
We compete with other major real estate investors with significant capital for attractive investment opportunities. These competitors include REITs, public and private financial institutions, and private institutional investors.
Our ability to realize our strategies and capitalize on our competitive strengths are dependent on our ability to effectively operate a large portfolio of high quality properties, maintain good relationships with our tenants and consumers, and remain well-capitalized. Our failure to do any of the foregoing could affect our ability to compete effectively in the markets in which we operate.
Some of our properties are subject to potential natural or other disastersdisasters.
A number of our properties are located in areas that are subject to natural or other disasters, including hurricanes, flooding and earthquakes. Furthermore, many of our properties are located in coastal regions, and would therefore be affected by any future increases in sea levels. For example, certain of our properties are located in California and Hawaii or in other areas with a higher risk of natural disasters such as earthquakes or tsunamis. Natural disasters can also delay redevelopment or development projects, increase investment costs to repair or replace damaged properties, increase future property insurance costs and negatively impact the tenant demand for lease space.
Possible terrorist activity or other acts or threats of violence and threats to public safety could adversely affect our financial condition and results of operationsoperations.
Terrorist attacks and threats of terrorist attacks in the United States or other acts or threats of violence may result in declining economic activity, which could harm the demand for goods and services offered by our tenants and the value of our properties and might adversely affect the value of an investment in our securities. Such a resulting decrease in retail demand could make it difficult for us to renew or re-lease our properties.
Terrorist activities or violence also could directly affect the value of our properties through damage, destruction or loss, and the availability of insurance for such acts, or of insurance generally, might be reduced or cost more, which could increase our operating expenses and adversely affect our financial condition and results of operations. To the extent that our tenants are affected by such attacks and threats of attacks, their businesses similarly could be adversely affected, including their ability to continue to meet obligations under their existing leases. These acts and threats might erode business and consumer confidence and spending and might result in increased volatility in national and international financial markets and economies. Any one of these events might decrease demand for real estate, decrease or delay the occupancy of our new or redeveloped properties, and limit our access to capital or increase our cost of raising capital.
Information technology failures and data security breaches could harm our businessbusiness.
We use information technology, digital telecommunications and other computer resources to carry out important operational activities and to maintain our business records. Many of these resources are provided to us and/or maintained on our behalf by third-party service providers pursuant to agreements that specify to varying degrees certain security and service level standards. Although we and our service providers employ what we believe are adequate security, disaster recovery and other preventative and corrective measures, our ability to conduct our business may be impaired if these resources are compromised, degraded, damaged or fail, whether due to a virus or other harmful circumstance, intentional penetration or disruption of our information technology resources by a third party, natural disaster, hardware or software corruption or failure or error or poor product or vendor/developer selection (including a failure of security controls incorporated into or applied to such hardware or software), telecommunications system failure, service provider error or failure, intentional or unintentional personnel actions (including the failure to follow our security protocols), or lost connectivity to our networked resources.
A significant and extended disruption in the functioning of these resources, including our primary website, could damage our reputation and cause us to lose customers, tenants and revenues, result in misstated financial reports, violations of loan covenants and/or missed reporting deadlines, result in our inability to properly monitor our compliance with the rules and regulations regarding our qualification as a REIT, result in the unintended and/or unauthorized public disclosure or the
misappropriation of proprietary, personal identifying and confidential information, require significant management attention and resources to remedy any resulting damages, subject us to claims for breach of contract, damages, credits, penalties or termination of leases or other agreements, and require us to incur significant expenses to address and remediate or otherwise resolve these kinds of issues, which expenses that we may not be able to recover in whole or in any part from our service providers or responsible parties, or their or our insurers. Moreover, cyber attacks perpetrated against our tenants, including unauthorized access to customers’ credit card data and other confidential information, could diminish consumer confidence and consumer spending.spending and negatively impactingimpact our tenants' businesses and our business.
We may incur costs to comply with environmental lawslaws.
Under various federal, state or local laws, ordinances and regulations, a current or previous owner or operator of real estate may be required to investigate and clean up hazardous or toxic substances released at a property, and may be held liable to third parties for bodily injury or property damage (investigation and/or clean-up costs) incurred by the parties in connection with the contamination. These laws often impose liability without regard to whether the owner or operator knew of the release of the hazardous or toxic substances. The presence of contamination or the failure to remediate contamination may adversely affect the owner's ability to sell, lease or borrow with respect to the real estate. Other federal, state and local laws, ordinances and regulations require abatement or removal of asbestos-containing materials in the event of demolition or certain renovations or remodeling, the cost of which may be substantial for certain redevelopments, and also govern emissions of and exposure to asbestos fibers in the air. Federal, state and local laws also regulate the operation and removal of underground storage tanks. In connection with the ownership, operation and management of certain properties, we could be held liable for the costs of remedial action with respect to these regulated substances or tanks or related claims.
Our properties have been subjected to varying degrees of environmental assessment at various times. It is possible that these assessments do not reveal all potential environmental liabilities or that conditions have changed since the assessment was prepared (typically, at the time the property was purchased or developed). However, the identification of new areas of
contamination, a change in the extent or known scope of contamination or changes in cleanup requirements could result in significant costs to us.
Some potential losses are not insuredinsured.
We carry comprehensive liability, fire, flood, earthquake, terrorism, extended coverage and rental loss and environmental insurance on all of our properties. We believe the policy specifications and insured limits of these policies are adequate and appropriate. There are, however, some types of losses, including lease and other contract claims, and certain environmental conditions not discovered within the applicable policy period, which generally are not insured. If an uninsured loss or a loss in excess of insured limits occurs, we could lose all or a portion of the capital we have invested in a property, as well as the anticipated future revenue from the property. If this happens, we might nevertheless remain obligated for any mortgage debt or other financial obligations related to the property.
BPYU is subject to litigation related to the BPY Transaction.
BPYU is subject to litigation related to the BPY Transaction. BPYU cannot predict the outcome of pending litigation, nor can it predict the amount of time and expense that will be required to resolve such litigation. The costs of defending the litigation, even if resolved in BPYU’s favor, could be substantial and such litigation could distract BPYU from pursuing potentially beneficial business opportunities.
Inflation or deflation may adversely affect our financial condition and results of operationsoperations.
Should the general price level increase in the future, this may have an impact on our consumers' disposable income. This may place pressure on retailer sales and margins as their costs rise and they may be unable to pass the costs along to the consumer, which in turn may affect their ability to pay rents and which could adversely impact our cash flow. Many but not all of our leases have fixed amounts for recoveries and if our costs rise, we may not be able to pass these costs on to our tenants. Rising costs may also impact our ability to generate cash flows.
Inflation also poses a risk to us due to the possibility of future increases in interest rates. Such increases would result in higher interest rates on new fixed-rate debt and adversely impact us due to our outstanding variable rate debt.debt which could adversely affect our cash flows and our ability to pay principal and interest on our debt and our ability to make distributions to our stockholders. Further, rising interest rates could limit our ability to refinance existing debt when it matures or significantly increase our future interest expense. From time to time, we manage our exposure to interest rate fluctuations related to a portion of our variable-rate debt using interest rate cap, swap and treasury lock agreements. Such agreements allow us to replace variable-rate debt with fixed-rate debt. However, our efforts to manage risks associated with interest rate volatility may not be successful. Additionally, interest rate cap, swap and treasury-lock agreements expose us to additional risks, including that the counterparties to the agreements might not perform their obligations. We also might be subject to additional costs, such as transaction fees or breakage costs, if we terminate these agreements.
Deflation may have an impact on our ability to repay our debt. Deflation may put pressure on our tenants' profit margins or delay consumption and thus weaken tenant sales, which may reduce our tenants' ability to pay rents. Deflationary pressure on retailers may diminish their ability to rent our space and decrease our ability to re-lease the space on favorable terms to us.
We may be adversely affected by the potential discontinuation of LIBOR.
The Financial Conduct Authority in the U.K. has announced that it will cease to compel banks to participate in LIBOR
after 2021. LIBOR is widely used as a benchmark rate around the world for derivative financial instruments, bonds and other
floating-rate instruments. This change to the administration of LIBOR, and any other reforms to benchmark interest rates, could
create significant risks and challenges for us and our operating businesses. The gradual elimination of LIBOR rates may have
an impact on over-the-counter derivative transactions, including potential contract repricing. The discontinuance of, or changes to, benchmark interest rates may require adjustments to agreements to which we and other market participants are parties, as well as to related systems and processes. This may result in market uncertainty until a new benchmark rate is established and potentially increased costs under such agreements.
Our real estate assets may be subject to impairment charges
charges.
We periodically assess whether there are anyregularly review our consolidated properties for potential impairment indicators whenever events or changes in circumstances indicate that the value of ourcarrying amount may not be recoverable. Impairment indicators are assessed separately for each property and include, but are not limited to, significant decreases in real estate assetsproperty net operating income, significant
decreases in occupancy percentage, debt maturities, changes in management's intent with respect to the properties and other investments may be impaired. A property’s value is considered to be impaired only if the estimated aggregate future undiscounted property cash flows are less than the carrying value of the property.prevailing market conditions. In our estimate of cash flows, we consider factors such as trends and prospects and the effects of demand and competition on expected future operating income. If we are evaluating the potential sale of an asset or redevelopment alternatives, the undiscounted future cash flows consider the most likely course of action as of the balance sheet date based on current plans, intended holding periods and available market information. We are required to make subjective assessments as to whether there are impairments in the value of our real estate assets and other investments. This includes estimates of our expected holding period of our properties, including estimates of the probability of obtaining concessions from creditors at properties for which the Company has suspended funding equity contributions to make contractual interest and/or principal payments. Impairment charges have an immediate direct impact on our earnings. There can be no assurance that we will not take additional charges in the future related to the impairment of our assets. Any future impairment could have a material adverse effect on our operating results in the period in which the charge is taken.
Organizational Risks
We are controlled by BPY and its interests may conflict with our interests or the interests of holders of Class A StockStock.
As of February 27, 2019,24, 2021, BPY and its affiliates control approximately 91% approximately 96.4% of the voting power of the Company’s outstanding voting shares, and the Company is party to a Master Services Agreement with Brookfield Asset Management and its affiliates. In the ordinary course of their business activities, BPY and Brookfield Asset Management may engage in activities where their interests conflict with our interests or those of holders of Class A Stock. BPY and Brookfield Asset Management may also pursue acquisition opportunities that may be complementary to our business, and, as a result, those acquisition opportunities may not be available to us. In addition, BPY and Brookfield Asset Management may have an interest in pursuing acquisitions, divestitures and other transactions that, in its judgment, could enhance its investment in us, even though such transactions might involve risks to the holders of our Class A Stock.
We are a "controlled company" within the meaning of the rules of the Nasdaq Stock Market ("Nasdaq") and, as a result, qualify for, and rely on, exemptions from certain corporate governance requirements. Holders of our Class A Stock do not have the same protections afforded to stockholders of companies that are subject to such requirements.
As of February 27, 2019,24, 2021, BPY and its affiliates control approximately 91% ofapproximately 96.4% of the Company’s shares entitled to vote generally in the election of directors. As a result, we are a "controlled company" within the meaning of the corporate governance standards of Nasdaq. Under these rules, a company of which more than 50% of the voting power in the election of directors is held by an individual, group or another company is a "controlled company" and may elect not to comply with certain corporate governance requirements, including the requirements that:
•we have a board that is comprised of a majority of "independent directors," as defined under the rules of such exchange;
•we have a nominating and corporate governance committee that is comprised entirely of independent directors; and
•we have a compensation committee that is comprised entirely of independent directors.
Although we are not required to under the controlled company exceptions, we have a majority of independent directors on our board and we have a fully independent governance and nominating committee. As we are externally managed under the Master Services Agreement and do not employ any of the persons responsible for managing our business, we do not have a compensation committee. Accordingly, holders of our Class A Stock do not have the same protections afforded to stockholders of companies that are subject to all of the corporate governance requirements of Nasdaq.
Our fourth amended and restated certificate of incorporation provides that the Court of Chancery of the State of Delaware will be the sole and exclusive forum for certain disputes between BPYU’s stockholders and BPYU and its current or former directors, officers and other stockholders, which could limit BPYU’s stockholders’ ability to obtain a favorable judicial forum for disputes with BPYU or its current or former directors, officers or other stockholders.
Pursuant to our fourth amended and restated certificate of incorporation, unless we consent in writing to the selection of an alternative forum, the Court of Chancery of the State of Delaware will be the sole and exclusive forum for (i) any derivative action or proceeding brought on behalf of BPYU, (ii) any action asserting a claim of breach of fiduciary duty owed by any current or former director, officer or stockholder of BPYU to BPYU or its stockholders, (iii) any action asserting a claim against BPYU arising pursuant to any provision of the Delaware General Corporation Law or our certificate of incorporation and bylaws, each as currently in effect, or (iv) any action asserting a claim against BPYU governed by the internal affairs
doctrine. The choice of forum provision will not apply to any causes of action arising under the Securities Act of 1933, as amended, and the Securities Exchange Act of 1934, as amended (the "Exchange Act").
The choice of forum provision may limit a BPYU stockholder’s ability to bring a claim in a judicial forum that it finds favorable for disputes with BPYU or its current or former directors, officers or other stockholders, which may discourage such lawsuits against BPYU and its current or former directors, officers and other stockholders. Alternatively, if a court were to find the choice of forum provision contained in our fourth amended and restated certificate of incorporation to be inapplicable or unenforceable in an action, BPYU may incur additional costs associated with resolving such action in other jurisdictions, which could harm its business, results of operations, and financial condition.
We are a holding company with no operations of our own and depend on our subsidiaries for cashcash.
Our operations are conducted almost entirely through our subsidiaries. Our ability to make dividends or distributions in connection with being a REIT is highly dependent on the earnings of and the receipt of funds from our subsidiaries through dividends or distributions, and our ability to generate cash to meet our debt service obligations is further limited by our subsidiaries' ability to make such dividends, distributions or intercompany loans. Our subsidiaries' ability to pay any dividends or distributions to us are limited by their obligations to satisfy their own obligations to their creditors and preferred stockholders before making any dividends or distributions to us. Delaware law imposes requirements that could further restrict our ability to pay dividends to holders of our Class A Stock.
We share control of some of our properties with other investors and may have conflicts of interest with those investorsinvestors.
For the Unconsolidated Properties (as defined in Note 1) and consolidated joint ventures, we are required to make decisions with the other investors who have interests in the respective property or properties. For example, the approval of certain of the other investors is required with respect to operating budgets and refinancing, encumbering, expanding or selling any of these properties, to make distributions, as well as to bankruptcy decisions related to the Unconsolidated Properties and related joint ventures. We might not have the same interests as the other investors in relation to these transactions. Accordingly, we might not be able to favorably resolve any of these issues, or we might have to provide financial or other inducements to the other investors to obtain a favorable resolution.
In addition, various restrictive provisions and rights apply to sales or transfers of interests in our jointly owned properties. As such, we might be required to make decisions about buying or selling interests in a property or properties at a time that is not desirable.
Bankruptcy of our joint venture partners could impose delays and costs on us with respect to the jointly owned retail propertiesproperties.
The bankruptcy of one of the other investors in any of our jointly owned properties could materially and adversely affect the respective property or properties. Pursuant to the Bankruptcy Code, we would be precluded from taking some actions affecting the estate of the other investor without prior court approval which would, in most cases, entail prior notice to other parties and a hearing. At a minimum, the requirement to obtain court approval may delay the actions we would or might want to take. If the relevant joint venture through which we have invested in a property has incurred recourse obligations, the discharge in bankruptcy of one of the other investors might result in our ultimate liability for a greater portion of those obligations than would otherwise be required.
We are impacted by tax-related obligations to some of our partnerspartners.
We own certain properties through partnerships that have arrangements in place that protect the deferred tax situation of our existing third party limited partners. Violation of these arrangements could impose costs on us. As a result, we may be restricted with respect to decisions such as financing, encumbering, expanding or selling these properties.
Several of our joint venture partners are tax-exempt. As such, they are taxable to the extent of their share of unrelated business taxable income generated from these jointly owned properties. As the manager of these joint ventures, we have obligations to avoid the creation of unrelated business taxable income at these properties. As a result, wetax status that may be restricted with respect toinfluence our decisions relatedrelating to the financing of, selling and revenue generation from thesetheir properties.
We provide financial support for a number of joint venture partnerspartners.
We provide secured financing to some of our joint venture partners. As of December 31, 2018, we have provided venture partners loans of $262.1 million (all of which is secured by the respective partnership interests). A default by a joint venture partner under their debt obligation may result in a loss.
We and/or a subsidiary that has elected to be treated as a REIT may not be able to maintain status as a REITREIT.
We have elected to be treated as a REIT commencing with our taxable year beginning July 1, 2010 (our date of incorporation), and certain of our subsidiaries have also made elections to be treated as REITs. Qualification and taxation as a REIT depends upon the REIT’s ability to satisfy several requirements (some of which are outside our control), including tests related to annual operating results, the nature and diversification of our assets, sources of income, distribution levels and diversity of stock ownership. Due to certain investments made by us and our affiliates and joint venture partners, we and our REIT subsidiaries may reflect a significant amount of related party rent as non-qualifying income each year and such non-qualifying income may affect the ability of us and such REIT subsidiaries to meet the REIT income requirements. In addition, certain distributions made by certain of our REIT subsidiaries may be considered preferential dividends and, accordingly, may affect the ability of those subsidiaries to satisfy the REIT distribution requirement and qualify as a REIT. If any of our REIT subsidiaries fail to qualify as a REIT, such failure could result in loss of our REIT status. The various REIT qualification tests required by the Internal Revenue Code of 1986, as amended (the "Code") are highly technical and complex. Accordingly, there can be no assurance that we or one or more of our REIT subsidiaries has operated in accordance with these requirements or will continue to operate in a manner so as to qualify or remain qualified as a REIT.
If we and/or one of our REIT subsidiaries fail to comply with the REIT qualification tests with respect to any taxable year, we or such REIT subsidiary may be subject to monetary penalties or possibly disqualification as a REIT. If we and/or a REIT subsidiary fail to maintain our qualification as a REIT, we and/or our REIT subsidiary would not be allowed to deduct distributions to stockholders in computing taxable income and federal income tax. If REIT status is lost, corporate level income tax would apply to our and/or our REIT subsidiary’s taxable income at the regular corporate rate, and such taxes could be substantial. As a result, the amount available for distribution to holders of equity securities that would otherwise receive dividends could be reduced for
the year or years involved, and we and/or such REIT subsidiary would no longer be required to make distributions to preserve our tax status. In addition, unless we and/or such REIT subsidiary were entitled to relief under the relevant statutory provisions, we and/or such REIT subsidiary would be disqualified from treatment as a REIT for four subsequent taxable years.
In order for us and our REIT subsidiaries to qualify for treatment as a REIT, assuming that certain other requirements are met, the Code generally requires that such entity distribute at least 90% of its taxable ordinary income to stockholders. To the extent that we or our REIT subsidiaries distribute less than 100% of our REIT taxable income (including both taxable ordinary income and taxable capital gains), we or any such REIT subsidiary will be subject to U.S. federal corporate income tax on the undistributed taxable income and could be subject to an additional 4% nondeductible excise tax if the actual amount that is distributed to equity holders in a calendar year is less than "the required minimum distribution amount" specified under U.S. federal income tax laws. We expect to distribute 100% of our taxable capital gains and taxable ordinary income to stockholders annually. It is possible, from time to time, that we may not have sufficient cash from operations to meet the distribution requirements. In the event such short fall occurs, we may pay dividends in the form of taxable stock dividends. In the case of a taxable stock dividend, stockholders would be required to include the dividend as income and would be required to satisfy the tax liability associated with the distribution with cash from other sources.
Legislative or regulatory action could adversely affect stockholders and our CompanyCompany.
On December 22, 2017, H.R. 1, informally titled the Tax Cuts and Jobs Act (the "TCJA"), was enacted. The TCJA makes major changes to the Code, including a number of provisions of the Code that affect the taxation of REITs and their stockholders. The long-term effect of the significant changes made by the TCJA remains uncertain, and administrative guidance will be required in order to fully evaluate the effect of many provisions. The effect of any technical corrections with respect to the TCJA could have an adverse effect on us or our stockholders or holders of our debt securities.
In addition, in recent years, numerous legislative, judicial and administrative changes have been made to the federal income tax laws applicable to investments in REITs and similar entities. Additional changes to tax laws are likely to continue to occur in the future, and we cannot assure our stockholders that any such changes will not adversely affect the taxation of a stockholder. We cannot assure you that future changes to tax laws and regulations will not have an adverse effect on an investment in our stock.
Liquidity Risks
Our indebtedness could adversely affect our financial health and operating flexibilityflexibility.
As of December 31, 2018,2020, we had $20.8$23.2 billion aggregate principal amount of indebtedness outstanding at our proportionate share including $8.0$6.9 billion of our share of unconsolidated debt and our junior subordinated notes of $206.2 million. Our indebtedness may have important consequences to us and the value of our equity, including:
•limiting our ability to borrow significant additional amounts for working capital, capital expenditures, debt service requirements, execution of our business strategy or other purposes;
•limiting our ability to use operating cash flow in other areas of our business or to pay dividends because we must dedicate a portion of these funds to service debt;
•increasing our vulnerability to general adverse economic and industry conditions, including increases in interest rates, particularly given the portion of our indebtedness which bears interest at variable rates;
•limiting our ability to capitalize on business opportunities and to react to competitive pressures and adverse changes in government regulation; and
•giving secured lenders the ability to foreclose on our assets.
We are also subject to the risks normally associated with debt financing, including the risk that our cash flows from operations will be insufficient to meet required debt service, that we will be able to refinance or extend such indebtedness on acceptable terms, or at all, or that rising interest rates could adversely affect our debt service costs. In addition, our interest rate hedging arrangements may expose us to additional risks, including a risk that the counterparty to the hedging arrangement may fail to honor its obligations and termination of such arrangements typically involve certain transaction fees or breakage costs. There can be no assurance that our hedging activities will have the desired impact on our results of operations, liquidity or financial condition.
Our debt contains restrictions and covenants which may limit our ability to enter into or obtain funding for certain transactions or operate our businessbusiness.
The terms of certain of our debt will require us to satisfy certain customary affirmative and negative covenants and to meet financial ratios and tests, including ratios and tests based on leverage, interest and fixed charge coverage and net worth, or to satisfy similar tests as a precondition to incurring additional debt. We entered into a revolving credit facility in April 2012 that subjects us to such covenants and restrictions. The revolving credit facility was amended in October 2015,July 2020, and we may draw up to $1.5 billion under it, including the uncommitted accordion feature. In addition, certain of our indebtedness contains restrictions. The covenants and other restrictions under our debt agreements affect, among other things, our ability to:
•amend our organizational documents;
•incur indebtedness;
•create liens on assets;
•sell assets;
•manage our cash flows;
•transfer assets to other subsidiaries;
•make capital expenditures;
•engage in mergers and acquisitions; and
•make distributions to equity holders, including holders of our Class A Stock.
In addition, our debt contains certain terms which include restrictive operational and financial covenants and restrictions on the distribution of cash flows from properties serving as collateral for the debt. Fees and cash flow restrictions may affect our ability to fund our on-going operations from our operating cash flows and we may be limited in our operating and financial flexibility and, thus, may be limited in our ability to respond to changes in our business or competitive activities.
The COVID-19 related global economic shutdown may also negatively impact our ability to meet our financial covenants in the near-term.
We may not be able to refinance, extend or repay our consolidated debt or our portion of indebtedness of our Unconsolidated Real Estate AffiliatesAffiliates.
As of December 31, 2018,2020, our proportionate share of total debt, including the $206.2 million of junior subordinated notes, aggregated $20.8$23.2 billion consisting of our consolidated debt, net of noncontrolling interest, of $12.8$16.3 billion combined with our share of the debt of our Unconsolidated Real Estate Affiliates (Note 5) of $8.0$6.9 billion. Of our proportionate share of total debt, $5.8$6.9 billion is recourse to the Company due to guarantees or other security provisions for the benefit of the note holder. There can be no assurance that we, or the joint venture, will be able to refinance or restructure this debt on acceptable terms or otherwise, or that operations of the properties or contributions by us and/or our partners will be sufficient to repay such loans. If we or the joint venture cannot service this debt, we or the joint venture may have to deed property back to the applicable lenders.
This risk may be increased as a result of disrupted market conditions resulting from the shutdown. Our strategy to stagger the maturities of our mortgage portfolio attempts to mitigate our exposure to excessive amounts of debt maturing in any one year and to maintain relationships with a large number of lenders to limit exposure to any one counterparty.
We may not be able to raise capital through financing activitiesactivities.
Substantially all of our assets are encumbered by property-level indebtedness; therefore, we may be limited in our ability to raise additional capital through property level or other financings. In addition, our ability to raise additional capital could be limited to refinancing existing secured mortgages before their maturity date which may result in yield maintenance or other prepayment penalties to the extent that the mortgage is not open for prepayment at par.
BPY Transaction Risks
BPR and BPY may fail to realize any or all of the anticipated benefits of the BPY Transaction or those benefits may take longer to realize than expected.
If BPY is not able to combine successfully the businesses of BPR and BPY in an efficient and effective manner, the anticipated benefits and cost savings of the BPY Transaction may not be realized fully, or at all, or may take longer to realize than expected, and the value of Class A Stock may be adversely affected.
An inability to realize the full extent of the anticipated benefits of the transactions, as well as any delays encountered in the integration process, could have an adverse effect on the revenues, level of expenses and operating results of BPY and BPR, which may adversely affect the value of Class A Stock.
Management will have to dedicate substantial effort to integrating the businesses of BPR and BPY. These efforts may divert management’s focus and resources from the business, corporate initiatives or strategic opportunities of BPY and BPR. In addition, the actual integration may result in additional and unforeseen expenses and the anticipated benefits of the integration may not be
realized. Actual growth and cost savings, if achieved, may be lower than what BPY and BPR expect and may take longer to achieve than anticipated. Difficulties associated with managing a larger and more complex property portfolio could prevent BPY and BPR from realizing the anticipated benefits of the transactions and have a material adverse effect on their business. If BPY and BPR are not able to address integration challenges adequately, they may be unable to realize the anticipated benefits of the integration of the two companies. Failure to achieve the anticipated benefits of the BPY Transaction could adversely affect BPY and BPR’s results of operations or cash flows, cause dilution to the earnings per BPY unit and per share of Class A Stock, decrease or delay the expected benefits of the BPY Transaction and negatively affect the price of BPY units and shares of Class A Stock.
BPY and BPR may be unable to retain necessary personnel.
The success of the BPY Transaction will depend in part on the ability of Brookfield Asset Management, as service provider to BPY and BPR, to retain their key employees. Key employees may depart because of, among other things, issues relating to the combination of two companies, and uncertainty and difficulty of integration or a desire not to remain long term with the companies. If key employees terminate their employment, or if an insufficient number of employees are retained to maintain effective operations, the business activities of BPR or BPY may be adversely affected and management’s attention may be diverted from successfully integrating the companies to hire suitable replacements, all of which may cause BPR or BPY’s business to suffer. In addition, BAM, BPR and BPY may not be able to locate suitable replacements for any key employees or to offer employment to potential replacements on reasonable terms.
If BPY and BPR (and Brookfield Asset Management), as service provider for BPR and BPY) are unable to attract, retain and motivate personnel that are critical to the successful integration of BPR into BPY and the future operation of the companies, BPY and BPR could face disruptions in their operations, loss of key employees, strategic relationships, key information, expertise or know-how and unanticipated additional recruiting and training costs. In addition, the loss of key personnel could diminish the anticipated benefits of the acquisition of BPR by BPY.
Each of BPR and BPY have incurred and expects to incur significant costs in connection with the BPY Transaction and the
integration of BPR and BPY.
Each of BPR and BPY have incurred significant costs and may continue to incur costs in connection with the BPY Transaction and integrating the portfolios of BPR and BPY, including unanticipated costs and the assumption of known and unknown liabilities. While BPR and BPY have assumed that a certain level of transaction and integration expenses will be incurred, there are factors beyond BPR’s and BPY’s control that could affect the total amount or the timing of integration expenses. Many of the expenses that will be incurred, by their nature, are difficult to estimate accurately at the present time. Although BPR and BPY expect that the elimination of duplicative costs, as well as the realization of other efficiencies related to the integration of the two businesses, should allow BPR and BPY to offset these incremental expenses over time, the net benefit may not be achieved in the near term, or at all.
Moreover, diversion of management focus and resources from the day-to-day operation of the business to matters relating to the integration of BPR and BPY could adversely affect each company’s business.
Class A Stock may not trade at the same price as the BPY units.
Although the Class A Stock is intended to provide an economic return that is equivalent to BPY units, there can be no assurance
that the market price of Class A Stock will be equal to the market price of BPY units at any time. Factors that could cause differences in such market prices may include:
perception and/or recommendations by analysts, investors and/or other third parties that these securities should be priced differently;
actual or perceived differences in distributions to holders of Class A Stock versus BPY unitholders, including as a result of any legal prohibitions;
business developments or financial performance or other events or conditions that may be specific to only BPR or BPY; and
difficulty in the exchange mechanics between Class A Stock and BPY units, including the potential expiration or
termination of the Rights Agreement, dated as of April 27, 2018 by and between BAM and Wilmington Trust, National Association, in accordance with its terms.
Holders of Class A Stock may not receive the same distributions as holders of BPY units, and, accordingly, may not receive the intended economic equivalence of the securities.
BPR intends to pay identical distributions in respect of the Class A Stock as BPY distributes to BPY unitholders. However, unforeseen circumstances (including legal prohibitions) may prevent the same distributions from being paid on each security. Accordingly, there can be no assurance that distributions will be identical for Class A Stock and BPY units in the future, which may impact the market price of these securities.
If a sufficient amount of Class A Stock is exchanged for BPY units, then Class A Stock may be de-listed.
Shares of Class A Stock began trading on Nasdaq following the consummation of the BPY Transaction. However, if a sufficient amount of Class A Stock is exchanged for BPY units, BPR may fail to meet the minimum listing requirements on the Nasdaq and Nasdaq may take steps to de-list the Class A Stock. This, in turn, would have a significant adverse effect on the liquidity of the Class A Stock, and holders thereof may not be able to exit their investments on favorable terms, or at all.
Additionally, if the market capitalization of Class A Stock (i.e., if the price per share of Class A Stock, multiplied by the number
of shares of Class A Stock outstanding) averages less than $1,000,000,000 over any period of thirty (30) consecutive trading days, the Company's Board of Directors will have the right to liquidate BPR’s assets and wind up BPR’s operations, which we refer to as a market capitalization liquidation event. Upon any market capitalization liquidation event, and subject to the prior rights of holders of the BPR Series A Preferred Stock and after the payment in full to any holder of BPR Class A Stock that has exercised its exchange rights, the holders of Class A Stock shall be entitled to a cash amount, for each share of Class A Stock, equal to the dollar volume-weighted average price of one BPY unit over the ten (10) trading days immediately following the public announcement of such market capitalization liquidation event, plus all declared and unpaid dividends. If, upon any such market capitalization liquidation event, the assets of BPR are insufficient to make such payment in full, then the assets of BPR will be distributed among the holders of Class A Stock ratably in proportion to the full amounts to which they would otherwise be respectively entitled to receive. Notwithstanding the foregoing, upon any market capitalization liquidation event, BPUS may elect to exchange all of the outstanding shares of Class A Stock for BPY units on a one-for-one basis. This initial one-for-one conversion factor is subject to adjustment in the event of certain dilutive or other capital events by BPY or BPR. Such a forced exchange of the Class A Stock for cash or BPY units could have a negative impact on the BPR stockholder’s investment, including adverse tax consequences.
The market price of Class A Stock and BPY units may be volatile, and holders of Class A Stock could lose a significant portion of their investment due to drops in the market price of Class A Stock.
The market price of shares of Class A Stock and BPY units may be volatile, and holders of Class A Stock may not be able to resell their shares at or above the implied price at which they acquired such securities due to fluctuations in the market price of Class A Stock, including changes in market price caused by factors unrelated to BPR or BPY’s operating performance or prospects. Specific factors that may have a significant effect on the market price of Class A Stock include, among others, the following:
changes in stock market analyst recommendations or earnings estimates regarding the Class A Stock and/or BPY units,
other companies comparable to BPR or BPY or companies in the industries they serve;
changes in the market price of BPY units;
actual or anticipated fluctuations in BPY’s or BPR’s operating results or future prospects;
reactions to public announcements by BPY and BPR;
strategic actions taken by BPY, BPR and/or their competitors;
adverse conditions in the financial market or general U.S. or international economic conditions, including those resulting from war, incidents of terrorism and responses to such events; and
sales of such securities by BPY, BPR and/or members of their management team or significant stockholders.
Investors in Class A Stock will be affected by BPY’s performance, including the performance of assets of BPY that are not assets of BPR. There can be no assurance that BPY will be able to continue paying distributions equal to the level currently paid by BPY, or that BPR will be able to pay all of the distributions intended to be payable on the Class A Stock.
Each share of Class A Stock is intended to provide an economic return equivalent to one BPY unit, and at any time from and after the date of the issuance of the Class A Stock, such stockholder may cause BPR to redeem a share of Class A Stock for an amount of cash equivalent to the value of a BPY unit or in the sole discretion of BPUS such share shall be exchanged for a BPY unit. Therefore, investors in Class A Stock will be affected by BPY's performance, including the performance of assets of BPY that are not assets of BPR. BPY and its business may be affected by a wide variety of factors, and we can provide no assurance that BPY's future performance will be comparable to its performance in the past.
In addition, distributions on BPY units may not be equivalent to the level currently paid by BPY for various reasons, including, but not limited to, the following:
BPY may not have enough unrestricted funds to pay such distributions due to changes in BPY’s cash requirements, capital spending plans, cash flow or financial position;
decisions on whether, when and in which amounts to make any future distributions will be dependent on then-existing conditions, including BPY and BPR’s financial condition, earnings, legal requirements, including limitations under Bermuda law, restrictions in BPY’s borrowing agreements that limit its ability to pay dividends to unitholders and other factors BPY deems relevant; and
BPY may desire to retain cash to improve its credit profile or for other reasons.
An active trading market for Class A Stock may not be sustained.
Prior to the BPY Transaction, there was no public market for Class A Stock. Although we have completed the BPY Transaction
and shares of our Class A Stock are listed on the Nasdaq, an active trading market for our Class A Stock may not be sustained and we cannot assure you as to the liquidity of markets for Class A Stock or to your ability to sell Class A Stock or the price at which you would be able to sell Class A Stock. Class A Stock could trade at prices that may be lower than market prices for BPY units. A number of factors, principally factors relating to BPY but also including factors specific to BPR and its business, financial condition and liquidity, economic and financial market conditions, interest rates, unavailability of capital and financing sources, volatility levels and other factors could lead to a decline in the value of Class A Stock and a lack of liquidity in any market for Class A Stock.
The BPR charter provides that the Court of Chancery of the State of Delaware will be the sole and exclusive forum for certain disputes between BPR’s stockholders and BPR and its current or former directors, officers and other stockholders, which could limit BPR’s stockholders’ ability to obtain a favorable judicial forum for disputes with BPR or its current or former directors, officers or other stockholders.
The amended and restated certificate of incorporation of BPR includes a forum selection provision that (i) applies to suits for breach of fiduciary duty brought against (a) current and former stockholders and (b) current and former directors and officers and (ii) expressly permits BPR to waive the forum selection provision with respect to certain proceedings. The amended BPR charter generally provides that, unless BPR consents in writing to the selection of an alternative forum, the Court of Chancery of the State of Delaware will be the sole and exclusive forum for (i) any derivative action or proceeding brought on behalf of BPR, (ii) any action asserting a claim of breach of fiduciary duty owed by any current or former director, officer or stockholder of BPR to BPR or its stockholders, (iii) any action asserting a claim against BPR arising pursuant to any provision of the Delaware General Corporation Law the amended BPR charter or the amended bylaws or (iv) any action asserting a claim against BPR governed by the internal affairs doctrine. The choice of forum provision may limit a BPR stockholder’s ability to bring a claim in a judicial forum that it finds favorable for disputes with BPR or its current or former directors, officers or other stockholders, which may discourage such lawsuits against BPR and its current or former directors, officers and other stockholders. Alternatively, if a court were to find the choice of forum provision contained in the amended BPR charter to be inapplicable or unenforceable in an action, BPR may incur additional costs associated with resolving such action in other jurisdictions, which could harm its business, results of operations, and financial condition.
General market conditions and unpredictable factors could adversely affect market prices of the BPR series A preferred stock.
There can be no assurance about the market prices of BPR series A preferred stock. Several factors, many of which are beyond the control of BPR and BPY, could influence the market prices of BPR series A preferred stock, including:
whether BPR declares or fails to declare dividends on the BPR series A preferred stock from time to time;
real or anticipated changes in the credit ratings assigned to BPR or BPY securities;
BPR’s and BPY’s creditworthiness and credit profile;
interest rates;
developments in the securities, credit markets, and developments with respect to financial institutions
generally;
the market for similar securities; and
economic, corporate, securities market, geopolitical, regulatory or judicial events that affect BPR and BPY, the asset
management or real estate industries or the financial markets generally.
Shares of Class A Stock, Class B Stock, Class C Stock and BPR Series A Preferred Stock will rank junior to all indebtedness of,
and other non-equity claims on, BPR with respect to assets available to satisfy such claims.
BPR is subject to litigation related to the BPY Transaction.
BPR is subject to litigation related to the BPY Transaction. BPR cannot predict the outcome of pending litigation, nor can it predict the amount of time and expense that will be required to resolve such litigation. The costs of defending the litigation, even if resolved in BPR’s favor, could be substantial and such litigation could distract BPR from pursuing potentially beneficial business opportunities.
FORWARD-LOOKING INFORMATION
Refer to Item 7.
ITEM 1B. UNRESOLVED STAFF COMMENTS
None.
ITEM 2. PROPERTIES
OurBPYU's investments in real estate as of December 31, 20182020 consisted of ourits interests in 124121 retail properties. We generally own the land underlying the properties; however, at certain of our properties, all or part of the underlying land is owned by a third party that leases the land to us pursuant to a long-term ground lease. We manage substantially all of our Consolidated Properties (defined in Note 1) and provide management, leasing, and other services to a majority of our Unconsolidated Properties. Information regarding encumbrances on our properties is included here and on Schedule III of this Annual Report.
Mall and freestanding GLA includes in-line mall shop and outparcel retail locations (locations that are not attached to the primary complex of buildings that comprise a mall) and excludes anchors and tenant-owned GLA.
The following sets forth certain information regarding our properties as of December 31, 20182020 (GLA in thousands):
RETAIL PROPERTIES | | | | | | | | | | | | | | | | | | | | | | | | | | | | | | | | | | | | | | | | | |
Property
Count | | Property Name | BPYU Ownership (2) | Location | Mall and Freestanding GLA | Anchor GLA (BPYU Owned) | Anchor GLA (Tenant Owned) | Strip Center GLA | Office GLA | Total GLA | Retail Percentage Leased | Proportionate GLA | Key Stores (3) |
| | | | | | | | | | | | | |
| Consolidated Retail Properties | | | | | | | | | |
| 1 | | | 200 Lafayette | 90% | New York, NY | 30 | | — | | — | | — | | — | | 30 | | 100% | 27 | | Leased |
| 2 | | | 218 W 57th Street | 90% | New York, NY | 35 | | — | | — | | — | | — | | 35 | | — | 32 | | |
| 3 | | | 605 North Michigan Avenue | 90% | Chicago, IL | 73 | | — | | — | | — | | — | | 73 | | 79.3% | 66 | | Sephora, Chase Bank, Regus |
| 4 | | | 530 Fifth Avenue | 81% | New York, NY | 59 | | — | | — | | — | | — | | 59 | | 100% | 48 | | Vans, Chase Bank, Duane Reade |
| 5 | | | 685 Fifth Avenue | 88% | New York, NY | 24 | | — | | — | | — | | — | | 24 | | 100% | 21 | | Coach, Stuart Weitzman, Tag Heuer |
| 6 | | | 730 Fifth Avenue | 90% | New York, NY | 22 | | — | | — | | — | | — | | 22 | | 100% | 20 | | Bulgari, Mikimoto, Zegna |
| 7 | | | 830 N. Michigan Ave. | 90% | Chicago, IL | 68 | | 50 | | — | | — | | — | | 117 | | 94.3% | 106 | | Uniqlo, Columbia |
| 8 | | | Beachwood Place | 90% | Beachwood, OH | 325 | | 317 | | 247 | | 97 | | — | | 986 | | 79.5% | 667 | | Nordstrom, Saks Fifth Avenue, Dillard's |
| 9 | | | Bellis Fair | 90% | Bellingham, WA | 427 | | 100 | | 238 | | — | | — | | 765 | | 83.2% | 476 | | Macy's, JCPenney, Kohl's, Dick's Sporting Goods, Target |
| 10 | | | Brass Mill Center | 90% | Waterbury, CT | 444 | | 218 | | 319 | | 189 | | — | | 1,171 | | 86.4% | 769 | | JCPenney, Burlington Stores, Regal Cinemas |
| 11 | | | Coastland Center (1) | 90% | Naples, FL | 339 | | 276 | | 315 | | — | | — | | 930 | | 89.7% | 555 | | Dillard's, Macy's, JCPenney |
| 12 | | | Columbia Mall | 90% | Columbia, MO | 296 | | — | | 421 | | — | | — | | 717 | | 87.9% | 267 | | Dillard's, JCPenney, Target |
| 13 | | | Coral Ridge Mall | 90% | Coralville, IA | 539 | | — | | 442 | | — | | 25 | | 1,007 | | 94.8% | 509 | | Dillard's, Scheels, JCPenney, Target, Homegoods, Best Buy, Ulta |
| 14 | | | Crossroads Center | 90% | St. Cloud, MN | 423 | | 168 | | 229 | | — | | — | | 819 | | 82.9% | 533 | | Macy's, Scheels, JCPenney, Target |
| 15 | | | Deerbrook Mall | 90% | Humble, TX | 634 | | — | | 654 | | — | | — | | 1,287 | | 96.1% | 572 | | Dillard's, Macy's, JCPenney, AMC Theaters, Dick's Sporting Goods |
| 16 | | | Eastridge Mall | 90% | Casper, WY | 281 | | 214 | | 76 | | — | | — | | 571 | | 82.7% | 447 | | JCPenney, Dick's Sporting Goods, Target |
| 17 | | | Four Seasons Town Centre | 90% | Greensboro, NC | 490 | | 294 | | 202 | | — | | — | | 986 | | 90.8% | 707 | | Dillard's, JCPenney, Round 1 Bowling |
| 18 | | | Fox River Mall | 90% | Appleton, WI | 611 | | — | | 595 | | — | | — | | 1,206 | | 95% | 551 | | Macy's, Scheels, JCPenney, Target |
| 19 | | | Grand Teton Mall | 90% | Idaho Falls, ID | 210 | | 199 | | 125 | | 93 | | — | | 628 | | 88% | 454 | | Dillard's, JCPenney, Ross Dress For Less |
| 20 | | | Greenwood Mall | 90% | Bowling Green, KY | 423 | | 278 | | 151 | | — | | — | | 852 | | 89% | 633 | | Dillard's, Belk, JCPenney |
|
| | | | | | | | | | | | | | | | | | | | | |
Property Count | | Property Name | BPR Ownership (2) | Location | Mall and Freestanding GLA | Anchor GLA (BPR Owned) | Anchor GLA (Tenant Owned) | Strip Center GLA | Office GLA | Total GLA | Retail Percentage Leased | Proportionate GLA | Key Stores (3) |
| | | | | | | | | | | | | | |
| Consolidated Retail Properties | |
| |
| |
| |
| | | | | |
| 1 |
| | 200 Lafayette | 90% | New York, NY | 30 |
| — |
| — |
| — |
| — |
| 30 |
| 100% | 27 |
| |
| 2 |
| | 218 W 57th Street | 90% | New York, NY | 35 |
| — |
| — |
| — |
| — |
| 35 |
| 100% | 32 |
| |
| 3 |
| | 605 North Michigan Avenue | 90% | Chicago, IL | 58 |
| — |
| — |
| — |
| — |
| 58 |
| 100% | 52 |
| Sephora, Chase Bank, Regus, Roots |
| 4 |
| | 530 Fifth Avenue | 81% | New York, NY | 46 |
| — |
| — |
| — |
| — |
| 46 |
| 100% | 38 |
| Chase Bank, Duane Reade, Vans |
| 5 |
| | 685 Fifth Avenue | 88% | New York, NY | 24 |
| — |
| — |
| — |
| — |
| 24 |
| 100% | 21 |
| Coach, Stuart Weitzman, Tag Heuer |
| 6 |
| | 830 N. Michigan Ave. | 90% | Chicago, IL | 117 |
| — |
| — |
| — |
| — |
| 117 |
| 100% | 106 |
| Uniqlo, Topshop |
| 7 |
| | Beachwood Place | 90% | Beachwood, OH | 326 |
| 317 |
| 247 |
| 97 |
| — |
| 988 |
| 98.7% | 668 |
| Dillard's, Nordstrom, Saks Fifth Avenue |
| 8 |
| | Bellis Fair | 90% | Bellingham, WA | 437 |
| 100 |
| 238 |
| — |
| — |
| 776 |
| 88.2% | 485 |
| JCPenney, Kohl's, Macy's, Target, Dick's Sporting Goods |
| 9 |
| | Brass Mill Center | 90% | Waterbury, CT | 440 |
| 218 |
| 319 |
| 188 |
| — |
| 1,166 |
| 94.5% | 764 |
| Burlington Stores, JCPenney, Macy's, Regal Cinemas |
| 10 |
| | Coastland Center (1) | 90% | Naples, FL | 341 |
| 276 |
| 315 |
| — |
| — |
| 931 |
| 94.7% | 556 |
| Dillard's, JCPenney, Macy's |
| 11 |
| | Columbia Mall | 90% | Columbia, MO | 306 |
| 86 |
| 335 |
| — |
| — |
| 728 |
| 87.9% | 354 |
| Dillard's, JCPenney, Target |
| 12 |
| | Coral Ridge Mall | 90% | Coralville, IA | 608 |
| — |
| 442 |
| — |
| — |
| 1,051 |
| 96.6% | 549 |
| Best Buy, Dillard's, JCPenney, Target, Home Goods, Scheels, Ulta |
| 13 |
| | Crossroads Center | 90% | St. Cloud, MN | 377 |
| 294 |
| 229 |
| — |
| — |
| 900 |
| 96.6% | 605 |
| JCPenney, Macy's, Target, Scheels |
| 14 |
| | Deerbrook Mall | 90% | Humble, TX | 641 |
| — |
| 654 |
| — |
| — |
| 1,294 |
| 95.9% | 578 |
| AMC Theaters, Dillard's, JCPenney, Macy's, Dick's Sporting Goods |
| 15 |
| | Eastridge Mall | 90% | Casper, WY | 281 |
| 214 |
| 76 |
| — |
| — |
| 571 |
| 80.2% | 447 |
| JCPenney, Macy's, Target, Dick's Sporting Goods |
| 16 |
| | Four Seasons Town Centre | 90% | Greensboro, NC | 507 |
| 294 |
| 212 |
| — |
| — |
| 1,013 |
| 97.1% | 723 |
| Dillard's, JCPenney, Round 1 Bowling & Amusement |
| 17 |
| | Fox River Mall | 90% | Appleton, WI | 600 |
| 30 |
| 565 |
| — |
| — |
| 1,195 |
| 96.6% | 569 |
| JCPenney, Macy's, Target, Scheels |
| 18 |
| | Grand Teton Mall | 90% | Idaho Falls, ID | 214 |
| 199 |
| 125 |
| 93 |
| — |
| 631 |
| 91% | 457 |
| Dillard's, JCPenney, Macy's, Ross Dress For Less |
| | | | | | | | | | | | | | | | | | | | | | | | | | | | | | | | | | | | | | | | | |
Property
Count | | Property Name | BPYU Ownership (2) | Location | Mall and Freestanding GLA | Anchor GLA (BPYU Owned) | Anchor GLA (Tenant Owned) | Strip Center GLA | Office GLA | Total GLA | Retail Percentage Leased | Proportionate GLA | Key Stores (3) |
| 21 | | | Hulen Mall | 90% | Ft. Worth, TX | 394 | | — | | 597 | | — | | — | | 990 | | 94% | 355 | | Dillard's, Macy's |
| 22 | | | Jordan Creek Town Center | 90% | West Des Moines, IA | 732 | | 152 | | 198 | | 252 | | — | | 1,334 | | 95.8% | 1,025 | | Von Maur, Dillard's, Scheels, Century Theaters |
| 23 | | | Mall Of Louisiana | 90% | Baton Rouge, LA | 602 | | — | | 806 | | 144 | | — | | 1,551 | | 95.4% | 673 | | Dillard's, Macy's, JCPenney, Nordstrom Rack, AMC Theaters, Dick's Sporting Goods, Main Event |
| 24 | | | Mall St. Matthews | 90% | Louisville, KY | 499 | | — | | 514 | | — | | — | | 1,013 | | 88.6% | 450 | | Dillard's, Cinemark, JCPenney, Dave & Buster's |
| 25 | | | Mayfair | 90% | Wauwatosa, WI | 632 | | 289 | | 360 | | — | | 188 | | 1,469 | | 97.8% | 1,000 | | Nordstrom, Macy's, AMC Theaters, Crate & Barrel |
| 26 | | | Meadows Mall | 90% | Las Vegas, NV | 309 | | — | | 637 | | — | | — | | 945 | | 84.9% | 279 | | Dillard's, Macy's, JCPenney, Round 1 Bowling |
| 27 | | | Mondawmin Mall | 90% | Baltimore, MD | 384 | | — | | — | | — | | 74 | | 458 | | 98.4% | 413 | | Ross Dress for Less, Shoppers Food & Pharmacy |
| 28 | | | Neshaminy Mall | 90% | Bensalem, PA | 382 | | 416 | | 218 | | — | | — | | 1,016 | | 73.3% | 720 | | Barnes & Noble, Boscov's, AMC Theaters, Round 1 Bowling |
| 29 | | | North Point Mall (4) | 90% | Alpharetta, GA | 400 | | 540 | | 363 | | — | | 25 | | 1,328 | | 88.1% | 871 | | Von Maur, Dillard's, Macy's, JCPenney |
| 30 | | | North Star Mall | 90% | San Antonio, TX | 516 | | 207 | | 522 | | — | | — | | 1,245 | | 95.6% | 652 | | Dillard's, Macy's, Saks Fifth Avenue, JCPenney |
| 31 | | | Northtown Mall | 90% | Spokane, WA | 431 | | 242 | | 242 | | — | | — | | 915 | | 89.4% | 607 | | Kohl's, JCPenney, Regal Cinemas |
| 32 | | | Oakwood Center | 90% | Gretna, LA | 355 | | 229 | | 332 | | — | | — | | 916 | | 88.9% | 528 | | Dillard's, JCPenney, Dick's Sporting Goods |
| 33 | | | Oakwood Mall | 90% | Eau Claire, WI | 462 | | 146 | | 198 | | — | | — | | 806 | | 91.1% | 549 | | JCPenney, Scheels, Hobby Lobby |
| 34 | | | Oxmoor Center (1) | 85% | Louisville, KY | 313 | | 296 | | 271 | | — | | — | | 880 | | 91.6% | 519 | | Von Maur, Macy's, Dick's Sporting Goods, Top Golf |
| 35 | | | Paramus Park | 90% | Paramus, NJ | 374 | | — | | 289 | | — | | 21 | | 684 | | 81.6% | 357 | | Macy's, Stew Leonard's |
| 36 | | | Park City Center | 90% | Lancaster, PA | 523 | | 515 | | 227 | | — | | 7 | | 1,271 | | 89.3% | 943 | | Boscov's, Kohl's, JCPenney |
| 37 | | | Park Meadows | 90% | Lone Tree, CO | 732 | | — | | 823 | | — | | — | | 1,555 | | 98% | 661 | | Nordstrom, Dillard's, Macy's, JCPenney, Dick's Sporting Goods |
| 38 | | | Peachtree Mall | 90% | Columbus, GA | 385 | | 222 | | 201 | | — | | 13 | | 821 | | 92.3% | 559 | | Dillard's, Macy's, At Home, JCPenney |
| 39 | | | Pecanland Mall | 90% | Monroe, LA | 410 | | 20 | | 532 | | — | | — | | 962 | | 82.3% | 388 | | Dillard's, Belk, JCPenney, Dick's Sporting Goods |
| 40 | | | Perimeter Mall | 90% | Atlanta, GA | 506 | | 222 | | 831 | | — | | — | | 1,559 | | 95.8% | 657 | | Nordstrom, Von Maur, Dillard's, Macy's |
| 41 | | | Pioneer Place (1) | 90% | Portland, OR | 318 | | — | | — | | — | | — | | 318 | | 92.1% | 287 | | Apple, Tiffany's, Louis Vuitton, H&M, Zara, WeWork |
| 42 | | | Prince Kuhio Plaza (1) | 90% | Hilo, HI | 308 | | 125 | | 62 | | — | | — | | 494 | | 90.6% | 390 | | Macy's, TJ Maxx, Tractor Supply, CVS |
| 43 | | | Providence Place (1) | 85% | Providence, RI | 652 | | 279 | | 200 | | — | | — | | 1,131 | | 96.6% | 793 | | Macy's, Boscov's, Providence Place Cinemas, Dave & Buster's |
| 44 | | | Quail Springs Mall | 90% | Oklahoma City, OK | 389 | | 160 | | 537 | | — | | — | | 1,086 | | 88.8% | 495 | | Von Maur, Dillard's, JCPenney, AMC Theaters, Lifetime Fitness, Round 1 Bowling |
| 45 | | | River Hills Mall | 90% | Mankato, MN | 368 | | 180 | | 174 | | — | | — | | 722 | | 87% | 494 | | Scheels, JCPenney, Target |
| 46 | | | Rivertown Crossings | 90% | Grandville, MI | 637 | | 150 | | 486 | | — | | — | | 1,273 | | 88.5% | 710 | | Macy's, Kohl's, JCPenney, Dick's Sporting Goods, Round 1 Bowling |
| 47 | | | Shops at Merrick Park (1) | 90% | Coral Gables, FL | 414 | | — | | 330 | | — | | 101 | | 845 | | 93% | 465 | | Neiman Marcus, Nordstrom, Equinox |
| 48 | | | Sooner Mall | 90% | Norman, OK | 243 | | 135 | | 137 | | — | | — | | 515 | | 91.1% | 341 | | Dillard's, JCPenney |
|
| | | | | | | | | | | | | | | | | | | | | |
Property Count | | Property Name | BPR Ownership (2) | Location | Mall and Freestanding GLA | Anchor GLA (BPR Owned) | Anchor GLA (Tenant Owned) | Strip Center GLA | Office GLA | Total GLA | Retail Percentage Leased | Proportionate GLA | Key Stores (3) |
| 19 |
| | Greenwood Mall | 90% | Bowling Green, KY | 425 |
| 278 |
| 151 |
| — |
| — |
| 854 |
| 94.1% | 634 |
| Dillard's, JCPenney, Belk |
| 20 |
| | Hulen Mall | 90% | Ft. Worth, TX | 393 |
| — |
| 597 |
| — |
| — |
| 989 |
| 95.4% | 354 |
| Dillard's, Macy's |
| 21 |
| | Jordan Creek Town Center | 90% | West Des Moines, IA | 749 |
| 156 |
| 198 |
| 264 |
| — |
| 1,366 |
| 98.6% | 1,055 |
| Dillard's, Von Maur, Century Theaters, Scheels |
| 22 |
| | Mall of Louisiana | 90% | Baton Rouge, LA | 583 |
| — |
| 806 |
| 144 |
| — |
| 1,533 |
| 97% | 656 |
| Dillard's, JCPenney, Macy's, Nordstrom Rack, AMC Theaters, Dick's Sporting Goods, Main Event |
| 23 |
| | Mall St. Matthews | 90% | Louisville, KY | 498 |
| — |
| 514 |
| — |
| — |
| 1,012 |
| 94.6% | 450 |
| Dillard's, JCPenney, Cinemark |
| 24 |
| | Mayfair | 90% | Wauwatosa, WI | 633 |
| 289 |
| 360 |
| — |
| 309 |
| 1,591 |
| 96.4% | 1,110 |
| Macy's, Nordstrom, AMC Theaters |
| 25 |
| | Meadows Mall | 90% | Las Vegas, NV | 309 |
| — |
| 637 |
| — |
| — |
| 946 |
| 97.2% | 279 |
| Curacao, Dillard's, JCPenney, Macy's |
| 26 |
| | Mondawmin Mall | 90% | Baltimore, MD | 386 |
| — |
| — |
| — |
| 74 |
| 459 |
| 99.8% | 415 |
| Ross Dress for Less, Marshalls, Shoppers Food & Pharmacy |
| 27 |
| | Neshaminy Mall | 90% | Bensalem, PA | 384 |
| 416 |
| 218 |
| — |
| — |
| 1,018 |
| 93% | 722 |
| Barnes & Noble, Boscov's, AMC Theaters, Main Event |
| 28 |
| | North Point Mall | 90% | Alpharetta, GA | 410 |
| 540 |
| 363 |
| — |
| 24 |
| 1,337 |
| 93% | 879 |
| Dillard's, JCPenney, Macy's, Von Maur, American Girl |
| 29 |
| | North Star Mall | 90% | San Antonio, TX | 518 |
| 207 |
| 522 |
| — |
| — |
| 1,248 |
| 98.2% | 655 |
| Dillard's, JCPenney, Macy's, Saks Fifth Avenue |
| 30 |
| | Northtown Mall (1) | 90% | Spokane, WA | 439 |
| 242 |
| 242 |
| — |
| — |
| 924 |
| 94.3% | 615 |
| JCPenney, Kohl's, Macy's, Regal Cinemas |
| 31 |
| | Oakwood Center | 90% | Gretna, LA | 400 |
| 182 |
| 332 |
| — |
| — |
| 914 |
| 97.9% | 525 |
| Dillard's, JCPenney, Dick's Sporting Goods |
| 32 |
| | Oakwood Mall | 90% | Eau Claire, WI | 468 |
| 146 |
| 198 |
| — |
| — |
| 812 |
| 93.3% | 554 |
| JCPenney, Hobby Lobby, Scheels |
| 33 |
| | Oxmoor Center (1) | 85% | Louisville, KY | 318 |
| 296 |
| 271 |
| — |
| — |
| 885 |
| 95.3% | 523 |
| Macy's, Von Maur, Dick's Sporting Goods |
| 34 |
| | Paramus Park | 90% | Paramus, NJ | 301 |
| — |
| 289 |
| — |
| — |
| 591 |
| 97.2% | 272 |
| Macy's, Stew Leonard's |
| 35 |
| | Park City Center | 90% | Lancaster, PA | 508 |
| 515 |
| 385 |
| — |
| 7 |
| 1,415 |
| 92.1% | 929 |
| Boscov's, JCPenney, Kohl's |
| 36 |
| | Peachtree Mall | 90% | Columbus, GA | 385 |
| 222 |
| 201 |
| — |
| 13 |
| 821 |
| 98.2% | 559 |
| Dillard's, JCPenney, Macy's, At Home |
| 37 |
| | Pecanland Mall | 90% | Monroe, LA | 346 |
| 20 |
| 595 |
| — |
| — |
| 961 |
| 92.8% | 330 |
| Belk, Dillard's, JCPenney, Dick's Sporting Goods |
| 38 |
| | Pioneer Place (1) | 90% | Portland, OR | 326 |
| — |
| — |
| — |
| — |
| 326 |
| 92.8% | 295 |
| We Work, Apple, H&M, Tiffany's, Zara, Louis Vuitton |
| 39 |
| | Prince Kuhio Plaza (1) | 90% | Hilo, HI | 268 |
| 125 |
| 62 |
| — |
| — |
| 454 |
| 93.7% | 354 |
| Macy's, TJ Maxx |
| 40 |
| | Providence Place (1) | 85% | Providence, RI | 714 |
| 233 |
| 200 |
| — |
| 4 |
| 1,151 |
| 98.6% | 810 |
| Macy's, Providence Place Theater, Dave & Buster's |
| 41 |
| | Quail Springs Mall | 90% | Oklahoma City, OK | 451 |
| 160 |
| 360 |
| — |
| — |
| 971 |
| 88.2% | 552 |
| Dillard's, JCPenney, Von Maur, Lifetime Fitness, AMC Theaters |
| 42 |
| | River Hills Mall | 90% | Mankato, MN | 373 |
| 180 |
| 174 |
| — |
| — |
| 727 |
| 94.4% | 499 |
| JCPenney, Target, Scheels |
| 43 |
| | Rivertown Crossings | 90% | Grandville, MI | 630 |
| — |
| 636 |
| — |
| — |
| 1,265 |
| 95.5% | 568 |
| JCPenney, Kohl's, Macy's, Dick's Sporting Goods |
| 44 |
| | Sooner Mall | 90% | Norman, OK | 243 |
| 135 |
| 137 |
| — |
| — |
| 515 |
| 86.3% | 341 |
| Dillard's, JCPenney |
| 45 |
| | Southwest Plaza | 90% | Littleton, CO | 682 |
| 35 |
| 542 |
| — |
| 64 |
| 1,322 |
| 99% | 704 |
| Dillard's, JCPenney, Macy's, Target, Dick's Sporting Goods |
| | | | | | | | | | | | | | | | | | | | | | | | | | | | | | | | | | | | | | | | | |
Property
Count | | Property Name | BPYU Ownership (2) | Location | Mall and Freestanding GLA | Anchor GLA (BPYU Owned) | Anchor GLA (Tenant Owned) | Strip Center GLA | Office GLA | Total GLA | Retail Percentage Leased | Proportionate GLA | Key Stores (3) |
| 49 | | | Southwest Plaza | 90% | Littleton, CO | 684 | | 35 | | 542 | | — | | 62 | | 1,323 | | 93.9% | 705 | | Dillard's, JCPenney, Target, Dick's Sporting Goods |
| 50 | | | Spokane Valley Mall | 90% | Spokane, WA | 326 | | 126 | | 251 | | 138 | | — | | 841 | | 87.7% | 532 | | Macy's, JCPenney, Nordstrom Rack, Dick's Sporting Goods, Regal Cinemas |
| 51 | | | Staten Island Mall | 90% | Staten Island, NY | 854 | | 50 | | 467 | | 83 | | — | | 1,454 | | 92.4% | 891 | | Primark, Macy's, JCPenney, AMC Theaters, Dave & Buster's |
| 52 | | | Stonestown Galleria | 90% | San Francisco, CA | 406 | | 161 | | — | | — | | — | | 567 | | 92.1% | 512 | | Regal Cinemas, Whole Foods, Trader Joe's, Target, The Sports Basement |
| 53 | | | The Shoppes At Buckland Hills | 90% | Manchester, CT | 554 | | — | | 513 | | — | | — | | 1,067 | | 92% | 500 | | Macy's, JCPenney, Dick's Sporting Goods |
| 54 | | | The Streets At Southpoint | 85% | Durham, NC | 598 | | — | | 726 | | — | | — | | 1,325 | | 95.7% | 510 | | Nordstrom, Macy's, Belk, JCPenney, Barnes & Noble |
| 55 | | | The Woodlands Mall | 90% | Woodlands, TX | 714 | | — | | 713 | | — | | 42 | | 1,469 | | 95.6% | 682 | | Nordstrom, Macy's, Dillard's, JCPenney, Dick's Sporting Goods |
| 56 | | | Town East Mall | 90% | Mesquite, TX | 454 | | — | | 809 | | — | | — | | 1,264 | | 94.5% | 410 | | Dillard's, Macy's, JCPenney, Dick's Sporting Goods |
| 57 | | | Towson Town Center | 90% | Towson, MD | 615 | | — | | 419 | | — | | — | | 1,034 | | 88.7% | 555 | | Nordstrom, Macy's, Round 1 Bowling, Crate & Barrel |
| 58 | | | Tysons Galleria | 90% | McLean, VA | 294 | | 260 | | 252 | | — | | — | | 806 | | 92.3% | 500 | | Neiman Marcus, Saks Fifth Avenue, Bowlero |
| 59 | | | Valley Plaza Mall | 90% | Bakersfield, CA | 533 | | 270 | | 292 | | — | | — | | 1,095 | | 96.5% | 725 | | Macy's, JCPenney, Target |
| 60 | | | Visalia Mall | 90% | Visalia, CA | 182 | | 257 | | — | | — | | — | | 439 | | 93.8% | 396 | | Macy's, JCPenney |
| 61 | | | Water Tower Place | 85% | Chicago, IL | 411 | | 297 | | — | | — | | 86 | | 794 | | 90.8% | 673 | | American Girl |
| 62 | | | Westlake Center | 90% | Seattle, WA | 126 | | — | | — | | — | | — | | 126 | | 95.1% | 114 | | Saks Off Fifth, Nordstrom Rack, Zara |
| 63 | | | Willowbrook (1) | 90% | Wayne, NJ | 565 | | 128 | | 738 | | — | | — | | 1,432 | | 96.8% | 626 | | Bloomingdale's, Macy's, Lord & Taylor, Cinemark, Dave & Buster's |
| | Total Consolidated Retail Properties | | 25,737 | | 8,222 | | 19,825 | | 996 | | 645 | | 55,425 | | 91.4% | 31,971 | | |
| Unconsolidated Retail Properties | | | | | | | | | |
| 64 | | | Ala Moana Center (1) | 45% | Honolulu, HI | 1,299 | | 972 | | — | | 14 | | 363 | | 2,648 | | 93.3% | 1,195 | | Nordstrom, Bloomingdale's, Neiman Marcus, Macy's, Foodland Farms, Target |
| 65 | | | Alderwood | 45% | Lynnwood, WA | 580 | | 178 | | 528 | | 39 | | — | | 1,325 | | 98.4% | 360 | | Nordstrom, Macy's, JCPenney, Loews Cineplex |
| 66 | | | Altamonte Mall | 45% | Altamonte Springs, FL | 482 | | 331 | | 312 | | — | | — | | 1,125 | | 90.1% | 367 | | Dillard's, Macy's, JCPenney, AMC Theaters |
| 67 | | | Apache Mall (1) | 46% | Rochester, MN | 413 | | 206 | | 163 | | — | | — | | 782 | | 95.2% | 285 | | Macy's, Scheels, JCPenney |
| 68 | | | Augusta Mall (1) | 46% | Augusta, GA | 478 | | — | | 597 | | — | | — | | 1,075 | | 94.6% | 220 | | Dillard's, Macy's, JCPenney, Dick's Sporting Goods |
| 69 | | | Baybrook Mall | 46% | Friendswood, TX | 1,074 | | 97 | | 721 | | — | | — | | 1,891 | | 98.9% | 539 | | Dillard's, Macy's, JCPenney, Lifetime Fitness, Star Cinema Grill, Dick's Sporting Goods, Dave & Buster's |
| 70 | | | Boise Towne Square (1) | 46% | Boise, ID | 409 | | 426 | | 248 | | 115 | | — | | 1,197 | | 89.4% | 437 | | Dillard's, Macy's, Kohl's, JCPenney, Nordstrom Rack |
| 71 | | | Carolina Place | 45% | Pineville, NC | 533 | | 277 | | 349 | | — | | — | | 1,160 | | 92.6% | 366 | | Dillard's, Belk, JCPenney, Dave & Buster's, Dick's Sporting Goods |
|
| | | | | | | | | | | | | | | | | | | | | |
Property Count | | Property Name | BPR Ownership (2) | Location | Mall and Freestanding GLA | Anchor GLA (BPR Owned) | Anchor GLA (Tenant Owned) | Strip Center GLA | Office GLA | Total GLA | Retail Percentage Leased | Proportionate GLA | Key Stores (3) |
| 46 |
| | Spokane Valley Mall (1) | 90% | Spokane, WA | 352 |
| 126 |
| 251 |
| 138 |
| — |
| 867 |
| 96.2% | 556 |
| JCPenney, Macy's, Regal Cinemas, Nordstrom Rack, Dick's Sporting Goods |
| 47 |
| | Staten Island Mall | 90% | Staten Island, NY | 828 |
| 50 |
| 467 |
| 83 |
| — |
| 1,428 |
| 97.1% | 868 |
| Macy's, JCPenney, Primark, AMC Theaters, Dave & Buster's |
| 48 |
| | Stonestown Galleria | 90% | San Francisco, CA | 409 |
| 428 |
| — |
| — |
| — |
| 837 |
| 97.6% | 755 |
| Nordstrom, Target, Regal Cinemas, Trader Joe's, Whole Foods |
| 49 |
| | The Shoppes at Buckland Hills | 90% | Manchester, CT | 544 |
| — |
| 513 |
| — |
| — |
| 1,057 |
| 97.3% | 491 |
| JCPenney, Macy's, Dick's Sporting Goods |
| 50 |
| | The Streets at Southpoint | 85% | Durham, NC | 608 |
| — |
| 726 |
| — |
| — |
| 1,334 |
| 98.6% | 518 |
| Belk, JCPenney, Macy's, Nordstrom |
| 51 |
| | The Woodlands Mall | 90% | Woodlands, TX | 700 |
| — |
| 713 |
| — |
| 42 |
| 1,455 |
| 98.6% | 669 |
| Dillard's, JCPenney, Macy's, Nordstrom, Dick's Sporting Goods |
| 52 |
| | Town East Mall | 90% | Mesquite, TX | 464 |
| — |
| 809 |
| — |
| — |
| 1,273 |
| 99.9% | 419 |
| Dillard's, JCPenney, Macy's, Dick's Sporting Goods |
| 53 |
| | Tysons Galleria | 90% | McLean, VA | 294 |
| 260 |
| 252 |
| — |
| — |
| 806 |
| 95.8% | 500 |
| Neiman Marcus, Saks Fifth Avenue |
| 54 |
| | Valley Plaza Mall | 90% | Bakersfield, CA | 550 |
| 311 |
| 292 |
| — |
| — |
| 1,152 |
| 99.7% | 776 |
| JCPenney, Macy's, Target |
| 55 |
| | Visalia Mall | 90% | Visalia, CA | 179 |
| 257 |
| — |
| — |
| — |
| 436 |
| 94.4% | 393 |
| JCPenney, Macy's |
| 56 |
| | Westlake Center | 90% | Seattle, WA | 133 |
| — |
| — |
| — |
| — |
| 133 |
| 99.6% | 120 |
| Saks Off Fifth, Nordstrom Rack |
| 57 |
| | Willowbrook (1) | 90% | Wayne, NJ | 529 |
| 128 |
| 738 |
| — |
| — |
| 1,395 |
| 98.9% | 593 |
| Bloomingdale's, Lord & Taylor, Macy's, Cinemark, Dave & Buster's |
| | | Total Consolidated Retail Properties | | 23,116 |
| 7,964 |
| 17,510 |
| 1,008 |
| 536 |
| 50,134 |
| 95.8% | 29,329 |
| |
| Unconsolidated Retail Properties | | | | | | | | | |
| 58 |
| | 85 Fifth Avenue | 45% | New York, NY | 13 |
| — |
| — |
| — |
| — |
| 13 |
| 100% | 6 |
| Anthropologie |
| 59 |
| | 522 Fifth Avenue | 9% | New York, NY | 10 |
| — |
| — |
| — |
| — |
| 10 |
| N/A | 1 |
| |
| 60 |
| | 730 Fifth Avenue | 45% | New York, NY | 25 |
| — |
| — |
| — |
| 38 |
| 63 |
| 100% | 28 |
| Bulgari, Mikimoto, Piaget, Zegna |
| 61 |
| | Ala Moana Center (1) | 45% | Honolulu, HI | 1,309 |
| 972 |
| — |
| 14 |
| 364 |
| 2,659 |
| 96.6% | 1,200 |
| Foodland Farms, Macy's, Neiman Marcus, Target, Bloomingdale's, Nordstrom, Saks Fifth Avenue |
| 62 |
| | Alderwood | 45% | Lynnwood, WA | 588 |
| — |
| 706 |
| 39 |
| — |
| 1,333 |
| 98.6% | 283 |
| JCPenney, Macy's, Nordstrom, Loews Cineplex |
| 63 |
| | Altamonte Mall | 45% | Altamonte Springs, FL | 475 |
| 364 |
| 312 |
| — |
| — |
| 1,151 |
| 97.4% | 379 |
| Dillard's, JCPenney, Macy's, AMC Theaters |
| 64 |
| | Apache Mall (1) | 46% | Rochester, MN | 410 |
| 206 |
| 163 |
| — |
| — |
| 779 |
| 96.6% | 284 |
| JCPenney, Macy's, Scheels |
| 65 |
| | Augusta Mall (1) | 46% | Augusta, GA | 497 |
| — |
| 597 |
| — |
| — |
| 1,095 |
| 98.6% | 229 |
| Dillard's, JCPenney, Macy's, Dick's Sporting Goods |
| 66 |
| | Baybrook Mall | 46% | Friendswood, TX | 1,065 |
| 97 |
| 721 |
| — |
| — |
| 1,882 |
| 99.6% | 535 |
| Dillard's, JCPenney, Lifetime Fitness, Macy's, Star Cinema Grill, Dick's Sporting Goods, Dave & Buster's |
| 67 |
| | Bayside Marketplace | 11% | Miami, FL | 206 |
| — |
| — |
| — |
| 1 |
| 208 |
| 77.3% | 22 |
| |
| 68 |
| | Boise Towne Square (1) | 46% | Boise, ID | 422 |
| 426 |
| 248 |
| 115 |
| — |
| 1,210 |
| 92.1% | 443 |
| Dillard's, JCPenney, Kohl's, Macy's, Nordstrom Rack |
| 69 |
| | Bridgewater Commons | 32% | Bridgewater, NJ | 413 |
| 151 |
| 352 |
| 93 |
| — |
| 1,009 |
| 98.9% | 207 |
| Bloomingdale's, Lord & Taylor, Macy's, AMC Theaters |
| | | | | | | | | | | | | | | | | | | | | | | | | | | | | | | | | | | | | | | | | |
Property
Count | | Property Name | BPYU Ownership (2) | Location | Mall and Freestanding GLA | Anchor GLA (BPYU Owned) | Anchor GLA (Tenant Owned) | Strip Center GLA | Office GLA | Total GLA | Retail Percentage Leased | Proportionate GLA | Key Stores (3) |
| 72 | | | Christiana Mall | 23% | Newark, DE | 610 | | — | | 641 | | — | | — | | 1,251 | | 97.9% | 138 | | Nordstrom, Macy's, JCPenney, Cinemark, Cabela's, Target |
| 73 | | | Clackamas Town Center | 45% | Happy Valley, OR | 627 | | — | | 775 | | — | | — | | 1,402 | | 94.6% | 283 | | Macy's, JCPenney, Century Theatres, Dave & Buster's |
| 74 | | | Columbiana Centre | 46% | Columbia, SC | 294 | | 145 | | 361 | | — | | — | | 800 | | 96.2% | 202 | | Dillard's, Belk, JCPenney, Dave & Buster's |
| 75 | | | Coronado Center (1) | 46% | Albuquerque, NM | 663 | | 118 | | 281 | | — | | — | | 1,062 | | 97.2% | 359 | | Macy's, Kohl's, JCPenney, Dick's Sporting Goods, Round 1 Bowling, Furniture City |
| 76 | | | Cumberland Mall | 46% | Atlanta, GA | 624 | | 155 | | 278 | | — | | — | | 1,058 | | 96.9% | 359 | | Macy's, Costco, Dick's Sporting Goods, Round 1 Bowling |
| 77 | | | Fashion Place (1) | 46% | Murray, UT | 466 | | 162 | | 338 | | — | | — | | 965 | | 99% | 289 | | Nordstrom, Dillard's, Macy's, Crate & Barrel |
| 78 | | | Fashion Show | 45% | Las Vegas, NV | 846 | | 272 | | 762 | | — | | — | | 1,879 | | 93.1% | 504 | | Neiman Marcus, Nordstrom, Saks Fifth Avenue, Dillard's, Macy's, Macy's Men, Dick's Sporting Goods |
| 79 | | | First Colony Mall | 45% | Sugar Land, TX | 541 | | — | | 619 | | — | | — | | 1,160 | | 98.5% | 244 | | Dillard's, Macy's, JCPenney, Dick's Sporting Goods, AMC Theaters |
| 80 | | | Florence Mall (4) | 45% | Florence, KY | 380 | | — | | 552 | | — | | — | | 933 | | 76.3% | 172 | | Macy's, Macy's Home Store, JCPenney |
| 81 | | | Galleria At Tyler | 45% | Riverside, CA | 562 | | — | | 622 | | — | | — | | 1,184 | | 94.2% | 254 | | Macy's, JCPenney, AMC Theaters |
| 82 | | | Glenbrook Square | 46% | Fort Wayne, IN | 422 | | 556 | | — | | — | | — | | 978 | | 88.3% | 450 | | Macy's, JCPenney, Round 1 Bowling |
| 83 | | | Glendale Galleria (1) | 45% | Glendale, CA | 511 | | 305 | | 525 | | — | | 139 | | 1,479 | | 93.6% | 431 | | Bloomingdale's, Macy's, JCPenney, Target, Dick's Sporting Goods, Gold's Gym |
| 84 | | | Governor's Square (1) | 46% | Tallahassee, FL | 338 | | — | | 692 | | — | | — | | 1,030 | | 82.3% | 156 | | Dillard's, JCPenney |
| 85 | | | Kenwood Towne Centre | 45% | Cincinnati, OH | 516 | | 241 | | 401 | | — | | — | | 1,158 | | 93.5% | 342 | | Nordstrom, Dillard's, Macy's, Louis Vuitton, Tiffany |
| 86 | | | Lynnhaven Mall | 46% | Virginia Beach, VA | 650 | | 150 | | 381 | | — | | — | | 1,182 | | 97.1% | 368 | | Dillard's, Macy's, JCPenney, Dick's Sporting Goods, AMC Theaters, Dave & Buster's |
| 87 | | | Market Place Shopping Center | 46% | Champaign, IL | 412 | | 81 | | 307 | | — | | — | | 800 | | 94.6% | 227 | | Macy's, Kohl's, JCPenney, Dick's Sporting Goods |
| 88 | | | Miami Design District | 20% | Miami, FL | 664 | | — | | — | | — | | 87 | | 750 | | 86.4% | 151 | | Hermes, Fendi, Louis Vuitton, Valentino, Bulgari, Prada, Gucci |
| 89 | | | Mizner Park (1) | 23% | Boca Raton, FL | 147 | | 80 | | — | | — | | 264 | | 491 | | 96.1% | 113 | | Lord & Taylor, IPIC Theaters |
| 90 | | | Natick Mall (1) | 45% | Natick, MA | 934 | | 88 | | 558 | | — | | — | | 1,581 | | 92% | 461 | | Neiman Marcus, Nordstrom, Macy's, Lord & Taylor, Wegman's, Dave & Buster's |
| 91 | | | Northbrook Court | 45% | Northbrook, IL | 450 | | 406 | | 130 | | — | | — | | 986 | | 87.7% | 386 | | Neiman Marcus, Lord & Taylor, AMC Theaters, Crate & Barrel, Fresh Farm |
| 92 | | | Northridge Fashion Center | 46% | Northridge, CA | 651 | | 257 | | 557 | | — | | — | | 1,464 | | 94.5% | 418 | | Macy's, JCPenney, Dick's Sporting Goods, Pacific Theaters, Dave & Buster's, Gold's Gym |
| 93 | | | Oakbrook Center | 43% | Oak Brook, IL | 1,381 | | 284 | | 468 | | — | | 260 | | 2,393 | | 97.3% | 829 | | Neiman Marcus, Nordstrom, Macy's, AMC Theatres, Lifetime Fitness, KidZania |
| 94 | | | Oglethorpe Mall | 46% | Savannah, GA | 399 | | 221 | | 316 | | — | | — | | 936 | | 89.1% | 286 | | Macy's, Belk, JCPenney |
| 95 | | | One Union Square | 45% | San Francisco, CA | 23 | | — | | — | | — | | 20 | | 42 | | 97.6% | 19 | | Bulgari, Moncler |
|
| | | | | | | | | | | | | | | | | | | | | |
Property Count | | Property Name | BPR Ownership (2) | Location | Mall and Freestanding GLA | Anchor GLA (BPR Owned) | Anchor GLA (Tenant Owned) | Strip Center GLA | Office GLA | Total GLA | Retail Percentage Leased | Proportionate GLA | Key Stores (3) |
| 70 |
| | Carolina Place | 45% | Pineville, NC | 416 |
| 325 |
| 349 |
| — |
| — |
| 1,089 |
| 99.1% | 334 |
| Belk, Dillard's, JCPenney, Dave & Buster's |
| 71 |
| | Christiana Mall (1) | 23% | Newark, DE | 625 |
| — |
| 641 |
| — |
| — |
| 1,267 |
| 99.3% | 141 |
| JCPenney, Macy's, Nordstrom, Target, Cabela's, Cinemark |
| 72 |
| | Clackamas Town Center | 45% | Happy Valley, OR | 641 |
| — |
| 775 |
| — |
| — |
| 1,415 |
| 98.4% | 289 |
| JCPenney, Macy's, Nordstrom, Century Theatres, Dave & Buster's |
| 73 |
| | Columbiana Centre | 46% | Columbia, SC | 295 |
| 145 |
| 361 |
| — |
| — |
| 801 |
| 98% | 203 |
| Belk, Dillard's, JCPenney, Dave & Buster's |
| 74 |
| | Coronado Center (1) | 46% | Albuquerque, NM | 599 |
| 196 |
| 281 |
| — |
| — |
| 1,076 |
| 98% | 366 |
| JCPenney, Kohl's, Macy's, Dick's Sporting Goods |
| 75 |
| | Cumberland Mall | 46% | Atlanta, GA | 538 |
| 226 |
| 278 |
| — |
| — |
| 1,042 |
| 100% | 352 |
| Macy's, Costco |
| 76 |
| | Fashion Place (1) | 46% | Murray, UT | 466 |
| 162 |
| 338 |
| — |
| — |
| 966 |
| 98.3% | 289 |
| Dillard's, Nordstrom, Macy's |
| 77 |
| | Fashion Show | 45% | Las Vegas, NV | 844 |
| 272 |
| 762 |
| — |
| — |
| 1,878 |
| 99.2% | 504 |
| Dillard's, Macy's, Neiman Marcus, Nordstrom, Saks Fifth Avenue, Macy's Men, Dick's Sporting Goods |
| 78 |
| | First Colony Mall | 45% | Sugar Land, TX | 545 |
| — |
| 619 |
| — |
| — |
| 1,164 |
| 98.6% | 246 |
| Dillard's, JCPenney, Macy's, AMC Theaters, Dick's Sporting Goods |
| 79 |
| | Florence Mall | 45% | Florence, KY | 378 |
| — |
| 552 |
| — |
| — |
| 930 |
| 90.3% | 171 |
| JCPenney, Macy's |
| 80 |
| | Galleria at Tyler (1) | 45% | Riverside, CA | 553 |
| — |
| 468 |
| — |
| — |
| 1,021 |
| 97.6% | 250 |
| JCPenney, Macy's, Nordstrom, AMC Theaters |
| 81 |
| | Glenbrook Square | 46% | Fort Wayne, IN | 429 |
| 556 |
| 221 |
| — |
| — |
| 1,206 |
| 95.8% | 453.0 |
| JCPenney, Macy's |
| 82 |
| | Glendale Galleria (1) | 45% | Glendale, CA | 508 |
| 305 |
| 525 |
| — |
| 138 |
| 1,476 |
| 98.6% | 429 |
| Bloomingdale's, Dick's Sporting Goods, JCPenney, Macy's, Target, Gold's Gym |
| 83 |
| | Governor's Square (1) | 46% | Tallahassee, FL | 336 |
| — |
| 692 |
| — |
| — |
| 1,027 |
| 94.2% | 155 |
| Dillard's, JCPenney, Macy's |
| 84 |
| | Kenwood Towne Centre | 45% | Cincinnati, OH | 519 |
| 241 |
| 401 |
| — |
| — |
| 1,160 |
| 96.5% | 343 |
| Dillard's, Macy's, Louis Vuitton, Nordstrom, Tiffany |
| 85 |
| | Lynnhaven Mall | 46% | Virginia Beach, VA | 653 |
| 150 |
| 381 |
| — |
| — |
| 1,184 |
| 99.1% | 370 |
| Dillard's, JCPenney, Macy's, Dave & Buster's, AMC Theaters, Dick's Sporting Goods |
| 86 |
| | Market Place Shopping Center | 46% | Champaign, IL | 507 |
| 235 |
| 150 |
| — |
| — |
| 892 |
| 99.1% | 342 |
| JCPenney, Macy's , Dick's Sporting Goods, Kohl's |
| 87 |
| | Miami Design District | 20% | Miami, FL | 722 |
| — |
| — |
| — |
| 103 |
| 825 |
| 83.7% | 166 |
| Bulgari, Fendi, Gucci, Hermes, Louis Vuitton, Prada, Valentino |
| 88 |
| | Mizner Park (1) | 23% | Boca Raton, FL | 160 |
| 80 |
| — |
| — |
| 269 |
| 510 |
| 95.9% | 117 |
| Lord & Taylor, IPIC Theaters |
| 89 |
| | Natick Mall | 45% | Natick, MA | 924 |
| 88 |
| 558 |
| — |
| — |
| 1,570 |
| 97% | 456 |
| Lord & Taylor, Macy's, Neiman Marcus, Nordstrom, Wegman's |
| 90 |
| | Northbrook Court | 45% | Northbrook, IL | 477 |
| 406 |
| 130 |
| — |
| — |
| 1,013 |
| 94.1% | 398 |
| Lord & Taylor, Neiman Marcus, AMC Theaters |
| 91 |
| | Northridge Fashion Center | 46% | Northridge, CA | 664 |
| 257 |
| 557 |
| — |
| — |
| 1,478 |
| 98.7% | 424 |
| JCPenney, Macy's, Pacific Theaters, Dick's Sporting Goods, Dave & Buster's |
| 92 |
| | Oakbrook Center | 43% | Oak Brook, IL | 1,158 |
| 386 |
| 468 |
| — |
| 263 |
| 2,275 |
| 98.3% | 778 |
| Macy's, Neiman Marcus, Nordstrom, Lifetime Fitness, KidZania, AMC Theatres |
| 93 |
| | Oglethorpe Mall | 46% | Savannah, GA | 401 |
| 221 |
| 316 |
| — |
| — |
| 937 |
| 99.3% | 286 |
| Belk, JCPenney, Macy's |
| | | | | | | | | | | | | | | | | | | | | | | | | | | | | | | | | | | | | | | | | |
Property
Count | | Property Name | BPYU Ownership (2) | Location | Mall and Freestanding GLA | Anchor GLA (BPYU Owned) | Anchor GLA (Tenant Owned) | Strip Center GLA | Office GLA | Total GLA | Retail Percentage Leased | Proportionate GLA | Key Stores (3) |
| 96 | | | Otay Ranch Town Center | 45% | Chula Vista, CA | 535 | | — | | 140 | | — | | — | | 675 | | 91.9% | 242 | | Macy's, AMC Theaters, Barons Market |
| 97 | | | Park Place | 46% | Tucson, AZ | 455 | | — | | 584 | | — | | — | | 1,039 | | 90.7% | 209 | | Dillard's, Century Theatres, Round 1 Bowling |
| 98 | | | Pembroke Lakes Mall | 46% | Pembroke Pines, FL | 379 | | 353 | | 386 | | — | | — | | 1,119 | | 94.9% | 337 | | Dillard's, Macy's, JCPenney, AMC Theaters, Round 1 Bowling |
| 99 | | | Pinnacle Hills Promenade | 45% | Rogers, AR | 367 | | 99 | | 162 | | 306 | | 74 | | 1,008 | | 85.3% | 382 | | Dillard's, JCPenney, Malco Theatres, Dave & Buster's |
| 100 | | | Plaza Frontenac | 50% | St. Louis, MO | 219 | | 126 | | 135 | | — | | — | | 479 | | 94.1% | 171 | | Neiman Marcus, Saks Fifth Avenue |
| 101 | | | Ridgedale Center | 46% | Minnetonka, MN | 364 | | 177 | | 596 | | — | | — | | 1,137 | | 89.2% | 249 | | Nordstrom, Macy's, JCPenney |
| 102 | | | Riverchase Galleria | 46% | Hoover, AL | 514 | | 330 | | 610 | | — | | — | | 1,454 | | 88.2% | 388 | | Von Maur, Macy's, Belk, Belk Homestore, JCPenney, Dave & Buster's |
| 103 | | | Saint Louis Galleria | 66% | St. Louis, MO | 460 | | — | | 714 | | — | | — | | 1,174 | | 96.7% | 306 | | Nordstrom, Dillard's, Macy's |
| 104 | | | Stonebriar Centre | 45% | Frisco, TX | 925 | | 163 | | 703 | | — | | — | | 1,791 | | 97.7% | 491 | | Nordstrom, Dillard's, Macy's, JCPenney, Dick's Sporting Goods, AMC Theaters, KidZania |
| 105 | | | The Crossroads | 46% | Portage, MI | 259 | | 82 | | 421 | | — | | — | | 762 | | 84% | 157 | | Macy's, Burlington Stores, JCPenney |
| 106 | | | The Gallery At Harborplace | 46% | Baltimore, MD | 91 | | — | | — | | — | | 292 | | 383 | | 63% | 176 | | Victoria Secret, Footlocker, Forever 21, Spaces |
| 107 | | | The Grand Canal Shoppes | 45% | Las Vegas, NV | 642 | | — | | — | | — | | 43 | | 685 | | 96.8% | 310 | | Louis Vuitton, Tao Nightclub, Smith & Wollensky, Canaletto |
| 108 | | | The Maine Mall | 46% | South Portland, ME | 570 | | — | | 378 | | — | | 1 | | 948 | | 97.7% | 262 | | Macy's, JCPenney, Round 1 Bowling, Best Buy, Jordan's Furniture |
| 109 | | | The Mall In Columbia | 45% | Columbia, MD | 705 | | 213 | | 449 | | — | | — | | 1,367 | | 91.3% | 414 | | Nordstrom, Macy's, Lord & Taylor, JCPenney, AMC Theaters, Main Event, Barnes & Noble |
| 110 | | | The Oaks Mall | 46% | Gainesville, FL | 342 | | 233 | | 325 | | — | | — | | 900 | | 85.4% | 265 | | Dillard's, Belk, JCPenney |
| 111 | | | The Parks Mall at Arlington | 46% | Arlington, TX | 761 | | — | | 749 | | — | | 1 | | 1,510 | | 98% | 350 | | Dillard's, Macy's, JCPenney, Nordstrom Rack, Dick's Sporting Goods |
| 112 | | | The Shoppes at River Crossing | 45% | Macon, GA | 409 | | — | | 333 | | — | | — | | 742 | | 88.9% | 185 | | Dillard's, Belk, Dick's Sporting Goods |
| 113 | | | The Shops at La Cantera | 34% | San Antonio, TX | 623 | | — | | 628 | | — | | 71 | | 1,322 | | 96.9% | 235 | | Neiman Marcus, Nordstrom, Dillard's, Macy's |
| 114 | | | The Shops at The Bravern | 36% | Bellevue, WA | 161 | | 125 | | — | | — | | — | | 286 | | 95.5% | 103 | | Hermes, Louis Vuitton, Gucci, Lifetime Fitness |
| 115 | | | The SoNo Collection | 12% | Norwalk, CT | 373 | | 300 | | — | | — | | — | | 673 | | 86.8% | 78 | | Nordstrom, Bloomingdale's, Lillian August |
| 116 | | | Tucson Mall (1) | 46% | Tucson, AZ | 618 | | — | | 641 | | 27 | | — | | 1,287 | | 90% | 297 | | Dillard's, Macy's, JCPenney, Dick's Sporting Goods |
| 117 | | | Westroads Mall | 46% | Omaha, NE | 517 | | 173 | | 356 | | — | | — | | 1,046 | | 95.6% | 317 | | Von Maur, JCPenney, AMC Theaters, Dick's Sporting Goods |
| 118 | | | Whaler's Village | 45% | Lahaina, HI | 111 | | — | | — | | — | | 9 | | 120 | | 94.3% | 54 | | Louis Vuitton, Lululemon, Leilani's, Hula Grill |
| 119 | | | White Marsh Mall | 46% | Baltimore, MD | 434 | | 257 | | 466 | | — | | — | | 1,158 | | 91% | 318 | | Macy's, Macy's Home Store, Boscov's, JCPenney, Dave & Buster's |
| 120 | | | Willowbrook Mall | 45% | Houston, TX | 520 | | — | | 984 | | — | | — | | 1,504 | | 96.5% | 235 | | Dillard's, Macy's, JCPenney, Dick's Sporting Goods |
|
| | | | | | | | | | | | | | | | | | | | | |
Property Count | | Property Name | BPR Ownership (2) | Location | Mall and Freestanding GLA | Anchor GLA (BPR Owned) | Anchor GLA (Tenant Owned) | Strip Center GLA | Office GLA | Total GLA | Retail Percentage Leased | Proportionate GLA | Key Stores (3) |
| 94 |
| | Otay Ranch Town Center | 45% | Chula Vista, CA | 530 |
| — |
| 140 |
| — |
| — |
| 670 |
| 93.6% | 239 |
| Macy's, AMC Theaters |
| 95 |
| | Park Meadows | 32% | Lone Tree, CO | 740 |
| — |
| 823 |
| — |
| — |
| 1,563 |
| 97.9% | 234 |
| Dillard's, JCPenney, Macy's, Nordstrom, Dick's Sporting Goods |
| 96 |
| | Park Place | 46% | Tucson, AZ | 474 |
| — |
| 581 |
| — |
| — |
| 1,056 |
| 99% | 218 |
| Dillard's, Macy's, Century Theatres |
| 97 |
| | Pembroke Lakes Mall | 46% | Pembroke Pines, FL | 394 |
| 353 |
| 386 |
| — |
| — |
| 1,134 |
| 98.1% | 344 |
| Dillard's, JCPenney, Macy's, AMC Theaters |
| 98 |
| | Perimeter Mall | 45% | Atlanta, GA | 506 |
| 222 |
| 831 |
| — |
| — |
| 1,559 |
| 96.3% | 329 |
| Dillard's, Macy's, Nordstrom, Von Maur |
| 99 |
| | Pinnacle Hills Promenade | 45% | Rogers, AR | 375 |
| 99 |
| 162 |
| 302 |
| 73 |
| 1,012 |
| 92.4% | 383 |
| Dillard's, JCPenney, Malco Theatres, Dave & Buster's |
| 100 |
| | Plaza Frontenac | 50% | St. Louis, MO | 223 |
| 126 |
| 135 |
| — |
| — |
| 484 |
| 96.1% | 173 |
| Neiman Marcus, Saks Fifth Avenue |
| 101 |
| | Ridgedale Center | 46% | Minnetonka, MN | 374 |
| 205 |
| 596 |
| — |
| — |
| 1,175 |
| 95.5% | 266 |
| JCPenney, Macy's, Nordstrom |
| 102 |
| | Riverchase Galleria | 46% | Hoover, AL | 528 |
| 330 |
| 610 |
| — |
| — |
| 1,468 |
| 98.1% | 395 |
| Belk, JCPenney, Macy's, Von Maur |
| 103 |
| | Saint Louis Galleria | 66% | St. Louis, MO | 466 |
| — |
| 714 |
| — |
| — |
| 1,180 |
| 98.8% | 310 |
| Dillard's, Macy's, Nordstrom |
| 104 |
| | Stonebriar Centre | 45% | Frisco, TX | 863 |
| 163 |
| 703 |
| — |
| — |
| 1,729 |
| 99.2% | 463 |
| Dillard's, JCPenney, Macy's, Nordstrom, AMC Theaters, Dick's Sporting Goods |
| 105 |
| | The Crossroads | 46% | Portage, MI | 265 |
| — |
| 503 |
| — |
| — |
| 768 |
| 93.5% | 122 |
| Burlington Stores, JCPenney, Macy's |
| 106 |
| | The Gallery at Harborplace | 46% | Baltimore, MD | 98 |
| — |
| — |
| — |
| 292 |
| 390 |
| 89.1% | 180 |
| Victoria Secret, Footlocker, Forever 21 |
| 107 |
| | The Grand Canal Shoppes (1) | 45% | Las Vegas, NV | 635 |
| 85 |
| — |
| — |
| 37 |
| 757 |
| 98.2% | 342 |
| Barneys New York, Louis Vuitton, Tao Nightclub |
| 108 |
| | The Maine Mall | 46% | South Portland, ME | 496 |
| 121 |
| 378 |
| — |
| 1 |
| 995 |
| 98.7% | 284 |
| Best Buy, JCPenney, Macy's, Round 1 Bowling & Amusement |
| 109 |
| | The Mall in Columbia | 45% | Columbia, MD | 708 |
| 278 |
| 449 |
| — |
| — |
| 1,435 |
| 96.6% | 445 |
| JCPenney, Lord & Taylor, Macy's, Nordstrom, Main Event, Barnes & Noble, AMC Theaters |
| 110 |
| | The Oaks Mall | 46% | Gainesville, FL | 349 |
| 233 |
| 325 |
| — |
| — |
| 907 |
| 95.8% | 268 |
| Belk, Dillard's, JCPenney |
| 111 |
| | The Parks Mall at Arlington | 46% | Arlington, TX | 761 |
| — |
| 749 |
| — |
| 1 |
| 1,511 |
| 99.7% | 351 |
| Dillard's, JCPenney, Macy's, Nordstrom Rack, Dick's Sporting Goods |
| 112 |
| | The Shops at La Cantera | 34% | San Antonio, TX | 624 |
| — |
| 628 |
| — |
| 73 |
| 1,325 |
| 98.4% | 236 |
| Dillard's, Macy's, Neiman Marcus, Nordstrom |
| 113 |
| | The Shops at The Bravern | 36% | Bellevue, WA | 169 |
| 125 |
| — |
| — |
| — |
| 294 |
| 87% | 106 |
| Neiman Marcus, Gucci, Hermes, Lifetime Fitness, Louis Vuitton |
| 114 |
| | The Shoppes at River Crossing | 45% | Macon, GA | 418 |
| — |
| 333 |
| — |
| — |
| 751 |
| 96.6% | 189 |
| Belk, Dillard's, Dick's Sporting Goods |
| 115 |
| | Towson Town Center | 32% | Towson, MD | 604 |
| — |
| 419 |
| — |
| — |
| 1,023 |
| 91.5% | 191 |
| Macy's, Nordstrom |
| 116 |
| | Tucson Mall (1) | 46% | Tucson, AZ | 625 |
| — |
| 641 |
| 36 |
| — |
| 1,302 |
| 94.1% | 304 |
| Dillard's, Dick's Sporting Goods, JCPenney, Macy's |
| 117 |
| | One Union Square | 45% | San Francisco, CA | 22 |
| — |
| — |
| — |
| 20 |
| 42 |
| 100% | 19 |
| Bulgari, Moncler |
| 118 |
| | Shops at Merrick Park (1) | 50% | Coral Gables, FL | 412 |
| — |
| 330 |
| — |
| 101 |
| 844 |
| 98.3% | 255 |
| Neiman Marcus, Nordstrom |
| 119 |
| | Water Tower Place | 43% | Chicago, IL | 411 |
| 297 |
| — |
| — |
| 89 |
| 797 |
| 97% | 340 |
| Macy's, American Girl |
| 120 |
| | Westroads Mall | 46% | Omaha, NE | 531 |
| — |
| 529 |
| — |
| — |
| 1,060 |
| 97.1% | 245 |
| JCPenney, Von Maur, AMC Theaters, Dick's Sporting Goods |
|
| | | | | | | | | | | | | | | | | | | | | |
Property Count | | Property Name | BPR Ownership (2) | Location | Mall and Freestanding GLA | Anchor GLA (BPR Owned) | Anchor GLA (Tenant Owned) | Strip Center GLA | Office GLA | Total GLA | Retail Percentage Leased | Proportionate GLA | Key Stores (3) |
| 121 |
| | Whaler's Village | 45% | Lahaina, HI | 110 |
| — |
| — |
| — |
| 9 |
| 120 |
| 98.3% | 54 |
| Lululemon, Louis Vuitton |
| 122 |
| | White Marsh Mall | 46% | Baltimore, MD | 443 |
| 257 |
| 466 |
| — |
| — |
| 1,166 |
| 96.3% | 322 |
| JCPenney, Macy's, Boscov's, Macy's Home Store, Dave & Buster's |
| 123 |
| | Willowbrook Mall | 45% | Houston, TX | 532 |
| — |
| 984 |
| — |
| — |
| 1,517 |
| 99.7% | 240 |
| Dillard's, JCPenney, Macy's, Dick's Sporting Goods |
| 124 |
| | Woodbridge Center | 46% | Woodbridge, NJ | 634 |
| 458 |
| 561 |
| — |
| — |
| 1,653 |
| 96.2% | 503 |
| Boscov's, JCPenney, Lord & Taylor, Macy's, Dick's Sporting Goods |
| | | Total Unconsolidated Retail Properties | | | 33,117 |
| 9,817 |
| 25,897 |
| 599 |
| 1,870 |
| 71,301 |
| 96.9% | 19,826 |
| |
| | | Total Retail Properties | | | 56,233 |
| 17,781 |
| 43,407 |
| 1,607 |
| 2,406 |
| 121,435 |
| 96.5% | 49,155 |
| |
| | | | | | | | | | | | | | |
| OTHER RETAIL PROPERTIES |
| Property Count | | Property Name | BPR Ownership | Location | Mall and Freestanding GLA | Anchor GLA (BPR Owned) | Anchor GLA (Tenant Owned) | Strip Center GLA | Office GLA | Total GLA | Retail Percentage Leased | Proportionate GLA | Key Store |
| 125 |
| | Shopping Leblon | 32% | Rio de Janeiro, Brazil | 256 |
| — |
| — |
| — |
| — |
| 256 |
| 99.5% | 81 | |
| | | Total | | | 56,489 |
| 17,781 |
| 43,407 |
| 1,607 |
| 2,406 |
| 121,691 |
| 95.7% | 49,236 |
| |
| | | | | | | | | | | | | | | | | | | | | | | | | | | | | | | | | | | | | | | | | |
Property
Count | | Property Name | BPYU Ownership (2) | Location | Mall and Freestanding GLA | Anchor GLA (BPYU Owned) | Anchor GLA (Tenant Owned) | Strip Center GLA | Office GLA | Total GLA | Retail Percentage Leased | Proportionate GLA | Key Stores (3) |
| 121 | | | Woodbridge Center | 46% | Woodbridge, NJ | 629 | | 458 | | 561 | | — | | — | | 1,649 | | 93.7% | 501 | | Macy's, Lord & Taylor, Boscov's, JCPenney, Dick's Sporting Goods |
| | Total Unconsolidated Retail Properties | | | 30,361 | | 9,095 | | 22,801 | | 501 | | 1,622 | | 64,380 | | 93.5% | 18,239 | | |
| | Total Retail Properties | | | 56,098 | | 17,316 | | 42,626 | | 1,498 | | 2,267 | | 119,805 | | 96.4% | 50,210 | | |
| | | | | | | | | | | | | |
| OTHER RETAIL PROPERTIES |
| Property Count | | Property Name | BPYU Ownership | Location | Mall and Freestanding GLA | Anchor GLA (BPYU Owned) | Anchor GLA (Tenant Owned) | Strip Center GLA | Office GLA | Total GLA | Retail Percentage Leased | Proportionate GLA | Key Store |
| 122 | | | Shopping Leblon | 32% | Rio de Janeiro, Brazil | 221 | | 64 | | — | | — | | — | | 286 | | 99.3% | 90 | |
| | Total | | | 56,319 | | 17,380 | | 42,626 | | 1,498 | | 2,267 | | 120,091 | | 92.6% | 50,300 | | |
_______________________________________________________________________________(1) A portion of the property is subject to a ground lease.
(2) BPRBPYU Ownership is shown net of the noncontrolling interest of our institutional investor (Note 3).
(3) Stores identified by management as significant due to size, market significance, traffic generation, rent impact or other reasons.
(4) Property conveyed to the lender subsequent to December 31, 2020.
MORTGAGES, NOTES AND OTHER DEBT
The following table sets forth certain information regarding the mortgages and other indebtedness encumbering ourBPYU's consolidated properties and ourits Unconsolidated Real Estate Affiliates, as well as ourits unsecured corporate debt (dollars in millions).
| | | | | | | | | | | | | | | | | | | | | | | | | | | | | | | | | | | | | | | | | | | | | | | | | | | | | | | | | | | | | | | | | | | | | | | | | | | | | | | | | | | | | | | | | | | | | | | | | | | | | | | | | | | | | | | | | | | | | | | | | | | | | | | | | | | | | | |
| Property Name | | Location | | Interest
Rate | Maturity Date (1) | | BPYU
Ownership (2) | | Proportionate
Total | | 2021 | | 2022 | | 2023 | | 2024 | | 2025 | | Thereafter | | Mortgage Details | | | | | | | | | | | | | | | | | | | | |
| | | | | | | | | | | | | | | | | | | | | | | | | | | | | | | | | | | | | | | | | | | | |
| Consolidated Property Level | | | | | | | | | | | | | | | | | | | | | | | | | | | | | | | | | | | | | | | | | | | | |
| Mall St. Matthews | | Louisville,KY | | 2.72% | January | 2021 | | 90% | | $ | 154 | | | $ | 154 | | | — | | | $ | — | | | $ | — | | | $ | — | | | $ | — | | | Fixed | | | | | | | | | | | | | | | | | | | | |
| Water Tower Place | | Chicago,IL | | 4.32% | April | 2021 | | 85% | | 306 | | | 306 | | | — | | | — | | | — | | | — | | | — | | | Fixed | | | | | | | | | | | | | | | | | | | | |
| Deerbrook Mall | | Humble (Houston),TX | | 5.25% | April | 2021 | | 90% | | 116 | | | 116 | | | — | | | — | | | — | | | — | | | — | | | Fixed | | | | | | | | | | | | | | | | | | | | |
| Brass Mill Center | | Waterbury,CT | | 3.41% | April | 2021 | | 90% | | 57 | | | 57 | | | — | | | — | | | — | | | — | | | — | | | Floating | | | | | | | | | | | | | | | | | | | | |
| Columbia Mall | | Columbia,MO | | 3.41% | April | 2021 | | 90% | | 39 | | | 39 | | | — | | | — | | | — | | | — | | | — | | | Floating | | | | | | | | | | | | | | | | | | | | |
| Eastridge | | Casper,WY | | 3.41% | April | 2021 | | 90% | | 37 | | | 37 | | | — | | | — | | | — | | | — | | | — | | | Floating | | | | | | | | | | | | | | | | | | | | |
| Four Seasons | | Greensboro,NC | | 3.41% | April | 2021 | | 90% | | 26 | | | 26 | | | — | | | — | | | — | | | — | | | — | | | Floating | | | | | | | | | | | | | | | | | | | | |
| Grand Teton Mall | | Idaho Falls,ID | | 3.41% | April | 2021 | | 90% | | 37 | | | 37 | | | — | | | — | | | — | | | — | | | — | | | Floating | | | | | | | | | | | | | | | | | | | | |
| Mayfair | | Wauwatosa (Milwaukee),WI | | 3.41% | April | 2021 | | 90% | | 297 | | | 297 | | | — | | | — | | | — | | | — | | | — | | | Floating | | | | | | | | | | | | | | | | | | | | |
| Mondawmin Mall | | Baltimore,MD | | 3.41% | April | 2021 | | 90% | | 73 | | | 73 | | | — | | | — | | | — | | | — | | | — | | | Floating | | | | | | | | | | | | | | | | | | | | |
| North Town Mall | | Spokane,WA | | 3.41% | April | 2021 | | 90% | | 74 | | | 74 | | | — | | | — | | | — | | | — | | | — | | | Floating | | | | | | | | | | | | | | | | | | | | |
| Oakwood | | Eau Claire,WI | | 3.41% | April | 2021 | | 90% | | 61 | | | 61 | | | — | | | — | | | — | | | — | | | — | | | Floating | | | | | | | | | | | | | | | | | | | | |
| Oakwood Center | | Gretna,LA | | 3.41% | April | 2021 | | 90% | | 74 | | | 74 | | | — | | | — | | | — | | | — | | | — | | | Floating | | | | | | | | | | | | | | | | | | | | |
| Pioneer Place | | Portland,OR | | 3.41% | April | 2021 | | 90% | | 109 | | | 109 | | | — | | | — | | | — | | | — | | | — | | | Floating | | | | | | | | | | | | | | | | | | | | |
| Quail Springs Mall | | Oklahoma City,OK | | 3.41% | April | 2021 | | 90% | | 56 | | | 56 | | | — | | | — | | | — | | | — | | | — | | | Floating | | | | | | | | | | | | | | | | | | | | |
| River Hills Mall | | Mankato,MN | | 3.41% | April | 2021 | | 90% | | 59 | | | 59 | | | — | | | — | | | — | | | — | | | — | | | Floating | | | | | | | | | | | | | | | | | | | | |
| Sooner Mall | | Norman,OK | | 3.41% | April | 2021 | | 90% | | 60 | | | 60 | | | — | | | — | | | — | | | — | | | — | | | Floating | | | | | | | | | | | | | | | | | | | | |
| Southwest Plaza | | Littleton (Denver),CO | | 3.41% | April | 2021 | | 90% | | 99 | | | 99 | | | — | | | — | | | — | | | — | | | — | | | Floating | | | | | | | | | | | | | | | | | | | | |
| Providence Place | | Providence,RI | | 5.65% | May | 2021 | | 85% | | 275 | | | 275 | | | — | | | — | | | — | | | — | | | — | | | Fixed | | | | | | | | | | | | | | | | | | | | |
| Town East Mall | | Mesquite (Dallas),TX | | 3.57% | June | 2021 | | 90% | | 145 | | | 145 | | | — | | | — | | | — | | | — | | | — | | | Fixed | | | | | | | | | | | | | | | | | | | | |
| Visalia Mall | | Visalia,CA | | 3.71% | June | 2021 | | 90% | | 67 | | | 67 | | | — | | | — | | | — | | | — | | | — | | | Fixed | | | | | | | | | | | | | | | | | | | | |
| Oxmoor Center | | Louisville,KY | | 5.37% | June | 2021 | | 85% | | 68 | | | 68 | | | — | | | — | | | — | | | — | | | — | | | Fixed | | | | | | | | | | | | | | | | | | | | |
| Rivertown Crossings | | Grandville (Grand Rapids),MI | | 5.19% | June | 2021 | | 90% | | 119 | | | 119 | | | — | | | — | | | — | | | — | | | — | | | Fixed | | | | | | | | | | | | | | | | | | | | |
| Tysons Galleria | | McLean (Washington, D.C.),VA | | 4.06% | September | 2021 | | 90% | | 252 | | | 252 | | | — | | | — | | | — | | | — | | | — | | | Fixed | | | | | | | | | | | | | | | | | | | | |
| Park City Center | | Lancaster (Philadelphia),PA | | 4.00% | September | 2021 | | 90% | | 110 | | | 110 | | | — | | | — | | | — | | | — | | | — | | | Floating | | | | | | | | | | | | | | | | | | | | |
| Westlake Center - Land | | Seattle,WA | | 12.90% | November | 2021 | | 90% | | 2 | | | 2 | | | — | | | — | | | — | | | — | | | — | | | Fixed | | | | | | | | | | | | | | | | | | | | |
| 530 Fifth Avenue | | New York,NY | | 3.41% | November | 2021 | | 87% | | 95 | | | 95 | | | — | | | — | | | — | | | — | | | — | | | Floating | | | | | | | | | | | | | | | | | | | | |
|
| | | | | | | | | | | | | | | | | | | | | | | | | | | | | | | | | | | | | | |
| Property Name | | Location | | Interest
Rate | Maturity Date (1) | | BPR Ownership (2) | | Proportionate Total | | 2019 | | 2020 | | 2021 | | 2022 | | 2023 | | Thereafter | | Mortgage Details |
| | | | | | | | | | | | | | | | | | | | | | | | | |
| Consolidated Property Level | | | | | | | | | | |
| | |
| | |
| | | | | | | | | | |
| Park City Center | | Lancaster (Philadelphia), PA | | 5.34% | June | 2019 | | 90% | | $ | 157 |
| | $ | 157 |
| | $ | — |
| | $ | — |
| | $ | — |
| | $ | — |
| | $ | — |
| | Fixed |
| 830 North Michigan | | Chicago, IL | | 3.95% | July | 2019 | | 90% | | 77 |
| | 77 |
| | — |
| | — |
| | — |
| | — |
| | — |
| | Floating |
| Westlake Center | | Seattle, WA | | 4.69% | July | 2019 | | 90% | | 38 |
| | 38 |
| | — |
| | — |
| | — |
| | — |
| | — |
| | Floating |
| Mall St. Matthews | | Louisville, KY | | 2.72% | June | 2020 | | 90% | | 159 |
| | — |
| | 159 |
| | — |
| | — |
| | — |
| | — |
| | Fixed |
| Town East Mall | | Mesquite (Dallas), TX | | 3.57% | June | 2020 | | 90% | | 145 |
| | — |
| | 145 |
| | — |
| | — |
| | — |
| | — |
| | Fixed |
| Visalia Mall | | Visalia, CA | | 3.71% | June | 2020 | | 90% | | 67 |
| | — |
| | 67 |
| | — |
| | — |
| | — |
| | — |
| | Fixed |
| Tysons Galleria | | McLean (Washington, D.C.), VA | | 4.06% | September | 2020 | | 90% | | 265 |
| | — |
| | 265 |
| | — |
| | — |
| | — |
| | — |
| | Fixed |
| Deerbrook Mall | | Humble (Houston), TX | | 5.25% | April | 2021 | | 90% | | 122 |
| | — |
| | — |
| | 122 |
| | — |
| | — |
| | — |
| | Fixed |
| Brass Mill Center | | Waterbury, CT | | 4.10% | April | 2021 | | 90% | | 59 |
| | — |
| | — |
| | 59 |
| | — |
| | — |
| | — |
| | Floating |
| Columbia Mall | | Columbia, MO | | 4.10% | April | 2021 | | 90% | | 48 |
| | — |
| | — |
| | 48 |
| | — |
| | — |
| | — |
| | Floating |
| Eastridge | | Casper, WY | | 4.10% | April | 2021 | | 90% | | 38 |
| | — |
| | — |
| | 38 |
| | — |
| | — |
| | — |
| | Floating |
| Four Seasons | | Greensboro, NC | | 4.10% | April | 2021 | | 90% | | 28 |
| | — |
| | — |
| | 28 |
| | — |
| | — |
| | — |
| | Floating |
| Grand Teton Mall | | Idaho Falls, ID | | 4.10% | April | 2021 | | 90% | | 40 |
| | — |
| | — |
| | 40 |
| | — |
| | — |
| | — |
| | Floating |
| Mayfair | | Wauwatosa (Milwaukee), WI | | 4.10% | April | 2021 | | 90% | | 308 |
| | — |
| | — |
| | 308 |
| | — |
| | — |
| | — |
| | Floating |
| Mondawmin Mall | | Baltimore, MD | | 4.10% | April | 2021 | | 90% | | 76 |
| | — |
| | — |
| | 76 |
| | — |
| | — |
| | — |
| | Floating |
| North Town Mall | | Spokane, WA | | 4.10% | April | 2021 | | 90% | | 77 |
| | — |
| | — |
| | 77 |
| | — |
| | — |
| | — |
| | Floating |
| Oakwood | | Eau Claire, WI | | 4.10% | April | 2021 | | 90% | | 63 |
| | — |
| | — |
| | 63 |
| | — |
| | — |
| | — |
| | Floating |
| Oakwood Center | | Gretna, LA | | 4.10% | April | 2021 | | 90% | | 77 |
| | — |
| | — |
| | 77 |
| | — |
| | — |
| | — |
| | Floating |
| Pioneer Place | | Portland, OR | | 4.10% | April | 2021 | | 90% | | 113 |
| | — |
| | — |
| | 113 |
| | — |
| | — |
| | — |
| | Floating |
| Quail Springs Mall | | Oklahoma City, OK | | 4.10% | April | 2021 | | 90% | | 62 |
| | — |
| | — |
| | 62 |
| | — |
| | — |
| | — |
| | Floating |
| River Hills Mall | | Mankato, MN | | 4.10% | April | 2021 | | 90% | | 63 |
| | — |
| | — |
| | 63 |
| | — |
| | — |
| | — |
| | Floating |
| Sooner Mall | | Norman, OK | | 4.10% | April | 2021 | | 90% | | 64 |
| | — |
| | — |
| | 64 |
| | — |
| | — |
| | — |
| | Floating |
| Southwest Plaza | | Littleton (Denver), CO | | 4.10% | April | 2021 | | 90% | | 102 |
| | — |
| | — |
| | 102 |
| | — |
| | — |
| | — |
| | Floating |
| Providence Place | | Providence, RI | | 5.65% | May | 2021 | | 85% | | 288 |
| | — |
| | — |
| | 288 |
| | — |
| | — |
| | — |
| | Fixed |
| Fox River Mall | | Appleton, WI | | 5.46% | June | 2021 | | 90% | | 149 |
| | — |
| | — |
| | 149 |
| | — |
| | — |
| | — |
| | Fixed |
| | | | | | | | | | | | | | | | | | | | | | | | | | | | | | | | | | | | | | | | | | | | | | | | | | | | | | | | | | | | | | | | | | | | | | | | | | | | | | | | | | | | | | | | | | | | | | | | | | | | | | | | | | | | | | | | | | | | | | | | | | | | | | | | | | | | | | |
| Property Name | | Location | | Interest
Rate | Maturity Date (1) | | BPYU
Ownership (2) | | Proportionate
Total | | 2021 | | 2022 | | 2023 | | 2024 | | 2025 | | Thereafter | | Mortgage Details | | | | | | | | | | | | | | | | | | | | |
| 200 Lafayette | | New York,NY | | 3.16% | November | 2021 | | 90% | | 16 | | | 16 | | | — | | | — | | | — | | | — | | | — | | | Floating | | | | | | | | | | | | | | | | | | | | |
| Bellis Fair | | Bellingham (Seattle),WA | | 5.23% | February | 2022 | | 90% | | 72 | | | — | | | 72 | | | — | | | — | | | — | | | — | | | Fixed | | | | | | | | | | | | | | | | | | | | |
| The Shoppes at Buckland Hills | | Manchester,CT | | 5.19% | March | 2022 | | 90% | | 101 | | | — | | | 101 | | | — | | | — | | | — | | | — | | | Fixed | | | | | | | | | | | | | | | | | | | | |
| The Streets at SouthPoint | | Durham,NC | | 4.36% | May | 2022 | | 85% | | 194 | | | — | | | 194 | | | — | | | — | | | — | | | — | | | Fixed | | | | | | | | | | | | | | | | | | | | |
| Spokane Valley Mall | | Spokane,WA | | 4.65% | June | 2022 | | 90% | | 45 | | | — | | | 45 | | | — | | | — | | | — | | | — | | | Fixed | | | | | | | | | | | | | | | | | | | | |
| 830 North Michigan | | Chicago,IL | | 4.00% | July | 2022 | | 90% | | 65 | | | — | | | 65 | | | — | | | — | | | — | | | — | | | Floating | | | | | | | | | | | | | | | | | | | | |
| Greenwood Mall | | Bowling Green,KY | | 4.19% | July | 2022 | | 90% | | 54 | | | — | | | 54 | | | — | | | — | | | — | | | — | | | Fixed | | | | | | | | | | | | | | | | | | | | |
| Westlake Center | | Seattle,WA | | 2.66% | July | 2022 | | 90% | | 44 | | | — | | | 44 | | | — | | | — | | | — | | | — | | | Floating | | | | | | | | | | | | | | | | | | | | |
| North Star Mall | | San Antonio,TX | | 3.93% | August | 2022 | | 90% | | 256 | | | — | | | 256 | | | — | | | — | | | — | | | — | | | Fixed | | | | | | | | | | | | | | | | | | | | |
| Coral Ridge Mall | | Coralville (Iowa City),IA | | 5.71% | September | 2022 | | 90% | | 86 | | | — | | | 86 | | | — | | | — | | | — | | | — | | | Fixed | | | | | | | | | | | | | | | | | | | | |
| Coastland Center | | Naples,FL | | 3.76% | November | 2022 | | 90% | | 98 | | | — | | | 98 | | | — | | | — | | | — | | | — | | | Fixed | | | | | | | | | | | | | | | | | | | | |
| Pecanland Mall | | Monroe,LA | | 3.88% | March | 2023 | | 90% | | 73 | | | — | | | — | | | 73 | | | — | | | — | | | — | | | Fixed | | | | | | | | | | | | | | | | | | | | |
| Crossroads Center (MN) | | St. Cloud,MN | | 3.25% | April | 2023 | | 90% | | 80 | | | — | | | — | | | 80 | | | — | | | — | | | — | | | Fixed | | | | | | | | | | | | | | | | | | | | |
| Meadows Mall | | Las Vegas,NV | | 3.96% | July | 2023 | | 90% | | 121 | | | — | | | — | | | 121 | | | — | | | — | | | — | | | Fixed | | | | | | | | | | | | | | | | | | | | |
| Prince Kuhio Plaza | | Hilo,HI | | 4.10% | July | 2023 | | 90% | | 35 | | | — | | | — | | | 35 | | | — | | | — | | | — | | | Fixed | | | | | | | | | | | | | | | | | | | | |
| Staten Island Mall | | Staten Island,NY | | 4.77% | September | 2023 | | 90% | | 203 | | | — | | | — | | | 203 | | | — | | | — | | | — | | | Fixed | | | | | | | | | | | | | | | | | | | | |
| Stonestown Galleria | | San Francisco,CA | | 4.39% | October | 2023 | | 90% | | 157 | | | — | | | — | | | 157 | | | — | | | — | | | — | | | Fixed | | | | | | | | | | | | | | | | | | | | |
| 605 North Michigan Avenue | | Chicago,IL | | 4.76% | December | 2023 | | 90% | | 72 | | | — | | | — | | | 72 | | | — | | | — | | | — | | | Fixed | | | | | | | | | | | | | | | | | | | | |
| Jordan Creek Town Center | | West Des Moines,IA | | 4.37% | January | 2024 | | 90% | | 174 | | | — | | | — | | | — | | | 174 | | | — | | | — | | | Fixed | | | | | | | | | | | | | | | | | | | | |
| Fox River Mall | | Appleton,WI | | 4.35% | June | 2024 | | 90% | | 143 | | | — | | | — | | | — | | | 143 | | | — | | | — | | | Fixed | | | | | | | | | | | | | | | | | | | | |
| 730 Fifth Avenue | | New York ,NY | | 5.28% | September | 2024 | | 90% | | 729 | | | — | | | — | | | — | | | 729 | | | — | | | — | | | Floating | | | | | | | | | | | | | | | | | | | | |
| Hulen Mall | | Fort Worth,TX | | 2.96% | October | 2024 | | 90% | | 80 | | | — | | | — | | | — | | | 80 | | | — | | | — | | | Floating | | | | | | | | | | | | | | | | | | | | |
| Shops at Merrick Park | | Coral Gables,FL | | 3.90% | November | 2024 | | 90% | | 352 | | | — | | | — | | | — | | | 352 | | | — | | | — | | | Fixed | | | | | | | | | | | | | | | | | | | | |
| Park Meadows | | Lone Tree,CO | | 3.56% | November | 2024 | | 90% | | 632 | | | — | | | — | | | — | | | 632 | | | — | | | — | | | Fixed | | | | | | | | | | | | | | | | | | | | |
| Valley Plaza Mall | | Bakersfield,CA | | 3.75% | March | 2025 | | 90% | | 206 | | | — | | | — | | | — | | | — | | | 206 | | | — | | | Fixed | | | | | | | | | | | | | | | | | | | | |
| Willowbrook Mall | | Wayne,NJ | | 3.55% | March | 2025 | | 90% | | 325 | | | — | | | — | | | — | | | — | | | 325 | | | — | | | Fixed | | | | | | | | | | | | | | | | | | | | |
| Beachwood Place | | Beachwood,OH | | 3.94% | March | 2025 | | 90% | | 185 | | | — | | | — | | | — | | | — | | | 185 | | | — | | | Fixed | | | | | | | | | | | | | | | | | | | | |
| Towson Town Center | | Towson,MD | | 3.82% | August | 2025 | | 90% | | 281 | | | — | | | — | | | — | | | — | | | 281 | | | — | | | Fixed | | | | | | | | | | | | | | | | | | | | |
| Paramus Park | | Paramus,NJ | | 4.07% | September | 2025 | | 90% | | 108 | | | — | | | — | | | — | | | — | | | 108 | | | — | | | Fixed | | | | | | | | | | | | | | | | | | | | |
| Peachtree Mall | | Columbus,GA | | 3.94% | December | 2025 | | 90% | | 64 | | | — | | | — | | | — | | | — | | | 64 | | | — | | | Fixed | | | | | | | | | | | | | | | | | | | | |
| Perimeter Mall | | Atlanta,GA | | 3.96% | September | 2026 | | 90% | | 248 | | | — | | | — | | | — | | | — | | | — | | | 248 | | | Fixed | | | | | | | | | | | | | | | | | | | | |
| North Point Mall | | Alpharetta (Atlanta),GA | | 4.54% | September | 2026 | | 90% | | 223 | | | — | | | — | | | — | | | — | | | — | | | 223 | | | Fixed | | | | | | | | | | | | | | | | | | | | |
| Mall of Louisiana | | Baton Rouge,LA | | 3.98% | August | 2027 | | 90% | | 292 | | | — | | | — | | | — | | | — | | | — | | | 292 | | | Fixed | | | | | | | | | | | | | | | | | | | | |
|
| | | | | | | | | | | | | | | | | | | | | | | | | | | | | | | | | | | | | | |
| Property Name | | Location | | Interest
Rate | Maturity Date (1) | | BPR Ownership (2) | | Proportionate Total | | 2019 | | 2020 | | 2021 | | 2022 | | 2023 | | Thereafter | | Mortgage Details |
| Rivertown Crossings | | Grandville (Grand Rapids), MI | | 5.19% | June | 2021 | | 90% | | 125 |
| | — |
| | — |
| | 125 |
| | — |
| | — |
| | — |
| | Fixed |
| Oxmoor Center | | Louisville, KY | | 5.37% | June | 2021 | | 85% | | 71 |
| | — |
| | — |
| | 71 |
| | — |
| | — |
| | — |
| | Fixed |
| Westlake Center - Land | | Seattle, WA | | 12.90% | November | 2021 | | 90% | | 2 |
| | — |
| | — |
| | 2 |
| | — |
| | — |
| | — |
| | Fixed |
| 530 Fifth Avenue | | New York, NY | | 5.71% | November | 2021 | | 81% | | 90 |
| | — |
| | — |
| | 90 |
| | — |
| | — |
| | — |
| | Floating |
| 200 Lafayette | | New York, NY | | 4.85% | November | 2021 | | 90% | | 24 |
| | — |
| | — |
| | 24 |
| | — |
| | — |
| | — |
| | Floating |
| Bellis Fair | | Bellingham (Seattle), WA | | 5.23% | February | 2022 | | 90% | | 75 |
| | — |
| | — |
| | — |
| | 75 |
| | — |
| | — |
| | Fixed |
| The Shoppes at Buckland Hills | | Manchester, CT | | 5.19% | March | 2022 | | 90% | | 105 |
| | — |
| | — |
| | — |
| | 105 |
| | — |
| | — |
| | Fixed |
| The Streets at SouthPoint | | Durham, NC | | 4.36% | May | 2022 | | 85% | | 203 |
| | — |
| | — |
| | — |
| | 203 |
| | — |
| | — |
| | Fixed |
| Spokane Valley Mall | | Spokane, WA | | 4.65% | June | 2022 | | 90% | | 51 |
| | — |
| | — |
| | — |
| | 51 |
| | — |
| | — |
| | Fixed |
| Greenwood Mall | | Bowling Green, KY | | 4.19% | July | 2022 | | 90% | | 56 |
| | — |
| | — |
| | — |
| | 56 |
| | — |
| | — |
| | Fixed |
| North Star Mall | | San Antonio, TX | | 3.93% | August | 2022 | | 90% | | 269 |
| | — |
| | — |
| | — |
| | 269 |
| | — |
| | — |
| | Fixed |
| Coral Ridge Mall | | Coralville (Iowa City), IA | | 5.71% | September | 2022 | | 90% | | 95 |
| | — |
| | — |
| | — |
| | 95 |
| | — |
| | — |
| | Fixed |
| Coastland Center | | Naples, FL | | 3.76% | November | 2022 | | 90% | | 103 |
| | — |
| | — |
| | — |
| | 103 |
| | — |
| | — |
| | Fixed |
| Pecanland Mall | | Monroe, LA | | 3.88% | March | 2023 | | 90% | | 76 |
| | — |
| | — |
| | — |
| | — |
| | 76 |
| | — |
| | Fixed |
| Crossroads Center (MN) | | St. Cloud, MN | | 3.25% | April | 2023 | | 90% | | 85 |
| | — |
| | — |
| | — |
| | — |
| | 85 |
| | — |
| | Fixed |
| The Woodlands | | Woodlands (Houston), TX | | 4.83% | June | 2023 | | 90% | | 268 |
| | — |
| | — |
| | — |
| | — |
| | 268 |
| | — |
| | Fixed |
| Meadows Mall | | Las Vegas, NV | | 3.96% | July | 2023 | | 90% | | 128 |
| | — |
| | — |
| | — |
| | — |
| | 128 |
| | — |
| | Fixed |
| Prince Kuhio Plaza | | Hilo, HI | | 4.10% | July | 2023 | | 90% | | 37 |
| | — |
| | — |
| | — |
| | — |
| | 37 |
| | — |
| | Fixed |
| Staten Island Mall | | Staten Island, NY | | 4.77% | September | 2023 | | 90% | | 214 |
| | — |
| | — |
| | — |
| | — |
| | 214 |
| | — |
| | Fixed |
| Hulen Mall | | Fort Worth, TX | | 5.15% | October | 2023 | | 90% | | 81 |
| | — |
| | — |
| | — |
| | — |
| | 81 |
| | — |
| | Floating |
| Stonestown Galleria | | San Francisco, CA | | 4.39% | October | 2023 | | 90% | | 162 |
| | — |
| | — |
| | — |
| | — |
| | 162 |
| | — |
| | Fixed |
| 605 North Michigan Avenue | | Chicago, IL | | 4.76% | December | 2023 | | 90% | | 72 |
| | — |
| | — |
| | — |
| | — |
| | 72 |
| | — |
| | Fixed |
| Jordan Creek Town Center | | West Des Moines, IA | | 4.37% | January | 2024 | | 90% | | 182 |
| | — |
| | — |
| | — |
| | — |
| | — |
| | 182 |
| | Fixed |
| Valley Plaza Mall | | Bakersfield, CA | | 3.75% | March | 2025 | | 90% | | 214 |
| | — |
| | — |
| | — |
| | — |
| | — |
| | 214 |
| | Fixed |
| Willowbrook Mall | | Wayne, NJ | | 3.55% | March | 2025 | | 90% | | 325 |
| | — |
| | — |
| | — |
| | — |
| | — |
| | 325 |
| | Fixed |
| Beachwood Place | | Beachwood, OH | | 3.94% | March | 2025 | | 90% | | 192 |
| | — |
| | — |
| | — |
| | — |
| | — |
| | 192 |
| | Fixed |
| Paramus Park | | Paramus, NJ | | 4.07% | September | 2025 | | 90% | | 108 |
| | — |
| | — |
| | — |
| | — |
| | — |
| | 108 |
| | Fixed |
| Peachtree Mall | | Columbus, GA | | 3.94% | December | 2025 | | 90% | | 68 |
| | — |
| | — |
| | — |
| | — |
| | — |
| | 68 |
| | Fixed |
| | | | | | | | | | | | | | | | | | | | | | | | | | | | | | | | | | | | | | | | | | | | | | | | | | | | | | | | | | | | | | | | | | | | | | | | | | | | | | | | | | | | | | | | | | | | | | | | | | | | | | | | | | | | | | | | | | | | | | | | | | | | | | | | | | | | | | |
| Property Name | | Location | | Interest
Rate | Maturity Date (1) | | BPYU
Ownership (2) | | Proportionate
Total | | 2021 | | 2022 | | 2023 | | 2024 | | 2025 | | Thereafter | | Mortgage Details | | | | | | | | | | | | | | | | | | | | |
| Providence Place - Other | | Providence,RI | | 7.75% | July | 2028 | | 85% | | 24 | | | — | | | — | | | — | | | — | | | — | | | 24 | | | Fixed | | | | | | | | | | | | | | | | | | | | |
| 685 Fifth Avenue | | New York,NY | | 4.53% | July | 2028 | | 88% | | 241 | | | — | | | — | | | — | | | — | | | — | | | 241 | | | Fixed | | | | | | | | | | | | | | | | | | | | |
| The Woodlands | | Woodlands (Houston),TX | | 4.35% | August | 2029 | | 90% | | 416 | | | — | | | — | | | — | | | — | | | — | | | 416 | | | Fixed | | | | | | | | | | | | | | | | | | | | |
| Norwalk | | Norwalk,CT | | 2.00% | December | 2037 | | 90% | | 3 | | | — | | | — | | | — | | | — | | | — | | | 3 | | | Fixed | | | | | | | | | | | | | | | | | | | | |
| | | | | | | | | | | | | | | | | | | | | | | | | | | | | | | | | | | | | | | | | | | | |
| Consolidated Property Level | | | | | | | | | | $ | 9,365 | | | $ | 2,883 | | | $ | 1,015 | | | $ | 741 | | | $ | 2,110 | | | $ | 1,169 | | | $ | 1,447 | | | | | | | | | | | | | | | | | | | | | | | |
| | | | | | | | | | | | | | | | | | | | | | | | | | | | | | | | | | | | | | | | | | | | |
| Unconsolidated Property Level | | | | | | | | | | | | | | | | | | | | | | | | | | | | | | | | | | | | | | | | | | | | |
| Kenwood Towne Centre | | Cincinnati,OH | | 5.37% | February | 2021 | | 63% | | $ | 124 | | | $ | 124 | | | — | | | $ | — | | | $ | — | | | $ | — | | | $ | — | | | Fixed | | | | | | | | | | | | | | | | | | | | |
| The Shops at The Bravern | | Bellevue,WA | | 2.47% | March | 2021 | | 36% | | 20 | | | 20 | | | — | | | — | | | — | | | — | | | — | | | Floating | | | | | | | | | | | | | | | | | | | | |
| Miami Design District Misc | | Miami,FL | | 8.88% | March | 2021 | | 20% | | 40 | | | 40 | | | — | | | — | | | — | | | — | | | — | | | Floating | | | | | | | | | | | | | | | | | | | | |
| Willowbrook Mall (TX) | | Houston,TX | | 5.13% | April | 2021 | | 45% | | 81 | | | 81 | | | — | | | — | | | — | | | — | | | — | | | Fixed | | | | | | | | | | | | | | | | | | | | |
| White Marsh Mall | | Baltimore,MD | | 3.66% | May | 2021 | | 46% | | 87 | | | 87 | | | — | | | — | | | — | | | — | | | — | | | Fixed | | | | | | | | | | | | | | | | | | | | |
| Park Place | | Tucson,AZ | | 5.18% | May | 2021 | | 46% | | 77 | | | 77 | | | — | | | — | | | — | | | — | | | — | | | Fixed | | | | | | | | | | | | | | | | | | | | |
| Tucson Mall | | Tucson,AZ | | 4.01% | June | 2021 | | 46% | | 113 | | | 113 | | | — | | | — | | | — | | | — | | | — | | | Fixed | | | | | | | | | | | | | | | | | | | | |
| Fashion Place | | Murray,UT | | 3.64% | June | 2021 | | 46% | | 104 | | | 104 | | | — | | | — | | | — | | | — | | | — | | | Fixed | | | | | | | | | | | | | | | | | | | | |
| Northbrook Court | | Northbrook,IL | | 4.25% | November | 2021 | | 45% | | 53 | | | 53 | | | — | | | — | | | — | | | — | | | — | | | Fixed | | | | | | | | | | | | | | | | | | | | |
| Fashion Show - Other | | Las Vegas, | | 6.06% | November | 2021 | | 45% | | 1 | | | 1 | | | — | | | — | | | — | | | — | | | — | | | Fixed | | | | | | | | | | | | | | | | | | | | |
| Northridge Fashion Center | | Northridge (Los Angeles),CA | | 5.10% | December | 2021 | | 46% | | 96 | | | 96 | | | — | | | — | | | — | | | — | | | — | | | Fixed | | | | | | | | | | | | | | | | | | | | |
| Whaler's Village | | Lahaina,HI | | 5.42% | January | 2022 | | 45% | | 36 | | | — | | | 36 | | | — | | | — | | | — | | | — | | | Fixed | | | | | | | | | | | | | | | | | | | | |
| Ala Moana Center | | Honolulu,HI | | 4.23% | April | 2022 | | 45% | | 632 | | | — | | | 632 | | | — | | | — | | | — | | | — | | | Fixed | | | | | | | | | | | | | | | | | | | | |
| The Gallery at Harborplace | | Baltimore,MD | | 5.24% | May | 2022 | | 46% | | 32 | | | — | | | 32 | | | — | | | — | | | — | | | — | | | Fixed | | | | | | | | | | | | | | | | | | | | |
| Florence Mall | | Florence (Cincinnati, OH),KY | | 4.15% | June | 2022 | | 45% | | 41 | | | — | | | 41 | | | — | | | — | | | — | | | — | | | Fixed | | | | | | | | | | | | | | | | | | | | |
| Clackamas Town Center | | Happy Valley,OR | | 4.18% | October | 2022 | | 45% | | 97 | | | — | | | 97 | | | — | | | — | | | — | | | — | | | Fixed | | | | | | | | | | | | | | | | | | | | |
| The Oaks Mall | | Gainesville,FL | | 4.55% | October | 2022 | | 46% | | 54 | | | — | | | 54 | | | — | | | — | | | — | | | — | | | Fixed | | | | | | | | | | | | | | | | | | | | |
| Westroads Mall | | Omaha,NE | | 4.55% | October | 2022 | | 46% | | 62 | | | — | | | 62 | | | — | | | — | | | — | | | — | | | Fixed | | | | | | | | | | | | | | | | | | | | |
| The Shoppes at River Crossing | | Macon,GA | | 3.75% | March | 2023 | | 45% | | 33 | | | — | | | — | | | 33 | | | — | | | — | | | — | | | Fixed | | | | | | | | | | | | | | | | | | | | |
| Ala Moana Expansion | | Honolulu,HI | | 3.80% | May | 2023 | | 45% | | 226 | | | — | | | — | | | 226 | | | — | | | — | | | — | | | Fixed | | | | | | | | | | | | | | | | | | | | |
| Cumberland Mall | | Atlanta,GA | | 3.67% | May | 2023 | | 46% | | 74 | | | — | | | — | | | 74 | | | — | | | — | | | — | | | Fixed | | | | | | | | | | | | | | | | | | | | |
|
| | | | | | | | | | | | | | | | | | | | | | | | | | | | | | | | | | | | | | |
| Property Name | | Location | | Interest
Rate | Maturity Date (1) | | BPR Ownership (2) | | Proportionate Total | | 2019 | | 2020 | | 2021 | | 2022 | | 2023 | | Thereafter | | Mortgage Details |
| North Point Mall | | Alpharetta (Atlanta), GA | | 4.54% | September | 2026 | | 90% | | 226 |
| | — |
| | — |
| | — |
| | — |
| | — |
| | 226 |
| | Fixed |
| Mall of Louisiana | | Baton Rouge, LA | | 3.98% | August | 2027 | | 90% | | 293 |
| | — |
| | — |
| | — |
| | — |
| | — |
| | 293 |
| | Fixed |
| Providence Place - Other | | Providence, RI | | 7.75% | July | 2028 | | 85% | | 27 |
| | — |
| | — |
| | — |
| | — |
| | — |
| | 27 |
| | Fixed |
| 685 Fifth Avenue | | New York, NY | | 4.53% | July | 2028 | | 88% | | 241 |
| | — |
| | — |
| | — |
| | — |
| | — |
| | 241 |
| | Fixed |
| Consolidated Property Level | | | | | | | | | | $ | 6,953 |
| | $ | 272 |
| | $ | 636 |
| | $ | 2,089 |
| | $ | 957 |
| | $ | 1,123 |
| | $ | 1,876 |
| | |
| | | | | | | | | | | | | | | | | | | | | | | | | |
| Unconsolidated Property Level | | | | | | | | | | | | | | | | | | | | | | | | |
| Governor's Square | | Tallahassee, FL | | 6.69% | April | 2019 | | 46% | | $ | 21 |
| | $ | 21 |
| | $ | — |
| | $ | — |
| | $ | — |
| | $ | — |
| | $ | — |
| | Fixed |
| Coronado Center | | Albuquerque, NM | | 3.50% | April | 2019 | | 46% | | 83 |
| | 83 |
| | — |
| | — |
| | — |
| | — |
| | — |
| | Fixed |
| 730 Fifth Avenue | | New York , NY | | 5.55% | May | 2019 | | 45% | | 406 |
| | 406 |
| | — |
| | — |
| | — |
| | — |
| | — |
| | Floating |
| The Grand Canal Shoppes | | Las Vegas, NV | | 4.24% | June | 2019 | | 45% | | 283 |
| | 283 |
| | — |
| | — |
| | — |
| | — |
| | — |
| | Fixed |
| Lynnhaven Mall | | Virginia Beach, VA | | 4.31% | June | 2019 | | 46% | | 108 |
| | 108 |
| | — |
| | — |
| | — |
| | — |
| | — |
| | Floating |
| Miami Design District Misc | | Miami, FL | | 6.71% | July | 2019 | | 20% | | 18 |
| | 18 |
| | — |
| | — |
| | — |
| | — |
| | — |
| | Floating |
| 522 Fifth Avenue | | New York, NY | | 4.00% | September | 2019 | | 9% | | 8 |
| | 8 |
| | — |
| | — |
| | — |
| | — |
| | — |
| | Floating |
| First Colony Mall | | Sugarland, TX | | 4.50% | November | 2019 | | 45% | | 77 |
| | 77 |
| | — |
| | — |
| | — |
| | — |
| | — |
| | Fixed |
| Natick Mall | | Natick (Boston), MA | | 4.60% | November | 2019 | | 45% | | 192 |
| | 192 |
| | — |
| | — |
| | — |
| | — |
| | — |
| | Fixed |
| Bayside Marketplace | | Miami, FL | | 4.40% | January | 2020 | | 11% | | 27 |
| | — |
| | 27 |
| | — |
| | — |
| | — |
| | — |
| | Floating |
| The Shops at The Bravern | | Bellevue, WA | | 4.69% | May | 2020 | | 36% | | 21 |
| | — |
| | 21 |
| | — |
| | — |
| | — |
| | — |
| | Floating |
| Tucson Mall | | Tucson, AZ | | 4.01% | June | 2020 | | 46% | | 113 |
| | — |
| | 113 |
| | — |
| | — |
| | — |
| | — |
| | Fixed |
| Fashion Place | | Murray, UT | | 3.64% | June | 2020 | | 46% | | 104 |
| | — |
| | 104 |
| | — |
| | — |
| | — |
| | — |
| | Fixed |
| Oakbrook Center | | Oak Brook (Chicago), IL | | 3.66% | July | 2020 | | 43% | | 183 |
| | — |
| | 183 |
| | — |
| | — |
| | — |
| | — |
| | Fixed |
| The Mall in Columbia | | Columbia, MD | | 3.95% | September | 2020 | | 45% | | 148 |
| | — |
| | 148 |
| | — |
| | — |
| | — |
| | — |
| | Fixed |
| Water Tower Place | | Chicago, IL | | 4.34% | October | 2020 | | 43% | | 158 |
| | — |
| | 158 |
| | — |
| | — |
| | — |
| | — |
| | Fixed |
| Kenwood Towne Centre | | Cincinnati, OH | | 5.37% | December | 2020 | | 63% | | 130 |
| | — |
| | 130 |
| | — |
| | — |
| | — |
| | — |
| | Fixed |
| Whaler's Village | | Lahaina, HI | | 5.42% | January | 2021 | | 45% | | 36 |
| | — |
| | — |
| | 36 |
| | — |
| | — |
| | — |
| | Fixed |
| Shops at Merrick Park | | Coral Gables, FL | | 5.73% | April | 2021 | | 50% | | 81 |
| | — |
| | — |
| | 81 |
| | — |
| | — |
| | — |
| | Fixed |
| Northridge Fashion Center | | Northridge (Los Angeles), CA | | 5.10% | April | 2021 | | 46% | | 101 |
| | — |
| | — |
| | 101 |
| | — |
| | — |
| | — |
| | Fixed |
| | | | | | | | | | | | | | | | | | | | | | | | | | | | | | | | | | | | | | | | | | | | | | | | | | | | | | | | | | | | | | | | | | | | | | | | | | | | | | | | | | | | | | | | | | | | | | | | | | | | | | | | | | | | | | | | | | | | | | | | | | | | | | | | | | | | | | |
| Property Name | | Location | | Interest
Rate | Maturity Date (1) | | BPYU
Ownership (2) | | Proportionate
Total | | 2021 | | 2022 | | 2023 | | 2024 | | 2025 | | Thereafter | | Mortgage Details | | | | | | | | | | | | | | | | | | | | |
| Carolina Place | | Pineville (Charlotte),NC | | 3.84% | June | 2023 | | 45% | | 72 | | | — | | | — | | | 72 | | | — | | | — | | | — | | | Fixed | | | | | | | | | | | | | | | | | | | | |
| Oglethorpe Mall | | Savannah,GA | | 3.90% | July | 2023 | | 46% | | 66 | | | — | | | — | | | 66 | | | — | | | — | | | — | | | Fixed | | | | | | | | | | | | | | | | | | | | |
| Augusta Mall | | Augusta,GA | | 4.36% | August | 2023 | | 46% | | 78 | | | — | | | — | | | 78 | | | — | | | — | | | — | | | Fixed | | | | | | | | | | | | | | | | | | | | |
| The SoNo Collection | | Norwalk,CT | | 4.75% | August | 2023 | | 12% | | 36 | | | — | | | — | | | 36 | | | — | | | — | | | — | | | Floating | | | | | | | | | | | | | | | | | | | | |
| Ridgedale Center | | Minnetonka,MN | | 2.76% | September | 2023 | | 46% | | 77 | | | — | | | — | | | 77 | | | — | | | — | | | — | | | Floating | | | | | | | | | | | | | | | | | | | | |
| Riverchase Galleria | | Birmingham,AL | | 3.66% | September | 2023 | | 46% | | 76 | | | — | | | — | | | 76 | | | — | | | — | | | — | | | Floating | | | | | | | | | | | | | | | | | | | | |
| Apache Mall | | Rochester,MN | | 3.66% | September | 2023 | | 46% | | 34 | | | — | | | — | | | 34 | | | — | | | — | | | — | | | Floating | | | | | | | | | | | | | | | | | | | | |
| Columbiana Centre | | Columbia,SC | | 3.66% | September | 2023 | | 46% | | 63 | | | — | | | — | | | 63 | | | — | | | — | | | — | | | Floating | | | | | | | | | | | | | | | | | | | | |
| One Union Square | | San Francisco,CA | | 5.12% | October | 2023 | | 45% | | 23 | | | — | | | — | | | 23 | | | — | | | — | | | — | | | Fixed | | | | | | | | | | | | | | | | | | | | |
| Boise Towne Square | | Boise,ID | | 4.79% | October | 2023 | | 46% | | 53 | | | — | | | — | | | 53 | | | — | | | — | | | — | | | Fixed | | | | | | | | | | | | | | | | | | | | |
| Galleria at Tyler | | Riverside,CA | | 5.05% | November | 2023 | | 45% | | 75 | | | — | | | — | | | 75 | | | — | | | — | | | — | | | Fixed | | | | | | | | | | | | | | | | | | | | |
| Oakbrook Center | | Oak Brook (Chicago),IL | | 3.68% | November | 2023 | | 43% | | 204 | | | — | | | — | | | 204 | | | — | | | — | | | — | | | Floating | | | | | | | | | | | | | | | | | | | | |
| The Crossroads (MI) | | Portage,MI | | 4.42% | December | 2023 | | 46% | | 41 | | | — | | | — | | | 41 | | | — | | | — | | | — | | | Fixed | | | | | | | | | | | | | | | | | | | | |
| The Mall in Columbia | | Columbia,MD | | 4.75% | December | 2023 | | 45% | | 113 | | | — | | | — | | | 113 | | | — | | | — | | | — | | | Floating | | | | | | | | | | | | | | | | | | | | |
| Woodbridge Center | | Woodbridge,NJ | | 4.80% | April | 2024 | | 46% | | 110 | | | — | | | — | | | — | | | 110 | | | — | | | — | | | Fixed | | | | | | | | | | | | | | | | | | | | |
| The Maine Mall | | South Portland,ME | | 4.66% | April | 2024 | | 46% | | 108 | | | — | | | — | | | — | | | 108 | | | — | | | — | | | Fixed | | | | | | | | | | | | | | | | | | | | |
| Governor's Square | | Tallahassee,FL | | 3.56% | May | 2024 | | 46% | | 28 | | | — | | | — | | | — | | | 28 | | | — | | | — | | | Floating | | | | | | | | | | | | | | | | | | | | |
| Coronado Center | | Albuquerque,NM | | 3.56% | May | 2024 | | 46% | | 101 | | | — | | | — | | | — | | | 101 | | | — | | | — | | | Floating | | | | | | | | | | | | | | | | | | | | |
| Lynnhaven Mall | | Virginia Beach,VA | | 3.56% | May | 2024 | | 46% | | 108 | | | — | | | — | | | — | | | 108 | | | — | | | — | | | Floating | | | | | | | | | | | | | | | | | | | | |
| Stonebriar Centre | | Frisco (Dallas),TX | | 4.05% | August | 2024 | | 45% | | 119 | | | — | | | — | | | — | | | 119 | | | — | | | — | | | Fixed | | | | | | | | | | | | | | | | | | | | |
| Baybrook Mall | | Friendswood (Houston),TX | | 5.52% | September | 2024 | | 46% | | 106 | | | — | | | — | | | — | | | 106 | | | — | | | — | | | Fixed | | | | | | | | | | | | | | | | | | | | |
| The Parks Mall at Arlington | | Arlington (Dallas),TX | | 5.57% | September | 2024 | | 46% | | 106 | | | — | | | — | | | — | | | 106 | | | — | | | — | | | Fixed | | | | | | | | | | | | | | | | | | | | |
| Fashion Show | | Las Vegas,NV | | 4.03% | November | 2024 | | 45% | | 377 | | | — | | | — | | | — | | | 377 | | | — | | | — | | | Fixed | | | | | | | | | | | | | | | | | | | | |
| Natick Mall | | Natick (Boston),MA | | 3.72% | November | 2024 | | 45% | | 228 | | | — | | | — | | | — | | | 228 | | | — | | | — | | | Fixed | | | | | | | | | | | | | | | | | | | | |
| Market Place Shopping Center | | Champaign,IL | | 3.11% | November | 2024 | | 46% | | 40 | | | — | | | — | | | — | | | 40 | | | — | | | — | | | Floating | | | | | | | | | | | | | | | | | | | | |
| Pinnacle Hills Promenade | | Rogers,AR | | 4.13% | January | 2025 | | 45% | | 49 | | | — | | | — | | | — | | | — | | | 49 | | | — | | | Fixed | | | | | | | | | | | | | | | | | | | | |
| Altamonte Mall | | Altamonte Springs (Orlando),FL | | 3.72% | February | 2025 | | 45% | | 69 | | | — | | | — | | | — | | | — | | | 69 | | | — | | | Fixed | | | | | | | | | | | | | | | | | | | | |
| Pembroke Lakes Mall | | Pembroke,FL | | 3.56% | March | 2025 | | 46% | | 120 | | | — | | | — | | | — | | | — | | | 120 | | | — | | | Fixed | | | | | | | | | | | | | | | | | | | | |
| Alderwood | | Lynnwood (Seattle),WA | | 3.48% | June | 2025 | | 45% | | 142 | | | — | | | — | | | — | | | — | | | 142 | | | — | | | Fixed | | | | | | | | | | | | | | | | | | | | |
| Boise Towne Plaza | | Boise,ID | | 4.13% | August | 2025 | | 46% | | 8 | | | — | | | — | | | — | | | — | | | 8 | | | — | | | Fixed | | | | | | | | | | | | | | | | | | | | |
| Glenbrook Square | | Fort Wayne,IN | | 4.27% | November | 2025 | | 46% | | 72 | | | — | | | — | | | — | | | — | | | 72 | | | — | | | Fixed | | | | | | | | | | | | | | | | | | | | |
| Glendale Galleria | | Glendale,CA | | 4.06% | September | 2026 | | 45% | | 193 | | | — | | | — | | | — | | | — | | | — | | | 193 | | | Fixed | | | | | | | | | | | | | | | | | | | | |
|
| | | | | | | | | | | | | | | | | | | | | | | | | | | | | | | | | | | | | | |
| Property Name | | Location | | Interest
Rate | Maturity Date (1) | | BPR Ownership (2) | | Proportionate Total | | 2019 | | 2020 | | 2021 | | 2022 | | 2023 | | Thereafter | | Mortgage Details |
| Willowbrook Mall (TX) | | Houston, TX | | 5.13% | April | 2021 | | 45% | | 85 |
| | — |
| | — |
| | 85 |
| | — |
| | — |
| | — |
| | Fixed |
| 85 Fifth Avenue | | New York, NY | | 5.14% | April | 2021 | | 45% | | 27 |
| | — |
| | — |
| | 27 |
| | — |
| | — |
| | — |
| | Floating |
| White Marsh Mall | | Baltimore, MD | | 3.66% | May | 2021 | | 46% | | 87 |
| | — |
| | — |
| | 87 |
| | — |
| | — |
| | — |
| | Fixed |
| Park Place | | Tucson, AZ | | 5.18% | May | 2021 | | 46% | | 81 |
| | — |
| | — |
| | 81 |
| | — |
| | — |
| | — |
| | Fixed |
| Miami Design District | | Miami, FL | | 6.87% | May | 2021 | | 20% | | 115 |
| | — |
| | — |
| | 115 |
| | — |
| | — |
| | — |
| | Floating |
| Fashion Show - Other | | Las Vegas, NV | | 6.06% | November | 2021 | | 45% | | 1 |
| | — |
| | — |
| | 1 |
| | — |
| | — |
| | — |
| | Fixed |
| Northbrook Court | | Northbrook, IL | | 4.25% | November | 2021 | | 45% | | 55 |
| | — |
| | — |
| | 55 |
| | — |
| | — |
| | — |
| | Fixed |
| Ala Moana Center | | Honolulu, HI | | 4.23% | April | 2022 | | 45% | | 632 |
| | — |
| | — |
| | — |
| | 632 |
| | — |
| | — |
| | Fixed |
| The Gallery at Harborplace | | Baltimore, MD | | 5.24% | May | 2022 | | 46% | | 34 |
| | — |
| | — |
| | — |
| | 34 |
| | — |
| | — |
| | Fixed |
| Florence Mall | | Florence (Cincinnati, OH), KY | | 4.15% | June | 2022 | | 45% | | 41 |
| | — |
| | — |
| | — |
| | 41 |
| | — |
| | — |
| | Fixed |
| Clackamas Town Center | | Happy Valley, OR | | 4.18% | October | 2022 | | 45% | | 97 |
| | — |
| | — |
| | — |
| | 97 |
| | — |
| | — |
| | Fixed |
| The Oaks Mall | | Gainesville, FL | | 4.55% | October | 2022 | | 46% | | 57 |
| | — |
| | — |
| | — |
| | 57 |
| | — |
| | — |
| | Fixed |
| Westroads Mall | | Omaha, NE | | 4.55% | October | 2022 | | 46% | | 65 |
| | — |
| | — |
| | — |
| | 65 |
| | — |
| | — |
| | Fixed |
| Bridgewater Commons | | Bridgewater, NJ | | 3.34% | November | 2022 | | 32% | | 95 |
| | — |
| | — |
| | — |
| | 95 |
| | — |
| | — |
| | Fixed |
| The Shoppes at River Crossing | | Macon, GA | | 3.75% | March | 2023 | | 45% | | 34 |
| | — |
| | — |
| | — |
| | — |
| | 34 |
| | — |
| | Fixed |
| Ala Moana Expansion | | Honolulu, HI | | 3.80% | May | 2023 | | 45% | | 226 |
| | — |
| | — |
| | — |
| | — |
| | 226 |
| | — |
| | Fixed |
| Cumberland Mall | | Atlanta, GA | | 3.67% | May | 2023 | | 46% | | 74 |
| | — |
| | — |
| | — |
| | — |
| | 74 |
| | — |
| | Fixed |
| Carolina Place | | Pineville (Charlotte), NC | | 3.84% | June | 2023 | | 45% | | 75 |
| | — |
| | — |
| | — |
| | — |
| | 75 |
| | — |
| | Fixed |
| Oglethorpe Mall | | Savannah, GA | | 3.90% | July | 2023 | | 46% | | 69 |
| | — |
| | — |
| | — |
| | — |
| | 69 |
| | — |
| | Fixed |
| Augusta Mall | | Augusta, GA | | 4.36% | August | 2023 | | 46% | | 78 |
| | — |
| | — |
| | — |
| | — |
| | 78 |
| | — |
| | Fixed |
| Columbiana Centre | | Columbia, SC | | 5.96% | September | 2023 | | 46% | | 63 |
| | — |
| | — |
| | — |
| | — |
| | 63 |
| | — |
| | Floating |
| Ridgedale Center | | Minnetonka, MN | | 4.95% | September | 2023 | | 46% | | 77 |
| | — |
| | — |
| | — |
| | — |
| | 77 |
| | — |
| | Floating |
| Riverchase Galleria | | Birmingham, AL | | 5.96% | September | 2023 | | 46% | | 76 |
| | — |
| | — |
| | — |
| | — |
| | 76 |
| | — |
| | Floating |
| Apache Mall | | Rochester, MN | | 5.96% | September | 2023 | | 46% | | 34 |
| | — |
| | — |
| | — |
| | — |
| | 34 |
| | — |
| | Floating |
| One Union Square | | San Francisco, CA | | 5.12% | October | 2023 | | 45% | | 23 |
| | — |
| | — |
| | — |
| | — |
| | 23 |
| | — |
| | Fixed |
| Boise Towne Square | | Boise, ID | | 4.79% | October | 2023 | | 46% | | 56 |
| | — |
| | — |
| | — |
| | — |
| | 56 |
| | — |
| | Fixed |
| Galleria at Tyler | | Riverside, CA | | 5.05% | November | 2023 | | 45% | | 79 |
| | — |
| | — |
| | — |
| | — |
| | 79 |
| | — |
| | Fixed |
| Market Place Shopping Center | | Champaign, IL | | 5.30% | November | 2023 | | 46% | | 41 |
| | — |
| | — |
| | — |
| | — |
| | 41 |
| | — |
| | Floating |
| Park Meadows | | Lone Tree, CO | | 4.60% | December | 2023 | | 32% | | 114 |
| | — |
| | — |
| | — |
| | — |
| | 114 |
| | — |
| | Fixed |
| The Crossroads (MI) | | Portage, MI | | 4.42% | December | 2023 | | 46% | | 42 |
| | — |
| | — |
| | — |
| | — |
| | 42 |
| | — |
| | Fixed |
|
| | | | | | | | | | | | | | | | | | | | | | | | | | | | | | | | | | | | | | |
| Property Name | | Location | | Interest
Rate | Maturity Date (1) | | BPR Ownership (2) | | Proportionate Total | | 2019 | | 2020 | | 2021 | | 2022 | | 2023 | | Thereafter | | Mortgage Details |
| Woodbridge Center | | Woodbridge, NJ | | 4.80% | April | 2024 | | 46% | | 112 |
| | — |
| | — |
| | — |
| | — |
| | — |
| | 112 |
| | Fixed |
| The Maine Mall | | South Portland, ME | | 4.66% | April | 2024 | | 46% | | 108 |
| | — |
| | — |
| | — |
| | — |
| | — |
| | 108 |
| | Fixed |
| Stonebriar Centre | | Frisco (Dallas), TX | | 4.05% | August | 2024 | | 45% | | 123 |
| | — |
| | — |
| | — |
| | — |
| | — |
| | 123 |
| | Fixed |
| Baybrook Mall | | Friendswood (Houston), TX | | 5.52% | September | 2024 | | 46% | | 110 |
| | — |
| | — |
| | — |
| | — |
| | — |
| | 110 |
| | Fixed |
| The Parks Mall at Arlington | | Arlington (Dallas), TX | | 5.57% | September | 2024 | | 46% | | 110 |
| | — |
| | — |
| | — |
| | — |
| | — |
| | 110 |
| | Fixed |
| Fashion Show | | Las Vegas, NV | | 4.03% | November | 2024 | | 45% | | 377 |
| | — |
| | — |
| | — |
| | — |
| | — |
| | 377 |
| | Fixed |
| Pinnacle Hills Promenade | | Rogers, AR | | 4.13% | January | 2025 | | 45% | | 51 |
| | — |
| | — |
| | — |
| | — |
| | — |
| | 51 |
| | Fixed |
| Altamonte Mall | | Altamonte Springs (Orlando), FL | | 3.72% | February | 2025 | | 45% | | 71 |
| | — |
| | — |
| | — |
| | — |
| | — |
| | 71 |
| | Fixed |
| Pembroke Lakes Mall | | Pembroke, FL | | 3.56% | March | 2025 | | 46% | | 120 |
| | — |
| | — |
| | — |
| | — |
| | — |
| | 120 |
| | Fixed |
| Alderwood | | Lynnwood (Seattle), WA | | 3.48% | June | 2025 | | 45% | | 149 |
| | — |
| | — |
| | — |
| | — |
| | — |
| | 149 |
| | Fixed |
| Boise Towne Plaza | | Boise, ID | | 4.13% | August | 2025 | | 46% | | 9 |
| | — |
| | — |
| | — |
| | — |
| | — |
| | 9 |
| | Fixed |
| Towson Town Center | | Towson, MD | | 3.82% | August | 2025 | | 32% | | 102 |
| | — |
| | — |
| | — |
| | — |
| | — |
| | 102 |
| | Fixed |
| Glenbrook Square | | Fort Wayne, IN | | 4.27% | November | 2025 | | 46% | | 73 |
| | — |
| | — |
| | — |
| | — |
| | — |
| | 73 |
| | Fixed |
| Perimeter Mall | | Atlanta, GA | | 3.96% | September | 2026 | | 45% | | 124 |
| | — |
| | — |
| | — |
| | — |
| | — |
| | 124 |
| | Fixed |
| Glendale Galleria | | Glendale, CA | | 4.06% | September | 2026 | | 45% | | 194 |
| | — |
| | — |
| | — |
| | — |
| | — |
| | 194 |
| | Fixed |
| The Shops at La Cantera | | San Antonio, Bexar County, TX | | 3.60% | May | 2027 | | 34% | | 118 |
| | — |
| | — |
| | — |
| | — |
| | — |
| | 118 |
| | Fixed |
| Baybrook Expansion | | Friendswood, TX | | 3.77% | December | 2027 | | 26% | | 37 |
| | — |
| | — |
| | — |
| | — |
| | — |
| | 37 |
| | Fixed |
| Christiana Mall | | Newark, DE | | 4.28% | August | 2028 | | 23% | | 124 |
| | — |
| | — |
| | — |
| | — |
| | — |
| | 124 |
| | Fixed |
| Plaza Frontenac | | St. Louis, MO | | 4.43% | August | 2028 | | 50% | | 50 |
| | — |
| | — |
| | — |
| | — |
| | — |
| | 50 |
| | Fixed |
| Saint Louis Galleria | | St. Louis, MO | | 5.11% | November | 2028 | | 66% | | 176 |
| | — |
| | — |
| | — |
| | — |
| | — |
| | 176 |
| | Fixed |
| Unconsolidated Property Level | | | | | | | | | | $ | 7,271 |
| | $ | 1,198 |
| | $ | 884 |
| | $ | 670 |
| | $ | 1,020 |
| | $ | 1,161 |
| | $ | 2,338 |
| | |
| | | | | | | | | | | | | | | | | | | | | | | | | |
| Corporate | | | | | | | | | | | | | | | | | | | | | | | | |
| BPR Term Loan A-1 | | N/A | | 4.75% | August | 2021 | | 90% | | $ | 675 |
| | $ | — |
| | $ | — |
| | $ | 675 |
| | $ | — |
| | $ | — |
| | $ | — |
| | Floating |
| Project Gold - Revolver | | BPR Revolver, | | 4.76% | August | 2022 | | 90% | | 349 |
| | — |
| | — |
| | — |
| | 349 |
| | — |
| | — |
| | Floating |
| BPR Term Loan A-2 | | N/A | | 4.75% | August | 2023 | | 90% | | 1,805 |
| | — |
| | — |
| | — |
| | — |
| | 1,805 |
| | — |
| | Floating |
| BPR Term Loan B | | N/A | | 5.00% | August | 2025 | | 90% | | 1,805 |
| | — |
| | — |
| | — |
| | — |
| | — |
| | 1,805 |
| | Floating |
| Junior Subordinated Notes Due 2036 | | N/A | | 3.97% | April | 2036 | | 90% | | 186 |
| | — |
| | — |
| | — |
| | — |
| | — |
| | 186 |
| | Floating |
| | | Property Name | | Location | | Interest
Rate | Maturity Date (1) | | BPR Ownership (2) | | Proportionate Total | | 2019 | | 2020 | | 2021 | | 2022 | | 2023 | | Thereafter | | Mortgage Details | Property Name | | Location | | Interest
Rate | Maturity Date (1) | | BPYU
Ownership (2) | | Proportionate
Total | | 2021 | | 2022 | | 2023 | | 2024 | | 2025 | | Thereafter | | Mortgage Details | |
| The Shops at La Cantera | | The Shops at La Cantera | | San Antonio, Bexar County,TX | | 3.60% | May | 2027 | | 34% | | 118 | | | — | | | — | | | — | | | — | | | — | | | 118 | | | Fixed | |
| Baybrook Expansion | | Baybrook Expansion | | Friendswood,TX | | 3.77% | December | 2027 | | 26% | | 37 | | | — | | | — | | | — | | | — | | | — | | | 37 | | | Fixed | |
| Christiana Mall | | Christiana Mall | | Newark,DE | | 4.28% | August | 2028 | | 23% | | 124 | | | — | | | — | | | — | | | — | | | — | | | 124 | | | Fixed | |
| Plaza Frontenac | | Plaza Frontenac | | St. Louis,MO | | 4.43% | August | 2028 | | 50% | | 50 | | | — | | | — | | | — | | | — | | | — | | | 50 | | | Fixed | |
| Saint Louis Galleria | | Saint Louis Galleria | | St. Louis,MO | | 5.08% | November | 2028 | | 66% | | 171 | | | — | | | — | | | — | | | — | | | — | | | 171 | | | Fixed | |
| The Grand Canal Shoppes | | The Grand Canal Shoppes | | Las Vegas,NV | | 4.29% | July | 2029 | | 45% | | 441 | | | — | | | — | | | — | | | — | | | — | | | 441 | | | Fixed | |
| First Colony Mall | | First Colony Mall | | Sugarland,TX | | 3.55% | November | 2029 | | 45% | | 99 | | | — | | | — | | | — | | | — | | | — | | | 99 | | | Fixed | |
| Miami Design District | | Miami Design District | | Miami,FL | | 4.13% | March | 2030 | | 20% | | 100 | | | — | | | — | | | — | | | — | | | — | | | 100 | | | Fixed | |
| Unconsolidated Property Level | | Unconsolidated Property Level | | $ | 6,318 | | | $ | 796 | | | $ | 954 | | | $ | 1,344 | | | $ | 1,431 | | | $ | 460 | | | $ | 1,333 | | | |
| | Corporate | | Corporate | | |
| BPYU Term Loan A-1 | | BPYU Term Loan A-1 | | N/A | | 3.14% | August | 2021 | | 90% | | $ | 23 | | | $ | 23 | | | — | | | $ | — | | | $ | — | | | $ | — | | | $ | — | | | Floating | |
| Project Gold - Revolver | | Project Gold - Revolver | | N/A | | 2.41% | August | 2022 | | 90% | | 916 | | | — | | | 916 | | | — | | | — | | | — | | | — | | | Floating | |
| Subordinated Unsecured Note ($25M) | | Subordinated Unsecured Note ($25M) | | N/A | | 2.09% | August | 2022 | | 90% | | 23 | | | — | | | 23 | | | — | | | — | | | — | | | — | | | Floating | |
| BPYU Term Loan A-2 | | BPYU Term Loan A-2 | | N/A | | 3.15% | August | 2023 | | 90% | | 1,805 | | | — | | | — | | | 1,805 | | | — | | | — | | | — | | | Floating | |
| BPYU Term Loan B | | BPYU Term Loan B | | N/A | | 2.65% | August | 2025 | | 90% | | 1,760 | | | — | | | — | | | — | | | — | | | 1,760 | | | — | | | Floating | |
| Senior Secured Notes - Silver Bonds | | Senior Secured Notes - Silver Bonds | | N/A | | 5.75% | May | 2026 | | 90% | | 853 | | | — | | | — | | | — | | | — | | | — | | | 853 | | | Floating | |
| Subordinated Unsecured Note ($27M) | | Subordinated Unsecured Note ($27M) | | N/A | | 2.98% | February | 2030 | | 90% | | 7 | | | — | | | — | | | — | | | — | | | — | | | 7 | | | Floating | |
| Subordinated Unsecured Note ($29M) | | Subordinated Unsecured Note ($29M) | | N/A | | 2.98% | March | 2030 | | 90% | | 27 | | | — | | | — | | | — | | | — | | | — | | | 27 | | | Floating | |
| | Total Corporate | | $ | 4,820 |
| | $ | — |
| | $ | — |
| | $ | 675 |
| | $ | 349 |
| | $ | 1,805 |
| | $ | 1,991 |
| | Total Corporate | | $ | 5,600 | | | $ | 23 | | | $ | 939 | | | $ | 1,805 | | | $ | — | | | $ | 1,760 | | | $ | 1,073 | | | |
| Other, net | | (31 | ) | | | | | | | | | | | | | | |
| | Total | | $ | 19,013 |
| | $ | 1,470 |
| | $ | 1,520 |
| | $ | 3,434 |
| | $ | 2,326 |
|
| $ | 4,089 |
|
| $ | 6,205 |
| | Total | | $ | 21,283 | | | $ | 3,702 | | | $ | 2,908 | | | $ | 3,890 | | | $ | 3,541 | | | $ | 3,389 | | | $ | 3,853 | | | |
(1) Assumes that all maturity extensions are exercised.
(2) BPRBPYU Ownership is shown net of the noncontrolling interest of our institutional investor (Note 3).
Below is a reconciliation of our proportionate share of mortgages, notes and loans payable (from above) to our consolidated mortgages, notes and loans payable per our Consolidated Balance Sheet as of December 31, 20182020 (dollars in millions).
|
| | | |
| Total Maturities, from above | $ | 19,013 |
|
| Debt related to solar projects and other | 50 |
|
| Proportionate Portfolio Debt | 19,063 |
|
| Deferred financing costs, market rate adjustments and other, net | (126 | ) |
| Junior Subordinated Notes Due 2036 | (206 | ) |
| Proportionate Mortgages, Notes and Loans Payable | $ | 18,731 |
|
| BPR Share of Unconsolidated Real Estate Affiliates | (7,271 | ) |
| Noncontrolling Interests | 1,130 |
|
| Consolidated Mortgages, Notes and Loans Payable on US GAAP Basis | $ | 12,590 |
|
| | | | | |
| Total Maturities, from above | $ | 21,283 | |
| Debt related to solar projects and other | 18 | |
| Proportionate Portfolio Debt | 21,301 | |
| Deferred financing costs, market rate adjustments and other, net | (103) | |
| Debt held for disposition | (247) | |
| Junior Subordinated Notes Due 2036 | (206) | |
| Proportionate Mortgages, Notes and Loans Payable | $ | 20,745 | |
| BPYU Share of Unconsolidated Real Estate Affiliates | (6,318) | |
| Noncontrolling Interests | 1,688 | |
| Consolidated Mortgages, Notes and Loans Payable on US GAAP Basis | $ | 16,115 | |
Lease Expiration Schedule
The following table indicates various lease expiration information related to our retail properties owned as of December 31, 2018.2020. The table excludes expirations and rental revenue from temporary tenants and tenants that pay percent-in-lieu rent. See "Note 2—Summary of Significant Accounting Policies" for our accounting policies for revenue recognition from our tenant leases and "Note 9—Rentals Under Operating 7—Leases" for the future minimum rentals of our operating leases for the consolidated properties (dollars in millions).
| | | | | | | | | | | | | | | | | | | | | | | | | | | | | | | | |
| Year | | Number of
Expiring
Leases | | Expiring GLA
at 100% | | Percent of
Total | | Expiring
Rent | | Expiring
Rent ($psf) |
| Specialty Leasing | | 1,069 | | | 2,564 | | | 4.9% | | $ | 36,925 | | | $ | 14.40 | |
| 2021 | | 1,699 | | | 5,461 | | | 10.5% | | 302,716 | | | 55.44 | |
| 2022 | | 1,893 | | | 7,011 | | | 13.5% | | 340,974 | | | 48.63 | |
| 2023 | | 1,504 | | | 6,217 | | | 12.0% | | 340,533 | | | 54.78 | |
| 2024 | | 1,348 | | | 7,043 | | | 13.6% | | 349,653 | | | 49.65 | |
| 2025 | | 1,183 | | | 4,940 | | | 9.5% | | 355,600 | | | 71.99 | |
| 2026 | | 856 | | | 4,236 | | | 8.2% | | 298,937 | | | 70.57 | |
| 2027 | | 675 | | | 3,755 | | | 7.2% | | 276,088 | | | 73.52 | |
| 2028 | | 579 | | | 2,997 | | | 5.8% | | 192,719 | | | 64.30 | |
| 2029 | | 493 | | | 2,846 | | | 5.5% | | 171,160 | | | 60.15 | |
| Subsequent | | 809 | | | 4,824 | | | 9.3% | | 266,209 | | | 55.19 | |
| Total | | 12,108 | | | 51,892 | | | 100.0% | | $ | 2,931,514 | | | $ | 56.49 | |
| Vacant Space | | 1,737 | | | 4,206 | | | | | | | |
| Mall and Freestanding GLA | | 13,845 | | | 56,098 | | | | | | | |
|
| | | | | | | | | | | | | | | | |
| Year | | Number of Expiring Leases | | Expiring GLA at 100% | | Percent of Total | | Expiring Rent | | Expiring Rent ($psf) |
| Specialty Leasing | | 952 |
| | 1,910 |
| | 3.5% | | $ | 50,910 |
| | $ | 26.66 |
|
| 2019 | | 2,123 |
| | 6,477 |
| | 11.9% | | 369,606 |
| | 57.06 |
|
| 2020 | | 1,641 |
| | 5,539 |
| | 10.3% | | 293,340 |
| | 52.96 |
|
| 2021 | | 1,490 |
| | 5,377 |
| | 9.9% | | 330,567 |
| | 61.47 |
|
| 2022 | | 1,346 |
| | 5,448 |
| | 10.1% | | 309,147 |
| | 56.75 |
|
| 2023 | | 1,296 |
| | 5,218 |
| | 9.6% | | 346,335 |
| | 66.37 |
|
| 2024 | | 961 |
| | 4,991 |
| | 9.2% | | 343,483 |
| | 68.82 |
|
| 2025 | | 978 |
| | 4,446 |
| | 8.2% | | 375,698 |
| | 84.50 |
|
| 2026 | | 821 |
| | 3,911 |
| | 7.2% | | 298,255 |
| | 76.26 |
|
| 2027 | | 704 |
| | 3,985 |
| | 7.3% | | 282,386 |
| | 70.86 |
|
| Subsequent | | 1,173 |
| | 6,931 |
| | 12.8% | | 461,935 |
| | 66.65 |
|
| Total | | 13,485 |
| | 54,233 |
| | 100.0% | | $ | 3,461,662 |
| | $ | 63.83 |
|
| Vacant Space | | 948 |
| | 1,990 |
| | | | | | |
| Mall and Freestanding GLA | | 14,433 |
| | 56,223 |
| | | | | | |
ITEM 3. LEGAL PROCEEDINGS
In the normal course of business, from time to time, we are involved in legal proceedings relating to the ownership and operations of our properties. In management's opinion, the liabilities, if any, that may ultimately result from such legal actions are not expected to have a material effect on our consolidated financial position, results of operations or liquidity.
The Company is subject to litigation related to the BPY Transaction. The Company cannot predict the outcome of pending litigation, nor can it predict the amount of time and expense that will be required to resolve such litigation.
ITEM 4. MINE SAFETY DISCLOSURES
Not applicable.
PART II
ITEM 5. MARKET FOR REGISTRANT'S COMMON EQUITY, RELATED STOCKHOLDER MATTERS AND ISSUER PURCHASES OF EQUITY SECURITIES
Our Class A Stock is listed on the Nasdaq under the symbol "BPR."BPYU." As of February 27, 2019,24, 2021, we had approximately 296329 stockholders of record of Class A Stock. Our Class B-1 Stock and Class B-2 Stock (together, the "Class B Stock"), Series B Preferred Stock and Class C Stock are not listed.
See Note 1211 for information regarding shares of our Class A Stock that may be issued under our equity compensation plans as of December 31, 20182020 and Note 109 for information regarding redemptions of the units of BPROPBPR OP, LP ("BPROP") held by limited partners for Class A Stock.
The following line graph sets forth the cumulative total returns on a $100 investment in each of the common stock of GGP Inc. (prior to August 28, 2018) and the Class A Stock of BPRBPYU (on and subsequent to August 28, 2018), S&P 500 and the FTSE National Association of REIT—REITs—Equity REITs from January 1, 2014December 31, 2015 through December 31, 2018.2020.
Total Return Performance (1)
January 2014December 2015 to December 20182020
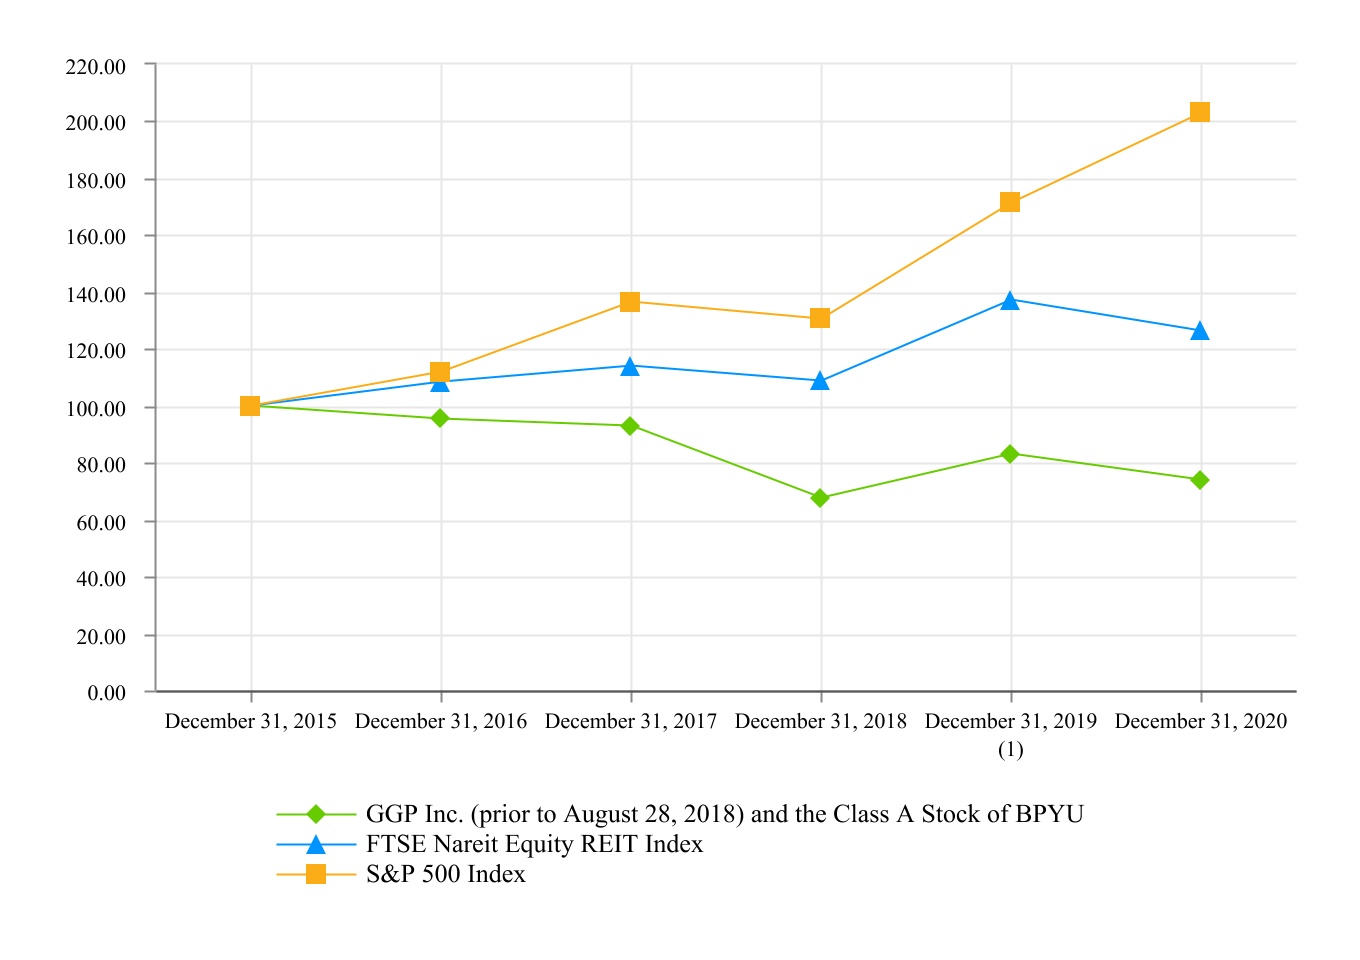 _____________________________________________________________________________
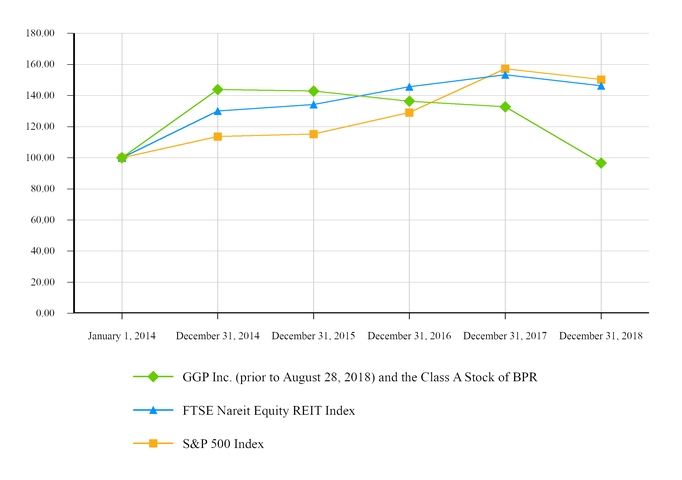
| | | As Of | | | January 1, 2014 | | December 31, 2014 | | December 31, 2015 | | December 31, 2016 | | December 31, 2017 | | December 31, 2018 | As Of | | December 31, 2015 | | December 31, 2016 | | December 31, 2017 | | December 31, 2018 | | December 31, 2019 | | December 31, 2020 |
| BPR | Cum $ | | 100 |
| | 144 |
| | 143 |
| | 136 |
| | 133 |
| | 97 |
| |
| Return % | | | | 43.85 |
| | 42.85 |
| | 36.39 |
| | 32.75 |
| | (3.43 | ) | |
| BPYU | | BPYU | Cum $ | | 100 | | | 95 | | | 93 | | | 68 | | | 83 | | | 74 | |
| Return % | | (4.53) | | | (7.07) | | | (32.40) | | | (17.00) | | | (25.94) | |
| FTSE Nareit Equity REIT Index | Cum $ | | 100 |
| | 130 |
| | 134 |
| | 146 |
| | 153 |
| | 146 |
| FTSE Nareit Equity REIT Index | Cum $ | | 100 | | | 109 | | | 114 | | | 109 | | | 137 | | | 126 | |
| Return % | | | | 30.14 |
| | 34.30 |
| | 45.74 |
| | 53.36 |
| | 46.27 |
| Return % | | 8.52 | | | 14.19 | | | 8.91 | | | 37.23 | | | 26.25 | |
| S&P 500 Index | Cum $ | | 100 |
| | 114 |
| | 115 |
| | 129 |
| | 157 |
| | 150 |
| S&P 500 Index | Cum $ | | 100 | | | 112 | | | 136 | | | 130 | | | 171 | | | 203 | |
| Return % | | | | 13.69 |
| | 15.26 |
| | 29.05 |
| | 57.22 |
| | 50.33 |
| Return % | | 11.96 | | | 36.40 | | | 30.42 | | | 71.49 | | | 103.04 | |
RecentUnregistered Sales of Unregistered Securities.Equity Securities and Use of Proceeds
None.In the third quarter of 2020, BPYU issued 19,367,288 shares of Class B-1 Stock to BPR FIN I Subco LLC, a related party, due to total contributions of $414.3 million, equal to $21.39 per share.
IssuerIn the fourth quarter of 2020, BPYU issued 5,513,266 shares of Class B-1 Stock to BPR FIN I Subco LLC, a related party, due to total contributions of 117.9 million, equal to $21.39 per share.
The Company used the proceeds to repay unsecured corporate debt, repurchase Class A Stock, and fund shareholder dividends. The issuance of the Class B-1 Stock was exempt from registration pursuant to Section 4(a)(2) of the Securities Act of 1933, as amended.
Recent Purchases of Equity Securities.Securities
| | | | | | | | | | | | | | | | | | | | | | | |
| Period | (a) Total number of shares (or units) purchased | | (b) Average price paid per share (or unit) | | (c) Total number of shares (or units) purchased as part of publicly announced plans or programs | | (d) Maximum number (or approximate dollar value) of shares (or units) that may yet be purchased under the plans or programs |
| | | | | | | |
| | | | | | | |
| | | | | | | |
| | | | | | | |
| | | | | | | |
| | | | | | | |
| October 1 - October 31, 2020 | 2,613,565 | | | 13.32 | | | 2,613,565 | | | (1) |
| November 1 - November 30, 2020 | — | | | — | | | — | | | (1) |
| December 1 - December 31, 2020 | — | | | — | | | — | | | (1) |
| Total | $ | 2,613,565 | | | $ | 13.32 | | | $ | 2,613,565 | | | (2) |
(1)On August 28, 2018,5, 2020, the Company’s Board of Directors authorized the repurchase of the greater of (i) 5% of the Company’s Class A Stock that are issued or outstanding or (ii) 10% of its public float of Class A Stock over the next 12 months from time to time as market conditions warrant. The Company has made no repurchases as
(2)As of August 5, 2020, the number of shares of Class A Stock comprising 10% of the Company's public float was greater than 5% of the Company's issued and outstanding Class A Stock, and was equal to 5,219,854 shares of Class A Stock. As of December 31, 20182020, zero shares of Class A Stock were available for repurchase under the shareCompany's stock repurchase program.plan.
On August 28, 2018, in connection with the BPY Transaction, each issued and outstanding share of the Company's common stock, other than shares owned by BPY or its affiliates, were canceled and extinguished and automatically converted into the right to receive cash from BPY in an amount, without interest, equal to $0.312 per share.
ITEM 6. SELECTED FINANCIAL DATA
The following table sets forth selected financial data which should be read in conjunction with the Consolidated Financial Statements and the related Notes and Management's Discussion and Analysis of Financial Condition and Results of Operations contained in this Annual Report.
| | | | | | | | | | | | | | | | | | | | | | | | | | | | | |
| | Year Ended December 31, 2020 | | Year Ended December 31, 2019 | | Year Ended December 31, 2018 | | Year Ended December 31, 2017 | | Year Ended December 31, 2016 |
| | (Dollars in thousands, except per share amounts) |
| OPERATING DATA (1) | | | | | | | | | |
| Total revenues | $ | 1,529,545 | | | $ | 1,563,968 | | | $ | 2,064,034 | | | $ | 2,327,862 | | | $ | 2,346,446 | |
| Total expenses | 1,447,488 | | | 1,373,886 | | | 1,636,358 | | | 1,489,605 | | | 1,546,193 | |
| Income from continuing operations | (801,584) | | | 480,911 | | | 4,163,769 | | | 666,873 | | | 1,308,273 | |
| Net (loss) income attributable to Brookfield Property REIT Inc. | (711,461) | | | 432,880 | | | 4,090,541 | | | 657,334 | | | 1,288,367 | |
| Common Stock Basic Earnings Per Share (Through August 27, 2018): | | | | | | | | | |
| Continuing operations | $ | — | | | $ | — | | | $ | 4.16 | | | $ | 0.72 | | | $ | 1.44 | |
| | | | | | | | | |
| | | | | | | | | |
| Common Stock Diluted Earnings Per Share (Through August 27, 2018): | | | | | | | | | |
| Continuing operations | $ | — | | | | | $ | 4.15 | | | $ | 0.68 | | | $ | 1.34 | |
| | | | | | | | | |
| | | | | | | | | |
| Class A dividends declared per share (August 28, 2018 through December 31, 2020) (Note 9) (1) | $ | 1.33 | | | $ | 1.32 | | | $ | 0.63 | | | $ | — | | | $ | — | |
| | | | | | | | | |
| | | | | | | | | |
| Common stock Dividends declared per share (August 28, 2018) (Note 9) (2) | $ | — | | | $ | — | | | $ | 0.44 | | | $ | 0.88 | | | $ | 1.06 | |
| FUNDS FROM OPERATIONS ("FFO") (3) | $ | 484,191 | | | $ | 674,213 | | | $ | 1,569,283 | | | $ | 1,530,590 | | | $ | 1,500,848 | |
| | | | | | | | | |
| CASH FLOW DATA (1) (4) | | | | | | | | | |
| Operating activities | $ | (8,430) | | | $ | 428,129 | | | $ | 584,549 | | | $ | 1,294,612 | | | $ | 1,136,151 | |
| Investing activities | $ | (252,832) | | | $ | (1,328,958) | | | $ | 2,697,130 | | | $ | (855,296) | | | $ | 521,411 | |
| Financing activities | $ | 354,360 | | | $ | 877,648 | | | $ | (3,214,925) | | | $ | (738,263) | | | $ | (1,564,114) | |
|
| | | | | | | | | | | | | | | | | | | |
| | Year Ended December 31, 2018 | | Year Ended December 31, 2017 | | Year Ended December 31, 2016 | | Year Ended December 31, 2015 | | Year Ended December 31, 2014 |
| | (Dollars in thousands, except per share amounts) |
| OPERATING DATA (1) | |
| | |
| | |
| | | | |
|
| Total revenues | $ | 2,064,034 |
| | $ | 2,327,862 |
| | $ | 2,346,446 |
| | $ | 2,403,906 |
| | $ | 2,535,559 |
|
| Total expenses | 1,636,358 |
| | 1,489,605 |
| | 1,546,193 |
| | 1,480,013 |
| | 1,594,046 |
|
| Income from continuing operations | 4,163,769 |
| | 666,873 |
| | 1,308,273 |
| | 1,393,596 |
| | 398,011 |
|
| Net income attributable to Brookfield Property REIT Inc. | 4,090,541 |
| | 657,334 |
| | 1,288,367 |
| | 1,374,561 |
| | 665,850 |
|
| Common Stock Basic Earnings Per Share (Through August 27, 2018): | |
| | |
| | |
| | | | |
|
| Continuing operations | 4.16 |
| | 0.72 |
| | 1.44 |
| | $ | 1.54 |
| | $ | 0.42 |
|
| Discontinued operations | — |
| | — |
| | — |
| | — |
| | 0.32 |
|
| Total basic earnings per share | $ | 4.16 |
| | $ | 0.72 |
| | $ | 1.44 |
| | $ | 1.54 |
| | $ | 0.74 |
|
| Common Stock Diluted Earnings Per Share (Through August 27, 2018): | |
| | |
| | |
| | | | |
|
| Continuing operations | 4.15 |
| | 0.68 |
| | 1.34 |
| | $ | 1.43 |
| | $ | 0.39 |
|
| Discontinued operations | — |
| | — |
| | — |
| | — |
| | 0.30 |
|
| Total diluted earnings per share | $ | 4.15 |
| | $ | 0.68 |
| | $ | 1.34 |
| | $ | 1.43 |
| | $ | 0.69 |
|
| Class A dividends declared per share (August 28, 2018 through December 31, 2018) (Note 11) (1) | $ | 0.63 |
| | $ | — |
| | $ | — |
| | $ | — |
| | $ | — |
|
| Common stock dividends declared per share (Through August 27, 2018) (Note 11) (2) | $ | 0.44 |
| | $ | 0.88 |
| | $ | 1.06 |
| | $ | 0.71 |
| | $ | 0.63 |
|
| FUNDS FROM OPERATIONS ("FFO") (3) | $ | 1,569,283 |
| | $ | 1,530,590 |
| | $ | 1,500,848 |
| | $ | 1,299,454 |
| | $ | 1,320,197 |
|
| CASH FLOW DATA (1) (4) | | | | | | | | | |
| Operating activities | $ | 584,549 |
| | $ | 1,294,612 |
| | $ | 1,136,151 |
| | $ | 1,068,586 |
| | $ | 950,794 |
|
| Investing activities | $ | 2,697,130 |
| | $ | (855,296 | ) | | $ | 521,411 |
| | $ | (313,488 | ) | | $ | (681,399 | ) |
| Financing activities | $ | (3,214,925 | ) | | $ | (738,263 | ) | | $ | (1,564,114 | ) | | $ | (778,175 | ) | | $ | (487,605 | ) |
| | | | As of December 31, | | As of December 31, |
| | 2018 | | 2017 | | 2016 | | 2015 | | 2014 | | 2020 | | 2019 | | 2018 | | 2017 | | 2016 |
| BALANCE SHEET DATA | |
| | |
| | |
| | |
| | |
| BALANCE SHEET DATA | | | | | | | | | |
| Investment in real estate assets—cost | $ | 19,443,057 |
| | $ | 24,821,824 |
| | $ | 23,278,210 |
| | $ | 23,791,086 |
| | $ | 25,582,072 |
| Investment in real estate assets—cost | $ | 22,188,924 | | | $ | 22,474,919 | | | $ | 19,443,057 | | | $ | 24,821,824 | | | $ | 23,278,210 | |
| Total assets | 19,033,526 |
| | 23,347,526 |
| | 22,732,746 |
| | 24,073,555 |
| | 25,281,631 |
| Total assets | 21,879,964 | | | 21,973,386 | | | 19,033,526 | | | 23,347,526 | | | 22,732,746 | |
| Total debt | 12,795,849 |
| | 13,038,659 |
| | 12,636,618 |
| | 14,422,360 |
| | 16,150,387 |
| Total debt | 16,320,786 | | | 16,109,094 | | | 12,795,849 | | | 13,038,659 | | | 12,636,618 | |
| Redeemable noncontrolling interests | 73,696 |
| | 248,126 |
| | 262,727 |
| | 287,627 |
| | 299,296 |
| Redeemable noncontrolling interests | 60,826 | | | 62,235 | | | 73,696 | | | 248,126 | | | 262,727 | |
| Stockholders' equity | 1,221,826 |
| | 8,795,660 |
| | 8,635,764 |
| | 8,270,043 |
| | 7,605,919 |
| Stockholders' equity | 1,843,286 | | | 1,762,367 | | | 1,221,826 | | | 8,795,660 | | | 8,635,764 | |
| |
(1) | Cash flow data only represents BPR's consolidated cash flows as defined by GAAP and as such, operating cash flow does not include the cash received from our Unconsolidated Real Estate Affiliates, except to the extent of contributions to or distributions from our Unconsolidated Real Estate Affiliates. |
(1) Cash flow data only represents BPYU's consolidated cash flows as defined by generally accepted accounting principles ("GAAP") and as such, operating cash flow does not include the cash received from our Unconsolidated Real Estate Affiliates, except to the extent of contributions to or distributions from our Unconsolidated Real Estate Affiliates.
(2) Excludes the Pre-Closing Dividend.
| |
(3) | (3) FFO (as defined below) are presented at our proportionate share and do not represent cash flows from operations as defined by GAAP. |
| |
(4) | We adopted accounting guidance which requires that the statement of cash flows explain the change during the reporting period in the total of cash, cash equivalents and restricted cash or restricted cash equivalents. This resulted in the reclassification of restricted cash within the statement of cash flows for all periods presented. |
(4) We adopted accounting guidance which requires that the statement of cash flows explain the change during the reporting period in the total of cash, cash equivalents and restricted cash or restricted cash equivalents. This resulted in the reclassification of restricted cash within the statement of cash flows for all periods presented.
ITEM 7. MANAGEMENT'S DISCUSSION AND ANALYSIS OF FINANCIAL CONDITION AND RESULTS OF OPERATIONS
All references to numbered Notes are to specific footnotes to our Consolidated Financial Statements included in this Annual Report and whose descriptions are incorporated into the applicable response by reference. The following discussion should be read in conjunction with such Consolidated Financial Statements and related Notes. Capitalized terms used, but not defined, in this Management's Discussion and Analysis of Financial Condition and Results of Operations have the same meanings as in such Notes.
Overview—Introduction
We own a property portfolio comprised primarily of Class A retail properties (defined primarily by sales per square foot). As of December 31, 2018,2020, we own,owned, either entirely or with joint venture partners, 124121 retail properties located throughout the United States comprising approximately 121120 million square feet of gross leasable area or GLA.
Our primary objective is to be an owner and operator of best-in-class retail properties that provide an outstanding environment and experience for our communities, retailers and consumers. Our strategy includes:
•increasing the permanent occupancy of our regional mall portfolio by converting temporary leases to permanent leases and leasing vacant space;
•renewing or replacing expiring leases at greater rental rates;
•actively recycling capital through the disposition of assets andassets; investing in whole or partial interests in high-quality regional malls, anchor pads, and our development pipeline and repaying debt; and
•continuing to execute on our existing redevelopment projects and seeking additional opportunities within our portfolio for redevelopment.
Despite the recent economic disruption caused by COVID-19, we expect that the high quality nature of our stabilized properties and associated cash flows will continue to be in demand from investors, although our ability to execute on recycling of capital initiatives will likely be impacted in the short term.
As of December 31, 2018,2020, the portfolio was 96.5%92.5% leased, compared to 96.7%96.4% leased at December 31, 2017.2019. On a suite-to-suite basis, the leases commencing occupancy in the trailing 12 months exhibited initial rents that were 10.6%1.1% higher than the final rents paid on expiring leases.
In 2018,Overview—Financial
The COVID-19 pandemic has spread globally, and has caused a global economic shutdown. The actions taken in response to the shutdown have interrupted business activities and supply chains; disrupted travel; contributed to significant volatility in the financial markets, resulting in a general decline in equity prices and lower interest rates; impacted social conditions; and adversely impacted local, regional, national and international economic conditions, as well as the labor markets. Accordingly, we caution you that our retail properties reported an averagefinancial position and consolidated performance presented below may not be indicative of $746our results in tenant sales per square foot. During this same period,future periods as a result of the spread betweenongoing and developing COVID-19 pandemic and its resulting impact on the rent paid on expiring leases and the rent commencing under new leases on a suite-to-suite basis in our retail portfolio increased by 10.6%, demonstrating our strong same-property growth potential.global economy.
Overview
Net income attributable to BPR increased 522.3%BPYU decreased 264.4% from $0.7 billion for the year ended December 31, 2017 to $4.1 billion for the year ended December 31, 2018 primarily due to gains and deferred taxes related to the sale of partial interests in properties related to joint ventures formed in conjunction with the BPY Transaction (Note 3). Operating income decreased 49.0% from $838.3$432.9 million for the year ended December 31, 20172019 to $427.7$(711.5) million for the year ended December 31, 2018.2020 primarily due to the increase in equity in loss of unconsolidated real estate affiliates and the decrease in gains on the sale of unconsolidated properties.
See Non-GAAP Supplemental Financial Measures below for a discussion of funds from operations ("FFO"), along with a reconciliation to Net (loss) income attributable to BPYU.
Operating Metrics
The following table summarizes selected operating metrics for our portfolio.
| | | | | | | | | | | | |
| December 31, 2020 (1) | | December 31, 2019 (1) | |
| In-Place Rents Per Square Foot (all less anchors) (2) | $ | 61.29 | | | $ | 61.70 | | |
| | | | |
| | | | |
| In-Place Rents Per Square Foot (<10K square feet) (2) | $ | 80.43 | | | $ | 79.84 | | |
| | | | |
| Percentage Occupied for Total Retail Properties | 92.1 | % | | 96.0 | % | |
| | | | |
| | | | |
| Percentage Leased for Total Retail Properties | 92.5 | % | | 96.4 | % | |
|
| | | | | | | |
| | December 31, 2018 (1) | | December 31, 2017 (1) |
| In-Place Rents Per Square Foot (all less anchors) (2) | $ | 61.86 |
| | $ | 62.29 |
|
| In-Place Rents Per Square Foot (<10K square feet) (2) | $ | 78.39 |
| | $ | 77.98 |
|
| | | | |
| Percentage Leased for Total Retail Properties | 96.5 | % | | 96.7 | % |
| |
(1) | Metrics exclude properties acquired in the year ended December 31, 2018 and the December 31, 2017, reductions in ownership as a result of sales or other transactions, and certain redevelopments and other properties. |
| |
(2) | Rent is presented on a cash basis and consists of base minimum rent and common area costs. |
Lease Spread Metrics
The following table summarizestables summarize signed leases compared to expiring leases in the same suite, for leases where (1) the downtime between new and previous tenant was less than 24 months, (2) the occupied space between the previous tenant and new tenant did not change by more than 10,000 square feet and (3) the new lease term is at least a year.
|
| | | | | | | | | | | | | | | | | | | | | | |
| | Number of Leases | | Square Feet (in thousands) | | Term/Years | | Initial Rent Per Square Foot (1) | | Expiring Rent Per Square Foot (2) | | Initial Rent Spread | | % Change |
| Trailing 12 Month Commencements | 1,239 |
| | 4,408 |
| | 7.1 | | $ | 70.35 |
| | $ | 63.60 |
| | $ | 6.75 |
| | 10.6 | % |
| | | | | | | | | | | | | | | | | | | | | | | | | | | | | | | | | | | | | | | | | |
| | Number of Leases | | Square Feet (in thousands) | | Term/Years | | Initial Rent Per Square Foot (1) | | Expiring Rent Per Square Foot (2) | | Initial Rent Spread | | % Change |
| Trailing 12 Month Commencements | 717 | | | 2,553 | | | 6.5 | | $ | 52.30 | | | $ | 51.47 | | | $ | 0.55 | | | 1.1 | % |
| | | | | | | | | | | | | |
| | | | | | | | | | | | | |
(1) Represents initial annual rent over the lease consisting of base minimum rent and common area maintenance.
(2) Represents expiring rent at end of lease consisting of base minimum rent and common area maintenance.
Results of Operations
Year Ended December 31, 20182020 and 20172019
Rental revenues increased $18.2 million, primarily due to the acquisition of an additional interest in four operating properties in the fourth quarter of 2019. The acquisition resulted in a $152.8 million increase in rental revenues during 2020 compared to 2019 (Note 3). This is offset by decreases in rental revenues across the portfolio during 2020 compared to 2019 .
Management fees and other corporate revenues decreased $41.4 million, primarily due to a decrease in gross receipts across the portfolio during 2020 compared to 2019.
Real estate taxes increased $21.7 million, primarily due to the acquisition of an additional interest in four operating properties in the fourth quarter of 2019. The acquisition resulted in a $14.9 million increase in real estate taxes during 2020 compared to 2019 (Note 3). In addition, the acquisition of an additional interest at one property in the third quarter of 2019 resulted in $3.2 million increase in real estate taxes during 2020 compared to 2019 (Note 3).
The following tableprovision for impairment of $133.7 million during 2020 is related to impairment charges recorded on two operating properties and the provision of impairment of $223.1 million during 2019 is related to impairment charges recorded on two operating properties (Note 2).
Depreciation and amortization increased $140.0 million primarily due to the acquisition of an additional interest in four operating properties in the fourth quarter of 2019. The acquisition resulted in a breakout$120.9 million increase in depreciation and amortization during 2020 compared to 2019 (Note 3).
Loss from changes in control of investment properties of $15.4 million during 2020 is related to the componentsacquisition of minimum rents:an additional interest at one property (Note 3). The gain from changes in control of investment properties of $720.7 million during 2019 is related to the acquisition of four operating properties which had been Unconsolidated Real Estate Affiliates from its former joint venture partners in the properties (affiliates of JPMorgan Chase & Co. ("JPM") and New York State Teachers' Retirement System ("NYSTRS")) and resulting in the Company obtaining control over the entities and consolidating the properties
|
| | | | | | | | | | | | | | |
| | Year Ended December 31, | | | | |
| | 2018 | | 2017 | | $ Change | | % Change |
| | (Dollars in thousands) | | | | |
| Components of Minimum Rents: | |
| | |
| | |
| | |
|
| Base minimum rents | $ | 1,272,332 |
| | $ | 1,447,837 |
| | $ | (175,505 | ) | | (12.1 | )% |
| Lease termination income | 31,297 |
| | 29,081 |
| | 2,216 |
| | 7.6 |
|
| Straight-line rent | (2,425 | ) | | 2,084 |
| | (4,509 | ) | | (216.4 | ) |
| Above and below-market tenant leases, net | (3,259 | ) | | (23,963 | ) | | 20,704 |
| | (86.4 | ) |
| Total minimum rents | $ | 1,297,945 |
| | $ | 1,455,039 |
| | $ | (157,094 | ) | | (10.8 | )% |
Base minimum rentsThe gain on extinguishment of debt of $14.3 million during 2020 is related to the debt buyback transactions that occurred in second quarter of 2020 (Note 6). The loss on extinguishment of debt of $27.5 million during 2019 is due to a pre-payment penalty related to the refinance at one property (Note 6).
Benefit from income taxes reflects an increase in 2020 of $45.1 million compared to 2019 primarily due to an adjustment to our prior year deferred taxes. Additionally, there was an increase in income tax benefit driven by the negative impact to operations from the COVID-19 pandemic.
Equity in loss of Unconsolidated Real Estate Affiliates of $180.6 million during 2020 is primarily related to impairment charges on four unconsolidated operating properties (Note 5) and a loss of revenues.
Unconsolidated Real Estate Affiliates - loss on investment of $51.8 million during 2020 is primarily related to the impairment charge on one investment property (Note 2).
Year Ended December 31, 2019 and 2018
Rental revenues decreased $175.5by $530.3 million primarily due to the joint ventures formed in conjunction with the BPY Transaction in the third quarter of 2018. The joint ventures resulted in a $158.3$503.2 million decrease in permanent base minimum rentsrental revenues during 20182019 compared to 2017.2018. In addition, the dispositionsale of threeour partial interest at one operating properties during 2017property in the fourth quarter of 2018 resulted in a $9.0$10.2 million decrease in base minimum rents.
Tenant recoveries decreased $103.2 million primarily due to the joint ventures formed in conjunction with the BPY Transaction in the third quarter 2018. The joint ventures resulted in $85.6 million decrease in tenant recoveriesrental revenues during 20182019 as compared to 2017.2018 as the property is now accounted for in Unconsolidated Real Estate Affiliates (Note 3).
In addition, the disposition of three operating properties during 2017 resulted in a $6.0 million decrease in tenant recoveries during 2018 compared to 2017.
Management fees and other corporate revenues increased $20.6$40.7 million, primarily due to the joint ventures formed in conjunction with the BPY Transaction in the third quarter of 2018. The joint ventures resulted in a $13.4$38.7 million increase in property management fees. In addition, property and asset managementleasing fees related to the Seritage joint venture increased by $11.0 million in 2018during 2019 compared to 20172018 (Note 3).
Real estate taxes decreased $16.0$50.1 million, primarily due to the joint ventures formed in conjunction with the BPY Transaction in the third quarter of 2018. The joint ventures resulted in a $28.5$54.1 million decrease in real estate taxes during 20182019 compared to 2017. This was partially offset by 218 West 57th Street, 530 Fifth Avenue and 685 Fifth Avenue becoming consolidated properties during the third quarter of 2017. This resulted in a $5.1 million increase in 2018 compared to 2017.
Property management and other costs increased $27.3 million primarily due to an increase in salaries and bonuses, corporate office rent and management fees.
Provision for impairment of $45.9 million is related to impairment charges recorded on one operating property (Note 2)3).
Depreciation and amortizationOther property operating costs decreased $60.3$73.9 million, primarily due to the joint ventures formed in conjunction with the BPY Transaction in the third quarter of 2018. The joint ventures resulted in a $78.2 million decrease in other property operating costs during 2019 compared to 2018 (Note 3).
Property management and other costs increased $56.6 million primarily due to an increase in salaries and bonuses, corporate office rent and management fees.
The provision for impairment of $223.1 million during 2019 is related to impairment charges recorded on two operating properties and the provision of impairment of $45.9 million during 2018 is related to impairment charges recorded on one property (Note 2).
Depreciation and amortization decreased $131.4 million primarily due to the joint ventures formed in conjunction with the BPY Transaction in the third quarter of 2018. The joint ventures resulted in a $160.1 million decrease in depreciation and amortization during 2019 compared to 2018 (Note 3). The development projects related to one operating property resulted in an offsetting $13.2 million increase in depreciation expense during 2019 compared to 2018.
Interest expense increased $34.8$101.8 million primarily due to a $85.5$210.6 million increase in interest expense on the new credit agreement entered into during the third quarter of 2018 (Note 6). In addition, 218 West 57th Street, 530 Fifth Avenue and 685 Fifth Avenue became consolidated propertiesThe acquisition of an additional interest at one operating property from our joint venture partner during the third quarter of 2017. This2019 resulted in a $19.6$16.9 million increase in interest expense during 20182019 compared to 2017.2018 (Note 3). This was partially offset by the joint venture transactions related to the BPY Transaction in the third quarter of 2018. This resulted in a $72.2$134.4 million decrease in interest expense during 20182019 compared to 20172018 (Note 3). In addition, the sale of our partial interest at one operating property in the fourth quarter of 2018 resulted in $8.1 million decrease in interest expense during 2019 compared to 2018 as the property is now accounted for as Unconsolidated Real Estate Affiliates (Note 3).
The gain from changes in control of investment properties and other, net of $3.1 billion$720.7 million during 2018 relates2019 is due to the joint venture transactions related to the BPYJPM Transaction in the thirdfourth quarter of 2018, the sale of an anchor box at The Oaks Mall, the sale of commercial office unit at 685 Fifth Avenue, the sale of a 49% interest in Fashion Place, and the sale of a 49.9% joint venture interest in the Sears Box at Oakbrook Center2019 (Note 3).
The gainloss on extinguishment of debt during 2018 primarily2019 relates to a pre-payment penalty related to the refinance at one property which was conveyed to the lender in full satisfaction of the debt (Note 3)6).
Benefit from income taxes increased $583.3reflects a decrease in 2019 of $603.9 million duringas compared to 2018 primarily due to the recognition of deferred taxes related to certain transactions effectuated in the BPY Transaction in 2018 (Note 3).
Equity in income of Unconsolidated Real Estate Affiliates decreased by $66.2$67.0 million primarily due to a decrease in income recognition on condominiums and demolition work at one property anddecrease in income related to joint ventures formed in conjunction with the BPY Transaction in the third quarter of 2018 (Note 3).
Unconsolidated Real Estate Affiliates - gain on investment of $487.2$240.4 million during 2018 is due2019 relates to the joint ventures formed in conjunction with the BPYJPM Transaction, in the third quarter of 2018 and the sale of a portionour 12.0% interest in Bayside Marketplace and the 49.3% sale of our interest in AeropostaleAuthentic Brands Group LLC ("ABG") (Note 3).
Year Ended December 31, 2017 and 2016
The following table is a breakout of the components of minimum rents:
|
| | | | | | | | | | | | | | |
| | Year Ended December 31, | | | | |
| | 2017 | | 2016 | | $ Change | | % Change |
| | (Dollars in thousands) | | | | |
| Components of Minimum Rents: | |
| | |
| | |
| | |
|
| Base minimum rents | $ | 1,447,837 |
| | $ | 1,455,452 |
| | $ | (7,615 | ) | | (0.5 | )% |
| Lease termination income | 29,081 |
| | 16,024 |
| | 13,057 |
| | 81.5 |
|
| Straight-line rent | 2,084 |
| | 11,867 |
| | (9,783 | ) | | (82.4 | ) |
| Above and below-market tenant leases, net | (23,963 | ) | | (33,639 | ) | | 9,676 |
| | (28.8 | ) |
| Total minimum rents | $ | 1,455,039 |
| | $ | 1,449,704 |
| | $ | 5,335 |
| | 0.4 | % |
Base minimum rents decreased by $7.6 million primarily due to our sale of a 50% interest in Fashion Show during the third quarter of 2016. This resulted in $45.0 million less base minimum rents during 2017 compared to 2016 as the property is now accounted for as Unconsolidated Real Estate Affiliates. The acquisition of the 50% interest in Riverchase Galleria from our joint venture partner and the acquisition of 605 N. Michigan Avenue during the fourth quarter of 2016 resulted in an offsetting $22.3 million increase in base minimum rents. In addition, the acquisition of our joint venture partner's interest in Neshaminy during the second quarter of 2017 and the transaction at 218 West 57th Street, 530 Fifth Avenue, and 685 Fifth Avenue during the third quarter of 2017 resulted in a $14.7 million increase in base minimum rents.
Lease termination income increased $13.1 million primarily due to lease terminations at multiple tenants spread across the portfolio during 2017.
Tenant recoveries decreased $24.5 million primarily due to our sale of an interest in Fashion Show during the third quarter of 2016. This resulted in $18.5 million less tenant recoveries during 2017 compared to 2016 as the property is now accounted for as Unconsolidated Real Estate Affiliates. In addition, the sale of two operating properties during the third quarter of 2016 and the conveyance of one property to the lender during the second quarter of 2017 resulted in a $6.4 million decrease in tenant recoveries. The acquisition of the 50% interest in Riverchase Galleria from our joint venture partner during the fourth quarter of 2016 resulted in an offsetting $8.6 million increase in tenant recoveries.
Overage rents decreased $7.7 million across the portfolio.
Management fees and other corporate revenues increased $9.3 million primarily due to $7.2 million in property and asset management fees related to the Seritage joint venture during 2017 (Note 3), a $4.3 million one-time profit participation payment received during 2017 related to our Aeropostale joint venture (Note 5), $3.4 million in property management fees related to the joint venture formed with Fashion Show during the third quarter of 2016 and $2.5 million in leasing fees at 530 Fifth Avenue. This is partially offset by the divestiture of our investment in Seritage Growth Properties stock in 2016, which resulted in a $13.1 million gain (Note 2).
Real estate taxes increased $7.6 million primarily due to the acquisition of the 50% interest in Riverchase Galleria from our joint venture partner, the acquisition of 605 N. Michigan Avenue during the fourth quarter of 2016 and the acquisition of our joint venture partner's interest in Neshaminy during the second quarter of 2017. This resulted in a $4.7 million increase in real estate taxes during 2017 compared to 2016. In addition, the transaction at 218 West 57th Street, 530 Fifth Avenue, and 685 Fifth Avenue during the third quarter of 2017 resulted in a $2.1 million increase in real estate taxes. Our sale of a 50% interest in Fashion Show during the third quarter of 2016 resulted in offsetting $1.5 million reduction in real estate taxes as the property is now accounted for as an Unconsolidated Real Estate Affiliate.
Property maintenance costs decreased $5.2 million primarily due to continued efforts to manage operating expenses. In addition, our sale of a 50% interest in Fashion Show during the third quarter of 2016 resulted in a $1.2 million reduction in property maintenance costs as the property is now accounted for as an Unconsolidated Real Estate Affiliate.
Marketing costs decreased $2.1 million primarily due to a change in corporate strategy that resulted in a net reduction in spending.
Provision for loan loss of $29.6 million relates to the settlement of the Rique note receivable during 2016.
Property management and other costs increased $6.6 million primarily due to bonus savings in the prior year.
Provision for impairment of $73.0 million is related to impairment charges recorded on three operating properties during 2016 (Note 2).
Depreciation and amortization increased by $32.6 million primarily due to tenant write offs.
Interest expense decreased by $29.3 million primarily due to the sale of a 50% interest in Fashion Show during the third quarter of 2016. This resulted in $20.1 million less interest expense during 2017 compared to 2016 as the property is now accounted for as Unconsolidated Real Estate Affiliates. In addition, we paid down a mortgage note at one of our operating properties during 2016 resulting in a $5.5 million decrease in interest expense (Note 6) and conveyed one property to the lender in full satisfaction of the debt during the second quarter of 2017, resulting in a $5.8 million decrease in interest expense. We also sold two operating properties during 2016, resulting in a $2.7 million decrease in interest expense (Note 3). The decreases were partially offset by an increase in the LIBOR rate over the prior year. In addition, the transaction at 218 West 57th Street, 530 Fifth Avenue and 685 Fifth Avenue resulted in a $5.6 million increase in interest expense over the period.
The loss on foreign currency during 2017 is related to the impact of changes in the exchange rate on the proceeds from the settlement of a note receivable denominated in Brazilian Reais and received in conjunction with the sale of Aliansce in the third quarter of 2013.
The gain from changes in control of investment properties and other of $79.1 million during 2017 relates to the transaction at 218 West 57th Street, 530 Fifth Avenue and 685 Fifth Avenue, the acquisition of the remaining 50% interest in 8 of the 12 anchor boxes included in the GSPH joint venture with Seritage Growth Properties, the acquisition of the remaining interest in Neshaminy Mall and our sale of our interests in two properties (Note 3).
The gain on extinguishment of debt during 2017 relates to one property which was conveyed to the lender in full satisfaction of the debt (Note 3).
Benefit from income taxes increased $11.8 million primarily due to the one-time benefit resulting from the change in future Federal statutory tax rates due to the passing of the TCJA on December 22, 2017.
Equity in income of Unconsolidated Real Estate Affiliates decreased by $78.9 million primarily due to the acquisition of the 50% interest in Riverchase Galleria from our joint venture partner during the fourth quarter of 2016. This resulted in $55.6 million less equity in income of Unconsolidated Real Estate Affiliates during 2017 compared to 2016. In addition, income recognition on condominiums decreased by $26.3 million during the period (Note 5). Our sale of a 50% interest in Fashion Show during the third quarter of 2016 resulted in offsetting $8.7 million increase in equity in income of Unconsolidated Real Estate Affiliates.
Unconsolidated Real Estate Affiliates - gain on investment of $12.0 million during 2017 is related to the sale of a portion of our interest in Aeropostale (Note 3).
Liquidity and Capital Resources
Our primary source of cash is from the ownership and management of our properties and strategic dispositions. In addition, we will also use financings as a source of capital. We may generate cash from refinancings or borrowings under our revolving credit facility.facility (the "Facility"). Our primary uses of cash include payment of operating expenses, debt service, reinvestment in and redevelopment of properties, tenant allowances, dividends, share repurchases and strategic acquisitions.
We anticipate maintaining financial flexibility by managing our future maturities and amortization of debt, and minimizing cross collateralizations and corporate guarantees.debt. We believe that we currently have sufficient liquidity to satisfy all of our commitments in the form of $247.0$204.5 million of consolidated unrestricted cash and $1.5 billion, including the uncommitted accordion feature,$485.0 million of available credit under our revolving credit facility as of December 31, 2018,2020, as well as anticipated cash provided by operations.
Our key financing objectives include:
•to obtain property-secured debt with laddered maturities; and
•to minimize the amount of debt that is cross-collateralized and/or recourse to us.
We may raise capital through public or private issuances of debt securities, preferred stock, Class A Stock, BPROP Units, share repurchasesunits of limited partnership interest in BPR OP, LP ("BPROP"), or other capital raising activities. In addition, we or our affiliates may repurchase our shares or corporate debt and bonds.
DuringThe future impact of the year endedglobal economic shutdown on our level of liquidity is uncertain at this time. Measures undertaken by governments and companies in our principal markets resulted in the temporary closure of many of our operating assets, with the vast majority of the assets having now reopened. The duration of any such continuing measures or the re-imposition of such measure in the future may impact our ability to collect rental income in our retail assets. The longer-term impact of the shutdown and resulting economic downturn could reduce demand for retail space.
Consequently, we are reviewing, and where appropriate adjusting, our current capital expenditure and financing assumptions on existing and future projects to reflect any potential shorter- and longer-term impact of the shutdown.
We are also reviewing contractual arrangements with our tenants to assess the rights and responsibilities of the Company and our tenants in response to the impact of the measures undertaken by governments and/or tenants. Potential responses may include, but are not limited to, extension of payment terms from tenants, adjustments to the duration of leases, payment holidays, and renegotiation of lease terms.
We expect to be able to refinance the majority of debt obligations maturing in the near term or to exercise contractual extension options thereon, although there is no guarantee we will be able to do so. In certain instances, we plan to seek certain modifications to mortgages, including lease restructuring approvals and technical default waivers, and potentially interest deferrals.
In addition, certain debt obligations are subject to financial covenants, and in the shorter-term, the shutdown may negatively impact our ability to meet such covenants. We are reviewing the financial covenants of each debt instrument and, where applicable, working with our lenders to address debt instruments which may potentially approach or breach covenant limits.
Such adjustments may include, but are not limited to, adjustment to the covenant limits, interest payment holidays, and temporary suspension of covenant testing.
In order to maintain financial flexibility, we maintain capacity under our Facility. As at December 31, 2018:
2020, the available capacity under such credit facility was $485.0 million. We refinanced a consolidated mortgage note at 685 Fifth Avenue. The prior $340.0 million variable-rate consolidated mortgage note matured on July 1, 2018 and had an interest rate of LIBOR plus 2.75%. In connection with refinancing, $100.0 million remained relatedbelieve we will be able to the commercial office unit and a new $275.0 million fixed-rate consolidated mortgage
note with a term-to-maturity of 10.0 years and an interest rate of 4.53% was obtainedcontinue to borrow funds on the retail unit. The $100.0 million was paid down in full in conjunction with the sale of the commercial office unit on July 13, 2018.Facility when and as required.
We refinanced mortgage notes totaling $1.1 billion at nine properties. The prior loans totaling $1.2 billion had a weighted-average interest rate of 4.89%. The new loans have a weighted-average term-to-maturity of 5.1 years and a weighted-average interest rate of 5.21%.
We obtained new mortgage notes totaling $416.2 million at six properties with a weighted-average term-to-maturity of 4.6 years and a weighted-average interest rate of 4.72%.
The Company entered intois party to a new credit agreement (the "Agreement""Credit Agreement") dated as of August 24, 2018 consisting of a revolving credit facility (the "Facility"),the Facility, Term A-1 and A-2 loans, and a Term B loan. The Facility provides for revolving loans of up to $1.5 billion and borrowings bear interest at a rate equal to LIBOR plus 225 basis points.2.25%. The Facility is scheduled to mature in August 2022 and had outstanding borrowings of $387.0 million$1.0 billion as of December 31, 2018.2020. The Term A-1 Loan has a total commitment outstanding of $900.0 million, with $700.0 million attributable to BPRBPYU and $200.0 million attributable to an affiliate, and is scheduled to mature in August 2021, bearing interest at a rate equal to LIBOR plus 225 basis points.2.25%. During the fourth quarteryear ended December 31, 2020, the Company made a principal payment of 2018, we paid down $173.8$9.0 million, ofand the Term A-1 Loan with the proceeds from the sale of 49% of Fashion Place (Note 3).remaining outstanding balance was $25.8 million. The Term A-2 Loan has a total commitment outstanding of $2.0 billion and is scheduled to mature in August 2023, bearing interest at a rate equal to LIBOR plus 225 basis points.2.25%, and the outstanding balance on December 31, 2020 was $2.0 billion. The Term B Loan has a total commitment outstanding of $2.0 billion and is scheduled to mature in August 2025 bearing interest at a rate equal to LIBOR plus 250 basis points.2.50%. During the year ended December 31, 2020, the Company made additional payments in the total amount of $25.0 million, and the outstanding balance of the Term B loan was $1,950.0 million. The Term A-1, A-2, and B Loans are contractually obligated to be prepaid through net proceeds from property level refinances and asset sales as outlined in the Credit Agreement.
The Credit Agreement contains certain restrictive covenants which limit material changes in the nature of our business conducted, including, but not limited to, mergers, dissolutions or liquidations, dispositions of assets, liens, incurrence of additional indebtedness, dividends, transactions with affiliates, prepayment of subordinated debt, negative pledges and changes in fiscal periods. In addition, we are required not to exceedmaintain compliance with certain financial covenants related to a maximum net debt-to-value ratio and a minimum fixed-charge-coverage ratio, as defined in the Credit Agreement.
On July 29, 2020, the Company entered into the First Amendment of its Credit Agreement in order to give effect to certain amendments, including, but not limited to the following:
•The lenders agreed to certain covenant relief in respect of the financial covenants through the fiscal quarter ending June 30, 2021 (the "Covenant Relief Period"). The maximum total indebtedness to value ratio financial maintenance covenant was eliminated permanently. The minimum fixed charge coverage ratio. ratio was reduced to 1.20x during the Covenant Relief Period and increases to 1.35x thereafter.
•The applicable margin for the Term A Loans and the Facility is LIBOR plus 3.00% during the Covenant Relief Period – and thereafter, will be LIBOR plus 3.00% if the total net indebtedness to value ratio is greater than 70%.
•The Company agreed to maintain an ongoing liquidity covenant (set at $500 million) which will be tested as of the last day of each month against the amount of unrestricted cash, undrawn available amounts under the Facility and undrawn amounts under the new Brookfield Liquidity Facility. The Company has entered into and maintains a $500 million Brookfield Liquidity Facility (the "Brookfield Liquidity Facility") and prior to the date the Company demonstrates compliance with the financial covenants in effect under the Credit Agreement prior to the First Amendment, any interest and principal payments thereunder must be paid-in-kind.
•The Company is required to "match-fund" drawings under the Facility in excess of $1.0 billion using proceeds of either the Brookfield Liquidity Facility or issuances of qualified equity interests. The match-funding requirement is required to be made (i) monthly, whereby any drawing during that month is in excess of the prior highest balance of the revolver (in excess of $1.0 billion), (ii) within 10 business days of a request from the agent if as of any day during a month, the excess draw amount would exceed $10 million and (iii) at any time of request for a revolving loan that the excess would be $100 million or greater (which would be match-funded substantially concurrently with the requested revolving loan draw).
•The Company is required to make additional prepayments of the Term A loans with proceeds of certain equity, debt issuances and asset sales.
•The Company also agreed to a number of additional restrictions, including restrictions on incurring additional indebtedness, making of certain restricted payments and the use of proceeds under the revolving facility, which apply either through the end of the Covenant Relief Period – and in the case of certain provisions, until the Company demonstrates compliance with the financial covenants in effect under the Credit Agreement prior to the First Amendment.
As of December 31, 2018,2020, we are not aware of any instances of non-compliance with such covenants. Though there is potential for a risk of default (see Note 18 for discussion specific to COVID-19), in the event the Company fails to maintain compliance
with its financial covenants, the Credit Agreement provides for a cure period, during which the Company has the opportunity to raise additional cash and reduce net debt balance, such as through capital contributions from BPY, or disposition of assets. Management has determined that in the event of a default, it is probable that these market-based alternatives would be available, and that these actions would provide the necessary cash flows to prevent or cure an event of default, although there is no guarantee that these market-based alternatives would be available.
On May 24, 2020, the Company executed a series of transactions to repurchase corporate debt on the open market, funded by intercompany loans from BPY. The total amounts of debt repurchased had a par value of $59.6 million, and a cash repurchase price of $45.3 million. Following each repurchase, the repurchased debt was formally cancelled. As a result of the debt repurchase and cancellation, the Company recognized a gain of $14.3 million included in gain on extinguishment of debt on the Consolidated Statements of Operations and Comprehensive Income (Loss) for the twelve months ended December 31, 2020.
During the twelve months ended December 31, 2020, the Company suspended equity contributions to make contractual interest and/or principal payments on eighteen consolidated and unconsolidated property level mortgages, including one mortgage that is in maturity default. The Company is currently engaging in negotiations with the creditors on these mortgages to obtain potential lender concessions or other relief. If the Company is unsuccessful in obtaining concessions from these creditors, it is possible that the property securing these loans would be transferred to the lenders. In such circumstances, the carrying value of the property may no longer be recoverable and may trigger an impairment charge. These mortgages are non-recourse and the creditors do not have security claims against the Company aside from the collateral property. As of December 31, 2020, the Company has accrued $46.6 million of default interest related to these mortgages per contractual debt agreements.
As of December 31, 2020, the Company amended the agreement at one property (Note 6). In addition, the Company was unsuccessful in obtaining concessions from the creditor at one property and the loan was transferred to the lender (Note 3). In total, the Company has suspended equity contributions to make contractual interest and/or principal payments on a total of $1.6 billion of property level mortgages and the related Investment in Real Estate securing these loans has a carrying value of $1.7 billion.
During the year ended December 31, 2017:2020:
We paid downOn November 20, 2020 the Company closed on a $73.4new loan at The Mall in Columbia in the amount of $250.0 million consolidated mortgage note at Four Seasons Town Centre. The prior loan had a term-to-maturity of 0.2 years andwith an interest rate at LIBOR plus 4.5% which matures on December 9, 2022, and has one year extension option . The loan replaced the previous debt of 5.6%. Four Seasons Town Centre subsequently$317.0 million which matured on November 23, 2020. The transaction incurred fees in the amount of $3.7 million, which were capitalized.
On November 9, 2020 the Company closed on a new mortgage at Oakbrook Center in the amount of $319.0 million with an interest rate at LIBOR plus 2.31% and a mezzanine loan in the amount of $156.0 million with an interest rate at LIBOR plus 6.0%, respectively. Both loans which mature on November 9, 2022, and have one-year extension option. These loans replaced the previous debt of $425.0 million which matured on January 5,2021. The transaction incurred fees of $6.3 million which were capitalized.
On April 24, 2020, the Company completed a property that was sold during the year ended December 31, 2017 as collateral in our $1.4one-year extension of a $1.3 billion loan secured by cross-collateralized mortgages on 14 properties.
We obtained a new consolidated mortgage note at Mall of Louisiana for $325.0 million with an interest rate of 3.98%.
We obtained a new unconsolidated mortgage note at one property for $74.2 million with an interest rate of 3.77% and paid down a $60.0 million unconsolidated mortgage note at that property15 properties with an interest rate of LIBOR plus 1.75%., which matures on April 25, 2021. An extension fee of $1.6 million was paid in conjunction with the extension.
We refinancedOn February 28, 2020, the Company closed a $190.0new loan at the Miami Design District joint venture in the amount of $500.0 million consolidated mortgage note with a $110.0an interest rate of 4.13%, which matures on March 1, 2030. The loan replaced the previous debt of $480.0 million consolidated mortgage note at 530 Fifth Avenue. Both notes hadwith an interest rate of LIBOR plus 3.25%.2.50% that was scheduled to mature on May 14, 2021. As a result of the refinancing, the joint venture incurred $3.7 million of deferred financing costs that were capitalized.
Additional financing activity is relatedDuring the year ended December 31, 2019:
On November 1, 2019 the Company closed a new mortgage loan at Merrick Park in amount of $390.0 million with a 5-year fixed interest rate at 3.90% which matures November 1, 2024. This loan replaced the previous debt of $161.0 million with a fixed rate at 5.73% that was scheduled to drawsmature on April 1, 2021. The refinance incurred fees of $7.9 million for a prepayment penalty to the lender that was factored into the fair value of debt as of the consolidation date. The refinance occurred in conjunction with the JPM Transaction in Note 3.
On November 1, 2019, the Company closed a new loan on Natick Mall for $505.0 million with a 5-year fixed interest rate at 3.72% which matures on November 1, 2024. This loan replaced the previous debt of $419.4 million with an interest rate of 4.60% that matured on November 1, 2019.
On November 1, 2019 the Company closed a new mortgage loan and repaymentsa mezzanine loan at Park Meadows in amount of $615.0 million with an interest rate of 3.18% and in amount of $85.0 million with an interest rate of 6.25%, respectively. Both loans mature on November 1, 2024. These loans replaced previous debt of $360.0 million and an interest rate of 4.60% that was scheduled to mature on December 1, 2023. In connection with the refinancing, the Company incurred prepayment penalties of $35.6 million. As the refinancing plan was contemplated in connection with the acquisition, such fees were factored into the fair value of debt recognized on the corporate revolver.consolidation date. The refinance occurred in conjunction with the JPM Transaction in Note 3.
On October 25, 2019, the Company closed a new loan on First Colony Mall for $220.0 million with a 10-year fixed interest rate at 3.55% which matures on November 1, 2029. This loan replaced the previous debt of $168.6 million with an interest rate of 4.50% that matured on November 1, 2019.
On September 6, 2019, the Company closed a new loan at Park City Center in the amount of $135.0 million with an interest rate of LIBOR plus 3.00% which matures on September 9, 2021. This loan replaced the previous debt of $172.2 million that matured June 6, 2019 and included a pay down of the existing mezzanine loan in the amount of $36.8 million. For the period between the maturity date of the previous debt and the effective date of the new loan, the company extended forbearance and paid forbearance fees in total amount of $0.5 million.
On August 26, 2019, the Company closed on new loans at 730 Fifth Avenue in the amount of $807.5 million which mature on September 1, 2024. The loans consist of a senior loan in amount of $587.3 million with a 5-year term at LIBOR plus 3.00%, a senior mezzanine loan in amount of $97.9 million with a 5-year term at LIBOR plus 4.25%, and a junior loan in amount of $122.3 million with a 5-year term at LIBOR plus 5.50%. The loans replaced the previous debt of $720.0 million that was previously extended to August 27, 2019 and included a pay down of $180.0 million on June 28, 2019.
On August 9, 2019, the Company closed on new debt at the SoNo Collection for $305.0 million. This debt is comprised of a $245.0 million mortgage loan and a $60.0 million mezzanine loan with respective interest rates of LIBOR plus 3.02% and LIBOR plus 6.75%. The loans mature on August 6, 2023.
On July 10, 2019, the Company closed a new loan on Westlake Center in the amount of $48.8 million with a 2-year floating rate loan at LIBOR plus 2.50% which matures on July 10, 2021. This loan replaced the previous debt of $42.5 million that matured July 10, 2019.
On July 5, 2019, the Company closed on new loans on The Woodlands Mall for a total of $465.0 million, which consists of $425.0 million with an interest rate of 4.25% and $40.0 million with an interest rate of 5.50%. The loan has a weighted average interest rate of 4.36% which matures on August 1, 2029. The loan replaced the previous debt of $294.0 million on the property that had a weighted average interest rate of 4.83% and scheduled to mature on June 10, 2023. In accordance with the previous debt agreement, the Company incurred a prepayment penalty of $27.5 million which is recorded as loss on extinguishment of debt on the Consolidated Statements of Operations and Comprehensive Income for the year ended December 31, 2019
On July 1, 2019, the Company closed on a one-year extension on the loan at 830 North Michigan Ave in the amount of $78.0 million at LIBOR plus 1.60% which matures on July 1, 2020. This loan replaced the previous debt of $85.0 million that matured on July 1, 2019 and includes principal repayment of $7.0 million made in conjunction with the extension.
On June 3, 2019, the Company closed a new loan on the Grand Canal Shoppes in the amount of $975.0 million with a 10-year fixed interest rate of 4.29%, which matures on July 2, 2029. This loan replaced the previous debt of $625.0 million on the property that matured on June 3, 2019.
On May 1, 2019, the Company and BPR Cumulus LLC, BPR Nimbus LLC and GGSI Sellco LLC (each, an indirect subsidiary of the Company) issued $1.0 billion aggregate principal amount of 5.75% Senior Secured Notes - Silver Bonds due 2026. The notes bear interest at an annual rate of 5.75% payable on May 15 and November 15 of each year, beginning on November 15, 2019 and will mature on May 15, 2026. During the last quarter of 2019, the Company made a principal payment in amount of $50.0 thousand.
On April 25, 2019, the Company obtained a one-year extension of a $1.3 billion loan secured by cross-collateralized mortgages on 15 properties with an interest rate of LIBOR plus 1.75% which matures on April 25, 2020. A principal repayment of $10.1
million was made in conjunction with the extension. The Company has one remaining one-year extension option to April 25, 2021 available.
On April 9, 2019, the Company closed a new loan on three properties included in the BPR-FF JV LLC joint venture that was formed with Brookfield Real Estate Partners during 2018 (Note 6). The three properties are Coronado Center, Governor's Square and Lynnhaven Mall. These properties were previously encumbered by $462.0 million of third-party debt which was replaced by a $515.0 million loan which is maturing May 1, 2024. The new loan consists of a senior loan in amount of $395.0 million with an interest rate at LIBOR plus 2.38%, and a mezzanine loan in amount of $120.0 million with an interest rate at LIBOR plus 6.75%. The new loan was recorded as an extinguishment of the previous loans and allocation of the new debt to the three properties.
As of December 31, 2018,2020, we had $7.3$8.7 billion of debt pre-payable at our proportionate share without penalty. We may pursue opportunities to refinance this debt at lower interest rates and longer maturities.
As of December 31, 2018,2020, our proportionate share of total debt aggregated $20.8$23.2 billion. Our total debt includes our consolidated debt of $12.8$16.3 billion and our share of Unconsolidated Real Estate Affiliates debt of $8.0$6.9 billion. Of our proportionate share of total debt, $5.8$6.9 billion is recourse to the Company or its subsidiaries (including the facility) due to guarantees or other security provisions for the benefit of the note holders.
The amount of debt due in the next three years represents 33.1%50.3% of our total debt at maturity. The maximum amount due in any one of the next ten years is no more than $4.5$4.2 billion at our proportionate share or approximately 21.7% of 17.9% our total debt at maturity.
The following table illustrates Refer to Note 18 in the Consolidated Financial Statements for the scheduled payments for our proportionateconsolidated share of total debt as of December 31, 2018,2020, assuming that all maturity extensions are exercised. The $206.2 million of junior subordinated notes are due in 2036, but we may redeem them any time after April 30, 2011 (Note 6). As we do not expect to redeem the notes prior to maturity, they are included in the consolidated debt maturing subsequent to 2023.2024.
|
| | | | | | | |
| | Consolidated | | Unconsolidated |
| | (Dollars in thousands) |
| 2019 | $ | 301,947 |
| | $ | 1,313,867 |
|
| 2020 | 703,746 |
| | 937,830 |
|
| 2021 | 2,873,677 |
| | 759,357 |
|
| 2022 | 1,460,733 |
| | 1,124,941 |
|
| 2023 | 3,244,970 |
| | 1,269,911 |
|
| Subsequent | 4,210,776 |
| | 2,592,358 |
|
| | $ | 12,795,849 |
| | $ | 7,998,264 |
|
We believe we will be able to extend the maturity date, repay under our available line of credit or refinance the consolidated debt that is scheduled to mature in 2019.2021. We also believe that the joint ventures will be able to refinance the debt of our Unconsolidated Real Estate Affiliatesunconsolidated real estate affiliates upon maturity; however, there can be no assurance that we will be able to refinance or restructure such debt on acceptable terms or otherwise, or that joint venture operations or contributions by us and/or our partners will be sufficient to repay such loans.
Acquisitions and Joint Venture Activity
From time-to-time we may acquire whole or partial interests in high-quality retail properties or make strategic dispositions. Refer to Note 3 for more information.
Reserves
With respect to our consolidated properties, for the years ended December 31, 2020 and 2019, we have recorded $42.3 million and $8.2 million respectively, associated with potentially uncollectible revenues, which includes $5.3 million and $0.1 million, respectively, for straight-line rent receivables. With respect to our Unconsolidated Real Estate Affiliates, for the years ended December 31, 2020 and 2019, our Unconsolidated Real Estate Affiliates have recorded $68.7 million and $11.3 million, respectively, associated with potentially uncollectible revenues, which includes $8.6 million and $0.2 million, respectively, for straight-line rent receivables. Of these amounts for the years ended December 31, 2020 and 2019, our share totaled $33.8 million and $6.0 million, respectively, which includes $4.2 million and $0.1 million, respectively, for straight-line rent receivables.
As of December 31, 2020, the Company, including consideration of our share of Unconsolidated Real Estate Affiliates, has collected approximately 75% of rents for the year then ended, and collections continue to increase subsequent to year end. While working to preserve our profitability and cash flow, we are also working with our tenants regarding requests for lease concessions and other forms of assistance. The Company continues to make meaningful progress in its negotiations with national and local tenants to secure rental payments, despite a significant portion of the Company’s tenants requesting rental assistance, whether in the form of deferral or rent reduction. As of December 31, 2020, in response to the COVID-19 pandemic, the Company granted rent deferrals and rent abatements of 4% and 5% of 2020 rents, respectively. The rent abatements granted were considered lease modifications and will be recognized prospectively over the remaining lease terms from the period of the rent that was abated. While we anticipate that we may grant further rent concessions, such as the deferral or abatement of lease payments, such rent concession requests are evaluated on a case-by-case basis. Not all requests for rent relief will be granted as the Company does not intend to forgo its legally enforceable contractual rights that exist under its lease agreements.
Developments and Redevelopments
We are currently redeveloping several consolidated and unconsolidated properties primarily to improve the productivity and value of the property, convert large-scale anchor boxes into smaller leasable areas and to create new in-line retail space and new restaurant venues. The execution of these redevelopment projects within our portfolio was identified as providing compelling risk-adjusted returns on investment.
We have development and redevelopment activities totaling approximately $657.5$449.0 million under construction and $533.1$327.0 million in the pipeline. We continue to evaluate a number of other redevelopment projects to further enhance the quality of our assets. We refer the reader to our disclosure related to forward-looking statements, below. The following table illustrates our planned redevelopments:
| | | | | Stabilized
Year | Proportionate Cost (1) | | Stabilized
Year | Proportionate Cost (1) | |
| Property | Location | Description | Total | To-Date | Property | Location | Description | Total | To-Date | |
| Major Development Summary (in millions, at share unless otherwise noted) | Major Development Summary (in millions, at share unless otherwise noted) | Major Development Summary (in millions, at share unless otherwise noted) | |
| Active developments | | | |
| | | | |
| The SoNo Collection (2) | Norwalk, CT | Ground up development | 2022 | $ | 451.3 |
| $ | 188.1 |
| |
| | | | | |
| Active redevelopments | Active redevelopments | | | Active redevelopments | | |
| | | | | |
| Oakbrook Center | Oak Brook, IL | Sears Redevelopment for Kidzania, Lifetime Fitness, and small shop | 2021 | 24.4 |
| 6.2 |
| |
| Paramus Park | Paramus, NJ | Sears Redevelopment for Stew Leonard's | 2021 | 20.7 |
| 7.4 |
| |
| Stonestown | San Francisco, CA | Macy's Redevelopment for Regal, Whole Foods, Sports Basement, B&N, small shop | 2021 | 95.3 |
| 1.3 |
| |
| Alderwood | | Alderwood | Lynnwood, WA | Sears Redevelopment - Residential | 2022 | $ | 13 | | $ | 4 | | |
| Stonestown Galleria | | Stonestown Galleria | San Francisco, CA | Anchor Redevelopment for Retail and Entertainment | 2023 | 149 | | 106 | | |
| Tysons Galleria | | Tysons Galleria | McLean, VA | Macy's Redevelopment for theater and multi level small shop expansion | 2023 | 111 | | 37 | | |
| Other Projects | Various | | 2020-2022 | 65.8 |
| 11.5 |
| Other Projects | Various | | 2021-2024 | 176 | | 56 | | |
| | Active developments/redevelopments | Active developments/redevelopments | | $ | 657.5 |
| $ | 214.6 |
| Active developments/redevelopments | | $ | 449 | | $ | 203 | | |
| In planning | In planning | | | In planning | | |
| | | | | |
| Northbrook Court | Northbrook, IL | Macy’s re-development including grocery anchored expansion and residential units | 2022 | $ | 75.5 |
| $ | 0.4 |
| |
| Oxmoor Center | Louisville, KY | Sears Redevelopment for Top Golf + restaurants | 2022 | 23.1 |
| 0.4 |
| Oxmoor Center | Louisville, KY | Sears Redevelopment for Entertainment and Restaurants | 2024 | $ | 30 | | $ | 1 | | |
| Stonestown | San Francisco, CA | Nordstrom Redevelopment for Target + spec entertainment | 2022 | 37.6 |
| 0.2 |
| |
| Valley Plaza Mall | Bakersfield, CA | Sears backfill for multi-tenant spec | 2021 | 18.1 |
| 0 |
| |
| Tysons Galleria | McLean, VA | Macy's Redevelopment for iPic and multi-level small-shop expansion | 2022 | 118.0 |
| 0.7 |
| |
| Cumberland | | Cumberland | Atlanta, GA | Residential | 2024 | 56 | | — | | |
| Northridge | | Northridge | Northridge, CA | Residential | 2025 | 50 | | — | | |
| Ala Moana | | Ala Moana | Honolulu, HI | Residential Tower | 2026 | 157 | | 1 | | |
| Other Projects | Various | | 2021-2023 | 260.8 |
| 0.8 |
| Other Projects | Various | | 2021-2025 | 34 | | 54 | | |
| | In planning | | $ | 533.1 |
| $ | 2.5 |
| In planning | | | $ | 327 | | $ | 56 | | |
| Total retail developments | | $ | 1,190.6 |
| $ | 217.1 |
| Total retail developments | | $ | 776 | | $ | 259 | | |
| |
(1) | Costs are at BPR's ownership share post August, 28, 2018, with closing of new joint venture partnerships. |
| |
(2) | Norwalk Total Projected Share of Cost and Total Investment to-date include $137 million BPY acquisition basis. |
(1) Costs are at BPYU's ownership share post - August, 28, 2018, with closing of new joint venture partnerships.
Our investment in these projects for the year ended December 31, 2018 increased from2020 decreased compared to those in the year ended December 31, 20172019 in conjunction with the applicable development plan and as projects near completion. The continued progression of redevelopment projects resulted in increases to BPR’sBPYU’s investment to date. Prior to the COVID-19 pandemic, our current projects were generally progressing in accordance with their timeline and budget. The impact of the pandemic and associated restrictions that have been put in place by local governments may cause delays in construction and may impact our ability to progress pre-leasing efforts.
Capital Expenditures, Capitalized Interest and Overhead (at share)
The following table illustrates our capital expenditures, capitalized interest, and internal costs associated with leasing and development overhead, which primarily relate to ordinary capital projects at our operating properties. In addition, we incurred tenant allowances and capitalized leasing costs for our operating properties as outlined below. Capitalized interest is based upon qualified expenditures and interest rates; capitalized leasing and development costs are based upon time expended on these activities. These costs are amortized over lives which are consistent with the related asset.
| | | | Year Ended December 31, | | Year Ended December 31, |
| | 2018 | | 2017 | | 2020 | | 2019 |
| | (Dollars in thousands) | | (Dollars in thousands) |
| Operating capital expenditures (1) | $ | 145,808 |
| | $ | 165,179 |
| Operating capital expenditures (1) | $ | 112,511 | | | $ | 167,118 | |
| Tenant allowances and capitalized leasing costs(2) | 190,327 |
| | 181,187 |
| |
| Tenant allowances and capitalized leasing costs (2) | | Tenant allowances and capitalized leasing costs (2) | 83,631 | | | 200,302 | |
| Capitalized interest and capitalized overhead | 69,582 |
| | 60,164 |
| Capitalized interest and capitalized overhead | 21,568 | | | 22,585 | |
| Total | $ | 405,717 |
| | $ | 406,530 |
| Total | $ | 217,710 | | | $ | 390,005 | |
| |
(1) | Reflects only non-tenant operating capital expenditures. |
| |
(2) | Tenant allowances paid on 7.9 million square feet. |
(1) Reflects only non-tenant operating capital expenditures.
(2) Tenant allowances paid on 3.9 million square feet for the year ended December 31, 2020 and 7.8 million for the year ended December 31, 2019.
Summary of Cash Flows
Cash Flows from Operating Activities
Net cash provided by operating activities was $(8.4) million for the year ended December 31, 2020, $428.1 million for the year ended December 31, 2019, and $584.5 million for the year ended December 31, 2018, $1,294.6 million for the year ended December 31, 2017, and $1,136.2 million for the year ended December 31, 2016.2018. Significant components of net cash provided by operating activities include:
2020 Activity
•equity in 2018, an increase in cash outflows from transaction expenses;
in 2017, increase in distributions received fromloss of Unconsolidated Real Estate Affiliates;Affiliates, $180.6 million;
•depreciation and amortization, $641.6 million;
in 2017, an increase in•provision for impairment, $133.7 million; and
•accounts and notes receivable, net, $(310.4) million.
2019 Activity
•a decrease of cash inflows was primarily due to the joint ventures formed in conjunction with the BPY Transaction in the third quarter of 2018 (Note 3); and
•gain from tenant recoveries.change in control of investment properties and other, net of $(720.7) million.
2018 Activity
•gain from change in control of investment properties and other, net of $(3.1) billion.
Cash Flows from Investing Activities
Net cash (used in) provided by (used in) investing activities was $(252.8) million for the year ended December 31, 2020, $(1.3) billion for the year ended December 31, 2019, and $2.7 billion for the year ended December 31, 2018, $(855.3) million for the year ended December 31, 2017, and $521.4 million for the year ended December 31, 2016.2018. Significant components of net cash (used in) provided by (used in) investing activities include:
20182020 Activity
•development of real estate and property improvements, $(272.8) million;
•proceeds from sales of investments properties and unconsolidated real estate affiliates, $3,050.3$88.4 million; and
•contributions to unconsolidated real estate affiliates, $(141.4) million.
2019 Activity
•acquisition of real estate and property additions, $(877.1) million;
•loans to joint venture and joint venture partners, $(95.8) million;
•proceeds from sales of investment properties and Unconsolidated Real estate Affiliates, $185.2 million;
•development of real estate and property improvements, $(674.5)$(514.3) million;
•net proceeds from distributions received from unconsolidatedUnconsolidated Real Estate Affiliates in excess of income, $363.2 million;
•contributions to Unconsolidated Real Estate Affiliates, $(239.4) million;
•proceeds from loan to affiliates, $330.0 million; and
•loans to affiliates, $(330.0) million.
2018 Activity
•proceeds from sale of investment properties and Unconsolidated Real Estate Affiliates, $3.1 billion;
•development of real estate and property improvements of $(674.5) million;
•net proceeds from distributions received from Unconsolidated Real Estate Affiliates in excess of income, $410.6 million;
•contributions to Unconsolidated Real Estate Affiliates, $(218.0) million; and
•proceeds from repayment of loans to joint ventures and joint venture partners, $204.9 million.
2017 Activity
proceeds from the sale of investment properties and unconsolidated real estate affiliates, $62.0 million;
development of real estate and property improvements of $(662.8) million;
net proceeds from distributions received from unconsolidated real estate in excess of income, $166.9 million;
contributions to Unconsolidated Real Estate Affiliates, $(120.4) million;
proceeds from repayment of loans to joint ventures and joint venture partners, $51.0 million; and
acquisition of real estate and real estate interests of $(230.8) million.
2016 Activity
proceeds from the sale of investment properties and unconsolidated real estate affiliates, $1.7 billion;
development of real estate and property improvements of $(547.4) million;
net proceeds from distributions received from unconsolidated real estate in excess of income, $82.8 million;
contributions to Unconsolidated Real Estate Affiliates, $(135.9) million;
proceeds from repayment of loans to joint ventures and joint venture partners, $13.0 million; and
acquisition of real estate and real estate interests of $(577.8) million.
Cash Flows from Financing Activities
Net cash used inprovided by (used in) financing activities was $3,214.9$354.4 million for the year ended December 31, 2018, $738.32020, $877.6 million for the year ended December 31, 2017,2019, and $1,564.1 million$(3.2) billion for the year ended December 31, 2016.2018. Significant components of net cash used inprovided by (used in) financing activities include:
20182020 Activity
•proceeds from the refinancing or issuance of mortgages, notes and loans payable, $906.4 million;
•principal payments on mortgages, notes, and loan payable, $(822.0) million;
•buyback of Class A Stock, $(168.4) million;
•issuances of Class B-1 Stock, $532.2 million;
•cash distributions to noncontrolling interests in consolidated real estate affiliates, $0.0 million; and
•cash distributions paid to stockholders, $(68.4) million.
2019 Activity
•proceeds from the refinancing or issuance of mortgages, notes and loans payable of $7.0$6.4 billion; net of which includes a $1.0 billion bond issuance;
•principal payments on mortgages, notes, and loan payable, $(4.5) billion;
•buyback of $(1.8) billion;Class A Stock, $(114.9) million;
•buyback of Class B-1 stock, $(224.5) million;
•issuances of Class B-1 Stock, $293.3 million;
•cash distributions to noncontrolling interests in consolidated real estate affiliates, $(99.3) million; and
•cash distributions paid to common stockholders of $(9.9) billion; and$(790.2) million.
cash contributions from noncontrolling interests from institutional investors of $1.5 billion.
20172018 Activity
•proceeds from the refinancing or issuance of mortgages, notes and loans payable, of $1.6$7.0 billion; net of principal payments of $(1.6)$(1.8) billion;
repurchase•issuances of treasury stock of $(274.0)Class C Stock, $200.0 million; and
•cash contributions from noncontrolling interests in consolidated real estate affiliates, $1.5 billion;
•cash distributions paid to common stockholders, of $(1.0) billion.$(9.9) billion; and
2016 Activity
acquisition of 1.4 million shares of our common stock for $(34.0) million;
•cash distributions and redemptions paid to holders of common and preferred stockholders of $(680.7) million and $(15.9) million, respectively; andunits, $(107.1) million.
principal payments on mortgage, notes and loans payable, net proceeds from refinancing or issuance of $(834.7) million.
Critical Accounting Policies
The preparation of the consolidated financial statements in conformity with GAAP requires management to make estimates and assumptions that affect the consolidated financial statements and disclosures. Some of these estimates and assumptions require application of difficult, subjective, and/or complex judgment about the effect of matters that are inherently uncertain and that may change in subsequent periods. We are required to make suchevaluate our estimates and assumptions when applyingon an ongoing basis. We base our estimates on historical experience and on various other assumptions that we believe to be reasonable under the following accounting policies:circumstances, the results of which form the basis for making judgments about the carrying values of assets and liabilities that are not readily apparent from other sources. Actual results may differ from these estimates under different assumptions or conditions.
Acquisitions of Operating Properties (Note 3)
New guidance issued clarified the definition of a business with the objective of adding guidance to assist entities with evaluating whether transactions should be accounted for as acquisitions (or disposals) of assets or businesses. Therefore, acquisitionsAcquisitions of properties are typically accounted for utilizing the historical costas acquisitions of the property and, accordingly,assets rather than acquisitions of a business. Accordingly, the results of operations of acquired properties have been included in the results of operations from the respective dates of acquisition.acquisition and acquisition costs are capitalized. Estimates of future cash flows and other valuation techniques are used to allocate the purchase price of acquired property between land, buildings and improvements, equipment, assumed debt liabilities and identifiable intangible assets and liabilities such as amounts related to in-place tenant leases, acquired above and below-market tenant and ground leases, and tenant relationships. No significant value had been ascribed to the tenant relationships.
The fair values of tangible assets are determined on an "if vacant" basis. The "if vacant" fair value is allocated to land, where applicable, buildings, equipment and tenant improvements based on comparable sales and other relevant information with respect to the property. Specifically, the "if vacant" value of the buildings and equipment was calculated using a cost approach utilizing published guidelines for current replacement cost or actual construction costs for similar, recently developed properties; and an income approach. Assumptions used in the income approach to the value of buildings include: capitalization and discount rates, lease-up time, market rents, make ready costs, land value, and site improvement value.
The estimated fair value of in-place tenant leases includes lease origination costs (the costs we would have incurred to lease the property to the current occupancy level of the property) and the lost revenues during the period necessary to lease-up from vacant to the current occupancy level. Such estimates include the fair value of leasing commissions, legal costs and tenant coordination
costs that would be incurred to lease the property to this occupancy level. Additionally, we evaluate the time period over which such occupancy level would be achieved and include an estimate of the net operating costs (primarily real estate taxes, insurance and utilities) incurred during the lease-up period, which generally ranges up to one year. The fair value of acquired in-place tenant leases is included in the balance of buildings and equipment and amortized over the remaining lease term for each tenant.
Identifiable intangible assets and liabilities are calculated for above-market and below-market tenant and ground leases where we are either the lessor or the lessee. The difference between the contractual rental rates and our estimate of market rental rates is measured over a period equal to the remaining non-cancelable term of the leases, including significantly below-market renewal options for which exercise of the renewal option appears to be reasonably assured. The remaining term of leases with renewal options at terms significantly below market reflect the assumed exercise of such below-market renewal options and assume the amortization period would coincide with the extended lease term. The above-market tenant leases and below-market ground leases are included in prepaid expenses and other assets (Note 15)14); the below-market tenant leases above-market ground leases and above-market headquarters office lease are included in accounts payable and accrued expenses (Note 16)15) in our Consolidated Balance Sheets.
Investments in Unconsolidated Real Estate Affiliates (Note 5)
We account for investments in joint ventures where we own a non-controlling joint interest using either the equity method or the cost method. If we have significant influence but not control over the investment, we utilize the equity method. If we have neither control nor significant influence, we utilize the cost method. Under the equity method, the cost of our investment is adjusted for our share of the earnings of such Unconsolidated Real Estate Affiliates from the date of acquisition, increased by our contributions and reduced by distributions received. Under the cost method, the cost of our investment is not adjusted for our share of the earnings of such Unconsolidated Real Estate Affiliates from the date of acquisition and distributions are treated as earnings when received.
To determine the method of accounting for partially owned joint ventures, we evaluate the characteristics of associated entities and determine whether an entity is a variable interest entity ("VIE"). A limited partnership or other similar entity is considered a VIE unless a simple majority of limited partners (excluding limited partners that are under common control with the general partner) have substantive kick-out rights or participating rights. Accounting guidance amended the following: (i) modified the evaluation of whether limited partnerships and similar legal entities are VIEs or voting interest entities, (ii) eliminated the presumption that a general partner should consolidate a limited partnership, (iii) affected the consolidation analysis of reporting entities that are involved with VIEs, and (iv) provided a scope exception for certain entities. If an entity is determined to be a VIE, we determine which party is the primary beneficiary by analyzing whether we have both the power to direct the entity's significant economic
activities and the obligation to absorb potentially significant losses or receive potentially significant benefits. Significant judgments and assumptions inherent in this analysis include the nature of the entity's operations, future cash flow projections, the entity's financing and capital structure, and contractual relationship and terms. Primary risks associated with our VIEs include the potential of funding the entities' debt obligations or making additional contributions to fund the entities' operations.
Partially owned, non-variable interest joint ventures over which we have controlling financial interest are consolidated in our consolidated financial statements. In determining if we have a controlling financial interest, we consider factors such as ownership interest, authority to make decisions, kick-out rights and substantive participating rights. Partially owned joint ventures where we do not have a controlling financial interest, but have the ability to exercise significant influence, are accounted for using the equity method.
We continually analyze and assess reconsideration events, including changes in the factors mentioned above, to determine if the consolidation treatment remains appropriate. Decisions regarding consolidation of partially owned entities frequently require significant judgment by our management. Errors in the assessment of consolidation could result in material changes to our consolidated financial statements.
Revenue Recognition and Related Matters
Minimum rents are recognized on a straight-line basis over the terms of the related operating leases, including the effect of any free rent periods. Minimum rents also include lease termination income collected from tenants to allow for the tenant to vacate their space prior to their scheduled termination dates, as well as accretion related to above-market and below-market tenant leases on acquired properties and properties that were recorded at fair value at the emergence from bankruptcy.
In leasing tenant space, we may provide funding to the lessee through a tenant allowance. In accounting for a tenant allowance, we determine whether the allowance represents funding for the construction of leasehold improvements and evaluate the ownership of such improvements. If we are considered the owner of the leasehold improvements for accounting purposes, we capitalize the amount of the tenant allowance and depreciate it over the shorter of the useful life of the leasehold improvements or the related
lease term. If the tenant allowance represents a payment for a purpose other than funding leasehold improvements, or in the event we are not considered the owner of the improvements for accounting purposes, the allowance is considered to be a lease incentive and is recognized over the lease term as a reduction of rental revenue on a straight-line basis.
Overage rent is paid by a tenant when the tenant's sales exceed an agreed upon minimum amount and is recognized on an accrual basis once tenant sales exceed contractual tenant lease thresholds and is calculated by multiplying the sales in excess of the minimum amount by a percentage defined in the lease. Tenant recoveries are most often established in the leases or in less frequent cases computed based upon a formula related to real estate taxes, insurance and other property operating expenses and are generally recognized as revenues in the period the related costs are incurred.
Accounting for real estate sales distinguishes between sales to a customer or non-customer for purposes of revenue recognition. Once we, as the seller, determine that we have a contract, we will identify each distinct non-financial asset promised to the counter-party and whether the counter-party obtains control and transfers risks and rewards of ownership of each non-financial asset to determine if we should derecognize the asset.
We provide an allowance for doubtful accounts against the portion of accounts receivable, net, including straight-line rents, which is estimated to be uncollectible. Such allowances are reviewed periodically based upon our recovery experience.
Notes receivable are evaluated for impairment at least quarterly. Impairment occurs when it is deemed probable that we will not be able to collect all amounts due according to the contractual terms of the loan. If a loan is considered to be impaired, we record an allowance through the provision for loan losses to reduce the carrying value of the loan to the present value of expected future cash flows discounted at the loan’s contractual effective rate or the fair value of the collateral, if repayment is expected solely from the collateral.
Leases
For operating leases with minimum scheduled rent increases, we recognize rental income on a straight‑line basis, including the effect of any free rent periods, over the lease term when collectability of lease payments is probable. Variable lease payments are recognized as rental income in the period when the changes in facts and circumstances on which the variable lease payments are based occur. Variable lease payments include overage rent, which is paid by a tenant when the tenant's sales exceed an agreed upon minimum amount, is recognized once tenant sales exceed contractual tenant lease thresholds and is calculated by multiplying the sales in excess of the minimum amount by a percentage defined in the lease.
Our leases also contain provisions for tenants to reimburse us for real estate taxes and insurance, as well as for other property operating expenses, marketing costs, and utilities, which are considered to be non-lease components. These tenant reimbursements are most often established in the leases or in less frequent cases computed based upon a formula. We have elected the practical expedient to not separate non-lease components from the lease component for all classes of underlying assets and determined that the lease component is the predominant component in the contract; therefore, these recoveries are recognized in a manner similar to minimum rents and variable rents within rental revenues on our Consolidated Statements of Operations and Comprehensive Income (Loss).
Rental revenues also includes lease termination income collected from tenants to allow for the tenant to vacate their space prior to their scheduled termination dates, as well as accretion related to above-market and below-market tenant leases on acquired properties and properties that were recorded at fair value at the emergence from bankruptcy.
Recognizing rental and related income on a straight-line basis results in a difference in the timing of revenue recognition from what is contractually due from tenants. Straight-line rents are recorded in accounts receivable, net in our Consolidated Balance Sheets. The Company is required to evaluate whether it is probable of collecting substantially all of the remaining lease payments. While we believe our leases generally contain provisions designed to ensure the creditworthiness of the tenant, companies in the retail industry, including some of our tenants, have declared bankruptcy, or from time to time, have voluntarily ceased their operations, downsized their brick and mortar presence or failed to comply with their contractual obligations to us and to others. While many of these tenants intend to exit the Chapter 11 bankruptcy process and resume operations, the outcomes of such proceedings are uncertain. We do evaluate the potential of bankruptcy and associated store closures when assessing whether the Company is probable of collecting substantially all of the remaining lease payments.
For leases where collectability of substantially all of the remaining lease payments is probable, we establish a general allowance for doubtful accounts against the portion of accounts receivable, net, including straight-line rents, which is estimated to be uncollectible due to credit-related losses based on our previous recovery experience. Lease concessions are generally considered a lease modification and thus are recognized prospectively over the remaining lease term when they become legally enforceable. However, the Company includes its estimate of potential lease concessions when establishing its general allowance, based on its best estimates of total lease concessions, recognizing the portion of the total concession that is deemed attributable to the current period through consideration of weighted average remaining lease terms. Changes in the general allowance are recognized in rental income on our Consolidated Statements of Operations and Comprehensive Income (Loss).
For leases where collectability of substantially all the remaining lease payments is not probable, the Company recognizes a current-period adjustment to rental income to the amount of cash collected from the lessee, effectively reducing cumulative income recognized since lease commencement from an accrual basis to cash basis. In addition, future revenue recognition is limited to amounts paid by the lessee. We will generally return to an accrual basis of accounting, if and when, all delinquent payments become current under the terms of the lease agreement and collectability of substantially all the remaining contractual lease payments is deemed probable.
In leasing tenant space, we may provide funding to the lessee through a tenant allowance. To account for a tenant allowance, we determine whether the allowance represents funding for the construction of leasehold improvements and evaluate the control and ownership of such improvements. If we are considered the owner of the leasehold improvements, we capitalize the amount of the tenant allowance and depreciate it over the shorter of the useful life of the leasehold improvements or the related lease term. If the tenant allowance represents a payment for a purpose other than funding leasehold improvements, or in the event we are not considered the owner of the leasehold improvements, the allowance is capitalized to deferred expenses and considered to be a lease incentive and is recognized over the lease term as a reduction of rental revenue on a straight-line basis.
Deferred expenses
The new leasing standard defines initial direct costs as incremental costs of a lease that would not have been incurred if the lease had not been obtained. These initial direct costs (consisting primarily of leasing commissions paid to third parties) are recognized as deferred expenses on our Consolidated Balance Sheet and are amortized using the straight-line method over the life of the leases. Other leasing costs which do not meet the definition of initial direct costs (consisting primarily of internal legal and leasing overhead costs) are expensed as incurred and included in property management and other costs in our Consolidated Statements of Operations and Comprehensive Income (Loss).
Topic 842 - Lease Modification Q&A
Due to the business disruptions and challenges severely affecting the global economy caused by the global economic shutdown, lessors may provide rent deferrals and other lease concessions to lessees. In April 2020, the Financial Accounting Standards Board ("FASB") staff issued a question and answer document (the "Lease Modification Q&A") focused on the application of lease accounting guidance to lease concessions provided as a result of the shutdown. Under existing lease guidance, economic relief that is agreed to or negotiated outside of the original lease agreement is typically considered a lease modification, in which case both the lessee and lessor would be required to apply the respective modification frameworks. However, if the lessee was entitled to the economic relief because of either contractual or legal rights, the relief would be accounted for outside of the modification framework. Although the original lease modification guidance in Accounting Standards Codification ("ASC") 842, Leases remain appropriate to address routine lease modifications, the Lease Modification Q&A established a different framework to account for certain lease concessions granted in response to the shutdown. The Lease Modification Q&A allows the Company, if certain criteria have been met, to make an accounting policy election to account for COVID-19 related lease concessions as either a lease modification or a negative variable adjustment to rental revenue. Such election is required to be applied consistently to leases with similar characteristics and similar circumstances.
The Company has elected to apply such relief and will avail itself of the election to treat lease concessions as lease modifications, thereby avoiding performing a lease by lease analysis for the lease concessions that were (1) granted as relief due to the shutdown and (2) result in the cash flows remaining substantially the same or less than the original contract.
Impairment
Operating properties
We regularly review our consolidated properties for potential impairment indicators whenever events or changes in circumstances indicate that the carrying amount may not be recoverable. Impairment indicators are assessed separately for each property and include, but are not limited to, significant decreases in real estate property net operating income, significant decreases in occupancy percentage, debt maturities, changes in management's intent with respect to the properties and prevailing market conditions.
If an indicator of potential impairment exists, the property is tested for recoverability by comparing its carrying amount to the estimated future undiscounted cash flows. The expected cash flows of a property are dependent on estimates and other factors subject to change, including (1) changes in the national, regional, global, and/or local economic climates, (2) competition from other shopping centers, stores, clubs, mailings, and the internet, (3) increases in operating costs and future required capital expenditures, (4) bankruptcy and/or other changes in the condition of third parties, including anchors and tenants, (5) expected holding period, (6) availability of and cost of financing, and (7) fair values including consideration of capitalization rates, discount rates, and comparable selling prices.prices, and (8) the probability of obtaining concessions from creditors at properties for which the Company has suspended funding equity contributions to make contractual interest and/or principal payments. These factors could cause our expected future cash flows from a retail property to change, and, as a result, an impairment could be considered to have occurred.
Although the carrying amount may exceed the estimated fair value of certain properties, a real estate asset is only considered to be impaired when its carrying amount cannot be recovered through estimated future undiscounted cash flows. To the extent an impairment provision is determined to be necessary, the excess of the carrying amount of the property over its estimated fair value is expensed to operations. In addition, the impairment provision is allocated proportionately to adjust the carrying amount of the asset group. The adjusted carrying amount, which represents the new cost basis of the property, is depreciated over the remaining useful life of the property.
Although we may market a property for sale, there can be no assurance that the transaction will be complete until the sale is finalized. However, GAAP requires us to utilize the Company's expected holding period of our properties when assessing recoverability. If we cannot recover the carrying value of these properties within the planned holding period, we will estimate the fair values of the assets and record impairment charges for properties when the estimated fair value is less than their carrying value.
Impairment indicators for pre-development costs, which are typically costs incurred during the beginning stages of a potential development and construction in progress, are assessed by project and include, but are not limited to, significant changes in the Company's plans with respect to the project, significant changes in projected completion dates, tenant demand, anticipated revenues or cash flows, development costs, market factors and sustainability of development projects.
Impairment charges are recorded in the Consolidated Statements of Operations and Comprehensive Income (Loss) when the carrying value of a property is not recoverable and it exceeds the estimated fair value of the property, which can occur in accounting periods preceding disposition and/or in the period of disposition.
Investment in Unconsolidated Real Estate Affiliates
A series of operating losses of an investee or other factors may indicate that an other-than-temporary decline in value of our investment in an Unconsolidated Real Estate Affiliate has occurred. The investment in each of the Unconsolidated Real Estate Affiliates is evaluated for valuation declines below the carrying amount. Accordingly, in addition to the property-specific impairment analysis that we performed for such joint ventures (as part of our operating property impairment process described above), we also considered whether there were other-than-temporary declines with respect to the carrying values of our Unconsolidated Real Estate Affiliates.
General
A significant judgement is made as to if and when impairment should be taken. The Company's assessment of impairment as of December 31, 2020 was based on the most current information available to the Company. Impairment charges could be taken in the future if economic conditions change or if the plans regarding our assets change. Therefore, we can provide no assurance that material impairment charges with respect to our assets, including operating properties, construction in progress and investments in Unconsolidated Real Estate Affiliates, will not occur in future periods. We will continue to monitor circumstances and events in future periods to determine whether impairments are warranted. Based upon current market conditions, certain of the Company’s properties may have fair values less than their carrying amounts. However, based on the Company’s plans with respect to those properties, the Company believes that their carrying amounts are recoverable and therefore, under applicable GAAP guidance, no impairment charges were recognized. If the operating conditions mentioned above deteriorate or if the Company’s expected holding period for assets change, subsequent tests for impairment could result in impairment charges in the future.
Capitalization of Development Costs
Construction and improvement costs incurred in connection with the development of new properties or the redevelopment of existing properties are capitalized. During development, we typically obtain land or land options, zoning and regulatory approvals, anchor commitments, and financing arrangements. This process may take several years during which we may incur significant costs. We capitalize all development costs once it is considered probable that a project will reach a successful conclusion. In the event a development is no longer deemed to be probable of occurring, the capitalized costs are expensed. Determination of when a development project is substantially complete and held available for occupancy and capitalization must cease also involves a degree of judgment. Real estate taxes, interest costs, and internal costs associated with leasing and development overhead incurred during construction periods are capitalized.
Contractual Cash Obligations and Commitments
The following table aggregates our subsequent contractual cash obligations and commitments as of December 31, 2018:2020:
| | | | | | | | | | | | | | | | | | | | | | | | | | | | | | | | | | | | | | | | | |
| | 2021 | | 2022 | | 2023 | | 2024 | | 2025 | | Subsequent/
Other | | Total |
| | | | | | (Dollars in thousands) | | | | |
| Long-term debt-principal (1) | $ | 3,580,941 | | | $ | 2,715,234 | | | $ | 2,142,753 | | | $ | 2,371,510 | | | $ | 3,103,457 | | | $ | 2,489,014 | | | $ | 16,402,909 | |
| Interest payments (2) | 536,017 | | | 443,633 | | | 365,290 | | | 288,992 | | | 171,224 | | | 78,169 | | | 1,883,325 | |
| Retained debt-principal | 56,975 | | | — | | | — | | | — | | | — | | | — | | | 56,975 | |
| Ground lease payments | 2,008 | | | 2,055 | | | 2,128 | | | 2,164 | | | 2,202 | | | 137,915 | | | 148,472 | |
| Corporate leases | 7,649 | | | 7,649 | | | 7,840 | | | 8,036 | | | 8,237 | | | 17,097 | | | 56,508 | |
| Purchase obligations (3) | 275,507 | | | — | | | — | | | — | | | — | | | — | | | 275,507 | |
| Junior Subordinated Notes (4) | — | | | — | | | — | | | — | | | — | | | 206,200 | | | 206,200 | |
| Total | $ | 4,459,097 | | | $ | 3,168,571 | | | $ | 2,518,011 | | | $ | 2,670,702 | | | $ | 3,285,120 | | | $ | 2,928,395 | | | $ | 19,029,896 | |
(1) Excludes $3.2 million of non-cash debt market rate adjustments, $105.9 million of deferred financing costs, and $11.0 million of debt related to solar projects.
(2) Based on rates as of December 31, 2020. Variable rates are based on a LIBOR rate of 2.0%. Excludes interest payments related to debt market rate adjustments.
|
| | | | | | | | | | | | | | | | | | | | | | | | | | | |
| | 2019 | | 2020 | | 2021 | | 2022 | | 2023 | | Subsequent/ Other | | Total |
| | | | | | (Dollars in thousands) | | | | |
| Long-term debt-principal (1) | $ | 418,006 |
| | $ | 808,052 |
| | $ | 2,881,788 |
| | $ | 1,443,819 |
| | $ | 3,166,110 |
| | $ | 4,163,148 |
| | $ | 12,880,923 |
|
| Interest payments (2) | 592,630 |
| | 558,729 |
| | 459,916 |
| | 379,088 |
| | 290,904 |
| | 434,170 |
| | 2,715,437 |
|
| Retained debt-principal | 1,917 |
| | 81,364 |
| | — |
| | — |
| | — |
| | — |
| | 83,281 |
|
| Ground lease payments | 2,139 |
| | 2,174 |
| | 2,209 |
| | 2,226 |
| | 2,233 |
| | 84,976 |
| | 95,957 |
|
| Corporate leases | 7,809 |
| | 7,990 |
| | 8,177 |
| | 8,366 |
| | 8,561 |
| | 33,859 |
| | 74,762 |
|
| Purchase obligations (3) | 269,568 |
| | — |
| | — |
| | — |
| | — |
| | — |
| | 269,568 |
|
| Junior Subordinated Notes (4) | — |
| | — |
| | — |
| | — |
| | — |
| | 206,200 |
| | 206,200 |
|
| Total | $ | 1,292,069 |
| | $ | 1,458,309 |
| | $ | 3,352,090 |
| | $ | 1,833,499 |
| | $ | 3,467,808 |
| | $ | 4,922,353 |
| | $ | 16,326,128 |
|
| |
(1) | Excludes $7.7 million of non-cash debt market rate adjustments, $123.8 million of deferred financing costs, and $31.0 million of debt related to solar projects. |
| |
(2) | Based on rates as of December 31, 2018. Variable rates are based on a LIBOR rate of 2.51%. Excludes interest payments related to debt market rate adjustments. |
| |
(3) | (3) Reflects accrued and incurred construction costs payable. Routine trade payables have been excluded. |
| |
(4) | The $206.2 million of junior subordinated notes are due in 2036, but may be redeemed by us any time. As we do not expect to redeem the notes prior to maturity, they are included in consolidated debt maturing subsequent to 2023. |
(4) The $206.2 million of junior subordinated notes are due in 2036, but may be redeemed by us any time. As we do not expect to redeem the notes prior to maturity, they are included in consolidated debt maturing subsequent to 2025.
Other long-term liabilities related to ongoing real estate taxes have not been included in the table as such amounts depend upon future applicable real estate tax rates. Real estate tax expense was $192.7 million in 2020, $171.1 million in 2019 and $221.2 million in 2018, $237.2 million in 2017 and $229.6 million in 2016.2018.
In the normal course of business, from time to time, we are involved in legal proceedings relating to the ownership and operations of our properties (reference is made to Item 3 above, which description is incorporated into this response).
We lease land or buildings at certain properties from third parties. The leases generally provide us with a right of first refusal in the event of a proposed sale of the property by the landlord. Rental payments are expensed as incurred and have, to the extent applicable, been straight-lined over the term of the lease. The following is a summary of our contractual rental expense, which is included in other property operating costs in our Consolidated Statements of Operations and Comprehensive Income:Income (Loss):
| | | | | | | | | | | | | | | | | |
| | Year Ended December 31, |
| | 2020 | | 2019 | | 2018 |
| | (Dollars in thousands) |
| Contractual rent expense, including participation rent | $ | 17,394 | | | $ | 12,979 | | | $ | 7,105 | |
| Contractual rent expense, including participation rent and excluding amortization of above and below-market ground leases and straight-line rent | 13,011 | | | 12,979 | | | 5,083 | |
|
| | | | | | | | | | | |
| | Year Ended December 31, |
| | 2018 | | 2017 | | 2016 |
| | (Dollars in thousands) |
| Contractual rent expense, including participation rent | $ | 7,105 |
| | $ | 8,561 |
| | $ | 8,589 |
|
| Contractual rent expense, including participation rent and excluding amortization of above and below-market ground leases and straight-line rent | 5,083 |
| | 6,304 |
| | 6,278 |
|
REIT Requirements
In order to remain qualified as a REIT for Federal income tax purposes, we must distribute at least 90% of our taxable ordinary income to stockholders. We are also subject to federal income tax to the extent we distribute less than 100% of our REIT taxable income, including capital gains. See Note 78 to the Consolidated Financial Statements for more detail on our ability to remain qualified as a REIT.
Recently Issued Accounting Pronouncements
Refer to Note 2 of the Consolidated Financial Statements for recently issued accounting pronouncements.
Subsequent Events
Refer to Note 2019 of the Consolidated Financial Statements for subsequent events.
Non-GAAP Supplemental Financial MeasuresMeasure and DefinitionsDefinition
Proportionate or At Share Basis
The following non-GAAP supplemental financial measures are all presented on a proportionate basis. The proportionate financial information presents the consolidated and unconsolidated properties at the Company’s ownership percentage or "at share". This form of presentation offers insights into the financial performance and condition of the Company as a whole, given the significance of the Company’s unconsolidated property operations that are owned through investments accounted for under GAAP using the equity method.
The proportionate financial information is not, and is not intended to be, a presentation in accordance with GAAP. The non-GAAP proportionate financial information reflects our proportionate economic ownership of each asset in our property portfolio that we do not wholly own. The amounts in the column labeled "Noncontrolling Interests" were derived on a property-by-property basis by including the share attributable to noncontrolling interests in each line item from each individual property. The Company does not have legal claim to the noncontrolling interest of assets, liabilities, revenue, and expenses. The amount of cash each noncontrolling interest receives is based on the specific provisions of each operating agreement and varies depending on certain factors including the amount of capital contributed by each investor and whether any investors are entitled to preferential distributions. The amounts in the column labeled "Unconsolidated Properties" were derived on a property-by-property basis by including our share of each line item from each individual entity. This provides visibility into our share of the operations of our joint ventures.
We do not control the unconsolidated joint ventures and the presentations of the assets and liabilities and revenues and expenses do not represent our legal claim to such items. The operating agreements of the unconsolidated joint ventures generally provide that partners may receive cash distributions (1) to the extent there is available cash from operations, (2) upon a capital event, such
as a refinancing or sale or (3) upon liquidation of the venture. The amount of cash each partner receives is based upon specific provisions of each operating agreement and varies depending on factors including the amount of capital contributed by each partner and whether any contributions are entitled to priority distributions. Upon liquidation of the joint venture and after all liabilities, priority distributions and initial equity contributions have been repaid, the partners generally would be entitled to any residual cash remaining based on their respective legal ownership percentages.
We provide non-GAAP proportionate financial information because we believe it assists investors and analysts in estimating our economic interest in our unconsolidated joint ventures when read in conjunction with the Company's reported results under GAAP. Other companies in our industry may calculate their proportionate interest differently than we do, limiting the usefulness as a comparative measure. Because of these limitations, the non-GAAP proportionate financial information should not be considered in isolation or as a substitute for our financial statements as reported under GAAP.
Funds From Operations ("FFO")
The Company determines FFO based upon the definition set forth by National Association of Real Estate Investment Trusts ("Nareit"). The Company determines FFO to be its share of consolidated net income (loss) attributable to common stockholders and redeemable non-controlling common unit holders computed in accordance with GAAP, adjusted for real estate related depreciation and amortization, excluding gains and losses from extraordinary items, excluding cumulative effects of accounting changes, excluding gains and losses from the sales of, or any impairment charges related to, previously depreciated operating properties, plus the allocable portion of FFO of unconsolidated joint ventures based upon the Company’s economic ownership interest, and all determined on a consistent basis in accordance with GAAP. The Company’s presentation of FFO has been reflected on a proportionate basis.
The Company considers FFO a helpful supplemental measure of the operating performance for equity REITs and a complement to GAAP measures because it is a recognized measure of performance by the real estate industry. FFO facilitates an understanding of the operating performance of the Company’s properties between periods because it does not give effect to real estate depreciation and amortization since these amounts are computed to allocate the cost of a property over its useful life. Since values for well-maintained real estate assets have historically increased or decreased based upon prevailing market conditions, the Company believes that FFO provides investors with a clearer view of the Company’s operating performance.
We calculate FFO in accordance with standards established by Nareit, which may not be comparable to measures calculated by other companies who do not use the Nareit definition of FFO or do not calculate FFO in accordance with Nareit guidance. In addition, although FFO is a useful measure when comparing our results to other REITs, it may not be helpful to investors when comparing us to non-REITs.
Reconciliation of Non-GAAP Financial MeasuresMeasure to GAAP Financial Measures
In order to provide a better understanding of the relationship between the Company’s non-GAAP financial measuresmeasure of FFO, a reconciliation of GAAP net income attributable to BPRBPYU to FFO has been provided. None of theThe Company’s non-GAAP financial measuresmeasure does not represent cash flow from operating activities in accordance with GAAP noneand should not be considered as an alternative to GAAP net income (loss) attributable to BPRBPYU and none areis not necessarily indicative of cash flow. In addition, the Company has presented suchthe financial measuresmeasure on a consolidated and unconsolidated basis (at the Company’s proportionate share) as the Company believes that given the significance of the Company’s operations that are owned through investments accounted for by the equity method of accounting, the detail of the operations of the Company’s unconsolidated properties provides important insights into the income and FFO produced by such investments.
The following table reconciles GAAP net income attributable to BPRBPYU to FFO for the years ended December 31, 20182020 and 2017:2019:
| | | | | | | | | | | |
| | Year Ended December 31, |
| | 2020 | | 2019 |
| Net Income Attributable to BPYU | $ | (711,461) | | | $ | 432,880 | |
| Provision for impairment excluded from FFO - Consolidated Properties | 133,671 | | | 223,287 | |
| Provision for impairment excluded from FFO - Unconsolidated Properties | 65,968 | | | — | |
| Gain from changes in control of investment properties and other | 15,433 | | | (720,706) | |
| Unconsolidated Real Estate Affiliates - gain (loss) on investment | 61,379 | | | (206,790) | |
| Gain on sales of investment properties | (13,402) | | | (14,414) | |
| Preferred stock dividends | (15,938) | | | (15,937) | |
| Above and below market ground rent | 4,383 | | | — | |
| Depreciation and amortization of capitalized real estate costs - Consolidated Properties | 622,435 | | | 482,531 | |
| Depreciation and amortization of capitalized real estate costs - Unconsolidated Properties | 456,073 | | | 531,323 | |
| Allocation of noncontrolling interests (1) | (134,350) | | | (37,961) | |
| FFO | 484,191 | | | 674,213 | |
| | | |
| | | |
| | | |
| | | |
| | | |
| | | |
| | | |
| | | |
| | | |
| | | |
| | | |
| | | |
| | | |
| | | |
| | | |
| | | |
|
| | | | | | | |
| | Year Ended December 31, |
| | 2018 | | 2017 |
| Net Income Attributable to BPR | $ | 4,090,541 |
| | $ | 657,334 |
|
| Redeemable noncontrolling interests | 39,232 |
| | 6,332 |
|
| Provision for impairment excluded from FFO | 45,866 |
| | — |
|
| Noncontrolling interests in depreciation of Consolidated Properties | (37,011 | ) | | (10,283 | ) |
| Unconsolidated Real Estate Affiliates - gain on investment | (3,692 | ) | | (12,000 | ) |
| Loss (gain) on sales of investment properties | (448,174 | ) | | 9,789 |
|
| Preferred stock dividends | (15,936 | ) | | (15,936 | ) |
| Losses (gains) from changes in control of investment properties and other | (3,097,196 | ) | | (79,056 | ) |
| Depreciation and amortization of capitalized real estate costs - Consolidated Properties | 606,204 |
| | 676,307 |
|
| Depreciation and amortization of capitalized real estate costs - Unconsolidated Properties | 389,449 |
| | 298,103 |
|
| FFO | 1,569,283 |
| | 1,530,590 |
|
(1) Noncontrolling interest holders' share of adjustments including depreciation, impairment, gain from changes in control of investment properties and other, Unconsolidated Real Estate Affiliates - gain on investment and gain on sales of investment properties.
Forward-Looking Statements
Certain statements made in this section or elsewhere in this report may be deemed "forward-looking statements" within the meaning of the Private Securities Litigation Reform Act of 1995.1995, Section 27A of the Securities Act of 1933 and Section 21E of the Securities Exchange Act of 1934, as amended. Statements that do not relate to historical or current facts or matters are forward-looking statements. When used, the words “may," "will," "seek," "expects," "anticipates," "believes," "targets," "intends," "should," "estimates," "could," "continue," "assume," "projects," "plans," or similar expressions, are intended to identify forward-looking statements. Although the Company believeswe believe the expectations reflected in any forward-looking statement are based on reasonable assumptions, itwe can give no assurance that itsour expectations will be attained, and it is possible that actual results may differ materially from those indicated by these forward-looking statements due to a variety of risks, uncertainties and other factors. Such factorsAccordingly, investors should use caution in relying on forward-looking statements.
Some of the risks and uncertainties that may cause our actual results, performance, or achievements to differ materially from those expressed or implied by forward-looking statements include, but are not limited to:
•the market price of BPY units and the combined business performance of BPY as a whole;
•general volatility of conditions affecting the retail sector;
•the effects of the COVID-19 pandemic and the possibility of future outbreaks of highly infectious or contagious diseases;
•our inability to acquire and maintain tenants or to lease space on terms favorable to us;
•risks related to the Company's abilitybankruptcy or store closures of national tenants with chains of stores in many of our properties;
•our inability to sell real estate quickly;
•risks related to perceptions by retailers and shoppers of the convenience and attractiveness of our retail properties;
•risks related to the development, expansion and acquisitions of properties;
•risks related to competition in our business;
•risks related to natural disasters, pandemics/epidemics or terrorist attacks;
•risks related to cyber and data security breaches or information technology failures;
•environmental uncertainties and related costs, including costs resulting from uninsured potential losses;
•general risks related to inflation or deflation;
•discontinuation of LIBOR;
•risks relating to impairment charges for our real estate assets;
•risks related to conflicts of interest with BPY and our status as a "controlled company" within the meaning of the rules of Nasdaq;
•our dependence on our subsidiaries for cash;
•risks related to our joint venture partners, including risks related to conflicts of interests, potential bankruptcies, tax-related obligations and financial support relating to such joint venture partners;
•our inability to maintain status as a REIT, and possible adverse changes to tax laws;
•risks related to our indebtedness and debt restrictions and covenants;
•our inability to refinance, extend, restructure or repay near and intermediate term debt, its indebtedness, its abilityindeterminate debt;
•our inability to raise capital through equity issuances,financing activities or asset sales orsales; and
•risks related to the incurrencestructure and trading of new debt, retail and credit market conditions, impairments, its liquidity demands and economic conditions. The Company discussesthe Class A Shares.
We discuss these and other risks and uncertainties in its annualour Annual Report and our quarterly periodic reports filed with the Securities and Exchange Commission. The Company may update that discussion in its periodic reports, but otherwise takes no duty or obligation to update or revise these forward-looking statements, whether as a result of new information, future developments, or otherwise.
ITEM 7A. QUANTITATIVE AND QUALITATIVE DISCLOSURES ABOUT MARKET RISK
We are subject to market risk associated with changes in interest rates both in terms of variable-rate debt and the price of new fixed-rate debt upon maturity of existing debt and for acquisitions. As of December 31, 2018,2020, we had consolidated debt of $12.6$16.1 billion, including $6.5$7.5 billion of variable-rate debt. A 25 basis point movement in the interest rate on the $6.5$7.5 billion of variable-rate debt would result in a $16.3$18.8 million annualized increase or decrease in consolidated interest expense and operating cash flows.
In addition, we are subject to interest rate exposure as a result of variable-rate debt collateralized by the Unconsolidated Properties. Our share (based on our respective equity ownership interests in the Unconsolidated Real Estate Affiliates) of such variable-rate debt was $1.1$0.7 billion at December 31, 2018.2020. A similar 25 basis point annualized movement in the interest rate on the variable-rate debt of the Unconsolidated Real Estate Affiliates would result in a $2.8$1.9 million annualized increase or decrease in our equity in the income (loss) of Unconsolidated Real Estate Affiliates.
In July 2017, the FCA announced it intends to stop compelling banks to submit rates for the calculation of LIBOR after 2021. As a result, the Federal Reserve Board and the Federal Reserve Bank of New York organized the Alternative Reference Rates Committee which identified the SOFR as its preferred alternative to USD-LIBOR. The Company is not able to predict when LIBOR will cease to be published or precisely how SOFR will be calculated and published. Any changes adopted by FCA or other governing bodies in the method used for determining LIBOR may result in a sudden or prolonged increase or decrease in reported LIBOR. If that were to occur, our interest payments could change. In addition, uncertainty about the extent and manner of future changes may result in interest rates and/or payments that are higher or lower than if LIBOR were to remain available in its current form.
The Company has contracts that are indexed to LIBOR and is monitoring and evaluating the related risks, which include interest amounts on our variable rate debt and the swap rate for our interest rate swaps as discussed in Note 6 - Mortgages, Notes and Loans Payable. In the event that LIBOR is discontinued, the interest rates will be based on a fallback reference rate specified in the applicable documentation governing such debt or swaps or as otherwise agreed upon. Such an event would not affect the Company’s ability to borrow or maintain already outstanding borrowings or swaps, but the alternative reference rate could be higher and more volatile than LIBOR.
Certain risks arise in connection with transitioning contracts to an alternative reference rate, including any resulting value transfer that may occur. The value of loans, securities, or derivative instruments tied to LIBOR could also be impacted if LIBOR is limited or discontinued. For some instruments, the method of transitioning to an alternative rate may be challenging, as they may require substantial negotiation with each respective counterparty.
If a contract is not transitioned to an alternative reference rate and LIBOR is discontinued, the impact is likely to vary by contract. If LIBOR is discontinued or if the method of calculating LIBOR changes from its current form, interest rates on our current or future indebtedness may be adversely affected.
While we expect LIBOR to be available in substantially its current form until the end of 2021, it is possible that LIBOR will become unavailable prior to that point. This could result, for example, if sufficient banks decline to make submissions to the LIBOR administrator. In that case, the risks associated with the transition to an alternative reference rate will be accelerated and magnified.
For additional information concerning our debt, and management's estimation process to arrive at a fair value of our debt as required by GAAP, reference is made to Item 7, Management's Discussion and Analysis, Liquidity and Capital Resources and Notes 4 and 6. At December 31, 2018,2020, the fair value of our consolidated debt has been estimated for this purpose to be $72.6$24.8 million higher than the carrying amount of $12.6$16.1 billion.
ITEM 8. FINANCIAL STATEMENTS AND SUPPLEMENTARY DATA
Reference is made to the Consolidated Financial Statements and Consolidated Financial Statement Schedule beginning on page F-1 for the required information.
ITEM 9. CHANGES IN AND DISAGREEMENTS WITH ACCOUNTANTS ON ACCOUNTING AND FINANCIAL DISCLOSURE
None.
ITEM 9A. CONTROLS AND PROCEDURES
Disclosure Controls and Procedures
As of the end of the period covered by this report, we carried out an evaluation, under the supervision and with the participation of our management, including the persons performing the functions of principal executive and principal financial officers for us pursuant to the Master Services Agreement, of the effectiveness of the design and operation of our disclosure controls and procedures (as defined in Rules 13a-15(e) and 15(d)-15(e) under the Securities Exchange Act of 1934, as amended, (the "Exchange Act"))Act). Based on that evaluation, the persons performing the functions of principal executive and principal financial officers for us pursuant to the Master Services Agreement have concluded that our disclosure controls and procedures are effective.were effective as of the end of the period covered by this report.
Management's Report on Internal Control Over Financial Reporting
Our management is responsible for establishing and maintaining adequate internal control over financial reporting. Our internal control over financial reporting is a process designed under the supervision of persons performing the functions of principal executive and principal financial officers for us pursuant to the Master Services Agreement to provide reasonable assurance regarding the reliability of financial reporting and preparation of our financial statements for external reporting purposes in accordance with accounting principles generally accepted in the United States of America.
As of December 31, 2018,2020, we conducted an assessment of the effectiveness of our internal control over financial reporting based on the framework utilizing the criteria set forth by the Committee of Sponsoring Organizations of the Treadway Commission in "Internal Control—Integrated Framework (2013)." Based on this assessment, management believes that, as of December 31, 2018,2020, the Company maintained effective internal controls over financial reporting. Deloitte & Touche LLP, the independent registered public accounting firm who audited our consolidated financial statements contained in this Form 10-K, has issued a report on our internal control over financial reporting, which is included herein.
There were no changes in internal control over financial reporting during the year ended December 31, 2020 that materially affected, or are reasonably likely to materially affect, our internal control over financial reporting. We have not experienced any
material impact to our internal control over financial reporting due to the COVID-19 pandemic. We are continually monitoring and assessing the COVID-19 pandemic on our internal controls to minimize the impact on their design and operating effectiveness.
REPORT OF INDEPENDENT REGISTERED PUBLIC ACCOUNTING FIRM
To the Stockholdersshareholders and the Board of Directors of Brookfield Property REIT Inc.
Opinion on Internal Control over Financial Reporting
We have audited the internal control over financial reporting of Brookfield Property REIT Inc. (formerly known as GGP Inc.) and subsidiaries (the “Company”) as of December 31, 2018,2020, based on criteria established in Internal Control -— Integrated Framework (2013) issued by the Committee of Sponsoring Organizations of the Treadway Commission (COSO). In our opinion, the Company maintained, in all material respects, effective internal control over financial reporting as of December 31, 2018,2020, based on criteria established in Internal Control -— Integrated Framework (2013) issued by COSO.
We have also audited, in accordance with the standards of the Public Company Accounting Oversight Board (United States) (PCAOB), the consolidated financial statements and consolidated financial statement schedule as of and for the year ended December 31, 2018,2020, of the Company and our report dated March 1, 2019,February 26, 2021, expressed an unqualified opinion on those consolidated financial statements and consolidated financial statement schedule.
Basis for Opinion
The Company’s management is responsible for maintaining effective internal control over financial reporting and for its assessment of the effectiveness of internal control over financial reporting, included in the accompanying Management’s Report on Internal Control Over Financial Reporting. Our responsibility is to express an opinion on the Company’s internal control over financial reporting based on our audit. We are a public accounting firm registered with the PCAOB and are required to be independent with respect to the Company in accordance with the U.S. federal securities laws and the applicable rules and regulations of the Securities and Exchange Commission and the PCAOB.
We conducted our audit in accordance with the standards of the PCAOB. Those standards require that we plan and perform the audit to obtain reasonable assurance about whether effective internal control over financial reporting was maintained in all material respects. Our audit included obtaining an understanding of internal control over financial reporting, assessing the risk that a material weakness exists, testing and evaluating the design and operating effectiveness of internal control based on the assessed risk, and performing such other procedures as we considered necessary in the circumstances. We believe that our audit provides a reasonable basis for our opinion.
Definition and Limitations of Internal Control over Financial Reporting
A company’s internal control over financial reporting is a process designed to provide reasonable assurance regarding the reliability of financial reporting and the preparation of financial statements for external purposes in accordance with generally accepted accounting principles. A company’s internal control over financial reporting includes those policies and procedures that (1) pertain to the maintenance of records that, in reasonable detail, accurately and fairly reflect the transactions and dispositions of the assets of the company; (2) provide reasonable assurance that transactions are recorded as necessary to permit preparation of financial statements in accordance with generally accepted accounting principles, and that receipts and expenditures of the company are being made only in accordance with authorizations of management and directors of the company; and (3) provide reasonable assurance regarding prevention or timely detection of unauthorized acquisition, use, or disposition of the company’s assets that could have a material effect on the financial statements.
Because of its inherent limitations, internal control over financial reporting may not prevent or detect misstatements. Also, projections of any evaluation of effectiveness to future periods are subject to the risk that controls may become inadequate because of changes in conditions, or that the degree of compliance with the policies or procedures may deteriorate.
/s/ Deloitte & Touche LLP
Chicago, Illinois
March 1, 2019February 26, 2021
ITEM 9B. OTHER INFORMATION
Not applicable.
PART III
ITEM 10. DIRECTORS, EXECUTIVE OFFICERS AND CORPORATE GOVERNANCE
Information about our Directors
Our current board of directors (“Board”) is as follows:
| | | | | | | | | | | | |
| Name | Age | Position | Director Since | |
| Caroline Atkinson | 68 | Director | 2019 | |
| Jeffrey M. Blidner | 72 | Director | 2018 | |
| Soon Young Chang | 61 | Director | 2018 | |
| | | | |
| Omar Carneiro da Cunha | 74 | Director | 2018 | |
| Stephen DeNardo | 67 | Director | 2018 | |
| Louis J. Maroun | 70 | Director | 2018 | |
| A. Douglas McGregor | 64 | Director | 2020 | |
| Lars Rodert | 59 | Lead Independent Director and Director | 2018 | |
| Michael J. Warren | 53 | Director | 2020 | |
Set forth below is biographical information for our current directors. All of our directors are also directors of the general partner of our parent company, BPY (the "BPY General Partner").
Caroline Atkinson. Ms. Atkinson is a Senior Adviser to Rock Creek investment firm in Washington D.C. and a trustee of the International Institute of Strategic Studies in London. Ms. Atkinson is an Oxford-trained economist with more than two decades of experience working as a senior policymaker in international economics and finance and as an executive in technology. She has held senior positions at Google Inc. (“Google”), the U.S. government, The International Monetary Fund and The Bank of England. Most recently, Ms. Atkinson was the Head of Global Policy for Google. Prior to joining Google, Ms. Atkinson worked for President Barack Obama as the Deputy National Security Adviser for International Economics at the White House. She was the President’s personal representative to major international economic summits, including the G-7/8 and the G-20. She was also the Advisor to Treasury Secretaries, Robert Rubin and Lawrence Summers. She has advised leading U.S. companies on global business and economic issues. Ms. Atkinson is a Member of the Board Executive Committee for the Peterson Institute for International Economics, and a Member of Council on Foreign Relations and the Economic Club of New York. The Board nominated Ms. Atkinson to serve as a director based, among other factors, on her experience in international economics and finance.
Jeffrey M. Blidner. Mr. Blidner is Vice Chairman of Brookfield Asset Management. Mr. Blidner is also Chief Executive Officer of Brookfield’s Private Funds Group, Chairman and a director of Brookfield Business Partners L.P. and Brookfield Renewable Partners L.P. and a director of Brookfield Asset Management and Brookfield Infrastructure Partners L.P. Prior to joining Brookfield in 2000, Mr. Blidner was a senior partner at a Canadian law firm. The Board nominated Mr. Blidner to serve as a director based, among other factors, on his knowledge of the Company and his experience in board governance.
Soon Young Chang. Dr. Chang is a member of the board of directors of Dubai World. Dr. Chang serves as Senior Advisor to the Investment Corporation of Dubai, providing strategic counsel and lending his global perspective to the investment arm of the Dubai Government. Dr. Chang is the founder and chairman of Midas International Asset Management Company, an international asset management fund which manages over $5 billion. He is also a founding partner of Sentinel Advisor, a New York-based arbitrage fund. Dr. Chang has served as an advisor to a variety of financial institutions, including Korea National Pension Corporation, Hyundai International Merchant Bank and Templeton-Ssangyong Investment Trust Company. Dr. Chang received his Master’s and Doctoral degrees from the George Washington University in the United States and has authored many books and articles on the subject of financial engineering. The Board nominated Dr. Chang to serve as a director based, among other factors, on his knowledge of the Company and his experience in asset management and international finance.
Omar Carneiro da Cunha. Mr. Cunha is a Senior Partner with Dealmaker Ltd., a consultancy and M&A advisory firm, with a focus in telecommunications, information technology, oil & gas and retail, and has also been a Senior Partner of BOND Consultoria Empresarial e Participacoes since 1994. He is also a director of Petroleo Brasileiro S/A (Petrobras), Chairman of the Audit Committee and member of the Investment Committee since 2020. He was the Chairman of “Bob’s”, a Brazilian fast-food company, from 1995 to 2008, a director of the Energisa Group since 1996, and a director of Grupo Libra from 2010 to 2019. In 2005, Mr. Cunha was the Deputy Chairman and Chief Executive Officer of VARIG Brazilian Airline. From 1995 to
1998, Mr. Cunha was the President of AT&T Brasil and a member of the Management Committee of AT&T International. Prior to that, Mr. Cunha worked for 27 years in Brazil and abroad for the Royal Dutch/Shell Group, and was President of Shell Brasil, Billiton Metals and Shell Quimica from 1991 to 1994. Mr. Cunha is currently a member of the board of the American Chamber of Commerce for Brazil. The Board nominated Mr. Cunha to serve as a director based, among other factors, on his knowledge of the Company and his experience in board governance in the telecommunications, technology, energy and retail sectors.
Stephen DeNardo. Mr. DeNardo is currently managing director and president and Chief Executive Officer of RiverOak Investment Corp., LLC and has held this position since 1999. From 1997 to 1999 he was Partner and Senior Vice President of ING Realty Partners, where he managed a $1 billion portfolio. Prior to his employment with ING Realty Partners, he was President of ARES Realty Capital from 1991 to 1997, where he managed a $5 billion portfolio of diversified debt and equity assets. Before joining ARES Realty Capital, he was a Partner at First Winthrop Corporation. Mr. DeNardo has held a license as a Certified Public Accountant since 1978 and is a Chartered Global Management Accountant. He also has a B.S. in Accounting from Fairleigh Dickinson University. The Board nominated Mr. DeNardo to serve as a director based, among other factors, on his knowledge of the Company, his financial acumen and his experience in commercial real estate and asset management.
Louis Joseph Maroun. Mr. Maroun is the Founder and Chairman of Sigma Real Estate Advisors and Sigma Capital Corporation, which specializes in international real estate advisory services. Prior to this role, Mr. Maroun was the Executive Chairman of ING Real Estate Canada and held executive positions in a number of real estate companies where he was responsible for overseeing operations, real estate transactions, asset and property management, as well as many other related functions. Mr. Maroun also is on the board of directors of Brookfield Renewable Energy Partners L.P., and Summit Industrial Income REIT. Mr. Maroun graduated from the University of New Brunswick in 1972 with a Bachelor’s degree, followed by a series of post graduate studies and in January of 2007, after a long and successful career in investment real estate, Mr. Maroun was elected to the position of Fellow of the Royal Institute of Chartered Surveyors. The Board nominated Mr. Maroun to serve as a director based, among other factors, on his knowledge of the Company and his experience in commercial real estate and board governance.
A. Douglas McGregor. Mr. McGregor was the Group Head of RBC Capital Markets and RBC Investor & Treasury Services, Chairman and Chief Executive Officer of RBC Capital Markets, and was a member of RBC’s Group Executive until his retirement in January 2020. He is also a director of the BPY General Partner. Mr. McGregor joined RBC in 1983 and held progressively senior roles at the bank, becoming Capital Markets Chief Executive Officer in 2008 and assuming responsibility for Investor & Treasury Services in 2012. As Chairman and Chief Executive Officer of RBC Capital Markets, Mr. McGregor had global oversight of the firm’s Corporate & Investment Banking and Global Markets activities conducted by its approximately 7,500 employees worldwide. He also directly led the investment bank’s real estate lending businesses. As Group Head of RBC Investor & Treasury Services, Mr. McGregor was responsible for this business’ custody, treasury and financing services for institutional clients globally. Mr. McGregor is also Chairman and member of the Audit Committee of Plaza Retail REIT. Mr. McGregor holds an Honours B.A. (Business) and an MBA from the University of Western Ontario. Mr. McGregor serves on the University Health Network’s Board of Trustees in Toronto and is a former Chairman of the Board of Directors of the Investment Industry Regulatory Organization of Canada. The Board nominated Mr. McGregor to serve as a director based, among other factors, on his experience in commercial real estate, asset management and international finance.
Lars Rodert. Mr. Rodert is the founder and Chief Executive Officer of ÖstVäst Advisory (“OVA”). Mr. Rodert has 30 years of experience in the global investment industry. Prior to OVA, Mr. Rodert spent 11 years as a Global Investment Manager for IKEA Treasury. Before joining IKEA, Mr. Rodert was with SEB Asset Management for 10 years as Chief Investment Officer and responsible for SEB Global Funds. Prior to SEB, Mr. Rodert spent 10 years in North America with five years at Investment Bank Gordon Capital and five years as a partner with a private investment holding company, Robur et. Securitas. Mr. Rodert is a director of PCCW Limited, an information and communications technology company. Mr. Rodert holds a Master of Science Degree in Business and Economics from Stockholm University. The Board nominated Mr. Rodert to serve as a director based, among other factors, on his knowledge of the Company and his experience in commercial real estate and board governance.
Michael J. Warren. Mr. Warren is the Managing Director of Albright Stonebridge Group (“ASG”). Mr. Warren served as ASG’s Managing Principal from 2013 to 2017 and as Principal from 2009 to 2013. Prior to ASG, Mr. Warren served as the Chief Operating Officer and Chief Financial Officer of Stonebridge International from 2004 to 2009, where he managed operations, business development, finance, and personnel portfolios. Mr. Warren served in various capacities in the Obama Administration, including as senior advisor in the White House Presidential Personnel Office and as co-lead for the Treasury and Federal Reserve agency review teams of the Obama-Biden Presidential Transition. Mr. Warren serves on the board of trustees and the risk & audit committees at Commonfund, the board of directors of Walker & Dunlop, Inc. and the board of directors of MAXIMUS. He serves as a trustee of Yale University and is a member of the Yale Corporation Investment Committee. Mr. Warren formerly served as a trustee of the District of Columbia Retirement Board and as a member of the board of directors of the United States Overseas Private Investment Corporation. Mr. Warren received degrees from Yale
University and Oxford University where he was a Rhodes Scholar. The Board nominated Mr. Warren to serve as a director based, among other factors, on his experience in business development and finance.
Information about our Executive Officers
Our service providers ("Service Providers"), wholly owned subsidiaries of Brookfield Asset Management, provide management services to us pursuant to our Master Services Agreement. Brian W. Kingston and Bryan K. Davis in their roles at the Service Providers perform similar functions for BPYU as would typically be performed by a principal executive officer and principal financial officer, respectively. These individuals are as follows:
| | | | | | | | | | | | |
| Name | Age | Position with One of the Service Providers | Since | |
| Brian W. Kingston | 47 | Chief Executive Officer | 2015 | |
| Bryan K. Davis | 47 | Chief Financial Officer | 2015 | |
| | | | |
| | | | |
| | | | |
| | | | |
| | | | |
| | | | |
| | | | |
Brian W. Kingston. Mr. Kingston was named Chief Executive Officer in 2015. He is also a Managing Partner at Brookfield Asset Management and Chief Executive Officer of Brookfield Property Group. Mr. Kingston joined Brookfield in 2001 and has been engaged in a wide range of merger and acquisition activities. From 2008 to 2013 he led Brookfield’s Australian business activities, holding the positions of Chief Executive Officer of Brookfield Office Properties Australia, Chief Executive Officer of Prime Infrastructure and Chief Financial Officer of Multiplex.
Bryan K. Davis. Mr. Davis was named Chief Financial Officer in 2015. He is also a Managing Partner at Brookfield Asset Management. Prior to that, he was Chief Financial Officer of Brookfield’s global office property company for eight years and spent five years in senior finance roles. Mr. Davis also held various senior finance positions including Chief Financial Officer of Trilon Financial Corporation, Brookfield Asset Management’s financial services subsidiary. Prior to joining Brookfield Asset Management in 1999, Mr. Davis was involved in providing restructuring and advisory services at Deloitte & Touche LLP. He is a Chartered Accountant and holds a Bachelor of Commerce degree from Queen’s University.
Corporate Governance
Code of Business Conduct and Ethics
The Board has adopted the Code of Business Conduct and Ethics (“Code of Conduct”) of Brookfield Asset Management, which is applicable to all directors, officers, employees and temporary workers of Brookfield Asset Management, its wholly owned subsidiaries and certain publicly traded controlled affiliates who have not adopted their own Code of Conduct, including the Company. Our Code of Conduct is available on our website at bpy.brookfield.com/bpyu under the “Corporate Governance—Governance Documents” heading. In addition, a copy may be obtained by writing to our Secretary at our principal executive offices. We intend to satisfy the disclosure requirement regarding any amendment to, or a waiver of, a provision of the Code of Conduct by posting such information requiredon the Company’s website.
Changes to Nomination Procedures for this ItemUse by Security Holders
There were no material changes to the procedures by which stockholders may recommend nominees to the Board during the fiscal year ended December 31, 2020.
Board Committees
Audit Committee
The Board has a standing Audit Committee, established in accordance with the requirements of the SEC. The members of the Audit Committee are Stephen DeNardo (Chairman), Louis J. Maroun and Lars Rodert. The Board has affirmatively determined that all of the members of the Audit Committee meet the requirements for independence and expertise, including financial literacy for the purposes of serving on the Audit Committee, under applicable Nasdaq Stock Market (“Nasdaq”) listing standards and SEC rules. The Board has also determined that Mr. DeNardo qualifies as an “audit committee financial expert” under applicable SEC rules.
The Audit Committee is incorporated by reference fromresponsible for assisting and advising the Board with respect to: our definitive Proxy Statement to be filed in connectionaccounting and financial reporting processes; the integrity and audits of our financial statements; our compliance with legal and regulatory requirements; and the qualifications, performance and independence of our independent accountants. The Audit Committee is responsible for engaging our independent auditors, reviewing the plans and results of each audit engagement with our 2019 Annual Meetingindependent auditors,
approving professional services provided by our independent accountants, considering the range of Stockholders.audit and non-audit fees charged by our independent auditors and reviewing the adequacy of our internal accounting controls.
Delinquent Section 16 Reports Section 16(a) of the Exchange Act requires our directors, executive officers and holders of more than 10% of a registered class of our equity securities to file reports with the SEC regarding their ownership and changes in ownership of such registered equity securities. Based on our review of the copies of all Section 16(a) forms received by us and other information, we believe that with regard to the fiscal year ended December 31, 2020, all of our executive officers, directors and greater than 10% stockholders complied with all applicable filing requirements.
ITEM 11. EXECUTIVE COMPENSATION
Compensation Discussion and Analysis
The Company does not directly employ any of the persons responsible for managing its business. Under our Master Services Agreement, our Service Providers provide, or arrange for other service providers to provide, day-to-day management and administrative services for our Company. Please see “Certain Relationships and Related Transactions, and Director Independence —Related Party Transactions—Master Services Agreement” below for further detail on our Master Services Agreement.
Messrs. Kingston and Davis in their roles at the Service Providers perform similar functions for BPYU as would typically be performed by a principal executive officer and principal financial officer, respectively. BPYU does not directly or indirectly compensate Messrs. Kingston and Davis or grant them any equity awards. BPYU does not reimburse the Service Providers for their compensation. The compensation of Messrs. Kingston and Davis is set by the Service Providers and we have no control over the determination of their compensation. Messrs. Kingston and Davis participate in employee benefit plans and arrangements sponsored by the Service Providers. We have not established any employee benefit plans or entered into any employment agreements with them.
Compensation of Directors
Directors receive an annual retainer of $15,000 for their service on the Board and reimbursement of expenses incurred in attending meetings. Directors also receive an annual retainer of $125,000 for serving on the board of directors and various committees of the BPY General Partner. The BPY General Partner pays the chair of its audit committee an additional $20,000 per year and pays the other members of its audit committee an additional $10,000 per year for serving in such positions. The BPY General Partner also pays its Chairman an additional $50,000 per year and its lead independent director an additional $10,000 per year. Directors who are not independent due to their employment with Brookfield Asset Management receive no fees for their services on the Board. The Governance and Nominating Committee periodically reviews Board compensation in relation to its peers and other similarly sized companies and is responsible for approving changes in compensation for non‑employee directors.
2020 Director Compensation
The information requiredfollowing table sets forth the compensation earned by or paid to each of our non-employee directors in 2020. Mr. Warren was appointed to the Board in November 2020 and did not receive any compensation during 2020.
| | | | | | | | | | | | | | |
| Name | Fees Earned or Paid in Cash ($) | Stock Awards ($) (1) | All Other Compensation ($) | Total ($) |
| Richard B. Clark | $ | — | | $ | — | | $ | — | | $ | — | |
| Caroline M. Atkinson | 15,000 | | — | | — | | 15,000 | |
| Jeffrey M. Blidner | — | | — | | — | | — | |
| Soon Young Chang | 15,000 | | — | | — | | 15,000 | |
| Omar Carneiro da Cunha | 15,000 | | — | | — | | 15,000 | |
| Scott R. Cutler | 15,000 | | — | | — | | 15,000 | |
| Stephen DeNardo | 15,000 | | — | | — | | 15,000 | |
| Louis J. Maroun | 15,000 | | — | | — | | 15,000 | |
| Lars Rodert | 15,000 | | — | | — | | 15,000 | |
| Michael J. Warren | — | | — | | — | | — | |
1.None of the directors held BPYU stock options or unvested stock awards as of December 31, 2020.
Compensation Committee Interlocks and Insider Participation
While certain of our subsidiaries have employees, BPYU does not have any employees. Under our Master Services Agreement, our Service Providers provide, or arrange for this Item is incorporated by reference fromother service providers to provide, day-to-day management and administrative services for our definitive Proxy Statement to be filedCompany. As a result, we do not directly pay employee or management compensation and do not require a compensation committee. Our directors participate in connection with our 2019 Annual Meetingthe consideration of Stockholders.director compensation.
ITEM 12. SECURITY OWNERSHIP OF CERTAIN BENEFICIAL OWNERS AND MANAGEMENT AND RELATED STOCKHOLDER MATTERS
The following table sets forth information required forregarding beneficial ownership of each class of our capital stock by certain persons as of December 31, 2020. In the case of persons other than Messrs. Kingston and Davis, our directors and Brookfield Asset Management, or where we have received additional information from the beneficial owner, the information presented in this Itemtable is incorporated by reference from our definitive Proxy Statementbased upon the most recent filings with the SEC.
The table lists the applicable percentage ownership based on 39,127,335 shares of Class A Stock, 202,438,184shares of Series B Preferred Stock, 196,886,256 shares of Class B‑1 Stock, 121,203,654 shares of Class B-2 stock, par value $0.01 per share (“Class B-2 Stock”), 640,051,301shares of Class C Stock and 10,000,000 shares of 6.375% Series A Cumulative Perpetual Redeemable Preferred Stock, par value $0.01 per share (“Series A Preferred Stock”) outstanding as of December 31, 2020.
The table below sets forth such estimated beneficial ownership for: each stockholder that is known to us to be a beneficial owner of more than 5% of the Company’s outstanding shares of each class of our capital stock (“Principal Stockholders”); each director; Messrs. Kingston and Davis; and all directors and Messrs. Kingston and Davis as a group.
| | | | | | | | | | | | | | | | | | | | | | | | | | | | | | | | | | | | | | |
| Class A Stock | Series B Preferred Stock | Class B-1 Stock | Class B-2 Stock | Class C Stock | Class A Preferred Stock |
| Name of Beneficial Owner | # Shares Beneficially Owned | % of Class | # Shares Beneficially Owned | % of Class | # Shares Beneficially Owned | % of Class | # Shares Beneficially Owned | % of Class | # Shares Beneficially Owned | % of Class | # Shares Beneficially Owned | % of Class |
| Principal Stockholders | | | | | | | | | | | | |
| Blackrock, Inc. (1) | 4,193,676 | | 11 | % | — | | — | | — | | — | | — | | — | | — | | — | | — | | — | |
| BPY | 3,036,315 | | 8 | % | 202,438,184 | | 100 | % | 196,886,256 | 100 | % | 121,203,654 | 100 | % | 640,051,301 | 100 | % | — | | — | |
| Persons and entities associated with Farallon Capital Management LLC (2) | 8,054,215 | | 21 | % | — | | — | | — | | — | | — | | — | | — | | — | | — | | — | |
| The Vanguard Group (3) | 2,790,454 | | 7 | % | — | | — | | — | | — | | — | | — | | — | | — | | — | | — | |
| Brookfield Asset Management (4) | 3,036,315 | | 8 | % | — | | — | | — | | — | | — | | — | | — | | — | | — | | — | |
| Global X Management Company LLC ("GXMC") (5) | 2,524,254 | | 6 | % | | | | | | | | | | |
| Named Executive Officers (6): | | | | | | | | | | | | |
| Brian W. Kingston | 235,000 | | 1 | % | — | | — | | — | | — | | — | | — | | — | | — | | — | | — | |
| Bryan K. Davis | 100,000 | | — | % | — | | — | | — | | — | | — | | — | | — | | — | | — | | — | |
| Directors (6): | — | | — | % | — | | — | | — | | — | | — | | — | | — | | — | | — | | — | |
| Caroline M. Atkinson | — | | — | % | — | | — | | — | | — | | — | | — | | — | | — | | — | | — | |
| Jeffrey M. Blidner | — | | — | % | — | | — | | — | | — | | — | | — | | — | | — | | — | | — | |
| Soon Young Chang | — | | — | % | — | | — | | — | | — | | — | | — | | — | | — | | — | | — | |
| Omar Carneiro da Cunha | — | | — | % | — | | — | | — | | — | | — | | — | | — | | — | | — | | — | |
| Stephen DeNardo | — | | — | % | — | | — | | — | | — | | — | | — | | — | | — | | — | | — | |
| Louis J. Maroun | — | | — | % | — | | — | | — | | — | | — | | — | | — | | — | | — | | — | |
| A. Douglas McGregor | — | | — | % | — | | — | | — | | — | | — | | — | | — | | — | | — | | — | |
| Lars Rodert | — | | — | % | — | | — | | — | | — | | — | | — | | — | | — | | — | | — | |
| Michael J. Warren | — | | — | % | — | | — | | — | | — | | — | | — | | — | | — | | — | | — | |
| All directors and executive officers as a group (11 persons) | 335,000 | | 1 | % | | | | | | | | | | |
| | | | | | | | | | | | |
•Represents beneficial ownership of less than 1%.
1.Information regarding BlackRock, Inc. (“BlackRock”) is based solely on a Schedule 13G/A filed in connectionby BlackRock with our 2019 Annual Meetingthe SEC on July 10, 2019. BlackRock’s address is 55 East 52nd Street, New York, NY 10055. The Schedule 13G/A indicates that BlackRock has sole voting power with respect to 3,827,792 shares of Stockholders.Class A Stock and sole dispositive power with respect to 4,193,676 shares of Class A Stock.
2.Information regarding Farallon Capital Management, LLC (“Farallon”) is based solely on a Schedule 13G filed by Farallon with the SEC on September 7, 2018 on behalf of Farallon and the following associated persons and entities: Farallon Capital Partners, L.P., Farallon Capital Institutional Partners, L.P., Farallon Capital Institutional Partners II, L.P., Farallon Capital Institutional Partners III, L.P., Four Crossings Institutional Partners V, L.P. and Farallon Capital (AM) Investors L.P., Farallon Partners, L.L.C., Farallon Institutional (GP) V, L.L.C., Philip D. Dreyfuss, Michael B. Fisch, Richard B. Fried, David T. Kim, Monica R. Landry, Michael G. Linn, Rajiv A. Patel, Thomas G. Roberts, Jr., William Seybold, Andrew J. M. Spokes, John R. Warren and Mark C. Wehrly (collectively, the “Farallon Reporting Persons”). The address of the Farallon Reporting Persons is c/o Farallon Capital Management, L.L.C., One Maritime Plaza, Suite 2100, San Francisco, CA 94111. The Schedule 13G indicates that, collectively, the Farallon Reporting Persons have shared voting and dispositive power over 8,054,215 shares of Class A Stock.
3.Information regarding The Vanguard Group (“Vanguard”) is based solely on a Schedule 13G/A filed by Vanguard with the SEC on February 8, 2021. Vanguard’s address is 100 Vanguard Blvd., Malvern, PA 19355. The Schedule 13G/A indicates that Vanguard has sole voting power with respect to 0 shares of Class A Stock, shared voting power with respect to 105,875 shares of Class A Stock, sole dispositive power with respect to 2,620,059 shares of Class A Stock and shared dispositive power with respect to 170,395 shares of Class A Stock.
4.Information regarding Brookfield Asset Management is based on a Schedule 13G filed by Brookfield Asset Management with the SEC on February 8, 2021 on behalf of Brookfield Asset Management and the following associated entities: BUSC Finance LLC (“BUSC Finance”), Brookfield US Inc. (“BUSI”), Brookfield US Holdings Inc. (“BUSHI”), Brookfield Holdings Canada Inc. (“BHC”), Brookfield Property Master Holdings LLC (“BPMH”) and Brookfield Property Group LLC (“BPG” and collectively, the “BAM Group”). The address for Brookfield Asset Management, BUSHI and BHC is Brookfield Place, 181 Bay Street, Suite 300, Toronto, ON M5J 2T3 Canada and the address for BPG, BUSC Finance, BUSI and BPMH is Brookfield Place, 250 Vesey Street, 15th Floor, New York, NY 10281. The Schedule 13G indicates that the BAM Group has shared voting and shared dispositive power with respect to 3,036,315 shares of Class A Stock.
5.Information regarding GXMC is based on a Schedule 13G filed by GXMC with the SEC on February 12, 2021. The address for GXMC is 605 Third Avenue, 43rd Floor, New York, NY 10158. The Schedule 13G indicates that GXMC has sole voting power and sole dispositive power with respect to 2,524,254 shares of Class A Stock.
6.Unless otherwise noted, the address of (i) Mr. Blidner is c/o Brookfield Asset Management, 181 Bay Street, Suite 300, Toronto, Ontario M5J 2T3; (ii) Ms. Atkinson and Messrs. Carneiro da Cunha, Chang, DeNardo, Maroun, McGregor, Rodert and Warren, is c/o Brookfield Property Partners Limited, 73 Front Street, 5th Floor, Hamilton, HM 12 Bermuda; and (iii) Messrs. Kingston and Davis is c/o Brookfield Property Group, Brookfield Place, 250 Vesey Street, 15th Floor, New York, NY 10281.
ITEM 13. CERTAIN RELATIONSHIPS AND RELATED TRANSACTIONS, AND DIRECTOR INDEPENDENCE
Conflicts Policy
Our Governance and Nominating Committee has approved a Conflicts Policy designed to assist with the proper identification, review and disclosure of related party transactions. The information requiredConflicts Policy addresses the approval and other requirements for this Itemtransactions in which there is incorporatedgreater potential for a conflict of interest to arise. These transactions include:
•acquisitions by referenceus from, and dispositions by us to, Brookfield Asset Management and its affiliates;
•the dissolution of the Company or its operating partnership;
•any material amendment to our definitive Proxy StatementMaster Services Agreement;
•any material service agreement or other material arrangement pursuant to which Brookfield Asset Management or its affiliates will be paid a fee, or other consideration other than any agreement or arrangement contemplated by our Master Services Agreement;
•termination of, or any determinations regarding indemnification under, our Master Services Agreement; and
•any other material transaction involving us and Brookfield Asset Management and its affiliates.
Our Conflicts Policy requires the transactions described above to be filedapproved by our Governance and Nominating Committee. Pursuant to our Conflicts Policy, the Governance and Nominating Committee may grant approvals for any of the transactions described above in the form of general guidelines, policies or procedures in which case no further special approval will be required in connection with a particular transaction or matter permitted thereby. The Conflicts Policy can be amended at the discretion of the Governance and Nominating Committee.
Related Party Transactions
Master Services Agreement
We have entered into a Master Services Agreement pursuant to which the Service Providers, wholly owned subsidiaries of Brookfield Asset Management, have agreed to provide or arrange for other Service Providers to provide management and administration services to our 2019 Annual MeetingCompany and its subsidiaries. The following is a summary of Stockholders.certain provisions of our Master Services Agreement. Because this description is only a summary of our Master Services Agreement, it does not necessarily contain all of the information that you may find useful. We therefore urge you to review our Master Services Agreement in its entirety. Our Master Services Agreement is available electronically on the website of the SEC at www.sec.gov and a copy may be obtained by writing to our Secretary at our principal executive offices.
Under our Master Services Agreement, we have appointed the Service Providers to provide or arrange for the provision of the following services: •supervising the carrying out of all day-to-day management, secretarial, accounting, banking, treasury, administrative, liaison, representative, regulatory and reporting functions and obligations;
•providing overall strategic advice, including advising with respect to the expansion into new markets;
•supervising the establishment and maintenance of books and records;
•identifying and recommending acquisitions or dispositions from time to time and, where requested to do so, assisting in negotiating the terms of such acquisitions or dispositions;
•recommending and, where requested to do so, assisting in the raising of funds whether by way of debt, equity or otherwise;
•recommending suitable candidates to serve on the boards of directors or the equivalent governing bodies of us and our operating entities;
•making recommendations with respect to the exercise of any voting rights to which we are entitled in respect of our operating entities;
• making recommendations with respect to the payment of dividends or any other distributions, including distributions by our Company to our unitholders;
•monitoring and/or oversight of accountants, legal counsel and other accounting, financial or legal advisors and technical, commercial, marketing and other independent experts, and managing litigation;
•attending to all matters necessary for any reorganization, bankruptcy proceedings, dissolution or winding up, subject to approval by the relevant board of directors or its equivalent;
•supervising the making of all tax elections, determinations and designations, the timely calculation and payment of taxes payable and the filing of all tax returns;
•supervising the preparation of the annual consolidated financial statements, quarterly interim financial statements and other public disclosure;
•making recommendations in relation to and effecting the entry into insurance arrangements;
•arranging for individuals to carry out the functions of principal executive, accounting and financial officers for our Company only for purposes of applicable securities laws;
•providing individuals to act as senior officers, subject to the approval of the relevant board of directors or its equivalent;
•providing advice, when requested, regarding the maintenance of compliance with applicable laws and other obligations; and
•providing all such other services as may from time to time be agreed that are reasonably related to day-to-day operations.
The Service Providers’ activities are subject to the supervision of the board of directors or equivalent governing body of BPYU and of each of the other Service Recipients, as applicable. The relevant governing body remains responsible for all investment and divestment decisions made by the Service Recipient.
Pursuant to the Master Services Agreement, BPYU pays an annual base management fee to the Service Providers equal to 1.25% of the total capitalization of BPYU, subject to certain adjustments. The total capitalization value of BPYU is equal to the aggregate of the value of all of the outstanding Class A Stock and other securities of BPYU and its direct or indirect subsidiaries that are not held by BPYU, BPY and certain of their affiliates, plus all outstanding third-party debt with recourse against BPYU and any other direct or indirect subsidiary, less all cash held by such entities. For the first 12 months following the closing of the BPY Transaction, Brookfield Asset Management agreed to waive management fees payable by BPYU and the incremental management fees BPY would otherwise be required to pay in respect of the securities issued in exchange for the GGP common stock in the BPY Transaction. For the year ended December 31, 2020, there were no fees paid under the Master Services Agreement.
For any quarter in which the Board determines that there is insufficient available cash to pay the base management fee as well as the next regular distribution on Class A Stock, BPYU may elect to pay all or a portion of the base management fee in Class A Stock, subject to certain conditions. The base management fee is calculated and paid on a quarterly basis.
To the extent that under any other arrangement BPYU or its subsidiaries makes a payment that is determined to be comparable to the base management fee payable by BPYU, the base management fee payable by BPYU will be reduced on a dollar-for-dollar basis by the comparable base management fee, subject to certain limitations. In addition, to the extent that there are any residual fees, comparable to the base management fees payable by BPYU, that are not used to reduce the base management fees payable by BPY, the base management fee payable by BPYU will be reduced on a dollar-for-dollar basis by such residual fees.
Additionally, the Service Providers are reimbursed for any out-of-pocket fees, costs and expenses incurred in the provision of the management and administration services, including those of any third party. However, BPYU is not required to reimburse the Service Providers for the salaries and other remuneration of their management, personnel or support staff who carry out any services or functions for BPYU or overhead for such persons.
Incentive Distributions
An affiliate of Brookfield Asset Management is entitled to receive incentive distributions based on an amount by which quarterly distributions on the Class A Stock and series K preferred units of BPYU’s operating partnership exceed specified target levels. Noincentive distributions were paid in the year ended December 31, 2020.
Financings
From time to time, Brookfield may loan funds to us or place funds on deposit with us, on terms approved by our Governance and Nominating Committee. The following arrangements were entered into during the year ended December 31, 2020:
•On February 10, 2020, the Company secured an $27.0 million subordinated unsecured note with Brookfield BPY Holdings Inc, and another $29.0 million note on March 25, 2020. The notes bear interest at rate equal to LIBOR plus 2.75%, and mature on February 10, 2030 and March 25, 2030, respectively.
•On May 19, 2020, the Company secured an additional $25.0 million subordinated unsecured note with Brookfield BPY Holdings Inc., and another $45.0 million on May 22, 2020. The notes were repaid in full on June 18, 2020 and July 16, 2020, respectively.
•On June 25, 2020, the Company secured another $25.0 million subordinated unsecured note at an interest rate equal to LIBOR plus 1.94% that is scheduled to mature on August 27, 2022.
•On July 16, 2020 and August 27, 2020, the Company made principal payments in the amount of $45.0 million and $22.1 million, respectively. The total outstanding balance of the notes as of December 31, 2020 was $63.2 million.
•The Company agreed to maintain an ongoing liquidity covenant (set at $500 million) which will be tested as of the last day of each month against the amount of unrestricted cash, undrawn available amounts under the Facility and undrawn amounts under the new Brookfield Liquidity Facility. The Company entered into and maintains a $500 million Brookfield Liquidity Facility and prior to the date the Company demonstrates compliance with the financial covenants in effect under the Credit Agreement prior to the First Amendment, any interest and principal payments thereunder must be paid-in-kind.
Other Services
Brookfield Asset Management and its affiliates may provide services to our subsidiaries which are outside the scope of our Master Services Agreement under arrangements that are on market terms and conditions, or otherwise permitted or approved by independent directors, pursuant to our Conflicts Policy, and pursuant to which Brookfield Asset Management will receive fees. The services that may be provided under these arrangements include financial advisory, property management, facilities management, development, relocation services, construction activities, marketing or other services. We may also provide similar services to Brookfield Asset Management and its affiliates that are on market terms and conditions, or otherwise permitted or approved by independent directors, pursuant to our Conflicts Policy, and pursuant to which we will receive fees. We paid or received the following fees for such services in the year ended December 31, 2020:
•Amounts received from Brookfield Asset Management and its subsidiaries for property management, leasing, tenant coordination, construction management, development management and marketing services – $22.8 million; and
•Amounts paid to Brookfield Asset Management and its subsidiaries for construction costs of development properties –$2.3 million.
Other Related Party Transactions
In connection with the BPY Transaction, Brookfield Asset Management entered into a rights agreement with Wilmington Trust Company whereby it agreed to satisfy, or cause to be satisfied, the obligations with respect to the secondary exchange rights contained in the Company’s Charter and deposit certain cash or securities in a collateral account in accordance with the agreement. In this agreement, Brookfield Asset Management was granted a consent right whereby prior to the issuance by BPYU of any shares of Class A Stock, BPYU will be required, for as long as Brookfield Asset Management is a party to the rights agreement, to obtain the consent of Brookfield Asset Management. The rights agreement will terminate on the earlier of the twentieth anniversary of the BPY Transaction or if there is no Class A Stock outstanding, other than Class A Stock owned by Brookfield Asset Management and its affiliates. Our Company is required to reimburse Brookfield Asset Management for all amounts paid to the rights agent (i) pursuant to the rights agreement including, in respect of services rendered, out-of-pocket expenses, counsel fees and other disbursements incurred in the administration and execution of the agreement and the exercise and performance of the rights agent’s duties thereunder, and (ii) in respect of any indemnification provided to the rights agent pursuant to the rights agreement.
BPYU, BPY, the BPY General Partner and BP US REIT LLC (“BPUS”), entered into a joint governance agreement, dated August 28, 2018 (the “Joint Governance Agreement”), intended to facilitate the governance of BPYU and BPY following the acquisition of all of the shares of common stock of GGP that BPY and its affiliates did not already own through a series of transactions (the “BPY Transaction”). Pursuant to the Joint Governance Agreement, BPUS has the right to designate candidates to be nominated for election to each directorship subject to election at any meeting of BPYU stockholders and BPYU will
include such nominees in its proxy statements without BPUS having to comply with the generally applicable provisions of the Company’s Bylaws regarding notice of stockholder nominations. The Joint Governance Agreement further provides that BPYU and the BPY General Partner will nominate an identical board of directors, except in limited circumstances. The nominees for the Board included in this Proxy Statement are also members of the board of directors of the BPY General Partner. Additionally, each of the BPY General Partner and BPYU have the right to expand its respective board of directors to add additional non overlapping independent members if it determines that the addition of non-overlapping board members is necessary to address or otherwise resolve a conflict of interest arising from its relationship with the other entity. Further, BPUS has the option, in its sole discretion, to cause each of the BPY General Partner and BPYU to expand the size of their respective boards, and to nominate one or more additional independent directors to fill the directorship created by such expansion.
Director Independence
A majority of the Board is independent. Of the ten directors currently serving on the Board, the Board affirmatively determined, based on the recommendation of the Governance and Nominating Committee, that Ms. Atkinson and Messrs. Carneiro da Cunha, DeNardo, Maroun, McGregor, Rodert and Warren are independent under the Nasdaq listing standards.
The Board reviewed director independence in February 2021. During this review, the Board considered transactions and relationships between each director nominee (including any member of his or her immediate family, if any) and the Company and its subsidiaries and affiliates. In making independence determinations, the Board considered each relationship not only from the standpoint of the director nominee, but also from the standpoint of persons and organizations with which the director nominee has a relationship. The purpose of this review is to determine whether any such relationship or transactions would interfere with the director’s or nominee’s independent judgment, and therefore be inconsistent with a determination that the director nominee is independent.
When assessing the independence of the directors designated by the BPY General Partner pursuant to the Joint Governance Agreement, the Board considered that they were nominated by significant stockholders of the Company but concluded that this did not impair their independence. As required by the Nasdaq listing standards, the Board considered whether the nominated directors themselves had a relationship with BPYU that would interfere with the director’s independent judgment in carrying out their duties as a director.
As a result of this review, the Board affirmatively determined that each of the current Board members, except Dr. Chang and Messrs. Clark and Blidner, is independent of the Company and its management under Nasdaq listing standards. Dr. Chang is not independent because he was appointed to the board of directors of the BPY General Partner as the representative of a large shareholder of BPY and Messrs. Clark and Blidner are not independent due to their employment with Brookfield Asset Management.
ITEM 14. PRINCIPAL ACCOUNTANT FEES AND SERVICES
The information requiredfollowing table summarizes the aggregate fees billed to BPYU for this Itemprofessional services rendered by its independent registered public accounting firm, Deloitte & Touche LLP (“Deloitte”):
| | | | | | | | | | | | | | |
| Year Ended December 31, | | 2020 | | 2019 |
Audit Fees(1) | | $ | 3,007,000 | | | $ | 3,155,600 | |
Audit Related Fees(2) | | 2,525,225 | | | 3,000,378 | |
Tax Fees(3) | | 33,740 | | | 32,130 | |
| All Other Fees | | — | | | — | |
| Total | | $ | 5,565,965 | | | $ | 6,188,108 | |
| | | | |
| | | | |
| | | | |
| | | | |
1.Audit fees consisted principally of the audits of the Company’s annual consolidated financial statements, internal
control over financial reporting, reviews of the consolidated financial statements included in the Company’s Quarterly
Reports on Form 10‑Q, comfort letters, and reviews of other filings or registration statements under the Securities Act
of 1933, as amended, and Securities Exchange Act of 1934, as amended (the “Exchange Act”).
2.Audit‑related fees consisted primarily of various audits of individual or portfolios of properties to comply with lender, joint venture partner or tenant requirements. The 2020 and 2019 fees exclude $0 and $256,600, respectively, related to consents provided for the 2019 and 2018 consolidated financial statements of the Company included in registration statements of BPY and its affiliates; all such fees were reimbursed by BPY.
3.Tax services consisted principally of services necessitated by the Company’s ongoing tax compliance requirements.
Audit Committee’s Pre‑Approval Policies and Procedures
We have adopted written policies that provide that the Audit Committee is incorporated by reference from our definitive Proxy Statementto pre‑approve all audit services and permitted non‑audit services to be filedperformed for us by our independent registered public accounting firm in connectionaccordance with our 2019 Annual Meeting of Stockholders.applicable law. During the fiscal year ended December 31, 2020, all audit and non‑audit services provided to us by Deloitte were pre‑approved by the Audit Committee.
PART IV
ITEM 15. EXHIBITS AND FINANCIAL STATEMENT SCHEDULES
| |
(a) | Consolidated Financial Statements and Consolidated Financial Statement Schedule. |
(a) Consolidated Financial Statements and Consolidated Financial Statement Schedule.
The consolidated financial statements and consolidated financial statement schedule listed in the accompanying Index to Consolidated Financial Statements and Consolidated Financial Statement Schedule are filed as part of this Annual Report.
(b) Exhibits.
| | | | | | | | | | | | | | | | | | | | | | | | | | | | | | | | |
| | | | Incorporated by Reference Herein |
Exhibit
Number | | Description | | Form | | Exhibit | | Filing Date | | File No. |
| | | | | | | | | | |
| | | | | | | | | | |
| | | | 8-K | | 2.1 | | 3/27/2018 | | 001-34948 |
| | | | | | | | | | |
| | | | S-4/A | | 2.2 | | 6/25/2018 | | 333-224593 |
| | | | | | | | | | |
| | | | 8-K | | 3.1 | | 6/25/2019 | | 001-34948 |
| | | | | | | | | | |
| | | | | | | | | | |
| | | | | | | | | | |
| | | | | | | | | | |
| | | | | | | | | | |
| | | | | | | | | | |
| | | | | | | | | | |
| | | | | | | | | | |
| | | | | | | | | | |
| | | | | | | | | | |
| | | | | | | | | | |
| | | | 8-A12B | | 3.2 | | 8/27/2018 | | 001-34948 |
| | | | | | | | | | |
| | | | | | | | | | |
| | | | | | | | | | |
| | | | | | | | | | |
| | | | | | | | | | |
| | | | | | | | | | |
| | | | | | | | | | |
| | | | | | | | | | |
| | | | | | | | | | |
| | | | | | | | | | |
| | | | | | | | | | |
| | | | | | | | | | |
| | | | | | | | | | |
| | | | 10-K | | 4.13 | | 2/27/2009 | | 001-11656 |
| | | | | | | | | | |
| | | | 10-K/A | | 4.14 | | 4/30/2010 | | 001-11656 |
| | | | | | | | | | |
| | | | 10-K | | 4.15 | | 2/27/2008 | | 001-11656 |
| | | | | | | | | | |
| | | | | | | | | | |
| | | | | | | | | | |
| | | | 10-Q | | 4.1 | | 5/10/2019 | | 001-34948 |
| | | | | | | | | | |
| | | | 10-Q | | 4.2 | | 5/10/2019 | | 001-34948 |
| | | | | | | | | | |
| | Indenture, dated as of May 1, 2019, by and among Brookfield Property REIT Inc., BPR Nimbus LLC, BPR Cumulus LLC and GGSI Sellco, LLC, as issuers, the guarantors party thereto and Wells Fargo Bank, National Association, as trustee and collateral agent. | | 8-K | | 4.1 | | 5/2/2019 | | 001-34948 |
| | | | | | | | | | |
| | | | 10-K | | 4.7 | | 2/2/2020 | | 001-34948 |
| | | | | | | | | | |
| | | | 8-K | | 10.1 | | 6/25/2019 | | 001-34948 |
| | | | | | | | | | |
| | | | | | | | | | |
| | | | | | | | | | |
| | | | | | | | | | | | | | | | | | | | | | | | | | | | | | | | |
| | | | Incorporated by Reference Herein |
Exhibit
Number | | Description | | Form | | Exhibit | | Filing Date | | File No. |
| | | | 10-K | | 10.20 | | 3/31/2006 | | 001-11656 |
| | | | | | | | | | |
| | | | | | | | | | |
| | | | | | | | | | |
| | | | 10-K | | 10.21 | | 3/31/2006 | | 001-11656 |
| | | | | | | | | | |
| | | | | | | | | | |
| | | | | | | | | | |
| | | | 10-K | | 10.22 | | 3/31/2006 | | 001-11656 |
| | | | | | | | | | |
| | | | 10-K | | 10.23 | | 3/31/2006 | | 001-11656 |
| | | | | | | | | | |
| | | | 10-K | | 10.25 | | 2/27/2008 | | 001-11656 |
| | | | | | | | | | |
| | | | 10-Q | | 10.1 | | 5/1/2015 | | 001-34948 |
| | | | | | | | | | |
| | | | S-8 | | 4.3 | | 8/29/2018 | | 333-227086 |
| | | | | | | | | | |
| | | | | | | | | | |
| | | | | | | | | | |
| | | | | | | | | | |
| | | | | | | | | | |
| | | | | | | | | | |
| | | | | | | | | | |
| | | | | | | | | | |
| | | | | | | | | | |
| | | | | | | | | | |
| | | | | | | | | | |
| | | | | | | | | | |
| | | | | | | | | | |
| | | | | | | | | | |
| | | | | | | | | | |
| | | | | | | | | | |
| | | | | | | | | | |
| | | | | | | | | | |
| | | | | | | | | | |
| | | | | | | | | | |
| | | | | | | | | | |
| | | | | | | | | | |
| | | | | | | | | | |
| | | | | | | | | | |
| | | | | | | | | | |
| | | | | | | | | | |
| | | | | | | | | | |
| | | | | | | | | | |
| | | | | | | | | | |
| | | | | | | | | | |
| | | | | | | | | | |
| | | | | | | | | | |
| | | | | | | | | | |
| | | | | | | | | | |
| | | | | | | | | | |
| | | | | | | | | | |
| | | | | | | | | | |
| | | | | | | | | | |
| | | | | | | | | | |
| | | | | | | | | | |
| | | | | | | | | | |
| | | | | | | | | | |
| | | | | | | | | | |
| | | | | | | | | | |
| | | | | | | | | | |
| | | | | | | | | | |
| | | | | | | | | | |
| | | | | | | | | | |
| | | | | | | | | | |
| | | | | | | | | | |
| | | | | | | | | | |
| | | | | | | | | | |
| | | | | | | | | | |
| | Amended and Restated Loan Agreement, dated as of April 25, 2016, by and among certain subsidiaries of the Predecessor, each as the Borrowers, the Lenders party thereto, Wells Fargo Securities, LLC, in its capacity as Joint Lead Arranger and Bookrunner, and U.S. Bank National Association, in its capacity as Administrative Agent, Joint Lead Arranger, and Bookrunner. | | 8-K | | 99.1 | | 4/29/2016 | | 001-34948 |
| | | | | | | | | | |
| | | | | | | | | | |
| | | | | | | | | | |
| | | | | | | | | | |
| | | | | | | | | | |
| | | | | | | | | | |
| | | | | | | | | | |
| | | | | | | | | | |
| | | | | | | | | | |
| | | | | | | | | | |
| | | | | | | | | | |
| | | | | | | | | | |
| | | | | | | | | | |
| | | | | | | | | | |
| | | | | | | | | | |
| | | | | | | | | | |
| | | | | | | | | | |
| | | | 8-K | | 10.3 | | 8/28/2018 | | 001-34948 |
| | | | | | | | | | |
| | | | 8-K | | 10.5 | | 8/28/2018 | | 001-34948 |
| | | | | | | | | | |
| | | | | | | | | | |
| | | | | | | | | | |
| | Credit Agreement, dated as of August 24, 2018, by and among Brookfield Retail Holdings VII Sub 3 LLC, Brookfield Property REIT Inc., GGP Nimbus, LLC, GGP Limited Partnership LLC, BPR OP, LP, GGSI Sellco, LLC, GGPLP Real Estate 2010 Loan Pledgor Holding, LLC, GGPLPLLC 2010 Loan Pledgor Holding, LLC, GGPLP 2010 Loan Pledgor Holding, LLC, and GGPLP L.L.C., each of the foregoing as the Borrowers, the Lenders party thereto, the Issuing Banks party thereto, the Swingline Lender party thereto, Morgan Stanley Senior Funding, Inc., in its capacity as co-administrative agent for the Term Lenders under the Term B Facility, and Wells Fargo Bank, National Association, in its capacities as administrative agent and collateral agent for the Lenders. | | 8-K | | 4.1 | | 8/28/2018 | | 001-34948 |
| | | | | | | | | | |
| | | | | | | | | | | | | | | | | | | | | | | | | | | | | | | | |
| | | | Incorporated by Reference Herein |
Exhibit
Number | | Description | | Form | | Exhibit | | Filing Date | | File No. |
| | First Amendment to the Credit Agreement, dated as of July 29, 2020, by and among Brookfield Retail Holdings VII Sub 3 LLC, a Delaware limited liability company, Brookfield Property REIT Inc., a Delaware corporation (f/k/a GGP Inc.), BPR Nimbus LLC, a Delaware limited liability company (f/k/a GGP Nimbus, LLC), BPR Cumulus LLC, a Delaware limited liability company (f/k/a GGP Limited Partnership LLC), BPR OP, LP (f/k/a GGP Operating Partnership, LP), a Delaware limited partnership, GGSI Sellco, LLC, a Delaware limited liability company, GGPLP Real Estate 2010 Loan Pledgor Holding, LLC, a Delaware limited liability company, GGPLPLLC 2010 Loan Pledgor Holding, LLC, a Delaware limited liability company, GGPLP 2010 Loan Pledgor Holding, LLC, a Delaware limited liability company and GGPLP L.L.C., a Delaware limited liability company, the Lenders party hereto, and Wells Fargo Bank, National Association, in its capacities as administrative agent and collateral agent for the Lenders. | | 8-K | | 10.1 | | 7/29/2020 | | 001-34948 |
| | | | | | | | | | |
| | | | | | | | | | |
| | | | | | | | | | |
| | | | | | | | | | |
| | | | | | | | | | |
| | | | | | | | | | |
| | | | | | | | | | |
| | | | | | | | | | |
| | | | | | | | | | |
| | | | | | | | | | |
| | | | | | | | | | |
| | | | | | | | | | |
| | | | | | | | | | |
| | | | | | | | | | |
| | | | | | | | | | |
| 101.SCH | | Inline XBRL Taxonomy Extension Schema Document (filed herewith). | | | | | | | | |
| | | | | | | | | | |
| 101.CAL | | Inline XBRL Taxonomy Extension Calculation Linkbase Document (filed herewith). | | | | | | | | |
| | | | | | | | | | |
| 101.LAB | | Inline XBRL Taxonomy Extension Label Linkbase Document (filed herewith). | | | | | | | | |
| | | | | | | | | | |
| 101.PRE | | Inline XBRL Taxonomy Extension Presentation Linkbase Document (filed herewith). | | | | | | | | |
| | | | | | | | | | |
| 101.DEF | | Inline XBRL Taxonomy Extension Definition Linkbase Document (filed herewith). | | | | | | | | |
| | | | | | | | | | | | | | | | | | | | | | | | | | | | | | | | |
(b) | Exhibits. | | | Incorporated by Reference Herein |
|
| | | | | | | | | | |
| | | | | Incorporated by Reference Herein |
Exhibit Number | | Description | | Form | | Exhibit | | Filing Date | | File No. |
| | | | 8-K | | 2.1 | | 3/27/2018 | | 001-34948 |
| | | | | | | | | | | |
| | | | S-4/A | | 2.2 | | 6/25/2018 | | 333-224593 |
| | | | | | | | | | | |
| | | | 8-K | | 3.1 | | 7/27/2018 | | 001-34948 |
| | | | | | | | | | | |
| | | | 8-K | | 3.1 | | 8/28/2018 | | 001-34948 |
| | | | | | | | | | | |
| | | | 8-A12B | | 3.1 | | 8/27/2018 | | 001-34948 |
|
| | | | | | | | | | |
| | | | | Incorporated by Reference Herein |
Exhibit Number | | Description | | Form | | Exhibit | | Filing Date | | File No. |
| | | | | | | | | | | |
| | | | 8-K | | 3.3 | | 8/28/2018 | | 001-34948 |
| | | | | | | | | | | |
| | | | 8-A12B | | 3.2 | | 8/27/2018 | | 001-34948 |
| | | | | | | | | | | |
| | | | 10-K | | 4.2 | | 3/31/2006 | | 001-11656 |
| | | | | | | | | | | |
| | | | 8-A12B | | 4.3 | | 3/3/2010 | | 001-11656 |
| | | | | | | | | | | |
| | | | 10-K | | 4.7 | | 3/31/2006 | | 001-11656 |
| | | | | | | | | | | |
| | | | 10-K | | 4.8 | | 3/31/2006 | | 001-11656 |
| | | | | | | | | | | |
| | | | 10-K | | 4.9 | | 3/31/2006 | | 001-11656 |
| | | | | | | | | | | |
| | | | 10-K | | 4.13 | | 2/27/2009 | | 001-11656 |
| | | | | | | | | | | |
| | | | 10-K/A | | 4.14 | | 4/30/2010 | | 001-11656 |
| | | | | | | | | | | |
| | | | 10-K | | 4.15 | | 2/27/2008 | | 001-11656 |
| | | | | | | | | | | |
| | | | 10-K | | 4.16 | | 2/27/2008 | | 001-11656 |
| | | | | | | | | | | |
| 4.10 | | Modified Redemption Rights Agreement, dated August 28, 2018, between Brookfield Property REIT Inc. and Everitt Enterprises, Inc. (filed herewith). | | | | | | | | |
| | | | | | | | | | | |
| 4.11 | | Modified Redemption Rights Agreement, dated August 28, 2018, between Brookfield Property REIT Inc. and Koury Corporation. (filed herewith). | | | | | | | | |
| | | | | | | | | | | |
| | | | 8-K | | 10.1 | | 8/28/2018 | | 001-34948 |
| | | | | | | | | | | |
| | | | 10-K | | 10.20 | | 3/31/2006 | | 001-11656 |
| | | | | | | | | | | |
Exhibit
Number | | Description | | Form | | Exhibit | | Filing Date | | File No. |
| | | | | | | | | | |
| | | | Incorporated by Reference Herein |
Exhibit
Number
| | Description | | Form | | Exhibit | | Filing Date | | File No. |
| | | | 10-K | | 10.21 | | 3/31/2006 | | 001-11656 |
| | | | | | | | | | |
| | | | 10-K | | 10.22 | | 3/31/2006 | | 001-11656 |
| | | | | | | | | | |
| | | | 10-K | | 10.23 | | 3/31/2006 | | 001-11656 |
| | | | | | | | | | |
| | | | 10-K | | 10.25 | | 2/27/2008 | | 001-11656 |
| | | | | | | | | | |
| | | | 10-Q | | 10.1 | | 5/1/2015 | | 001-34948 |
| | | | | | | | | | |
| | | | S-8 | | 4.3 | | 8/29/2018 | | 333-227086 |
| | | | | | | | | | |
| | | | 8-K | | 10.1 | | 2/17/2015 | | 001-34948 |
| | | | | | | | | | |
| | | | 10-K | | 10.26 | | 2/22/2018 | | 001-34948 |
| | | | | | | | | | |
| | | | 10-Q | | 10.1 | | 11/2/2017 | | 001-34948 |
| | | | | | | | | | |
| | | | 8-K | | 10.1 | | 11/12/2010 | | 001-34948 |
| | | | | | | | | | |
| | | | 8-K | | 10.7 | | 11/12/2010 | | 001-34948 |
| | | | | | | | | | |
| | | | 10-K | | 10.51 | | 3/8/2011 | | 001-34948 |
| | | | | | | | | | |
| | | | 10-K | | 10.48 | | 2/28/2013 | | 001-34948 |
| | | | | | | | | | |
| | Standstill Agreement, dated November 9, 2010, between Brookfield Retail Holdings LLC, Brookfield Retail Holdings II LLC, Brookfield Retail Holdings III LLC, Brookfield Retail Holdings IV-A LLC, Brookfield Retail Holdings IV-B LLC, Brookfield Retail Holdings IV-C LLC, Brookfield Retail Holdings IV-D LLC, Brookfield Retail Holdings V LP and the Predecessor. | | 8-K | | 10.4 | | 11/12/2010 | | 001-34948 |
| | | | | | | | | | |
|
| | | | | | | | | | |
| | | | | Incorporated by Reference Herein |
Exhibit Number | | Description | | Form | | Exhibit | | Filing Date | | File No. |
| | Amended and Restated Loan Agreement, dated as of April 25, 2016, by and among certain subsidiaries of the Predecessor, each as the Borrowers, the Lenders party thereto, Wells Fargo Securities, LLC, in its capacity as Joint Lead Arranger and Bookrunner, and U.S. Bank National Association, in its capacity as Administrative Agent, Joint Lead Arranger, and Bookrunner. | | 8-K | | 99.1 | | 4/29/2016 | | 001-34948 |
| | | | | | | | | | | |
| | | | 8-K | | 10.1 | | 3/27/2018 | | 001-34948 |
| | | | | | | | | | | |
| | | | 8-K | | 10.2 | | 3/27/2018 | | 001-34948 |
| | | | | | | | | | | |
| | | | 8-K | | 10.3 | | 3/27/2018 | | 001-34948 |
| | | | | | | | | | | |
| | | | 8-K | | 10.4 | | 3/27/2018 | | 001-34948 |
| | | | | | | | | | | |
| | | | S-4/A | | 10.2 | | 6/25/2018 | | 333-224593 |
| | | | | | | | | | | |
| | | | 8-K | | 10.3 | | 8/28/2018 | | 001-34948 |
| | | | | | | | | | | |
| | | | 8-K | | 10.5 | | 8/28/2018 | | 001-34948 |
| | | | | | | | | | | |
| | Credit Agreement, dated as of August 24, 2018, by and among Brookfield Retail Holdings VII Sub 3 LLC, Brookfield Property REIT Inc., GGP Nimbus, LLC, GGP Limited Partnership LLC, BPR OP, LP, GGSI Sellco, LLC, GGPLP Real Estate 2010 Loan Pledgor Holding, LLC, GGPLPLLC 2010 Loan Pledgor Holding, LLC, GGPLP 2010 Loan Pledgor Holding, LLC, and GGPLP L.L.C., each of the foregoing as the Borrowers, the Lenders party thereto, the Issuing Banks party thereto, the Swingline Lender party thereto, Morgan Stanley Senior Funding, Inc., in its capacity as co-administrative agent for the Term Lenders under the Term B Facility, and Wells Fargo Bank, National Association, in its capacities as administrative agent and collateral agent for the Lenders. | | 8-K | | 4.1 | | 8/28/2018 | | 001-34948 |
| | | | | | | | | | | |
| | | | | | | | | | |
| | | | | | | | | | | |
| | | | | | | | | | |
| | | | | | | | | | | |
|
| 104 | | Cover Page Interactive Data File (formatted as Inline XBRL with applicable taxonomy extension information contained in Exhibits 101.*) (filed herewith). | | | | | | | | |
| | | | Incorporated by Reference Herein |
Exhibit
Number
| | Description | | Form | | Exhibit | | Filing Date | | File No. |
| | | | | | | | | | |
| | | | | | | | | | |
| | | | | | | | | | |
| | | | | | | | | | |
| | | | | | | | | | |
| | | | | | | | | | |
| | | | | | | | | | |
| | | | | | | | | | |
| | | | | | | | | | |
| | | | | | | | | | |
101 | | The following financial information from Brookfield Property REIT Inc.'s. Annual Report on Form 10-K for the year ended December 31, 2018, filed with the SEC on March 1, 2019, formatted in XBRL (Extensible Business Reporting Language): (1) Consolidated Balance Sheets, (2) Consolidated Statement of Operations and Comprehensive Income (Loss), (3) Consolidated Statements of Equity, (4) Consolidated Statements of Cash Flows and (5) Notes to Consolidated Financial Statements. | | | | | | | | |
| |
* | Incorporated by reference to filings by GGP Inc. (formerly GGP, Inc. and General Growth Properties, Inc. and referred to as the “Predecessor"* Incorporated by reference to filings by GGP Inc. (formerly GGP, Inc. and General Growth Properties, Inc. and referred to as the "Predecessor") |
| |
# | Management contracts and compensatory plans or arrangements required to be filed as an exhibit pursuant to Item 15(b) of Form 10-K. |
| |
(c) | Separate financial statements. |
# Management contracts and compensatory plans or arrangements required to be filed as an exhibit pursuant to Item 15(b) of Form 10-K.
(c) Separate financial statements.
Not applicable.
ITEM 16. FORM 10-K SUMMARY
Not applicable.
SIGNATURES
Pursuant to the requirements of Section 13 or 15(d) of the Securities Exchange Act of 1934, the registrant has duly caused this report to be signed on its behalf by the undersigned, thereunto duly authorized.
| | | | | | | | |
| | |
| | |
| Brookfield Property REIT Inc. | | |
| | |
| /s/ MICHELLE CAMPBELL | | |
| Michelle Campbell | | |
| Secretary | | March 1, 2019February 26, 2021 |
We, the undersigned officers and directors of Brookfield Property REIT Inc., hereby severally constitute Brian W. Kingston and Bryan K. Davis, and each of them singly, our true and lawful attorneys with full power to them, and each of them singly, to sign for us and in our names in the capacities indicated below, any and all amendments, to this Annual Report on Form 10-K and generally to do all such things in our name and behalf in such capacities to enable Brookfield Property REIT Inc. to comply with the applicable provisions of the Securities Exchange Act of 1934, and we hereby ratify and confirm our signatures as they may be signed by our said attorneys, or any of them, to any and all such amendments.
Pursuant to the requirements of the Securities Exchange Act of 1934, this report has been signed below by the following persons on behalf of the registrant and in the capacities and on the dates indicated.
| | | | | | | | | | | |
| Signature | | Title | Date |
| | | |
| /s/ BRIAN W. KINGSTON | | Chief Executive Officer* | February 26, 2021 |
| Brian W. Kingston | | Brookfield Property Group LLC | |
| | | |
Signature | | Title | Date |
| | | |
/s/ BRIAN W. KINGSTON | | Chief Executive Officer* | March 1, 2019 |
Brian W. Kingston | | Brookfield Property Group LLC | |
| | | |
| /s/ BRYAN K. DAVIS | | Chief Financial Officer* | March 1, 2019February 26, 2021 |
| Bryan K. Davis | | Brookfield Property Group LLC | |
| | | |
/s/ RICHARD B. CLARK | | Chairman of the Board of Directors | March 1, 2019 |
Richard B. Clark | | | |
| | | |
| /s/ CAROLINE ATKINSON | | Director | March 1, 2019February 26, 2021 |
| Caroline Atkinson | | | |
| | | |
| /s/ JEFFREY M. BLIDNER | | Director | March 1, 2019February 26, 2021 |
| Jeffrey M. Blidner | | | |
| | | |
| /s/ SOON YOUNG CHANG | | Director | March 1, 2019February 26, 2021 |
| Soon Young Chang | | | |
| | | |
| /s/ OMAR CARNEIRO DA CUNHA | | Director | March 1, 2019February 26, 2021 |
| Omar Carneiro da Cunha | | | |
| | | |
/s/ SCOTT CUTLER | | Director | March 1, 2019 |
Scott Cutler | | | |
| | | |
| /s/ STEPHEN DENARDO | | Director | March 1, 2019February 26, 2021 |
| Stephen DeNardo | | | |
| | | |
| /s/ LOUIS JOSEPH MAROUN | | Director | March 1, 2019February 26, 2021 |
| Louis Joseph Maroun | | | |
| | | |
/s/ LARS RODERT | | Director | March 1, 2019 |
Lars Rodert | | | |
| |
* | Messrs. Kingston and Davis perform the functions of chief executive officer and chief financial officer, respectively, for Brookfield Property REIT Inc. (the “Company”) pursuant to a Master Services Agreement dated August 27, 2018, among Brookfield Asset Management Inc., the Company and certain other parties thereto. | | |
| /s/ LARS RODERT | | Director | February 26, 2021 |
| Lars Rodert | | | |
| | | |
| /s/ MICHAEL J. WARREN | | Director | February 26, 2021 |
| Michael J. Warren | | | |
* Messrs. Kingston and Davis perform the functions of chief executive officer and chief financial officer, respectively, for Brookfield Property REIT Inc. (the "Company") pursuant to a Master Services Agreement dated August 27, 2018, among Brookfield Asset Management Inc., the Company and certain other parties thereto.
Brookfield Property REIT Inc.
INDEX TO CONSOLIDATED FINANCIAL STATEMENTS
AND CONSOLIDATED FINANCIAL STATEMENT SCHEDULE
The following consolidated financial statements and consolidated financial statement schedule are included in Item 8 of this Annual Report on Form 10-K:
|
| | | | |
| Page
Number
|
| Consolidated Financial Statements | |
| |
| |
| |
| |
| |
| |
|
| | | | | | | |
| |
| | |
| | |
| | |
| | |
| | |
| | |
| | |
| | |
| | |
| | |
| | |
| | |
| | |
| | |
| | |
| | |
| | |
| | |
| | |
| | |
| | |
| Consolidated Financial Statement Schedule | |
| |
All other schedules are omitted since the required information is either not present in any amounts, is not present in amounts sufficient to require submission of the schedule or because the information required is included in the consolidated financial statements and related notes.
REPORT OF INDEPENDENT REGISTERED PUBLIC ACCOUNTING FIRM
To the Stockholdersshareholders and the Board of Directors of Brookfield Property REIT Inc.
Opinion on the Financial Statements
We have audited the accompanying consolidated balance sheets of Brookfield Property REIT Inc. (formerly known as GGP Inc.) and subsidiaries (the "Company") as of December 31, 20182020 and 2017,2019, the related consolidated statements of operations and comprehensive income (loss), equity, and cash flows, for each of the three years in the period ended December 31, 2018,2020, and the related notes and the consolidated financial statement schedule listed in the Index at Item 15 (collectively referred to as the "financial statements"). In our opinion, the financial statements present fairly, in all material respects, the financial position of the Company as of December 31, 20182020 and 2017,2019, and the results of its operations and its cash flows for each of the three years in the period ended December 31, 2018,2020, in conformity with accounting principles generally accepted in the United States of America.
We have also audited, in accordance with the standards of the Public Company Accounting Oversight Board (United States) (PCAOB), the Company's internal control over financial reporting as of December 31, 2018,2020, based on criteria established in Internal Control -— Integrated Framework (2013) issued by the Committee of Sponsoring Organizations of the Treadway Commission and our report dated March 1, 2019,February 26, 2021, expressed an unqualified opinion on the Company's internal control over financial reporting.
Basis for Opinion
These financial statements are the responsibility of the Company's management. Our responsibility is to express an opinion on the Company's financial statements based on our audits. We are a public accounting firm registered with the PCAOB and are required to be independent with respect to the Company in accordance with the U.S. federal securities laws and the applicable rules and regulations of the Securities and Exchange Commission and the PCAOB.
We conducted our audits in accordance with the standards of the PCAOB. Those standards require that we plan and perform the audit to obtain reasonable assurance about whether the financial statements are free of material misstatement, whether due to error or fraud. Our audits included performing procedures to assess the risks of material misstatement of the financial statements, whether due to error or fraud, and performing procedures that respond to those risks. Such procedures included examining, on a test basis, evidence regarding the amounts and disclosures in the financial statements. Our audits also included evaluating the accounting principles used and significant estimates made by management, as well as evaluating the overall presentation of the financial statements. We believe that our audits provide a reasonable basis for our opinion.
Critical Audit Matters
The critical audit matters communicated below are matters arising from the current-period audit of the financial statements that were communicated or required to be communicated to the audit committee and that (1) relate to accounts or disclosures that are material to the financial statements and (2) involved our especially challenging, subjective, or complex judgments. The communication of critical audit matters does not alter in any way our opinion on the financial statements, taken as a whole, and we are not, by communicating the critical audit matters below, providing separate opinions on the critical audit matters or on the accounts or disclosures to which they relate.
Investment in Real Estate - Impairment - Refer to Notes 2, 3, and 4 to the financial statements
Critical Audit Matter Description
The Company’s investments in real estate assets are evaluated for potential impairment periodically or when events or changes in circumstances indicate that the carrying amount of a consolidated property may not be recoverable, or an investment in an unconsolidated real estate affiliate may be other than temporarily impaired. The Company’s evaluation of the recoverability of consolidated properties involves the comparison of undiscounted future cash flows expected to be generated by each property over the Company’s expected remaining holding period to the respective carrying amount. The Company’s evaluation of whether an investment in an unconsolidated real estate affiliate has incurred a loss in value that is other than temporary includes an assessment of the expected return generated from the property or properties held within the investment, and the Company’s intent and ability to retain the investment for a period of time to allow for full recovery. The Company’s undiscounted future cash flows analysis and the assessment of expected remaining holding period requires management to make significant estimates and assumptions related to future real estate property net operating income, future required capital expenditures, capitalization rates, expected return on unconsolidated real estate affiliates, and the probability of obtaining concessions from
creditors at properties for which the Company has suspended funding equity contributions to make contractual interest and/or principal payments.
We identified the testing of impairment of investments in real estate assets as a critical audit matter because it requires a high degree of auditor judgment and an increased extent of effort, including the need to involve our fair value specialists, when performing audit procedures to evaluate the reasonableness of management’s undiscounted future cash flows analysis and assessment of expected remaining holding period.
How the Critical Audit Matter Was Addressed in the Audit
Our audit procedures related to the undiscounted future cash flows analysis and the assessment of expected remaining holding period included the following, among others:
•We tested the effectiveness of controls over management’s evaluation of the recoverability of investments in real estate, including those over future real estate property net operating income, future required capital expenditures, capitalization rates, expected returns on unconsolidated real estate affiliates, and the probability of obtaining concessions from creditors at properties for which the Company has suspended funding equity contributions to make contractual interest and/or principal payments.
•Evaluated the reasonableness of expected remaining holding periods used in the Company’s undiscounted future cash flows analysis, including evaluation of the probability of obtaining concessions from creditors at properties for which the Company has suspended funding equity contributions to make contractual interest and/or principal payments, as well as consideration of potential sales of properties.
•Evaluated the reasonableness of the Company’s expected returns on unconsolidated real estate.
•Evaluated the source information and assumptions used by management, and tested the mathematical accuracy of, the undiscounted future cash flows analysis.
•Compared management’s real estate property net operating income projections to the Company’s historical results, contemplating the impact of rent concessions, as well as compared projections to external market sources for reasonableness, with the assistance of our fair value specialists.
•Compared management’s capitalization rate assumptions to external market sources for reasonableness.
Collectability and Evaluation of Accounts Receivable and Straight-Line Rent Receivables - Refer to Notes 2 and 12 to the financial statements
Critical Audit Matter Description
The recent global COVID-19 pandemic has impacted the Company’s ability to collect rental income on a timely basis. As a result, the Company has worked with their tenants regarding requests for lease concessions and other forms of assistance, and may grant further rent concessions, such as the deferral or abatement of lease payments, on a case-by-case basis. The Company is required to evaluate whether it is probable of collecting substantially all of the remaining lease payments. For leases where collectability of substantially all of the lease payments is not probable, the Company records a current-period adjustment to rental income to the amount of cash collected from the lessee, effectively reducing cumulative income recognized since lease commencement from an accrual basis to cash basis. For leases where collectability of substantially all the lease payments is probable, the Company records an allowance for doubtful accounts against the portion of accounts receivable, net, including straight-line rents, which is estimated to be uncollectible. Such estimates are based on the Company’s previous recovery experience and expectations of future lease concessions. Lease concessions are generally considered a lease modification and thus are recognized prospectively over the remaining lease term. However, the Company does include its estimate of potential lease concessions when establishing its general reserve, based on its best estimates of total lease concessions expected, recognizing the portion of the total concession that is deemed attributable to the current period through consideration of weighted average remaining lease terms. These write off amounts impact both receivables, trade and straight-line rent receivables, which are both included within Accounts receivable, net on the consolidated balance sheet. The Accounts receivable, net balance was $525.0 million as of December 31, 2020.
We identified the collectability and evaluation of accounts receivable and straight-line rent receivables as a critical audit matter because it requires a high degree of auditor judgment and an increased extent of effort in evaluating the probability of collecting substantially all of the remaining lease payments and estimating the timing, frequency, and significance of potential lease concessions for the Company’s general reserve.
How the Critical Audit Matter Was Addressed in the Audit
Our audit procedures related to the collectability of accounts receivable include the following among others:
•We tested the effectiveness of controls over management’s assessment of the probability of collecting substantially all of the remaining lease payments and estimating the timing, frequency, and significance of potential lease concessions for its general reserve.
•We evaluated the reasonableness of management’s assessment of the probability of collecting substantially all of the remaining lease payments, including consideration of collections after the balance sheet date, and estimating the timing, frequency, and significance of potential lease concessions for its general reserves, as well as evaluated the completeness and accuracy of management’s analysis.
•We inquired of Company personnel, including those from the accounts receivable collections department, leasing department, legal department, and financial reporting to evaluate whether management’s estimates of the timing, frequency, and significance of potential lease concessions were reasonable based on consideration of the most recent tenant correspondence, payment history, and status of lease modification negotiations including rent deferrals or abatements. We inspected tenant records and executed lease modification agreements to corroborate our inquiries.
•We performed accounts receivable confirmation testing including confirming the terms of recent lease amendments with tenants.
•We evaluated whether Account Receivables, Net was appropriately reduced for those tenants which have declared bankruptcy or ceased business operations.
•We evaluated the completeness and accuracy of disclosures related to the collectability of Accounts Receivable, Net.
/s/ Deloitte & Touche LLP
Chicago, Illinois
March 1, 2019February 26, 2021
We have served as the Company's auditor since 2001.
Brookfield Property REIT Inc. (Dollars in thousands, except per share amounts) CONSOLIDATED BALANCE SHEETS |
| | | | | | | |
| | December 31,
2018 | | December 31,
2017 |
| Assets: | |
| | |
|
| Investment in real estate: | |
| | |
|
| Land | $ | 2,706,701 |
| | $ | 4,013,874 |
|
| Buildings and equipment | 10,774,079 |
| | 16,957,720 |
|
| Less accumulated depreciation | (2,214,603 | ) | | (3,188,481 | ) |
| Construction in progress | 576,695 |
| | 473,118 |
|
| Net property and equipment | 11,842,872 |
| | 18,256,231 |
|
| Investment in Unconsolidated Real Estate Affiliates | 5,385,582 |
| | 3,377,112 |
|
| Net investment in real estate | 17,228,454 |
| | 21,633,343 |
|
| Cash and cash equivalents | 247,019 |
| | 164,604 |
|
| Accounts receivable, net | 222,562 |
| | 334,081 |
|
| Notes receivable | 256,937 |
| | 417,558 |
|
| Deferred expenses, net | 145,631 |
| | 284,512 |
|
| Prepaid expenses and other assets | 313,648 |
| | 494,795 |
|
| Deferred tax assets, net | 619,275 |
| | 18,633 |
|
| Total assets | $ | 19,033,526 |
| | $ | 23,347,526 |
|
| Liabilities: | |
| | |
|
| Mortgages, notes and loans payable | $ | 12,589,649 |
| | $ | 12,832,459 |
|
| Investment in Unconsolidated Real Estate Affiliates | 124,627 |
| | 21,393 |
|
| Accounts payable and accrued expenses | 953,369 |
| | 919,432 |
|
| Dividend payable | 4,668 |
| | 219,508 |
|
| Junior subordinated notes | 206,200 |
| | 206,200 |
|
| Total liabilities | 13,878,513 |
| | 14,198,992 |
|
| Redeemable equity interests | 2,305,895 |
| | — |
|
| Redeemable noncontrolling interests | 73,696 |
| | 248,126 |
|
| Total redeemable interests | 2,379,591 |
| | 248,126 |
|
| Commitments and Contingencies (Note 19) | — |
| | — |
|
| Equity: | | | |
|
| Class B Stock: 4,942,500,000 shares authorized, $0.01 par value, 454,744,938 issued and outstanding as of December 31, 2018 | 4,547 |
| | — |
|
| Class C Stock: 1,000,000,000 shares authorized, $0.01 par value, 640,051,301 issued and outstanding as of December 31, 2018 | 6,401 |
| | — |
|
| Common Stock: 965,000,000 shares authorized, $0.01 par value, no shares issued or outstanding as of December 31, 2018, and 11,000,000,000 shares authorized, $0.01 par value, 1,040,382,900 issued and 956,982,536 outstanding as of December 31, 2017 | — |
| | 10,130 |
|
| Preferred Stock: 500,000,000 shares authorized, $.01 par value, 10,000,000 shares issued and outstanding as of December 31, 2018 and December 31, 2017 | 242,042 |
| | 242,042 |
|
| Additional paid-in capital | 5,772,824 |
| | 11,845,532 |
|
| Retained earnings (accumulated deficit) | (4,721,335 | ) | | (2,107,498 | ) |
| Accumulated other comprehensive loss | (82,653 | ) | | (71,906 | ) |
| Common stock in treasury, at cost, 55,969,390 shares as of December 31, 2017 | — |
| | (1,122,640 | ) |
| Total stockholders' equity | 1,221,826 |
| | 8,795,660 |
|
| Noncontrolling interests in Consolidated Real Estate Affiliates | 26,652 |
| | 55,379 |
|
| Noncontrolling interests of the Operating Partnership | 1,526,944 |
| | 49,369 |
|
| Total equity | 2,775,422 |
| | 8,900,408 |
|
| Total liabilities, redeemable interests and equity | $ | 19,033,526 |
| | $ | 23,347,526 |
|
The accompanying notes are an integral part of these consolidated financial statements.
Brookfield Property REIT Inc. (Dollars in thousands, except per share amounts) CONSOLIDATED STATEMENTS OF OPERATIONS AND COMPREHENSIVE INCOME |
| | | | | | | | | | | |
| | Year Ended December 31, |
| | 2018 | | 2017 | | 2016 |
| Revenues: | |
| | |
| | |
|
| Minimum rents | $ | 1,297,945 |
| | $ | 1,455,039 |
| | $ | 1,449,704 |
|
| Tenant recoveries | 540,376 |
| | 643,607 |
| | 668,081 |
|
| Overage rents | 29,659 |
| | 34,874 |
| | 42,534 |
|
| Management fees and other corporate revenues | 125,776 |
| | 105,144 |
| | 95,814 |
|
| Other | 70,278 |
| | 89,198 |
| | 90,313 |
|
| Total revenues | 2,064,034 |
| | 2,327,862 |
| | 2,346,446 |
|
| Expenses: | |
| | |
| | |
|
| Real estate taxes | 221,175 |
| | 237,198 |
| | 229,635 |
|
| Property maintenance costs | 41,637 |
| | 49,784 |
| | 55,027 |
|
| Marketing | 7,787 |
| | 11,043 |
| | 13,155 |
|
| Other property operating costs | 253,210 |
| | 286,168 |
| | 282,591 |
|
| Provision for doubtful accounts | 12,102 |
| | 10,701 |
| | 8,038 |
|
| Provision for loan loss | — |
| | — |
| | 29,615 |
|
| Property management and other costs | 172,554 |
| | 145,251 |
| | 138,602 |
|
| General and administrative | 46,441 |
| | 56,133 |
| | 55,745 |
|
| Costs related to the BPY Transaction | 202,523 |
| | — |
| | — |
|
| Provision for impairment | 45,866 |
| | — |
| | 73,039 |
|
| Depreciation and amortization | 633,063 |
| | 693,327 |
| | 660,746 |
|
| Total expenses | 1,636,358 |
| | 1,489,605 |
| | 1,546,193 |
|
| Interest and dividend income | 33,710 |
| | 61,566 |
| | 59,960 |
|
| Interest expense | (576,700 | ) | | (541,945 | ) | | (571,200 | ) |
| (Loss) gain on foreign currency | — |
| | (819 | ) | | 14,087 |
|
| Gains from changes in control of investment properties and other, net | 3,097,196 |
| | 79,056 |
| | 722,904 |
|
| Gains on extinguishment of debt | 13,983 |
| | 55,112 |
| | — |
|
| Income before income taxes, equity in income of Unconsolidated Real Estate Affiliates and allocation to noncontrolling interests | 2,995,865 |
| | 491,227 |
| | 1,026,004 |
|
| Benefit from (provision for) income taxes | 594,186 |
| | 10,896 |
| | (901 | ) |
| Equity in income of Unconsolidated Real Estate Affiliates | 86,552 |
| | 152,750 |
| | 231,615 |
|
| Unconsolidated Real Estate Affiliates - gain on investment, net | 487,166 |
| | 12,000 |
| | 51,555 |
|
| Net income | 4,163,769 |
| | 666,873 |
| | 1,308,273 |
|
| Allocation to noncontrolling interests | (73,228 | ) | | (9,539 | ) | | (19,906 | ) |
| Net income attributable to Brookfield Property REIT Inc. | 4,090,541 |
| | 657,334 |
| | 1,288,367 |
|
| Class A Stock Earnings Per Share (August 28, 2018 through December 31, 2018) (See Note 11) | | | | | |
| Basic & Diluted Earnings Per Share | $ | 0.63 |
| | $ | — |
| | $ | — |
|
| Common Stock Earnings Per Share (Through August 27, 2018) (See Note 11) | |
| | |
| | |
|
| Basic | $ | 4.16 |
| | $ | 0.72 |
| | $ | 1.44 |
|
| Diluted | $ | 4.15 |
| | $ | 0.68 |
| | $ | 1.34 |
|
| Comprehensive Income, Net: | |
| | |
| | |
|
| Net income | $ | 4,163,769 |
| | $ | 666,873 |
| | $ | 1,308,273 |
|
| Other comprehensive income (loss): | |
| | |
| | |
|
| Foreign currency translation | (10,725 | ) | | (1,551 | ) | | 14,319 |
|
| Reclassification adjustment for realized gains on available-for-sale securities included in net income | — |
| | — |
| | (11,978 | ) |
| Net unrealized gains on other financial instruments | 16 |
| | 12 |
| | 5 |
|
| Other comprehensive (loss) income | (10,709 | ) | | (1,539 | ) |
| 2,346 |
|
| Comprehensive income | 4,153,060 |
| | 665,334 |
| | 1,310,619 |
|
| Comprehensive income allocated to noncontrolling interests | (73,267 | ) | | (9,450 | ) | | (19,904 | ) |
| Comprehensive income attributable to Brookfield Property REIT Inc. | 4,079,793 |
| | 655,884 |
| | 1,290,715 |
|
The accompanying notes are an integral part of these consolidated financial statements.
Brookfield Property REIT Inc. (Dollars in thousands, except per share amounts) CONSOLIDATED STATEMENTS OF EQUITY |
| | | | | | | | | | | | | | | | | | | | | | | | | | | | | | | | | | | | | | | | | | | |
| | Common Stock | | Class B Stock | | Class C Stock | | Preferred Stock | | Additional Paid-In Capital | | Retained Earnings (Accumulated Deficit) | | Accumulated Other Comprehensive Income (Loss) | | Common Stock in Treasury | | Noncontrolling
Interests in Consolidated Real Estate Affiliates and Operating Partnership | | Total Equity | | Redeemable Class A Stock |
| | (Dollars in thousands, except for share amounts) | | |
| Balance at January 1, 2016 | $ | 9,386 |
| | $ | — |
| | $ | — |
| | $ | 242,042 |
| | $ | 11,362,369 |
| | $ | (2,141,549 | ) | | $ | (72,804 | ) | | $ | (1,129,401 | ) | | $ | 38,251 |
| | $ | 8,308,294 |
| | $ | — |
|
| | | | | | | | | | | | | | | | | | | | | | |
| Net income | |
| | | | | | |
| | |
| | 1,288,367 |
| | | | | | 4,175 |
| | 1,292,542 |
| | |
| Distributions to noncontrolling interests in consolidated Real Estate Affiliates | |
| | | | | | |
| | |
| | |
| | |
| | |
| | (3,358 | ) | | (3,358 | ) | | |
| Acquisition/disposition of partner's noncontrolling interests in consolidated Real Estate Affiliates | | | | | | | | | (18,416 | ) | | | | | | | | (2,970 | ) | | (21,386 | ) | | |
| Contributions received from noncontrolling interest in consolidated Real Estate Affiliates | | | | | | | | | | | | | | | | | 13,943 |
| | 13,943 |
| | |
| Long Term Incentive Plan Common Unit grants, net (61,358 LTIP Units) |
|
| | | | | | |
| | 104 |
| | (950 | ) | | |
| | |
| | 14,924 |
| | 14,078 |
| | |
| Restricted stock grants, net of forfeitures (342,037 common shares) | 3 |
| | | | | | |
| | 3,317 |
| | |
| | |
| | |
| | |
| | 3,320 |
| | |
| Employee stock purchase program (126,825 common shares) | — |
| | | | | | |
| | 4,206 |
| | |
| | |
| | |
| | |
| | 4,206 |
| | |
| Stock option exercise, net of forfeitures (2,886,986 common shares) | 31 |
| | | | | | | | 58,374 |
| | | | | | | | | | 58,405 |
| | |
| Cancellation of repurchased common shares (1,260,490 common shares) | (15 | ) | | | | | | |
| | (19,846 | ) | | (17,805 | ) | | |
| | 37,666 |
| | |
| | — |
| | |
| OP Unit Conversion to Common Stock (200,000 common shares) | 2 |
| | | | | | | | 5,425 |
| | | | | | | | | | 5,427 |
| | |
| Treasury stock purchases (1,887,751 common shares) | |
| | | | | | |
| | |
| | |
| | | | (46,225 | ) | | |
| | (46,225 | ) | | |
| Cash dividends reinvested (DRIP) in stock (32,381 common shares) | |
| | | | | | |
| | 889 |
| | (215 | ) | | |
| | |
| | |
| | 674 |
| | |
| Other comprehensive income | | | | | | | | | | | | | 14,242 |
| | | | | | 14,242 |
| | |
| Amounts reclassified from Accumulated Other Comprehensive Income | | | | | | | | | | | | | (11,894 | ) | | | | | | (11,894 | ) | | |
| Cash distributions declared ($1.06 per share) | |
| | | | | | |
| |
|
| | (936,779 | ) | | |
| | |
| | |
| | (936,779 | ) | | |
| Cash distributions on Preferred Stock | |
| | | | | | |
| | |
| | (15,935 | ) | | |
| | |
| | |
| | (15,935 | ) | | |
| Fair value adjustment for noncontrolling interest in Operating Partnership | | | | | | | | | 21,175 |
| | | | | | | | | | 21,175 |
| | |
| | | | | | | | | | | | | | | | | | | | | | |
| Balance at December 31, 2016 | $ | 9,407 |
| | $ | — |
| | $ | — |
| | $ | 242,042 |
| | $ | 11,417,597 |
| | $ | (1,824,866 | ) | | $ | (70,456 | ) | | $ | (1,137,960 | ) | | $ | 64,965 |
| | $ | 8,700,729 |
| | $ | — |
|
| | | | | | | | | | | | | | | | | | | | | | |
Brookfield Property REIT INC. (Dollars in thousands, except per share amounts) CONSOLIDATED STATEMENTS OF EQUITY (Continued) |
| | | | | | | | | | | | | | | | | | | | | | | | | | | | | | | | | | | | | | | | | | | |
| | Common
Stock | | Class B Stock | | Class C Stock | | Preferred
Stock | | Additional
Paid-In
Capital | | Retained
Earnings
(Accumulated
Deficit) | | Accumulated Other
Comprehensive
Income (Loss) | | Common
Stock in
Treasury | | Noncontrolling
Interests in Consolidated Real Estate Affiliates and Operating Partnership | | Total
Equity | | Redeemable Class A Stock |
| | (Dollars in thousands, except for share amounts) | | |
| Balance at January 1, 2017 | $ | 9,407 |
| | $ | — |
| | $ | — |
| | $ | 242,042 |
| | $ | 11,417,597 |
| | $ | (1,824,866 | ) | | $ | (70,456 | ) | | $ | (1,137,960 | ) | | $ | 64,965 |
| | $ | 8,700,729 |
| | $ | — |
|
| | | | | | | | | | | | | | | | | | | | | | |
| Cumulative effect of accounting change | | | | | | | | | 2,342 |
| | (3,000 | ) | | | | | | 658 |
| | — |
| | |
| Net income | |
| | | | | | |
| | |
| | 657,334 |
| | |
| | |
| | 2,842 |
| | 660,176 |
| | |
| Distributions to noncontrolling interests in consolidated Real Estate Affiliates | |
| | | | | | |
| | |
| | |
| | |
| | |
| | (5,597 | ) | | (5,597 | ) | | |
| Acquisition/disposition of partner's noncontrolling interests in consolidated Real Estate Affiliates | | | | | | | | |
|
| | | | | | | | 10,795 |
| | 10,795 |
| | |
| Contributions received from noncontrolling interest in consolidated Real Estate Affiliates | | | | | | | | | | | | | | | | | 15,258 |
| | 15,258 |
| | |
| Long Term Incentive Plan Common Unit grants, net (451,585 LTIP Units) | | | | | | | | |
|
| |
|
| | | | | | 15,827 |
| | 15,827 |
| | |
| Restricted stock grants, net (787,484 common shares) | 8 |
| | | | | | | | 9,660 |
| | |
| | |
| | |
| | | | 9,668 |
| | |
| Employee stock purchase program (147,475 common shares) | 1 |
| | | | | | |
| | 3,520 |
| | |
| | |
| | |
| | |
| | 3,521 |
| | |
| Stock option exercise (690,969 common shares) | 8 |
| | | | | | |
| | 23,017 |
| | |
| | |
| | |
| | |
| | 23,025 |
| | |
| Cancellation of repurchased common shares (13,278,252 common shares) | (133 | ) | | | | | | | | (174,098 | ) | | (115,074 | ) | | | | 289,305 |
| | | | — |
| | |
| Treasury stock purchases (12,650,991 common shares) | |
| | | | | | |
| | | | | | |
| | (273,985 | ) | | |
| | (273,985 | ) | | |
| Cash dividends reinvested (DRIP) in stock (43,732 common shares) | | | | | | | | | 1,019 |
| | (274 | ) | | |
| | |
| | |
| | 745 |
| | |
| Other comprehensive loss | |
| | | | | | |
| | | | |
| | (1,450 | ) | | |
| | |
| | (1,450 | ) | | |
| Cash distributions declared ($0.88 per share) | |
| | | | | | |
| | |
| | (805,682 | ) | | |
| | |
| | |
| | (805,682 | ) | | |
| Cash distributions on Preferred Stock | |
| | | | | | |
| | |
| | (15,936 | ) | | |
| | |
| | |
| | (15,936 | ) | | |
| Exercise of Warrants (83,866,187 common shares) | 839 |
| | | | | | | | 550,357 |
| | | | | | | | | | 551,196 |
| | |
| Fair value adjustment for noncontrolling interest in Operating Partnership | |
| | | | | | |
| | 12,118 |
| | |
| | |
| | |
| | |
| | 12,118 |
| | |
| | | | | | | | | | | | | | | | | | | | | | |
| Balance at December 31, 2017 | $ | 10,130 |
| | $ | — |
| | $ | — |
| | $ | 242,042 |
| | $ | 11,845,532 |
| | $ | (2,107,498 | ) | | $ | (71,906 | ) | | $ | (1,122,640 | ) | | $ | 104,748 |
| | $ | 8,900,408 |
| | $ | — |
|
| | | | | | | | | | | | | | | | | | | | | | |
Brookfield Property REIT INC. (Dollars in thousands, except per share amounts) CONSOLIDATED STATEMENTS OF EQUITY (Continued) |
| | | | | | | | | | | | | | | | | | | | | | | | | | | | | | | | | | | | | | | | | | | |
| | Common
Stock | | Class B Stock | | Class C Stock | | Preferred
Stock | | Additional
Paid-In
Capital | | Retained
Earnings
(Accumulated
Deficit) | | Accumulated Other
Comprehensive
Income (Loss) | | Common
Stock in
Treasury | | Noncontrolling
Interests in Consolidated Real Estate Affiliates and Operating Partnership | | Total
Equity | | Redeemable Class A Stock |
| | (Dollars in thousands, except for share amounts) | | |
| Balance at January 1, 2018 | $ | 10,130 |
| | $ | — |
| | $ | — |
| | $ | 242,042 |
| | $ | 11,845,532 |
| | $ | (2,107,498 | ) | | $ | (71,906 | ) | | $ | (1,122,640 | ) | | $ | 104,748 |
| | $ | 8,900,408 |
| | $ | — |
|
| | | | | | | | | | | | | | | | | | | | | | |
| Cumulative effect of accounting change | | | | | | | | | | | (16,864 | ) | | | | | | — |
| | (16,864 | ) | | |
| Net income | |
| | | | | | |
| | |
| | 4,001,959 |
| | |
| | |
| | 36,789 |
| | 4,038,748 |
| | 88,582 |
|
| Distributions to noncontrolling interests in consolidated Real Estate Affiliates | |
| | | | | | |
| | |
| | |
| | |
| | |
| | (15,023 | ) | | (15,023 | ) | | |
| Acquisition/disposition of partner's noncontrolling interests in consolidated Real Estate Affiliates | | | | | | | | | 3,808 |
| | | | | | | | (25,429 | ) | | (21,621 | ) | | |
| Cash dividends reinvested (DRIP) in stock (11,239 common shares) | | | | | | | | | 245 |
| | (245 | ) | | | | | | | | — |
| | |
| Adjust Mezzanine Equity to Fair Value | | | | | | | | | 40,294 |
| | | | | | | | | | 40,294 |
| | |
| Contributions received from noncontrolling interest in consolidated Real Estate Affiliates | | | | | | | | | | | | | | | | | 894 |
| | 894 |
| | |
| Long Term Incentive Plan Common Unit grants, net (238,655 LTIP Units) | | | | | | | | | | | | | | | | | 17,858 |
| | 17,858 |
| | |
| Restricted stock grants, net (1,000,143 Common Shares and 68,675 Class A Stock) | 10 |
| | | | | | | | 11,141 |
| | |
| | |
| | |
| | | | 11,151 |
| | 4,781 |
|
| Employee stock purchase program (80,522 common shares) |
|
| | | | | | |
| | 1,797 |
| | |
| | |
| | |
| | |
| | 1,797 |
| | |
| Stock option exercise (288,715 common shares) | 3 |
| | | | | | |
| | 4,972 |
| | |
| | |
| | |
| | |
| | 4,975 |
| | |
| OP Unit Conversion to Common Stock (4,098,105 common shares) | 41 |
| | | | | | | | 87,149 |
| | | | | | | | | | 87,190 |
| | |
| Preferred stock dividend | | | | | | | | | | | (15,936 | ) | | | | | | | | (15,936 | ) | | |
| Other comprehensive loss | |
| | | | | | |
| | |
| | |
| | (10,747 | ) | | |
| | |
| | (10,747 | ) | | |
| Dividends on Common Stock | | | | | | | | | | | (421,446 | ) | | | | | | | | (421,446 | ) | | |
| Special Pre-Closing Dividend | | | | | | | | | | | (9,152,446 | ) | | | | | | (36,436 | ) | | (9,188,882 | ) | | |
| BPR Equity Recapitalization (See Note 1) | (10,184 | ) | | 4,074 |
| | — |
| | | | (7,428,697 | ) | | 2,903,347 |
| | | | 1,122,640 |
| | (662 | ) | | (3,409,482 | ) | | 3,402,365 |
|
| Cash Contribution from BPY | | | | | 6,401 |
| | | | 193,599 |
| | | | | | | | | | 200,000 |
| | |
| Class A Conversion to Class B (47,390,895 Class B shares) | | | 473 |
| | | | | | 1,012,984 |
| | 87,794 |
| | | | | | | | 1,101,251 |
| | (1,101,251 | ) |
| Adjust Class A Stock to Fair Value | | | | | | | | |
|
| |
|
| | | | | | | | — |
| |
|
|
| Acquisition of Noncontrolling Interest by Institutional Investor | | | | | | | | | | | | | | | | | 1,470,857 |
| | 1,470,857 |
| | |
| Class A Dividend | | | | | | | | | | | | | | | | | | | — |
| | (88,582 | ) |
| | | | | | | | | | | | | | | | | | | | | | |
| Balance at December 31, 2018 | $ | — |
| | $ | 4,547 |
| | $ | 6,401 |
| | $ | 242,042 |
| | $ | 5,772,824 |
| | $ | (4,721,335 | ) | | $ | (82,653 | ) | | $ | — |
| | $ | 1,553,596 |
| | $ | 2,775,422 |
| | $ | 2,305,895 |
|
The accompanying notes are an integral part of these consolidated financial statements.
Brookfield Property REIT Inc.
(Dollars in thousands, except per share amounts)
CONSOLIDATED BALANCE SHEETS
| | | | | | | | | | | |
| | December 31,
2020 | | December 31,
2019 |
| Assets: | | | |
| Investment in real estate: | | | |
| Land | $ | 3,620,513 | | | $ | 3,659,595 | |
| Buildings and equipment | 13,968,906 | | | 14,020,589 | |
| Less accumulated depreciation | (2,967,879) | | | (2,569,911) | |
| Construction in progress | 256,510 | | | 160,443 | |
| Net property and equipment | 14,878,050 | | | 15,270,716 | |
| Investment in Unconsolidated Real Estate Affiliates | 4,342,995 | | | 4,634,292 | |
| Net investment in real estate | 19,221,045 | | | 19,905,008 | |
| Cash and cash equivalents | 204,541 | | | 197,829 | |
| Accounts receivable, net | 524,982 | | | 234,928 | |
| Notes receivable | 45,553 | | | 76,310 | |
| Deferred expenses, net | 158,633 | | | 188,591 | |
| Prepaid expenses and other assets | 827,746 | | | 745,060 | |
| Deferred tax assets, net | 655,060 | | | 625,660 | |
| Assets held for disposition | 242,404 | | | 0 | |
| Total assets | $ | 21,879,964 | | | $ | 21,973,386 | |
| Liabilities: | | | |
| Mortgages, notes and loans payable | $ | 16,114,586 | | | $ | 15,902,894 | |
| Investment in Unconsolidated Real Estate Affiliates | 151,095 | | | 125,565 | |
| Accounts payable and accrued expenses | 993,617 | | | 1,027,130 | |
| Dividend payable | 903 | | | 21 | |
| | | |
| Junior subordinated notes | 206,200 | | | 206,200 | |
| Liabilities held for disposition | 263,141 | | | 0 | |
| Total liabilities | 17,729,542 | | | 17,261,810 | |
| Redeemable equity interests | 839,143 | | | 1,354,234 | |
| Redeemable noncontrolling interests | 60,826 | | | 62,235 | |
| Total redeemable interests | 899,969 | | | 1,416,469 | |
| Commitments and Contingencies (Note 18) | 0 | | | 0 | |
| Equity: | | | |
| Class B Stock & Series B Preferred Stock (collectively, "Combined Class B Stock"): 5,907,500,000 shares authorized, $0.01 par value, 526,042,279 issued and outstanding as of December 31, 2020, 493,665,297 issued and outstanding as of December 31, 2019 | 5,261 | | | 4,937 | |
| Class C Stock: 1,000,000,000 shares authorized, $0.01 par value, 640,051,301 issued and outstanding as of December 31, 2020 and December 31, 2019 | 6,401 | | | 6,401 | |
| | | |
| Preferred Stock: 500,000,000 shares authorized, $.01 par value, 10,000,000 shares issued and outstanding as of December 31, 2020 and December 31, 2019 | 242,042 | | | 242,042 | |
| Additional paid-in capital | 7,363,064 | | | 6,670,844 | |
| Accumulated deficit | (5,674,064) | | | (5,076,455) | |
| Accumulated other comprehensive loss | (99,418) | | | (85,402) | |
| | | |
| Total stockholders' equity | 1,843,286 | | | 1,762,367 | |
| Noncontrolling interests in Consolidated Real Estate Affiliates | 13,444 | | | 26,210 | |
| Noncontrolling interests of the Operating Partnership | 1,393,723 | | | 1,506,530 | |
| Total equity | 3,250,453 | | | 3,295,107 | |
| Total liabilities, redeemable interests and equity | $ | 21,879,964 | | | $ | 21,973,386 | |
The accompanying notes are an integral part of these consolidated financial statements.
Brookfield Property REIT Inc.
(Dollars in thousands, except per share amounts)
CONSOLIDATED STATEMENTS OF OPERATIONS AND COMPREHENSIVE INCOME (LOSS)
| | | | | | | | | | | | | | | | | |
| | Year Ended December 31, |
| | 2020 | | 2019 | | 2018 |
| Revenues: | | | | | |
| Rental revenues, net | $ | 1,355,880 | | | $ | 1,337,684 | | | $ | 1,867,980 | |
| Management fees and other corporate revenues | 125,107 | | | 166,505 | | | 125,776 | |
| Other | 48,558 | | | 59,779 | | | 70,278 | |
| Total revenues | 1,529,545 | | | 1,563,968 | | | 2,064,034 | |
| Operating Expenses: | | | | | |
| Real estate taxes | 192,726 | | | 171,072 | | | 221,175 | |
| Property maintenance costs | 31,728 | | | 32,032 | | | 41,637 | |
| Marketing | 6,713 | | | 5,945 | | | 7,787 | |
| Other property operating costs | 185,524 | | | 179,278 | | | 253,210 | |
| Provision for doubtful accounts | 0 | | | 0 | | | 12,102 | |
| | | | | |
| Property management and other costs | 231,047 | | | 229,150 | | | 172,554 | |
| General and administrative | 24,487 | | | 22,452 | | | 46,441 | |
| Costs related to the BPY Transaction | 0 | | | 9,179 | | | 202,523 | |
| Provision for impairment | 133,671 | | | 223,142 | | | 45,866 | |
| Depreciation and amortization | 641,592 | | | 501,636 | | | 633,063 | |
| Total operating expenses | 1,447,488 | | | 1,373,886 | | | 1,636,358 | |
| | | | | |
| Interest and dividend income | 8,138 | | | 25,792 | | | 33,710 | |
| Interest expense | (693,656) | | | (678,460) | | | (576,700) | |
| | | | | |
| | | | | |
| (Loss) gain from changes in control of investment properties and other, net | (15,433) | | | 720,706 | | | 3,097,196 | |
| Gain (loss) on extinguishment of debt | 14,320 | | | (27,542) | | | 13,983 | |
| (Loss) income before income taxes, equity in (loss) income of Unconsolidated Real Estate Affiliates and related gain on investment, and allocation to noncontrolling interests | (604,574) | | | 230,578 | | | 2,995,865 | |
| Benefit from (provision for) income taxes | 35,367 | | | (9,683) | | | 594,186 | |
| Equity in (loss) income of Unconsolidated Real Estate Affiliates | (180,577) | | | 19,586 | | | 86,552 | |
| Unconsolidated Real Estate Affiliates - (loss) gain on investment, net | (51,800) | | | 240,430 | | | 487,166 | |
| | | | | |
| | | | | |
| | | | | |
| | | | | |
| | | | | |
| | | | | |
| Net (loss) income | (801,584) | | | 480,911 | | | 4,163,769 | |
| Allocation to noncontrolling interests | 90,123 | | | (48,031) | | | (73,228) | |
| Net (loss) income attributable to Brookfield Property REIT Inc. | (711,461) | | | 432,880 | | | 4,090,541 | |
| | | | | |
| | | | | |
| Class A Stock Earnings Per Share (August 28, 2018 through December 31, 2020) (See Note 10) | | | | | |
| Basic & Diluted Earnings Per Share | $ | 1.33 | | | $ | 1.32 | | | $ | 0.63 | |
| Common Stock Earnings Per Share (Through August 27, 2018) (See Note 10) | | | | | |
| | | | | |
| | | | | |
| Basic | | | | | $ | 4.16 | |
| | | | | |
| | | | | |
| | | | | |
| Diluted | | | | | $ | 4.15 | |
| Comprehensive (Loss) Income, Net: | | | | | |
| Net (loss) income | $ | (801,584) | | | $ | 480,911 | | | $ | 4,163,769 | |
| Other comprehensive income (loss): | | | | | |
| Foreign currency translation | (15,432) | | | (2,608) | | | (10,725) | |
| | | | | |
| Net unrealized gain (loss) on other financial instruments | 37 | | | (141) | | | 16 | |
| Other comprehensive loss | (15,395) | | | (2,749) | | | (10,709) | |
| Comprehensive (loss) income | (816,979) | | | 478,162 | | | 4,153,060 | |
| Comprehensive loss (income) allocated to noncontrolling interests | 91,502 | | | (48,031) | | | (73,267) | |
| Comprehensive (loss) income attributable to Brookfield Property REIT Inc. | (725,477) | | | 430,131 | | | 4,079,793 | |
| | | | | |
| | | | | |
The accompanying notes are an integral part of these consolidated financial statements.
Brookfield Property REIT Inc.
(Dollars in thousands, except per share amounts)
CONSOLIDATED STATEMENTS OF EQUITY
| | | | | | | | | | | | | | | | | | | | | | | | | | | | | | | | | | | | | | | | | | | | | | | | | | | | | | | | | | | | | | | | | |
| | Common
Stock | | Combined Class B Stock | | Class C Stock | | Preferred
Stock | | Additional
Paid-In
Capital | |
Accumulated
Deficit | | Accumulated Other
Comprehensive
Income (Loss) | | Common
Stock in
Treasury | | Noncontrolling
Interests in Consolidated Real Estate Affiliates and Operating Partnership | | Total
Equity | | Redeemable Class A Stock |
| (Dollars in thousands, except for share amounts) | | |
| Balance at January 1, 2018 | $ | 10,130 | | | $ | 0 | | | $ | 0 | | | $ | 242,042 | | | $ | 11,845,532 | | | $ | (2,107,498) | | | $ | (71,906) | | | $ | (1,122,640) | | | $ | 104,748 | | | $ | 8,900,408 | | | $ | 0 | |
| | | | | | | | | | | | | | | | | | | | | |
| Cumulative effect of accounting change | | | | | | | | | | | (16,864) | | | | | | | | | (16,864) | | | |
| Net income | | | | | | | | | | | 4,001,959 | | | | | | | 36,789 | | | 4,038,748 | | | 88,582 | |
| Distributions to noncontrolling interests in consolidated Real Estate Affiliates | | | | | | | | | | | | | | | | | (15,023) | | | (15,023) | | | |
| Acquisition/disposition of partner's noncontrolling interests in consolidated Real Estate Affiliates | | | | | | | | | 3,808 | | | | | | | | | (25,429) | | | (21,621) | | | |
| Contributions received from noncontrolling interest in consolidated Real Estate Affiliates | | | | | | | | | | | | | | | | | 894 | | | 894 | | | |
| Long Term Incentive Plan Common Unit grants, net (238,655 LTIP Units) | | | | | | | | | 0 | | 0 | | | | | | 17,858 | | | 17,858 | | | |
| Restricted stock grants, net (1,000,143 Common Shares and 68,675 Class A Stock) | 10 | | | | | | | | | 11,141 | | | | | | | | | | | 11,151 | | | 4,781 | |
| Employee stock purchase program (80,522 common shares) | | | | | | | | | 1,797 | | | | | | | | | | | 1,797 | | | |
| Stock option exercise (288,715 common shares) | 3 | | | | | | | | | 4,972 | | | | | | | | | | | 4,975 | | | |
| | | | | | | | | | | | | | | | | | | | | |
| | | | | | | | | | | | | | | | | | | | | |
| | | | | | | | | | | | | | | | | | | | | |
| Cash dividends reinvested (DRIP) in stock (11,239 common shares) | | | | | | | | | 245 | | | (245) | | | | | | | | | 0 | | | |
| Other comprehensive loss | | | | | | | | | | | | | (10,747) | | | | | | | (10,747) | | | |
| | | | | | | | | | | | | | | | | | | | | |
| | | | | | | | | | | | | | | | | | | | | |
| | | | | | | | | | | | | | | | | | | | | |
| | | | | | | | | | | | | | | | | | | | | |
| Adjust Mezzanine Equity to Fair Value | | | | | | | | | 40,294 | | | | | | | | | | | 40,294 | | | |
| OP Unit Conversion to Common Stock (4,098,105 common shares) | 41 | | | | | | | | | 87,149 | | | | | | | | | | | 87,190 | | | |
| Preferred stock dividend | | | | | | | | | | | (15,936) | | | | | | | | | (15,936) | | | |
| Dividends on Common Stock | | | | | | | | | | | (421,446) | | | | | | | | | (421,446) | | | |
| Special Pre-Closing Dividend | | | | | | | | | | | (9,152,446) | | | | | | | (36,436) | | | (9,188,882) | | | |
| BPR Equity Recapitalization (See Note 1) | (10,184) | | | 4,074 | | | | | | (7,428,697) | | | 2,903,347 | | | | 1,122,640 | | (662) | | | (3,409,482) | | | 3,402,365 | |
| Cash Contribution from BPY | | | | | 6,401 | | | | 193,599 | | | | | | | | | | | 200,000 | | | |
| Class A Conversion to Class B (47,390,895 Class B shares) | | | 473 | | | | | | | 1,012,984 | | | 87,794 | | | | | | | | 1,101,251 | | | (1,101,251) | |
| Acquisition of Noncontrolling Interest by Institutional Investor | | | | | | | | | | | | | | | | | 1,470,857 | | | 1,470,857 | | | |
| Class A Dividend | | | | | | | | | | | | | | | | | | | — | | | (88,582) | |
| | | | | | | | | | | | | | | | | | | | | |
| | | | | | | | | | | | | | | | | | | | | |
| Balance at December 31, 2018 | $ | 0 | | | $ | 4,547 | | | $ | 6,401 | | | $ | 242,042 | | | $ | 5,772,824 | | | $ | (4,721,335) | | | $ | (82,653) | | | $ | 0 | | | $ | 1,553,596 | | | $ | 2,775,422 | | | $ | 2,305,895 | |
| | | | | | | | | | | | | | | | | | | | | |
| | | | | | | | | | | | | | | | | | | | | |
| | | | | | | | | | | | | | | | | | | | | | | | | | | | | | | | | | | | | | | | | | | | | | | | | | | | | |
| Combined Class B Stock | | Class C Stock | | Preferred
Stock | | Additional
Paid-In
Capital | | Accumulated
Deficit | | Accumulated Other
Comprehensive
Income (Loss) | | Noncontrolling
Interests in Consolidated Real Estate Affiliates and Operating Partnership | | Total
Equity | | Redeemable Class A Stock |
| (Dollars in thousands, except for share amounts) |
| Balance at January 1, 2019 | $ | 4,547 | | | $ | 6,401 | | | $ | 242,042 | | | $ | 5,772,824 | | | $ | (4,721,335) | | | $ | (82,653) | | | $ | 1,553,596 | | | $ | 2,775,422 | | | $ | 2,305,895 | |
| | | | | | | | | | | | | | | | | |
| Net Income | | | | | | | | | 324,255 | | | | | 42,279 | | | 366,534 | | | 108,625 | |
| Distributions to noncontrolling interests in consolidated Real Estate Affiliates | | | | | | | | | | | | | (99,331) | | | (99,331) | | | |
| Acquisition/disposition of partner's noncontrolling interests in consolidated Real Estate Affiliates | | | | | | | | | | | | | 5,237 | | | 5,237 | | | |
| Contributions received from noncontrolling interest in consolidated Real Estate Affiliates | | | | | | | | | | | | | 31,688 | | | 31,688 | | | |
| Long Term Incentive Plan & Stock Option Expense | | | | | | | | | 877 | | | | | | | 877 | | | |
| Restricted stock grants, net of forfeitures (604,202 Class A Stock) | | | | | | | | | | | | | | | — | | | 9,190 | |
| Preferred stock dividend ($1.5936 per share) | | | | | | | | | (15,937) | | | | | | | (15,937) | | | |
| Other comprehensive loss | | | | | | | | | | | (2,749) | | | | | (2,749) | | | |
| Dividends on Combined Class B Stock (Refer to Note 9) | | | | | | | | | (681,567) | | | | | | | (681,567) | | | |
| Class A Conversion to Class B-1 (40,030,429 Class A Shares converted to 35,704,228 Class B-1 Shares) | 358 | | | | | | | 763,356 | | | 76,927 | | | | | | | 840,641 | | | (840,641) | |
| Dividends on Class A ($1.32 per share) | | | | | | | | | | | | | | | — | | | (108,625) | |
| Buyback of Class A Stock | | | | | | | | | 5,283 | | | | | | | 5,283 | | | (120,210) | |
| Buyback of Class B-1 Stock | (105) | | | | | | | (158,517) | | | (65,902) | | | | | | | (224,524) | | | |
| Series K Preferred Unit redemption | | | | | | | | | 944 | | | | | (729) | | | 215 | | | |
| Class B-1 Equity Issuance | 137 | | | | | | | 293,181 | | | | | | | | | 293,318 | | | |
| | | | | | | | | | | | | | | | | |
| Balance at December 31, 2019 | $ | 4,937 | | | $ | 6,401 | | | $ | 242,042 | | | $ | 6,670,844 | | | $ | (5,076,455) | | | $ | (85,402) | | | $ | 1,532,740 | | | $ | 3,295,107 | | | $ | 1,354,234 | |
| | | | | | | | | | | | | | | | | |
| | | | | | | | | | | | | | | | | | | | | | | | | | | | | | | | | | | | | | | | | | | | | | | | | | | | | |
| Combined Class B Stock | | Class C Stock | | Preferred
Stock | | Additional
Paid-In
Capital | | Accumulated
Deficit | | Accumulated Other
Comprehensive
Income (Loss) | | Noncontrolling
Interests in Consolidated Real Estate Affiliates and Operating Partnership | | Total
Equity | | Redeemable Class A Stock |
| (Dollars in thousands, except for share amounts) |
| Balance at January 1, 2020 | $ | 4,937 | | | $ | 6,401 | | | $ | 242,042 | | | $ | 6,670,844 | | | $ | (5,076,455) | | | $ | (85,402) | | | $ | 1,532,740 | | | $ | 3,295,107 | | | $ | 1,354,234 | |
| | | | | | | | | | | | | | | | | |
| Net income | | | | | | | | | (779,834) | | | | | (93,739) | | | (873,573) | | | 68,373 | |
| Acquisition/disposition of partner's noncontrolling interests in consolidated Real Estate Affiliates | | | | | | | | | | | | | (481) | | | (481) | | | |
| Long Term Incentive Plan & Stock Option Expense | | | | | | | — | | | 76 | | | | | | | 76 | | | |
| Restricted stock grants, net of forfeitures (733,369 Class A Stock) | | | | | | | | | | | | | | | — | | | 9,401 | |
| Preferred stock dividend ($1.5938 per share) | | | | | | | | | (15,938) | | | | | | | (15,938) | | | |
| Other comprehensive loss | | | | | | | | | | | (14,016) | | | (1,379) | | | (15,395) | | | |
| Class A Conversion to Class B-1 (11,579,807 Class A Shares converted to 7,496,429 Class B-1 Shares) | 75 | | | | | | | 160,274 | | | 82,827 | | | | | | | 243,176 | | | (243,176) | |
| Dividends on Class A ($1.33 per share) | | | | | | | | | | | | | | | — | | | (68,373) | |
| Buyback of Class A Stock | | | | | | | | | 112,894 | | | | | | | 112,894 | | | (281,316) | |
| Series K Preferred Unit redemption | | | | | | | | | 2,366 | | | | | (29,974) | | | (27,608) | | | |
| Class B-1 Equity Issuance | 249 | | | | | | | 531,946 | | | | | | | | | 532,195 | | | |
| | | | | | | | | | | | | | | | | |
| Balance at December 31, 2020 | $ | 5,261 | | | $ | 6,401 | | | $ | 242,042 | | | $ | 7,363,064 | | | $ | (5,674,064) | | | $ | (99,418) | | | $ | 1,407,167 | | | $ | 3,250,453 | | | $ | 839,143 | |
The accompanying notes are an integral part of these consolidated financial statements.
Brookfield Property REIT Inc.
(Dollars in thousands, except per share amounts)
CONSOLIDATED STATEMENTS OF CASH FLOWS | | | | | | | | | | | | | | | | | |
| | Year Ended December 31, |
| | 2020 | | 2019 | | 2018 |
| Cash Flows (used in) provided by Operating Activities: | | | | | |
| Net (loss) income | $ | (801,584) | | | $ | 480,911 | | | $ | 4,163,769 | |
| Adjustments to reconcile net (loss) income to net cash provided by operating activities: | | | | | |
| Equity in loss (income) of Unconsolidated Real Estate Affiliates | 180,577 | | | (19,586) | | | (86,552) | |
| Distributions received from Unconsolidated Real Estate Affiliates | 30,228 | | | 127,121 | | | 117,167 | |
| Provision for doubtful accounts | 62,395 | | | 10,733 | | | 12,102 | |
| Depreciation and amortization | 641,592 | | | 501,636 | | | 633,063 | |
| Amortization/write-off of deferred finance costs | 34,881 | | | 29,409 | | | 19,294 | |
| Accretion/write-off of debt market rate adjustments | (1,506) | | | (1,684) | | | (1,585) | |
| Amortization of intangibles other than in-place leases | (9,040) | | | (15,798) | | | 16,061 | |
| Amortization of right-of-use assets | 10,060 | | | 5,282 | | | 0 | |
| Straight-line rent amortization | (41,885) | | | (8,488) | | | 2,425 | |
| Deferred income taxes | (29,400) | | | (7,420) | | | (600,643) | |
| | | | | |
| | | | | |
| Unconsolidated Real Estate Affiliates— loss (gain) on investment, net | 51,800 | | | (240,430) | | | (487,166) | |
| Losses (gain) from changes in control of investment properties and other, net | 15,433 | | | (720,706) | | | (3,097,196) | |
| Loss (gain) on extinguishment of debt | (14,320) | | | 27,542 | | | (13,983) | |
| Provisions for impairment | 133,671 | | | 223,142 | | | 45,866 | |
| | | | | |
| | | | | |
| | | | | |
| | | | | |
| Net changes: | | | | | |
| Accounts and notes receivable, net | (310,363) | | | 34,790 | | | (40,790) | |
| Prepaid expenses and other assets | (38,365) | | | 5,433 | | | (34,829) | |
| Deferred expenses, net | (3,392) | | | (15,279) | | | (44,746) | |
| | | | | |
| Accounts payable and accrued expenses | 84,939 | | | 1,317 | | | (59,352) | |
| Other, net | (4,151) | | | 10,204 | | | 41,644 | |
| Net cash (used in) provided by operating activities | (8,430) | | | 428,129 | | | 584,549 | |
| Cash Flows (used in) provided by Investing Activities: | | | | | |
| Acquisition of real estate and property additions | 0 | | | (877,059) | | | (63,700) | |
| Development of real estate and property improvements | (272,782) | | | (514,287) | | | (674,485) | |
| Purchase of US Treasury securities in connection with defeasance of mortgage note payable | 0 | | | (168,777) | | | 0 | |
| Distributions received from Unconsolidated Real Estate Affiliates in excess of income | 72,731 | | | 363,168 | | | 410,578 | |
| Loans to joint venture and joint venture partners | (2,168) | | | (95,815) | | | (12,393) | |
| Loans to affiliates | 0 | | | (330,000) | | | 0 | |
| Proceeds from repayment of loans from affiliates | 0 | | | 330,000 | | | 0 | |
| Proceeds from repayment of loans to joint venture and joint venture partners | 2,379 | | | 18,020 | | | 204,867 | |
| Proceeds from sales of investment properties and Unconsolidated Real Estate Affiliates | 88,377 | | | 185,167 | | | 3,050,301 | |
| Contributions to Unconsolidated Real Estate Affiliates | (141,369) | | | (239,375) | | | (218,038) | |
| | | | | |
| | | | | |
| | | | | |
| Net cash (used in) provided by investing activities | (252,832) | | | (1,328,958) | | | 2,697,130 | |
| Cash Flows provided by (used in) Financing Activities: | | | | | |
| Proceeds from refinancing/issuance of mortgages, notes and loans payable | 906,395 | | | 6,420,326 | | | 7,031,647 | |
| Principal payments on mortgages, notes and loans payable | (821,971) | | | (4,527,272) | | | (1,774,657) | |
| Payment of deferred finance costs | (8,661) | | | (42,146) | | | (112,626) | |
| Buyback of Class A Stock | (168,422) | | | (114,927) | | | 0 | |
| Buyback of Combined Class B Stock | 0 | | | (224,524) | | | 0 | |
| Issuances of Class B Stock | 532,195 | | | 293,318 | | | 0 | |
| Issuances of Class C Stock | 0 | | | 0 | | | 200,000 | |
| Series K preferred unit redemptions | (29,018) | | | (14,783) | | | 0 | |
| Stock Issuance Costs | 0 | | | 0 | | | (6,524) | |
| | | | | |
| | | | | |
| | | | | |
| Cash contributions from noncontrolling interests in consolidated real estate affiliates | 31,688 | | | 0 | | | 1,471,750 | |
| Cash distributions paid to stockholders | (68,373) | | | (790,192) | | | (9,873,248) | |
| Cash distributions to noncontrolling interests in consolidated real estate affiliates | 0 | | | (99,331) | | | (15,023) | |
| Cash distributions reinvested (DRIP) in common stock | 0 | | | 0 | | | 357 | |
| Cash distributions paid to preferred stockholders | (15,938) | | | (15,938) | | | (19,920) | |
| Cash distributions and redemptions paid to holders of common units | (3,535) | | | (6,883) | | | (107,050) | |
| Other, net | 0 | | | 0 | | | (9,631) | |
| Net cash provided by (used in) financing activities | 354,360 | | | 877,648 | | | (3,214,925) | |
| | | | | |
| Net change in cash, cash equivalents and restricted cash | 93,098 | | | (23,181) | | | 66,754 | |
| Cash, cash equivalents and restricted cash at beginning of year | 275,512 | | | 298,693 | | | 231,939 | |
| Cash, cash equivalents and restricted cash at end of year | $ | 368,610 | | | $ | 275,512 | | | $ | 298,693 | |
|
| | | | | | | | | | | |
| | Year Ended December 31, |
| | 2018 | | 2017 | | 2016 |
| Cash Flows provided by Operating Activities: | |
| | |
| | |
|
| Net income | $ | 4,163,769 |
| | $ | 666,873 |
| | $ | 1,308,273 |
|
| Adjustments to reconcile net income to net cash provided by operating activities: | |
| | |
| | |
|
| Equity in income of Unconsolidated Real Estate Affiliates | (86,552 | ) | | (152,750 | ) | | (231,615 | ) |
| Distributions received from Unconsolidated Real Estate Affiliates | 117,167 |
| | 237,956 |
| | 120,674 |
|
| Provision for doubtful accounts | 12,102 |
| | 10,701 |
| | 8,038 |
|
| Depreciation and amortization | 633,063 |
| | 693,327 |
| | 660,746 |
|
| Amortization/write-off of deferred finance costs | 19,294 |
| | 11,880 |
| | 11,876 |
|
| Accretion/write-off of debt market rate adjustments | (1,585 | ) | | (4,346 | ) | | (5,184 | ) |
| Amortization of intangibles other than in-place leases | 16,061 |
| | 28,309 |
| | 41,154 |
|
| Straight-line rent amortization | 2,425 |
| | (2,084 | ) | | (11,867 | ) |
| Deferred income taxes | (600,643 | ) | | (15,532 | ) | | 15,353 |
|
| Gain on dispositions, net | — |
| | (5,356 | ) | | (37,526 | ) |
| Unconsolidated Real Estate Affiliates—gain on investment, net | (487,166 | ) | | (12,000 | ) | | (51,555 | ) |
| Gains from changes in control of investment properties and other, net | (3,097,196 | ) | | (79,056 | ) | | (722,904 | ) |
| Loss (gain) on extinguishment of debt | (13,983 | ) | | (55,112 | ) | | 5,403 |
|
| Provisions for impairment | 45,866 |
| | — |
| | 73,039 |
|
| Provisions for loan loss | — |
| | — |
| | 29,615 |
|
| (Gain) loss on foreign currency | — |
| | 819 |
| | (14,087 | ) |
| Net changes: | |
| | |
| | |
|
| Accounts and notes receivable, net | (40,790 | ) | | (6,103 | ) | | (37,489 | ) |
| Prepaid expenses and other assets | (34,829 | ) | | (40,326 | ) | | (4,092 | ) |
| Deferred expenses, net | (44,746 | ) | | (36,603 | ) | | (27,888 | ) |
| Accounts payable and accrued expenses | (59,352 | ) | | 13,777 |
| | (27,924 | ) |
| Other, net | 41,644 |
| | 40,238 |
| | 34,111 |
|
| Net cash provided by operating activities | 584,549 |
| | 1,294,612 |
| | 1,136,151 |
|
| Cash Flows provided by (used in) Investing Activities: | |
| | |
| | |
|
| Acquisition of real estate and property additions | (63,700 | ) | | (230,754 | ) | | (577,845 | ) |
| Development of real estate and property improvements | (674,485 | ) | | (662,762 | ) | | (547,447 | ) |
| Distributions received from Unconsolidated Real Estate Affiliates in excess of income | 410,578 |
| | 166,867 |
| | 82,800 |
|
| Loans to joint venture and joint venture partners | (12,393 | ) | | (121,262 | ) | | (59,769 | ) |
| Proceeds from repayment of loans to joint venture and joint venture partners | 204,867 |
| | 50,964 |
| | 13,042 |
|
| Proceeds from sales of investment properties and Unconsolidated Real Estate Affiliates | 3,050,301 |
| | 62,007 |
| | 1,699,466 |
|
| Contributions to Unconsolidated Real Estate Affiliates | (218,038 | ) | | (120,356 | ) | | (135,906 | ) |
| Sale (acquisition) of marketable securities | — |
| | — |
| | 46,408 |
|
| Other, net | — |
| | — |
| | 662 |
|
| Net cash provided by (used in) investing activities | 2,697,130 |
| | (855,296 | ) | | 521,411 |
|
| Cash Flows used in Financing Activities: | |
| | |
| | |
|
| Proceeds from refinancing/issuance of mortgages, notes and loans payable | 7,031,647 |
| | 1,595,000 |
| | 908,479 |
|
| Principal payments on mortgages, notes and loans payable | (1,774,657 | ) | | (1,579,655 | ) | | (1,743,216 | ) |
| Deferred finance costs | (112,626 | ) | | (3,133 | ) | | (13,771 | ) |
| Issuances of Class C Stock | 200,000 |
| | — |
| | — |
|
| Stock Issuance Costs | (6,524 | ) | | — |
| | — |
|
| Treasury stock purchases | — |
| | (273,985 | ) | | (34,021 | ) |
| Proceeds from warrant exercises | — |
| | 551,196 |
| | — |
|
| Cash contributions from noncontrolling interests in consolidated real estate affiliates | 1,471,750 |
| | 15,258 |
| | — |
|
| Cash distributions paid to common stockholders | (9,873,248 | ) | | (1,020,018 | ) | | (680,712 | ) |
| Cash distributions to noncontrolling interests in consolidated real estate affiliates | (15,023 | ) | | (5,597 | ) | | (24,445 | ) |
| Cash distributions reinvested (DRIP) in common stock | 357 |
| | 1,020 |
| | 889 |
|
| Cash distributions paid to preferred stockholders | (19,920 | ) | | (15,936 | ) | | (15,935 | ) |
| Cash distributions and redemptions paid to holders of common units | (107,050 | ) | | (18,372 | ) | | (5,545 | ) |
| Other, net | (9,631 | ) | | 15,959 |
| | 44,163 |
|
| Net cash used in financing activities | (3,214,925 | ) | | (738,263 | ) | | (1,564,114 | ) |
| Effect on foreign exchange rates on cash and cash equivalents | — |
| | (819 | ) | | — |
|
| Net change in cash, cash equivalents and restricted cash | 66,754 |
| | (299,766 | ) | | 93,448 |
|
| Cash, cash equivalents and restricted cash at beginning of year | 231,939 |
| | 531,705 |
| | 438,257 |
|
| Cash, cash equivalents and restricted cash at end of year | $ | 298,693 |
| | $ | 231,939 |
| | $ | 531,705 |
|
Brookfield Property REIT Inc.
(Dollars in thousands, except per share amounts)
CONSOLIDATED STATEMENTS OF CASH FLOWS (Continued)
|
| | | | | | | | | | | |
| | Year Ended December 31, |
| | 2018 | | 2017 | | 2016 |
| Supplemental Disclosure of Cash Flow Information: | |
| | |
| | |
|
| Interest paid | $ | 595,435 |
| | $ | 548,833 |
| | $ | 567,137 |
|
| Interest capitalized | 20,840 |
| | 11,085 |
| | 5,257 |
|
| Income taxes paid | 3,015 |
| | 14,957 |
| | 4,150 |
|
| Accrued capital expenditures included in accounts payable and accrued expenses | 267,102 |
| | 219,317 |
| | 115,077 |
|
| Sale of Fashion Show (Refer to Note 3) | | | | | |
| Acquisition of Riverchase Galleria (Refer to Note 3) | | | | | |
| Acquisition of an additional interest in Miami Design District (Refer to Note 5) | | | | | |
| Acquisition of 522 Fifth Avenue (Refer to Note 3) | | | | | |
| Disposition of Lakeside (Refer to Note 3) | | | | | |
| Issuance of note collateralized by Riverchase Galleria and Tysons Galleria anchor box (Refer to Note 14) | | | | | |
| Acquisition and/or change of control at 218 West 57th Street, 530 Fifth Avenue and 685 Fifth Avenue (Refer to Note 3) | | | | | |
| Exercise of warrants (Note 8) | | | | | |
| | | | | | | | | | | | | | | | | |
| | Year Ended December 31, |
| | 2020 | | 2019 | | 2018 |
| Supplemental Disclosure of Cash Flow Information: | | | | | |
| Interest paid | $ | 644,802 | | | $ | 659,484 | | | $ | 595,435 | |
| Interest capitalized | 7,640 | | | 14,730 | | | 20,840 | |
| Income taxes paid | 7,716 | | | 8,743 | | | 3,015 | |
| | | | | |
| | | | | |
| Accrued capital expenditures included in accounts payable and accrued expenses | 272,080 | | | 301,096 | | | 267,102 | |
| | | | | |
| | | | | |
| | | | | |
| | | | | |
| | | | | |
| | | | | |
| | | | | |
| | | | | |
| | | | | |
| Cash paid for amounts included in the measurement of lease liabilities | 9,263 | | | 8,636 | | | 0 | |
| Recognition of right-of-use assets | 0 | | | 73,633 | | | 0 | |
| Lease liabilities arising from obtaining right-of-use lease asset | 0 | | | 73,633 | | | 0 | |
| Straight-line ground rent assets reclassed to right-of-use lease asset | 0 | | | 53,779 | | | 0 | |
| Straight-line ground rent liability reclassed to right-of-use lease asset | 0 | | | 3,817 | | | 0 | |
| Straight-line office rent liability reclassed to right-of-use lease asset | 0 | | | 3,599 | | | 0 | |
| Non-cash transfer of legal rights for Coronado Mall (Refer to Note 3) | 0 | | | 53,109 | | | 0 | |
| Non-cash satisfaction of notes receivable from joint venture partner (Refer to Note 3) | 0 | | | 250,000 | | | 0 | |
| Non-cash transfer of legal rights for Pembroke Lakes Mall (Refer to Note 3) | 0 | | | 33,849 | | | 0 | |
| Non-cash consideration of the ownership interest in Bridgewater Commons (Refer to Note 3) | 0 | | | 161,885 | | | 0 | |
| Non-cash US treasury securities transferred in connection with the defeasance of mortgage note payable and defeasance of mortgage note payable (Refer to Note 3) | 0 | | | 168,777 | | | 0 | |
| Non-cash contribution from noncontrolling interest | 0 | | | 31,687 | | | 0 | |
| Non-cash transfer of legal rights for Mall in Columbia (Refer to Note 3) | 45,500 | | | 0 | | | 0 | |
| | | | | |
| | | | | |
The accompanying notes are an integral part of these consolidated financial statements.
Brookfield Property REIT Inc.
NOTES TO CONSOLIDATED FINANCIAL STATEMENTS
(Dollars in thousands, except share and per share amounts)
NOTE 1 ORGANIZATION
GGP Inc., ("GGP” now known as Brookfield Property REIT Inc. or “BPR" and referred(referred to herein as "BPYU" or the "Company"), formerly known as GGP Inc. ("GGP"), a Delaware corporation, was organized in July 2010 and is an externally managed real estate investment trust referred to as a "REIT"("REIT").
On March 26, 2018, GGP and Brookfield Property Partners L.P. ("BPY") entered into an agreement and plan of merger (as amended by the amendment thereto dated June 25, 2018, the "Merger Agreement") pursuant to which BPY would acquire all of the shares of GGP common stock, par value $0.01 per share, that BPY and its affiliates did not already own through a series of transactions (collectively, the "BPY Transaction"), including, among other things, the exchange of all shares of GGP common stock owned by certain affiliates of BPY and any subsidiary of GGP for a newly authorized series of preferred stock of GGP designated Series B Preferred Stock (the "Class B Exchange") and the payment of a special dividend payable to certain holders of record of GGP common stock pursuant to the terms of the Merger Agreement (the "Pre-Closing Dividend").
On July 26, 2018, GGP obtained the requisite stockholder approval for the BPY Transaction at a special meeting of GGP stockholders. Therefore, on July 27, 2018, GGP effected the Class B Exchange by exchanging shares of GGP common stock owned by certain affiliates of BPY and any subsidiary of GGP into Series B Preferred Stock.
On August 27, 2018, pursuant to the Merger Agreement, the Pre-Closing Dividend and consideration was paid to all holders of record of GGP common stock (not including holders of GGP restricted stock, but including certain holders of GGP options who were deemed stockholders) on July 27, 2018 following the Class B Exchange. The Pre-Closing Dividend and consideration provided for the distribution of up to $23.50 in cash or a choice of either one BPY limited partnership unit ("BPY unit") or one share of newly authorized Class A Stock of BPR,BPYU, par value $0.01 per share ("Class A Stock"), subject to proration in each case, based on an aggregate cash consideration amount of $9.25 billion.
Pursuant to the Merger Agreement, on August 27, 2018, GGP’s certificate of incorporation was amended and restated (the "Charter Amendments") to, among other things, change the Company's name to Brookfield Property REIT Inc., authorize the issuance of Class A Stock, Class B-1 Stock, par value $0.01 per share ("Class B-1 Stock") and Class C Stock, par value $0.01 per share ("Class C Stock") and to provide the terms governing the Series B Preferred Stock and Class B-1 Stock (collectively, "Class B Stock"). In addition, the Company amended and restated its bylaws (the "Bylaws Amendments") and the agreement of limited partnership of GGP Operating Partnership, LP ("GGPOP"), a subsidiary of GGP that was renamed BPR OP, LP ("BPROP") (the "Amended BPR OP Partnership Agreement"). The Charter Amendments superseded the certificate of designations authorizing the Company's Series B Preferred stock, such that the Series B Preferred Stock remains outstanding but is referred to following the Charter Amendments as Class B Stock, having the rights, powers, preferences and other terms given to Class B Stock in the Charter Amendments.
Each share of Class A Stock was structured to provide its holder with an economic return that is equivalent to that of a BPY unit, including rights to identical distributions. Subsequent to the BPY Transaction, Class A stockholders have the right to exchange all or a portion of their Class A Stock for cash at a price equal to the value of an equivalent number of BPY units, subject to adjustment in the event of certain dilutive or other capital events by BPY or BPR. BP US REIT LLC (formerly known as Brookfield Properties, Inc.) ("BPUS"), an affiliate ofBPYU. BPY, has the option, but not the obligation, to settle any exchange requests by exchanging each share of Class A Stock for one BPY unit. All dividends to holders of Class A Stock will be paid prior and in preference to any dividends or distributions on the Class B Stock or Class C Stock or the common stock of BPR and will be fully declared and paid before any dividends are declared and paid or any other distributions are made on any Class B Stock or Class C Stock or the common stock of BPR.Stock. The holders of Class A Stock shall not be entitled to any dividends from BPRBPYU other than the Class A dividend.
Except as otherwise expressly provided in the Charter Amendments or as required by law, the holders of Class A Stock, Class B Stock and Class C Stock will vote together and not as separate classes. The holders of shares of each of Class B Stock and Class C Stock will be entitled to one vote for each share thereof held at the record date for the determination of stockholders entitled to vote on any matter. The holders of shares of Class A Stock will be entitled to one vote for each share thereof held at the record date for the determination of stockholders entitled to vote on any matter, except that holders of shares of Class A Stock will not be entitled to vote (i) on a liquidation or dissolution or conversion of the Class A Stock in connection with a market capitalization
Brookfield Property REIT INC.
NOTES TO CONSOLIDATED FINANCIAL STATEMENTS (Continued)
(Dollars in thousands, except share and per share amounts)
liquidation event (as described in the Charter Amendments), or (ii) to reduce the voting power of the Class B Stock or Class C Stock.
Brookfield Property REIT Inc.
NOTES TO CONSOLIDATED FINANCIAL STATEMENTS
(Dollars in thousands, except share and per share amounts)
BPYU is an indirect subsidiary of BPY, one of the world's largest commercial real estate companies. Although the BPY Transaction resulted in a change of control of the Company, BPRBPYU remains a reporting entity. Accordingly, the Company accounted for the BPY Transaction as an equity recapitalization transaction. The BPY Transaction resulted in the consummation of a series of recapitalization and financing transactions (see Note 6) and joint venture asset sales (see Note 3).
In these notes, the terms "we", "us" and "our" refer to BPRBPYU and its subsidiaries. BPR,BPYU, through its subsidiaries and affiliates, is an owner and operator of retail properties. As of December 31, 2018,2020, we are the owner, either entirely or with joint venture partners, of 124121 retail properties.
Substantially all of our business is conducted through BPROP, which we sometimes refer to herein as the Operating Partnership and its subsidiaries. As of December 31, 2018, BPR2020, BPYU held approximately 99% of the common equity of BPROP, while the remaining 1% was held by limited partners and certain previous contributors of properties to BPROP.
In addition to holding ownership interests in various joint ventures, the Operating Partnership generally conducts its operations through BPR REIT Services LLC. ("BPRRS"), Brookfield Properties Retail Inc. ("BPRI") and General Growth Management, Inc. ("GGMI"). Each of GGMI and BPRI is a taxable REIT subsidiary ("TRS"), which provides real estate management and leasing fees, development fees, financing fees for other ancillary services for a majority of our Unconsolidated Real Estate Affiliates (defined below) and for substantially all of our Consolidated Properties (defined below). BPRI also serves as a contractor to GGMI for these services. BPRRS generally provides financial, accounting, tax, legal, development, and other services to our Consolidated Properties.
We refer to our ownership interests in properties in which we own a majority or controlling interest and are consolidated under accounting principles generally accepted in the United States of America ("GAAP") as the "Consolidated Properties." We also own interests in certain properties through joint venture entities in which we own a noncontrolling interest ("Unconsolidated Real Estate Affiliates") and we refer to those properties as the "Unconsolidated Properties".
On January 4, 2021, Brookfield Asset Management Inc. ("Brookfield Asset Management" or "BAM") announced a proposal to BPY to acquire all of the limited partnership units of BPY that it does not already own ("BPY units") at a value of $16.50 per BPY unit, or $5.9 billion in total value (the "BAM Proposal"). Under the BAM Proposal, BPY unitholders would have the ability to elect to receive, per BPY unit, a combination of (i) 0.40 BAM Class A limited voting shares ("Brookfield Shares"), (ii) $16.50 in cash, and/or (iii) 0.66 of BPY preferred units with a liquidation preference of $25.00 per unit ("New Preferred Units"), subject in each case to pro-ration based on a maximum of $59.5 million Brookfield Shares (42% of the total value of BPY Units), maximum cash consideration of $2.95 billion (50% of the total value of BPY Units), and a maximum value of $500 million in New Preferred Units (8% of the total value of the Units. If unitholders collectively elect to receive in excess of $500 million in New Preferred Units, the amount of New Preferred Units can increase to a maximum of $1 billion, offset against the maximum amount of Brookfield Shares. The maximum amount of cash consideration would not be affected.
Under the BAM Proposal, holders of Class A stock would be entitled to receive the same per share consideration as BPY unitholders upon exchange of their shares into BPY units. It is also expected that the BPYU 6.375% Series A Cumulative Redeemable Preferred Stock would be redeemed at its par value of $25.00 per share in connection with the proposed transaction. The board of directors of the BPY General Partner has established a special committee to evaluate and respond to the BAM Proposal.
Brookfield Property REIT Inc.
NOTES TO CONSOLIDATED FINANCIAL STATEMENTS
(Dollars in thousands, except share and per share amounts)
NOTE 2 SUMMARY OF SIGNIFICANT ACCOUNTING POLICIES
Principles of Consolidation and Basis of Presentation
The accompanying consolidated financial statements include the accounts of BPR,BPYU, our subsidiaries and joint ventures in which we have a controlling interest. For consolidated joint ventures, the noncontrolling partner's share of the assets, liabilities and operations of the joint ventures (generally computed as the joint venture partner's ownership percentage) is included in noncontrolling interests in consolidated real estate affiliates as permanent equity of the Company. Intercompany balances and transactions have been eliminated. Noncontrolling interests are included on our Consolidated Balance Sheets related to the Common, Preferred, and LTIP Units of BPROP and are presented either as redeemable noncontrolling interests or as noncontrolling interests in our permanent equity. The Operating Partnership and each of our consolidated joint ventures are variable interest entities as the limited partners do not have substantive kick-out rights or substantive participating rights. However, as the Company holds a majority voting interest in the Operating Partnership and our consolidated joint ventures, it qualifies for the exemption from providing certain of the disclosure requirements associated with variable interest entities.
We operate in a single reportable segment, which includes the operation, development and management of retail and other rental properties. Our portfolio is targeted to a range of market sizes and consumer tastes. Each of our operating properties is considered a separate operating segment, as each property earns revenues and incurs expenses, individual property operating results are reviewed and discrete financial information is available. The Company's chief operating decision maker is comprised of a team of several members of executive management who use property operations in assessing segment operating performance. We do not distinguish or group our consolidated operations based on geography, size or type for purposes of making property operating decisions. Our operating properties have similar economic characteristics and provide similar products and services to our tenants. There are no individual operating segments that are greater than 10% of combined revenue or combined assets. When assessing segment operating performance, certain non-cash and non-comparable items such as straight-line rent, depreciation expense and intangible asset and liability amortization, are excluded from property operations, which are a result of our emergence, acquisition
Brookfield Property REIT INC.
NOTES TO CONSOLIDATED FINANCIAL STATEMENTS (Continued)
(Dollars in thousands, except share and per share amounts)
accounting and other capital contribution or restructuring events. Further, all material operations are within the United States and no customer or tenant comprises more than 10% of consolidated revenues. As a result, the Company's operating properties are aggregated into a single reportable segment.
Properties
Real estate assets are stated at cost less any provisions for impairments. Expenditures for significant betterments and improvements are capitalized. Maintenance and repairs are charged to expense when incurred. Construction and improvement costs incurred in connection with the development of new properties or the redevelopment of existing properties are capitalized. Real estate taxes, interest costs, and internalinitial direct costs associated with leasing and development overhead incurred during construction periods are capitalized. Capitalization is based on qualified expenditures and interest rates. Capitalized real estate taxes, interest costs, and internalinitial direct costs associated with leasing and development overhead are amortized over lives which are consistent with the related assets.
Pre-development costs, which generally include legal and professional fees and other third-party costs directly related to the construction assets, are capitalized as part of the property being developed. In the event a development is no longer deemed to be probable of occurring, the capitalized costs are expensed (see also our impairment policies in this note below).
We periodically review the estimated useful lives of our properties, and may adjust them as necessary. The estimated useful lives of our properties range from 10-45 years.
Depreciation or amortization expense is computed using the straight-line method based upon the following estimated useful lives:
|
| | | | |
| Years |
| Buildings and improvements | 10 - 45 |
| Equipment and fixtures | 3 - 20 |
| Tenant improvements | Shorter of useful life or applicable lease term |
Brookfield Property REIT Inc.
Certain prior period amounts includedNOTES TO CONSOLIDATED FINANCIAL STATEMENTS
(Dollars in prepaid expensesthousands, except share and other assets of $21.1 million and deferred tax liabilities of $2.4 million in the Consolidated Balance Sheets have been reclassified to deferred tax assets, net as of December 31, 2017.per share amounts)
Acquisitions of Operating Properties (Note 3)
Acquisitions of properties are typically accounted for as acquisitions of assets rather than acquisitions of a business. Accordingly, the results of operations of acquired properties have been included in the results of operations from the respective dates of acquisition and acquisition costs are capitalized. Estimates of future cash flows and other valuation techniques are used to allocate the purchase price of acquired property between land, buildings and improvements, equipment, assumed debt liabilities and identifiable intangible assets and liabilities such as amounts related to in-place tenant leases, acquired above and below-market tenant and ground leases, and tenant relationships.
The fair values of tangible assets are determined on an "if vacant" basis. The "if vacant" fair value is allocated to land, where applicable, buildings, equipment and tenant improvements based on comparable sales and other relevant information with respect to the property. Specifically, the "if vacant" value of the buildings and equipment was calculated using a cost approach utilizing published guidelines for current replacement cost or actual construction costs for similar, recently developed properties; and an income approach. Assumptions used in the income approach to the value of buildings include: capitalization and discount rates, lease-up time, market rents, make ready costs, land value, and site improvement value.
The estimated fair value of in-place tenant leases includes lease origination costs (the costs we would have incurred to lease the property to the current occupancy level of the property) and the lost revenues during the period necessary to lease-up from vacant to the current occupancy level. Such estimates include the fair value of leasing commissions, legal costs and tenant coordination costs that would be incurred to lease the property to this occupancy level. Additionally, we evaluate the time period over which
Brookfield Property REIT INC.
NOTES TO CONSOLIDATED FINANCIAL STATEMENTS (Continued)
(Dollars in thousands, except share and per share amounts)
such occupancy level would be achieved and include an estimate of the net operating costs (primarily real estate taxes, insurance and utilities) incurred during the lease-up period, which generally ranges up to one year. The fair value of acquired in-place tenant leases is included in the balance of buildings and equipment and amortized over the remaining lease term for each tenant.
Identifiable intangible assets and liabilities are calculated for above-market and below-market tenant and ground leases where we are either the lessor or the lessee. The difference between the contractual rental rates and our estimate of market rental rates is measured over a period equal to the remaining non-cancelable term of the leases, including significantly below-market renewal options for which exercise of the renewal option appears to be reasonably assured. The remaining term of leases with renewal options at terms significantly below market reflect the assumed exercise of such below-market renewal options and assume the amortization period would coincide with the extended lease term.
The gross asset balances of the in-place value of tenant leases are included in buildings and equipment in our Consolidated Balance Sheets.
| | | | | | | | | | | | | | | | | |
| Gross Asset | | Accumulated
Amortization | | Net Carrying
Amount |
| As of December 31, 2020 | | | | | |
| Tenant leases: | | | | | |
| In-place value | $ | 302,296 | | | $ | (107,210) | | | $ | 195,086 | |
| As of December 31, 2019 | | | | | |
| Tenant leases: | | | | | |
| In-place value | $ | 311,838 | | | $ | (72,658) | | | $ | 239,180 | |
|
| | | | | | | | | | | |
| | Gross Asset | | Accumulated Amortization | | Net Carrying Amount |
| As of December 31, 2018 | |
| | |
| | |
|
| Tenant leases: | |
| | |
| | |
|
| In-place value | $ | 188,140 |
| | $ | (86,510 | ) | | $ | 101,630 |
|
| As of December 31, 2017 | |
| | |
| | |
|
| Tenant leases: | |
| | |
| | |
|
| In-place value | $ | 347,232 |
| | $ | (181,088 | ) | | $ | 166,144 |
|
The above-market tenant leases and below-market ground leases are included in prepaid expenses and other assets (Note 15)14); the below-market tenant leases above-market ground leases and above-market headquarters office lease are included in accounts payable and accrued expenses (Note 16)15) in our Consolidated Balance Sheets.
Brookfield Property REIT Inc.
NOTES TO CONSOLIDATED FINANCIAL STATEMENTS
(Dollars in thousands, except share and per share amounts)
Amortization/accretion of all intangibles, including the intangibles in Note 1514 and Note 16,15, had the following effects on our income from continuing operations:
| | | | | | | | | | | | | | | | | |
| | Year Ended December 31, |
| | 2020 | | 2019 | | 2018 |
| Amortization/accretion effect on continuing operations | $ | (76,029) | | | $ | (14,101) | | | $ | (48,655) | |
|
| | | | | | | | | | | |
| | Year Ended December 31, |
| | 2018 | | 2017 | | 2016 |
| Amortization/accretion effect on continuing operations | $ | (48,655 | ) | | $ | (74,802 | ) | | $ | (86,979 | ) |
Future amortization/accretion of all intangibles, including the intangibles in Note 1514 and Note 1615 is estimated to decrease results from continuing operations as follows:
| | | | | | | | |
| Year | | Amount |
| 2021 | | $ | 41,692 | |
| 2022 | | 31,333 | |
| 2023 | | 23,933 | |
| 2024 | | 19,798 | |
| 2025 | | 17,225 | |
|
| | | | |
| Year | | Amount |
| 2019 | | $ | 21,490 |
|
| 2020 | | 15,116 |
|
| 2021 | | 10,239 |
|
| 2022 | | 9,413 |
|
| 2023 | | 9,084 |
|
Marketable Securities
Marketable securities are comprised of equity securities that are classified as available-for-sale. Available-for-sale securities are presented in prepaid expenses and other assets on our Consolidated Balance Sheets at fair value. Unrealized gains and losses resulting from the mark-to-market of these securities are included in other comprehensive income. Realized gains and losses are recognized in earnings only upon the sale of the securities and are recorded based on the weighted average cost of such securities.
Brookfield Property REIT INC.
NOTES TO CONSOLIDATED FINANCIAL STATEMENTS (Continued)
(Dollars in thousands, except share and per share amounts)
During the year ended December 31, 2016, we recognized gains of $13.1 million in management fees and other corporate revenues on the Consolidated Statements of Operations and Comprehensive Income from the sale of Seritage Growth Properties stock.
Investments in Unconsolidated Real Estate Affiliates (Note 5)
We account for investments in joint ventures where we own a non-controlling joint interest using either the equity method or the cost method. If we have significant influence but not control over the investment, we utilize the equity method. If we have neither control nor significant influence, we utilize the cost method. Under the equity method, the cost of our investment is adjusted for our share of the earnings of such Unconsolidated Real Estate Affiliates from the date of acquisition, increased by our contributions and reduced by distributions received. Under the cost method, the cost of our investment is not adjusted for our share of the earnings of such Unconsolidated Real Estate Affiliates from the date of acquisition and distributions are treated as earnings when received.
To determine the method of accounting for partially owned joint ventures, we evaluate the characteristics of associated entities and determine whether an entity is a variable interest entity ("VIE"). A limited partnership or other similar entity is considered a VIE unless a simple majority of limited partners (excluding limited partners that are under common control with the general partner) have substantive kick-out rights or participating rights. Accounting guidance amended the following: (i) modified the evaluation of whether limited partnerships and similar legal entities are VIEs or voting interest entities, (ii) eliminated the presumption that a general partner should consolidate a limited partnership, (iii) affected the consolidation analysis of reporting entities that are involved with VIEs, and (iv) provided a scope exception for certain entities. If an entity is determined to be a VIE, we determine which party is the primary beneficiary by analyzing whether we have both the power to direct the entity's significant economic activities and the obligation to absorb potentially significant losses or receive potentially significant benefits. Significant judgments and assumptions inherent in this analysis include the nature of the entity's operations, future cash flow projections, the entity's financing and capital structure, and contractual relationship and terms.
Primary risks associated with our VIEs include the potential of funding the entities' debt obligations or making additional contributions to fund the entities' operations.
Generally, the operating agreements with respect to our Unconsolidated Real Estate Affiliates provide that assets, liabilities and funding obligations are shared in accordance with our ownership percentages. Therefore, we generally also share in the profit and losses, cash flows and other matters relating to our Unconsolidated Real Estate Affiliates in accordance with our respective ownership percentages. Except for Retained Debt (as described in Note 5), differences between the carrying amount of our investment in the Unconsolidated Real Estate Affiliates and our share of the underlying equity of our Unconsolidated Real Estate Affiliates are typically amortized over lives ranging from 5 to- 45 years. When cumulative distributions exceed our investment in the joint venture, the investment is reported as a liability in our consolidated financial statements. The liability is limited to our maximum potential obligation to fund contractual obligations, including recourse related to certain debt obligations.
Partially owned joint ventures over which we have controlling financial interest are consolidated in our consolidated financial statements. In determining if we have a controlling financial interest, we consider factors such as ownership interest, authority to make decisions, kick-out rights and substantive participating rights. Partially owned joint ventures where we do not have a controlling financial interest, but have the ability to exercise significant influence, are accounted for using the equity method.
Brookfield Property REIT Inc.
NOTES TO CONSOLIDATED FINANCIAL STATEMENTS
(Dollars in thousands, except share and per share amounts)
To the extent that we contribute assets to a joint venture accounted for using the equity method, our investment in the joint venture is recorded at the fair value of the consideration of the assets that were contributed to the joint venture. We will recognize gains and losses on the contribution of our real estate to joint ventures, relating to our entire investment in the property, to the extent the buyer is independent of the Company, the collection of the sales price is reasonably assured, and we will not be required to support the operations of the property or its related obligations to an extent greater than our proportionate interest.
The combined summarized financial information of unconsolidated joint ventures is disclosed in Note 5 to the Consolidated Financial Statements.5.
We continually analyze and assess reconsideration events, including changes in the factors mentioned above, to determine if the consolidation treatment remains appropriate. Decisions regarding consolidation of partially owned entities frequently require significant judgment by our management.
Brookfield Property REIT INC.
NOTES TO CONSOLIDATED FINANCIAL STATEMENTS (Continued)
(Dollars in thousands, except share and per share amounts)
Cash and Cash Equivalents
Highly-liquid investments with initial maturities of three months or less are classified as cash equivalents, excluding amounts restricted by certain lender and other agreements.
Leases
Our leases, in which we are the lessor or lessee, are substantially all accounted for as operating leases. Leases in which we are the lessor that transfer substantially all the risks and benefits of ownership to tenants are considered finance leases and the present values of the minimum lease payments and the estimated residual values of the leased properties, if any, are accounted for as receivables. Leases in which we are the lessee that transfer substantially all the risks and benefits of ownership to us are considered capital leases and the present values of the minimum lease payments are accounted for as assets and liabilities.
Tenant improvements, either paid directly or in the form of construction allowances paid to tenants, are capitalized as buildings and equipment and depreciated over the shorter of the useful life or the applicable lease term.
In leasing tenant space, we may provide funding to the lessee through a tenant allowance. In accounting for a tenant allowance, we determine whether the allowance represents funding for the construction of leasehold improvements and evaluate the ownership of such improvements. If we are considered the owner of the leasehold improvements, we capitalize the amount of the tenant allowance and depreciate it over the shorter of the useful life of the leasehold improvements or the related lease term. If the tenant allowance represents a payment for a purpose other than funding leasehold improvements, or in the event we are not considered the owner of the leasehold improvements, the allowance is capitalized to deferred expenses and considered to be a lease incentive and is recognized over the lease term as a reduction of rental revenue on a straight-line basis.
Deferred Expenses
Deferred expenses primarily consist of leasing commissions and related costs and are amortized using the straight-line method over the life of the leases.
Revenue Recognition and Related Matters
Minimum rents are recognized on a straight-line basis over the terms of the related operating leases, including the effect of any free rent periods. Minimum rents also include lease termination income collected from tenants to allow for the tenant to vacate their space prior to their scheduled termination dates, as well as accretion related to above-market and below-market tenant leases on acquired properties and properties that were recorded at fair value at the emergence from bankruptcy. The following is a summary of amortization of straight-line rent, net amortization/accretion related to above-market and below-market tenant leases and termination income, which is included in minimum rents:
|
| | | | | | | | | | | |
| | Year Ended December 31, |
| | 2018 | | 2017 | | 2016 |
| Amortization of straight-line rent | $ | (2,425 | ) | | $ | 2,084 |
| | $ | 11,867 |
|
| Net amortization/accretion of above and below-market tenant leases | (3,259 | ) | | (23,963 | ) | | (33,639 | ) |
| Lease termination income | 31,297 |
| | 29,081 |
| | 16,021 |
|
The following is a summary of straight-line rent receivables, which are included in accounts receivable, net in our Consolidated Balance Sheets and are reduced for allowances and amounts doubtful of collection:
|
| | | | | | | |
| | December 31, 2018 | | December 31, 2017 |
| Straight-line rent receivables, net | $ | 136,007 |
| | $ | 231,290 |
|
Brookfield Property REIT INC.
NOTES TO CONSOLIDATED FINANCIAL STATEMENTS (Continued)
(Dollars in thousands, except share and per share amounts)
Overage rent is paid by a tenant when the tenant's sales exceed an agreed upon minimum amount and is recognized on an accrual basis once tenant sales exceed contractual tenant lease thresholds and is calculated by multiplying the sales in excess of the minimum amount by a percentage defined in the lease.
Tenant recoveries are established in the leases or computed based upon a formula related to real estate taxes, insurance and other property operating expenses and are generally recognized as revenues in the period the related costs are incurred.
Accounting for real estate sales distinguishes between sales to a customer or non-customer for purposes of revenue recognition. Once we, as the seller, determine that we have a contract, we will identify each distinct non-financial asset promised to the counter-party and whether the counter-party obtains control and transfers risks and rewards of ownership of each non-financial asset to determine if we should derecognize the asset.
Notes receivable are evaluated for impairment at least quarterly. Impairment occurs when it is deemed probable that we will not be able to collect all amounts due according to the contractual terms of the loan. If a loan is considered to be impaired, we record an allowance through the provision for loan losses to reduce the carrying value of the loan to the present value of expected future cash flows discounted at the loan’s contractual effective rate or the fair value of the collateral, if repayment is expected solely from the collateral.
We provide an allowance for doubtful accounts against the portion of accounts receivable, net including straight-line rents, which is estimated to be uncollectible.uncollectible, which includes a portfolio based reserve and reserves for specific disputed amounts. Such allowances are reviewed each period based upon our recovery experience and the specific facts of each outstanding amount. The following table summarizes the changes in allowance for doubtful accounts:
| | | | | | | | | | | | | | | | | |
| | 2020 | | 2019 | | 2018 |
| Balance as of January 1, | $ | 27,825 | | | $ | 19,657 | | | $ | 19,457 | |
| Provision for doubtful accounts (1) | 71,083 | | | 15,728 | | | 14,309 | |
| | | | | |
| Write-offs | (28,880) | | | (7,560) | | | (14,109) | |
| Balance as of December 31, | $ | 70,028 | | | $ | 27,825 | | | $ | 19,657 | |
(1) Excludes recoveries of $1.6 million, $4.7 million and $2.2 million for the years ended December 31, 2020, 2019 and 2018, respectively.
Leases (Note 7)
We have entered into lease arrangements for the land and buildings at certain properties, as well as for the use of office space in Chicago, Illinois. We account for leases under ASC 842, Leases ("the new leasing standard"). We elected to use the "package of
Brookfield Property REIT Inc.
NOTES TO CONSOLIDATED FINANCIAL STATEMENTS
(Dollars in thousands, except share and per share amounts)
|
| | | | | | | | | | | |
| | 2018 | | 2017 | | 2016 |
| Balance as of January 1, | $ | 19,457 |
| | $ | 17,883 |
| | $ | 14,654 |
|
| Provision for doubtful accounts (1) | 14,309 |
| | 13,594 |
| | 10,534 |
|
| Write-offs | (14,109 | ) | | (12,020 | ) | | (7,305 | ) |
| Balance as of December 31, | $ | 19,657 |
| | $ | 19,457 |
| | $ | 17,883 |
|
| |
(1) | Excludes recoveries of $2.2 million, $2.9 million and $2.4 million for the years ended December 31, 2018, 2017 and 2016, respectively. |
The new leasing standard requires lessees to record a right-of-use ("ROU") asset and a related lease liability for the rights and obligations associated with all lessee leases. ASC 842 also modified the lease classification criteria through the elimination of "bright-line" tests, the removal of historical real estate specific lease provisions, and changes to lessor accounting to align with the new revenue recognition standard ASC 606, Revenue from Contracts with Customers.
In addition to the "package of practical expedients", we elected to use the following additional practical expedients permitted by the new leasing standard:
•The transition practical expedient that allows us to carry forward our historical accounting treatment for land easements on existing agreements.
•The short-term lease election that allows a lessee not to apply the balance sheet recognition requirements to leases with a term of 12 months or less; lease payments associated with these leases are recognized on a straight-line basis as an expense over the lease term and are not material.
•The practical expedient which allows a lessee to not separate lease and non-lease components. We have elected to apply this election to all classes of underlying assets.
•The Company did not elect to apply the practical expedients related to hindsight or assessing impairment of ROU assets.
Lessee arrangements
To account for leases for which we are the lessee under the new leasing standard, contracts must be analyzed upon inception to determine if the arrangement is, or contains, a lease. A lease conveys the right to control the use of an identified asset for a period of time in exchange for consideration. Lease classification tests and measurement procedures are performed at the lease commencement date. Differences in lease classification will affect only the pattern and classification of expense recognition in our Consolidated Statements of Operations and Comprehensive Income (Loss).
The lease liability is initially measured as the present value of the lease payments over the lease term, discounted using the interest rate implicit in the lease, if that rate is readily determinable; otherwise, the lessee’s incremental borrowing rate is used. The lease liability balance is subsequently amortized using the effective interest method. The incremental borrowing rate is determined using an approach based on the rate of interest that the lessee would pay to borrow on a collateralized basis over a similar term at an amount equal to the lease payments in a similar economic environment. We utilized a market-based approach to estimate the IBR for each individual lease. Therefore, we utilized different data sets to estimate base IBRs via an analysis of (i) yields on outstanding public debt of BPYU, as well as comparable companies, (ii) observable mortgage rates, and (iii) unlevered property yields and discount rates. We then applied adjustments to account for considerations related to (i) term and (ii) security that may not be fully incorporated by the aforementioned data sets. Based on individual characteristics of each lease, we selected an IBR taking into consideration how each data approach and adjustments thereto incorporate term, currency and security.
The lease term is the noncancelable period of the lease, and includes any renewal and termination options we are reasonably certain to exercise. The reasonably certain threshold is evaluated at lease commencement and is typically met if substantial economic incentives or termination penalties are identified.
Lease payments measured at the commencement date include fixed payments, in-substance fixed payments, variable lease payments dependent on a rate or index (using the index or rate in effect at lease commencement), any purchase option the lessee is reasonably certain to exercise, and payments of penalties for terminating the lease if the lease term reflects the lessee exercising the termination option. Fully variable lease payments without an in-substance fixed component are not included in the measurement of the lease liability and are recognized in the period in which the underlying contingency is resolved.
The lease liability is remeasured when the contract is modified, upon the resolution of a contingency such that variable payments become fixed or if our assessment of exercising an extension, termination or purchase option changes. Once remeasured, an adjustment is made to the ROU asset. However, if the carrying amount of the right-of-use asset is reduced to zero, any remaining amount of the remeasurement is recognized in earnings.
Brookfield Property REIT Inc.
NOTES TO CONSOLIDATED FINANCIAL STATEMENTS
(Dollars in thousands, except share and per share amounts)
The ROU asset balance is initially measured as the lease liability amount, adjusted for any lease payments made prior to the commencement date, initial direct costs, estimated costs to dismantle, remove, or restore the underlying asset and incentives received.
Our current lessee lease portfolio is comprised primarily of operating leases. If we enter into a finance lease, the new leasing standard requires us to initially recognize and measure these leases using the same method as described above for operating leases. Subsequent to initial recognition, each lease payment would be allocated between interest expense and a reduction of the lease liability. This expense would be recognized over the lease term using the interest method to produce a constant periodic rate of interest on the remaining balance of the liability for each period and would be included in interest expense in our Consolidated Statements of Operations and Comprehensive Income (Loss). The ROU asset would be amortized on a straight-line basis over the lease term, with depreciation recorded in depreciation and amortization in our Consolidated Statements of Operations and Comprehensive Income (Loss).
The ROU assets in our operating leases are evaluated for impairment in a manner similar to our operating properties, as described below under "Impairment".
Lessor arrangements
At the inception of a new lease arrangement, including new leases that arise from amendments, we assess the terms and conditions to determine the proper lease classification. When the terms of a lease effectively transfer control of the underlying asset, the lease is classified as a sales-type lease. When a lease does not effectively transfer control of the underlying asset to the lessee, but we obtain a guarantee for the value of the asset from a third party, we classify the lease as a direct financing lease. All other leases are classified as operating leases. Control of the underlying asset is transferred to the lessee if any of the following criteria are met: (i) transfer of ownership to the lessee prior to or shortly after the end of the lease term, (ii) lessee has an option to purchase the underlying property that the lessee is reasonably certain to exercise, (iii) the lease term is for the major part of the underlying property’s remaining economic life, (iv) the present value of the sum of lease payments and any residual value guaranteed by the lessee that is not already reflected in the lease payments is equal to or exceeds substantially all of the fair value of the leased property or (v) the underlying property is of such a specialized nature that it is expected to have no alternative use at the end of the lease term. As of December 31, 2020 and 2019, we do not have any material sales-type or direct financing leases.
For operating leases with minimum scheduled rent increases, we recognize rental income on a straight‑line basis, including the effect of any free rent periods, over the lease term when collectability of lease payments (and, if applicable, any amounts necessary to satisfy a residual value guarantee) is probable. Variable lease payments are recognized as rental income in the period when the changes in facts and circumstances on which the variable lease payments are based occur. Variable lease payments include overage rent, which is paid by a tenant when the tenant's sales exceed an agreed upon minimum amount, is recognized once tenant sales exceed contractual tenant lease thresholds and is calculated by multiplying the sales in excess of the minimum amount by a percentage defined in the lease.
Our leases also contain provisions for tenants to reimburse us for real estate taxes and insurance, as well as for other property operating expenses, marketing costs, and utilities, which are considered to be non-lease components. These tenant reimbursements are most often established in the leases or in less frequent cases computed based upon a formula. We have elected the practical expedient to not separate non-lease components from the lease component for all classes of underlying assets and determined that the lease component is the predominant component in the contract; therefore, these recoveries are recognized in a manner similar to minimum rents and variable rents within rental revenues on our Consolidated Statements of Operations and Comprehensive Income (Loss).
Recognizing rental and related income on a straight-line basis results in a difference in the timing of revenue recognition from what is contractually due from tenants. Straight-line rents are recorded in accounts receivable, net in our Consolidated Balance Sheet. The Company is required to evaluate whether it is probable of collecting substantially all of the remaining lease payments. While we believe our leases generally contain provisions designed to ensure the creditworthiness of the tenant, companies in the retail industry, including some of our tenants, have declared bankruptcy, or from time to time, have voluntarily ceased their operations, downsized their brick and mortar presence or failed to comply with their contractual obligations to us and to others. While many of these tenants intend to exit the Chapter 11 bankruptcy process and resume
Brookfield Property REIT Inc.
NOTES TO CONSOLIDATED FINANCIAL STATEMENTS
(Dollars in thousands, except share and per share amounts)
operations, the outcomes of such proceedings are uncertain. We do evaluate the potential of bankruptcy and associated store closures when assessing whether the Company is probable of collecting substantially all of the remaining lease payments.
For leases where collectability of substantially all of the lease payments is probable, we establish a general allowance for doubtful accounts against the portion of accounts receivable, net, including straight-line rents, which is estimated to be uncollectible due to credit-related losses based on our previous recovery experience. Lease concessions are generally considered a lease modification and thus are recognized prospectively over the remaining lease term when they become legally enforceable. However, the Company does include its estimate of potential lease concessions when establishing its general allowance, based on its best estimates of total lease concessions, recognizing the portion of the total concession that is deemed attributable to the current period through consideration of weighted average remaining lease terms. Changes in the general allowance are recognized in rental income on our Consolidated Statements of Operations and Comprehensive Income (Loss).
For leases where we determine that collectability of substantially all the remaining lease payments is not probable, the Company recognizes a current-period adjustment to rental income to the amount of cash collected from the lessee, effectively reducing cumulative income recognized since lease commencement from an accrual basis to cash basis. In addition, future revenue recognition is limited to amounts paid by the lessee. We will generally return to an accrual basis of accounting, if and when, all delinquent payments become current under the terms of the lease agreement and collectability of substantially all the remaining contractual lease payments is probable.
With respect to our consolidated properties, for the years ended December 31, 2020 and 2019, we have recorded $42.3 million and $8.2 million, respectively, associated with potentially uncollectible revenues, which includes $5.3 million and $0.1 million, respectively, for straight-line rent receivables. With respect to our Unconsolidated Real Estate Affiliates, for the years ended December 31, 2020 and 2019, our Unconsolidated Real Estate Affiliates have recorded $68.7 million and $11.3 million. respectively, associated with potentially uncollectible revenues, which includes $8.6 million and $0.2 million, respectively, for straight-line rent receivables. Of these amounts for the years ended December 31, 2020 and 2019, our share totaled $33.8 million and $6.0 million, respectively, which includes $4.2 million and $0.1 million, respectively, for straight-line rent receivables.
As of December 31, 2020, the Company, including consideration of our share of Unconsolidated Real Estate Affiliates, has collected approximately 75% of rents for the year then ended, and collections continue to increase subsequent to year end. While working to preserve our profitability and cash flow, we are also working with our tenants regarding requests for lease concessions and other forms of assistance. The Company continues to make meaningful progress in its negotiations with national and local tenants to secure rental payments, despite a significant portion of the Company’s tenants requesting rental assistance, whether in the form of deferral or rent reduction. As of December 31, 2020, in response to the COVID-19 pandemic, the Company granted rent deferrals and rent abatements of 4% and 5% of 2020 rents, respectively. The rent abatements granted were considered lease modifications and will be recognized prospectively over the remaining lease terms from the period of the rent that was abated. While we anticipate that we may grant further rent concessions, such as the deferral or abatement of lease payments, such rent concession requests are evaluated on a case-by-case basis. Not all requests for rent relief will be granted as the Company does not intend to forgo its legally enforceable contractual rights that exist under its lease agreements.
Rental revenues also includes lease termination income collected from tenants to allow for the tenant to vacate their space prior to their scheduled termination dates, as well as accretion related to above-market and below-market tenant leases on acquired properties and properties that were recorded at fair value upon acquisition.
In leasing tenant space, we may provide funding to the lessee through a tenant allowance. To account for a tenant allowance, we determine whether the allowance represents funding for the construction of leasehold improvements and evaluate the control and ownership of such improvements. If we are considered the owner of the leasehold improvements, we capitalize the amount of the tenant allowance and depreciate it over the shorter of the useful life of the leasehold improvements or the related lease term. If the tenant allowance represents a payment for a purpose other than funding leasehold improvements, or in the event we are not considered the owner of the leasehold improvements, the allowance is capitalized to deferred expenses and considered to be a lease incentive and is recognized over the lease term as a reduction of rental revenue on a straight-line basis.
Brookfield Property REIT Inc.
NOTES TO CONSOLIDATED FINANCIAL STATEMENTS
(Dollars in thousands, except share and per share amounts)
The following is a summary of amortization of straight-line rent, net amortization/accretion related to above-market and below-market tenant leases and termination income, which is included in rental revenues:
| | | | | | | | | | | | | | | | | |
| | Year Ended December 31, |
| | 2020 | | 2019 | | 2018 |
| Amortization of straight-line rent | $ | 41,885 | | | $ | 8,488 | | | $ | (2,425) | |
| Net amortization/accretion of above and below-market tenant leases | 15,352 | | | 22,037 | | | (3,259) | |
| Lease termination income | 8,123 | | | 13,235 | | | 31,297 | |
The following is a summary of straight-line rent receivables, which are included in accounts receivable, net in our Consolidated Balance Sheets and are reduced for allowances and amounts doubtful of collection:
| | | | | | | | | | | |
| December 31, 2020 | | December 31, 2019 |
| Straight-line rent receivables, net | $ | 182,228 | | | $ | 142,791 | |
Deferred expenses
The new leasing standard defines initial direct costs as incremental costs of a lease that would not have been incurred if the lease had not been obtained. These initial direct costs (consisting primarily of leasing commissions paid to third parties) are recognized as deferred expenses on our Consolidated Balance Sheets and are amortized using the straight-line method over the life of the leases. Other leasing costs which do not meet the definition of initial direct costs (consisting primarily of internal legal and leasing overhead costs) are expensed as incurred and included in property management and other costs in our Consolidated Statements of Operations and Comprehensive Income (Loss).
Management Fees and Other Corporate Revenues
Management fees and other corporate revenues primarily represent real estate management and leasing fees, development fees, financing fees and fees for other ancillary services performed for the benefit of certain of the Unconsolidated Real Estate Affiliates. Management fees are reported at 100% of the revenue earned from the joint venture in management fees and other corporate revenues on our Consolidated Statements of Operations and Comprehensive Income.Income (Loss). Our share of the management fee expense incurred by the Unconsolidated Real Estate Affiliates is reported within equity in income of Unconsolidated Real Estate Affiliates on our Consolidated Statements of Operations and Comprehensive Income (Loss) and in property management and other costs in the Condensed Combined Statements of Income in Note 5.
The following table summarizes the management fees from affiliates and our share of the management fee expense: | | | | | | | | | | | | | | | | | |
| | Year Ended December 31, |
| | 2020 | | 2019 | | 2018 |
| Management fees from affiliates | $ | 125,482 | | | $ | 164,096 | | | $ | 125,555 | |
| Management fee expense | (36,100) | | | (48,595) | | | (46,953) | |
| Net management fees from affiliates | $ | 89,382 | | | $ | 115,501 | | | $ | 78,602 | |
|
| | | | | | | | | | | |
| | Year Ended December 31, |
| | 2018 | | 2017 | | 2016 |
| Management fees from affiliates (1) | $ | 125,555 |
| | $ | 97,136 |
| | $ | 82,742 |
|
| Management fee expense | (46,953 | ) | | (38,166 | ) | | (33,049 | ) |
| Net management fees from affiliates | $ | 78,602 |
| | $ | 58,970 |
| | $ | 49,693 |
|
| |
(1) | Excludes $8.0 million in corporate fees earned during the year ended December 31, 2017 and a $13.1 million gain recognized in management fees and other corporate revenues on the divestiture of our investment in Seritage Growth Properties during the year ended December 31, 2016. |
Brookfield Property REIT INC.
NOTES TO CONSOLIDATED FINANCIAL STATEMENTS (Continued)
(Dollars in thousands, except share and per share amounts)
Based upon the new revenue recognition guidance adopted on January 1, 2018, we determined that typical management fees including property and asset management, construction and development management services, leasing services, property acquisition and disposition services and financing services, needed to be evaluated for each separate performance obligation included in the contract in order to determine timing of revenue recognition. Revenues from contracts within the scope of the new revenue recognition guidance were $120.5 million, $157.4 million and $122.7 million for the yearyears ended December 31, 2018.2020, 2019 and 2018, respectively. Management determined that property and asset management and construction and development management services each represent a series of stand-ready performance obligations satisfied over time with each day of service being a distinct performance obligation. For property and asset management services, we are compensated for our services through a monthly management fee earned based on a specified percentage of the monthly rental income or rental receipts generated from the property under management. For construction and development services, we are compensated for planning, administering and monitoring the design and construction of projects at our joint venture properties typically based on
Brookfield Property REIT Inc.
NOTES TO CONSOLIDATED FINANCIAL STATEMENTS
(Dollars in thousands, except share and per share amounts)
a percentage of project costs, hourly rate of development staff or a fixed fee. Revenues from such contracts were $101.1 million, $126.9 million and $104.8 million for the yearyears ended December 31, 2020, 2019 and 2018, respectively, and are recognized over the life of the applicable contract.
Conversely, leasing services, property acquisition and disposition services and financing services are each considered to be a single performance obligation, satisfied as of a point in time. Our fee is paid upon the occurrence of certain contractual event(s) that may be contingent and pattern of revenue recognition may differ from the timing of payment. For these services, the obligation is the execution of the lease, closing of the sale or acquisition, or closing of the financing or refinancing. As such, revenues are recognized at the point in time when the respective obligation has been satisfied. Revenues from such contracts were $19.3 million, $30.5 million and $17.8 million for the yearyears ended December 31, 2018.2020, 2019 and 2018, respectively.
Management Fee Expense
Following the BPY Transaction, certain Brookfield Asset Management Inc. ("BAM:)-ownedBAM owned entities provide certain management and administration services to BPR. BPR willBPYU. BPYU and its affiliates pay an annual basea management fee to BAM equal to 1.25% of the totalbased on market capitalization of BPR, subject to certain adjustments.and metrics defined by management. For the first twelve months following closing of the BPY Transaction, BAM has agreed to waive management fees payable by BPR. There were no amountsBPYU. For the period from August 29, 2019 through December 31, 2019, the Company accrued base management fees of $2.1 million due pursuant to these servicesBAM; which are included in accounts payable and accrued expenses on the Consolidated Balance Sheets and in property management and other costs on the Consolidated Statements of Operations and Comprehensive Income (Loss) for the year ended December 31, 2018.2019. For the year ended December 31, 2020, the Company accrued base management fees of $16.5 million due to BAM; which are included in the accounts payable and accrued expenses on the Consolidated Balance Sheets and in property management and other costs on the Consolidated Statements of Operations and Comprehensive Income (Loss) for the year ended December 31, 2020.
Following the BPY Transaction, an affiliate of BAM is entitled to receive incentive distributions based on an amount by which quarterly distributions exceed specified target levels. There were no such amounts payable for the year ended December 31, 2018.2020 and 2019.
Income Taxes (Note 7)8)
We expect to distribute 100% of our taxable capital gains and taxable ordinary income to stockholders annually. If, with respect to any taxable year, we fail to maintain our qualification as a REIT and cannot correct such failure, we would not be allowed to deduct distributions to stockholders in computing our taxable income and federal income tax. If any of our REIT subsidiaries fail to qualify as a REIT, such failure could result in our loss of REIT status. If we lose our REIT status, corporate level income tax would apply to our taxable income at regular corporate rates. As a result, the amount available for distribution to holders of equity securities that would otherwise receive dividends would be reduced for the year or years involved, and we would no longer be required to make distributions. In addition, unless we were entitled to relief under the relevant statutory provisions, we would be disqualified from treatment as a REIT for four subsequent taxable years.
Deferred income taxes are accounted for using the asset and liability method. Deferred tax assets and liabilities are recognized for the expected future tax consequences of events that have been included in the financial statements or tax returns and are recorded primarily by certain of our taxable REIT subsidiaries. Under this method, deferred tax assets and liabilities are determined based on the differences between the financial reporting and tax bases of assets and liabilities using enacted tax rates in effect for the year in which the differences are expected to reverse. Deferred income taxes also reflect the impact of operating loss and tax credit carryforwards. A valuation allowance is provided if we believe it is more likely than not that all or some portion of the deferred tax asset will not be realized. An increase or decrease in the valuation allowance that results from a change in circumstances, and which causes a change in our judgment about the realizability of the related deferred tax asset, is included in the current tax provision. In addition, we recognize and report interest and penalties, if necessary, related to uncertain tax positions within our provision for income tax expense.
Brookfield Property REIT INC.
NOTES TO CONSOLIDATED FINANCIAL STATEMENTS (Continued)
(Dollars in thousands, except share and per share amounts)
We earn investment tax credits related to solar projects at certain properties. We use the flow through method of accounting for investment tax credits. Under this method, investment tax credits are recognized as a reduction to income tax expense in the year they are earned.
Brookfield Property REIT Inc.
NOTES TO CONSOLIDATED FINANCIAL STATEMENTS
(Dollars in thousands, except share and per share amounts)
Impairment
Operating Properties
We regularly review our consolidated properties for potential impairment indicators whenever events or changes in circumstances indicate that the carrying amount may not be recoverable. Impairment indicators are assessed separately for each property and include, but are not limited to, significant decreases in real estate property net operating income, significant decreases in occupancy percentage, debt maturities, changes in management's intent with respect to the properties and prevailing market conditions.
If an indicator of potential impairment exists, the property is tested for recoverability by comparing its carrying amount to the estimated future undiscounted cash flows.flows expected to be generated by each property over the Company's expected remaining holding period to the respective carrying amount. Although the carrying amount may exceed the estimated fair value of certain properties, a real estate asset is only considered to be impaired when its carrying amount cannot be recovered through estimated future undiscounted cash flows.flows over the Company's expected remaining holding period. To the extent an impairment provision is determined to be necessary, the excess of the carrying amount of the property over its estimated fair value is expensed to operations. In addition, the impairment provision is allocated proportionately to adjust the carrying amount of the asset group. The adjusted carrying amount, which represents the new cost basis of the property, is depreciated over the remaining useful life of the property.
Although we may market a property for sale, there can be no assurance that the transaction will be complete until the sale is finalized. However, GAAP requires us to utilize the Company's expected holding period of our properties when assessing recoverability. When estimating the expected holding period of our properties, the Company estimates the probability of obtaining concessions from creditors at properties for which the Company has suspended funding equity contributions to make contractual interest and/or principal payments. If we cannot recover the carrying value of these properties within the planned holding period, we will estimate the fair values of the assets and record impairment charges for properties when the estimated fair value is less than their carrying value.
Impairment indicators for pre-development costs, which are typically costs incurred during the beginning stages of a potential development and construction in progress, are assessed by project and include, but are not limited to, significant changes in the Company's plans with respect to the project, significant changes in projected completion dates, tenant demand, anticipated revenues or cash flows, development costs, market factors and sustainability of development projects.
Impairment charges are recorded in the Consolidated Statements of Operations and Comprehensive Income (Loss) when the carrying value of a property is not recoverable and it exceeds the estimated fair value of the property, which can occur in accounting periods preceding disposition and/or in the period of disposition.
During the year ended December 31, 2020, we recorded a $133.7 million impairment charge on our Consolidated Statements of Operations and Comprehensive Income (Loss), $71.5 million of which related to a reduction in the probability-weighted holding period at one of the operating properties, where the Company is currently engaging in negotiations with the creditor to obtain potential lender concessions or other relief and $62.2 million of which related to one operating property as a result of a significant decrease in market leasing assumptions.
During the year ended December 31, 2019, we recorded a $223.1 million impairment charge on our Consolidated Statements of Operations and Comprehensive Income (Loss), $184.3 million of which related to one operating property as a result of a significant decrease in market leasing assumptions and $38.8 million of which related to the impairment charge on one operating property where the carrying value exceeded the transfer price to our affiliate (Note 3).
During the year ended December 31, 2018, we recorded a $45.9 million impairment charge on our Consolidated Statements of Operations and Comprehensive Income (Loss) related to one1 operating property that had non-recourse debt maturing during 2019 that exceeded the fair value of the operating property. The property was conveyed to the lender in full satisfaction of the debt on November 1, 2018.
No provisions forA significant judgment is made as to if and when impairment were recognized during the year endedshould be taken. The Company’s assessment of impairment as of December 31, 2017.2020 was based on the most current information available to the Company. Impairment charges could be taken in the future if economic conditions change or if the plans regarding our assets change. Therefore, we can provide no assurance
During the year ended December 31, 2016, we recorded an $73.0 million impairment charge on our Consolidated Statements of Operations and Comprehensive Income. This impairment charge related to three operating properties. We received bona fide purchase offers for two properties which were less than their respective carrying values. The other property had non-recourse debt maturing during 2016 that exceeded the fair value of the operating property. This property was transferred to a special servicer in 2016.
Changes in economic and operating conditions that occur subsequent to our review of recoverability of our properties could impact the assumptions used in that assessment and could result in future impairment if assumptions regarding those properties differ from actual results.
Brookfield Property REIT INC.Inc.
NOTES TO CONSOLIDATED FINANCIAL STATEMENTS (Continued)
(Dollars in thousands, except share and per share amounts)
that material impairment charges with respect to our assets, including operating properties, construction in progress and investments in Unconsolidated Real Estate Affiliates, will not occur in future periods. We will continue to monitor circumstances and events in future periods to determine whether impairments are warranted. Based upon current market conditions, certain of the Company’s properties may have fair values less than their carrying amounts. However, based on the Company’s plans with respect to those properties, the Company believes that their carrying amounts are recoverable and therefore, under applicable GAAP guidance, no impairment charges were recognized. If the operating conditions mentioned above deteriorate or if the Company’s expected holding period for assets change, subsequent tests for impairment could result in impairment charges in the future.
Investment in Unconsolidated Real Estate Affiliates
A series of operating losses of an investee or other factors may indicate that an other-than-temporary decline in value of our investment in an Unconsolidated Real Estate Affiliate has occurred. The investment in each of the Unconsolidated Real Estate Affiliates is evaluated for valuation declines below the carrying amount. Accordingly, in addition to the property-specific impairment analysis that we performed for such joint ventures (as part of our operating property impairment process described above), we also considered whether there were other-than-temporary declines with respect to the carrying values of our Unconsolidated Real Estate Affiliates.
NoDuring the year ended December 31, 2020, we recorded a $130.5 million impairment charge in our Unconsolidated Real Estate Affiliates related to four operating properties, which is related to a reduction in the probability-weighted holding period at the operating properties. In addition, as of December 31, 2020, the Company committed to a plan to sell its interest in a foreign Unconsolidated Real Estate Affiliate, requiring the Company to include the Accumulated other comprehensive loss in the carrying amount of the investment when assessing impairment. The carrying value of the investment plus the Accumulated other comprehensive loss exceeds the expected sales price of the investment, resulting in an impairment recognized of $57.8 million in Unconsolidated Real Estate Affiliates – gain (loss) on investment, net.
NaN impairments related to our investments in Unconsolidated Real Estate Affiliates were recognized for the years ended December 31, 2018, 20172019 and 2016.2018.
Changes in economic and operating conditions that occur subsequent to our review of recoverability of our investments in Unconsolidated Real Estate Affiliates could impact the assumptions used in that assessment and could result in future impairment if assumptions regarding those investments differ from actual results.
Notes Receivable
Notes receivable are evaluated for impairment at least quarterly. Impairment occurs when it is deemed probable that we will not be able to collect all amounts due according to the contractual terms of the loan. If a loan is considered to be impaired, we record an allowance through the provision for loan losses to reduce the carrying value of the loan to the present value of expected future cash flows discounted at the loan’s contractual effective rate or the fair value of the collateral, if repayment is expected solely from the collateral.
No impairments related to our notes receivable were recognized for the years ended December 31, 20182020, 2019 and 2017. During the year ended December 31, 2016, we determined, based on current information and events, that it was probable that we would be unable to collect all amounts due according to the contractual terms of one of our notes receivable. We recognized a $29.6 million loss on the note recorded in the provision for loan loss on the Consolidated Statements of Operations and Comprehensive Income based on the value of the collateral and included accrued interest of $7.5 million in the provision for loan loss.2018.
Property Management and Other and General and Administrative Costs
Property management and other costs represent regional and home office costs and include items such as corporate payroll, rent for office space, supplies and professional fees, which represent corporate overhead costs not generated at the properties. General and administrative costs represent the costs to run the public company and include payroll and other costs for employees, audit fees, professional fees and administrative fees related to the public company.
Fair Value Measurements (Note 4)
The accounting principles for fair value measurements establish a three-tier fair value hierarchy, which prioritizes the inputs used in measuring fair value. These tiers include:
Brookfield Property REIT Inc.
NOTES TO CONSOLIDATED FINANCIAL STATEMENTS
(Dollars in thousands, except share and per share amounts)
•Level 1 - defined as observable inputs such as quoted prices for identical assets or liabilities in active markets;
•Level 2 - defined as inputs other than quoted prices in active markets that are either directly or indirectly observable; and
•Level 3 - defined as unobservable inputs in which little or no market data exists, therefore requiring an entity to develop its own assumptions.
The impairment section above includes a discussion of all impairments recognized during the years ended December 31, 2018, 20172020, 2019 and 2016,2018, which were based on Level 2 and Level 3 inputs. Note 4 includes a discussion of properties measured at fair value on a non-recurring basis using Level 2 and Level 3 inputs and the fair value of debt, which is estimated on a recurring basis using Level 2 and Level 3 inputs. Note 103 discusses certain asset acquisition transactions that required fair value measurements related to equity method investments and acquired interests that were valued on a non-recurring basis using Level 3 inputs. Note 9 includes a discussion of certain redeemable noncontrolling interests that are measured at fair value using Level 1 inputs.
Brookfield Property REIT INC.
NOTES TO CONSOLIDATED FINANCIAL STATEMENTS (Continued)
(Dollars in thousands, except share and per share amounts)
Concentrations of Credit Risk
Financial instruments that potentially subject us to significant concentrations of credit risk consist principally of cash and cash equivalents. We are exposed to credit risk with respect to cash held at various financial institutions and access to our credit facility. Our credit risk exposure with regard to our cash and the $1.5 billion available under our credit facility is spread among a diversified group of investment grade financial institutions. We had $387.0$1,015.0 million outstanding and no amounts$715.0 million outstanding under our credit facility as of December 31, 20182020 and 2017,2019, respectively.
Recently Issued Accounting Pronouncements
Based upon the new revenue recognition guidance, revenue recognized for the year ended December 31, 2018 is not significantly different as compared to what would have been recognized in the same period under guidance that was in effect before the change. Effective January 1, 2018, companies were required to apply a five-step model in accounting for revenue. The core principle of the revenue model is that a company recognizes revenue to depict the transfer of promised goods or services to customers in an amount that reflects the consideration to which the entity expects to be entitled in exchange for those goods or services. Lease contracts are excluded from this revenue recognition criteria; however, the sale of real estate is required to follow the new model. Expanded quantitative and qualitative disclosures regarding revenue recognition are required for contracts that are subject to this pronouncement. The new standard could be adopted either retrospectively to each prior reporting period presented or on a modified retrospective approach as a cumulative effect adjustment as of the date of adoption. The Company adopted the model effective January 1, 2018 using the modified retrospective approach for implementation. The Company elected to use the practical expedient to apply the model only to contracts not yet completed as of the date of adoption. The adoption resulted in a cumulative-effect adjustment to increase equity as of January 1, 2018 of approximately $1.90 million related to changes in the revenue recognition pattern of lease commissions earned by the Company from our joint ventures and the sale of condos in our Unconsolidated Real Estate Affiliates (Note 5).
In February 2016, the Financial Accounting Standards Board ("FASB") issued ASU 2016-02, Leases. This new guidance, including related Accounting Standard Updates ("ASUs") that have subsequently been issued, was effective January 1, 2019 and requires lessees to recognize a liability to make lease payments and a right-of-use ("ROU") asset, initially measured at the present value of lease payments, for both operating and financing leases. For leases with a term of 12 months or less, lessees will be permitted to make an accounting policy election by class of underlying asset to not recognize lease liabilities and lease assets. The guidance allows lessors to make an accounting policy election, by class of underlying asset, to not separate non-lease components from lease components if certain requirements are met. The guidance also provides an optional transition method which would allow entities to initially apply the new guidance in the period of adoption, recognizing a cumulative-effect adjustment to the opening balance of retained earnings, if necessary.
The Company adopted the new standard on January 1, 2019 and applied the new guidance prospectively from the date of adoption and will not recast prior-period comparative information presented together with the 2019 financial statements. The Company elected to use the “package of practical expedients”, which allows the Company not to reassess under the new standard prior conclusions about lease identification, lease classification, and initial direct costs. The Company does not expect any material adjustments to the opening balance of retained earnings upon adoption of the new standard given the nature of the impacts and the other transition practical expedients elected by the Company.
Upon adoption, the Company expects to recognize a lease liability of approximately $70 million to $80 million for operating leases on our consolidated properties where we are the lessee, such as ground leases and office leases with a term of more than 12 months. For leases with a term of 12 months or less, the Company will make an accounting policy election by class of underlying asset to not recognize lease liabilities and ROU assets. All of the leases for which the Company will record a lease liability and ROU asset are classified as operating leases under existing GAAP, and the current classification will be carried forward subsequent to adoption of Topic 842. Differences in lease classification will affect only the pattern and classification of expense recognition in the income statement.
For leases where the Company is the lessor, the Company expects that accounting for lease components will be largely unchanged from existing GAAP; the Company plans to elect the practical expedient to not separate non-lease components from lease components. This election is expected to result in a change on the Company’s Consolidated Statement of Operations and Comprehensive Income. The Company will no longer present minimum rents, overage rents and tenant recoveries as separate line
Brookfield Property REIT INC.
NOTES TO CONSOLIDATED FINANCIAL STATEMENTS (Continued)
(Dollars in thousands, except share and per share amounts)
items because the Company will now account for these line items as a single combined lease component, rental income, on the basis of the lease component being the predominant component in the contract. Topic 842 introduced certain changes to the lease classification rules for lessors. Accordingly, the Company expects that some leases may be classified as sales-type leases after the new standard is adopted. This change is not expected to have a material impact on the Company’s financial statements. The new standard disallows the capitalization of internal leasing costs and legal costs. The Company elected to use the practical expedient in transition to not re-evaluate costs that were previously capitalized. The Company will apply the new guidance on the capitalization of leasing costs prospectively beginning on January 1, 2019.
In June 2016, the FASB issued ASU 2016-13,Financial Instruments - Credit Losses (Topic 326: Measurement of Credit Losses on Financial Instruments, which changes the model for the measurement of credit losses on financial instruments. Specifically, the amendments in the ASU replace the incurred loss impairment methodology in current GAAP with a methodology that reflects expected credit losses and requires consideration of a broader range of reasonable and supportable information to inform credit loss estimates. The amendments in this ASU will be effective for the Company January 1, 2020 with early adoption permitted on January 1, 2019. The Company is evaluating the potential impact of this pronouncement on its consolidated financial statements.
In October 2016,November 2018, the FASB issued ASU 2016-16,2018-19, Codification Improvements to Topic 326, Financial Instruments - Credit Losses, which changedclarifies that receivables arising from operating leases are not within the current income tax accounting for intra-entity asset sales to be only for inventory.scope of this new guidance. The Company adopted this standard effectiveon January 1, 2018. For those companies that2020 which did not recognize the income taxmaterially impact of a sale other than inventory before the adoption date, the new ASU was applied on a modified retrospective basis, with a cumulative-effect adjustment directly to retained earnings as of January 1, 2018. This resulted in a cumulative-effect adjustment to decrease retained earnings by the unamortized balance of the $18.8 million prepaid asset established in December 2016.its consolidated financial statements.
In November 2016, the FASB issued ASU 2016-18, which requires that a statement of cash flows explain the change during the reporting period in the total of cash, cash equivalents and restricted cash or restricted cash equivalents. This standard is effective for public entities for fiscal years beginning after December 15, 2017, and interim periods within those fiscal years. The Company adopted this guidance on December 31, 2017, which changed our statements of cash flows and related disclosures for all periods presented.
In February 2017, the FASB issued ASU 2017-05, which clarifies the accounting for the derecognition of nonfinancial assets by eliminating the exception in current GAAP for transfers of investments in real estate entities (including equity method investments). The amendments in this update provide guidance on the accounting of partial sales of nonfinancial assets and contributions of nonfinancial assets to a joint venture or other noncontrolling investee. Upon adoption, an entity would use the guidance in the new revenue recognition standard (discussed above) to determine whether it is transferring multiple, distinct assets and would recognize a gain or loss for each distinct asset transferred. When an entity transfers nonfinancial assets included in a subsidiary and retains or receives an equity interest, it first determines whether it has retained a controlling financial interest in the subsidiary. If so, the entity does not derecognize the assets and accounts for the sale of noncontrolling interest in the subsidiary under the consolidation guidance covering decreases in ownership which would result in recognizing a gain or loss. If an entity retains or receives a noncontrolling interest in the entity that owns the asset post-sale, that noncontrolling interest is considered noncash consideration and is included in the transaction price at its fair value. The retained noncontrolling interest is included at its fair value and results in an entity recognizing 100% of the gain on sale of the asset. The Company adopted this standard as of January 1, 2018 using the modified retrospective approach for implementation. We elected to use the practical expedient to apply the standard only to contracts not yet completed as of the date of adoption. The adoption will result in higher gains on future sales of partial real estate interests due to recognizing 100% of the gain on the sale of the partial interest and recording the retained noncontrolling interest at fair value. As of the adoption date, January 1, 2018, there was no cumulative-effect adjustment recorded to retained earnings.
In August 2018, the FASB issued ASU 2018-13, Fair Value Measurement.Measurement. This new guidance is effective January 1, 2020, with early adoption permitted, and modifies the disclosure requirements on fair value measurements. Public entities will be required to disclose the following: (i) the changes in unrealized gains and losses for the period included in other comprehensive income for recurring Level 3 fair value measurements held at the end of the reporting period and (ii) the range and weighted average of significant unobservable inputs used to develop Level 3 fair value measurements. In addition, public entities will no longer be required to disclose the following: (i) the amount of and reasons for transfers between Level 1 and Level 2 of the fair value hierarchy, (ii) the policy for timing of transfers between levels and (iii) the valuation processes for Level 3 fair value measurements. The new pronouncement also clarifies and modifies certain existing provisions, including eliminating "at a minimum" from the phrase "an entity shall disclose at a minimum" to promote the appropriate exercise of discretion by entities when considering fair value
Brookfield Property REIT INC.
NOTES TO CONSOLIDATED FINANCIAL STATEMENTS (Continued)
(Dollars in thousands, except share and per share amounts)
measurement disclosures and clarifying that materiality is an appropriate consideration when evaluating disclosure requirements. The Company is evaluating the potentialadopted this standard on January 1, 2020 which did not materially impact of this pronouncement on its consolidated financial statements.
In March 2020, the FASB issued ASU 2020-04, Reference Rate Reform. This temporary guidance is effective as of March 12, 2020 through December 31, 2022 to ease potential burdens related to the accounting for, or recognizing the effects of, reference rate reform on financial reporting. The guidance provides optional expedients for applying existing GAAP to contract modifications and hedging relationships affected by the move of global capital markets away from interbank offered rates, most notably the London Interbank Offered Rate (LIBOR). The Company has not adopted any of the optional expedients or exceptions as of December 31, 2020, but will continue to evaluate the possible adoption of any such expedients or exceptions during the effective period as circumstances evolve.
Brookfield Property REIT Inc.
NOTES TO CONSOLIDATED FINANCIAL STATEMENTS
(Dollars in thousands, except share and per share amounts)
Due to the business disruptions and challenges severely affecting the global economy caused by the COVID-19 pandemic ("COVID-19" or "the global economic shutdown" or "the shutdown"), lessors may provide rent deferrals and other lease concessions to lessees. In April 2020, the FASB staff issued a question and answer document (the "Lease Modification Q&A") focused on the application of lease accounting guidance to lease concessions provided as a result of the global economic shutdown. Under existing lease guidance, economic relief that is agreed to or negotiated outside of the original lease agreement is typically considered a lease modification, in which case both the lessee and lessor would be required to apply the respective modification frameworks. However, if the lessee was entitled to the economic relief because of either contractual or legal rights, the relief would be accounted for outside of the modification framework. Although the original lease modification guidance in ASC 842, Leases remain appropriate to address routine lease modifications, the Lease Modification Q&A established a different framework to account for certain lease concessions granted in response to the global economic shutdown. The Lease Modification Q&A allows the Company, if certain criteria have been met, to make an accounting policy election to account for COVID-19 related lease concessions as either a lease modification or a negative variable adjustment to rental revenue. Such election is required to be applied consistently to leases with similar characteristics and similar circumstances.
The Company has elected to apply such relief and will avail itself of the election to treat lease concessions as lease modifications, thereby avoiding performing a lease by lease analysis for the lease concessions that were (1) granted as relief due to the shutdown and (2) result in the cash flows remaining substantially the same or less than the original contract. The adoption of this standard did not materially impact the Company's consolidated financial statements.
Use of Estimates
The preparation of the consolidated financial statements in conformity with GAAP requires management to make estimates and assumptions. These estimates and assumptions affect the reported amounts of assets and liabilities and the disclosure of contingent assets and liabilities at the date of the consolidated financial statements and the reported amounts of revenues and expenses during the reporting periods. For example, estimates and assumptions have been made with respect to allocating the purchase price of real estate acquisitions, the useful lives of assets, capitalization of development and leasing costs, provision for income taxes, recoverable amounts of receivables and deferred taxes, provision for loan loss, initial valuations and related amortization periods of deferred costs and intangibles, particularly with respect to acquisitions, impairment of long-lived assets, litigation related accruals and disclosures and fair value of debt. Actual results could differ from these and other estimates.
NOTE 3 ACQUISITIONS, SALES AND JOINT VENTURE ACTIVITY
On December 17, 2020 the Company transferred its right in the Sears Anchor Parcel at Cumberland Mall to Cumberland REIT Sub-TRS LLC, a subsidiary of Cumberland REIT Sub LLC. In connection with the formation of the Cumberland REIT Sub LLC joint venture, the Company agreed to use reasonable efforts to transfer its legal rights at an agreed upon value of $20.8 million, which represents the original agreed upon value of $15.0 million and subsequent capital expenditures.
On December 17, 2020 the Company transferred its right in the Sears Anchor Parcel at Northridge Fashion Center to BPR Northridge TRS Sub LLC, a subsidiary of BPR-FF LLC. In connection with the formation of the BPRS-FF LLC joint venture, the Company agreed to use reasonable efforts to transfer its legal rights at an agreed upon value of $17.0 million, which represents the original agreed upon value of $10.0 million and subsequent capital expenditures.
On October 30, 2020, the Company conveyed 85 Fifth Ave to the lender in satisfaction of $59.0 million in outstanding debt. Accordingly, the Company recognized a loss of $3.6 million included in Unconsolidated Real Estate Affiliates - gain on investment, net on our Consolidated Statements of Operations and Comprehensive Income (Loss) for the year ended December 31, 2020.
On September 3, 2020, the Company transferred its right in the Sears Anchor Parcel at The Mall in Columbia to TMIC FS Anchor Parcel LLC, a subsidiary of Mall in Columbia JV LLC. In connection with the formation of the Mall in Columbia JV LLC joint venture, the Company agreed to use reasonable efforts to transfer its legal rights at an agreed upon value of $45.5 million.
On May 27, 2020, the Company completed a restructuring with respect to Water Tower Place with its joint venture partner for nominal consideration and assumption of the partner’s share of the debt, resulting in the Company obtaining control of the entity with a total ownership percentage for the Company of 93.93%. Accordingly, the Company recognized a loss of
Brookfield Property REIT INC.Inc.
NOTES TO CONSOLIDATED FINANCIAL STATEMENTS (Continued)
(Dollars in thousands, except share and per share amounts)
$15.4 million included in loss from changes in control of investment properties on the Consolidated Statements of Operations and Comprehensive Income (Loss) for the year ended December 31, 2020.
On March 11, 2020, BPR Nimbus LLC (an indirect subsidiary of the Company) purchased 690,427 shares of Series B Convertible Preferred Stock in Camp NYC, Inc. (par value $0.01 per share) at a price of approximately of $7.24 per share, for a $5.0 million total investment, resulting in a 5.5% ownership interest in Camp NYC, Inc. The investment is accounted for using the cost method (adjusted for impairment and observable price changes) as the Company has neither control nor significant influence over Camp NYC, Inc. and is included in Investment in Unconsolidated Real Estate Affiliates on the Consolidated Balance Sheets.
On February 21, 2020, the Company completed the sale of eight outparcels for a gross sales price of $12.1 million, which resulted in a gain of $7.8 million included in Other Revenues on the Consolidated Statements of Operations and Comprehensive Income (Loss) for the year ended December 31, 2020. All of the eight outparcels were located at consolidated entities.
On February 7, 2020, our joint venture partner at the SoNo Collection contributed $70.8 million in additional capital to the joint venture, resulting in a dilution of the Company’s ownership interest from 17.0% to 12.9%.
On January 14, 2020, BPR Cumulus LLC (an indirect subsidiary of the Company) purchased 758,725 shares of Common Stock in Allied Esports Entertainment, Inc. (par value $0.01 per share) at a price of $6.59 per share, for a $5.0 million total investment. The investment was marked to fair value as of December 31, 2020, which resulted in a loss of $3.8 million included in Unconsolidated Real Estate Affiliates - (loss) gain on investment, net on the Consolidated Statements of Operations and Comprehensive Income (Loss) for the year ended December 31, 2020. This investment resulted in a 3.2% ownership interest in Allied Esports Entertainment, Inc. The investment is accounted for at fair value as the Company has neither control nor significant influence over Allied Esports Entertainment, Inc. and is included in Investment in Unconsolidated Real Estate Affiliates on the Consolidated Balance Sheets.
On January 9, 2020, the Company completed the sale of its 27.0% interest in Aero OpCo LLC ("Aeropostale") for a gross sales
price of $36.0 million, which resulted in a gain on the sale of $15.1 million included in Unconsolidated Real Estate Affiliates - (loss) gain on investment, net on the Consolidated Statements of Operations and Comprehensive Income (Loss) for the year ended December 31, 2020.
On January 9, 2020, the Company completed the sale of its 1.2% interest in Authentic Brands Group LLC ("ABG") for a gross sales price of $33.5 million, which resulted in a gain on the sale of $1.4 million included in Unconsolidated Real Estate Affiliates - (loss) gain on investment, net on the Consolidated Statements of Operations and Comprehensive Income (Loss) for the year ended December 31, 2020.
In connection with the formation of the BPR-FF JV LLC joint venture described below, the Company agreed to use reasonable efforts to cause a transfer to BPR-FF JV LLC of the legal rights it held at Pembroke Lakes Mall at an agreed upon value of $33.8 million. On November 30, 2019, the Company transferred its rights in the Sears Anchor Parcel at Pembroke Lakes Mall to Pembroke Sears Anchor Parcel LLC. At the time of the formation noted above, the legal rights were valued at $35.0 million, resulting in a gain of $1.2 million recorded in other revenues on the Consolidated Statement of Operations and Comprehensive Income for the year ended December 31, 2019.
On November 12, 2019, the Company sold its remaining 10% ownership interest in 522 Fifth Avenue in New York City to one of its joint venture partners for $1.0 million. At the time of the sale, the Company's Investment in Unconsolidated Real Estate Affiliate was $7.5 million and the Company recorded a loss of $6.5 million on the sale within Unconsolidated Real Estate Affiliates - gain on investment, net in the Consolidated Statements of Operations and Comprehensive Income for the year ended December 31, 2019.
On November 1, 2019, the Company (through various indirect subsidiaries) acquired additional ownership interests in four operating properties which had been Unconsolidated Real Estate Affiliates from its former joint venture partners in the properties (affiliates of JPMorgan Chase & Co. ("JPM") and New York State Teachers' Retirement System ("NYSTRS")), bringing its ownership level to 100% and resulting in the Company obtaining control over the entities and consolidating the properties beginning on the transaction date ("JPM Transaction"). In the JPM Transaction, the Company acquired a 65% interest in Park Meadows and Towson Town Center (from JPM and NYSTRS), a 45% interest in Shops at Merrick Park (from
Brookfield Property REIT Inc.
NOTES TO CONSOLIDATED FINANCIAL STATEMENTS
(Dollars in thousands, except share and per share amounts)
JPM), and a 50% interest in Perimeter Mall (from JPM). The Company also transferred its 35% ownership interest in Bridgewater Commons to an affiliate of JPM and NYSTRS. The transaction was accounted for as an asset acquisition for the properties over which the Company obtained control and a sale of the investment in Bridgewater Commons. The transaction consideration for the asset acquisition consisted of cash consideration of $755.7 million and non-cash consideration consisting of the ownership interest in Bridgewater Commons, which the Company valued at $161.9 million, resulting in total transaction consideration for the acquired ownership interests of $917.6 million. The Company recorded a gain of $108.9 million related to the sale of its ownership interest in Bridgewater Commons, which had a carrying value of $53.0 million prior to the JPM Transaction, within Unconsolidated Real Estate Affiliates - gain on investment, net. As a result of the acquisition, in determining the transaction date basis of the newly consolidated properties, the Company determined the fair value of its previously held equity interests of the four properties acquired to be $876.6 million and recorded a gain on changes in control of investment properties of $681.2 million related to its existing 35% interest in Park Meadows and Towson Town Center, 55% interest in Shops at Merrick Park and 50% interest in Perimeter Mall. The fair value of the previously held equity interests was combined with the total transaction consideration for the acquired interests to determine the total cost of the asset acquisition of $1,794.2 million.
NOTE 3 ACQUISITIONS, SALES AND JOINT VENTURE ACTIVITY
The table below summarizes the gain from changes in control of investment properties for the JPM Transaction ($ in millions):
| | | | | |
| Fair value of Investment in Unconsolidated Real Estate Affiliates as of change in control | $ | 876.6 | |
| |
| Less: carrying value of Investment in Unconsolidated Real Estate Affiliates | 195.4 | |
| |
| Gain from changes in control of investment properties and other, net | $ | 681.2 | |
| |
| |
| |
| |
| |
The following table summarizes the allocation of the purchase price to net assets acquired at the date of acquisition. The allocation was based on the relative fair value of the assets acquired and liabilities assumed ($ in millions):
| | | | | |
| Investment in real estate, including intangible assets and liabilities | $ | 2,937.7 | |
| Fair value of debt held by the acquired properties | (1,155.1) | |
| Net working capital | 11.6 | |
| Net assets acquired | $ | 1,794.2 | |
| |
| |
| |
| |
| |
| |
On September 13, 2019, BPR Cumulus LLC (an indirect subsidiary of the Company) purchased 10,000,000 shares of Class A Units in PFC Associates LLC (P.F. Chang's) (par value $0.01 per share) at a price of $1.00 per share, for a $10.0 million total investment, resulting in a 3.2% ownership interest in PF Chang's. P.F. Chang's is a tenant at certain properties for which we receive rental income included in rental revenues on the Consolidated Statements of Operations and Comprehensive Income. The investment is accounted for using the cost method as the Company has neither control nor significant influence over PF Chang's and is included in Investment in Unconsolidated Real Estate Affiliates on the Consolidated Balance Sheets.
On August 26, 2019, the Company purchased an additional ownership interest of 49.677% in 730 Fifth Owners, LLC from its joint venture partner resulting in the Company obtaining control of the entity with a total ownership percentage for the Company of 99.677%. The transaction was accounted for as an asset acquisition. The transaction consideration consisted of cash consideration of $153.0 million and satisfaction of notes receivable of $249.5 million from the joint venture partner. Because of the presence of non-cash consideration, the Company determined that the fair value of the net assets acquired was more readily determinable than the fair value of the consideration given, and determined that the aggregate fair value of the joint venture's equity was $808.0 million on the acquisition date, which was allocated to the Company's 99.677% ownership interest for $805.4 million and the joint venture partner's remaining 0.323% non-controlling interest for $2.6 million. Concurrent with this transaction, the joint venture partner repaid $54.7 million of interest on the notes receivable (including amounts that had been annually capitalized onto the outstanding principal balance). The Company recorded a gain on change in control of investment properties of $39.7 million related to the Company's previously held 50% ownership interest. Immediately following this transaction, the Company sold a condominium interest in one unit of the property to an affiliate of the joint venture partner for a gross sales price of $12.6 million and incurred fees of $0.4 million, which resulted in no gain or loss, as the fair value of the condominium interest in the consolidation transaction had been determined to be $12.2 million.
Brookfield Property REIT Inc.
NOTES TO CONSOLIDATED FINANCIAL STATEMENTS
(Dollars in thousands, except share and per share amounts)
The table below summarizes the gain from changes in control of investment properties ($ in millions):
| | | | | |
| Fair value of Investment in Unconsolidated Real Estate Affiliates as of change in control | $ | 404.0 | |
| |
| Less: carrying value of Investment in Unconsolidated Real Estate Affiliates | 364.3 | |
| |
| Gain from changes in control of investment properties and other, net | $ | 39.7 | |
| |
| |
| |
| |
| |
The following table summarizes the allocation of the purchase price to net assets acquired at the date of acquisition. The allocation were based on the relative fair value of the assets acquired and liabilities assumed ($ in millions):
| | | | | |
| Investment in real estate, including intangible assets and liabilities | $ | 1,560.5 | |
| Debt held by the joint venture | (720.0) | |
| Net working capital | (32.5) | |
| Net assets acquired | $ | 808.0 | |
| |
| |
| |
| |
| |
| |
On October 28, 2019, the Company purchased an additional ownership interest of 0.29% in 730 Fifth Owners, LLC from its joint venture partner for $1.8 million. Following this transaction, the Company has a 99.967% ownership interest.
On August 19, 2019, the Company sold the SoNo Collection to a newly formed joint venture owned 80.5% by an affiliated fund (which is a related party of the Company) and 19.5% by the Company. The property was contributed to the joint venture at a value of $419.3 million based on project-specific cash costs. This excludes additional costs to complete the project by the joint venture. Prior to obtaining project-specific financing on August 9, 2019, the Company was required under GAAP to capitalize interest on general corporate financings into the cost basis of the project, which resulted in a $38.8 million impairment due to the difference between the project’s GAAP basis and the sale price based upon total project-specific cash costs. Following the transaction, the Company accounts for its non-controlling investment in the SoNo Collection under the equity method of accounting as the Company can exercise significant influence but not control over the joint venture. On December 4, 2019, the joint venture partner contributed $30.0 million and committed to contribute an additional $70.8 million in additional capital to the joint venture, resulting in a dilution of the Company's ownership interest from 19.5% to 12.9% as of December 31, 2019. The $70.8 million contribution was received on February 7, 2020.
On August 12, 2019, the Company completed the sale of the land at the former Sears anchor parcel at Columbia Mall for a gross sales price of $5.0 million, which resulted in a gain on the sale of $3.6 million included in other revenues on the Consolidated Statements of Operations and Comprehensive Income for the year ended December 31, 2019.
On August 9, 2019, the Company completed the sale of 49.3% of its interest in Authentic Brands Group LLC ("ABG") for a gross sales price of $32.1 million, which resulted in a gain on the sale of $16.8 million included in Unconsolidated Real Estate Affiliates - Gain on Investment on the Consolidated Statements of Operations and Comprehensive Income for the year ended December 31, 2019. The basis of the remaining 50.7% investment was marked to fair value of $32.1 million in conjunction with the sale transaction noted above, which resulted in an additional gain on sale of $16.8 million directly related to the step up basis in fair value. This gain is recorded in Unconsolidated Real Estate Affiliates - Gain on Investment on the Consolidated Statements of Operations and Comprehensive Income for the year ended December 31, 2019. The investment will continue to be accounted for using the cost method as the Company has neither control nor significant influence over ABG and is included in Investment in Unconsolidated Real Estate Affiliates on the Consolidated Balance Sheets.
On July 26, 2019, the Company purchased 2,255,503 shares of Series D Preferred Units in Industrious National Management Company LLC at a price of $2.22 per share, for a $5.0 million total investment, resulting in a less than 2.0% ownership interest in Industrious National Management Company LLC. The investment is accounted for using the cost method as the Company has neither control nor significant influence over Industrious National Management Company LLC and is included in Investment in Unconsolidated Real Estate Affiliates on the Consolidated Balance Sheets as of December 31, 2019.
On April 19, 2019, BPR Cumulus LLC (an indirect subsidiary of the Company) purchased 1,250,000 shares of Series F Convertible Preferred Stock in Pinstripes, Inc. (par value $0.01 per share) at a price of $8.00 per share, for a $10.0 million total investment, resulting in a 7.6% ownership interest in Pinstripes, Inc. The investment is accounted for using the cost method as
Brookfield Property REIT Inc.
NOTES TO CONSOLIDATED FINANCIAL STATEMENTS
(Dollars in thousands, except share and per share amounts)
the Company has neither control nor significant influence over Pinstripes, Inc. and is included in Investment in Unconsolidated Real Estate Affiliates on the Consolidated Balance Sheets as of December 31, 2019.
In connection with the formation of the BPR-FF JV LLC joint venture described below, the Company agreed to use reasonable efforts to cause a transfer to BPR-FF JV LLC of the legal rights it held at Coronado Center Mall at an agreed upon value of $53.1 million. On April 9, 2019, the Company transferred its rights in the Sears Anchor Parcel at Coronado Center Mall to Coronado Center LLC. No gain or loss was recognized on the transaction.
On January 7, 2019, the Company completed the sale of our 12.0% interest in Bayside Marketplace for a sales price of $42.0 million. Due to cumulative distributions received in excess of its investment, the Company had a liability balance associated with its investment in Bayside Marketplace. Accordingly, the Company recognized a gain of $104.4 million included in Unconsolidated Real Estate Affiliates - gain on investment on our Consolidated Statements of Operations and Comprehensive Income for the year ended December 31, 2019.
On December 14, 2018, we completed the sale of a 49% joint venture interest in Fashion Place for an initial basis in the partnership of $179.9 million, which resulted in a gain of $294.5 million recognized in gain from changes in control of investment properties and other, net for the year ended December 31, 2018.
On November 1, 2018, we conveyed Oak View Mall to the lender in full satisfaction of $74.7 million in outstanding debt. This transaction resulted in a $12.4 million gain on extinguishment of debt for the year ended December 31, 2018.
On August 27, 2018, the BPR-FF JV LLC joint venture was formed with Brookfield Real Estate Partners F LP. The Company contributed properties and recognized gains (losses) as summarized in the table below ($ in millions):
| | | | | | | | | | | | | | | | | | | | | | | | | | | | | | | | | | | | | | | | | | | | | | | | | | |
| Property | | Prior Ownership | | Current Ownership | | Total Asset Value | | Other Costs (1) | | Debt Balance | | Book Value of Investment | | (Loss) gain from changes in control of investment properties and other, net | | Unconsolidated Real Estate Affiliates - (loss) gain on investment, net |
| Apache Mall | | 100% | | 51% | | $ | 143.0 | | | $ | (2.0) | | | $ | 73.5 | | | $ | 56.9 | | | $ | 10.6 | | | $ | 0 | |
| Augusta Mall | | 100% | | 51% | | 251.8 | | | 1.0 | | | 170.0 | | | (34.1) | | | 116.9 | | | 0 | |
| Boise Towne Square | | 100% | | 51% | | 354.5 | | | 1.0 | | | 142.0 | | | 41.6 | | | 171.9 | | | 0 | |
| Columbiana Centre | | 100% | | 51% | | 268.8 | | | (2.0) | | | 137.3 | | | 1.0 | | | 128.5 | | | 0 | |
| Coronado Center | | 100% | | 51% | | 359.2 | | | (0.1) | | | 182.8 | | | 54.3 | | | 122.0 | | | 0 | |
| Glenbrook Square | | 100% | | 51% | | 166.8 | | | 0.4 | | | 160.0 | | | 0.5 | | | 6.7 | | | 0 | |
| Governor's Square | | 100% | | 51% | | 105.7 | | | 0.3 | | | 66.9 | | | 39.8 | | | (0.7) | | | 0 | |
| Lynnhaven Mall | | 100% | | 51% | | 383.7 | | | 0.5 | | | 235.0 | | | 40.9 | | | 108.3 | | | 0 | |
| Market Place Shopping Center | | 100% | | 51% | | 153.1 | | | 2.4 | | | 113.4 | | | 20.0 | | | 22.1 | | | 0 | |
| Mizner Park | | 50% | | 26% | | 235.2 | | | 0 | | | 0 | | | 39.1 | | | 0 | | | 18.5 | |
| Northridge Fashion Center | | 100% | | 51% | | 584.7 | | | (2.3) | | | 221.1 | | | 79.0 | | | 282.3 | | | 0 | |
| Oglethorpe Mall | | 100% | | 51% | | 203.1 | | | 0.4 | | | 149.8 | | | 8.5 | | | 45.2 | | | 0 | |
| Park Place | | 100% | | 51% | | 269.6 | | | 0.6 | | | 176.8 | | | 84.6 | | | 8.8 | | | 0 | |
| Pembroke Lakes Mall | | 100% | | 51% | | 471.1 | | | 0.8 | | | 260.0 | | | 40.1 | | | 171.8 | | | 0 | |
| Riverchase Galleria | | 100% | | 51% | | 260.9 | | | 6.2 | | | 164.2 | | | 110.0 | | | (7.1) | | | 0 | |
| The Crossroads | | 100% | | 51% | | 108.8 | | | 1.9 | | | 92.0 | | | 15.2 | | | 3.5 | | | 0 | |
| The Gallery at Harborplace | | 100% | | 51% | | 122.3 | | | 0.8 | | | 74.1 | | | 37.8 | | | 11.2 | | | 0 | |
| The Maine Mall | | 100% | | 51% | | 339.7 | | | 1.3 | | | 235.0 | | | 4.8 | | | 101.2 | | | 0 | |
| The Oaks Mall | | 100% | | 51% | | 160.2 | | | 0.4 | | | 125.1 | | | 36.0 | | | (0.5) | | | 0 | |
| Tucson Mall | | 100% | | 51% | | 260.1 | | | 0.5 | | | 246.0 | | | 25.7 | | | (11.1) | | | 0 | |
| Westroads Mall | | 100% | | 51% | | 287.4 | | | 0.4 | | | 141.3 | | | 68.8 | | | 77.7 | | | 0 | |
| White Marsh Mall | | 100% | | 51% | | 233.5 | | | 0.3 | | | 190.0 | | | 16.1 | | | 27.7 | | | 0 | |
| Woodbridge Center | | 100% | | 51% | | 247.6 | | | 5.9 | | | 245.1 | | | 10.7 | | | (2.3) | | | 0 | |
| | | | | | $ | 5,970.8 | | | $ | 18.7 | | | $ | 3,601.4 | | | $ | 797.3 | | | $ | 1,394.7 | | | $ | 18.5 | |
(1) Includes working capital, closing costs, liabilities, and financing costs.
Brookfield Property REIT Inc.
NOTES TO CONSOLIDATED FINANCIAL STATEMENTS
(Dollars in thousands, except share and per share amounts)
|
| | | | | | | | | | | | | | | | | | | | | | | | | | | | |
| Property | | Prior Ownership | | Current Ownership | | Total Asset Value | | Other Costs (1) | | Debt Balance | | Book Value of Investment | | Gains from changes in control of investment properties and other, net | | Unconsolidated Real Estate Affiliates - gain on investment, net |
| Apache Mall | | 100% | | 51% | | $ | 143.0 |
| | $ | (2.0 | ) | | $ | 73.5 |
| | $ | 56.9 |
| | $ | 10.6 |
| | $ | — |
|
| Augusta Mall | | 100% | | 51% | | 251.8 |
| | 1.0 |
| | 170.0 |
| | (34.1 | ) | | 116.9 |
| | — |
|
| Boise Towne Square | | 100% | | 51% | | 354.5 |
| | 1.0 |
| | 142.0 |
| | 41.6 |
| | 171.9 |
| | — |
|
| Columbiana Centre | | 100% | | 51% | | 268.8 |
| | (2.0 | ) | | 137.3 |
| | 1.0 |
| | 128.5 |
| | — |
|
| Coronado Center | | 100% | | 51% | | 359.2 |
| | (0.1 | ) | | 182.8 |
| | 54.3 |
| | 122.0 |
| | — |
|
| Glenbrook Square | | 100% | | 51% | | 166.8 |
| | 0.4 |
| | 160.0 |
| | 0.5 |
| | 6.7 |
| | — |
|
| Governor's Square | | 100% | | 51% | | 105.7 |
| | 0.3 |
| | 66.9 |
| | 39.8 |
| | (0.7 | ) | | — |
|
| Lynnhaven Mall | | 100% | | 51% | | 383.7 |
| | 0.5 |
| | 235.0 |
| | 40.9 |
| | 108.3 |
| | — |
|
| Market Place Shopping Center | | 100% | | 51% | | 153.1 |
| | 2.4 |
| | 113.4 |
| | 20.0 |
| | 22.1 |
| | — |
|
| Mizner Park | | 50% | | 26% | | 235.2 |
| | — |
| | — |
| | 39.1 |
| | — |
| | 18.5 |
|
| Northridge Fashion Center | | 100% | | 51% | | 584.7 |
| | (2.3 | ) | | 221.1 |
| | 79.0 |
| | 282.3 |
| | — |
|
| Oglethorpe Mall | | 100% | | 51% | | 203.1 |
| | 0.4 |
| | 149.8 |
| | 8.5 |
| | 45.2 |
| | — |
|
| Park Place | | 100% | | 51% | | 269.6 |
| | 0.6 |
| | 176.8 |
| | 84.6 |
| | 8.8 |
| | — |
|
| Pembroke Lakes Mall | | 100% | | 51% | | 471.1 |
| | 0.8 |
| | 260.0 |
| | 40.1 |
| | 171.8 |
| | — |
|
| Riverchase Galleria | | 100% | | 51% | | 260.9 |
| | 6.2 |
| | 164.2 |
| | 110.0 |
| | (7.1 | ) | | — |
|
| The Crossroads | | 100% | | 51% | | 108.8 |
| | 1.9 |
| | 92.0 |
| | 15.2 |
| | 3.5 |
| | — |
|
| The Gallery at Harborplace | | 100% | | 51% | | 122.3 |
| | 0.8 |
| | 74.1 |
| | 37.8 |
| | 11.2 |
| | — |
|
| The Maine Mall | | 100% | | 51% | | 339.7 |
| | 1.3 |
| | 235.0 |
| | 4.8 |
| | 101.2 |
| | — |
|
| The Oaks Mall | | 100% | | 51% | | 160.2 |
| | 0.4 |
| | 125.1 |
| | 36.0 |
| | (0.5 | ) | | — |
|
| Tucson Mall | | 100% | | 51% | | 260.1 |
| | 0.5 |
| | 246.0 |
| | 25.7 |
| | (11.1 | ) | | — |
|
| Westroads Mall | | 100% | | 51% | | 287.4 |
| | 0.4 |
| | 141.3 |
| | 68.8 |
| | 77.7 |
| | — |
|
| White Marsh Mall | | 100% | | 51% | | 233.5 |
| | 0.3 |
| | 190.0 |
| | 16.1 |
| | 27.7 |
| | — |
|
| Woodbridge Center | | 100% | | 51% | | 247.6 |
| | 5.9 |
| | 245.1 |
| | 10.7 |
| | (2.3 | ) | | — |
|
| | | | | | | $ | 5,970.8 |
| | $ | 18.7 |
| | $ | 3,601.4 |
| | $ | 797.3 |
| | $ | 1,394.7 |
| | $ | 18.5 |
|
| |
(1) | Includes working capital, closing costs, liabilities, and financing costs. |
On August 27, 2018, joint ventures were formed with the Teachers Insurance and Annuity Association of America. The Company contributed properties and recognized gains (losses) as summarized in the table below ($ in millions):
| | | | | | | | | | | | | | | | | | | | | | | | | | | | | | | | | | | | | | | | | | | | | | | | | | |
| Property | | Prior Ownership | | Current Ownership | | Total Asset Value | | Other Costs (1) | | Debt Balance | | Book Value of Investment | | (Loss) gain from changes in control of investment properties and other, net | | Unconsolidated Real Estate Affiliates - (loss) gain on investment, net |
| Baybrook Lifestyle | | 53% | | 29% | | $ | 292.5 | | | $ | (0.1) | | | $ | 140.0 | | | $ | 17.9 | | | $ | 0 | | | $ | 18.4 | |
| Baybrook Mall | | 100% | | 51% | | 683.7 | | | (0.4) | | | 240.3 | | | 74.3 | | | 368.7 | | | 0 | |
| The Mall in Columbia | | 100% | | 50% | | 838.9 | | | (10.1) | | | 332.3 | | | 256.6 | | | 239.9 | | | 0 | |
| The Shops at La Cantera | | 75% | | 38% | | 847.5 | | | (0.4) | | | 350.0 | | | 38.6 | | | 334.8 | | | 0 | |
| | | | | | $ | 2,662.6 | | | $ | (11.0) | | | $ | 1,062.6 | | | $ | 387.4 | | | $ | 943.4 | | | $ | 18.4 | |
Table of Contents(1) Includes working capital, closing costs, liabilities, and financing costs.Brookfield Property REIT INC.
NOTES TO CONSOLIDATED FINANCIAL STATEMENTS (Continued)
(Dollars in thousands, except share and per share amounts)
|
| | | | | | | | | | | | | | | | | | | | | | | | | | | | |
| Property | | Prior Ownership | | Current Ownership | | Total Asset Value | | Other Costs (1) | | Debt Balance | | Book Value of Investment | | Gains from changes in control of investment properties and other, net | | Unconsolidated Real Estate Affiliates - gain on investment, net |
| Baybrook Lifestyle | | 53% | | 29% | | $ | 292.5 |
| | $ | (0.1 | ) | | $ | 140.0 |
| | $ | 17.9 |
| | $ | — |
| | $ | 18.4 |
|
| Baybrook Mall | | 100% | | 51% | | 683.7 |
| | (0.4 | ) | | 240.3 |
| | 74.3 |
| | 368.7 |
| | — |
|
| The Mall in Columbia | | 100% | | 50% | | 838.9 |
| | (10.1 | ) | | 332.3 |
| | 256.6 |
| | 239.9 |
| | — |
|
| The Shops at La Cantera | | 75% | | 38% | | 847.5 |
| | (0.4 | ) | | 350.0 |
| | 38.6 |
| | 334.8 |
| | — |
|
| | | | | | | $ | 2,662.6 |
| | $ | (11.0 | ) | | $ | 1,062.6 |
| | $ | 387.4 |
| | $ | 943.4 |
| | $ | 18.4 |
|
| |
(1) | Includes working capital, closing costs, liabilities,and financing costs. |
On August 27, 2018, joint ventures were formed with CBRE Global Investment Partners. The Company contributed properties and recognized gains (losses) as summarized in the table below ($ in millions):
| | | | | | | | | | | | | | | | | | | | | | | | | | | | | | | | | | | | | | | | | | | | | | | | | | |
| Property | | Prior Ownership | | Current Ownership | | Total Asset Value | | Other Costs (1) | | Debt Balance | | Book Value of Investment | | (Loss) gain from changes in control of investment properties and other, net | | Unconsolidated Real Estate Affiliates - (loss) gain on investment, net |
| Cumberland Mall | | 100% | | 51% | | $ | 400.0 | | | $ | (7.2) | | | $ | 160.0 | | | $ | 7.7 | | | $ | 225.1 | | | $ | 0 | |
| Parks at Arlington | | 100% | | 51% | | 530.0 | | | 0 | | | 239.8 | | | 40.7 | | | 249.5 | | | 0 | |
| Ridgedale Center | | 100% | | 51% | | 300.0 | | | 0 | | | 167.0 | | | 153.6 | | | (20.6) | | | 0 | |
| | | | | | $ | 1,230.0 | | | $ | (7.2) | | | $ | 566.8 | | | $ | 202.0 | | | $ | 454.0 | | | $ | 0 | |
|
| | | | | | | | | | | | | | | | | | | | | | | | | | | | |
| Property | | Prior Ownership | | Current Ownership | | Total Asset Value | | Other Costs (1) | | Debt Balance | | Book Value of Investment | | Gains from changes in control of investment properties and other, net | | Unconsolidated Real Estate Affiliates - gain on investment, net |
| Cumberland Mall | | 100% | | 51% | | $ | 400.0 |
| | $ | (7.2 | ) | | $ | 160.0 |
| | $ | 7.7 |
| | $ | 225.1 |
| | $ | — |
|
| Parks at Arlington | | 100% | | 51% | | 530.0 |
| | — |
| | 239.8 |
| | 40.7 |
| | 249.5 |
| | — |
|
| Ridgedale Center | | 100% | | 51% | | 300.0 |
| | — |
| | 167.0 |
| | 153.6 |
| | (20.6 | ) | | — |
|
| | | | | | | $ | 1,230.0 |
| | $ | (7.2 | ) | | $ | 566.8 |
| | $ | 202.0 |
| | $ | 454.0 |
| | $ | — |
|
| |
(1) | Includes working capital, closing costs, liabilities, and financing costs. |
On August 27, 2018, joint ventures were formed with the California Public Employees' Retirement System. The Company contributed properties and recognized gains (losses) as summarized in the table below ($ in millions):
| | | | | | | | | | | | | | | | | | | | | | | | | | | | | | | | | | | | | | | | | | | | | | | | | | |
| Property | | Prior Ownership | | Current Ownership | | Total Asset Value | | Other Costs (1) | | Debt Balance | | Book Value of Investment | | (Loss) gain from changes in control of investment properties and other, net | | Unconsolidated Real Estate Affiliates - (loss) gain on investment, net |
| Ala Moana Center | | 63% | | 50% | | $ | 5,045.9 | | | $ | 0 | | | $ | 1,900.0 | | | $ | 112.3 | | | $ | 0 | | | $ | 280.9 | |
| Christiana Mall | | 50% | | 25% | | 1,036.9 | | | 3.0 | | | 550.0 | | | (34.7) | | | 0 | | | 159.4 | |
| | | | | | $ | 6,082.8 | | | $ | 3.0 | | | $ | 2,450.0 | | | $ | 77.6 | | | $ | 0 | | | $ | 440.3 | |
|
| | | | | | | | | | | | | | | | | | | | | | | | | | | | |
| Property | | Prior Ownership | | Current Ownership | | Total Asset Value | | Other Costs (1) | | Debt Balance | | Book Value of Investment | | Gains from changes in control of investment properties and other, net | | Unconsolidated Real Estate Affiliates - gain on investment, net |
| Ala Moana Center | | 63% | | 50% | | $ | 5,045.9 |
| | $ | — |
| | $ | 1,900.0 |
| | $ | 112.3 |
| | $ | — |
| | $ | 280.9 |
|
| Christiana Mall | | 50% | | 25% | | 1,036.9 |
| | 3.0 |
| | 550.0 |
| | (34.7 | ) | | — |
| | 159.4 |
|
| | | | | | | $ | 6,082.8 |
| | $ | 3.0 |
| | $ | 2,450.0 |
| | $ | 77.6 |
| | $ | — |
| | $ | 440.3 |
|
| |
(1) | Includes working capital, closing costs, liabilities, and financing costs. |
On August 27, 2018, a new joint venture, BPY Retail Holdings LLC, was formed with an institutional investor who contributed approximately $1.5 billion. As a result of this investment, the institutional investor owns a 9.75% noncontrolling interest in all retail assets of the Company, as all retail assets are wholly or partially owned by the Operating Partnership.
On August 3, 2018, we completed the sale of an anchor box at The Oaks Mall for a gross sales price of $5.0 million, which resulted in a loss of $13.8 million recognized in gains from changes in control of investment properties and other for the year ended December 31, 2018.
On July 13, 2018, we completed the sale of the commercial office unit at 685 Fifth Avenue for a gross sales price of $135.0 million. In conjunction with the sale, we paid down a $100.0 million loan and recognized a gain of $11.4 million in gains from changes in control of investment properties and other, net for the year ended December 31, 2018.
Brookfield Property REIT INC.Inc.
NOTES TO CONSOLIDATED FINANCIAL STATEMENTS (Continued)
(Dollars in thousands, except share and per share amounts)
On January 29, 2018, we completed the sale of a 49.49% joint venture interest in the Sears Box at Oakbrook Center to our joint venture partner for a sales price of $44.7 million, which resulted in a gain of $12.7 million recognized in gains from changes in control of investment properties and other, net for the year ended December 31, 2018.
On September 15, 2016, joint ventures we formed with Simon Property Group and Authentic Brands Group LLC ("ABG") acquired Aeropostale, Inc. ("Aeropostale") for $80.0 million in total cash which included cash for working capital requirements of the retail business. The intellectual property and brand related assets were assigned to the Aero IpCo, LLC venture ("IPCO") and the assets and liabilities necessary to run the stores were assigned to the Aero OpCo, LLC venture ("OPCO"). In connection with the transaction, our total investment was $20.4 million of cash contributed to the ventures for an effective ownership of approximately 26% in the two joint ventures. Aeropostale is a tenant at certain properties for which we receive rental income included in minimum rents on the Consolidated Statements of Operations and Comprehensive Income. On December 29, 2017, we sold approximately 54% of our interest in IPCO to ABG for a sales price of $16.6 million, which resulted in a gain of $12.0 million recognized in Unconsolidated Real Estate Affiliates - gain on investment on our Consolidated Statements of Operations and Comprehensive Income for the year ended December 31, 2017. On March 30, 2018, ABG exercised their call right to purchase the remaining 46% of our original interest in IPCO for a sales price of $13.9 million, which resulted in a gain of $10.4 million recognized in Unconsolidated Real Estate Affiliates - gain on investment on our Consolidated Statements of Operations and Comprehensive Income for the year ended December 31, 2018. In addition, we invested $30.5 million in ABG units. The investment is considered a cost method investment and is included in investment in Unconsolidated Real Estate Affiliates on the Consolidated Balance Sheets.
On December 15, 2017, we closed on the sale of The Shops at Fallen Timbers in Maumee, Ohio for $21.0 million. The transaction resulted in a loss on sale of $0.3 million recognized in gains from changes in control of investment properties and other for the year ended December 31, 2017.
On October 3, 2017, we acquired a 100% interest in two anchor boxes at Neshaminy Mall and Oakwood Center located in Bensalem, Pennsylvania and Gretna, Louisiana, respectively. The gross consideration of the two acquired anchor boxes was $21.4 million.
On September 19, 2017, we entered into three transactions with affiliates of Thor Equities ("Thor") related to three separate joint ventures with Thor. First, we acquired 49.9% of its partner's interest in 218 West 57th Street based on a gross property valuation of $104.0 million. After the acquisition, we owned a 99.9% interest in 218 West 57th Street, while Thor retained a 0.1% interest. A portion of the net proceeds from the acquisition were used by Thor to pay off their $12.3 million note receivable to the Company related to the property. Of the remaining net proceeds, $9.75 million was used to pay down a portion of their note receivable for 530 Fifth Avenue and $3.36 million was used to pay down a portion of their note receivable to the Company for 685 Fifth Avenue.
Second, we recapitalized the 530 Fifth Avenue joint venture based on a gross property valuation of $334 million, whereby (i) Thor’s common interest having a value of $48.1 million was converted to a preferred equity interest with a 7.0% cumulative return in 530 Fifth Avenue, which serves as collateral for Thor's still-outstanding note receivable, and (ii) we owned a 90.23% common equity interest in 530 Fifth Avenue, while Thor retained a 9.77% common equity interest. The preferred return payable to Thor must first go toward interest and principal due to the Company under Thor’s note receivable for 530 Fifth Avenue.
Finally, we agreed to recapitalize the 685 Fifth Avenue joint venture based on a gross property valuation of $652.6 million, whereby upon closing (i) Thor’s common interest having a value of $150 million was converted to a preferred equity interest with a 7.0% cumulative return in 685 Fifth Avenue, which serves as collateral for Thor's still-outstanding note receivable, and (ii) we own a 97.03% common equity interest in 685 Fifth Avenue, while Thor retains a 2.97% common equity interest. The preferred return payable to Thor must first go toward interest and principal due to the Company under Thor’s note receivable for 685 Fifth Avenue. The recapitalization was effective on December 31, 2017.
We had previously accounted for our interest in these three joint ventures using the equity method of accounting (Note 2). As a result of the transactions described above, we now consolidate these joint ventures with our joint venture partners' share of equity included in noncontrolling interest (Note 2). In addition, the $48.1 million and $151.3 million notes receivable due from our joint venture partner at 530 Fifth Avenue and 685 Fifth Avenue, respectively, are presented on the balance sheet in noncontrolling interests in consolidated real estate affiliates. The notes receivable and our joint venture partners' share of equity effectively net within the noncontrolling interest.
Brookfield Property REIT INC.
NOTES TO CONSOLIDATED FINANCIAL STATEMENTS (Continued)
(Dollars in thousands, except share and per share amounts)
The table below summarizes the gain from changes in control calculation ($ in millions):
|
| | | |
| Gain from changes in control for 218 West 57th Street, 530 Fifth Avenue and 685 Fifth Avenue | |
| Net implied fair value of previous investment and consideration | $ | 250.0 |
|
| Less: carrying value of Investment in Unconsolidated Real Estate Affiliates | 198.1 |
|
| Gain from changes in control of investment properties and other, net | $ | 51.9 |
|
The following table summarizes the allocation of the purchase price to the net assets acquired at the date of acquisition. These allocations were based on the relative fair values of the assets acquired and liabilities assumed ($ in millions):
|
| | | | | | | | | |
| Allocation of Thor Equities Purchase Price | 218 W. 57th Street | 530 Fifth Avenue | 685 Fifth Avenue |
| Investment in real estate, including intangible assets and liabilities | $ | 104.0 |
| $ | 334.0 |
| $ | 652.6 |
|
| Fair value of debt (1) | (53.0 | ) | (221.0 | ) | (340.0 | ) |
| Net working capital (2) | 0.1 |
| 14.3 |
| 1.7 |
|
| Net assets acquired | $ | 51.1 |
| $ | 127.3 |
| $ | 314.3 |
|
| |
(1) | 530 Fifth Avenue includes $31.0 million of an intercompany loan between 530 Fifth Avenue and the Company. 218 W. 57th Street includes $53.0 million of an intercompany loan between 218 W. 57th Street and the Company. Both loans eliminate in consolidation. |
| |
(2) | 530 Fifth Avenue includes a $9.4 million escrow. |
Capitalization rates and discount rates were based on a reasonable range of current market rates for 218 West 57th Street, 530 Fifth Avenue and 685 Fifth Avenue. Based upon these inputs, we determined that our valuations of the properties using a discounted cash flow or a direct capitalization model were classified within Level 3 of the fair value hierarchy (Note 2).
|
| | |
Unobservable Quantitative Input | | Range |
Discount Rates | | 6.0% to 7.0% |
Terminal capitalization rates | | 4.0% to 5.5% |
On July 12, 2017, we closed on the acquisition of the remaining 50% interest in eight of the 12 anchor boxes included in the existing GS Portfolio Holdings LLC ("GSPH") joint venture with Seritage Growth Properties ("Seritage") for $190.1 million based on a total valuation of $380.2 million. We had previously owned a 50% interest in the joint venture and accounted for the joint venture using the equity method of accounting (Note 2), but as a result of the transaction we now consolidate our 100% interest in the eight acquired anchor boxes. Of the total purchase price, $126.4 million was settled upon closing and Seritage retained certain special rights (governed by a Special Rights Agreement), which were callable by the Company for $63.7 million and were paid in full as of December 31, 2018. Simultaneously, the four remaining anchor boxes in GSPH were distributed to a newly formed joint venture, GS Portfolio Holdings II, LLC ("GSPHII"), between the Company and Seritage in which the ownership interest remains at 50% for both joint venture partners. We account for GSPHII using the equity method of accounting (Note 2). In addition, BPROP provided a loan to GSPHII for $127.4 million. This loan is collateralized by GSPHII's interest in the properties (Note 14). Finally, we acquired a 50% interest in five anchor boxes through a newly formed joint venture, GS Portfolio Holdings 2017 ("GSPH2017"), for $57.5 million. We account for this joint venture using the equity method of accounting (Note 2).
The table below summarizes the gain from changes in control calculation ($ in millions):
|
| | | |
| Gain from a Change of Control in GSPH | |
| Consideration paid to acquire our joint venture partner's interest | $ | 190.1 |
|
| Less: carrying value of Investment in Unconsolidated Real Estate Affiliates | 147.2 |
|
| Gain from changes in control of investment properties and other, net | $ | 42.9 |
|
On June 30, 2017, we conveyed Lakeside Mall to the lender in full satisfaction of $144.5 million in outstanding debt. This transaction resulted in a $55.1 million gain on extinguishment of debt for the year ended December 31, 2017.
Brookfield Property REIT INC.
NOTES TO CONSOLIDATED FINANCIAL STATEMENTS (Continued)
(Dollars in thousands, except share and per share amounts)
On June 9, 2017, we closed on the acquisition of our joint venture partner's 50% interest in Neshaminy Mall located in Bensalem, Pennsylvania for a gross purchase price of $65.0 million. Post acquisition, we own 100% of the mall. Prior to the acquisition of the remaining interest, the carrying value for our investment was $55.2 million. As a result of this acquisition, the implied fair value of our previous investment in Neshaminy Mall is $34.2 million, resulting in a loss of $21.0 million, recognized in loss from changes in control of investment properties and other for the year ended December 31, 2017.
On May 12, 2017, we closed on the sale of Red Cliffs Mall in St. George, Utah for $39.1 million. The transaction netted proceeds of approximately $36.3 million and resulted in a gain on sale of $5.6 million recognized in gain from changes in control of investment properties and other for the year ended December 31, 2017.
On December 1, 2016, we entered into an agreement with a qualified intermediary to acquire 605 N. Michigan Avenue located in Chicago, Illinois. The Company loaned the qualified intermediary $140.0 million to acquire the property as replacement property in a reverse 1031 exchange pursuant to the applicable Internal Revenue Service policy. 605 N. Michigan Avenue was deemed to be a VIE for which the Company was deemed to be the primary beneficiary as it has the ability to direct the activities of the entity that most significantly impact its economic performance and has all of the risks and rewards of ownership. Accordingly, the Company consolidated 605 N. Michigan Avenue as of December 31, 2016. The reverse 1031 exchange was closed out during the year ended December 31, 2017, and the sole membership interests of the VIE were assigned to us and the respective outstanding loan was extinguished, resulting in the entity being wholly owned by us and no long considered a VIE. The purchase price allocation was recorded in 2016 using a preliminary estimate of the net assets acquired. Certain amounts were reclassified according to the subsequent purchase price allocation recorded during 2017.
On November 1, 2016, Riverchase Galleria (located in Hoover, Alabama) redeemed the 50% interest of our joint venture partner for a gross purchase price of $143.5 million including the assumption of our joint venture partner's $110.3 million share of property level debt. Concurrently, the 50% interest was acquired by our joint venture through certain capital contributions. Our overall ownership in Riverchase Galleria was 75.5% as of December 31, 2016 and 86.3% as of December 31, 2017.
The table below summarizes the loss calculation ($ in millions):
|
| | | |
| Loss from a Change of Control in Riverchase Galleria | |
| Cash paid to acquire our joint venture partner's interest | $ | 33.8 |
|
| Less: carrying value of investment in Riverchase Galleria | (78.0 | ) |
| Losses from changes in control of investment properties | $ | (44.2 | ) |
The following table summarizes the allocation of the purchase price to the net assets acquired at the date of acquisition. These allocations were based on the relative fair values of the assets acquired and liabilities assumed. ($ in millions):
|
| | | |
| Allocation of the Riverchase Purchase Price | |
| Investment in real estate, including intangible assets and liabilities | $ | 274.3 |
|
| Fair value of debt (1) | (220.7 | ) |
| Net working capital (2) | 12.7 |
|
| Net assets acquired | $ | 66.3 |
|
(1) Debt represents an intercompany loan between Riverchase Galleria and BPR and eliminates in consolidation.
(2) Includes tax increment financing (TIF) associated with the city of Hoover, Alabama.
On October 28, 2016, we acquired four Macy's boxes, including the box at Tysons Galleria, at various properties for $45.7 million for the purpose of re-tenanting and repositioning space. Subsequently on December 8, 2016, we acquired an additional Macy's box at Stonestown Galleria for $40.7 million.
Brookfield Property REIT INC.
NOTES TO CONSOLIDATED FINANCIAL STATEMENTS (Continued)
(Dollars in thousands, except share and per share amounts)
On August 1, 2016, we closed on the sale of Rogue Valley Mall located in Medford, Oregon for a sales price of $61.5 million. This transaction netted proceeds of approximately $6.4 million and resulted in a loss of $1.0 million recognized in gain from changes in control of investment properties and other for the year ended December 31, 2016.
On July 29, 2016, we reached an agreement on the sale of a 50% interest in Fashion Show located in Las Vegas, Nevada to TIAA-CREF Global Investments, LLC ("TIAACREF") for a sales price of $1.25 billion. We closed on the sale of the initial 49% and received proceeds of approximately $813.9 million on July 29, 2016, and we received the remaining $16.6 million for the closing of the final 1% interest on October 4, 2016. This transaction resulted in a gain on sale of $634.9 million recognized in gain from changes in control of investment properties and other for the year ended December 31, 2016.
The table below summarizes the gain calculation ($ in millions):
|
| | | |
| Cash received from joint venture partner | $ | 830.5 |
|
| Less: carrying value of previous investment in Fashion Show | (195.6 | ) |
| Gain from change in control of investment property | $ | 634.9 |
|
On July 21, 2016, we closed on the sale of Newgate Mall located in Ogden, Utah for a sales price of $69.5 million. The transaction netted proceeds of approximately $8.4 million and resulted in a loss of $1.4 million recognized in gain from changes in control of investment properties and other for the year ended December 31, 2016.
On June 30, 2016, we closed on the sale of our 49.8% interest in One Stockton Partners, LLC in San Francisco, California to our joint venture partner for $49.8 million. In connection with the sale, $16.3 million in mortgage debt was assumed. This transaction netted proceeds of approximately $33.5 million and resulted in a gain of $22.7 million recognized in Unconsolidated Real Estate Affiliates - gain on investment on our Consolidated Statements of Operations and Comprehensive Income for the year ended December 31, 2016. In addition to the sale, the joint venture partner made an $8.0 million repayment of a note receivable.
On June 28, 2016, we closed on the sale of the office building and parking garage at Pioneer Place in Portland, Oregon for $121.8 million. This transaction netted proceeds of approximately $116.0 million and resulted in a gain on sale of $35.2 million recognized in gain from changes in control of investment properties and other for the year ended December 31, 2016.
On February 2, 2016, we closed on the acquisition of our joint venture partner's 25% interest in Spokane Valley Mall in Spokane, Washington for $37.5 million. This transaction resulted in a reduction of additional paid-in capital of $18.4 million due to the acquisition of our partner's noncontrolling interest.
On January 29, 2016, we closed on the sale of our 75% interest in Provo Towne Center in Provo, Utah to our joint venture partner for $37.5 million. Mortgage debt of $31.1 million was repaid upon closing. This transaction netted proceeds of approximately $2.8 million and resulted in a loss of $6.7 million recognized in gain from changes in control of investment properties and other for the year ended December 31, 2016.
On January 29, 2016, we closed on the sale of our 10% interest in 522 Fifth Avenue in New York City to our joint venture partner for $25.0 million, inclusive of the repayment of previously existing notes receivable from our joint venture partner. We received proceeds of $10.0 million upon closing and proceeds of $5.4 million on December 15, 2016. This transaction resulted in a gain on sale of $11.0 million recognized in Unconsolidated Real Estate Affiliates - gain on investment for the year ended December 31, 2016. On May 25, 2017, we received a 10% interest in 522 Fifth Avenue in full satisfaction of the remaining $9.0 million due.
On January 15, 2016, we closed on the sale of Eastridge Mall in San Jose, California for $225.0 million. This transaction netted proceeds of approximately $216.3 million and resulted in a gain on sale of $71.7 million recognized in gain from changes in control of investment properties and other for the year ended December 31, 2016.
On January 8, 2016, we closed on the sale of our 50% interest in Owings Mills Mall in Owings Mills, Maryland to our joint venture partner for $11.6 million. This transaction netted proceeds of approximately $11.6 million and resulted in a gain on sale of $0.6 million recognized in Unconsolidated Real Estate Affiliates - gain on investment for the year ended December 31, 2016.
Brookfield Property REIT INC.
NOTES TO CONSOLIDATED FINANCIAL STATEMENTS (Continued)
(Dollars in thousands, except share and per share amounts)
NOTE 4 FAIR VALUE
Nonrecurring Fair Value Measurements
We estimate fair value relating to impairment assessments based upon discounted cash flow and direct capitalization models that include all projected cash inflows and outflows over a specific holding period, or the negotiated sales price, if applicable. Such projected cash flows are comprised of contractual rental revenues and forecasted rental revenues and expenses based upon market conditions and expectations for growth. Capitalization rates and discount rates utilized in these models are based on a reasonable range of current market rates for each property analyzed. Based upon these inputs, we determined that our valuations of properties using a discounted cash flow or a direct capitalization model were classified within Level 3 of the fair value hierarchy. For our properties for which the estimated fair value was based on negotiated sales prices, we determined that our valuation was classified within Level 2 of the fair value hierarchy.
The following table summarizes certain of our assets that are measured at fair value on a nonrecurring basis as a result of impairment charges recorded during the yearyears ended December 31, 2020, 2019 and 2018. No
| | | | | | | | | | | | | | | | | | | | | | | | | | | | | |
| Total Fair Value
Measurement | | Quoted Prices in
Active Markets
for Identical Assets
(Level 1) | | Significant Other
Observable Inputs
(Level 2) | | Significant
Unobservable Inputs
(Level 3) | | Provisions for Impairment |
| Year Ended December 31, 2020 | | | | | | | | | |
| Investments in real estate (1) | $ | 124,817 | | | $ | 0 | | | $ | 0 | | | $ | 124,817 | | | $ | 133,671 | |
| Year Ended December 31, 2019 | | | | | | | | | |
| Investments in real estate (1) | $ | 599,721 | | | $ | 0 | | | $ | 0 | | | $ | 599,721 | | | $ | 223,142 | |
| Year Ended December 31, 2018 | | | | | | | | | |
| Investments in real estate (1) | $ | 62,490 | | | $ | 0 | | | $ | 0 | | | $ | 62,490 | | | $ | 45,866 | |
| | | | | | | | | |
| | | | | | | | | |
| | | | | | | | | |
| | | | | | | | | |
(1) Refer to Note 2 for more information regarding impairment. The impairment charges were recognized duringrecorded on the year ended December 31, 2017.Investments in real estate balance represents a loss incurred at consolidated properties. Refer to Note 5 for information regarding the impairment losses recorded on our Unconsolidated Real Estate Affiliates.
|
| | | | | | | | | | | | | | | | | | | |
| | Total Fair Value Measurement | | Quoted Prices in Active Markets for Identical Assets (Level 1) | | Significant Other Observable Inputs (Level 2) | | Significant
Unobservable Inputs
(Level 3) | | Provisions for Impairment |
| Year Ended December 31, 2018 | | | | | | | | | |
| Investments in real estate (1) | $ | 62,490 |
| | $ | — |
| | $ | — |
| | $ | 62,490 |
| | $ | 45,866 |
|
| | | | | | | | |
(1)Unobservable Quantitative Input | Refer | Range |
| Year ended December 31, 2020 | | |
| Discount rates | | 6.00% to Note 2 for more information regarding impairment. Investments in real estate includes consolidated properties and Unconsolidated Real Estate Affiliates.10.75% |
| Terminal capitalization rates | | 4.00% to 9.50% |
| Year ended December 31, 2019 | | |
| Agreed upon purchase price | | N/A |
| Discount rate | | 5.50% |
| Terminal capitalization rate | | 4.00% |
| Year ended December 31, 2018 | | |
| Discount rates | | 9.75% to 11.00% |
| Terminal capitalization rates | | 9.50% to 10.25% |
| | |
Unobservable Quantitative Input | | Range |
Discount rates | | 9.75% to 11.00% |
Terminal capitalization rates | | 9.50% to 10.25% |
Brookfield Property REIT Inc.
NOTES TO CONSOLIDATED FINANCIAL STATEMENTS
(Dollars in thousands, except share and per share amounts)
Disclosure of Fair Value of Financial Instruments
The fair values of our financial instruments approximate their carrying amount in our consolidated financial statements except for debt. Management's estimates of fair value are presented below for our debt as of December 31, 20182020 and 2017.2019.
| | | | December 31, 2018 | | December 31, 2017 | | December 31, 2020 | | December 31, 2019 |
| | Carrying Amount (1) | | Estimated Fair Value | | Carrying Amount (2) | | Estimated Fair Value | | Carrying
Amount (1) | | Estimated
Fair Value | | Carrying
Amount (2) | | Estimated
Fair Value |
| Fixed-rate debt | $ | 6,073,193 |
| | $ | 6,048,104 |
| | $ | 10,420,252 |
| | $ | 10,467,262 |
| Fixed-rate debt | $ | 8,581,538 | | | $ | 8,556,275 | | | $ | 8,627,332 | | | $ | 8,631,704 | |
| Variable-rate debt | 6,516,456 |
| | 6,614,172 |
| | 2,412,207 |
| | 2,415,457 |
| Variable-rate debt | 7,533,048 | | | 7,583,107 | | | 7,275,562 | | | 7,355,744 | |
| | $ | 12,589,649 |
| | $ | 12,662,276 |
| | $ | 12,832,459 |
| | $ | 12,882,719 |
| | $ | 16,114,586 | | | $ | 16,139,382 | | | $ | 15,902,894 | | | $ | 15,987,448 | |
(1) Includes net $7.7$3.2 million of market rate adjustments and $123.8$105.9 million of deferred financing costs.
(2) Includes net $23.5$4.7 million of market rate adjustments and $30.3$131.8 million of deferred financing costs.
The fair value of our junior subordinated notes approximates their carrying amount as of December 31, 20182020 and 2017.2019. We estimated the fair value of mortgages, notes and other loans payable using Level 2 and Level 3 inputs based on recent financing transactions, estimates of the fair value of the property that serves as collateral for such debt, historical risk premiums for loans of comparable quality, current LIBOR, U.S. treasury obligation interest rates and on the discounted estimated future cash payments to be made on such debt. The discount rates estimated reflect our judgment as to what the approximate current lending rates for loans or groups of loans with similar maturities and assume that the debt is outstanding through maturity. We have utilized market information as available or present value techniques to estimate the amounts required to be disclosed. Since such amounts are estimates that are
Brookfield Property REIT INC.
NOTES TO CONSOLIDATED FINANCIAL STATEMENTS (Continued)
(Dollars in thousands, except share and per share amounts)
based on limited available market information for similar transactions and do not acknowledge transfer or other repayment restrictions that may exist in specific loans, it is unlikely that the estimated fair value of any such debt could be realized by immediate settlement of the obligation.
Brookfield Property REIT INC.Inc.
NOTES TO CONSOLIDATED FINANCIAL STATEMENTS (Continued)
(Dollars in thousands, except share and per share amounts)
NOTE 5 UNCONSOLIDATED REAL ESTATE AFFILIATES
Following is summarized financial information for all of our real estate related Unconsolidated Real Estate Affiliates accounted for using the equity method and a reconciliation to our total investment in Unconsolidated Real Estate Affiliates. The reconciliation to our total investment in Unconsolidated Real Estate Affiliates is inclusive of investments accounted for using the cost method adjusted for impairment and observable price changes (Note 2).
| | | | | | | | | | | |
| | December 31, 2020 | | December 31, 2019 |
| Condensed Combined Balance Sheets—Unconsolidated Real Estate Affiliates (1) | | | |
| Assets: | | | |
| Land | $ | 3,436,531 | | | $ | 3,458,485 | |
| Buildings and equipment | 21,861,373 | | | 22,119,745 | |
| Less accumulated depreciation | (4,584,222) | | | (4,303,109) | |
| Construction in progress | 360,681 | | | 657,170 | |
| | | |
| | | |
| Net investment in real estate | 21,074,363 | | | 21,932,291 | |
| Cash and cash equivalents | 601,138 | | | 662,879 | |
| Accounts receivable, net | 684,035 | | | 344,946 | |
| Notes receivable | 20,490 | | | 22,497 | |
| Deferred expenses, net | 387,073 | | | 428,460 | |
| Prepaid expenses and other assets | 592,288 | | | 692,407 | |
| Total assets | $ | 23,359,387 | | | $ | 24,083,480 | |
| Liabilities and Owners' Equity: | | | |
| Mortgages, notes and loans payable | $ | 14,648,187 | | | $ | 15,173,099 | |
| Accounts payable, accrued expenses and other liabilities | 996,380 | | | 1,079,915 | |
| Cumulative effect of foreign currency translation ("CFCT") | (29,453) | | | (9,985) | |
| Owners' equity, excluding CFCT | 7,744,273 | | | 7,840,451 | |
| Total liabilities and owners' equity | $ | 23,359,387 | | | $ | 24,083,480 | |
| Investment in Unconsolidated Real Estate Affiliates, Net: | | | |
| Owners' equity | $ | 7,714,820 | | | $ | 7,830,466 | |
| Less: joint venture partners' equity | (4,317,525) | | | (4,357,244) | |
| Plus: excess investment/basis differences | 761,503 | | | 954,262 | |
| Investment in Unconsolidated Real Estate Affiliates, net (equity method) | 4,158,798 | | | 4,427,484 | |
| Investment in Unconsolidated Real Estate Affiliates, net (securities) | 33,102 | | | 57,061 | |
| | | |
| Retail investment, net | 0 | | | 24,182 | |
| Investment in Unconsolidated Real Estate Affiliates, net | $ | 4,191,900 | | | $ | 4,508,727 | |
| | | |
| Reconciliation—Investment in Unconsolidated Real Estate Affiliates: | | | |
| Asset—Investment in Unconsolidated Real Estate Affiliates | $ | 4,342,995 | | | $ | 4,634,292 | |
| Liability—Investment in Unconsolidated Real Estate Affiliates | (151,095) | | | (125,565) | |
| Investment in Unconsolidated Real Estate Affiliates, net | $ | 4,191,900 | | | $ | 4,508,727 | |
|
| | | | | | | |
| | December 31, 2018 | | December 31, 2017 |
| Condensed Combined Balance Sheets—Unconsolidated Real Estate Affiliates (1) | |
| | |
|
| Assets: | |
| | |
|
| Land | $ | 3,595,706 |
| | $ | 2,908,181 |
|
| Buildings and equipment | 23,468,110 |
| | 14,014,665 |
|
| Less accumulated depreciation | (4,361,210 | ) | | (3,794,792 | ) |
| Construction in progress | 489,250 |
| | 545,305 |
|
| Net property and equipment | 23,191,856 |
| | 13,673,359 |
|
| Investments in unconsolidated joint ventures | 632,060 |
| | 613,136 |
|
| Net investment in real estate | 23,823,916 |
| | 14,286,495 |
|
| Cash and cash equivalents | 540,905 |
| | 438,664 |
|
| Accounts receivable, net | 348,655 |
| | 386,634 |
|
| Notes receivable | 22,881 |
| | 15,058 |
|
| Deferred expenses, net | 511,814 |
| | 339,327 |
|
| Prepaid expenses and other assets | 796,815 |
| | 381,980 |
|
| Total assets | $ | 26,044,986 |
| | $ | 15,848,158 |
|
| Liabilities and Owners' Equity: | |
| | |
|
| Mortgages, notes and loans payable | $ | 16,139,498 |
| | $ | 10,504,799 |
|
| Accounts payable, accrued expenses and other liabilities | 1,118,663 |
| | 1,115,549 |
|
| Cumulative effect of foreign currency translation ("CFCT") | (21,384 | ) | | (38,013 | ) |
| Owners' equity, excluding CFCT | 8,808,209 |
| | 4,265,823 |
|
| Total liabilities and owners' equity | $ | 26,044,986 |
| | $ | 15,848,158 |
|
| Investment in Unconsolidated Real Estate Affiliates, Net: | |
| | |
|
| Owners' equity | $ | 8,786,824 |
| | $ | 4,227,810 |
|
| Less: joint venture partners' equity | (4,796,896 | ) | | (2,413,822 | ) |
| Plus: excess investment/basis differences | 1,220,632 |
| | 1,547,462 |
|
| Investment in Unconsolidated Real Estate Affiliates, net (equity method) | 5,210,560 |
| | 3,361,450 |
|
| Investment in Unconsolidated Real Estate Affiliates, net (cost method) | 30,483 |
| | 30,483 |
|
| Elimination of consolidated real estate investment interest through joint venture | — |
| | (52,305 | ) |
| Retail investment, net | 19,912 |
| | 16,091 |
|
| Investment in Unconsolidated Real Estate Affiliates, net | $ | 5,260,955 |
| | $ | 3,355,719 |
|
| | | | |
| Reconciliation—Investment in Unconsolidated Real Estate Affiliates: | |
| | |
|
| Asset—Investment in Unconsolidated Real Estate Affiliates | $ | 5,385,582 |
| | $ | 3,377,112 |
|
| Liability—Investment in Unconsolidated Real Estate Affiliates | (124,627 | ) | | (21,393 | ) |
| Investment in Unconsolidated Real Estate Affiliates, net | $ | 5,260,955 |
| | $ | 3,355,719 |
|
| |
(1) | The Condensed Combined Balance Sheets - Unconsolidated Real Estate Affiliates include the joint ventures formed in conjunction with the BPY Transaction subsequent to August 27, 2018 and Fashion Place subsequent to December 14, 2018 (Note 3). |
(1) Excludes the joint ventures dissolved as a result of the Water Tower Place joint venture restructuring as of December 31, 2020, and the JPM Transaction and 730 Fifth Avenue as of December 31, 2019 (Note 3).
Brookfield Property REIT INC.Inc.
NOTES TO CONSOLIDATED FINANCIAL STATEMENTS (Continued)
(Dollars in thousands, except share and per share amounts)
| | | | | | | | | | | | | | | | | |
| | Year Ended December 31, |
| 2020 | | 2019 | | 2018 |
| Condensed Combined Statements of Income (Loss) —Unconsolidated Real Estate Affiliates (1) | | | | | |
| Revenues: | | | | | |
| Rental revenues, net | $ | 1,964,269 | | | $ | 2,488,056 | | | $ | 2,019,866 | |
| | | | | |
| | | | | |
| Condominium sales | 17,147 | | | 9,390 | | | 110,792 | |
| Other | 44,893 | | | 136,069 | | | 84,049 | |
| Total revenues | 2,026,309 | | | 2,633,515 | | | 2,214,707 | |
| Expenses: | | | | | |
| Real estate taxes | 213,738 | | | 241,626 | | | 182,514 | |
| Property maintenance costs | 45,652 | | | 55,174 | | | 36,361 | |
| Marketing | 19,954 | | | 22,109 | | | 24,282 | |
| Other property operating costs | 276,955 | | | 330,316 | | | 270,071 | |
| Condominium cost of sales | 9,924 | | | 6,844 | | | 79,927 | |
| Provision for doubtful accounts | 0 | | | 0 | | | 9,128 | |
| Property management and other costs (2) | 84,934 | | | 112,295 | | | 103,475 | |
| General and administrative | 2,897 | | | 3,911 | | | 3,026 | |
| Provision for impairment | 130,502 | | | 0 | | | 0 | |
| Depreciation and amortization | 900,047 | | | 1,028,631 | | | 725,316 | |
| Total operating expenses | 1,684,603 | | | 1,800,906 | | | 1,434,100 | |
| | | | | |
| Interest income | 4,383 | | | 11,750 | | | 7,401 | |
| Interest expense | (685,584) | | | (716,690) | | | (550,939) | |
| Provision for income taxes | (2,251) | | | (961) | | | (1,842) | |
| Equity in loss of unconsolidated joint ventures | 0 | | | (36,606) | | | (33,621) | |
| Income (loss) from continuing operations | (341,746) | | | 90,102 | | | 201,606 | |
| | | | | |
| Allocation to noncontrolling interests | (7) | | | (64) | | | (78) | |
| Net income (loss) attributable to the ventures | $ | (341,753) | | | $ | 90,038 | | | $ | 201,528 | |
| Equity In Income (Loss) of Unconsolidated Real Estate Affiliates: | | | | | |
| Net income (loss) attributable to the ventures | $ | (341,753) | | | $ | 90,038 | | | $ | 201,528 | |
| Joint venture partners' share of (income) loss | 187,381 | | | (44,279) | | | (97,758) | |
| Elimination of loss from consolidated real estate investment with interest owned through joint venture | 0 | | | 0 | | | 679 | |
| Gain on retail investment | 0 | | | 5,159 | | | 12,374 | |
| Amortization of capital or basis differences | (26,205) | | | (31,332) | | | (30,271) | |
| Equity in income (loss) of unconsolidated real estate affiliates | $ | (180,577) | | | $ | 19,586 | | | $ | 86,552 | |
|
| | | | | | | | | | | |
| | Year Ended
December 31, 2018 | | Year Ended
December 31, 2017 | | Year Ended
December 31, 2016 |
| Condensed Combined Statements of Income—Unconsolidated Real Estate Affiliates (1) | |
| | |
| | |
|
| Revenues: | |
| | |
| | |
|
| Minimum rents | $ | 1,402,237 |
| | $ | 1,186,646 |
| | $ | 1,106,691 |
|
| Tenant recoveries | 568,355 |
| | 489,307 |
| | 473,357 |
|
| Overage rents | 49,274 |
| | 36,377 |
| | 39,298 |
|
| Condominium sales | 110,792 |
| | 328,237 |
| | 520,360 |
|
| Other | 84,049 |
| | 70,497 |
| | 52,511 |
|
| Total revenues | 2,214,707 |
| | 2,111,064 |
| | 2,192,217 |
|
| Expenses: | |
| | |
| | |
|
| Real estate taxes | 182,514 |
| | 140,944 |
| | 124,355 |
|
| Property maintenance costs | 36,361 |
| | 41,550 |
| | 41,132 |
|
| Marketing | 24,282 |
| | 21,338 |
| | 22,368 |
|
| Other property operating costs | 270,071 |
| | 230,930 |
| | 214,071 |
|
| Condominium cost of sales | 79,927 |
| | 239,528 |
| | 379,401 |
|
| Provision for doubtful accounts | 9,128 |
| | 6,416 |
| | 13,665 |
|
| Property management and other costs (2) | 103,475 |
| | 84,446 |
| | 71,499 |
|
| General and administrative | 3,026 |
| | 2,101 |
| | 3,198 |
|
| Depreciation and amortization | 725,316 |
| | 505,387 |
| | 466,715 |
|
| Total expenses | 1,434,100 |
| | 1,272,640 |
| | 1,336,404 |
|
| Interest income | 7,401 |
| | 11,054 |
| | 9,505 |
|
| Interest expense | (550,939 | ) | | (465,242 | ) | | (318,628 | ) |
| Provision for income taxes | (1,842 | ) | | (1,312 | ) | | (1,278 | ) |
| Equity in loss of unconsolidated joint ventures | (33,621 | ) | | (23,553 | ) | | (45,057 | ) |
| Income from continuing operations | 201,606 |
| | 359,371 |
| | 500,355 |
|
| Allocation to noncontrolling interests | (78 | ) | | (103 | ) | | (128 | ) |
| Net income attributable to the ventures | $ | 201,528 |
| | $ | 359,268 |
| | $ | 500,227 |
|
| Equity In Income of Unconsolidated Real Estate Affiliates: | |
| | |
| | |
|
| Net income attributable to the ventures | $ | 201,528 |
| | $ | 359,268 |
| | $ | 500,227 |
|
| Joint venture partners' share of income | (97,758 | ) | | (162,469 | ) | | (235,544 | ) |
| Elimination of loss from consolidated real estate investment with interest owned through joint venture | 679 |
| | 860 |
| | 1,266 |
|
| Gain (loss) on retail investment | 12,374 |
| | (3,874 | ) | | 4,264 |
|
| Amortization of capital or basis differences | (30,271 | ) | | (41,035 | ) | | (38,598 | ) |
| Equity in income of Unconsolidated Real Estate Affiliates | $ | 86,552 |
| | $ | 152,750 |
| | $ | 231,615 |
|
| |
(1) | The Condensed Combined Statements of Income - Unconsolidated Real Estate Affiliates include income from Miami Design District subsequent to June 1, 2017, income from the joint ventures formed in conjunction with the BPY Transaction subsequent to August 27, 2018 and Fashion Place subsequent to December 14, 2018 (Note 3). |
| |
(2) | Includes management fees charged to the unconsolidated joint ventures by BPRRS and BPRI. |
(2) Includes management fees charged to the unconsolidated joint ventures by BPRRS and BPRI.
The Unconsolidated Real Estate Affiliates represent our investments in real estate joint ventures that are not consolidated. We hold interests in 2824 domestic joint ventures, comprising 6758 U.S. retail properties and one1 joint venture in Brazil. Generally, we share in the profits and losses, cash flows and other matters relating to our investments in Unconsolidated Real Estate Affiliates in accordance with our respective ownership percentages. We manage most of the properties owned by these joint ventures. We account for investments in joint ventures where we own a non-controlling joint interest using either the equity method or the cost method (adjusted for impairment and observable price changes). If we have significant influence but not control over the
Brookfield Property REIT INC.Inc.
NOTES TO CONSOLIDATED FINANCIAL STATEMENTS (Continued)
(Dollars in thousands, except share and per share amounts)
method. If we have significant influence but not control over the investment, we utilize the equity method. If we have neither control nor significant influence, we utilize the cost method. If we control the joint venture, we account for the venture as a consolidated investment.
As of December 31, 2020, the balance of ROU assets was $67.7 million, net and lease liabilities was $69.9 million for 24 ground leases in the Condensed Combined Balance Sheets - Unconsolidated Real Estate Affiliates under ASC 842, included in prepaid expenses and other assets and accounts payable and accrued expenses, respectively. As of December 31, 2019, the balance of ROU assets was $68.9 million, net and lease liabilities was $70.1 million for 24 ground leases in the Condensed Combined Balance Sheets - Unconsolidated Real Estate Affiliates under ASC 842, included in prepaid expenses and other assets and accounts payable and accrued expenses, respectively. All of these leases are operating leases; we do not have any finance leases.
On June 1, 2017, we receivedMay 27, 2020, the Company acquired an additional 7.3%ownership interest of our49.5% in the Water Tower Joint Venture from its joint venture partner's membership interests in Miami Design District in full satisfaction of two promissory notespartner for $57.6 million and $40.4 million, respectively, resulting innominal consideration. Following this, the Company has a total93.9% ownership of 22.3%. We determined that we had significant influence over the investment subsequent to the acquisition of the additional interest, and therefore we changed our method of accounting for this joint venture from the cost method to the equity method (Note 2).
On July 12, 2017, we closed on the acquisition of the remaining 50% interest in eight anchor boxes included in the GSPH joint venture with Seritage. We had previously owned a 50% interest in the joint venture and accountedits wholly owned subsidiary.
On December 23, 2019, an equity method investment of the Company formed a joint venture with a third party to develop and operate a residential building adjacent to a retail property owned by the equity method investment. The Company's effective ownership of this new venture is 12.5%, and management has concluded that the Company has the ability to exercise significant influence over the entity. Therefore, the Company is accounting for its investment in the jointnew venture using the equity method of accounting, but as a result of the transaction we now consolidate our 100% interest in the eight acquired anchor boxes. Simultaneously, we distributed the four remaining anchor boxes in GSPH to a newly formed joint venture, GSPHII, between the Company and Seritage in which the ownership interest remains at 50% for both joint venture partners, and we continue to account for this joint venture using the equity method of accounting. Finally, we acquired a 50% interest in five anchor boxes through a newly formed joint venture, GSPH2017, which we account for using the equity method of accounting.
On September 19, 2017,30, 2019, the Company completed the sale of certain space formerly occupied by Barneys at Grand Canal Shoppes for a gross sales price of $37.6 million, which resulted in $15.9 million included in Equity in Income of Unconsolidated Real Estate Affiliates on the Consolidated Statements of Operations and Comprehensive Income for the year ended December 31, 2019.
During the year ended December 31, 2020, we entered into three transactions with affiliatesrecorded $130.5 million of Thorimpairment charges on our Condensed Combined Statements of Income (Loss) - Unconsolidated Real Estate Affiliates related to joint ventures between the Company and Thor at 218 West 57th Street, 530 Fifth Avenue and 685 Fifth Avenue. As a result of these transactions, we changedfour operating properties.
NaN impairments related to our method of accounting for these three joint ventures from the equity method of accounting. We now consolidate the joint ventures with our joint venture partner's share of equity includedinvestments in noncontrolling interest (Note 3).
Condominium Sales and Condominium Cost of Sales
On March 7, 2014, we formed a joint venture, AMX Partners, LLC, with Kahikolu Partners, LLC,Unconsolidated Real Estate Affiliates were recognized for the purpose of constructing a luxury residential condominium tower (the Park Lane condominium project) on a site located within the Ala Moana Shopping Center. Under the previous revenue recognition guidance, the percentage of completion method was used to account for the sales revenue of the Park Lane condominium project. Upon adoption of the new revenue recognition standard (Note 2), risksyears ended December 31, 2019 and rewards of ownership and control over the condominium unit transfers upon the closing of the sale to the customer, and as such, the joint venture will recognize revenue for the condominium unit upon closing.2018.
Unconsolidated Mortgages, Notes and Loans Payable and Retained Debt
Our proportionate share of the mortgages, notes and loans payable of the unconsolidated joint ventures was $7.6$6.9 billion as of December 31, 20182020 and $5.1$7.2 billion as of December 31, 2017,2019, including Retained Debt (as defined below). There can be no assurance that the Unconsolidated Properties will be able to refinance or restructure such debt on acceptable terms or otherwise, or that joint venture operations or contributions by us and/or our partners will be sufficient to repay such loans.
On November 20, 2020, the Company closed a new loan on Mall in Columbia for $250.0 million with an interest rate of LIBOR plus 4.50% which matures on December 9, 2022. This loan replaced the previous debt of $317.0 million with an interest rate of 3.95% that matured on November 23, 2020.
On November 9, 2020, the Company closed on new debt on Oakbrook Center for $475.0 million. This debt is comprised of a $319.0 million mortgage loan and a $156.0 million mezzanine loan with respective interest rates of LIBOR plus 2.31% and LIBOR plus 6.00%. The loans mature on November 9, 2022. This debt replaced the previous debt of $425.0 million with an interest rate of 3.66% that was scheduled to mature on January 5, 2021.
On February 28, 2020, the Company closed a new loan at the Miami Design District joint venture in the amount of $500.0 million with an interest rate of 4.13%, which matures on March 1, 2030. The loan replaced the previous debt of $480.0 million with an interest rate of LIBOR plus 2.50% that was scheduled to mature on May 14, 2021.
On November 1, 2019, the Company closed a new loan on Natick Mall for $505.0 million with a 5-year fixed interest rate at 3.72% which matures on November 1, 2024. This loan replaced the previous debt of $419.4 million with an interest rate of 4.60% that matured on November 1, 2019.
Brookfield Property REIT Inc.
NOTES TO CONSOLIDATED FINANCIAL STATEMENTS
(Dollars in thousands, except share and per share amounts)
On, October 25, 2019, the Company closed a new loan on First Colony Mall for $220.0 million with a 10-year fixed interest rate at 3.55% which matures on November 1, 2029. This loan replaced the previous debt of $168.6 million with an interest rate of 4.50% that matured on November 1, 2019.
On August 9, 2019, the Company closed on new debt at the SoNo Collection for $305.0 million. This debt is comprised of a $245.0 million mortgage loan and a $60.0 million mezzanine loan with respective interest rates of LIBOR plus 3.02% and LIBOR plus 6.75%. The loans mature on August 6, 2023.
On June 3, 2019, the Company closed on new debt on the Grand Canal Shoppes in the amount of $975.0 million with a 10-year fixed interest rate of 4.29%, which matures on July 2, 2029. This loan replaced the previous debt of $625.0 million on the property that matured on June 3, 2019.
On April 9, 2019, the Company closed on new debt on three properties included in the BPR-FF JV LLC joint venture (Note 3). The three properties are Coronado Center, Governor's Square and Lynnhaven Mall. These properties were previously encumbered by $462.0 million of third-party debt which was replaced by a $515.0 million loan with an interest rate of LIBOR plus 3.40%, maturing May 1, 2024. The new loan was recorded as an extinguishment of the previous loans and allocation of the new debt to the three properties.
During the year ended December 31, 2020, the Company suspended equity contributions to make contractual interest and/or principal payments on eight property level mortgages. The Company is currently engaging in negotiations with the creditors on these mortgages to obtain potential lender concessions or other relief. If the Company is unsuccessful in obtaining concessions from these creditors, it is possible that the property securing these loans would be transferred to the lenders. In such circumstances, the carrying value of the property may no longer be recoverable and may trigger an impairment charge. These mortgages are non-recourse and the creditors do not have security claims against the Company aside from the collateral property. As of December 31, 2020, the Company has accrued $26.8 million of default interest related to these mortgages per contractual debt agreements.
As of December 31, 2020, the Company was unsuccessful in obtaining concessions from the creditor at one property and the loan was transferred to the lender (Note 3). In total at share, the Company has suspended equity contributions to make contractual interest and/or principal payments on a total $530.0 million of property level mortgages and the related Investment in real estate securing these loans has a carrying valued of $494.4 million.
We have debt obligations in excess of our pro rata share of the debt for one1 of our Unconsolidated Real Estate Affiliates ("Retained Debt"). This Retained Debt represents distributed debt proceeds of the Unconsolidated Real Estate Affiliates in excess of our pro rata share of the non-recourse mortgage indebtedness. The proceeds of the Retained Debt which were distributed to us are included as a reduction in our investment in Unconsolidated Real Estate Affiliates. We had Retained Debt of $83.3$79.7 million at one1 property as of December 31, 2018,2020, and $85.2$81.5 million as of December 31, 2017.2019. We are obligated to contribute funds on an ongoing basis, as needed, to our Unconsolidated Real Estate Affiliates in amounts sufficient to pay debt service on such Retained Debt. If we do not contribute such funds, our interest in or our distributions from such Unconsolidated Real Estate Affiliates could be reduced to the extent of such deficiencies. As of December 31, 2018,2020, we do not anticipate an inability to perform on our obligations with respect to the Retained Debt.
Brookfield Property REIT INC.Inc.
NOTES TO CONSOLIDATED FINANCIAL STATEMENTS (Continued)
(Dollars in thousands, except share and per share amounts)
NOTE 6 MORTGAGES, NOTES AND LOANS PAYABLE
Mortgages, notes and loans payable and the weighted-average interest rates are summarized as follows:
| | | | December 31, 2018 (1) | | Weighted-Average Interest Rate (2) | | December 31, 2017 (3) | | Weighted-Average Interest Rate (2) | | December 31, 2020 (1) | | Weighted-Average
Interest Rate (2) | | December 31, 2019 (3) | | Weighted-Average
Interest Rate (2) |
| Fixed-rate debt: | |
| | |
| | |
| | |
| Fixed-rate debt: | | | | | | | |
| Collateralized mortgages, notes and loans payable | $ | 6,073,193 |
| | 4.38 | % | | $ | 10,420,252 |
| | 4.41 | % | Collateralized mortgages, notes and loans payable | $ | 7,649,040 | | | 4.19 | % | | $ | 7,638,697 | | | 4.21 | % |
| Senior Secured Notes - Silver Bonds | | Senior Secured Notes - Silver Bonds | 932,498 | | | 5.75 | % | | 988,635 | | | 5.75 | % |
| Total fixed-rate debt | 6,073,193 |
| | 4.38 | % | | 10,420,252 |
| | 4.41 | % | Total fixed-rate debt | 8,581,538 | | | 4.36 | % | | 8,627,332 | | | 4.39 | % |
| Variable-rate debt: | |
| | |
| | |
| | |
| Variable-rate debt: | | | | | | | |
| Collateralized mortgages, notes and loans payable (4) | 1,702,142 |
| | 4.22 | % | | 2,418,628 |
| | 3.39 | % | Collateralized mortgages, notes and loans payable (4) | 2,534,781 | | | 4.01 | % | | 2,594,182 | | | 4.20 | % |
| Unsecured corporate debt (5) | 4,814,314 |
| | 4.86 | % | | (6,421 | ) | | — |
| Unsecured corporate debt (5) | 4,998,267 | | | 2.80 | % | | 4,681,380 | | | 4.16 | % |
| Total variable-rate debt | 6,516,456 |
| | 4.69 | % | | 2,412,207 |
| | 3.39 | % | Total variable-rate debt | 7,533,048 | | | 3.21 | % | | 7,275,562 | | | 4.17 | % |
| Total Mortgages, notes and loans payable | $ | 12,589,649 |
| | 4.54 | % | | $ | 12,832,459 |
| | 4.22 | % | Total Mortgages, notes and loans payable | $ | 16,114,586 | | | 3.82 | % | | $ | 15,902,894 | | | 4.29 | % |
| Junior Subordinated Notes | $ | 206,200 |
| | 3.97 | % | | $ | 206,200 |
| | 2.83 | % | Junior Subordinated Notes | $ | 206,200 | | | 1.66 | % | | $ | 206,200 | | | 3.39 | % |
| |
(1) | Includes net $7.7 million of market rate adjustments and $123.8 million of deferred financing costs. |
| |
(2) | Represents the weighted-average interest rates on our principal balances, excluding the effects of market rate adjustments and deferred financing costs. |
| |
(3) | Includes net $23.5 million of market rate adjustments and $30.3 million of deferred financing costs. |
| |
(4) | $1.4 billion of the variable-rate balance is cross-collateralized. |
| |
(5) | Includes deferred financing costs, which are shown as a reduction to the debt balance. See table below for the balance excluding deferred financing costs. |
(1) Includes net $3.2 million of market rate adjustments and $105.9 million of deferred financing costs.
(2) Represents the weighted-average interest rates on our principal balances, excluding the effects of market rate adjustments and deferred financing costs.
(3) Includes net $4.7 million of market rate adjustments and $131.8 million of deferred financing costs.
(4) $1.3 billion of the variable-rate balance is cross-collateralized.
(5) Includes deferred financing costs, which are shown as a reduction to the debt balance. See table below for the balance excluding deferred financing costs.
Collateralized Mortgages, Notes and Loans Payable
As of December 31, 2018, $11.92020, $15.8 billion of land, buildings and equipment (before accumulated depreciation) and construction in progress have been pledged as collateral for our consolidated mortgages, notes and loans payable. Certain of these consolidated secured loans, representing $1.4$1.3 billion of debt, are cross-collateralized. Although a majority of the $7.8$10.2 billion of consolidated fixed and variable rate collateralized mortgages, notes and loans payable are non-recourse, $689.4$711.5 million of such mortgages, notes and loans payable are recourse to the Company as guarantees on secured financings. In addition, certain mortgage loans contain other credit enhancement provisions which have been provided by BPR.BPYU. Certain mortgages, notes and loans payable may be prepaid but are generally subject to a prepayment penalty equal to a yield-maintenance premium, defeasance or a percentage of the loan balance.
During the twelve months ended December 31, 2020, the Company suspended equity contributions to make contractual interest and/or principal payments on ten consolidated property level mortgages, including one mortgage that is in maturity default. The Company is currently engaging in negotiations with the creditors on these mortgages to obtain potential lender concessions or other relief. If the Company is unsuccessful in obtaining concessions from these creditors, it is possible that the property securing these loans would be transferred to the lenders. In such circumstances, the carrying value of the property may no longer be recoverable and may trigger an impairment charge. These mortgages are non-recourse and the creditors do not have security claims against the Company aside from the collateral property. As of December 31, 2020, the Company has accrued $19.8 million of default interest related to these mortgages per contractual debt agreements.
As of December 31, 2020, the Company has amended a loan agreement at one property. In total, the Company has suspended equity contributions to make contractual interest and/or principal payments on a total of $1.1 billion of consolidated property level mortgages and the related investment in real estate securing these loans has a carrying value of $1.2 billion.
During the year ended December 31, 2018, we refinanced a consolidated mortgage note2020, the Company completed the following financing transactions:
•Three-year extension at 685 Fifth Avenue. The prior $340.0Fox River Mall in amount of $187.0 million variable-rate consolidated mortgage note matured on July 1, 2018 and had an interest rate of LIBOR plus 2.75%. In connection with the refinancing, $100.0 million remained related to the commercial office unit and a new $275.0 million fixed-rate consolidated mortgage note with a term-to-maturitymaturity date of 10.0 years and an interest rateJune 1, 2024. The transaction incurred fees in the amount of 4.53% was obtained$3.1 million, due on the retail unit. The $100.0 million was paid down in full in conjunction with the sale of the commercial office unit on July 13, 2018. In addition, we obtained a new fixed-rate subordinate loan at The Woodlands Mall for $62.4 million with an interest rate of 4.05% and obtained a new fixed-rate loan at 605 North Michigan Avenue for $80.0 million with an interest rate of 4.76%. We also refinanced mortgage notes totaling $117.0 million at two properties. The prior loans totaling $152.3 million had a weighted-average interest rate of 4.42%. The new loans have a weighted-average term-to-maturity of 4.3 years and a weighted-average interest rate of 5.24%. We released Columbiana Centre from the $1.4 billion term loan, substituting Columbia Mall and Quail Springs Mall and conveyed Oak View Mall to the lender in full satisfaction of $74.7 million in outstanding debt. The Oak View transaction resulted in a $12.4 million gain on extinguishment of debt for the year ended December 31, 2018.2020.
During the year ended December 31, 2017, we paid down a $73.4 million consolidated mortgage note at Four Seasons Town Centre. The prior loan had a term-to-maturity of 0.2 years and an interest rate of 5.6%. Four Seasons Town Centre subsequently replaced a property that was sold during the year ended December 31, 2017 as collateral in our $1.4 billion loan secured by cross-
Brookfield Property REIT INC.Inc.
NOTES TO CONSOLIDATED FINANCIAL STATEMENTS (Continued)
(Dollars in thousands, except share and per share amounts)
collateralized•One-year extension of a $1.3 billion loan secured by cross-collateralized mortgages on 15 properties. In addition, we obtainedproperties with an interest rate of LIBOR plus 1.75%, which matures on April 25, 2021. An extension fee of $1.6 million was paid in conjunction with the extension.
During the year ended December 31, 2019, the Company completed the following transactions:
•New loan at Shops at Merrick Park in amount of $390.0 million with a new consolidated mortgage note5-year fixed interest rate at Mall3.90% which matures November 1, 2024. This loan replaced the previous debt of Louisiana$161.0 million with a fixed rate at 5.73% that was scheduled to mature on April 1, 2021. The refinance incurred fees of $7.9 million for $325.0a prepayment penalty to the lender that was factored into the fair value of debt as of the consolidation date. The refinance occurred in conjunction with the JPM Transaction in Note 3.
•New loans at Park Meadows in amount $615.0 million with an interest rate of 3.98%3.18% and a Mezzanine loan in amount of $85.0 million with an interest rate of 6.25%. Also, as a resultBoth loans mature on November 1, 2024. These loans replaced previous debt of $360.0 million and an interest rate of 4.60% that was scheduled to mature on December 1, 2023. In connection with the three transactionsrefinancing, the Company incurred prepayment penalties of $35.6 million. As the refinancing plan was contemplated in connection with the acquisition, such fees were factored into the fair value of debt recognized on the consolidation date. The refinance occurred in conjunction with the JPM Transaction in Note 3.
•New loan at 218 West 57th Street, 530 Fifth Avenue and 685 Fifth Avenue (Note 3), we now consolidate a totalPark City Center in the amount of $450.0$135.0 million consolidated mortgage notes with interest rates of LIBOR plus 2.75% and LIBOR plus 3.25%. Finally, we refinanced a $190.0 million consolidated mortgage note with a $110.0 million consolidated mortgage note at 530 Fifth Avenue. Both notes had an interest rate of LIBOR plus 3.25%3.00% which matures on September 9, 2021. This loan replaced the previous debt of $172.2 million that matured June 6, 2019 and included a pay down of the existing mezzanine loan in the amount of $36.8 million. For the period between the maturity date of the previous debt and the effective date of the new loan, the Company extended forbearance and paid forbearance fees in total amount of $0.5 million.
•New loans on 730 Fifth Avenue in the amount of $807.5 million which mature on September 1, 2024. The loans consist of a senior loan in amount of $587.3 million with a 5-year term at LIBOR plus 3.00%, a senior mezzanine loan in amount of $97.9 million with a 5-year term at LIBOR plus 4.25%, and a junior loan in amount of $122.3 million with a 5-year term at LIBOR plus 5.50%. We manage our exposureThe loans replaced the previous debt of $720.0 million that was previously extended to August 27, 2019 and included a pay down of $180.0 million on June 28, 2019.
•New loan on Westlake Center in the amount of $48.8 million with a 2-year floating rate loan at LIBOR plus 2.50% which matures on July 10, 2021. This loan replaced the previous debt of $42.5 million that matured July 10, 2019.
•New loans on The Woodlands Mall for a total of $465.0 million, which consists of $425.0 million with an interest rate fluctuations related to this debt usingof 4.25% and $40.0 million with an interest rate cap agreements. However, our efforts to manage risks associated withof 5.50%. The loan has a weighted average interest rate volatility may not be successful.of 4.36% which matures on August 1, 2029. The loan replaced the previous debt of $294.0 million on the property that had a weighted average interest rate of 4.83% and scheduled to mature on June 10, 2023. In accordance with the previous debt agreement, the Company incurred a prepayment penalty of $27.5 million which is recorded as loss on extinguishment of debt on the Consolidated Statements of Operations and Comprehensive Income for the year ended December 31, 2019.
Our $1.4•One-year extension on the loan at 830 North Michigan Ave in the amount of $78.0 million at LIBOR plus 1.60% which matures on July 1, 2020. This loan replaced the previous debt of $85.0 million that matured on July 1, 2019 and includes principal repayment of $7.0 million made in conjunction with the extension.
•One-year extension of a $1.3 billion loan is secured by cross-collateralized mortgages on 15 properties. Theproperties with an interest rate isof LIBOR plus 1.75% and the recourse is 50%. The loanwhich matures on April 25, 2019,2020. A principal repayment of $10.1 million was made in conjunction with two one year extension options.the extension.
Brookfield Property REIT Inc.
NOTES TO CONSOLIDATED FINANCIAL STATEMENTS
(Dollars in thousands, except share and per share amounts)
Corporate and Other Unsecured Loans
We have certain unsecured debt obligations, the terms of which are described below:
| | | | | | | | | | | | | | | | | | | | | | | | | | |
| | December 31, 2020 (1) | | Weighted-Average
Interest Rate | | December 31, 2019 (2) | | Weighted-Average
Interest Rate |
| Unsecured debt: | | | | | | | | |
| Unsecured corporate debt | | 5,064,522 | | | 2.80 | % | | 4,769,510 | | | 4.16 | % |
| Senior Secured Notes - Silver Bonds | | 945,360 | | | 5.75 | % | | 999,950 | | | 5.75 | % |
| Total corporate debt | | $ | 6,009,882 | | | 3.26 | % | | $ | 5,769,460 | | | 4.44 | % |
|
| | | | | | | | | | | | | | |
| | | December 31, 2018 (1) | | Weighted-Average Interest Rate | | December 31, 2017 (2) | | Weighted-Average Interest Rate |
| Unsecured debt: | | |
| | |
| | |
| | |
|
| Unsecured corporate debt | | 4,923,740 |
| | 4.86 | % | | — |
| | — |
|
| Total unsecured debt | | $ | 4,923,740 |
| | 4.86 | % | | $ | — |
| | — |
|
On May 24, 2020, the Company executed a series of transactions to repurchase corporate debt on the open market, funded by intercompany loans from BPY. The total amounts of debt repurchased had a par value of $59.6 million, and a cash repurchase price of $45.3 million. Following each repurchase, the repurchased debt was formally cancelled. As a result of the debt repurchase and cancellation, the Company recognized a gain of $14.3 million included in Gain (loss) on extinguishment of debt on the Consolidated Statements of Operations and Comprehensive Income (Loss) for the year ended December 31, 2020. | |
(1) | Excludes deferred financing costs of $109.4 million in 2018 that decrease the total amount that appears outstanding in our Consolidated Balance Sheets. |
| |
(2) | Excludes deferred financing costs of $6.4 million in 2017 that decrease the total amount that appears outstanding in our Consolidated Balance Sheets. |
On May 1, 2019, the Company and BPR Cumulus LLC, BPR Nimbus LLC and GGSI Sellco LLC (each, an indirect subsidiary of the Company) issued $1.0 billion aggregate principal amount of 5.75% Senior Secured Notes - Silver Bonds due 2026. The notes bear interest at an annual rate of 5.75% payable on May 15 and November 15 of each year, beginning on November 15, 2019 and will mature on May 15, 2026. During the last quarter of 2019, the Company made a principal payment in amount of $50.0 thousand. During the year ended December 31, 2020, the Company made additional principal payments totaling $54.6 million. The remaining outstanding balance as of December 31, 2020 was $945.4 million.
On March 25, 2019, the Company secured a $341.8 million subordinated unsecured note with Brookfield BPY Holdings Inc., a related party. The note bore interest at a rate equal to LIBOR plus 2.75% and was scheduled to mature on March 25, 2029. During the year ended December 31, 2019, the Company repaid this loan in full. The Company borrowed an additional $70.5 million during the second quarter of 2019, with a maturity date of June 25, 2029. During the year ended December 31, 2019, the Company made principal payments totaling $68.0 million. The Company borrowed an additional $31.7 million during the last quarter of 2019 which was due on January 6, 2020 and has been repaid. On February 10, 2020, the Company secured an additional $27.0 million subordinated unsecured note with Brookfield BPY Holdings Inc, and another $29.0 million note on March 25, 2020. The notes bear interest at rate equal to LIBOR plus 2.75%, and mature on February 10, 2030 and March 25, 2030, respectively. On May 19, 2020, the Company secured an additional $25.0 million subordinated unsecured note with Brookfield BPY Holdings Inc., and another $45.0 million on May 22, 2020. The notes were repaid in full on June 18, 2020 and July 16, 2020, respectively. On June 25, 2020, the Company secured another $25.0 million subordinated unsecured note at an interest rate equal to LIBOR plus 1.94% that is scheduled to mature on August 27, 2022. On July 16, 2020 and August 27, 2020, the Company made a principal payments in the amount of $45.0 million and $22.1 million, respectively. The total outstanding balance of the notes as of December 31, 2020 was $63.2 million which includes $1.7 million of payment-in-kind interest.
The Company entered into a new credit agreement (the "Agreement""Credit Agreement") dated as of August 24, 2018 consisting of a revolving credit facility (the "Facility"), Term A-1 and A-2 loans, and a Term B loan. The Facility provides for revolving loans of up to $1.5 billion and borrowings bear interest at a rate equal to LIBOR plus 225 basis points.2.25%. The Facility is scheduled to mature in August 2022 and had outstanding borrowings of $387.0 million$1.0 billion as of December 31, 2018.2020. The Term A-1 Loan has a total commitment outstanding of $900.0 million, with $700.0 million attributable to BPRBPYU and $200.0 million attributable to an affiliate, and is scheduled to mature in August 2021, bearing interest at a rate equal to LIBOR plus 225 basis points.2.25%. During the year ended December 31, 2020, the Company made a principal payment of $9.0 million, and the remaining outstanding balance was $25.8 million. The Term A-2 Loan has a total commitment outstanding of $2.0 billion and is scheduled to mature in August 2023, bearing interest at a rate equal to LIBOR plus 225 basis points.2.25%, and the outstanding balance on December 31, 2020 was $2.0 billion. The Term B Loan has a total commitment outstanding of $2.0 billion and is scheduled to mature in August 2025
Brookfield Property REIT Inc.
NOTES TO CONSOLIDATED FINANCIAL STATEMENTS
(Dollars in thousands, except share and per share amounts)
bearing interest at a rate equal to LIBOR plus 250 basis points.2.50%. During the year ended December 31, 2020, the Company made additional payments in the total amount of $25.0 million, and the outstanding balance of the Term B loan was $1,950.0 million. The Term A-1, A-2, and B Loans are contractually obligated to be prepaid through net proceeds from property level refinances and asset sales as outlined in the Credit Agreement.
The Credit Agreement contains certain restrictive covenants which limit material changes in the nature of our business conducted, including, but not limited to, mergers, dissolutions or liquidations, dispositions of assets, liens, incurrence of additional indebtedness, dividends, transactions with affiliates, prepayment of subordinated debt, negative pledges and changes in fiscal periods. In addition, we are required not to exceedmaintain compliance with certain financial covenants related to a maximum net debt-to-value ratio and a minimum fixed-charge-coverage ratio, as defined in the Credit Agreement.
On July 29, 2020, the Company entered into the First Amendment of its Credit Agreement in order to give effect to certain amendments, including, but not limited to the following:
•The lenders agreed to certain covenant relief in respect of the financial covenants through the fiscal quarter ending June 30, 2021 (the "Covenant Relief Period"). The maximum total indebtedness to value ratio financial maintenance covenant was eliminated permanently. The minimum fixed charge coverage ratio. ratio was reduced to 1.20x during the Covenant Relief Period and increases to 1.35x thereafter.
•The applicable margin for the Term A Loans and the Facility is LIBOR plus 3.00% during the Covenant Relief Period – and thereafter, will be LIBOR plus 3.00% if the total net indebtedness to value ratio is greater than 70%.
•The Company agreed to maintain an ongoing liquidity covenant (set at $500 million) which will be tested as of the last day of each month against the amount of unrestricted cash, undrawn available amounts under the Facility and undrawn amounts under the new Brookfield Liquidity Facility. The Company has entered into and maintains a $500 million Brookfield Liquidity Facility (the "Brookfield Liquidity Facility") and prior to the date the Company demonstrates compliance with the financial covenants in effect under the Credit Agreement prior to the First Amendment, any interest and principal payments thereunder must be paid-in-kind.
•The Company is required to "match-fund" drawings under the Facility in excess of $1.0 billion using proceeds of either the Brookfield Liquidity Facility or issuances of qualified equity interests. The match-funding requirement is required to be made (i) monthly, whereby any drawing during that month is in excess of the prior highest balance of the revolver (in excess of $1.0 billion), (ii) within 10 business days of a request from the agent if as of any day during a month, the excess draw amount would exceed $10 million and (iii) at any time of request for a revolving loan that the excess would be $100 million or greater (which would be match-funded substantially concurrently with the requested revolving loan draw).
•The Company is required to make additional prepayments of the Term A loans with proceeds of certain equity, debt issuances and asset sales.
•The Company also agreed to a number of additional restrictions, including restrictions on incurring additional indebtedness, making of certain restricted payments and the use of proceeds under the revolving facility, which apply either through the end of the Covenant Relief Period – and in the case of certain provisions, until the Company demonstrates compliance with the financial covenants in effect under the Credit Agreement prior to the First Amendment.
As of December 31, 2018,2020, we are not aware of any instances of non-compliance with such covenants. Though there is potential for a risk of default (See Note 18 for discussion specific to COVID-19), in the event the Company fails to maintain compliance with its financial covenants, the Credit Agreement provides for a cure period, during which the Company has the opportunity to raise additional cash and reduce net debt balance, such as through capital contributions from BPY, or disposition of assets. Management has determined that in the event of a default, it is probable that these market-based alternatives would be available, and that these actions would provide the necessary cash flows to prevent or cure an event of default, although there is no guarantee that these market-based alternatives would be available.
Junior Subordinated Notes
GGP Capital Trust I, a Delaware statutory trust (the "Trust") completed a private placement of $200.0 million of trust preferred securities ("TRUPS") in 2006. The Trust also issued $6.2 million of common securities to BPROP. The Trust used the proceeds from the sale of the TRUPS and common securities to purchase $206.2 million of floating rate junior subordinated notes of
Brookfield Property REIT Inc.
NOTES TO CONSOLIDATED FINANCIAL STATEMENTS
(Dollars in thousands, except share and per share amounts)
BPROP due 2036. Distributions on the TRUPS are equal to LIBOR plus 1.45%. Distributions are cumulative and accrue from the date of original issuance. The TRUPS mature on April 30, 2036, but may be redeemed beginning on April 30, 2011 if the Trust exercises its right to redeem a like amount of junior subordinated notes. The junior subordinated notes bear interest at LIBOR plus 1.45% and are fully recourse to the Company. We have recorded the junior subordinated notes as a liability and our common equity interest in the Trust as prepaid expenses and other assets in our Consolidated Balance Sheets as of December 31, 20182020 and December 31, 2017.2019.
Brookfield Property REIT INC.
NOTES TO CONSOLIDATED FINANCIAL STATEMENTS (Continued)
(Dollars in thousands, except share and per share amounts)
Letters of Credit and Surety Bonds
We had outstanding letters of credit and surety bonds of $42.4$50.1 million and $50.0 million as of December 31, 20182020 and $51.3 million as of December 31, 2017.2019, respectively. These letters of credit and bonds were issued primarily in connection with insurance requirements, special real estate assessments and construction obligations.
We are not aware of any instances of non-compliance with our financial covenants related to our mortgages, notes and loans payable as of December 31, 2018.2020.
NOTE 7 LEASES
Lessee arrangements
We are the lessee in several ground lease agreements for the land under some of our owned buildings. Generally, we own the land underlying the properties; however, at certain properties, all or part of the underlying land is owned by a third party that leases the land to us through a long-term ground lease. In addition, we lease office space for our corporate headquarters and field offices. Our material consolidated leases have reasonably certain lease terms ranging from 4 years - 40 years. Certain leases provide the lessee with 2 to 3renewal options which are considered to be termination options unless it is reasonably certain that the Company will elect to renew and generally range from five years to ten years each, with renewal rent payments based on a predetermined annual increase, market rates at the time of exercise of the renewal, or changes in the Consumer Price Index ("CPI").
As of December 31, 2020, the balance of operating ROU assets was $392.5 million, net and lease liabilities of $74.9 million for seven ground leases and one office lease in the Consolidated Balance Sheets under Topic 842, and are included in prepaid expenses and other assets and accounts payable and accrued expenses, respectively.
The maturity of ouroperating lease liabilities as of December 31, 2020 is as follows:
| | | | | | | | | | | | | |
| Year | | Amount | | | | | |
| 2021 | | $ | 9,470 | | | | | | |
| 2022 | | 9,704 | | | | | | |
| 2023 | | 9,968 | | | | | | |
| 2024 | | 10,200 | | | | | | |
| 2025 | | 10,439 | | | | | | |
| 2026 and thereafter | | 155,012 | | | | | | |
| Total undiscounted lease payments | | 204,793 | | | | | | |
| Less: Present value adjustment | | (129,897) | | | | | | |
| Total lease liability | | $ | 74,896 | | | | | | |
Brookfield Property REIT Inc.
NOTES TO CONSOLIDATED FINANCIAL STATEMENTS
(Dollars in thousands, except share and per share amounts)
The maturity of ouroperating lease liabilities as of December 31, 2019 is as follows:
| | | | | |
| Year | Amount |
| 2020 | $ | 9,305 | |
| 2021 | 9,520 | |
| 2022 | 9,754 | |
| 2023 | 10,018 | |
| 2024 | 10,250 | |
| 2025 and thereafter | 165,583 | |
| Total undiscounted lease payments | 214,430 | |
| Less: Present value adjustment | (135,930) | |
| Total | $ | 78,500 | |
Straight-line rent expense recognized for ourconsolidated operating leases is as follows:
| | | | | | | | |
| Year Ended December 31, 2020 | Year Ended December 31, 2019 |
| Ground leases | $ | 7,717 | | $ | 2,775 | |
| Office leases | 7,856 | | 7,856 | |
Straight-line rent expense is included in other property operating costs for ground leases and property management and other costs for the office lease, respectively, in the Consolidated Statements of Operations and Comprehensive Income (Loss). Several lease agreements include variable lease payments which vary based on factors such as sublease income received, the revenues or net operating income of the properties constructed on the leased premises, increases in CPI, and changes in market rents. In addition, our leases require us to reimburse the lessor for the lessor’s tax, insurance and common area costs. Variable lease payments and short-term lease costs recognized as rent expense for operating leases were not significant for the years ended December 31, 2020 and 2019 and are included in other property operating costs in the Consolidated Statements of Operations and Comprehensive Income (Loss).
The following summarizes additional information related to our operating leases as of December 31, 2020 and December 31, 2019:
| | | | | | | | | | | |
| Year Ended December 31, 2020 | Year Ended December 31, 2019 | | | |
| Weighted-average remaining lease term (years) | 23.2 | 23.0 | | | |
| Weighted-average discount rate | 7.69% | 7.67% | | | |
| | | | | |
| Supplemental disclosure for the consolidated statement of cash flows: | | | | | |
| Cash paid for amounts included in the measurement of lease liabilities | $9,263 | $8,636 | | | |
Lessor arrangements
We own a property portfolio comprised primarily of Class A retail properties and lease these retail spaces to tenants. As of December 31, 2020, we own a controlling interest in and consolidated 63 retail properties located throughout the United States comprising approximately 55 million square feet of GLA. We enter into operating leases with a variety of tenants, the majority of which are national and regional retail chains and local retailers. These operating leases expire starting in year 2021 and typically include renewal options, which are generally exercisable only by the tenant. Certain leases also include early termination options which are typically exercisable only by the tenant. Our leases do not allow the tenant to purchase the retail space. Minimum future rentals exclude amounts which are payable by certain tenants based upon a percentage of their gross sales or as reimbursement of operating expenses and amortization of above and below-market tenant leases. Consequently, our credit risk is concentrated in the retail industry.
Brookfield Property REIT Inc.
NOTES TO CONSOLIDATED FINANCIAL STATEMENTS
(Dollars in thousands, except share and per share amounts)
The maturity analysis of the lease payments we expect to receive from our operating leases as of December 31, 2020 are as follows:
| | | | | |
| Year | Amount |
| 2021 | $ | 1,027,192 | |
| 2022 | 941,265 | |
| 2023 | 831,193 | |
| 2024 | 703,715 | |
| 2025 | 576,745 | |
| Subsequent | 1,859,218 | |
| $ | 5,939,328 | |
The maturity analysis of the lease payments we expect to receive from our operating leases as of December 31, 2019 are as follows:
| | | | | | | | |
| Year | Amount | | | |
| 2020 | $ | 1,105,295 | | | | |
| 2021 | 1,035,494 | | | | |
| 2022 | 930,124 | | | | |
| 2023 | 815,823 | | | | |
| 2024 | 691,981 | | | | |
| Subsequent | 2,369,894 | | | | |
| $ | 6,948,611 | | | | |
All lease-related income is reported as a single line item, rental revenues, in our Consolidated Statements of Operations and Comprehensive Income (Loss). Effective January 1, 2019, with the adoption of ASC 842, rental revenues is presented net of provision for doubtful accounts. Rental income recognized on a straight-line basis consists primarily of fixed and in-substance fixed lease payments (including lease payments related to non-lease components which have been combined with the lease component). Variable rental income represents variable lease payments, which consist primarily of overage rents; reimbursements for tenants’ pro rata share of real estate taxes, insurance, property operating and marketing expenses, and utilities; lease payments related to CPI-based escalations and market rent resets; and lease termination income.
In accordance with the terms of our operating leases, we bill our tenants separately for minimum rents, tenant recoveries and overage rents, lease termination income as shown below for the years ended December 31, 2020 and December 31, 2019:
| | | | | | | | | | | | | | |
| | Year Ended December 31, 2020 | | Year Ended December 31, 2019 | | |
| Minimum rents, billed | | $ | 1,005,643 | | | $ | 916,624 | | | |
| Tenant recoveries, billed | | 393,454 | | | 362,840 | | | |
| Lease termination income, billed | | 8,123 | | | 13,235 | | | |
| Overage rent, billed | | 16,061 | | | 25,193 | | | |
| COVID-19 rent abatements granted | | (62,243) | | | 0 | | | |
| Total contractual operating lease billings | | 1,361,038 | | | 1,317,892 | | | |
| Adjustment to recognize contractual operating lease billings on a straight-line basis | | 41,885 | | | 8,488 | | | |
| Above and below-market tenant leases, net | | 15,352 | | | 22,037 | | | |
| Less provision for doubtful accounts | | (62,395) | | | (10,733) | | | |
| Total rental revenues, net | | $ | 1,355,880 | | | $ | 1,337,684 | | | |
During 2020, as a result of the COVID-19 pandemic, a significant portion of the Company’s tenants requested rental assistance, whether in the form of deferral or rent reduction. Lease concessions granted in response to the COVID-19 pandemic are
Brookfield Property REIT Inc.
NOTES TO CONSOLIDATED FINANCIAL STATEMENTS
(Dollars in thousands, except share and per share amounts)
accounted for as a lease modification and are recognized prospectively over the remaining lease term when they become legally enforceable. However, prior to the legal execution of the lease concession, when establishing its general allowance, the Company recognizes the portion of estimated concessions that is deemed attributable to the current period through consideration of weighted average remaining lease terms. In the table above, contractual operating lease billings are reduced by rent abatements executed during the period. Such rent abatements, net of estimated lease concessions previously recognized in the general allowance, are recognized as an increase to straight-line rent receivables. In the table above, such amounts are included in the adjustment to recognize contractual operating lease billings on a straight-line basis.
Of the total contractual rental revenues we have billed, 78.4% and 77.6% are fixed lease payments for the year ended December 31, 2020 and December 31, 2019, respectively.
NOTE 78 INCOME TAXES
The Company elected to be taxed as a REIT under the Internal Revenue Code of 1986, as amended. We intend to maintain REIT status. To qualify as a REIT, the Company must meet a number of organizational and operational requirements, including a requirement to distribute at least 90% of our taxable ordinary income. In addition, the Company is required to meet certain asset and income tests.
As a REIT, we will generally not be subject to corporate level Federal income tax on taxable income we distribute currently to our stockholders. If we fail to qualify as a REIT in any taxable year, we will be subject to Federal income taxes at regular corporate rates and may not be able to qualify as a REIT for four4 subsequent taxable years. Even if we qualify for taxation as a REIT, we may be subject to certain state and local taxes on our income or property, and to Federal income and excise taxes on our undistributed taxable income and capital gains. We are currently statutorily open to audit by the Internal Revenue Service for the years ended December 31, 20152017 through 20182020 and are statutorily open to audit by state taxing authorities for the years ended December 31, 20142016 through 2018.2020.
In conjunction with the BPY Transaction, certain of BPR’sBPYU’s subsidiaries contributed inmade a taxable manner acontribution of portion of their interests in specific assets to a newly formed corporate subsidiary of BPRI. This taxable contribution caused an increase in the tax basis of the contributed assets to fair market value at the corporate subsidiary level and generated a related taxable gain to the Company, which has been distributed to shareholders. The increase in tax basis in the assets created a temporary book to tax basis temporary difference of approximately $2.6 billion and a related deferred tax asset of $638.5 million within the newly formed subsidiary of BPRI. We determined that this deferred tax asset was properly recorded through our consolidated income statementstatements and that no valuation allowance is necessary on the deferred tax assets as of December 31, 20182020 primarily due to our ability to recognize the benefit of the increased tax basis through operations or sale of properties. Future fair market value declines related to the contributed assets could require a valuation allowance on all or a portion of the deferred tax asset. The Company continues to evaluate the ability to recognize the benefit through operations, sales of properties, and prudent and feasible tax planning strategies.
The (benefit from) provision for (benefit from) income taxes for the years ended December 31, 2018, 2017,2020, 2019, and 20162018 are as follows:
| | | | | | | | | | | | | | | | | |
| | December 31, 2020 | | December 31, 2019 | | December 31, 2018 |
| Current | $ | (5,967) | | | $ | 17,568 | | | $ | 6,499 | |
| Deferred | (29,400) | | | (7,885) | | | (600,685) | |
| Total | $ | (35,367) | | | $ | 9,683 | | | $ | (594,186) | |
Brookfield Property REIT Inc.
NOTES TO CONSOLIDATED FINANCIAL STATEMENTS
(Dollars in thousands, except share and per share amounts)
|
| | | | | | | | | | | |
| | December 31, 2018 | | December 31, 2017 | | December 31, 2016 |
| Current | $ | 6,499 |
| | $ | 8,658 |
| | $ | 804 |
|
| Deferred | (600,685 | ) | | (19,554 | ) | | 97 |
|
| Total | $ | (594,186 | ) | | $ | (10,896 | ) | | $ | 901 |
|
| | | | | | | | | | | | | | | | | |
| December 31, 2020 | | December 31, 2019 | | December 31, 2018 |
| Tax at statutory rate on (losses) earnings from continuing operations before income taxes | $ | (156,733) | | | $ | 93,239 | | | $ | 734,235 | |
| (Decrease) increase in valuation allowance, net | (209) | | | 1,505 | | | 117 | |
| State income (benefit) taxes, net of federal income tax | (3,510) | | | 5,649 | | | 2,879 | |
| Investment Tax Credits | 0 | | | (1,958) | | | (12,134) | |
| Tax at statutory rate on REIT income (losses) not subject to Federal income taxes | 156,476 | | | (87,988) | | | (695,546) | |
| Tax (benefit) expense from prior period | (17,889) | | | 13,514 | | | 16,369 | |
| Tax benefit from change in state rates and apportionment | (13,501) | | | (15,538) | | | 0 | |
| Tax benefit from BPY Transaction | 0 | | | 0 | | | (638,494) | |
| Other permanent differences | (1) | | | 1,260 | | | (1,612) | |
| (Benefit from) provision for income taxes | $ | (35,367) | | | $ | 9,683 | | | $ | (594,186) | |
Realization of a deferred tax benefit is dependent upon generating sufficient taxable income in future periods. The Company has $78.7$146.4 million of federal and state loss carryforwards, the majority of which are currently scheduled to expire in subsequent years through 2037. Federal2040. State operating losses of $7.4$29.4 million generated during 2018 and later will be carried forward indefinitely until utilized.
Brookfield Property REIT INC.
NOTES TO CONSOLIDATED FINANCIAL STATEMENTS (Continued)
(Dollars in thousands, except share and per share amounts)
Each TRS and certain REIT entities subject to state income taxes are tax paying components for purposes of classifying deferred tax assets and liabilities. Net deferred tax assets (liabilities) are summarized as follows:
| | | | | | | | | | | | | | | | | |
| | December 31, 2020 | | December 31, 2019 | | December 31, 2018 |
| Total deferred tax assets | $ | 666,458 | | | $ | 638,513 | | | $ | 630,215 | |
| Valuation allowance | (10,103) | | | (10,362) | | | (8,857) | |
| Net deferred tax assets | 656,355 | | | 628,151 | | | 621,358 | |
| Total deferred tax liabilities | (1,295) | | | (2,491) | | | (2,083) | |
| Net deferred tax assets | $ | 655,060 | | | $ | 625,660 | | | $ | 619,275 | |
|
| | | | | | | | | | | |
| | December 31, 2018 | | December 31, 2017 | | December 31, 2016 |
| Total deferred tax assets | $ | 630,215 |
| | $ | 29,801 |
| | $ | 22,090 |
|
| Valuation allowance | (8,857 | ) | | (8,740 | ) | | (15,147 | ) |
| Net deferred tax assets | 621,358 |
| | 21,061 |
| | 6,943 |
|
| Total deferred tax liabilities | (2,083 | ) | | (2,428 | ) | | (3,843 | ) |
| Net deferred tax assets | $ | 619,275 |
| | $ | 18,633 |
| | $ | 3,100 |
|
Due to the uncertainty of the realization of certain tax carryforwards, we have established valuation allowances on those deferred tax assets that we do not reasonably expect to realize. Deferred tax assets that we believe have only a remote possibility of realization have not been recorded.
The tax effects of temporary differences and carryforwards included in the net deferred tax assets (liabilities) as of December 31, 2018,2020, December 31, 20172019 and December 31, 20162018 are summarized as follows:
| | | | | | | | | | December 31, 2020 | | December 31, 2019 | | December 31, 2018 |
| | December 31, 2018 | | December 31, 2017 (1) | | December 31, 2016 | |
| Operating loss and other carryforwards (2) | $ | 63,604 |
| | $ | 47,577 |
| | $ | 42,496 |
| |
| Operating loss and other carryforwards (1) | | Operating loss and other carryforwards (1) | $ | 56,492 | | | $ | 42,187 | | | $ | 58,328 | |
| Other TRS property, primarily differences in basis of assets and liabilities | 564,528 |
| | (20,204 | ) | | (24,249 | ) | Other TRS property, primarily differences in basis of assets and liabilities | 607,474 | | | 582,970 | | | 564,528 | |
| Interest deduction carryforwards | | Interest deduction carryforwards | 1,197 | | | 10,865 | | | 5,276 | |
| Valuation allowance | (8,857 | ) | | (8,740 | ) | | (15,147 | ) | Valuation allowance | (10,103) | | | (10,362) | | | (8,857) | |
| Net deferred tax assets | $ | 619,275 |
| | $ | 18,633 |
| | $ | 3,100 |
| Net deferred tax assets | $ | 655,060 | | | $ | 625,660 | | | $ | 619,275 | |
| |
(1) | Due to the changes in the Tax Cuts and Jobs Act, the deferred tax assets and liabilities including the valuation allowances were revalued as of December 31, 2017 using the new corporate tax rate. |
| |
(2) | Includes solar and other tax credits of $43.5 million, $33.6 million and $20.6 million as of December 31, 2018, December 31, 2017 and December 31, 2016, respectively. |
(1) Includes solar and other tax credits of $36.1 million, $29.4 million and $43.5 million as of December 31, 2020, December 31, 2019 and December 31, 2018, respectively.
Brookfield Property REIT Inc.
NOTES TO CONSOLIDATED FINANCIAL STATEMENTS
(Dollars in thousands, except share and per share amounts)
We have no0 unrecognized tax benefits recorded pursuant to uncertain tax positions as of December 31, 20182020 and December 31, 2017.2019.
NOTE 8 WARRANTS
As of December 31, 2016, Brookfield and certain parties who were previously members of a Brookfield investor consortium owned 73,930,000 warrants (the "Warrants") to purchase common stock of GGP with an initial weighted average exercise price of $10.70. Each Warrant was fully vested upon issuance, had a term of seven years and expired on November 9, 2017. Below is a summary of Warrants that were originally issued.
|
| | | | | | | |
| Warrant Holder | | Number of Warrants | | Initial Exercise Price |
| Brookfield - A | | 57,500,000 |
| | $ | 10.75 |
|
| Brookfield - B | | 16,430,000 |
| | 10.50 |
|
| | | 73,930,000 |
| | |
|
The exercise prices of the Warrants were subject to adjustment for future dividends, stock dividends, distribution of assets, stock splits or reverse splits of our common stock or certain other events. In accordance with the agreement, these calculations adjusted both the exercise price and the number of shares issuable for the originally issued 73,930,000 Warrants. During 2017, the number of shares issuable upon exercise of the outstanding Warrants changed as follows:
Brookfield Property REIT INC.
NOTES TO CONSOLIDATED FINANCIAL STATEMENTS (Continued)
(Dollars in thousands, except share and per share amounts)
|
| | | | | | | | | |
| | | | | Exercise Price |
| Record Date | | Issuable Shares | | Brookfield - A | | Brookfield - B |
| April 13, 2017 | | 94,170,214 |
| | 8.44 |
| | 8.24 |
|
| July 13, 2017 | | 95,057,357 |
| | 8.36 |
| | 8.17 |
|
| October 13, 2017 | | 17,942,385 |
| | 8.27 |
| | 8.08 |
|
The warrant holders had the option for 57,500,000 Warrants to either full share settle (i.e. deliver cash for the exercise price of the Warrants) or net share settle at the option of the holder. The remaining 16,430,000 Warrants had to be net share settled. As of December 31, 2017, no Warrants remained outstanding.
During 2017, 83,866,187 shares of the Company's common stock were issued for exercised Warrants. As of December 31, 2017, no Warrants remained outstanding. Refer to the following paragraphs for details pertaining to each transaction.
On October 6, 2017, Brookfield exercised Warrants to purchase shares of our common stock, par value $0.01 per share, using a combination of the net share settlement method and the full physical settlement method. On October 6, 2017, the Warrants exercised by Brookfield were settled in accordance with the terms of the Warrant agreement. 55,296,573 shares of common stock were issued to Brookfield for an aggregate of $462.4 million in cash and 13,523,695 shares of common stock were issued to Brookfield under net share settlement at a price of $21.21 per share.
On October 25, 2017, Abu Dhabi Investment Authority ("ADIA") exercised 5,549,327 warrants to purchase common stock, par value $0.01 per share, using the net share settlement method. On October 30, 2017, the Warrants exercised by ADIA were settled in accordance with the terms of the Warrant Agreement and 4,314,330 shares of common stock were issued to ADIA. The Company withheld 2,896,465 shares of common stock, valued at the closing price for the common stock on October 25, 2017 of $20.60, to satisfy the aggregate exercise price.
On November 2, 2017, The Northern Trust Company exercised 8,258,881 Warrants to purchase common stock, par value $0.01 per share, using the full share settlement method. On November 7, 2017, the Warrants exercised were settled in accordance with the terms of the Warrant Agreement and 10,731,589 shares of common stock were issued for an aggregate of $88.8 million in cash.
NOTE 9 RENTALS UNDER OPERATING LEASES
We receive rental income from the leasing of retail and other space under operating leases. The minimum future rentals based on operating leases of our Consolidated Properties as of December 31, 2018 are as follows:
|
| | | | |
| Year | | Amount |
| 2019 | | $ | 764,196 |
|
| 2020 | | 696,381 |
|
| 2021 | | 621,582 |
|
| 2022 | | 543,232 |
|
| 2023 | | 464,453 |
|
| Subsequent | | 1,442,312 |
|
| | | $ | 4,532,156 |
|
Minimum future rentals exclude amounts which are payable by certain tenants based upon a percentage of their gross sales or as reimbursement of operating expenses and amortization of above and below-market tenant leases. Such operating leases are with a variety of tenants, the majority of which are national and regional retail chains and local retailers, and consequently, our credit risk is concentrated in the retail industry.
Brookfield Property REIT INC.
NOTES TO CONSOLIDATED FINANCIAL STATEMENTS (Continued)
(Dollars in thousands, except share and per share amounts)
NOTE 10 EQUITY AND REDEEMABLE NONCONTROLLING INTERESTS
Allocation to Noncontrolling Interests
Noncontrolling interests consists of the redeemable interests related to BPROP Common, Preferred, and LTIP Units and the noncontrolling interest in our consolidated joint ventures. The following table reflects the activity included in the allocation to noncontrolling interests.
| | | | Year Ended December 31, | | Year Ended December 31, |
| | 2018 | | 2017 | | 2016 | | 2020 | | 2019 | | 2018 |
| Distributions to preferred BPROP units ("Preferred Units") | $ | (4,636 | ) | | $ | (1,867 | ) | | $ | (8,680 | ) | Distributions to preferred BPROP units ("Preferred Units") | $ | (3,616) | | | $ | (5,752) | | | $ | (4,636) | |
| Net income allocation to noncontrolling interests in BPROP from continuing operations ("Common Units") | (31,803 | ) | | (4,830 | ) | | (7,051 | ) | Net income allocation to noncontrolling interests in BPROP from continuing operations ("Common Units") | 0 | | | 0 | | | (31,803) | |
| Net income allocation to noncontrolling interests in BPROP from continuing operations ("LTIP units") | (8,159 | ) | | (1,502 | ) | | (2,920 | ) | Net income allocation to noncontrolling interests in BPROP from continuing operations ("LTIP units") | 0 | | | 0 | | | (8,159) | |
| Net income allocated to noncontrolling interest in consolidated real estate affiliates | (915 | ) | | (1,340 | ) | | (1,255 | ) | |
| Net income allocated to noncontrolling interests of the Operating Partnership (1) | (27,715 | ) | | — |
| | — |
| |
| Net (income) loss allocated to noncontrolling interest in consolidated real estate affiliates | | Net (income) loss allocated to noncontrolling interest in consolidated real estate affiliates | 10,906 | | | (577) | | | (915) | |
| Net (income) loss allocated to noncontrolling interests of the Operating Partnership (1) | | Net (income) loss allocated to noncontrolling interests of the Operating Partnership (1) | 82,833 | | | (41,702) | | | (27,715) | |
| Allocation to noncontrolling interests | (73,228 | ) | | (9,539 | ) | | (19,906 | ) | Allocation to noncontrolling interests | 90,123 | | | (48,031) | | | (73,228) | |
| Other comprehensive (income) loss allocated to noncontrolling interests | (39 | ) | | 89 |
| | 2 |
| Other comprehensive (income) loss allocated to noncontrolling interests | 1,379 | | | 0 | | | (39) | |
| Comprehensive income allocated to noncontrolling interests | $ | (73,267 | ) | | $ | (9,450 | ) | | $ | (19,904 | ) | |
| Comprehensive (income) loss allocated to noncontrolling interests | | Comprehensive (income) loss allocated to noncontrolling interests | $ | 91,502 | | | $ | (48,031) | | | $ | (73,267) | |
(1) Represents the noncontrolling interest of our institutional investor (Note 3).
Noncontrolling Interests
The noncontrolling interest related to the Common, Preferred, and LTIP Units of BPROP are presented either as redeemable noncontrolling interests in mezzanine equity or as noncontrolling interests in our permanent equity on our Consolidated Balance Sheets. Classification as redeemable or permanent equity is considered on a tranche-by-tranche basis and is dependent on whether we could be required, under certain events outside of our control, to redeem the securities for cash by the holders of the securities, Thosethose tranches for which we could be required to redeem the security for cash are included in redeemable equity. If we control the decision to redeem the securities for cash, the securities are classified as permanent equity.
The redeemable Common and Preferred Units of BPROP are recorded at the greater of the carrying amount adjusted for the noncontrolling interest’s share of the allocation of income or loss (and its share of other comprehensive income or loss) and dividends or their redemption value (i.e. fair value) as of each measurement date. The excess of the fair value over the carrying amount from period to period is recorded within additional paid-in capital in our Consolidated Balance Sheets. Allocation to noncontrolling interests is presented as an adjustment to net income to arrive at net income (loss) attributable to BPR.BPYU. The preferred redeemable noncontrolling interests have been recorded at carrying value.
Generally, each Series K Preferred Unit of BPROP entitles its holder to distributions and a liquidation preference identical to those established for each share of BPR’s Class A Stock, and each Series L Preferred Unit of BPROP entitles its holder to distributions and a liquidation preference identical to those established for each share of BPR’s Class B Stock. Each LTIP Unit of BPROP is convertible into, and, except for the level of preference, entitles its holder to regular and liquidating distributions equivalent to that of, 0.016256057 Series K Preferred Units, subject to adjustment. Each Series K unit received by an LTIP holder in connection with the BPY Transaction is redeemable for a cash amount equal to the average closing price of BPR’s Class A Stock for the five consecutive trading days ending on the date of the notice of redemption, provided that BPR may elect to satisfy such redemption by delivering one share of BPR’s Class A Stock. If the holders had requested redemption of the Class A stock and Preferred Units as of December 31, 2018, the aggregate amount of cash the company would have paid would have been $1.77 billion and $68.6 million, respectively.
Brookfield Property REIT INC.
NOTES TO CONSOLIDATED FINANCIAL STATEMENTS (Continued)
(Dollars in thousands, except share and per share amounts)
Holders of Series B Preferred Units, Series D Preferred Units, Series E Preferred Units and Series G Preferred Units of BPROP are each entitled to periodic distributions at the rates set forth in the FifthSixth Amended and Restated Agreement of Limited Partnership of BPROP. Generally, each Series K Preferred Unit of BPROP entitles its holder to distributions and a liquidation preference identical to those established for each share of BPYU's Class A Stock. The holders of Series L Preferred Units of BPROP are generally entitled to a pro rata distribution of an aggregate cash amount equal to the sum of (i) the aggregate cash dividends declared on all outstanding shares of BPYU's Class B-1 Stock and Class B-2 Stock (together, the "Class B Stock") and (ii) the aggregate cash dividends declared on all outstanding shares of BPYU's Series B Preferred Stock. Holders of Common Units of BPROP are entitled to distributions of all or a portion of BPROP’s remaining net operating cash flow, when and as declared by BPROP’s general partner. However, the FifthSixth Amended and Restated Agreement of Limited Partnership of
Brookfield Property REIT Inc.
NOTES TO CONSOLIDATED FINANCIAL STATEMENTS
(Dollars in thousands, except share and per share amounts)
BPROP permits distributions solely to BPRBPYU if such distributions were required to allow the Company to comply with the REIT distribution requirements or to avoid the imposition of excise tax.
Noncontrolling Interests - Permanent
As of December 31, 2020, there were 9,717.658 Series B Preferred Units of BPROP outstanding. The Series B Preferred Units have a carrying value of $50 per unit.
Also, as of December 31, 2020, there were 776,734.389 Common Units of BPROP outstanding and 315,992.124 Series K Preferred Units of BPROP held by former common unit holders. These Series K Units were established at $21 per unit and are not subject to adjustment based on fair value.
Noncontrolling Interests - Redeemable
The Series D Preferred Units of BPROP are convertible based on a conversion ratio of 1.50821, which is the quotient of the Series D Preferred Unit’s $50 liquidation preference and $33.151875 conversion price. Upon conversion, each Series D Preferred Unit entitles its holder to (i) $21.9097 in cash, (ii) a number of Series K Preferred Units of BPROP equal to (x) 0.40682134 Series K Preferred Units (which is subject to adjustment), multiplied by (y) the Series D conversion ratio; and (iii) a number of Common Units of BPROP equal to (x) one Common Unit (which is subject to adjustment), multiplied by (y) the Series D conversion ratio. As of December 31, 2020, there were 532,749.6574 Series D Preferred Units of BPROP outstanding.
The Series E Preferred Units of BPROP are convertible based on a conversion ratio of 1.29836, which is the quotient of the Series E Preferred Unit’s $50 liquidation preference and $38.51 conversion price. Upon conversion, each Series E Preferred Unit entitles its holder to (i) $18.8613 in cash, (ii) a number of Series K Preferred Units of BPROP equal to (x) 0.40682134 Series K Preferred Units (which is subject to adjustment), multiplied by (y) the Series E conversion ratio; and (iii) a number of Common Units of BPROP equal to (x) one Common Unit (which is subject to adjustment), multiplied by (y) the Series E conversion ratio.
As of December 31, 2018,2020, there were 532,749.6574 Series D Preferred Units of BPROP outstanding and 502,657.8128 Series E Preferred Units of BPROP outstanding.
Also, asThe holder of December 31, 2018, there were 9,717.658 Series B Preferred Units of BPROP outstanding. As of July 10, 2017, the Series B Preferred Unit conversion option expired, and each Series B Preferred Unit now has a fixed cash redemption value of $50 per unit. As of December 31, 2018, there were 4,176,972.006 Common Units of BPROP outstanding that had been issued upon conversion of Series B Preferred Units and 1,044,082.000 Series K Preferred Units of BPROP outstanding that were distributed with respect to such Common Units, which are both subject to certain redemption rights.
Only the holders of the Series K Preferred UnitsUnit of BPROP issued upon conversion of Series D Preferred Units or Series E Preferred Units of BPROP havehas the right to redeem such Series K Preferred UnitsUnit for a cash amount equal to the average closing price of BPR’sBPYU’s Class A Stock for the five consecutive trading days ending on the date of the notice of redemption, provided that BPRBPYU may elect to satisfy such redemption by delivering one share of BPR’sBPYU’s Class A Stock. The holder of each Common Unit of BPROP issued upon conversion of Series D Preferred Units or Series E Preferred Units of BPROP has the right to redeem such Common Unit for a cash amount equal to $0.324405869, subject to adjustment.
Except as otherwise noted, the Common, Preferred, andEach LTIP UnitsUnit of BPROP are notis convertible orinto, and, except for the level of preference, entitles its holder to regular and liquidating distributions equivalent to that of 0.016256057 Series K Preferred Units, subject to adjustment. Each Series K Preferred Unit received by an LTIP holder in connection with the BPY Transaction is redeemable atfor a cash amount equal to the electionaverage closing price of eitherBPYU's Class A Stock for five consecutive trading days ending on the holder or BPROP.date of the notice of redemption, provided that BPYU may elect to satisfy such redemption by delivering one share of BPYU's Class A Stock. If the holders had requested redemption of the Class A Stock and Preferred Units as of December 31, 2020, the aggregate amount of cash the Company would have paid would have been $584.6 million and $55.8 million, respectively.
Brookfield Property REIT INC.Inc.
NOTES TO CONSOLIDATED FINANCIAL STATEMENTS (Continued)
(Dollars in thousands, except share and per share amounts)
The following table reflects the activity of the redeemable noncontrolling interests for the years ended December 31, 2018, 2017,2020, 2019, and 2016.2018.
| | | | | |
| Balance at January 1, 2018 | $ | 248,126 | |
| Net income | 31,803 | |
| Distributions | (3,685) | |
| Adjustment of Mezzanine Equity to fair value | (40,294) | |
| Common Unit Redemption to Common Stock | (85,818) | |
| |
| |
| Other comprehensive income | 39 | |
| Reclassification of Mezzanine Equity to Permanent Equity | (37,841) | |
| Pre-Closing Dividend | (60,673) | |
| BPR Equity Recapitalization | 21,923 | |
| LTIP Conversion to Series K | 116 | |
| |
| Balance at December 31, 2018 | $ | 73,696 | |
| Balance at January 1, 2019 | $ | 73,696 | |
| Net income | 3,545 | |
| |
| |
| |
| |
| |
| |
| |
| Series K Preferred Unit redemption | (15,006) | |
| |
| Balance at December 31, 2019 | $ | 62,235 | |
| Balance at January 1, 2020 | 62,235 | |
| Net income | 0 | |
| Series K Preferred Unit redemption | (1,409) | |
| |
| |
| |
| |
| |
| |
| |
| |
| Balance at December 31, 2020 | $ | 60,826 | |
|
| | | |
| Balance at January 1, 2016 | $ | 287,627 |
|
| Net income | 7,051 |
|
| Distributions | (5,449 | ) |
| Redemption of operating partnership units | (2,120 | ) |
| Preferred Unit Redemption to Common Stock | (2 | ) |
| Other comprehensive income | (3,205 | ) |
| Fair value adjustment for redeemable noncontrolling interests in Operating Partnership | (21,175 | ) |
| Balance at December 31, 2016 | $ | 262,727 |
|
| Balance at January 1, 2017 | 262,727 |
|
| Net income | 4,830 |
|
| Distributions | (6,573 | ) |
| Redemption of operating partnership units | (651 | ) |
| Preferred Unit Redemption to Common Stock | — |
|
| Other comprehensive income | (89 | ) |
| Fair value adjustment for redeemable noncontrolling interests in Operating Partnership | (12,118 | ) |
| Balance at December 31, 2017 | $ | 248,126 |
|
| Balance at January 1, 2018 | $ | 248,126 |
|
| Net income | 31,803 |
|
| Distributions | (3,685 | ) |
| Adjustment of Mezzanine Equity to fair value | (40,294 | ) |
| Common Unit Redemption to Common Stock | (85,818 | ) |
| Other comprehensive income | 39 |
|
| Reclassification of Mezzanine Equity to Permanent Equity | (37,841 | ) |
| Pre-Closing Dividend | (60,673 | ) |
| BPR Equity Recapitalization | 21,923 |
|
| LTIP Conversion to Series K | 116 |
|
| Balance at December 31, 2018 | $ | 73,696 |
|
Redeemable Class A Stock
Class A Stock refers to the Company's Class A Stock, par value $0.01 per share, authorized and issued to unaffiliated GGP common stockholders that were unaffiliated with BPY as part of the BPY Transaction.
Each share of Class A Stock is entitled to cumulative dividends per share in a cash amount equal in value to the amount of any distribution made on a BPY unit. In addition, each share of Class A Stock is exchangeable for one BPY unit or its cash equivalent (the form of payment to be determined by BPUS,BPY or an affiliate, in its sole discretion). Such exchange and distribution rights are subject to adjustment in the event of certain dilutive or other capital events by BPY or BPR.BPYU. If and to the extent declared by the Company's board of directors, the record and payment dates for the dividends or other distributions upon the shares of Class A Stock, to the extent not prohibited by applicable law, is expected to be the same as the record and payment dates for the dividends or other distributions upon the BPY units. Pursuant to the terms of the Company's charter, all such dividends to holders of Class A Stock will be paid prior and in preference to any dividends or distributions on the Class B Stock, Series B Preferred Stock or Class C Stock or the Common Stock and will be fully declared and paid before any dividends are declared and paid or any other distributions are made on any Class B Stock, Class CSeries B Preferred Stock or the CommonClass C Stock. The holders of Class A Stock shall not be entitled to any dividends from BPRBPYU other than the Class A dividend.
Brookfield Property REIT INC.
NOTES TO CONSOLIDATED FINANCIAL STATEMENTS (Continued)
(Dollars in thousands, except share and per share amounts)
Upon any liquidation, dissolution or winding up of the Company that is not a Market Capitalization Liquidation Event (as defined below) or substantially concurrent with the liquidation, dissolution or winding up of BPY, the holders of Class A Stock are entitled to a cash amount, for each share of Class A Stock, equal to the market price of one BPY unit (subject to adjustment in the event of certain dilutive or other capital events by BPY or BPR)BPYU) on the date immediately preceding announcement of such liquidation, dissolution or winding up, plus all declared and unpaid dividends. If, upon any such liquidation, dissolution or winding up, the assets of BPRBPYU are insufficient to make such payment in full, then the assets of BPRBPYU will be distributed among the holders of Class A Stock ratably in proportion to the full amounts to which they would otherwise be respectively entitled to receive.
If the market capitalization of the Class A Stock (i.e., if the price per share of Class A Stock, multiplied by the number of shares of Class A Stock outstanding) averages, over any period of 30 consecutive trading days, less than one (1) billion dollars, the Company's Board of Directors
Brookfield Property REIT Inc.
NOTES TO CONSOLIDATED FINANCIAL STATEMENTS
(Dollars in thousands, except share and per share amounts)
BPYU board will have the right to liquidate BPR’sBPYU’s assets and wind up BPR’sBPYU’s operations (a "Market Capitalization Liquidation Event"). Upon any Market Capitalization Liquidation Event, the holders of Class A Stock shall be entitled to a cash amount, for each share of Class A Stock, equal to the dollar volume-weighted average price of one BPY unit over the ten (10) trading days immediately following the public announcement of such Market Capitalization Liquidation Event, plus all declared and unpaid dividends. If, upon any such market capitalization liquidation event,Market Capitalization Liquidation Event, the assets of BPRBPYU are insufficient to make such payment in full, then the assets of BPRBPYU will be distributed among the holders of Class A Stock ratably in proportion to the full amounts which they would otherwise be respectively entitled to receive. Notwithstanding the foregoing, upon any market capitalization liquidation event,Market Capitalization Liquidation Event, BPY may elect to exchange all of the outstanding shares of the Class A Stock for BPY units on a one-for-one basis, subject to adjustment in the event of certain dilutive or other capital events by BPY or BPR.BPYU.
Holders of Class A Stock shall have the right to exchange all or a portion of their Class A Stock for cash at a price equal to the value of an equivalent number of BPY units, subject to adjustment in the event of certain dilutive or other capital events by BPY or BPR.BPYU. Upon receipt of a request for exchange, BPRBPYU will deliver a notice of exchange to BPY within one (1) business day and will have ten (10) business days to deliver the cash amount to the tendering holder. Upon receipt of the notice of exchange, BPY or an affiliate may elect to satisfy BPR’sBPYU’s exchange obligation by exchanging all of the shares of the Class A Stock tendered for BPY units on a one-for-one basis. This initial one-for-one conversion factor is subject to adjustment in the event of certain dilutive or other capital events by BPY or BPR.BPYU. If so elected, BPY will have to satisfy such obligation within ten (10) business days from the date of the notice of exchange. If BPY exercises its right to assume the exchange obligation, units of BPY units will be delivered in exchange for the Class A Stock and such Class A Stock will automatically be converted into Class B Stock.
As there are certain events outside of the Company’s control whereby it could be required to redeem the Class A Stock for cash by the holders of the securities, the Class A Stock is included in redeemable equity. Accordingly, the Class A Stock are recorded at the greater of the carrying amount or their redemption value (i.e. fair value) as of each measurement date. The excess of the fair value over the carrying amount from period to period is recorded within additional paid-in capital in the Company’s Consolidated Balance Sheets. There is no adjustment within additional paid-in capital for the Class A stock when the fair value is less than the carrying value.
Class B Stock
The following descriptionCompany’s shareholders approved the amendment and restatement of the Company’s charter at its annual stockholder meeting on June 19, 2019 (the "Restated Charter"), which became effective on June 26, 2019 and, among other things, authorized the Company’s issuance of up to 965,000,000 shares of a new class of stock called Class BB-2 Stock, sets forth certain general terms and provisionspar value of Class B Stock.$0.01 per share. Each share of Class B-1B-2 Stock shall have terms (including the same powers, preferences and relative, participating, optional and other special rights, and qualifications, limitations and restrictions) identical to the terms of a share of Class B Stock. References herein toB-1 Stock other than voting rights. The following description sets forth certain general terms and provisions of the Class B Stock shall be deemed to be a reference to Class B Stock and Class B-1 Stock, as applicable. Stock.
Pursuant to the Restated Charter Amendments and subject to the prior rights of holders of all classes, including the Class A Stock, and any series of preferred stock at the time outstanding having prior rights as to dividends, each share of Class B Stock entitles its holder to cumulative dividends per share in a cash amount at a rate of 10%6.5% per year of the Class B liquidation amount per share with(which rate was 10.0% per year until the effective date of the Restated Charter on June 26, 2019) equal to $21.39 per share. On October 18, 2018, each holder of the Class B-1 Stock hereby irrevocably waived, all of its right, title and interest in and to 2.5% of the dividend rate, including without elimination all rights and entitlement to payment of such amounts. This partial dividend waiver resulted in a 7.5% effective rate per year of the Class B liquidation amountLiquidation Amount per share equal toand was terminated upon the last closing price of a share of GGP common stock on the New York Stock Exchange on the trading day immediately preceding the date the series B designations was filed with the Secretary of Stateeffectiveness of the State of Delaware.Restated Charter. Dividends on the Class B Stock may also be paid by an in-kind distribution of additional shares of Class B Stock or any other class of shares of capital stock of BPRBPYU ranking junior to the Class A Stock. Dividends on the Class B Stock shall be cumulative and shall be payable quarterly in arrears, when, as and if declared by the Company's Board of Directors with respect to dividends on the Class B Stock.
Brookfield Property REIT INC.
NOTES TO CONSOLIDATED FINANCIAL STATEMENTS (Continued)
(Dollars in thousands, except share and per share amounts)
Holders of the Class B Stock are not entitled to receive dividends, redemptions or other distributions: (i) unless and until (a) BPRBPYU has paid the aggregate dividends owed to the holders of Class A Stock and (b) the dividend coverage ratio (as defined below) is equal to or greater than 1.25:1, (ii) if any tendering holder of Class A Stock has not received the cash or BPY units due upon exchange or (iii) if holders of Class A Stock are owed cash in the event of an adjustment to the conversion
Brookfield Property REIT Inc.
NOTES TO CONSOLIDATED FINANCIAL STATEMENTS
(Dollars in thousands, except share and per share amounts)
factor. The dividend coverage ratio is referred to as a ratio of (i) BPYU’s funds from operations, as calculated in accordance with the definition of funds from operations used by the National Association of Real Estate Investment Trusts ("Nareit"), for the immediately preceding fiscal quarter, to (ii) the product of (a) the amount of the most recent regular quarterly distribution declared by BPY on each BPY unit, times (b) the number of shares of Class A Stock outstanding at such time.
Series B Preferred Stock
The following description sets forth certain general terms and provisions of the Series B Preferred Stock, par value $0.01 per share, of the Company (the "Series B Preferred Stock").
Pursuant to the Restated Charter and subject to the prior rights of holders of all classes, including the Class A Stock, Class B Stock and any series of preferred stock at the time outstanding having prior rights as to dividends, each share of Series B Preferred Stock will entitle its holder to cumulative dividends per share in a cash amount at a rate of 8.65% per year of the Class B liquidation amount per share (which rate was 10.0% until the effective date of the Restated Charter on June 26, 2019), with such Class B liquidation amount per share equal to $21.39. Dividends on the Series B Preferred Stock may also be paid by an in-kind distribution of additional shares of Series B Preferred Stock or any other class of shares of capital stock of BPYU ranking junior to the Class A Stock and Class B Stock. Dividends on the Series B Preferred Stock shall be cumulative and shall be payable quarterly in arrears, when, as and if declared by the Company's Board of Directors with respect to dividends on the Series B Preferred Stock.
Holders of the Series B Preferred Stock are not entitled to receive dividends, redemptions or other distributions: (i) unless and until (a) BPYU has paid the aggregate dividends owed to the holders of Class A Stock and Class B Stock and (b) the dividend coverage ratio (as defined below) is equal to or greater than 1.25:1, (ii) if any tendering holder of Class A Stock has not received the cash or BPY units due upon exchange or (iii) if holders of Class A Stock are owed cash in the event of an adjustment to the conversion factor. The dividend coverage ratio is referred to as a ratio of (i) BPR’sBPYU’s funds from operations, as calculated in accordance with the definition of funds from operations used by Nareit, for the immediately preceding fiscal quarter, to (ii) the product of (a) the amount of the most recent regular quarterly distribution declared by BPY on each BPY unit, times (b) the number of shares of Class A Stock outstanding at such time.
Class C Stock
Class C Stock refers to the Company's Class C Stock, par value $0.01 per share, authorized as part of the BPY Transaction. Pursuant to the amended charter and subject to the prior rights of holders of all classes, including the holders of Class A Stock, and Class B Stock, Series B Preferred Stock and any series of preferred stock at the time outstanding having prior rights as to dividends, each share of Class C Stock entitleswill entitle its holder to dividends when, as and if declared by the Company's Board of Directors out of any assets of BPRBPYU legally available therefore. The record and payment date for dividends on shares of Class C Stock shall be such date that the Company's Board of Directors shall designate.
Notwithstanding the foregoing, holders of the Class C Stock are not entitled to receive dividends, redemptions or other distributions: (i) unless and until (a) BPRBPYU has paid the aggregate dividends owed to the holders of Class A Stock and (b) the dividend coverage ratio is equal to or greater than 1.25:1, (ii) if any tendering holder of Class A Stock has not received the cash or BPY units due upon exchange, (iii) if holders of Class A Stock are owed cash in the event of an adjustment to the conversion factor or (iv) unless and until the full cumulative dividends on the Class B Stock and Series B Preferred Stock for all past dividend periods and any current dividend periods have been (or contemporaneously are) (a) declared or paid in cash or (b) declared and a sum sufficient for the payment thereof in cash is set apart for such payment.
Voting Rights
| | | | | | | | | | | | | | |
| Stock Class | Authorized | Issued | Shares Outstanding | Votes per Share |
| Class A Stock | 4,517,500,000 | | 40,545,336 | | 39,127,335 | | 1:1 |
| Class B-1 Stock | 4,517,500,000 | | 202,400,441 | | 202,400,441 | | 1:1 |
| Class B-2 Stock | 965,000,000 | | 121,203,654 | | 121,203,654 | | 0:1 |
| Series B Preferred Stock | 425,000,000 | | 202,438,184 | | 202,438,184 | | 1:1 |
| Class C Stock | 1,000,000,000 | | 640,051,301 | | 640,051,301 | | 1:1 |
Brookfield Property REIT Inc.
NOTES TO CONSOLIDATED FINANCIAL STATEMENTS
(Dollars in thousands, except share and per share amounts)
All share counts in table above are as of December 31, 2020.
Class A Stock Dividend
Our Board of Directors declared Class A Stock dividends during 20182020 and 2019 as follows:
| | | | | | | | | | | | | | | | | | | | |
| Declaration Date | | Record Date | | Payment Date | | Dividend Per Share |
| 2020 | | | | | | |
| November 5 | | November 30 | | December 31 | | $ | 0.3325 | |
| August 5 | | August 31 | | September 30 | | 0.3325 | |
| May 7 | | May 29 | | June 30 | | 0.3325 | |
| February 5 | | February 28 | | March 31 | | 0.3325 | |
| 2019 | | | | | | |
| November 4 | | November 29 | | December 31 | | $ | 0.330 | |
| August 1 | | August 30 | | September 30 | | 0.330 | |
| May 6 | | May 31 | | June 28 | | 0.330 | |
| February 6 | | February 28 | | March 29 | | 0.330 | |
Class A Stock Repurchases and Conversions
On August 1, 2019, the Company’s Board of Directors authorized the repurchase of the greater of (i) 5% of the Company’s Class A Stock that are issued or outstanding or (ii) 10% of its public float of Class A Stock over the next 12 months from time to time as market conditions warrant.
On March 29, 2019, BPYU purchased for cancellation 4,679,802 shares of Class A Stock at a purchase price of $20.30 per share, for an aggregate cost of approximately $95 million, excluding fees and expenses.
In the second quarter of 2019, BPYU purchased 200,000 shares of Class A Stock at an average purchase price of $18.37 per share for an aggregate cost of approximately $3.68 million, which were subsequently canceled in July 2019.
Furthermore, there were 647,250 shares of Class A Stock that were purchased in relation to 2019 restricted stock grants. These shares were purchased at an average purchase price of $19.40 per share for an aggregate cost of approximately $12.59 million.
In the third quarter of 2019, BPYU purchased 197,225 shares of Class A Stock at an average purchase price of $18.56 per share for an aggregate cost of approximately $3.66 million, which were subsequently canceled in the quarter.
In the fourth quarter of 2019, there were no Class A Stock repurchases.
During the year ended December 31, 2019, there were 40,030,429 shares of Class A Stock converted to 35,704,228 shares of Class B-1 Stock, at a weighted average price of $18.97 and $21.39, respectively.
In the first quarter of 2020, BPYU purchased 855,000 shares of Class A Stock in relation to the 2020 restricted stock grant. These shares were purchased at an average price of $18.57 per share for an aggregate cost of approximately $15.87 million.
On August 5, 2020 the Company’s Board of Directors authorized the repurchase of the greater of (i) 5% of the Company’s Class A Stock that are issued or outstanding or (ii) 10% of its public float of Class A Stock over the next 12 months from time to time as market conditions warrant.
On August 18, 2020, a total of 7,321,155 shares of Class A stock were properly tendered for an aggregate cost of approximately $87.9 million, equal to $12.00 per share.
Brookfield Property REIT Inc.
NOTES TO CONSOLIDATED FINANCIAL STATEMENTS
(Dollars in thousands, except share and per share amounts)
|
| | | | | | | | |
| Declaration Date | | Record Date | | Payment Date | | Dividend Per Share |
| 2018 | | | | | | |
| November 1 | | November 30, 2018 | | December 31, 2018 | | $ | 0.315 |
|
| August 28 | | August 31, 2018 | | September 28, 2018 | | 0.315 |
|
CommonIn the fourth quarter of 2020, BPYU purchased for cancellation 2,613,565 shares of Class A Stock Dividendat an average purchase price of $13.32 per share for an aggregate cost of approximately $34.8 million.
During the twelve months ended December 31, 2020, there were 11,579,807 shares of Class A Stock converted to 7,496,429 shares of Class B-1 Stock, at a weighted average price of $13.85 and $21.39, respectively.
Class B Stock and Series B Preferred Stock Dividends
Our Board of Directors did not declare dividends in 2020 for Class B-1 Stock, Class B-2 Stock and Series B Preferred stock. Our Board of Directors declared common stock dividends on the Class B-1 Stock, Class B-2 Stock and the Series B Preferred Stock during 2018 and 20172019 as follows:
|
| | | | | | | | |
| Declaration Date (1) | | Record Date | | Payment Date | | Dividend Per Share |
| 2018 | | | | | | |
| May 3 | | July 13, 2018 | | July 31, 2018 | | $ | 0.22 |
|
| February 7 | | April 13, 2018 | | April 30, 2018 | | 0.22 |
|
| 2017 | | | | | | |
| October 31 | | December 15, 2017 | | January 5, 2018 | | $ | 0.22 |
|
| August 2 | | October 13, 2017 | | October 31, 2017 | | 0.22 |
|
| May 1 | | July 13, 2017 | | July 28, 2017 | | 0.22 |
|
| January 30 | | April 13, 2017 | | April 28, 2017 | | 0.22 |
|
Class B-1 Stock Dividends |
| | | | | | | | | | | | | | | | | | | |
| Declaration Date | | Record Date | | Payment Date | | Average Dividend Per Share |
| 2019 | | | | | | |
| November 4 | | December 25 | | December 25 | | $ | 0.110 | |
On November 4, 2019, a partial dividend was declared in the amount of $0.11 per share of the Class B-1 Stock.
Class B-2 Stock Dividends
| | | | | | | | | | | | | | | | | | | | |
| Declaration Date | | Record Date | | Payment Date | | Average Dividend Per Share |
| 2019 | | | | | | |
| November 4 | | December 25 | | December 25 | | $ | 0.110 | |
On November 4, 2019, a partial dividend was declared in the amount of $0.11 per share of the Class B-2 Stock.
Combined Class B Stock and Series B Preferred Stock (Prior to Restated Charter)
| | | | | | | | | | | | | | | | | | | | |
| Declaration Date | | Record Date | | Payment Date | | Average Dividend Per Share |
| 2019 | | | | | | |
| May 25 | | June 25 | | June 25 | | $ | 0.397 | |
| March 25 | | March 27 | | March 27 | | 1.015 | |
A dividend was declared on the Class B-1 Stock and the Series B Preferred Stock of the Company in the amount equal to all unpaid dividends on such shares from the date of issue to March 31, 2019 at the rate of 7.5% per annum payable on March 27, 2019 to the holders of record of Class B-1 Stock and the Series B Preferred Stock on March 27, 2019 for a combined distribution total of approximately $467.3 million.
In the second quarter of 2019, a dividend was declared on the Class B-1 Stock and the Series B Preferred Stock of the Company in the amount equal to all unpaid dividends on such shares from March 31, 2019 to June 25, 2019 at the rate of 7.5% per annum payable on June 25, 2019 to the holders of record of Class B-1 Stock and the Series B Preferred Stock on June 25, 2019 for a combined distribution total of approximately $183.8 million.
Class B-1 Stock Issuance & Repurchase
In the first quarter of 2019, BPYU repurchased 10,496,703 shares of Class B-1 Stock held by BPR FIN 1 Subco LLC, a related party, for fair market value consideration of $224.5 million, equal to $21.39 per share.
Brookfield Property REIT Inc.
NOTES TO CONSOLIDATED FINANCIAL STATEMENTS
(Dollars in thousands, except share and per share amounts)
In the fourth quarter of 2019, BPYU issued 13,712,834 shares of Class B-1 Stock to BPR FIN 1 Subco LLC, a related party, due to a contribution of $293.3 million, equal to $21.39 per share.
In the third quarter 2020, BPYU issued 19,367,288 shares of Class B-1 Stock to BPR FIN I Subco LLC, a related party, due to total contributions of $414.3 million, equal to $21.39 per share.
In the fourth quarter 2020, BPYU issued 5,513,266 shares of Class B-1 Stock to BPR FIN I Subco LLC, a related party, due to total contributions of 117.9 million, equal to $21.39 per share.
Class B-2 Stock Exchange
On June 26, 2019, following the effectiveness of the Restated Charter, certain subsidiaries of BPR FIN 1 Subco LLC, a related party, exchanged an aggregate of 121,203,654 shares of Class B-1 Stock held by such subsidiaries for 121,203,654 shares of Class B-2 Stock.
Common Stock Dividends
Our Board of Directors did not declare dividends in 2020 on our common stock. Our Board of Directors declared dividends on our common stock during 2019 as follows:
| | | | | | | | | | | | | | | | | | | | |
| Declaration Date (1) | | Record Date | | Payment Date | | Dividend Per Share |
| | | | | | |
| | | | | | |
| | | | | | |
| 2019 | | | | | | |
| May 6 | | May 31, 2019 | | June 28, 2019 | | $ | 0.33 | |
| February 6 | | February 28, 2019 | | March 29, 2019 | | 0.33 | |
| | | | | | |
| | | | | | |
| | | | | | |
| | | | | | |
| | | | | | |
| | | | | | |
| | | | | | |
| | | | | | |
(1) Excludes the Pre-Closing Dividend (Note 1).
Brookfield Property REIT INC.
NOTES TO CONSOLIDATED FINANCIAL STATEMENTS (Continued)
(Dollars in thousands, except share and per share amounts)
Distributions paid on our common stock and their tax status, as sent to our stockholders, is presented in the following table. The tax status of the Company's distributions in 2018, 2017, and 2016 may not be indicative of future periods.
|
| | | | | | | | | | | |
| | Year Ended December 31, |
| | 2018 | | 2017 | | 2016 |
Class A Stock (August 28, 2018 through December 31, 2018) | | | | | |
| Ordinary income | $ | 0.118 |
| | $ | — |
| | $ | — |
|
| Capital gain distributions | 0.512 |
| | — |
| | — |
|
| Distributions per share | $ | 0.630 |
| | $ | — |
| | $ | — |
|
| | | | | | |
Common Stock (Through August 27, 2018) | | | | | |
| Ordinary income | $ | 3.742 |
| | $ | 0.861 |
| | $ | 0.685 |
|
| Capital gain distributions | 16.234 |
| | — |
| | 0.300 |
|
| Distributions per share | $ | 19.976 |
| | $ | 0.861 |
| | $ | 0.985 |
|
OurA Dividend Reinvestment Plan ("DRIP") provided eligible holders of GGP's common stock with a convenient method of increasing their investment in the Company by reinvesting all or a portion of cash dividends in additional shares. Pursuant to the DRIP, eligible stockholders who enrolled in the DRIP on or before the fourth business day preceding the record date for a dividend payment were able to have that dividend reinvested. As a result of the DRIP elections, no shares were issued during the year ended December 31, 2018 and 43,732 shares were issued during the year ended December 31, 2017. The Company terminated the registration statement relating to our DRIP (File No. 333-172795) with the filing of a post-effective amendment on August 28, 2018. As a result of the DRIP elections, 0 shares were issued pursuant to the DRIP during the year ended December 31, 2020 and year ended December 31, 2019.
Preferred Stock
On February 13, 2013, we issued, in a public offering, 10,000,000 shares of 6.375% Series A Cumulative Redeemable Preferred Stock (the "Pre-Merger Preferred Stock") at a price of $25.00 per share, resulting in net proceeds of $242.0 million after issuance costs. In connection with the BPY Transaction, each share of Pre-Merger Preferred Stock was converted into one share of 6.375% Series A cumulative redeemable preferred stock of BPRBPYU (the "Series A Preferred Stock"). The Series A Preferred Stock is recorded net of issuance costs within equity on our Consolidated Balance Sheets, and accrues a quarterly dividend at an annual rate of 6.375%. The dividend is paid in arrears in preference to dividends on our Class A Stock, and reduces net income available to common stockholders, and therefore, earnings per share. Preferred stock dividends were $15.9 million for the years ended December 31, 2018,2020, December 31, 20172019 and December 31, 2016.2018.
The Series A Preferred Stock does not have a stated maturity date but we may redeem the Series A Preferred Stock for $25.00 per share plus all accrued and unpaid dividends. Upon certain circumstances surrounding a change of control, holders of Series A Preferred Stock may elect to convert each share of their Series A Preferred Stock into a number of shares of Class A Stock or Class BC Stock, at the option of the holder, equivalent to $25.00 plus accrued and unpaid dividends, but not to exceed a cap of 2.4679 shares of Class A Stock or Class C Stock (subject to certain adjustments related to splits, subdivisions, or combinations). The BPY Transaction did not meet the definition of a change in control per the certificate of designation governing the Series A Preferred Stock.
Brookfield Property REIT INC.Inc.
NOTES TO CONSOLIDATED FINANCIAL STATEMENTS (Continued)
(Dollars in thousands, except share and per share amounts)
Our Board of Directors declared preferred stock dividends during 20182020 and 20172019 as follows:
| | | | | | | | | | | | | | | | | | | | |
| Declaration Date | | Record Date | | Payment Date | | Dividend Per Share |
| 2020 | | | | | | |
| November 5 | | December 15, 2020 | | January 1, 2021 | | $ | 0.3984 | |
| August 5 | | September 15, 2020 | | October 1, 2020 | | 0.3984 | |
| May 7 | | June 15, 2020 | | July 1, 2020 | | 0.3984 | |
| February 5 | | March 15, 2020 | | April 1, 2020 | | 0.3984 | |
| 2019 | | | | | | |
| November 4 | | December 13, 2019 | | January 1, 2020 | | $ | 0.3984 | |
| August 1 | | September 13, 2019 | | October 1, 2019 | | 0.3984 | |
| May 6 | | June 14, 2019 | | July 1, 2019 | | 0.3984 | |
| February 6 | | March 15, 2019 | | April 1, 2019 | | 0.3984 | |
| | | | | | |
| | | | | | |
| | | | | | |
| | | | | | |
| | | | | | |
|
| | | | | | | | |
| Declaration Date | | Record Date | | Payment Date | | Dividend Per Share |
| 2018 | | | | | | |
| November 1 | | December 14, 2018 | | January 1, 2019 | | $ | 0.3984 |
|
| July 31 | | September 17, 2018 | | October 1, 2018 | | 0.3984 |
|
| May 3 | | June 15, 2018 | | July 2, 2018 | | 0.3984 |
|
| February 7 | | March 15, 2018 | | April 2, 2018 | | 0.3984 |
|
| 2017 | | | | | | |
| October 31 | | December 15, 2017 | | January 2, 2018 | | $ | 0.3984 |
|
| August 2 | | September 15, 2017 | | October 2, 2017 | | 0.3984 |
|
| May 1 | | June 15, 2017 | | July 3, 2017 | | 0.3984 |
|
| January 30 | | March 15, 2017 | | April 3, 2017 | | 0.3984 |
|
NOTE 1110 EARNINGS PER SHARE
Class A Stock (August 28, 2018 through December 31, 2018)
Income available to Class A stockholders is limited to distributed income or dividends declared. Additionally, for purposes of allocating earnings to Class A Stock, the portion of the change in the carrying amount of Class A Stock that reflects a redemption in excess of fair value is considered a dividend to the Class A stockholders. As the Class A Stock redemption value approximates its fair value, basic and diluted earnings per share ("EPS") for Class A Stock is equivalent to the dividends declared for the period August 28, 2018 throughyear ended December 31, 2018.2020. Shares of Class A Stock outstanding were 162,323,96764,024,422 and 109,804,51339,127,335 as of August 28, 2018 and December 31, 2018,2019 and 2020, respectively. EPS is not presented for Class B Stock and Class C Stock as neither class of stock is publicly traded.
Common Stock
BasicIn 2018, basic EPS for common stock iswas computed by dividing net income available to common stockholders by the weighted-average number of GGP common shares outstanding. Diluted EPS for common stock iswas computed after adjusting the numerator and denominator of the basic EPS computation for the effects of all potentially dilutive common shares. The dilutive effect of the warrantsWarrants and the dilutive effect of options and their equivalents (including fixed awards and nonvested stock issued under stock-based compensation plans), arewere computed using the "treasury" method. The dilutive effect of the Preferred Units is computed using the "if-converted" method.
Brookfield Property REIT INC.Inc.
NOTES TO CONSOLIDATED FINANCIAL STATEMENTS (Continued)
(Dollars in thousands, except share and per share amounts)
Information related to our EPS calculations is summarized as follows:
| | | | | | | | |
| | January 1, 2018 through August 27, 2018 |
| Numerators - Basic: | | |
| Net income | | $ | 3,860,424 | |
| Preferred Stock dividends | | (11,952) | |
| Allocation to noncontrolling interests | | (43,049) | |
| Net income attributable to common stockholders | | $ | 3,805,423 | |
| Numerators - Diluted: | | |
| Distributions to Preferred Units | | 1,711 | |
| Net income attributable to common stockholders | | $ | 3,807,134 | |
| Denominators: | | |
| Weighted-average number of common shares outstanding - basic | | 914,066 | |
| Effect of dilutive securities | | 3,831 | |
| Weighted-average number of common shares outstanding - diluted | | 917,897 | |
| Anti-dilutive Securities: | | |
| | |
| Effect of Common Units | | 7,662 | |
| Effect of LTIP Units | | 1,748 | |
| Weighted-average number of anti-dilutive securities | | 9,410 | |
|
| | | | |
| | | January 1, 2018 through August 27, 2018 |
| Numerators - Basic: | | |
| Net income | | $ | 3,860,424 |
|
| Preferred Stock dividends | | (11,952 | ) |
| Allocation to noncontrolling interests | | (43,049 | ) |
| Net income attributable to common stockholders | | $ | 3,805,423 |
|
| Numerators - Diluted: | | |
| Distributions to Preferred Units | | 1,711 |
|
| Net income attributable to common stockholders | | $ | 3,807,134 |
|
| Denominators: | | |
| Weighted-average number of common shares outstanding - basic | | 914,066 |
|
| Effect of dilutive securities | | 3,831 |
|
| Weighted-average number of common shares outstanding - diluted | | 917,897 |
|
| Anti-dilutive Securities: | | |
| Effect of Common Units | | 7,662 |
|
| Effect of LTIP Units | | 1,748 |
|
| Weighted-average number of anti-dilutive securities | | 9,410 |
|
|
| | | | | | | |
| | Year Ended December 31, |
| | 2017 | | 2016 |
| Numerators—Basic: | |
| | |
|
| Net income | $ | 666,873 |
| | $ | 1,308,273 |
|
| Preferred Stock dividend | (15,936 | ) | | (15,935 | ) |
| Allocation to noncontrolling interests | (9,539 | ) | | (19,906 | ) |
| Net income attributable to common stockholders | $ | 641,398 |
| | $ | 1,272,432 |
|
| Numerators—Diluted: | |
| | |
|
| Net income attributable to common stockholders | $ | 641,398 |
| | $ | 1,272,432 |
|
| Diluted net income attributable to common stockholders | $ | 641,398 |
| | $ | 1,272,432 |
|
| Denominators: | |
| | |
|
| Weighted-average number of common shares outstanding—basic | 897,156 |
| | 884,029 |
|
| Effect of dilutive securities | 50,403 |
| | 68,304 |
|
| Weighted-average number of common shares outstanding—diluted | 947,559 |
| | 952,333 |
|
| Anti-dilutive Securities: | |
| | |
|
| Effect of Preferred Units | 1,514 |
| | 5,209 |
|
| Effect of Common Units | 6,592 |
| | 4,782 |
|
| Effect of LTIP Units | 1,836 |
| | 1,767 |
|
| | 9,942 |
| | 11,758 |
|
For the period January 1, 2018 through August 27, 2018, dilutive options and dilutive shares related to the Preferred Units arewere included in the denominator of dilutive EPS. Distributions to Preferred Units arewere included in the numerator of dilutive EPS. For
Brookfield Property REIT INC.
NOTES TO CONSOLIDATED FINANCIAL STATEMENTS (Continued)
(Dollars in thousands, except share and per share amounts)
the yearsyear ended December 31, 2017 and 2016,2018, dilutive options and dilutive shares related to the warrants arewere included in the denominator of diluted EPS.
Outstanding Common Units and LTIP Units have been excluded from the diluted earnings per share calculation because including such units would also require that the share of BPROP income attributable to such units be added back to net income therefore resulting in no effect on EPS. For the years ended December 31, 2017 and 2016, outstanding Preferred Units have been excluded from the diluted EPS calculation for all periods presented because including the Preferred Units would also require that the Preferred Units dividend be added back to the net income, resulting in anti-dilution.
During the year ended December 31, 2017, warrants were exercised for 83,866,187 shares of common stock using both full and net share settlement.
BPY owned 55,969,390 shares of treasury stock of GGP as of December 31, 2017. These shares are presented as common stock in treasury, at cost, on our Consolidated Balance Sheet. Additionally, BPR Nimbus LLC, (formerly known as GGP Nimbus, LP), held 27,459,195 shares of stock as a result of warrants purchased during the year ended December 31, 2013. These shares are presented as issued, but not outstanding on our Consolidated Balance Sheet as of December 31, 2017. Accordingly, these shares have been excluded from the calculation of EPS.
NOTE 1211 STOCK-BASED COMPENSATION PLANS
Incentive Stock Plans
The GGP Inc. 2010 Equity Plan (the "Equity Plan") renamed as the Amended and Restated Brookfield Property REIT Inc. 2010 Equity Incentive Plan on August 28, 2018 in connection with the BPY Transaction, reserves for the issuance of 4% of outstanding Class A Stock on a fully diluted basis. The Equity Plan provides for grants of nonqualified stock options, incentive stock options, stock appreciation rights, restricted stock, other stock-based awards and performance-based compensation (collectively, "the Awards"). The Company's directors, officers and other employees and those of its subsidiaries and affiliates are eligible for the Awards. The Equity Plan is not subject to the Employee Retirement Income Security Act of 1974, as amended. No participant may be granted more than 4,000,000 shares, or the equivalent dollar value of such shares, in any year. Options granted under the Equity Plan will be designated as either nonqualified stock options or incentive stock options. An option granted as an incentive stock option will, to the extent it fails to qualify as an incentive stock option, be treated as a nonqualified option. The exercise price of an option may not be less than the fair value of a share of BPR'sBPYU's Class A Stock on the date of grant. The term of each option will be determined prior to the date of grant, but may not exceed 10 years. In addition to the Equity Plan, effective February 20, 2019, the Brookfield Property Group Restricted BPR Class A Stock Plan and Brookfield Property L.P. FV LTIP Unit Plan (the "2019 Plans") provide for grants of restricted shares of Class A Stock of the Company and FV LTIP Units of Brookfield Property L.P., respectively. Officers and employees of any member of the Brookfield Properties Group and of their respective affiliates are eligible for Awards under these plans.
In connection with the BPY Transaction, the Company's Equity Plan was amended and certain outstanding awards were modified. All outstanding GGP in and out of the money options were canceled and replaced with Class A Stock of BPRBPYU and BPY options, respectively. Certain existing appreciation only LTIP awards were canceled and replaced with substitute awards of a BPY affiliate. Outstanding restricted GGP shares were replaced with restricted shares of Class A Stock. As the awards were modified in conjunction with an equity restructuring, they were accounted for as modifications. Incremental compensation cost was
Brookfield Property REIT Inc.
NOTES TO CONSOLIDATED FINANCIAL STATEMENTS
(Dollars in thousands, except share and per share amounts)
measured as the excess of the fair value of the replacement awards over the fair value of the original awards immediately before the terms were modified. Total compensation cost measured at the date of modification was the grant-date fair value of the original awards for which the requisite service is expected to be rendered (or has already been rendered) plus the incremental cost associated with the replacement awards. For vested awards, incremental compensation cost was recognized on the modification date. For unvested awards, incremental compensation cost is being recognized over the remaining service period.
Stock Options
Stock options under the Equity Plan generally vest in 25% increments annually from one year from the grant date (subject to certain exceptions in the case of retirement).
Brookfield Property REIT INC.
NOTES TO CONSOLIDATED FINANCIAL STATEMENTS (Continued)
(Dollars in thousands, except share and per share amounts)
The following tables summarize stock option activity for the Equity Plan for BPRBPYU for the years ended December 31, 2018, 20172020, 2019 and 2016:2018:
| | | | 2018 | | 2017 | | 2016 | | 2020 | | 2019 | | 2018 (1) |
| | Shares | | Weighted Average Exercise Price | | Shares | | Weighted Average Exercise Price | | Shares | | Weighted Average Exercise Price (2) | | Shares | | Weighted
Average
Exercise
Price | | Shares | | Weighted
Average
Exercise
Price | | Shares | | Weighted
Average
Exercise
Price |
| Stock options Outstanding at January 1, | 14,427,103 |
| | $ | 17.84 |
| | 15,277,189 |
| | $ | 17.90 |
| | 18,162,700 |
| | $ | 17.34 |
| Stock options Outstanding at January 1, | 175,799 | | | 25.66 | | | 1,011,523 | | | 19.71 | | | 14,427,103 | | | 17.84 | |
| Granted (1) (3) | 1,068,818 |
| | 19.70 |
| | — |
| | — |
| | 247,592 |
| | 20.81 |
| |
| Granted (1) | | Granted (1) | 0 | | | 0 | | | 0 | | | 0 | | | 1,068,818 | | | 19.70 | |
| Exercised | (338,715 | ) | | 16.55 |
| | (690,969 | ) | | 18.00 |
| | (2,886,986 | ) | | 14.45 |
| Exercised | 0 | | | 0 | | | (773,642) | | | 17.91 | | | (338,715) | | | 16.55 | |
| Forfeited | (8,377 | ) | | 26.41 |
| | (153,822 | ) | | 22.47 |
| | (230,509 | ) | | 19.94 |
| Forfeited | 0 | | | 0 | | | 0 | | | 0 | | | (8,377) | | | 26.41 | |
| Expired | (55,917 | ) | | 23.27 |
| | (5,295 | ) | | 28.86 |
| | (15,608 | ) | | 17.73 |
| Expired | (39,137) | | | 24.30 | | | (62,082) | | | 25.36 | | | (55,917) | | | 23.27 | |
| Conversion Effect (3) | (14,081,389 | ) | | 17.85 |
| | — |
| | — |
| | — |
| | — |
| |
| Conversion Effect (1) | | Conversion Effect (1) | 0 | | | 0 | | | 0 | | | 0 | | | (14,081,389) | | | 18 | |
| Stock options Outstanding at December 31, | 1,011,523 |
| | $ | 19.71 |
| | 14,427,103 |
| | $ | 17.84 |
| | 15,277,189 |
| | $ | 17.90 |
| Stock options Outstanding at December 31, | 136,662 | | | $ | 26.05 | | | 175,799 | | | 25.66 | | | 1,011,523 | | | 19.71 | |
|
| |
(1) | Included in 2016 grants are 156,331 units related to additional grants required as a result of antidilution provisions triggered by our 2016 distribution of a special dividend declared on December 13, 2016 (Note 10). |
| |
(2) | Changes to prior year weighted average exercise price is due to adjustment of the strike price for the special dividend issued in 2016. |
| |
(3) | In connection with the BPY Transaction, outstanding GGP in and out of the money options were canceled and replaced with Class A Stock of BPR and BPY options, respectively. The BPY options remain outstanding as of December 31, 2018 as they are held by employees of BPR(1) In connection with the BPY Transaction, outstanding GGP in and out of the money options were canceled and replaced with Class A Stock of BPYU and BPY options, respectively. The BPY options remain outstanding as of December 31, 2020 as they are held by employees of BPYU subsidiaries. |
|
| | | | | | | | | | | | | | | | | | | | |
| | | Stock Options Outstanding | | Stock Options Exercisable |
| Range of Exercise Prices | | Shares | | Weighted Average Remaining Contractual Term (in years) | | Weighted Average Exercise Price | | Shares | | Weighted Average Remaining Contractual Term (in years) | | Weighted Average Exercise Price |
| $17.01 - $23.00 | | 773,642 |
| | 4.52 | | 17.91 |
| | 773,642 |
| | 4.52 | | 17.91 |
|
| $23.01 - $30.00 | | 237,881 |
| | 5.83 | | 25.58 |
| | 188,141 |
| | 5.71 | | 25.64 |
|
| Total | | 1,011,523 |
| | 4.83 | | $ | 19.71 |
| | 961,783 |
| | 4.75 | | $ | 19.42 |
|
| Intrinsic value ($16.12 stock price as of December 31, 2018) | | $ | (3,636 | ) | | | | |
| | $ | (3,176 | ) | | | | |
|
| | | | | | | | | | | | | | | | | | | | | | | | | | | | | | | | | | | | | | |
| | | Stock Options Outstanding | | Stock Options Exercisable |
| Range of Exercise Prices | | Shares | | Weighted Average
Remaining Contractual
Term (in years) | | Weighted
Average
Exercise
Price | | Shares | | Weighted Average
Remaining Contractual
Term (in years) | | Weighted
Average
Exercise
Price |
| | | | | | | | | | | | |
| $24.00 - $30.00 | | 136,662 | | | 4.02 | | 26.05 | | | 136,662 | | | 4.02 | | 26.05 | |
| Total | | 136,662 | | | 4.02 | | $ | 26.05 | | | 136,662 | | | 4.02 | | $ | 26.05 | |
| Intrinsic value ($14.94 stock price as of December 31, 2020) | | $ | (1,518) | | | | | | | $ | (1,518) | | | | | |
There were no new stock options granted in 20182020, 2019, and 2017. The weighted-average fair value of stock options as of the grant date was $4.52 for stock options granted during the year ended December 31, 2016, excluding 156,331 of special dividend shares granted during 2016 as a result of antidilution provisions that were triggered by a special dividend distribution.2018. The intrinsic value of stock options exercised during the year was $1.6$0.0 million $3.9$1.4 million, and $42.1$1.6 million for the year ended December 31, 2018,2020, December 31, 2017,2019, and December 31, 2016,2018, respectively.
Brookfield Property REIT INC.
NOTES TO CONSOLIDATED FINANCIAL STATEMENTS (Continued)
(Dollars in thousands, except share and per share amounts)
Restricted Stock
Pursuant to the Equity Plan, BPRBPYU made restricted stock grants to certain employees and non-employee directors. The vesting terms of these grants are specific to the individual grant. The vesting terms varied in that a portion of the shares vested either immediately or on the first anniversary and the remainder vested in the equal annual amounts over the next two to five years. Participating employees were required to remain employed for vesting to occur (subject to certain exceptions in the case of retirement). Shares that did not vest were forfeited. DividendsFor awards granted prior to 2019, dividends are paid on restricted stock and are not returnable, even if the underlying stock does not ultimately vest.vest whereas awards granted in 2019 and forward are subject
Brookfield Property REIT Inc.
NOTES TO CONSOLIDATED FINANCIAL STATEMENTS
(Dollars in thousands, except share and per share amounts)
to a clawback. The following table summarizes restricted stock activity for the respective grant year ended December 31, 2018,2020, December 31, 20172019 and December 31, 2016:2018:
| | | | 2018 | | 2017 | | 2016 | | 2020 | | 2019 | | 2018 |
| | Shares | | Weighted Average Grant Date Fair Value | | Shares | | Weighted Average Grant Date Fair Value | | Shares | | Weighted Average Grant Date Fair Value | | Shares | | Weighted
Average Grant
Date Fair Value | | Shares | | Weighted
Average Grant
Date Fair Value | | Shares | | Weighted
Average Grant
Date Fair Value |
| Nonvested restricted stock grants outstanding as of beginning of period | 982,529 |
| | $ | 25.42 |
| | 453,596 |
| | $ | 27.16 |
| | 206,219 |
| | $ | 29.16 |
| Nonvested restricted stock grants outstanding as of beginning of period | 1,040,998 | | | $ | 20.92 | | | 733,576 | | | $ | 22.67 | | | 982,529 | | | $ | 25.42 | |
| Granted | 667,831 |
| | 21.52 |
| | 771,960 |
| | 24.77 |
| | 329,326 |
| | 26.20 |
| Granted | 851,102 | | | 18.57 | | | 673,567 | | | 19.90 | | | 667,831 | | | 21.52 | |
| Vested | (319,763 | ) | | 24.35 |
| | (174,806 | ) | | 26.76 |
| | (71,570 | ) | | 28.48 |
| Vested | (359,809) | | | 21.49 | | | (296,780) | | | 22.95 | | | (319,763) | | | 24.35 | |
| Forfeited | (136,959 | ) | | 24.27 |
| | (68,221 | ) | | 26.24 |
| | (10,379 | ) | | 27.28 |
| Forfeited | (117,733) | | | 19.50 | | | (69,365) | | | 20.82 | | | (136,959) | | | 24.27 | |
| Conversion Effect (1) | (460,062 | ) | | 25.22 |
| | — |
| | — |
| | — |
| | — |
| Conversion Effect (1) | 0 | | | 0 | | | 0 | | | 0 | | | (460,062) | | | 25.22 | |
| Nonvested restricted stock grants outstanding as of end of period | 733,576 |
| | $ | 22.67 |
| | 982,529 |
| | $ | 25.42 |
| | 453,596 |
| | $ | 27.16 |
| Nonvested restricted stock grants outstanding as of end of period | 1,414,558 | | | $ | 19.48 | | | 1,040,998 | | | $ | 20.92 | | | 733,576 | | | $ | 22.67 | |
(1) In connection with the BPY Transaction, outstanding restricted GGP shares were replaced with restricted shares of Class A Stock.
The weighted average remaining contractual term of nonvested awards as of December 31, 20182020 was 2.52.86 years. The fair value of shares vested during the year was $7.8$7.7 million, $4.7$6.8 million, and $2.0$7.8 million for the year ended December 31, 2018,2020, December 31, 2017,2019, and December 31, 2016,2018, respectively.
LTIP Units
Pursuant to the Equity Plan, GGP made LTIP Unit grants to certain employees and non-employee directors. The vesting terms of these grants are specific to the individual grant. A portion of the shares vest either immediately or on the first anniversary and the remainder vest in equal annual amounts over the next two to four years. Participating employees are required to remain employed for vesting to occur (subject to certain exceptions in the case of retirement).
LTIP Units are classes of partnership interests that under certain conditions, including vesting, are convertible by the holder into units of BPROP Series K preferred stock of the Operating Partnership, which are redeemable by the holder for shares of Class A stock on a one-to-one ratio (subject to adjustment for changes to the Company's capital structure) or for the cash value of such shares at the option of the Company.
Brookfield Property REIT INC.
NOTES TO CONSOLIDATED FINANCIAL STATEMENTS (Continued)
(Dollars in thousands, except share and per share amounts)
The following table summarizes LTIP Unit activity for the Equity Plan for the Company for the years ended December 31, 2018,2020, December 31, 20172019 and December 31, 2016:2018:
| | | | | | | | | | | | | | | | | | | | | | | | | | | | | | | | | | | | | | | |
| 2020 | | 2019 | | 2018 | | |
| Shares | | Weighted Average Grant Date Fair Value | | Shares | | Weighted Average Grant Date Fair Value | | Shares | | Weighted Average Grant Date Fair Value | | | | |
| LTIP Units Outstanding at January 1, | 1,795,525 | | | $ | 23.74 | | | 3,032,863 | | | $ | 26.01 | | | 3,779,904 | | | $ | 27.29 | | | | | |
| Granted | 24,251 | | | 18.56 | | | 0 | | | 0 | | | 1,387,289 | | | 22.51 | | | | | |
| Exercised | (113,152) | | | 28.35 | | | (1,217,545) | | | 29.41 | | | (73,660) | | | 28.95 | | | | | |
| Forfeited | (288,427) | | | 22.42 | | | (19,793) | | | 22.42 | | | (856,467) | | | 25.85 | | | | | |
| Canceled (1) | 0 | | | 0 | | | 0 | | | 0 | | | (1,204,203) | | | 25.93 | | | | | |
| LTIP Units Outstanding at December 31, | 1,418,197 | | | $ | 23.56 | | | 1,795,525 | | | $ | 23.74 | | | 3,032,863 | | | $ | 26.01 | | | | | |
Brookfield Property REIT Inc.
NOTES TO CONSOLIDATED FINANCIAL STATEMENTS
(Dollars in thousands, except share and per share amounts)
|
| | | | | | | | | | | | | | | | | | | | |
| | 2018 | | 2017 | | 2016 |
| | Shares | | Weighted Average Grant Date Fair Value | | Shares | | Weighted Average Grant Date Fair Value | | Shares | | Weighted Average Grant Date Fair Value (2) |
| LTIP Units Outstanding at January 1, | 3,779,904 |
| | $ | 27.29 |
| | 3,775,802 |
| | $ | 27.40 |
| | 1,724,747 |
| | $ | 29.32 |
|
| Granted (1) | 1,387,289 |
| | 22.51 |
| | 122,547 |
| | 25.40 |
| | 2,089,917 |
| | 25.84 |
|
| Exercised | (73,660 | ) | | 28.95 |
| | (92,880 | ) | | 29.15 |
| | — |
| | — |
|
| Forfeited | (856,467 | ) | | 25.85 |
| | (25,565 | ) | | 27.69 |
| | (38,862 | ) | | 28.95 |
|
| Canceled (3) | (1,204,203 | ) | | 25.93 |
| | — |
| | — |
| | — |
| | — |
|
| LTIP Units Outstanding at December 31, | 3,032,863 |
| | $ | 26.01 |
| | 3,779,904 |
| | $ | 27.29 |
| | 3,775,802 |
| | $ | 27.40 |
|
| |
(1) | Included in 2016 grants are 19,064 units related to additional grants required as a result of antidilution provisions triggered by our 2016 distribution of a special dividend declared on December 13, 2016 (Note 10). |
(2) Changes to prior year weighted average grant date fair value is due to adjustment(1) In connection with the BPY Transaction, certain existing LTIP awards were canceled and replaced with substitute awards of the strike price for the special dividend issued in 2016.a BPY affiliate. The substitute LTIP awards remain outstanding as of December 31, 2020, 2019 and 2018 as they are held by employees of BPYU subsidiaries.
| |
(3) | In connection with the BPY Transaction, certain existing LTIP awards were canceled and replaced with substitute awards of a BPY affiliate. The substitute LTIP awards remain outstanding as of December 31, 2018 as they are held by employees of BPR subsidiaries. |
Performance Equity Compensation
Pursuant to the Equity Plan, GGP made performance restricted stock and LTIP Unit ("equity performance instruments") grants to certain employees. These grants are subject to certain performance vesting conditions based on Relative TSR of the Equity REIT Index, Relative TSR of the Retail REIT Index, TSR growth of the company, and FFO Growth of the company. The equity performance instruments are considered earned based on meeting these performance vesting conditions, which are each weighted 25% and vest at the end of the three-year performance period. The LTIP Units receive dividends at a ratio of 10% cash and 90% as a dividend reinvestment which is subject to the performance vesting conditions and three-year performance period. As a result of the BPY Transaction, all performance metrics were deemed met with outstanding awards still requiring time vesting according to original grant terms.
The following table summarizes performance restricted stock and LTIP Unit activity for the respective grant years ended December 31, 20182020 and December 31, 2017:2019:
| | | | 2018 | | 2017 | | 2020 | | 2019 | |
| | Shares | | Weighted Average Grant Date Fair Value | | Shares | | Weighted Average Grant Date Fair Value | | Shares | | Weighted Average Grant Date Fair Value | | Shares | | Weighted Average Grant Date Fair Value | |
| Nonvested performance grants outstanding as of beginning of period | 1,074,595 |
| | 25.59 |
| | 593,200 |
| | 26.07 |
| Nonvested performance grants outstanding as of beginning of period | 490,309 | | | 24.86 | | | 1,141,673 | | | 24.92 | | |
| Granted | 406,306 |
| | 21.52 |
| | 554,264 |
| | 25.11 |
| Granted | 0 | | | 0 | | | 0 | | | 0 | | |
| Vested | (77,969 | ) | | 21.06 |
| | — |
| | — |
| Vested | (144,585) | | | 22.67 | | | (651,364) | | | 24.95 | | |
| Canceled | (164,074 | ) | | 25.56 |
| | (72,869 | ) | | 25.82 |
| Canceled | 0 | | | 0 | | | 0 | | | 0 | | |
| Conversion Effect (1) | (97,185 | ) | | 20.11 |
| | — |
| | — |
| Conversion Effect (1) | 0 | | | 0 | | | 0 | | | 0 | | |
| Nonvested performance grants outstanding as of end of period | 1,141,673 |
| | 24.92 |
| | 1,074,595 |
| | 25.59 |
| Nonvested performance grants outstanding as of end of period | 345,724 | | | 25.78 | | | 490,309 | | | 24.86 | | |
| |
(1) | (1) In connection with the BPY Transaction, all performance metrics were deemed met with outstanding awards still requiring time vesting according to the original grant terms. |
Brookfield Property REIT INC.
NOTES TO CONSOLIDATED FINANCIAL STATEMENTS (Continued)
(Dollars in thousands, except share and per share amounts)
Other Required Disclosures
Historical data, such as the past performance of our common stock and the length of service by employees, is used to estimate expected life of the stock options, restricted stock, and LTIP Units and represents the period of time the options or grants are expected to be outstanding. There were no options granted in 2020 or 2019. The weighted average estimated values of options granted for 2018 were based on the following assumptions:
| | | | | | | | | | | | | | | | | |
| | Year Ended December 31, |
| | 2020 | | 2019 | | 2018 |
| Risk-free interest rate (*) | 0 | | | 0 | | | 2.37 | % |
| Dividend yield (*) | 0 | | | 0 | | | 4.09 | % |
| Expected volatility | 0 | | | 0 | | | 25.50 | % |
| Expected life (in years) | — | | | — | | | 6.25 |
|
| | | | | | | | |
| | Year Ended December 31, |
| | 2018 | | 2017 | | 2016 |
| Risk-free interest rate (*) | 2.37 | % | | 2.45 | % | | 1.52 | % |
| Dividend yield (*) | 4.09 | % | | 3.47 | % | | 3.07 | % |
| Expected volatility | 25.50 | % | | 40.00 | % | | 25.00 | % |
| Expected life (in years) | 6.25 |
| | 6.25 |
| | 6.25 |
|
(*) Weighted average
Brookfield Property REIT Inc.
NOTES TO CONSOLIDATED FINANCIAL STATEMENTS
(Dollars in thousands, except share and per share amounts)
Compensation expense related to stock-based compensation plans is summarized in the following table:
| | | | Year Ended December 31, | | Year Ended December 31, |
| | 2018 (1) | | 2017 | | 2016 | | 2020 | | 2019 | | 2018 (1) |
| Stock options—Property management and other costs | $ | 236 |
| | $ | 3,366 |
| | $ | 5,833 |
| Stock options—Property management and other costs | $ | 0 | | | $ | 50 | | | $ | 236 | |
| Stock options—General and administrative | 122 |
| | 7,732 |
| | 10,448 |
| Stock options—General and administrative | 0 | | | 4 | | | 122 | |
| Restricted stock—Property management and other costs | 10,537 |
| | 5,787 |
| | 2,860 |
| Restricted stock—Property management and other costs | 6,568 | | | 5,910 | | | 10,537 | |
| Restricted stock—General and administrative | 12,514 |
| | 3,357 |
| | 635 |
| Restricted stock—General and administrative | 2,822 | | | 1,863 | | | 12,514 | |
| LTIP Units - Property management and other costs | 1,538 |
| | 1,366 |
| | 1,346 |
| LTIP Units - Property management and other costs | 25 | | | 257 | | | 1,538 | |
| LTIP Units - General and administrative | 22,709 |
| | 18,621 |
| | 14,804 |
| LTIP Units - General and administrative | 51 | | | 1,782 | | | 22,709 | |
| Total | $ | 47,656 |
| | $ | 40,229 |
| | $ | 35,926 |
| Total | $ | 9,466 | | | $ | 9,866 | | | $ | 47,656 | |
| |
(1) | In connection with the BPY Transaction, outstanding equity awards were modified resulting in an acceleration of expense of $21.5 million. |
(1) In connection with the BPY Transaction, outstanding equity awards were modified resulting in an acceleration of expense of $21.5 million.
Unrecognized compensation expense as of December 31, 20182020 is as follows:
| | | Year | Amount | Year | Amount |
| 2019 | $ | 8,855 |
| |
| 2020 | 4,681 |
| |
| 2021 | 2,372 |
| 2021 | $ | 6,858 | |
| 2022 | 350 |
| 2022 | 5,385 | |
| 2023 | | 2023 | 5,136 | |
| 2024 | | 2024 | 3,314 | |
| 2025 | | 2025 | 432 | |
| | $ | 16,258 |
| | $ | 21,125 | |
These amounts may be impacted by future grants, changes in forfeiture estimates or vesting terms, and actual forfeiture rates which differ from estimated forfeitures.
NOTE 1312 ACCOUNTS RECEIVABLE, NET
The following table summarizes the significant components of accounts receivable, net.
| | | | | | | | | | | | | | |
| | December 31, 2020 | | December 31, 2019 |
| Trade receivables | | $ | 384,464 | | | $ | 111,582 | |
| Short-term tenant receivables | | 6,703 | | | 4,198 | |
| Straight-line rent receivable | | 188,950 | | | 144,249 | |
| Other accounts receivable | | 14,894 | | | 2,725 | |
| Total accounts receivable | | 595,011 | | | 262,754 | |
| Provision for doubtful accounts | | (70,029) | | | (27,826) | |
| Total accounts receivable, net | | $ | 524,982 | | | $ | 234,928 | |
Receivables related to legally executed rent deferrals are presented within trade receivables in the table above.
At the time of the legal execution of a lease concession that abates previously recognized trade receivables, such amounts (net of estimated lease concessions previously recognized in the provision for doubtful accounts) are reclassified to straight-line rent receivables. Refer to Notes 2 and 7 for additional information regarding the Company's consideration of the collectability of accounts receivable.
Brookfield Property REIT INC.Inc.
NOTES TO CONSOLIDATED FINANCIAL STATEMENTS (Continued)
(Dollars in thousands, except share and per share amounts)
|
| | | | | | | | |
| | | December 31, 2018 | | December 31, 2017 |
| Trade receivables | | $ | 97,329 |
| | $ | 109,968 |
|
| Short-term tenant receivables | | 4,378 |
| | 4,776 |
|
| Straight-line rent receivable | | 137,387 |
| | 233,630 |
|
| Other accounts receivable | | 3,126 |
| | 5,165 |
|
| Total accounts receivable | | 242,220 |
| | 353,539 |
|
| Provision for doubtful accounts | | (19,658 | ) | | (19,458 | ) |
| Total accounts receivable, net | | $ | 222,562 |
| | $ | 334,081 |
|
NOTE 1413 NOTES RECEIVABLE
The following table summarizes the significant components of notes receivable.
| | | | | | | | | | | | | | |
| | December 31, 2020 | | December 31, 2019 |
| Notes receivable | | $ | 40,999 | | | $ | 69,963 | |
| Accrued interest | | 4,554 | | | 6,347 | |
| | | | |
| | | | |
| Total notes receivable | | $ | 45,553 | | | $ | 76,310 | |
|
| | | | | | |
| | | December 31, 2018 | | December 31, 2017 |
| Notes receivable | | 239,597 |
| | 404,129 |
|
| Accrued interest | | 17,340 |
| | 13,429 |
|
| Total notes receivable | | 256,937 |
| | 417,558 |
|
On July 12, 2017,December 20, 2019 the Company issued a $31.7 million subordinated unsecured note to an institutional investor. The note was repaid in full on January 7, 2020.
On January 30, 2019, we entered into a promissory noterevolving credit facility with our joint venture GSPHII,BPY Bermuda Holdings IV Limited, a related party in which we lent GSPHII $127.4 million that bore$330.0 million. The note had an interest at 6.3% fromrate of LIBOR plus 2.50% and was scheduled to mature on January 1, 2018 until30, 2020. On March 25, 2019, the note matured on December 31, 2018. Interest payments occurred a monthwas repaid in arrears, commencing on the first day of the second calendar month with a final payment on the maturity date. The note was collateralized by GSPHII's interest in four anchor boxes (Note 3). The $127.4 million outstanding was paid down in full as of December 31, 2018.full.
On May 23, 2017, we entered into a promissory note with our joint venture partner, Bayside Equities, LLC ("Bayside Equities"), a subsidiary of Ashkenazy Holding Co., LLC, in which we lent Bayside Equities $19.1 million that bears interest at 12.2% per annum. The note was collateralized by Bayside Equities' economic interest in Riverchase Galleria and the Tysons Galleria anchor box and was paid down as of December 31, 2018 in conjunction with the BPY Transaction.
Notes receivable includes $204.3 million of notes receivable from our joint venture partners related to the acquisition of 730 Fifth Avenue in New York, New York. The first note was issued for $104.3 million to our joint venture partner in the retail portion and bears interest at 8.0% compounded annually and matures on February 12, 2025. The second note was issued for $100.0 million to the joint venture partner acquiring the office portion of the property and bears interest at 8.0% subject to terms and conditions in the loan agreement and matures on April 17, 2025. As of December 31, 2018, there was $183.8 million outstanding on the first note. The $80.0 million outstanding on the second note was paid down in full during the second quarter of 2018.
NOTE 1514 PREPAID EXPENSES AND OTHER ASSETS
The following table summarizes the significant components of prepaid expenses and other assets.
| | | | | | | | | | | | | | | | | | | | | | | | | | | | | | | | | | | |
| | 12/31/2020 | | 12/31/2019 |
| | Gross Asset | | Accumulated
Amortization | | Balance | | Gross Asset | | Accumulated
Amortization | | Balance |
| Intangible assets: | | | | | | | | | | | |
| Above-market tenant leases, net | $ | 133,220 | | | $ | (54,922) | | | $ | 78,298 | | | $ | 177,480 | | | $ | (79,467) | | | $ | 98,013 | |
| | | | | | | | | | | |
| Real estate tax stabilization agreement, net | 111,506 | | | (64,016) | | | 47,490 | | | 111,506 | | | (57,704) | | | 53,802 | |
| Total intangible assets | $ | 244,726 | | | $ | (118,938) | | | $ | 125,788 | | | $ | 288,986 | | | $ | (137,171) | | | $ | 151,815 | |
| Remaining prepaid expenses and other assets: | | | | | | | | | | | |
| Restricted cash | | | | | 164,069 | | | | | | | 77,683 | |
| Security and escrow deposits | | | | | 1,160 | | | | | | | 1,259 | |
| Prepaid expenses | | | | | 45,266 | | | | | | | 27,632 | |
| Other non-tenant receivables | | | | | 70,916 | | | | | | | 56,948 | |
| Operating lease right-of-use assets, net | | | | | 392,634 | | | | | | | 402,573 | |
| Finance lease right-of-use assets, net | | | | | 7,873 | | | | | | | 7,995 | |
| | | | | | | | | | | |
| Other | | | | | 20,040 | | | | | | | 19,155 | |
| Total remaining prepaid expenses and other assets | | | | | 701,958 | | | | | | | 593,245 | |
| Total prepaid expenses and other assets | | | | | $ | 827,746 | | | | | | | $ | 745,060 | |
Brookfield Property REIT INC.Inc.
NOTES TO CONSOLIDATED FINANCIAL STATEMENTS (Continued)
(Dollars in thousands, except share and per share amounts)
|
| | | | | | | | | | | | | | | | | | | | | | | |
| | December 31, 2018 | | December 31, 2017 |
| | Gross Asset | | Accumulated Amortization | | Balance | | Gross Asset | | Accumulated Amortization | | Balance |
| Intangible assets: | |
| | |
| | |
| | |
| | |
| | |
|
| Above-market tenant leases, net | $ | 160,363 |
| | $ | (125,152 | ) | | $ | 35,211 |
| | $ | 411,789 |
| | $ | (313,228 | ) | | $ | 98,561 |
|
| Below-market ground leases, net | 61,983 |
| | (8,293 | ) | | 53,690 |
| | 118,994 |
| | (14,870 | ) | | 104,124 |
|
| Real estate tax stabilization agreement, net | 111,506 |
| | (51,393 | ) | | 60,113 |
| | 111,506 |
| | (45,081 | ) | | 66,425 |
|
| Total intangible assets | $ | 333,852 |
| | $ | (184,838 | ) | | $ | 149,014 |
| | $ | 642,289 |
| | $ | (373,179 | ) | | $ | 269,110 |
|
| Remaining prepaid expenses and other assets: | |
| | |
| | |
| | |
| | |
| | |
|
| Restricted cash | | | | | 51,674 |
| | | | | | 67,335 |
|
| Security and escrow deposits | |
| | |
| | 1,394 |
| | |
| | |
| | 2,308 |
|
| Prepaid expenses | |
| | |
| | 39,816 |
| | |
| | |
| | 54,987 |
|
| Other non-tenant receivables | |
| | |
| | 53,016 |
| | |
| | |
| | 31,265 |
|
| Other | |
| | |
| | 18,734 |
| | |
| | |
| | 69,790 |
|
| Total remaining prepaid expenses and other assets | |
| | |
| | 164,634 |
| | |
| | |
| | 225,685 |
|
| Total prepaid expenses and other assets | |
| | |
| | $ | 313,648 |
| | |
| | |
| | $ | 494,795 |
|
Brookfield Property REIT INC.
NOTES TO CONSOLIDATED FINANCIAL STATEMENTS (Continued)
(Dollars in thousands, except share and per share amounts)
NOTE 1615 ACCOUNTS PAYABLE AND ACCRUED EXPENSES
The following table summarizes the significant components of accounts payable and accrued expenses.
| | | | | | | | | | | | | | | | | | | | | | | | | | | | | | | | | | | |
| | 12/31/2020 | | 12/31/2019 |
| | Gross Liability | | Accumulated
Accretion | | Balance | | Gross Liability | | Accumulated
Accretion | | Balance |
| Intangible liabilities: | | | | | | | | | | | |
| Below-market tenant leases, net | $ | 222,432 | | | $ | (72,364) | | | $ | 150,068 | | | $ | 218,608 | | | $ | (56,893) | | | $ | 161,715 | |
| | | | | | | | | | | |
| | | | | | | | | | | |
| Total intangible liabilities | $ | 222,432 | | | $ | (72,364) | | | $ | 150,068 | | | $ | 218,608 | | | $ | (56,893) | | | $ | 161,715 | |
| Remaining accounts payable and accrued expenses: | | | | | | | | | | | |
| Accrued interest | | | | | 63,693 | | | | | | | 42,371 | |
| Accounts payable and accrued expenses | | | | | 83,041 | | | | | | | 71,720 | |
| Accrued real estate taxes | | | | | 76,401 | | | | | | | 53,210 | |
| Deferred gains/income | | | | | 94,752 | | | | | | | 85,598 | |
| Accrued payroll and other employee liabilities | | | | | 57,134 | | | | | | | 61,002 | |
| Construction payable | | | | | 272,080 | | | | | | | 301,096 | |
| Tenant and other deposits | | | | | 14,644 | | | | | | | 15,078 | |
| Insurance reserve liability | | | | | 12,793 | | | | | | | 12,787 | |
| Finance lease obligations | | | | | 9,093 | | | | | | | 9,094 | |
| Conditional asset retirement obligation liability | | | | | 2,342 | | | | | | | 3,275 | |
| | | | | | | | | | | |
| Lease liability right-of-use | | | | | 74,896 | | | | | | | 78,500 | |
| | | | | | | | | | | |
| Other | | | | | 82,680 | | | | | | | 131,684 | |
| Total remaining accounts payable and accrued expenses | | | | | 843,549 | | | | | | | 865,415 | |
| Total accounts payable and accrued expenses | | | | | $ | 993,617 | | | | | | | $ | 1,027,130 | |
|
| | | | | | | | | | | | | | | | | | | | | | | |
| | December 31, 2018 | | December 31, 2017 |
| | Gross Liability | | Accumulated Accretion | | Balance | | Gross Liability | | Accumulated Accretion | | Balance |
| Intangible liabilities: | |
| | |
| | |
| | |
| | |
| | |
|
| Below-market tenant leases, net | $ | 194,858 |
| | $ | (76,825 | ) | | $ | 118,033 |
| | $ | 348,984 |
| | $ | (162,228 | ) | | $ | 186,756 |
|
| Above-market headquarters office leases, net | — |
| | — |
| | — |
| | 4,342 |
| | (3,860 | ) | | 482 |
|
| Above-market ground leases, net | 754 |
| | (73 | ) | | 681 |
| | 9,880 |
| | (2,648 | ) | | 7,232 |
|
| Total intangible liabilities | $ | 195,612 |
| | $ | (76,898 | ) | | $ | 118,714 |
| | $ | 363,206 |
| | $ | (168,736 | ) | | $ | 194,470 |
|
| Remaining accounts payable and accrued expenses: | |
| | |
| | |
| | |
| | |
| | |
|
| Accrued interest | |
| | |
| | 29,576 |
| | |
| | |
| | 43,874 |
|
| Accounts payable and accrued expenses | |
| | |
| | 68,425 |
| | |
| | |
| | 77,405 |
|
| Accrued real estate taxes | |
| | |
| | 59,877 |
| | |
| | |
| | 78,213 |
|
| Deferred gains/income | |
| | |
| | 75,841 |
| | |
| | |
| | 90,379 |
|
| Accrued payroll and other employee liabilities | |
| | |
| | 64,515 |
| | |
| | |
| | 54,520 |
|
| Construction payable | |
| | |
| | 267,102 |
| | |
| | |
| | 221,172 |
|
| Tenant and other deposits | |
| | |
| | 12,248 |
| | |
| | |
| | 32,106 |
|
| Insurance reserve liability | |
| | |
| | 12,281 |
| | |
| | |
| | 12,035 |
|
| Capital lease obligations | |
| | |
| | 5,385 |
| | |
| | |
| | 5,385 |
|
| Conditional asset retirement obligation liability | |
| | |
| | 2,484 |
| | |
| | |
| | 6,149 |
|
| Other (1) | |
| | |
| | 236,921 |
| | |
| | |
| | 103,724 |
|
| Total remaining accounts payable and accrued expenses | |
| | |
| | 834,655 |
| | |
| | |
| | 724,962 |
|
| Total accounts payable and accrued expenses | |
| | |
| | $ | 953,369 |
| | |
| | |
| | $ | 919,432 |
|
(1) Increase relates to sales deposits received in advance of closing.
NOTE 1716 ACCUMULATED OTHER COMPREHENSIVE LOSS
Components of accumulated other comprehensive loss as of December 31, 20182020 and 20172019 are as follows:
| | | | | | | | | | | |
| | December 31, 2020 | | December 31, 2019 |
| Net unrealized gains (losses) on financial instruments | $ | 29 | | | $ | (9) | |
| Foreign currency translation | (100,826) | | | (85,393) | |
| Noncontrolling interests | 1,379 | | | 0 | |
| Accumulated other comprehensive loss | $ | (99,418) | | | $ | (85,402) | |
|
| | | | | | | |
| | December 31, 2018 | | December 31, 2017 |
| Net unrealized gains on financial instruments | $ | 133 |
| | $ | 116 |
|
| Foreign currency translation | (82,786 | ) | | (72,022 | ) |
| Accumulated other comprehensive loss | $ | (82,653 | ) | | $ | (71,906 | ) |
NOTE 1817 LITIGATION
In the normal course of business, from time to time, we are involved in legal proceedings relating to the ownership and operations of our properties. In management's opinion, the liabilities, if any, that may ultimately result from such legal actions are not expected to have a material effect on our consolidated financial position, results of operations or liquidity.
The Company is subject to litigation related to the BPY Transaction. The Company cannot predict the outcome of pending litigation, nor can it predict the amount of time and expense that will be required to resolve such litigation.
Brookfield Property REIT INC.Inc.
NOTES TO CONSOLIDATED FINANCIAL STATEMENTS (Continued)
(Dollars in thousands, except share and per share amounts)
NOTE 1918 COMMITMENTS AND CONTINGENCIES
We lease land or buildings at certain properties from third parties. The leases generally provide us with a right of first refusal in the event of a proposed sale of the property by the landlord. Rental payments are expensed as incurred and have, to the extent applicable, been straight-lined over the term of the lease. The following is a summary of our contractual rental expense as presented in our Consolidated Statements of Operations and Comprehensive Income:Income (Loss):
| | | | | | | | | | | | | | | | | | | | |
| | | Year Ended December 31, |
| | | 2020 | | 2019 | | 2018 |
| Contractual rent expense, including participation rent | | $ | 17,394 | | | $ | 12,979 | | | $ | 7,105 | |
| Contractual rent expense, including participation rent and excluding amortization of above and below-market ground leases and straight-line rent | | 13,011 | | | 12,979 | | | 5,083 | |
|
| | | | | | | | | | | | |
| | | Year Ended December 31, |
| | | 2018 | | 2017 | | 2016 |
| Contractual rent expense, including participation rent | | $ | 7,105 |
| | $ | 8,561 |
| | $ | 8,589 |
|
| Contractual rent expense, including participation rent and excluding amortization of above and below-market ground leases and straight-line rent | | 5,083 |
| | 6,304 |
| | 6,278 |
|
See Note 78 and Note 1817 for our obligations related to uncertain tax positions and for disclosure of additional contingencies.
The following table summarizes the contractual maturities of our long-term commitments.commitments other than operating leases which are included in Note 7. Long-term debt and ground leases includeincludes the related acquisition accounting fair value adjustments:
| | | | 2019 | | 2020 | | 2021 | | 2022 | | 2023 | | Subsequent/ Other | | Total | | 2021 | | 2022 | | 2023 | | 2024 | | 2025 | | Subsequent/
Other | | Total |
| Mortgages, notes and loans payable | $ | 419,708 |
| | $ | 809,880 |
| | $ | 2,883,611 |
| | $ | 1,445,297 |
| | $ | 3,166,904 |
| | $ | 3,864,249 |
| | $ | 12,589,649 |
| Mortgages, notes and loans payable | $ | 3,582,821 | | | $ | 2,716,712 | | | $ | 2,143,547 | | | $ | 2,371,516 | | | $ | 3,103,463 | | | $ | 2,196,527 | | | $ | 16,114,586 | |
| Retained debt-principal | 1,917 |
| | 81,364 |
| | — |
| | — |
| | — |
| | — |
| | 83,281 |
| Retained debt-principal | 56,975 | | | 0 | | | 0 | | | 0 | | | 0 | | | 0 | | | 56,975 | |
| Purchase obligations | 269,568 |
| | — |
| | — |
| | — |
| | — |
| | — |
| | 269,568 |
| Purchase obligations | 275,507 | | | 0 | | | 0 | | | 0 | | | 0 | | | 0 | | | 275,507 | |
| Ground lease payments | 2,139 |
| | 2,174 |
| | 2,209 |
| | 2,226 |
| | 2,233 |
| | 84,976 |
| | 95,957 |
| |
| Junior Subordinated Notes (1) | — |
| | — |
| | — |
| | — |
| | — |
| | 206,200 |
| | 206,200 |
| Junior Subordinated Notes (1) | 0 | | | 0 | | | 0 | | | 0 | | | 0 | | | 206,200 | | | 206,200 | |
| Corporate Leases | 7,809 |
| | 7,990 |
| | 8,177 |
| | 8,366 |
| | 8,561 |
| | 33,859 |
| | 74,762 |
| |
| Uncertain tax position liability | — |
| | — |
| | — |
| | — |
| | — |
| | — |
| | — |
| |
| Total | $ | 701,141 |
| | $ | 901,408 |
| | $ | 2,893,997 |
| | $ | 1,455,889 |
| | $ | 3,177,698 |
| | $ | 4,189,284 |
| | $ | 13,319,417 |
| Total | $ | 3,915,303 | | | $ | 2,716,712 | | | $ | 2,143,547 | | | $ | 2,371,516 | | | $ | 3,103,463 | | | $ | 2,402,727 | | | $ | 16,653,268 | |
| |
(1) | (1) The $206.2 million of junior subordinated notes are due in 2036, but may be redeemed any time after April 30, 2011. As we do not expect to redeem the notes prior to maturity, they are included in the consolidated debt maturing subsequent to 2025.
The future impact of the shutdown on our level of liquidity is uncertain at this time. Measures undertaken by governments and companies in our principal markets have resulted in the temporary closure of many of our operating assets with the vast majority of the assets now open. The duration of such measures may impact our ability to collect rental income in our retail assets. The longer-term impact of the pandemic and resulting economic downturn could reduce demand for retail space.
Consequently, we are reviewing, and where appropriate adjusting, our current capital expenditure and financing assumptions on existing and future projects to reflect any potential shorter- and longer-term impact of the global economic shutdown.
We are also reviewing contractual arrangements with our tenants to assess the rights and responsibilities of junior subordinated notes are due in 2036, but may be redeemed any time after April 30, 2011. As we do not expect to redeem the notes prior to maturity, they are included in the consolidated debt maturing subsequent to 2023. |
NOTE 20 SUBSEQUENT EVENTS
On January 7, 2019, the Company completedand our tenants in response to the saleimpact of its 12%the measures undertaken by governments and/or tenants. Potential responses may include, but are not limited to, extension of payment terms from tenants, adjustments to the duration of leases, payment holidays, and renegotiation of lease terms.
We expect to be able to refinance the majority of debt obligations maturing in the near term or to exercise contractual extension options thereon, although there is no guarantee we will be able to do so. In certain instances, we plan to seek certain modifications to mortgages, including lease restructuring approvals and technical default waivers, and potentially interest deferrals.
In addition, certain debt obligations are subject to financial covenants. As a result, in Bayside Marketplace for a gross valuethe shorter-term, the global economic shutdown may negatively impact our ability to meet such covenants. We are reviewing the financial covenants of $42.0 million.each debt instrument and, where applicable, working with our lenders to address debt instruments which may potentially approach or
On January 30, 2019, we entered into a revolving credit facility with BPY Bermuda Holdings IV Limited in which we lent $330.0 million. The note has an interest rate of LIBOR plus 2.50% and matures on January 30, 2020.
On February 11, 2019, the Company made an offer to purchase for cash up to $95,000,000 in value of its class A stock, at a price between $19.00 and $21.00 per share.
Brookfield Property REIT INC.Inc.
NOTES TO CONSOLIDATED FINANCIAL STATEMENTS (Continued)
(Dollars in thousands, except share and per share amounts)
breach covenant limits. Such adjustments may include, but are not limited to, adjustment to the covenant limits, interest payment holidays, and temporary suspension of covenant testing.
In order to maintain financial flexibility, we maintain capacity under the Facility. As of December 31, 2020, the available liquidity under such credit facility was $485.0 million. We believe we will be able to continue to borrow funds on the Facility when and as required.
NOTE 2119 SUBSEQUENT EVENTS
On January 1, 2021, the Company conveyed Florence Mall to the lender in satisfaction of $90.0 million in outstanding debt.
On January 1, 2021, the Company conveyed North Point Mall to the lender in satisfaction of $247.0 million in outstanding debt.
On January 4, 2021, Brookfield Asset Management, Inc. ("Brookfield Asset Management" or "BAM") with institutional partners announced a proposal to BPY to acquire all of the limited partnership units of BPY that it does not already own. Refer to Note 1 for more information.
On February 5, 2021, the Company closed on a new loan at Kenwood Towne Centre in the amount of $210.0 million with an interest rate of LIBOR plus 3.40%, which matures on February 9, 2024.
Brookfield Property REIT Inc.
NOTES TO CONSOLIDATED FINANCIAL STATEMENTS
(Dollars in thousands, except share and per share amounts)
NOTE 20 QUARTERLY FINANCIAL INFORMATION (UNAUDITED)
Quarterly data for the year ended December 31, 20182020 and 20172019 is summarized in the table below. In Q1 2018Q2 2020 and Q3 2018, theyQ4 2020, the adjustments include the impact of provisions for impairment (Note 2). In Q2 2017,2020, Q2 2019, Q3 2017, Q4 2017, Q1 2018, Q3 20182019 and Q4 2018,2019, the adjustments include gains (losses) from changes in control of investment properties in continuing operations. In Q1 2020, Q2 2020, Q3 2020, Q4 2017,2020, Q1 20182019, Q3 2019 and Q3 2018,Q4 2019, the adjustments include gains (losses) on investment in Unconsolidated Real Estate Affiliates (Note 3).
| | | | | | | | | | | | | | | | | | | | | | | |
| | 2020 |
| | First
Quarter | | Second
Quarter | | Third
Quarter | | Fourth
Quarter |
| Total revenues | $ | 403,630 | | | $ | 374,465 | | | $ | 366,983 | | | $ | 384,467 | |
| | | | | | | |
| Loss from continuing operations | (100,449) | | | (231,605) | | | (190,250) | | | (279,280) | |
| | | | | | | |
| Net loss attributable to Brookfield Property REIT Inc. | (81,827) | | | (209,050) | | | (170,620) | | | (249,964) | |
| | | | | | | |
| Class A Stock Earnings Per Share: | | | | | | | |
| Basic & Diluted Earnings Per Share | 0.3325 | | | 0.3325 | | | 0.3325 | | | 0.3325 | |
| | | | | | | |
| | | | | | | |
| | | | | | | |
| | | | | | | |
| | | | | | | |
| | | | | | | |
| | | | | | | |
| | | | | | | |
| | | | | | | |
| | | | | | | |
| | | | | | | |
| | | | | | | |
| | | | | | | | | | | | | | | | | | | | | | | |
| | 2019 |
| | First
Quarter | | Second
Quarter | | Third
Quarter | | Fourth
Quarter |
| Total revenues | $ | 376,383 | | | $ | 361,032 | | | $ | 375,125 | | | $ | 451,428 | |
| | | | | | | |
| Income (loss) from continuing operations | 38,283 | | | (265,105) | | | (36,789) | | | 744,522 | |
| | | | | | | |
| Net income (loss) attributable to Brookfield Property REIT Inc. | 31,650 | | | (227,220) | | | (33,423) | | | 661,873 | |
| | | | | | | |
| Class A Stock Earnings Per Share: | | | | | | | |
| Basic & Diluted Earnings Per Share | 0.33 | | | 0.33 | | | 0.33 | | | 0.33 | |
| | | | | | | |
| | | | | | | |
| | | | | | | |
| | | | | | | |
| | | | | | | |
| | | | | | | |
| | | | | | | |
| | | | | | | |
| | | | | | | |
| | | | | | | |
| | | | | | | |
| | | | | | | |
|
| | | | | | | | | | | | | | | |
| | 2018 |
| | First Quarter | | Second Quarter | | Third Quarter | | Fourth Quarter |
| Total revenues | $ | 574,166 |
| | $ | 583,144 |
| | $ | 493,149 |
| | $ | 413,575 |
|
| Income from continuing operations | 65,896 |
| | 95,564 |
| | 3,712,255 |
| | 290,054 |
|
| Net income attributable to Brookfield Property REIT Inc. | 64,036 |
| | 93,615 |
| | 3,683,274 |
| | 249,616 |
|
| | | | | | | | |
| Class A Stock Earnings Per Share: | | | | | | | |
| Basic & Diluted Earnings Per Share | — |
| | — |
| | 0.315 |
| | 0.315 |
|
| Dividends declared per share | — |
| | — |
| | 0.315 |
| | 0.315 |
|
| | | | | | | | |
| Common Stock Earnings Per Share: | | | | | | | |
| Basic Earnings Per Share | 0.06 |
| | 0.09 |
| | 4.70 |
| | — |
|
| Diluted Earnings Per Share | 0.06 |
| | 0.09 |
| | 4.68 |
| | — |
|
| Dividends declared per share | 0.22 |
| | 0.22 |
| | — |
| | — |
|
| | | | | | | | |
| Weighted-average shares outstanding: | | | | | | | |
| Basic | 957,450 |
| | 958,387 |
| | 777,208 |
| | — |
|
| Diluted | 960,293 |
| | 960,195 |
| | 781,030 |
| | — |
|
|
| | | | | | | | | | | | | | | |
| | 2017 |
| | First Quarter | | Second Quarter | | Third Quarter | | Fourth Quarter |
| Total revenues | $ | 566,332 |
| | $ | 555,796 |
| | $ | 578,357 |
| | $ | 627,375 |
|
| Income from continuing operations | 110,369 |
| | 128,318 |
| | 226,272 |
| | 201,914 |
|
| Net income attributable to Brookfield Property REIT Inc. | 107,160 |
| | 125,863 |
| | 222,780 |
| | 201,531 |
|
| | | | | | | | |
| Basic Earnings Per Share | 0.12 |
| | 0.14 |
| | 0.25 |
| | 0.21 |
|
| Diluted Earnings Per Share | 0.11 |
| | 0.13 |
| | 0.23 |
| | 0.21 |
|
| Dividends declared per share | 0.22 |
| | 0.22 |
| | 0.22 |
| | 0.22 |
|
| | | | | | | | |
| Weighted-average shares outstanding: | | | | | | | |
| Basic | 884,505 |
| | 882,255 |
| | 878,663 |
| | 942,766 |
|
| Diluted | 949,516 |
| | 945,325 |
| | 940,184 |
| | 954,947 |
|
Brookfield Property REIT Inc.
SCHEDULE III—REAL ESTATE AND ACCUMULATED DEPRECIATION
DECEMBER 31, 20182020
(Dollars in thousands)
| | | | | | | | | | | | | | | | | | | | | | | | | | | | | | | | | | | | | | | | | | | | | | | | | | | | | | | | | | | | | | | | | | | | | | | | | | |
| | | | | | | Acquisition Cost (b) | | Costs Capitalized
Subsequent to
Acquisition | | Gross Amounts at Which Carried at Close of Period (c) | | | | | | |
| Name of Center | | Location | | Encumbrances (a) | | Land | | Buildings and
Improvements | | Land | | Buildings and
Improvements | | Land | | Buildings and
Improvements | | Total | | Accumulated
Depreciation (d) | | Date
Acquired | | Life Upon
Which Latest
Statement of
Operation is
Computed |
| 200 LaFayette | | New York, NY | | 17,850 | | | 29,750 | | | 90,674 | | | (9,678) | | | (60,161) | | | 20,072 | | | 30,513 | | | 50,585 | | | 6,583 | | | April, 2015 | | (d) |
| 218 W 57th Street | | New York, NY | | 53,000 | | | 66,978 | | | 37,022 | | | (40,747) | | | (23,201) | | | 26,231 | | | 13,821 | | | 40,052 | | | 0 | | | September, 2017 | | (d) |
| 530 5th Avenue | | New York, NY | | 151,448 | | | 289,494 | | | 99,481 | | | (146,316) | | | (33,970) | | | 143,178 | | | 65,511 | | | 208,689 | | | 4,325 | | | September, 2017 | | (d) |
| 605 North Michigan Avenue | | Chicago, IL | | 79,917 | | | 50,980 | | | 90,634 | | | 0 | | | 3,753 | | | 50,980 | | | 94,387 | | | 145,367 | | | 13,123 | | | December, 2016 | | (d) |
| 685 Fifth Avenue | | New York, NY | | 273,350 | | | 549,756 | | | 117,780 | | | (98,073) | | | (25,589) | | | 451,683 | | | 92,191 | | | 543,874 | | | 19,623 | | | September, 2017 | | (d) |
| 730 Fifth Ave | | New York, NY | | 853,020 | | | 0 | | | 0 | | | 713,419 | | | 820,400 | | | 713,419 | | | 820,400 | | | 1,533,819 | | | 47,276 | | | June, 2019 | | (d) |
| 830 North Michigan Avenue | | Chicago, IL | | 71,600 | | | 33,200 | | | 123,553 | | | 15,298 | | | 4,321 | | | 48,498 | | | 127,874 | | | 176,372 | | | 25,099 | | | October, 2013 | | (d) |
| Beachwood Place | | Beachwood, OH | | 204,237 | | | 59,156 | | | 196,205 | | | 7,354 | | | 59,454 | | | 66,510 | | | 255,659 | | | 322,169 | | | 62,102 | | | November, 2010 | | (d) |
| Bellis Fair | | Bellingham, WA | | 79,325 | | | 14,122 | | | 102,033 | | | 0 | | | 33,085 | | | 14,122 | | | 135,118 | | | 149,240 | | | 41,075 | | | November, 2010 | | (d) |
| Brass Mill Center | | Waterbury, CT | | 62,995 | | | 31,496 | | | 99,107 | | | 0 | | | 18,535 | | | 31,496 | | | 117,642 | | | 149,138 | | | 38,014 | | | November, 2010 | | (d) |
| Coastland Center | | Naples, FL | | 108,252 | | | 24,470 | | | 166,038 | | | 0 | | | 4,451 | | | 24,470 | | | 170,489 | | | 194,959 | | | 44,225 | | | November, 2010 | | (d) |
| Columbia Mall | | Columbia, MO | | 42,802 | | | 7,943 | | | 107,969 | | | (1,236) | | | (1,726) | | | 6,707 | | | 106,243 | | | 112,950 | | | 26,201 | | | November, 2010 | | (d) |
| Coral Ridge Mall | | Coralville, IA | | 95,713 | | | 20,178 | | | 134,515 | | | (554) | | | 26,609 | | | 19,624 | | | 161,124 | | | 180,748 | | | 39,883 | | | November, 2010 | | (d) |
| Crossroads Center | | St. Cloud, MN | | 88,255 | | | 15,499 | | | 103,077 | | | (267) | | | 17,196 | | | 15,232 | | | 120,273 | | | 135,505 | | | 31,588 | | | November, 2010 | | (d) |
| Deerbrook Mall | | Humble, TX | | 128,782 | | | 36,761 | | | 133,448 | | | 0 | | | 26,048 | | | 36,761 | | | 159,496 | | | 196,257 | | | 40,915 | | | November, 2010 | | (d) |
| Eastridge Mall | | Casper, WY | | 40,971 | | | 5,484 | | | 36,756 | | | 0 | | | 8,875 | | | 5,484 | | | 45,631 | | | 51,115 | | | 23,418 | | | November, 2010 | | (d) |
| Four Seasons Town Centre | | Greensboro, NC | | 28,272 | | | 17,259 | | | 126,570 | | | (391) | | | 23,151 | | | 16,868 | | | 149,721 | | | 166,589 | | | 64,932 | | | November, 2010 | | (d) |
| Fox River Mall | | Appleton, WI | | 158,248 | | | 42,259 | | | 217,932 | | | (103) | | | 10,659 | | | 42,156 | | | 228,591 | | | 270,747 | | | 56,768 | | | November, 2010 | | (d) |
| Grand Teton Mall | | Idaho Falls, ID | | 41,269 | | | 13,066 | | | 59,658 | | | (1,215) | | | (4,616) | | | 11,851 | | | 55,042 | | | 66,893 | | | 16,113 | | | November, 2010 | | (d) |
| Greenwood Mall | | Bowling Green, KY | | 59,727 | | | 12,459 | | | 85,370 | | | 1,417 | | | 6,130 | | | 13,876 | | | 91,500 | | | 105,376 | | | 32,179 | | | November, 2010 | | (d) |
| Hulen Mall | | Fort Worth, TX | | 87,156 | | | 8,665 | | | 112,252 | | | 0 | | | 31,823 | | | 8,665 | | | 144,075 | | | 152,740 | | | 37,811 | | | November, 2010 | | (d) |
| Jordan Creek Town Center | | West Des Moines, IA | | 192,171 | | | 54,663 | | | 262,608 | | | 6,042 | | | 15,770 | | | 60,705 | | | 278,378 | | | 339,083 | | | 67,794 | | | November, 2010 | | (d) |
| Mall of Louisiana | | Baton Rouge, LA | | 322,393 | | | 88,742 | | | 319,097 | | | (141) | | | 23,709 | | | 88,601 | | | 342,806 | | | 431,407 | | | 84,176 | | | November, 2010 | | (d) |
| Mall St. Matthews | | Louisville, KY | | 170,205 | | | 42,014 | | | 155,809 | | | (6,522) | | | 28,433 | | | 35,492 | | | 184,242 | | | 219,734 | | | 48,412 | | | November, 2010 | | (d) |
| Mayfair Mall | | Wauwatosa, WI | | 329,307 | | | 84,473 | | | 352,140 | | | (1,950) | | | 54,100 | | | 82,523 | | | 406,240 | | | 488,763 | | | 103,200 | | | November, 2010 | | (d) |
| Meadows Mall | | Las Vegas, NV | | 134,055 | | | 30,275 | | | 136,846 | | | (1,574) | | | 1,589 | | | 28,701 | | | 138,435 | | | 167,136 | | | 34,488 | | | November, 2010 | | (d) |
| Merrick Park | | Coral Gables, FL | | 388,420 | | | 0 | | | 0 | | | 11,888 | | | 343,608 | | | 11,888 | | | 343,608 | | | 355,496 | | | 19,775 | | | November, 2019 | | (d) |
| Mondawmin Mall | | Baltimore, MD | | 80,673 | | | 19,707 | | | 63,348 | | | 0 | | | 23,360 | | | 19,707 | | | 86,708 | | | 106,415 | | | 26,737 | | | November, 2010 | | (d) |
| Neshaminy Mall | | Bensalem, PA | | 462 | | | 11,615 | | | 48,224 | | | 4,401 | | | 12,414 | | | 16,016 | | | 60,638 | | | 76,654 | | | 12,746 | | | June, 2017 | | (d) |
| North Star Mall | | San Antonio, TX | | 283,030 | | | 91,135 | | | 392,422 | | | 0 | | | 24,633 | | | 91,135 | | | 417,055 | | | 508,190 | | | 104,910 | | | November, 2010 | | (d) |
| NorthTown Mall | | Spokane, WA | | 81,945 | | | 12,310 | | | 108,857 | | | 0 | | | 32,894 | | | 12,310 | | | 141,751 | | | 154,061 | | | 41,705 | | | November, 2010 | | (d) |
| Oakwood Center | | Gretna, LA | | 82,201 | | | 21,105 | | | 74,228 | | | 4,309 | | | 28,645 | | | 25,414 | | | 102,873 | | | 128,287 | | | 32,181 | | | November, 2010 | | (d) |
| Oakwood Mall | | Eau Claire, WI | | 67,194 | | | 13,786 | | | 92,114 | | | 204 | | | 4,300 | | | 13,990 | | | 96,414 | | | 110,404 | | | 27,227 | | | November, 2010 | | (d) |
| Oxmoor Center | | Louisville, KY | | 80,067 | | | 0 | | | 117,814 | | | 0 | | | 20,820 | | | 0 | | | 138,634 | | | 138,634 | | | 36,811 | | | November, 2010 | | (d) |
|
| | | | | | | | | | | | | | | | | | | | | | | | | | | | | | | | | | | | | | | | | | |
| | | | | | | Acquisition Cost (b) | | Costs Capitalized Subsequent to Acquisition | | Gross Amounts at Which Carried at Close of Period (c) | | | | | | |
| Name of Center | | Location | | Encumbrances (a) | | Land | | Buildings and Improvements | | Land | | Buildings and Improvements | | Land | | Buildings and Improvements | | Total | | Accumulated Depreciation (d) | | Date Acquired | | Life Upon Which Latest Statement of Operation is Computed |
| 200 LaFayette | | New York, NY | | 26,635 |
| | 29,750 |
| | 90,674 |
| | (9,678 | ) | | (55,693 | ) | | 20,072 |
| | 34,981 |
| | 55,053 |
| | 4,806 |
| | April, 2015 | | (d) |
| 218 W 57th Street | | New York, NY | | 53,000 |
| | 66,978 |
| | 37,022 |
| | — |
| | 1,011 |
| | 66,978 |
| | 38,033 |
| | 105,011 |
| | 1,053 |
| | September, 2017 | | (d) |
| 530 5th Avenue | | New York, NY | | 147,615 |
| | 289,494 |
| | 99,481 |
| | — |
| | 25,051 |
| | 289,494 |
| | 124,532 |
| | 414,026 |
| | 6,064 |
| | September, 2017 | | (d) |
| 605 North Michigan Avenue | | Chicago, IL | | 79,863 |
| | 50,980 |
| | 90,634 |
| | — |
| | 2,831 |
| | 50,980 |
| | 93,465 |
| | 144,445 |
| | 6,494 |
| | December, 2016 | | (d) |
| 685 Fifth Avenue | | New York, NY | | 272,914 |
| | 549,756 |
| | 117,780 |
| | (98,073 | ) | | (20,152 | ) | | 451,683 |
| | 97,628 |
| | 549,311 |
| | 10,114 |
| | September, 2017 | | (d) |
| 830 North Michigan Avenue | | Chicago, IL | | 84,842 |
| | 33,200 |
| | 123,553 |
| | 15,298 |
| | 9,102 |
| | 48,498 |
| | 132,655 |
| | 181,153 |
| | 20,819 |
| | October, 2013 | | (d) |
| Beachwood Place | | Beachwood, OH | | 212,669 |
| | 59,156 |
| | 196,205 |
| | 7,354 |
| | 48,899 |
| | 66,510 |
| | 245,104 |
| | 311,614 |
| | 47,127 |
| | November, 2010 | | (d) |
| Bellis Fair | | Bellingham, WA | | 83,162 |
| | 14,122 |
| | 102,033 |
| | — |
| | 33,087 |
| | 14,122 |
| | 135,120 |
| | 149,242 |
| | 31,781 |
| | November, 2010 | | (d) |
| Brass Mill Center | | Waterbury, CT | | 65,309 |
| | 31,496 |
| | 99,107 |
| | — |
| | 14,025 |
| | 31,496 |
| | 113,132 |
| | 144,628 |
| | 30,057 |
| | November, 2010 | | (d) |
| Coastland Center | | Naples, FL | | 114,027 |
| | 24,470 |
| | 166,038 |
| | — |
| | 4,028 |
| | 24,470 |
| | 170,066 |
| | 194,536 |
| | 35,915 |
| | November, 2010 | | (d) |
| Columbia Mall | | Columbia, MO | | 53,145 |
| | 7,943 |
| | 107,969 |
| | (154 | ) | | (722 | ) | | 7,789 |
| | 107,247 |
| | 115,036 |
| | 21,813 |
| | November, 2010 | | (d) |
| Coral Ridge Mall | | Coralville, IA | | 106,915 |
| | 20,178 |
| | 134,515 |
| | 2,219 |
| | 26,405 |
| | 22,397 |
| | 160,920 |
| | 183,317 |
| | 33,832 |
| | November, 2010 | | (d) |
| Crossroads Center | | St. Cloud, MN | | 94,316 |
| | 15,499 |
| | 103,077 |
| | — |
| | 8,179 |
| | 15,499 |
| | 111,256 |
| | 126,755 |
| | 24,442 |
| | November, 2010 | | (d) |
| Deerbrook Mall | | Humble, TX | | 134,970 |
| | 36,761 |
| | 133,448 |
| | — |
| | 20,313 |
| | 36,761 |
| | 153,761 |
| | 190,522 |
| | 32,071 |
| | November, 2010 | | (d) |
| Eastridge Mall | | Casper, WY | | 42,477 |
| | 5,484 |
| | 36,756 |
| | — |
| | 8,682 |
| | 5,484 |
| | 45,438 |
| | 50,922 |
| | 18,158 |
| | November, 2010 | | (d) |
| Four Seasons Town Centre | | Greensboro, NC | | 30,628 |
| | 17,259 |
| | 126,570 |
| | — |
| | 17,102 |
| | 17,259 |
| | 143,672 |
| | 160,931 |
| | 48,708 |
| | November, 2010 | | (d) |
| Fox River Mall | | Appleton, WI | | 165,355 |
| | 42,259 |
| | 217,932 |
| | (103 | ) | | 7,561 |
| | 42,156 |
| | 225,493 |
| | 267,649 |
| | 45,907 |
| | November, 2010 | | (d) |
| Grand Teton Mall | | Idaho Falls, ID | | 44,601 |
| | 13,066 |
| | 59,658 |
| | (1,073 | ) | | (3,854 | ) | | 11,993 |
| | 55,804 |
| | 67,797 |
| | 13,770 |
| | November, 2010 | | (d) |
| Greenwood Mall | | Bowling Green, KY | | 61,440 |
| | 12,459 |
| | 85,370 |
| | 1,417 |
| | 6,208 |
| | 13,876 |
| | 91,578 |
| | 105,454 |
| | 25,998 |
| | November, 2010 | | (d) |
| Hulen Mall | | Fort Worth, TX | | 88,932 |
| | 8,665 |
| | 112,252 |
| | — |
| | 29,210 |
| | 8,665 |
| | 141,462 |
| | 150,127 |
| | 29,341 |
| | November, 2010 | | (d) |
| Jordan Creek Town Center | | West Des Moines, IA | | 201,023 |
| | 54,663 |
| | 262,608 |
| | 6,042 |
| | 24,730 |
| | 60,705 |
| | 287,338 |
| | 348,043 |
| | 57,676 |
| | November, 2010 | | (d) |
| Mall of Louisiana | | Baton Rouge, LA | | 323,971 |
| | 88,742 |
| | 319,097 |
| | (141 | ) | | 10,100 |
| | 88,601 |
| | 329,197 |
| | 417,798 |
| | 68,154 |
| | November, 2010 | | (d) |
| Mall St. Matthews | | Louisville, KY | | 176,282 |
| | 42,014 |
| | 155,809 |
| | (6,522 | ) | | 20,994 |
| | 35,492 |
| | 176,803 |
| | 212,295 |
| | 37,836 |
| | November, 2010 | | (d) |
| Mayfair Mall | | Wauwatosa, WI | | 341,409 |
| | 84,473 |
| | 352,140 |
| | (1,950 | ) | | 47,655 |
| | 82,523 |
| | 399,795 |
| | 482,318 |
| | 81,801 |
| | November, 2010 | | (d) |
| Meadows Mall | | Las Vegas, NV | | 141,635 |
| | 30,275 |
| | 136,846 |
| | (1,574 | ) | | 3,190 |
| | 28,701 |
| | 140,036 |
| | 168,737 |
| | 29,257 |
| | November, 2010 | | (d) |
| Mondawmin Mall | | Baltimore, MD | | 83,644 |
| | 19,707 |
| | 63,348 |
| | — |
| | 23,302 |
| | 19,707 |
| | 86,650 |
| | 106,357 |
| | 22,477 |
| | November, 2010 | | (d) |
| Neshaminy Mall | | Bensalem, PA | | 411 |
| | 11,615 |
| | 48,224 |
| | 4,401 |
| | 15,919 |
| | 16,016 |
| | 64,143 |
| | 80,159 |
| | 7,905 |
| | June, 2017 | | (d) |
| North Point Mall | | San Antonio, TX | | 249,707 |
| | 57,900 |
| | 228,517 |
| | — |
| | 11,446 |
| | 57,900 |
| | 239,963 |
| | 297,863 |
| | 54,239 |
| | November, 2010 | | (d) |
| North Star Mall | | Northridge, CA | | 298,284 |
| | 91,135 |
| | 392,422 |
| | — |
| | 18,511 |
| | 91,135 |
| | 410,933 |
| | 502,068 |
| | 84,364 |
| | November, 2010 | | (d) |
| NorthTown Mall | | Spokane, WA | | 84,954 |
| | 12,310 |
| | 108,857 |
| | — |
| | 31,679 |
| | 12,310 |
| | 140,536 |
| | 152,846 |
| | 31,553 |
| | November, 2010 | | (d) |
| Oakwood Center | | Gretna, LA | | 85,219 |
| | 21,105 |
| | 74,228 |
| | 4,309 |
| | 28,209 |
| | 25,414 |
| | 102,437 |
| | 127,851 |
| | 25,958 |
| | November, 2010 | | (d) |
| Oakwood Mall | | Eau Claire, WI | | 69,662 |
| | 13,786 |
| | 92,114 |
| | 204 |
| | 5,046 |
| | 13,990 |
| | 97,160 |
| | 111,150 |
| | 21,710 |
| | November, 2010 | | (d) |
| Oxmoor Center | | Louisville, KY | | 83,817 |
| | — |
| | 117,814 |
| | — |
| | 15,546 |
| | — |
| | 133,360 |
| | 133,360 |
| | 28,465 |
| | November, 2010 | | (d) |
| | | | | | | | | Acquisition Cost (b) | | Costs Capitalized Subsequent to Acquisition | | Gross Amounts at Which Carried at Close of Period (c) | | | | | | | | | | | Acquisition Cost (b) | | Costs Capitalized
Subsequent to
Acquisition | | Gross Amounts at Which Carried at Close of Period (c) | | | | |
| Name of Center | | Location | | Encumbrances (a) | | Land | | Buildings and Improvements | | Land | | Buildings and Improvements | | Land | | Buildings and Improvements | | Total | | Accumulated Depreciation (d) | | Date Acquired | | Life Upon Which Latest Statement of Operation is Computed | Name of Center | | Location | | Encumbrances (a) | | Land | | Buildings and
Improvements | | Land | | Buildings and
Improvements | | Land | | Buildings and
Improvements | | Total | | Accumulated
Depreciation (d) | | Date
Acquired | | Life Upon
Which Latest
Statement of
Operation is
Computed |
| Paramus Park | | Paramus, NJ | | 119,626 |
| | 31,320 |
| | 102,054 |
| | 5,563 |
| | 52,275 |
| | 36,883 |
| | 154,329 |
| | 191,212 |
| | 28,109 |
| | November, 2010 | | (d) | Paramus Park | | Paramus, NJ | | 119,737 | | | 31,320 | | | 102,054 | | | 5,563 | | | 85,765 | | | 36,883 | | | 187,819 | | | 224,702 | | | 39,002 | | | November, 2010 | | (d) |
| Park City Center | | Lancaster, PA | | 173,813 |
| | 42,451 |
| | 195,409 |
| | — |
| | 3,772 |
| | 42,451 |
| | 199,181 |
| | 241,632 |
| | 39,431 |
| | November, 2010 | | (d) | Park City Center | | Lancaster, PA | | 120,081 | | | 42,451 | | | 195,409 | | | 0 | | | 9,917 | | | 42,451 | | | 205,326 | | | 247,777 | | | 49,385 | | | November, 2010 | | (d) |
| Park Meadows | | Park Meadows | | Denver, Colorado | | 699,221 | | | 0 | | | 0 | | | 187,010 | | | 979,418 | | | 187,010 | | | 979,418 | | | 1,166,428 | | | 44,906 | | | November, 2019 | | (d) |
| Peachtree Mall | | Columbus, GA | | 75,151 |
| | 13,855 |
| | 92,143 |
| | 734 |
| | 9,022 |
| | 14,589 |
| | 101,165 |
| | 115,754 |
| | 21,810 |
| | November, 2010 | | (d) | Peachtree Mall | | Columbus, GA | | 71,011 | | | 13,855 | | | 92,143 | | | 734 | | | 7,296 | | | 14,589 | | | 99,439 | | | 114,028 | | | 25,888 | | | November, 2010 | | (d) |
| Pecanland Mall | | Monroe, LA | | 83,643 |
| | 12,943 |
| | 73,231 |
| | — |
| | 10,749 |
| | 12,943 |
| | 83,980 |
| | 96,923 |
| | 20,603 |
| | November, 2010 | | (d) | Pecanland Mall | | Monroe, LA | | 80,969 | | | 12,943 | | | 73,231 | | | 0 | | | 13,964 | | | 12,943 | | | 87,195 | | | 100,138 | | | 25,474 | | | November, 2010 | | (d) |
| Perimeter Mall | | Perimeter Mall | | Atlanta, GA | | 274,980 | | | 0 | | | 0 | | | 125,584 | | | 454,364 | | | 125,584 | | | 454,364 | | | 579,948 | | | 26,605 | | | November, 2019 | | (d) |
| Pioneer Place | | Portland, OR | | 124,776 |
| | 21,462 |
| | 97,096 |
| | (3,890 | ) | | 115,032 |
| | 17,572 |
| | 212,128 |
| | 229,700 |
| | 43,247 |
| | November, 2010 | | (d) | Pioneer Place | | Portland, OR | | 120,358 | | | 21,462 | | | 97,096 | | | (3,890) | | | 123,525 | | | 17,572 | | | 220,621 | | | 238,193 | | | 58,501 | | | November, 2010 | | (d) |
| Prince Kuhio Plaza | | Hilo, HI | | 40,391 |
| | — |
| | 52,373 |
| | — |
| | 24,344 |
| | — |
| | 76,717 |
| | 76,717 |
| | 25,421 |
| | November, 2010 | | (d) | Prince Kuhio Plaza | | Hilo, HI | | 38,536 | | | 0 | | | 52,373 | | | 0 | | | 26,440 | | | 0 | | | 78,813 | | | 78,813 | | | 33,524 | | | November, 2010 | | (d) |
| Providence Place | | Providence, RI | | 369,763 |
| | — |
| | 400,893 |
| | — |
| | 78,232 |
| | — |
| | 479,125 |
| | 479,125 |
| | 91,683 |
| | November, 2010 | | (d) | Providence Place | | Providence, RI | | 350,422 | | | 0 | | | 400,893 | | | 0 | | | 86,815 | | | 0 | | | 487,708 | | | 487,708 | | | 116,171 | | | November, 2010 | | (d) |
| Quail Springs Mall | | Oklahoma City, OK | | 68,959 |
| | 40,523 |
| | 149,571 |
| | (24 | ) | | 16,288 |
| | 40,499 |
| | 165,859 |
| | 206,358 |
| | 29,370 |
| | June, 2013 | | (d) | Quail Springs Mall | | Oklahoma City, OK | | 62,305 | | | 40,523 | | | 149,571 | | | (3,318) | | | 20,830 | | | 37,205 | | | 170,401 | | | 207,606 | | | 41,132 | | | June, 2013 | | (d) |
| River Hills Mall | | Mankato, MN | | 69,703 |
| | 16,207 |
| | 85,608 |
| | — |
| | 13,140 |
| | 16,207 |
| | 98,748 |
| | 114,955 |
| | 21,270 |
| | November, 2010 | | (d) | River Hills Mall | | Mankato, MN | | 65,858 | | | 16,207 | | | 85,608 | | | (425) | | | 13,448 | | | 15,782 | | | 99,056 | | | 114,838 | | | 27,291 | | | November, 2010 | | (d) |
| Rivertown Crossings | | Grandville, MI | | 137,916 |
| | 47,790 |
| | 181,770 |
| | (504 | ) | | 11,286 |
| | 47,286 |
| | 193,056 |
| | 240,342 |
| | 41,935 |
| | November, 2010 | | (d) | Rivertown Crossings | | Grandville, MI | | 132,139 | | | 47,790 | | | 181,770 | | | 711 | | | 12,791 | | | 48,501 | | | 194,561 | | | 243,062 | | | 48,891 | | | November, 2010 | | (d) |
| Sooner Mall | | Norman, OK | | 70,561 |
| | 9,902 |
| | 69,570 |
| | — |
| | 2,956 |
| | 9,902 |
| | 72,526 |
| | 82,428 |
| | 15,989 |
| | November, 2010 | | (d) | Sooner Mall | | Norman, OK | | 66,186 | | | 9,902 | | | 69,570 | | | (321) | | | 4,001 | | | 9,581 | | | 73,571 | | | 83,152 | | | 19,696 | | | November, 2010 | | (d) |
| Southwest Plaza | | Littleton, CO | | 113,414 |
| | 19,024 |
| | 203,044 |
| | (16 | ) | | (12,524 | ) | | 19,008 |
| | 190,520 |
| | 209,528 |
| | 58,263 |
| | November, 2010 | | (d) | |
| Spokane Valley Mall | | Spokane, WA | | 55,643 |
| | 16,817 |
| | 100,209 |
| | — |
| | (7,874 | ) | | 16,817 |
| | 92,335 |
| | 109,152 |
| | 24,320 |
| | November, 2010 | | (d) | Spokane Valley Mall | | Spokane, WA | | 49,430 | | | 16,817 | | | 100,209 | | | (483) | | | (8,076) | | | 16,334 | | | 92,133 | | | 108,467 | | | 29,906 | | | November, 2010 | | (d) |
| Staten Island Mall | | Staten Island, NY | | 240,010 |
| | 102,227 |
| | 375,612 |
| | 11,118 |
| | 216,340 |
| | 113,345 |
| | 591,952 |
| | 705,297 |
| | 83,703 |
| | November, 2010 | | (d) | Staten Island Mall | | Staten Island, NY | | 226,068 | | | 102,227 | | | 375,612 | | | 11,118 | | | 352,171 | | | 113,345 | | | 727,783 | | | 841,128 | | | 148,127 | | | November, 2010 | | (d) |
| Stonestown Galleria | | San Francisco, CA | | 179,391 |
| | 65,962 |
| | 203,043 |
| | (1,686 | ) | | 51,264 |
| | 64,276 |
| | 254,307 |
| | 318,583 |
| | 44,817 |
| | November, 2010 | | (d) | Stonestown Galleria | | San Francisco, CA | | 173,551 | | | 65,962 | | | 203,043 | | | (1,686) | | | 64,887 | | | 64,276 | | | 267,930 | | | 332,206 | | | 57,798 | | | November, 2010 | | (d) |
| Southwest Plaza | | Southwest Plaza | | Littleton, CO | | 109,398 | | | 19,024 | | | 203,044 | | | (16) | | | (14,503) | | | 19,008 | | | 188,541 | | | 207,549 | | | 82,142 | | | November, 2010 | | (d) |
| The Shoppes at Buckland | | Manchester, CT | | 115,818 |
| | 35,180 |
| | 146,474 |
| | (280 | ) | | 6,228 |
| | 34,900 |
| | 152,702 |
| | 187,602 |
| | 31,177 |
| | November, 2010 | | (d) | The Shoppes at Buckland | | Manchester, CT | | 111,619 | | | 35,180 | | | 146,474 | | | (16,313) | | | (85,613) | | | 18,867 | | | 60,861 | | | 79,728 | | | 1,380 | | | November, 2010 | | (d) |
| The Streets at SouthPoint | | Durham, NC | | 238,444 |
| | 66,045 |
| | 242,189 |
| | (74 | ) | | 12,418 |
| | 65,971 |
| | 254,607 |
| | 320,578 |
| | 54,126 |
| | November, 2010 | | (d) | The Streets at SouthPoint | | Durham, NC | | 227,845 | | | 66,045 | | | 242,189 | | | (74) | | | 20,926 | | | 65,971 | | | 263,115 | | | 329,086 | | | 66,099 | | | November, 2010 | | (d) |
| The Woodlands Mall | | The Woodlands, TX | | 296,788 |
| | 84,889 |
| | 349,315 |
| | 2,315 |
| | 50,103 |
| | 87,204 |
| | 399,418 |
| | 486,622 |
| | 83,441 |
| | November, 2010 | | (d) | The Woodlands Mall | | The Woodlands, TX | | 458,886 | | | 84,889 | | | 349,315 | | | 2,315 | | | 58,756 | | | 87,204 | | | 408,071 | | | 495,275 | | | 108,455 | | | November, 2010 | | (d) |
| Town East Mall | | Mesquite, TX | | 160,114 |
| | 9,928 |
| | 168,555 |
| | — |
| | 21,747 |
| | 9,928 |
| | 190,302 |
| | 200,230 |
| | 38,637 |
| | November, 2010 | | (d) | Town East Mall | | Mesquite, TX | | 160,145 | | | 9,928 | | | 168,555 | | | 0 | | | 41,789 | | | 9,928 | | | 210,344 | | | 220,272 | | | 48,140 | | | November, 2010 | | (d) |
| Towson Town Center | | Towson Town Center | | Coral Gables, FL | | 308,955 | | | 0 | | | 0 | | | 74,232 | | | 454,277 | | | 74,232 | | | 454,277 | | | 528,509 | | | 26,917 | | | November, 2019 | | (d) |
| Tysons Galleria | | McLean, VA | | 293,377 |
| | 90,317 |
| | 351,005 |
| | (105 | ) | | 89,241 |
| | 90,212 |
| | 440,246 |
| | 530,458 |
| | 75,800 |
| | November, 2010 | | (d) | Tysons Galleria | | McLean, VA | | 279,406 | | | 90,317 | | | 351,005 | | | (105) | | | 101,096 | | | 90,212 | | | 452,101 | | | 542,313 | | | 101,559 | | | November, 2010 | | (d) |
| Valley Plaza Mall | | Bakersfield, CA | | 236,676 |
| | 38,964 |
| | 211,930 |
| | 6,763 |
| | 47,838 |
| | 45,727 |
| | 259,768 |
| | 305,495 |
| | 46,937 |
| | November, 2010 | | (d) | Valley Plaza Mall | | Bakersfield, CA | | 227,762 | | | 38,964 | | | 211,930 | | | 6,763 | | | 53,091 | | | 45,727 | | | 265,021 | | | 310,748 | | | 59,285 | | | November, 2010 | | (d) |
| Visalia Mall | | Visalia, CA | | 73,974 |
| | 11,912 |
| | 80,185 |
| | — |
| | 4,555 |
| | 11,912 |
| | 84,740 |
| | 96,652 |
| | 17,745 |
| | November, 2010 | | (d) | Visalia Mall | | Visalia, CA | | 73,696 | | | 11,912 | | | 80,185 | | | 0 | | | 6,916 | | | 11,912 | | | 87,101 | | | 99,013 | | | 21,291 | | | November, 2010 | | (d) |
| Water Tower Place | | Water Tower Place | | Seattle, WA | | 361,143 | | | 85,443 | | | 308,331 | | | 0 | | | 442 | | | 85,443 | | | 308,773 | | | 394,216 | | | 19,489 | | | May, 2020 | | (d) |
| Westlake Center | | Seattle, WA | | 45,729 |
| | 19,055 |
| | 129,295 |
| | (14,819 | ) | | (60,668 | ) | | 4,236 |
| | 68,627 |
| | 72,863 |
| | 17,342 |
| | November, 2010 | | (d) | Westlake Center | | Wayne, NJ | | 51,071 | | | 19,055 | | | 129,295 | | | (14,819) | | | (51,953) | | | 4,236 | | | 77,342 | | | 81,578 | | | 26,563 | | | November, 2010 | | (d) |
| Willowbrook | | Wayne, NJ | | 359,555 |
| | 110,660 |
| | 419,822 |
| | — |
| | 34,769 |
| | 110,660 |
| | 454,591 |
| | 565,251 |
| | 94,608 |
| | November, 2010 | | (d) | Willowbrook | | 359,699 | | | 110,660 | | | 419,822 | | | 0 | | | 38,664 | | | 110,660 | | | 458,486 | | | 569,146 | | | 117,715 | | | November, 2010 | | (d) |
| Construction in progress and other (e) | | 4,949,781 |
| | 21,447 |
| | 61,894 |
| | (5,951 | ) | | 988,253 |
| | 15,497 |
| | 1,050,147 |
| | 1,065,644 |
| | 125,152 |
| | Various | | (d) | |
| Office, other and construction in progress (e) | | Office, other and construction in progress (e) | | 6,001,997 | | | 79,347 | | | 290,411 | | | (78,655) | | | 351,751 | | | 692 | | | 642,162 | | | 642,854 | | | 185,132 | | |
| | | | | | | | | | | | | | | | | | | | | | Total | | $ | 16,320,786 | | | $ | 2,871,023 | | | $ | 9,442,719 | | | $ | 749,490 | | | $ | 4,782,697 | | | $ | 3,620,513 | | | $ | 14,225,416 | | | $ | 17,845,929 | | | $ | 2,967,879 | | |
| | | Total | | $ | 12,795,849 |
|
| $ | 2,785,580 |
|
| $ | 9,134,388 |
|
| $ | (78,880 | ) |
| $ | 2,216,386 |
|
| $ | 2,706,701 |
|
| $ | 11,350,774 |
|
| $ | 14,057,475 |
|
| $ | 2,214,603 |
| | |
(a) See description of mortgages, notes and other loans payable in Note 6 of Notes to Consolidated Financial Statements. Includes $1.4$1.3 billion cross-collateralized loan.
(b) Acquisition for individual properties represents historical cost at the end of the month acquired.
(c) The aggregate cost of land, buildings and improvements of consolidated properties for federal income tax purposes is approximately $11.9$16.6 billion.
(d) Depreciation is computed based upon the following estimated useful lives:
|
| | | | | | | |
| | Years |
| Buildings and improvements | | 10 - 45 |
| Equipment and fixtures | | 3 - 20 |
| Tenant improvements | | Shorter of useful life or applicable lease term |
(e) Other retail properties.
Brookfield Property REIT Inc.
NOTES TO SCHEDULE III
(Dollars in thousands)
Reconciliation of Real Estate
| | | | | | | | | | | | | | | | | |
| | 2020 | | 2019 | | 2018 |
| (In thousands) | | | | | |
| Balance at beginning of period | $ | 17,840,627 | | | $ | 14,057,475 | | | $ | 21,444,712 | |
| Additions | 636,185 | | | 4,740,235 | | | 818,570 | |
| Impairments | (173,708) | | | (253,121) | | | (64,699) | |
| Dispositions, transfers and write-offs | (457,175) | | | (703,962) | | | (8,141,108) | |
| Balance at end of period | $ | 17,845,929 | | | $ | 17,840,627 | | | $ | 14,057,475 | |
|
| | | | | | | | | | | |
| | 2018 | | 2017 | | 2016 |
| (In thousands) | |
| | |
| | |
|
| Balance at beginning of period | $ | 21,444,712 |
| | $ | 19,409,217 |
| | $ | 20,285,046 |
|
| Additions | 818,570 |
| | 2,428,887 |
| | 958,651 |
|
| Impairments | (64,699 | ) | | — |
| | (130,619 | ) |
| Dispositions, transfers and write-offs | (8,141,108 | ) | | (393,392 | ) | | (1,703,861 | ) |
| Balance at end of period | $ | 14,057,475 |
| | $ | 21,444,712 |
| | $ | 19,409,217 |
|
Reconciliation of Accumulated Depreciation | | | | | | | | | | | | | | | | | |
| | 2020 | | 2019 | | 2018 |
| (In thousands) | | | | | |
| Balance at beginning of period | $ | 2,569,911 | | | $ | 2,214,603 | | | $ | 3,188,481 | |
| Depreciation expense | 608,978 | | | 473,424 | | | 583,024 | |
| Dispositions, transfers and write-offs | (211,010) | | | (118,116) | | | (1,556,902) | |
| Balance at end of period | $ | 2,967,879 | | | $ | 2,569,911 | | | $ | 2,214,603 | |
|
| | | | | | | | | | | |
| | 2018 | | 2017 | | 2016 |
| (In thousands) | |
| | |
| | |
|
| Balance at beginning of period | $ | 3,188,481 |
| | $ | 2,737,286 |
| | $ | 2,452,127 |
|
| Depreciation expense | 583,024 |
| | 644,148 |
| | 620,540 |
|
| Dispositions, transfers and write-offs | (1,556,902 | ) | | (192,953 | ) | | (335,381 | ) |
| Balance at end of period | $ | 2,214,603 |
| | $ | 3,188,481 |
| | $ | 2,737,286 |
|