UNITED STATES
SECURITIES AND EXCHANGE COMMISSION
Washington, D.C. 20549
FORM 10-K
(Mark One)
|
| |
| x | ANNUAL REPORT PURSUANT TO SECTION 13 OR 15(d) OF THE SECURITIES EXCHANGE ACT OF 1934 |
For the fiscal year ended December 31, 20162018 |
| |
| | OR |
| o | TRANSITION REPORT PURSUANT TO SECTION 13 OR 15(d) OF THE SECURITIES EXCHANGE ACT OF 1934 |
| | For the transition period from _________ to __________ |
Commission file numbers: 001-35263 and 333-197780
|
|
| VEREIT, Inc. |
| VEREIT Operating Partnership, L.P. |
| (Exact name of registrant as specified in its charter) |
|
| | |
| Maryland (VEREIT, Inc.) | | 45-2482685 |
| Delaware (VEREIT Operating Partnership, L.P.) | | 45-1255683 |
| (State or other jurisdiction of incorporation or organization) | | (I.R.S. Employer Identification No.) |
| | | |
| 2325 E. Camelback Road, Suite 1100, Phoenix, AZ | | 85016 |
| (Address of principal executive offices) | | (Zip Code) |
|
|
| (800) 606-3610 |
| (Registrant’s telephone number, including area code) |
|
| | |
| Securities registered pursuant to Section 12(b) of the Securities Exchange Act of 1934: |
| Title of each class: | Name of each exchange on which registered: |
| Common Stock, $0.01 par value per share (VEREIT, Inc.) | New York Stock Exchange |
| 6.70% Series F Cumulative Redeemable Preferred Stock, $0.01 par value per share (VEREIT, Inc.) | New York Stock Exchange |
| | | |
| Securities registered pursuant to Section 12(g) of the Securities Exchange Act of 1934: |
| None | |
Indicate by check mark if the registrant is a well-known seasoned issuer, as defined in Rule 405 of the Securities Act of 1933.
VEREIT, Inc. Yes x No o VEREIT Operating Partnership, L.P. Yes x No o
Indicate by check mark if the registrant is not required to file reports pursuant to Section 13 or Section 15(d) of the Securities Exchange Act of 1934.
VEREIT, Inc. Yes o No x VEREIT Operating Partnership, L.P. Yes o No x
Indicate by check mark whether the registrant (1) has filed all reports required to be filed by Section 13 or 15(d) of the Securities Exchange Act of 1934 during the preceding 12 months (or for such shorter period that the registrant was required to file such reports), and (2) has been subject to such filing requirements for the past 90 days. VEREIT, Inc. Yes x No oVEREIT Operating Partnership, L.P. Yes x No o
Indicate by check mark whether the registrant has submitted electronically and posted on its corporate Web Site, if any, every Interactive Data File required to be submitted and posted pursuant to Rule 405 of Regulation S-T during the preceding 12 months (or for such shorter period that the registrant was required to submit and post such files). VEREIT, Inc. Yes x No o VEREIT Operating Partnership, L.P. Yes x No o
Indicate by check mark if disclosure of delinquent filers pursuant to Item 405 of Regulation S-K is not contained herein, and will not be contained, to the best of registrant’s knowledge, in definitive proxy or information statements incorporated by reference in Part III of this Form 10-K or any amendment to this Form 10-K. ox
Indicate by check mark whether the registrant is a large accelerated filer, an accelerated filer, a non-accelerated filer, or a smaller reporting company or an emerging growth company. See definitionthe definitions of “large accelerated filer,” “accelerated filer,” and “smaller reporting company,” and “emerging growth company” in Rule 12b-2 of the Exchange Act.
|
| | | | | | | | |
| VEREIT, Inc. | Large accelerated filer | x | | Accelerated filer | o | | Non-accelerated filer | o |
| | | | | | | |
| Smaller reporting company | o | | Emerging growth company | o | | |
|
| | | |
VEREIT, Inc. | Large accelerated filer x
| | Accelerated filer o
|
| Non-accelerated filer o
| (Do not check if a smaller reporting company) | Smaller reporting company o
|
|
| | | |
| VEREIT Operating Partnership, L.P. | Large accelerated filer | o | | Accelerated filer | o | | Non-accelerated filer | x |
| | Non-accelerated filer x
| (Do not check if a smaller reporting company) | | | | | |
| Smaller reporting company | o | | Emerging growth company | o | | |
If an emerging growth company, indicate by check mark if the registrant has elected not to use the extended transition period for complying with any new or revised financial accounting standards pursuant to Section 13(a) of the Exchange Act. VEREIT, Inc. ¨ VEREIT Operating Partnership, L.P. o
Indicate by check mark whether the registrant is a shell company (as defined in Rule 12b-2 of the Exchange Act).
VEREIT, Inc. Yes o No x VEREIT Operating Partnership, L.P. Yes o No x
The aggregate market value of voting and non-voting common stock held by non-affiliates of VEREIT, Inc. as of June 30, 201629, 2018 was approximately $9.2$7.2 billion based on the closing sale price for VEREIT, Inc.’s common stock on that day as reported by the New York Stock Exchange. Such value excludes common stock held by executive officers and directors.
There were 974,109,378967,784,153 shares of common stock of VEREIT, Inc. outstanding as of February 22, 2017.19, 2019.
There is no public trading market for the common units of VEREIT Operating Partnership, L.P. As a result, the aggregate market value of the common units held by non-affiliates of VEREIT Operating Partnership, L.P. cannot be determined.
DOCUMENTS INCORPORATED BY REFERENCE
Certain portions of VEREIT, Inc.’s Definitive Proxy Statement for its 20172019 Annual Meeting of Stockholders (the “Proxy Statement”) to be filed pursuant to Rule 14a-6 of the Securities Exchange Act of 1934, as amended, are incorporated by reference into this Annual Report on Form 10-K. Other than those portions of the Proxy Statement specifically incorporated by reference pursuant to Items 10 through 14 of Part III hereof, no other portions of the Proxy Statement shall be deemed so incorporated.
EXPLANATORY NOTE
This report combines the Annual Reports on Form 10-K for the year ended December 31, 20162018 of VEREIT, Inc., a Maryland corporation, and VEREIT Operating Partnership, L.P., a Delaware limited partnership, of which VEREIT, Inc. is the sole general partner. Unless otherwise indicated or unless the context requires otherwise, all references in this report to “we,” “us,” “our,” “VEREIT,” the “Company” or the “Company”“General Partner” mean VEREIT, Inc., which we sometimes refer to as the “General Partner”, together with its consolidated subsidiaries, including VEREIT Operating Partnership, L.P., and all references to the “Operating Partnership” or “OP” mean VEREIT Operating Partnership, L.P. together with its consolidated subsidiaries.
As the sole general partner of VEREIT Operating Partnership, L.P., VEREIT, Inc. has the full, exclusive and complete responsibility for the Operating Partnership’s day-to-day management and control.
We believe combining the Annual Reports on Form 10-K of VEREIT, Inc. and VEREIT Operating Partnership, L.P. into this single report results in the following benefits:
enhancing investors’ understanding of the Company and the Operating Partnership by enabling investors to view the business as a whole in the same manner as management views and operates the business;
eliminating duplicative disclosure and providing a more streamlined and readable presentation since a substantial portion of the disclosure applies to both the Company and the Operating Partnership; and
creating time and cost efficiencies through the preparation of one combined report instead of two separate reports.
There are a few differences between the Company and the Operating Partnership, which are reflected in the disclosure in this report. We believe it is important to understand the differences between the Company and the Operating Partnership in the context of how we operate as an interrelated consolidated company. VEREIT, Inc. is a real estate investment trust whose only material asset is its ownership of partnership interests of the Operating Partnership. As a result, VEREIT, Inc. does not conduct business itself, other than acting as the sole general partner of the Operating Partnership, issuing public equity or debt from time to time and guaranteeing certain unsecured debt of the Operating Partnership and certain of its subsidiaries. The Operating Partnership holds substantially all of the assets of the Company and holds the ownership interests in the Company’s joint ventures. The Operating Partnership conducts the operations of the business and is structured as a partnership with no publicly traded equity. Except for net proceeds from public equity or debt issuances by VEREIT, Inc., which are generally contributed to the Operating Partnership in exchange for partnership units, the Operating Partnership generates the capital required by the Company’s business through the Operating Partnership’s operations, by the Operating Partnership’s direct or indirect incurrence of indebtedness or through the issuance of partnership units. To help investors understand the significant differences between VEREIT, Inc. and the Operating Partnership, there are separate sections in this report that separately discuss VEREIT, Inc. and the Operating Partnership, including the consolidated financial statements and certain notes to the consolidated financial statements as well as separate disclosures in Item 9A. Controls and Procedures and Exhibit 31 and Exhibit 32 certifications. As general partner with control of the Operating Partnership, VEREIT, Inc. consolidates the Operating Partnership for financial reporting purposes. Therefore, the assets and liabilities of VEREIT, Inc. and VEREIT Operating Partnership, L.P. are the same on their respective consolidated financial statements. The separate discussions of VEREIT, Inc. and VEREIT Operating Partnership, L.P. in this report should be read in conjunction with each other to understand the results of the Company on a consolidated basis and how management operates the Company.
VEREIT, INC. and VEREIT OPERATING PARTNERSHIP, L.P.
For the fiscal year ended December 31, 20162018
Forward-Looking Statements
This Annual Report on Form 10-K includes “forward-looking statements” (within the meaning of the federal securities laws, Section 27A of the Securities Act of 1933, as amended (the “Securities Act”), and Section 21E of the Exchange Act)Act of 1934, as amended (the “Exchange Act”)) that reflect our expectations and projections about our future results, performance, prospects and opportunities. We have attempted to identify these forward-looking statements by the use of words such as “may,” “will,” “seek,” “expects,” “anticipates,” “believes,” “targets,” “intends,” “should,” “estimates,” “could,” “continue,” “assume,” “projects,” “plans” or similar expressions. These forward-looking statements are based on information currently available to us and are subject to a number of known and unknown risks, uncertainties and other factors that may cause our actual results, performance or achievements to be materially different from any future results, performance or achievements expressed or implied by these forward-looking statements. These factors include, among other things, those discussed below. We intend for all such forward-looking statements to be covered by the safe harbor provisions for forward-looking statements contained in Section 27A of the Securities Act and Section 21E of the Exchange Act, as applicable by law. We do not undertake publicly to update or revise any forward-looking statements, whether as a result of changes in underlying assumptions or new information, future events or otherwise, except as may be required to satisfy our obligations under federal securities law.
The following are some, but not all, of the assumptions, risks, uncertainties and other factors that could cause our actual results to differ materially from those presented in our forward-looking statements:
We may be unable to renew leases, lease vacant space or re-lease space as leases expire on favorable terms or at all.
We are subject to risks associated with tenant, geographic and industry concentrations with respect to our properties.
Our properties, goodwill and intangible assets and other assets may be subject to impairment charges.
We could be subject to unexpected costs or unexpected liabilities that may arise from potential dispositions.dispositions, including related to limited partnership, tenant-in-common and Delaware statutory trust real estate programs (“1031 real estate programs”) and VEREIT’s management with respect to such programs.
We are subject to competition in the acquisition and disposition of properties and in the leasing of our properties and we may be unable to acquire, dispose of, or lease properties on advantageous terms.
We could be subject to risks associated with bankruptcies or insolvencies of tenants, or from tenant defaults generally.generally or from the unpredictability of the business plans and financial condition of our tenants.
We may be affected byare subject to risks associated with pending government investigations relating to the findings of the previously-announced investigation conducted in 2014 by the audit committee (the “Audit Committee”) of the General Partner’s boardBoard of directorsDirectors (the “Audit Committee Investigation”) and related litigation.litigation, including the expense of such investigations and litigation and any additional potential payments upon resolution.
We have substantial indebtedness, which may affect our ability to pay dividends, and expose us to interest rate fluctuation risk and the risk of default under our debt obligations.
Our overall borrowing and operating flexibility may be adversely affected by the terms and restrictions within the indenture governing the Senior Notes (as defined in Note 11 –Debtsenior unsecured notes (the “Senior Notes”), and the Credit Agreement governing the terms of the Credit Facility (as both terms are defined in Note 11 –DebtItem 1. Business).
Our access to capital and terms of future financings may be affected by adverse changes to our credit rating.
We may be affected by the incurrence of additional secured or unsecured debt.
We may not be able to achieve and maintain profitability.
We may not generate cash flows sufficient to pay our dividends to stockholders or meet our debt service obligations.
We may be affected by risks resulting from losses in excess of insured limits.
We may fail to remain qualified as a real estate investment trust (“REIT”) for U.S. federal income tax purposes.
Compliance with the REIT annual distribution requirements may limit our operating flexibility.
| |
• | We may be unable to fully reestablish the financial network which previously supported Cole Capital® and its Cole REITs (defined below) and/or regain the prior level of transaction and capital raising volume of Cole Capital.
|
Our Cole Capital operations are subject to extensive governmental regulation.
We are subject to conflicts of interest relating to Cole Capital’s investment management business.
We may be unable to retain or hire key personnel.
All forward-looking statements should be read in light of the risks identified in Part I, Item 1A. Risk Factors within thisour Annual Report on Form 10-K.10-K for the year ended December 31, 2018.
We use certain defined terms throughout this Annual Report on Form 10-K that have the following meanings:
When we refer to “annualized rental income,” we mean the rental revenue under our leases on operating properties owned at the respective reporting date on a straight-line basis, which includes the effect of rent escalations and any tenant concessions, such as free rent, and excludes any bad debt allowances and any contingent rent, such as percentage rent. Management uses annualized rental income as a basis for tenant, industry and geographic concentrations and other metrics within the portfolio. Annualized rental income is not indicative of future performance.
When we refer to a “creditworthy tenant,” we mean a tenant that has entered into a lease that we determine is creditworthy and may include tenants with an investment grade or below investment grade credit rating, as determined by major credit rating agencies, or unrated tenants. To the extent we determine that a tenant is a “creditworthy tenant” even though it does not have an investment grade credit rating, we do so based on our management’s determination that a tenant should have the financial wherewithal to honor its obligations under its lease with us. As explained further below, this determination is based on our management’s substantial experience performing credit analysis and is made after evaluating all of a tenant’s due diligence materials that are made available to us, including financial statements and operating data.
When we refer to a “direct financing lease,” we mean a lease that requires specific treatment due to the significance of the lease payments from the inception of the lease compared to the fair value of the property, term of the lease, a transfer of ownership, or a bargain purchase option. These leases are recorded as a net asset on the balance sheet. The amount recorded is calculated as the fair value of the remaining lease payments on the leases and the estimated fair value of any expected residual property value at the end of the lease term.
When we refer to properties that are net leased on a “long term basis,” we mean properties with remaining primary lease terms of generally seven to 10 years or longer on average, depending on property type.
Under a “net lease,” the tenant occupying the leased property (usually as a single tenant) does so in much the same manner as if the tenant were the owner of the property. There are various forms of net leases, most typically classified as triple net or double net. Triple net leases typically require that the tenant pay all expenses associated with the property (e.g., real estate taxes, insurance, maintenance and repairs). Double net leases typically require that the tenant pay all operating expenses associated with the property (e.g., real estate taxes, insurance and maintenance), but excludes some or all major repairs (e.g., roof, structure and parking lot). Accordingly, the owner receives the rent “net” of these expenses, rendering the cash flow associated with the lease predictable for the term of the lease. Under a net lease, the tenant generally agrees to lease the property for a significant term and agrees that it will either have no ability or only limited ability to terminate the lease or abate rent prior to the expiration of the term of the lease as a result of real estate driven events such as casualty, condemnation or failure by the landlord to fulfill its obligations under the lease.
When we refer to “operating properties” we mean properties owned by the Company and beginning in 2017, omitting Excluded Properties. “Excluded Properties” are defined as properties for which (i) the related mortgage loan is in default, and (ii) management decides to transfer the properties to the lender in connection with settling the mortgage note obligation. As of December 31, 2018, our portfolio was comprised of 3,994 retail, restaurant, office and industrial real estate properties with an aggregate of 95.0 million square feet, of which 98.8% was leased, with a weighted-average remaining lease term of 8.9 years. As of December 31, 2018, there were no Excluded Properties. During the year ended December 31, 2018, one vacant industrial property was considered an Excluded Property. The Company entered into a deed-in-lieu of foreclosure agreement and conveyed its interest in this property to the lender in April 2018.
PART I
Item 1. Business.
Overview
We areVEREIT is a full-service real estate operating company that operates through two business segments, our real estate investment (“REI”) segmentwhich owns and our investment management segment, Cole Capital, as further discussedmanages one of the largest portfolios of single-tenant commercial properties in “Note 3 – Segment Reporting” to our consolidated financial statements. Through our REI segment, we own and actively manage a diversified portfolio of 4,142the U.S. The Company has 3,994 retail, restaurant, office and industrial real estateoperating properties with an aggregate of 93.395.0 million square feet, of which 98.3%98.8% was leased as of December 31, 2016,2018, with a weighted-average remaining lease term of 9.98.9 years. Through our Cole Capital segment, we are responsibleVEREIT’s business model provides equity capital to creditworthy corporations in return for raising capital for and managing the affairs of certain non-listed real estate investment trusts (the “Cole REITs”)long-term leases on a day-to-day basis, identifying and making acquisitions and investments on behalf of the Cole REITs, and recommending to the respective board of directors of each of the Cole REITs an approach for providing investors with liquidity. Cole Capital receives compensation and reimbursement for performing these services.their properties.
Substantially all of the REI segment’sour real estate operations are conducted through the Operating Partnership. VEREIT, Inc. is the sole general partner and holder of 97.6% of the common partnership interests in the Operating Partnership (the “OP Units”) as of December 31, 20162018 with the remaining 2.4% of the OP Units owned by certain non-affiliated investors and certain former directors, officers and employees of the Former Manager (defined below)(as defined in Item 1A. Risk Factors).
Prior to the fourth quarter of 2017, the Company operated through two business segments, the real estate investment segment and the investment management segment, Cole Capital. The Company completed the sale of Cole Capital on February 1, 2018. SubstantiallyThe assets, liabilities and related financial results of substantially all of the Cole Capital segment’s operationssegment are conducted through Cole Capital Advisors, Inc. (“CCA”), an Arizona corporation and a wholly owned subsidiary ofreflected in the Operating Partnership. CCA is treated as a taxable REIT subsidiary (“TRS”) under Section 856 of the Internal Revenue Code of 1986, as amended (the “Internal Revenue Code”). Prior to January 8, 2014, we were externally managed by ARC Properties Advisors, LLC (the “Former Manager”) on a day-to-day basis, with the exception of certain acquisition, accounting and portfolio management activities which were performed by our employees. In August 2013, our board of directors (the “Board of Directors” or the “Board”) determined that it was in our best interests to become self-managed, and we completed our transition to self-management on January 8, 2014. Through strategic mergers and acquisitions discussed in “Note 6 – Mergers with Real Estate Businesses” to our consolidated financial statements the Company has grown significantly since incorporation.as discontinued operations.
VEREIT, Inc. was incorporated in the State of Maryland on December 2, 2010 and has elected to be treated as a REIT for U.S. federal income tax purposes. The Operating Partnership was incorporatedformed in the State of Delaware on January 13, 2011. We operate our business in a manner that permits us to maintain our exemption from registration under the Investment Company Act of 1940, as amended (the “Investment Company Act”).amended. VEREIT, Inc.’s shares of common stock (“Common Stock”) and 6.70% Series F Cumulative Redeemable Preferred Stock (“Series F Preferred Stock”) trade on the New York Stock Exchange (the “NYSE”) under the trading symbols “VER” and “VER PRF,” respectively.
20162018 Developments
Real Estate Acquisitions
During the year ended December 31, 2016,2018, the Company acquired controlling financial interests in eight52 commercial properties, including one land parcel for build-to-suit development, for an aggregate purchase price of $100.2 million.$502.7 million, which includes $2.6 million of external acquisition-related expenses that were capitalized.
Real Estate Dispositions
During the year ended December 31, 2016,2018, the Company disposed of 301 149 properties, including one property conveyed to a lender in a deed-in-lieu of foreclosure transaction, the Excluded Property, and one property owned by an unconsolidated joint venture for an aggregate sales price of $1.20 billion,$560.5 million, of which the Company’s share was $1.14 billion,$521.4 million, resulting in consolidated proceeds of $1.00 billion$502.3 million after closing costs, $55.0 millionrepayment of debt assumptions and $57.0 million of debt repayments by the unconsolidated joint venture.venture’s mortgage loan and closing costs. The Company recorded a gain of $96.9 million related to the dispositions.
Balance Sheet and Liquidity
2016 Bond OfferingLitigation Settlements
During the year ended December 31, 2018, the Company entered into settlement agreements with various plaintiffs in connection with litigation filed as a result of the findings of the Audit Committee Investigation for $217.5 million. The Company also entered into a settlement agreement for $15.7 million subsequent to December 31, 2018, which was accrued as of December 31, 2018 and $300.0 million 2016 Term Loanincluded in litigation, merger and other non-routine costs, net of insurance recoveries in the consolidated statements of operations for the year ended December 31, 2018. See Note 10 – Commitments and Contingencies for additional information.
Credit Agreement
On June 2, 2016,May 23, 2018, the Operating Partnership closed its senior note offeringGeneral Partner, as guarantor, and the OP, as borrower, entered into a credit agreement with Wells Fargo Bank, National Association, as administrative agent and the other lenders party thereto (the “2016 Bond Offering”“Credit Agreement”),. The Credit Agreement allows for maximum borrowings of $2.9 billion, consisting of (i) $0.4a $2.0 billion aggregate principal amount of 4.125% Senior Notes due June 1, 2021unsecured revolving credit facility (the “Revolving Credit Facility”) and (ii) $0.6 billion aggregate principal amount of 4.875% Senior Notes due June 1, 2026 and entereda $900.0 million unsecured term loan facility (the “Credit Facility Term Loan,” together with the Revolving Credit Facility, the “Credit Facility”). In connection with entering into the $300.0 million 2016 Term Loan, as defined in Note 11 –Debt. On July 5, 2016,Credit Agreement, the Company redeemedOP repaid all of the $1.3 billion aggregateoutstanding obligations under the Amended and Restated Credit Agreement dated as of June 30, 2014 (as amended, the “2014 Credit Agreement”) and the 2014 Credit Agreement was terminated.
2018 Convertible Notes
The Company’s convertible senior notes due August 1, 2018 (the “2018 Convertible Notes”) matured and the principal amountoutstanding balance of our outstanding 2.000% Senior Notes due February 2017,$597.5 million, plus accrued and unpaid interest thereon, andwas repaid with proceeds from the required make-whole premium.Revolving Credit Facility.
Common Stock Offering2025 Senior Notes
On August 10, 2016, VEREIT, Inc. issued 69.0October 16, 2018, the Company closed a senior note offering, consisting of $550.0 million sharesaggregate principal amount of common stock in a public offering forthe OP’s 4.625% Senior Notes due 2025 (the “2025 Senior Notes”). The OP used the net proceeds after underwriting discounts andfrom the offering costs, of $702.5 million, which were usedthe notes to repay the entire $300.0 million 2016 Term Loan and in part to repay amountsborrowings under theits Revolving Credit Facility.
Common Stock Continuous Offering ProgramDebt Activity
On September 19, 2016, the Company registered a continuous equity offering program (the “Program”) pursuant to which the Company can offer and sell, from time to time through September 19, 2019 in “at-the-market” offerings or certain other transactions, shares of common stock with an aggregate gross sales price of up to $750.0 million, through its sales agents. There were no shares of common stock issued under the Program duringDuring the year ended December 31, 2016.
Debt Repayments
As a result2018, the Company’s total debt increased by $14.5 million, from $6.07 billion to $6.09 billion, partially due to the issuance of the reduction in mortgage debt due to property dispositions2025 Senior Notes, and other measures taken by management,net borrowings on the Company decreased total debt by $1.7 billion, from $8.1 billion to $6.4 billion, comprised of unsecured bonds of $0.3 billion, unsecured2014 Credit Agreement and Credit Facility of $1.0 billion,$218.0 million. These borrowings were partially offset by the repayment of $597.5 million of the 2018 Convertible Notes and a reduction of $153.9 million in secured debtdebt.
Share Repurchase Programs
On May 12, 2017, the Company’s Board of $0.4 billion.Directors authorized the repurchase of up to $200.0 million of the Company’s outstanding Common Stock over the subsequent 12 months, as market conditions warranted (the “2017 Share Repurchase Program”). On May 3, 2018, the Company’s Board of Directors terminated the 2017 Share Repurchase Program and authorized a new program (the “2018 Share Repurchase Program,” and collectively with the 2017 Share Repurchase Program, the “Share Repurchase Programs”) that permits the Company to repurchase up to $200.0 million of its outstanding Common Stock through May 3, 2019, as market conditions warrant. During the year ended December 31, 2018, the Company repurchased approximately 6.4 million shares of Common Stock in multiple open market transactions, at a weighted average share price of $6.94, for an aggregate purchase price of $44.6 million, as part of the 2017 Share Repurchase Program and 0.8 million shares of Common Stock in multiple open market transactions, at a weighted average share price of $6.95 for an aggregate purchase price of $5.6 million as part of the 2018 Share Repurchase Program.
Cole Capital Sale
On February 1, 2018, we sold all of the issued and outstanding shares of common stock of Cole Capital Advisors, Inc. (“CCA”), our subsidiary that sponsored and managed non-listed real estate investment trusts, and certain of CCA’s subsidiaries, to CCA Acquisition, LLC (the “Cole Purchaser”), an affiliate of CIM Group, LLC for total consideration of approximately $120.0 million in cash.
On February 1, 2018, we entered into a services agreement (the “Services Agreement”) with Cole Capital, pursuant to which we will continue to provide certain services to Cole Capital and its subsidiaries and to Cole Credit Property Trust IV, Inc. (“CCPT IV”), CIM Income NAV, Inc. (formerly known as Cole Real Estate Income Strategy (Daily NAV), Inc.) (“INAV”), Cole Office & Industrial REIT (CCIT II), Inc. (“CCIT II”), Cole Office & Industrial REIT (CCIT III), Inc. (“CCIT III”), and Cole Credit Property Trust V, Inc. (“CCPT V” and collectively with CCPT IV, INAV, CCIT II and CCIT III, the “Cole REITs”) including operational real estate support. Under the terms of the Services Agreement, we are entitled to receive reimbursement for certain of the services provided and fees based on the future revenues of Cole Capital above a specified dollar threshold (the “Net Revenue Payments”), up to an aggregate of $80.0 million in Net Revenue Payments. There were no Net Revenue Payments received or earned for 2018.
Primary Investment Focus
We own and actively manage a diversified portfolio of single-tenant retail, restaurant, office and industrial real estate assets subject to long-term net leases with creditworthy tenants. Our focus is on single-tenant, net-leased properties that are strategically located and essential to the business operations of the tenant, as well as retail properties that offer necessity and value-oriented products or services. We actively manage the portfolio by considering several metrics including property type, tenant concentration, geography, credit and key economic factors for appropriate balance and diversity. We believe that actively managing our portfolio allows us to attain the best operating results for each asset and the overall portfolio through strategic planning, implementation of these plans and responding proactively to changes and challenges in the marketplace.
Additionally, we employ a shared services model for Cole Capital’s portfolios by providing transactional and operational real estate functions. The shared services model allows our strong and experienced real estate team to be active in the markets at all times and manage complimentary portfolios.
Investment Policies
When evaluating prospective investments in or dispositions of real property, our management considers relevant real estate and financial factors, including the location of the property, the leases and other agreements affecting the property and business operations of the tenant, the creditworthiness of major tenants, its income-producing capacity, its physical condition, its prospects for appreciation, its prospects for liquidity, tax considerations and other factors. In this regard, our management will have substantial discretion with respect to the selection of specific investments, subject in certain instances to the approval of the Board of Directors.
As part of our overall portfolio strategy, we seek to lease space and/or acquire properties leased to creditworthy tenants that meet our underwriting and operating guidelines. Prior to entering into any transaction, our corporate credit analysis and underwriting professionals conduct a review of a tenant’s credit quality. In addition, we consistently monitor the credit quality of our portfolio by actively reviewing the creditworthiness of certain tenants, focusing primarily on those tenants representing the greatest concentration of our portfolio. This review primarily includes an analysis of the tenant’s financial statements either quarterly, or as frequently as the lease permits. We also consider tenant credit quality when assessing our portfolio for strategic dispositions. When we assess tenant credit quality, we, among other factors that we may deem relevant: (i) review relevant financial information,
including financial ratios, net worth, revenue, cash flows, leverage and liquidity; (ii) evaluate the depth and experience of the tenant’s management team; and (iii) assess the strength/growth of the tenant’s industry. On an on-going basis, we evaluate the need for an allowance for doubtful accounts arising from estimated losses that could result from the tenant’s inability to make required current rent payments and an allowance against accrued rental incomerevenue for future potential losses that we deem to be unrecoverable over the term of the lease. The factors considered in determining the credit risk of our tenants include, but are not limited to: payment history; credit status and change in status (credit ratings for public companies are used as a primary metric); change in tenant space needs (i.e., expansion/downsize); tenant financial performance; economic conditions in a specific geographic region; and industry specific credit considerations. We are of the opinion that the credit risk of our portfolio is reduced by the high quality of our existing tenant base, reviews of prospective tenants’ risk profiles prior to lease execution and consistent monitoring of our portfolio to identify potential problem tenants.
tenants and mitigation options.
Real Estate Investments
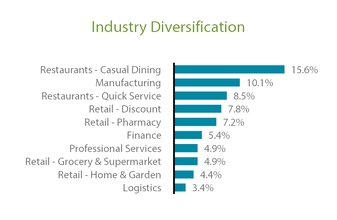
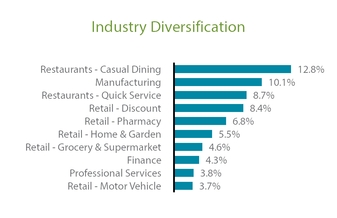
As of December 31, 2016,2018, the Company owned 4,1423,994 operating properties comprising 93.395.0 million square feet of retail and commercial space located in 49 states and Puerto Rico, and Canada, which includes properties owned through consolidated joint ventures. The rentable space at these properties was 98.3%98.8% leased with a weighted-average remaining lease term of 9.98.9 years. There were no tenants exceeding 10% of our consolidated annualized rental income as of December 31, 20162018, 2017 or 2015.2016. As of December 31, 2014, leases with Red Lobster® restaurants2018, 2017 and 2016, properties located in Texas represented 11.6%12.5%, 12.8% and 13.5%, respectively, of our consolidated annualized rental income. As of December 31, 2016, 20152018, tenants in the casual dining restaurant and 2014, properties locatedmanufacturing industries accounted for 12.8% and 10.1%, respectively, of our consolidated annualized rental income. As of December 31, 2017, tenants in Texas represented 13.5%, 13.1%the casual dining restaurant and 12.7%manufacturing industries accounted for 13.8% and 10.1%, respectively, of our consolidated annualized rental income. As of December 31, 2016, tenants in the casual dining restaurant and manufacturing industries accounted for 15.6% and 10.1%, respectively, of our consolidated annualized rental income. As of December 31, 2015, tenants in the casual dining restaurant and manufacturing industries accounted for 16.6% and 10.1%, respectively, of our consolidated annualized rental income. As of December 31, 2014, tenants in the casual dining restaurant industry accounted for 18.4% of our consolidated annualized rental income.
Cole Capital®
Cole Capital sponsors and manages direct investment real estate programs, which primarily include five publicly registered, non-listed REITs, as discussed in “Note 2 – Summary of Significant Accounting Policies” to our consolidated financial statements. Cole Capital is responsible for raising capital for and managing the day-to-day affairs of the Cole REITs, identifying and making acquisitions and investments on behalf of the Cole REITs, and recommending to each of the Cole REIT’s respective board of directors an approach for providing investors with liquidity. Cole Capital serves as the dealer manager and distributes shares of common stock for certain Cole REITs and advises them regarding offerings, manages relationships with participating broker-dealers and financial advisors, and provides assistance in connection with compliance matters relating to the offerings. Cole Capital receives compensation and reimbursement for services relating to the Cole REITs’ offerings and the investment, management, financing and disposition of their respective assets, as applicable. Cole Capital also develops new REIT offerings, including obtaining regulatory approvals from the U.S. Securities and Exchange Commission (the “SEC”), the Financial Industry Regulatory Authority, Inc. (“FINRA”) and various blue sky jurisdictions for such offerings.
Financing Policies
We rely on leverage to allow us to invest in a greater number of assets and enhance our asset returns. We expect our leverage metrics to improve over time.
We intend to finance future acquisitions with the most advantageous source of capital available to us at the time of the transaction, which may include a combination of public and private offerings of our equity and debt securities, secured and unsecured corporate-level debt, property-level debt and mortgage financing and other public, private or bank debt. In addition, we may acquire properties in exchange for the issuance of common stockCommon Stock or OP Units and in many cases we may acquire properties subject to existing mortgage indebtedness.
We also may obtain secured or unsecured debt to acquire properties, and we expect that our financing sources will include the public debt market, banks and institutional investment firms, including asset managers and life insurance companies. Although we intend to maintain a conservative capital structure, our charter does not contain a specific limitation on the amount of debt we may incur and the Board of Directors may implement or change target debt levels at any time without the approval of our stockholders.
Competition
In our REI segment, weWe are subject to competition in the acquisition and disposition of properties and in the leasing of our properties. We compete with a number of developers, owners and operators of retail, restaurant, office and industrial real estate, many of which own properties similar to ours in the same markets in which our properties are located. We also may face new competitors and, due to our focus on single-tenant properties located throughout the United States, and because many of our competitors are locally or regionally focused, we do not expect to encounter the same competitors in each region of the United States. Many of our competitors have greater financial and other resources than us and may have other advantages over us. Our competitors may be willing to accept lower returns on their investments and may succeed in buying the properties that we have targeted for acquisition. We may also incur costs in connection with unsuccessful acquisitions that we will not be able to recover. Foreign investors may view the U.S. real estate market as being more stable than other international markets and may increase investments in high-quality single-tenant properties, especially in gateway cities.
In our Cole Capital segment, We may also incur costs in connection with unsuccessful acquisitions that we also face competition in raising funds for the Cole REITs from other entities with similar investment objectives such as other non-listed REITs, publicly traded REITs and private funds, including hedge funds.will not be able to recover.
Regulations
Our investments are subject to various federal, state, local and foreign laws, ordinances and regulations, including, among other things, health, safety and zoning regulations, land use controls, environmental controls relating to air and water quality, noise pollution and indirect environmental impacts such as increased motor vehicle activity. We believe that we have all material permits and approvals necessary under current law to operate our investments.
Our properties are also subject to laws such as the Americans with Disabilities Act of 1990 (“ADA”), which require that all public accommodations must meet federal requirements related to access and use by disabled persons. Some of our properties may currently not be in compliance with the ADA. If one or more of the properties in our portfolio is not in compliance with the ADA or any other regulatory requirements, we may be required to incur additional costs to bring the property into compliance.
Environmental Matters
Under various federal, state and local environmental laws, a current owner of real estate may be required to investigate and clean up contaminated property. Under these laws, courts and government agencies have the authority to impose cleanup responsibility and liability even if the owner did not know of and was not responsible for the contamination. For example, liability can be imposed upon us based on the activities of our tenants or a prior owner. In addition to the cost of the cleanup, environmental contamination on a property may adversely affect the value of the property and our ability to sell, rent or finance the property, and may adversely impact our investment in that property.
Prior to acquisition of a property, we will obtain Phase I environmental reports, or will rely on recent Phase I environmental reports. These reports will be prepared in accordance with an appropriate level of due diligence based on our standards and generally include a physical site inspection, a review of relevant federal, state and local environmental and health agency database records, one or more interviews with appropriate site-related personnel, review of the property’s chain of title and review of historic aerial photographs and other information on past uses of the property and nearby or adjoining properties. We may also obtain a Phase II investigation which may include limited subsurface investigations and tests for substances of concern where the results of the Phase I environmental reports or other information indicates possible contamination or where our consultants recommend such procedures.
Employees
As of December 31, 2016,2018, we had approximately 350180 employees.
Available Information
We electronically file Annual Reports on Form 10-K, Quarterly Reports on Form 10-Q, Current Reports on Form 8-K and all amendments to those reports, and proxy statements, with the SEC.U.S. Securities and Exchange Commission (the “SEC”). You may read and copyaccess any materials we file with the SEC at the SEC’s Public Reference Room at 100 F Street, NE, Washington, D.C. 20549, or you may access them through the EDGAR database at the SEC’s website at http://www.sec.gov. In addition, copies of our filings with the SEC may be obtained from theour website maintained for us at www.ir.vereit.com. We are providing our website address solely for the information of investors. We do not intend for the information contained on our website to be incorporated into this Annual Report on Form 10-K or other filings with the SEC.
Supplemental Federal Income Tax Considerations
This summary is for general information purposes only and is not tax advice. This discussion does not address all aspects of taxation that may be relevant to particular holders of our securities in light of their personal investment or tax circumstances.
Recent Legislation
Tax Cuts and Jobs Act
On December 22, 2017, H.R. 1, informally titled the Tax Cuts and Jobs Act (the “TCJA”), was enacted. The TCJA made major changes to the Internal Revenue Code of 1986, as amended (the “Internal Revenue Code”), including a number of provisions of the Internal Revenue Code that affect the taxation of REITs and their stockholders. The long-term effect of the significant changes made by the TCJA remains uncertain, and additional administrative guidance will be required in order to fully evaluate the effect of many provisions. The effect of any technical corrections with respect to the TCJA could have an adverse effect on us or our stockholders or holders of our debt securities.
Item 1A. Risk Factors.
Investors should carefully consider the following factors, together with all the other information included in this Annual Report on Form 10-K, in evaluating the Company and our business. If any of the following risks actually occur, our business, financial condition and results of operations could be materially and adversely affected, the trading price of the General Partner'sVEREIT's securities could decline and its stockholders and/or the Operating Partnership's unitholders may lose all or part of their investment. Additional risks and uncertainties not presently known to us or that we currently deem immaterial also may impair our business operations. This “Risk Factors” section contains references to our “capital stock” and to our “stockholders” and “unitholders.” Unless expressly stated otherwise, references to our “capital stock” represent the General Partner’s common stockVEREIT’s Common Stock and any class or series of its preferred stock, references to our “stockholders” represent holders of the General Partner’s common stockVEREIT’s Common Stock and any class or series of its preferred stock, and references to our “unitholders” represent holders of the OP unitsUnits and any class of series of the Operating Partnership’s preferred units.
Risks Related to Our Business
We are primarily dependent on single-tenant leases for our revenue and, accordingly, if we are unable to renew leases, lease vacant space, including vacant space resulting from tenant defaults, or re-lease space as leases expire, on favorable terms or at all, our financial condition could be adversely affected.
We focus our investment activities on ownership of freestanding, single-tenant commercial properties that are net leased to a single tenant. Therefore, the financial failure of, or other default by, a significant tenant or multiple tenants could cause a material reduction in our revenues and operating cash flows. In addition, this risk is increased where we lease multiple properties to the extent that we enter intoa single tenant under a master lease withlease. In such an instance, a default specific to a particular tenant, theproperty could result in a termination of such master lease could affect each property subject to the entire master lease, resulting in the loss of revenue from all such properties.properties under the master lease.
We cannot assure you that our leases will be renewed or that we will be able to lease or re-lease the properties on favorable terms, or at all, or that lease terminations will not cause us to sell the properties at a loss. Any of our properties that become vacant could be difficult to sell or re-lease at similar or sell.favorable rental rates or at all. We have and may continue to experience vacancies either by the continued default of a tenant under its lease or the expiration of one of our leases. We typically must incur all of the costs of ownership for a property that is vacant. Upon or pending the expiration of leases at our properties, we may be required to make rent or other concessions to tenants, or accommodate requests for renovations,lower rents, remodeling and other improvements, in order to retain and attract tenants. Certain of our properties may be specifically suited to the particular needs of a tenant (e.g., a retail bank branch or distribution warehouse) and major renovations and expenditures may be required in order for us to re-lease the space for other uses. If the vacancies continue for a long period of time, we may suffer reduced revenues, resulting in less cash available for distribution to our stockholders and unitholders. If we are unable to renew leases, lease vacant space, including vacant space resulting from tenant defaults, or re-lease space as leases expire, on favorable terms or at all, our financial condition could be adversely affected.
We are subject to tenant, geographic and industry concentrations that make us more susceptible to adverse events with respect to certain tenants, geographic areas or industries.
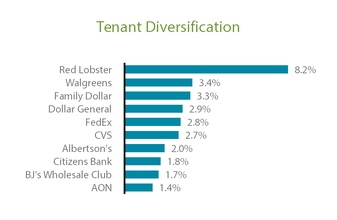
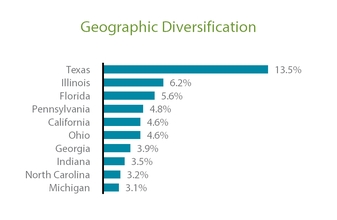
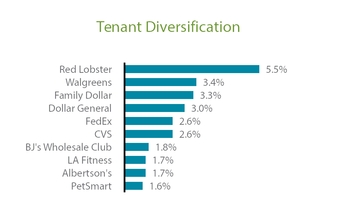
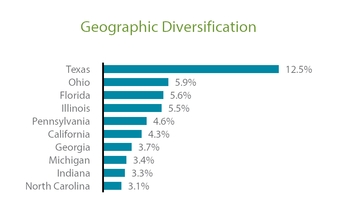
As of December 31, 2016,2018, we had derived approximately:
$96.763.7 million, or 8.2%5.5%, of our annualized rental income from Red Lobster®, a wholly owned subsidiary of Golden Gate Capital;
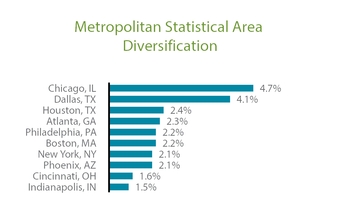
$297.7339.2 million, or 25.3%29.5%, of our annualized rental income from properties located in the following threefour states: Texas (13.5%(12.5%), Illinois (6.2%Ohio (5.9%), Florida (5.6%), and Florida (5.6%Illinois (5.5%); and
$642.0600.9 million, or 54.6%52.3%, of our annualized rental income from tenants in the following six industries: the casual dining restaurant industry (15.6%(12.8%), the manufacturing industry (10.1%), the quick service restaurant industry (8.5%(8.7%), the discount retail industry (7.8%(8.4%), the pharmacy retail industry (7.2%(6.8%) and the financehome and garden retail industry (5.4%(5.5%).
As we continue to acquire properties, our portfolio may become more concentrated by tenant, geographic area or industry. Any adverse change in the financial condition of a tenant with whom we may have a significant credit concentration now or in the future, or any downturn of the economy in any state or industry in which we may have a significant credit concentration now or in the future, could result in a material reduction of our cash flows or material losses to us. These concentrations may also strengthen tenant bargaining power and make us more susceptible to adverse regulatory changes, natural disasters or other unexpected events that may impact a particular tenant, geographic location or industry which could negatively affect our operations or result in a material reduction of our cash flows or material losses to us.
Our net leases may require us to pay property-related expenses that are not the obligations of our tenants.
Under the terms of the majority of our net leases, in addition to satisfying their rent obligations, our tenants are responsible for the payment or reimbursement of property expenses such as real estate taxes, insurance and ordinary maintenance and repairs. However, under the provisions of certain existing leases and leases that we may enter into in the future with our tenants, we may be required to pay some or all of the expenses of the property, such as the costs of environmental liabilities, roof and structural repairs, real estate taxes, insurance, certain non-structural repairs and maintenance. If our properties incur significant expenses that must be paid by us under the terms of our leases, our business, financial condition and results of operations may be adversely affected and the amount of cash available to meet expenses and to make distributions to our stockholders and unitholders may be reduced.
Our properties may be subject to impairment charges.
We routinely evaluate our real estate investments for impairment indicators. The judgment regarding the existence of impairment indicators is based on factors such as market conditions and tenant performance. For example, the early termination of, or default under, a lease by a tenant may lead to an impairment charge. Since our investment focus is on properties net leased
to a single tenant, the financial failure of, or other default by, a single tenant under its leaselease(s) may result in a significant impairment loss. If we determine that an impairment has occurred, we would be required to make a downward adjustment to the net carrying value of the property, which could have a material adverse effect on our results of operations in the period in which the impairment charge is recorded. Management has recorded impairment charges related to certain properties in the year ended December 31, 2016,2018, and may record future impairments based on actual results and changes in circumstances. Negative developments in the real estate market may cause management to reevaluate the business and macro-economic assumptions used in its impairment
analysis. Changes in management’s assumptions based on actual results may have a material impact on the Company’s financial statements. See “Note 10 Note 6 – Fair Value Measures”Measures to our consolidated financial statements for a discussion of real estate impairment charges.
Our ownership of certain properties and other facilities are subject to ground leases or other similar agreements which limit our uses of these properties and may restrict our ability to sell or otherwise transfer such properties.
As of December 31, 2016,2018, we held interests in properties and other facilities through leasehold interests in the land on which the buildings are located and we may acquire additional properties in the future that are subject to ground leases or other similar agreements. As of December 31, 2016,2018, the costs associated with these ground leases represented 2.0% of annualized rental revenue. ManyThe terms of the ground leases may be different than the related operating lease for the property and many of our ground leases and other similar agreements limit our uses of these properties and may restrict our ability to sell or otherwise transfer such properties without the ground landlord’s consent, all of which may impair their value.
Real estate investments are relatively illiquid and therefore we may not be able to dispose of properties when appropriate or on favorable terms.
Real estate investments are, in general, relatively illiquid and may become even more illiquid during periods of economic downturn. As a result, we may not be able to sell our properties quickly or on favorable terms in response to changes in the economy or other conditions when it otherwise may be prudent to do so. In addition, certain significant expenditures generally do not change in response to economic or other conditions, including debt service obligations, real estate taxes, and operating and maintenance costs. This combination of variable revenue and relatively fixed expenditures may result, under certain market conditions, in reduced earnings. Further, as a result of the 100% prohibited transactions tax applicable to REITs, we intend to hold our properties for investment, rather than primarily for sale in the ordinary course of business, which may cause us to forgo or defer sales of properties that otherwise would be favorable. Therefore, we may be unable to adjust our portfolio promptly in response to economic, market or other conditions, which could adversely affect our business, financial condition, liquidity and results of operations.
Our investments inA substantial portion of our properties where the underlying tenant hasare leased to tenants with a below investment grade credit rating, as determined by major credit rating agencies, or has an unrated tenantare leased to tenants that are not rated, and may have a greater risk of default.
As of December 31, 2016,2018, approximately 58.8%58.1% of our tenants were not rated or did not have an investment grade credit rating from a major ratings agency or were not affiliates of companies having an investment grade credit rating. Our investments in properties leased to such tenants may have a greater risk of default and bankruptcy than investments in properties leased exclusively to investment grade tenants. When we invest in properties where the tenant does not have a publicly available credit rating, we will use certain credit assessmentcredit-assessment tools as well as rely on our own estimatesunderwriting and analysis of the tenant’s credit rating which includes, among other things, reviewing the tenant’s financial information (e.g., financial ratios, net worth, revenue, cash flows, leverage and liquidity, if applicable). If our ratings estimates are inaccurate, the default or bankruptcy risk for the subject tenant may be greater than anticipated. If our lender or a credit rating agency disagrees with our ratings estimates, we may not be able to obtain our desired level of leverage or our financing costs may exceed those that we projected. This outcome could have an adverse impact on our returns on that asset and hence our operating results.
We may be unable to sell a property if or when we decide to do so, including as a result of uncertain market conditions, which could adversely impact our ability to make cash distributions to our stockholders and unitholders.
We expect to hold the various real properties in which we invest until such time as we decide that a sale or other disposition is appropriate given our investment business objectives.objectives and REIT limitations. We generally intend to hold properties for an extended time, but our management or Board of Directors may exercise their discretion as to whether and when to sell a property to achieve investment or portfolio objectives. Our ability to dispose of properties on advantageous terms or at all depends on certain factors beyond our control, including competition from other sellers, and the availability of attractive financing for potential buyers of our properties.properties and the quality of the underlying tenant. In addition, if our competitors sell assets similar to assets we intend to divest and/or at valuations below our valuations for comparable assets, we may be unable to divest our assets at all or at favorable pricing or terms. We cannot predict the various market conditions affecting real estate investments which will exist at any particular time in the future. Due to the uncertainty of market conditions which may affect the disposition of our properties, we cannot assure you that we will be able to sell such properties at a profit or at all in the future. Accordingly, the extent to which our stockholders and unitholders will receive cash distributions and realize potential appreciation on our real estate investments will depend upon
fluctuating market conditions. Furthermore, we may be required to seek modifications of an underlying lease or expend funds to correct defects or to make improvements before a property can be sold.
Dividends paid from sources other than our cash flow from operations could affect our profitability, restrict our ability to generate sufficient cash flow from operations, and dilute stockholders’ and unitholders’ interests in us.
We may not generate sufficient cash flow from operations to pay dividends and we may in the future pay dividends from sources other than from our cash flow from operations, such as from the proceeds of property or other asset dispositions, borrowings (including on our existing line of credit), cash and cash equivalents balances, and/or the saleofferings of assets debt and/or the proceeds from offerings ofequity securities. We have not established any limit on the amount of borrowings and/or the sale of property or other assets or the proceeds from an
offering of debt or equity securities that may be used to fund dividends, except that, in accordance with our organizational documents and Maryland law, we may not make dividend distributions that would: (1) cause us to be unable to pay our debts as they become due in the usual course of business; (2) cause our total assets to be less than the sum of our total liabilities plus senior liquidation preferences; or (3) jeopardize our ability to qualify as a REIT.
Funding dividends from borrowings could restrict the amount we can borrow for investments, which may affect our profitability. Funding dividends with the sale of property or other assets or the proceeds of offerings of debt or equity securities may affect our ability to generate cash flows. In addition, funding dividends from the sale of additional securities could dilute your interest in us if we sell shares of our common stock or securities that are convertible or exercisable into shares of our common stock to third party investors. As a result, the return you realize on your investment may be reduced. Payment of dividends from these sources could affect our profitability, restrict our ability to generate sufficient cash flow from operations, and dilute stockholders’ and unitholders’ interests in us, any or all of which may adversely affect your overall return. In addition, funding dividends from the sale of additional debt or equity securities could dilute your interest in us if we sell shares of our Common Stock or securities that are convertible or exercisable into shares of our Common Stock to third party investors. As a result, the return you realize on your investment may be reduced.
We could face potential adverse effects from the bankruptcies or insolvencies of tenants or from tenant defaults generally.
The bankruptcy or insolvency of our tenants may adversely affect the income produced by our properties. Under bankruptcy law, a tenant cannot be evicted solely because of its bankruptcy and has the option to assume or reject any unexpired lease. If the tenant rejects the lease, any resulting claim we have for breach of the lease (excluding collateral securing the claim) will be treated as a general unsecured claim. Our claim against the bankrupt tenant for unpaid and future rent will be subject to a statutory cap that might be substantially less than the remaining rent actually owed under the lease, and it is unlikely that a bankrupt tenant that rejects its lease would pay in full amounts it owes us under the lease. Even if a lease is assumed and brought current, we still run the risk that a tenant could condition lease assumption on a restructuring of certain terms, including rent, that would have an adverse impact on us. Any shortfall resulting from the bankruptcy of one or more of our tenants could adversely affect our cash flows and results of operations and could cause us to reduce the amount of distributions to our stockholders and unitholders.
In addition, the financial failure of, or other default by, one or more of the tenants to whom we have exposure could have an adverse effect on the results of our operations. While we evaluate the creditworthiness of our tenants by reviewing available financial and other pertinent information, there can be no assurance that any tenant will be able to make timely rental payments or avoid defaulting under its lease. If any of our tenants’ businesses experience significant adverse changes, they may fail to make rental payments when due, close a number of stores, exercise early termination rights (to the extent such rights are available to the tenant) or declare bankruptcy. A default by a significant tenant or multiple tenants could cause a material reduction in our revenues and operating cash flows. In addition, if a tenant defaults, we may incur substantial costs in protecting our investment.
If a sale-leaseback transaction is re-characterized in a tenant’s bankruptcy proceeding, our financial condition could be adversely affected.
We have entered and may continue to enter into sale-leaseback transactions. In a sale-leaseback transaction, we purchase a property and then lease it back to the third party from whom we purchased it. In the event of the bankruptcy of a tenant, a transaction structured as a sale-leaseback might possibly be re-characterized as either a financing or a joint venture, either of which outcomes could adversely affect our financial condition, cash flows and the amount available for distributionsdistribution to our stockholders and unitholders.
If thea sale-leaseback wereis re-characterized as a financing, we would not be considered the owner of the property and, as a result, would have the status of a creditor in relation to the tenant. In that event, we would no longer have the right to sell or encumber our ownership interest in the property. Instead, we would have a claim against the tenant for the amounts owed under the lease, with the claim arguably secured by the property. The tenant/debtor might have the ability to propose a plan restructuring the term, interest rate and amortization schedule of its outstanding balance. If confirmed by the bankruptcy court, we could be bound by the new terms and prevented from foreclosing our lien on the property. If the sale-leaseback wereis re-characterized as a joint venture, our lesseetenant and we could be treated as co-venturers with regard to the property. As a result, we could be held liable, under some circumstances, for debts incurred by the lesseetenant relating to the property.
We have a history of operating losses and cannot assure you that we will achieve or maintain profitability.
Since our inception in 2010, we have experienced net losses (calculated in accordance with generally accepted accounting principles in the United States (“U.S. GAAP) each fiscal yearGAAP”) and as of December 31, 2016,2018, had an accumulated deficit of $4.2$5.47 billion. The extent of our future operating losses and the timing of when we will achieve profitability are uncertain, and together depend on the demand for, and value of, our portfolio of properties. We may never achieve or sustain profitability.
We may be unable to enter into and consummate property acquisitions on advantageous terms or our property acquisitions may not perform as we expect due to competitive conditions and other factors.
We may acquire properties in the future. The acquisition of properties entails various risks, including the risks that our investments may not perform as we expect and that our cost estimates for bringing an acquired property up to market standards may prove inaccurate. Further, we expect to finance any future acquisitions through a combination of borrowings (including under our unsecured credit facility (the “Credit Facility”)Revolving Credit Facility), cash and cash equivalent balances, proceeds from equity and/or debt offerings by the General Partner,VEREIT, the Operating Partnership or their subsidiaries, fundscash flow from operations and proceeds from property contributions andor other asset dispositions which, if unavailable, could adversely affect our cash flows.
In addition, our ability to acquire properties in the future on satisfactory terms and successfully integrate and operate such properties is subject to the following significant risks:
we may be unable to acquire desired properties or the purchase price of a desired property may increase significantly because of competition from other real estate investors, including other real estate operating companies, REITs and investment funds, including the Cole REITs;funds;
we may acquire properties that are not accretive to our resultsearnings upon acquisition;
we may be unable to obtain the necessary debt or equity financing to consummate an acquisition or, if obtainable, financing may not be on satisfactory terms;
we may need to spend more than budgeted amounts to make necessary improvements or renovations to acquired properties;
agreements for the acquisition of properties are typically subject to customary conditions to closing, including satisfactory completion of due diligence investigations, and we may spend significant time and money on potential acquisitions that we do not consummate;
we may be unable to quickly and efficiently integrate new acquisitions, particularly acquisitions of portfolios of properties, into our existing operations; and
we may acquire properties without any recourse, or with only limited recourse, for liabilities, whether known or unknown, such as cleanup of environmental contamination, remediation of latent defects, claims by tenants, vendors or other persons against the former owners of the properties and claims for indemnification by general partners, directors, officers and others indemnified by the former owners of the properties.
Any of the above risks could adversely affect our business, financial condition, liquidity and results of operations.
We have assumed, and may in the future assume, liabilities in connection with our property acquisitions, including unknown liabilities.
We have assumed, and may in the future assume, existing liabilities in connection with property acquisitions, some of which may have been unknown or unquantifiable at the time of the transaction or the magnitude of which may have increased since the time of the transaction. UnknownSuch liabilities might include liabilities for cleanup or remediation of undisclosed or disclosed environmental conditions, claims of tenants or other persons dealing with prior owners of the properties, tax liabilities, employment-related issues, and accrued but unpaid liabilities whether incurred in the ordinary course of business or otherwise. If the magnitude of such unknown liabilities is high,material or higher than anticipated, either singly or in the aggregate, it could adversely affect our business, financial condition, liquidity and results of operations.
We face intense competition, which may decrease or prevent increases in the occupancy and rental rates of our properties.
We are subject to competition in the leasing of our properties. We compete with numerous developers, owners and operators of retail, restaurant, industrial and office real estate, many of which have greater financial and other resources than us. Many of our competitors own properties similar to ours in the same markets in which our properties are located. If one of our properties is nearing the end of the lease term or becomes vacant and our competitors (which could include funds sponsored by us) offer space at rental rates below current market rates or below the rental rates we currently charge our tenants, we may lose existing or potential tenants and we may be pressured to reduce our rental rates below those we currently charge or to offer substantial rent concessions in order to retain tenants when such tenants’ lease
leases expire or to attract new tenants. In addition, if our competitors sell assets similar to assets we intend to divest in the same markets and/or at valuations below our valuations for comparable assets, we may be unable to divest our assets at all or at favorable pricing or on favorable terms. As a result of these actions by our competitors, our business, financial condition, liquidity and results of operations may be adversely affected.
The value of our real estate investments is subject to risks associated with our real estate assets and with the real estate industry.
Our real estate investments are subject to various risks, fluctuations and cycles in value and demand, many of which are beyond our control. Certain events may decrease our cash available for distribution to our stockholders and unitholders, as well as the value of our properties. These events include, but are not limited to:
adverse changes in international, national or local economic and demographic conditions;
vacancies or our inability to lease space on favorable terms, including possible market pressures to offer tenants rent abatements, tenant improvements, early termination rights or tenant-favorable renewal options;
adverse changes in financial conditions of buyers, sellers and tenants of properties;
inability to collect rent from tenants, or other failures by tenants to perform the obligations under their leases;
competition from other real estate investors, including other real estate operating companies, REITs and institutional investment funds;
reductions in the level of demand for commercial space generally, and freestanding net leased properties specifically, and changes in the relative popularity of our tenants and/or properties;
increases in the supply of freestanding single-tenant properties;
fluctuations in interest rates, which could adversely affect our ability, or the ability of buyers and tenants of our properties, to obtain financing on favorable terms or at all;
increases in expenses, including, but not limited to, insurance costs, labor costs, energy prices, real estate assessments and other taxes and costs of compliance with laws, regulations and governmental policies, all of which have an adverse impact on the rent a tenant may be willing to pay us in order to lease one or more of our properties;
loss of property rights, adverse impacts on our tenants’ business operations and/or increases in tenant vacancies resulting from eminent domain proceedings;
civil unrest, acts of God, including earthquakes, floods, hurricanes and other natural disasters, including extreme weather events from possible future climate change, which may result in uninsured losses, and acts of war or terrorism; and
changes in, and changes in enforcement of, laws, regulations and governmental policies, including, without limitation, health, safety, environmental, zoning and tax laws, governmental fiscal policies and the ADA.
In addition, our properties are subject to the ADA and while our tenants are obligated to comply with the ADA and may be obligated under our leases to pay for the costs associated with compliance with the ADA, if compliance involves expenditures that are greater than anticipated or if tenants fail or are unable to comply, we may be required to incur expenses to bring a property into compliance.
Any or all of these factors could materially adversely affect our results of operations through decreased revenues or increased costs.
Uninsured losses or losses in excess of our insurance coverage could materially adversely affect our financial condition and cash flows, and there can be no assurance as to future costs and the scope of coverage that may be available under insurance policies.
We carry comprehensivecommercial general liability, fire, extended coverage,flood, earthquake, and property and rental loss insurance covering all of the properties in our portfolio under one or more blanket insurance policies with policy specifications, limits and deductibles customarily carried for similar properties. In addition, we carry professional liability and directors’ and officers’ insurance, and cyber liability insurance. We select policy specifications and insured limits that we believe are appropriate and adequate given the relative risk of loss, insurance coverages provided by tenants, the cost of the coverage and industry practice. There can be no assurance, however, that the insured limits on any particular policy will adequately cover an insured loss if one occurs. If any such loss is insured, we may be required to pay a significant deductible on any claim for recovery of such a loss prior to our insurer being obligated to reimburse us for the loss, or the amount of the loss may exceed our coverage for the loss. In addition, we may reduce or discontinue terrorism, earthquake, flood or other insurancecertain coverages on some or all of our properties in the future if the cost of premiums for any of these policies exceeds, in our judgment, the value of the coverage discounted for the risk of loss. Our title insurance policies may not insure for the current aggregate market value of our portfolio, and we do not intend to increase our title insurance coverage as the market value of our portfolio increases.
Further, we do not carry insurance for certain losses, including, but not limited to, losses caused by riots, war or war.nuclear explosions. Certain types of losses may be either uninsurable or not economically insurable, such as losses due to earthquakes,nuclear explosions, riots or acts of war. If we experience a loss that is uninsured or which exceeds policy limits, we could lose the capital invested in
the damaged properties as well as the anticipated future cash flows from those properties. In addition, if the damaged properties are subject to recourse indebtedness, we would continue to be liable for the indebtedness, even if these properties were irreparably damaged. In addition, we carry several different lines of insurance, placed with several large insurance carriers. If any one of these large insurance carriers were to become insolvent, we would be forced to replace the existing insurance coverage with another suitable carrier, and any outstanding claims would be at risk for collection. In such an event, we cannot be certain that we would be able to replace the coverage at similar or otherwise favorable terms. As a result of any of the situations described above, our financial condition and cash flows may be materially and adversely affected.
Our participation in joint ventures creates additional risks as compared to direct real estate investments, and the actions of our joint venture partners could adversely affect our operations or performance.
We have in the past participated, and may in the future participate, in transactions structured to purchase or dispose of assets jointly with unaffiliated third parties or the Cole REITs (a “joint venture”). There are additional risks involved in joint venture transactions. As a co-investor in a joint venture, we may not be in a position to exercise sole decision-making authority relating to the property, joint venture, or other entity. In addition, there is the potential of the third-party participant in the joint venture becoming bankrupt and the possibility of diverging or inconsistent economic or business interests of us and that participant. These diverging interests
could result in, among other things, exposure to liabilities of the joint venture in excess of our proportionate share of these liabilities. Investments in joint ventures may preclude us from acquiring properties for our own portfolio or a property that may be suitable for our portfolio may instead be allocated to the joint venture. The competing rights of each owner in a jointly-owned property could effect a reduction in the value of each owner’s interest in the subject property.
If we are unable to maintain effective disclosure controls and procedures and effective internal control over financial reporting, investor confidence and our stock price could be adversely affected.
Our management is responsible for establishing and maintaining effective disclosure controls and procedures and internal control over financial reporting. There were no changes to our internal control over financial reporting that occurred during the year ended December 31, 20162018 that have materially affected, or are reasonably likely to materially affect, our internal control over financial reporting, however, there can be no guarantee as to the effectiveness of our disclosure controls and procedures and we cannot assure you that our internal control over financial reporting will not be subject to material weaknesses in the future. If we fail to maintain the adequacy of our internal controls over financial reporting and our operating internal controls, including any failure to implement required new or improved controls as a result of changes to our business or otherwise, or if we experience difficulties in their implementation, our business, results of operations and financial condition could be adversely affected and we could fail to meet our reporting obligations.
Government investigations relating to the findings of the Audit Committee Investigation may require timehas resulted in significant expenses and attention from certain members of management,may result in significant legal expenses, fines, and/or penalties, including indemnification obligations, and cause our business, financial condition, liquidity and results of operations to suffer.
On November 13, 2014, we received the first of two subpoenas relating to the findings of the Audit Committee Investigation from the staff of the SEC, each of which called for the production of certain documents. On December 19, 2014, we received a subpoena from the Securities Division of the Office of the Secretary of the Commonwealth of Massachusetts. The U.S. Attorney’s Office for the Southern District of New York also contacted counsel for the Company and counsel for the Audit Committee. We and the Audit Committee are cooperating with these regulators in their investigations. The amountU.S. Attorney’s Office for the Southern District of New York has indicated that it does not intend to bring criminal charges against the Company arising from its investigation. In addition, we have not been in contact with the Massachusetts regulator since June 2015 and we believe that the investigation has concluded. We cannot, however, predict the outcome or time needed to resolve these investigations is uncertain, and we cannot predict the outcome of these investigationsSEC investigation or whether we will face additional government investigations, inquiries or other actions related to these matters. Subject to certain limitations, we are obligated to advance certain legal expenses to and indemnify our current and former directors, officers and employees, among others in connection with the ongoing government investigations and potential future government inquiries, investigations or actions. These matters could require us to expend management time and could result in civil and criminal actions seeking, among other things, injunctions against us and the payment of significant fines and/or penalties, as well as requiring payment of substantial legal fees and indemnification obligations, and cause our business, financial condition, liquidity and results of operations to suffer. We have not reserved an amount for the SEC investigation because we believe that any probable loss or reasonably possible range of loss is not reasonably estimable at this time. We can provide no assurance as to the outcome of any government investigation.
The Company and certain of our former officers and former and current directors, among others, have been named as defendants in various lawsuits related to the findings of the Audit Committee Investigation and those lawsuits may require time and attention from certain members of management, resultwhich have resulted in significant legal expenses and/or damages,which are expected to continue. Any resolution could require substantial payments by the Company, including indemnification obligations, and may materially impact our business, financial condition, liquidity and results of operations.
Since the October 29, 2014 announcement of the findings of the Audit Committee Investigation and the subsequent restatement of the Company’s financial statements in March 2015, the Company and its former officers and current and former directors (along with others) have been named as defendants in multiple putative securities class action complaints in the United States District Court for the Southern District of New York, which were subsequently consolidated under the caption In re American Realty Capital Properties, Inc. Litigation, 1:15-mc-00040-AKH,No. 15-MC-00040 (AKH), multiple individual securities lawsuits (“opt-out actions”) and multiple derivative lawsuits. The Company has currently settled all but one of the opt-out actions. See “Note 15 Note 10 – Commitments and Contingencies”Contingencies to our consolidated financial statements for additional details regarding pending litigation matters related to the Audit Committee Investigation.
As a result of the various pending litigations, and subject to certain limitations, we are obligated to advance certain legal expenses to and indemnify our current and former directors, officers and employees, as well as certain outside individuals and entities. In addition,These lawsuits have resulted in significant ongoing legal expenses, which are expected to continue. We have not reserved amounts for the pending class action and remaining opt-out action because we believe that any probable loss or reasonably possible range of loss is not reasonably estimable at this time. The resolution of these lawsuits maymatters, and the timing thereof, are uncertain. Any such resolution, whether through a judgment or a settlement, could require management time and attention, result in significant legal expenses,substantial payments by the Company, including potential indemnification obligations, and/or damages, which mayare not expected to be covered by insurance, and may materially impact the Company’s business, financial condition, liquidity and results of operations.
Historical 1031 real estate programs we manage may divert resources from our core business operations and may subject us to unexpected liabilities and costs.
We continue to serve as the asset manager of certain historical 1031 real estate programs. While the volume of programs under management has been decreasing, we continue to manage the remaining properties which requires the allocation of staff and other Company resources. Continuing management of these programs may divert resources from our core business operations and could result in unexpected liabilities and costs, including potential litigation.
Our accounting policies and methods are fundamental to how we record and report our financial position and results of operations, and they require management to make estimates, judgments, and assumptions about matters that are inherently uncertain.
Our accounting policies and methods are fundamental to how we record and report our financial position and results of operations. We have identified several accounting policies as being critical to the presentation of our financial position and results of operations because they require management to make particularly subjective or complex judgments about matters that are
inherently uncertain and because of the likelihood that materially different amounts would be recorded under different conditions or using different assumptions. Because of the inherent uncertainty of the estimates, judgments, and assumptions associated with these critical accounting policies, we cannot provide any assurance that we will not make subsequent significant adjustments to our consolidated financial statements. If our judgments, assumptions, and allocations prove to be incorrect, or if circumstances change, our business, financial condition, liquidity and results of operations could be adversely affected.
Changes in U.S. accounting standards regarding operating leases may makepronouncements could adversely impact our or our tenants’ reported financial performance.
Accounting policies and methods are fundamental to how we record and report our financial condition and results of operations. From time to time the leasing of our properties less attractive to our potential tenants, which could reduce overall demand for our leasing services.
Under current authoritative accounting guidance for leases, a lease is classified by a tenant as a capital lease if the significant risks and rewards of ownership are considered to reside with the tenant. Under capital lease accounting for a tenant, both the leased asset and liability are reflected on its balance sheet. If the lease does not meet the criteria for a capital lease, the lease is to be considered an operating lease by the tenant, and the obligation does not appear on the tenant’s balance sheet; rather, the contractual future minimum payment obligations are only disclosed in the footnotes thereto. Thus, entering into an operating lease can appear to enhance a tenant’s balance sheet in comparison to direct ownership. The Financial Accounting Standards Board (the “FASB”) and the International Accounting Standards Board (the “IASB”) conducted a joint project to re-evaluate lease accounting. In February 2016,SEC, who create and interpret appropriate accounting standards, may change the FASB issued Accounting Standards Update, (“ASU”) 2016-02, Leases (“ASU 2016-02”) which will requirefinancial accounting and reporting standards or their interpretation and application of these standards that a lessee recognize assets and liabilities ongovern the balance sheet for all leases with a lease term of more than 12 months, with the result being the recognition of a right of use asset and a lease liability and the disclosure of key information about the entity's leasing arrangements. These and other potential changes to the accounting guidance could affect both our accounting for leases as well as thatpreparation of our current and potential tenants.financial statements. These changes may affect howcould have a material impact on our real estate leasing business is conducted. For example, with the ASU 2016-02 revision, companies may be less willing to enter into leases in general or desire to enter into leases with shorter terms because the apparent benefits to their balance sheets under current practicereported financial condition and results of operations. In some cases, we could be reducedrequired to apply a new or eliminated. Thisrevised standard retroactively, resulting in restating prior period financial statements. Similarly, these changes could have a material impact in turn could make it more difficult for us to enter into leases on terms we find favorable. The amendments in ASU 2016-02 are effective for fiscal years beginning after December 15, 2018, including interim periods within those fiscal years. The Company is currently evaluating the impact ASU 2016-02 will have on its consolidatedour tenants’ reported financial statements.condition or results of operations and affect their preferences regarding leasing real estate.
We may not be able to maintain our competitive advantages if we are not able to attract and retain key personnel.
Our success depends to a significant extent on our ability to attract and retain key members of our executive team and staff. Our future success depends in part on the continued service of our senior management team.teams and staff supporting our continuing operations. If there are changes in senior leadership affecting our continuing operations, such changes could be disruptive and could compromise our ability to executeoperate our strategic plan.business. While we have entered into employment agreements with certain key personnel, there can be no assurance that we will be able to retain the services of
individuals whose knowledge and skills are important to our businesses. Our success also depends on our ability to prospectively attract, integrate, train and retain qualified management personnel. Because the competition for qualified personnel is intense, costs related to compensation and retention could increase significantly in the future. If we were to lose a sufficient number of our key employees and were unable to replace them in a reasonable period of time, these losses could damage our business and adversely affect our results of operations.
Competition that traditional retail tenants face from e-commerce retail sales, or the integration of brick and mortar stores with e-commerce retailers, could adversely affect our business.
Our retail tenants face increasing competition from e-commerce retailers. E-commerce sales continue to account for an increasing percentage of retail sales and this trend is expected to continue. These trends may have an impact on decisions that retailers make regarding their brick and mortar stores. Changes in shopping trends as a result of the growth in e-commerce may also impact the profitability of retailers that do not adapt to changes in market conditions. The continued growth of e-commerce sales could decrease the need for traditional retail outlets and reduce retailers' space and property requirements. These conditions could adversely impact our results of operations and cash flows if we are unable to meet the needs of our tenants or if our tenants encounter financial difficulties as a result of changing market conditions.
Cybersecurity risks and cyber incidents may adversely affect our business by causing a disruption to our operations, a compromise or corruption of our confidential information, and/or damage to our business relationships or reputation, all of which could negatively impact our financial results.
A cyber incident is considered to be any adverse event that threatens the confidentiality, integrity or availability of our information resources. These incidents may be an intentional attack or an unintentional event and could involve gaining unauthorized access to our information systems for purposes of misappropriating assets, stealing confidential information, corrupting data or causing operational disruption. The result of these incidents may include disrupted operations (e.g., disruption of finance or accounting systems that process or receive payment obligations, manage cash, warehouse data and other processes and procedures), misstated or unreliable financial data, liability for stolen assets or information, increased cybersecurity protection and insurance costs, litigation and damage to our tenant and investor relationships. In addition, from time to time, we update, modify or change our information systems and, although we have taken steps to protect the security of the data and systems, our security measures may not be able to prevent cyber incidents resulting from such modifications or changes. As our reliance on technology has increased, so have the risks posed to our information systems, both internal and those we have outsourced. We have implemented processes, procedures (including training and recovery procedures) and internal controls to help mitigate cybersecurity risks and cyber intrusions, but these measures, as well as our increased awareness of the nature and extent of a risk of a cyber incident, do not guarantee that our financial results, operations, business relationships or confidential information will not be negatively impacted by such an incident. The remediation of a cyber incident could result in significant unplanned expenditures and our cash flows and results of operations could be adversely affected.
We may acquire properties or portfolios of properties through tax deferred contribution transactions, which could result in the dilution of our stockholders and unitholders, and limit our ability to sell or refinance such assets.
We have in the past and may in the future acquire properties or portfolios of properties through tax deferred contribution transactions in exchange for OP Units. Under the limited partnership agreementThird Amended and Restated Agreement of Limited Partnership of the OP, as amended (the “LPA”), after holding the OP Units for a period of one year, unless otherwise consented to by the General Partner, holders of OP Units have a right to redeem the OP Units for the cash value of a corresponding number of shares of the General Partner’s common stockCommon Stock or, at the
option of the General Partner, a corresponding number of shares of the General Partner’s common stock.Common Stock. This could result in the dilution of our stockholders and unitholders through the issuance of OP Units that may be exchanged for shares of our common stock.Common Stock. This acquisition structure may also have the effect of, among other things, reducing the amount of tax depreciation we could deduct over the tax life of the acquired properties, and may require that we agree to restrictions on our ability to dispose of, or refinance the debt on, the acquired properties in order to protect the contributors’ ability to defer recognition of taxable gain. Similarly, we may be required to incur or maintain debt we would otherwise not incur so we can allocate the debt to the contributors to maintain their tax bases. These restrictions could limit our ability to sell or refinance an asset at a time, or on terms, that would be favorable absent such restrictions.
Risks Related to Financing
We intend to rely on external sources of capital to fund future capital needs, and if we encounter difficulty in obtaining such capital, we may not be able to meet maturing obligations or make any additional investments.
In order to qualify as a REIT under the Internal Revenue Code, we are required, among other things, to distribute annually to our stockholders at least 90% of our REIT taxable income (which does not equal net income as calculated in accordance with U.S. GAAP), determined without regard to the deduction for dividends paid and excluding any net capital gain. Because of this dividend requirement, we may not be able to fund from cash retained from operations all of our future capital needs, including capital needed to refinance maturing obligations or make investments.
Market volatility and disruption could hinder our ability to obtain new debt financing or refinance our maturing debt on favorable terms or at all or to raise debt and equity capital. Our access to capital will depend upon a number of factors, including:
general market conditions;
the market’s perception of our future growth potential;
the extent of investor interest;
analyst reports about us and the REIT industry;
the general reputation of REITs and the attractiveness of their equity securities in comparison to other equity securities, including securities issued by other real estate-based companies;
our financial performance and that of our tenants;
our current debt levels;
our current and expected future earnings;
our cash flow and cash dividends, including our ability to satisfy the dividend requirements applicable to REITs; and
the market price per share of our common stock.Common Stock.
If we are unable to obtain needed capital on satisfactory terms or at all, we may not be able to meet our obligations and commitments as they mature or make any additional investments.
We have substantial amounts of indebtedness outstanding, which may affect our ability to pay dividends, and may expose us to interest rate fluctuation risk and to the risk of default under our debt obligations.
As of December 31, 2016,2018, our aggregate indebtedness was $6.4$6.1 billion. We may incur significant additional debt in the future, including borrowings under our Credit Facility, for various purposes including, without limitation, the funding of future acquisitions, if any, capital improvements and leasing commissions in connection with the repositioning of a property and litigation expenses. At December 31, 2016,2018, we had $2.3$2.5 billion of undrawn commitments under our Credit Facility. Our substantial outstanding indebtedness, and the limitations imposed on us by our debt agreements, could have significant adverse consequences, including as follows:
our cash flow may be insufficient to meet our required principal and interest payments;
we may be unable to borrow additional funds as needed or on satisfactory terms to fund future working capital, capital expenditures and other general corporate requirements, which could, among other things, adversely affect our ability to capitalize upon any acquisition opportunities or fund capital improvements and leasing commissions;
we may be unable to pay off or refinance our indebtedness at maturity or the refinancing terms may be less favorable than the terms of our original indebtedness;
payments of principal and interest on borrowings may leave us with insufficient cash resources to make the dividend payments necessary to maintain our REIT qualification or may otherwise impose restrictions on our ability to make distributions;
we may be forced to dispose of one or more of our properties, possibly on disadvantageous terms;
we may violate restrictive covenants in our loan documents, which would entitle the lenders to accelerate our debt obligations;
certain of the property subsidiaries’ loan documents may include restrictions that limit the subsidiary’s ability to take certain actions with respect to the property, including restrictions on suchthe subsidiary’s ability to make dividends to us;us or restrictions that require us to obtain lender consent which could adversely affect our ability to sell, lease or otherwise address issues with the property;
we may be unable to hedge floating-rate debt, counterparties may fail to honor their obligations under our hedge agreements, these agreements may not effectively hedge interest rate fluctuation risk, and, upon the expiration of any hedge agreements, we would be exposed to then-existing market rates of interest and future interest rate volatility;
we may default on our obligations and the lenders or mortgagees may foreclose on our properties that secure their loans and exercise their rights under any assignment of rents and leases;
we may be vulnerable to general adverse economic and industry conditions; and
we may be at a disadvantage compared to our competitors with less indebtedness.
If we default under a loan or indenture (including any default in respect of the financial maintenance and negative covenants contained in the Credit Agreement, or the indenture governing the Senior Notes, we may automatically be in default under any other loan or indenture that has cross-default provisions (including the credit agreement (the “Credit Agreement”)), dated June 30, 2014, as amended, with Wells Fargo Bank National Association, as administrative agent, and other lender parties thereto,Credit Agreement governing the Credit Facility), and (x) further borrowings under the Credit Facility will be prohibited, and outstanding indebtedness under the Credit Facility, and our indenture (including the indenture governing the Senior Notes) or such other loans may be accelerated and (y) to the extent any such debt is secured, directly or indirectly, by any properties or assets, the lenders may foreclose on the properties or assets securing such indebtedness.
In addition, increases in interest rates may impede our operating performance and payments of required debt service obligations or amounts due at maturity, or creation of additional reserves under loan agreements or indentures, could adversely affect our financial condition and operating results.
Further, any foreclosure on our properties could create taxable income without accompanying cash proceeds, which could adversely affect our ability to meet the REIT dividend requirements imposed by the Internal Revenue Code.
The indenture governing our Senior Notes and the Credit Agreement governing the Credit Facility contain restrictive covenants that limit our operating flexibility.
The indenture governing our Senior Notes and the Credit Agreement governing the Credit Facility require us to meetcomply with customary affirmative and negative covenants and other financial and operating covenants. Thecovenants that, among other things, restrict our ability to take specific actions, including restrictions on our ability to:
consummate a merger, consolidation or sale of all or substantially all of our assets; and
incur or guarantee additional secured and unsecured indebtedness.
In addition, the indenture governing our Senior Notes requires us to maintain financial ratios for total leverage, secured debt, debt service coverage and total unencumbered assets. In addition, the Credit Agreement requires us, among other things, to maintain a minimum tangible net worth,maximum unencumbered leverage ratio and the Credit Agreement governing the Credit Facility requires us, among other things, to maintain a maximum consolidated leverage ratio, a minimum fixed charge coverage ratio, a maximum secured leverage ratio, a totalmaximum unencumbered asset value ratio, a minimum encumbered interest coverageleverage ratio and a minimum encumbered asset value. These covenants restrict our ability to incur secured or unsecured indebtednessunencumbered interest coverage ratio. The Credit Agreement governing the Credit Facility also includes customary restrictions on, among others, liens, negative pledges, intercompany transfers, fundamental changes, transactions with affiliates and may also restrict our ability to engage in certain business activities.restricted payments.
Our ability to comply with these and other provisions of the indenture governing our Senior Notes and the Credit Agreement governing the Credit Facility may be affected by changes in our operating and financial performance, changes in general business and economic conditions, adverse regulatory developments or other events adversely impacting us. Any failure to comply with these covenants would constitute a default under the indenture governing our Senior Notes and/or the Credit Agreement, as applicable, and would prevent further borrowings under the Credit Agreement and could cause those and other obligations to become due and payable. If any of our indebtedness is accelerated, we may not be able to repay it.
Our organizational documents have no limitation on the amount of indebtedness that we may incur. As a result, we may become more highly leveraged in the future, which could adversely affect our financial condition.
Our business strategy contemplates the use of both secured and unsecured debt to finance long-term growth. While we intend to limit our indebtedness, to maintain an overall net debt to gross real estate investment ratio of approximately 45% to 55% (provided that we may exceed this amount for individual properties in select cases where attractive financing is available), our organizational documents contain no limitations on the amount of debt that we may incur. Further, our financing decisions and related decisions regarding levels of debt may be determined by our Board of Directors in its discretion without stockholder approval. As a result, we may be able to incur substantial additional debt, including secured debt, in the future, subject to us meeting the financial and operating covenants described above, which could result in us becoming more highly leveraged and adversely affecting our financial condition.
Increases in interest rates would increase our debt service obligations and may adversely affect the refinancing of our existing debt and our ability to incur additional debt, which could adversely affect our financial condition.
Certain of our borrowings bear interest at variable rates, and we may incur additional variable-rate debt in the future. Increases in interest rates would result in higher interest expenses on our existing unhedged variable rate debt, and increase the costs of refinancing existing debt or incurring new debt. Additionally, increases in interest rates may result in a decrease in the value of our real estate and decrease the market price of our capital stock and could accordingly adversely affect our financial condition.condition, cash flow and results of operation.
We may not be able to generate sufficient cash flow to meet our debt service obligations.
Our ability to make payments on and to refinance our indebtedness, and to fund our operations, working capital and capital expenditures, depends on our ability to generate cash. To a certain extent, our cash flow is subject to general economic, industry, financial, competitive, operating, legislative, regulatory and other factors, many of which are beyond our control.
We cannot assure you that our business will generate sufficient cash flow from operations or that future sources of cash will be available to us in an amount sufficient to enable us to pay amounts due on our indebtedness or to fund our other liquidity needs.
Additionally, ifIf we incur additional indebtedness in connection with any future acquisitions or development projects or for any other purpose, our debt service obligations could increase. We may need to refinance all or a portion of our indebtedness before maturity. Our ability to refinance our indebtedness or obtain additional financing will depend on, among other things:
our financial condition and market conditions at the time;
restrictions in the agreements governing our indebtedness;
general economic and capital market conditions;
the availability of credit from banks or other lenders;
investor confidence in us; and
our results of operations.
As a result, we may not be able to refinance our indebtedness on commercially reasonable terms, or at all. If we do not generate sufficient cash flow from operations, and additional borrowings or refinancings or proceeds of asset sales or other sources of cash are not available to us, we may not have sufficient cash to enable us to meet all of our obligations. Accordingly, if we cannot service our indebtedness, we may have to take actions such as seeking additional equity, or delaying any strategic acquisitions and alliances or capital expenditures, any of which could have a material adverse effect on our operations.
Adverse changes in our credit ratings could affect our borrowing capacity and borrowing terms.
Credit rating agencies continually evaluate their ratings for the companies that they follow, including us. The credit rating agencies also evaluate our industry as a whole and may change their credit ratings for us based on their overall view of our industry. Our Senior Notes are periodically rated by nationally recognized credit rating agencies.agencies, but we cannot be sure that credit rating agencies will maintain their ratings on the Senior Notes. Our current corporate credit rating is “BB+” and our issue-level ratingratings for our Senior Notes isare “BBB-” with a “positive”“stable” outlook from Standard & Poor’s Rating Services. Our corporate credit and issue-level ratings for our Senior Notes are “Ba1”“Baa3” with a “positive”“stable” outlook assigned by Moody’s Investor Service, Inc. Both agencies have upgradedOur corporate credit and issue-level ratings for our ratings in comparison to the prior year, however, there can be no assurance that our ratings will not fluctuate. Fitch Ratings, Inc. has also assigned to us a first time investment grade rating ofSenior Notes are “BBB-” with a “stable” outlook. outlook assigned by Fitch Ratings, Inc.
The credit ratings are based on our operating performance, liquidity and leverage ratios, overall financial position, and other factors viewed by the credit rating agencies as relevant to our industry and the economic outlook in general. Our credit ratings can adversely affect the cost and availability of capital, as well as the terms of any financing we obtain. Since we depend in part on debt financing to fund our business, an adverse change in our credit ratings could have a material adverse effect on our financial condition, liquidity, results of operations and the trading price of our Senior Notes.
Risks Related to Equity
The Board of Directors may create and issue a class or series of common or preferred stock without stockholder approval.
Subject to applicable legal and regulatory requirements, the Board of Directors is empowered under our charter to amend our charter from time to time to increase or decrease the aggregate number of shares of our stock or the number of shares of stock of any class or series that we have authority to issue, to designate and issue from time to time one or more classes or series of stock and to classify or reclassify any unissued shares of our common stockCommon Stock or preferred stock without stockholder approval. The Board of Directors may determine the relative preferences, conversion or other rights, voting powers, restrictions, limitations as to dividends or other distributions, qualifications or terms or conditions of redemption of any class or series of stock issued. As a result, we may issue series or classes of stock with voting rights, rights to dividends or other rights, senior to the rights of holders of our outstanding capital stock. The issuance of any such stock could also have the effect of delaying or preventing a change of control transaction that might otherwise be in the best interests of our stockholders. In addition, future sales of shares of our common stockCommon Stock or preferred stock may be dilutive to existing stockholders.
The trading price of our common stockCommon Stock has been and may continue to be subject to wide fluctuations.
The sales price of our common stockCommon Stock on the NYSE has fluctuated in recent quarters. Our stock price may fluctuate in response to a number of events and factors, including as a result of future offerings of our securities, as a result of the events or realization of the risks described in this “Risk Factors”“Risk Factors” section or in our future filings with the SEC, and as a result of changes to our dividend yield relative to yields on other financial instruments (e.g.(e.g., increases in interest rates resulting in higher yields on other financial instruments may adversely affect the sales price of our common stock)Common Stock). In addition, the trading volume and price of our common stockCommon Stock may fluctuate and be adversely impacted in response to a number of factors, including: actual or anticipated variations in our operating results, earnings, or liquidity, or those of our competitors;
changes in our dividend policy;
publication of research reports about us, our competitors, our tenants, or the REIT industry;
changes in market valuations of companies similar to us;
speculation in the press or investment community;
our failure to meet, or changes to, our earnings estimates, or those of any securities analysts;
increases in market interest rates;
adverse market reaction to the amount of or the maturity of our debt and our ability to refinance such debt and the terms thereof;
adverse market reaction to any additional indebtedness we incur or equity or securities we may issue;
changes in our credit ratings;
actual or perceived conflicts of interest;
changes in our key management;
the financial condition, liquidity, results of operations, and prospects of our tenants;
resolution of pending litigation and government investigations;
failure to maintain our REIT qualification; and
•general market and economic conditions, including the current state of the credit and capital markets.
The issuance of additional equity securities may dilute earnings per share and existing equity holders.
Giving effect to the issuance of common stockCommon Stock in future potential offerings, the receipt of future potential net proceeds and the use of those proceeds, additional equity offerings may have a dilutive effect on our expected earnings per share. Additionally, we are not restricted from issuing additional shares of our common stockCommon Stock or preferred stock, including any securities that are convertible into or exchangeable for, or that represent the right to receive, common stockCommon Stock or preferred stock or any substantially similar securities in the future. The market price of our common stockCommon Stock could decline as a result of sales of a large number of shares of our common stockCommon Stock in the market or the perception that such sales could occur.
Future offerings of debt, which would be senior to our common stockCommon Stock upon liquidation, or preferred equity securities that may be senior to our common stockCommon Stock for purposes of dividend distributions or upon liquidation, may adversely affect the market price of our common stock.Common Stock.
In the future, we may issue debt or preferred equity securities. Upon liquidation, holders of our debt securities and shares of preferred stock and lenders with respect to other borrowings will receive distributions of our available assets prior to the holders of our common stock.Common Stock. Additional equity offerings, including offerings of convertible preferred stock, may dilute the holdings of
our existing stockholders or otherwise reduce the market price of our common stock,Common Stock, or both. Holders of our common stockCommon Stock are not entitled to preemptive rights or other protections against dilution. Preferred stock, if issued, could have a preference on liquidating distributions or a preference on distribution payments that could limit our ability to make distributions to holders of our common stock.Common Stock. Because our decision to issue securities in any future offering will depend on market conditions and other factors beyond our control, we cannot predict or estimate the amount, timing or nature of our future offerings. Thus, our stockholders bear the risk of our future offerings reducing the market price of our common stockCommon Stock and diluting their stock holdings in us.
The change of control conversion feature of the Series F Preferred Stock may make it more difficult for a party to take over the Company or discourage a party from taking over the Company.
Upon the occurrence of a change of control (as defined in the Articles Supplementary for the Series F Preferred Stock) the result of which is that our common stockCommon Stock or the common securities of the acquiring or surviving entity are not listed on a national stock exchange, holders of the Series F Preferred Stock will have the right (unless, prior to the change of control conversion date, we have provided or provide notice of our election to redeem the Series F Preferred Stock) to convert some or all of their Series
F Preferred Stock into shares of our common stockCommon Stock (or equivalent value of alternative consideration). The change of control conversion feature of the Series F Preferred Stock may have the effect of discouraging a third party from making an acquisition proposal for the Company or of delaying, deferring or preventing certain change of control transactions of the Company under circumstances that stockholders may otherwise believe are in their best interests.
Risks Relating to our REI SegmentReal Estate Investments
Because we own real property, we are subject to extensive environmental regulation, which creates uncertainty regarding future environmental expenditures and liabilities.
Environmental laws regulate, and impose liability for, releases of hazardous or toxic substances into the environment. Under various provisions of these laws, an owner or operator of real estate, such as us, is or may be liable for costs related to soil or groundwater contamination on, in, or migrating to or from its property. In addition, persons who arrange for the disposal or treatment of hazardous or toxic substances may be liable for the costs of cleaning up contamination at the disposal site. Such laws often impose liability regardless of whether the person knew of, or was responsible for, the presence of the hazardous or toxic substances that caused the contamination. The presence of, or contamination resulting from, any of these substances, or the failure to properly remediate them, may adversely affect our ability to sell or lease our property or to borrow using such property as collateral. In addition, persons exposed to hazardous or toxic substances may sue us for personal injury damages. As a result, in connection with our current or former ownership, operation, management and development of real properties, we may be potentially liable for investigation and cleanup costs, penalties, and damages under environmental laws. Further, environmental laws may impose liabilities, costs or operating limitations on our tenants which could adversely affect our tenants’ operations and their ability to make rental payments to us.
Although our properties are generally subjected to preliminary environmental assessments, known as Phase I assessments, by independent environmental consultants that identify certain liabilities, Phase I assessments are limited in scope, and may not include or identify all potential environmental liabilities or risks associated with the property. Further, any environmental liabilities that arose since the date the studies were done would not be identified in the assessments. Unless required by applicable laws or regulations, we may not further investigate, remedy or ameliorate the liabilities disclosed in the Phase I assessments.
We cannot assure you that these or other environmental studies identified all potential environmental liabilities, or that we will not incur material environmental liabilities in the future. If we do incur material environmental liabilities in the future, we may face significant remediation costs, and we may find it difficult to finance or sell any affected properties.
We aremay be subject to risks relating to mortgage, bridge or mezzanine loans.
Investinginvestments in mortgage, bridge or mezzanine loans which may adversely affect our investment and our ability to sell those loans held for sale.
We have in the past and in the future may invest in mortgage, bridge or mezzanine loans which investment involves risk of defaults on those loans caused by many conditions beyond our control, including local and other economic conditions (such as the decline of the underlying property value from our initial investment) affecting real estate values and interest rate levels. If there are defaults under these loans, we may not be able to repossess and sell quickly or foreclose on any properties securing such loans.loans which could reduce the value of our investment in the defaulted loan. An action to foreclose on a property securing a loan is regulated by state statutes and regulations and is subject to many of the delays and expenses of any lawsuit brought in connection with the foreclosure if the defendant raises defenses or counterclaims. In the event of default by a mortgagor,borrower, these restrictions, among other things, may impede our ability to sell our remaining investment or foreclose on or sell the mortgaged propertycollateral or to obtain proceeds sufficient to repay all amounts due to us on the loan, which could reduce the value of our investment in the defaulted
loan. As of December 31, 2018, our investments of mortgage, bridge or mezzanine loans notes receivable were classified as held for sale, however, we may in the future determine to invest in mortgage, bridge or mezzanine loans.
We are subject to risks relating to real estate-related securities, including commercial mortgage backed securities (“CMBS”).
Real estate-related securities are often unsecured and also may be subordinated to other obligations of the issuer. As a result, investments in real estate-related securities may be subject to risks of (1) limited liquidity in the secondary trading market in the case of unlisted or thinly traded securities, (2) substantial market price volatility resulting from changes in prevailing interest rates in the case of traded equity securities, (3) subordination to the prior claims of banks and other senior lenders to the issuer, (4) the operation of mandatory sinking fund or call/redemption provisions during periods of declining interest rates that could cause the issuer to reinvest redemption proceeds in lower yielding assets, (5) the possibility that earnings of the issuer or that income from collateral may be insufficient to meet debt service and distribution obligations and (6) the declining creditworthiness and potential for insolvency of the issuer during periods of rising interest rates and economic slowdown or downturn. These risks may adversely affect the value of outstanding real estate-related securities, and the ability of the obliged parties to repay principal and interest or make distribution payments.payments and our ability to sell these securities we determine to market for sale.
CMBS are securities that evidence interests in, or are secured by, a single commercial mortgage loan or a pool of commercial mortgage loans. Accordingly, these securities are subject to the risks listed above and all of the risks of the underlying mortgage loans. CMBS are issued by investment banks and non-regulated financial institutions, and are not insured or guaranteed by the U.S. government. The value of CMBS may change due to shifts in the market’s perception of issuers and regulatory or tax changes adversely affecting the mortgage securities market as a whole and may be negatively impacted by any dislocation in the mortgage-backed securities market in general.
CMBS are also subject to several risks created through the securitization process. Subordinate CMBS are paid interest only to the extent that there are funds available to make payments. To the extent the collateral pool includes delinquent loans, there is a risk that interest payments on subordinate CMBS will not be fully paid. Subordinate CMBS are also subject to greater credit risk than those CMBS that are more highly rated. In certain instances, third-party guarantees or other forms of credit support can reduce the credit risk.
Our build-to-suit program isacquisitions are subject to additional risks related to properties under development.
WeFrom time to time, we engage in build-to-suit programsacquisitions and the acquisition of properties under development. In connection with these businesses, we enter into purchase and sale arrangements with sellers or developers of suitable properties under development or construction. In such cases, we are generally obligated to purchase the property at the completion of construction, provided that the construction conforms to definitive plans, specifications, and costs approved by us in advance.advance, and if other conditions have been met, such as there being an effective lease for the property, and the tenant having accepted the property and commenced paying rent. We may also engage in development and construction activities involving existing properties, including the construction of new buildings or the expansion of existing facilities (typically at the request of a tenant) or the development or build-out of vacant space at retail properties.space. We may advance significant amounts in connection with certain development projects.
As a result, we are subject to potential development risks and construction delays and the resultant increased costs and risks, as well as the risk of loss of certain amounts that we have advanced should a development project not be completed. To the extent that we engage in development or construction projects, we may be subject to uncertainties associated with obtaining permits or re-zoning for development, environmental and land use concerns of governmental entities and/or community groups, and the builder’s ability to build in conformity with plans, specifications, budgeted costs and timetables. If a developer or builder fails to perform, we may terminate the purchase, modify the construction contract or resort to legal action to compel performance (or in certain cases, we may elect to take over the project and pursue completion of the project ourselves). A developer’s or builder’s performance may also be affected or delayed by conditions beyond that party’s control. Delays in obtaining permits or completion of construction could also give tenants the right to terminate preconstruction leases.
We may incur additional risks if we make periodic progress payments or other advances to builders before they complete construction. These and other such factors can result in increased project costs or the loss of our investment. Although we rarely engage in construction activities relating to space that is not already leased to one or more tenants, to the extent that we do so, we may be subject to normal lease-up risks relating to newly constructed projects. We also will rely on rental incomerevenue and expense projections and estimates of the fair market value of property upon completion of construction when agreeing upon a price at the time we acquire the property. If these projections are inaccurate, we may pay too much for a property and our return on our investment could suffer. If we contract with a development company for a newly developed property, there is a risk that money advanced to that development company for the project may not be fully recoverable if the developer fails to successfully complete the project.
Risks Relating to our Cole Capital Segment
We may be unable to fully restore the distribution network which previously supported Cole Capital and the Cole REITs and/or regain the prior capital raising level of Cole Capital, which may adversely affect the financial success of Cole Capital and the Company.
Three of the five Cole REITs currently sponsored and managed by Cole Capital have ongoing public offerings. Following the announcement made by the Company on October 29, 2014 that certain of its financial statements could no longer be relied upon, various broker-dealers and clearing firms participating in offerings of the Cole REITs suspended sales activity with Cole Capital, resulting in a significant decrease in capital raising activity and, consequently, a decline in the overall revenue generated by Cole Capital.
In addition, non-listed REIT sales have decreased industry wide since December 31, 2015. As discussed below, financial service firms are subject to and may be adversely affected by extensive regulations and requirements by agencies, which not only impact our business, but the industry as a whole.
Cole Capital generates revenue from capital raising activity and asset management and advisory activity, the latter of which is also contingent upon successful capital raising activity as each of the Cole REITs is a blind pool whose portfolio is largely built through the deployment of proceeds raised in the respective Cole REIT’s public offering. Revenue generated from Cole Capital’s capital raising activity is received in the form of dealer manager fees, which are earned at the point of sale of the Cole REITs’ common stock and, therefore, a reduction in capital raising activity directly results in a reduction in such dealer manager fees. Cole Capital receives additional compensation, including one-time acquisition fees and ongoing advisory fees from its asset management and advisory activity. Acquisition fees are earned, in large part, when Cole Capital deploys capital raised from a Cole REIT’s public offering into real estate acquisitions on behalf of such Cole REIT. Cole Capital also receives advisory fees that are calculated based, in whole or in part, upon the value of each Cole REIT’s total invested assets. An increase in assets under
management, which generally occurs as the Cole REITs raise more capital, typically results in increased advisory fees. Therefore, a slowdown in capital raising activity could delay or reduce Cole Capital’s receipt of those additional fees. Additional fees may be earned by Cole Capital following the completion of a Cole REIT’s public offering and deployment of capital therefrom. A description of Cole Capital’s fees is contained in “Note 18 –Risks Related Party Transactions and Arrangements” to our consolidated financial statements. While certain of the broker-dealers and the clearing firms have reengaged with Cole Capital following their suspensions, there can be no assurance that the remaining broker-dealers will reengage with Cole Capital on a timely basis or at all. If these circumstances continue for a prolonged period of time, capital raising activity at Cole Capital may continue to be negatively affected, reducing overall fee generation at Cole Capital and, therefore, the overall financial success of Cole Capital and the Company could be adversely affected. In addition, there is no guarantee as to the Cole Capital segment’s actual results. The fair value of goodwill and intangible assets allocated to the Cole Capital segment are dependent upon projected results, including, but not limited to, the timing and aggregate amount of capital raised and deployed on behalf of the Cole REITs, which is influenced by the Company’s ability to reinstate certain selling agreements that were suspended as a result of the Audit Committee Investigation. If the Company is unable to reinstate certain selling agreements with broker-dealers and clearing firms on a timely basis, the fair value of goodwill and intangible assets allocated to the Cole Capital segment may be less than the respective carrying value, resulting in an impairment that could have a material adverse effect on the Company’s financial results.
During the quarter ended December 31, 2016, we recorded significant impairment charges in respect of goodwill and intangible assets allocated to the Cole Capital segment. We reassessed the expected collectability of the program development costs, based on assumptions used to calculate these impairments, and recorded additional reserves in the quarter ended December 31, 2016. Additional charges and/or reserves may be recorded in subsequent periods if actual proceeds raised from the offerings and corresponding program development costs incurred differ from management’s assumptions used at December 31, 2016.
Cole Capital is subject to risks that are particular to its role as sponsor and dealer manager for direct investment program offerings.
Cole Capital, including Cole Capital Corporation, which is Cole Capital’s broker-dealer subsidiary and a wholesale broker-dealer registered with the SEC and a member firm of FINRA, is subject to various risks and uncertainties that are common in the securities industry. Such risks and uncertainties include:
the volatility of financial markets;
extensive governmental regulation;
intense competition; and
litigation.
Cole Capital’s business, which involves sponsoring and distributing interests in direct investment programs, depends on a number of factors including our ability to enter into agreements with broker-dealers to participate in the Cole REIT offerings, our success in investing the proceeds of each offering, managing the properties acquired and generating cash flow to make distributions to investors in our direct investment programs and our success in entering into liquidity events for the direct investment programs. We are subject to competition from other sponsors and dealer managers of direct investment programs and other investments, and there can be no assurance that this business will be successful.
Sponsorship of the Cole REITs also involves risks relating to competition from sponsors of other similar programs and risks relating to the possibility that such programs will not receive capital at the levels and at such times that are anticipated or needed to meet up-front or ongoing costs or debt obligations.
FINRA rules applicable to Cole Capital and the Cole REITs’ business, including Rule 2310 (Direct Participation Programs) which, among other things, imposes limits on total compensation to brokers in connection with an offering, and amendments to Rule 2340 (Customer Account Statements) which were effective in April 2016 and changed the manner in which the value of shares in a Cole REIT may be reflected on customer account statements, as well as FINRA investigations into the manner in which shares are sold by some retail brokers, may have a negative impact on the business of Cole Capital. Public authorities may continue to enact new and more stringent standards, or interpret existing laws and regulations in a more restrictive manner, which may adversely affect companies in the industry, including us.
In addition, Cole Capital is subject to risks that are particular to its function as a wholesale broker-dealer and sponsor of the Cole REITs. For example, in its capacity as dealer manager, the broker-dealer provides substantial promotional support to broker-dealers selling a particular offering, including by providing sales literature, forums, webinars, press releases and other mass forms of communication. Due to Cole Capital acting as a sponsor of the Cole REITs and the volume of materials that Cole Capital Corporation may provide throughout the course of an offering, much of Cole Capital’s activities may be scrutinized by regulators. We and Cole Capital may be exposed to significant liability under federal and state securities laws. Additionally, Cole Capital Corporation may be subject to fines and suspension from the SEC and FINRA.
Failure to comply with the SEC’s net capital requirements could subject us to sanctions imposed by the SEC or FINRA.
Cole Capital Corporation, our broker-dealer subsidiary, is required to maintain certain levels of minimum net capital subject to the SEC’s net capital rule. The net capital rule is designed to measure the general financial integrity and liquidity of a broker-dealer. Compliance with the net capital rule limits those operations of broker-dealers that require the intensive use of their capital, such as underwriting commitments and principal trading activities. The rule also limits the ability of securities firms to pay dividends or make payments on certain indebtedness, such as subordinated debt, as it matures. FINRA may enter the offices of a broker-dealer at any time, without notice, and calculate the firm’s net capital. If the calculation reveals a deficiency in net capital, FINRA may immediately restrict or suspend certain or all the activities of a broker-dealer. If Cole Capital Corporation is not able to maintain adequate net capital, or its net capital falls below requirements established by the SEC, it may be subject to disciplinary action in the form of fines, censure, suspension, expulsion or the termination of business altogether. In addition, if these net capital rules are changed or expanded, or if there is an unusually large charge against net capital, operations that require the intensive use of capital would be limited. A large operating loss or charge against net capital could adversely affect Cole Capital’s ability to expand or even maintain its present levels of business, which could have a material adverse effect on its business of sponsoring and distributing interests in direct investment programs.
Broker-dealers and other financial services firms are subject to extensive regulations and increased scrutiny.
The financial services industry is subject to extensive regulation by U.S. federal, state and international government agencies, as well as various self-regulatory agencies. Turmoil in the financial markets has contributed to significant rule changes, heightened scrutiny of the conduct of financial services firms and increasing penalties for rule violations. Cole Capital Corporation may be adversely affected by new laws or rules (including the pending Department of Labor fiduciary standard), changes to the laws, rules or in the interpretation of existing rules or more rigorous enforcement. Some of these rules, if implemented, could impact Cole Capital Corporation’s business, including through the potential implementation of a more stringent fiduciary standard for brokers for sales of commission products, such as the Cole REITs, and enhanced regulatory oversight over incentive compensation.
The Cole Capital segment also may be adversely affected by other evolving regulatory standards, such as those relating to suitability and supervision. Legal claims or regulatory actions against Cole Capital Corporation or any of the other entities that comprise Cole Capital also could have adverse financial effects on us or harm our reputation, which could harm our business prospects.
Cole Capital Corporation, which is registered as a broker-dealer under the Exchange Act and is a member of FINRA, is subject to regulation, examination and supervision by the SEC, FINRA, other self-regulatory organizations and state securities regulators. Broker-dealers are subject to regulations that cover all aspects of the securities business, including sales practices, use and safekeeping of clients’ funds and securities’ capital adequacy, record-keeping and the conduct and qualification of officers, employees and independent contractors. Failure by Cole Capital Corporation to comply with applicable laws or regulations could result in censures, penalties or fines, the issuance of cease and desist orders, suspension or expulsion from the securities industry, or other similar adverse consequences. Additionally, the adverse publicity arising from the imposition of sanctions could harm our reputation and cause us to lose existing clients or fail to gain new clients.
Financial services firms are also subject to rules and regulations relating to the prevention and detection of money laundering. The USA PATRIOT Act of 2001 mandates that financial institutions, including broker-dealers and investment advisors, establish and implement anti-money laundering (“AML”) programs reasonably designed to achieve compliance with the Bank Secrecy Act of 1970 and the rules thereunder. Financial services firms must maintain AML policies, procedures and controls, designate an AML compliance officer to oversee the firm’s AML program, implement appropriate employee training and provide for annual independent testing of the program. Cole Capital Corporation has established AML programs, which we subject to periodic third-party testing, but there can be no assurance of the effectiveness of these programs. Failure to comply with AML requirements could subject Cole Capital Corporation to disciplinary sanctions and other penalties. Financial services firms must also comply with applicable privacy and data protection laws and regulations, including SEC Regulation S-P and applicable provisions of the 1999 Gramm-Leach-Bliley Act, the Fair Credit Reporting Act of 1970 and the 2003 Fair and Accurate Credit Transactions Act. Any violations of laws and regulations relating to the safeguarding of private information could subject Cole Capital Corporation to fines and penalties, as well as to civil action by affected parties.Services Agreement
We are subject to conflicts of interest relating to the Cole Capital’s investment management business.REITs.
Cole Capital currently manages five
During the initial term of the Services Agreement, property acquisition opportunities will be allocated among us and the real estate programs sponsored by CCA pursuant to an asset allocation policy and in accordance with the terms of the Services Agreement. The Cole REITs all of which have characteristics, including targeted investment types, and investment objectives and investment strategiescriteria substantially similar to our own. As a result, we may be seeking to acquire properties and real estate-related investments at the same time as the Cole REITs. In addition, certain of our officers are also officers and/or directors
During the initial term of the Cole REITsServices Agreement, in the event that an investment opportunity is identified that may be suitable for more than one of us or the other programs sponsored by CCA and asfor which more than one of such they will have duties to us as well as to the Cole REITs. We have implemented certain procedures to help manage any perceived or actual conflicts among us and the Cole REITs, including adoptingentities has sufficient uninvested funds, then an allocation policy to allocate property acquisitions among uscommittee, which is comprised of employees of the Company and the Cole REITs based onemployees of CIM Group, LLC, CCA or their respective affiliates, will examine the following factors:
factors, among others, in determining the entity for which the investment opportunity is most appropriate:
the investment objective of each entity;
the anticipated operating cash flows of each entity and the cash requirements of each entity;
the effect of the potential acquisition both on diversification of each entity’s investments by type of property, geographic area and tenant concentration;
the amount of funds available to each entity and the length of time such funds have been available for investment;
the policy of each entity relating to leverage of properties;
the income tax effects of the purchase to each entity; and
the size of the investment.
If, we determine that anin the judgment of the allocation committee, the investment opportunity may be equally appropriate for more than one entity,program, then the entity that has had the longest period of time elapse since it was allocated an investment opportunity of a similar size and type (e.g.,e.g., office, industrial, multi-tenantretail properties or single tenant retail)anchored shopping centers) will be allocated such investment opportunity. In addition, we haveIf a subsequent development, such as a delay in the closing of the acquisition or a delay in the construction of a property, causes any such investment, in the opinion of the allocation committee, to be more appropriate for an entity other than the entity that committed to make the investment, the allocation committee may determine that the Company or a program sponsored by CCA will make the investment.
For programs sponsored by CCA that commenced operations on or after March 5, 2013, the Company retains a right of first refusal over three of the Cole REITs with respect tofor all opportunities to acquire majority single-tenant real estate and real estate-related assets or portfolios with a purchase price greater than $100.0$100 million. This right of first refusal applies to CCIT II, CCIT III and CCPT V, but does not apply to CCPT IV or INAV.
There can be no assurance that these policies will be adequate to address all of the conflicts that may arise or will address such conflicts in a manner that is favorable to us.
Further, under the advisory agreements with the Cole REITs, Cole Capital receives fees for various services, including, but not limited to, the day-to-day management of the Cole REITs and transaction-related services. The terms of these advisory agreements were not the result of arm’s length negotiations between independent parties and as a result, the terms of these agreements may not be as favorable to us as they would have been if we had negotiated these agreements with unaffiliated third parties.
Because the revenue streams from the advisory agreements Cole Capital has with the Cole REITs are subject to limitation or cancellation, any such termination could have an adverse effect on our business, results of operations and financial condition.
The advisory agreements under which Cole Capital provides services to the Cole REITs are subject to renewal on an annual basis and may generally be terminated by each Cole REIT upon 60 days’ notice to us, with or without cause. The advisory agreements with four of the five Cole REITs are scheduled to expire on November 30, 2017 unless otherwise renewed. The advisory agreement with the remaining Cole REIT is scheduled to expire on September 22, 2017 unless otherwise renewed. There can be no assurance that these agreements will not expire or be otherwise terminated and any such termination could have an adverse effect on our business, financial condition and results of operations.
Risks Related to our Organization and Structure
We are a holding company with no direct operations. As a result, we rely on funds received from the Operating Partnership to pay liabilities and dividends, our stockholders’ claims will be structurally subordinated to all liabilities of the Operating Partnership and our stockholders do not have any voting rights with respect to the Operating Partnership’s activities, including the issuance of additional OP Units.
We are a holding company and conduct all of our operations through the Operating Partnership. We do not have, apart from our ownership of the Operating Partnership, any independent operations. As a result, we rely on distributions from the Operating Partnership to pay any dividends we might declare on shares of our common stock.Common Stock. We also rely on distributions from the Operating Partnership to meet our debt service and other obligations, including our obligations to make distributions required to maintain our REIT qualification. The ability of subsidiaries of the Operating Partnership to make distributions to the Operating Partnership, and the ability of the Operating Partnership to make distributions to us in turn, will depend on their operating results and on the terms of any loans that encumber the properties owned by them. Such loans may contain lockbox arrangements, reserve requirements, financial covenants and other provisions that restrict the distribution of funds. In the event of a default under these loans, the defaulting subsidiary would be prohibited from distributing cash. As a result, a default under any of these loans by the borrower subsidiaries could cause us to have insufficient cash to make distributions on our common stockCommon Stock required to maintain our REIT qualification.
In addition, because we are a holding company, stockholders’ claims will be structurally subordinated to all existing and future liabilities and obligations (whether or not for borrowed money) of the Operating Partnership and its subsidiaries. Therefore, in the event of our bankruptcy, liquidation or reorganization, claims of our stockholders will be satisfied only after all of our and the Operating Partnership’s and its subsidiaries’ liabilities and obligations have been paid in full.
As of December 31, 2016,2018, we owned approximately 97.6% of the OP Units in the Operating Partnership. However, the Operating Partnership may issue additional OP Units in the future. Such issuances could reduce our ownership percentage in the Operating Partnership. Because our stockholders would not directly own any such OP Units, they would not have any voting rights with respect to any such issuances or other partnership-level activities of the Operating Partnership.
Our charter and bylaws and Maryland law contain provisions that may delay or prevent a change of control transaction.
Our charter, subject to certain exceptions, limits any person to actual or constructive ownership of no more than 9.8% in value of the aggregate of our outstanding shares of stock and not more than 9.8% (in value or in number of shares, whichever is more restrictive) of any class or series of our shares of stock. In addition, our charter provides that we may not consolidate, merge, sell all or substantially all of our assets or engage in a share exchange unless such actions are approved by the affirmative vote of at least two-thirds of the Board of Directors. The ownership limits and the other restrictions on ownership and transfer of our stock and the Board approval requirements contained in our charter may delay or prevent a transaction or a change of control that might involve a premium price for our common stockCommon Stock or otherwise be in the best interest of our stockholders.
Certain provisions in the LPA may delay, defer or prevent unsolicited acquisitions of us.
Certain provisions in the LPA may delay or make more difficult unsolicited acquisitions of us or changes in our control. These provisions could discourage third parties from making such proposals, although some stockholders might consider such proposals, if made, desirable. These provisions include, among others:
redemption rights of qualifying parties;
the ability of the General Partner in some cases to amend the LPA without the consent of the limited partners;
the right of the limited partners to consent to transfers of the general partnership interest of the General Partner and mergers or consolidations of the Company under specified limited circumstances; and
restrictions relating to our qualification as a REIT under the Internal Revenue Code.
The LPA also contains other provisions that may have the effect of delaying, deferring or preventing a transaction or a change of control that might involve a premium price for our common stockCommon Stock or otherwise be in the best interest of our stockholders.
Tax protection provisions on certain properties could limit our operating flexibility.
We have agreed with ARC Real Estate Partners, LLC, an affiliate of the Former Manager,ARC Properties Advisors, LLC (the “Former Manager”), to indemnify it against any adverse tax consequences if we were to sell, convey, transfer or otherwise dispose of all or any portion of the interests in the properties that were acquired by us in our formation transactions, in a taxable transaction. These tax protection provisions apply until September 6, 2021, which is the 10th anniversary of the closing of our initial public offering (“IPO”). Although it may be in our stockholders’ best interest that we sell one or more of these properties, it may be economically disadvantageous for us to do so because of these obligations. We have also agreed to make debt available for ARC Real Estate Partners, LLC to guarantee. We agreed to these provisions at the time of our IPO in order to assist ARC Real Estate Partners, LLC in preserving its tax position after its contribution of its interests in our initial properties. As a result, we may be required to incur and maintain more debt than we would otherwise.
The Company’s fiduciary duties as sole general partner of the Operating Partnership could create conflicts of interest.
The Company has fiduciary duties to the Operating Partnership and the limited partners in the Operating Partnership, the discharge of which may conflict with the interests of its stockholders. The LPA provides that, in the event of a conflict between the duties owed by the Company’s directors to the Company and the duties that the Company owes in its capacity as the sole general partner of the Operating Partnership to the Operating Partnership’s limited partners, the Company’s directors are under no obligation to give priority to the interests of such limited partners. As a holder of OP Units, the Company will have the right to vote on certain amendments to the LPA (which require approval by a majority in interest of the limited partners, including the Company) and individually to approve certain amendments that would adversely affect the rights of the Operating Partnership’s limited partners, as well as the right to vote on mergers and consolidations of the Company in its capacity as sole general partner of the Operating Partnership in certain limited circumstances. These voting rights may be exercised in a manner that conflicts with the interests of the Company’s stockholders. For example, the Company cannot adversely affect the limited partners’ rights to
receive distributions, as set forth in the LPA, without their consent, even though modifying such rights might be in the best interest of the Company’s stockholders generally.
The Board of Directors may change significant corporate policies without stockholder approval.
Our investment, financing, borrowing and dividend policies and our policies with respect to other activities, including growth, debt, capitalization, operations and operations,other governance matters, will be determined by the Board of Directors. These policies may be amended or revised at any time and from time to time at the discretion of the Board of Directors without a vote of our stockholders. In addition, the Board of Directors may change our policies with respect to conflicts of interest provided that such changes are consistent with applicable legal requirements. A change in these policies could have an adverse effect on our business, financial condition, liquidity and results of operations and our ability to satisfy our debt service obligations and to make distributions to our stockholders and unitholders.
Our rights and the rights of our stockholders to take action against our directors and officers are limited under Maryland law.
Maryland law provides that a director or officer has no liability in that capacity if he or she performs his or her duties in good faith, in a manner he or she reasonably believes to be in our best interests and with the care that an ordinarily prudent person in a like position would use under similar circumstances. In addition, Maryland law permits a Maryland corporation to include in its charter a provision limiting the liability of its directors and officers to the corporation and its stockholders for money damages except for liability resulting from (1) actual receipt of an improper personal benefit or profit in money, property or services or (2) active and deliberate dishonesty established by a final judgment as being material to the cause of action. Our charter contains such a provision and limits the liability of our directors and officers to the maximum extent permitted by Maryland law. Maryland law requires us to indemnify our directors and officers for liability actually incurred in connection with any proceeding to which they may be made, or threatened to be made, a party, except to the extent that the act or omission of the director or officer was material to the matter giving rise to the proceeding and was either committed in bad faith or was the result of active and deliberate dishonesty, the director or officer actually received an improper personal benefit in money, property or services, or, in the case of any criminal proceeding, the director or officer had reasonable cause to believe that the act or omission was unlawful. As a result, we and our stockholders may have more limited rights against our directors and officers than might otherwise exist under common law. In addition, our charter obligates us to advance the reasonable defense costs incurred by our directors and officers. Finally, we have entered into agreements with our directors and officers pursuant to which we have agreed to indemnify them to the maximum extent permitted by Maryland law.
U.S. Federal Income and Other Tax Risks
Our failure to remain qualified as a REIT would subject us to U.S. federal income tax and potentially state and local tax, and would adversely affect our operations and the market price of our capital stock.
We elected to be taxed as a REIT commencing with the taxable year ended December 31, 2011 and believe we have operated, and intend to operate, in a manner that has allowed us to qualify as a REIT and will allow us to continue to qualify as a REIT. However, we may terminate our REIT qualification if the Board of Directors determines that not qualifying as a REIT is in our best interests, or the qualification may be terminated inadvertently. Our qualification as a REIT depends upon our satisfaction of certain asset, income, organizational, distribution, stockholder ownership and other requirements on a continuing basis. We structured our activities in a manner designed to satisfy the requirements for qualification as a REIT. However, the REIT qualification requirements are extremely complex and interpretation of the U.S. federal income tax laws governing qualification as a REIT is limited. Accordingly, we cannot be certain that we have been or will be successful in qualifying to be taxed as a REIT. Our ability to satisfy the asset tests depends on our analysis of the characterization and fair market values of our assets, some of which are not susceptible to a precise determination, and for which we will not obtain independent appraisals. Our compliance with the annual income and quarterly asset requirements also depends on our ability to successfully manage the composition of our income and assets on an ongoing basis. Accordingly, if certain of our operations were to be recharacterized by the Internal Revenue Service (the “IRS”), such recharacterization would jeopardize our ability to satisfy the requirements for qualification as a REIT. Furthermore, future legislative, judicial or administrative changes to the U.S. federal income tax laws could result in our disqualification as a REIT for past or future periods.
If we fail to qualify as a REIT for any taxable year and we do not qualify for certain statutory relief provisions, we will be subject to U.S. federal income tax on our taxable income at corporate rates. In addition, we would generally be disqualified from treatment as a REIT for the four taxable years following the year of losing our REIT qualification. Losing our REIT qualification would reduce our net earnings because of the additional tax liability. In addition, distributions to stockholders would no longer qualify for the dividends paid deduction, and we would no longer be required to make distributions and, accordingly, distributions the Operating Partnership makes to its unitholders could be similarly reduced. If this occurs, we might be required to borrow funds or liquidate some investments in order to pay the applicable tax.
Even if we continue to qualify as a REIT, in certain circumstances, we may incur tax liabilities that would reduce our cash available for distribution to our stockholders and unitholders.
Even if we continue to qualify as a REIT, we may be subject to U.S. federal, state and local income taxes. For example, net income from the sale of properties that are considered held for sale and not for investment (a “prohibited transaction” under the Internal Revenue Code) will be subject to a 100% tax. In addition, we may not make sufficient distributions to avoid income and excise taxes on retained income. We also may decide to retain net capital gain we earn from the sale or other disposition of our property or other assets and pay U.S. federal income tax directly on such income. In that event, our stockholders would be treated for federal income tax purposes as if they earned that income and paid the tax on it directly. However, stockholders that are tax-exempt, such as charities or qualified pension plans, would have no benefit from their deemed payment of such tax liability unless they file U.S. federal income tax returns and thereon seek a refund of such tax. We may, in certain circumstances, be required to pay an excise or penalty tax (which could be significant in amount) in order to utilize one or more relief provisions under the Internal Revenue Code to maintain our qualification as a REIT.
A REIT may own up to 100% of the stock of one or more TRSs.taxable REIT subsidiaries (“TRS”). Both the subsidiary and the REIT must jointly elect to treat the subsidiary as a TRS of the REIT. A TRS may hold assets and earn income that would not be qualifying assets or income if held or earned directly by a REIT, including gross income from operations pursuant to advisory agreements with the Cole REITs.REIT. We may use TRSs generally to hold properties for sale in the ordinary course of business or to hold assets or conduct activities that we cannot conduct directly as a REIT. Our TRSsTRS will be subject to applicable U.S. federal, state, local and foreign income tax on their taxable income. In addition, the TRS rules limit the deductibility of interest paid or accrued by a TRS to its parent REIT to ensure that the TRS is subject to an appropriate level of corporate taxation. These rules also impose a 100% excise tax on certain transactions between a TRS and its parent REIT that are not conducted on an arm’s-length basis.
Not all taxing jurisdictions recognize the favorable tax treatment afforded to REITs under the Internal Revenue Code. As such, we may be subject to regular corporate net income taxes in certain state, local or foreign taxing jurisdictions. In addition, we, the Operating Partnership, our TRSs,TRS, and/or other entities through which we conduct our business may also be subject to state, local or foreign income, franchise, sales, transfer, excise or other taxes. Any taxes that we incur directly or indirectly will reduce our cash available for distribution to our stockholders and unitholders. Additionally, changes in state, local or foreign tax law could reduce the cash flow from certain investments made by us and could make such investments less attractive to potential buyers when we seek to liquidate such investments.
To qualify as a REIT we must meet annual distribution requirements, which may force us to forgo otherwise attractive opportunities or borrow funds during unfavorable market conditions. This could delay or hinder our ability to meet our investment objectives and reduce your overall return.
In order to qualify as a REIT, we must distribute annually to our stockholders at least 90% of our REIT taxable income (which does not equal net income as calculated in accordance with U.S. GAAP), determined without regard to the deduction for dividends paid and excluding any net capital gain. We will be subject to U.S. federal income tax on our undistributed taxable income and net capital gain and to a 4% nondeductible excise tax on any amount by which dividends we pay with respect to any calendar year are less than the sum of (a) 85% of our ordinary income, (b) 95% of our capital gain net income and (c) 100% of our undistributed income from prior years. These requirements could cause us to distribute amounts that otherwise would be spent on investments in real estate assets and it is possible that we might be required to borrow funds, possibly at unfavorable rates, or sell assets to fund these dividends or make taxable stock dividends. Although we intend to make distributions sufficient to meet the annual distribution requirements and to avoid U.S. federal income and excise taxes on our earnings while we qualify as a REIT, it is possible that we might not always be able to do so.
If the Operating Partnership or certain other subsidiaries fail to qualify as a partnership or are not otherwise disregarded for U.S. federal income tax purposes, then we would cease to qualify as a REIT.
We intend to maintain the status of the Operating Partnership as a partnership for U.S. federal income tax purposes. However, if the IRS were to successfully challenge the status of the Operating Partnership as a partnership for such purposes, it would be taxable as a corporation. This would result in our failure to qualify as a REIT and would cause us to be subject to a corporate-level tax on our income. This would substantially reduce our cash available to pay distributions and the yield on your investments. In addition, if one or more of the partnerships or limited liability companies through which the Operating Partnership owns its properties, in whole or in part, loses its characterization as a partnership and is otherwise not disregarded for U.S. federal income tax purposes, then it would be subject to taxation as a corporation, thereby reducing distributions to the Operating Partnership. Such a recharacterization of a subsidiary entity could also threaten our ability to maintain our REIT qualification.
Recent legislation substantially modified the taxation of REITs and their shareholders, and the effects of such legislation and related regulatory action are uncertain.
On December 22, 2017, the TCJA was signed into law. The TCJA makes major changes to the Internal Revenue Code, including a number of provisions of the Internal Revenue Code that affect the taxation of REITs and their stockholders. Among the changes made by the TCJA are permanently reducing the generally applicable corporate tax rate, generally reducing the tax rate applicable to individuals and other non-corporate taxpayers for tax years beginning after December 31, 2017 and before January 1, 2026, eliminating or modifying certain previously allowed deductions (including substantially limiting interest deductibility and, for individuals, the deduction for non-business state and local taxes), and, for taxable years beginning after December 31, 2017 and before January 1, 2026, providing for preferential rates of taxation through a deduction of up to 20% (subject to certain limitations) on most ordinary REIT dividends and certain trade or business income of non-corporate taxpayers. The TCJA also imposes new limitations on the deduction of net operating losses and requires us to recognize income for tax purposes no later than when we take it into account on our financial statements, which may result in us having to make additional taxable distributions to our stockholders in order to comply with REIT distribution requirements or avoid taxes on retained income and gains. The effect of the significant changes made by the TCJA is highly uncertain, and administrative guidance will be required in order to fully evaluate the effect of many provisions. The effect of any technical corrections with respect to the TCJA could have an adverse effect on us or our stockholders. Investors should consult their tax advisors regarding the implications of the TCJA on their investment in our capital stock.
Dividends payable by REITs generally do not qualify for the reduced tax rates available for some dividends.
Currently, the maximum U.S. federal income tax rate applicable to qualified dividend income payable to U.S. stockholders that are individuals, trusts and estates is 20% (not including the net investment income tax). Dividends payable by REITs, however, generally are not eligible for this reduced rate. Although this does not adversely affect the taxation of REITs or dividends payable by REITs, the more favorable rates applicable to regular corporate qualified dividends could cause investors who are individuals, trusts and estates to perceive investments in REITs to be relatively less attractive than investments in the stocks of non-REIT corporations that pay dividends, which could adversely affect the value of the shares of REITs, including our common stock. TaxCommon Stock. Pursuant to the TCJA, non-corporate recipients of dividends from a REIT (other than capital gains dividends and dividends eligible for treatment as qualified dividends) may deduct up to 20% of such REIT dividends for taxable years beginning before January 1, 2026. This deduction mitigates but does not eliminate the difference in effective tax rates could be changed in future legislation.between REIT dividends and dividends paid by C corporations.
If we were considered to have actually or constructively paid a “preferential dividend” to certain of our stockholders, our status as a REIT could be adversely affected.
For our taxable years that ended on or before December 31, 2014, and for any year in which we fail to be a “publicly offered” REIT within the meaning of Section 562 of the Internal Revenue Code, in order for our distributions to be counted as satisfying the annual distribution requirements for REITs, and to provide us with a REIT-level tax deduction, the distributions could not have been “preferential dividends.” We believe we qualify as a publicly offered REIT, but there can be no assurance that we will continue to so qualify. A dividend is not a preferential dividend if the distribution is pro rata among all outstanding shares of stock within a particular class, and in accordance with the preferences among different classes of stock as set forth in our organizational documents. There is uncertainty as to the IRS’s position regarding whether certain arrangements that REITs have with their stockholders could give rise to the inadvertent payment of a preferential dividend. While we believe that our operations have been structured in such a manner that we will not be treated as inadvertently paying preferential dividends, there is no de minimis or reasonable cause exception with respect to preferential dividends under the Internal Revenue Code. Therefore, if the IRS were to take the position that we inadvertently paid a preferential dividend prior to January 1, 2015 (or any later year in which we are not a publicly offered REIT), we may be deemed either to (a) have distributed less than 100% of our REIT taxable income and be subject to tax on the undistributed portion, or (b) have distributed less than 90% of our REIT taxable income and our status as a REIT could be terminated for the year in which such determination is made and for the four taxable years following the year of termination if we were unable to cure such failure.
Complying with REIT requirements may limit our ability to hedge our liabilities effectively and may cause us to incur tax liabilities.
The REIT provisions of the Internal Revenue Code may limit our ability to hedge our liabilities. Any income from a hedging transaction we enter into to manage risk of interest rate changes, price changes or currency fluctuations with respect to borrowings made or to be made to acquire or carry real estate assets or to offset certain other positions, if properly identified under applicable Treasury Regulations, does not constitute “gross income” for purposes of the 75% or 95% gross income tests. To the extent that we enter into other types of hedging transactions, the income from those transactions will likely be treated as non-qualifying income for purposes of one or both of the gross income tests. As a result of these rules, we may need to limit our use of advantageous
hedging techniques or implement those hedges through a TRS. This could increase the cost of our hedging activities because our TRSs would be subject to tax on gains or expose us to greater risks associated with changes in interest rates than we would otherwise want to bear. In addition, losses in a TRS generally will not provide any tax benefit, except for being carried forward against future taxable income of such TRS.
Complying with REIT requirements may force us to forgo or liquidate otherwise attractive investment opportunities.
To qualify as a REIT, we must ensure that we meet the REIT gross income tests annually and that at the end of each calendar quarter, at least 75% of the value of our assets consists of cash, cash items, government securities and qualified REIT real estate assets, including certain mortgage loans and certain kinds of mortgage-related securities. The remainder of our investment in securities (other than government securities, qualified real estate assets and stock of a TRS) generally cannot include more than 10% of the outstanding voting securities of any one issuer or more than 10% of the total value of the outstanding securities of any one issuer. In addition, in general, no more than 5% of the value of our assets (other than government securities, qualified real estate assets and stock of a TRS) can consist of the securities of any one issuer, no more than 25% (20% for taxable years beginning after December 31, 2017)20% of the value of our total assets can be represented by securities of one or more TRSs and no more than 25% of the value of our total assets can be represented by certain debt securities of publicly offered REITs. If we fail to comply with these requirements at the end of any calendar quarter, we must correct the failure within 30 days after the end of the calendar quarter or qualify for certain statutory relief provisions to avoid losing our REIT qualification and suffering adverse tax consequences. As a result, we may be required to liquidate assets from our portfolio or not make otherwise attractive investments in order to maintain our qualification as a REIT. These actions could have the effect of reducing our income and amounts available for distribution to our stockholders.
Re-characterization of sale-leaseback transactions may cause us to lose our REIT status.
We may purchase properties and lease them back to the sellers of such properties. The Internal Revenue ServiceIRS could challenge our characterization of certain leases in any such sale-leaseback transactions as “true leases,” which allows us to be treated as the owner of the property for U.S. federal income tax purposes. In the event that any sale-leaseback transaction is challenged and re-characterized as a financing transaction or loan for U.S. federal income tax purposes, deductions for depreciation and cost recovery relating to such property would be disallowed. If a sale-leaseback transaction were so re-characterized, we might fail to satisfy the REIT qualification “asset tests” or the “income tests” and, consequently, lose our REIT status effective with the year of re-characterization. Alternatively, such a recharacterization could cause the amount of our REIT taxable income to be recalculated, which might also cause us to fail to meet the distribution requirement for a taxable year and thus lose our REIT status.
We may incur adverse tax consequences if ARCT III, CapLease, ARCT IV or Cole failed to qualify as a REIT for U.S. federal income tax purposes.
The tax years subsequent to and including the fiscal year ended December 31, 2012 remain open to examination by the major taxing jurisdictions to which the OP, the General Partner, American Realty Capital Trust III, Inc. (“ARCT III”), CapLease, Inc. (“CapLease”), American Realty Capital Trust IV, Inc., (“ARCT IV”), Cole Real Estate Investments, Inc. (“Cole”) and Cole Credit Property Trust, Inc. (“CCPT”) are subject. If any of ARCT III, CapLease, ARCT IV, Cole or CCPT failed to qualify as a REIT for U.S. federal income tax purposes at any time prior to such entity’s merger with us, we may inherit significant tax liabilities and could fail to qualify as a REIT.
We may be subject to adverse legislative or regulatory tax changes that could increase our tax liability, reduce our operating flexibility and reduce the market price of our capital stock.
In recent years, numerous legislative, judicial and administrative changes have been made in the provisions of U.S. federal income tax laws applicable to investments similar to an investment in shares of our common stock.Common Stock. Additional changes to the tax laws are likely to continue to occur, and we cannot assure you that any such changes will not adversely affect our taxation and our ability to qualify as a REIT or the taxation of a stockholder. Any such changes could have an adverse effect on an investment in our shares or on the market value or the resale potential of our assets. Our stockholders are urged to consult with their tax advisor with respect to the impact of recent legislation on their investment in our shares and the status of legislative, regulatory or administrative developments and proposals and their potential effect on an investment in our shares.
Although REITs generally receive better tax treatment than entities taxed as regular corporations, it is possible that future legislation would result in a REIT having fewer tax advantages, and it could become more advantageous for a company that invests in real estate to elect to be treated for U.S. federal income tax purposes as a regular corporation. As a result, our charter provides the Board of Directors with the power, under certain circumstances, to revoke or otherwise terminate our REIT election and cause us to be taxed as a regular corporation, without the vote of our stockholders. The Board of Directors has fiduciary duties to us and our stockholders and could only cause such changes in our tax treatment if it determines in good faith that such changes are in the best interest of our stockholders.
In addition, according to publicly released statements, a top legislative priority of the Trump administration and the current Congress may be significant reform of the Internal Revenue Code, including significant changes to taxation of business entities and the deductibility of interest expense. There is a substantial lack of clarity around the likelihood, timing and details of any such tax reform and the impact of any potential tax reform on our business and on the price of our common stock.
Non-U.S. stockholders may be subject to U.S. federal withholding tax and may be subject to U.S. federal income tax upon the disposition of our shares.
Gain recognized by a non-U.S. stockholder upon the sale or exchange of our common stockCommon Stock generally will not be subject to U.S. federal income taxation unless such stock constitutes a “U.S. real property interest” (“USRPI”) under the Foreign Investment in Real Property Tax Act of 1980 (the “FIRPTA”). Our common stockCommon Stock will not constitute a USRPI so long as we are a “domestically-controlled qualified investment entity.” A domestically-controlled qualified investment entity includes a REIT if at all times during a specified testing period, less than 50% in value of such REIT’s stock is held directly or indirectly by non-U.S. stockholders. We believe that we are a domestically-controlled qualified investment entity. However, because our common stockCommon Stock is and will be publicly traded, no assurance can be given that we are or will be a domestically-controlled qualified investment entity.
Even if we do not qualify as a domestically-controlled qualified investment entity at the time a non-U.S. stockholder sells or exchanges our common stock,Common Stock, gain arising from such a sale or exchange would not be subject to U.S. taxation under FIRPTA as a sale of a USRPI if: (a) our common stockCommon Stock is “regularly traded,” as defined by applicable Treasury regulations, on an established
securities market, and (b) such non-U.S. stockholder owned, actually and constructively, 10% or less of our common stockCommon Stock at any time during the five-year period ending on the date of the sale. We anticipate that our shares will be “regularly traded” on an established securities market for the foreseeable future, although, no assurance can be given that this will be the case. We encourage you to consult your tax advisor to determine the tax consequences applicable to you if you are a non-U.S. stockholder.
Our property taxes could increase due to property tax rate changes or reassessment, which would impact our cash flows.
Even if we qualify as a REIT for federal income tax purposes, we will be required to pay some state and local taxes on our properties. The real property taxes on our properties may increase as property tax rates change or as our properties are assessed or reassessed by taxing authorities. Therefore, the amount of property taxes we pay in the future may increase substantially. If the property taxes we pay increase and if any such increase is not reimbursable under the terms of our lease, then our cash flows will be impacted, and our ability to pay expected distributions to our stockholders and unitholders could be adversely affected.
The share ownership restrictions of the Internal Revenue Code for REITs and the 9.8% share ownership limit in our charter may inhibit market activity in our shares of stock and restrict our business combination opportunities.
In order to qualify as a REIT, five or fewer individuals, as defined in the Internal Revenue Code, may not own, actually or constructively, more than 50% in value of our issued and outstanding shares of stock at any time during the last half of each taxable year, other than the first year for which a REIT election is made. Attribution rules in the Internal Revenue Code determine if any individual or entity actually or constructively owns our shares of stock under this requirement. Additionally, at least 100 persons must beneficially own our shares of stock during at least 335 days of a taxable year for each taxable year, other than the first year for which a REIT election is made. To help insure that we meet these tests, among other purposes, our charter restricts the acquisition and ownership of our shares of stock.
Our charter, with certain exceptions, authorizes our directors to take such actions as are necessary and desirable to preserve our qualification as a REIT while we so qualify. Unless exempted by the Board of Directors, for so long as we qualify as a REIT, our charter prohibits, among other limitations on ownership and transfer of shares of our stock, any person from beneficially or constructively owning (applying certain attribution rules under the Internal Revenue Code) more than 9.8% in value of the aggregate of our outstanding shares of stock and more than 9.8% (in value or in number of shares, whichever is more restrictive) of any class or series of our shares of stock. The Board of Directors, in its sole discretion and upon receipt of certain representations and undertakings, may exempt a person (prospectively or retrospectively) from the ownership limits. However, the Board of Directors may not, among other limitations, grant an exemption from these ownership restrictions to any proposed transferee whose ownership, direct or indirect, in excess of the 9.8% ownership limit would result in the termination of our qualification as a REIT. These restrictions on transferability and ownership will not apply, however, if the Board of Directors determines that it is no longer in our best interest to continue to qualify as a REIT or that compliance with the restrictions is no longer required in order for us to continue to so qualify as a REIT. These ownership limits could delay or prevent a transaction or a change in control that might involve a premium price for our common stockCommon Stock or otherwise be in the best interest of our stockholders.
Item 1B. Unresolved Staff Comments.
None.
Item 2. Properties.
Our principalleases primarily consist of corporate offices, areincluding our headquarters located at 2325 E. Camelback Road, Suite 1100,in Phoenix, Arizona 85016. We have additional office space in New York, New York; Orlando, Florida; Alpharetta, Georgia; Austin, Texas; Washington, D.C.; Los Angeles, California; and Glenview, Illinois. We lease all of these offices, other than our office space in Glenview, Illinois, which was acquired in 2013. We believe these properties we own and lease are suitable for our operations for the foreseeable future.
Arizona. As of December 31,
2016,2018, the Company owned
4,1423,994 operating properties comprising
93.395.0 million square feet of retail and commercial space located in 49 states
and Puerto Rico,
and Canada, which includes properties owned through consolidated joint ventures. The rentable space at these properties was
98.3%98.8% leased with a weighted-average remaining lease term of
9.98.9 years. See
Item 7. Management’s Discussion and Analysis of Financial Condition and Results of Operations — Real Estate Portfolio Metrics for a discussion of the properties we hold for rental operations and Schedule III – Real Estate and Accumulated Depreciation for a detailed listing of such properties. Item 3. Legal Proceedings.
The information contained under the heading “Litigation” in “Note 15 –10 – Commitments and Contingencies” to our consolidated financial statements is incorporated by reference into this Part I, Item 3. Except as set forth therein, as of the end of the period covered by this Annual Report on Form 10-K, we are not a party to, and none of our properties are subject to, any material pending legal proceedings.
Item 4. Mine Safety Disclosures.
Not applicable.
PART II
Item 5. Market for Registrant’s Common Equity, Related Stockholder Matters and Issuer Purchases of Equity Securities.
Market Information
Effective July 31, 2015, we transferred the listing of the General Partner’s common stockCommon Stock and Series F Preferred Stock to the NYSE from NASDAQ Global Select Market (“NASDAQ”).Market. The General Partner’s common stockCommon Stock and Series F Preferred Stock trade under the trading symbols “VER” and “VER PRF,” respectively.
Stock Price Performance Graph
Set forth below is a line graph comparing the cumulative total stockholder return on the General Partner’s common stock,Common Stock, based on the market price of the common stockCommon Stock and assuming reinvestment of dividends, with the FTSE National Association of Real Estate Investment Trusts All Equity REITs Index (“FTSE NAREIT All Equity REITs”) and the S&P 500 Index (“S&P 500”) for the period commencing December 31, 20112013 and ending December 31, 2016.2018. The graph assumes an investment of $100 on December 31, 2011.2013.
The graph above and the accompanying text are not “soliciting material,” are not deemed filed with the SEC and are not to be incorporated by reference in any filing by us under the Securities Act or the Exchange Act, whether made before or after the date hereof and irrespective of any general incorporation language in any such filing. In addition, the stock price performance in the graph above is not indicative of future stock price performance.
Stock Price and Distributions
For each quarter indicated,On February 20, 2019, the following table reflects the respective high and low sales prices for the General Partner’s common stock as quoted by NASDAQ or NYSE, as applicable, and the dividend or distribution declared per share of common stock or OP Unit by the General Partner or the Operating Partnership, respectively, in each such period:
|
| | | | | | | | | | | | | | | | | | | | | | | | | | | | | | | | |
| | | First Quarter 2015 (1) | | Second Quarter 2015 (1) | | Third Quarter 2015 | | Fourth Quarter 2015 | | First Quarter 2016 | | Second Quarter 2016 | | Third Quarter 2016 | | Fourth Quarter 2016 |
| High | | $ | 10.38 |
| | $ | 10.15 |
| | $ | 9.08 |
| | $ | 8.66 |
| | $ | 8.92 |
| | $ | 10.14 |
| | $ | 11.09 |
| | $ | 10.35 |
|
| Low | | $ | 8.82 |
| | $ | 8.10 |
| | $ | 7.50 |
| | $ | 7.55 |
| | $ | 6.68 |
| | $ | 8.67 |
| | $ | 9.76 |
| | $ | 7.99 |
|
| | | | | | | | | | | | | | | | | |
Dividends or distributions declared on common stock or OP Units (2) | | $ | — |
| | $ | — |
| | $ | 0.1375 |
| | $ | 0.1375 |
| | $ | 0.1375 |
| | $ | 0.1375 |
| | $ | 0.1375 |
| | $ | 0.1375 |
|
| |
(1) | We agreed to suspend the payment of dividends on the General Partner’s common stock until the Company complied with certain periodic financial reporting and related requirements in connection with the amendments to the Credit Facility. On March 30, 2015, the Company satisfied these periodic financial reporting and related requirements. On August 5, 2015, theCompany’s Board of Directors authorized the reinstatement of a dividend on our common stock. |
| |
(2) | The dividend that the General Partner pays on its common stock is equal to the distributions that the Operating Partnership makes on its OP Units pursuant to the terms of the LPA. However, the Operating Partnership did not make distributions in respect of a substantial portion of the outstanding OP Units held by its limited partners beginning on October 15, 2015 and continuing through January 15, 2017 when the dividend on the General Partner’s common stock was paid, as further discussed in “Note 16 - Equity” in our consolidated financial statements. |
On February 22, 2017, the Company’s board of directors declared a quarterly cash dividend of $0.1375 per share of common stockCommon Stock (equaling an annualized dividend rate of $0.55 per share) for the first quarter of 20172019 to stockholders of record as of March 31, 2017,29, 2019, which will be paid on April 17, 2017.15, 2019. An equivalent distribution by the Operating Partnership is applicable per OP Unit. Our future distributions may vary and will be determined by the General Partner’s Board of Directors based upon the circumstances prevailing at the time, including our financial condition, operating results, estimated taxable income and REIT distribution requirements, and may be adjusted at the discretion of the Board.Board of Directors.
As of February 22, 2017,19, 2019, the General Partner had approximately 4,2003,441 registered stockholders of record of its common stock.Common Stock. This figure does not reflect the beneficial ownership of shares held in nominee name. There is no established trading market for the Operating Partnership's OP Units. As of February 22, 2017,19, 2019, there were 2926 record holders of the OP Units.
Recent Sales of Unregistered Securities
During 2018, the year ended December 31, 2016, the Company redeemed 15,450General Partner issued an aggregate of 32,439 shares of Common Stock in redemption of 32,439 Limited Partner OP Units for shares of(which refers to OP Units issued to parties other than the General Partner's common stock.Partner). These shares of common stockCommon Stock were issued in reliance on an exemption from registration under Section 4(a)(2) of the Securities Act. We relied on the exemption under Section 4(a)(2) based upon factual representations received from the limited partner who received the shares of common stock.Common Stock.
Securities Authorized for Issuance Under Equity Compensation Plans
The following table shows the amount of securities remaining available for future issuance under our equity compensation plans as of December 31, 2016:2018:
|
| | | | | | | | | |
Plan Category | | Number of securities to be issued upon exercise of outstanding options, warrants and rights | | Weighted-average exercise price of outstanding options, warrants and rights | | Securities Available For Future Issuance Under Equity Compensation Plans (1)
|
Equity compensation plans approved by security holders | | — |
| | — |
| | 92,059,754 |
|
Equity compensation plans not approved by security holders | | — |
| | — |
| | — |
|
Total | | — |
| | — |
| | 92,059,754 |
|
|
| | | | | | | | | | |
| Plan Category | | Number of securities to be issued upon exercise of outstanding options, warrants and rights (a) | | Weighted-average exercise price of outstanding options, warrants and rights (b) | | Securities Available For Future Issuance Under Equity Compensation Plans (1) (excluding securities reflected in column (a)) (c) |
| Equity compensation plans approved by security holders | | 2,763,165 |
| | $ | 6.84 |
| | 89,395,172 |
|
| Equity compensation plans not approved by security holders | | — |
| | — |
| | — |
|
| Total | | 2,763,165 |
| | $ | 6.84 |
| | 89,395,172 |
|
| |
| (1) | TheRepresents the total number of shares of common stockCommon Stock reserved for the issuance of equity incentive awards under our equity-based compensation plans. Shares available under the Equity Plan isare equal to 10.0% of the total number of issued and outstanding shares of our common stockCommon Stock (on a fully diluted basis assuming the redemption of all OP Units for shares of common stock)Common Stock) at any time. As such, the number of shares available for issuance under the Equity Plan changes automatically with changes in the total number of outstanding shares of common stock,Common Stock, outstanding OP Units, and dilutive securities. See “Note 1712 – Equity-based Compensation” to our consolidated financial statements for a discussion of the Company’s equityequity-based compensation plans.
|
Repurchases of Equity Securities
|
| | | | | | | |
| Period | | Total Number of Shares/ Units Purchased (1) | | Average Price Paid Per Share/Unit (2) |
| October 1, 2018 - October 31, 2018 | | 16,538 |
| | $ | 7.16 |
|
| November 1, 2018 - November 30, 2018 | | — |
| | — |
|
| December 1, 2018 - December 31, 2018 | | — |
| | — |
|
| Total | | 16,538 |
| | $ | 7.16 |
|
| |
| (1) | We are authorized to repurchase shares of the General Partner’s Common Stock to satisfy employee withholding tax obligations related to equity-based compensation. During the fourth quarter of 2018, the General Partner and the Operating Partnership repurchased shares of Common Stock and corresponding OP Units that were issued to the General Partner, respectively, in order to satisfy the minimum tax withholding obligation for state and federal payroll taxes on employee restricted shares. |
| |
| (2) | The price paid per share/unit is based on the weighted average closing price on the respective vesting date. |
On May 12, 2017, the Company’s Board of Directors authorized the repurchase of up to $200.0 million of the General Partner’s common stockoutstanding shares of Common Stock over 12 months from the date of authorization, as market conditions warranted, under the 2017 Share Repurchase Program. On May 3, 2018, the Company’s Board of Directors terminated the 2017 Share Repurchase Program and authorized the 2018 Share Repurchase Program that permits the Company to satisfy employee withholding tax obligations relatedrepurchase up to stock-based compensation.$200.0 million of its outstanding Common Stock through May 3, 2019, as market conditions warrant. The 2018 Share Repurchase Program has similar terms as the 2017 Share Repurchase Program. During the year ended December 31, 2016,2018, the General Partner and the Operating PartnershipCompany repurchased the followingapproximately 6.4 million shares of common stockCommon Stock in multiple open market transactions for $44.6 million as part of the 2017 Share Repurchase Program and corresponding OP Units that were issuedapproximately 0.8 million shares of Common Stock in multiple open market transactions for $5.6 million as part of the 2018 Share Repurchase Program. None of the share repurchases under the 2018 Share Repurchase Program occurred during the fourth quarter of 2018. As of December 31, 2018, the Company had $194.4 million available for share repurchases under the 2018 Share Repurchase Program. Additional shares of Common Stock repurchased by the Company under the 2018 Share Repurchase Program, if any, will be returned to the General Partner, respectively, in order to satisfy the minimum tax withholding obligation for state and federal payroll taxes on employee stock awards:status of authorized but unissued shares of Common Stock.
|
| | | | | | | |
| Period | | Total Number of Shares/ Units Purchased | | Average Price Paid Per Share/Unit (1) |
| January 1, 2016 - January 31, 2016 | | 40,714 |
| | $ | 7.52 |
|
| February 1, 2016 - February 29, 2016 | | 42,316 |
| | 7.30 |
|
| March 1, 2016 - March 31, 2016 | | 42,126 |
| | 8.55 |
|
| April 1, 2016 - April 30, 2016 | | 1,391 |
| | 8.95 |
|
| May 1, 2016 - May 31, 2016 | | 2,434 |
| | 9.89 |
|
| June 1, 2016 - June 30, 2016 | | — |
| | — |
|
| July 1, 2016 - July 31, 2016 | | 18,991 |
| | 10.17 |
|
| August 1, 2016 - August 31, 2016 | | — |
| | — |
|
| September 1, 2016 - September 30, 2016 | | 552 |
| | 10.45 |
|
| October 1, 2016 - October 31, 2016 | | 25,996 |
| | 9.65 |
|
| November 1, 2016 - November 30, 2016 | | 2,081 |
| | 8.86 |
|
| December 1, 2016 - December 31, 2016 | | 25,141 |
| | 8.53 |
|
| Total | | 201,742 |
| | $ | 8.40 |
|
(1) With respect to these shares/units, the price paid per share/unit is based on the weighted average closing price on the respective vesting date.
Item 6. Selected Financial Data.
The following selected financial data should be read in conjunction with the accompanying consolidated financial statements and related notes thereto and “ItemItem 7. Management’s Discussion and Analysis of Financial Condition and Results of Operations”Operations appearing elsewhere in this Annual Report on Form 10-K. Prior periods have been reclassified to conform to current presentation, as discussed in “Note 2 – Summary of Significant Accounting Policies”Policies to our consolidated financial statements. The selected financial data (in thousands, except share and per share amounts) presented below was derived from our consolidated financial statements:
| | | | | December 31, | | December 31, |
| | | 2016 | | 2015 | | 2014 (1) | | 2013 | | 2012 | | 2018 | | 2017 | | 2016 | | 2015 | | 2014 |
| Balance sheet data: | | | | | | | | | | | | | | | | | | | | |
| Total real estate investments, at cost | | $ | 15,584,442 |
| | $ | 16,784,721 |
| | $ | 18,292,560 |
| | $ | 7,459,142 |
| | $ | 1,875,615 |
| | $ | 15,604,839 |
| | $ | 15,615,375 |
| | $ | 15,584,442 |
| | $ | 16,784,721 |
| | $ | 18,292,560 |
|
| Total assets | | $ | 15,587,574 |
| | $ | 17,405,866 |
| | $ | 20,427,136 |
| | $ | 7,747,494 |
| | $ | 2,168,429 |
| | $ | 13,963,493 |
| | $ | 14,705,578 |
| | $ | 15,587,574 |
| | $ | 17,405,866 |
| | $ | 20,427,136 |
|
| Total debt, net | | $ | 6,367,248 |
| | $ | 8,059,802 |
| | $ | 10,425,778 |
| | $ | 4,136,619 |
| | $ | 375,956 |
| | $ | 6,087,922 |
| | $ | 6,073,444 |
| | $ | 6,367,248 |
| | $ | 8,059,802 |
| | $ | 10,425,778 |
|
| Total liabilities | | $ | 6,968,041 |
| | $ | 8,691,907 |
| | $ | 11,044,806 |
| | $ | 5,248,967 |
| | $ | 499,669 |
| | $ | 6,663,349 |
| | $ | 6,662,702 |
| | $ | 6,968,041 |
| | $ | 8,691,907 |
| | $ | 11,044,806 |
|
| Temporary equity | | $ | — |
| | $ | — |
| | $ | — |
| | $ | 269,299 |
| | $ | — |
| |
| Total equity | | $ | 8,619,533 |
| | $ | 8,713,959 |
| | $ | 9,382,330 |
| | $ | 2,229,228 |
| | $ | 1,668,760 |
| | $ | 7,300,144 |
| | $ | 8,042,876 |
| | $ | 8,619,533 |
| | $ | 8,713,959 |
| | $ | 9,382,330 |
|
| | | | | | | | | | | | | | | | | | | | | |
| | | Year Ended December 31, | | Year Ended December 31, |
| | | 2016 | | 2015 | | 2014 (1) | | 2013 (1) | | 2012 | | 2018 | | 2017 | | 2016 | | 2015 | | 2014 |
| Operating data: | | | | | | | | | | | | | | | | | | | | |
| Total revenues | | $ | 1,454,823 |
| | $ | 1,556,017 |
| | $ | 1,579,257 |
| | $ | 329,323 |
| | $ | 67,207 |
| |
| Total operating expenses | | 1,401,352 |
| | 1,488,692 |
| | 1,949,835 |
| | 663,067 |
| | 97,822 |
| |
| Operating income (loss) | | 53,471 |
|
| 67,325 |
|
| (370,578 | ) |
| (333,744 | ) |
| (30,615 | ) | |
| Total other expenses, net | | (303,520 | ) | | (354,809 | ) | | (396,567 | ) | | (171,876 | ) | | (10,877 | ) | |
| Gain (loss) on disposition of real estate and held for sale assets, net | | 45,524 |
| | (72,311 | ) | | (277,031 | ) | | — |
| | — |
| |
| Benefit from (provision for) income taxes | | 3,701 |
| | 36,303 |
| | 33,264 |
| | (2,195 | ) | | — |
| |
| Loss from continuing operations | | (200,824 | ) |
| (323,492 | ) |
| (1,010,912 | ) |
| (507,815 | ) |
| (41,492 | ) | |
| Net loss from discontinued operations | | — |
| | — |
| | — |
| | — |
| | (745 | ) | |
| Net loss | | (200,824 | ) |
| (323,492 | ) |
| (1,010,912 | ) |
| (507,815 | ) |
| (42,237 | ) | |
Net loss attributable to non-controlling interests(2) | | 4,961 |
| | 7,139 |
| | 33,727 |
| | 16,316 |
| | 585 |
| |
| Net loss attributable to General Partner | | $ | (195,863 | ) |
| $ | (316,353 | ) |
| $ | (977,185 | ) |
| $ | (491,499 | ) |
| $ | (41,652 | ) | |
| Rental revenue | | | $ | 1,257,867 |
| | $ | 1,252,285 |
| | $ | 1,335,447 |
| | $ | 1,441,135 |
| | $ | 1,375,699 |
|
Litigation, merger and other non-routine costs, net of insurance recoveries (1) | | | 290,963 |
| | 47,960 |
| | 3,884 |
| | 33,628 |
| | 199,685 |
|
| Impairments | | | 54,647 |
| | 50,548 |
| | 182,820 |
| | 91,755 |
| | 100,547 |
|
| Total other operating expenses | | | 834,644 |
| | 897,524 |
| | 959,714 |
| | 1,025,962 |
| | 1,116,266 |
|
| Total gain (loss) on dispositions and assets held for sale | | | 94,331 |
| | 61,536 |
| | 45,524 |
| | (72,311 | ) | | (277,031 | ) |
| Interest and other expenses, net | | | (258,568 | ) | | (259,412 | ) | | (304,304 | ) | | (351,882 | ) | | (398,947 | ) |
| Provision for income taxes | | | (5,101 | ) | | (6,882 | ) | | (7,136 | ) | | (4,589 | ) | | (7,313 | ) |
| (Loss) income from continuing operations | | | (91,725 | ) |
| 51,495 |
| | (76,887 | ) | | (138,992 | ) | | (724,090 | ) |
Income (loss) from discontinued operations, net of income taxes (2) | | | 3,695 |
| | (19,117 | ) | | (123,937 | ) | | (184,500 | ) | | (286,822 | ) |
| Net (loss) income | | | (88,030 | ) |
| 32,378 |
| | (200,824 | ) | | (323,492 | ) | | (1,010,912 | ) |
Net loss (income) attributable to non-controlling interests (3) | | | 2,256 |
| | (560 | ) | | 4,961 |
| | 7,139 |
| | 33,727 |
|
| Net (loss) income attributable to General Partner | | | $ | (85,774 | ) |
| $ | 31,818 |
| | $ | (195,863 | ) | | $ | (316,353 | ) | | $ | (977,185 | ) |
| | | | | | | | | | | | | | | | | | | | | |
| Cash flow data: | | | | | | | | | | | | | | | | | | | | |
| Net cash flows provided by operating activities | | $ | 800,528 |
| | $ | 867,013 |
| | $ | 502,887 |
| | $ | 11,918 |
| | $ | 9,440 |
| | $ | 493,914 |
| | $ | 793,267 |
| | $ | 797,948 |
| | $ | 859,695 |
| | $ | 502,887 |
|
| Net cash flows provided by (used in) investing activities | | $ | 890,193 |
| | $ | 932,595 |
| | $ | (2,554,456 | ) | | $ | (4,541,718 | ) | | $ | (1,701,422 | ) | | $ | 151,119 |
| | $ | (274,106 | ) | | $ | 881,637 |
| | $ | 941,417 |
| | $ | (2,527,726 | ) |
| Net cash flows (used in) provided by financing activities | | $ | (1,503,372 | ) | | $ | (2,147,216 | ) | | $ | 2,415,555 |
| | $ | 4,289,950 |
| | $ | 1,965,226 |
| | $ | (655,406 | ) | | $ | (756,595 | ) | | $ | (1,506,985 | ) | | $ | (2,151,604 | ) | | $ | 2,415,555 |
|
| | | | | | | | | | | | | | | | | | | | | |
| Per share data: | | | | | | | | | | | | | | | | | | | | |
| Basic and diluted net loss per share from continuing operations attributable to common stockholders | | $ | (0.29 | ) | | $ | (0.43 | ) | | $ | (1.36 | ) | | $ | (2.41 | ) | | $ | (0.40 | ) | | $ | (0.17 | ) | | $ | (0.02 | ) | | $ | (0.16 | ) | | $ | (0.23 | ) | | $ | (1.01 | ) |
| Basic and diluted net loss per share attributable to common stockholders | | $ | (0.29 | ) | | $ | (0.43 | ) | | $ | (1.36 | ) | | $ | (2.41 | ) | | $ | (0.41 | ) | |
Weighted-average number of shares of common stock outstanding - basic (3) | | 931,422,844 |
| | 903,360,763 |
| | 793,150,098 |
| | 205,341,431 |
| | 103,306,366 |
| |
| Basic and diluted net income (loss) per share from discontinued operations attributable to common stockholders | | | 0.00 |
| | (0.02 | ) | | (0.13 | ) | | (0.20 | ) | | (0.35 | ) |
Basic and diluted net loss per share attributable to common stockholders (4) | | | $ | (0.16 | ) | | $ | (0.04 | ) | | $ | (0.29 | ) | | $ | (0.43 | ) | | $ | (1.36 | ) |
Weighted-average number of shares of Common Stock outstanding - basic (5)(6) | | | 969,092,268 |
| | 974,098,652 |
| | 931,422,844 |
| | 903,360,763 |
| | 793,150,098 |
|
| Cash dividends declared per common share | | $ | 0.55 |
| | $ | 0.28 |
| | $ | 1.08 |
| | $ | 0.91 |
| | $ | 0.89 |
| | $ | 0.55 |
| | $ | 0.55 |
| | $ | 0.55 |
| | $ | 0.28 |
| | $ | 1.08 |
|
| |
| (1) | See “Note 6 – Mergers with Real Estate Businesses” to our consolidated financial statements for discussionThe Company's operations were impacted by litigation and investigations prompted by the results of the impact ofAudit Committee Investigation beginning in 2014 through 2018 and significant mergers onduring 2014. During 2018, the Company’s operations during these periods.
Company expensed litigation settlement costs of $233.2 million. |
| |
| (2) | On February 1, 2018, the Company completed the sale of its investment management segment, Cole Capital. Substantially all of the Cole Capital segment is reflected in the financial statements as discontinued operations. |
| |
| (3) | Represents income or loss attributable to limited partners and consolidated joint venture partners. |
| |
(3)(4) | Amounts may not total due to rounding. |
| |
| (5) | For all periods presented, the effect of certain OP Units outstanding, long-term incentive plan units of the Operating Partnership (“LTIP Units”), unvested restricted shares or units, stock options, OP Units outstanding and convertible preferred shares were excluded from the weighted-average share calculation as the effect would be anti-dilutive.antidilutive. |
| |
| (6) | For 2014, the effect of long-term incentive plan units of the OP was also excluded from the weighted-average share calculation as the effect would be antidilutive. |
Item 7. Management’s Discussion and Analysis of Financial Condition and Results of Operations.
The following discussion and analysis should be read in conjunction with the accompanying consolidated financial statements and notes thereto appearing elsewhere in this Annual Report on Form 10-K. We make statements in this section that are forward-looking statements within the meaning of the federal securities laws. For a complete discussion of forward-looking statements, see the section in this report entitled “Forward-Looking“Forward-Looking Statements.” Certain risks may cause our actual results, performance or achievements to differ materially from those expressed or implied by the following discussion. For a discussion of such risk factors, see the section in this report entitled “Risk Factors.“Risk Factors.” Overview
We areVEREIT is a full-service real estate operating company that operates through two business segments, our real estate investment segment, REI,which owns and our investment management segment, Cole Capital, as further discussedmanages one of the largest portfolios of single-tenant commercial properties in “Note 3 – Segment Reporting” to our consolidated financial statements. Through our REI segment, we own and actively manage a diversified portfolio of 4,142the U.S. The Company has 3,994 retail, restaurant, office and industrial real estateoperating properties with an aggregate of 93.395.0 million square feet, of which 98.3%98.8% was leased as of December 31, 2016,2018, with a weighted-average remaining lease term of 9.98.9 years. Through ourOn February 1, 2018, the Company completed the sale of its investment management segment, Cole Capital. The assets, liabilities and related financial results of substantially all of the Cole Capital segment we are responsible for raising capital for and managingreflected in the affairs of the Cole REITs on a day-to-day basis, identifying and making acquisitions and investments on behalf of the Cole REITs, and recommending to the respective board of directors of each of the Cole REITs an approach for providing investors with liquidity. Cole Capital receives compensation and reimbursement for performing these services. As of December 31, 2016, the Cole REITs and other real estate programs’ assets under management were $7.3 billion.
Mergers and Major Acquisitions
See “Note 6 – Mergers with Real Estate Businesses” to our consolidated financial statements for a discussion of the mergers consummated during the year ended December 31, 2014 with American Realty Capital Trust IV, Inc. and Cole Real Estate Investments, Inc.as discontinued operations.
Our Business Environment and Current Outlook
Current conditions in the global capital markets remain volatile as the world’s economic growth has been affected by geopolitical and economic events. In addition, there is uncertainty surrounding the policy stance of the new U.S. administration and its global ramifications. In the United States, the overall economic environment continued to improve in 2016. During 2016, the U.S. real gross domestic product increased 1.6% to $16.66 trillion, the unemployment rate decreased 0.3 percentage points to 4.7%, and Core CPI, a measure of inflation which removes food & energy prices and is seasonally adjusted, increased 2.2%, as compared to the same period a year earlier.
Economic trends and government policies affect global and regional commercial real estate markets as well as our operations directly. These include: overall economic activity and employment growth, interest rate levels, the cost and availability of credit and the impact of tax and regulatory policies.
Critical Accounting Policies and Significant Accounting Estimates
Our accounting policies have been established to conform with U.S. GAAP. The preparation of financial statements in conformity with U.S. GAAP requires us to use judgment in the application of accounting policies, including making estimates and assumptions. These judgments affect the reported amounts of assets and liabilities and disclosure of contingent assets and liabilities at the dates of the financial statements and the reported amounts of revenue and expenses during the reporting periods. Management believes that we have made these estimates and assumptions in an appropriate manner and in a way that accurately reflects our financial condition. We continually test and evaluate these estimates and assumptions using our historical knowledge of the business, as well as other factors, to ensure that they are reasonable for reporting purposes. However, actual results may differ from these estimates and assumptions. If our judgment or interpretation of the facts and circumstances relating to the various transactions had been different, it is possible that different accounting policies would have been applied, thus resulting in a different presentation of the financial statements. Additionally, other companies may utilize different assumptions or estimates that may impact comparability of our results of operations to those of companies in similar businesses. We believe the following critical accounting policies govern the significant judgments and estimates used in the preparation of our financial statements, which should be read in conjunction with the more complete discussion of our accounting policies and procedures included in “Note 2 – Summary of Significant Accounting Policies”Policies to our consolidated financial statements.
Loss Contingencies
The Company records a liability in the consolidated financial statements for loss contingencies when a loss is known or considered probable and the amount is reasonably estimable. We review these matters on a quarterly basis. If the reasonable estimate of a known or probable loss is a range, and no amount within the range is a better estimate than any other, the minimum amount of the range is accrued. If a material loss is reasonably possible but not known or probable, and the amount is reasonably estimable, the estimated loss or range of loss is disclosed. The risks and uncertainties involved in applying the principles related to estimating loss contingencies include, but are not limited to, the following:
Litigation outcomes are inherently unpredictable and are often resolved over long periods of time.
Estimating probable and reasonably possible losses requires the analysis of multiple possible outcomes that often depend on judgments about potential actions by third parties, future changes in facts and circumstances, differing interpretations of the law, assessments of the amount of damages, and other factors beyond our control. There is the potential for a material adverse effect on our financial statements if one or more matters are resolved in a particular period in an amount materially in excess of what we anticipated.
We do not recognize insurance recoveries until any contingencies relating to the insurance recovery claim have been resolved.
See Note 10 – Commitments and Contingencies for additional information.
Goodwill Impairment
We evaluate goodwill for impairment annually or more frequently when an event occurs or circumstances change that indicate the carrying value by reporting unit, may not be recoverable. The risks and uncertainties involved in applying the principles related to goodwill impairment include, but are not limited to, the following:
We estimate the fair value of the reporting units, which we have determined is the same as our reportable segments, using discounted cash flows and relevant competitor multiples.
We monitor factors that may impact the fair value including market comparable company multiples, interest rates and global economic conditions.
We use a combined income and market approach in evaluations for potential impairment, which requires management to make key assumptions related to revenue growth rate, cash flow assumptions, discount rate and selection of comparable companies.
See Note 10 – Fair Value Measures for discussion regarding our sensitivity analysis performed around these assumptions.
Intangible Asset Impairment
The Company evaluates intangible assetsperformed its annual test of goodwill for impairment whenand determined an event occurs or circumstances change that indicateestimated fair value of $15.2 billion, $15.1 billion and $18.3 billion at the 2018, 2017, and 2016 measurement dates, respectively, which exceeded the carrying value may not be recoverable. The risksvalues by 13.4%, 8.1% and uncertainties involved21.0%, respectively. As such, no goodwill impairment was recorded during the years ended December 31, 2018, 2017 or 2016 in applying(loss) income from continuing operations. If all other assumptions were held constant, increasing the principles related to intangible impairment include, but are not limited to,discount rate by 0.5% would decrease the following:
We estimateamount that the 2018 fair value using a discounted cash flow model specificexceeds the 2018 carrying value from $1.8 billion to the applicable Cole REITs.
We monitor factors that could impact fair value including the ability to timely reinstate certain selling agreements, timing of and aggregate capital raised and deployed on behalf of the Cole REITs, the actual timing of closing an offering or executing a liquidity event on behalf of a Cole REIT and operations of future managed real estate programs.
We utilized the income approach in evaluation for impairment, which requires management to make key assumptions related to future cash flows and a discount rate.
See Note 10 – Fair Value Measures for discussion regarding our sensitivity analysis performed around these assumptions.$1.0 billion.
Real Estate Investment Impairment
We invest in real estate assets and subsequently monitor those investments quarterly for impairment, including the review of real estate properties subject to direct financing leases. Additionally, we record depreciation and amortization related to our investments. The risks and uncertainties involved in applying the principles related to real estate investments include, but are not limited to, the following:
The estimated useful lives of our depreciable assets affectsaffect the amount of depreciation and amortization recognized on our investments.
The review of impairment indicators and subsequent determination of the undiscounted future cash flows could require us to reduce the value of assets and recognize an impairment loss.
The fair value of held for sale assets is estimated by management. This estimated value could result in a reduction of the carrying value of the asset.
The evaluation of real estate assets for potential impairment requires the Company’s management to exercise significant judgment and make certain key assumptions. There are inherent uncertainties in making these estimates such as market conditions and performance and sustainability of the Company’s tenants.
Changes in assumptions based on actual resultsrelated to management’s intent to sell or lease the real estate assets used to develop the forecasted cash flows may have a material impact on the Company’s financial results.
Loans Held for Investment Impairment
We evaluate loans held for investment on a quarterly basis. As a first step in the notes receivable impairment process, we must determine, based on current information and events, if it is probable that we will be unable to collect the amounts due in accordance with the loan agreement. The risks and uncertainties involved in applying the principles related to notes receivable include, but are not limited to, the following:
Evaluating the financial condition and other current obligations of the borrower involves judgment in assessing their liquidity and financial stability.
Program Development Costs
We assess the collectability of the program development costs, considering the offering period and historical and forecasted sales of shares under the Cole REITs’ respective offerings and reserve for any balances considered not collectible. Additional reserves are generally recorded if actual proceeds raised from the offerings and corresponding program development costs incurred differ from management’s assumptions. The risks and uncertainties involved in applying the principles related to program development costs include, but are not limited to, the following:
Estimating recoverability for each program which involves an analysis of expected reimbursement revenue and projected organization and offering costs.
Utilizing assumptions to calculate impairment charges related to goodwill and impairment, as discussed above.
Assessing the impact of the change in calculations of recoverability percentages.
Consolidation of Equity Investments
We hold equity investments in unconsolidated joint ventures and each of the Cole REITs and account for these investments using the equity method of accounting as we have the ability to exercise significant influence, but not control, over operating and financial policies of these investments. We must continually evaluate these and other non-controlling interests for consolidation based on standards set forth in U.S. GAAP. For legal entities being evaluated, we must first determine whether the interests that we hold and fees we receive qualify as variable interests in the entity, as discussed in “Note 2 – Summary of Significant Accounting Policies” to our consolidated financial statements. The difference between consolidating the VIE and accounting for it using the equity method could be material to the Company’s consolidated financial statements. The risks and uncertainties involved in applying the principles related to equity investments include, but are not limited to, the following:
Consideration for variable interest entities involves determining their ability to finance their operations without additional subordinated financial support, whether the equity holders lack the characteristic of controlling financial interest, or whether the entity is established with non-substantive voting rights.
We perform significance calculations based on investments, total assets and income, on an individual basis or on an aggregated basis, by any combination of unconsolidated subsidiaries and equity-method investees.
Allocation of Purchase Price of Business Combinations, including Acquired PropertiesReal Estate Assets
In connection with our acquisition of properties, we allocate the purchase price to the tangible and intangible assets and
liabilities acquired based on their respective estimated fair values. Tangible assets consist of land, buildings, fixtures and tenant improvements. Intangible assets consist of above- and below- market lease values and the value of in-place leases. Our purchase price allocations are developed utilizing third-party appraisal reports, industry standards and management experience. The risks and uncertainties involved in applying the principles related to purchase price allocations include, but are not limited to, the following:
The value allocated to land as opposed to buildings, fixtures and tenant improvements affects the amount of depreciation expense we record. If more value is attributed to land, depreciation expense is lower than if more value is attributed to buildings, fixtures and tenant improvements;
Intangible lease assets and liabilities can be significantly affected by estimates, including market rent, lease term including renewal options at rental rates below estimated market rental rates, carrying costs of the property during a hypothetical expected lease-up period, and current market conditions and costs, including tenant improvement allowances and rent concessions; and
We determine whether any financing assumed is above- or below- market based upon comparison to similar financing terms for similar investment properties.
Income Taxes
As a REIT, the General Partner generally is not subject to federal income tax on taxable income that it distributes to its shareholders as long as it distributes at least 90% of its annual taxable income (computed without regard to the deduction for dividends paid and excluding net capital gains), with the exception of its TRS entities. However, the General Partner, including its TRS entities, and the Operating Partnership are still subject to certain state and local income and franchise taxes in the various jurisdictions in which they operate.
We provide for income taxes in accordance with current authoritative accounting and tax guidance. The tax provision or benefit related to significant or unusual items is recognized in the quarter in which those items occur. In addition, the effect of changes in enacted tax laws, rates or tax status is recognized in the quarter in which the change occurs. The risks and uncertainties involved in applying the principles related to income taxes include, but are not limited to, the following:
Our calculations related to income taxes contain uncertainties due to judgment used to calculate tax liabilities in the application of complex tax laws and regulations across the tax jurisdictions where we operate;
We file income tax returns in the U.S. federal jurisdiction, the Canadian federal jurisdiction and various state and local jurisdictions, and are subject to routine examinations by the respective tax authorities. We may be challenged upon review by the applicable taxing authorities, and positions we have taken may not be sustained; and
The accounting estimates used to compute the provision for or benefit from income taxes may change as new events occur, additional information is obtained or the tax environment changes.
Recently Issued Accounting Pronouncements
Recently issued accounting pronouncements are described in “Note 2 – Summary of Significant Accounting Policies” to our consolidated financial statements.
Operating Highlights and Key Performance Indicators
20162018 Activity
Acquired controlling financial interests in eight52 commercial properties, including one land parcel for build-to-suit development, for an aggregate purchase price of $100.2 million.$502.7 million, which includes $2.6 million of external acquisition-related expenses that were capitalized.
Disposed of 301 149 properties and one property owned by an unconsolidated joint venture for an aggregate sales price of $1.20 billion,$560.5 million, of which ourthe Company’s share was $1.14 billion,$521.4 million, resulting in consolidated proceeds of $1.00 billion$502.3 million after closing costs, $55.0 millionrepayment of debt assumptions and $57.0 million of debt repayments by the unconsolidated joint venture.venture’s mortgage loan and closing costs. We recorded an aggregate gain of $96.9 million related to these sales.
Sold substantially all of Cole Capital for approximately $120.0 million in cash.
Entered into settlement agreements with various plaintiffs in connection with litigation filed as a result of the findings of the Audit Committee Investigation for $217.5 million. The Company also entered into settlement agreements for $15.7 million subsequent to December 31, 2018, which was accrued and included in litigation, merger and other non-routine costs, net of insurance recoveries in the consolidated statements of operations for the year ended December 31, 2018.
On May 23, 2018, entered into the Credit Agreement which allows for maximum borrowings of $2.9 billion, consisting of a $2.0 billion Revolving Credit Facility and a $900.0 million Credit Facility Term Loan. In connection with entering into the Credit Agreement, the existing 2014 Credit Agreement was terminated.
On August 1, 2018, the Company’s 2018 Convertible Notes matured and the principal outstanding balance of $597.5 million, plus accrued and unpaid interest thereon, was repaid with proceeds from the Revolving Credit Facility.
On October 16, 2018, the Company closed a senior note offering, consisting of $550.0 million aggregate principal amount of the OP’s 4.625% Senior Notes due 2025. The OP used the net proceeds from the offering of the notes to repay borrowings under its Revolving Credit Facility.
Closed on a public offeringTotal secured debt decreased by$153.9 million, from $2.1 billion to sell 69.0$1.9 billion.
Repurchased approximately 6.4 million shares of common stock,Common Stock in multiple open market transactions, at a weighted average share price of $6.94, for an aggregate purchase price of $44.6 million, as defined in Note 1 – Organization, for net proceeds, after underwriting discountspart of the 2017 Share Repurchase Program and offering costs, of $702.5 million.
Closed the 2016 Bond Offering of $1.0 billion and entered into a $300.00.8 million 2016 Term Loan, as defined in Note 11 –Debt, to the consolidated financial statements, which was subsequently repaid.
Registered a continuous offering program allowing for the issuance of up to $750.0 million in shares of common stock over three years.
Total debt decreased by $1.7 billion, from $8.1 billion to $6.4 billion, comprisedCommon Stock in multiple open market transactions, at a weighted average share price of unsecured bonds$6.95 for an aggregate purchase price of $0.3 billion, unsecured Credit Facility$5.6 million, as part of $1.0 billion, and secured debt of $0.4 billion.the 2018 Share Repurchase Program.
Declared a quarterly dividend of $0.1375 per share of common stockCommon Stock for each quarter of 2016,2018, representing an annualized dividend rate of $0.55 per share.
Real Estate Portfolio Metrics
In managing our portfolio, we are committed to diversification by property type, tenant, geography and industry. Below is a summary of our operating property type diversification and our top ten concentrations as of December 31, 2016,2018, based on annualized rental income of $1.2 billion for the year ended December 31, 2016.billion.
Our financial performance is influenced by the timing of acquisitions and dispositions and the operating performance of our real estate properties. The following table shows the property statistics of our real estate assets,operating properties, excluding properties owned through our unconsolidated joint ventures, as of December 31, 2016, 20152018, 2017 and 2014:2016:
| |
| | 2016 | | 2015 | | 2014 | | 2018 | | 2017 (1) | | 2016 |
| Portfolio Metrics | | |
| Properties owned | | 4,142 | | 4,435 | | 4,648 | |
| Operating properties | | | 3,994 | | 4,091 | | 4,142 |
| Rentable square feet (in millions) | | 93.3 | | 99.6 | | 103.1 | | 95.0 | | 94.4 | | 93.3 |
Economic occupancy rate (1)(2) | | 98.3% | | 98.6% | | 99.3% | | 98.8% | | 98.8% | | 98.3% |
Investment-grade tenants (2)(3) | | 41.2% | | 42.5% | | 46.9% | | 41.9% | | 39.6% | | 41.2% |
| |
| (1) | Omits the impact, if any, of the Excluded Properties. |
| |
| (2) | Economic occupancy rate equals the sum of square feet leased (including month-to-month)space subject to month-to-month agreements) divided by total square feet. |
| |
(2)(3) | Investment-grade tenants are those with a credit rating of BBB- or higher by Standard & Poor’s RatingFinancial Services LLC or a credit rating of Baa3 or higher by Moody’s Investor Service, Inc. The ratings may reflect those assigned by Standard & Poor’s RatingFinancial Services LLC or Moody’s Investor Service, Inc. to the lease guarantor or the parent company, as applicable. |
The following table shows the economic metrics of our real estate assets,operating properties, excluding properties owned through our unconsolidated joint ventures, as of and for the years ended December 31, 2016, 20152018, 2017 and 2014:2016:
| | | | | 2016 | | 2015 | | 2014 | | 2018 | | 2017 (1) | | 2016 |
| Economic Metrics | | |
Weighted-average lease term (in years) (1)(2) | | 9.9 | | 10.6 | | 11.8 | | 8.9 | | 9.5 | | 9.9 |
Lease rollover (1)(2): | | |
Lease rollover: (2)(3) | | |
| Annual average | | 4.3% | | 3.8% | | 3.2% | | 5.5% | | 4.8% | | 4.3% |
| Maximum for a single year | | 7.4% | | 4.5% | | 4.3% | | 7.2% | | 7.3% | | 7.4% |
| |
| (1) | Omits the impact, if any, of the Excluded Properties. |
| |
| (2) | Based on annualized rental income of our real estate portfolio as of the respective reporting date. |
| |
(2)(3) | Through the end of the next five years measured as of the end of eachrespective reporting period.date. |
Operating Performance
In addition, management uses the following financial metrics of our business segments to assess our operating performance (dollar amounts in thousands, except per share amounts). Data presented includes both continuing operations, which primarily represent the Company's real estate operations, and discontinued operations, which represent substantially all of Cole Capital, except as otherwise indicated.
|
| | | | | | | | | | | | |
| | | Year Ended December 31, |
| | | 2016 | | 2015 | | 2014 |
| Financial Metrics | | | | | | |
| Real Estate Investment Segment | | | | | | |
| Revenues | | $ | 1,335,447 |
| | $ | 1,441,135 |
| | $ | 1,375,699 |
|
| Operating income (loss) | | $ | 195,479 |
| | $ | 297,080 |
| | $ | (30,706 | ) |
| Net loss | | $ | (69,373 | ) | | $ | (136,095 | ) | | $ | (714,238 | ) |
Funds from operations attributable to common stockholders and limited partners (“FFO”) (1) | | $ | 744,867 |
| | $ | 772,563 |
| | $ | 445,810 |
|
Adjusted funds from operations attributable to common stockholders and limited partners (“AFFO”) (1) | | $ | 725,302 |
| | $ | 769,201 |
| | $ | 685,472 |
|
AFFO per diluted share (1) | | $ | 0.76 |
| | $ | 0.83 |
| | $ | 0.82 |
|
| | | | | | | |
| Financial Metrics (continued) | | | | | | |
| Cole Capital Segment | | | | | | |
| Revenues | | $ | 119,376 |
| | $ | 114,882 |
| | $ | 203,558 |
|
| Operating loss | | $ | (142,008 | ) | | $ | (229,755 | ) | | $ | (339,872 | ) |
| Net loss | | $ | (131,451 | ) | | $ | (187,397 | ) | | $ | (296,674 | ) |
FFO (1) | | $ | (131,451 | ) | | $ | (187,397 | ) | | $ | (296,674 | ) |
AFFO (1) | | $ | 16,155 |
| | $ | 12,857 |
| | $ | 65,242 |
|
AFFO per diluted share (1) | | $ | 0.02 |
| | $ | 0.01 |
| | $ | 0.08 |
|
| | | | | | | |
| Consolidated | | | | | | |
| Revenues | | $ | 1,454,823 |
|
| $ | 1,556,017 |
|
| $ | 1,579,257 |
|
| Operating income (loss) | | $ | 53,471 |
|
| $ | 67,325 |
|
| $ | (370,578 | ) |
| Net loss | | $ | (200,824 | ) |
| $ | (323,492 | ) |
| $ | (1,010,912 | ) |
FFO (1) | | $ | 613,416 |
|
| $ | 585,166 |
|
| $ | 149,136 |
|
AFFO (1) | | $ | 741,457 |
|
| $ | 782,058 |
|
| $ | 750,714 |
|
AFFO per diluted share (1) | | $ | 0.78 |
| | $ | 0.84 |
| | $ | 0.90 |
|
|
| | | | | | | | | | | | |
| | | Year Ended December 31, |
| | | 2018 | | 2017 | | 2016 |
| Financial Metrics | | | | | | |
| Rental revenue |
| $ | 1,257,867 |
| | $ | 1,252,285 |
| | $ | 1,335,447 |
|
| (Loss) income from continuing operations |
| $ | (91,725 | ) | | $ | 51,495 |
| | $ | (76,887 | ) |
| Income (loss) from discontinued operations, net of income taxes | | $ | 3,695 |
| | $ | (19,117 | ) | | $ | (123,937 | ) |
| | | | | | | |
| Basic and diluted net loss per share from continuing operations attributable to common stockholders | | $ | (0.17 | ) | | $ | (0.02 | ) | | $ | (0.16 | ) |
| Basic and diluted net income (loss) per share from discontinued operations attributable to common stockholders | | 0.00 |
| | (0.02 | ) | | (0.13 | ) |
Basic and diluted net loss per share attributable to common stockholders (1) | | $ | (0.16 | ) | | $ | (0.04 | ) | | $ | (0.29 | ) |
| | | | | | | |
FFO attributable to common stockholders and limited partners from continuing operations (2) | | $ | 434,371 |
| | $ | 672,225 |
| | $ | 737,353 |
|
FFO attributable to common stockholders and limited partners from discontinued operations (2) | | 3,695 |
| | (19,117 | ) | | (123,937 | ) |
FFO attributable to common stockholders and limited partners (2) |
| $ | 438,066 |
| | $ | 653,108 |
| | $ | 613,416 |
|
| | | | | | | |
AFFO attributable to common stockholders and limited partners from continuing operations (2) | | $ | 710,688 |
| | $ | 702,556 |
| | $ | 723,354 |
|
AFFO attributable to common stockholders and limited partners from discontinued operations (2) | | 3,202 |
| | 36,213 |
| | 18,103 |
|
AFFO attributable to common stockholders and limited partners (2) |
| $ | 713,890 |
| | $ | 738,769 |
| | $ | 741,457 |
|
| | | | | | | |
AFFO attributable to common stockholders and limited partners from continuing operations per diluted share (2) | | $ | 0.72 |
| | $ | 0.70 |
| | $ | 0.76 |
|
AFFO attributable to common stockholders and limited partners from discontinued operations per diluted share (2) | | 0.00 |
| | 0.04 |
| | 0.02 |
|
AFFO attributable to common stockholders and limited partners per diluted share (2) | | $ | 0.72 |
| | $ | 0.74 |
| | $ | 0.78 |
|
| |
| (1) | Amounts may not total due to rounding. See Note 14 –Net Income (Loss) Per Share/Unit for calculation of net (loss) income per share. |
| |
| (2) | See the “Non-GAAP Measures”Non-GAAP Measures section below for descriptions of our non-GAAP measures and reconciliations to the most comparable U.S. GAAP measure. |
The following table presents the total assets of the Company, by segment (in thousands):
|
| | | | | | | | |
| | | Total Assets |
| | | December 31, 2016 | | December 31, 2015 |
| REI segment | | $ | 15,337,623 |
| | $ | 16,966,729 |
|
| Cole Capital segment | | 249,951 |
| | 439,137 |
|
| Total | | $ | 15,587,574 |
| | $ | 17,405,866 |
|
Property Financing
Our mortgage notes payable consisted of the following as of December 31, 2016, 20152018, 2017 and 20142016 (dollar amounts in thousands):
|
| | | | | | | | | | | | | |
| | | Encumbered Properties | | Outstanding Loan Amount | | Weighted Average
Effective Interest Rate (1)(2) | | Weighted Average Maturity (3) |
| December 31, 2016 | | 619 |
| | $ | 2,629,949 |
| | 4.95 | % | | 4.6 |
|
| December 31, 2015 | | 654 |
| | $ | 3,039,882 |
| | 5.08 | % | | 5.1 |
|
| December 31, 2014 | | 776 |
| | $ | 3,689,795 |
| | 4.88 | % | | 6.2 |
|
|
| | | | | | | | | | | | |
| | | Encumbered Properties | | Outstanding Loan Amount | | Weighted Average
Effective Interest Rate (1)(2) | | Weighted Average Maturity (3) |
| December 31, 2018 | | 459 |
| | $ | 1,917,132 |
| | 4.93 | % | | 3.4 |
December 31, 2017 (4) | | 471 |
| | $ | 2,054,838 |
| | 4.88 | % | | 4.1 |
| December 31, 2016 | | 619 |
| | $ | 2,629,949 |
| | 4.95 | % | | 4.6 |
| |
| (1) | Mortgage notes payable have fixed rates or are fixed by way of interest rate swap arrangements. EffectiveWeighted average effective interest rates ranged from 2.00%3.1% to 6.1% at December 31, 2018, 3.1% to 7.2% at December 31, 2017, and 2.0% to 7.75% at December 31, 2016, 3.10% to 10.68% at December 31, 2015 and 2.75% to 7.20% at December 31, 2014.2016. |
| |
| (2) | Weighted average interest rate is computed using the interest rate in effect until the anticipated repayment date. Should the loan not be repaid at the anticipated repayment date, the applicable interest rate would increase as specified in the respective loan agreement until the extended maturity date. |
| |
| (3) | Weighted average remaining years to maturity as of December 31, 2016, 2015, and 2014, respectively. Weighted average years remaining to maturity is computed using the anticipated repayment date as specified in each loan agreement, where applicable. |
| |
| (4) | Omits the Excluded Property and the related outstanding loan amount of $16.2 million and interest rate of 9.48%. |
Future Lease Expirations
The following is a summary of lease expirations for the next 10 years and beyond at the operating properties we owned as of December 31, 20162018 (dollar amounts and square feet in thousands):
| | | Year of Expiration | | Number of Leases
Expiring (1) | | Square Feet | | Square Feet as a % of Total Portfolio | | Annualized Rental Income Expiring | | Annualized Rental Income Expiring as a % of Total Portfolio | | Number of Leases
Expiring (1) | | Square Feet | | Square Feet as a % of Total Portfolio | | Annualized Rental Income Expiring | | Annualized Rental Income Expiring as a % of Total Portfolio |
| 2017 | | 126 |
| | 1,973 |
| | 2.1 | % | | $ | 27,663 |
| | 2.4 | % | |
| 2018 | | 213 |
| | 3,368 |
| | 3.6 | % | | 37,029 |
| | 3.1 | % | |
| 2019 | | 184 |
| | 3,242 |
| | 3.5 | % | | 55,142 |
| | 4.7 | % | | 139 |
| | 2,331 |
| | 2.4 | % | | $ | 35,949 |
| | 3.1 | % |
| 2020 | | 231 |
| | 4,203 |
| | 4.6 | % | | 46,299 |
| | 3.9 | % | | 207 |
| | 3,526 |
| | 3.5 | % | | 40,754 |
| | 3.5 | % |
| 2021 | | 194 |
| | 11,046 |
| | 11.8 | % | | 87,378 |
| | 7.4 | % | | 192 |
| | 8,491 |
| | 8.9 | % | | 76,624 |
| | 6.7 | % |
| 2022 | | 276 |
| | 9,638 |
| | 10.4 | % | | 84,589 |
| | 7.3 | % | | 262 |
| | 9,365 |
| | 9.9 | % | | 81,816 |
| | 7.1 | % |
| 2023 | | 212 |
| | 5,935 |
| | 6.3 | % | | 72,330 |
| | 6.2 | % | | 316 |
| | 6,593 |
| | 7.0 | % | | 82,859 |
| | 7.2 | % |
| 2024 | | 177 |
| | 9,158 |
| | 9.9 | % | | 106,982 |
| | 9.1 | % | | 194 |
| | 9,334 |
| | 9.9 | % | | 110,212 |
| | 9.6 | % |
| 2025 | | 266 |
| | 4,233 |
| | 4.5 | % | | 61,111 |
| | 5.2 | % | | 271 |
| | 4,324 |
| | 4.7 | % | | 60,665 |
| | 5.3 | % |
| 2026 | | 247 |
| | 7,832 |
| | 8.4 | % | | 82,723 |
| | 7.1 | % | | 222 |
| | 9,654 |
| | 10.2 | % | | 84,105 |
| | 7.3 | % |
| 2027 | | | 360 |
| | 7,939 |
| | 8.3 | % | | 104,748 |
| | 9.1 | % |
| 2028 | | | 317 |
| | 6,275 |
| | 6.6 | % | | 77,301 |
| | 6.7 | % |
| Thereafter | | 1,315 |
| | 31,052 |
| | 33.2 | % | | 512,537 |
| | 43.6 | % | | 766 |
| | 26,014 |
| | 27.4 | % | | 396,079 |
| | 34.4 | % |
| Total | | 3,441 |
| | 91,680 |
| | 98.3 | % | | $ | 1,173,783 |
| | 100.0 | % | | 3,246 |
| | 93,846 |
| | 98.8 | % | | $ | 1,151,112 |
| | 100.0 | % |
| |
| (1) | The Company has certain leases comprised of multiple properties. |
Results of Operations
RevenuesOn February 1, 2018, the Company sold substantially all of Cole Capital, which is presented as discontinued operations for all periods presented. The Company’s continuing operations represent primarily those of the real estate investment segment. The operating expense reimbursements line item has been combined into rental revenue for prior periods presented to be consistent with the current year presentation.
Rental Revenue
The table below sets forth, for the periods presented, certainrental revenue information and the dollar amount change year over year (in(dollar amounts in thousands):
|
| | | | | | | | | | | | | | | | | | | | |
| | | Year Ended December 31, |
| | | 2016 | | 2015 | | 2014 | | 2016 vs 2015
Increase/(Decrease) | | 2015 vs 2014
Increase/(Decrease) |
| Revenues: | | | | | | | | | | |
| Rental income | | $ | 1,227,937 |
| | $ | 1,339,787 |
| | $ | 1,271,574 |
| | $ | (111,850 | ) |
| $ | 68,213 |
|
| Direct financing lease income | | 2,055 |
| | 2,720 |
| | 3,603 |
| | (665 | ) |
| (883 | ) |
| Operating expense reimbursements | | 105,455 |
| | 98,628 |
| | 100,522 |
| | 6,827 |
|
| (1,894 | ) |
| Cole Capital revenue: | | | | | | | |
|
| | |
| Offering-related fees and reimbursements | | 36,533 |
| | 24,410 |
| | 87,109 |
| | 12,123 |
|
| (62,699 | ) |
| Transaction service fees and reimbursements | | 12,959 |
| | 30,109 |
| | 64,956 |
| | (17,150 | ) |
| (34,847 | ) |
| Management fees and reimbursements | | 69,884 |
| | 60,363 |
| | 51,493 |
| | 9,521 |
|
| 8,870 |
|
| Total Cole Capital revenue | | 119,376 |
| | 114,882 |
|
| 203,558 |
| | 4,494 |
|
| (88,676 | ) |
| Total revenues | | $ | 1,454,823 |
| | $ | 1,556,017 |
|
| $ | 1,579,257 |
| | $ | (101,194 | ) |
| $ | (23,240 | ) |
|
| | | | | | | | | | | | | | | | | | | | |
| | | Year Ended December 31, |
| | | 2018 | | 2017 | | 2016 | | 2018 vs 2017
Increase/(Decrease) | | 2017 vs 2016
Increase/(Decrease) |
| Rental revenue | | $ | 1,257,867 |
| | $ | 1,252,285 |
| | $ | 1,335,447 |
| | $ | 5,582 |
| | $ | (83,162 | ) |
Rental Income
20162018 vs 20152017 – RentalThe increase in rental revenue decreased $111.9of $5.6 million during the year ended December 31, 2016, of which $105.6 million was due2018 as compared to the disposition of 529 consolidated properties subsequent to January 1, 2015. The decrease was also due to an increase in tenant vacancies, particularly Ovation Brands, Inc., which filed for chapter 11 bankruptcy on March 7, 2016 (the “Ovation Bankruptcy”).
2015 vs 2014 – The increase in rental income during the year ended December 31, 20152017 was primarily due to the acquisition of 1,107 properties in 2014, including the consummation of the Cole Merger in the first quarter of 2014 and the acquisition of over 500 Red Lobster® restaurants in the third quarter of 2014, offset by the disposition of 338 properties subsequentreal estate properties. Subsequent to January 1, 2014.2017, the Company acquired 140 occupied properties for an aggregate purchase price of $1.2 billion and disposed of 286 consolidated properties, of which 69 were vacant, for an aggregate sales price of $1.1 billion.
Cole Capital Revenue
Cole Capital’s results of operations are primarily impacted by capital raised on behalf of the Cole REITs in offerings as well as the timing and extent of real estate asset acquisitions, dispositions, assets under management and reimbursements, which are driven by the Cole REITs’ capital raised, cash flows provided by operations and available proceeds from debt financing.
Offering-Related Fees and Reimbursements
Offering-related fees and reimbursementsinclude selling commissions, dealer manager fees and/or distribution and stockholder servicing fees earned from selling securities in the Cole REITs. The Company reallows 100% of selling commissions and may reallow all or a portion of our dealer manager and distribution and stockholder servicing fees to participating broker-dealers as a marketing and due diligence expense reimbursement, based on factors such as the volume of shares sold by such participating broker-dealers and the amount of marketing support provided by such participating broker-dealers. The following table represents offering-related fees and reimbursements as well as amounts reallowed for the periods presented and the dollar amount change year over year (in thousands).
|
| | | | | | | | | | | | | | | | | | | | |
| | | Year Ended December 31, |
| | | 2016 | | 2015 | | 2014 | | 2016 vs 2015
Increase/(Decrease) | | 2015 vs 2014
Increase/(Decrease) |
| Offering-related fees | | $ | 28,250 |
| | $ | 19,232 |
| | $ | 74,556 |
| | $ | 9,018 |
|
| $ | (55,324 | ) |
| Offering-related reimbursements | | 8,283 |
| | 5,178 |
| | 12,553 |
| | 3,105 |
|
| (7,375 | ) |
| Less: reallowed fees and commissions | | 23,174 |
| | 16,195 |
| | 66,228 |
| | 6,979 |
|
| (50,033 | ) |
| Offering-related fees and reimbursements, net of reallowed | | $ | 13,359 |
|
| $ | 8,215 |
|
| $ | 20,881 |
| | $ | 5,144 |
|
| $ | (12,666 | ) |
2017 vs 2016 vs 2015– The increasedecrease in offering-related fees and reimbursements, netrental revenue of reallowed fees and commissions of $5.1$83.2 million during the year ended December 31, 2016 was a direct result of a $216.2 million increase in capital raise to $487.2 million during the year ended December 31, 2016 from $271.0 million during the year ended December 31, 2015. The increase in capital raise was due to new broker-dealer relationships, as well as certain broker-dealers lifting the suspension of their selling agreements.
2015 vs 2014 – The net decrease in offering-related fees and reimbursements of $12.7 million for the year ended December 31, 2015 was a direct result of the decrease in capital raise related to the suspension of certain selling agreements, as discussed above. Additionally, the decrease was partly due to the closing of the offering of Cole Credit Property Trust IV, Inc. in the first quarter of 2014.
Transaction Service Fees and Reimbursements
2016 vs 2015 – Transaction service fees and reimbursementrevenue consist primarily of acquisition and disposition fees earned from acquiring and selling properties on behalf of the Cole REITs and other real estate programs. The decrease of $17.2 million during the year ended December 31, 2016, was due to a decrease in property acquisitions from $992.2 million, during the year ended December 31, 2015, to $660.2 million for the year ended December 31, 2016. In addition, disposition fee revenue decreased as the Company received $4.4 million of such fees relating to the Cole Corporate Income Trust, Inc. disposition in 2015.
2015 vs 2014 – Transaction service fees were $27.9 million for the year ended December 31, 20152017 as compared to $60.7 million during the same period in 2014. Transaction-related reimbursement revenues were $2.2 million for the year ended December 31, 2015, as compared to $4.3 million during the same period in 2014. The net decrease of $34.9 million for the year ended December 31, 2015 was primarily due to decreases in acquisition fee revenue as there were less funds raised by the Managed REITs’ offerings that could be deployed into real estate acquisitions on their behalf.
Management Fees and Reimbursements
2016 vs 2015 – The increase of $9.5 million for the year ended December 31, 2016 was primarily due to an increase in the average assets under management, excluding assets owned by CCIT, as CCIT merged with Select Income REIT ondisposition of 438 consolidated properties subsequent to January 29, 2015, from $6.3 billion for the year ended December 31, 2015 to $7.0 billion for the year ended December 31, 2016 and an increase in reimbursement revenue of $3.7 million for the year ended December 31,1, 2016.
2015 vs 2014 – Management fees were $46.5 million for the year ended December 31, 2015 as compared to $42.7 million during the same period in 2014. Management reimbursement revenues were $13.8 million for the year ended December 31, 2015, as compared to $8.8 million during the same period in 2014. The overall net increase in fees and reimbursements of $8.8 million for the year ended December 31, 2015 primarily related to an increase in reimbursement revenue as the Company was no longer waiving certain expenses due from the Managed REITs in 2015, as well as an increase in advisory fees due to an increase in assets under management.
Operating Expenses
The table below sets forth, for the periods presented, certain operating expense information and the dollar amount change year over year (dollar amounts in thousands):
|
| | | | | | | | | | | | | | | | | | | | |
| | | Year Ended December 31, |
| | | 2016 | | 2015 | | 2014 | | 2016 vs 2015
Increase/(Decrease) | | 2015 vs 2014
Increase/(Decrease) |
| Operating expenses: | | | | | | | |
|
| | |
| Cole Capital reallowed fees and commissions | | $ | 23,174 |
| | $ | 16,195 |
| | $ | 66,228 |
| | $ | 6,979 |
|
| $ | (50,033 | ) |
| Acquisition related expenses | | 1,321 |
| | 6,243 |
| | 38,940 |
| | (4,922 | ) |
| (32,697 | ) |
| Litigation, merger and other non-routine costs, net of insurance recoveries | | 3,884 |
| | 33,628 |
| | 199,616 |
| | (29,744 | ) |
| (165,988 | ) |
| Property operating expenses | | 144,428 |
| | 130,855 |
| | 137,741 |
| | 13,573 |
|
| (6,886 | ) |
| Management fees to affiliates | | — |
| | — |
| | 13,888 |
| | — |
| | (13,888 | ) |
| General and administrative expenses | | 136,608 |
| | 149,066 |
| | 167,428 |
| | (12,458 | ) |
| (18,362 | ) |
| Depreciation and amortization expenses | | 788,186 |
| | 847,611 |
| | 916,003 |
| | (59,425 | ) |
| (68,392 | ) |
| Impairments | | 303,751 |
| | 305,094 |
| | 409,991 |
| | (1,343 | ) |
| (104,897 | ) |
| Total operating expenses | | $ | 1,401,352 |
|
| $ | 1,488,692 |
|
| $ | 1,949,835 |
| | $ | (87,340 | ) |
| $ | (461,143 | ) |
|
| | | | | | | | | | | | | | | | | | | | |
| | | Year Ended December 31, |
| | | 2018 | | 2017 | | 2016 | | 2018 vs 2017
Increase/(Decrease) | | 2017 vs 2016
Increase/(Decrease) |
| Acquisition-related | | $ | 3,632 |
| | $ | 3,402 |
| | $ | 1,321 |
| | $ | 230 |
| | $ | 2,081 |
|
| Litigation, merger and other non-routine costs, net of insurance recoveries | | 290,963 |
| | 47,960 |
| | 3,884 |
| | 243,003 |
| | 44,076 |
|
| Property operating | | 126,461 |
| | 128,717 |
| | 144,428 |
| | (2,256 | ) | | (15,711 | ) |
| General and administrative | | 63,933 |
| | 58,603 |
| | 51,927 |
| | 5,330 |
| | 6,676 |
|
| Depreciation and amortization | | 640,618 |
| | 706,802 |
| | 762,038 |
| | (66,184 | ) | | (55,236 | ) |
| Impairments | | 54,647 |
| | 50,548 |
| | 182,820 |
| | 4,099 |
| | (132,272 | ) |
| Total operating expenses | | $ | 1,180,254 |
| | $ | 996,032 |
| | $ | 1,146,418 |
| | $ | 184,222 |
| | $ | (150,386 | ) |
Acquisition RelatedAcquisition-Related Expenses
20162018 vs 20152017 - – Acquisition relatedAcquisition-related expenses, primarilywhich consist of legal, deed transfer and other costsallocated internal salaries related to real estate purchase transactions, includingtime spent on acquiring commercial properties and costs incurredassociated with unconsummated deals, remained relatively constant during the year ended December 31, 2018 as compared to the same period in 2017.
2017 vs 2016 - The increase of $2.1 million in acquisition-related expenses for deals that were not consummated.the year ended December 31, 2017, as compared to the same period in 2016 was primarily due to an increase in allocated internal salaries resulting from time spent on acquiring commercial properties during the year ended December 31, 2017. The Company acquired 88 properties and three land parcels for an interest inaggregate purchase price of $748.8 million during the year ended December 31, 2017 as compared with the acquisition of eight commercial properties for aan aggregate purchase price of $100.2 million during the year ended December 31, 2016 as compared with the acquisition of 16 properties for an aggregate purchase price of $36.3 million during the year ended December 31, 2015. The decrease in acquisition related expenses of $4.9 million during the year ended December 31, 2016 was due to a decrease in costs incurred for deals that were not consummated and fewer properties acquired in 2016.
2015 vs 2014 – The Company acquired interests in 16 commercial properties, including nine land parcels for build-to-suit development, for an aggregate purchase price of $36.3 million during the year ended December 31, 2015 as compared with the acquisition of 1,107 properties including 31 land parcels, for an aggregate purchase price of $3.8 billion during the year ended December 31, 2014. The decrease in acquisition related expenses during the year ended December 31, 2015 was primarily due to a significant decrease in acquisition activity as compared to the same period in 2014.
Litigation, Merger and Other Non-Routine Costs, Net of Insurance Recoveries
20162018 vs 20152017 - – The decreaseincrease of $29.7$243.0 million during the year ended December 31, 20162018 as compared to the same period in 2017 was primarily due to litigation settlements related to litigation filed as a $20.0 million decrease in legal fees incurred for litigation arising from the resultsresult of the findings of the Audit Committee Investigation and related litigation and investigations. Additionally, the Company recognized insurance recoveries of $21.2$233.2 million during the year ended December 31, 20162018. Related litigation costs increased $21.2 million for the year ended December 31, 2018 as compared to $11.4the same period in 2017, offset by the reversal of an accrual of $10.9 million, in 2015.as the Company was legally released from certain advancement obligations. In addition, insurance recoveries of $2.3 million were recognized during the year ended December 31, 2018 related to the litigation resulting from prior mergers.
20152017 vs 20142016 –- The decreaseincrease of $166.0$44.1 million during the year ended December 31, 2015 was primarily related to costs incurred relating2017, as compared to the Cole Merger and the ARCT IV Merger, including a $78.2 million subordinated distribution feesame period in 2016 was due to an affiliateincrease of the Former Manager upon the consummation of the ARCT IV Merger that was settled with 6.7$25.2 million OP Unitsin legal fees incurred related to the affiliate of the Former Manager during the year ended December 31, 2014. No such fees were incurred for any mergers during the year ended December 31, 2015. However, the Company incurred $44.2 million of expenses in connection with the Audit Committee Investigation and related litigation and investigations during the year ended December 31, 2015. These expenses were offset by $11.42017 as compared to the same period in 2016. Additionally, the Company recognized $21.2 million of insurance proceeds, $10.5recoveries during the year ended December 31, 2016, of which $10.5 million related to expenses for litigation arisingresulting from the results ofprior mergers and $10.7 million related to the Audit Committee Investigation.Investigation and related litigation and investigations. No insurance recoveries were recognized during the year ended December 31, 2017 related to the litigation resulting from prior mergers.
Property Operating Expenses and Operating Expense Reimbursement
The table below sets forth, for the periods presented, the property operating expenses, net of operating expense reimbursements, and the dollar amount change year over year (dollar amounts in thousands):
|
| | | | | | | | | | | | | | | | | | | | |
| | | Year Ended December 31, |
| | | 2016 | | 2015 | | 2014 | | 2016 vs 2015
Increase/(Decrease) | | 2015 vs 2014
Increase/(Decrease) |
| Property operating expenses | | $ | 144,428 |
| | $ | 130,855 |
| | $ | 137,741 |
| | $ | 13,573 |
|
| $ | (6,886 | ) |
| Less: Operating expense reimbursements | | 105,455 |
| | 98,628 |
| | 100,522 |
| | 6,827 |
|
| (1,894 | ) |
| Property operating expenses, net of operating expense reimbursements | | $ | 38,973 |
|
| $ | 32,227 |
|
| $ | 37,219 |
| | $ | 6,746 |
|
| $ | (4,992 | ) |
20162018 vs 20152017 – Property operating expenses such as taxes, insurance, ground rent and maintenance include both reimbursable and non-reimbursable property expenses. Operating expense reimbursement revenue represents reimbursements for such costs that are reimbursable by the tenants per their respective leases. The net increasedecrease in property operating expenses of $6.7$2.3 million during the year ended December 31, 20162018 as compared to the same period in 2017 was primarily due to the acquisition and disposition of real estate properties. Subsequent to January 1, 2017, the Company acquired 140 occupied properties for an increase in tenant vacancies, particularly related to the Ovation Bankruptcy.aggregate purchase price of $1.2 billion and disposed of 286 consolidated properties, of which 69 were vacant, for an aggregate sales price of $1.1 billion.
20152017 vs 20142016 – The net decrease in property operating expenses of $5.0$15.7 million during the year ended December 31, 20152017 as compared to the same period in 2016 was driven primarily by the disposal of our portfolio of anchored shopping centers, which generally have higher non-reimbursable operating expenses, during the fourth quarter of 2014, as well asdue to the disposition of 228438 consolidated properties in 2015.subsequent to January 1, 2016.
Management Fees to Affiliates
2016 vs 2015 – There were no management fees to affiliates incurred during the years ended December 31, 2016 or 2015 as discussed in “Note 18 –Related Party Transactions and Arrangements” to our consolidated financial statements.
2015 vs 2014 – There were no management fees to affiliates incurred during the year ended December 31, 2015 as discussed in “Note 18 –Related Party Transactions and Arrangements” to our consolidated financial statements, as we completed our transition to self-management on January 8, 2014. During the year ended December 31, 2014, we incurred fees of $13.9 million related to asset management services.
General and Administrative Expenses
20162018 vs 20152017 – The decreaseincrease of $12.5$5.3 million during the year ended December 31, 20162018 as compared to the same period in 2017 was primarily due to a decrease of $8.7 million in consulting and other professional fees in 2016, as well as a decrease in equity-based compensation of $3.8 million primarily due to certain awards which were fully expensed during 2015. Additionally, during the year ended December 31, 2016, accounting fees decreased $1.8 million, primarily due to the work performed during the first quarter of 2015 in connection with the restatements, and legal fees decreased $1.7 million, primarily due to costs incurred in 2015 related to strategic, tax and regulatory matters. These decreases were partially offset by an increase in the amount reserved related to the collectability of program development costs$5.5 million of $4.8compensation and benefits, including equity-based compensation.
2017 vs 2016 – The increase of $6.7 million during the year ended December 31, 20162017 as compared to the same period in 2015. See2016 was primarily due to an increase of $6.8 million of compensation and benefits, including equity-based compensation.
Depreciation and Amortization Expenses
2018 vs 2017 Note 18 –Related Party Transactions and Arrangements for further discussion on the Cole REIT’s program development costs.
2015 vs 2014– The decrease in general and administrative expenseof $66.2 million during the year ended December 31, 2015 was primarily related to a decrease in equity-based compensation of $18.8 million, from $33.3 million for the year ended December 31, 2014 to $14.5 million for the year ended December 31, 2015, largely as a result of the forfeiture of certain awards in connection with the departure of certain officers and directors in the fourth quarter of 2014. The overall decrease in compensation and benefits is also due to the Company’s headcount reduction2018 as compared to the same period in 2014, partially offset by2017 was primarily due to furniture and fixtures that were fully depreciated during 2017 and 2018, as they had reached the increase in severance to former employees.end of their useful lives.
Depreciation and Amortization Expenses
20162017 vs 20152016 – The decrease of $59.4$55.2 million during the year ended December 31, 2017 as compared to the same period in 2016 was primarily related to the disposition of 529438 consolidated properties subsequent to January 1, 2015.2016. The Company also recorded $182.8$50.5 million and $91.8$182.8 million of impairment charges on real estate investments during the yearyears ended December 31, 20162017 and 2015,2016, respectively, which reduced the carrying value being depreciated and amortized.
Impairments
20152018 vs 20142017 – The decreaseincrease in depreciation and amortization expenseimpairments of $4.1 million during the year ended December 31, 20152018 as compared to the same period in 2017 was primarily attributable to management’s change in strategy related to certain retail properties which management determined, based on discussions with the current tenants, will not be re-leased, offset by a decrease in the amortization of the management and advisory contracts (the “Management Contracts”) with the Managed REITs of $42.6 million dueimpairments related to an impairment of $86.4 million recorded in the fourth quarter of 2014. Additionally, real estate depreciation and amortization expense decreased $27.0 million, primarily due to dispositions of 228 properties in 2015 and 110 properties in 2014.industrial properties. The Company also recorded $100.5 million of impairment charges on real estate investments from continuing operationsimpaired 70 properties during the year ended December 31, 2014, of which impairment charges totaling $96.7 million arose2018 as compared to 69 properties during the fourth quarter of 2014.year ended December 31, 2017.
Impairments
20162017 vs 20152016 – The decrease in impairments of $1.3$132.3 million during the year ended December 31, 2017 as compared to the same period in 2016 was primarily due to a decrease in the impairmentnumber of properties impaired from 153 properties during the intangible assets and goodwill inyear ended December 31, 2016 to 69 properties during the Cole Capital segment of $92.4 million, as discussed in “Note 10 – Fair Value Measures” to our consolidated financial statements, offset by an increase in impairment charges recorded related toyear ended December 31, 2017. In addition, the REI segment of $91.1 million primarilydecrease was also due to management identifying certain properties for potential sale as part of its portfolio management strategy to reduce exposure to office properties as well as the Ovation Bankruptcy.
2015 vs 2014 – The decrease in impairments during the year ended December 31, 2015 was primarily due to a decrease in2016 as well as the impairment of goodwill in the Cole Capital segment of $83.4 million from $223.0 million in 2014 to $139.7 million in 2015. There was also a decrease in the impairment of real estate assets of $8.7 million from an impairment of $100.5 millionChapter 11 bankruptcy filed by Ovation Brands, Inc. during the year ended December 31, 2014, as compared to an impairment of $91.8 million in 2015.2016.
Other (Expense) Income, Provision for Income Taxes and Income Tax Benefit(Loss) from Discontinued Operations
The table below sets forth, for the periods presented, certain financial information and the dollar amount change year over year (dollar amounts in thousands):
|
| | | | | | | | | | | | | | | | | | | | |
| | | Year Ended December 31, |
| | | 2016 | | 2015 | | 2014 | | 2016 vs 2015
Increase/(Decrease) | | 2015 vs 2014
Increase/(Decrease) |
| Other (expense) income and tax benefit (provision): | | | | | | | |
|
| | |
| Interest expense | | $ | (317,376 | ) | | $ | (358,392 | ) | | $ | (452,648 | ) | | $ | (41,016 | ) |
| $ | (94,256 | ) |
| (Loss) gain on extinguishment and forgiveness of debt, net | | (771 | ) | | 4,812 |
| | (21,869 | ) | | (5,583 | ) |
| 26,681 |
|
| Other income, net | | 6,035 |
| | 6,439 |
| | 88,596 |
| | (404 | ) |
| (82,157 | ) |
| Reserve for loan loss | | — |
| | (15,300 | ) | | — |
| | 15,300 |
| | |
| Equity in income (loss) and gain on disposition of unconsolidated entities | | 9,783 |
| | 9,092 |
| | (76 | ) | | 691 |
|
| 9,168 |
|
| Loss on derivative instruments, net | | (1,191 | ) | | (1,460 | ) | | (10,570 | ) | | 269 |
|
| 9,110 |
|
| Gain (loss) on disposition of real estate and held for sale assets, net | | 45,524 |
| | (72,311 | ) | | (277,031 | ) | | 117,835 |
|
| 204,720 |
|
| Benefit from income taxes | | 3,701 |
| | 36,303 |
| | 33,264 |
| | (32,602 | ) |
| 3,039 |
|
|
| | | | | | | | | | | | | | | | | | | | |
| | | Year Ended December 31, |
| | | 2018 | | 2017 | | 2016 | | 2018 vs 2017
Increase/(Decrease) | | 2017 vs 2016
Increase/(Decrease) |
| Interest expense | | $ | (280,887 | ) | | $ | (289,766 | ) | | $ | (317,376 | ) | | $ | (8,879 | ) | | $ | (27,610 | ) |
| Gain (loss) on extinguishment and forgiveness of debt, net | | 5,360 |
| | 18,373 |
| | (771 | ) | | (13,013 | ) | | 19,144 |
|
| Other income, net | | 14,735 |
| | 6,242 |
| | 5,251 |
| | 8,493 |
| | 991 |
|
| Equity in income and gain on disposition of unconsolidated entities | | 1,869 |
| | 2,763 |
| | 9,783 |
| | (894 | ) | | (7,020 | ) |
| Gain (loss) on derivative instruments, net | | 355 |
| | 2,976 |
| | (1,191 | ) | | (2,621 | ) | | 4,167 |
|
| Gain on disposition of real estate and real estate assets held for sale, net | | 94,331 |
| | 61,536 |
| | 45,524 |
| | 32,795 |
| | 16,012 |
|
| Provision for income taxes | | (5,101 | ) | | (6,882 | ) | | (7,136 | ) | | (1,781 | ) | | (254 | ) |
| Income (loss) from discontinued operations, net of income taxes | | 3,695 |
| | (19,117 | ) | | (123,937 | ) | | 22,812 |
| | 104,820 |
|
Interest Expense
20162018 vs 20152017 – The decrease of $41.0$8.9 million during the year ended December 31, 20162018 as compared to the same period in 2017 was primarily a result of a decrease in the total outstanding debt balance from $8.1 billion as of December 31, 2015 to $6.4 billion as of December 31, 2016, largely due to the repayment of all outstandingthe 2018 Convertible Notes of $597.5 million and a $153.9 million reduction of secured debt, partially offset by the issuance of $550.0 million of the 2025 Senior Notes and an increase in net borrowings under the revolving credit facility, repaymentfacilities of $0.5 billion of the Credit Facility Term Loan, as well as reducing secured debt with proceeds from the public equity offering and property dispositions.
2015 vs 2014 – The$218.0 million. In addition, there was a decrease in interest expenseamortization of deferred financing costs of $3.1 million related to the credit facilities during the year ended December 31, 20152018 as compared to the same period in 2017, which was due to lower deferred financing costs incurred in connection with the entrance into the Credit Agreement during the year ended December 31, 2018 as compared to the deferred financing costs incurred in connection with the 2014 Credit Agreement.
2017 vs 2016 – The decrease of $27.6 million during the year ended December 31, 2017 as compared to the same period in 2016 was primarily a result of a decrease in amortization expense in relationdue to a 2014 cumulative adjustment$579.9 million reduction of amortization for premium on a loan in default of $16.7 million. The decrease also related to the decrease in total outstandingsecured debt, balance from $10.4 billion as of December 31, 2014 to $8.1 billion as of December 31, 2015, largely due to paying down $1.8 billion on the revolving credit facility as well as the prepayment of mortgage notes payable and assumption of debt by the buyer in property dispositions as discussed in “Note 11 – Debt” to our consolidated financial statements. These decreases were partially offset by an increasethe issuance of $6.9$600.0 million of Senior Notes and a reduction in interest expense on bonds that were issued in February 2014.net borrowings under the credit facilities of $315.0 million.
Gain (Loss) Gain on Extinguishment and Forgiveness of Debt, Net
20162018 vs 20152017 – Gain (loss) on extinguishment and forgiveness of debt, net decreased $13.0 million during the year ended December 31, 2018 as compared to the same period in 2017. During the year ended December 31, 2016,2018, the Company recordedentered into a lossdeed-in-lieu of $0.8 million in relation toforeclosure agreement with the write-off of deferred financing costs and net premiums consisting of losses relating to the early extinguishment of our 2017 Senior Notes of $13.2 million and the prepaymentlender of a portion of the Credit Facility Term Loan of $4.3 million, as well as the 2016 Term Loan of $2.6 million, as discussedmortgage loan, secured by one property, which resulted in “Note 11 –Debt” to our consolidated financial statements. These losses were partially offset by a gain on forgiveness of debt of $19.1$5.2 million. During the same period in 2017, the Company entered into deed-in-lieu of foreclosure agreements with the lenders of three mortgage loans, secured by six properties, which resulted in a gain on forgiveness of debt of $20.5 million, which was offset by the write-off of $2.0 million of deferred financing costs related to a property foreclosed upon.the termination of the 2014 Credit Agreement.
20152017 vs 20142016 – A gainGain (loss) on extinguishment and forgiveness of debt, net of $4.8 million was recorded for the year ended December 31, 2015, which primarily related to the foreclosure of the Company’s property in Bethseda, Maryland. During the year ended December 31, 2015, the Company also repaid an aggregate of $548.9 million of mortgage notes payable prior to maturity or assumed by the buyer in a property disposition as compared to $1.6 billion repaid prior to maturity in 2014. In connection with the extinguishments, we paid prepayment fees totaling $102,000 and $35.9 million for the years ended December 31, 2015 and 2014, respectively, which are also included in (loss) gain on extinguishment and forgiveness of debt, net in the consolidated financial statements.
Other Income, Net
2016 vs 2015 – Other income, net remained relatively constant, decreasing $0.4increased $19.1 million during the year ended December 31, 20162017 as compared to the same period in 2015.2016. During the year ended December 31, 2017, the Company entered into deed-in-lieu of foreclosure agreements with the lenders of three mortgage loans, secured by six properties, which resulted in a gain on forgiveness of debt of $20.5 million. There were no comparable transactions resulting in gains on forgiveness of debt during the year ended December 31, 2016.
Other Income, Net
2018 vs 2017 – The line items “Otherincrease of $8.5 million during the year ended December 31, 2018 as compared to the same period in 2017 was primarily due to a $5.1 million gain on measuring the Company’s investments in the Cole REITs at fair value after the investments were no longer accounted for using the equity method, $4.8 million received related to a fully reserved loan receivable and a gain of $1.7 million related to the sale of three mortgage notes, offset by a loss of $2.2 million related to the sale of six CMBS and a reduction of $1.2 million in 1031 real estate program revenues during the year ended December 31, 2018.
2017 vs 2016 – The increase of $1.0 million during the year ended December 31, 2017 as compared to the same period in 2016 was primarily due to post-closing adjustments of $1.6 million, recorded in accordance with the purchase and sale agreement during the year ended December 31, 2016, related to a multi-tenant asset portfolio sale completed in 2014, offset by a decrease in interest income net”, “Gain (loss)related to the Company’s investment securities and mortgage notes receivable of $0.6 million.
Equity in Income and Gain on dispositionDisposition of interest in joint venture” and “EquityUnconsolidated Entities
2018 vs 2017 – Equity in income and gain on disposition of unconsolidated entities” previously reported have been reclassified to conform with the current period’s presentation, as discussed in “Note 2 – Summary of Significant Accounting Policies” to the consolidated financial statements.
2015 vs 2014 – The decrease in other income, net during the year ended December 31, 2015 was primarily a result of a litigation settlement with RCS Capital Corporation in 2014, from which the Company received $60.0 million in connection with the unconsummated sale of Cole Capital as discussed in “Note 18 – Related Party Transactions and Arrangements” to our consolidated financial statements. The decrease also related to the decrease in interest income from investment securities, largely resulting from the sale of 15 CMBS for $158.0 million during the third quarter of 2014, as well as a decrease in interest income from mortgage notes receivable, two of which were repaid in the fourth quarter of 2014.
Reserve for Loan Loss
The reserve for loan loss of $15.3 million for the year ended December 31, 2015 related to an unsecured note from RCS Capital Corporation in connection with the unconsummated sale of Cole Capital, as discussed in “Note 18 –Related Party Transactions and Arrangements” to the consolidated financial statements. During the three months ended December 31, 2015, the Company assessed the collectability of the note, determined it was unlikely to be repaid and recorded the reserve equal to the carrying value of the note.
Equity in Income (Loss) and Gain on Disposition of Unconsolidated Entities
2016 vs 2015 – Equity in income (loss) and gain on disposition of unconsolidated entities increased $0.7decreased $0.9 million during the year ended December 31, 20162018 as compared to 2015.the same period in 2017. During the year ended December 31, 2016,2018, the Company recoredrecorded a $0.7 million gain of $10.2 million related toon the disposition and liquidation of one property comprising 343 million square feet of office space, owned by an unconsolidated joint venture. During the year ended December 31, 2015,2017, the Company recoredrecorded a $1.9 million gain of $6.7 million related toon the disposition of its interest in one consolidated joint venture, whose only assets consisted of investments in threeland parcel owned by one unconsolidated joint ventures that owned three properties, comprising 752 million square feet of retail space. During the years ended December 31,venture.
2017 vs 2016 and 2015, the Company recognized $0.9 million and $2.3 million of net income, respectively, from the unconsolidated joint ventures. The Company recorded equity in loss related to its investments in the Cole REITs of $1.3 million during the year ended December 31, 2016, as compared to equity in income of $49,000 during the year ended December 31, 2015. The line items “Other income, net”, “Gain (loss) on disposition of interest in joint venture” and “Equity– Equity in income and gain on disposition of unconsolidated entities” previously reported have been reclassified to conform with the current period’s presentation, as discussed in “Note 2 – Summary of Significant Accounting Policies” to the consolidated financial statements.
2015 vs 2014 – The increase of $9.2entities decreased $7.0 million during the year ended December 31, 20152017 as compared to 2014 is primarily due tothe same period in 2016. During the year ended December 31, 2017, the Company recorded a gain of $6.7$1.9 million related to the disposition of our interest in one consolidatedland parcel owned by one unconsolidated joint venture. During the year ended December 31, 2016, the Company recorded a gain of $10.2 million related to the disposition of one unconsolidated joint venture as discussed above. owning one property.
Loss
Gain (Loss) on Derivative Instruments, Net
20162018 vs 20152017 – The $2.6 million decrease during the year ended December 31, 2016, is due2018 as compared to the same period in 2017, was primarily a result of the termination of two13 derivative instruments with an aggregate notional value of $662.4 million and the de-designation of one derivative instrument with a notional value of $27.8 million during 2017.
2017 vs 2016 – The $4.2 million increase during the year ended December 31, 2017 as compared to the same period in 2016, was primarily the result of the termination of six interest rate swaps in connection with the early repayment of a portion of the outstanding borrowings under the 2014 Credit Facility Term Loan, as discussed in “Note 11 –Debt” to our consolidated financial statements,Agreement, which resulted in a gain of $1.1 million as compared to a loss of $3.3 million offset by an increase in the fair value of the Company’s interest rate swaps.
2015 vs 2014 – Loss on derivative instruments, net related to the ineffective portion of changes in fair value of cash flow hedges. The decrease in loss on derivative instruments, net for the year ended December 31, 2015 primarily related to the fact that we recorded a loss of $18.8 million for the year ended December 31, 2014 relating to the Series D embedded derivative, which was settled in connection with the redemption of the Series D Preferred Stock in the third quarter of 2014.2016.
Gain (Loss) on Disposition of Real Estate and Real Estate Assets Held For Sale, Assets, Net
20162018 vs 20152017 – DuringThe increase in gain on disposition of real estate and real estate assets held for sale, net of $32.8 million during the year ended December 31, 2016,2018 as compared to the change of $117.8 million from a net loss on dispositions of real estate to a net gain issame period in 2017, was due to the Company’s disposition of 301148 properties, excluding one property conveyed to the lender in a deed-in-lieu of foreclosure transaction, for an aggregate sales price of $1.1 billion,$526.4 million which resulted in an aggregatea gain of $50.6$96.2 million during the year ended December 31, 2018, as compared to the disposal of 228131 properties, excluding six properties transferred to the lender in either a deed-in-lieu of foreclosure or foreclosure sale transaction, for an aggregate sales price of $1.4 billion$594.9 million during the same period in 20152017 for a lossgain of $69.1$64.7 million. During the year ended December 31, 2016,2018, the Company also recordedrecognized a loss of $5.1$1.9 million related to assets classified as held for sale, as compared to a loss of $3.2$3.1 million during the same period in 2015.2017.
20152017 vs 20142016 – The lossincrease in gain on disposition of real estate and real estate assets held for sale, assets, net decreased $204.7 million due to the Company’s disposition of 228 properties, including two properties owned by consolidated joint ventures, for an aggregate sales price of $1.4 billion, which resulted in a loss of $69.1 million, as compared to the disposal of 110 properties for an aggregate price of $1.6 billion, which resulted in a loss of $277.0 million
Benefit From Income Taxes
2016 vs 2015 – The decrease of $32.6$16.0 million during the year ended December 31, 2017 as compared to the same period in 2016, was primarily due to the Company’s disposition of 131 properties, excluding six properties transferred to the lender in either a decreasedeed-in-lieu of foreclosure or foreclosure sale transaction, for an aggregate sales price of $594.9 million which resulted in a gain of $64.7 million during the year ended December 31, 2017, as compared to the disposal of 301 properties for an aggregate sales price of $1.1 billion during the same period in 2016 for a gain of $50.6 million, which included $28.8 million of goodwill allocation related to the sales. During the year ended December 31, 2017, the Company also recognized a loss attributableof $3.1 million related to taxable subsidiariesassets classified as held for sale, as compared to a loss of $90.8 million.$5.1 million during the same period in 2016.
2015Provision for Income Taxes
2018 vs 20142017 – The benefit fromconsolidated provision for income taxes of $36.3$5.1 million for the year ended December 31, 2015 reflected an increase2018 as compared to a provision of $3.0$6.9 million from a benefit from income taxes of $33.3 million duringfor the same period in 2014. The increased benefit primarily2017 reflects an overall decrease in expense attributable to the tax impact related to the gain on the sale of certain Canadian properties in 2017.
2017 vs 2016 – The consolidated provision for income taxes of $6.9 million for the year ended December 31, 2017 as compared to a provision of $7.1 million for the same period in 2016 reflects an overall decrease in expense attributable to higher state taxes in 2016 and tax on net income from properties held in and sold by a TRS in 2016, which were partially offset by tax on the gain on the sale of certain Canadian properties in 2017.
Income (Loss) from Discontinued Operations, Net of Income Taxes
2018 vs 2017 – The decrease in loss from discontinued operations, net of income taxes withinof $22.8 million during the REI segment.year ended December 31, 2018 was primarily due to the completion of the sale of Cole Capital on February 1, 2018.
2017 vs 2016 – During the fourth quarter of 2017, the Company entered into a purchase and sale agreement to sell substantially all of the Cole Capital segment. The decrease in loss from discontinued operations, net of income taxes of $104.8 million during the year ended December 31, 2017 was primarily due to decreases in impairment of goodwill of $120.9 million, in general and administrative expenses of $18.8 million and in amortization of intangible assets of $11.7 million, partially offset by the loss recognized on classification as held for sale of $20.0 million and an increase in the provision for income taxes of $24.7 million. Revenues, net of reallowed fees and commissions increased $1.8 million for the year ended December 31, 2017, as compared to the year ended December 31, 2016.
Non-GAAP Measures
Our results are presented in accordance with U.S. GAAP. We also disclose certain non-GAAP measures, as discussed further below. Management uses these non-GAAP financial measures in our internal analysis of results and believes these measures are useful to investors for the reasons explained below. These non-GAAP financial measures should not be considered as substitutes for any measures derived in accordance with U.S. GAAP.
Funds from Operations and Adjusted Funds from Operations
Due to certain unique operating characteristics of real estate companies, as discussed below, the National Association of Real Estate Investment Trusts, Inc. (“NAREIT”Nareit”), an industry trade group, has promulgated a supplemental performance measure known as funds from operations (“FFO”), which we believe to be an appropriate supplemental performance measure to reflect the operating performance of a REIT. FFO is not equivalent to our net income or loss as determined under U.S. GAAP.
NAREITNareit defines FFO as net income or loss computed in accordance with U.S. GAAP, excluding gains or losses from disposition of property, depreciation and amortization of real estate assets, and impairment write-downs on real estate, including theand our pro rata share of FFO adjustments forrelated to unconsolidated partnerships and joint ventures. We calculated FFO in accordance with NAREIT’sNareit’s definition described above.
In addition to FFO, we use adjusted funds from operations (“AFFO”) as a non-GAAP supplemental financial performance measure to evaluate the operating performance of the Company. AFFO, as defined by the Company, excludes from FFO non-routine items such as acquisition relatedacquisition-related expenses, litigation, merger and other non-routine costs, net of insurance recoveries, held for sale loss on discontinued operations, net revenue or expense earned or incurred that is related to the Services Agreement we entered into with Cole Capital on February 1, 2018, gains or losses on sale of investment securities or mortgage notes receivable, and legal settlements and insurance recoveries not in the ordinary course of business.business and payments received on fully reserved loan receivables. We also exclude certain non-cash items such as impairments of goodwill orand intangible assets, straight-line rental revenue, unrealizedrent, net of bad debt expense related to straight-line rent, net direct financing lease adjustments, gains or losses on derivatives, reserves for loan loss, gains or losses on the extinguishment or forgiveness of debt, non-current portion of the tax benefit or expense, equity-based compensation and amortization of intangible assets, deferred financing costs, premiums and discounts on debt and investments, above-market lease assets and below-market lease liabilities. We omit the impact of the Excluded Properties and related non-recourse mortgage notes from FFO to calculate AFFO. Management believes that excluding these costs from FFO provides investors with supplemental performance information that is consistent with the performance models and analysis used by management, and provides investors a view of the performance of our portfolio over time. AFFO allows for a comparison of the performance of our operations with other publicly tradedpublicly-traded REITs, as AFFO, or an equivalent measure, is routinely reported by publicly tradedpublicly-traded REITs, and we believe often used by analysts and investors for comparison purposes.
For all of these reasons, we believe FFO and AFFO, in addition to net income (loss), as defined by U.S. GAAP, are helpful supplemental performance measures and useful in understanding the various ways in which our management evaluates the performance of the Company over time. However, not all REITs calculate FFO and AFFO the same way, so comparisons with other REITs may not be meaningful. FFO and AFFO should not be considered as alternatives to net income (loss) and are not intended to be used as a liquidity measure indicative of cash flow available to fund our cash needs. Neither the SEC, NAREIT,Nareit, nor any other regulatory body has evaluated the acceptability of the exclusions used to adjust FFO in order to calculate AFFO and its use as a non-GAAP financial performance measure.
The table below presents FFO and AFFO for the years ended December 31, 2016, 20152018, 2017 and 20142016 (in thousands, except share and per share data). and includes both continuing operations, which primarily represent the Company's real estate operations, and discontinued operations, which represent substantially all of Cole Capital.
| | | | | Year Ended December 31, | | Year Ended December 31, |
| Consolidated | | 2016 | | 2015 | | 2014 | |
| Net loss | | $ | (200,824 | ) | | $ | (323,492 | ) | | $ | (1,010,912 | ) | |
| | | | 2018 | | 2017 | | 2016 |
| Net (loss) income | | | $ | (88,030 | ) | | $ | 32,378 |
| | $ | (200,824 | ) |
| Dividends on non-convertible preferred stock | | (71,892 | ) | | (71,892 | ) | | (71,094 | ) | | (71,892 | ) | | (71,892 | ) | | (71,892 | ) |
| (Gain) loss on real estate assets and interest in joint venture, net | | (55,722 | ) | | 65,582 |
| | 277,031 |
| |
| Gain on disposition of real estate assets and interests in unconsolidated joint ventures, net | | | (95,034 | ) | | (61,536 | ) | | (55,722 | ) |
| Depreciation and amortization of real estate assets | | 756,315 |
| | 817,469 |
| | 844,527 |
| | 637,097 |
| | 703,133 |
| | 756,315 |
|
| Impairment of real estate | | 182,820 |
| | 91,755 |
| | 100,547 |
| | 54,647 |
| | 50,548 |
| | 182,820 |
|
| Proportionate share of adjustments for unconsolidated entities | | 2,719 |
| | 5,744 |
| | 9,037 |
| | 1,278 |
| | 477 |
| | 2,719 |
|
| FFO attributable to common stockholders and limited partners | | 613,416 |
| | 585,166 |
|
| 149,136 |
| | 438,066 |
| | 653,108 |
| | 613,416 |
|
| Acquisition related expenses | | 1,321 |
| | 6,243 |
| | 38,940 |
| |
| Acquisition-related expenses | | | 3,632 |
| | 3,402 |
| | 1,321 |
|
| Litigation, merger and other non-routine costs, net of insurance recoveries | | 3,884 |
| | 33,628 |
| | 199,616 |
| | 290,309 |
| | 51,762 |
| | 3,884 |
|
| Impairment of intangible assets | | 120,931 |
| | 213,339 |
| | 309,444 |
| |
| Reserve for loan loss | | — |
| | 15,300 |
| | — |
| |
| Legal settlements | | — |
| | (1,250 | ) | | (63,206 | ) | |
| Gain on investment securities | | — |
| | (65 | ) | | (6,357 | ) | |
| Loss on derivative instruments, net | | 1,191 |
| | 1,460 |
| | 10,570 |
| |
| Impairment of goodwill and intangible assets | | | — |
| | — |
| | 120,931 |
|
| Loss on disposition and held for sale loss on discontinued operations | | | 1,815 |
| | 20,027 |
| | — |
|
| Payments received on fully reserved loans | | | (4,792 | ) | | — |
| | — |
|
| Gain on investment securities and mortgage notes receivable | | | (4,092 | ) | | (65 | ) | | — |
|
| (Gain) loss on derivative instruments, net | | | (355 | ) | | (2,976 | ) | | 1,191 |
|
| Amortization of premiums and discounts on debt and investments, net | | (14,693 | ) | | (19,183 | ) | | (6,449 | ) | | (3,486 | ) | | (4,616 | ) | | (14,693 | ) |
| Amortization of above-market lease assets and deferred lease incentives, net of amortization of below-market lease liabilities | | 5,396 |
| | 4,522 |
| | 5,900 |
| | 4,178 |
| | 5,366 |
| | 5,396 |
|
| Net direct financing lease adjustments | | 2,264 |
| | 2,037 |
| | 1,595 |
| | 2,023 |
| | 2,093 |
| | 2,264 |
|
| Amortization and write-off of deferred financing costs | | 28,063 |
| | 33,998 |
| | 91,922 |
| | 19,166 |
| | 24,536 |
| | 28,063 |
|
| Amortization of management contracts | | 26,171 |
| | 25,903 |
| | 68,537 |
| | — |
| | 14,514 |
| | 26,171 |
|
Deferred tax benefit (1) | | (10,136 | ) | | (52,242 | ) | | (33,324 | ) | |
| Loss (gain) on extinguishment and forgiveness of debt, net | | 771 |
| | (4,812 | ) | | 21,869 |
| |
Deferred and other tax (benefit) expense (1) | | | (1,855 | ) | | 8,671 |
| | (10,136 | ) |
| (Gain) loss on extinguishment and forgiveness of debt, net | | | (5,360 | ) | | (18,373 | ) | | 771 |
|
| Straight-line rent, net of bad debt expense related to straight-line rent | | (54,190 | ) | | (82,398 | ) | | (75,171 | ) | | (39,723 | ) | | (44,903 | ) | | (54,190 | ) |
| Equity-based compensation | | 10,728 |
| | 14,500 |
| | 31,825 |
| | 12,417 |
| | 16,751 |
| | 10,728 |
|
| Other amortization and non-cash charges | | 5,296 |
| | 3,840 |
| | 2,727 |
| |
| Other amortization and non-cash charges, net | | | 1,446 |
| | 2,566 |
| | 5,296 |
|
| Proportionate share of adjustments for unconsolidated entities | | 1,044 |
| | 2,072 |
| | 3,140 |
| | 36 |
| | 378 |
| | 1,044 |
|
| Adjustments for Excluded Properties | | | 465 |
| | 6,528 |
| | — |
|
| AFFO attributable to common stockholders and limited partners | | $ | 741,457 |
| | $ | 782,058 |
|
| $ | 750,714 |
| | $ | 713,890 |
| | $ | 738,769 |
| | $ | 741,457 |
|
| | | | | | | | | | | | | |
| Weighted-average shares of common stock outstanding - basic | | 931,422,844 |
| | 903,360,763 |
| | 793,150,098 |
| |
| Weighted-average shares of Common Stock outstanding - basic | | | 969,092,268 |
| | 974,098,652 |
| | 931,422,844 |
|
Effect of Limited Partner OP Units and dilutive securities(2) | | 24,626,646 |
| | 26,013,303 |
| | 44,502,144 |
| | 24,145,875 |
| | 24,059,312 |
| | 24,626,646 |
|
Weighted-average shares of common stock outstanding - diluted (3) | | 956,049,490 |
|
| 929,374,066 |
|
| 837,652,242 |
| |
Weighted-average shares of Common Stock outstanding - diluted (3) | | | 993,238,143 |
| | 998,157,964 |
| | 956,049,490 |
|
| | | | | | | | | | | | | |
AFFO attributable to common stockholders and limited partners per diluted share | | $ | 0.78 |
| | $ | 0.84 |
|
| $ | 0.90 |
| | $ | 0.72 |
|
| $ | 0.74 |
| | $ | 0.78 |
|
| |
| (1) | This adjustment represents the non-current portion of the provision for or benefit from income taxes in order to show only the current portion of the provision for or benefit from income taxes as an impact to AFFO. For the three months ended December 31, 2017, this adjustment is net of a current tax benefit due to the acceleration of a bonus compensation-related deduction to take advantage of the Company’s higher effective tax rate in 2017. As the Company already recognized the prior year bonus compensation-related tax deduction during the three months ended March 31, 2017, the acceleration of the 2018 benefit was not included in the computation of AFFO. |
| |
| (2) | Dilutive securities include unvested restricted shares of common stock andCommon Stock, unvested restricted stock units.units and stock options. |
| |
| (3) | Weighted-average shares for all periods presented exclude the effect of the convertible debt as the Company would expect to settle the debt with cash.cash and any shares underlying restricted stock units that are not issuable based on the Company’s level of achievement of certain performance targets through the respective reporting period. |
The table below presents FFO and AFFO for the REI segment for the years ended December 31, 2016, 2015 and 2014 (in thousands, except share and per share data).
|
| | | | | | | | | | | | |
| | | Year Ended December 31, |
| REI segment: | | 2016 | | 2015 | | 2014 |
| Net loss | | $ | (69,373 | ) | | $ | (136,095 | ) | | $ | (714,238 | ) |
| Dividends on non-convertible preferred stock | | (71,892 | ) | | (71,892 | ) | | (71,094 | ) |
| (Gain) loss on real estate assets and interest in joint venture, net | | (55,722 | ) | | 65,582 |
| | 277,031 |
|
| Depreciation and amortization of real estate assets | | 756,315 |
| | 817,469 |
| | 844,527 |
|
| Impairment of real estate | | 182,820 |
| | 91,755 |
| | 100,547 |
|
| Proportionate share of adjustments for unconsolidated entities | | 2,719 |
| | 5,744 |
| | 9,037 |
|
| FFO attributable to common stockholders and limited partners |
| 744,867 |
|
| 772,563 |
|
| 445,810 |
|
| | | | | | | |
| Acquisition related expenses | | 1,257 |
| | 5,649 |
| | 35,578 |
|
| Litigation, merger and other non-routine costs, net of insurance recoveries | | 3,884 |
| | 33,628 |
| | 197,647 |
|
| Reserve for loan loss | | — |
| | 15,300 |
| | — |
|
| Legal settlements | | — |
| | (1,250 | ) | | (63,206 | ) |
| Gain on investment securities | | — |
| | (65 | ) | | (6,357 | ) |
| Loss on derivative instruments, net | | 1,191 |
| | 1,460 |
| | 10,570 |
|
| Amortization of premiums and discounts on debt and investments, net | | (14,693 | ) | �� | (19,183 | ) | | (6,449 | ) |
| Amortization of above-market lease assets and deferred lease incentives, net of amortization of below-market lease liabilities | | 5,396 |
| | 4,522 |
| | 5,900 |
|
| Net direct financing lease adjustments | | 2,264 |
| | 2,037 |
| | 1,595 |
|
| Amortization and write-off of deferred financing costs | | 28,063 |
| | 33,998 |
| | 91,922 |
|
| Loss (gain) on extinguishment and forgiveness of debt, net | | 771 |
| | (4,812 | ) | | 21,869 |
|
| Straight-line rent, net of bad debt expense related to straight-line rent | | (54,190 | ) | | (82,398 | ) | | (75,171 | ) |
| Equity-based compensation | | 5,448 |
| | 5,672 |
| | 22,304 |
|
| Other amortization and non-cash charges | | — |
| | 8 |
| | 320 |
|
| Proportionate share of adjustments for unconsolidated entities | | 1,044 |
| | 2,072 |
| | 3,140 |
|
| AFFO attributable to common stockholders and limited partners |
| $ | 725,302 |
|
| $ | 769,201 |
|
| $ | 685,472 |
|
| | | | | | | |
| Weighted-average shares of common stock outstanding - basic | | 931,422,844 |
| | 903,360,763 |
| | 793,150,098 |
|
Effect of Limited Partner OP Units and dilutive securities(1) | | 24,626,646 |
| | 26,013,303 |
| | 44,502,144 |
|
Weighted-average shares of common stock outstanding - diluted (2) |
| 956,049,490 |
|
| 929,374,066 |
|
| 837,652,242 |
|
| | | | | | | |
| AFFO attributable to common stockholders and limited partners per diluted share |
| $ | 0.76 |
|
| $ | 0.83 |
|
| $ | 0.82 |
|
| |
(1) | Dilutive securities include unvested restricted shares of common stock and unvested restricted stock units. |
| |
(2) | Weighted-average shares for all periods presented exclude the effect of the convertible debt as the Company would expect to settle the debt with cash. |
The table below presents FFO and AFFO for the Cole Capital segment for the years ended December 31, 2016, 2015 and 2014 (in thousands, except share and per share data).
|
| | | | | | | | | | | | |
| | | Year Ended December 31, |
| Cole Capital segment: | | 2016 | | 2015 | | 2014 |
| Net loss | | $ | (131,451 | ) | | $ | (187,397 | ) | | $ | (296,674 | ) |
| FFO attributable to common stockholders and limited partners |
| (131,451 | ) |
| (187,397 | ) |
| (296,674 | ) |
| | | | | | | |
| Acquisition related expenses | | 64 |
| | 594 |
| | 3,362 |
|
| Litigation, merger and other non-routine costs, net of insurance recoveries | | — |
| | — |
| | 1,969 |
|
| Impairment of intangible assets | | 120,931 |
| | 213,339 |
| | 309,444 |
|
| Amortization of Management Contracts | | 26,171 |
| | 25,903 |
| | 68,537 |
|
Deferred tax benefit (1) | | (10,136 | ) | | (52,242 | ) | | (33,324 | ) |
| Equity-based compensation | | 5,280 |
| | 8,828 |
| | 9,521 |
|
| Other amortization and non-cash charges | | 5,296 |
| | 3,832 |
| | 2,407 |
|
| AFFO attributable to common stockholders and limited partners |
| $ | 16,155 |
|
| $ | 12,857 |
|
| $ | 65,242 |
|
| | | | | | | |
| Weighted-average shares of common stock outstanding - basic | | 931,422,844 |
| | 903,360,763 |
| | 793,150,098 |
|
Effect of Limited Partner OP Units and dilutive securities(2) | | 24,626,646 |
| | 26,013,303 |
| | 44,502,144 |
|
Weighted-average shares of common stock outstanding - diluted (3) |
| 956,049,490 |
|
| 929,374,066 |
|
| 837,652,242 |
|
| | | | | | | |
| AFFO attributable to common stockholders and limited partners per diluted share |
| $ | 0.02 |
|
| $ | 0.01 |
|
| $ | 0.08 |
|
| |
(1) | This adjustment represents the non-current portion of the benefit from income taxes in order to show only the current portion of the provision for or benefit from income taxes as an impact to AFFO. |
| |
(2) | Dilutive securities include unvested restricted shares of common stock and unvested restricted stock units. |
| |
(3) | Weighted-average shares for all periods presented exclude the effect of the convertible debt as the Company would expect to settle the debt with cash. |
Liquidity and Capital Resources
General
Our principal liquidity needs for the next twelve months and beyond are to:
fund normal operating expenses;
fund capital expenditures, tenant improvements and leasing costs
meet debt service and principal repayment obligations, including balloon payments on maturing debt;
pay dividends;
fund capital expenditures, tenant improvements and leasing costs;
pay litigation costs and expenses;expenses (including any settlements or judgments); and
fund property and/or common stock acquisitions.
We expect to be able to satisfy these obligations using one or more of the following sources:
cash flow from operations;
proceeds from real estate dispositions;
utilization of existing line of credit;Credit Facility;
cash and cash equivalents balance; and
issuance of VEREIT debt and equity securities.securities; and
cash flow from insurance recoveries.
Universal Shelf Registration
In May 2016, VEREIT, Inc. and the OP filed a shelf registration statement with the SEC, which is effective for a term of three years. In accordance with SEC rules, the amount of securities to be issued pursuant to this shelf registration statement was not specified when it was filed and there is no specific dollar limit. The securities covered by this registration statement include (i) common stock, (ii) preferred stock, (iii) debt securities, (iv) depositary shares representing fractional interests in shares of preferred stock, (v) warrants to purchase debt securities, common stock, preferred stock, or depositary shares, and (vi) any combination of these securities. We may periodically offer one or more of these securities in amounts, prices and on terms to be announced when and if these securities are offered. The specifics of any future offerings, along with the use of proceeds of any securities offered, will be described in detail in a prospectus supplement, or other offering materials, at the time of any offering.
2016 Bond Offering and $300.0 million 2016 Term Loan
On June 2, 2016, the Operating Partnership closed its senior note offering, consisting of (i) $0.4 billion aggregate principal amount of 4.125% Senior Notes due June 1, 2021 and (ii) $0.6 billion aggregate principal amount of 4.875% Senior Notes due June 1, 2026 and entered into the $300.0 million 2016 Term Loan, as defined in Note 11 –Debt. On July 5, 2016, the Company redeemed all of the $1.3 billion aggregate principal amount of our outstanding 2.000% Senior Notes due February 2017, plus accrued and unpaid interest thereon and the required make-whole premium.
Common Stock Offering
On August 10, 2016, VEREIT, Inc. issued 69.0 million shares of common stock in a public offering for net proceeds, after underwriting discounts and offering costs, of $702.5 million which were used to repay the entire $300.0 million 2016 Term Loan and in part to repay amounts under the Credit Facility.
Continuous Equity Offering Program
On September 19, 2016, the Company registered a continuous equity offering program (the “Program”) pursuant to which the Company can offer and sell, from time to time through September 19, 2019 in “at-the-market” offerings or certain other transactions, shares of common stockCommon Stock with an aggregate gross sales price of up to $750.0 million, through its sales agents. The Company intends to use the proceeds from any sale of shares for general corporate purposes, which may include funding potential acquisitions and repurchasing or repaying outstanding indebtedness. As of December 31, 2016,2018, no shares of common stockCommon Stock have been issued pursuant to the Program.
Share Repurchase Program
On May 3, 2018, the Company’s Board of Directors terminated the 2017 Share Repurchase Program and authorized the 2018 Share Repurchase Program, which permits the Company to repurchase up to $200.0 million of its outstanding Common Stock through May 3, 2019, as market conditions warrant. As of December 31, 2018, the Company had $194.4 million available for share repurchases under the 2018 Share Repurchase Program. Additional shares of Common Stock repurchased by the Company, if any, will be returned to the status of authorized but unissued shares of Common Stock.
Disposition Activity
As part of our effort to optimize our real estate portfolio by focusing on holding core assets, during the year ended December 31, 2016,2018, we disposed of 301149 properties, including one property conveyed to a lender in a deed-in-lieu of foreclosure transaction, and one property owned by an unconsolidated joint venture for an aggregate sales price of $1.20 billion,$560.5 million, of which our share was $1.14 billion,$521.4 million, resulting in consolidated proceeds of $1.00 billion$502.3 million after disposition feesrepayment of the unconsolidated joint venture’s mortgage loan and debt assumptions.closing costs. We expect to continue to explore opportunities to sell additional properties as we pay off outstanding debt and reduce our borrowings under the Credit Facility, which will reduce our overall leverage andto provide us further financial flexibility.flexibility and fund property acquisitions.
Credit Facility
Summary and Obligations
We,On May 23, 2018, the Company, as guarantor, and the Operating Partnership, as borrower, are parties to theentered into a Credit FacilityAgreement with Wells Fargo Bank, National Association, as administrative agent, and the other lenders party thereto.
thereto that allows for maximum borrowings of $2.9 billion, consisting of a $2.0 billion Revolving Credit Facility and a $900.0 million Credit Facility Term Loan, available through February 23, 2019, for up to four borrowings of delayed-draw term loans. As of December 31, 2016,2018, the Revolving Credit Facility had an outstanding balance of $253.0 million and $150.0 million had been drawn on the Credit Facility allowed for maximum borrowings of $2.8 billion, consisting of a $0.5 billion term loan facility (the “Credit Facility Term Loan”) and a $2.3 billion revolving credit facility. The maximum aggregate dollar amount of letters of credit that may be outstanding at any one time underLoan. In connection with entering into the Credit Facility is $25.0 million. DuringAgreement, the year ended December 31, 2016, the CompanyOP repaid all of the outstanding borrowingsobligations under its revolving credit facility. Additionally, the Company repaid $0.5 billion of the2014 Credit Facility Term Loan, resulting in the write-off of unamortized deferred financing costs of $4.3 million, which is included in (loss) gain on extinguishment and forgiveness of debt, net in the accompanying consolidated statements of operations. As discussed in Note 12 –Derivatives and Hedging Activities, in connection with the early repayment of a portion of the Credit Facility Term Loan, the Company terminated two of its interest rate swaps, resulting in the reclassification of $3.3 million in accumulated other comprehensive loss to earnings, which is included in loss on derivative instruments, net in the accompanying consolidated statements of operations. The remaining outstanding balance on the Credit Facility Term Loan of $0.5 billion is, in effect, fixed through the use of derivative instruments used to hedge interest rate volatility. Including the spread, which can vary based on the General Partner’s credit rating, the interest rate on this portion was 3.25% at December 31, 2016. As of December 31, 2016, a maximum of $2.3 billion was available to the OP for future borrowings, subject to borrowing availability.Agreement.
The revolving credit facilityRevolving Credit Facility generally bears interest at an annual rate of London Inter-Bank Offer Rate (“LIBOR”) plus 1.00%0.775% to 1.80%1.55% or Base Rate plus 0.00% to 0.80%0.55% (based upon ourthe General Partner’s then current credit rating). “Base Rate” is defined as the highest of the prime rate, the federal funds rate plus 0.50% or a floating rate based on one month LIBOR plus 1.0%, determined on a daily basis. The Credit Facility Term Loan generally bears interest at an annual rate of LIBOR plus 1.15%0.85% to 2.05%1.75%, or Base Rate plus 0.15%0.00% to 1.05%0.75% (based upon ourthe General Partner’s then current credit rating). In addition, the Credit Agreement provides the flexibility for interest rate auctions, pursuant to which, at the Company’s election, the Company may request that lenders make competitive bids to provide revolving loans, which competitive bids may be at pricing levels that differ from the foregoing interest rates.
The Credit Agreement provides for monthly interest payments under the Credit Facility. In the event of default, at the election of a majority of the lenders (or automatically upon a bankruptcy event of default with respect to the OP or the General Partner), the commitments of the lenders under the Credit Facility will mature, and payment of any unpaid amounts in respect of the Credit Facility will be accelerated. The revolving credit facility and the Credit Facility Term Loan both terminate on June 30, 2018, in each case, unless extended in accordance with the terms of the Credit Agreement. The Credit Agreement provides for a one-year extension option with respect to each of the revolving credit facility and the Credit Facility Term Loan, exercisable at the Company’s election and subject to certain customary conditions, as well as certain customary “amend and extend” provisions. At any time, upon timely notice by the OP and subject to any breakage fees, the OP may prepay borrowings under the Credit Facility (subject to certain limitations applicable to the prepayment of any loans obtained through an interest rate auction, as described above). The OP incurs a fee equal to 0.15% to 0.25% per annum (based upon the General Partner’s then current credit rating) multiplied by the commitments (whether or not utilized) in respect of the revolving credit facility. In addition, the OP incurs customary administrative agent, letter of credit issuance, letter of credit fronting, extension and other fees.
Credit Facility Covenants
The Credit Facility requires restrictions on corporate guarantees, as well as the maintenance of certain financial covenants. The key financial covenants in the Credit Facility, as defined and calculated per the terms of the Credit Agreement include maintaining the following:
|
| | |
| Unsecured Credit Facility Key Covenants | | Required |
Minimum tangible net worth | | ≥ $5.5 B |
| Ratio of total indebtedness to total asset value | | ≤ 60% |
| Ratio of adjusted EBITDA to fixed charges | | ≥ 1.5x |
| Ratio of secured indebtedness to total asset value | | ≤ 45% |
| Ratio of unsecured indebtedness to unencumbered asset value | | ≤ 60% |
| Ratio of unencumbered adjusted NOI to unsecured interest expense | | ≥ 1.75x |
Minimum unencumbered asset value | | ≥ $8.0 B |
As of December 31, 2016, the maximum percentage of unencumbered asset value permitted to be attributable to restaurants was 30%.
The Company believes that it was in compliance with the financial covenants pursuant to the Credit Agreement and is not restricted from accessing any borrowing availability under the Credit Facility as of December 31, 2016.
2018.
Corporate Bonds
Summary and Obligations
During the year ended December 31, 2018, the Company closed the 2025 Senior Notes offering, consisting of $550.0 million aggregate principal amount of 4.625% Senior Notes due 2025. The OP used the net proceeds from the offering of the notes to repay borrowings under its Revolving Credit Facility.
As of December 31, 2016,2018, the OP had $2.25$3.4 billion aggregate principal amount of Senior Notes outstanding.outstanding, with a weighted-average maturity of 5.0 years. The indenture governing the Senior Notes requires that the Company be in compliance with certain key financial covenants, including maintaining the following:
|
| | |
| Corporate Bond Key Covenants | | Required |
| Limitation on incurrence of total debt | | ≤ 65% |
| Limitation on incurrence of secured debt | | ≤ 40% |
| Debt service coverage ratio | | ≥ 1.5x |
| Maintenance of total unencumbered assets | | ≥ 150% |
There were no material changes to the financial covenants of our existing Senior Notes during the year ended December 31, 2016. The covenants of our new Senior Notes are materially the same as our existing Senior Notes.2018. As of December 31, 2016,2018, the Company believes that it was in compliance with these financial covenants based on the covenant limits and calculations in place at that time.
On February 6, 2019, the Company’s 2019 Senior Notes matured and the principal outstanding of $750.0 million, plus accrued and unpaid interest thereon, was repaid, utilizing borrowings under the Credit Facility.
Convertible Debt
Summary and Obligations
On July 29, 2013,During the year ended December 31, 2018, the Company’s 2018 Convertible Notes matured and the principal outstanding of $597.5 million, plus accrued and unpaid interest thereon, was repaid with proceeds from the Revolving Credit Facility.
As of December 31, 2018, the Company issued $300.0had $402.5 million aggregate principal amount outstanding of convertible senior notes due 2018 (the “2018 Convertible Notes”) and, pursuant to an over-allotment exercise by the underwriters of such 2018 Convertible Notes offering, issued an additional $10.0 million aggregate principal amount of its 2018 Convertible Notes on August 1, 2013. On December 10, 2013, the Company issued an additional $287.5 million of the 2018 Convertible Notes by reopening the indenture governing the 2018 Convertible Notes. Also on December 10, 2013, the Company issued $402.5 million aggregate principal amount of convertible senior notes due15, 2020 (the “2020 Convertible Notes and, together with the 2018 Convertible Notes, the “Convertible Notes”). The 2018 Convertible Notes have a weighted average interest rate of 3.00%, a conversion rate of 60.5997 and mature on August 1, 2018 andOP has issued corresponding identical convertible notes to the 2020 Convertible Notes have a weighted average interest rate of 3.75%, a conversion rate of 66.7249 and mature on December 15, 2020. The Convertible Notes are convertible into cash or shares of the Company’s Common Stock at the Company’s option.General Partner. There were no changes to the terms of ourthe 2020 Convertible Notes duringand the year endedCompany believes that it was in compliance with the financial covenants pursuant to the indenture governing the 2020 Convertible Notes as of December 31, 2016.2018.
Mortgage Notes Payable and Other Debt
Summary and Obligations
As of December 31, 2016,2018, we had non-recourse mortgage indebtedness of $2.6$1.9 billion, which was collateralized by 619459 properties, reflecting a decrease from December 31, 20152017 of $409.9$153.9 million derived primarily from our disposition activity during the year ended December 31, 2016.2018. Our mortgage indebtedness bore interest at the weighted-average rate of 4.95%4.93% per annum and had a weighted-average maturity of 4.63.4 years. We may in the future incur additional mortgage debt on the properties we currently own or use long-term non-recourse financing to acquire additional properties.
On December 30, 2016, the Company received a notice of default from the lender of a non-recourse loan secured by 16 properties, which had an outstanding balance of $11.6 million on the notice date, due to the Company’s non-repayment of the respective loan balance at maturity. The Company and the lender are assessing options in relation to the default.
On March 6, 2015, the Company received a notice of default from the lender of a non-recourse loan secured by two properties, which had an outstanding balance of $38.1 million on the notice date, due to the Company’s election not to make a reserve payment required per the loan agreement. The foreclosure sale of the first property securing the loan occurred during the three months ended June 30, 2016. As the loan was outstanding upon the foreclosure of the first property, the Company recorded a loss of $3.4 million in gain (loss) on disposition of real estate and held for sale assets, net in the accompanying consolidated statements of operations for the year ended December 31, 2016. The foreclosure proceedings on the second property that secured the loan were completed during the three months ended September 30, 2016. As a result of the foreclosure sale and deed transfer of both properties securing the loan, the Company recognized a gain on forgiveness of debt of $19.1 million, which is included in (loss) gain on extinguishment and forgiveness of debt, net in the accompanying consolidated statements of operations.
Restrictions on Loan Covenants
The payment terms of our loan obligations vary. In general, only interest amounts are payable monthly with all unpaid principal and interest due at maturity. Some of our loan agreements require that we comply with specific reporting and financial covenants mainly related to debt coverage ratios and loan-to-value ratios. Each loan that has these requirements has specific ratio thresholds that must be met.
Restrictions on Loan Covenants
Our mortgage loan obligations generally restrict corporate guarantees and require the maintenance of financial covenants, including maintenance of certain financial ratios (such as specified debt to equity and debt service coverage ratios), as well as the maintenance of a minimum net worth. Each loan that has these requirements has specific ratio thresholds that must be met. The mortgage loan agreements contain no dividend restrictions except in the event of default or when a distribution would drive liquidity below the applicable thresholds. At December 31, 2016,2018, the Company believes that it was in compliance with the financial covenants under the mortgage loan agreements except forand had no restrictions on the loans in default as described above and in “Note 11 –Debt” to our consolidated financial statements.payment of dividends.
Other DebtLitigation
As ofDuring the year ended December 31, 2016,2018, we entered into settlement agreements with various plaintiffs in connection with litigation filed as a result of the findings of the Audit Committee Investigation for $217.5 million. The Company had a secured term loan from KBC Bank, N.V. with an outstanding principal balance of $20.9also entered into settlement agreements for $15.7 million and remaining unamortized premium of $0.1 million (the “KBC Loan”). The interest coupon on the KBC Loan is fixed at 5.81% annually until its maturity in January 2018. The KBC Loan is non-recourse to the Company, subject to limited non-recourse exceptions. The KBC Loan provides for monthly payments of both principal and interest. The scheduled principal repayments subsequent to December 31, 2016 are $7.7 million2018, which was accrued and $13.2 millionincluded in litigation, merger and other non-routine costs, net of insurance recoveries in the consolidated statements of operations for the yearsyear ended 2017 and 2018, respectively.December 31, 2018.
Dividends
On November 1, 2016,5, 2018, the Company’s boardBoard of directorsDirectors declared a quarterly cash dividend of $0.1375 per share of common stockCommon Stock (equaling an annualized dividend rate of $0.55 per share) for the fourth quarter of 20162018 to stockholders of record as of December 30, 2016,31, 2018, which was paid on January 17, 2017.15, 2019. An equivalent distribution by the Operating Partnership is applicable per OP unit.
Our Series F Preferred Stock, as discussed in “Note 1611 – Equity” to our consolidated financial statements, will pay cumulative cash dividends at the rate of 6.70% per annum on their liquidation preference of $25.00 per share (equivalent to $1.675 per share on an annual basis). As of December 31, 2016,2018, there were approximately 42.8 million shares of Series F Preferred Stock (and approximately 42.8 million corresponding Series F Preferred Units that were issued to the General Partner) and 86,874 Limited Partner Series F Preferred Units that were issued and outstanding.
Contractual Obligations
The following is a summary of our contractual obligations as of December 31, 20162018 (in thousands):
| | | | | Total | | Less than 1 year | | 1-3 years | | 4-5 years | | More than 5 years | | Total | | Less than 1 year | | 1-3 years | | 4-5 years | | More than 5 years |
Principal payments - mortgage notes and other debt (1) | | $ | 2,650,896 |
| | $ | 294,774 |
| | $ | 452,073 |
| | $ | 665,333 |
| | $ | 1,238,716 |
| |
Interest payments - mortgage notes and other debt (1) (2) (3) | | 582,710 |
| | 124,443 |
| | 207,956 |
| | 157,006 |
| | 93,305 |
| |
| Principal payments - mortgage notes | | | $ | 1,917,132 |
| | $ | 167,279 |
| | $ | 617,957 |
| | $ | 459,741 |
| | $ | 672,155 |
|
Interest payments - mortgage notes (1) (2) | | | 321,914 |
| | 93,710 |
| | 144,935 |
| | 80,830 |
| | 2,439 |
|
| Principal payments - Credit Facility | | 500,000 |
| | — |
| | 500,000 |
| | — |
| | — |
| | 403,000 |
| | — |
| | — |
| | 403,000 |
| | — |
|
Interest payments - Credit Facility (2) (3) | | 24,601 |
| | 16,459 |
| | 8,142 |
| | — |
| | — |
| |
Interest payments - Credit Facility (2) | | | 58,702 |
| | 15,918 |
| | 30,990 |
| | 11,794 |
| | — |
|
| Principal payments - corporate bonds | | 2,250,000 |
| | — |
| | 750,000 |
| | 400,000 |
| | 1,100,000 |
| | 3,400,000 |
| | 750,000 |
| | 400,000 |
| | — |
| | 2,250,000 |
|
| Interest payments - corporate bonds | | 558,737 |
| | 91,250 |
| | 162,188 |
| | 127,875 |
| | 177,424 |
| | 754,473 |
| | 120,075 |
| | 226,151 |
| | 202,776 |
| | 205,471 |
|
| Principal payments - convertible debt | | 1,000,000 |
| | — |
| | 597,500 |
| | 402,500 |
| | — |
| | 402,500 |
| | — |
| | 402,500 |
| | — |
| | — |
|
| Interest payments - convertible debt | | 88,086 |
| | 33,019 |
| | 40,644 |
| | 14,423 |
| | — |
| | 29,517 |
| | 15,094 |
| | 14,423 |
| | — |
| | — |
|
| Operating and ground lease commitments | | 310,977 |
| | 18,774 |
| | 36,943 |
| | 34,845 |
| | 220,415 |
| | 287,159 |
| | 18,479 |
| | 36,120 |
| | 35,890 |
| | 196,670 |
|
| Build-to-suit commitments | | 201 |
| | 201 |
| | — |
| | — |
| | — |
| |
Build-to-suit and other commitments (3) | | | 30,343 |
| | 30,343 |
| | — |
| | — |
| | — |
|
| Total | | $ | 7,966,208 |
| | $ | 578,920 |
| | $ | 2,755,446 |
| | $ | 1,801,982 |
| | $ | 2,829,860 |
| | $ | 7,604,740 |
| | $ | 1,210,898 |
| | $ | 1,873,076 |
| | $ | 1,194,031 |
| | $ | 3,326,735 |
|
| |
| (1) | For loans in maturity default, discussed in Note 11 –Debt and Note 22 – Subsequent Events, the payment obligations for future periods are based on an estimated extension of maturity during the first quarter of 2017.
|
| |
(2) | As of December 31, 2016,2018, we had $242.2$50.7 million of variable rate mortgage notes and $0.5 billion of variable rate debt on the Credit Facility effectively fixed through the use of interest rate swap agreements. We used the effective interest rates fixed under our swap agreements to calculate the debt payment obligations in future periods. |
| |
(3)(2) | Interest payments due in future periods on the $11.3$14.0 million of variable rate debt and the Credit Facility payment obligations were calculated using a forward LIBOR curve. |
| |
| (3) | Includes one build-to-suit development project and the Company’s share of capital expenditures related an expansion project of the property held within an unconsolidated joint venture. |
Cash Flow Analysis for the year ended December 31, 20162018
Operating Activities – During the year ended December 31, 2016,2018, net cash provided by operating activities decreased $66.5$299.4 million to $800.5$493.9 million from $867.0$793.3 million during the same period in 2015.2017. The decrease was primarily due to a decreasean increase in rental receipts related tolitigation and other non-routine costs, including litigation settlements, paid during the disposition of 529 consolidated properties subsequent to January 1, 2015. This decreaseyear ended December 31, 2018. In addition, there was partially offset by a decrease in interest payments and payments relateddue to the Audit Committee Investigationrepayment of the 2018 Convertible Notes and related litigation,a reduction of secured debt, offset by the issuance of the 2025 Senior Notes and an increase in net of insurance recoveries.borrowings under the credit facilities during the year ended December 31, 2018 as compared to the same period in 2017.
Investing Activities – Net cash provided by investing activities for the year ended December 31, 2016 decreased $42.42018 increased $425.2 million to $890.2$151.1 million from $932.6$274.1 million net cash used in investing activities during the same period in 2015.2017. The decreaseincrease was primarily related to an increasea decrease in investments in real estate assets of $63.9$198.4 million, net proceeds from disposition of discontinued operations of $122.9 million and an investmentincrease in an unconsolidated joint venturecash proceeds from dispositions of $25.8 million during 2016 and a decrease in uses and refunds of deposits for real estate assetsand joint ventures of $35.4$56.8 million. These decreases were partially offset by a decrease in real estate development payments of $40.3 million and the receipt of $50.0 million on the Affiliate Lines of Credit, as compared to $10.0 million in 2015.
Financing Activities – Net cash used in financing activities of $1.5 billion$655.4 million decreased $643.8$101.2 million during the year ended December 31, 20162018 from $2.1 billion$756.6 million during the same period in 2015.2017. The decrease was primarily duerelated to the 2016 common stock offering offering resultinga decrease in payments on mortgage notes payable and other debt, including debt extinguishment costs of $286.5 million, which was partially offset by a decrease of $117.1 million in net proceeds after underwriting discountsrelated to the credit facilities, corporate bonds and offering costs,convertible notes and repurchases of $702.5Common Stock under the Share Repurchase Programs of $50.2 million and an increasewith no comparable repurchases during the same period in proceeds from debt, net of repayments, of $305.6 million, which were partially offset by an increase in distributions paid of $345.0 million.2017.
Cash Flow Analysis for the year ended December 31, 2015
Operating Activities –The level of cash flows provided by operating activities is affected by acquisition and transaction costs, the timing of interest payments, as well as the receipt of scheduled rent payments. During the year ended December 31, 2015, net cash provided by operating activities increased $364.1 million to $867.0 million from $502.9 million. The increase was primarily due to an increase in revenue, excluding non-cash adjustments, of $59.2 million, a decrease in merger and other transaction expenses of $87.7 million, a decrease in prepayment fees and penalties relating to debt repayment of $35.9 million and a decrease in the net change in assets and liabilities of $206.4 million.
Investing Activities –Net cash provided by investing activities for the year ended December 31, 2015 increased $3.5 billion to $932.6 million from net cash used in investing activities in 2014 of $2.6 billion. The increase in cash flow primarily related to a decrease in cash paid for real estate assets of $3.5 billion and a decrease in cash paid for real estate businesses of $756.2 million, both as a result of a decrease in acquisition activity as compared to the same period in the prior year. The increase was partially offset by a decrease in cash proceeds from the disposition of real estate assets of $589.7 million, driven primarily by the sale of the multi-tenant portfolio in 2014.
Financing Activities –Net cash used in financing activities increased $4.5 billion to $2.1 billion during the year ended December 31, 2015 from net cash provided by financing activities of $2.4 billion. The increase was primarily related to a decrease in proceeds from the issuance of corporate bonds of $2.5 billion and an increase in net payments on the Credit Facility of $1.6 billion, combined with a decrease in the proceeds from the issuance of common stock, net of offering costs, of $1.6 billion, all of which related to the fact that the Company raised more capital to fund large acquisitions in the prior period. The increase was partially offset by a decrease in distributions paid of $714.9 million.
Cash Flow Analysis for the year ended December 31, 20142017
Operating Activities – During the year ended December 31, 2014,2017, net cash provided by operating activities decreased $4.7 million to $793.3 million from $797.9 million during the same period in 2016. The decrease was $502.9 million. Cash flows provided by operating activitiesprimarily due to a decrease in rental receipts related to the disposition of 438 consolidated properties subsequent to January 1, 2016 and an increase in litigation and other non-routine costs paid during the year ended December 31, 2014 were mainly due to adjusted net income of $806.6 million (net loss of $1.0 billion adjusted for non-cash items including the issuance of OP Units, depreciation and amortization, gain on sale of properties, equity-based compensation, gain on derivative instruments and gain on the early extinguishment of debt totaling $1.8 billion, in the aggregate),2017. This decrease was mostly offset by a decrease in accounts payableinterest payments and accrued expensesinsurance recoveries received as compared to the same period in 2016, the receipt of $16.3 million, a decreasean income tax refund during the year ended December 31, 2017, and an increase in prepaid and other assetsrental receipts related to the acquisition of $97.1 million and a decrease in deferred rent, derivative and other liabilities of $99.9 million.96 consolidated properties subsequent to January 1, 2016.
Investing Activities – Net cash used in investing activities for the year ended December 31, 20142017 changed $1.2 billion to $274.1 million from cash provided by investing activities of $881.6 million during the same period in 2016. The change was $2.6 billion, primarily related to the totalan increase in investments in real estate assets of $598.8 million and decrease in cash consideration of $756.2 million for the merger of American Realty Capital Trust IV, Inc. with and into a subsidiary of the OP (the “ARCT IV Merger”), the merger of Cole with and into a wholly owned subsidiary of the Company (the “Cole Merger”) and the merger of CCPT with and into a direct subsidiary of the General Partner (the “CCPT Merger”) and $3.5 billion in the acquisition of 1,107 properties. The net cash used in investing activities was partially offset by the proceeds from the saledispositions of propertiesreal estate and joint ventures of $1.6 billion, combined with the proceeds from the sale of investment securities of $159.8$555.2 million.
Financing Activities – Net cash provided byused in financing activities was $2.4 billionof $756.6 million decreased $750.4 million during the year ended December 31, 2014 related2017 from $1.5 billion during the same period in 2016. The decrease was primarily due to a decrease in repayments of debt, net of proceeds, from the issuance of corporate bonds of $2.5$1.5 billion, proceeds from mortgage notes payable of $1.0 billion and proceeds from the issuance of common stock of $1.6 billion. These inflows werewhich was partially offset by payments on mortgage notes payablethe 2016 Common Stock offering resulting in net proceeds, after underwriting discounts and offering costs, of $1.1 billion, total$702.8 million and an increase in distributions paid of $920.3 million and $116.4 million of deferred financing cost payments.$28.1 million.
Election as a REIT
The General Partner elected to be taxed as a REIT for U.S. federal income tax purposes under Sections 856 through 860 of the Internal Revenue Code commencing with the taxable year ended December 31, 2011. We believe we are organized and operating in such a manner as to qualify to be taxed as a REIT for the taxable year ended December 31, 2018. As a REIT, except as discussed below, the General Partner is generally is not subject to federal income tax on taxable income that it distributes to its stockholders so long as it distributes at least 90% of its annual taxable income (computed without regard to the deduction for dividends paid and excluding net capital gains). REITs are subject to a number of other organizational and operational requirements. Even ifHowever, the General Partner, maintains its qualification for taxation as a REIT, it may beTRS entities, and the OP are still subject to certain state and local taxes on its income, franchise and property taxes in the various jurisdictions in which they operate. The General Partner may also be subject to federal income taxes on certain income and excise taxes on its undistributed income. We believe we are organized and operating in such a manner as to qualify to be taxed as a REIT for the taxable year ended December 31, 2016.
The Operating PartnershipOP is classified as a partnership for U.S. federal income tax purposes. As a partnership, the Operating PartnershipOP is not a taxable entity for U.S. federal income tax purposes. Instead, each partner in the Operating PartnershipOP is required to take into accountinclude its allocable share of the Operating Partnership’sOP’s income, gains, losses, deductions and credits for each taxable year. However, the Operating Partnership may be subject to certain state and local taxes on its income and property. Under the LPA, the Operating PartnershipOP is required to conduct business in such a manner as to permit the General partnerPartner at all times to qualify as a REIT.
The Company conducts substantially all of its Cole Capital segment business activities through a TRS. A TRS is a subsidiary of a REIT that is subject to corporate federal, state and local income taxes, as applicable. The Company’s use of a TRS enables it to engage in certain business activities while complying with the REIT qualification requirements and to retain any income generated by these businesses for reinvestment without the requirement to distribute those earnings. The Company conductsconducted substantially all of the Cole Capital business activities through a TRS until it sold the Cole Capital business on February 1, 2018.
During the year ended December 31, 2018, the Company conducted all of its business in the United States, Puerto Rico and Canada and as a result, it filesfiled income tax returns in the U.S. federal jurisdiction, the Canadian federal jurisdiction and various state and local jurisdictions. With few exceptions, the Company is no longer subject to routine examinations by taxing authorities for years before 2014. Certain of the Company’s inter-companyintercompany transactions that have been eliminated in consolidation for financial accounting purposes are also subject to taxation.
Inflation
We may be adversely impacted by inflation on any leases that do not contain indexed escalation provisions. However, net leases that require the tenant to pay its allocable share of operating expenses, including common area maintenance costs, real estate taxes and insurance, may reduce our exposure to increases in costs and operating expenses resulting from inflation.
Related Party Transactions and Agreements
InThrough the past, we entered into certain agreements and paid certain fees or reimbursements to the Former Manager and its affiliates. As of December 31, 2014, as a resultclosing of the departure of certain executive officers (one of whom was a director) in the fourth quarter of 2014, the Former Manager and its affiliatesCole Capital sale, we were no longer affiliated with us. Accordingly, there have been no related party transactions to report during the years ended December 31, 2016 and 2015 aside from those with the Cole REITs, as further described below.
We are contractually responsible for managing the Cole REITs’ affairs on a day-to-day basis, identifying and making acquisitions and investments on the Cole REITs’ behalf, and recommending to each of the Cole REIT’s respective board of directors an approach for providing investors with liquidity. In addition, we distributedistributed the shares of common stock for certain of the Cole REITs and adviseadvised them regarding offerings, managemanaged relationships with participating broker-dealers and financial advisors, and provideprovided assistance in connection with compliance matters relating to the offerings. We receivereceived compensation and reimbursement for services relating to the Cole REITs’ offerings and the investment, management and disposition of their respective assets, as applicable. See “Note 1813 – Related Party Transactions and Arrangements” to our consolidated financial statements in this report for a further explanation of the various related party transactions, agreements and fees.
Off-Balance Sheet Arrangements
We have no material off-balance sheet arrangements that have had or are reasonably likely to have a current or future effect on our financial condition, changes in financial condition, revenues or expenses, results of operations, liquidity, capital expenditures or capital resources.
Item 7A. Quantitative and Qualitative Disclosures About Market Risk.
Market Risk
The market risk associated with financial instruments and derivative financial instruments is the risk of loss from adverse changes in market prices or interest rates. Our market risk arises primarily from interest rate risk relating to variable-rate borrowings. To meet our short and long-term liquidity requirements, we borrow funds at a combination of fixed and variable rates. Our interest rate risk management objectives are to limit the impact of interest rate changes inon earnings and cash flows and to manage our overall borrowing costs. To achieve these objectives, from time to time, we may enter into interest rate hedge contracts such as swaps, collars and treasury lock agreements in order to mitigate our interest rate risk with respect to various debt instruments. We would not hold or issue these derivative contracts for trading or speculative purposes. We have limited operations in Canada and thus, are not exposed to material foreign currency fluctuations.
Interest Rate Risk
As of December 31, 2016,2018, our debt included fixed-rate debt, including debt that has interest rates that are fixed with the use of derivative instruments, with a fair value and carrying value each of $6.5 billion and $6.4 billion, respectively.$5.7 billion. Changes in market interest rates on our fixed rate debt impact the fair value of the debt, but they have no impact on interest incurred or cash flow. For instance, if interest rates rise 100 basis points, and the fixed rate debt balance remains constant, we expect the fair value of our debt to decrease, the same way the price of a bond declines as interest rates rise. The sensitivity analysis related to our fixed-rate debt assumes an immediate 100 basis point move in interest rates from their December 31, 20162018 levels, with all other variables held constant. A 100 basis point increase in market interest rates would result in a decrease in the fair value of our fixed rate debt of $231.0$201.3 million. A 100 basis point decrease in market interest rates would result in an increase in the fair value of our fixed-rate debt of $230.6$213.8 million.
As of December 31, 2016,2018, our debt included variable-rate debt with a fair value of $417.2 million and a carrying value each of $11.3$417.0 million. The sensitivity analysis related to our variable-rate debt assumes an immediate 100 basis point move in interest rates from their December 31, 20162018 levels, with all other variables held constant. A 100 basis point increase or decrease in variable interest rates on our variable-rate notes payabledebt would increase or decrease our interest expense by $0.1$4.2 million annually. See “Note 117 – Debt” to our consolidated financial statements.
As of December 31, 2016,2018, our interest rate swapsswap had a fair value that resulted in assets of $0.2 million and a liability of $3.5$0.5 million. See “Note 122 –Derivatives and Hedging Activities Summary of Significant Accounting Policies” to our consolidated financial statements for further discussion.
As the information presented above includes only those exposures that existed as of December 31, 2016,2018, it does not consider exposures or positions arising after that date. The information presented herein has limited predictive value. Future actual realized gains or losses with respect to interest rate fluctuations will depend on cumulative exposures, hedging strategies employed and the magnitude of the fluctuations.
These amounts were determined by considering the impact of hypothetical interest rate changes on our borrowing costs and assume no other changes in our capital structure.
Credit Risk
Concentrations of credit risk arise when a number of tenants are engaged in similar business activities, or activities in the same geographic region, or have similar economic features that would cause their ability to meet contractual obligations, including those to the Company, to be similarly affected by changes in economic conditions. The Company is subject to tenant, geographic and industry concentrations. Any downturn of the economic conditions in one or more of these tenants, geographies or industries could result in a material reduction of our cash flows or material losses to us.
The factors considered in determining the credit risk of our tenants include, but are not limited to: payment history; credit status and change in status (credit ratings for public companies are used as a primary metric); change in tenant space needs (i.e., expansion/downsize); tenant financial performance; economic conditions in a specific geographic region; and industry specific credit considerations. We believe that the credit risk of our portfolio is reduced by the high quality of our existing tenant base, reviews of prospective tenants’ risk profiles prior to lease execution and consistent monitoring of our portfolio to identify potential problem tenants.
Item 8. Financial Statements and Supplementary Data.
The information required by Item 8 is hereby incorporated by reference to our consolidated financial statements beginning on page F-1 of this document.
Item 9. Changes in and Disagreements with Accountants on Accounting and Financial Disclosure.
None.
Item 9A. Controls and Procedures.
I. Discussion of Controls and Procedures of the General Partner
For purposes of the discussion in this Part I of Item 9A, the “Company” refers to the General Partner.
Evaluation of Disclosure Controls and Procedures
We maintain disclosure controls and procedures (as defined in Rules 13a-15(e) and 15d-15(e) of the Securities Exchange Act of 1934, as amended (the “Exchange Act”)) that are designed to provide reasonable assurance that information required to be disclosed in our Exchange Act reports is recorded, processed, summarized and reported within the time periods specified in the Securities and Exchange Commission’sSEC’s rules and forms, and that such information is accumulated and communicated to our management, including our Chief Executive Officer and Chief Financial Officer, as appropriate, to allow timely decisions regarding required disclosure. In designing and evaluating the disclosure controls and procedures, we recognize that no controls and procedures, no matter how well designed and operated, can provide absolute assurance of achieving the desired control objectives.
In accordance with Rules 13a-15(b) and 15d-15(b) of the Exchange Act, management, under the supervision and with the participation of our Chief Executive Officer and Chief Financial Officer, carried out an evaluation of the effectiveness of our disclosure controls and procedures as of December 31, 20162018 and determined that the disclosure controls and procedures were effective at a reasonable assurance level as of that date.
Management’s Annual Report on Internal Control over Financial Reporting
Our management is responsible for establishing and maintaining adequate internal control over financial reporting, as such term is defined in Rules 13a-15(f) and 15d-15(f) under the Exchange Act. Internal control over financial reporting is a process to provide reasonable assurance regarding the reliability of our financial reporting and the preparation of financial statements for external purposes in accordance with GAAP. Because of its inherent limitations, internal control over financial reporting is not intended to provide absolute assurance that a misstatement of our financial statements would be prevented or detected.
Under the supervision and with the participation of our management, including our Chief Executive Officer and Chief Financial Officer, we conducted an evaluation of the effectiveness of our internal control over financial reporting based on the framework in Internal Control — Integrated Framework (2013) issued by the Committee of Sponsoring Organizations of the Treadway Commission.
Based on this evaluation, management has concluded that our internal control over financial reporting was effective as of December 31, 2016.2018.
The effectiveness of our internal control over financial reporting as of December 31, 20162018 has been audited by Deloitte & Touche LLP, an independent registered public accounting firm, as stated in their report in this Annual Report on Form 10-K.
Changes in Internal Control Over Financial Reporting
No change occurred in our internal control over financial reporting (as defined in Rules 13a-15(f) and 15d -15(f) of the Exchange Act) during the three months ended December 31, 20162018 that has materially affected, or is reasonably likely to materially affect, our internal control over financial reporting.
II. Discussion of Controls and Procedures of the Operating Partnership
In the information incorporated by reference into this Part II of Item 9A, the term “Company” refers to the Operating Partnership, except as the context otherwise requires.
Evaluation of Disclosure Controls and Procedures
We maintain disclosure controls and procedures (as defined in Rules 13a-15(e) and 15d-15(e) of the Exchange Act that are designed to provide reasonable assurance that information required to be disclosed in our Exchange Act reports is recorded, processed, summarized and reported within the time periods specified in the Securities and Exchange Commission’sSEC’s rules and forms, and that such information is accumulated and communicated to our management, including our Chief Executive Officer and Chief Financial Officer, as
appropriate, to allow timely decisions regarding required disclosure. In designing and evaluating the disclosure controls and procedures, we recognize that no controls and procedures, no matter how well designed and operated, can provide absolute assurance of achieving the desired control objectives.
In accordance with Rules 13a-15(b) and 15d-15(b) of the Exchange Act, management, under the supervision and with the participation of our Chief Executive Officer and Chief Financial Officer, carried out an evaluation of the effectiveness of our disclosure controls and procedures as of December 31, 20162018 and determined that the disclosure controls and procedures were effective at a reasonable assurance level as of that date.
Management’s Annual Report on Internal Control over Financial Reporting
Our management is responsible for establishing and maintaining adequate internal control over financial reporting, as such term is defined in Rules 13a-15(f) and 15d-15(f) under the Exchange Act. Internal control over financial reporting is a process to provide reasonable assurance regarding the reliability of our financial reporting and the preparation of financial statements for external purposes in accordance with GAAP. Because of its inherent limitations, internal control over financial reporting is not intended to provide absolute assurance that a misstatement of our financial statements would be prevented or detected.
Under the supervision and with the participation of our management, including our Chief Executive Officer and Chief Financial Officer, we conducted an evaluation of the effectiveness of our internal control over financial reporting based on the framework in Internal Control — Integrated Framework (2013) issued by the Committee of Sponsoring Organizations of the Treadway Commission.
Based on this evaluation, management has concluded that our internal control over financial reporting was effective as of December 31, 2016.2018.
Changes in Internal Control Over Financial Reporting
No change occurred in our internal control over financial reporting (as defined in Rules 13a-15(f) and 15d -15(f) of the Exchange Act) during the three months ended December 31, 20162018 that has materially affected, or is reasonably likely to materially affect, our internal control over financial reporting.
REPORT OF INDEPENDENT REGISTERED PUBLIC ACCOUNTING FIRM
To the shareholders and the Board of Directors and Stockholders of
VEREIT, Inc.
Phoenix, AZ
Opinion on Internal Control over Financial Reporting
We have audited the internal control over financial reporting of VEREIT, Inc. and subsidiaries (the “Company”) as of December 31, 2016,2018, based on criteria established in Internal Control-IntegratedControl - Integrated Framework (2013)(2013) issued by the Committee of Sponsoring Organizations of the Treadway Commission. Commission (COSO). In our opinion, the Company maintained, in all material respects, effective internal control over financial reporting as of December 31, 2018, based on criteria established in Internal Control - Integrated Framework (2013) issued by COSO.
We have also audited, in accordance with the standards of the Public Company Accounting Oversight Board (United States) (PCAOB), the consolidated financial statements and financial statement schedules as of and for the year ended December 31, 2018, of the Company and our report dated February 20, 2019, expressed an unqualified opinion on those financial statements.
Basis for Opinion
The Company’s management is responsible for maintaining effective internal control over financial reporting and for its assessment of the effectiveness of internal control over financial reporting included in the accompanying Management’s Annual Report on Internal Control over Financial Reporting. Our responsibility is to express an opinion on the Company’s internal control over financial reporting based on our audit. We are a public accounting firm registered with the PCAOB and are required to be independent with respect to the Company in accordance with the U.S. federal securities laws and the applicable rules and regulations of the Securities and Exchange Commission and the PCAOB.
We conducted our audit in accordance with the standards of the Public Company Accounting Oversight Board (United States).PCAOB. Those standards require that we plan and perform the audit to obtain reasonable assurance about whether effective internal control over financial reporting was maintained in all material respects. Our audit included obtaining an understanding of internal control over financial reporting, assessing the risk that a material weakness exists, testing and evaluating the design and operating effectiveness of internal control based on the assessed risk and performing such other procedures as we considered necessary in the circumstances. We believe that our audit provides a reasonable basis for our opinion.
Definition and Limitations of Internal Control over Financial Reporting
A company’s internal control over financial reporting is a process designed by, or under the supervision of, the company’s principal executive and principal financial officers, or persons performing similar functions, and effected by the company’s board of directors, management, and other personnel to provide reasonable assurance regarding the reliability of financial reporting and the preparation of financial statements for external purposes in accordance with accounting principles generally accepted in the United States of America (“generally accepted accounting principles”).principles. A company’s internal control over financial reporting includes those policies and procedures that (1) pertain to the maintenance of records that, in reasonable detail, accurately and fairly reflect the transactions and dispositions of the assets of the company; (2) provide reasonable assurance that transactions are recorded as necessary to permit preparation of financial statements in accordance with generally accepted accounting principles, and that receipts and expenditures of the company are being made only in accordance with authorizations of management and directors of the company; and (3) provide reasonable assurance regarding prevention or timely detection of unauthorized acquisition, use, or disposition of the company’s assets that could have a material effect on the financial statements.
Because of theits inherent limitations, of internal control over financial reporting including the possibility of collusion or improper management override of controls, material misstatements due to error or fraud may not be preventedprevent or detected on a timely basis.detect misstatements. Also, projections of any evaluation of the effectiveness of the internal control over financial reporting to future periods are subject to the risk that the controls may become inadequate because of changes in conditions, or that the degree of compliance with the policies or procedures may deteriorate.
In our opinion, the Company maintained, in all material respects, effective internal control over financial reporting as of December 31, 2016, based on the criteria established in Internal Control-Integrated Framework (2013) issued by the Committee of Sponsoring Organizations of the Treadway Commission.
We have also audited, in accordance with the standards of the Public Company Accounting Oversight Board (United States), the consolidated financial statements and financial statement schedules as of and for the year ended December 31, 2016 of the Company and our report dated February 22, 2017 expressed an unqualified opinion on those consolidated financial statements and financial statement schedules.
/s/ DELOITTE & TOUCHE LLP
Phoenix, AZArizona
February 22, 201720, 2019
Item 9B. Other Information.
The following disclosure would have otherwise been filed in a Current Report on Form 8-K under the heading “Item 5.02. Departure of Directors or Certain Officers; Election of Directors; Appointment of Certain Officers; Compensatory Arrangements of Certain Officers.”
Amendment to Employment Letter with William C. Miller
Effective February 22, 2017, the Company amended (the “Miller Amendment”) the Employment Letter effective as of February 23, 2016 with William C. Miller (the “Miller Employment Agreement”). Pursuant to the Miller Amendment, the provision in the Miller Employment Agreement regarding a sales management bonus is deleted, and instead, Mr. Miller is eligible to receive a sales management bonus equal to 17 basis points on all capital raised by the Cole REITs sponsored by Cole Capital (excluding capital raised pursuant to each such REIT’s distribution reinvestment plan) but only after the total capital raise for the applicable year exceeds $200 million and only on the amount of capital raised above the $200 million threshold, up to a maximum threshold of $550 million. Except as noted herein, all other provisions of the Miller Employment Agreement remain unchanged.
The foregoing description of the Miller Amendment does not purport to be complete and is qualified in its entirety by reference to such amendment a copy of which is attached to this Annual Report on Form 10-K.
None
PART III
Item 10. Directors, Executive Officers and Corporate Governance.
ThisThe information required by this Item will be containedincluded in our definitive proxy statement for the 20172019 Annual Meeting of Stockholders (the “Proxy Statement”), to be filed within 120 days following the end of our fiscal year, and is incorporated herein by reference.
Item 11. Executive Compensation.
The information required by this Item will be included in the Proxy Statement and is incorporated herein by reference.
Item 12. Security Ownership of Certain Beneficial Owners and Management and Related Stockholder Matters.
The information required by this Item will be included in the Proxy Statement and is incorporated herein by reference.
Item 13. Certain Relationships and Related Transactions, and Director Independence.
The information required by this Item will be included in the Proxy Statement and is incorporated herein by reference.
Item 14. Principal Accounting Fees and Services.
The information required by this Item will be included in the Proxy Statement and is incorporated herein by reference.
PART IV
Item 15. Exhibits and Financial Statement Schedules.
Financial Statements
The Financial Statements are included herein at pages F-1 through F-84.F-60.
Financial Statement Schedules
Schedule II - Valuation and Qualifying Accounts is included herein on page F-85.F-61.
Schedule III - Real Estate and Accumulated Depreciation is included herein on pages F-86F-62 through F-214.F-194.
Schedule IV - Mortgage Loans Held for Investment is included herein on page F-215.F-195.
Exhibits
The following exhibits are included in this Annual Report on Form 10-K for the fiscal year ended December 31, 20162018 (and are numbered in accordance with Item 601 of Regulation S-K):
|
| | |
| Exhibit No. | | Description |
| 2.1 | | Agreement and Plan of Merger by and among VEREIT, Inc., VEREIT Operating Partnership, L.P., Tiger Acquisition LLC, American Realty Capital Trust III, Inc. and American Realty Capital Operating Partnership III, L.P., dated as of December 14, 2012 (Incorporated by reference to the Company’s Current Report on Form 8-K (File No. 001-35263), filed with the SEC on December 17, 2012). |
| 2.2 | | Agreement and Plan of Merger, by and among, VEREIT, Inc., VEREIT Operating Partnership, L.P., Safari Acquisition, LLC, CapLease, Inc., CapLease, LP and CLF OP General Partner LLC, dated as of May 28, 2013 (Incorporated by reference to the Company’s Current Report on Form 8-K (File No.NO. 001-35263), filed with the SEC on May 28, 2013). |
| 2.3 | | Purchase and Sale Agreement, by and among, CNL APF Partners, LP and Certain Affiliates as Seller Parties, and VEREIT Operating Partnership, L.P., as Purchaser, dated May 31, 20132013. (Incorporated by reference to the Company’s Amended Current Report on Form 8-K/A (File No. 001-35263), filed with the SEC on June 7, 2013)7,2013). |
| 2.4 | | Agreement and Plan of Merger, dated as of July 1, 2013, among VEREIT, Inc., American Realty Capital Trust IV, Inc., Thunder Acquisition, LLC, VEREIT Operating Partnership, L.P. and American Realty Capital Operating Partnership IV, L.P. (Incorporated by reference to the Company’s Current Report on Form 8-K (File No. 001-35263), filed with the SEC on July 2, 2013). |
| 2.4.1 | | Amendment dated as of October 6, 2013 to the Agreement and Plan of Merger, dated as of July 1, 2013, by and among VEREIT, Inc., VEREIT Operating Partnership, L.P., Thunder Acquisition, LLC, American Realty Capital Trust IV, Inc. and American Realty Capital Operating Partnership IV, L.P. (Incorporated by reference to the Company’s First Current Report on Form 8-K (File No. 001-35263), filed with the SEC on October 7, 2013). |
| 2.4.2 | | Second Amendment dated as of October 11, 2013 to the Agreement and Plan of Merger, dated as of July 1, 2013, by and among VEREIT, Inc., VEREIT Operating Partnership, L.P., Thunder Acquisition, LLC, American Realty Capital Trust IV, Inc. and American Realty Capital Operating Partnership IV, L.P. (Incorporated by reference as Annex E to the Company’s Final Prospectus filed Pursuant to Rule 424(b)(3) (Registration No. 333-190056), filed with the SEC on December 4, 2013). |
| 2.5 | | Equity Interest Purchase Agreement by and between Inland American Real Estate Trust, Inc. and AR Capital, LLC, dated as of August 8, 2013 (Incorporated by reference to the Company’s Amended Current Report on Form 8-K/A (File No. 001-35263), filed with the SEC on September 25, 2013). |
2.6 | | Purchase and Sale Agreement by and among ARC PADRBPA001, LLC and AR Capital, LLC and the sellers described on schedules thereto, dated as of July 24, 2013 (Incorporated by reference to the Company’s Second Current Report on Form 8-K (File No. 001-35263), filed with the SEC on October 7, 2013). |
2.7 | | |
| 3.1 | | |
| 3.2 | | |
| 3.3 | | |
| 3.4 | | |
| 3.5 | | |
| 3.6 | | |
|
| | |
Exhibit No. | | Description |
| 3.7 | | |
|
| | |
| Exhibit No. | | Description |
| 3.8 | | |
| 3.9 | | |
| 3.10 | | |
| 3.11 | | |
| 3.12 | | |
| 3.13 | | |
| 4.1 | | |
| 4.2 | | |
| 4.3 | | |
| 4.4 | | |
| 4.5 | | |
| 4.6 | | Form of 3.00% Convertible Senior Notes due 2018 (Incorporated by reference to the Company's Current Report on Form 8-K (File No. 001-35263), filed with the SEC on December 11, 2013). |
4.7 | | |
4.84.7 | | |
4.94.8 | | Indenture, dated as of February 6, 2014, among ARC Properties Operating Partnership, L.P., Clark Acquisition, LLC, the guarantors named therein and U.S. Bank National Association, as trustee (Incorporated by reference to the Company'sCompany’s Current Report on Form 8-K (File No. 001-35263), filed with the SEC on February 7, 2014). |
4.104.9 | | |
4.114.10 | | Registration Rights Agreement,First Supplemental Indenture, dated as of February 6, 2014,9, 2015, by and among ARC Properties Operating Partnership, L.P., Clark Acquisition, LLC, the guarantors named therein, BarclaysAmerican Realty Capital Properties, Inc. and Citigroup Global Markets Inc.U.S. Bank National Association (Incorporated by reference to the Company'sCompany’s Current Report on Form 8-K (File No. 001-35263), filed with the SEC on February 7, 2014)13, 2015). |
4.124.11 | | |
| 4.12 | | |
| 4.13 | | |
| 4.14 | | |
| 4.15 | | |
| 4.16 | | |
| 4.17 | | |
|
| | |
| Exhibit No. | | Description |
| 10.1 | | |
| 10.2 | | |
| 10.3 | | |
| 10.4† | | |
10.210.5† | | |
10.310.6† | | |
10.410.7†* | | |
| 10.8†* | | |
| 10.9†* | | |
| 10.10†* | | |
| 10.11†* | | |
| 10.12†* | | |
| 10.13†* | | |
| 10.14† | | |
| 10.15† | | |
| 10.16† | | |
|
| | |
Exhibit No.10.17† | | Description |
10.5 | | Asset Purchase and Sale Agreement, dated as of July 1, 2013, between VEREIT Operating Partnership, L.P. and American Realty Capital Advisors IV, LLC (Incorporated by reference to the Company's Current Report on Form 8-K (File No. 001-35263), filed with the SEC on July 2, 2013). |
10.6 | | Contribution and Exchange Agreement, dated as of January 3, 2014, among VEREIT Operating Partnership, L.P., American Realty Capital Trust IV Special Limited Partner, LLC, AREP and ARCT IV Operating Partnership (Incorporated by reference to the Company's Current Report on Form 8-K (File No. 001-35263), filed with the SEC on January 3, 2014). |
10.7 | | Asset Purchase and Sale Agreement, entered into as of January 8, 2014, by and among VEREIT Operating Partnership, L.P. and ARC Properties Advisors, LLC (Incorporated by reference to the Company's Annual Report on Form 10-K (File No. 001-35263), for the year ended December 31, 2013 filed with the SEC on February 27, 2014). |
10.8 | | Assignment and Assumption Agreement, dated January 8, 2014, by and between AR Capital, LLC and VEREIT, Inc. (Incorporated by reference to the Company's Annual Report on Form 10-K (File No. 001-35263), for the year ended December 31, 2013 filed with the SEC on February 27, 2014). |
10.9 | | Agreement of Purchase and Sale, dated as of June 11, 2014, among certain subsidiaries of VEREIT, Inc. party thereto and BRE DDR Retail Holdings III LLC (Incorporated by reference to the Company's Quarterly Report on Form 10-Q (File No. 001-35263), for the quarter ended June 30, 2014 filed with the SEC on July 29, 2014). |
10.10 | | Amended and Restated Credit Agreement, dated as of June 30, 2014, among VEREIT Operating Partnership, L.P., VEREIT, Inc., lenders party thereto, and Wells Fargo Bank, National Association, as administrative agent (Incorporated by reference to the Company's Quarterly Report on Form 10-Q (File No. 001-35263), for the quarter ended June 30, 2014 filed with the SEC on July 29, 2014). |
10.11 | | Second Amendment to Credit Agreement, entered into among VEREIT Operating Partnership, L.P., VEREIT, Inc., the lenders party thereto and Wells Fargo Bank, National Association, dated July 31, 2015 (Incorporated by reference to the Company's Quarterly Report on Form 10-Q (File No. 001-35263), for the quarter ended June 30, 2015 filed with the SEC on August 6, 2015). |
10.12 | | First Amendment to Agreement of Purchase and Sale, dated as of July 18, 2014, among certain subsidiaries of VEREIT, Inc. party thereto and BRE DDR Retail Holdings III LLC (Incorporated by reference to the Company's Quarterly Report on Form 10-Q (File No. 001-35263), for the quarter ended June 30, 2014 filed with the SEC on July 29, 2014). |
10.13 | | Equity Purchase Agreement by and between VEREIT Operating Partnership, L.P. and RCS Capital Corporation, dated as of September 30, 2014 (Incorporated by reference to the Company's Quarterly Report on Form 10-Q (File No. 001-35263), for the quarter ended September 30, 2014 filed with the SEC on March 2, 2015). |
10.14 | | Employment Agreement, dated as of January 9, 2015, by and between VEREIT, Inc. and Michael Sodo (Incorporated by reference to the Company's Current Report on Form 8-K (File No. 001-35263), filed with the SEC on January 15, 2015). |
10.15 | | Employment Agreement, dated as of March 10, 2015, by and between VEREIT, Inc. and Glenn Rufrano (Incorporated by reference to the Company's Current Report on Form 8-K (File No. 001-35263), filed with the SEC on March 16, 2015). |
10.16 | | |
10.1710.18† | | |
10.1810.19† | | Amended and Restated Employment Letter,Agreement, dated as of May 11,March 10, 2015, by and between VEREIT, Inc. and Gavin BrandonGlenn Rufrano (Incorporated by reference to the Company's QuarterlyCompany’s Current Report on Form 10-Q8-K (File No. 001-35263), for the quarter ended June 30, 2015 filed with the SEC on August 6,March 16, 2015). |
10.1910.20† | | Amended and Restated Employee Confidentiality and Non-Competition Agreement, dated May 11, 2015, executed by Gavin Brandon (Incorporated by reference |
10.20 | | Employment Agreement, dated as of May 21,March 10, 2015, by and between VEREIT, Inc. and Lauren GoldbergGlenn Rufrano (Incorporated by reference to the Company's Quarterly Report on Form 10-Q (File No. 001-35263), for the quarter ended June 30, 2015 filed with the SEC on August 6, 2015). |
10.21 | | Amendment effective February 23, 2016, to Employment Agreement between VEREIT, Inc. and Lauren Goldberg, as of May 26, 2015 (Incorporated by reference to the Company'sCompany’s Annual Report on Form 10-K (File No. 001-35263), for the year ended December 31, 20152017 filed with the SEC on February 23, 2016)22, 2018). |
10.2210.21† | | Separation Agreement and General Release, dated June 10, 2015, by and between VEREIT, Inc., Equity Fund Advisors, Inc. and Michael T. Ezzell (Incorporated by reference to the Company's Quarterly Report on Form 10-Q (File No. 001-35263), for the quarter ended June 30, 2015 filed with the SEC on August 6, 2015). |
10.23 | | Form of Deferred Stock Unit Award Agreement to be entered into with Non-Executive Directors pursuant to the VEREIT, Inc. Equity Plan (Incorporated by reference to the Company's Quarterly Report on Form 10-Q (File No. 001-35263), for the quarter ended June 30, 2015 filed with the SEC on August 6, 2015). |
10.24 | | Form of 2015 Time-Based Restricted Stock Unit Award Agreement to be entered into with Employees pursuant to the VEREIT, Inc. Equity Plan (Incorporated by reference to the Company's Quarterly Report on Form 10-Q (File No. 001-35263), for the quarter ended June 30, 2015 filed with the SEC on August 6, 2015). |
10.25 | | Form of 2015 Performance-Based Restricted Stock Unit Award Agreement to be entered into with Employees pursuant to the VEREIT, Inc. Equity Plan (Incorporated by reference to the Company's Quarterly Report on Form 10-Q (File No. 001-35263), for the quarter ended June 30, 2015 filed with the SEC on August 6, 2015). |
|
| | |
Exhibit No. | | Description |
10.26 | | Separation Agreement, dated as of October 1, 2015, by and between VEREIT, Inc. and Michael J. Sodo (Incorporated by reference to the Company's Quarterly Report on Form 10-Q (File No. 001-35263), for the quarter ended September 31, 2015 filed with the SEC on November 5, 2015). |
10.27 | | Employment Letter and Confidentiality and Non-Competition Agreement, effective as of October 5, 2015, by and between VEREIT, Inc. and Michael J. Bartolotta (Incorporated by reference to the Company'sCompany’s Quarterly Report on Form 10-Q (File No. 001-35263), for the quarter ended September 31, 2015 filed with the SEC on November 5, 2015). |
10.2810.22† | | Form of 2016 Time-Based Restricted Stock Unit Award Agreement to be entered into with executive officers pursuantAmendment, effective February 21, 2018, to the Employment Agreement, dated as of October 5, 2015, by and between VEREIT, Inc. Equity Planand Michael J. Bartolotta (Incorporated by reference to the Company'sCompany’s Annual Report on Form 10-K (File No. 001-35263), for the year ended December 31, 2017 filed with the SEC on February 22, 2018). |
| 10.23† | | |
| 10.24† | | |
10.2910.25† | | Form of 2016 Performance-Based Restricted Stock Unit Award Agreement to be entered into with executive officers pursuantAmendment, effective February 21, 2018, to the Employment Agreement, dated as of May 21, 2015, by and between VEREIT, Inc. Equity Planand Lauren Goldberg (Incorporated by reference to the Company'sCompany’s Annual Report on Form 10-K (File No. 001-35263), for the year ended December 31, 20152017 filed with the SEC on February 23, 2016)22, 2018). |
|
10.30 | | |
| Exhibit No. | | Form of 2016 Time-Based Restricted Stock Unit Award Agreement to be entered into with other employees pursuant to the VEREIT, Inc. Equity Plan (Incorporated by reference to the Company's Annual Report on Form 10-K for the year ended December 31, 2015 filed with the SEC on February 23, 2016).Description |
10.3110.26† | | Form of 2016 Performance-Based Restricted Stock Unit Award Agreement to be entered into with other employees pursuant to the VEREIT, Inc. Equity Plan (Incorporated by reference to the Company's Annual Report on Form 10-K for the year ended December 31, 2015 filed with the SEC on February 23, 2016). |
10.32 | | |
10.3310.27† | | Amendment, effective February 21, 2018, to the Employment Agreement, dated as of February 23, 2016, by and between VEREIT, Inc. and Paul McDowell (Incorporated by reference to the Company’s Annual Report on Form 10-K (File No. 001-35263), for the year ended December 31, 2017 filed with the SEC on February 22, 2018). |
| 10.28† | | |
10.3410.29† | | Amended and RestatedAmendment, effective February 21, 2018, to the Employment Letter,Agreement, dated as of February 23, 2016, by and between VEREIT, Inc. and William C. MillerThomas Roberts (Incorporated by reference to the Company'sCompany’s Annual Report on Form 10-K (File No. 001-35263), for the year ended December 31, 20152017 filed with the SEC on February 23, 2016)22, 2018). |
10.35*10.30† | | Amendment effective February 22, 2017, to the Amended and Restated Employment |
10.36 | | Credit Agreement, dated as of June 2, 2016, amongMiller and VEREIT, Operating Partnership, L.P., VEREIT, Inc. the lenders party thereto and JPMorgan Chase Bank, N.A., as administrative agentInc (Incorporated by reference to the Company's CurrentCompany’s Annual Report on Form 8-K10-K (File No. 001-35263), for the year ended December 31, 2017 filed with the SEC on June 3, 2016)February 22, 2018). |
12.1* | | VEREIT Inc. Consolidated Ratio of Earnings to Fixed Charges |
12.2* | | VEREIT Operating Partnership, L.P. Consolidated Ratio of Earnings to Fixed Charges |
| 21.1* | | |
| 23.1* | | |
| 23.2* | | |
23.3* | | Consent of Grant Thornton LLP. |
23.4* | | Consent of Grant Thornton LLP. |
| 31.1* | | |
| 31.2* | | |
| 31.3* | | |
| 31.4* | | |
| 32.1** | | |
| 32.2** | | |
| 32.3** | | |
| 32.4** | | |
|
| | |
Exhibit No. | | Description |
| 101.INS* | | XBRL Instance Document. |
| 101.SCH* | | XBRL Taxonomy Extension Schema Document. |
| 101.CAL* | | XBRL Taxonomy Extension Calculation Linkbase Document. |
| 101.DEF* | | XBRL Taxonomy Extension Definition Linkbase Document. |
| 101.LAB* | | XBRL Taxonomy Extension Label Linkbase Document. |
| 101.PRE* | | XBRL Taxonomy Extension Presentation Linkbase Document. |
_____________________________
| |
| ** | In accordance with Item 601(b)(32) of Regulation S-K, this Exhibit is not deemed “filed” for purposes of Section 18 of the Exchange Act or otherwise subject to the liabilities of that section. Such certifications will not be deemed incorporated by reference into any filing under the Securities Act or the Exchange Act, except to the extent that the registrant specifically incorporates it by reference. |
† Management contract or compensatory plan or arrangement.
Item 16. Form 10-K Summary.
Not Applicable
SIGNATURES
Pursuant to the requirements of the Securities Exchange Act of 1934, as amended, each registrant has duly caused this Annual Report on Form 10-K to be signed on its behalf by the undersigned thereunto duly authorized.
|
| | |
| | VEREIT, INC. |
| | By: | /s/ Michael J. Bartolotta |
| | Michael J. Bartolotta |
| | Executive Vice President and Chief Financial Officer (Principal Financial Officer) |
|
| | |
| | VEREIT OPERATING PARTNERSHIP, L.P. |
| | By: VEREIT, Inc., its sole general partner |
| | By: | /s/ Michael J. Bartolotta |
| | Michael J. Bartolotta |
| | Executive Vice President and Chief Financial Officer (Principal Financial Officer) |
Dated: February 22, 201720, 2019
Pursuant to the requirements of the Securities Exchange Act of 1934, as amended, this Form 10-K has been signed below by the following persons on behalf of each registrant and in the capacities and on the dates indicated.
|
| | | | |
| Name | | Capacity * | | Date |
| | | | | |
| /s/ Glenn J. Rufrano | | Chief Executive Officer | | February 22, 201720, 2019 |
| Glenn J. Rufrano | | (Principal Executive Officer and Director) | | |
| | | | | |
| /s/ Michael J. Bartolotta | | Executive Vice President and Chief Financial Officer | | February 22, 201720, 2019 |
| Michael J. Bartolotta | | (Principal Financial Officer) | | |
| | | | | |
| /s/ Gavin B. Brandon | | Senior Vice President and Chief Accounting Officer | | February 22, 201720, 2019 |
| Gavin B. Brandon | | (Principal Accounting Officer) | | |
| | | | |
/s/ Bruce D. Frank | | Director | | February 22, 2017 |
Bruce D. Frank | | | | |
| | | | | |
| /s/ Hugh R. Frater | | Director, Non-Executive Chairman | | February 22, 201720, 2019 |
| Hugh R. Frater | | | | |
| | | | | |
| /s/ David B. Henry | | Director | | February 22, 201720, 2019 |
| David B. Henry | | | | |
| | | | |
| /s/ Mary Hogan Preusse | | Director | | February 20, 2019 |
| Mary Hogan Preusse | | | | |
| | | | |
| /s/ Richard J. Lieb | | Director | | February 20, 2019 |
| Richard J. Lieb | | | | |
| | | | | |
| /s/ Mark S. Ordan | | Director | | February 22, 201720, 2019 |
| Mark S. Ordan | | | | |
| | | | | |
| /s/ Eugene A. Pinover | | Director | | February 22, 201720, 2019 |
| Eugene A. Pinover | | | | |
| | | | | |
| /s/ Julie G. Richardson | | Director | | February 22, 201720, 2019 |
| Julie G. Richardson | | | | |
|
| |
| * | Each person is signing in his or her capacity as an officer and/or director of VEREIT, Inc., which is the sole general partner of VEREIT Operating Partnership, L.P. |
INDEX TO CONSOLIDATED FINANCIAL STATEMENTS
|
| |
| | Page |
| Financial Statements |
| |
| |
| |
| |
| |
| |
| |
| |
| |
| |
| |
| |
| F-61 |
| F-86F-62 |
| F-215F-195 |
REPORT OF INDEPENDENT REGISTERED PUBLIC ACCOUNTING FIRM
To the shareholders and the Board of Directors and Stockholders of
VEREIT, Inc.
Phoenix, AZ
Opinion on the Financial Statements
We have audited the accompanying consolidated balance sheets of VEREIT, Inc. and subsidiaries (the "Company"“Company”) as of December 31, 20162018 and 2015, and2017, the related consolidated statements of operations, comprehensive income (loss), changes in equity and cash flows for each of the twothree years in the period ended December 31, 2016. Our audits also included2018, and the financial statementrelated notes and the schedules listed in the Index at Item 15. These consolidated15 (collectively referred to as the “financial statements”). In our opinion, the financial statements andpresent fairly, in all material respects, the financial statement schedules are the responsibilityposition of the Company's management. Our responsibility is to express an opinion on these consolidated financial statementsCompany as of December 31, 2018 and financial statement schedules based on our audits.2017, and the results of its operations and its cash flows for each of the three years in the period ended December 31, 2018, in conformity with accounting principles generally accepted in the United States of America.
We conducted our auditshave also audited, in accordance with the standards of the Public Company Accounting Oversight Board (United States). (PCAOB), the Company’s internal control over financial reporting as of December 31, 2018, based on criteria established in Internal Control - Integrated Framework (2013) issued by the Committee of Sponsoring Organizations of the Treadway Commission and our report dated February 20, 2019, expressed an unqualified opinion on the Company’s internal control over financial reporting.
Basis for Opinion
These financial statements are the responsibility of the Company’s management. Our responsibility is to express an opinion on the Company’s financial statements based on our audits. We are a public accounting firm registered with the PCAOB and are required to be independent with respect to the Company in accordance with the U.S. federal securities laws and the applicable rules and regulations of the Securities and Exchange Commission and the PCAOB.
We conducted our audits in accordance with the standards of the PCAOB. Those standards require that we plan and perform the audit to obtain reasonable assurance about whether the financial statements are free of material misstatement. An audit includesmisstatement, whether due to error or fraud. Our audits included performing procedures to assess the risks of material misstatement of the financial statements, whether due to error or fraud, and performing procedures that respond to those risks. Such procedures included examining, on a test basis, evidence supportingregarding the amounts and disclosures in the financial statements. An auditOur audits also includes assessingincluded evaluating the accounting principles used and significant estimates made by management, as well as evaluating the overall presentation of the financial statement presentation.statements. We believe that our audits provide a reasonable basis for our opinion.
In our opinion, the consolidated financial statements referred to above present fairly, in all material respects, the financial position of the company and subsidiaries as of December 31, 2016 and 2015, and the results of their operations and their cash flows for each of the two years in the period ended December 31, 2016, in conformity with accounting principles generally accepted in the United States of America. Also, in our opinion, such financial statement schedules, when considered in relation to the basic consolidated financial statements taken as a whole, present fairly, in all material respects, the information set forth therein.
We have also audited, in accordance with the standards of the Public Company Accounting Oversight Board (United States), the Company's internal control over financial reporting as of December 31, 2016, based on Internal Control-Integrated Framework (2013) issued by the Committee of Sponsoring Organizations of the Treadway Commission and our report dated February 22, 2017 expressed an unqualified opinion on the Company's internal control over financial reporting.
/s/ DELOITTE & TOUCHE LLP
Phoenix, Arizona
February 22, 201720, 2019
We have served as the Company’s auditor since 2015.
REPORT OF INDEPENDENT REGISTERED PUBLIC ACCOUNTING FIRM
To the Partnerspartners of
VEREIT Operating Partnership, L.P.
Phoenix, AZ
Opinion on the Financial Statements
We have audited the accompanying consolidated balance sheets of VEREIT Operating Partnership, L.P.L.P and subsidiaries (the “Operating Partnership”"Operating Partnership") as of December 31, 20162018 and 2015, and2017, the related consolidated statements of operations, comprehensive income (loss), changes in equity, and cash flows, for each of the twothree years in the period ended December 31, 2016. Our audits also included2018, and the financial statementrelated notes and the schedules listed in the Index at Item 15. These consolidated15 (collectively referred to as the "financial statements"). In our opinion, the financial statements present fairly, in all material respects, the financial position of the Operating Partnership as of December 31, 2018 and 2017, and the results of its operations and its cash flows for each of the three years in the period ended December 31, 2018, in conformity with accounting principles generally accepted in the United States of America.
Basis for Opinion
These financial statement schedulesstatements are the responsibility of the Operating Partnership’sPartnership's management. Our responsibility is to express an opinion on these consolidatedthe Operating Partnership's financial statements and financial statement schedules based on our audits. We are a public accounting firm registered with the Public Company Accounting Oversight Board (United States) (PCAOB) and are required to be independent with respect to the Operating Partnership in accordance with the U.S. federal securities laws and the applicable rules and regulations of the Securities and Exchange Commission and the PCAOB.
We conducted our audits in accordance with the standards of the Public Company Accounting Oversight Board (United States).PCAOB. Those standards require that we plan and perform the audit to obtain reasonable assurance about whether the financial statements are free of material misstatement.misstatement, whether due to error or fraud. The Operating Partnership is not required to have, nor were we engaged to perform, an audit of its internal control over financial reporting. Our audit included considerationAs part of our audits, we are required to obtain an understanding of internal control over financial reporting as a basis for designing audit procedures that are appropriate in the circumstances, but not for the purpose of expressing an opinion on the effectiveness of the Operating Partnership’s internal control over financial reporting. Accordingly, we express no such opinion. An audit includes
Our audits included performing procedures to assess the risks of material misstatement of the financial statements, whether due to error or fraud, and performing procedures that respond to those risks. Such procedures included examining, on a test basis, evidence supportingregarding the amounts and disclosures in the financial statements. An auditOur audits also includes assessingincluded evaluating the accounting principles used and significant estimates made by management, as well as evaluating the overall presentation of the financial statement presentation.statements. We believe that our audits provide a reasonable basis for our opinion.
In our opinion, the consolidated financial statements referred to above present fairly, in all material respects, the financial position of VEREIT Operating Partnership, L.P and subsidiaries as of December 31, 2016 and 2015, and the results of their operations and their cash flows for each of the two years in the period ended December 31, 2016, in conformity with accounting principles generally accepted in the United States of America. Also, in our opinion, such financial statement schedules, when considered in relation to the basic consolidated financial statements taken as a whole, present fairly, in all material respects, the information set forth therein.
/s/ DELOITTE & TOUCHE LLP
Phoenix, Arizona
February 22, 2017
REPORT OF INDEPENDENT REGISTERED PUBLIC ACCOUNTING FIRM
Board of Directors and Shareholders
VEREIT, Inc.20, 2019
We have audited the consolidated balance sheet of VEREIT, Inc. (a Maryland corporation) and subsidiaries (formerly American Realty Capital Properties, Inc.) (the “Company”)served as of December 31, 2014 (not presented herein), and the related statements of operations, comprehensive loss, changes in equity, and cash flows for the year then ended. Our audit of these consolidated financial statements included the financial statement schedules listed in the Index to Consolidated Financial Statements. These financial statements and financial statement schedules are the responsibility of the Company’s management. Our responsibility is to express an opinion on these financial statements and financial statement schedules based on our audit.
We conducted our audit in accordance with the standards of the Public Company Accounting Oversight Board (United States). Those standards require that we plan and perform the audit to obtain reasonable assurance about whether the financial statements are free of material misstatement. An audit includes examining, on a test basis, evidence supporting the amounts and disclosures in the financial statements. An audit also includes assessing the accounting principles used and significant estimates made by management, as well as evaluating the overall financial statement presentation. We believe that our audit provides a reasonable basis for our opinion.
In our opinion, the consolidated financial statements referred to above present fairly, in all material respects, the financial position of VEREIT, Inc. and subsidiaries as of December 31, 2014, and the results of their operations and their cash flows for the year ended December 31, 2014 in conformity with accounting principles generally accepted in the United States of America. Also in our opinion, the related financial statement schedules, when considered in relation to the basic consolidated financial statements taken as a whole, present fairly, in all material respects, the information set forth therein.
/s/ GRANT THORNTON LLP
Phoenix, Arizona
March 30, 2015, except for Note 2 in the previously filed 2015 financial statements, which is not presented herein regarding the adoption of ASU 2015-03, Interest - Imputation of Interest (Subtopic 835-30), as to which the date is February 23, 2016
REPORT OF INDEPENDENT REGISTERED PUBLIC ACCOUNTING FIRM
Board of Directors of General Partner and Limited Partners
VEREIT Operating Partnership, L.P. and subsidiaries
We have audited the consolidated balance sheet of VEREIT Operating Partnership, L.P. (a Delaware partnership) and subsidiaries (formerly ARC Properties Operating Partnership, L.P.) (collectively the “Operating Partnership”) as of December 31, 2014 (not presented herein), and the related consolidated statements of operations, comprehensive loss, changes in equity and cash flows for the year then ended. Our audit of these consolidated financial statements included the financial statement schedules listed in the Index to Consolidated Financial Statements. These financial statements and financial statement schedules are the responsibility of the Operating Partnership’s management. Our responsibility is to express an opinion on these financial statements and financial statement schedules based on our audit.
We conducted our audit in accordance with the standards of the Public Company Accounting Oversight Board (United States). Those standards require that we plan and perform the audit to obtain reasonable assurance about whether the financial statements are free of material misstatement. We were not engaged to perform an audit of the Operating Partnership’s internal control over financial reporting. Our audit included consideration of internal control over financial reporting as a basis for designing audit procedures that are appropriate in the circumstances, but not for the purpose of expressing an opinion on the effectiveness of the Operating Partnership’s internal control over financial reporting. Accordingly, we express no such opinion. An audit also includes examining, on a test basis, evidence supporting the amounts and disclosures in the financial statements, assessing the accounting principles used and significant estimates made by management, as well as evaluating the overall financial statement presentation. We believe that our audit provides a reasonable basis for our opinion.
In our opinion, the consolidated financial statements referred to above present fairly, in all material respects, the financial position of VEREIT Operating Partnership, L.P. and subsidiaries as of December 31, 2014, and the results of their operations and their cash flows for the year ended December 31, 2014 in conformity with accounting principles generally accepted in the United States of America. Also in our opinion, the related financial statement schedules, when considered in relation to the basic consolidated financial statements taken as a whole, present fairly, in all material respects, the information set forth therein.
/s/ GRANT THORNTON LLP
Phoenix, Arizona
March 30, 2015, except for Note 2 in the previously filed 2015 financial statements, which is not presented herein regarding the adoption of ASU 2015-03, Interest - Imputation of Interest (Subtopic 835-30), as to which the date is February 23, 2016
auditor since 2015.
VEREIT, INC.
CONSOLIDATED BALANCE SHEETS
(In thousands, except for share and per share data)
| | | | | December 31, 2016 | | December 31, 2015 | | December 31, 2018 | | December 31, 2017 |
| ASSETS | | | | | | | | |
| Real estate investments, at cost: | | | | | | | | |
| Land | | $ | 2,895,625 |
| | $ | 3,120,653 |
| | $ | 2,843,212 |
| | $ | 2,865,855 |
|
| Buildings, fixtures and improvements | | 10,644,296 |
| | 11,445,690 |
| | 10,749,228 |
| | 10,711,845 |
|
| Intangible lease assets | | 2,044,521 |
| | 2,218,378 |
| | 2,012,399 |
| | 2,037,675 |
|
| Total real estate investments, at cost | | 15,584,442 |
| | 16,784,721 |
| | 15,604,839 |
| | 15,615,375 |
|
| Less: accumulated depreciation and amortization | | 2,331,643 |
| | 1,778,597 |
| | 3,436,772 |
| | 2,908,028 |
|
| Total real estate investments, net | | 13,252,799 |
| | 15,006,124 |
| | 12,168,067 |
| | 12,707,347 |
|
| Investment in unconsolidated entities | | 46,077 |
| | 56,824 |
| | 35,289 |
| | 39,520 |
|
| Investment in direct financing leases, net | | 39,455 |
| | 46,312 |
| |
| Investment securities, at fair value | | 47,215 |
| | 53,304 |
| |
| Mortgage notes receivable, net | | 22,764 |
| | 24,238 |
| |
| Cash and cash equivalents | | 256,452 |
| | 69,103 |
| | 30,758 |
| | 34,176 |
|
| Restricted cash | | 45,018 |
| | 59,767 |
| | 22,905 |
| | 27,662 |
|
| Intangible assets, net | | 24,609 |
| | 50,779 |
| |
| Rent and tenant receivables and other assets, net | | 330,705 |
| | 303,637 |
| | 366,092 |
| | 389,060 |
|
| Goodwill | | 1,462,203 |
| | 1,656,374 |
| | 1,337,773 |
| | 1,337,773 |
|
| Due from affiliates | | 21,349 |
| | 60,633 |
| |
| Real estate assets held for sale, net | | 38,928 |
| | 18,771 |
| |
| Due from affiliates, net | | | — |
| | 6,041 |
|
| Real estate assets held for sale and assets related to discontinued operations, net | | | 2,609 |
| | 163,999 |
|
| Total assets | | $ | 15,587,574 |
|
| $ | 17,405,866 |
| | $ | 13,963,493 |
|
| $ | 14,705,578 |
|
| | | | | | | | | |
| LIABILITIES AND EQUITY | | | | | | | | |
| Mortgage notes payable and other debt, net | | $ | 2,671,106 |
| | $ | 3,111,985 |
| |
| Mortgage notes payable, net | | | $ | 1,922,657 |
| | $ | 2,082,692 |
|
| Corporate bonds, net | | 2,226,224 |
| | 2,536,333 |
| | 3,368,609 |
| | 2,821,494 |
|
| Convertible debt, net | | 973,340 |
| | 962,894 |
| | 394,883 |
| | 984,258 |
|
| Credit facility, net | | 496,578 |
| | 1,448,590 |
| | 401,773 |
| | 185,000 |
|
| Below-market lease liabilities, net | | 224,023 |
| | 251,692 |
| | 173,479 |
| | 198,551 |
|
| Accounts payable and accrued expenses | | 146,137 |
| | 151,877 |
| | 145,611 |
| | 136,474 |
|
| Deferred rent, derivative and other liabilities | | 68,039 |
| | 87,490 |
| |
| Deferred rent and other liabilities | | | 69,714 |
| | 62,985 |
|
| Distributions payable | | 162,578 |
| | 140,816 |
| | 186,623 |
| | 175,301 |
|
| Due to affiliates | | 16 |
| | 230 |
| | — |
| | 66 |
|
| Liabilities related to discontinued operations | | | — |
| | 15,881 |
|
| Total liabilities | | 6,968,041 |
| | 8,691,907 |
| | 6,663,349 |
| | 6,662,702 |
|
| Commitments and contingencies (Note 15) | |
| |
|
| |
| Preferred stock, $0.01 par value, 100,000,000 shares authorized and 42,834,138 issued and outstanding as of each of December 31, 2016 and December 31, 2015 | | 428 |
| | 428 |
| |
| Common stock, $0.01 par value, 1,500,000,000 shares authorized and 974,146,650 and 904,884,394 issued and outstanding as of December 31, 2016 and December 31, 2015, respectively | | 9,741 |
| | 9,049 |
| |
| Commitments and contingencies (Note 10) | | |
| |
|
|
| Preferred stock, $0.01 par value, 100,000,000 shares authorized and 42,834,138 issued and outstanding as of each of December 31, 2018 and December 31, 2017 | | | 428 |
| | 428 |
|
| Common stock, $0.01 par value, 1,500,000,000 shares authorized and 967,515,165 and 974,208,583 issued and outstanding as of December 31, 2018 and December 31, 2017, respectively | | | 9,675 |
| | 9,742 |
|
| Additional paid-in-capital | | 12,640,171 |
| | 11,931,768 |
| | 12,615,472 |
| | 12,654,258 |
|
| Accumulated other comprehensive loss | | (2,556 | ) | | (2,025 | ) | | (1,280 | ) | | (3,569 | ) |
| Accumulated deficit | | (4,200,423 | ) | | (3,415,233 | ) | | (5,467,236 | ) | | (4,776,581 | ) |
| Total stockholders’ equity | | 8,447,361 |
| | 8,523,987 |
| | 7,157,059 |
| | 7,884,278 |
|
| Non-controlling interests | | 172,172 |
| | 189,972 |
| | 143,085 |
| | 158,598 |
|
| Total equity | | 8,619,533 |
| | 8,713,959 |
| | 7,300,144 |
| | 8,042,876 |
|
| Total liabilities and equity | | $ | 15,587,574 |
|
| $ | 17,405,866 |
| | $ | 13,963,493 |
|
| $ | 14,705,578 |
|
The accompanying notes are an integral part of these statements.
VEREIT, INC.
CONSOLIDATED STATEMENTS OF OPERATIONS
(In thousands, except for per share data)
|
| | | | | | | | | | | | |
| | | Year Ended December 31, |
| | | 2016 | | 2015 | | 2014 |
| Revenues: | | | | | | |
| Rental income | | $ | 1,227,937 |
| | $ | 1,339,787 |
| | $ | 1,271,574 |
|
| Direct financing lease income | | 2,055 |
| | 2,720 |
| | 3,603 |
|
| Operating expense reimbursements | | 105,455 |
| | 98,628 |
| | 100,522 |
|
| Cole Capital revenue | | 119,376 |
| | 114,882 |
| | 203,558 |
|
| Total revenues | | 1,454,823 |
|
| 1,556,017 |
|
| 1,579,257 |
|
| Operating expenses: | | | | | | |
| Cole Capital reallowed fees and commissions | | 23,174 |
| | 16,195 |
| | 66,228 |
|
Acquisition related (1) | | 1,321 |
| | 6,243 |
| | 38,940 |
|
Litigation, merger and other non-routine costs, net of insurance recoveries (2) | | 3,884 |
| | 33,628 |
| | 199,616 |
|
| Property operating | | 144,428 |
| | 130,855 |
| | 137,741 |
|
| Management fees to affiliates | | — |
| | — |
| | 13,888 |
|
General and administrative (3) | | 136,608 |
| | 149,066 |
| | 167,428 |
|
| Depreciation and amortization | | 788,186 |
| | 847,611 |
| | 916,003 |
|
| Impairments | | 303,751 |
| | 305,094 |
| | 409,991 |
|
| Total operating expenses | | 1,401,352 |
|
| 1,488,692 |
|
| 1,949,835 |
|
| Operating income (loss) | | 53,471 |
|
| 67,325 |
|
| (370,578 | ) |
| Other (expense) income: | | | | | | |
| Interest expense | | (317,376 | ) | | (358,392 | ) | | (452,648 | ) |
| (Loss) gain on extinguishment and forgiveness of debt, net | | (771 | ) | | 4,812 |
| | (21,869 | ) |
| Other income, net | | 6,035 |
| | 6,439 |
| | 88,596 |
|
| Reserve for loan loss | | — |
| | (15,300 | ) | | — |
|
| Equity in income (loss) and gain on disposition of unconsolidated entities | | 9,783 |
| | 9,092 |
| | (76 | ) |
| Loss on derivative instruments, net | | (1,191 | ) | | (1,460 | ) | | (10,570 | ) |
| Total other expenses, net | | (303,520 | ) |
| (354,809 | ) |
| (396,567 | ) |
| Loss before taxes and real estate dispositions | | (250,049 | ) | | (287,484 | ) |
| (767,145 | ) |
| Gain (loss) on disposition of real estate and held for sale assets, net | | 45,524 |
| | (72,311 | ) | | (277,031 | ) |
| Loss before taxes | | (204,525 | ) |
| (359,795 | ) |
| (1,044,176 | ) |
| Benefit from income taxes | | 3,701 |
| | 36,303 |
| | 33,264 |
|
| Net loss | | (200,824 | ) |
| (323,492 | ) |
| (1,010,912 | ) |
Net loss attributable to non-controlling interests (4) | | 4,961 |
| | 7,139 |
| | 33,727 |
|
| Net loss attributable to the General Partner | | $ | (195,863 | ) |
| $ | (316,353 | ) |
| $ | (977,185 | ) |
| | | | | | | |
| Basic and diluted net loss per share attributable to common stockholders | | $ | (0.29 | ) | | $ | (0.43 | ) | | $ | (1.36 | ) |
| Distributions declared per common share | | $ | 0.55 |
| | $ | 0.28 |
| | $ | 1.03 |
|
|
| | | | | | | | | | | | |
| | | Year Ended December 31, |
| | | 2018 | | 2017 | | 2016 |
| Rental revenue | | $ | 1,257,867 |
| | $ | 1,252,285 |
| | $ | 1,335,447 |
|
| Operating expenses: | | | | | | |
| Acquisition-related | | 3,632 |
| | 3,402 |
| | 1,321 |
|
| Litigation, merger and other non-routine costs, net of insurance recoveries | | 290,963 |
| | 47,960 |
| | 3,884 |
|
| Property operating | | 126,461 |
| | 128,717 |
| | 144,428 |
|
| General and administrative | | 63,933 |
| | 58,603 |
| | 51,927 |
|
| Depreciation and amortization | | 640,618 |
| | 706,802 |
| | 762,038 |
|
| Impairments | | 54,647 |
| | 50,548 |
| | 182,820 |
|
| Total operating expenses | | 1,180,254 |
|
| 996,032 |
|
| 1,146,418 |
|
| Other (expense) income: | | | | | | |
| Interest expense | | (280,887 | ) | | (289,766 | ) | | (317,376 | ) |
| Gain (loss) on extinguishment and forgiveness of debt, net | | 5,360 |
| | 18,373 |
| | (771 | ) |
| Other income, net | | 14,735 |
| | 6,242 |
| | 5,251 |
|
| Equity in income and gain on disposition of unconsolidated entities | | 1,869 |
| | 2,763 |
| | 9,783 |
|
| Gain (loss) on derivative instruments, net | | 355 |
| | 2,976 |
| | (1,191 | ) |
| Gain on disposition of real estate and real estate assets held for sale, net | | 94,331 |
| | 61,536 |
| | 45,524 |
|
| Total other expenses, net | | (164,237 | ) |
| (197,876 | ) |
| (258,780 | ) |
| (Loss) income before taxes | | (86,624 | ) |
| 58,377 |
|
| (69,751 | ) |
| Provision for income taxes | | (5,101 | ) | | (6,882 | ) | | (7,136 | ) |
| (Loss) income from continuing operations | | (91,725 | ) |
| 51,495 |
|
| (76,887 | ) |
| Income (loss) from discontinued operations, net of income taxes | | 3,695 |
| | (19,117 | ) | | (123,937 | ) |
| Net (loss) income | | (88,030 | ) | | 32,378 |
| | (200,824 | ) |
Net loss (income) attributable to non-controlling interests (1) | | 2,256 |
| | (560 | ) | | 4,961 |
|
| Net (loss) income attributable to the General Partner | | $ | (85,774 | ) |
| $ | 31,818 |
|
| $ | (195,863 | ) |
| | | | | | | |
| Basic and diluted net loss per share from continuing operations attributable to common stockholders | | $ | (0.17 | ) | | $ | (0.02 | ) | | $ | (0.16 | ) |
| Basic and diluted net income (loss) per share from discontinued operations attributable to common stockholders | | $ | 0.00 |
| | $ | (0.02 | ) | | $ | (0.13 | ) |
Basic and diluted net loss per share attributable to common stockholders (2) | | $ | (0.16 | ) | | $ | (0.04 | ) | | $ | (0.29 | ) |
| |
| (1) | Includes $1.7 million of expenses paid to affiliates of the Former Manager (as defined in Note 1 – Organization) for the year ended December 31, 2014. No such expenses were incurred during the years ended December 31, 2016 and 2015.
|
| |
(2) | Includes $137.8 million of expenses paid to affiliates of the Former Manager (as defined in Note 1 – Organization) for the year ended December 31, 2014. No such expenses were incurred during the years ended December 31, 2016 and 2015.
|
| |
(3) | Includes $16.1 million of expenses paid to affiliates of the Former Manager (as defined in Note 1 – Organization) for the year ended December 31, 2014. No such expenses were incurred during the years ended December 31, 2016 and 2015.
|
| |
(4) | Represents net loss (income) attributable to limited partners and consolidated joint venture partners. |
| |
| (2) | Amounts may not total due to rounding. |
The accompanying notes are an integral part of these statements.
VEREIT, INC.
CONSOLIDATED STATEMENTS OF COMPREHENSIVE INCOME (LOSS)
(In thousands)
|
| | | | | | | | | | | | |
| | | Year Ended December 31, |
| | | 2016 | | 2015 | | 2014 |
| Net loss | | $ | (200,824 | ) | | $ | (323,492 | ) | | $ | (1,010,912 | ) |
| Other comprehensive loss: | | | | | | |
| Unrealized loss on interest rate derivatives | | (7,685 | ) | | (15,694 | ) | | (16,448 | ) |
| Reclassification of previous unrealized loss on interest rate derivatives into net loss | | 9,397 |
| | 11,706 |
| | 9,446 |
|
| Unrealized (loss) gain on investment securities, net | | (2,271 | ) | | (997 | ) | | 9,716 |
|
| Reclassification of previous unrealized loss (gain) on investment securities into net loss as other income, net | | — |
| | 110 |
| | (7,652 | ) |
| Total other comprehensive loss | | (559 | ) |
| (4,875 | ) |
| (4,938 | ) |
| | | | | | | |
| Total comprehensive loss | | (201,383 | ) | | (328,367 | ) |
| (1,015,850 | ) |
Comprehensive loss attributable to non-controlling interests (1) | | 4,989 |
| | 7,261 |
| | 33,727 |
|
| Total comprehensive loss attributable to the General Partner | | $ | (196,394 | ) |
| $ | (321,106 | ) |
| $ | (982,123 | ) |
|
| | | | | | | | | | | | |
| | | Year Ended December 31, |
| | | 2018 | | 2017 | | 2016 |
| Net (loss) income | | $ | (88,030 | ) | | $ | 32,378 |
| | $ | (200,824 | ) |
| Other comprehensive income (loss): | | | | | | |
| Unrealized gain (loss) on interest rate derivatives | | — |
| | (18 | ) | | (7,685 | ) |
| Reclassification of previous unrealized loss (gain) on interest rate derivatives into net (loss) income | | 313 |
| | (70 | ) | | 9,397 |
|
| Unrealized loss on investment securities, net | | (205 | ) | | (951 | ) | | (2,271 | ) |
| Reclassification of previous unrealized loss (gain) on investment securities into net (loss) income as other income, net | | 2,237 |
| | — |
| | — |
|
| Total other comprehensive income (loss) | | 2,345 |
|
| (1,039 | ) | | (559 | ) |
| | | | | | | |
| Total comprehensive (loss) income | | (85,685 | ) | | 31,339 |
| | (201,383 | ) |
Comprehensive loss (income) attributable to non-controlling interests (1) | | 2,200 |
| | (534 | ) | | 4,989 |
|
| Total comprehensive (loss) income attributable to the General Partner | | $ | (83,485 | ) | | $ | 30,805 |
| | $ | (196,394 | ) |
| |
| (1) | Represents comprehensive loss (income)attributable to limited partners and consolidated joint venture partners. |
The accompanying notes are an integral part of these statements.
VEREIT, INC.
CONSOLIDATED STATEMENTS OF CHANGES IN EQUITY
(In thousands, except for share data)
|
| | | | | | | | | | | | | | | | | | | | | | | | | | | | | | | | | | | | | | |
| | | Preferred Stock | | Common Stock | | | | | | | | | | | | |
| | | Number
of Shares | | Par
Value | | Number
of Shares | | Par
Value | | Additional Paid-In Capital | | Accumulated Other Comprehensive Income (loss) | | Accumulated
Deficit | | Total Stock-holders’ Equity | | Non-Controlling Interests | | Total Equity |
| Balance, January 1, 2014 | | 42,199,547 |
| | $ | 422 |
| | 239,234,725 |
| | $ | 2,392 |
|
| $ | 2,940,907 |
|
| $ | 7,666 |
|
| $ | (877,957 | ) |
| $ | 2,073,430 |
|
| $ | 155,798 |
|
| $ | 2,229,228 |
|
Issuance of common stock, net (1) | | — |
| | — |
| | 662,305,318 |
| | 6,623 |
| | 8,923,640 |
| | — |
| | — |
| | 8,930,263 |
| | — |
| | 8,930,263 |
|
| Conversion of Common OP Units to common stock | | — |
| | — |
| | 1,108,351 |
| | 11 |
| | 16,035 |
| | — |
| | — |
| | 16,046 |
| | (16,046 | ) | | — |
|
| Conversion of Preferred OP Units to Series F Preferred Stock | | 634,591 |
| | 6 |
| | — |
| | — |
| | 12,671 |
| | — |
| | — |
| | 12,677 |
| | (12,677 | ) | | — |
|
| Repurchases of common stock to settle tax obligation | | — |
| | — |
| | (551,664 | ) | | (5 | ) | | (7,685 | ) | | — |
| | — |
| | (7,690 | ) | | — |
| | (7,690 | ) |
| Equity-based compensation, net | | — |
| | — |
| | 3,433,701 |
| | 34 |
| | 30,227 |
| | — |
| | — |
| | 30,261 |
| | 1,600 |
| | 31,861 |
|
| Excess tax benefit | | — |
| | — |
| | — |
| | — |
| | 4,458 |
| | — |
| | — |
| | 4,458 |
| | — |
| | 4,458 |
|
| Distributions declared on common stock | | — |
| | — |
| | — |
| | — |
| | — |
| | — |
| | (819,377 | ) | | (819,377 | ) | | — |
| | (819,377 | ) |
| Issuance of OP Units | | — |
| | — |
| | — |
| | — |
| | — |
| | — |
| | — |
| | — |
| | 152,484 |
| | 152,484 |
|
| Distributions to non-controlling interest holders | | — |
| | — |
| | — |
| | — |
| | — |
| | — |
| | — |
| | — |
| | (36,318 | ) | | (36,318 | ) |
| Distributions to participating securities | | — |
| | — |
| | — |
| | — |
| | — |
| | — |
| | (5,335 | ) | | (5,335 | ) | | — |
| | (5,335 | ) |
| Distributions to preferred shareholders | | — |
| | — |
| | — |
| | — |
| | — |
| | — |
| | (98,722 | ) | | (98,722 | ) | | — |
| | (98,722 | ) |
| Contributions from non-controlling interest holders | | — |
| | — |
| | — |
| | — |
| | — |
| | — |
| | — |
| | — |
| | 982 |
| | 982 |
|
| Non-controlling interests retained in Cole Merger | | — |
| | — |
| | — |
| | — |
| | — |
| | — |
| | — |
| | — |
| | 24,766 |
| | 24,766 |
|
| Redemption of OP Units | | — |
| | — |
| | — |
| | — |
| | — |
| | — |
| | — |
| | — |
| | (8,420 | ) | | (8,420 | ) |
| Net loss | | — |
| | — |
| | — |
| | — |
| | — |
| | — |
| | (977,185 | ) | | (977,185 | ) | | (33,727 | ) | | (1,010,912 | ) |
| Other comprehensive loss | | — |
| | — |
| | — |
| | — |
| | — |
| | (4,938 | ) | | — |
| | (4,938 | ) | | — |
| | (4,938 | ) |
| Balance, December 31, 2014 | | 42,834,138 |
| | $ | 428 |
| | 905,530,431 |
| | $ | 9,055 |
|
| $ | 11,920,253 |
|
| $ | 2,728 |
|
| $ | (2,778,576 | ) |
| $ | 9,153,888 |
|
| $ | 228,442 |
|
| $ | 9,382,330 |
|
| Repurchases of common stock to settle tax obligation | | — |
| | — |
| | (268,414 | ) | | (2 | ) | | (2,225 | ) | | — |
| | — |
| | (2,227 | ) | | — |
| | (2,227 | ) |
| Equity-based compensation, net | | — |
| | — |
| | (377,623 | ) | | (4 | ) | | 14,504 |
| | — |
| | — |
| | 14,500 |
| | — |
| | 14,500 |
|
| Tax shortfall from equity-based compensation | | — |
| | — |
| | — |
| | — |
| | (764 | ) | | — |
| | — |
| | (764 | ) | | — |
| | (764 | ) |
| Distributions declared on common stock | | — |
| | — |
| | — |
| | — |
| | — |
| | — |
| | (248,476 | ) | | (248,476 | ) | | — |
| | (248,476 | ) |
| Distributions to non-controlling interest holders | | — |
| | — |
| | — |
| | — |
| | — |
| | — |
| | — |
| | — |
| | (45,594 | ) | | (45,594 | ) |
| Distributions to participating securities | | — |
| | — |
| | — |
| | — |
| | — |
| | — |
| | (410 | ) | | (410 | ) | | — |
| | (410 | ) |
| Distributions to preferred shareholders | | — |
| | — |
| | — |
| | — |
| | — |
| | — |
| | (71,418 | ) | | (71,418 | ) | | (474 | ) | | (71,892 | ) |
| Disposition of consolidated joint venture interest | | — |
| | — |
| | — |
| | — |
| | — |
| | — |
| | — |
| | — |
| | 14,859 |
| | 14,859 |
|
| Net loss | | — |
| | — |
| | — |
| | — |
| | — |
| | — |
| | (316,353 | ) | | (316,353 | ) | | (7,139 | ) | | (323,492 | ) |
| Other comprehensive loss | | — |
| | — |
| | — |
| | — |
| | — |
| | (4,753 | ) | | — |
| | (4,753 | ) | | (122 | ) | | (4,875 | ) |
| Balance, December 31, 2015 | | 42,834,138 |
|
| $ | 428 |
|
| 904,884,394 |
|
| $ | 9,049 |
|
| $ | 11,931,768 |
|
| $ | (2,025 | ) |
| $ | (3,415,233 | ) |
| $ | 8,523,987 |
|
| $ | 189,972 |
|
| $ | 8,713,959 |
|
| Issuance of common stock, net | | — |
| | — |
| | 69,000,000 |
| | 690 |
| | 701,786 |
| | — |
| | — |
| | 702,476 |
| | — |
| | 702,476 |
|
| Conversion of OP Units to common stock | | — |
| | — |
| | 15,450 |
| | — |
| | 159 |
| | — |
| | — |
| | 159 |
| | (159 | ) | | — |
|
| Repurchases of common stock to settle tax obligation | | — |
| | — |
| | (481,261 | ) | | (5 | ) | | (4,647 | ) | | — |
| | — |
| | (4,652 | ) | | — |
| | (4,652 | ) |
| Equity-based compensation, net | | — |
| | — |
| | 728,067 |
| | 7 |
| | 10,721 |
| | — |
| | — |
| | 10,728 |
| | — |
| | 10,728 |
|
| Contributions from non-controlling interest holders | | — |
| | — |
| | — |
| | — |
| | — |
| | — |
| | — |
| | — |
| | 675 |
| | 675 |
|
|
| | | | | | | | | | | | | | | | | | | | | | | | | | | | | | | | | | | | | | |
| | | Preferred Stock | | Common Stock | | | | | | | | | | | | |
| | | Number
of Shares | | Par
Value | | Number
of Shares | | Par
Value | | Additional Paid-In Capital | | Accumulated Other Comprehensive Loss | | Accumulated
Deficit | | Total Stock-holders’ Equity | | Non-Controlling Interests | | Total Equity |
| Balance, January 1, 2016 | | 42,834,138 |
| | $ | 428 |
| | 904,884,394 |
| | $ | 9,049 |
| | $ | 11,931,768 |
| | $ | (2,025 | ) | | $ | (3,415,233 | ) | | $ | 8,523,987 |
| | $ | 189,972 |
| | $ | 8,713,959 |
|
| Issuance of Common Stock, net | | — |
| | — |
| | 69,000,000 |
| | 690 |
| | 701,786 |
| | — |
| | — |
| | 702,476 |
| | — |
| | 702,476 |
|
| Conversion of OP Units to Common Stock | | — |
| | — |
| | 15,450 |
| | — |
| | 159 |
| | — |
| | — |
| | 159 |
| | (159 | ) | | — |
|
| Repurchases of Common Stock to settle tax obligation | | — |
| | — |
| | (481,261 | ) | | (5 | ) | | (4,647 | ) | | — |
| | — |
| | (4,652 | ) | | — |
| | (4,652 | ) |
| Equity-based compensation, net | | — |
| | — |
| | 728,067 |
| | 7 |
| | 10,721 |
| | — |
| | — |
| | 10,728 |
| | — |
| | 10,728 |
|
| Contributions from non-controlling interest holders | | — |
| | — |
| | — |
| | — |
| | — |
| | — |
| | — |
| | — |
| | 675 |
| | 675 |
|
Distributions declared on Common Stock —
$0.55 per common share | | — |
| | — |
| | — |
| | — |
| | — |
| | — |
| | (515,935 | ) | | (515,935 | ) | | — |
| | (515,935 | ) |
| Distributions to non-controlling interest holders | | — |
| | — |
| | — |
| | — |
| | — |
| | — |
| | — |
| | — |
| | (13,183 | ) | | (13,183 | ) |
| Dividend equivalents on awards granted under the Equity Plan | | — |
| | — |
| | — |
| | — |
| | — |
| | — |
| | (1,260 | ) | | (1,260 | ) | | — |
| | (1,260 | ) |
| Distributions to preferred shareholders and unitholders | | — |
| | — |
| | — |
| | — |
| | — |
| | — |
| | (71,748 | ) | | (71,748 | ) | | (144 | ) | | (71,892 | ) |
| Cumulative effect adjustment for equity-based compensation forfeitures | | — |
| | — |
| | — |
| | — |
| | 384 |
| | — |
| | (384 | ) | | — |
| | — |
| | — |
|
| Net loss | | — |
| | — |
| | — |
| | — |
| | — |
| | — |
| | (195,863 | ) | | (195,863 | ) | | (4,961 | ) | | (200,824 | ) |
| Other comprehensive loss | | — |
| | — |
| | — |
| | — |
| | — |
| | (531 | ) | | — |
| | (531 | ) | | (28 | ) | | (559 | ) |
| Balance, December 31, 2016 | | 42,834,138 |
| | $ | 428 |
| | 974,146,650 |
| | $ | 9,741 |
| | $ | 12,640,171 |
| | $ | (2,556 | ) | | $ | (4,200,423 | ) | | $ | 8,447,361 |
| | $ | 172,172 |
| | $ | 8,619,533 |
|
| Repurchases of Common Stock under 2017 Share Repurchase Program | | — |
| | — |
| | (68,759 | ) | | (1 | ) | | (517 | ) | | — |
| | — |
| | (518 | ) | | — |
| | (518 | ) |
| Repurchases of Common Stock to settle tax obligation | | — |
| | — |
| | (268,550 | ) | | (2 | ) | | (2,146 | ) | | — |
| | — |
| | (2,148 | ) | | — |
| | (2,148 | ) |
| Equity-based compensation, net | | — |
| | — |
| | 399,242 |
| | 4 |
| | 16,750 |
| | — |
| | — |
| | 16,754 |
| | — |
| | 16,754 |
|
| Contributions from non-controlling interest holders | | — |
| | — |
| | — |
| | — |
| | — |
| | — |
| | — |
| | — |
| | 101 |
| | 101 |
|
Distributions declared on Common Stock —
$0.55 per common share | | — |
| | — |
| | — |
| | — |
| | — |
| | — |
| | (535,657 | ) | | (535,657 | ) | | — |
| | (535,657 | ) |
| Distributions to non-controlling interest holders | | — |
| | — |
| | — |
| | — |
| | — |
| | — |
| | — |
| | — |
| | (13,227 | ) | | (13,227 | ) |
| Dividend equivalents on awards granted under the Equity Plan | | — |
| | — |
| | — |
| | — |
| | — |
| | — |
| | (571 | ) | | (571 | ) | | — |
| | (571 | ) |
| Distributions to preferred shareholders and unitholders | | — |
| | — |
| | — |
| | — |
| | — |
| | — |
| | (71,748 | ) | | (71,748 | ) | | (144 | ) | | (71,892 | ) |
| Disposition of joint venture | | — |
| | — |
| | — |
| | — |
| | — |
| | — |
| | — |
| | — |
| | (838 | ) | | (838 | ) |
| Net income | | — |
| | — |
| | — |
| | — |
| | — |
| | — |
| | 31,818 |
| | 31,818 |
| | 560 |
| | 32,378 |
|
| Other comprehensive income | | — |
| | — |
| | — |
| | — |
| | — |
| | (1,013 | ) | | — |
| | (1,013 | ) | | (26 | ) | | (1,039 | ) |
| Balance, December 31, 2017 | | 42,834,138 |
| | $ | 428 |
| | 974,208,583 |
| | $ | 9,742 |
| | $ | 12,654,258 |
| | $ | (3,569 | ) | | $ | (4,776,581 | ) | | $ | 7,884,278 |
| | $ | 158,598 |
| | $ | 8,042,876 |
|
| Conversion of OP Units to Common Stock | | — |
| | — |
| | 32,439 |
| | — |
| | 241 |
| | — |
| | — |
| | 241 |
| | (241 | ) | | — |
|
VEREIT, INC.
CONSOLIDATED STATEMENTS OF CHANGES IN EQUITY – (Continued)
(In thousands, except for share data)
| | | | | Preferred Stock | | Common Stock | | | | | | | | | | | | | | Preferred Stock | | Common Stock | | | | | | | | | | | | |
| | | Number
of Shares | | Par
Value | | Number
of Shares | | Par
Value | | Additional Paid-In Capital | | Accumulated Other Comprehensive Income (loss) | | Accumulated
Deficit | | Total Stock-holders’ Equity | | Non-Controlling Interests | | Total Equity | | Number
of Shares | | Par
Value | | Number
of Shares | | Par
Value | | Additional Paid-In Capital | | Accumulated Other Comprehensive Loss | | Accumulated
Deficit | | Total Stock-holders’ Equity | | Non-Controlling Interests | | Total Equity |
| Distributions declared on common stock | | — |
| | $ | — |
| | — |
| | $ | — |
| | $ | — |
| | $ | — |
| | $ | (516,703 | ) | | $ | (516,703 | ) | | $ | — |
| | $ | (516,703 | ) | |
| Repurchases of Common Stock under Share Repurchase Programs | | | — |
| | $ | — |
| | (7,206,876 | ) | | $ | (72 | ) | | $ | (50,082 | ) | | $ | — |
| | $ | — |
| | $ | (50,154 | ) | | $ | — |
| | (50,154 | ) |
| Repurchases of Common Stock to settle tax obligation | | | — |
| | — |
| | (324,502 | ) | | (2 | ) | | (2,324 | ) | | — |
| | — |
| | (2,326 | ) | | — |
| | (2,326 | ) |
| Equity-based compensation, net | | | — |
| | — |
| | 805,521 |
| | 7 |
| | 13,307 |
| | — |
| | — |
| | 13,314 |
| | — |
| | 13,314 |
|
| Contributions from non-controlling interest holders | | | — |
| | — |
| | — |
| | — |
| | — |
| | — |
| | — |
| | — |
| | 120 |
| | 120 |
|
Distributions declared on Common Stock —
$0.55 per common share | | | — |
| | — |
| | — |
| | — |
| | — |
| | — |
| | (532,144 | ) | | (532,144 | ) | | — |
| | (532,144 | ) |
| Distributions to non-controlling interest holders | | — |
| | — |
| | — |
| | — |
| | — |
| | — |
| | — |
| | — |
| | (13,183 | ) | | (13,183 | ) | | — |
| | — |
| | — |
| | — |
| | — |
| | — |
| | — |
| | — |
| | (13,048 | ) | | (13,048 | ) |
| Distributions to participating securities | | — |
| | — |
| | — |
| | — |
| | — |
| | — |
| | (492 | ) | | (492 | ) | | — |
| | (492 | ) | |
| Dividend equivalents on awards granted under the Equity Plan | | | — |
| | — |
| | — |
| | — |
| | 72 |
| | — |
| | (989 | ) | | (917 | ) | | — |
| | (917 | ) |
| Distributions to preferred shareholders and unitholders | | — |
| | — |
| | — |
| | — |
| | — |
| | — |
| | (71,748 | ) | | (71,748 | ) | | (144 | ) | | (71,892 | ) | | — |
| | — |
| | — |
| | — |
| | — |
| | — |
| | (71,748 | ) | | (71,748 | ) | | (144 | ) | | (71,892 | ) |
| Cumulative-effect adjustment for equity-based compensation forfeitures | | — |
| | — |
| | — |
| | — |
| | 384 |
| | — |
| | (384 | ) | | — |
| | — |
| | — |
| |
| Net loss | | — |
| | — |
| | — |
| | — |
| | — |
| | — |
| | (195,863 | ) | | (195,863 | ) | | (4,961 | ) | | (200,824 | ) | | — |
| | — |
| | — |
| | — |
| | — |
| | — |
| | (85,774 | ) | | (85,774 | ) | | (2,256 | ) | | (88,030 | ) |
| Other comprehensive loss | | — |
| | — |
| | — |
| | — |
| | — |
| | (531 | ) | | — |
| | (531 | ) | | (28 | ) | | (559 | ) | | — |
| | — |
| | — |
| | — |
| | — |
| | 2,289 |
| | — |
| | 2,289 |
| | 56 |
| | 2,345 |
|
| Balance, December 31, 2016 | | 42,834,138 |
|
| $ | 428 |
|
| 974,146,650 |
|
| $ | 9,741 |
|
| $ | 12,640,171 |
|
| $ | (2,556 | ) |
| $ | (4,200,423 | ) |
| $ | 8,447,361 |
|
| $ | 172,172 |
|
| $ | 8,619,533 |
| |
| Balance, December 31, 2018 | | | 42,834,138 |
|
| $ | 428 |
|
| 967,515,165 |
|
| $ | 9,675 |
|
| $ | 12,615,472 |
|
| $ | (1,280 | ) |
| $ | (5,467,236 | ) |
| $ | 7,157,059 |
|
| $ | 143,085 |
|
| $ | 7,300,144 |
|
| |
(1) | Includes $2.2 million issued to affiliates of the Former Manager (as defined in Note 1 – Organization) for the year ended December 31, 2014. No such amounts were issued to affiliates of the Former Manager during the years ended December 31, 2016 and 2015.
|
The accompanying notes are an integral part of these statements.
VEREIT, INC.
CONSOLIDATED STATEMENTS OF CASH FLOWS
(In thousands)
| | | | | Year Ended December 31, | | Year Ended December 31, |
| | | 2016 | | 2015 | | 2014 | | 2018 | | 2017 | | 2016 |
| Cash flows from operating activities: | | |
| | |
| | | | | | |
| | |
| Net loss | | $ | (200,824 | ) | | $ | (323,492 | ) | | $ | (1,010,912 | ) | |
| Adjustments to reconcile net loss to net cash provided by operating activities: | | | | | | | |
| Issuance of OP Units | | — |
| | — |
| | 92,884 |
| |
| Net (loss) income | | | $ | (88,030 | ) | | $ | 32,378 |
| | $ | (200,824 | ) |
| Adjustments to reconcile net (loss) income to net cash provided by operating activities: | | | | | | | |
| Depreciation and amortization | | 806,548 |
| | 866,549 |
| | 1,007,164 |
| | 659,948 |
| | 745,499 |
| | 806,548 |
|
| (Gain) loss on real estate assets and joint venture, net | | (55,722 | ) | | 65,582 |
| | 277,031 |
| |
| Gain on real estate assets, net | | | (96,068 | ) | | (61,536 | ) | | (55,722 | ) |
| Impairments from held for sale | | | — |
| | 20,027 |
| | — |
|
| Impairments | | 303,751 |
| | 305,094 |
| | 409,991 |
| | 54,647 |
| | 50,548 |
| | 303,751 |
|
| Reserve for loan loss | | — |
| | 15,300 |
| | — |
| |
| Equity-based compensation | | 10,728 |
| | 14,500 |
| | 31,861 |
| | 13,314 |
| | 16,751 |
| | 10,728 |
|
| Equity in income of unconsolidated entities | | 415 |
| | (2,361 | ) | | 77 |
| |
| Equity in income of unconsolidated entities and gain on joint venture | | | (1,869 | ) | | (2,726 | ) | | 415 |
|
| Distributions from unconsolidated entities | | 4,013 |
| | 11,352 |
| | 8,335 |
| | 1,366 |
| | 3,646 |
| | 1,433 |
|
| Loss on derivative instruments | | 1,191 |
| | 1,460 |
| | 10,570 |
| |
| (Gain) on investment securities | | — |
| | (65 | ) | | (6,357 | ) | |
| Loss (gain) on extinguishment and forgiveness of debt, net | | 771 |
| | (4,812 | ) | | (14,012 | ) | |
| Note receivable issued in legal settlement | | — |
| | — |
| | (15,300 | ) | |
| Gain on investments | | | (4,092 | ) | | (65 | ) | | — |
|
| (Gain) loss on derivative instruments, net | | | (355 | ) | | (2,976 | ) | | 1,191 |
|
| (Gain) loss on extinguishment and forgiveness of debt, net | | | (5,360 | ) | | (18,373 | ) | | 771 |
|
| Changes in assets and liabilities: | | | | | | | | | | | | |
| Investment in direct financing leases | | 3,976 |
| | 2,035 |
| | 1,597 |
| | 2,078 |
| | 2,097 |
| | 3,976 |
|
| Rent and tenant receivables and other assets, net | | (52,626 | ) | | (62,356 | ) | | (97,125 | ) | | (34,096 | ) | | (21,394 | ) | | (52,626 | ) |
| Due from affiliates | | (416 | ) | | 25,489 |
| | (32,821 | ) | | — |
| | 1,163 |
| | (416 | ) |
| Assets held for sale classified as discontinued operations | | | (2,492 | ) | | 13,812 |
| | — |
|
| Accounts payable and accrued expenses | | (3,323 | ) | | (999 | ) | | (16,279 | ) | | 1,688 |
| | 10,742 |
| | (3,323 | ) |
| Deferred rent, derivative and other liabilities | | (17,740 | ) | | (45,934 | ) | | (99,930 | ) | |
| Deferred rent and other liabilities | | | 7,162 |
| | (395 | ) | | (17,740 | ) |
| Due to affiliates | | (214 | ) | | (329 | ) | | (43,887 | ) | | (66 | ) | | 50 |
| | (214 | ) |
| Liabilities related to discontinued operations | | | (13,861 | ) | | 4,019 |
| | — |
|
| Net cash provided by operating activities | | 800,528 |
| | 867,013 |
|
| 502,887 |
| | 493,914 |
| | 793,267 |
|
| 797,948 |
|
| Cash flows from investing activities: | | | | | | | | | | | | |
| Investments in real estate assets | | (100,194 | ) | | (36,319 | ) | | (3,539,906 | ) | | (500,625 | ) | | (699,004 | ) | | (100,194 | ) |
| Acquisition of real estate businesses, net of cash acquired | | — |
| | — |
| | (756,232 | ) | |
| Capital expenditures and leasing costs | | (16,568 | ) | | (18,569 | ) | | (34,687 | ) | | (22,291 | ) | | (21,694 | ) | | (16,568 | ) |
| Real estate developments | | (17,411 | ) | | (57,682 | ) | | (72,515 | ) | | (9,221 | ) | | (14,850 | ) | | (17,411 | ) |
| Principal repayments received from borrowers | | 5,417 |
| | 6,921 |
| | 77,614 |
| |
| Principal repayments received on investment securities and mortgage notes receivable | | | 5,761 |
| | 6,796 |
| | 5,417 |
|
| Investments in unconsolidated entities | | (25,777 | ) | | — |
| | (2,500 | ) | | (771 | ) | | — |
| | (25,777 | ) |
| Proceeds from disposition of real estate and joint ventures | | 1,000,700 |
| | 1,009,107 |
| | 1,598,767 |
| |
| Return of investment from unconsolidated entities | | | 48 |
| | 1,972 |
| | 2,580 |
|
| Proceeds from disposition of real estate and joint venture | | | 502,289 |
| | 445,525 |
| | 1,000,700 |
|
| Proceeds from disposition of discontinued operations | | | 122,915 |
| | — |
| | — |
|
| Investment in leasehold improvements and other assets | | (2,259 | ) | | (1,911 | ) | | (11,890 | ) | | (841 | ) | | (1,191 | ) | | (2,259 | ) |
| Deposits for real estate assets | | | (13,412 | ) | | (37,226 | ) | | (17,856 | ) |
| Proceeds from sale of investments and other assets | | — |
| | 392 |
| | 159,752 |
| | 46,966 |
| | 400 |
| | — |
|
| Deposits for real estate assets | | (17,856 | ) | | (16,542 | ) | | (265,372 | ) | |
| Uses and refunds of deposits for real estate assets | | 13,305 |
| | 48,702 |
| | 347,971 |
| | 17,267 |
| | 36,111 |
| | 13,305 |
|
| Line of credit advances to affiliates | | (10,300 | ) | | (10,000 | ) | | (125,000 | ) | |
| Line of credit repayments from affiliates | | 50,000 |
| | 10,000 |
| | 81,100 |
| |
| Investment in mortgage notes receivable | | — |
| | — |
| | (2,952 | ) | |
| Change in restricted cash | | 11,136 |
| | (1,504 | ) | | (8,606 | ) | |
| Proceeds from the settlement of property-related insurance claims | | | 1,434 |
| | 355 |
| | — |
|
| Line of credit advances to Cole REITs | | | (2,200 | ) | | (16,400 | ) | | (10,300 | ) |
| Line of credit repayments from Cole REITs | | | 3,800 |
| | 25,100 |
| | 50,000 |
|
| Net cash provided by (used in) investing activities | | 890,193 |
| | 932,595 |
|
| (2,554,456 | ) | | 151,119 |
| | (274,106 | ) |
| 881,637 |
|
| Cash flows from financing activities: | | | | | | | | | | | | |
| Proceeds from mortgage notes payable | | 3,112 |
| | 1,445 |
| | 1,010,219 |
| | 187 |
| | 4,652 |
| | 3,112 |
|
| Payments on mortgage notes payable and other debt, including extinguishment costs | | (333,409 | ) | | (184,504 | ) | | (1,255,506 | ) | |
| Payments on mortgage notes payable and other debt, including debt extinguishment costs | | | (137,887 | ) | | (424,385 | ) | | (337,022 | ) |
| Proceeds from credit facility | | 1,033,000 |
| | 60,000 |
| | 5,824,000 |
| | 1,934,000 |
| | 329,000 |
| | 1,033,000 |
|
| Payments on credit facility | | (1,993,000 | ) | | (1,784,000 | ) | | (5,918,800 | ) | | (1,716,000 | ) | | (645,107 | ) | | (1,993,000 | ) |
| Proceeds from corporate bonds | | 1,000,000 |
| | — |
| | 2,545,760 |
| | 546,304 |
| | 600,000 |
| | 1,000,000 |
|
| Payments on corporate bonds, including extinguishment costs | | (1,311,203 | ) | | — |
| | — |
| | — |
| | — |
| | (1,311,203 | ) |
| Repayment of convertible notes | | | (597,500 | ) | | — |
| | — |
|
| Payments of deferred financing costs | | (19,872 | ) | | (2,436 | ) | | (116,373 | ) | | (25,471 | ) | | (9,575 | ) | | (19,872 | ) |
| Proceeds from 2016 Term Loan | | 300,000 |
| | — |
| | — |
| |
| Repayment of 2016 Term Loan | | (300,000 | ) | | — |
| | — |
| |
| Redemption of Series D Preferred Stock | | — |
| | — |
| | (316,126 | ) | |
| Repurchases of common stock to settle tax obligations | | (4,652 | ) | | (2,227 | ) | | (7,690 | ) | |
| Proceeds from the issuance of Common Stock, net of underwriters’ discount | | 702,765 |
| | — |
| | 1,656,000 |
| |
| Payments of equity issuance costs | | (280 | ) | | — |
| | (60,955 | ) | |
| Repurchases of Common Stock under the Share Repurchase Programs | | | (50,154 | ) | | (518 | ) | | — |
|
| Proceeds from 2016 term loan | | | — |
| | — |
| | 300,000 |
|
VEREIT, INC.
CONSOLIDATED STATEMENTS OF CASH FLOWS – (Continued)
(In thousands)
|
| | | | | | | | | | | | |
| | | Year Ended December 31, |
| | | 2016 | | 2015 | | 2014 |
| Contributions from non-controlling interest holders | | 675 |
| | — |
| | 982 |
|
| Distributions paid | | (580,508 | ) | | (235,494 | ) | | (950,414 | ) |
| Windfall tax benefits related to equity-based compensation | | — |
| | — |
| | 4,458 |
|
| Net cash (used in) provided by financing activities | | (1,503,372 | ) |
| (2,147,216 | ) |
| 2,415,555 |
|
| Net change in cash and cash equivalents | | 187,349 |
| | (347,608 | ) | | 363,986 |
|
| Cash and cash equivalents, beginning of period | | 69,103 |
| | 416,711 |
| | 52,725 |
|
| Cash and cash equivalents, end of period | | $ | 256,452 |
| | $ | 69,103 |
|
| $ | 416,711 |
|
|
| | | | | | | | | | | | |
| | | Year Ended December 31, |
| | | 2018 | | 2017 | | 2016 |
| Repayment of 2016 term loan | | $ | — |
| | $ | — |
| | $ | (300,000 | ) |
| Repurchases of Common Stock to settle tax obligations | | (2,326 | ) | | (2,148 | ) | | (4,652 | ) |
| Proceeds from the issuance of Common Stock, net of underwriters’ discount | | — |
| | — |
| | 702,765 |
|
| Payments of equity issuance costs | | — |
| | — |
| | (280 | ) |
| Contributions from non-controlling interest holders | | 120 |
| | 101 |
| | 675 |
|
| Distributions paid | | (606,679 | ) | | (608,615 | ) | | (580,508 | ) |
| Net cash used in financing activities | | (655,406 | ) | | (756,595 | ) |
| (1,506,985 | ) |
| Net change in cash and cash equivalents and restricted cash | | (10,373 | ) | | (237,434 | ) | | 172,600 |
|
| | | | | | | |
| Cash and cash equivalents and restricted cash, beginning of period | | $ | 64,036 |
| | $ | 301,470 |
| | $ | 128,870 |
|
| Less: cash and cash equivalents of discontinued operations | | (2,198 | ) | | (2,973 | ) | | (4,968 | ) |
| Cash and cash equivalents and restricted cash from continuing operations, beginning of period | | 61,838 |
| | 298,497 |
| | 123,902 |
|
| | | | | | | |
| Cash and cash equivalents, and restricted cash, end of period | | 53,663 |
| | 64,036 |
| | 301,470 |
|
| Less: cash and cash equivalents of discontinued operations | | — |
| | (2,198 | ) | | (2,973 | ) |
| Cash and cash equivalents and restricted cash from continuing operations, end of period | | $ | 53,663 |
| | $ | 61,838 |
|
| $ | 298,497 |
|
| Reconciliation of Cash and Cash Equivalents and Restricted Cash | | | | | | |
| Cash and cash equivalents at beginning of period | | $ | 34,176 |
| | $ | 253,479 |
| | $ | 64,135 |
|
| Restricted cash at beginning of period | | 27,662 |
| | 45,018 |
| | 59,767 |
|
| Cash and cash equivalents and restricted cash at beginning of period | | 61,838 |
| | 298,497 |
| | 123,902 |
|
| | | | | | | |
| Cash and cash equivalents at end of period | | 30,758 |
| | 34,176 |
| | 253,479 |
|
| Restricted cash at end of period | | 22,905 |
| | 27,662 |
| | 45,018 |
|
| Cash and cash equivalents and restricted cash at end of period | | $ | 53,663 |
| | $ | 61,838 |
| | $ | 298,497 |
|
The accompanying notes are an integral part of these statements.
VEREIT OPERATING PARTNERSHIP, L.P.
CONSOLIDATED BALANCE SHEETS
(In thousands, except for unit data)
|
| | | | | | | | |
| | | December 31, 2018 | | December 31, 2017 |
| ASSETS | | | | |
| Real estate investments, at cost: | | | | |
| Land | | $ | 2,843,212 |
| | $ | 2,865,855 |
|
| Buildings, fixtures and improvements | | 10,749,228 |
| | 10,711,845 |
|
| Intangible lease assets | | 2,012,399 |
| | 2,037,675 |
|
| Total real estate investments, at cost | | 15,604,839 |
|
| 15,615,375 |
|
| Less: accumulated depreciation and amortization | | 3,436,772 |
| | 2,908,028 |
|
| Total real estate investments, net | | 12,168,067 |
|
| 12,707,347 |
|
| Investment in unconsolidated entities | | 35,289 |
| | 39,520 |
|
| Cash and cash equivalents | | 30,758 |
| | 34,176 |
|
| Restricted cash | | 22,905 |
| | 27,662 |
|
| Rent and tenant receivables and other assets, net | | 366,092 |
| | 389,060 |
|
| Goodwill | | 1,337,773 |
| | 1,337,773 |
|
| Due from affiliates, net | | — |
| | 6,041 |
|
| Real estate assets held for sale and assets related to discontinued operations, net | | 2,609 |
| | 163,999 |
|
| Total assets | | $ | 13,963,493 |
|
| $ | 14,705,578 |
|
| | | | | |
| LIABILITIES AND EQUITY | | | | |
|
| Mortgage notes payable, net | | $ | 1,922,657 |
| | $ | 2,082,692 |
|
| Corporate bonds, net | | 3,368,609 |
| | 2,821,494 |
|
| Convertible debt, net | | 394,883 |
| | 984,258 |
|
| Credit facility, net | | 401,773 |
| | 185,000 |
|
| Below-market lease liabilities, net | | 173,479 |
| | 198,551 |
|
| Accounts payable and accrued expenses | | 145,611 |
| | 136,474 |
|
| Deferred rent and other liabilities | | 69,714 |
| | 62,985 |
|
| Distributions payable | | 186,623 |
| | 175,301 |
|
| Due to affiliates | | — |
| | 66 |
|
| Liabilities related to discontinued operations | | — |
| | 15,881 |
|
| Total liabilities | | 6,663,349 |
|
| 6,662,702 |
|
| Commitments and contingencies (Note 10) | |
|
| |
|
|
| General Partner's preferred equity, 42,834,138 General Partner Series F Preferred Units issued and outstanding as of each of December 31, 2018 and December 31, 2017 | | 710,325 |
| | 782,073 |
|
| General Partner's common equity, 967,515,165 and 974,208,583 General Partner OP Units issued and outstanding as of December 31, 2018 and December 31, 2017, respectively | | 6,446,734 |
| | 7,102,205 |
|
| Limited Partner's preferred equity, 86,874 Limited Partner Series F Preferred Units issued and outstanding as of each of December 31, 2018 and December 31, 2017 | | 2,883 |
| | 3,027 |
|
| Limited Partner's common equity, 23,715,908 and 23,748,347 Limited Partner OP Units issued and outstanding as of December 31, 2018 and December 31, 2017, respectively | | 138,931 |
| | 154,266 |
|
| Total partners’ equity | | 7,298,873 |
|
| 8,041,571 |
|
| Non-controlling interests | | 1,271 |
| | 1,305 |
|
| Total equity | | 7,300,144 |
|
| 8,042,876 |
|
| Total liabilities and equity | | $ | 13,963,493 |
|
| $ | 14,705,578 |
|
The accompanying notes are an integral part of these statements.
VEREIT OPERATING PARTNERSHIP, L.P.
CONSOLIDATED STATEMENTS OF OPERATIONS
(In thousands, except for per unit data)
|
| | | | | | | | | | | | |
| | | Year Ended December 31, |
| | | 2018 | | 2017 | | 2016 |
| Rental revenue | | $ | 1,257,867 |
| | $ | 1,252,285 |
| | $ | 1,335,447 |
|
| Operating expenses: | | | | | | |
| Acquisition-related | | 3,632 |
| | 3,402 |
| | 1,321 |
|
| Litigation, merger and other non-routine costs, net of insurance recoveries | | 290,963 |
| | 47,960 |
| | 3,884 |
|
| Property operating | | 126,461 |
| | 128,717 |
| | 144,428 |
|
| General and administrative | | 63,933 |
| | 58,603 |
| | 51,927 |
|
| Depreciation and amortization | | 640,618 |
| | 706,802 |
| | 762,038 |
|
| Impairments | | 54,647 |
| | 50,548 |
| | 182,820 |
|
| Total operating expenses | | 1,180,254 |
|
| 996,032 |
| | 1,146,418 |
|
| Other (expense) income: | | | | | | |
| Interest expense | | (280,887 | ) | | (289,766 | ) | | (317,376 | ) |
| Gain (loss) on extinguishment and forgiveness of debt, net | | 5,360 |
| | 18,373 |
| | (771 | ) |
| Other income, net | | 14,735 |
| | 6,242 |
| | 5,251 |
|
| Equity in income and gain on disposition of unconsolidated entities | | 1,869 |
| | 2,763 |
| | 9,783 |
|
| Gain (loss) on derivative instruments, net | | 355 |
| | 2,976 |
| | (1,191 | ) |
| Gain on disposition of real estate and real estate assets held for sale, net | | 94,331 |
| | 61,536 |
| | 45,524 |
|
| Total other expenses, net | | (164,237 | ) |
| (197,876 | ) | | (258,780 | ) |
| (Loss) income before taxes | | (86,624 | ) |
| 58,377 |
| | (69,751 | ) |
| Provision for income taxes | | (5,101 | ) | | (6,882 | ) | | (7,136 | ) |
| (Loss) income from continuing operations | | (91,725 | ) | | 51,495 |
| | (76,887 | ) |
| Income (loss) from discontinued operations, net of income taxes | | 3,695 |
| | (19,117 | ) | | (123,937 | ) |
| Net (loss) income | | (88,030 | ) |
| 32,378 |
| | (200,824 | ) |
Net loss attributable to non-controlling interests (1) | | 154 |
| | 194 |
| | 14 |
|
| Net (loss) income attributable to the OP | | $ | (87,876 | ) |
| $ | 32,572 |
| | $ | (200,810 | ) |
| | | | | | | |
| Basic and diluted net loss per unit from continuing operations attributable to common unitholders | | $ | (0.17 | ) | | $ | (0.02 | ) | | $ | (0.16 | ) |
| Basic and diluted net income (loss) per unit from discontinued operations attributable to common unitholders | | $ | 0.00 |
| | $ | (0.02 | ) | | $ | (0.13 | ) |
Basic and diluted net loss per unit attributable to common unitholders (2) | | $ | (0.16 | ) | | $ | (0.04 | ) | | $ | (0.29 | ) |
| |
| (1) | Represents net loss attributable to consolidated joint venture partners. |
| |
| (2) | Amounts may not total due to rounding. |
The accompanying notes are an integral part of these statements.
VEREIT OPERATING PARTNERSHIP, L.P.
CONSOLIDATED BALANCE SHEETS
(In thousands, except for unit data)
|
| | | | | | | | |
| | | December 31, 2016 | | December 31, 2015 |
| ASSETS | | | | |
| Real estate investments, at cost: | | | | |
| Land | | $ | 2,895,625 |
| | $ | 3,120,653 |
|
| Buildings, fixtures and improvements | | 10,644,296 |
| | 11,445,690 |
|
| Intangible lease assets | | 2,044,521 |
| | 2,218,378 |
|
| Total real estate investments, at cost | | 15,584,442 |
|
| 16,784,721 |
|
| Less: accumulated depreciation and amortization | | 2,331,643 |
| | 1,778,597 |
|
| Total real estate investments, net | | 13,252,799 |
|
| 15,006,124 |
|
| Investment in unconsolidated entities | | 46,077 |
| | 56,824 |
|
| Investment in direct financing leases, net | | 39,455 |
| | 46,312 |
|
| Investment securities, at fair value | | 47,215 |
| | 53,304 |
|
| Mortgage notes receivable, net | | 22,764 |
| | 24,238 |
|
| Cash and cash equivalents | | 256,452 |
| | 69,103 |
|
| Restricted cash | | 45,018 |
| | 59,767 |
|
| Intangible assets, net | | 24,609 |
| | 50,779 |
|
| Rent and tenant receivables and other assets, net | | 330,705 |
| | 303,637 |
|
| Goodwill | | 1,462,203 |
| | 1,656,374 |
|
| Due from affiliates | | 21,349 |
| | 60,633 |
|
| Real estate assets held for sale, net | | 38,928 |
| | 18,771 |
|
| Total assets | | $ | 15,587,574 |
|
| $ | 17,405,866 |
|
| | | | | |
| LIABILITIES AND EQUITY | | | | |
|
| Mortgage notes payable and other debt, net | | $ | 2,671,106 |
| | $ | 3,111,985 |
|
| Corporate bonds, net | | 2,226,224 |
| | 2,536,333 |
|
| Convertible debt, net | | 973,340 |
| | 962,894 |
|
| Credit facility, net | | 496,578 |
| | 1,448,590 |
|
| Below-market lease liabilities, net | | 224,023 |
| | 251,692 |
|
| Accounts payable and accrued expenses | | 146,137 |
| | 151,877 |
|
| Deferred rent, derivative and other liabilities | | 68,039 |
| | 87,490 |
|
| Distributions payable | | 162,578 |
| | 140,816 |
|
| Due to affiliates | | 16 |
| | 230 |
|
| Total liabilities | | 6,968,041 |
|
| 8,691,907 |
|
| Commitments and contingencies (Note 15) | |
|
| |
|
|
| General Partner's preferred equity, 42,834,138 General Partner Preferred Units issued and outstanding as of each of December 31, 2016 and December 31, 2015 | | 853,821 |
| | 925,569 |
|
| General Partner's common equity, 974,146,650 and 904,884,394 General Partner OP Units issued and outstanding as of December 31, 2016 and December 31, 2015, respectively | | 7,593,540 |
| | 7,598,418 |
|
| Limited Partner's preferred equity, 86,874 Limited Partner Preferred Units issued and outstanding as of each of December 31, 2016 and December 31, 2015 | | 3,171 |
| | 3,315 |
|
| Limited Partner's common equity, 23,748,347 and 23,763,797 Limited Partner OP Units issued and outstanding as of December 31, 2016 and December 31, 2015, respectively | | 166,598 |
| | 184,800 |
|
| Total partners’ equity | | 8,617,130 |
|
| 8,712,102 |
|
| Non-controlling interests | | 2,403 |
| | 1,857 |
|
| Total equity | | 8,619,533 |
|
| 8,713,959 |
|
| Total liabilities and equity | | $ | 15,587,574 |
|
| $ | 17,405,866 |
|
The accompanying notes are an integral part of these statements.
VEREIT OPERATING PARTNERSHIP, L.P.
CONSOLIDATED STATEMENTS OF OPERATIONS
(In thousands, except for per unit data)
|
| | | | | | | | | | | | |
| | | Year Ended December 31, |
| | | 2016 | | 2015 | | 2014 |
| Revenues: | | | | | | |
| Rental income | | $ | 1,227,937 |
| | $ | 1,339,787 |
| | $ | 1,271,574 |
|
| Direct financing lease income | | 2,055 |
| | 2,720 |
| | 3,603 |
|
| Operating expense reimbursements | | 105,455 |
| | 98,628 |
| | 100,522 |
|
| Cole Capital revenue | | 119,376 |
| | 114,882 |
| | 203,558 |
|
| Total revenues | | 1,454,823 |
|
| 1,556,017 |
|
| 1,579,257 |
|
| Operating expenses: | | | | | | |
| Cole Capital reallowed fees and commissions | | 23,174 |
| | 16,195 |
| | 66,228 |
|
Acquisition related (1) | | 1,321 |
| | 6,243 |
| | 38,940 |
|
Litigation, merger and other non-routine costs, net of insurance recoveries (2) | | 3,884 |
| | 33,628 |
| | 199,616 |
|
| Property operating | | 144,428 |
| | 130,855 |
| | 137,741 |
|
| Management fees to affiliates | | — |
| | — |
| | 13,888 |
|
General and administrative (3) | | 136,608 |
| | 149,066 |
| | 167,428 |
|
| Depreciation and amortization | | 788,186 |
| | 847,611 |
| | 916,003 |
|
| Impairments | | 303,751 |
| | 305,094 |
| | 409,991 |
|
| Total operating expenses | | 1,401,352 |
|
| 1,488,692 |
|
| 1,949,835 |
|
| Operating income (loss) | | 53,471 |
|
| 67,325 |
|
| (370,578 | ) |
| Other (expense) income: | | | | | | |
| Interest expense | | (317,376 | ) | | (358,392 | ) | | (452,648 | ) |
| (Loss) gain on extinguishment and forgiveness of debt, net | | (771 | ) | | 4,812 |
| | (21,869 | ) |
| Other income, net | | 6,035 |
| | 6,439 |
| | 88,596 |
|
| Reserve for loan loss | | — |
| | (15,300 | ) | | — |
|
| Equity in income (loss) and gain on disposition of unconsolidated entities | | 9,783 |
| | 9,092 |
| | (76 | ) |
| Loss on derivative instruments, net | | (1,191 | ) | | (1,460 | ) | | (10,570 | ) |
| Total other expenses, net | | (303,520 | ) |
| (354,809 | ) |
| (396,567 | ) |
| Loss before taxes and real estate dispositions | | (250,049 | ) |
| (287,484 | ) |
| (767,145 | ) |
| Gain (loss) on disposition of real estate and held for sale assets, net | | 45,524 |
| | (72,311 | ) | | (277,031 | ) |
| Loss before taxes | | (204,525 | ) | | (359,795 | ) |
| (1,044,176 | ) |
| Benefit from income taxes | | 3,701 |
| | 36,303 |
| | 33,264 |
|
| Net loss | | (200,824 | ) |
| (323,492 | ) |
| (1,010,912 | ) |
Net loss (income) attributable to non-controlling interests (4) | | 14 |
| | (1,274 | ) | | 154 |
|
| Net loss attributable to the OP | | $ | (200,810 | ) |
| $ | (324,766 | ) |
| $ | (1,010,758 | ) |
| | | | | | | |
| Basic and diluted net loss per unit attributable to common unitholders | | $ | (0.29 | ) | | $ | (0.43 | ) | | $ | (1.36 | ) |
| Distributions declared per common unit | | $ | 0.55 |
| | $ | 0.28 |
| | $ | 1.03 |
|
| |
(1) | Includes $1.7 million of expenses paid to affiliates of the Former Manager (as defined in Note 1 – Organization) for the year ended December 31, 2014. No such expenses were incurred during the years ended December 31, 2016 and 2015.
|
| |
(2) | Includes $137.8 million of expenses paid to affiliates of the Former Manager (as defined in Note 1 – Organization) for the year ended December 31, 2014. No such expenses were incurred during the years ended December 31, 2016 and 2015.
|
| |
(3) | Includes $16.1 million of expenses paid to affiliates of the Former Manager (as defined in Note 1 – Organization) for the year ended December 31, 2014. No such expenses were incurred during the years ended December 31, 2016 and 2015.
|
| |
(4) | Represents loss (income) attributable to consolidated joint venture partners. |
The accompanying notes are an integral part of these statements.
VEREIT OPERATING PARTNERSHIP, L.P.
CONSOLIDATED STATEMENTS OF COMPREHENSIVE INCOME (LOSS)
(In thousands)
|
| | | | | | | | | | | | |
| | | Year Ended December 31, |
| | | 2016 | | 2015 | | 2014 |
| Net loss | | $ | (200,824 | ) | | $ | (323,492 | ) | | (1,010,912 | ) |
| Other comprehensive loss: | | | | | | |
| Unrealized loss on interest rate derivatives | | (7,685 | ) | | (15,694 | ) | | (16,448 | ) |
| Reclassification of previous unrealized loss on interest rate derivatives into net loss | | 9,397 |
| | 11,706 |
| | 9,446 |
|
| Unrealized (loss) gain on investment securities, net | | (2,271 | ) | | (997 | ) | | 9,716 |
|
| Reclassification of previous unrealized loss (gain) on investment securities into net loss as other income, net | | — |
| | 110 |
| | (7,652 | ) |
| Total other comprehensive loss | | (559 | ) |
| (4,875 | ) |
| (4,938 | ) |
| | | | | | | |
| Total comprehensive loss | | (201,383 | ) |
| (328,367 | ) |
| (1,015,850 | ) |
Comprehensive loss (income) attributable to non-controlling interests (1) | | 14 |
| | (1,274 | ) | | 154 |
|
| Total comprehensive loss attributable to the OP | | $ | (201,369 | ) |
| $ | (329,641 | ) |
| $ | (1,015,696 | ) |
|
| | | | | | | | | | | | |
| | | Year Ended December 31, |
| | | 2018 | | 2017 | | 2016 |
| Net (loss) income | | $ | (88,030 | ) | | $ | 32,378 |
| | $ | (200,824 | ) |
| Other comprehensive income (loss): | | | | | | |
| Unrealized gain (loss) on interest rate derivatives | | — |
| | (18 | ) | | (7,685 | ) |
| Reclassification of previous unrealized loss (gain) on interest rate derivatives into net (loss) income | | 313 |
| | (70 | ) | | 9,397 |
|
| Unrealized loss on investment securities, net | | (205 | ) | | (951 | ) | | (2,271 | ) |
| Reclassification of previous unrealized loss (gain) on investment securities into net (loss) income as other income, net | | 2,237 |
| | — |
| | — |
|
| Total other comprehensive income (loss) | | 2,345 |
|
| (1,039 | ) | | (559 | ) |
| | | | | | | |
| Total comprehensive (loss) income | | (85,685 | ) |
| 31,339 |
| | (201,383 | ) |
Comprehensive loss attributable to non-controlling interests (1) | | 154 |
| | 194 |
| | 14 |
|
| Total comprehensive (loss) income attributable to the OP | | $ | (85,531 | ) |
| $ | 31,533 |
| | $ | (201,369 | ) |
| |
| (1) | Represents comprehensive loss (income) attributable to consolidated joint venture partners. |
The accompanying notes are an integral part of these statements.
VEREIT OPERATING PARTNERSHIP, L.P.
CONSOLIDATED STATEMENTS OF CHANGES IN EQUITY
(In thousands, except for unit data)
|
| | | | | | | | | | | | | | | | | | | | | | | | | | | | | | | | | | | | | | | | | |
| | | Preferred Units | | Common Units | | | | | | |
| | | General Partner | | Limited Partner | | General Partner | | Limited Partner | | | | | | |
| | | Number of Units | | Capital | | Number of Units | | Capital | | Number of Units | | Capital | | Number of Units | | Capital | | Total Partners' Capital | | Non-Controlling Interests | | Total Capital |
| Balance, January 1, 2014 | | 42,199,547 |
| | $ | 1,054,989 |
| | 721,465 |
| | $ | 16,466 |
| | 239,234,725 |
| | $ | 1,018,123 |
| | 17,832,274 |
| | $ | 139,083 |
| | $ | 2,228,661 |
| | $ | 567 |
| | $ | 2,229,228 |
|
Issuance of Common OP Units, net (1) | | — |
| | — |
| | — |
| | — |
| | 662,305,318 |
| | 8,930,263 |
| | 7,956,297 |
| | 152,484 |
| | 9,082,747 |
| | — |
| | 9,082,747 |
|
| Conversion of Limited Partners' Common OP Units to General Partner's Common OP Units | | — |
| | — |
| | — |
| | — |
| | 1,108,351 |
| | 16,046 |
| | (1,108,351 | ) | | (16,046 | ) | | — |
| | — |
| | — |
|
| Conversion of Limited Partners' Preferred OP Units to General Partner's Preferred OP Units | | 634,591 |
| | 12,677 |
| | (634,591 | ) | | (12,677 | ) | | — |
| | — |
| | — |
| | — |
| | — |
| | — |
| | — |
|
| Repurchases of Common OP Units to settle tax obligation | | — |
| | — |
| | — |
| | — |
| | (551,664 | ) | | (7,690 | ) | | — |
| | — |
| | (7,690 | ) | | — |
| | (7,690 | ) |
| Equity-based compensation, net | | — |
| | — |
| | — |
| | — |
| | 3,433,701 |
| | 30,261 |
| | — |
| | 1,600 |
| | 31,861 |
| | — |
| | 31,861 |
|
| Excess tax benefit | | — |
| | — |
| | — |
| | — |
| | — |
| | 4,458 |
| | — |
| | — |
| | 4,458 |
| | — |
| | 4,458 |
|
| Distributions to Common OP Units, LTIPs and non-controlling interests | | — |
| | — |
| | — |
| | — |
| | — |
| | (824,712 | ) | | — |
| | (33,856 | ) | | (858,568 | ) | | (2,462 | ) | | (861,030 | ) |
| Distributions to Preferred OP Units | | — |
| | (70,679 | ) | | — |
| | (414 | ) | | — |
| | (27,629 | ) | | — |
| | — |
| | (98,722 | ) | | — |
| | (98,722 | ) |
| Contributions from non-controlling interest holders | | — |
| | — |
| | — |
| | — |
| | — |
| | — |
| | — |
| | — |
| | — |
| | 982 |
| | 982 |
|
| Non-controlling interests retained in Cole Merger | | — |
| | — |
| | — |
| | — |
| | — |
| | — |
| | — |
| | — |
| | — |
| | 24,766 |
| | 24,766 |
|
| Redemption of OP Units | | — |
| | — |
| | — |
| | — |
| | — |
| | — |
| | (916,423 | ) | | (8,420 | ) | | (8,420 | ) | | — |
| | (8,420 | ) |
| Net loss | | — |
| | — |
| | — |
| | — |
| | — |
| | (977,185 | ) | | — |
| | (33,573 | ) | | (1,010,758 | ) | | (154 | ) | | (1,010,912 | ) |
| Other comprehensive loss | | — |
| | — |
| | — |
| | — |
| | — |
| | (4,768 | ) | | — |
| | (170 | ) | | (4,938 | ) | | — |
| | (4,938 | ) |
| Balance, December 31, 2014 | | 42,834,138 |
| | $ | 996,987 |
| | 86,874 |
| | $ | 3,375 |
| | 905,530,431 |
| | $ | 8,157,167 |
|
| 23,763,797 |
|
| $ | 201,102 |
|
| $ | 9,358,631 |
|
| $ | 23,699 |
|
| $ | 9,382,330 |
|
| Repurchases of Common OP Units to settle tax obligation | | — |
| | — |
| | — |
| | — |
| | (268,414 | ) | | (2,227 | ) | | — |
| | — |
| | (2,227 | ) | | — |
| | (2,227 | ) |
| Equity-based compensation, net | | — |
| | — |
| | — |
| | — |
| | (377,623 | ) | | 14,500 |
| | — |
| | — |
| | 14,500 |
| | — |
| | 14,500 |
|
| Tax shortfall from equity-based compensation | | — |
| | — |
| | — |
| | — |
| | — |
| | (764 | ) | | — |
| | — |
| | (764 | ) | | — |
| | (764 | ) |
| Distributions to Common OP Units and non-controlling interests | | — |
| | — |
| | — |
| | — |
| | — |
| | (249,300 | ) | | — |
| | (7,619 | ) | | (256,919 | ) | | (37,975 | ) | | (294,894 | ) |
| Distributions to Preferred OP Units | | — |
| | (71,418 | ) | | — |
| | (60 | ) | | — |
| | — |
| | — |
| | — |
| | (71,478 | ) | | — |
| | (71,478 | ) |
| Disposition of consolidated joint venture interest | | — |
| | — |
| | — |
| | — |
| | — |
| | — |
| | — |
| | — |
| | — |
| | 14,859 |
| | 14,859 |
|
| Net (loss) income | | — |
| | — |
| | — |
| | — |
| | — |
| | (316,353 | ) | | — |
| | (8,413 | ) | | (324,766 | ) | | 1,274 |
| | (323,492 | ) |
| Other comprehensive loss | | — |
| | — |
| | — |
| | — |
| | — |
| | (4,605 | ) | | — |
| | (270 | ) | | (4,875 | ) | | — |
| | (4,875 | ) |
| Balance, December 31, 2015 | | 42,834,138 |
| | $ | 925,569 |
| | 86,874 |
| | $ | 3,315 |
| | 904,884,394 |
| | $ | 7,598,418 |
|
| 23,763,797 |
|
| $ | 184,800 |
|
| $ | 8,712,102 |
|
| $ | 1,857 |
|
| $ | 8,713,959 |
|
| Issuance of Common OP Units, net | | — |
| | — |
| | — |
| | — |
| | 69,000,000 |
| | 702,476 |
| | — |
| | — |
| | 702,476 |
| | — |
| | 702,476 |
|
| Conversion of Limited Partners' Common OP Units to General Partner's Common OP Units | | — |
| | — |
| | — |
| | — |
| | 15,450 |
| | 159 |
| | (15,450 | ) | | (159 | ) | | — |
| | — |
| | — |
|
| Repurchases of Common OP Units to settle tax obligation | | — |
| | — |
| | — |
| | — |
| | (481,261 | ) | | (4,652 | ) | | — |
| | — |
| | (4,652 | ) | | — |
| | (4,652 | ) |
| Equity-based compensation, net | | — |
| | — |
| | — |
| | — |
| | 728,067 |
| | 10,728 |
| | — |
| | — |
| | 10,728 |
| | — |
| | 10,728 |
|
| Contributions from non-controlling interest holders | | — |
| | — |
| | — |
| | — |
| | — |
| | — |
| | — |
| | — |
| | — |
| | 675 |
| | 675 |
|
|
| | | | | | | | | | | | | | | | | | | | | | | | | | | | | | | | | | | | | | | | |
| | | Preferred Units | | Common Units | | | | | | |
| | | General Partner | | Limited Partner | | General Partner | | Limited Partner | | | | | | |
| | | Number of Units | | Capital | | Number of Units | | Capital | | Number of Units | | Capital | | Number of Units | | Capital | | Total Partners' Capital | | Non-Controlling Interests | | Total Capital |
| Balance, January 1, 2016 | | 42,834,138 |
| | $ | 925,569 |
| | 86,874 |
| | $ | 3,315 |
| | 904,884,394 |
| | $ | 7,598,418 |
| | 23,763,797 |
| | $ | 184,800 |
|
| $ | 8,712,102 |
| | $ | 1,857 |
|
| $ | 8,713,959 |
|
| Issuance of common OP Units | | — |
| | — |
| | — |
| | — |
| | 69,000,000 |
| | 702,476 |
| | — |
| | — |
| | 702,476 |
| | — |
| | 702,476 |
|
| Conversion of limited partners' common OP Units to General Partner's common OP Units | | — |
| | — |
| | — |
| | — |
| | 15,450 |
| | 159 |
| | (15,450 | ) | | (159 | ) | | — |
| | — |
| | — |
|
| Repurchases of common OP Units to settle tax obligation | | — |
| | — |
| | — |
| | — |
| | (481,261 | ) | | (4,652 | ) | | — |
| | — |
| | (4,652 | ) | | — |
| | (4,652 | ) |
| Equity-based compensation, net | | — |
| | — |
| | — |
| | — |
| | 728,067 |
| | 10,728 |
| | — |
| | — |
| | 10,728 |
| | — |
| | 10,728 |
|
| Contributions from non-controlling interest holders | | — |
| | — |
| | — |
| | — |
| | — |
| | — |
| | — |
| | — |
| | — |
| | 675 |
| | 675 |
|
| Distributions to common OP Units and non-controlling interests —$0.55 per common unit | | — |
| | — |
| | — |
| | — |
| | — |
| | (515,935 | ) | | — |
| | (13,068 | ) | | (529,003 | ) | | (115 | ) | | (529,118 | ) |
| Dividend equivalents on awards granted under the Equity Plan | | — |
| | — |
| | — |
| | — |
| | — |
| | (1,260 | ) | | — |
| | — |
| | (1,260 | ) | | — |
| | (1,260 | ) |
| Distributions to preferred OP Units | | — |
| | (71,748 | ) | | — |
| | (144 | ) | | — |
| | — |
| | — |
| | — |
| | (71,892 | ) | | — |
| | (71,892 | ) |
| Net loss | | — |
| | — |
| | — |
| | — |
| | — |
| | (195,863 | ) | | — |
| | (4,947 | ) | | (200,810 | ) | | (14 | ) | | (200,824 | ) |
| Other comprehensive loss | | — |
| | — |
| | — |
| | — |
| | — |
| | (531 | ) | | — |
| | (28 | ) | | (559 | ) | | — |
| | (559 | ) |
| Balance, December 31, 2016 | | 42,834,138 |
|
| $ | 853,821 |
|
| 86,874 |
|
| $ | 3,171 |
|
| 974,146,650 |
|
| $ | 7,593,540 |
|
| 23,748,347 |
|
| $ | 166,598 |
|
| $ | 8,617,130 |
|
| $ | 2,403 |
|
| $ | 8,619,533 |
|
| Repurchases of common OP Units under the 2017 Share Repurchase Program | | — |
| | — |
| | — |
| | — |
| | (68,759 | ) | | (518 | ) | | — |
| | — |
| | (518 | ) | | — |
| | (518 | ) |
| Repurchases of common OP Units to settle tax obligation | | — |
| | — |
| | — |
| | — |
| | (268,550 | ) | | (2,148 | ) | | — |
| | — |
| | (2,148 | ) | | — |
| | (2,148 | ) |
| Equity-based compensation, net | | — |
| | — |
| | — |
| | — |
| | 399,242 |
| | 16,754 |
| | — |
| | — |
| | 16,754 |
| | — |
| | 16,754 |
|
| Contributions from non-controlling interest holders | | — |
| | — |
| | — |
| | — |
| | — |
| | — |
| | — |
| | — |
| | — |
| | 101 |
| | 101 |
|
| Distributions to common OP Units and non-controlling interests —$0.55 per common unit | | — |
| | — |
| | — |
| | — |
| | — |
| | (535,657 | ) | | — |
| | (13,060 | ) | | (548,717 | ) | | (167 | ) | | (548,884 | ) |
| Dividend equivalents on awards granted under the Equity Plan | | — |
| | — |
| | — |
| | — |
| | — |
| | (571 | ) | | — |
| | — |
| | (571 | ) | | — |
| | (571 | ) |
| Distributions to preferred OP Units | | — |
| | (71,748 | ) | | — |
| | (144 | ) | | — |
| | — |
| | — |
| | — |
| | (71,892 | ) | | — |
| | (71,892 | ) |
| Disposition of consolidated joint venture interest | | — |
| | — |
| | — |
| | — |
| | — |
| | — |
| | — |
| | — |
| | — |
| | (838 | ) | | (838 | ) |
| Net income (loss) | | — |
| | — |
| | — |
| | — |
| | — |
| | 31,818 |
| | — |
| | 754 |
| | 32,572 |
| | (194 | ) | | 32,378 |
|
| Other comprehensive loss | | — |
| | — |
| | — |
| | — |
| | — |
| | (1,013 | ) | | — |
| | (26 | ) | | (1,039 | ) | | — |
| | (1,039 | ) |
| Balance, December 31, 2017 | | 42,834,138 |
|
| $ | 782,073 |
|
| 86,874 |
|
| $ | 3,027 |
|
| 974,208,583 |
|
| $ | 7,102,205 |
|
| 23,748,347 |
|
| $ | 154,266 |
|
| $ | 8,041,571 |
|
| $ | 1,305 |
|
| $ | 8,042,876 |
|
| Conversion of limited partners' common OP Units to General Partner's common OP Units | | — |
| | — |
| | — |
| | — |
| | 32,439 |
| | 241 |
| | (32,439 | ) | | (241 | ) | | — |
| | — |
| | — |
|
| Repurchases of common OP Units under Share Repurchase Programs | | — |
| | — |
| | — |
| | — |
| | (7,206,876 | ) | | (50,154 | ) | | — |
| | — |
| | (50,154 | ) | | — |
| | (50,154 | ) |
| Repurchases of common OP Units to settle tax obligation | | — |
| | — |
| | — |
| | — |
| | (324,502 | ) | | (2,326 | ) | | — |
| | — |
| | (2,326 | ) | | — |
| | (2,326 | ) |
| Equity-based compensation, net | | — |
| | — |
| | — |
| | — |
| | 805,521 |
| | 13,314 |
| | — |
| | — |
| | 13,314 |
| | — |
| | 13,314 |
|
| Contributions from non-controlling interest holders | | — |
| | — |
| | — |
| | — |
| | — |
| | — |
| | — |
| | — |
| | — |
| | 120 |
| | 120 |
|
| Distributions to common OP Units and non-controlling interests —$0.55 per common unit | | — |
| | — |
| | — |
| | — |
| | — |
| | (532,144 | ) | | — |
| | (13,048 | ) | | (545,192 | ) | | — |
| | (545,192 | ) |
VEREIT OPERATING PARTNERSHIP, L.P.
CONSOLIDATED STATEMENTS OF CHANGES IN EQUITY – (Continued)
(In thousands, except for unit data)
|
| | | | | | | | | | | | | | | | | | | | | | | | | | | | | | | | | | | | | | | | | |
| | | Preferred Units | | Common Units | | | | | | |
| | | General Partner | | Limited Partner | | General Partner | | Limited Partner | | | | | | |
| | | Number of Units | | Capital | | Number of Units | | Capital | | Number of Units | | Capital | | Number of Units | | Capital | | Total Partners' Capital | | Non-Controlling Interests | | Total Capital |
| Distributions to Common OP Units and non-controlling interest holders | | — |
| | $ | — |
| | — |
| | $ | — |
| | — |
| | $ | (517,195 | ) | | $ | — |
| | $ | (13,068 | ) | | $ | (530,263 | ) | | $ | (115 | ) | | $ | (530,378 | ) |
| Distributions to Preferred OP Units | | — |
| | (71,748 | ) | | — |
| | (144 | ) | | — |
| | �� |
| | — |
| | — |
| | (71,892 | ) | | — |
| | (71,892 | ) |
| Net loss | | — |
| | — |
| | — |
| | — |
| | — |
| | (195,863 | ) | | — |
| | (4,947 | ) | | (200,810 | ) | | (14 | ) | | (200,824 | ) |
| Other comprehensive loss | | — |
| | — |
| | — |
| | — |
| | — |
| | (531 | ) | | — |
| | (28 | ) | | (559 | ) | | — |
| | (559 | ) |
| Balance, December 31, 2016 | | 42,834,138 |
|
| $ | 853,821 |
|
| 86,874 |
|
| $ | 3,171 |
|
| 974,146,650 |
|
| $ | 7,593,540 |
|
| 23,748,347 |
|
| $ | 166,598 |
|
| $ | 8,617,130 |
|
| $ | 2,403 |
|
| $ | 8,619,533 |
|
| |
(1) | Includes $2.2 million issued to affiliates of the Former Manager (as defined in Note 1 – Organization) for the year ended December 31, 2014. No such amounts were issued to affiliates of the Former Manager during the years ended December 31, 2016 and 2015.
|
|
| | | | | | | | | | | | | | | | | | | | | | | | | | | | | | | | | | | | | | | | |
| | | Preferred Units | | Common Units | | | | | | |
| | | General Partner | | Limited Partner | | General Partner | | Limited Partner | | | | | | |
| | | Number of Units | | Capital | | Number of Units | | Capital | | Number of Units | | Capital | | Number of Units | | Capital | | Total Partners' Capital | | Non-Controlling Interests | | Total Capital |
| Dividend equivalents on awards granted under the Equity Plan | | — |
| | $ | — |
| | — |
| | $ | — |
| | — |
| | $ | (917 | ) | | — |
| | $ | — |
| | $ | (917 | ) | | $ | — |
| | $ | (917 | ) |
| Distributions to preferred OP Units | | — |
| | (71,748 | ) | | — |
| | (144 | ) | | — |
| | — |
| | — |
| | — |
| | (71,892 | ) | | — |
| | (71,892 | ) |
| Net loss | | — |
| | — |
| | — |
| | — |
| | — |
| | (85,774 | ) | | — |
| | (2,102 | ) | | (87,876 | ) | | (154 | ) | | (88,030 | ) |
| Other comprehensive income | | — |
| | — |
| | — |
| | — |
| | — |
| | 2,289 |
| | — |
| | 56 |
| | 2,345 |
| | — |
| | 2,345 |
|
| Balance, December 31, 2018 | | 42,834,138 |
| | $ | 710,325 |
| | 86,874 |
| | $ | 2,883 |
| | 967,515,165 |
| | $ | 6,446,734 |
| | 23,715,908 |
| | $ | 138,931 |
| | $ | 7,298,873 |
| | $ | 1,271 |
| | $ | 7,300,144 |
|
The accompanying notes are an integral part of these statements.
VEREIT OPERATING PARTNERSHIP, L.P.
CONSOLIDATED STATEMENTS OF CASH FLOWS
(In thousands)
| | | | | Year Ended December 31, | | Year Ended December 31, |
| | | 2016 | | 2015 | | 2014 | | 2018 | | 2017 | | 2016 |
| Cash flows from operating activities: | | | | | | | | | | | | |
| Net loss | | $ | (200,824 | ) | | $ | (323,492 | ) | | (1,010,912 | ) | |
| Adjustments to reconcile net loss to net cash provided by operating activities: | | | | | | | |
| Issuance of OP Units | | — |
| | — |
| | 92,884 |
| |
| Net (loss) income | | | $ | (88,030 | ) | | $ | 32,378 |
| | $ | (200,824 | ) |
| Adjustments to reconcile net (loss) income to net cash provided by operating activities: | | | | | | | |
| Depreciation and amortization | | 806,548 |
| | 866,549 |
| | 1,007,164 |
| | 659,948 |
| | 745,499 |
| | 806,548 |
|
| (Gain) loss on real estate assets and joint venture, net | | (55,722 | ) | | 65,582 |
| | 277,031 |
| |
| Gain on real estate assets, net | | | (96,068 | ) | | (61,536 | ) | | (55,722 | ) |
| Impairments from held for sale | | | — |
| | 20,027 |
| | — |
|
| Impairments | | 303,751 |
| | 305,094 |
| | 409,991 |
| | 54,647 |
| | 50,548 |
| | 303,751 |
|
| Reserve for loan loss | | — |
| | 15,300 |
| | — |
| |
| Equity-based compensation | | 10,728 |
| | 14,500 |
| | 31,861 |
| |
| Equity based compensation | | | 13,314 |
| | 16,751 |
| | 10,728 |
|
| Equity in income of unconsolidated entities | | 415 |
| | (2,361 | ) | | 77 |
| | (1,869 | ) | | (2,726 | ) | | 415 |
|
| Distributions from unconsolidated entities | | 4,013 |
| | 11,352 |
| | 8,335 |
| | 1,366 |
| | 3,646 |
| | 1,433 |
|
| Loss on derivative instruments | | 1,191 |
| | 1,460 |
| | 10,570 |
| |
| (Gain) on investment securities | | — |
| | (65 | ) | | (6,357 | ) | |
| Loss (gain) on extinguishment and forgiveness of debt, net | | 771 |
| | (4,812 | ) | | (14,012 | ) | |
| Note receivable issued in legal settlement | | — |
| | — |
| | (15,300 | ) | |
| Gain on investments | | | (4,092 | ) | | (65 | ) | | — |
|
| (Gain) loss on derivative instruments, net | | | (355 | ) | | (2,976 | ) | | 1,191 |
|
| (Gain) loss on extinguishment of debt and forgiveness of debt | | | (5,360 | ) | | (18,373 | ) | | 771 |
|
| Changes in assets and liabilities: | | | | | | | | | | | | |
| Investment in direct financing leases | | 3,976 |
| | 2,035 |
| | 1,597 |
| | 2,078 |
| | 2,097 |
| | 3,976 |
|
| Rent and tenant receivables and other assets, net | | (52,626 | ) | | (62,356 | ) | | (97,125 | ) | | (34,096 | ) | | (21,394 | ) | | (52,626 | ) |
| Due from affiliates | | (416 | ) | | 25,489 |
| | (32,821 | ) | | — |
| | 1,163 |
| | (416 | ) |
| Assets held for sale classified as discontinued operations | | | (2,492 | ) | | 13,812 |
| | — |
|
| Accounts payable and accrued expenses | | (3,323 | ) | | (999 | ) | | (16,279 | ) | | 1,688 |
| | 10,742 |
| | (3,323 | ) |
| Deferred rent, derivative and other liabilities | | (17,740 | ) | | (45,934 | ) | | (99,930 | ) | |
| Deferred rent and other liabilities | | | 7,162 |
| | (395 | ) | | (17,740 | ) |
| Due to affiliates | | (214 | ) | | (329 | ) | | (43,887 | ) | | (66 | ) | | 50 |
| | (214 | ) |
| Liabilities related to discontinued operations | | | (13,861 | ) | | 4,019 |
| | — |
|
| Net cash provided by operating activities | | 800,528 |
|
| 867,013 |
|
| 502,887 |
| | 493,914 |
|
| 793,267 |
| | 797,948 |
|
| Cash flows from investing activities: | | | | | | | | | | | | |
| Investments in real estate assets | | (100,194 | ) | | (36,319 | ) | | (3,539,906 | ) | | (500,625 | ) | | (699,004 | ) | | (100,194 | ) |
| Acquisition of real estate businesses, net of cash acquired | | — |
| | — |
| | (756,232 | ) | |
| Capital expenditures and leasing costs | | (16,568 | ) | | (18,569 | ) | | (34,687 | ) | | (22,291 | ) | | (21,694 | ) | | (16,568 | ) |
| Real estate developments | | (17,411 | ) | | (57,682 | ) | | (72,515 | ) | | (9,221 | ) | | (14,850 | ) | | (17,411 | ) |
| Principal repayments received from borrowers | | 5,417 |
| | 6,921 |
| | 77,614 |
| |
| Principal repayments received on investment securities and mortgage notes receivable | | | 5,761 |
| | 6,796 |
| | 5,417 |
|
| Investments in unconsolidated entities | | (25,777 | ) | | — |
| | (2,500 | ) | | (771 | ) | | — |
| | (25,777 | ) |
| Return of investment from unconsolidated entities | | | 48 |
| | 1,972 |
| | 2,580 |
|
| Proceeds from disposition of real estate and joint venture | | 1,000,700 |
| | 1,009,107 |
| | 1,598,767 |
| | 502,289 |
| | 445,525 |
| | 1,000,700 |
|
| Proceeds from disposition of discontinued operations | | | 122,915 |
| | — |
| | — |
|
| Investment in leasehold improvements and other assets | | (2,259 | ) | | (1,911 | ) | | (11,890 | ) | | (841 | ) | | (1,191 | ) | | (2,259 | ) |
| Deposits for real estate assets | | | (13,412 | ) | | (37,226 | ) | | (17,856 | ) |
| Proceeds from sale of investments and other assets | | — |
| | 392 |
| | 159,752 |
| | 46,966 |
| | 400 |
| | — |
|
| Deposits for real estate assets | | (17,856 | ) | | (16,542 | ) | | (265,372 | ) | |
| Uses and refunds of deposits for real estate assets | | 13,305 |
| | 48,702 |
| | 347,971 |
| | 17,267 |
| | 36,111 |
| | 13,305 |
|
| Line of credit advances to affiliates | | (10,300 | ) | | (10,000 | ) | | (125,000 | ) | |
| Line of credit repayments from affiliates | | 50,000 |
| | 10,000 |
| | 81,100 |
| |
| Investment in mortgage notes receivable | | — |
| | — |
| | (2,952 | ) | |
| Change in restricted cash | | 11,136 |
| | (1,504 | ) | | (8,606 | ) | |
| Proceeds from the settlement of property-related insurance claims | | | 1,434 |
| | 355 |
| | — |
|
| Line of credit advances to Cole REITs | | | (2,200 | ) | | (16,400 | ) | | (10,300 | ) |
| Line of credit repayments from Cole REITs | | | 3,800 |
| | 25,100 |
| | 50,000 |
|
| Net cash provided by (used in) investing activities | | 890,193 |
| | 932,595 |
|
| (2,554,456 | ) | | 151,119 |
| | (274,106 | ) | | 881,637 |
|
| Cash flows from financing activities: | | | | | | | | | | | | |
| Proceeds from mortgage notes payable | | 3,112 |
| | 1,445 |
| | 1,010,219 |
| | 187 |
| | 4,652 |
| | 3,112 |
|
| Payments on mortgage notes payable and other debt, including extinguishment costs | | (333,409 | ) | | (184,504 | ) | | (1,255,506 | ) | |
| Payments on mortgage notes payable and other debt, including debt extinguishment costs | | | (137,887 | ) | | (424,385 | ) | | (337,022 | ) |
| Proceeds from credit facility | | 1,033,000 |
| | 60,000 |
| | 5,824,000 |
| | 1,934,000 |
| | 329,000 |
| | 1,033,000 |
|
| Payments on credit facility | | (1,993,000 | ) | | (1,784,000 | ) | | (5,918,800 | ) | | (1,716,000 | ) | | (645,107 | ) | | (1,993,000 | ) |
| Proceeds from corporate bonds | | 1,000,000 |
| | — |
| | 2,545,760 |
| | 546,304 |
| | 600,000 |
| | 1,000,000 |
|
| Payments on corporate bonds, including extinguishment costs | | (1,311,203 | ) | | — |
| | — |
| | — |
| | — |
| | (1,311,203 | ) |
| Repayment of convertible notes | | | (597,500 | ) | | — |
| | — |
|
| Payments of deferred financing costs | | (19,872 | ) | | (2,436 | ) | | (116,373 | ) | | (25,471 | ) | | (9,575 | ) | | (19,872 | ) |
| Proceeds from 2016 Term Loan | | 300,000 |
| | — |
| | — |
| |
| Repayment of 2016 Term Loan | | (300,000 | ) | | — |
| | — |
| |
| Redemption of Series D Preferred Stock | | — |
| | — |
| | (316,126 | ) | |
| Repurchases of common units to settle tax obligations | | (4,652 | ) | | (2,227 | ) | | (7,690 | ) | |
| Proceeds from the issuance of Common Units, net of underwriters’ discount | | 702,765 |
| | — |
| | 1,656,000 |
| |
| Payments of equity issuance costs | | (280 | ) | | — |
| | (60,955 | ) | |
| Proceeds from 2016 term loan | | | — |
| | — |
| | 300,000 |
|
| Repayment of 2016 term loan | | | — |
| | — |
| | (300,000 | ) |
VEREIT OPERATING PARTNERSHIP, L.P.
CONSOLIDATED STATEMENTS OF CASH FLOWS – (Continued)
(In thousands)
|
| | | | | | | | | | | | |
| | | Year Ended December 31, |
| | | 2016 | | 2015 | | 2014 |
| Contributions from non-controlling interest holders | | 675 |
| | — |
| | 982 |
|
| Distributions paid | | (580,508 | ) | | (235,494 | ) | | (950,414 | ) |
| Windfall tax benefits related to equity-based compensation | | — |
| | — |
| | 4,458 |
|
| Net cash (used in) provided by financing activities | | (1,503,372 | ) |
| (2,147,216 | ) |
| 2,415,555 |
|
| Net change in cash and cash equivalents | | 187,349 |
| | (347,608 | ) |
| 363,986 |
|
| Cash and cash equivalents, beginning of period | | 69,103 |
| | 416,711 |
| | 52,725 |
|
| Cash and cash equivalents, end of period | | $ | 256,452 |
|
| $ | 69,103 |
|
| $ | 416,711 |
|
|
| | | | | | | | | | | | |
| | | Year Ended December 31, |
| | | 2018 | | 2017 | | 2016 |
| Repurchases of Common Stock under the Share Repurchase Programs | | $ | (50,154 | ) | | $ | (518 | ) | | $ | — |
|
| Repurchases of Common Stock to settle tax obligations | | (2,326 | ) | | (2,148 | ) | | (4,652 | ) |
| Proceeds from the issuance of common OP Units, net of underwriters’ discount | | — |
| | — |
| | 702,765 |
|
| Payments of equity issuance costs | | — |
| | — |
| | (280 | ) |
| Contributions from non-controlling interest holders | | 120 |
| | 101 |
| | 675 |
|
| Distributions paid | | (606,679 | ) | | (608,615 | ) | | (580,508 | ) |
| Net cash used in financing activities | | (655,406 | ) |
| (756,595 | ) | | (1,506,985 | ) |
| Net change in cash and cash equivalents and restricted cash | | (10,373 | ) | | (237,434 | ) | | 172,600 |
|
| | | | | | | |
| Cash and cash equivalents and restricted cash, beginning of period | | $ | 64,036 |
| | $ | 301,470 |
| | $ | 128,870 |
|
| Less: cash and cash equivalents of discontinued operations | | (2,198 | ) | | (2,973 | ) | | (4,968 | ) |
| Cash and cash equivalents and restricted cash from continuing operations, beginning of period | | 61,838 |
| | 298,497 |
| | 123,902 |
|
| | | | | | | |
| Cash and cash equivalents, and restricted cash, end of period | | 53,663 |
| | 64,036 |
| | 301,470 |
|
| Less: cash and cash equivalents of discontinued operations | | — |
| | (2,198 | ) | | (2,973 | ) |
| Cash and cash equivalents and restricted cash from continuing operations, end of period | | $ | 53,663 |
| | $ | 61,838 |
| | $ | 298,497 |
|
| Reconciliation of Cash and Cash Equivalents and Restricted Cash | | | | | | |
| Cash and cash equivalents at beginning of period | | $ | 34,176 |
| | $ | 253,479 |
| | $ | 64,135 |
|
| Restricted cash at beginning of period | | 27,662 |
| | 45,018 |
| | 59,767 |
|
| Cash and cash equivalents and restricted cash at beginning of period | | 61,838 |
| | 298,497 |
| | 123,902 |
|
| | | | | | | |
| Cash and cash equivalents at end of period | | 30,758 |
| | 34,176 |
| | 253,479 |
|
| Restricted cash at end of period | | 22,905 |
| | 27,662 |
| | 45,018 |
|
| Cash and cash equivalents and restricted cash at end of period | | $ | 53,663 |
| | $ | 61,838 |
| | $ | 298,497 |
|
The accompanying notes are an integral part of these statements.
VEREIT, INC. ANDand VEREIT OPERATING PARTNERSHIP, L.P.
NOTES TO CONSOLIDATED FINANCIAL STATEMENTS
December 31, 20162018
Note 1 – Organization
VEREIT® is a Maryland corporation, incorporated on December 2, 2010, that qualified as a real estate investment trust (“REIT”) for U.S. federal income tax purposes beginning in the taxable year ended December 31, 2011. VEREIT Operating Partnership, L.P. (together with its subsidiaries, the “Operating Partnership” or the “OP”),The OP is a Delaware limited partnership of which the General Partner is the sole general partner. VEREIT’s common stock, par value $0.01 per share (“Common Stock”), and its 6.70% Series F Cumulative Redeemable Preferred Stock, par value $0.01 per share (“Series F Preferred Stock”) trade on the New York Stock Exchange (“NYSE”) under the trading symbols, “VER” and “VER PRF,” respectively. As used herein, the terms the “Company,” “we,” “our” and “us” refer to VEREIT, together with its consolidated subsidiaries, including the OP.
The CompanyVEREIT is a full-service real estate operating company with investment management capabilities that operates through two reportable segments, its real estate investment (“REI”) segment and its investment management segment, Cole Capital® (“Cole Capital”), as further discussed in Note 3 – Segment Reporting. Through the REI segment, the Companywhich owns and actively manages a diversified portfolioone of retail, restaurant, office and industrial real estatethe largest portfolios of single-tenant commercial properties subjectin the U.S. VEREIT’s business model provides equity capital to creditworthy corporations in return for long-term net leases with creditworthy tenants.on their properties. The Company actively manages its portfolio considering a number of metrics including property type, concentration and key economic factors for appropriate balance and diversity. Through the Cole Capital segment, the Company is responsible for raising capital for and managing the affairs of the Cole REITs® (as defined in Note 3 – Segment Reporting) on a day-to-day basis, identifying and making acquisitions and investments on the Cole REITs’ behalf, and recommending to the respective board of directors of each of the Cole REITs an approach for providing investors with liquidity. Cole Capital receives compensation and reimbursement for performing these services. To support both reportable segments, the Company employs a shared services model pursuant to which its personnel are integral in providing, among other things, transactional and operational functions to the Company’s owned portfolio and the Cole REITs.
Substantially all of the REI segment’sCompany’s operations are conducted through the OP. VEREIT is the sole general partner and holder of 97.6% of the common equity interests in the OP as of December 31, 20162018 with the remaining 2.4% of the common equity interests owned by unaffiliated investors and certain former directors, officers and employees of ARC Properties Advisors, LLC (the “Former Manager”). Under the limited partnership agreement of the OP, as amended (the “LPA”), after holding units of limited partner interests in the OP (“OP Units”), including Series F Preferred Units, for a period of one year and meeting the other requirements in the LPA, unless an earlier redemption is otherwise consented to by VEREIT, holders of OP Units, including Series F Preferred Units, have the right to redeem the OP Unitsunits for the cash value of a corresponding number of shares of VEREIT’s Common Stock or VEREIT’s Series F Preferred Stock, as applicable, or, at the option of VEREIT, a corresponding number of shares of VEREIT’s Common Stock or Series F Preferred Stock. The remaining rights of the holders of OP Units are limited, however, and do not include the ability to replace the General Partner or to approve the sale, purchase or refinancing of the OP’s assets.
Substantially all of the Cole Capital segment’s operations are conducted through Cole Capital Advisors, Inc. (“CCA”), an Arizona corporation and a wholly owned subsidiary of the OP. CCA is treated as a taxable REIT subsidiary (“TRS”) under Section 856 of the Internal Revenue Code of 1986, as amended (the “Internal Revenue Code”).
The actions of the OP and its relationship with the General Partner are governed by the LPA. The General Partner does not have any significant assets other than its investment in the OP. Therefore, the assets and liabilities of the General Partner and the OP are substantially the same. Additionally, pursuant to the LPA, all administrative expenses and expenses associated with the formation, continuity, existence and operation of the General Partner incurred by the General Partner on the OP’s behalf shall be treated as expenses of the OP. Further, when the General Partner issues any equity instrument that has been approved by the General Partner’s boardBoard of directors,Directors, the LPA requires the OP to issue to the General Partner equity instruments with substantially similar terms, to protect the integrity of the Company’s umbrella partnership REIT structure, pursuant to which each holder of interests in the OP has a proportionate economic interest in the OP reflecting its capital contributions thereto. OP Units and Series F Preferred Units issued to the General Partner are referred to as General“General Partner OP Units.Units” and “General Partner Series F Preferred Units,” respectively. OP Units and Series F Preferred Units issued to parties other than the General Partner are referred to as Limited“Limited Partner OP Units.Units” and “Limited Partner Series F Preferred Units,” respectively. The LPA also provides that the OP issue debt with terms and provisions consistent with debt issued by the General Partner. The LPA will be amended to provide for the issuance of any additional class of equivalent equity instruments to the extent the General Partner’s boardBoard of directorsDirectors authorizes the issuance of any new class of equity securities.
Prior to January 8, 2014, the Company was externally managed by ARC Properties Advisors, LLC (the “Former Manager”)As discussed in Note 4 —Discontinued Operations, on a day-to-day basis, with the exception of certain acquisition, accounting and portfolio management activities which were performed by the Company’s employees. In August 2013, the General Partner’s board of directors determined that it was in the best interests of the Company and its stockholders to become self-managed, andFebruary 1, 2018, the Company completed the sale of its transition to self-management on January 8, 2014.investment management segment, Cole Capital. The assets, liabilities and related financial results of substantially all of the Cole Capital segment are reflected in the financial statements as discontinued operations.
VEREIT, INC. AND VEREIT OPERATING PARTNERSHIP, L.P.
NOTES TO CONSOLIDATED FINANCIAL STATEMENTS
December 31, 2016 – (Continued)
Note 2 – Summary of Significant Accounting Policies
Basis of Accounting
The consolidated financial statements of the Company presented herein include the accounts of the General Partner and its consolidated subsidiaries, including the OP. All intercompany transactions have been eliminated upon consolidation. The financial statements are prepared on the accrual basis of accounting in accordance with generally accepted accounting principles in the United States (“U.S. GAAP”).
Principles of Consolidation and Basis of Presentation
The consolidated financial statements include the accounts of the Company and its consolidated subsidiaries and consolidated joint venture arrangements (the “Consolidated Joint Ventures”).arrangements. The portions of the Consolidated Joint Venturesconsolidated joint venture arrangements not owned by the Company are presented
VEREIT, INC. and VEREIT OPERATING PARTNERSHIP, L.P.
NOTES TO CONSOLIDATED FINANCIAL STATEMENTS
December 31, 2018 – (Continued)
as non-controlling interests in VEREIT’s and the OP’s consolidated balance sheets, statements of operations, statements of comprehensive income (loss) and statements of changes in equity. In addition, as described in Note 1 – Organization,Organization, certain third parties have been issued OP Units. Holders of OP Units are considered to be non-controlling interest holders in the OP and their ownership interest in the limited partner’s share is presented as non-controlling interests in VEREIT’s consolidated balance sheets, statements of operations, statements of comprehensive income (loss) and statements of changes in equity. Further, a portion of the earnings and losses of the OP are allocated to non-controlling interest holders based on their respective ownership percentages. Upon conversion of OP Units to Common Stock, any difference between the fair value of shares of Common Stock issued and the carrying value of the OP Units converted is recorded as a component of equity. As of each of December 31, 20162018 and December 31, 2015,2017, there were approximately 23.75 million and 23.7623.7 million Limited Partner OP Units outstanding, respectively.outstanding.
For legal entities being evaluated for consolidation, the Company must first determine whether the interests that it holds and fees it receives qualify as variable interests in the entity. A variable interest is an investment or other interest that will absorb portions of an entity’s expected losses or receive portions of the entity’s expected residual returns. The Company’s evaluation includes consideration of fees paid to the Company where the Company acts as a decision maker or service provider to the entity being evaluated. If the Company determines that it holds a variable interest in an entity, it evaluates whether that entity is a variable interest entity (“VIE”). VIEs are entities where investors lack sufficient equity at risk for the entity to finance its activities without additional subordinated financial support or where equity investors, as a group, lack one of the following characteristics: (a) the power to direct the activities that most significantly impact the entity’s economic performance, (b) the obligation to absorb the expected losses of the entity, or (c) the right to receive the expected returns of the entity.
The Company then qualitatively assesses whether it is (or is not) the primary beneficiary of a VIE, which is generally defined as the party who has a controlling financial interest in the VIE. Consideration of various factors include, but are not limited to, the Company’s ability to direct the activities that most significantly impact the entity’s economic performance and its obligation to absorb losses from or right to receive benefits of the VIE that could potentially be significant to the VIE. The Company consolidates any VIEs when the Company is determined to be the primary beneficiary of the VIE and the difference between consolidating the VIE and accounting for it using the equity method could be material to the Company’s consolidated financial statements. The Company continually evaluates the need to consolidate these VIEs based on standards set forth in U.S. GAAP.
In October 2016, the U.S. Financial Accounting Standards Board (the “FASB”) Accounting Standards Update, (“ASU”) No. 2016-17, Consolidation (Topic 810): Interests Held through Related Parties That Are under Common Control (“ASU 2016-17”), which changes how a single decision maker will consider its indirect interests when performing the primary beneficiary analysis under the VIE model. Under ASU 2015-02 “Consolidation (Topic 810), Amendments to the Consolidation Analysis,” a single decision maker was required to consider an indirect interest held by a related party under common control in its entirety. Under ASU 2016-17, the single decision maker will consider the indirect interest on a proportionate basis. ASU 2016-17 does not change the characteristics of a primary beneficiary in the VIE model. The amendments of ASU 2016-17 are effective for reporting periods beginning after December 15, 2016, with early adoption permitted. The Company is currently evaluating the impact this amendment will have on its consolidated financial statements.
Reclassification
As described below, the following items previously reported have been reclassified to conform with the current period’s presentation.
The landoperating expense reimbursements line item has been combined into rental revenue for prior periods presented to be consistent with the current year presentation.
The investment in direct financing leases, net, investment securities, at fair value and constructionmortgage notes receivable, net line items from prior periods have been combined into the rent and tenant receivables and other assets, net caption on the consolidated balance sheets. Investments in progressthe Cole REITs, as defined in “Investment in Cole REITs” section herein, has also been reclassified as of December 31, 2017 to rent and tenant receivables and other assets, net from investment in unconsolidated entities to be consistent with the current year presentation. Refer to Note 5 – Rent and Tenant Receivables and Other Assets, Netfor reclassification amounts and additional information.
The distributions declared on Common Stock line item from prior periods has been combined intoupdated to exclude distributions on restricted stock units (“Restricted Stock Units”) and deferred stock units (“Deferred Stock Units”) on the buildings, fixtures and improvements captionconsolidated statements of changes in equity for all periods presented. These amounts are now included in the consolidated balance sheets.line item dividend equivalents on awards granted under the Equity Plan (as defined in incomeNote 12 – Equity-based Compensation), which also includes dividend equivalents on restricted shares of unconsolidated joint venturesCommon Stock (“Restricted Shares”). The dividend equivalents on Restricted Shares were previously included
VEREIT, INC. AND VEREIT OPERATING PARTNERSHIP, L.P.
NOTES TO CONSOLIDATED FINANCIAL STATEMENTS
December 31, 2016 – (Continued)
in other income, netthe line item distributions to participating securities in the consolidated statements of operations has been includedchanges in a separate caption entitled equity in income (loss) and gain on disposition of unconsolidated entities. Gain (loss) on investment securities previously included as a separate caption in the consolidated statements of operations, has been included in other income, net in the consolidated statements of operations.equity.
Use of Estimates
The preparation of financial statements in conformity with U.S. GAAP requires management to make estimates and assumptions that affect the reported amounts of assets and liabilities and disclosure of contingent assets and liabilities at the date of the financial statements and the reported amounts of revenues and expenses during the reporting period. Actual results could differ from those estimates. Management makes significant estimates regarding goodwill and intangible asset impairments, real estate investment impairment, loans held for investment, program development costs, allocation of purchase price of business combinationsreal estate asset acquisitions and income taxes as well as the consolidationtaxes.
VEREIT, INC. and VEREIT OPERATING PARTNERSHIP, L.P.
NOTES TO CONSOLIDATED FINANCIAL STATEMENTS
December 31, 2018 – (Continued)
Real Estate Investments
The Company records acquired real estate at cost and makes assessments as to the useful lives of depreciable assets. The Company considers the period of future benefit of the asset to determine the appropriate useful lives. Depreciation is computed using a straight-line method over the estimated useful life of 40 years for buildings, five to 15 years for building fixtures and improvements and the remaining lease term for intangible lease assets.
Assets Held for Sale
Upon classifying a real estate investment as held for sale, the Company will no longer recognize depreciation expense related to the depreciable assets of the property. Furthermore, the Company will allocate goodwill to the cost basis of an asset upon held for sale classification. Assets held for sale are recorded at the lower of carrying value or estimated fair value, less the estimated cost to dispose of the assets. See Note 5 –Real Estate Investments for further discussion regarding properties held for sale.
If circumstances arise that the Company previously considered unlikely and, as a result, the Company decides not to sell a property previously classified as held for sale, the Company will reclassify the property as held and used. The Company measures and records a property that is reclassified as held and used at the lower of (i) its carrying value before the property was classified as held for sale, adjusted for any depreciation expense that would have been recognized had the property been continuously classified as held and used or (ii) the estimated fair value at the date of the subsequent decision not to sell.
Development Activities
Project costs, which include interest expense, associated with the development, construction and lease-up of a real estate project are capitalized as construction in progress. Once the development and construction of the building is substantially completed, the amounts capitalized to construction in progress are transferred to (i) land and (ii) buildings, fixtures and improvements and are depreciated over their respective useful lives.
Investment in Unconsolidated Entities
Unconsolidated Joint Ventures
The Company accounts for its investment in unconsolidated joint venture arrangements (the “Unconsolidated Joint Ventures”) using the equity method of accounting as the Company has the ability to exercise significant influence, but not control, over operating and financial policies of these investments. The equity method of accounting requires the investment to be initially recorded at cost and subsequently adjusted for the Company’s share of equity in the joint ventures’ earnings and distributions. The Company records its proportionate share of net income (loss) from the Unconsolidated Joint Ventures in equity in income (loss) and gain on disposition of unconsolidated entities in the consolidated statements of operations. See Note 5 –Real Estate Investments for further discussion on investments in Unconsolidated Joint Ventures.
VEREIT, INC. AND VEREIT OPERATING PARTNERSHIP, L.P.
NOTES TO CONSOLIDATED FINANCIAL STATEMENTS
December 31, 2016 – (Continued)
Cole REITs
As of December 31, 2016 and 2015, the Company owned equity investments in the Cole REITs, as defined in Note 3 – Segment Reporting. The Company accounts for these investments using the equity method of accounting which requires the investment to be initially recorded at cost and subsequently adjusted for the Company’s share of equity in the respective entity’s earnings and distributions. The Company records its proportionate share of net income (loss) from the Cole REITs in equity in income and gain on disposition of unconsolidated entities in the consolidated statements of operations. See Note 18 –Related Party Transactions and Arrangements for further discussion on the Cole REITs.
Allocation of Purchase Price of Business Combinations including Acquired Properties
In accordance with the guidance for business combinations, the Company determines whether a transaction or other event is a business combination. If the transaction is determined to be a business combination, the Company determines if the transaction is considered to be between entities under common control. The acquisition of an entity under common control is accounted for on the carryover basis of accounting whereby the assets and liabilities of the acquired company are recorded on the same basis as they were carried by the acquired company on the merger date. All other business combinations are accounted for by applying the acquisition method of accounting. Under the acquisition method, the Company recognizes the identifiable assets acquired, the liabilities assumed and any non-controlling interest in the acquired entity at fair value. In addition, the Company evaluates the existence of goodwill or a gain from a bargain purchase.Real Estate Assets
The Company allocates the purchase price of acquired properties that constitute a business under U.S. GAAP and businesses accounted for under the acquisition method of accounting to tangible and identifiable intangible assets and liabilities acquired based on their respectiverelative fair values. Tangible assets include land, buildings, fixtures and improvements on an as-if vacant basis. The Company utilizes various estimates, processes and information to determine the as-if vacant property value. Identifiable intangible assets and liabilities include amounts allocated to acquired leases for above-market and below-market lease rates and the value of in-place leases. In making estimates ofestimating fair values for purposes of allocating purchase price, the Company utilizes a number of sources, including independent appraisals that may be obtained in connection with the acquisition or financing of the respective property and other market data. The Company also considers information obtained about each property as a result of its pre-acquisition due diligence, as well as subsequent marketing and leasing activities, in estimating the fair value of the tangible and intangible assets acquired and intangible liabilities assumed.
The aggregate value of intangible assets related to in-place leases is primarily the difference between the property valued with existing in-place leases adjusted to market rental rates and the property valued as if vacant. Factors considered by the Company in its analysis of the in-place lease intangibles include an estimate of carrying costs during the expected lease-up period for each property, taking into account current market conditions and costs to execute similar leases. In estimating carrying costs, the Company includes real estate taxes, insurance and other operating expenses and estimates of lost rentals at market rates during the expected lease-up period, which typically ranges from six to 18 months. The Company also estimates costs to execute similar leases, including leasing commissions, legal and other related expenses. The value of in-place leases is amortized over the initial term of the respective leases. If a tenant terminates its lease, then the unamortized portion of the in-place lease value is charged to expense.
Above-market and below-market in-place lease values for owned properties are recorded based on the present value (using an interest rate which reflects the risks associated with the leases acquired) of the difference between the contractual amounts to be paid pursuant to the in-place leases and management’s estimate of fair market lease rates for the corresponding in-place leases, measured over a period equal to the remaining non-cancelable term of the lease, including any bargain renewal periods. Above-market leases are amortized as a reduction to rental incomerevenue over the remaining terms of the respective leases. Below-market leases are amortized as an increase to rental incomerevenue over the remaining terms of the respective leases, including any bargain renewal periods.
The fair value of investments and debt are valued using techniques consistent with those disclosed in Note 10 – Fair Value Measures, depending on the naturedetermination of the investment or debt. The fair valuevalues of all other assumedthe real estate assets and liabilities acquired requires the use of significant assumptions with regard to the current market rental rates, rental growth rates, capitalization and discount rates, interest rates and other variables. The use of alternative estimates may result in a different allocation of the Company’s purchase price, which could materially impact the Company’s results of operations.
In January 2017, the Company elected to early adopt ASU 2017-01, Business Combinations (Topic 805): Clarifying the Definition of a Business (“ASU 2017-01”), which clarifies the definition of a business by adding guidance to assist entities in evaluating whether transactions should be accounted for as acquisitions of assets or businesses. During the years ended December 31, 2018 and 2017, all real estate acquisitions qualified as asset acquisitions, and external acquisition costs related to asset acquisitions were capitalized and allocated to tangible and intangible assets and liabilities as described above. Prior to January 1, 2017, external costs related to property acquisitions were expensed as incurred. Internal costs, such as employee salaries, related to activities necessary to complete, or affect, self-originating asset acquisitions or business combinations are classified as acquisition-related expenses in the accompanying consolidated statements of operations for all periods presented.
Assets Held for Sale
Upon classifying a real estate investment as held for sale, the Company will no longer recognize depreciation expense related to the depreciable assets of the property. Assets held for sale are recorded at the lower of carrying value or estimated fair value, less the estimated cost to dispose of the assets. See Note 3–Real Estate Investments and Related Intangibles for further discussion regarding properties held for sale.
If circumstances arise that the Company previously considered unlikely and, as a result, the Company decides not to sell a property previously classified as held for sale, the Company will reclassify the property as held and used. The Company measures and records a property that is basedreclassified as held and used at the lower of (i) its carrying value before the property was classified
VEREIT, INC. and VEREIT OPERATING PARTNERSHIP, L.P.
NOTES TO CONSOLIDATED FINANCIAL STATEMENTS
December 31, 2018 – (Continued)
as held for sale, adjusted for any depreciation expense that would have been recognized had the property been continuously classified as held and used or (ii) the estimated fair value at the date of the subsequent decision not to sell.
Development Activities
Project costs, which include interest expense, associated with the development, construction and lease-up of a real estate project are capitalized as construction in progress. Once the development and construction of the building is substantially completed, the amounts capitalized to construction in progress are transferred to (i) land and (ii) buildings, fixtures and improvements and are depreciated over their respective useful lives.
Discontinued Operations
The Company reports discontinued operations when a component of an entity or group of components that has been disposed of or classified as held for sale represents a strategic shift that has or will have a major effect on an entity’s operations and financial results. The results of operations for assets meeting the best information available.definition of discontinued operations are reflected in the Company’s consolidated statements of operations as discontinued operations for all periods presented. See Note 4 —Discontinued Operations for further discussion regarding discontinued operations.
Investment in Unconsolidated Entities
Unconsolidated Joint Ventures
The Company accounts for its investment in unconsolidated joint venture arrangements using the equity method of accounting as the Company has the ability to exercise significant influence, but not control, over operating and financing policies of these investments. The equity method of accounting requires the investment to be initially recorded at cost and subsequently adjusted for the Company’s share of equity in the joint ventures’ earnings and distributions. The Company records its proportionate share of net income (loss) from the unconsolidated joint ventures in equity in income and gain on disposition of unconsolidated entities in the consolidated statements of operations. See Note 3–Real Estate Investments and Related Intangiblesfor further discussion on investments in unconsolidated joint ventures.
Investment in Cole REITs
As of December 31, 2017, the Company owned equity investments in Cole Credit Property Trust IV, Inc. (“CCPT IV”), CIM Income NAV, Inc. (formerly known as Cole Real Estate Income Strategy (Daily NAV), Inc.) (“INAV”), Cole Office & Industrial REIT (CCIT II), Inc. (“CCIT II”), Cole Office & Industrial REIT (CCIT III), Inc. (“CCIT III”), and Cole Credit Property Trust V, Inc. (“CCPT V” and collectively with CCPT IV, INAV, CCIT II and CCIT III, the “Cole REITs”). On February 1, 2018, the Company sold certain of its equity investments to CCA Acquisition, LLC (the “Cole Purchaser”), an affiliate of CIM Group, LLC, retaining interests in CCIT II, CCIT III and CCPT V. Subsequent to the sale of Cole Capital and the adoption of ASU 2016-01 (as defined in “Recent Accounting Pronouncements” section below), the Company carries these investments at fair value, as the Company does not exert significant influence over CCIT II, CCIT III or CCPT V, and any changes in the fair value are recognized in other income, net in the accompanying consolidated statement of operations for the year ended December 31, 2018.Prior to the sale of Cole Capital, the Company accounted for these investments using the equity method of accounting, which required the investment to be initially recorded at cost and subsequently adjusted for the Company’s share of equity in the respective Cole REIT’s earnings and distributions. The Company recorded its proportionate share of net income or loss from the Cole REITs in equity in income and gain on disposition of unconsolidated entities in the consolidated statement of operations for the year ended December 31, 2018.
Leasehold Improvements and Property and Equipment
The Company leases its corporate office facilities under operating leases. Leasehold improvements related to these are recorded at cost less accumulated amortization. Leasehold improvements are amortized over the lesser of the estimated useful life or remaining lease term.
Property and equipment, which typically include computer hardware and software, furniture and fixtures, among other items, are stated at cost less accumulated depreciation. Property and equipment are depreciated on a straight-line method over the estimated useful lives of the assets, which range from three to seven years. The Company reassesses the useful lives of its property and
VEREIT, INC. AND VEREIT OPERATING PARTNERSHIP, L.P.
NOTES TO CONSOLIDATED FINANCIAL STATEMENTS
December 31, 2016 – (Continued)
equipment and adjusts the future monthly depreciation expense based on the new useful life, as applicable. If the Company disposes of an asset, the asset and related accumulated depreciation are written off upon disposal.
VEREIT, INC. and VEREIT OPERATING PARTNERSHIP, L.P.
NOTES TO CONSOLIDATED FINANCIAL STATEMENTS
December 31, 2018 – (Continued)
Goodwill
In the case of a business combination, after identifying all tangible and intangible assets and liabilities, the excess consideration paid over the fair value of the assets and liabilities acquired and assumed, respectively, represents goodwill. In connection with prior mergers, the Company recorded goodwill as a result of the merger consideration exceeding the net assets acquired. As of December 31, 2018 and 2017, the carrying value of goodwill was $1.3 billion.
InPrior to the adoption of ASU 2017-01 in January 2017, in the event the Company disposesdisposed of a property, or classifiesclassified a property as an asset held for sale, that constitutesconstituted a business under U.S. GAAP, the Company will allocateallocated a portion of the REI segment’sreal estate investments reporting unit’s goodwill to that property in determining the gain or loss on the disposal of the property. The amount of goodwill allocated to the business will bewas based on the relative fair value of the business to the fair value of the reporting unit. During the year ended December 31, 2016, the Company allocated $73.2 million of goodwill to dispositions and held for sale assets, which included $2.3 million of goodwill allocated to the cost basis of two properties foreclosed upon. The REI segmentallocated goodwill of $73.2 million was included in gain on disposition of real estate and real estate assets held for sale, net, in the Cole Capital segment each comprise one reporting unit.consolidated statement of operations.
Impairments
Real Estate Assets
The Company performs quarterly impairment review procedures, primarily through continuous monitoring of events and changes in circumstances that could indicate the carrying value of its real estate assets may not be recoverable. Impairment indicators that the Company considers include, but are not limited to, decrease in net operating income, bankruptcy or other credit concerns of a property’s major tenant or tenants, such as history of late payments, rental concessions and other factors, as well as significant decreases in a property’s revenues due to lease terminations, vacancies, co-tenancy clauses or reduced lease rates. When impairment indicators are identified or if a property is considered to have a more likely than not probability of being disposed of within the next 12 to 24 months, the Company assesses the recoverability of the assets by determining whether the carrying value of the assets will be recovered through the undiscounted future cash flows expected from the use of the assets and their eventual disposition. U.S. GAAP requires us to utilize the Company’s expected holding period of our properties when assessing recoverability. In the event that such expected undiscounted future cash flows do not exceed the carrying value, the Company will adjust the real estate assets to their respective fair values and recognize an impairment loss. Generally, fair value is determined using a discounted cash flow analysis and recent comparable sales transactions.Theor leasing transactions. The assumptions and uncertainties utilized in the evaluation of the impairment of real estate assets are discussed in detail in Note 106 – Fair Value Measures. See also Note 5 –Real Estate Investments for further discussion regarding real estate investment activity.
Goodwill
The Company evaluates goodwill for impairment annually or more frequently when an event occurs or circumstances change that indicate the carrying value by reporting unit, may not be recoverable. The Company’s annual testing date is during the fourth quarter. TheIn 2017, the Company testsadopted ASU 2017-04, Intangibles – Goodwill and Others (Topic 350): Simplifying the Test for Goodwill Impairment, which allows the Company to test goodwill for impairment by first comparing the carrying value of net assets to thetheir respective fair value of each reporting unit.value. If the fair value is determined to be less than the carrying value, or if qualitative factors indicate that it is more likely than not that goodwill is impaired, a second step is performed to compute the amount ofan impairment ascharge will be recorded for the difference between the fair value of goodwill and the carrying value. The Company estimates the fair value of the reporting units using discounted cash flows and relevant competitor multiples. The evaluation of goodwill for potential impairment requires the Company’s management to exercise significant judgment and to make certain assumptions. While the Company believes its assumptions are reasonable, there are no guarantees as to actual results. Changes in assumptions based on actual results may have a material impact on the Company’s financial results. The assumptionsanalysis performed for the annual goodwill tests during the years ended December 31, 2018, 2017 and uncertainties utilized2016 resulted in the evaluation of the impairment of goodwill are discussed in detail in Note 10 – Fair Value Measures.no impairment. Goodwill activity by segmentrelated to discontinued operations is also discussed in Note 4 — – Goodwill and Other IntangiblesDiscontinued Operations.
Intangible Assets
The Company evaluates intangible assets for impairment when an event occurs or circumstances change that indicate the carrying value may not be recoverable. The Company tests intangible assets for impairment by first comparing the carrying value of the asset group to the undiscounted future cash flows expected from the use of the assets and their eventual disposition. In the event that such expected undiscounted future cash flows do not exceed the carrying value, the Company will adjust the intangible assets to their respective fair values and recognize an impairment loss.
The Company’s intangible assets primarily consist of management and advisory contracts that the Company has with certain Cole REITs. The Company will estimate the fair value of the intangible assets using a discounted cash flow model specific to the applicable Cole REITs. The evaluation of intangible assets for potential impairment requires the Company’s management to exercise significant judgment and to make certain assumptions. While the Company believes its assumptions are reasonable, there are no guarantees as to actual results. Changes in assumptions based on actual results may have a material impact on the Company’s
VEREIT, INC. ANDand VEREIT OPERATING PARTNERSHIP, L.P.
NOTES TO CONSOLIDATED FINANCIAL STATEMENTS
December 31, 20162018 – (Continued)
financial results. The assumptions and uncertainties utilized in the evaluation of the impairment of intangibles are discussed in detail in Note 10 – Fair Value Measures. Intangible assets are also discussed in Note 4 – Goodwill and Other Intangibles.
Investment in Unconsolidated Entities
The Company is required to determine whether an event or change in circumstances has occurred that may have a significant adverse effect on the fair value of any of its investment in the unconsolidated entities. If an event or change in circumstance has occurred, the Company is required to evaluate its investment in the unconsolidated entity for potential impairment and determine if the carrying value of its investment exceeds its fair value. An impairment charge is recorded when an impairment is deemed to be other-than-temporary. To determine whether an impairment is other-than-temporary, the Company considers whether it has the ability and intent to hold the investment until the carrying value is fully recovered. The evaluation of an investment in an unconsolidated entity for potential impairment requires the Company’s management to exercise significant judgment and to make certain assumptions. The use of different judgments and assumptions could result in different conclusions. No impairments of unconsolidated entities were identified during the years ended December 31, 2016, 2015 or 2014.2018, 2017 and 2016.
Leasehold Improvements and Property and Equipment
Leasehold improvements and property and equipment are reviewed for impairment when events or changes in circumstances indicate that the carrying value of such assets may not be recoverable. If this review indicates that the carrying value of the asset is not recoverable, the Company records an impairment loss, measured at fair value by estimated discounted cash flows or market appraisals. The evaluation of leasehold improvements and property and equipment for potential impairment requires the Company’s management to exercise significant judgment and to make certain assumptions. The use of different judgments and assumptions could result in different conclusions. No impairments of leasehold improvements and property and equipment were identified during the years ended December 31, 2016, 2015 or 2014.2018, 2017 and 2016.
Cash and Cash Equivalents
Cash and cash equivalents include cash in bank accounts, as well as investments in highly-liquid money market funds with original maturities of three months or less. The Company deposits cash with several high quality financial institutions. These deposits are guaranteed by the Federal Deposit Insurance Corporation (“FDIC”) up to an insurance limit of $250,000. At times, the Company’s cash and cash equivalents may exceed federally insured levels. Although the Company bears risk on amounts in excess of those insured by the FDIC, it has not experienced and does not anticipate any losses due to the high quality of the institutions where the deposits are held.
Restricted Cash
The Company had $45.0$22.9 million and $59.8$27.7 million, respectively, in restricted cash as of December 31, 20162018 and December 31, 2015.2017. Restricted cash primarily consists of reserves related to lease expirations, as well as maintenance, structural and debt service reserves. In accordance with certain debt agreements, rent from certain of the Company’s tenants is deposited directly into a lockbox account, from which the monthly debt service payments are disbursed to the lender and the excess funds are then disbursed to the Company. Included in restricted cash at December 31, 20162018 was $40.7$21.5 million in lender reserves and $4.3$1.4 million held in restricted lockbox accounts. Included in restricted cash at December 31, 20152017 was $47.9$26.4 million in lender reserves and $11.9$1.3 million held in restricted lockbox accounts.
Investment in Direct Financing Leases
The Company has acquired certain properties that are subject to leases that qualify as direct financing leases in accordance with U.S. GAAP due to the significance of the lease payments from the inception of the leases compared to the fair value of the property or due to bargain purchase options. Investments in direct financing leases represent the fair value of the remaining lease payments on the leases and the estimated fair value of any expected residual property value at the end of the lease term. The fair value of the remaining lease payments is estimated using a discounted cash flow analysis based on interest rates that would represent the Company’s incremental borrowing rate for similar types of debt. The expected residual property value at the end of the lease term is estimated using market data and assessments of the remaining useful lives of the properties at the end of the lease terms, among other factors. Income from direct financing leases is calculated using the effective interest method over the remaining term of the lease.
VEREIT, INC. ANDand VEREIT OPERATING PARTNERSHIP, L.P.
NOTES TO CONSOLIDATED FINANCIAL STATEMENTS
December 31, 20162018 – (Continued)
Mortgage Notes Receivable
The Company classifies its mortgage notes receivable as long-term investments as the Company intends to hold the mortgage notes receivable for the foreseeable future or until maturity. Mortgage notes receivable investments are carried on the Company’s consolidated balance sheets at amortized cost (unpaid principal balance adjusted for unearned discount or premium and mortgage notes receivable origination fees), net of any allowance for mortgage notes receivable losses. Discounts or premiums and mortgage notes receivable origination fees are amortized as a component of interest income using the effective interest method over the life of the respective mortgage notes receivable. From time to time, the Company may determine to sell a mortgage note receivable in which case it must reclassify the asset as held for sale. Mortgage notes receivable held for sale are carried at the lower of cost or estimated fair value. The Company also evaluates its mortgage notes receivable for possible impairment on a quarterly basis, as discussed in Note 8 – Mortgage Notes Receivable.
Commercial Mortgage-Backed Securities
The Company classifies all of its commercial mortgage-backed securities (“CMBS”) as available for sale for financial accounting purposes. Under U.S. GAAP, securities classified as available for sale are carried on the consolidated balance sheet at fair value with the net unrealized gains or losses included in accumulated other comprehensive income (loss), a component of stockholders’ equity. Any premiums or discounts on securities are amortized as a component of interest income using the effective interest method.
The Company estimates fair value on all securities investments quarterly based on a variety of inputs. Under U.S. GAAP, securities where the fair value is less than the Company’s cost are deemed impaired and, therefore, must be measured for other-than-temporary impairment. If an impaired security (i.e., fair value is below cost) is intended to be sold or required to be sold prior to expected recovery of the impairment loss, the full amount of the loss must be recorded in earnings as an other-than-temporary impairment. Otherwise, temporary impairment losses are included in other comprehensive income (loss).
In estimating credit or other-than-temporary impairment losses, management considers a variety of factors, including (1) the financial condition and near-term prospects of the credit, including credit rating of the security and the underlying tenant and an estimate of the likelihood, amount and expected timing of any default, (2) whether the Company expects to hold the investment for a period of time sufficient to allow for anticipated recovery in fair value, (3) the length of time and the extent to which the fair value has been below cost, (4) current market conditions, (5) expected cash flows from the underlying collateral and an estimate of underlying collateral values, and (6) subordination levels within the securitization pool. These estimates are highly subjective and could differ materially from actual results. From the period the Company acquired the CMBS through December 31, 2016, the Company had no other-than-temporary impairment losses. See Note 7 – Investment Securities, at Fair Valuefor further discussion.
Deferred Financing Costs
Deferred financing costs represent commitment fees, legal fees and other costs associated with obtaining commitments for financing. PursuantD to the Company’s adoption of the FASB ASU 2015-03, Interest – Imputation of Interest (Subtopic 835-30): Simplifying the Presentation of Debt Issuance Costs, the presentation of all deferredeferred financing costs, other than those associated with the revolving credit facility,Revolving Credit Facility (as defined in Note 7 –Debt), are presented on the consolidated balance sheets as a direct deduction from the carrying amount of the related debt liability rather than as an asset. These costs are amortized to interest expense over the terms of the respective financing agreements using the effective interest method. Unamortized deferred financing costs are written off when the associated debt is refinanced or repaid before maturity. Costs incurred in connection with potential financial transactions that are not completed are expensed in the period in which it is determined the financing will not be completed.
Convertible Debt
The Company has an outstanding aggregate balance of $1.0 billion$402.5 million related to the 2020 Convertible Notes (as defined in Note 117 – Debt). The 2020 Convertible Notes are convertible into cash or shares of the Company’s Common Stock at the Company’s option. In accordance with U.S GAAP, the 2020 Convertible Notes are accounted for as a liability with a separate equity component recorded for the conversion option. A liability was recorded for the 2020 Convertible Notes on the respective issuance date at fair value based on a discounted cash flow analysis using current market rates for debt instruments with similar terms. The difference between the initial proceeds from the 2020 Convertible Notes and the estimated fair value of the debt instruments resulted in a debt discount, with an offset recorded to additional paid-in capital representing the equity component. The debt discount is being amortized to interest expense over the respective term of the 2020 Convertible Notes.
VEREIT, INC. AND VEREIT OPERATING PARTNERSHIP, L.P.
NOTES TO CONSOLIDATED FINANCIAL STATEMENTS
December 31, 2016 – (Continued)
Derivative Instruments
The Company may use derivative financial instruments, including interest rate swaps, caps, options, floors and other interest rate derivative contracts, to hedge all or a portion of the interest rate risk associated with its borrowings. Certain of the techniques used to hedge exposure to interest rate fluctuations may also be used to protect against declines in the market value of assets that result from general trends in debt markets. The principal objective of such agreements is to minimize the risks and/or costs associated with the Company’s operating and financial structure as well as to hedge specific anticipated transactions. The Company does not intend to utilize derivatives for purposes other than interest rate risk management.
The Company records all derivatives on the consolidated balance sheets at fair value. The accounting for changes in the fair value of derivatives depends on the intended use of the derivative, whether the Company has elected to designate a derivative in a hedging relationship and apply hedge accounting and whether the hedging relationship has satisfied the criteria necessary to apply hedge accounting. Derivatives designated and qualifying as a hedge of the exposure to changes in the fair value of an asset, liability, or firm commitment attributable to a particular risk, such as interest rate risk, are considered fair value hedges. Derivatives designated and qualifying as a hedge of the exposure to variability in expected future cash flows, or other types of forecasted transactions, are considered cash flow hedges. Derivatives may also be designated as hedges of the foreign currency exposure of a net investment in a foreign operation. Hedge accounting generally provides for the matching of the timing of gain or loss recognition on the hedging instrument with the recognition of the changes in the fair value of the hedged asset or liability that are attributable to the hedged risk in a fair value hedge or the earnings effect of the hedged forecasted transactions in a cash flow hedge. The Company may enter into derivative contracts that are intended to economically hedge certain of its risk, even though hedge accounting does not apply or the Company elects not to apply hedge accounting.
The accounting for subsequent changes in the fair value of these derivatives depends on whether each has been designated and qualifies for hedge accounting treatment. If the Company elects not to apply hedge accounting treatment, any changes in the fair value of these derivative instruments is recognized immediately in lossgain (loss) on derivative instruments, net in the consolidated statements of operations and consolidated statements of comprehensive income (loss). If the derivative is designated and qualifies for hedge accounting treatment, the change in the estimated fair value of the derivative is recorded in other comprehensive income (loss) to the extent that it is effective. Any ineffective portion of a derivative’s change in fair value will be immediately recognized in earnings.
As of December 31, 2018, the Company had one interest rate derivative that was not designated as a qualifying hedging relationship with a fair value of $0.5 million associated with a loan with a notional value of $50.7 million. As of December 31, 2017, the Company had two interest rate derivatives that were not designated as qualifying hedging relationships with an aggregate fair value of $0.6 million associated with loans with an aggregate notional value of $78.9 million. The fair value of the interest rate derivatives is included in rent and tenant receivables and other assets, net in the accompanying consolidated balance sheets.
Revenue Recognition
In May 2014, the U.S. Financial Accounting Standards Board (“FASB”) issued ASU 2014-09, Revenue from Contracts with Customers (“ASU 2014-09”) (Topic 606), which supersedes the revenue recognition requirements in Revenue Recognition,
VEREIT, INC. and VEREIT OPERATING PARTNERSHIP, L.P.
NOTES TO CONSOLIDATED FINANCIAL STATEMENTS
December 31, 2018 – (Continued)
Accounting Standards Codification (“ASC”) (Topic 605) and requires an entity to recognize revenue in a way that depicts the transfer of promised goods or services to customers in an amount that reflects the consideration to which the entity expects to be entitled in exchange for those goods or services. The Company adopted ASU 2014-09 and the related ASUs (collectively, the “Revenue ASUs”) during the first quarter of 2018 using the modified retrospective approach, which allows a cumulative effect adjustment to beginning retained earnings equal to initially applying the Revenue ASUs to all contracts with customers not completed as of the date of adoption. Adoption of the Revenue ASUs did not result in a cumulative effect adjustment to retained earnings as all contracts not completed as of adoption within the scope of Topic 606 have the same revenue recognition timing and measurement under Topic 605. Revenues generated through leasing arrangements are excluded from the Revenue ASUs as discussed below.
Revenue Recognition – REI- Real Estate
The Company’s rental revenue is recognized when earned and collectability is reasonably assured and includes rental revenues which primarily consist of rental income and include rentsproperty operating expense reimbursements that each tenant pays in accordance with the terms of each lease reportedlease. Rental revenue also includes amortization of above and below-market leases. Many of the leases have rent escalations and the rental revenue is recognized on a straight-line basis, over the initial non-cancelable term of the lease, are recognized when earned and collectability is reasonably assured. When the Company acquires a property, the term of each existing lease is considered to commence as of the acquisition date for the purposes of this calculation. Since many of the leases provide for rental increases at specified intervals, straight-line basis accountingwhich requires the Company to record a receivable and include in revenues, straight-line rent receivables that the Company will only receivebe received if the tenant makes all rent payments required through the expiration of the initial term of the lease.lease term. Straight-line rent receivables are included in rent and tenant receivables and other assets, net, in the consolidated balance sheets. See Note 95 – Rent and Tenant Receivables and Other Assets, Net. Cost recoveries from tenants are included in operating expense reimbursements inFor leases that have contingent rental revenue based on a percentage of the consolidated statements of operations in the period the related costs are incurred. The Company defers the revenue related to lease payments received from tenants in advance of their due dates. As of December 31, 2016 and December 31, 2015,tenant’s sales, the Company had $57.6 million and $67.2 million, respectively, of deferredrecognizes contingent rental income, whichrevenue when the specified target is included in deferred rent, derivative and other liabilities in the consolidated balance sheets.achieved.
The Company continually reviews receivables related to rent and unbilled rent receivables and determines collectability by taking into consideration the tenant’s payment history, the financial condition of the tenant, business conditions in the industry in which the tenant operates and economic conditions in the area in which the property is located. In the event that the collectability of a receivable is uncertain, the Company will record an increase in the allowance for uncollectible accounts in the consolidated balance sheets and bad debt expense in property operating expenses in the consolidated statements of operations asoperations. The Company suspends revenue recognition when the collectability of amounts due pursuant to a reduction to rental income. As of December 31, 2016 and December 31, 2015, the Company maintained an allowance for uncollectible accounts of $6.0 million and $6.6 million, respectively.lease is no longer reasonably assured.
Revenue Recognition –- Cole Capital
Revenue includesAs discussed in Note 4 —Discontinued Operations, on February 1, 2018, the Company completed the sale of its investment management segment, Cole Capital. The assets, liabilities and related financial results of substantially all of the Cole Capital segment are reflected in the financial statements as discontinued operations.
Cole Capital earned securities sales commissions, dealer manager fees, distribution and stockholder servicing fees, real estate acquisition fees, financing coordination fees, property management fees, advisory fees, asset management fees and performance fees for services relating to the Cole REITs’ offerings and the investment and management of their respective assets, in accordance with the respective dealer manager and advisory agreements. The Company records dealer manager fees, excluding those related to INAV (as definedwas also reimbursed for certain costs incurred in Note 3 – Segment Reporting), and securities sales commissions as revenue upon the sale of Cole REIT shares. Dealer manager fees from the sale of INAV shares and distribution and stockholder servicing fees areproviding these services, which were recorded as revenue whenas the fees are fixed or determinable. expenses were incurred subject to revenue constraint due to the limitations on the amount that was reimbursable based on the terms of the respective dealer manager and advisory agreements. Refer to Note 13 –Related Party Transactions and Arrangements for a disaggregation of Cole Capital revenues.
Revenue Recognition - Other
The Company records revenue relatedentered into a services agreement (the “Services Agreement”) with the Cole Purchaser, pursuant to acquisitionwhich the Company will continue to provide certain services to the Cole Purchaser and financing coordinationthe Cole REITs, including operational real estate support, (“Transition Services Revenues”) through March 31, 2019 (or, if later, the date of the last government filing other than a tax filing made by any of the Cole REITs with respect to its 2018 fiscal year). Under the terms of the Services Agreement, the Company will be entitled to receive reimbursement for certain of the services provided. The Company recorded Transition Services Revenues as costs associated with providing such services were incurred, which coincided with the timing in which the performance obligations of the contract had been met. During the period from February 1, 2018 through December 31, 2018, the Company incurred $15.0 million of such costs and recognized revenues of $15.0 million, which are recorded in other income, net in the consolidated statement of operations. The Company may also receive additional fees uponover the next six years if future revenues of Cole Capital exceed a specified dollar threshold (the “Net Revenue Payments”), up to an aggregate of $80.0 million in Net Revenue Payments.
VEREIT, INC. ANDand VEREIT OPERATING PARTNERSHIP, L.P.
NOTES TO CONSOLIDATED FINANCIAL STATEMENTS
December 31, 20162018 – (Continued)
completion of a transaction and advisory, asset and property management fees as services are performed. The Company is also reimbursed for certain costs incurred in providing these services. Securities sales commissions and dealer manager reimbursements are recorded as revenue as the expenses are incurred, as long as reimbursement is reasonably assured. The Company, in its sole discretion, may reallow all or a portion of its dealer manager fee to such participating broker-dealers as a marketing and due diligence expense reimbursement, based on factors such as the volume of shares issued by such participating broker-dealers and the amount of marketing support provided by such participating broker-dealers. The Company also reallows 100% of selling commissions earned to participating broker-dealers. Refer to Note 18 –Related Party Transactions and Arrangements for further discussion. In addition, the Company earns property management, asset management and disposition fees from certain joint ventures and other real estate programs.
Contingent Rental Income
The Company owns certain properties that have associated leases that require the tenant to pay contingent rental income based on a percentage of the tenant’s sales after the achievement of certain sales thresholds, which may be monthly, quarterly or annual targets. As a lessor, the Company defers the recognition of contingent rental income until the specified target that triggers the contingent rental income is achieved, or until such sales upon which percentage rent is based are known.
Program Development Costs
The Company pays for organization, registration and offering expenses associated with the sale of common stock of the Cole REITs, as further discussed in Note 18 –Related Party Transactions and Arrangements. The reimbursement of these expenses by the Cole REITs is limited to a certain percentage of the proceeds raised from their offerings, in accordance with their respective advisory agreements and charters. Such expenses paid by the Company on behalf of the Cole REITs in excess of these limits that are expected to be collected are recorded as program development costs, which are included in rent and tenant receivables and other assets, net on the consolidated balance sheets. The Company assesses the collectability of the program development costs, considering the offering period and historical and forecasted sales of shares under the Cole REITs’ respective offerings and reserves for any balances considered not collectible. Additional reserves are generally recorded if actual proceeds raised from the offerings and corresponding program development costs incurred differ from management’s assumptions.
Acquisition Related Expenses and Litigation, Merger and Other Non-routineNon-Routine Costs, Net of Insurance Recoveries
All costs incurred as a result of a business combination are classified as acquisition related expenses or other non-routine transaction related expenses and expensed as incurred. Acquisition related expenses include legal and other transaction related costs incurred in connection with self-originated acquisitions, including purchases of portfolios. In addition, indirect costs, such as internal salaries, that are tracked and documented in a manner that clearly indicates that the activities driving the cost directly relate to activities necessary to complete, or effect, self-originating purchases are classified as acquisition related expenses.
SimilarExternal costs incurred in relation to prior mergers (which are not considered self-originating purchases) and litigation resulting therefrom and other non-routine transactions are included in litigation, merger and other non-routine costs, net of insurance recoveries in the consolidated statements of operations. The Company has also incurred legal fees and other costs associated with the investigation conducted by the audit committee (the “Audit Committee”) of the General Partner’s board of directors (the “Audit Committee Investigation”) and the litigations and investigations resulting therefrom,from the Audit Committee Investigation (defined below), which are considered non-routine. The Company has directors’ and officers’ insurance and the insurance carriers have paid certain defense costs subject to standard reservation of rights under the respective policies.
VEREIT, INC. AND VEREIT OPERATING PARTNERSHIP, L.P.
NOTES TO CONSOLIDATED FINANCIAL STATEMENTS
December 31, 2016 – (Continued)
Litigation, merger and other non-routine costs, net of insurance recoveries include the following costs (amounts in thousands):
|
| | | | | | | | | | | | | |
| | | Year Ended December 31, |
| | | 2016 | | 2015 | | 2014 |
| Merger related costs: | | | | | | |
| Strategic advisory services | | $ | — |
| | $ | — |
| | $ | 35,765 |
|
| Transfer taxes | | 562 |
| | (2,509 | ) | (1 | ) | 5,109 |
|
| Legal fees and expenses | | — |
| | — |
| | 5,464 |
|
| Personnel costs and other reimbursements | | — |
| | — |
| | 751 |
|
| Multi-tenant spin off | | — |
| | — |
| | 7,450 |
|
| Other fees and expenses | | — |
| | — |
| | 1,676 |
|
| Litigation and other non-routine costs: | | | | | | |
| Post-transaction support services | | — |
| | — |
| | 14,251 |
|
| Subordinated distribution fee | | — |
| | — |
| | 78,244 |
|
Audit Committee Investigation and related matters (2) | | 24,207 |
| | 44,242 |
| | 17,660 |
|
| Furniture, fixtures and equipment | | — |
| | — |
| | 14,085 |
|
| Legal fees and expenses | | 311 |
| | 2,704 |
| (3 | ) | 8,216 |
|
| Personnel costs and other reimbursements | | — |
| | — |
| | 2,718 |
|
| Other fees and expenses | | — |
| | 632 |
| | 9,016 |
|
| Total costs incurred | | 25,080 |
|
| 45,069 |
|
|
| 200,405 |
|
| Insurance recoveries | | (21,196 | ) | | (11,441 | ) | | (789 | ) |
| Total | | $ | 3,884 |
| | $ | 33,628 |
|
|
| $ | 199,616 |
|
|
| | | | | | | | | | | | |
| | | Year Ended December 31, |
| | | 2018 | | 2017 | | 2016 |
| Merger Related Costs: | | | | | | |
Transfer taxes(1) | | $ | — |
| | $ | (1,595 | ) | | $ | 562 |
|
| Litigation and other non-routine costs: | | | | | | |
Audit Committee Investigation and related matters (2) | | $ | 59,755 |
| | $ | 49,434 |
| | $ | 24,207 |
|
Legal fees and expenses (3) | | 530 |
| | 421 |
| | 311 |
|
Litigation settlements (4) | | 233,246 |
| | — |
| | — |
|
| Total costs | | 293,531 |
|
| 48,260 |
| | 25,080 |
|
Insurance recoveries (5) | | (2,568 | ) | | (300 | ) | | (21,196 | ) |
| Total | | $ | 290,963 |
| | $ | 47,960 |
| | $ | 3,884 |
|
| |
| (1) | The negative balance for the year ended December 31, 20152017 is a result of estimated costs accrued in prior periods that exceeded actual expenses incurred. |
| |
| (2) | Includes all fees and costs associated with the previously-announced investigation conducted by the Audit Committee and various litigations and investigations prompted by the results of the Audit2014 investigation conducted by the audit committee (the “Audit Committee”) of the Company’s Board of Directors (the “Audit Committee Investigation,Investigation”), including fees and costs incurred pursuant to the Company’s advancement obligations.obligations, litigation related thereto and in connection with related insurance recovery matters, net of accrual reversals. During the year ended December 31, 2018, the Company reversed an accrual of $10.9 million, as the Company was legally released from certain advancement obligations, and the accrued amounts were paid directly by the Company’s insurers to the payees subsequent to December 31, 2018. There were no reversals in the years ended December 31, 2017 and 2016. |
| |
| (3) | ForIncludes legal fees and expenses associated with litigation resulting from prior mergers and related insurance recovery matters and excludes amounts presented in income from discontinued operations, net of income taxes in the consolidated statements of operations for the year ended December 31, 2015, legal fees2018. |
| |
| (4) | Refer to Note 10– Commitments and expenses primarily relateContingencies for additional information. |
| |
| (5) | $2.3 million recorded during the year ended December 31, 2018 relates to fees incurred in connection with a legal matter resolved in early 2014.litigation resulting from prior mergers. |
Due from AffiliatesLoss Contingencies
The Company receivesrecords a liability in the consolidated financial statements for loss contingencies when a loss is known or may be entitled to receive compensation and reimbursement for services primarily relating to the Cole REITs’ offeringsconsidered probable and the investment, management, financingamount is reasonably estimable. If the reasonable estimate of a known or probable loss is a range, and dispositionno amount within the range is a better estimate than any other, the minimum amount of their respective assets. Refer to Note 18 –Related Party Transactionsthe range is accrued. If a material loss is reasonably possible but not known or probable, and Arrangements for further explanation.is reasonably estimable, the estimated loss or range of loss is disclosed.
Equity-based Compensation
The Company has an equity-based incentive award plan for non-executive directors, officers, other employees and advisors or consultants who provide services to the Company, as applicable, and a non-executive director restricted share plan, which are accounted for under U.S. GAAP for share-based payments. The expense for such awards is recognized over the vesting period or when the requirements for exercise of the award have been met. See Note 1712 – Equity-based Compensation for additional information on these plans.
Per Share Data
Income (loss) per basic share of Common Stock is calculated by dividing net income (loss) less dividends on unvested restricted sharesRestricted Shares of Common Stock and dividends on preferred stock by the weighted-average number of shares of Common Stock issued and outstanding during such period. Diluted income (loss) per share of Common Stock considers the effect of potentially dilutive shares of Common Stock outstanding during the period.
Reportable Segments
The Company has concluded that it has two reportable segments as it has organized its operations into two segments for management and internal financial reporting purposes, REI and Cole Capital. The identification of reportable segments requires the Company’s management to exercise certain judgments. Refer to Note 3 – Segment Reporting for further discussion.
VEREIT, INC. AND VEREIT OPERATING PARTNERSHIP, L.P.
NOTES TO CONSOLIDATED FINANCIAL STATEMENTS
December 31, 2016 – (Continued)
Income Taxes
The General Partner currently qualifies and has elected to be taxed as a REIT for U.S. federal income tax purposes under Sections 856 through 860 of the Internal Revenue Code.Code commencing with the taxable year ended December 31, 2011. We believe we are organized and operating in such a manner as to qualify to be taxed as a REIT for the taxable year ended December 31, 2018. As a REIT, except as discussed below, the
VEREIT, INC. and VEREIT OPERATING PARTNERSHIP, L.P.
NOTES TO CONSOLIDATED FINANCIAL STATEMENTS
December 31, 2018 – (Continued)
General Partner is generally is not subject to federal income tax on taxable income that it distributes to its stockholders so long as it distributes at least 90% of its annual taxable income (computed without regard to the deduction for dividends paid and excluding net capital gains). REITs are subject to a number of other organizational and operational requirements. Even ifHowever, the General Partner, maintains its qualification for taxation as a REIT, it may beTRS entities, and the OP are still subject to certain state and local taxes on its income, franchise and property taxes in the various jurisdictions in which they operate. The General Partner may also be subject to federal income taxes on certain income and excise taxes on its undistributed income.
The OP is classified as a partnership for U.S. federal income tax purposes. As a partnership, the OP is not a taxable entity for U.S. federal income tax purposes. Instead, each partner in the OP is required to take into accountinclude its allocable share of the OP’s income, gains, losses, deductions and credits for each taxable year. However, the OP may be subject to certain state and local taxes on its income and property.
As of December 31, 2016, the OP and the General Partner had no material uncertain income tax positions. The tax years subsequent to and including the fiscal year ended December 31, 2012 remain open to examination by the major taxing jurisdictions to which the OP, the General Partner, American Realty Capital Trust III, Inc. (“ARCT III”), CapLease, Inc. (“CapLease”), American Realty Capital Trust IV, Inc., (“ARCT IV”), Cole Real Estate Investments, Inc. (“Cole”) and Cole Credit Property Trust, Inc. are subject.
Under the LPA, the OP is to conduct business in such a manner as to permit the General Partner at all times to qualify as a REIT.
The Company conducts substantially all of its Cole Capital segment business activities through a TRS. A TRS is a subsidiary of a REIT that is subject to corporate federal, state and local income taxes, as applicable. The Company’s use of a TRS enables it to engage in certain business activities while complying with the REIT qualification requirements and to retain any income generated by these businesses for reinvestment without the requirement to distribute those earnings. The Company conductsconducted substantially all of the Cole Capital business activities through a TRS until it sold the Cole Capital business on February 1, 2018.
During the year ended December 31, 2018, the Company conducted all of its business in the United States, Puerto Rico and Canada and as a result, it filesfiled income tax returns in the U.S. federal jurisdiction, the Canadian federal jurisdiction and various state and local jurisdictions. With few exceptions, the Company is no longer subject to routine examinations by taxing authorities for years before 2014. Certain of the Company’s inter-companyintercompany transactions that have been eliminated in consolidation for financial accounting purposes are also subject to taxation.
The Company provides for income taxes in accordance with current authoritative accounting and tax guidance. The tax provision or benefit related to significant or unusual items is recognized in the quarter in which those items occur. In addition, the effect of changes in enacted tax laws, rates or tax status is recognized in the quarter in which the change occurs. The accounting estimates used to compute the provision for or benefit from income taxes may change as new events occur, additional information is obtained or the tax environment changes.
During the years ended December 31, 2018, 2017 and 2016, the Company recognized state and local income and franchise tax expense of $4.7 million, $6.9 million and $6.0 million, respectively, which are included in provision for income taxes in the accompanying consolidated statements of operations. In addition, the Company recorded a provision for federal income taxes of $0.4 million and $1.1 million for the years ended December 31, 2018 and 2016 related to a TRS entity, which is also included in provision for income taxes in the accompanying consolidated statements of operations. No provision for federal income taxes related to a TRS entity was recorded for the year ended December 31, 2017. The provision for or benefit from income taxes attributable to the Cole Capital business, substantially all of which was conducted through a TRS entity, is included in discontinued operations for all periods presented, as discussed in Note 4 —Discontinued Operations.
The Company had no unrecognized tax benefits as of or during the years ended December 31, 2018, 2017 or 2016. Any interest and penalties related to unrecognized tax benefits would be recognized in provision for income taxes in the accompanying consolidated statements of operations.
As of December 31, 2018, the OP and the General Partner had no material uncertain income tax positions.
Recent Accounting Pronouncements
Adopted Accounting Standards
In May 2014,January 2016, the FASB issued ASU 2014-09, Revenue from Contracts with Customers2016-01, Financial Instruments – Overall (Subtopic 825-10), Recognition and Measurement of Financial Assets and Financial Liabilities (“ASU 2014-09”2016-01”), which supersedesrequires equity investments (except those accounted for under the revenue recognition requirementsequity method of accounting or those that result in Revenue Recognition, Accounting Standards Codification (“ASC”) (Topic 605) and requires an entity to recognize revenue in a way that depictsconsolidation of the transfer of promised goods or services to customers in an amount that reflects the consideration to which the entity expectsinvestee) to be entitledmeasured at fair value with changes in exchangefair value recognized in net income (loss). An entity may choose to measure equity investments that do not have a readily determinable fair value at costs minus impairment, if any, plus or minus changes resulting from observable price changes in orderly transactions for those goodsthe identical or services. In August 2015, an amendment to ASU 2014-09, ASU 2015-14, Revenue from Contracts with Customers (Topic 606): Deferrala similar investment of the Effective Date (“same issue. ASU 2015-14”), was issued to defer the2016-01 is effective date for all entities by one year. For public business entities, certain not-for-profit entitiesfiscal years, and certain employee benefit plans, the guidance should be applied to annual reportinginterim periods within, beginning after December 15, 2017 including interim reporting periods within that reporting period. Earlier application is permitted onlyand requires prospective treatment of equity securities without readily determinable fair values. The Company adopted ASU 2016-01 as of annual reporting periods beginning after December 15, 2016, including interim reporting periods within that reporting period. Companies may use eitherJanuary 1, 2018 and recorded a full retrospective or a modified retrospective approach to adopt ASU 2014-09. The Company$5.1 million gain, which is currently assessingincluded in other income, net in the adoption methodology. In accordance withaccompanying consolidated statements of operations, on measuring the Company’s planinvestments in the Cole REITs at fair value after the investments were no longer accounted for using the adoption of ASU 2014-09, the Company’s implementation team has identified the Company’s revenue streams and is performing an in-depth review of the Company’s revenue contracts to identify the related performance obligations and to evaluate the impact on the Company’s financial statements and internal accounting processes and controls. As the majority of the Company’s revenue is derived from real estate lease contracts, as discussed in relation to ASU 2016-02 Leases (Topic 842) (“ASU 2016-02”), the Company does not expect that the adoption of ASU 2014-09 will have a material impact on its consolidated financial statements.equity method.
VEREIT, INC. ANDand VEREIT OPERATING PARTNERSHIP, L.P.
NOTES TO CONSOLIDATED FINANCIAL STATEMENTS
December 31, 20162018 – (Continued)
In January 2016,February 2017, the FASB issued ASU 2016-01, Financial Instruments(2017-05, Other Income – Gains and Losses from the Derecognition of Nonfinancial Assets (Subtopic 610-20): Clarifying the Scope of Asset Derecognition Guidance and Accounting for Partial Sales of Nonfinancial Assets (“ASU 2017-05”), which clarifies the following: 1) nonfinancial assets within the scope of Subtopic 825-10), which610-20 may include nonfinancial assets transferred within a legal entity to a counterparty; 2) an entity should allocate consideration to each distinct asset by applying the guidance in Topic 606 on allocating the transaction price to performance obligations; and 3) requires all equity investmentsentities to be measured at fair value with changesderecognize a distinct nonfinancial asset or distinct in substance nonfinancial asset in a partial sale transaction when it (a) does not have (or ceases to have) a controlling financial interest in the fair value recognized through net income (other than those accounted for under equity method of accounting or thoselegal entity that result in consolidation ofholds the investee). The amendments in this update also require an entity to present separately in other comprehensive income, the portion of the total change in the fair value of a liability resulting from a change in the instrument-specific credit risk when the entity has elected to measure the liability at fair valueasset in accordance with Subtopic 810 and (b) transfers control of the fair value option for financial instruments. In addition, the amendmentsasset in accordance with Topic 606. The adoption of this update require separate presentation of financial assets and financial liabilities by measurement category and form of financial assetstandard will result in higher gains on the balance sheetsale of partial real estate interests, including contributions of nonfinancial assets to a joint venture or other noncontrolling investee, due to recognizing the accompanying notes tofull gain when the financial statements. The amendments in this updatederecognition criteria are met and recording the retained noncontrolling interest at its fair value. ASU 2017-05 is effective for fiscal years,annual periods, and interim periods within those years,therein, beginning after December 15, 2017. ASU 2017-05 was adopted during the first quarter of fiscal year 2018, in conjunction with the Revenue ASUs, using the modified retrospective approach. The Company is currently evaluatingalso elected the practical expedient to only apply the guidance to contracts that were not completed upon adoption. At adoption, the Company did not have any contracts that were not completed within the scope of ASU 2017-05 and as such, the adoption of ASU 2017-05 did not impact that this new guidance will have on its consolidatedthe Company’s financial statements.
Accounting Standards Not Yet Adopted
In February 2016, the FASB issued ASU 2016-02, which will require that a lessee recognize assets and liabilities on the balance sheet for all leases with a lease term of more than 12 months, with the result being the recognition of a right of use (“ROU”) asset and a lease liability and the disclosure of key information about the entity’s leasing arrangements. The lessor accounting model under ASU 2016-02 retains ais similar to existing guidance, however it limits the capitalization of initial direct leasing costs, such as internally generated costs. The Company expects to elect all practical expedients permitted under ASC Topic 842, other than the hindsight practical expedient, which permits entities to use hindsight in determining the lease terms. Accordingly, the Company will retain distinction between a finance leases (i.e.lease (i.e., capital leases under current U.S. GAAP)existing guidance) and an operating leases. The classification criterialease and account for distinguishing between finance leases andits existing operating leases will be substantially similar to the classification criteria for distinguishing between capital leases andas operating leases under current U.S. GAAP. The amendmentsthe new guidance, without reassessing (a) whether the contracts contain a lease under ASC Topic 842, (b) whether classification of the operating leases would be different in ASU 2016-02 are effective for fiscal years beginning after December 15, 2018, including interim periods within those fiscal years,accordance with early adoption permitted. A modified retrospective approach is required for existing leases thatASC Topic 842, or (c) whether the unamortized initial direct costs before transition adjustments would have not expired upon adoption. The Company’s implementation team is developing an inventorymet the definition of all leases, as well as identifying any non-lease componentsinitial direct costs in theASC Topic 842 at lease arrangements, and evaluating the impact to the Company, both as lessor and lessee, and its consolidated financial statements.commencement.
In March 2016,January 2018, the FASB issued ASU 2016-05, Effect of Derivative Contract Novations on Existing Hedge Accounting Relationships2018-01, Leases (Topic 815).842): Land Easement Practical Expedient for Transition to Topic 842. The amendments help address transition guidance as it relates to land easements. As the Company plans to elect this practical expedient, it will only evaluate new or modified land easements upon adoption of Topic 842.
In July 2018, the FASB issued ASU 2018-10, Leases (Topic 842), which contained targeted improvements to amend inconsistencies and clarify guidance that were brought about by stakeholders. Additionally, in this update clarifyJuly 2018, the FASB issued ASU 2018-11, Leases (Topic 842), which provided the following practical expedients: (1) a transition method that allows entities to apply the new standard at the adoption date and to recognize a change incumulative-effect adjustment to the counterpartyopening balance of retained earnings effective at the adoption date; and (2) the option for lessors to a derivative instrument that has been designated as a hedging instrument does not inseparate lease and of itself, require de-designation of that hedging relationshipnon-lease components provided that all other hedge accountingcertain criteria continue to beare met. These provisions are effective for fiscal years beginning after December 15, 2016, and interim periods within those fiscal years, with early adoption permitted. The Company plans to adopt prospectively and will consider for any future novations.elect the practical expedients included in ASU 2018-11. As the Company is not electing the hindsight practical expedient, the Company does not expect to have a cumulative effect adjustment to retained earnings upon adoption.
In March 2016,December 2018, the FASB issued ASU 2016-09, Compensation – Stock Compensation2018-20, Narrow-Scope Improvements for Lessors, Leases (Topic 718): Improvement842). This ASU 2018-20 provides an election for lessors to Employee Share-Based Payment Accounting (“ASU 2016-09”), which affects entities that issue share-based payment awardsexclude sales and related taxes from consideration in the contract, requires lessors to their employees. ASU 2016-09 is designedexclude from revenue and expense lessor costs paid directly to simplify several aspects ofa third party by lessees, and clarifies lessors’ accounting for share-based payment award transactions including the income tax consequences, classification of awards as either equity or liabilities, classification on the statement of cash flowsvariable payments related to both lease and forfeiture rate calculations. The guidance will be effective for annual reporting periods beginning after December 15, 2016 and interim periods within those fiscal years with early adoption permitted. nonlease components.
The Company elected to early adoptis currently evaluating the impact of adoption, and anticipates this guidance during the first quarter of 2016, which did notstandard will have a material effectimpact on the Company’sits consolidated financial statements. In connection with the adoption,balance sheets. However, the Company modifieddoes not expect adoption will have a material impact on its consolidated statements of operations. While the consolidated statement of changes in equityCompany is continuing to include the line item cumulative-effect adjustment for equity-based compensation forfeitures, which represents applicationassess potential impacts of the standard, it currently expects the most significant impact will be the recognition of ROU assets and lease liabilities for operating leases. Our initial ROU asset and liability will be approximately $223.0 million. The Company expects its accounting change on a modified retrospective basis.for capital leases to remain substantially unchanged. Leases pursuant to which the Company is the lessee primarily consist of approximately 200 leases, of which the majority are ground leases. The Company will adopt ASU 2016-12 and its related amendments beginning January 1, 2019.
In June 2016, the FASB issued ASU 2016-13, Financial Instruments – Credit Losses (Topic 326) (“ASU 2016-13”). ASU 2016-13 is intended to improve financial reporting by requiring more timely recordingrecognition of credit losses on loans and other financial instruments that are not accounted for at fair value through net income, including loans held for investment, held-to-maturity debt securities, trade and other receivables, net investment in leases and other such commitments. ASU 2016-13 requires that financial
VEREIT, INC. and VEREIT OPERATING PARTNERSHIP, L.P.
NOTES TO CONSOLIDATED FINANCIAL STATEMENTS
December 31, 2018 – (Continued)
assets measured at amortized cost be presented at the net amount expected to be collected, through an allowance for credit losses that is deducted from the amortized cost basis. The amendments in ASU 2016-13 require the Company to measure all expected credit losses based upon historical experience, current conditions, and reasonable and supportable forecasts that affect the collectability of the financial assets and eliminates the “incurred loss” methodology under current U.S. GAAP. In November 2018, the FASB issued ASU No. 2018-19, Codification Improvements to Topic 326, Financial Instruments—Credit Losses (“ASU 2018-19”). This ASU clarifies that receivables from operating leases are accounted for using the lease guidance and not as financial instruments. ASU 2016-13 isand ASU 2018-19 are effective for fiscal years, and interim periods within, beginning after December 15, 2019. Early adoption is permitted for fiscal years, and interim periods within, beginning after December 15, 2018. The Company is currently evaluating the impact this amendmentthese amendments will have on its consolidated financial statements.
Note 3– Real Estate Investments and Related Intangibles
Property Acquisitions
During the year ended December 31, 2018, the Company acquired controlling financial interests in 52 commercial properties for an aggregate purchase price of $502.7 million (the “2018 Acquisitions”), which includes one land parcel for build-to-suit development, further discussed below, $2.1 million related to an outstanding tenant improvement allowance recorded as a payable as of the acquisition date and for which the Company received a credit at close, and $2.6 million of external acquisition-related expenses that were capitalized.
During the year ended December 31, 2017, the Company acquired a controlling interest in 88 commercial properties and three land parcels for an aggregate purchase price of $748.8 million (the “2017 Acquisitions”), which includes $3.3 million of external acquisition-related expenses that were capitalized and includes 22 properties acquired in a nonmonetary exchange discussed below.
During the year ended December 31, 2016, the FASB issuedCompany acquired a controlling interest in eight commercial properties for an aggregate purchase price of $100.2 million (the “2016 Acquisitions”). Prior to the adoption of ASU 2016-15, Statement of Cash Flows (Topic 230): Classification of Certain Cash Receipts and Cash Payments (“ASU 2016-15”), which is intended to address diversity in practice2017-01, costs related to how certain cash receiptsproperty acquisitions were expensed as incurred. The Company has not included pro forma information for the Company's 2016 Acquisitions, which were acquired prior to the adoption of ASU 2017-01 and cash payments are presented and classified inmet the statementdefinition of cash flows. a business combination, as they did not have a material impact on the Company's financial position or results of operations.
The amendments in ASU 2016-15 address eight specific cash flow issues as well as applicationfollowing table presents the allocation of the predominance principle (dependence on predominant source or usefair values of receipt or payment)the assets acquired and are effective for public business entities for fiscal years beginning afterliabilities assumed during the periods presented (in thousands):
|
| | | | | | | | | | | | |
| | | Year Ended December 31, |
| | | 2018 | | 2017 | | 2016 |
| Real estate investments, at cost: | | | | | | |
| Land | | $ | 86,285 |
| | $ | 110,634 |
| | $ | 23,187 |
|
| Buildings, fixtures and improvements | | 350,942 |
| | 523,445 |
| | 67,865 |
|
| Total tangible assets | | 437,227 |
| | 634,079 |
| | 91,052 |
|
| Acquired intangible assets: | | | | | | |
In-place leases and other intangibles (1) | | 62,791 |
| | 105,940 |
| | 9,613 |
|
Above-market leases (2) | | 2,750 |
| | 10,445 |
| | — |
|
| Assumed intangible liabilities: | | | | | | |
Below-market leases (3) | | (116 | ) | | (1,680 | ) | | (471 | ) |
| Total purchase price of assets acquired | | $ | 502,652 |
| | $ | 748,784 |
| | $ | 100,194 |
|
| |
| (1) | The weighted average amortization period for acquired in-place leases and other intangibles is 16.3 years, 15.8 years and 13.8 years for 2018 Acquisitions, 2017 Acquisitions and 2016 Acquisitions, respectively. |
| |
| (2) | The weighted average amortization period for acquired above-market leases is 10.8 years and 18.0 years for 2018 Acquisitions and 2017 Acquisitions, respectively. There were no acquired above-market leases during the year ended December 31, 2016. |
| |
| (3) | The weighted average amortization period for acquired intangible lease liabilities is 9.9 years, 13.8 years and 10.0 years for 2018 Acquisitions, 2017 Acquisitions and 2016 Acquisitions, respectively. |
As of December 15, 201731, 2018, the Company invested $3.5 million, including $0.5 million of external acquisition-related expenses that were capitalized, in one build-to-suit development project. The Company’s estimated remaining committed investment is $24.9 million, and interim periodsthe project is expected to be completed within those fiscal years with early adoption permitted. ASU 2016-15 requires retrospective adoption unless it is impracticable tothe next 12 months.
VEREIT, INC. ANDand VEREIT OPERATING PARTNERSHIP, L.P.
NOTES TO CONSOLIDATED FINANCIAL STATEMENTS
December 31, 20162018 – (Continued)
apply,Future Lease Payments
The following table presents future minimum base rent payments due to the Company over the next five years and thereafter. These amounts exclude contingent rent payments, as applicable, that may be collected from certain tenants based on provisions related to sales thresholds and increases in annual rent based on exceeding certain economic indexes among other items (in thousands):
|
| | | | | | | | |
| | | Future Minimum Operating Lease
Base Rent Payments | | Future Minimum
Direct Financing Lease Payments (1) |
| 2019 | | $ | 1,107,610 |
| | $ | 2,448 |
|
| 2020 | | 1,080,639 |
| | 2,135 |
|
| 2021 | | 1,042,346 |
| | 2,014 |
|
| 2022 | | 972,564 |
| | 1,925 |
|
| 2023 | | 890,327 |
| | 1,541 |
|
| Thereafter | | 5,387,232 |
| | 707 |
|
| Total | | $ | 10,480,718 |
| | $ | 10,770 |
|
| |
| (1) | Related to25 properties which are subject to direct financing leases and, therefore, revenue is recognized as direct financing lease income on the discounted cash flows of the lease payments. Amounts reflected are the minimum base rental cash payments due to the Company under the lease agreements on these respective properties. |
Property Dispositions and Real Estate Assets Held for Sale
During the year ended December 31, 2018, the Company disposed of 149 properties, including one property conveyed to a lender in a deed-in-lieu of foreclosure transaction as discussed in Note 7 –Debt, for an aggregate gross sales price of $526.4 million, of which case it isour share was $504.3 million after the profit participation payments related to be applied prospectively asthe disposition of the earliest date practicable.34 Red Lobster properties. The dispositions resulted in proceeds of $496.7 million after closing costs. The Company plansrecorded a gain of $96.2 million related to adopt ASU 2016-15 during the fourth quartersales which is included in gain on disposition of fiscal year 2017.
In November 2016, the FASB issued ASU 2016-18, Statement of Cash Flows (Topic 230): Restricted Cash (“ASU 2016-18”), which provides guidance on the presentation of restricted cashreal estate and restricted cash equivalents in the statement of cash flows. In accordance with ASU 2016-18, restricted cash and restricted cash equivalents should be included with cash and cash equivalents when reconciling the beginning-of-period and end-of-period amounts shown on the statements of cash flows. The amendments of ASU 2016-18 are effective for reporting periods beginning after December 15, 2017, with early adoption permitted. The Company is currently evaluating the impact this amendment will have on its consolidated financial statements.
In January 2017, the FASB issued ASU 2017-01, Business Combinations (Topic 805): Clarifying the Definition of a Business (“ASU 2017-01”), which clarifies the definition of a business by adding guidance to assist entities in evaluating whether transactions should be accounted for as acquisitions (or disposals) ofreal estate assets or businesses. The guidance is effective for annual periods beginning after December 15, 2017, including interim periods within those periods, with early adoption permitted and is required to be applied prospectively to any transactions occurring within the period of adoption. The Company plans to adopt ASU 2017-01 during the first quarter of fiscal year 2017 and expects that most future acquisitions (or disposals) will qualify as asset acquisitions (or disposals). As such, future acquisition related expenses associated with these asset acquisitions will be capitalized and the REI segment’s goodwill will no longer be allocated to these asset dispositions at the time the asset is classified as held for sale, or upon dispositionnet in determining the accompanying consolidated statements of operations.
During the year ended December 31, 2018, the Company also disposed of one property owned by an unconsolidated joint venture for a gross sales price of $34.1 million, of which our share was $17.1 million based on our ownership interest in the joint venture, resulting in proceeds of $5.6 million after debt repayments of $20.4 million and closing costs. The Company recorded a gain or lossof $0.7 million related to the sale and liquidation of the joint venture, which is included in equity in income and gain on disposition of unconsolidated entities in the accompanying consolidated statements of operations.
During the year ended December 31, 2017, the Company disposed of 137 properties, including one property owned by a consolidated joint venture, six properties transferred to the lender in either a deed-in-lieu of foreclosure or foreclosure sale transaction as discussed in Note 7 –Debt, and 15 properties disposed of in connection with a nonmonetary exchange discussed below, for an aggregate gross sales price of $594.9 million, of which our share was $574.4 million after the profit participation payment related to the disposition of 31 Red Lobster properties and the consolidated joint venture partner’s share of the sales price. The dispositions resulted in proceeds of $445.5 million after a mortgage loan assumption of $66.0 million and closing costs. Additionally, the Company’s tax provision for the year ended December 31, 2017 included $1.7 million of Canadian tax gain on the sale of certain Canadian properties. The Company recorded a gain of $64.7 million, which is included in gain on disposition of real estate and real estate assets held for sale.
In January 2017,sale, net in the FASB issued ASU 2017-04, Intangibles – Goodwill and Others (Topic 350): Simplifying the Test for Goodwill Impairment (“ASU 2017-04”), which simplifies the measurementaccompanying consolidated statements of goodwill impairment by eliminating Step 2 from the goodwill impairment test (comparing the implied fair value of goodwill with the carrying amount of goodwill). ASU 2017-04 is effective for public business entities for annual periods beginning after December 15, 2019, and interim periods within those fiscal years, with early adoption is permitted. The Company is currently evaluating the impact this amendment will have on its consolidated financial statements.
Note 3 – Segment Reportingoperations.
The Company has organized its operations into two segments for management and internal financial reporting purposes, REI and Cole Capital, as further discussed below.
REI – Through its REI segment,During the Company owns and actively manages a diversified portfolio of retail, restaurant, office and industrial real estate properties subject to long-term net leases with creditworthy tenants. As ofyear ended December 31, 2016, the Company owned 4,142disposed of 301 properties, comprising 93.3for an aggregate gross sales price of $1.08 billion, of which our share was $1.04 billion after the profit participation payment related to the disposition of 70 Red Lobster properties. The dispositions resulted in proceeds of $958.4 million square feetafter a mortgage loan assumption of retail$55.0 million and commercial space locatedclosing costs. The Company recorded a gain of $45.7 million, which included $67.8 million of goodwill allocated to the cost basis of such properties, which is included in 49 states, Puerto Rico and Canada, which includes properties owned through consolidated joint ventures. The rentable space at these properties was 98.3% leased with a weighted-average remaining lease termgain on disposition of 9.9 years. In addition, as of December 31, 2016, the Company owned eight CMBS and nine mortgage notes receivable.
Cole Capital – Through its Cole Capital segment, the Company is responsible for managing the day-to-day affairs of Cole Credit Property Trust IV, Inc. (“CCPT IV”); Cole Real Estate Income Strategy (Daily NAV), Inc. (“INAV”); Cole Office & Industrial REIT (CCIT II), Inc. (“CCIT II”); Cole Office & Industrial REIT (CCIT III), Inc. (“CCIT III”), Cole Credit Property Trust V, Inc. (“CCPT V”); and other real estate offeringsand real estate assets held for sale, net in registration (collectively with CCPT IV, INAV, CCIT II, CCIT III and CCPT V, the “Cole REITs”), raising capital for those Cole REITs in offering, identifying and making acquisitions and investments on the Cole REITs’ behalf and recommending to the respective boardaccompanying consolidated statements of directors of each of the Cole REITs an approach for providing investors with liquidity. Cole Capital serves as the dealer manager and distributes shares of common stock for certain Cole REITs and advises them regarding offerings, manages relationships with participating broker-dealers and financial advisors and provides assistance in connection with compliance matters relating to the offerings. Cole Capital receives compensation and reimbursement for services relating to the Cole REITs’ offerings and the investment, management, financing and disposition of their respective assets, as applicable. Cole Capital also develops new REIT offerings and assists in obtaining regulatory approvals from the SEC, the Financial Industry Regulatory Authority, Inc. and various blue sky jurisdictions for such offerings. See Note 18 –Related Party Transactions and Arrangements for further discussion on the Cole REITs.operations.
VEREIT, INC. ANDand VEREIT OPERATING PARTNERSHIP, L.P.
NOTES TO CONSOLIDATED FINANCIAL STATEMENTS
December 31, 20162018 – (Continued)
The Company allocates certain operating expenses, such as legal fees, employee related costs and benefits and general overhead expenses between its operating segments. The following tables present a summary of the comparative financial results and total assets for each segment (in thousands):
|
| | | | | | | | | | | | |
| | | Year Ended December 31, |
| | | 2016 | | 2015 | | 2014 |
| REI segment: | | | | | | |
| Revenues: | | | | | | |
| Rental income | | $ | 1,227,937 |
| | $ | 1,339,787 |
| | $ | 1,271,574 |
|
| Direct financing lease income | | 2,055 |
| | 2,720 |
| | 3,603 |
|
| Operating expense reimbursements | | 105,455 |
| | 98,628 |
| | 100,522 |
|
| Total real estate investment revenues | | 1,335,447 |
|
| 1,441,135 |
|
| 1,375,699 |
|
| Operating expenses: | | | | | | |
| Acquisition related | | 1,257 |
| | 5,649 |
| | 35,578 |
|
| Litigation, merger and other non-routine costs, net of insurance recoveries | | 3,884 |
| | 33,628 |
| | 197,647 |
|
| Property operating | | 144,428 |
| | 130,855 |
| | 137,741 |
|
| Management fees to affiliates | | — |
| | — |
| | 13,888 |
|
| General and administrative | | 51,265 |
| | 64,691 |
| | 76,261 |
|
| Depreciation and amortization | | 756,314 |
| | 817,477 |
| | 844,743 |
|
| Impairment of real estate | | 182,820 |
| | 91,755 |
| | 100,547 |
|
| Total operating expenses | | 1,139,968 |
|
| 1,144,055 |
|
| 1,406,405 |
|
| Operating income (loss) | | 195,479 |
|
| 297,080 |
|
| (30,706 | ) |
| Other (expense) income: | | | | | | |
| Interest expense | | (317,376 | ) | | (358,392 | ) | | (452,648 | ) |
| (Loss) gain on extinguishment and forgiveness of debt, net | | (771 | ) | | 4,812 |
| | (21,869 | ) |
| Other income, net | | 5,289 |
| | 3,953 |
| | 85,975 |
|
| Reserve for loan loss | | — |
| | (15,300 | ) | | — |
|
| Equity in income (loss) and gain on disposition of unconsolidated entities | | 9,783 |
| | 9,092 |
| | (76 | ) |
| Loss on derivative instruments, net | | (1,191 | ) | | (1,460 | ) | | (10,570 | ) |
| Total other expenses, net | | (304,266 | ) |
| (357,295 | ) |
| (399,188 | ) |
| Loss before taxes and real estate dispositions | | (108,787 | ) |
| (60,215 | ) |
| (429,894 | ) |
| Gain (loss) on disposition of real estate and held for sale assets, net | | 45,524 |
| | (72,311 | ) | | (277,031 | ) |
| Loss before taxes | | (63,263 | ) |
| (132,526 | ) |
| (706,925 | ) |
| Provision for income taxes | | (6,110 | ) | | (3,569 | ) | | (7,313 | ) |
| Net loss | | $ | (69,373 | ) |
| $ | (136,095 | ) |
| $ | (714,238 | ) |
| | | | | | | |
VEREIT, INC. AND VEREIT OPERATING PARTNERSHIP, L.P.
NOTES TO CONSOLIDATED FINANCIAL STATEMENTS
December 31, 2016 – (Continued)
|
| | | | | | | | | | | | |
| | | Year Ended December 31, |
| | | 2016 | | 2015 | | 2014 |
| Cole Capital segment: | | | | | | |
| Revenues: | | | | | | |
| Offering-related fees and reimbursements | | $ | 36,533 |
| | $ | 24,410 |
| | $ | 87,109 |
|
| Transaction service fees and reimbursements | | 12,959 |
| | 30,109 |
| | 64,956 |
|
| Management fees and reimbursements | | 69,884 |
| | 60,363 |
| | 51,493 |
|
| Total Cole Capital revenues | | 119,376 |
|
| 114,882 |
|
| 203,558 |
|
| Operating expenses: | | | | | | |
| Cole Capital reallowed fees and commissions | | 23,174 |
| | 16,195 |
| | 66,228 |
|
| Acquisition related | | 64 |
| | 594 |
| | 3,362 |
|
| Litigation, merger and other non-routine costs, net of insurance recoveries | | — |
| | — |
| | 1,969 |
|
| General and administrative | | 85,343 |
| | 84,375 |
| | 91,167 |
|
| Depreciation and amortization | | 31,872 |
| | 30,134 |
| | 71,260 |
|
| Impairments | | 120,931 |
| | 213,339 |
| | 309,444 |
|
| Total operating expenses | | 261,384 |
|
| 344,637 |
|
| 543,430 |
|
| Operating loss | | (142,008 | ) |
| (229,755 | ) |
| (339,872 | ) |
| Total other income, net | | 746 |
| | 2,486 |
| | 2,621 |
|
| Loss before income taxes | | (141,262 | ) |
| (227,269 | ) |
| (337,251 | ) |
| Benefit from income taxes | | 9,811 |
| | 39,872 |
| | 40,577 |
|
| Net loss | | $ | (131,451 | ) |
| $ | (187,397 | ) |
| $ | (296,674 | ) |
| | | | | | | |
| Total Company: | | | | | | |
| Total revenues | | $ | 1,454,823 |
|
| $ | 1,556,017 |
|
| $ | 1,579,257 |
|
| Total operating expenses | | $ | (1,401,352 | ) |
| $ | (1,488,692 | ) |
| $ | (1,949,835 | ) |
| Total other expense, net | | $ | (303,520 | ) |
| $ | (354,809 | ) |
| $ | (396,567 | ) |
| Net loss | | $ | (200,824 | ) |
| $ | (323,492 | ) |
| $ | (1,010,912 | ) |
|
| | | | | | | | |
| | | Total Assets |
| | | December 31, 2016 | | December 31, 2015 |
| REI segment | | $ | 15,337,623 |
| | $ | 16,966,729 |
|
| Cole Capital segment | | 249,951 |
| | 439,137 |
|
| Total Company | | $ | 15,587,574 |
|
| $ | 17,405,866 |
|
Note 4 – Goodwill and Other Intangibles
Goodwill
In connection with prior mergers, the Company recorded goodwill as a result of the merger consideration exceeding the net assets acquired. The goodwill recorded as a result of the merger of Cole Real Estate Investments, Inc. (“Cole”) with and into a wholly owned subsidiary of the Company (the “Cole Merger”) was allocated between the Company’s two segments, the REI segment and the Cole Capital segment. The REI segment and the Cole Capital segment each comprise one reporting unit. For discussion regarding the Company’s policies on goodwill allocation for future acquisitions and dispositions, please see Note 2 – Summary of Significant Accounting Policies.
The Company evaluates goodwill for impairment annually or more frequently when an event occurs or circumstances change that indicate the carrying value, by reporting unit, may not be recoverable. The analysis performed for the annual goodwill test during the years ended December 31, 2016, 2015 and 2014 resulted in impairment charges of $120.9 million, $139.7 million and $223.1 million, respectively, in the Cole Capital reporting unit. See Note 10 – Fair Value Measures for a discussion of the Company’s fair value measurements regarding goodwill and intangible assets.
VEREIT, INC. AND VEREIT OPERATING PARTNERSHIP, L.P.
NOTES TO CONSOLIDATED FINANCIAL STATEMENTS
December 31, 2016 – (Continued)
The following table summarizes the Company’s goodwill activity by segment from January 1, 2015 to December 31, 2016 (in thousands):
|
| | | | | | | | | | | | |
| | | REI Segment | | Cole Capital Segment | | Consolidated |
| Balance, January 1, 2015 | | $ | 1,509,396 |
| | $ | 385,398 |
|
| $ | 1,894,794 |
|
Goodwill allocated to dispositions and held for sale assets (1) | | (98,765 | ) | | — |
| | (98,765 | ) |
| Impairment | | — |
| | (139,655 | ) | | (139,655 | ) |
| Balance, December 31, 2015 | | $ | 1,410,631 |
|
| $ | 245,743 |
|
| $ | 1,656,374 |
|
Goodwill allocated to dispositions and held for sale assets (1) (2) | | (73,240 | ) | | — |
| | (73,240 | ) |
| Impairment | | — |
| | (120,931 | ) | | (120,931 | ) |
| Balance as of December 31, 2016 | | $ | 1,337,391 |
|
| $ | 124,812 |
|
| $ | 1,462,203 |
|
| |
(1) | Included in gain (loss) on disposition of real estate and held for sale assets, net, in the consolidated statement of operations. |
| |
(2) | Includes $71.0 million of goodwill allocated to the cost basis of properties disposed of and classified as held for sale as discussed in Note 5 –Real Estate Investments and $2.3 million of goodwill allocated to the cost basis of two properties foreclosed upon as discussed in Note 11 –Debt during the year ended December 31, 2016.
|
Intangible Assets
The intangible assets primarily consisted of management and advisory contracts that the Company has with certain Cole REITs, which are subject to an estimated remaining useful life of approximately three years.
In connection with the annual goodwill impairment test, the fair value of the intangible assets were analyzed during the three months ended December 31, 2016. Based on this analysis, the Company concluded that the fair value of the intangible assets exceeded the carrying value and no impairment charge was recorded. The Company recorded $26.2 million of amortization expense related to the intangible assets duringDuring the year ended December 31, 2016.2016, the Company also disposed of one property owned by an unconsolidated joint venture for a gross sales price of $113.5 million, of which our share was $102.1 million based on our ownership interest in the joint venture, resulting in proceeds of $42.3 million after debt repayments of $57.0 million and closing costs. The Company recorded $25.9a gain of $10.2 million of amortization expenses related to the intangiblesale, which is included in equity in income and gain on disposition of unconsolidated entities in the accompanying consolidated statements of operations.
As of December 31, 2018, there were five properties classified as held for sale with a carrying value of $2.6 million, included in assets related to real estate assets held for sale and discontinued operations, net in the accompanying consolidated balance sheet, which are expected to be sold in the next 12 months as part of the Company’s portfolio management strategy. As of December 31, 2017, there were 30 properties classified as held for sale. During the year ended December 31, 2015. The estimated amortization expense is expected2018, the Company recorded a loss of $1.9 million related to be $16.6 million and $4.0 millionheld for sale properties. During the years endingyear ended December 31, 2017, and 2018, respectively, and $3.8the Company recorded a loss of $3.1 million related to held for sale properties. During the nine months ending September 30, 2019. See Note 10 – Fair Value Measures for a discussion of the Company’s fair value measurements regarding goodwill and intangible assets. The intangible assets were $24.6 million and $50.8 million, net of accumulated amortization of $29.6 million and $3.4 million, respectively, as ofyear ended December 31, 2016, and December 31, 2015.the Company recorded a loss of $5.1 million related to held for sale properties, which included $3.2 million of goodwill allocated to the cost basis of such properties.
Intangible Lease Assets and Liabilities
Intangible lease assets and liabilities of the Company consisted of the following as of December 31, 20162018 and 20152017 (amounts in thousands, except weighted-average useful life):
|
| | | | | | | | | | |
| | | Weighted-Average Useful Life | | December 31, 2016 | | December 31, 2015 |
| Intangible lease assets: | | | | | | |
| In-place leases, net of accumulated amortization of $494,131 and $398,770, respectively | | 14.8 | | $ | 1,192,756 |
| | $ | 1,458,354 |
|
| Leasing commissions, net of accumulated amortization of $1,836 and $1,035, respectively | | 9.9 | | 10,231 |
| | 4,872 |
|
| Above-market lease assets and deferred lease incentives, net of accumulated amortization of $69,670 and $47,041, respectively | | 16.5 | | 275,897 |
| | 308,306 |
|
| Total intangible lease assets, net | | | | $ | 1,478,884 |
|
| $ | 1,771,532 |
|
| | | | | | | |
| Intangible lease liabilities: | | | | | | |
| Below-market leases, net of accumulated amortization of $56,891 and $38,340, respectively | | 18.0 | | $ | 224,023 |
| | $ | 251,692 |
|
|
| | | | | | | | | | |
| | | Weighted-Average Useful Life | | December 31, 2018 | | December 31, 2017 |
| Intangible lease assets: | | | | | | |
| In-place leases and other intangibles, net of accumulated amortization of $703,909 and $599,680, respectively | | 15.5 | | $ | 980,971 |
| | $ | 1,091,433 |
|
| Leasing commissions, net of accumulated amortization of $4,048 and $2,902, respectively | | 10.7 | | 15,660 |
| | 13,876 |
|
| Above-market lease assets and deferred lease incentives, net of accumulated amortization of $105,936 and $88,335, respectively | | 16.4 | | 201,875 |
| | 241,449 |
|
| Total intangible lease assets, net | | | | $ | 1,198,506 |
| | $ | 1,346,758 |
|
| | | | | | | |
| Intangible lease liabilities: | | | | | | |
| Below-market leases, net of accumulated amortization of $89,905 and $73,916, respectively | | 18.8 | | $ | 173,479 |
| | $ | 198,551 |
|
VEREIT, INC. AND VEREIT OPERATING PARTNERSHIP, L.P.
NOTES TO CONSOLIDATED FINANCIAL STATEMENTS
above‑ and below-market leases and deferred lease incentives amortized and included as a net decrease to rental revenue was $4.2 million for the year ended December 31, 2018 and $5.4 million for each of the years ended December 31, 2017 and 2016, – (Continued)
respectively. The aggregate amount of in-place leases, leasing commissions and other lease intangibles amortized and included in depreciation and amortization expense was $139.6 million, $154.2 million and $170.0 million for the years ended December 31, 2018, 2017 and 2016, respectively.
The following table provides the projected amortization expense and adjustments to rental incomerevenue related to the intangible lease assets and liabilities for the next five years as of December 31, 20162018 (amounts in thousands):
| | | | | 2017 | | 2018 | | 2019 | | 2020 | | 2021 | | 2019 | | 2020 | | 2021 | | 2022 | | 2023 |
| In-place leases: | | | | | | | | | | | |
| In-place leases and other intangibles: | | | | | | | | | | | |
| Total projected to be included in amortization expense | | $ | 146,814 |
| | $ | 134,960 |
| | $ | 124,008 |
| | $ | 115,862 |
| | $ | 106,889 |
| | $ | 126,457 |
| | $ | 119,161 |
| | $ | 111,335 |
| | $ | 97,159 |
| | $ | 86,311 |
|
| Leasing commissions: | | | | | | | | | | | | | | | | | | | | |
| Total projected to be included in amortization expense | | 1,124 |
| | 936 |
| | 862 |
| | 821 |
| | 772 |
| | 1,911 |
| | 1,778 |
| | 1,620 |
| | 1,556 |
| | 1,359 |
|
| Above-market lease assets and deferred lease incentives: | | | | | | | | | | | Above-market lease assets and deferred lease incentives: | | | | | | | | |
| Total projected to be deducted from rental income | | 24,745 |
| | 24,243 |
| | 22,330 |
| | 21,894 |
| | 21,377 |
| |
| Total projected to be deducted from rental revenue | | | 20,870 |
| | 20,456 |
| | 20,027 |
| | 19,213 |
| | 18,270 |
|
| Below-market lease liabilities: | | | | | | | | | | | | | | | | | | | | |
| Total projected to be included in rental income | | 20,100 |
| | 19,773 |
| | 19,040 |
| | 17,856 |
| | 16,501 |
| |
| Total projected to be included in rental revenue | | | 17,973 |
| | 16,821 |
| | 15,656 |
| | 14,809 |
| | 13,924 |
|
Note 5 – Real Estate Investments
The Company acquired controlling financial interests in eight commercial properties for a purchase price of $100.2 million during the year ended December 31, 2016 (the “2016 Acquisitions”). The Company recorded revenue for the year ended December 31, 2016 of $2.1 million and net income of $0.5 million related to the 2016 Acquisitions.
During the year ended December 31, 2015, the Company acquired controlling interests in 16 commercial properties, including nine land parcels, for an aggregate purchase price of $36.3 million (the “2015 Acquisitions”). The Company recorded revenue for the year ended December 31, 2015 of $1.2 million and net income of $0.4 million related to the 2015 Acquisitions.
During the year ended December 31, 2014, the Company acquired controlling interests in 1,107 commercial properties, including a sale-leaseback transaction of 522 Red Lobster® restaurants and 20 other branded restaurant properties and 31 land parcels (the “2014 Acquisitions”), but excluding the properties acquired in the Cole Merger, CCPT Merger and the ARCT IV Merger, for an aggregate purchase price of $3.8 billion.
The following table presents the allocation of the fair values of the assets acquired and liabilities assumed during the periods presented (in thousands):
|
| | | | | | | | | | | | |
| | | Year Ended December 31, |
| | | 2016 | | 2015 | | 2014 |
| Real estate investments, at cost: | | | | | | |
| Land | | $ | 23,187 |
| | $ | 5,051 |
| | $ | 808,930 |
|
| Buildings, fixtures and improvements | | 67,865 |
| | 28,643 |
| | 2,505,409 |
|
| Total tangible assets | | 91,052 |
| | 33,694 |
|
| 3,314,339 |
|
| Acquired intangible assets: | | | | | | |
In-place leases (1) | | 9,613 |
| | 2,580 |
| | 545,389 |
|
Above-market leases (2) | | — |
| | 153 |
| | 112,484 |
|
| Assumed intangible liabilities: | | | | | | |
Below-market leases (3) | | (471 | ) | | (108 | ) | | (107,185 | ) |
| Fair value adjustment of assumed notes payable | | — |
| | — |
| | (23,589 | ) |
| Total purchase price of assets acquired | | $ | 100,194 |
| | $ | 36,319 |
|
| $ | 3,841,438 |
|
| Mortgage notes payable assumed | | — |
| | — |
| | (301,532 | ) |
| Cash paid for acquired real estate investments | | $ | 100,194 |
|
| $ | 36,319 |
|
| $ | 3,539,906 |
|
| |
(1) | The weighted average amortization period for acquired in-place leases is 13.8 years, 11.0 years and 19.0 years for 2016 Acquisitions, 2015 Acquisitions and 2014 Acquisitions, respectively. |
| |
(2) | The weighted average amortization period for acquired above-market leases is 14.1 years and 19.4 years for 2015 Acquisitions and 2014 Acquisitions, respectively. There were no acquired above-market leases during the year ended December 31, 2016. |
| |
(3) | The weighted average amortization period for acquired intangible lease liabilities is 10.0 years, 15.0 years and 20.6 years for 2016 Acquisitions, 2015 Acquisitions and 2014 Acquisitions, respectively. |
VEREIT, INC. ANDand VEREIT OPERATING PARTNERSHIP, L.P.
NOTES TO CONSOLIDATED FINANCIAL STATEMENTS
December 31, 20162018 – (Continued)
The Company has not included pro forma information for the Company’s 2016 or 2015 Acquisitions as they did not have a material impact on its consolidated financial position or results of operations. The following table presents unaudited pro forma information as if all of the Company’s acquisitions in 2014, including the Cole Merger, the ARCT IV Merger and the CCPT Merger, as discussed in Note 6 – Mergers with Real Estate Businesses, were completed on January 1, 2013 for each period presented below. These amounts have been calculated after applying the Company’s accounting policies and adjusting the results of acquisitions to reflect the additional depreciation and amortization and interest expense that would have been charged had the acquisitions occurred on January 1, 2013. Additionally, the unaudited pro forma net loss attributable to stockholders was adjusted to exclude acquisition related expenses of $38.8 million and $76.1 million for the years ended December 31, 2014 and 2013, respectively, and merger and other non-routine transaction related expenses of $200.5 million and $210.5 million for the years ended December 31, 2014 and 2013, respectively, which is included in litigation, merger and other non-routine costs, net of insurance recoveries in the accompanying consolidated statements of operations. Data below is presented in thousands.
|
| | | | | | | | |
| | | Year Ended December 31, |
| | | 2014 | | 2013 |
| | | (Unaudited) | | (Unaudited) |
| Pro forma revenues | | $ | 1,853,014 |
| | $ | 1,585,511 |
|
| Pro forma net (loss) attributable to stockholders | | $ | (606,549 | ) | | $ | (478,093 | ) |
Future Lease Payments
The following table presents future minimum base rent payments due to the Company over the next five years and thereafter. These amounts exclude contingent rent payments, as applicable, that may be collected from certain tenants based on provisions related to sales thresholds and increases in annual rent based on exceeding certain economic indexes among other items (in thousands):
|
| | | | | | | | |
| | | Future Minimum Operating Lease Base Rent Payments | | Future Minimum Direct Financing Lease Payments (1) |
| 2017 | | $ | 1,106,798 |
| | $ | 3,819 |
|
| 2018 | | 1,096,146 |
| | 3,016 |
|
| 2019 | | 1,058,299 |
| | 2,397 |
|
| 2020 | | 1,021,668 |
| | 2,023 |
|
| 2021 | | 978,368 |
| | 1,899 |
|
| Thereafter | | 6,487,753 |
| | 3,993 |
|
| Total | | $ | 11,749,032 |
| | $ | 17,147 |
|
| |
(1) | 32 properties are subject to direct financing leases and, therefore, revenue is recognized as direct financing lease income on the discounted cash flows of the lease payments. Amounts reflected are the minimum base rental cash payments due to the Company under the lease agreements on these respective properties. |
Investment in Direct Financing Leases, Net
The components of the Company’s net investment in direct financing leases as of December 31, 2016 and December 31, 2015 are as follows (in thousands):
|
| | | | | | | | |
| | | December 31, 2016 | | December 31, 2015 |
| Future minimum lease payments receivable | | $ | 17,147 |
| | $ | 21,993 |
|
| Unguaranteed residual value of property | | 27,450 |
| | 31,562 |
|
| Unearned income | | (5,142 | ) | | (7,243 | ) |
| Net investment in direct financing leases | | $ | 39,455 |
|
| $ | 46,312 |
|
VEREIT, INC. AND VEREIT OPERATING PARTNERSHIP, L.P.
NOTES TO CONSOLIDATED FINANCIAL STATEMENTS
December 31, 2016 – (Continued)
Property Dispositions and Held for Sale AssetsNonmonetary Exchange
During the year ended December 31, 2016,2017, the Company disposedcompleted a nonmonetary exchange through the simultaneous acquisition of 30122 Bob Evans properties for an aggregate gross sales price of $1.08 billion, of which our share was $1.04 billion after the profit participation payment related to theand disposition of 7015 Red Lobster properties. Pursuant to Nonmonetary Transactions, ASC (Topic 845), the cost of a nonmonetary asset acquired in exchange for another nonmonetary asset is the fair value of the asset surrendered to obtain the acquired nonmonetary asset, and a gain or loss should be recognized on the exchange. The dispositions resulted in consolidated proceedsfair value of $958.4 million after a mortgage loan assumptionthe asset received should be used to measure the cost if the fair value of $55.0 millionthe asset received is more reliable than the fair value of the asset surrendered. The Company estimated the fair value of the Bob Evans and closing costs. TheRed Lobster properties using valuation techniques consistent with the income approach and concluded that the fair value was $50.1 million. As the fair value of the assets received exceeded the book value of the assets surrendered, the Company recorded a gain of $45.7$7.4 million, related to the sales, which included $67.8 million of goodwill allocated to the cost basis of such properties. The Company’s gain on the sales is included in gain (loss) on disposition of real estate and real estate assets held for sale, assets, net in the accompanying consolidated statements of operations. During the year ended December 31, 2016, the Company also disposed of one property owned by an unconsolidated joint venture for a gross sales price of $113.5 million, of which our share was $102.1 million based on our ownership interest in the joint venture, resulting in proceeds of $42.3 million after mortgage loan repayments of $57.0 million and closing costs. The Company recorded a gain of $10.2 million related to the sale, which is included in equity in income (loss) and gain on disposition of unconsolidated entities in the accompanying consolidated statements of operations.
During the year ended December 31, 2015, the Company disposed of 228 properties, including two properties owned by consolidated joint ventures, for an aggregate sales price of $1.4 billion, resulting in consolidated proceeds of $966.1 million after mortgage loan assumptions and closing costs. The Company recorded a loss of $69.1 million related to the sales, which included $96.7 million of goodwill allocated in the cost basis of such properties. The Company’s loss on the sales is included in gain (loss) on disposition of real estate and held for sale assets, net in the accompanying consolidated statements of operations. During the year ended December 31, 2015, the Company also disposed of its interest in one consolidated joint venture, whose only assets consisted of investments in three Unconsolidated Joint Ventures, for an aggregate gross sales price of $77.5 million, of which the Company’s share was $69.8 million based on its ownership interest, resulting in consolidated proceeds of $43.0 million after mortgage loan repayment and closing costs. The mortgage loan obligation of the consolidated joint venture was held by an unconsolidated entity. The Company recorded a gain of $6.7 million related to the sale of the consolidated joint venture, which is included in equity in income (loss) and gain on disposition of unconsolidated entities in the accompanying consolidated statements of operations.
As of December 31, 2016, there were 11 properties classified as held for sale which are expected to be sold in the next 12 months as part of the Company’s portfolio management strategy. As of December 31, 2015, there were 17 properties classified as held for sale. During the years ended December 31, 2016 and 2015, the Company recorded a loss of $0.2 million and $3.2 million, respectively, related to properties classified as held for sale as of December 31, 2016 and 2015, which included $3.2 million and $2.1 million, respectively, of goodwill allocated to the cost basis of such properties. The loss on properties held for sale is included in gain (loss) on disposition of real estate and held for sale assets, net in the accompanying consolidated statements of operations.
Multi-tenant Shopping Center Portfolio Sale
On October 17, 2014, the Company completed the sale of a portfolio consisting of 64 multi-tenant properties and seven single-tenant properties (the “Multi-Tenant Portfolio”) for $1.9 billion to the Blackstone/DDR Joint Venture. The disposition to Blackstone and DDR provided $1.3 billion of net proceeds, of which $1.2 billion were used to reduce the Company’s leverage by paying down the Company’s line of credit. In connection with the sale, $542.8 million of secured mortgage debt was either repaid or assumed by the Blackstone/DDR Joint Venture, providing the Company with $1.3 billion in net proceeds and resulting in a net loss on sale of $262.0 million, which included $195.5 million of goodwill allocation.
The Multi-Tenant Portfolio was not classified as discontinued operations for any periods presented, however, the Company has determined that the Multi-Tenant Portfolio was an individually significant component of the Company. The following table summarizes the operating income from continued operations of the Multi-Tenant Portfolio for the year ended December 31, 2014 (in thousands):
|
| | | | |
| | | Year Ended December 31, 2014 |
| Total revenue | | $ | 122,522 |
|
| Total expenses | | (123,776 | ) |
| Loss from Multi-Tenant Portfolio | | $ | (1,254 | ) |
VEREIT, INC. AND VEREIT OPERATING PARTNERSHIP, L.P.
NOTES TO CONSOLIDATED FINANCIAL STATEMENTS
December 31, 2016 – (Continued)
Impairment of Real Estate Investments
The Company performs quarterly impairment review procedures, primarily through continuous monitoring of events and changes in circumstances that could indicate the carrying value of its real estate assets may not be recoverable.
During the year ended December 31, 2016, management identified certain properties for potential sale as part of its portfolio management strategy to reduce exposure to office properties. Additionally, a tenant of 59 restaurant properties filed for bankruptcy during the year ended December 31, 2016. As part of the Company’s quarterly impairment review procedures and considering the factors mentioned above, real estate assets with carrying values totaling $668.2 million were deemed to be impaired and their carrying values were reduced to their estimated fair values of $485.4 million, resulting in impairment charges of $182.8 million during the year ended December 31, 2016. During the years ended December 31, 2015 and 2014, real estate assets with carrying values totaling $340.0 million and $199.5 million, respectively, were deemed to be impaired and their carrying values were reduced to their estimated fair values of $248.3 million and $99.0 million, respectively, resulting in impairment charges of $91.8 million and $100.5 million, respectively.
Consolidated Joint Ventures
The Company had interestsan interest in two Consolidated Joint Venturesone consolidated joint venture that owned two propertiesone property as of each of December 31, 20162018 and December 31, 2015.2017. As of December 31, 20162018 and December 31, 2015,2017, the Consolidated Joint Venturesconsolidated joint venture had total assets of $57.0$32.5 million and $58.5$33.7 million, of which $50.8$29.9 million and $55.2$30.7 million, respectively, were real estate investments, net of accumulated depreciation and amortization. As of December 31, 2016, oneThe property was secured by a mortgage note payable, of $11.6 million, which was non-recourse to the Company.Company and had a balance of $14.0 million and $14.9 million, as of December 31, 2018 and 2017, respectively. The Company has the ability to control operating and financialfinancing policies of the Consolidated Joint Ventures.consolidated joint venture. There are restrictions on the use of these assets as the Company would generally be required to obtain the approval of eachthe joint venture partner (the “Partner”) in accordance with the respective joint venture agreement for any major transactions. The Company and each Partnerthe joint venture partner are subject to the provisions of eachthe joint venture agreement, which includes provisions for when additional contributions may be required to fund certain cash shortfalls. The Partners’ share
Unconsolidated Joint Ventures
As of December 31, 2018, the Company held an investment in an unconsolidated joint venture that owned one property with a carrying value of $35.3 million. As of December 31, 2017, the Company held investments in two unconsolidated joint ventures that each owned one property with an aggregate Consolidated Joint Ventures’ loss was $14,000 forcarrying value of $39.5 million. During the year ended December 31, 2016. 2018, the Company disposed of one property owned by an unconsolidated joint venture as previously discussed in the “Property Dispositions and Real Estate Assets Held for Sale” section herein.
The Partners’Company had a 90% legal ownership interest in the unconsolidated joint venture at December 31, 2018 and December 31, 2017 and accounts for its investment using the equity method of accounting as the Company has the ability to exercise significant influence, but not control, over operating and financing policies of the investment. The equity method of accounting requires the investment to be initially recorded at cost and subsequently adjusted for the Company’s share of incomeequity in earnings and distributions from five Consolidated Joint Ventures was $1.3 million forthe joint venture. During the year ended December 31, 2015. The2018 the Company disposedrecognized $1.2 million of its interest in three of these Consolidated Joint Ventures duringnet income from unconsolidated joint ventures. During the yearyears ended December 31, 2015, which included one Consolidated Joint Venture, whose only assets were investments2017 and 2016 the Company recognized $3.3 million and $0.9 million of net income, respectively, from two unconsolidated joint ventures. The Company’s legal ownership interest may, at times, not equal the Company’s economic interest because of various provisions in three Unconsolidated Joint Ventures. certain joint venture agreements regarding distributions of cash flow based on capital account balances, allocations of profits and losses and payments of preferred returns.
The Partners’ sharecarrying amount of the loss from six Consolidated Joint Venturesunconsolidated joint venture was $154,000 forgreater than the year ended December 31, 2014. The Company disposed of its interest in one of these Consolidated Joint Ventures during the year ended December 31, 2014. The Partners’ share of the Consolidated Joint Ventures’ income or loss is includedunderlying equity in net loss attributable to non-controlling interests in the consolidated statements of operations.
Unconsolidated Joint Ventures
The Company’s investment in Unconsolidated Joint Ventures consisted of interests in two joint ventures that owned two properties as of December 31, 2016, and interests in three joint ventures that owned three properties as of December 31, 2015. As of December 31, 2016 and December 31, 2015, the Company owned aggregate equity investments of $41.3 million and $52.8 million, respectively, in Unconsolidated Joint Ventures.
As of December 31, 2016, the Company’s maximum exposure to risk was $41.3 million, the carrying value of the investments, which is presented in investment in unconsolidated entities in the consolidated balance sheet. The Unconsolidated Joint Ventures had total debt outstanding of $20.4assets by $4.7 million as of December 31, 2016, none2018. The carrying amount of which is recoursethe unconsolidated joint ventures was greater than the underlying equity in net assets by $8.6 million as of December 31, 2017. This difference relates to a purchase price allocation of goodwill and a step up in fair value of the investment assets acquired in connection with mergers. The step up in fair value was allocated to the Company, as discussedindividual investment assets and is being amortized in Note 11 –Debt.accordance with the Company’s depreciation policy. The Company and the respective unconsolidated joint venture partnerspartner are subject to the provisions of the applicable joint venture agreement, which includes provisions for when additional contributions may be required to fund certain cash shortfalls.
Duringshortfalls, including the years ended December 31, 2016, 2015 and 2014, the Company recognized $0.9 million, $2.3 million and $1.5 millionCompany’s share of net income, respectively, from the Unconsolidated Joint Ventures which owned two, three and six properties, at the respective year end.expansion project capital expenditures.
VEREIT, INC. ANDand VEREIT OPERATING PARTNERSHIP, L.P.
NOTES TO CONSOLIDATED FINANCIAL STATEMENTS
December 31, 20162018 – (Continued)
Note 4 — Discontinued Operations
On November 13, 2017, the Company entered into a purchase and sale agreement (as amended by that certain First Amendment to the Purchase and Sale Agreement, dated as of February 1, 2018, the “Cole Capital Purchase and Sale Agreement”). On February 1, 2018, the Company completed the sale of its investment management segment, Cole Capital, under the terms of the Cole Capital Purchase and Sale Agreement. Substantially all of the Cole Capital segment’s operations were conducted through Cole Capital Advisors, Inc. (“CCA”), an Arizona corporation and a wholly owned subsidiary of the OP. The OP sold all of the issued and outstanding shares of common stock of CCA and certain of CCA’s subsidiaries to the Cole Purchaser, for approximately $120.0 million paid in cash at closing. The Company could also receive up to an aggregate of $80.0 million in Net Revenue Payments. There were no Net Revenue Payments received or earned for 2018. Substantially all of the Cole Capital segment financial results are reflected in the financial statements as discontinued operations.
The following is a summary of the assets and liabilities related to discontinued operations and real estate assets held for sale as of December 31, 2018 and 2017 (in thousands):
|
| | | | | | | | |
| | December 31, 2018 | | December 31, 2017 |
| Carrying amount of major classes of assets included in discontinued operations: | | | | |
| Cash | | $ | — |
| | $ | 2,198 |
|
Intangible assets, net (1) | | — |
| | 9,892 |
|
Other assets, net (2) | | — |
| | 6,975 |
|
Goodwill (3) | | — |
| | 124,812 |
|
| Due from Cole REITs, net | | — |
| | 1,284 |
|
Loss recognized on classification as held for sale (4) | | — |
| | (19,509 | ) |
| Assets related to discontinued operations, net | | $ | — |
| | $ | 125,652 |
|
| | | | | |
| Carrying amount of major classes of liabilities included in discontinued operations: | | | | |
| Accounts payable and accrued expenses | | $ | — |
| | $ | 14,269 |
|
| Other liabilities | | — |
| | 1,512 |
|
| Due to Cole REITs | | — |
| | 100 |
|
| Liabilities related to discontinued operations | | $ | — |
| | $ | 15,881 |
|
| |
| (1) | The intangible assets consisted of management and advisory contracts that the Company had with certain Cole REITs. Accumulated amortization was $44.1 million as of December 31, 2017. |
| |
| (2) | Includes program development costs of $3.3 million as of December 31, 2017, which were net of reserves of $7.6 million. |
| |
| (3) | The Company performed the annual goodwill test using the $120.0 million cash proceeds provided for under the Cole Capital Purchase and Sale Agreement, plus the estimated fair value of the Net Revenue Payments and determined the carrying amount exceeded the estimated fair value. As such, no goodwill impairment was recorded during the year ended December 31, 2017. |
| |
| (4) | The Company recognized a loss of $20.0 million on classification of the discontinued operations as held for sale, of which $0.5 million represented estimated costs to sell that were subsequently accrued in accounts payable and accrued expenses as of December 31, 2017. In determining the loss recognized on classification as held for sale, the Company elected to account for the future Net Revenue Payments as a gain contingency. Under this approach, the Company will not recognize any Net Revenue Payments until realized. |
VEREIT, INC. and VEREIT OPERATING PARTNERSHIP, L.P.
NOTES TO CONSOLIDATED FINANCIAL STATEMENTS
December 31, 2018 – (Continued)
The following is a summary of the Company’s percentage ownership and carrying amount related to each offinancial information for discontinued operations for the Unconsolidated Joint Ventures as ofyears ended December 31, 2018, 2017 and 2016 (dollar amounts in(in thousands):
|
| | | | | | | | |
| Name of Joint Venture | | Partner | | Ownership Percentage (1) | | Carrying Amount of Investment (2) |
| Cole/Mosaic JV South Elgin IL, LLC | | Affiliate of Mosaic Properties and Development, LLC | | 50% | | $ | 5,891 |
|
| Cole/Faison JV Bethlehem GA, LLC | | Faison-Winder Investors, LLC | | 90% | | 35,438 |
|
| | | | | | | $ | 41,329 |
|
|
| | | | | | | | | | | | |
| | | Year Ended December 31, |
| Revenues: | | 2018 | | 2017 | | 2016 |
| Offering-related fees and reimbursements | | $ | 1,027 |
| | $ | 16,096 |
| | $ | 36,526 |
|
| Transaction service fees and reimbursements | | 334 |
| | 13,929 |
| | 12,533 |
|
| Management fees and reimbursements | | 6,452 |
| | 76,214 |
| | 68,686 |
|
| Total revenues | | $ | 7,813 |
|
| $ | 106,239 |
|
| $ | 117,745 |
|
| Operating expenses: | | | | | | |
| Cole Capital reallowed fees and commissions | | 602 |
| | 9,879 |
| | 23,174 |
|
Transaction costs (1) | | (654 | ) | | 3,802 |
| | — |
|
| General and administrative | | 4,450 |
| | 63,783 |
| | 82,558 |
|
| Amortization of intangible assets | | — |
| | 14,490 |
| | 26,148 |
|
| Goodwill and intangible asset impairments | | — |
| | — |
| | 120,931 |
|
| Total operating expenses | | 4,398 |
|
| 91,954 |
|
| 252,811 |
|
| Other income, net | | — |
| | 464 |
| | 292 |
|
| Loss on disposition and assets held for sale | | (1,815 | ) | | (20,027 | ) | | — |
|
| Income (loss) before taxes | | 1,600 |
|
| (5,278 | ) |
| (134,774 | ) |
| Benefit from (provision for) income taxes | | 2,095 |
| | (13,839 | ) | | 10,837 |
|
| Income (loss) from discontinued operations, net of income taxes | | $ | 3,695 |
|
| $ | (19,117 | ) |
| $ | (123,937 | ) |
| |
| (1) | The Company’s ownership interest in this table reflects its legal ownership interest. Legal ownership may, at times, not equalnegative balance for the Company’s economic interest in the listed properties because of various provisions in certain joint venture agreements regarding distributions of cash flow based on capital account balances, allocations of profits and losses and payments of preferred returns. Asyear ended December 31, 2018 is a result the Company’sof estimated costs accrued in prior periods that exceeded actual economic interest (as distinct from its legal ownership interest) in certain of the properties could fluctuate from time to time and may not wholly align with its legal ownership interests. |
| |
(2) | The total carrying amount of the investments is greater than the underlying equity in net assets by $6.4 million. This difference relates to a purchase price step up in fair value of the investment assets acquired in connection with the Cole Merger. The step up in fair value was allocated to the individual investment assets and is being amortized in accordance with the Company’s depreciation policy.expenses incurred. |
Note 6 – Mergers with Real Estate Businesses
American Realty Capital Trust IV, Inc. Merger
On July 1, 2013, the General Partner entered into an Agreement and PlanThe following is a summary of Merger, as amended (the “ARCT IV Merger Agreement”), with ARCT IV, and certain subsidiaries of each company. The ARCT IV Merger Agreement providedcash flows related to discontinued operations for the merger of ARCT IV withyears ended December 31, 2018, 2017 and into a subsidiary of the OP (the “ARCT IV Merger”). The ARCT IV Merger was consummated on January 3, 2014 (the “ARCT IV Merger Date”).2016 (in thousands):
Pursuant to the terms of the ARCT IV Merger Agreement, each outstanding share of common stock of ARCT IV, including unvested restricted shares that vested in conjunction with the ARCT IV Merger, was exchanged for (i) $9.00 in cash, (ii) 0.5190 of a share of the Company’s Common Stock (the “ARCT IV Exchange Ratio”) and (iii) 0.5937 of a share of a new series of preferred stock designated as the 6.70% Series F Cumulative Redeemable Preferred Stock (“Series F Preferred Stock”) and each outstanding unit of ARCT IV’s operating partnership (each, an “ARCT IV OP Unit”), other than ARCT IV OP Units held by American Realty Capital Trust IV Special Limited Partner, LLC (the “ARCT IV Special Limited Partner”), and American Realty Capital Advisors IV, LLC (the “ARCT IV Advisor”) was exchanged for (i) $9.00 in cash, (ii) 0.5190 of a Limited Partner OP Unit and (iii) 0.5937 of a Limited Partner OP Unit designated as Series F Preferred Units (“Limited Partner Series F OP Units”). In total, the Operating Partnership, on the Company’s behalf, paid $651.4 million in cash, the Company issued 36.9 million shares of Common Stock and 42.2 million shares of Series F Preferred Stock to the former ARCT IV shareholders, and the Operating Partnership issued 0.7 million units of Limited Partner Series F OP units and 0.6 million Limited Partner OP Units to the former ARCT IV OP Unit holders in connection with the consummation of the ARCT IV Merger. In addition, each outstanding ARCT IV Class B Unit (as defined below) and each outstanding ARCT IV OP Unit held by the ARCT IV Special Limited Partner and the ARCT IV Advisor was converted into 2.3961 Limited Partner OP Units, resulting in the OP issuing 1.2 million Limited Partner OP Units. In accordance with the LPA, the OP issued a corresponding number of General Partner OP Units and General Partner Series F Preferred Units to the Company when shares of the Company’s Common Stock and Series F Preferred Stock were issued to former common stockholders of ARCT IV, respectively.On January 3, 2014, the OP entered into a contribution and exchange agreement with the ARCT IV OP, the ARCT IV Special Limited Partner and ARC Real Estate Partners, LLC (“ARC Real Estate”), an entity under common ownership with the Former Manager. The ARCT IV Special Limited Partner was entitled to receive certain distributions from the ARCT IV OP, including the subordinated distribution of net sales proceeds resulting from an “investment liquidity event” (as defined in the agreement of limited partnership of the ARCT IV OP). The ARCT IV Merger constituted an “investment liquidity event,” as a result |
| | | | | | | | | | | |
| | | Year Ended December 31, |
| | | 2018 | | 2017 | 2016 |
| Cash flows related to discontinued operations: | | | | | |
| Cash flows (used in) provided by operating activities | | $ | (10,468 | ) | | $ | 33,232 |
| $ | 35,251 |
|
| Cash flows provided by investing activities | | $ | 122,915 |
| | $ | — |
| $ | — |
|
Income Taxes
Cole Capital’s business, substantially all of which the ARCT IV Special Limited Partner, in connection with management’s successful attainmentwas conducted through a TRS, recognized a benefit of the 6.0% performance hurdle and the return to ARCT IV’s stockholders of $358.3$2.1 million in addition to their initial investment, received a subordinated distribution of net sales proceeds from the ARCT IV OP equal to $63.2 million. Pursuant to the contribution and exchange agreement, the ARCT IV Special Limited Partner contributed its interest in the ARCT IV OP, inclusive of the subordinated distribution proceeds received, to the ARCT IV OP in exchange for 2.8 million equity units of the ARCT IV OP, based on a price per share of $22.50. The fair value of these units at date of issuance was $78.2 million and has been included in litigation, merger and other non-routine costs, net of insurance recoveries in the accompanying consolidated statements of operations for the year ended December 31, 2014. Upon consummation2018, a provision of $13.8 million the ARCT IV Merger, these equity units were immediately converted to 6.7year ended December 31, 2017 and a benefit of $10.8 million Limited Partner OP Units after application offor the exchange ratio of 2.3961 per ARCT IV OP Unit. In conjunction with the ARCT IV Mergeryear ended December 31, 2016.
VEREIT, INC. ANDand VEREIT OPERATING PARTNERSHIP, L.P.
NOTES TO CONSOLIDATED FINANCIAL STATEMENTS
December 31, 20162018 – (Continued)
Agreement,The following table presents the ARCT IV Special Limited Partner agreed to a minimum two-year holding period for these Limited Partner OP Units before being redeemable by the holder for cash or, at the optionreconciliation of the General Partner,(benefit from) provision for income taxes with the Common Stockamount computed by applying the statutory federal income tax rate to loss before income taxes for the years ended December 31, 2018, 2017 and 2016 (in thousands):
|
| | | | | | | | | | | | |
| | | Year Ended December 31, |
| | | 2018 | | 2017 | | 2016 |
| Income (loss) before taxes | | $ | 1,600 |
| | $ | (5,278 | ) | | $ | (134,774 | ) |
| Less: Income from non-taxable entities | | (685 | ) | | (9,523 | ) | | (9,008 | ) |
| Income (loss) attributable to taxable subsidiaries before income taxes | | $ | 915 |
|
| $ | (14,801 | ) |
| $ | (143,782 | ) |
| | | | | | | |
| Federal provision at statutory rate | | 192 |
| | (5,180 | ) | | (50,324 | ) |
| Impairment of goodwill | | — |
| | — |
| | 42,327 |
|
| Nondeductible portion of transaction costs and loss recognized on classification as held for sale | | (719 | ) | | 8,283 |
| | — |
|
| Impact of change in federal tax rate | | — |
| | 3,481 |
| | — |
|
| Impact of valuation allowance | | (1,158 | ) | | 6,165 |
| | — |
|
| State income taxes and other | | (410 | ) | | 1,090 |
| | (2,840 | ) |
| Total (benefit from) provision for income taxes - Cole Capital | | $ | (2,095 | ) |
| $ | 13,839 |
|
| $ | (10,837 | ) |
The following table presents the components of the Company.
In addition, as part of the contribution and exchange agreement, ARC Real Estate contributed $750,000 in cash to the ARCT IV OP, effective prior to the consummation of the ARCT IV Merger, in exchange(benefit from) provision for ARCT IV OP Units. Upon the consummation of the ARCT IV Merger, these equity units converted at an exchange ratio of 2.3961 Limited Partner OP Units per ARCT IV OP Unit, resulting in the Operating Partnership issuing 0.1 million Limited Partner OP Units to ARC Real Estate.
Accounting Treatmentincome taxes for the ARCT IV Mergeryears ended December 31, 2018, 2017 and 2016 (in thousands):
The Company and ARCT IV, from inception to the ARCT IV Merger Date, were considered to be entities under common control. Both entities’ advisors were wholly owned subsidiaries of AR Capital, LLC (“ARC”). ARC and its related parties had ownership interests in the Company and ARCT IV through the ownership of shares of common stock, OP Units and other equity interests. In addition, the advisors of both entities were contractually eligible to receive potential fees for their services to both of the companies, including asset management fees, incentive fees and other fees and had continued to receive fees from the OP prior to the Company’s transition to self-management. Due to the significance of these fees, the advisors and ultimately ARC were determined to have a significant economic interest in both companies in addition to having the power to direct the activities of the companies through advisory/management agreements, which qualified them as affiliated companies under common control in accordance with U.S. GAAP. The acquisition of an entity under common control is accounted for on the carryover basis of accounting, whereby the assets and liabilities of the companies are recorded upon the merger on the same basis as they were carried by the companies on the ARCT IV Merger Date. In addition, U.S. GAAP requires the Company to present historical financial information as of the earliest period of common control. Therefore, the accompanying consolidated financial statements, including the notes thereto, are presented as if the ARCT IV Merger, including the impact of the equity transactions entered into to consummate the merger, had occurred at the earliest period presented.Cole Real Estate Investments, Inc. Merger
On October 22, 2013, the Company and a wholly owned subsidiary entered into an agreement and plan of merger (the “Cole Merger Agreement”) with Cole, a publicly traded Maryland corporation. The Cole Merger Agreement provided for the merger of Cole with and into a wholly owned subsidiary of the Company (the “Cole Merger”). The Cole Merger was consummated on February 7, 2014 (the “Cole Acquisition Date”).
Pursuant to the terms of the Cole Merger Agreement, each share of common stock of Cole issued and outstanding immediately prior to the effectiveness of the Cole Merger, including unvested restricted stock units and performance stock units that vested in conjunction with the Cole Merger, other than shares owned by the Company, any subsidiary of the Company or any wholly owned subsidiary of Cole, was converted into the right to receive either (i) 1.0929 shares of the Company’s Common Stock (the “Stock Consideration”) or (ii) $13.82 in cash (the “Cash Consideration” and together with the Stock Consideration, the “Merger Consideration”). Holders of approximately 98% of outstanding Cole shares elected to receive the Stock Consideration and holders of approximately 2% of outstanding Cole shares elected to receive the Cash Consideration, pursuant to the terms of the Cole Merger Agreement, resulting in the Company issuing approximately 520.8 million shares of Common Stock and paying $181.8 million in cash to Cole’s shareholders based on their elections. In accordance with the LPA, the Operating Partnership issued a corresponding number of General Partner OP Units to the Company when shares of the Company’s Common Stock were issued to former common stockholders of Cole.
In addition, the Company issued approximately 2.8 million shares of Common Stock, in the aggregate, to certain executives of Cole pursuant to letter agreements entered into between the Company and such individuals, concurrently with the execution of the Cole Merger Agreement. Additionally, effective as of the Cole Acquisition Date, the Company issued, but had not yet allocated, 0.4 million shares with dividend equivalent rights commensurate with the Company’s Common Stock. In accordance with the LPA, the Operating Partnership issued a corresponding number of General Partner OP Units to the Company when shares of the Company’s Common Stock were issued to former executives of Cole. |
| | | | | | | | | | | | |
| | | Year Ended December 31, |
| | | 2018 | | 2017 | | 2016 |
| Current | | | | | | |
| Federal | | $ | (74 | ) | | $ | (120 | ) | | $ | 2,244 |
|
| State | | (166 | ) | | 602 |
| | (2,762 | ) |
| Total current (benefit from) provision for income taxes | | (240 | ) |
| 482 |
|
| (518 | ) |
| Deferred | | | | | | |
| Federal | | (1,756 | ) | | 12,016 |
| | (9,021 | ) |
| State | | (99 | ) | | 1,341 |
| | (1,298 | ) |
| Total deferred (benefit from) provision for income taxes | | (1,855 | ) |
| 13,357 |
| | (10,319 | ) |
| Total (benefit from) provision for income taxes - Cole Capital | | $ | (2,095 | ) |
| $ | 13,839 |
|
| $ | (10,837 | ) |
VEREIT, INC. ANDand VEREIT OPERATING PARTNERSHIP, L.P.
NOTES TO CONSOLIDATED FINANCIAL STATEMENTS
December 31, 20162018 – (Continued)
The fair value of the consideration transferred at the Cole Acquisition Date totaled $7.5 billion and consisted of the following (in thousands):
|
| | | |
| | As of Cole Acquisition Date |
| Fair value of consideration transferred: | |
| Cash | $ | 181,775 |
|
| Common Stock | 7,285,868 |
|
| Total consideration transferred | $ | 7,467,643 |
|
The fair value of the 520.8 million shares of Common Stock issued, excluding those shares of Common Stock transferred to former Cole executives, was determined based on the closing market price of the Company’s Common Stock on the Cole Acquisition Date.
Accounting Treatment for the Cole Merger
The Cole Merger has been accounted for under the acquisition method of accounting under U.S. GAAP. Under the acquisition method of accounting, the assets acquired and liabilities assumed from Cole were recorded as of the acquisition date at their respective fair values. Any excess of purchase price over the fair values was recorded as goodwill. Results of operations for Cole are included in the Company’s consolidated financial statements subsequent to the Cole Acquisition Date.
Purchase Price Allocation of Cole Merger
Initially, the purchase price for the acquisition was allocated to assets acquired and liabilities assumed based on their preliminary fair values. During the three months ended December 31, 2014, we identified certain measurement period adjustments that impacted the provisional accounting, which decreased the fair value of the identifiable management and advisory contracts with the Cole REITs and corresponding deferred tax liability by $80.4 million and $30.7 million, respectively, and an increase of $49.6 million to goodwill as of the Cole Acquisition Date. The following table summarizes the estimated fair values of the assets acquired and liabilities assumed at the Cole Acquisition Date (in thousands):
|
| | | | |
| | | As of Cole Acquisition Date |
| Identifiable assets acquired at fair value: |
| Land | | $ | 1,737,839 |
|
| Buildings, fixtures and improvements | | 5,901,827 |
|
| Acquired intangible lease assets | | 1,324,217 |
|
| Total real estate investments | | 8,963,883 |
|
| Investment in unconsolidated entities | | 103,966 |
|
| Investment securities, at fair value | | 151,197 |
|
| Loans held for investment, net | | 72,326 |
|
| Cash and cash equivalents | | 149,965 |
|
| Restricted cash | | 15,704 |
|
| Intangible assets | | 305,000 |
|
| Deferred costs and other assets | | 94,667 |
|
| Due from affiliates | | 3,301 |
|
| Total identifiable assets acquired | | $ | 9,860,009 |
|
VEREIT, INC. AND VEREIT OPERATING PARTNERSHIP, L.P.
NOTES TO CONSOLIDATED FINANCIAL STATEMENTS
December 31, 2016 – (Continued)
|
| | | | |
| | | As of Cole Acquisition Date |
| Identifiable liabilities assumed at fair value: |
| Mortgage notes payable, net | | $ | 2,706,585 |
|
| Credit facilities | | 1,309,000 |
|
| Other debt | | 49,013 |
|
| Below-market lease liabilities | | 212,433 |
|
| Accounts payable and accrued expenses | | 142,243 |
|
| Deferred rent, derivative and other liabilities | | 204,558 |
|
| Dividends payable | | 6,271 |
|
| Due to affiliates | | 44,242 |
|
| Total liabilities assumed | | 4,674,345 |
|
| | | |
| Non-controlling interests | | 24,766 |
|
| | | |
| Net identifiable assets acquired | | 5,160,898 |
|
| Goodwill | | 2,262,547 |
|
| Net assets acquired | | $ | 7,423,445 |
|
The fair values of real estate investments, including acquired lease intangibles, and below-market lease liabilities allocated to the REI segment were estimated by the Company with the assistance of a third-party valuation firm. The estimated fair values of these assets and liabilities total $9.0 billion and $212.4 million, respectively. The recorded values represent the estimated fair values related to such assets and liabilities. The fair value of the remaining Cole assets and liabilities were calculated in accordance with the Company’s policy on purchase price allocation, as disclosed in Note 2 – Summary of Significant Accounting Policies.
Goodwill of $1.7 billion was assigned to the REI segment. The goodwill recognized was attributed to the enhancement of the Company’s year-round rental revenue stream, realized and expected synergies, the impact of the merger on lowering the Company’s cost of capital, as well as the benefits of critical mass, improved portfolio diversification and enhanced access to capital markets. Goodwill of $608.5 million was assigned to the Cole Capital segment. The goodwill was primarily supported by management’s belief that Cole Capital brings an established management platform with numerous strategic benefits including growth from new income streams and the ability to offer new products. None of the goodwill is expected to be deductible for income tax purposes.
The amounts of revenue and net income related to Cole property acquisitions and Cole Capital included in the accompanying consolidated statements of operations from the Cole Acquisition Date to the period ended December 31, 2014 was $814.8 million and $47.3 million respectively.
The unaudited pro forma information in Note 5 –Real Estate Investments is presented as if Cole had been included in the consolidated results of the Company for the entire period ended December 31, 2014.
Cole Credit Property Trust, Inc. Merger
On March 17, 2014, the Company and a wholly owned subsidiary entered into an Agreement and Plan of Merger (the “CCPT Merger Agreement”) with CCPT. The CCPT Merger Agreement provided for the merger of CCPT with and into a direct subsidiary of the Company (the “CCPT Merger”). The CCPT Merger was consummated on May 19, 2014 (the “CCPT Acquisition Date”). The fair value of the consideration transferred at the CCPT Acquisition Date totaled $73.2 million, which was paid in cash.
Pursuant to the CCPT Merger Agreement, the Company commenced a cash tender offer to purchase all of the outstanding shares of common stock of CCPT (the “CCPT Common Stock”) (other than shares owned by CCPT, the Company or any subsidiary of the Company), upon the terms and subject to the conditions set forth in the Offer to Purchase, dated March 31, 2014, and the related Letter of Transmittal (together with any amendments or supplements to the foregoing, the “Offer”), at a price of $7.25 per share (the “Offer Price”), net to the seller in cash, without interest, less any applicable withholding tax. On May 19, 2014, the Company accepted for payment and paid for all shares of CCPT Common Stock that were validly tendered in the Offer. As of the expiration of the Offer, a total of 7,735,069 shares of CCPT Common Stock were validly tendered and not withdrawn, representing approximately 77% of the shares of CCPT Common Stock outstanding.
VEREIT, INC. AND VEREIT OPERATING PARTNERSHIP, L.P.
NOTES TO CONSOLIDATED FINANCIAL STATEMENTS
December 31, 2016 – (Continued)
Immediately following the acceptance for payment and payment for the shares of CCPT Common Stock that were validly tendered in the Offer, the Company exercised its option (the “Top-Up Option”), granted pursuant to the CCPT Merger Agreement, to purchase, at a price per share equal to the Offer Price, 13,457,874 newly issued shares of CCPT Common Stock (collectively, the “Top-Up Shares”). The Top-Up Shares, taken together with the shares of CCPT Common Stock owned, directly or indirectly, by the Company and its subsidiaries immediately following the acceptance for payment and payment for the shares of CCPT Common Stock that were validly tendered in the Offer, constituted one share more than 90% of the outstanding shares of CCPT Common Stock (after giving effect to the issuance of all shares subject to the Top-Up Option), the applicable threshold required to effect a short-form merger under applicable Maryland law without stockholder approval.
Following the consummation of the Offer and the exercise of the Top-Up Option, in accordance with the CCPT Merger Agreement, the Company completed its acquisition of CCPT by effecting a short-form merger under Maryland law, pursuant to which CCPT was merged with and into a subsidiary of the Company, with the subsidiary surviving the merger as a wholly owned subsidiary of the Company. The CCPT Merger became effective following the filing of the Articles of Merger with the State Department of Assessments and Taxation of Maryland and the filing of the Certificate of Merger with the Secretary of State of the State of Delaware with an effective date of May 19, 2014 (the “Effective Time”).
At the Effective Time, each share of CCPT Common Stock not purchased in the Offer (other than shares held by CCPT, the Company or any subsidiary of the Company, which were automatically canceled and retired and ceased to exist) was converted into the right to receive an amount, in cash and without interest, equal to the Offer Price.
Accounting Treatment for the CCPT Merger
The CCPT Merger has been accounted for under the acquisition method of accounting under U.S. GAAP. Under the acquisition method of accounting, the assets acquired and liabilities assumed from CCPT were recorded as of the acquisition date at their respective fair values. Any excess of purchase price over the fair values was recorded as goodwill. Results of operations for CCPT are included in the Company’s consolidated financial statements subsequent to the CCPT Acquisition Date.
Fair Value of Consideration Transferred
The fair value of the consideration transferred at the CCPT Acquisition Date totaled $73.2 million, which was paid in cash. The acquisition was funded by the Company through additional borrowings under its revolving credit facility.
Purchase Price Allocation of CCPT Acquisition
The consideration transferred pursuant to the CCPT Merger Agreement was allocated to the assets acquired and liabilities assumed based upon their preliminary estimated fair values as of the CCPT Acquisition Date. The following table summarizes the estimated fair values of the assets acquired and liabilities assumed as of the CCPT Acquisition Date (in thousands):
|
| | | | |
| | | As of CCPT Acquisition Date |
| Identifiable assets acquired at fair value: | | |
| Land | | $ | 28,258 |
|
| Buildings, fixtures and improvements | | 113,296 |
|
| Acquired intangible lease assets | | 17,960 |
|
| Total real estate investments | | 159,514 |
|
| Cash and cash equivalents | | 167 |
|
| Restricted cash | | 2,420 |
|
| Prepaid expenses and other assets | | 297 |
|
| Total identifiable assets acquired | | $ | 162,398 |
|
| | | |
VEREIT, INC. AND VEREIT OPERATING PARTNERSHIP, L.P.
NOTES TO CONSOLIDATED FINANCIAL STATEMENTS
December 31, 2016 – (Continued)
|
| | | | |
| | | As of CCPT Acquisition Date |
| Identifiable liabilities assumed at fair value: | | |
| Mortgage notes payable | | $ | 85,286 |
|
| Unsecured credit facility | | 800 |
|
| Accounts payable and accrued expenses | | 443 |
|
| Below-market lease liability | | 1,752 |
|
| Due to affiliates | | 568 |
|
| Deferred rent and other liabilities | | 390 |
|
| Total liabilities assumed | | 89,239 |
|
| Net identifiable assets acquired | | $ | 73,159 |
|
The fair value of real estate investments, including acquired lease intangibles, and below-market lease liabilities were estimated by the Company with the assistance of a third party valuation firm. The estimated fair value of these assets and liabilities total $159.5 million and $1.8 million, respectively. The recorded values represent the estimated fair values related to such assets and liabilities. The fair value of the remaining CCPT assets and liabilities were calculated in accordance with the Company’s policy on purchase price allocation, as disclosed in Note 2 – Summary of Significant Accounting Policies.
The amounts of revenue and net loss related to the CCPT Merger included in the accompanying consolidated statements of operations from the CCPT Acquisition Date to the period ended December 31, 2014 were $8.2 million and $1.8 million, respectively.
The unaudited pro forma information in Note 5 –Real Estate Investments is presented as if CCPT had been included in the consolidated results of the Company for the entire year ended December 31, 2014.
Abandoned Spin-off of Multi-Tenant Shopping Center Portfolio; Sale to Blackstone/DDR Joint Venture
On March 13, 2014, the Company announced its intention to spin off its multi-tenant shopping center business (the “MT Spin-off”) into a publicly traded REIT, American Realty Capital Centers, Inc., which was expected to operate under the name “ARCenters” and to trade on the NASDAQ Global Market under the symbol “ARCM.” The OP was expected to retain 25% ownership of ARCM. The MT Spin-off was expected to be effectuated through a pro rata taxable special distribution of one share of ARCM common stock for every 10 shares of the Company’s common stock and every 10 OP Units held by third parties in the OP. On April 4, 2014, ARCM filed a Registration Statement on Form 10 to register ARCM’s common stock, par value $0.01 per share, pursuant to Section 12(b) of the Exchange Act so that, upon consummation of the MT Spin-off, shares of ARCM received by holders of the Company’s common stock, or OP Units, as applicable, could freely trade their newly received ARCM common stock. ARCM was expected to be externally managed by the Company.
On May 21, 2014, the Company announced that it had reassessed its plans for the multi-tenant shopping center portfolio and entered into a letter of intent to sell such portfolio to an affiliate of Blackstone Real Estate Partners VII L.P. (“Blackstone”), expecting to finalize pertinent documentation related thereto within 30 days of such date. The properties included in such sale were the same properties that would have been spun off into ARCM and, consequently, the Company abandoned its proposed spin-off at such time. On June 11, 2014, indirect subsidiaries of the Company entered into an Agreement of Purchase and Sale with BRE DDR Retail Holdings III LLC (the “Blackstone/DDR Joint Venture”), an entity indirectly jointly owned by affiliates of Blackstone and DDR Corp. (“DDR”), pursuant to which the parties subsequently consummated the sale of the Company’s multi-tenant shopping center portfolio. See Note 5 –Real Estate Investments for further discussion on the sale of the properties, which closed on October 17, 2014.
Note 7 – Investment Securities, at Fair Value
Investment securities are considered available-for-sale and, therefore, increases or decreases in the fair value of these investments are recorded in accumulated other comprehensive income (loss) as a component of equity in the consolidated balance sheets unless the securities are considered to be other-than-temporarily impaired at which time the losses are reclassified to expense.
VEREIT, INC. AND VEREIT OPERATING PARTNERSHIP, L.P.
NOTES TO CONSOLIDATED FINANCIAL STATEMENTS
December 31, 2016 – (Continued)
The following tables detail the unrealized gains and losses on investment securities as of December 31, 2016 and December 31, 2015 (in thousands):
|
| | | | | | | | | | | | | | | | |
| | | December 31, 2016 |
| | | Amortized Cost | | Gross Unrealized Gains | | Gross Unrealized Losses | | Fair Value |
| CMBS | | $ | 48,297 |
| | $ | 1,248 |
| | $ | (2,330 | ) | | $ | 47,215 |
|
|
| | | | | | | | | | | | | | | | |
| | | December 31, 2015 |
| | Amortized Cost | | Gross Unrealized Gains | | Gross Unrealized Losses | | Fair Value |
| CMBS | | $ | 52,115 |
| | $ | 2,169 |
| | $ | (980 | ) | | $ | 53,304 |
|
As of December 31, 2016 and December 31, 2015, the Company owned eight and ten CMBS, respectively, with an estimated aggregate fair value of $47.2 million and $53.3 million, respectively. During the year ended December 31, 2016, two CMBS with a combined carrying value of less than $0.1 million at December 31, 2015, were paid in full or reached maturity. The consideration received approximated carrying value. The Company generally receives monthly payments of principal and interest on the CMBS. As of December 31, 2016, the Company earned interest on the CMBS at rates ranging between 5.88% and 8.95%. As of December 31, 2016, the fair value of five CMBS were below their amortized cost. In estimating other-than-temporary impairment losses, management considers a variety of factors, including: (i) whether the Company has the intent to sell the impaired security, (ii) whether the Company expects to hold the investment for a period of time sufficient to allow for anticipated recovery in fair value, and (iii) whether the company expects to recover the entire amortized cost basis of the security. The Company believes that none of the unrealized losses on investment securities are other-than-temporary as management expects the Company will fully recover the entire amortized cost basis of all securities. As of December 31, 2016, the Company had no other-than-temporary impairment losses.
In connection with the Cole Merger, the Company acquired 15 CMBS with an estimated aggregate fair value of $151.2 million. In September of 2014, the Company sold the 15 CMBS acquired in the Cole Merger for proceeds of $158.0 million, and recorded a gain of $6.2 million, which is included in other income, net in the accompanying consolidated statements of operations. During the year ended December 31, 2015, the Company recorded a $65,000 gain on the sale of investment securities, which is included in other income, net in the accompanying consolidated statements of operations. No such gain was recorded for the year ended December 31, 2016.
The scheduled maturity of the Company’s CMBS as of December 31, 2016 are as follows (in thousands):
|
| | | | | | | | |
| | | December 31, 2016 |
| | | Amortized Cost | | Fair Value |
| Due within one year | | $ | — |
| | $ | — |
|
| Due after one year through five years | | 21,408 |
| | 22,301 |
|
| Due after five years through 10 years | | 12,836 |
| | 10,531 |
|
| Due after 10 years | | 14,053 |
| | 14,383 |
|
| Total | | $ | 48,297 |
|
| $ | 47,215 |
|
Note 8 – Mortgage Notes Receivable
As of December 31, 2016, the Company owned nine mortgage notes receivable with a weighted-average interest rate of 6.3% and weighted-average years to maturity of 13.0 years. During the year ended December 31, 2016, one note with a carrying value of $0.4 million at December 31, 2015, reached maturity and was paid in full. The following table details the mortgage notes receivable as of December 31, 2016 (dollar amounts in thousands):
|
| | | | | | | | | | | | | | | |
| Outstanding Balance | | Carrying Value | | Interest Rate Range | | Maturity Date Range |
| $ | 24,776 |
| | $ | 22,764 |
| | 5.9 | % | – | 7.2% | | May 2020 | – | January 2033 |
VEREIT, INC. AND VEREIT OPERATING PARTNERSHIP, L.P.
NOTES TO CONSOLIDATED FINANCIAL STATEMENTS
December 31, 2016 – (Continued)
The Company’s mortgage notes receivable are comprised primarily of fully-amortizing or nearly fully-amortizing first mortgage loans. The Company has one mortgage note receivable where the Company does not receive monthly payments of principal and interest but rather the interest is capitalized into the outstanding balance that is due at maturity. The mortgage notes receivable are primarily on commercial real estate, each leased to a single tenant. Therefore, the Company’s monitoring of the credit quality of its mortgage notes receivable is focused primarily on an analysis of the tenant, including review of tenant quality and ratings, trends in the tenant’s industry and general economic conditions and an analysis of measures of collateral coverage, such as an estimate of the loan-to-value ratio (principal amount outstanding divided by the estimated value of the property) and its remaining term until maturity.
The following table summarizes the scheduled aggregate principal payments due to the Company on the mortgage notes receivable subsequent to December 31, 2016 (in thousands):
|
| | | | |
| | | Outstanding Balance |
| Due within one year | | $ | 1,104 |
|
| Due after one year through five years | | 5,363 |
|
| Due after five years through 10 years | | 7,018 |
|
Due after 10 years(1) | | 15,154 |
|
| Total | | $ | 28,639 |
|
| |
(1) | Includes additional $3.9 million of interest that will be capitalized into the outstanding balance of the mortgage note receivable subsequent to December 31, 2016. |
Unsecured Note Reserve
During the year ended December 31, 2015, the Company assessed the collectability of an unsecured note held with an affiliate of the Former Manager after the December debt service payment was not paid. The Company assessed the liquidity of the borrower, the lien position of the note and the other obligations of the borrower. Based on the analysis, the Company concluded that it was unlikely that the unsecured note will be repaid and recorded a reserve for loan loss equal to the $15.3 million carrying value of the note for the three months ended December 31, 2015. No principal or interest payments have been received relating to the unsecured note during the year ended December 31, 2016.
Note 9 – Rent and Tenant Receivables and Other Assets, Net
Rent and tenant receivables and other assets, net consisted of the following as of December 31, 20162018 and December 31, 20152017 (in thousands):
|
| | | | | | | | |
| | | December 31, 2016 | | December 31, 2015 |
Accounts receivable, net (1) | | $ | 49,148 |
| | $ | 44,798 |
|
| Straight-line rent receivable | | 201,584 |
| | 161,079 |
|
Deferred costs, net (2) | | 16,154 |
| | 26,110 |
|
| Prepaid expenses | | 6,814 |
| | 9,773 |
|
Leasehold improvements, property and equipment, net (3) | | 14,702 |
| | 18,180 |
|
| Restricted escrow deposits | | 5,741 |
| | 1,190 |
|
| Deferred tax asset and tax receivable | | 31,113 |
| | 25,287 |
|
Program development costs, net (4) | | 3,161 |
| | 12,855 |
|
| Interest rate swap assets, at fair value | | 199 |
| | 1,892 |
|
Other assets, net (5) | | 2,089 |
| | 2,473 |
|
| Total | | $ | 330,705 |
|
| $ | 303,637 |
|
|
| | | | | | | | |
| | | December 31, 2018 | | December 31, 2017 |
| | | | | |
Straight-line rent receivable, net (1) | | $ | 259,106 |
| | $ | 230,529 |
|
Accounts receivable, net (2) | | 36,939 |
| | 36,921 |
|
Deferred costs, net (3) | | 17,515 |
| | 5,746 |
|
| Investment in direct financing leases, net | | 13,254 |
| | 19,539 |
|
Mortgage notes receivable, net (4) | | 10,164 |
| | 20,294 |
|
Leasehold improvements, property and equipment, net (5) | | 9,754 |
| | 12,089 |
|
| Investment in Cole REITs | | 7,844 |
| | 3,264 |
|
| Prepaid expenses | | 5,022 |
| | 6,493 |
|
| Other assets, net | | 3,594 |
| | 5,003 |
|
| Income tax receivable | | 1,760 |
| | 3,213 |
|
| Restricted escrow deposits | | 1,140 |
| | 4,995 |
|
Investment securities, at fair value(6) | | — |
| | 40,974 |
|
| Total | | $ | 366,092 |
|
| $ | 389,060 |
|
| |
| (1) | Allowance for doubtfuluncollectible accounts included in straight-line rent receivable, net was $6.0$1.0 million and $6.6$2.0 million as of December 31, 20162018 and 2017, respectively. As of December 31, 2015,2018, the allowance related to suspended revenue recognition was $0.1 million. As of December 31, 2017, there was no allowance related to suspended revenue recognition. |
| |
| (2) | In the event that the collectability of a receivable is uncertain, the Company will record an increase in the allowance for uncollectible accounts in the consolidated balance sheets and bad debt expense in property operating expenses in the consolidated statements of operations. Allowance for uncollectible accounts was $5.3 million and $6.3 million as of December 31, 2018 and 2017, respectively. The Company suspends revenue recognition when the collectability of amounts due pursuant to a lease is no longer reasonably assured. As of December 31, 2018 and 2017, the allowance related to suspended revenue recognition was $9.1 million and $12.6 million, respectively. |
| |
(2)(3) | Amortization expense for deferred costs related to the revolving credit facilityfacilities totaled $7.3 million for the year ended December 31, 2018 and $10.4 million $10.7 million and $10.8 million for each of the years ended December 31, 2016, 20152017 and 2014, respectively.2016. Accumulated amortization for deferred costs related to the revolving credit facility were $29.8Revolving Credit Facility, as defined in Note 7 –Debt, was $47.6 million and $19.4$40.3 million as of December 31, 20162018 and December 31, 2015, respectively. |
VEREIT, INC. AND VEREIT OPERATING PARTNERSHIP, L.P.
NOTES TO CONSOLIDATED FINANCIAL STATEMENTS
December 31, 2016 – (Continued)
| |
(3) | Amortization expense for leasehold improvements totaled $2.3 million, $2.2 million and $1.3 million for the years ended December 31, 2016, 2015 and 2014, respectively, inclusive of write offs of $1.0 million for the year ended December 31, 2016. Accumulated amortization was $3.5 million and $2.6 million as of December 31, 2016 and December 31, 2015, respectively. Depreciation expense for property and equipment totaled $3.4 million, $2.1 million and $1.6 million for the years ended December 31, 2016, 2015 and 2014, respectively, inclusive of write offs of $1.2 million for the year ended December 31, 2016. Accumulated depreciation was $3.9 million and $3.7 million as of December 31, 2016 and December 31, 2015,2017, respectively.
|
| |
| (4) | As of December 31, 20162018, the Company owned five mortgage notes receivable with a weighted-average interest rate of 6.4% and weighted-average years to maturity of 12.1 years. During the year ended December 31, 2015,2018, the Company had reservessold three mortgage notes receivable with an aggregate carrying value of $31.7$8.8 million and $34.8at December 31, 2017, resulting in a net gain of $1.7 million, respectively, relating towhich is included in other income, net in the program development costs.accompanying consolidated statements of operations. |
| |
| (5) | NetAmortization expense for leasehold improvements totaled $1.2 million for each of $1.6the years ended December 31, 2018 and 2017, with no related write-offs. Amortization expense for leasehold improvements totaled $2.3 million for the year ended December 31, 2016, inclusive of interest receivable reserveswrite-offs of $1.0 million. Accumulated amortization was $5.9 million and $4.7 million as of December 31, 2016. No such reserves were recorded at2018 and 2017, respectively. Depreciation expense for property and equipment totaled $2.3 million, $1.8 million and $3.4 million for the years ended December 31, 2015.2018, 2017 and 2016, respectively, inclusive of write-offs of $0.8 million, $0.6 million and $1.2 million for the years ended December 31, 2018, 2017 and 2016, respectively. Accumulated depreciation was $7.0 million and $5.7 million as of December 31, 2018 and 2017, respectively. |
| |
| (6) | During the year ended December 31, 2018, two commercial mortgage-backed securities (“CMBS”) were repaid and six CMBS were sold for an aggregate gross sales price of $36.0 million for a net realized loss of $2.2 million, which is included in other income, net in the accompanying consolidated statements of operations. |
Note 106 – Fair Value Measures
The Company determines fair value based on quoted prices when available or through the use of alternative approaches, such as discounting the expected cash flows using market interest rates commensurate with the credit quality and duration of the investment. U.S. GAAP guidance defines three levels of inputs that may be used to measure fair value:
Level 1 – Quoted prices in active markets for identical assets and liabilities that the reporting entity has the ability to access at the measurement date.
Level 2 – Inputs other than quoted prices included within Level 1 that are observable for the asset and liability or can be corroborated with observable market data for substantially the entire contractual term of the asset or liability.
Level 3 – Unobservable inputs reflect the entity’s own assumptions about the assumptions that market participants would use in the pricing of the asset or liability and are consequently not based on market activity, but rather through particular valuation techniques.
VEREIT, INC. and VEREIT OPERATING PARTNERSHIP, L.P.
NOTES TO CONSOLIDATED FINANCIAL STATEMENTS
December 31, 2018 – (Continued)
The determination of where an asset or liability falls in the hierarchy requires significant judgment and considers factors specific to the asset or liability. In instances where the determination of the fair value measurement is based on inputs from different levels of the fair value hierarchy, the level in the fair value hierarchy within which the entire fair value measurement falls is based on the lowest level input that is significant to the fair value measurement in its entirety. The Company evaluates its hierarchy disclosures each quarter and depending on various factors, it is possible that an asset or liability may be classified differently from quarter to quarter. Changes in the type of inputs may result in a reclassification for certain assets. There were no transfers between Level 1, Level 2 or Level 3 of the fair value hierarchy during the year ended December 31, 2016. The Company expectsdoes not expect that changes in classifications between levels will be infrequent.frequent.
Items Measured at Fair Value on a Recurring Basis
The following tables present information about the Company’s assets and liabilities measured at fair value on a recurring basis based on market rates of the Company’s positions and other observable interest rates as discussed in Note 7 – Investment Securities, at Fair Value andNote 12 –Derivatives and Hedging Activities, as of December 31, 20162018 and December 31, 2015,2017, aggregated by the level in the fair value hierarchy within which those instruments fall (in thousands):
|
| | | | | | | | | | | | | | | | |
|
| Level 1 |
| Level 2 |
| Level 3 |
| Balance as of December 31, 2016 |
| Assets: |
|
|
|
|
|
|
|
|
| CMBS | | $ | — |
| | $ | — |
| | $ | 47,215 |
| | $ | 47,215 |
|
| Interest rate swap assets |
| — |
| | 199 |
| | — |
|
| 199 |
|
| Total assets | | $ | — |
| | $ | 199 |
| | $ | 47,215 |
| | $ | 47,414 |
|
| Liabilities: | | | | | | | | |
| Derivative liabilities |
| $ | — |
| | $ | (3,547 | ) | | $ | — |
|
| $ | (3,547 | ) |
|
|
| Level 1 |
| Level 2 |
| Level 3 |
| Balance as of December 31, 2015 |
| Assets: | | | | | | | | |
| CMBS | | $ | — |
| | $ | — |
| | $ | 53,304 |
| | $ | 53,304 |
|
| Derivative assets | | — |
| | 1,892 |
| | — |
| | 1,892 |
|
| Total assets | | $ | — |
| | $ | 1,892 |
| | $ | 53,304 |
| | $ | 55,196 |
|
| Liabilities: | | | | | | | | |
| Derivative liabilities | | $ | — |
| | $ | (6,922 | ) | | $ | — |
| | $ | (6,922 | ) |
VEREIT, INC. AND VEREIT OPERATING PARTNERSHIP, L.P.
NOTES TO CONSOLIDATED FINANCIAL STATEMENTS
December 31, 2016 – (Continued)
|
| | | | | | | | | | | | | | | | |
|
| Level 1 |
| Level 2 |
| Level 3 |
| Balance as of December 31, 2018 |
| Assets: |
|
|
|
|
|
|
|
|
| Derivative assets |
| $ | — |
| | $ | 544 |
| | $ | — |
|
| $ | 544 |
|
| Investment in Cole REITs | | — |
| | — |
| | 7,844 |
| | 7,844 |
|
| Total assets | | $ | — |
| | $ | 544 |
| | $ | 7,844 |
| | $ | 8,388 |
|
|
|
| Level 1 |
| Level 2 |
| Level 3 |
| Balance as of December 31, 2017 |
| Assets: | | | | | | | | |
| CMBS | | $ | — |
| | $ | — |
| | $ | 40,974 |
| | $ | 40,974 |
|
| Derivative assets | | — |
| | 627 |
| | — |
| | 627 |
|
| Total assets | | $ | — |
| | $ | 627 |
| | $ | 40,974 |
| | $ | 41,601 |
|
CMBS – The Company’s CMBS arewere carried at fair value and arewere valued using Level 3 inputs. The Company used estimated non-binding quoted market prices from the trading desks of financial institutions that are dealers in such securities for similar CMBS tranches that actively participate in the CMBS market. Broker quotes are only indicative of fair value and may not necessarily represent what the Company would receive in an actual trade for the applicable instrument. Management determinesdetermined that the prices arewere representative of fair value through its knowledge of and experience in the market. The significant unobservable input used in valuing the CMBS iswas the discount rate or market yield used to discount the estimated future cash flows expected to be received from the underlying investment, which include both future principal and interest payments. Significant increases or decreases in the discount rate or market yield would result in a decrease or increase in the fair value measurement. The following risks arewere included in the consideration and selection of discount rates or market yields: risk of default, rating of the investment and comparable company investments.
Derivative Assets and Liabilities – The Company’s derivative financial instruments relate to interest rate swaps, discussed in Note 12 –Derivatives and Hedging Activities.swaps. The valuation of derivative instruments is determined using a discounted cash flow analysis on the expected cash flows of each derivative. This analysis reflects the contractual terms of the derivatives, including the period to maturity, as well as observable market-based inputs, including interest rate curves and implied volatilities. In addition, credit valuation adjustments are incorporated into the fair values to account for the Company’s potential nonperformance risk and the performance risk of the counterparties.
Although the Company has determined that the majority of the inputs used to value its derivatives fall within Level 2 of the fair value hierarchy, the credit valuation adjustments associated with those derivatives utilize Level 3 inputs, such as estimates of current credit spreads to evaluate the likelihood of default by the Company and its counterparties. However, as of December 31, 2016,2018 and 2017, the Company has assessed the significance of the impact of the credit valuation adjustments on the overall valuation of its derivative positions and has determined that the credit valuation adjustments are not significant to the overall valuation of the Company’s derivatives. As a result, the Company has determined that its derivative valuations in their entirety are classified in Level 2 of the fair value hierarchy.
VEREIT, INC. and VEREIT OPERATING PARTNERSHIP, L.P.
NOTES TO CONSOLIDATED FINANCIAL STATEMENTS
December 31, 2018 – (Continued)
Investment in Cole REITs –The fair values of CCIT II and CCPT V were estimated using the net asset value per share. The Company determined that the CCIT III per share primary offering price net of short-term financial instruments such as cashselling commissions and cash equivalents, restricted cash, duedealer manager fees approximated fair value. Each of the Cole REIT’s share redemption programs includes restrictions that limit the number of shares redeemed by the respective Cole REIT. CCIT II has estimated that it will commence a liquidity event over the next three to affiliates and accounts payable approximate their carrying value infive years. CCPT V has estimated that it will commence a liquidity event over the accompanying consolidated balance sheets duenext three to their short-term nature and are classified as Level 1 undersix years following the fair value hierarchy.termination of its initial public offering. CCIT III has estimated that it will commence a liquidity event five to seven years following the termination of its initial public offering. Subsequent to December 31, 2018, CCIT III terminated its primary offering, however it continues to issue shares pursuant to its distribution reinvestment plan.
The following are reconciliations of the changes in assets and liabilities with Level 3 inputs in the fair value hierarchy for the yearsyear ended December 31, 20162018 (in thousands):
|
| | | | | | | | |
| | | CMBS | | Investment in Cole REITs (1) |
| Beginning balance, January 1, 2018 | | $ | 40,974 |
| | $ | 3,264 |
|
| Total gains and losses | | | | |
| Unrealized loss included in other comprehensive income, net | | (205 | ) | | — |
|
| Realized loss included in other income, net | | (34 | ) | | — |
|
| Unrealized gain included in other income, net | | — |
| | 5,102 |
|
| Purchases, issuance, settlements | | | | |
| Return of principal received | | (4,864 | ) | | — |
|
| Amortization included in net income, net | | 157 |
| | — |
|
| Sale of investments | | (36,028 | ) | | (522 | ) |
| Ending Balance, December 31, 2018 | | $ | — |
| | $ | 7,844 |
|
| |
| (1) | As discussed in Note 2 – Summary of Significant Accounting Policies, as of December 31, 2017, the Company accounted for its investment in Cole REITs using the equity method of accounting. Subsequent to the sale of Cole Capital, the Company retained interests in CCIT II, CCIT III and CCPT V, which were carried at fair value as of December 31, 2018. |
The following are reconciliations of the changes in assets and 2015liabilities with Level 3 inputs in the fair value hierarchy for the year ended December 31, 2017 (in thousands):
|
| | | | |
| | | CMBS |
| Beginning balance, January 1, 2016 | | $ | 53,304 |
|
| Total gains and losses: | | |
| Unrealized loss included in other comprehensive income, net | | (2,271 | ) |
| Purchases, issuances, settlements and amortization: | | |
| Principal payments received | | (4,077 | ) |
| Amortization included in net income | | 259 |
|
| Ending balance, December 31, 2016 | | $ | 47,215 |
|
|
| | | | |
| | | CMBS |
| Beginning balance, January 1, 2017 | | $ | 47,215 |
|
| Total gains and losses | | |
| Unrealized loss included in other comprehensive income, net | | (951 | ) |
| Purchases, issuance, settlements | | |
| Return of principal received | | (4,388 | ) |
| Amortization included in net income, net | | (902 | ) |
| Ending Balance, December 31, 2017 | | $ | 40,974 |
|
|
| | | | |
| | | CMBS |
| Beginning balance, January 1, 2015 | | $ | 58,646 |
|
| Total gains and losses: | | |
| Unrealized loss included in other comprehensive income, net | | (977 | ) |
| Purchases, issuances, settlements and amortization: | | |
| Principal payments received | | (4,504 | ) |
| Amortization included in net income | | 139 |
|
| Ending balance, December 31, 2015 | | $ | 53,304 |
|
VEREIT, INC. ANDand VEREIT OPERATING PARTNERSHIP, L.P.
NOTES TO CONSOLIDATED FINANCIAL STATEMENTS
December 31, 20162018 – (Continued)
The fair values of the Company’s financial instruments that are not reported at fair value in the consolidated balance sheets are reported below (dollar amounts in thousands):
|
| | | | | | | | | | | | | | | | | | |
| | | Level | | Carrying Amount at December 31, 2016 | | Fair Value at December 31, 2016 | | Carrying Amount at December 31, 2015 | | Fair Value at December 31, 2015 |
| Assets: | | | | | | | | | | |
| Mortgage notes receivable | | 3 | | $ | 22,764 |
| | $ | 30,460 |
| | $ | 24,238 |
| | $ | 31,842 |
|
| | | | | | | | | | | |
Liabilities (1): | | | | | | | | | | |
| Mortgage notes payable and other debt, net | | 2 | | $ | 2,687,739 |
| | $ | 2,713,155 |
| | $ | 3,133,005 |
| | $ | 3,240,153 |
|
| Corporate bonds, net | | 2 | | 2,248,063 |
| | 2,273,850 |
| | 2,547,255 |
| | 2,580,786 |
|
| Convertible debt, net | | 2 | | 987,106 |
| | 1,004,733 |
| | 982,217 |
| | 1,007,042 |
|
| Credit facility | | 2 | | 500,000 |
| | 500,000 |
| | 1,460,000 |
| | 1,536,264 |
|
| Total liabilities | | | | $ | 6,422,908 |
| | $ | 6,491,738 |
| | $ | 8,122,477 |
| | $ | 8,364,245 |
|
| |
(1) | Current and prior period liabilities’ carrying and fair values exclude net deferred financing costs. |
Mortgage notes receivable – The fair value of the Company’s fixed-rate loan portfolio is estimated with a discounted cash flow analysis, utilizing scheduled cash flows and discount rates estimated by management to approximate market interest rates.
Debt – The fair value is estimated by an independent third party using a discounted cash flow analysis, based on management’s estimates of observable market interest rates. Corporate bonds and convertible debt are valued using quoted market prices in active markets with limited trading volume when available.
Items Measured at Fair Value onConvertible Debt
Summary and Obligations
During the year ended December 31, 2018, the Company’s 2018 Convertible Notes matured and the principal outstanding of $597.5 million, plus accrued and unpaid interest thereon, was repaid with proceeds from the Revolving Credit Facility.
As of December 31, 2018, the Company had $402.5 million aggregate principal amount outstanding of convertible senior notes due December 15, 2020 (the “2020 Convertible Notes”). The OP has issued corresponding identical convertible notes to the General Partner. There were no changes to the terms of the 2020 Convertible Notes and the Company believes that it was in compliance with the financial covenants pursuant to the indenture governing the 2020 Convertible Notes as of December 31, 2018.
Mortgage Notes Payable and Other Debt
Summary and Obligations
As of December 31, 2018, we had non-recourse mortgage indebtedness of $1.9 billion, which was collateralized by 459 properties, reflecting a Non-Recurring Basis
Certain financial and nonfinancial assets and liabilities are measured at fair value on a nonrecurring basis and are subject to fair value adjustments in certain circumstances, such as when there is evidencedecrease from December 31, 2017 of impairment.
Real Estate Assets
As discussed in Note 5 –Real Estate Investments,$153.9 million derived primarily from our disposition activity during the year ended December 31, 2016, real estate assets related to 153 properties were deemed to be impaired and their carrying values were reduced to their estimated fair value of $485.4 million, resulting in impairment charges of $182.8 million. During2018. Our mortgage indebtedness bore interest at the year ended December 31, 2015, real estate assets related to 202 properties were deemed to be impaired and their carrying values were reduced to their estimated fair value of $248.3 million, resulting in impairment charges of $91.8 million. During the year ended December 31, 2014, real estate assets related to 16 properties were deemed to be impaired and their carrying values were reduced to their estimated fair values of $99.0 million, resulting in impairment charges of $100.5 million. The Company estimates fair values using Level 3 inputs and using a combined income and market approach, specifically using discounted cash flow analysis and recent comparable sales transactions. The evaluation of real estate assets for potential impairment requires the Company’s management to exercise significant judgment and to make certain key assumptions, including, but not limited to, the following: (1) capitalization rate; (2) discount rates; (3) number of years property will be held; (4) property operating expenses; and (5) re-leasing assumptions including number of months to re-lease, market rental income and required tenant improvements. There are inherent uncertainties in making these estimates such as market conditions and performance and sustainability of the Company’s tenants. For the Company’s impairment tests for the real estate assets during the year ended December 31, 2016, the Company used a range of discount rates from of 6.7% to 9.0% with a weighted-average rate of 8.0%4.93% per annum and capitalization rates from 6.7% to 12.5% withhad a weighted-average ratematurity of 7.9%.3.4 years. We may in the future incur additional mortgage debt on the properties we currently own or use long-term non-recourse financing to acquire additional properties.
The following table presents the impairment charges by asset class recorded during the years ended December 31, 2016payment terms of our loan obligations vary. In general, only interest amounts are payable monthly with all unpaid principal and 2015 (dollar amounts in thousands):interest due at maturity. Some of our loan agreements require that we comply with specific reporting and financial covenants mainly related to debt coverage ratios and loan-to-value ratios. Each loan that has these requirements has specific ratio thresholds that must be met.
Restrictions on Loan Covenants |
| | | | | | | | | |
| | | Year Ended December 31, 2016 | | Year Ended December 31, 2015 | |
| Properties impaired | | 153 |
| | 202 |
| (1) |
| | | | | | |
| Asset classes impaired: | | | | | |
| Investment in real estate assets, net | | $ | 183,240 |
| | $ | 88,465 |
| |
| Investment in direct financing leases, net | | — |
| | 4,020 |
| |
| Below-market lease liabilities, net | | (421 | ) | | (730 | ) | |
| Total impairment loss | | $ | 182,819 |
|
| $ | 91,755 |
| |
| |
(1) | Includes 101 properties disposed of during the year ended December 31, 2016. |
VEREIT, INC. AND VEREIT OPERATING PARTNERSHIP, L.P.
NOTES TO CONSOLIDATED FINANCIAL STATEMENTS
December 31, 2016 – (Continued)
Goodwill and Intangible Assets
The Company tested the goodwill allocated to the Cole Capital reporting unit for impairment and recorded goodwill impairment charges of $120.9 million, $139.7 million and $223.1 million for the years ended December 31, 2016, 2015 and 2014, respectively. The Company also tested the goodwill allocated to the REI reporting unit for impairment during the years ended December 31, 2016, 2015 and 2014. The fair values of the REI reporting unit were estimated by management to be $18.3 billion, $19.7 billion and $20.4 billion at the 2016, 2015, and 2014 measurement dates, respectively, which exceeded the carrying values by 21.0%, 13.0% and 5.5%, respectively. As such, no goodwill impairment was recorded during the years ended December 31, 2016, 2015 or 2014 to the REI reporting unit.
In connection with the annual goodwill impairment test, the fair value of the intangible assets were also analyzed, as discussed in Note 4 – Goodwill and Other Intangibles. Based on this analysis, there were no impairment charges recorded for the year ended December 31, 2016. The Company recorded impairment charges of $73.7 million and $86.4 million for the years ended December 31, 2015 and 2014, respectively.
The Company estimated the fair value of the two reporting units, REI and Cole Capital, using both the income and market approach in evaluating goodwill for impairment. The assumptions utilized in the income approach include, but are not limited to, revenue growth rates, future cash flows and a discount rate. The assumptions utilized in the market approach include, but are not limited to, future cash flows, the selection of comparable companies and measures of operating results and pricing multiples. AFFO and EBITDA multiples for market comparable companies were used to estimate the fair value of the REI and Cole Capital reporting units, respectively, by applying those multiples to the projected financial information prepared by management.
The uncertainties associated with the fair value assumptions for Cole Capital include, but are not limited to: (i) the Company’s ability to timely reinstate certain selling agreements that were suspended as a result of the Audit Committee Investigation and the resulting restatements, (ii) the timing and extent of capital raised and deployed on behalf of the Cole REITs, (iii) the actual timing of closing an offering or executing a liquidity event on behalf of a Cole REIT, and (iv) operations of future managed real estate programs. The uncertainties associated with the fair value assumptions for the goodwill allocated to the REI reporting unit are the same as the uncertainties for real estate assets.
If all other assumptions were held constant, increasing the discount rate by 1.0% for Cole Capital would increase the 2016 goodwill impairment charge by approximately $6.5 million or 5.4%. If all other assumptions were held constant, increasing the discount rate by 1.0% would decrease the percentage that the 2016 fair value exceeds the 2016 carrying value of the REI reporting unit from 21.0% to 8.6%.
VEREIT, INC. AND VEREIT OPERATING PARTNERSHIP, L.P.
NOTES TO CONSOLIDATED FINANCIAL STATEMENTS
December 31, 2016 – (Continued)
Note 11 – Debt
As of December 31, 2016, the Company had $6.4 billion of debt outstanding, including net premiums and net deferred financing costs, with a weighted-average years to maturity of 4.4 years and a weighted-average interest rate of 4.2%. The following table summarizes the carrying value of debt as of December 31, 2016 and December 31, 2015, and the debt activity for the year ended December 31, 2016 (in thousands):
|
| | | | | | | | | | | | | | | | | | | | | |
| | | | | | Year Ended December 31, 2016 | | |
| | | | Balance as of December 31, 2015 | | Debt Issuances | | Repayments, Extinguishment and Assumptions | | Accretion and Amortization | | Balance as of December 31, 2016 |
| Mortgage notes payable: | | | | | | | | | | |
| | Outstanding balance | | $ | 3,039,882 |
| | $ | 3,112 |
| | $ | (413,045 | ) |
| $ | — |
| | $ | 2,629,949 |
|
| | Net premiums (1) | | 59,402 |
| | — |
| | (2,313 | ) | | (20,338 | ) | | 36,751 |
|
| | Deferred costs | | (21,020 | ) | | (27 | ) | | 522 |
| | 3,892 |
| | (16,633 | ) |
| Other debt: | | | | | | | | | |
|
|
| | Outstanding balance | | 33,463 |
| | — |
| | (12,516 | ) | | — |
| | 20,947 |
|
| | Premium (1) | | 258 |
| | — |
| | — |
| | (166 | ) | | 92 |
|
| Mortgages and other debt, net | | 3,111,985 |
|
| 3,085 |
|
| (427,352 | ) |
| (16,612 | ) |
| 2,671,106 |
|
| Corporate bonds: | | | | | | | | | |
|
|
| | Outstanding balance | | 2,550,000 |
| | 1,000,000 |
| | (1,300,000 | ) | | — |
| | 2,250,000 |
|
| | Discount (2) | | (2,745 | ) | | — |
| | 73 |
| | 735 |
| | (1,937 | ) |
| | Deferred costs | | (10,922 | ) | | (17,137 | ) | | 1,898 |
| | 4,322 |
| | (21,839 | ) |
| Corporate bonds, net | | 2,536,333 |
|
| 982,863 |
|
| (1,298,029 | ) |
| 5,057 |
|
| 2,226,224 |
|
| Convertible debt: | | | | | | | | | |
|
|
| | Outstanding balance | | 1,000,000 |
| | — |
| | — |
| | — |
| | 1,000,000 |
|
| | Discount (2) | | (17,779 | ) | | — |
| | — |
| | 4,885 |
| | (12,894 | ) |
| | Deferred costs | | (19,327 | ) | | — |
| | — |
| | 5,561 |
| | (13,766 | ) |
| Convertible debt, net | | 962,894 |
|
| — |
|
| — |
|
| 10,446 |
|
| 973,340 |
|
| Credit facility: | | | | | | | | | |
|
|
| | Outstanding balance | | 1,460,000 |
| | 1,033,000 |
| | (1,993,000 | ) | | — |
| | 500,000 |
|
| | Deferred costs (3) | | (11,410 | ) | | — |
| | 4,313 |
| | 3,675 |
| | (3,422 | ) |
| Credit facility, net | | 1,448,590 |
|
| 1,033,000 |
|
| (1,988,687 | ) |
| 3,675 |
|
| 496,578 |
|
| 2016 Term Loan: | | | | | | |
| | Outstanding balance | | — |
| | 300,000 |
| | (300,000 | ) | | — |
| | — |
|
| | Deferred costs | | — |
| | (2,764 | ) | | 2,588 |
| | 176 |
| | — |
|
| 2016 Term Loan, net | | — |
| | 297,236 |
|
| (297,412 | ) |
| 176 |
| | — |
|
| | | | | | | | | | | |
|
|
| Total debt | | $ | 8,059,802 |
|
| $ | 2,316,184 |
|
| $ | (4,011,480 | ) |
| $ | 2,742 |
|
| $ | 6,367,248 |
|
| |
(1) | Net premiums on mortgage notes payable and other debt were recorded upon the assumption of the respective debt instruments in relation to the various mergers and acquisitions. Amortization of these net premiums is recorded as a reduction to interest expense over the remaining term of the respective debt instruments using the effective-interest method. |
| |
(2) | Discounts on the corporate bonds and convertible debt were recorded based upon the fair value of the respective debt instruments as of the respective issuance dates. Amortization of these discounts is recorded as an increase to interest expense over the remaining term of the respective debt instruments using the effective-interest method. |
| |
(3) | Deferred costs relate to the term portion of the credit facility. |
VEREIT, INC. AND VEREIT OPERATING PARTNERSHIP, L.P.
NOTES TO CONSOLIDATED FINANCIAL STATEMENTS
December 31, 2016 – (Continued)
Mortgage Notes Payable
The Company’s mortgage notes payable consisted of the following as of December 31, 2016 (dollar amounts in thousands):
|
| | | | | | | | | | | | | | | | |
| | | Encumbered Properties | | Gross Carrying Value of Collateralized Properties (2) | | Outstanding Balance | | Weighted-Average Interest Rate (3) (4) | | Weighted-Average Years to Maturity (4) |
Fixed-rate debt (1) | | 618 |
| | $ | 5,083,978 |
| | $ | 2,618,652 |
| | 4.95 | % | | 4.6 |
| Variable-rate debt | | 1 |
| | 30,273 |
| | 11,297 |
| | 3.79 | % | | 0.6 |
Total (5) | | 619 |
| | $ | 5,114,251 |
| | $ | 2,629,949 |
| | 4.95 | % | | 4.6 |
| |
(1) | Includes $242.2 million of variable-rate debt fixed by way of interest rate swap arrangements. |
| |
(2) | Gross carrying value is gross real estate assets, including investment in direct financing leases, net of gross real estate liabilities. |
| |
(3) | Weighted-average interest rate for variable-rate debt represents the interest rate in effect as of December 31, 2016. |
| |
(4) | Weighted average years remaining to maturity is computed using the anticipated repayment date as specified in each loan agreement, where applicable. Weighted average interest rate is computed using the interest rate in effect until the anticipated repayment date. Should the loan not be repaid at the anticipated repayment date, the applicable interest rate shall increase as specified in the respective loan agreement until the extended maturity date. |
| |
(5) | The table above does not include the loan amount associated with an unconsolidated joint venture of $20.4 million, none of which is recourse to the Company. This loan has a secured fixed rate of 5.20% and a maturity date of July 2021, with weighted-average years to maturity of 4.5 years as of December 31, 2016. |
The Company’sOur mortgage loan agreementsobligations generally restrict corporate guarantees and require the maintenance of financial covenants, including maintenance of certain financial ratios (such as specified debt to equity and debt service coverage ratios)., as well as the maintenance of a minimum net worth. The mortgage loan agreements contain no dividend restrictions except in the event of default or when a distribution would drive liquidity below the applicable thresholds. At December 31, 2016,2018, the Company believes that it was in compliance with the financial covenants under the mortgage loan agreements except for the loans in default described below, and had no restrictions on the payment of dividends.
Litigation
During the yearsyear ended December 31, 20162018, we entered into settlement agreements with various plaintiffs in connection with litigation filed as a result of the findings of the Audit Committee Investigation for $217.5 million. The Company also entered into settlement agreements for $15.7 million subsequent to December 31, 2018, which was accrued and 2015, the Company repaid mortgage notes payable resultingincluded in a gain on extinguishment of debt of $0.3 millionlitigation, merger and loss on extinguishment of debt of $0.1 million, respectively, due to the write-off of unamortized premiums,other non-routine costs, net of deferred financing costs and prepayment penalties, which are includedinsurance recoveries in (loss) gain on extinguishment and forgiveness of debt, net in the accompanying consolidated statements of operations.
On December 30, 2016, the Company received a notice of default from the lender of a non-recourse loan secured by 16 properties, which had an outstanding balance of $11.6 million on the notice date, due to the Company’s non-repayment of the respective loan balance at maturity. The Company and the lender are assessing options in relation to the default.
On March 6, 2015, the Company received a notice of default from the lender of a non-recourse loan secured by two properties, which had an outstanding balance of $38.1 million on the notice date, due to the Company’s election not to make a reserve payment required per the loan agreement. The foreclosure sale of the first property securing the loan occurred during the three months ended June 30, 2016. As the loan was outstanding upon the foreclosure of the first property, the Company recorded a loss of $3.4 million in gain (loss) on disposition of real estate and held for sale assets, net in the accompanying consolidated statements of operations for the year ended December 31, 2016. The foreclosure proceedings on the second property that secured the loan were completed during the three months ended September 30, 2016. As a result of the foreclosure sale and deed transfer of both properties securing the loan, the Company recognized a gain on forgiveness of debt of $19.1 million, which is included in (loss) gain on extinguishment and forgiveness of debt, net in the accompanying consolidated statements of operations.2018.
Dividends
On January 13, 2015,November 5, 2018, the Company’s Board of Directors declared a substantially vacant office building in Bethesda, Maryland was foreclosed upon afterquarterly cash dividend of $0.1375 per share of Common Stock (equaling an annualized dividend rate of $0.55 per share) for the Company electedfourth quarter of 2018 to stop making debt service payments on the related non-recourse loan with an outstanding balancestockholders of $53.8 millionrecord as of December 31, 2014.2018, which was paid on January 15, 2019. An equivalent distribution by the Operating Partnership is applicable per OP unit.
Our Series F Preferred Stock, as discussed in Note 11 – Equity to our consolidated financial statements, will pay cumulative cash dividends at the rate of 6.70% per annum on their liquidation preference of $25.00 per share (equivalent to $1.675 per share on an annual basis). As a result of the foreclosure, the Company forfeited its rightDecember 31, 2018, there were approximately 42.8 million shares of Series F Preferred Stock (and approximately 42.8 million corresponding Series F Preferred Units that were issued to the propertyGeneral Partner) and was relieved86,874 Limited Partner Series F Preferred Units that were issued and outstanding.
Contractual Obligations
The following is a summary of allour contractual obligations as of December 31, 2018 (in thousands):
|
| | | | | | | | | | | | | | | | | | | | |
| | | Total | | Less than 1 year | | 1-3 years | | 4-5 years | | More than 5 years |
| Principal payments - mortgage notes | | $ | 1,917,132 |
| | $ | 167,279 |
| | $ | 617,957 |
| | $ | 459,741 |
| | $ | 672,155 |
|
Interest payments - mortgage notes (1) (2) | | 321,914 |
| | 93,710 |
| | 144,935 |
| | 80,830 |
| | 2,439 |
|
| Principal payments - Credit Facility | | 403,000 |
| | — |
| | — |
| | 403,000 |
| | — |
|
Interest payments - Credit Facility (2) | | 58,702 |
| | 15,918 |
| | 30,990 |
| | 11,794 |
| | — |
|
| Principal payments - corporate bonds | | 3,400,000 |
| | 750,000 |
| | 400,000 |
| | — |
| | 2,250,000 |
|
| Interest payments - corporate bonds | | 754,473 |
| | 120,075 |
| | 226,151 |
| | 202,776 |
| | 205,471 |
|
| Principal payments - convertible debt | | 402,500 |
| | — |
| | 402,500 |
| | — |
| | — |
|
| Interest payments - convertible debt | | 29,517 |
| | 15,094 |
| | 14,423 |
| | — |
| | — |
|
| Operating and ground lease commitments | | 287,159 |
| | 18,479 |
| | 36,120 |
| | 35,890 |
| | 196,670 |
|
Build-to-suit and other commitments (3) | | 30,343 |
| | 30,343 |
| | — |
| | — |
| | — |
|
| Total | | $ | 7,604,740 |
| | $ | 1,210,898 |
| | $ | 1,873,076 |
| | $ | 1,194,031 |
| | $ | 3,326,735 |
|
| |
| (1) | As of December 31, 2018, we had $50.7 million of variable rate mortgage notes effectively fixed through the use of interest rate swap agreements. We used the effective interest rates fixed under our swap agreements to calculate the debt payment obligations in future periods. |
| |
| (2) | Interest payments due in future periods on the $14.0 million of variable rate debt and the Credit Facility payment obligations were calculated using a forward LIBOR curve. |
| |
| (3) | Includes one build-to-suit development project and the Company’s share of capital expenditures related an expansion project of the property held within an unconsolidated joint venture. |
Cash Flow Analysis for the non-recourse loan. year ended December 31, 2018
Operating Activities –During the year ended December 31, 2015,2018, net cash provided by operating activities decreased $299.4 million to $493.9 million from $793.3 million during the Company recordedsame period in 2017. The decrease was primarily due to an increase in litigation and other non-routine costs, including litigation settlements, paid during the year ended December 31, 2018. In addition, there was a gaindecrease in interest payments due to the repayment of the 2018 Convertible Notes and a reduction of secured debt, offset by the issuance of the 2025 Senior Notes and an increase in net borrowings under the credit facilities during the year ended December 31, 2018 as compared to the same period in 2017.
Investing Activities –Net cash provided by investing activities for the year ended December 31, 2018 increased $425.2 million to $151.1 million from $274.1 million net cash used in investing activities during the same period in 2017. The increase was primarily related to a decrease in investments in real estate assets of $198.4 million, net proceeds from disposition of discontinued operations of $122.9 million and an increase in cash proceeds from dispositions of real estate and joint ventures of $56.8 million.
Financing Activities –Net cash used in financing activities of $655.4 million decreased $101.2 million during the year ended December 31, 2018 from $756.6 million during the same period in 2017. The decrease was primarily related to a decrease in payments on the forgivenessmortgage notes payable and other debt, including debt extinguishment costs of debt of $4.9$286.5 million, which is includedwas partially offset by a decrease of $117.1 million in (loss) gain on extinguishmentnet proceeds related to the credit facilities, corporate bonds and forgivenessconvertible notes and repurchases of Common Stock under the Share Repurchase Programs of $50.2 million with no comparable repurchases during the same period in 2017.
Cash Flow Analysis for the year ended December 31, 2017
Operating Activities –During the year ended December 31, 2017, net cash provided by operating activities decreased $4.7 million to $793.3 million from $797.9 million during the same period in 2016. The decrease was primarily due to a decrease in rental receipts related to the disposition of 438 consolidated properties subsequent to January 1, 2016 and an increase in litigation and other non-routine costs paid during the year ended December 31, 2017. This decrease was mostly offset by a decrease in interest payments and insurance recoveries received as compared to the same period in 2016, the receipt of an income tax refund during the year ended December 31, 2017, and an increase in rental receipts related to the acquisition of 96 consolidated properties subsequent to January 1, 2016.
Investing Activities –Net cash used in investing activities for the year ended December 31, 2017 changed $1.2 billion to $274.1 million from cash provided by investing activities of $881.6 million during the same period in 2016. The change was primarily related to an increase in investments in real estate assets of $598.8 million and decrease in cash proceeds from dispositions of real estate and joint ventures of $555.2 million.
Financing Activities –Net cash used in financing activities of $756.6 million decreased $750.4 million during the year ended December 31, 2017 from $1.5 billion during the same period in 2016. The decrease was primarily due to a decrease in repayments of debt, net of proceeds, of $1.5 billion, which was partially offset by the 2016 Common Stock offering resulting in net proceeds, after underwriting discounts and offering costs, of $702.8 million and an increase in distributions paid of $28.1 million.
Election as a REIT
The General Partner elected to be taxed as a REIT for U.S. federal income tax purposes under Sections 856 through 860 of the Internal Revenue Code commencing with the taxable year ended December 31, 2011. We believe we are organized and operating in such a manner as to qualify to be taxed as a REIT for the taxable year ended December 31, 2018. As a REIT, the General Partner is generally not subject to federal income tax on taxable income that it distributes to its stockholders so long as it distributes at least 90% of its annual taxable income (computed without regard to the deduction for dividends paid and excluding net capital gains). However, the General Partner, its TRS entities, and the OP are still subject to certain state and local income, franchise and property taxes in the various jurisdictions in which they operate. The General Partner may also be subject to federal income taxes on certain income and excise taxes on its undistributed income.
The OP is classified as a partnership for U.S. federal income tax purposes. As a partnership, the OP is not a taxable entity for U.S. federal income tax purposes. Instead, each partner in the OP is required to include its allocable share of the OP’s income, gains, losses, deductions and credits for each taxable year. Under the LPA, the OP is to conduct business in such a manner as to permit the General Partner at all times to qualify as a REIT.
A TRS is a subsidiary of a REIT that is subject to federal, state and local income taxes, as applicable. The Company’s use of a TRS enables it to engage in certain business activities while complying with the REIT qualification requirements and to retain any income generated by these businesses for reinvestment without the requirement to distribute those earnings. The Company conducted substantially all of the Cole Capital business activities through a TRS until it sold the Cole Capital business on February 1, 2018.
During the year ended December 31, 2018, the Company conducted all of its business in the United States, Puerto Rico and Canada and filed income tax returns in the U.S. federal jurisdiction, the Canadian federal jurisdiction and various state and local jurisdictions. With few exceptions, the Company is no longer subject to routine examinations by taxing authorities for years before 2014. Certain of the Company’s intercompany transactions that have been eliminated in consolidation for financial accounting purposes are also subject to taxation.
Inflation
We may be adversely impacted by inflation on any leases that do not contain indexed escalation provisions. However, net leases that require the tenant to pay its allocable share of operating expenses, including common area maintenance costs, real estate taxes and insurance, may reduce our exposure to increases in costs and operating expenses resulting from inflation.
Related Party Transactions and Agreements
Through the closing of the Cole Capital sale, we were contractually responsible for managing the Cole REITs’ affairs on a day-to-day basis, identifying and making acquisitions and investments on the Cole REITs’ behalf, and recommending to each of the Cole REIT’s respective board of directors an approach for providing investors with liquidity. In addition, we distributed the shares of common stock for certain of the Cole REITs and advised them regarding offerings, managed relationships with participating broker-dealers and financial advisors, and provided assistance in connection with compliance matters relating to the offerings. We received compensation and reimbursement for services relating to the Cole REITs’ offerings and the investment, management and disposition of their respective assets, as applicable. See Note 13 –Related Party Transactions and Arrangements to our consolidated financial statements in this report for a further explanation of the various related party transactions, agreements and fees.
Off-Balance Sheet Arrangements
We have no material off-balance sheet arrangements that have had or are reasonably likely to have a current or future effect on our financial condition, changes in financial condition, revenues or expenses, results of operations, liquidity, capital expenditures or capital resources.
Item 7A. Quantitative and Qualitative Disclosures About Market Risk.
Market Risk
The market risk associated with financial instruments and derivative financial instruments is the risk of loss from adverse changes in market prices or interest rates. Our market risk arises primarily from interest rate risk relating to variable-rate borrowings. To meet our short and long-term liquidity requirements, we borrow funds at a combination of fixed and variable rates. Our interest rate risk management objectives are to limit the impact of interest rate changes on earnings and cash flows and to manage our overall borrowing costs. To achieve these objectives, from time to time, we may enter into interest rate hedge contracts such as swaps, collars and treasury lock agreements in order to mitigate our interest rate risk with respect to various debt instruments. We would not hold or issue these derivative contracts for trading or speculative purposes.
Interest Rate Risk
As of December 31, 2018, our debt included fixed-rate debt, including debt that has interest rates that are fixed with the use of derivative instruments, with a fair value and carrying value each of $5.7 billion. Changes in market interest rates on our fixed rate debt impact the fair value of the debt, but they have no impact on interest incurred or cash flow. For instance, if interest rates rise 100 basis points, and the fixed rate debt balance remains constant, we expect the fair value of our debt to decrease, the same way the price of a bond declines as interest rates rise. The sensitivity analysis related to our fixed-rate debt assumes an immediate 100 basis point move in interest rates from their December 31, 2018 levels, with all other variables held constant. A 100 basis point increase in market interest rates would result in a decrease in the fair value of our fixed rate debt of $201.3 million. A 100 basis point decrease in market interest rates would result in an increase in the fair value of our fixed-rate debt of $213.8 million.
As of December 31, 2018, our debt included variable-rate debt with a fair value of $417.2 million and a carrying value of $417.0 million. The sensitivity analysis related to our variable-rate debt assumes an immediate 100 basis point move in interest rates from their December 31, 2018 levels, with all other variables held constant. A 100 basis point increase or decrease in variable interest rates on our variable-rate debt would increase or decrease our interest expense by $4.2 million annually. See Note 7 –Debt to our consolidated financial statements.
As of December 31, 2018, our interest rate swap had a fair value that resulted in assets of $0.5 million. See Note 2 – Summary of Significant Accounting Policies to our consolidated financial statements for further discussion.
As the information presented above includes only those exposures that existed as of December 31, 2018, it does not consider exposures or positions arising after that date. The information presented herein has limited predictive value. Future actual realized gains or losses with respect to interest rate fluctuations will depend on cumulative exposures, hedging strategies employed and the magnitude of the fluctuations.
These amounts were determined by considering the impact of hypothetical interest rate changes on our borrowing costs and assume no other changes in our capital structure.
Credit Risk
Concentrations of credit risk arise when a number of tenants are engaged in similar business activities, or activities in the same geographic region, or have similar economic features that would cause their ability to meet contractual obligations, including those to the Company, to be similarly affected by changes in economic conditions. The Company is subject to tenant, geographic and industry concentrations. Any downturn of the economic conditions in one or more of these tenants, geographies or industries could result in a material reduction of our cash flows or material losses to us.
The factors considered in determining the credit risk of our tenants include, but are not limited to: payment history; credit status and change in status (credit ratings for public companies are used as a primary metric); change in tenant space needs (i.e., expansion/downsize); tenant financial performance; economic conditions in a specific geographic region; and industry specific credit considerations. We believe that the credit risk of our portfolio is reduced by the high quality of our existing tenant base, reviews of prospective tenants’ risk profiles prior to lease execution and consistent monitoring of our portfolio to identify potential problem tenants.
Item 8. Financial Statements and Supplementary Data.
The information required by Item 8 is hereby incorporated by reference to our consolidated financial statements beginning on page F-1 of this document.
Item 9. Changes in and Disagreements with Accountants on Accounting and Financial Disclosure.
None.
Item 9A. Controls and Procedures.
I. Discussion of Controls and Procedures of the General Partner
For purposes of the discussion in this Part I of Item 9A, the “Company” refers to the General Partner.
Evaluation of Disclosure Controls and Procedures
We maintain disclosure controls and procedures (as defined in Rules 13a-15(e) and 15d-15(e) of the Exchange Act that are designed to provide reasonable assurance that information required to be disclosed in our Exchange Act reports is recorded, processed, summarized and reported within the time periods specified in the SEC’s rules and forms, and that such information is accumulated and communicated to our management, including our Chief Executive Officer and Chief Financial Officer, as appropriate, to allow timely decisions regarding required disclosure. In designing and evaluating the disclosure controls and procedures, we recognize that no controls and procedures, no matter how well designed and operated, can provide absolute assurance of achieving the desired control objectives.
In accordance with Rules 13a-15(b) and 15d-15(b) of the Exchange Act, management, under the supervision and with the participation of our Chief Executive Officer and Chief Financial Officer, carried out an evaluation of the effectiveness of our disclosure controls and procedures as of December 31, 2018 and determined that the disclosure controls and procedures were effective at a reasonable assurance level as of that date.
Management’s Annual Report on Internal Control over Financial Reporting
Our management is responsible for establishing and maintaining adequate internal control over financial reporting, as such term is defined in Rules 13a-15(f) and 15d-15(f) under the Exchange Act. Internal control over financial reporting is a process to provide reasonable assurance regarding the reliability of our financial reporting and the preparation of financial statements for external purposes in accordance with GAAP. Because of its inherent limitations, internal control over financial reporting is not intended to provide absolute assurance that a misstatement of our financial statements would be prevented or detected.
Under the supervision and with the participation of our management, including our Chief Executive Officer and Chief Financial Officer, we conducted an evaluation of the effectiveness of our internal control over financial reporting based on the framework in Internal Control — Integrated Framework (2013) issued by the Committee of Sponsoring Organizations of the Treadway Commission.
Based on this evaluation, management has concluded that our internal control over financial reporting was effective as of December 31, 2018.
The effectiveness of our internal control over financial reporting as of December 31, 2018 has been audited by Deloitte & Touche LLP, an independent registered public accounting firm, as stated in their report in this Annual Report on Form 10-K.
Changes in Internal Control Over Financial Reporting
No change occurred in our internal control over financial reporting (as defined in Rules 13a-15(f) and 15d -15(f) of the Exchange Act) during the three months ended December 31, 2018 that has materially affected, or is reasonably likely to materially affect, our internal control over financial reporting.
II. Discussion of Controls and Procedures of the Operating Partnership
In the information incorporated by reference into this Part II of Item 9A, the term “Company” refers to the Operating Partnership, except as the context otherwise requires.
Evaluation of Disclosure Controls and Procedures
We maintain disclosure controls and procedures (as defined in Rules 13a-15(e) and 15d-15(e) of the Exchange Act that are designed to provide reasonable assurance that information required to be disclosed in our Exchange Act reports is recorded, processed, summarized and reported within the time periods specified in the SEC’s rules and forms, and that such information is accumulated and communicated to our management, including our Chief Executive Officer and Chief Financial Officer, as
appropriate, to allow timely decisions regarding required disclosure. In designing and evaluating the disclosure controls and procedures, we recognize that no controls and procedures, no matter how well designed and operated, can provide absolute assurance of achieving the desired control objectives.
In accordance with Rules 13a-15(b) and 15d-15(b) of the Exchange Act, management, under the supervision and with the participation of our Chief Executive Officer and Chief Financial Officer, carried out an evaluation of the effectiveness of our disclosure controls and procedures as of December 31, 2018 and determined that the disclosure controls and procedures were effective at a reasonable assurance level as of that date.
Management’s Annual Report on Internal Control over Financial Reporting
Our management is responsible for establishing and maintaining adequate internal control over financial reporting, as such term is defined in Rules 13a-15(f) and 15d-15(f) under the Exchange Act. Internal control over financial reporting is a process to provide reasonable assurance regarding the reliability of our financial reporting and the preparation of financial statements for external purposes in accordance with GAAP. Because of its inherent limitations, internal control over financial reporting is not intended to provide absolute assurance that a misstatement of our financial statements would be prevented or detected.
Under the supervision and with the participation of our management, including our Chief Executive Officer and Chief Financial Officer, we conducted an evaluation of the effectiveness of our internal control over financial reporting based on the framework in Internal Control — Integrated Framework (2013) issued by the Committee of Sponsoring Organizations of the Treadway Commission.
Based on this evaluation, management has concluded that our internal control over financial reporting was effective as of December 31, 2018.
Changes in Internal Control Over Financial Reporting
No change occurred in our internal control over financial reporting (as defined in Rules 13a-15(f) and 15d -15(f) of the Exchange Act) during the three months ended December 31, 2018 that has materially affected, or is reasonably likely to materially affect, our internal control over financial reporting.
REPORT OF INDEPENDENT REGISTERED PUBLIC ACCOUNTING FIRM
To the shareholders and the Board of Directors of VEREIT, Inc.
Opinion on Internal Control over Financial Reporting
We have audited the internal control over financial reporting of VEREIT, Inc. and subsidiaries (the “Company”) as of December 31, 2018, based on criteria established in Internal Control - Integrated Framework (2013) issued by the Committee of Sponsoring Organizations of the Treadway Commission (COSO). In our opinion, the Company maintained, in all material respects, effective internal control over financial reporting as of December 31, 2018, based on criteria established in Internal Control - Integrated Framework (2013) issued by COSO.
We have also audited, in accordance with the standards of the Public Company Accounting Oversight Board (United States) (PCAOB), the consolidated financial statements and financial statement schedules as of and for the year ended December 31, 2018, of the Company and our report dated February 20, 2019, expressed an unqualified opinion on those financial statements.
Basis for Opinion
The Company’s management is responsible for maintaining effective internal control over financial reporting and for its assessment of the effectiveness of internal control over financial reporting included in the accompanying Management’s Annual Report on Internal Control over Financial Reporting. Our responsibility is to express an opinion on the Company’s internal control over financial reporting based on our audit. We are a public accounting firm registered with the PCAOB and are required to be independent with respect to the Company in accordance with the U.S. federal securities laws and the applicable rules and regulations of the Securities and Exchange Commission and the PCAOB.
We conducted our audit in accordance with the standards of the PCAOB. Those standards require that we plan and perform the audit to obtain reasonable assurance about whether effective internal control over financial reporting was maintained in all material respects. Our audit included obtaining an understanding of internal control over financial reporting, assessing the risk that a material weakness exists, testing and evaluating the design and operating effectiveness of internal control based on the assessed risk and performing such other procedures as we considered necessary in the circumstances. We believe that our audit provides a reasonable basis for our opinion.
Definition and Limitations of Internal Control over Financial Reporting
A company’s internal control over financial reporting is a process designed to provide reasonable assurance regarding the reliability of financial reporting and the preparation of financial statements for external purposes in accordance with generally accepted accounting principles. A company’s internal control over financial reporting includes policies and procedures that (1) pertain to the maintenance of records that, in reasonable detail, accurately and fairly reflect the transactions and dispositions of the assets of the company; (2) provide reasonable assurance that transactions are recorded as necessary to permit preparation of financial statements in accordance with generally accepted accounting principles, and that receipts and expenditures of the company are being made only in accordance with authorizations of management and directors of the company; and (3) provide reasonable assurance regarding prevention or timely detection of unauthorized acquisition, use, or disposition of the company’s assets that could have a material effect on the financial statements.
Because of its inherent limitations, internal control over financial reporting may not prevent or detect misstatements. Also, projections of any evaluation of effectiveness to future periods are subject to the risk that controls may become inadequate because of changes in conditions, or that the degree of compliance with the policies or procedures may deteriorate.
/s/ DELOITTE & TOUCHE LLP
Phoenix, Arizona
February 20, 2019
Item 9B. Other Information.
None
PART III
Item 10. Directors, Executive Officers and Corporate Governance.
The information required by this Item will be included in our definitive proxy statement for the 2019 Annual Meeting of Stockholders (the “Proxy Statement”), to be filed within 120 days following the end of our fiscal year, and is incorporated herein by reference.
Item 11. Executive Compensation.
The information required by this Item will be included in the Proxy Statement and is incorporated herein by reference.
Item 12. Security Ownership of Certain Beneficial Owners and Management and Related Stockholder Matters.
The information required by this Item will be included in the Proxy Statement and is incorporated herein by reference.
Item 13. Certain Relationships and Related Transactions, and Director Independence.
The information required by this Item will be included in the Proxy Statement and is incorporated herein by reference.
Item 14. Principal Accounting Fees and Services.
The information required by this Item will be included in the Proxy Statement and is incorporated herein by reference.
PART IV
Item 15. Exhibits and Financial Statement Schedules.
Financial Statements
The Financial Statements are included herein at pages F-1 through F-60.
Financial Statement Schedules
Schedule II - Valuation and Qualifying Accounts is included herein on page F-61.
Schedule III - Real Estate and Accumulated Depreciation is included herein on pages F-62 through F-194.
Schedule IV - Mortgage Loans Held for Investment is included herein on page F-195.
Exhibits
The following exhibits are included in this Annual Report on Form 10-K for the fiscal year ended December 31, 2018 (and are numbered in accordance with Item 601 of Regulation S-K):
|
| | |
| Exhibit No. | | Description |
| 2.1 | | Agreement and Plan of Merger by and among VEREIT, Inc., VEREIT Operating Partnership, L.P., Tiger Acquisition LLC, American Realty Capital Trust III, Inc. and American Realty Capital Operating Partnership III, L.P., dated as of December 14, 2012 (Incorporated by reference to the Company’s Current Report on Form 8-K (File No. 001-35263), filed with the SEC on December 17, 2012). |
| 2.2 | | Agreement and Plan of Merger, by and among, VEREIT, Inc., VEREIT Operating Partnership, L.P., Safari Acquisition, LLC, CapLease, Inc., CapLease, LP and CLF OP General Partner LLC, dated as of May 28, 2013 (Incorporated by reference to the Company’s Current Report on Form 8-K (File NO. 001-35263), filed with the SEC on May 28, 2013). |
| 2.3 | | Purchase and Sale Agreement, by and among, CNL APF Partners, LP and Certain Affiliates as Seller Parties, and VEREIT Operating Partnership, L.P., as Purchaser, dated May 31, 2013. (Incorporated by reference to the Company’s Amended Current Report on Form 8-K/A (File No. 001-35263), filed with the SEC on June 7,2013). |
| 2.4 | | Agreement and Plan of Merger, dated as of July 1, 2013, among VEREIT, Inc., American Realty Capital Trust IV, Inc., Thunder Acquisition, LLC, VEREIT Operating Partnership, L.P. and American Realty Capital Operating Partnership IV, L.P. (Incorporated by reference to the Company’s Current Report on Form 8-K (File No. 001-35263), filed with the SEC on July 2, 2013). |
| 2.4.1 | | Amendment dated as of October 6, 2013 to the Agreement and Plan of Merger, dated as of July 1, 2013, by and among VEREIT, Inc., VEREIT Operating Partnership, L.P., Thunder Acquisition, LLC, American Realty Capital Trust IV, Inc. and American Realty Capital Operating Partnership IV, L.P. (Incorporated by reference to the Company’s First Current Report on Form 8-K (File No. 001-35263), filed with the SEC on October 7, 2013). |
| 2.4.2 | | Second Amendment dated as of October 11, 2013 to the Agreement and Plan of Merger, dated as of July 1, 2013, by and among VEREIT, Inc., VEREIT Operating Partnership, L.P., Thunder Acquisition, LLC, American Realty Capital Trust IV, Inc. and American Realty Capital Operating Partnership IV, L.P. (Incorporated by reference as Annex E to the Company’s Final Prospectus filed Pursuant to Rule 424(b)(3) (Registration No. 333-190056), filed with the SEC on December 4, 2013). |
| 2.5 | | |
| 3.1 | | |
| 3.2 | | |
| 3.3 | | |
| 3.4 | | |
| 3.5 | | |
| 3.6 | | |
| 3.7 | | |
|
| | |
| Exhibit No. | | Description |
| 3.8 | | |
| 3.9 | | |
| 3.10 | | |
| 3.11 | | |
| 3.12 | | |
| 3.13 | | |
| 4.1 | | |
| 4.2 | | |
| 4.3 | | |
| 4.4 | | |
| 4.5 | | |
| 4.6 | | |
| 4.7 | | |
| 4.8 | | Indenture, dated as of February 6, 2014, among ARC Properties Operating Partnership, L.P., Clark Acquisition, LLC, the guarantors named therein and U.S. Bank National Association, as trustee (Incorporated by reference to the Company’s Current Report on Form 8-K (File No. 001-35263), filed with the SEC on February 7, 2014). |
| 4.9 | | |
| 4.10 | | |
| 4.11 | | |
| 4.12 | | |
| 4.13 | | |
| 4.14 | | |
| 4.15 | | |
| 4.16 | | |
| 4.17 | | |
|
| | |
| Exhibit No. | | Description |
| 10.1 | | |
| 10.2 | | |
| 10.3 | | |
| 10.4† | | |
| 10.5† | | |
| 10.6† | | |
| 10.7†* | | |
| 10.8†* | | |
| 10.9†* | | |
| 10.10†* | | |
| 10.11†* | | |
| 10.12†* | | |
| 10.13†* | | |
| 10.14† | | |
| 10.15† | | |
| 10.16† | | |
| 10.17† | | |
| 10.18† | | |
| 10.19† | | |
| 10.20† | | |
| 10.21† | | |
| 10.22† | | Amendment, effective February 21, 2018, to the Employment Agreement, dated as of October 5, 2015, by and between VEREIT, Inc. and Michael J. Bartolotta (Incorporated by reference to the Company’s Annual Report on Form 10-K (File No. 001-35263), for the year ended December 31, 2017 filed with the SEC on February 22, 2018). |
| 10.23† | | |
| 10.24† | | |
| 10.25† | | Amendment, effective February 21, 2018, to the Employment Agreement, dated as of May 21, 2015, by and between VEREIT, Inc. and Lauren Goldberg (Incorporated by reference to the Company’s Annual Report on Form 10-K (File No. 001-35263), for the year ended December 31, 2017 filed with the SEC on February 22, 2018). |
|
| | |
| Exhibit No. | | Description |
| 10.26† | | |
| 10.27† | | Amendment, effective February 21, 2018, to the Employment Agreement, dated as of February 23, 2016, by and between VEREIT, Inc. and Paul McDowell (Incorporated by reference to the Company’s Annual Report on Form 10-K (File No. 001-35263), for the year ended December 31, 2017 filed with the SEC on February 22, 2018). |
| 10.28† | | |
| 10.29† | | Amendment, effective February 21, 2018, to the Employment Agreement, dated as of February 23, 2016, by and between VEREIT, Inc. and Thomas Roberts (Incorporated by reference to the Company’s Annual Report on Form 10-K (File No. 001-35263), for the year ended December 31, 2017 filed with the SEC on February 22, 2018). |
| 10.30† | | |
| 21.1* | | |
| 23.1* | | |
| 23.2* | | |
| 31.1* | | |
| 31.2* | | |
| 31.3* | | |
| 31.4* | | |
| 32.1** | | |
| 32.2** | | |
| 32.3** | | |
| 32.4** | | |
| 101.INS* | | XBRL Instance Document. |
| 101.SCH* | | XBRL Taxonomy Extension Schema Document. |
| 101.CAL* | | XBRL Taxonomy Extension Calculation Linkbase Document. |
| 101.DEF* | | XBRL Taxonomy Extension Definition Linkbase Document. |
| 101.LAB* | | XBRL Taxonomy Extension Label Linkbase Document. |
| 101.PRE* | | XBRL Taxonomy Extension Presentation Linkbase Document. |
_____________________________
| |
| ** | In accordance with Item 601(b)(32) of Regulation S-K, this Exhibit is not deemed “filed” for purposes of Section 18 of the Exchange Act or otherwise subject to the liabilities of that section. Such certifications will not be deemed incorporated by reference into any filing under the Securities Act or the Exchange Act, except to the extent that the registrant specifically incorporates it by reference. |
† Management contract or compensatory plan or arrangement.
Item 16. Form 10-K Summary.
Not Applicable
SIGNATURES
Pursuant to the requirements of the Securities Exchange Act of 1934, as amended, each registrant has duly caused this Annual Report on Form 10-K to be signed on its behalf by the undersigned thereunto duly authorized.
|
| | |
| VEREIT, INC. |
| By: | /s/ Michael J. Bartolotta |
| Michael J. Bartolotta |
| Executive Vice President and Chief Financial Officer (Principal Financial Officer) |
|
| | |
| VEREIT OPERATING PARTNERSHIP, L.P. |
| By: VEREIT, Inc., its sole general partner |
| By: | /s/ Michael J. Bartolotta |
| Michael J. Bartolotta |
| Executive Vice President and Chief Financial Officer (Principal Financial Officer) |
Dated: February 20, 2019
Pursuant to the requirements of the Securities Exchange Act of 1934, as amended, this Form 10-K has been signed below by the following persons on behalf of each registrant and in the capacities and on the dates indicated.
|
| | | | |
| Name | | Capacity * | | Date |
| | | | |
| /s/ Glenn J. Rufrano | | Chief Executive Officer | | February 20, 2019 |
| Glenn J. Rufrano | | (Principal Executive Officer and Director) | | |
| | | | |
| /s/ Michael J. Bartolotta | | Executive Vice President and Chief Financial Officer | | February 20, 2019 |
| Michael J. Bartolotta | | (Principal Financial Officer) | | |
| | | | |
| /s/ Gavin B. Brandon | | Senior Vice President and Chief Accounting Officer | | February 20, 2019 |
| Gavin B. Brandon | | (Principal Accounting Officer) | | |
| | | | |
| /s/ Hugh R. Frater | | Director, Non-Executive Chairman | | February 20, 2019 |
| Hugh R. Frater | | | | |
| | | | |
| /s/ David B. Henry | | Director | | February 20, 2019 |
| David B. Henry | | | | |
| | | | |
| /s/ Mary Hogan Preusse | | Director | | February 20, 2019 |
| Mary Hogan Preusse | | | | |
| | | | |
| /s/ Richard J. Lieb | | Director | | February 20, 2019 |
| Richard J. Lieb | | | | |
| | | | |
| /s/ Mark S. Ordan | | Director | | February 20, 2019 |
| Mark S. Ordan | | | | |
| | | | |
| /s/ Eugene A. Pinover | | Director | | February 20, 2019 |
| Eugene A. Pinover | | | | |
| | | | |
| /s/ Julie G. Richardson | | Director | | February 20, 2019 |
| Julie G. Richardson | | | | |
|
| |
| * | Each person is signing in his or her capacity as an officer and/or director of VEREIT, Inc., which is the sole general partner of VEREIT Operating Partnership, L.P. |
INDEX TO CONSOLIDATED FINANCIAL STATEMENTS
|
| |
| Page |
| Financial Statements |
| |
| |
| |
| |
| |
| |
| |
| |
| |
| |
| |
| |
| F-61 |
| F-62 |
| F-195 |
REPORT OF INDEPENDENT REGISTERED PUBLIC ACCOUNTING FIRM
To the shareholders and the Board of Directors of VEREIT, Inc.
Opinion on the Financial Statements
We have audited the accompanying consolidated balance sheets of VEREIT, Inc. and subsidiaries (the “Company”) as of December 31, 2018 and 2017, the related consolidated statements of operations.operations, comprehensive income (loss), changes in equity and cash flows for each of the three years in the period ended December 31, 2018, and the related notes and the schedules listed in the Index at Item 15 (collectively referred to as the “financial statements”). In our opinion, the financial statements present fairly, in all material respects, the financial position of the Company as of December 31, 2018 and 2017, and the results of its operations and its cash flows for each of the three years in the period ended December 31, 2018, in conformity with accounting principles generally accepted in the United States of America.
We have also audited, in accordance with the standards of the Public Company Accounting Oversight Board (United States) (PCAOB), the Company’s internal control over financial reporting as of December 31, 2018, based on criteria established in Internal Control - Integrated Framework (2013) issued by the Committee of Sponsoring Organizations of the Treadway Commission and our report dated February 20, 2019, expressed an unqualified opinion on the Company’s internal control over financial reporting.
Basis for Opinion
These financial statements are the responsibility of the Company’s management. Our responsibility is to express an opinion on the Company’s financial statements based on our audits. We are a public accounting firm registered with the PCAOB and are required to be independent with respect to the Company in accordance with the U.S. federal securities laws and the applicable rules and regulations of the Securities and Exchange Commission and the PCAOB.
We conducted our audits in accordance with the standards of the PCAOB. Those standards require that we plan and perform the audit to obtain reasonable assurance about whether the financial statements are free of material misstatement, whether due to error or fraud. Our audits included performing procedures to assess the risks of material misstatement of the financial statements, whether due to error or fraud, and performing procedures that respond to those risks. Such procedures included examining, on a test basis, evidence regarding the amounts and disclosures in the financial statements. Our audits also included evaluating the accounting principles used and significant estimates made by management, as well as evaluating the overall presentation of the financial statements. We believe that our audits provide a reasonable basis for our opinion.
/s/ DELOITTE & TOUCHE LLP
Phoenix, Arizona
February 20, 2019
We have served as the Company’s auditor since 2015.
REPORT OF INDEPENDENT REGISTERED PUBLIC ACCOUNTING FIRM
To the partners of VEREIT Operating Partnership, L.P.
Opinion on the Financial Statements
We have audited the accompanying consolidated balance sheets of VEREIT Operating Partnership, L.P and subsidiaries (the "Operating Partnership") as of December 31, 2018 and 2017, the related consolidated statements of operations, comprehensive income (loss), changes in equity, and cash flows, for each of the three years in the period ended December 31, 2018, and the related notes and the schedules listed in the Index at Item 15 (collectively referred to as the "financial statements"). In our opinion, the financial statements present fairly, in all material respects, the financial position of the Operating Partnership as of December 31, 2018 and 2017, and the results of its operations and its cash flows for each of the three years in the period ended December 31, 2018, in conformity with accounting principles generally accepted in the United States of America.
Basis for Opinion
These financial statements are the responsibility of the Operating Partnership's management. Our responsibility is to express an opinion on the Operating Partnership's financial statements based on our audits. We are a public accounting firm registered with the Public Company Accounting Oversight Board (United States) (PCAOB) and are required to be independent with respect to the Operating Partnership in accordance with the U.S. federal securities laws and the applicable rules and regulations of the Securities and Exchange Commission and the PCAOB.
We conducted our audits in accordance with the standards of the PCAOB. Those standards require that we plan and perform the audit to obtain reasonable assurance about whether the financial statements are free of material misstatement, whether due to error or fraud. The Operating Partnership is not required to have, nor were we engaged to perform, an audit of its internal control over financial reporting. As part of our audits, we are required to obtain an understanding of internal control over financial reporting but not for the purpose of expressing an opinion on the effectiveness of the Operating Partnership’s internal control over financial reporting. Accordingly, we express no such opinion.
Our audits included performing procedures to assess the risks of material misstatement of the financial statements, whether due to error or fraud, and performing procedures that respond to those risks. Such procedures included examining, on a test basis, evidence regarding the amounts and disclosures in the financial statements. Our audits also included evaluating the accounting principles used and significant estimates made by management, as well as evaluating the overall presentation of the financial statements. We believe that our audits provide a reasonable basis for our opinion.
/s/ DELOITTE & TOUCHE LLP
Phoenix, Arizona
February 20, 2019
We have served as the Operating Partnership’s auditor since 2015.
VEREIT, INC.
CONSOLIDATED BALANCE SHEETS
(In thousands, except for share and per share data)
|
| | | | | | | | |
| | | December 31, 2018 | | December 31, 2017 |
| ASSETS | | | | |
| Real estate investments, at cost: | | | | |
| Land | | $ | 2,843,212 |
| | $ | 2,865,855 |
|
| Buildings, fixtures and improvements | | 10,749,228 |
| | 10,711,845 |
|
| Intangible lease assets | | 2,012,399 |
| | 2,037,675 |
|
| Total real estate investments, at cost | | 15,604,839 |
| | 15,615,375 |
|
| Less: accumulated depreciation and amortization | | 3,436,772 |
| | 2,908,028 |
|
| Total real estate investments, net | | 12,168,067 |
| | 12,707,347 |
|
| Investment in unconsolidated entities | | 35,289 |
| | 39,520 |
|
| Cash and cash equivalents | | 30,758 |
| | 34,176 |
|
| Restricted cash | | 22,905 |
| | 27,662 |
|
| Rent and tenant receivables and other assets, net | | 366,092 |
| | 389,060 |
|
| Goodwill | | 1,337,773 |
| | 1,337,773 |
|
| Due from affiliates, net | | — |
| | 6,041 |
|
| Real estate assets held for sale and assets related to discontinued operations, net | | 2,609 |
| | 163,999 |
|
| Total assets | | $ | 13,963,493 |
|
| $ | 14,705,578 |
|
| | | | | |
| LIABILITIES AND EQUITY | | | | |
| Mortgage notes payable, net | | $ | 1,922,657 |
| | $ | 2,082,692 |
|
| Corporate bonds, net | | 3,368,609 |
| | 2,821,494 |
|
| Convertible debt, net | | 394,883 |
| | 984,258 |
|
| Credit facility, net | | 401,773 |
| | 185,000 |
|
| Below-market lease liabilities, net | | 173,479 |
| | 198,551 |
|
| Accounts payable and accrued expenses | | 145,611 |
| | 136,474 |
|
| Deferred rent and other liabilities | | 69,714 |
| | 62,985 |
|
| Distributions payable | | 186,623 |
| | 175,301 |
|
| Due to affiliates | | — |
| | 66 |
|
| Liabilities related to discontinued operations | | — |
| | 15,881 |
|
| Total liabilities | | 6,663,349 |
| | 6,662,702 |
|
| Commitments and contingencies (Note 10) | |
| |
|
|
| Preferred stock, $0.01 par value, 100,000,000 shares authorized and 42,834,138 issued and outstanding as of each of December 31, 2018 and December 31, 2017 | | 428 |
| | 428 |
|
| Common stock, $0.01 par value, 1,500,000,000 shares authorized and 967,515,165 and 974,208,583 issued and outstanding as of December 31, 2018 and December 31, 2017, respectively | | 9,675 |
| | 9,742 |
|
| Additional paid-in-capital | | 12,615,472 |
| | 12,654,258 |
|
| Accumulated other comprehensive loss | | (1,280 | ) | | (3,569 | ) |
| Accumulated deficit | | (5,467,236 | ) | | (4,776,581 | ) |
| Total stockholders’ equity | | 7,157,059 |
| | 7,884,278 |
|
| Non-controlling interests | | 143,085 |
| | 158,598 |
|
| Total equity | | 7,300,144 |
| | 8,042,876 |
|
| Total liabilities and equity | | $ | 13,963,493 |
|
| $ | 14,705,578 |
|
The accompanying notes are an integral part of these statements.
VEREIT, INC.
CONSOLIDATED STATEMENTS OF OPERATIONS
(In thousands, except for per share data)
|
| | | | | | | | | | | | |
| | | Year Ended December 31, |
| | | 2018 | | 2017 | | 2016 |
| Rental revenue | | $ | 1,257,867 |
| | $ | 1,252,285 |
| | $ | 1,335,447 |
|
| Operating expenses: | | | | | | |
| Acquisition-related | | 3,632 |
| | 3,402 |
| | 1,321 |
|
| Litigation, merger and other non-routine costs, net of insurance recoveries | | 290,963 |
| | 47,960 |
| | 3,884 |
|
| Property operating | | 126,461 |
| | 128,717 |
| | 144,428 |
|
| General and administrative | | 63,933 |
| | 58,603 |
| | 51,927 |
|
| Depreciation and amortization | | 640,618 |
| | 706,802 |
| | 762,038 |
|
| Impairments | | 54,647 |
| | 50,548 |
| | 182,820 |
|
| Total operating expenses | | 1,180,254 |
|
| 996,032 |
|
| 1,146,418 |
|
| Other (expense) income: | | | | | | |
| Interest expense | | (280,887 | ) | | (289,766 | ) | | (317,376 | ) |
| Gain (loss) on extinguishment and forgiveness of debt, net | | 5,360 |
| | 18,373 |
| | (771 | ) |
| Other income, net | | 14,735 |
| | 6,242 |
| | 5,251 |
|
| Equity in income and gain on disposition of unconsolidated entities | | 1,869 |
| | 2,763 |
| | 9,783 |
|
| Gain (loss) on derivative instruments, net | | 355 |
| | 2,976 |
| | (1,191 | ) |
| Gain on disposition of real estate and real estate assets held for sale, net | | 94,331 |
| | 61,536 |
| | 45,524 |
|
| Total other expenses, net | | (164,237 | ) |
| (197,876 | ) |
| (258,780 | ) |
| (Loss) income before taxes | | (86,624 | ) |
| 58,377 |
|
| (69,751 | ) |
| Provision for income taxes | | (5,101 | ) | | (6,882 | ) | | (7,136 | ) |
| (Loss) income from continuing operations | | (91,725 | ) |
| 51,495 |
|
| (76,887 | ) |
| Income (loss) from discontinued operations, net of income taxes | | 3,695 |
| | (19,117 | ) | | (123,937 | ) |
| Net (loss) income | | (88,030 | ) | | 32,378 |
| | (200,824 | ) |
Net loss (income) attributable to non-controlling interests (1) | | 2,256 |
| | (560 | ) | | 4,961 |
|
| Net (loss) income attributable to the General Partner | | $ | (85,774 | ) |
| $ | 31,818 |
|
| $ | (195,863 | ) |
| | | | | | | |
| Basic and diluted net loss per share from continuing operations attributable to common stockholders | | $ | (0.17 | ) | | $ | (0.02 | ) | | $ | (0.16 | ) |
| Basic and diluted net income (loss) per share from discontinued operations attributable to common stockholders | | $ | 0.00 |
| | $ | (0.02 | ) | | $ | (0.13 | ) |
Basic and diluted net loss per share attributable to common stockholders (2) | | $ | (0.16 | ) | | $ | (0.04 | ) | | $ | (0.29 | ) |
| |
| (1) | Represents net loss (income) attributable to limited partners and consolidated joint venture partners. |
| |
| (2) | Amounts may not total due to rounding. |
The accompanying notes are an integral part of these statements.
VEREIT, INC.
CONSOLIDATED STATEMENTS OF COMPREHENSIVE INCOME (LOSS)
(In thousands)
|
| | | | | | | | | | | | |
| | | Year Ended December 31, |
| | | 2018 | | 2017 | | 2016 |
| Net (loss) income | | $ | (88,030 | ) | | $ | 32,378 |
| | $ | (200,824 | ) |
| Other comprehensive income (loss): | | | | | | |
| Unrealized gain (loss) on interest rate derivatives | | — |
| | (18 | ) | | (7,685 | ) |
| Reclassification of previous unrealized loss (gain) on interest rate derivatives into net (loss) income | | 313 |
| | (70 | ) | | 9,397 |
|
| Unrealized loss on investment securities, net | | (205 | ) | | (951 | ) | | (2,271 | ) |
| Reclassification of previous unrealized loss (gain) on investment securities into net (loss) income as other income, net | | 2,237 |
| | — |
| | — |
|
| Total other comprehensive income (loss) | | 2,345 |
|
| (1,039 | ) | | (559 | ) |
| | | | | | | |
| Total comprehensive (loss) income | | (85,685 | ) | | 31,339 |
| | (201,383 | ) |
Comprehensive loss (income) attributable to non-controlling interests (1) | | 2,200 |
| | (534 | ) | | 4,989 |
|
| Total comprehensive (loss) income attributable to the General Partner | | $ | (83,485 | ) | | $ | 30,805 |
| | $ | (196,394 | ) |
| |
| (1) | Represents comprehensive loss (income)attributable to limited partners and consolidated joint venture partners. |
The accompanying notes are an integral part of these statements.
VEREIT, INC.
CONSOLIDATED STATEMENTS OF CHANGES IN EQUITY
(In thousands, except for share data)
|
| | | | | | | | | | | | | | | | | | | | | | | | | | | | | | | | | | | | | | |
| | | Preferred Stock | | Common Stock | | | | | | | | | | | | |
| | | Number
of Shares | | Par
Value | | Number
of Shares | | Par
Value | | Additional Paid-In Capital | | Accumulated Other Comprehensive Loss | | Accumulated
Deficit | | Total Stock-holders’ Equity | | Non-Controlling Interests | | Total Equity |
| Balance, January 1, 2016 | | 42,834,138 |
| | $ | 428 |
| | 904,884,394 |
| | $ | 9,049 |
| | $ | 11,931,768 |
| | $ | (2,025 | ) | | $ | (3,415,233 | ) | | $ | 8,523,987 |
| | $ | 189,972 |
| | $ | 8,713,959 |
|
| Issuance of Common Stock, net | | — |
| | — |
| | 69,000,000 |
| | 690 |
| | 701,786 |
| | — |
| | — |
| | 702,476 |
| | — |
| | 702,476 |
|
| Conversion of OP Units to Common Stock | | — |
| | — |
| | 15,450 |
| | — |
| | 159 |
| | — |
| | — |
| | 159 |
| | (159 | ) | | — |
|
| Repurchases of Common Stock to settle tax obligation | | — |
| | — |
| | (481,261 | ) | | (5 | ) | | (4,647 | ) | | — |
| | — |
| | (4,652 | ) | | — |
| | (4,652 | ) |
| Equity-based compensation, net | | — |
| | — |
| | 728,067 |
| | 7 |
| | 10,721 |
| | — |
| | — |
| | 10,728 |
| | — |
| | 10,728 |
|
| Contributions from non-controlling interest holders | | — |
| | — |
| | — |
| | — |
| | — |
| | — |
| | — |
| | — |
| | 675 |
| | 675 |
|
Distributions declared on Common Stock —
$0.55 per common share | | — |
| | — |
| | — |
| | — |
| | — |
| | — |
| | (515,935 | ) | | (515,935 | ) | | — |
| | (515,935 | ) |
| Distributions to non-controlling interest holders | | — |
| | — |
| | — |
| | — |
| | — |
| | — |
| | — |
| | — |
| | (13,183 | ) | | (13,183 | ) |
| Dividend equivalents on awards granted under the Equity Plan | | — |
| | — |
| | — |
| | — |
| | — |
| | — |
| | (1,260 | ) | | (1,260 | ) | | — |
| | (1,260 | ) |
| Distributions to preferred shareholders and unitholders | | — |
| | — |
| | — |
| | — |
| | — |
| | — |
| | (71,748 | ) | | (71,748 | ) | | (144 | ) | | (71,892 | ) |
| Cumulative effect adjustment for equity-based compensation forfeitures | | — |
| | — |
| | — |
| | — |
| | 384 |
| | — |
| | (384 | ) | | — |
| | — |
| | — |
|
| Net loss | | — |
| | — |
| | — |
| | — |
| | — |
| | — |
| | (195,863 | ) | | (195,863 | ) | | (4,961 | ) | | (200,824 | ) |
| Other comprehensive loss | | — |
| | — |
| | — |
| | — |
| | — |
| | (531 | ) | | — |
| | (531 | ) | | (28 | ) | | (559 | ) |
| Balance, December 31, 2016 | | 42,834,138 |
| | $ | 428 |
| | 974,146,650 |
| | $ | 9,741 |
| | $ | 12,640,171 |
| | $ | (2,556 | ) | | $ | (4,200,423 | ) | | $ | 8,447,361 |
| | $ | 172,172 |
| | $ | 8,619,533 |
|
| Repurchases of Common Stock under 2017 Share Repurchase Program | | — |
| | — |
| | (68,759 | ) | | (1 | ) | | (517 | ) | | — |
| | — |
| | (518 | ) | | — |
| | (518 | ) |
| Repurchases of Common Stock to settle tax obligation | | — |
| | — |
| | (268,550 | ) | | (2 | ) | | (2,146 | ) | | — |
| | — |
| | (2,148 | ) | | — |
| | (2,148 | ) |
| Equity-based compensation, net | | — |
| | — |
| | 399,242 |
| | 4 |
| | 16,750 |
| | — |
| | — |
| | 16,754 |
| | — |
| | 16,754 |
|
| Contributions from non-controlling interest holders | | — |
| | — |
| | — |
| | — |
| | — |
| | — |
| | — |
| | — |
| | 101 |
| | 101 |
|
Distributions declared on Common Stock —
$0.55 per common share | | — |
| | — |
| | — |
| | — |
| | — |
| | — |
| | (535,657 | ) | | (535,657 | ) | | — |
| | (535,657 | ) |
| Distributions to non-controlling interest holders | | — |
| | — |
| | — |
| | — |
| | — |
| | — |
| | — |
| | — |
| | (13,227 | ) | | (13,227 | ) |
| Dividend equivalents on awards granted under the Equity Plan | | — |
| | — |
| | — |
| | — |
| | — |
| | — |
| | (571 | ) | | (571 | ) | | — |
| | (571 | ) |
| Distributions to preferred shareholders and unitholders | | — |
| | — |
| | — |
| | — |
| | — |
| | — |
| | (71,748 | ) | | (71,748 | ) | | (144 | ) | | (71,892 | ) |
| Disposition of joint venture | | — |
| | — |
| | — |
| | — |
| | — |
| | — |
| | — |
| | — |
| | (838 | ) | | (838 | ) |
| Net income | | — |
| | — |
| | — |
| | — |
| | — |
| | — |
| | 31,818 |
| | 31,818 |
| | 560 |
| | 32,378 |
|
| Other comprehensive income | | — |
| | — |
| | — |
| | — |
| | — |
| | (1,013 | ) | | — |
| | (1,013 | ) | | (26 | ) | | (1,039 | ) |
| Balance, December 31, 2017 | | 42,834,138 |
| | $ | 428 |
| | 974,208,583 |
| | $ | 9,742 |
| | $ | 12,654,258 |
| | $ | (3,569 | ) | | $ | (4,776,581 | ) | | $ | 7,884,278 |
| | $ | 158,598 |
| | $ | 8,042,876 |
|
| Conversion of OP Units to Common Stock | | — |
| | — |
| | 32,439 |
| | — |
| | 241 |
| | — |
| | — |
| | 241 |
| | (241 | ) | | — |
|
VEREIT, INC. AND
CONSOLIDATED STATEMENTS OF CHANGES IN EQUITY – (Continued)
(In thousands, except for share data)
|
| | | | | | | | | | | | | | | | | | | | | | | | | | | | | | | | | | | | | | |
| | | Preferred Stock | | Common Stock | | | | | | | | | | | | |
| | | Number
of Shares | | Par
Value | | Number
of Shares | | Par
Value | | Additional Paid-In Capital | | Accumulated Other Comprehensive Loss | | Accumulated
Deficit | | Total Stock-holders’ Equity | | Non-Controlling Interests | | Total Equity |
| Repurchases of Common Stock under Share Repurchase Programs | | — |
| | $ | — |
| | (7,206,876 | ) | | $ | (72 | ) | | $ | (50,082 | ) | | $ | — |
| | $ | — |
| | $ | (50,154 | ) | | $ | — |
| | (50,154 | ) |
| Repurchases of Common Stock to settle tax obligation | | — |
| | — |
| | (324,502 | ) | | (2 | ) | | (2,324 | ) | | — |
| | — |
| | (2,326 | ) | | — |
| | (2,326 | ) |
| Equity-based compensation, net | | — |
| | — |
| | 805,521 |
| | 7 |
| | 13,307 |
| | — |
| | — |
| | 13,314 |
| | — |
| | 13,314 |
|
| Contributions from non-controlling interest holders | | — |
| | — |
| | — |
| | — |
| | — |
| | — |
| | — |
| | — |
| | 120 |
| | 120 |
|
Distributions declared on Common Stock —
$0.55 per common share | | — |
| | — |
| | — |
| | — |
| | — |
| | — |
| | (532,144 | ) | | (532,144 | ) | | — |
| | (532,144 | ) |
| Distributions to non-controlling interest holders | | — |
| | — |
| | — |
| | — |
| | — |
| | — |
| | — |
| | — |
| | (13,048 | ) | | (13,048 | ) |
| Dividend equivalents on awards granted under the Equity Plan | | — |
| | — |
| | — |
| | — |
| | 72 |
| | — |
| | (989 | ) | | (917 | ) | | — |
| | (917 | ) |
| Distributions to preferred shareholders and unitholders | | — |
| | — |
| | — |
| | — |
| | — |
| | — |
| | (71,748 | ) | | (71,748 | ) | | (144 | ) | | (71,892 | ) |
| Net loss | | — |
| | — |
| | — |
| | — |
| | — |
| | — |
| | (85,774 | ) | | (85,774 | ) | | (2,256 | ) | | (88,030 | ) |
| Other comprehensive loss | | — |
| | — |
| | — |
| | — |
| | — |
| | 2,289 |
| | — |
| | 2,289 |
| | 56 |
| | 2,345 |
|
| Balance, December 31, 2018 | | 42,834,138 |
|
| $ | 428 |
|
| 967,515,165 |
|
| $ | 9,675 |
|
| $ | 12,615,472 |
|
| $ | (1,280 | ) |
| $ | (5,467,236 | ) |
| $ | 7,157,059 |
|
| $ | 143,085 |
|
| $ | 7,300,144 |
|
The accompanying notes are an integral part of these statements.
VEREIT, INC.
CONSOLIDATED STATEMENTS OF CASH FLOWS
(In thousands)
|
| | | | | | | | | | | | |
| | | Year Ended December 31, |
| | | 2018 | | 2017 | | 2016 |
| Cash flows from operating activities: | | | | |
| | |
| Net (loss) income | | $ | (88,030 | ) | | $ | 32,378 |
| | $ | (200,824 | ) |
| Adjustments to reconcile net (loss) income to net cash provided by operating activities: | | | | | | |
| Depreciation and amortization | | 659,948 |
| | 745,499 |
| | 806,548 |
|
| Gain on real estate assets, net | | (96,068 | ) | | (61,536 | ) | | (55,722 | ) |
| Impairments from held for sale | | — |
| | 20,027 |
| | — |
|
| Impairments | | 54,647 |
| | 50,548 |
| | 303,751 |
|
| Equity-based compensation | | 13,314 |
| | 16,751 |
| | 10,728 |
|
| Equity in income of unconsolidated entities and gain on joint venture | | (1,869 | ) | | (2,726 | ) | | 415 |
|
| Distributions from unconsolidated entities | | 1,366 |
| | 3,646 |
| | 1,433 |
|
| Gain on investments | | (4,092 | ) | | (65 | ) | | — |
|
| (Gain) loss on derivative instruments, net | | (355 | ) | | (2,976 | ) | | 1,191 |
|
| (Gain) loss on extinguishment and forgiveness of debt, net | | (5,360 | ) | | (18,373 | ) | | 771 |
|
| Changes in assets and liabilities: | | | | | | |
| Investment in direct financing leases | | 2,078 |
| | 2,097 |
| | 3,976 |
|
| Rent and tenant receivables and other assets, net | | (34,096 | ) | | (21,394 | ) | | (52,626 | ) |
| Due from affiliates | | — |
| | 1,163 |
| | (416 | ) |
| Assets held for sale classified as discontinued operations | | (2,492 | ) | | 13,812 |
| | — |
|
| Accounts payable and accrued expenses | | 1,688 |
| | 10,742 |
| | (3,323 | ) |
| Deferred rent and other liabilities | | 7,162 |
| | (395 | ) | | (17,740 | ) |
| Due to affiliates | | (66 | ) | | 50 |
| | (214 | ) |
| Liabilities related to discontinued operations | | (13,861 | ) | | 4,019 |
| | — |
|
| Net cash provided by operating activities | | 493,914 |
| | 793,267 |
|
| 797,948 |
|
| Cash flows from investing activities: | | | | | | |
| Investments in real estate assets | | (500,625 | ) | | (699,004 | ) | | (100,194 | ) |
| Capital expenditures and leasing costs | | (22,291 | ) | | (21,694 | ) | | (16,568 | ) |
| Real estate developments | | (9,221 | ) | | (14,850 | ) | | (17,411 | ) |
| Principal repayments received on investment securities and mortgage notes receivable | | 5,761 |
| | 6,796 |
| | 5,417 |
|
| Investments in unconsolidated entities | | (771 | ) | | — |
| | (25,777 | ) |
| Return of investment from unconsolidated entities | | 48 |
| | 1,972 |
| | 2,580 |
|
| Proceeds from disposition of real estate and joint venture | | 502,289 |
| | 445,525 |
| | 1,000,700 |
|
| Proceeds from disposition of discontinued operations | | 122,915 |
| | — |
| | — |
|
| Investment in leasehold improvements and other assets | | (841 | ) | | (1,191 | ) | | (2,259 | ) |
| Deposits for real estate assets | | (13,412 | ) | | (37,226 | ) | | (17,856 | ) |
| Proceeds from sale of investments and other assets | | 46,966 |
| | 400 |
| | — |
|
| Uses and refunds of deposits for real estate assets | | 17,267 |
| | 36,111 |
| | 13,305 |
|
| Proceeds from the settlement of property-related insurance claims | | 1,434 |
| | 355 |
| | — |
|
| Line of credit advances to Cole REITs | | (2,200 | ) | | (16,400 | ) | | (10,300 | ) |
| Line of credit repayments from Cole REITs | | 3,800 |
| | 25,100 |
| | 50,000 |
|
| Net cash provided by (used in) investing activities | | 151,119 |
| | (274,106 | ) |
| 881,637 |
|
| Cash flows from financing activities: | | | | | | |
| Proceeds from mortgage notes payable | | 187 |
| | 4,652 |
| | 3,112 |
|
| Payments on mortgage notes payable and other debt, including debt extinguishment costs | | (137,887 | ) | | (424,385 | ) | | (337,022 | ) |
| Proceeds from credit facility | | 1,934,000 |
| | 329,000 |
| | 1,033,000 |
|
| Payments on credit facility | | (1,716,000 | ) | | (645,107 | ) | | (1,993,000 | ) |
| Proceeds from corporate bonds | | 546,304 |
| | 600,000 |
| | 1,000,000 |
|
| Payments on corporate bonds, including extinguishment costs | | — |
| | — |
| | (1,311,203 | ) |
| Repayment of convertible notes | | (597,500 | ) | | — |
| | — |
|
| Payments of deferred financing costs | | (25,471 | ) | | (9,575 | ) | | (19,872 | ) |
| Repurchases of Common Stock under the Share Repurchase Programs | | (50,154 | ) | | (518 | ) | | — |
|
| Proceeds from 2016 term loan | | — |
| | — |
| | 300,000 |
|
VEREIT, INC.
CONSOLIDATED STATEMENTS OF CASH FLOWS – (Continued)
(In thousands)
|
| | | | | | | | | | | | |
| | | Year Ended December 31, |
| | | 2018 | | 2017 | | 2016 |
| Repayment of 2016 term loan | | $ | — |
| | $ | — |
| | $ | (300,000 | ) |
| Repurchases of Common Stock to settle tax obligations | | (2,326 | ) | | (2,148 | ) | | (4,652 | ) |
| Proceeds from the issuance of Common Stock, net of underwriters’ discount | | — |
| | — |
| | 702,765 |
|
| Payments of equity issuance costs | | — |
| | — |
| | (280 | ) |
| Contributions from non-controlling interest holders | | 120 |
| | 101 |
| | 675 |
|
| Distributions paid | | (606,679 | ) | | (608,615 | ) | | (580,508 | ) |
| Net cash used in financing activities | | (655,406 | ) | | (756,595 | ) |
| (1,506,985 | ) |
| Net change in cash and cash equivalents and restricted cash | | (10,373 | ) | | (237,434 | ) | | 172,600 |
|
| | | | | | | |
| Cash and cash equivalents and restricted cash, beginning of period | | $ | 64,036 |
| | $ | 301,470 |
| | $ | 128,870 |
|
| Less: cash and cash equivalents of discontinued operations | | (2,198 | ) | | (2,973 | ) | | (4,968 | ) |
| Cash and cash equivalents and restricted cash from continuing operations, beginning of period | | 61,838 |
| | 298,497 |
| | 123,902 |
|
| | | | | | | |
| Cash and cash equivalents, and restricted cash, end of period | | 53,663 |
| | 64,036 |
| | 301,470 |
|
| Less: cash and cash equivalents of discontinued operations | | — |
| | (2,198 | ) | | (2,973 | ) |
| Cash and cash equivalents and restricted cash from continuing operations, end of period | | $ | 53,663 |
| | $ | 61,838 |
|
| $ | 298,497 |
|
| Reconciliation of Cash and Cash Equivalents and Restricted Cash | | | | | | |
| Cash and cash equivalents at beginning of period | | $ | 34,176 |
| | $ | 253,479 |
| | $ | 64,135 |
|
| Restricted cash at beginning of period | | 27,662 |
| | 45,018 |
| | 59,767 |
|
| Cash and cash equivalents and restricted cash at beginning of period | | 61,838 |
| | 298,497 |
| | 123,902 |
|
| | | | | | | |
| Cash and cash equivalents at end of period | | 30,758 |
| | 34,176 |
| | 253,479 |
|
| Restricted cash at end of period | | 22,905 |
| | 27,662 |
| | 45,018 |
|
| Cash and cash equivalents and restricted cash at end of period | | $ | 53,663 |
| | $ | 61,838 |
| | $ | 298,497 |
|
The accompanying notes are an integral part of these statements.
VEREIT OPERATING PARTNERSHIP, L.P.
CONSOLIDATED BALANCE SHEETS
(In thousands, except for unit data)
|
| | | | | | | | |
| | | December 31, 2018 | | December 31, 2017 |
| ASSETS | | | | |
| Real estate investments, at cost: | | | | |
| Land | | $ | 2,843,212 |
| | $ | 2,865,855 |
|
| Buildings, fixtures and improvements | | 10,749,228 |
| | 10,711,845 |
|
| Intangible lease assets | | 2,012,399 |
| | 2,037,675 |
|
| Total real estate investments, at cost | | 15,604,839 |
|
| 15,615,375 |
|
| Less: accumulated depreciation and amortization | | 3,436,772 |
| | 2,908,028 |
|
| Total real estate investments, net | | 12,168,067 |
|
| 12,707,347 |
|
| Investment in unconsolidated entities | | 35,289 |
| | 39,520 |
|
| Cash and cash equivalents | | 30,758 |
| | 34,176 |
|
| Restricted cash | | 22,905 |
| | 27,662 |
|
| Rent and tenant receivables and other assets, net | | 366,092 |
| | 389,060 |
|
| Goodwill | | 1,337,773 |
| | 1,337,773 |
|
| Due from affiliates, net | | — |
| | 6,041 |
|
| Real estate assets held for sale and assets related to discontinued operations, net | | 2,609 |
| | 163,999 |
|
| Total assets | | $ | 13,963,493 |
|
| $ | 14,705,578 |
|
| | | | | |
| LIABILITIES AND EQUITY | | | | |
|
| Mortgage notes payable, net | | $ | 1,922,657 |
| | $ | 2,082,692 |
|
| Corporate bonds, net | | 3,368,609 |
| | 2,821,494 |
|
| Convertible debt, net | | 394,883 |
| | 984,258 |
|
| Credit facility, net | | 401,773 |
| | 185,000 |
|
| Below-market lease liabilities, net | | 173,479 |
| | 198,551 |
|
| Accounts payable and accrued expenses | | 145,611 |
| | 136,474 |
|
| Deferred rent and other liabilities | | 69,714 |
| | 62,985 |
|
| Distributions payable | | 186,623 |
| | 175,301 |
|
| Due to affiliates | | — |
| | 66 |
|
| Liabilities related to discontinued operations | | — |
| | 15,881 |
|
| Total liabilities | | 6,663,349 |
|
| 6,662,702 |
|
| Commitments and contingencies (Note 10) | |
|
| |
|
|
| General Partner's preferred equity, 42,834,138 General Partner Series F Preferred Units issued and outstanding as of each of December 31, 2018 and December 31, 2017 | | 710,325 |
| | 782,073 |
|
| General Partner's common equity, 967,515,165 and 974,208,583 General Partner OP Units issued and outstanding as of December 31, 2018 and December 31, 2017, respectively | | 6,446,734 |
| | 7,102,205 |
|
| Limited Partner's preferred equity, 86,874 Limited Partner Series F Preferred Units issued and outstanding as of each of December 31, 2018 and December 31, 2017 | | 2,883 |
| | 3,027 |
|
| Limited Partner's common equity, 23,715,908 and 23,748,347 Limited Partner OP Units issued and outstanding as of December 31, 2018 and December 31, 2017, respectively | | 138,931 |
| | 154,266 |
|
| Total partners’ equity | | 7,298,873 |
|
| 8,041,571 |
|
| Non-controlling interests | | 1,271 |
| | 1,305 |
|
| Total equity | | 7,300,144 |
|
| 8,042,876 |
|
| Total liabilities and equity | | $ | 13,963,493 |
|
| $ | 14,705,578 |
|
The accompanying notes are an integral part of these statements.
VEREIT OPERATING PARTNERSHIP, L.P.
CONSOLIDATED STATEMENTS OF OPERATIONS
(In thousands, except for per unit data)
|
| | | | | | | | | | | | |
| | | Year Ended December 31, |
| | | 2018 | | 2017 | | 2016 |
| Rental revenue | | $ | 1,257,867 |
| | $ | 1,252,285 |
| | $ | 1,335,447 |
|
| Operating expenses: | | | | | | |
| Acquisition-related | | 3,632 |
| | 3,402 |
| | 1,321 |
|
| Litigation, merger and other non-routine costs, net of insurance recoveries | | 290,963 |
| | 47,960 |
| | 3,884 |
|
| Property operating | | 126,461 |
| | 128,717 |
| | 144,428 |
|
| General and administrative | | 63,933 |
| | 58,603 |
| | 51,927 |
|
| Depreciation and amortization | | 640,618 |
| | 706,802 |
| | 762,038 |
|
| Impairments | | 54,647 |
| | 50,548 |
| | 182,820 |
|
| Total operating expenses | | 1,180,254 |
|
| 996,032 |
| | 1,146,418 |
|
| Other (expense) income: | | | | | | |
| Interest expense | | (280,887 | ) | | (289,766 | ) | | (317,376 | ) |
| Gain (loss) on extinguishment and forgiveness of debt, net | | 5,360 |
| | 18,373 |
| | (771 | ) |
| Other income, net | | 14,735 |
| | 6,242 |
| | 5,251 |
|
| Equity in income and gain on disposition of unconsolidated entities | | 1,869 |
| | 2,763 |
| | 9,783 |
|
| Gain (loss) on derivative instruments, net | | 355 |
| | 2,976 |
| | (1,191 | ) |
| Gain on disposition of real estate and real estate assets held for sale, net | | 94,331 |
| | 61,536 |
| | 45,524 |
|
| Total other expenses, net | | (164,237 | ) |
| (197,876 | ) | | (258,780 | ) |
| (Loss) income before taxes | | (86,624 | ) |
| 58,377 |
| | (69,751 | ) |
| Provision for income taxes | | (5,101 | ) | | (6,882 | ) | | (7,136 | ) |
| (Loss) income from continuing operations | | (91,725 | ) | | 51,495 |
| | (76,887 | ) |
| Income (loss) from discontinued operations, net of income taxes | | 3,695 |
| | (19,117 | ) | | (123,937 | ) |
| Net (loss) income | | (88,030 | ) |
| 32,378 |
| | (200,824 | ) |
Net loss attributable to non-controlling interests (1) | | 154 |
| | 194 |
| | 14 |
|
| Net (loss) income attributable to the OP | | $ | (87,876 | ) |
| $ | 32,572 |
| | $ | (200,810 | ) |
| | | | | | | |
| Basic and diluted net loss per unit from continuing operations attributable to common unitholders | | $ | (0.17 | ) | | $ | (0.02 | ) | | $ | (0.16 | ) |
| Basic and diluted net income (loss) per unit from discontinued operations attributable to common unitholders | | $ | 0.00 |
| | $ | (0.02 | ) | | $ | (0.13 | ) |
Basic and diluted net loss per unit attributable to common unitholders (2) | | $ | (0.16 | ) | | $ | (0.04 | ) | | $ | (0.29 | ) |
| |
| (1) | Represents net loss attributable to consolidated joint venture partners. |
| |
| (2) | Amounts may not total due to rounding. |
The accompanying notes are an integral part of these statements.
VEREIT OPERATING PARTNERSHIP, L.P.
CONSOLIDATED STATEMENTS OF COMPREHENSIVE INCOME (LOSS)
(In thousands)
|
| | | | | | | | | | | | |
| | | Year Ended December 31, |
| | | 2018 | | 2017 | | 2016 |
| Net (loss) income | | $ | (88,030 | ) | | $ | 32,378 |
| | $ | (200,824 | ) |
| Other comprehensive income (loss): | | | | | | |
| Unrealized gain (loss) on interest rate derivatives | | — |
| | (18 | ) | | (7,685 | ) |
| Reclassification of previous unrealized loss (gain) on interest rate derivatives into net (loss) income | | 313 |
| | (70 | ) | | 9,397 |
|
| Unrealized loss on investment securities, net | | (205 | ) | | (951 | ) | | (2,271 | ) |
| Reclassification of previous unrealized loss (gain) on investment securities into net (loss) income as other income, net | | 2,237 |
| | — |
| | — |
|
| Total other comprehensive income (loss) | | 2,345 |
|
| (1,039 | ) | | (559 | ) |
| | | | | | | |
| Total comprehensive (loss) income | | (85,685 | ) |
| 31,339 |
| | (201,383 | ) |
Comprehensive loss attributable to non-controlling interests (1) | | 154 |
| | 194 |
| | 14 |
|
| Total comprehensive (loss) income attributable to the OP | | $ | (85,531 | ) |
| $ | 31,533 |
| | $ | (201,369 | ) |
| |
| (1) | Represents comprehensive loss attributable to consolidated joint venture partners. |
The accompanying notes are an integral part of these statements.
VEREIT OPERATING PARTNERSHIP, L.P.
CONSOLIDATED STATEMENTS OF CHANGES IN EQUITY
(In thousands, except for unit data)
|
| | | | | | | | | | | | | | | | | | | | | | | | | | | | | | | | | | | | | | | | |
| | | Preferred Units | | Common Units | | | | | | |
| | | General Partner | | Limited Partner | | General Partner | | Limited Partner | | | | | | |
| | | Number of Units | | Capital | | Number of Units | | Capital | | Number of Units | | Capital | | Number of Units | | Capital | | Total Partners' Capital | | Non-Controlling Interests | | Total Capital |
| Balance, January 1, 2016 | | 42,834,138 |
| | $ | 925,569 |
| | 86,874 |
| | $ | 3,315 |
| | 904,884,394 |
| | $ | 7,598,418 |
| | 23,763,797 |
| | $ | 184,800 |
|
| $ | 8,712,102 |
| | $ | 1,857 |
|
| $ | 8,713,959 |
|
| Issuance of common OP Units | | — |
| | — |
| | — |
| | — |
| | 69,000,000 |
| | 702,476 |
| | — |
| | — |
| | 702,476 |
| | — |
| | 702,476 |
|
| Conversion of limited partners' common OP Units to General Partner's common OP Units | | — |
| | — |
| | — |
| | — |
| | 15,450 |
| | 159 |
| | (15,450 | ) | | (159 | ) | | — |
| | — |
| | — |
|
| Repurchases of common OP Units to settle tax obligation | | — |
| | — |
| | — |
| | — |
| | (481,261 | ) | | (4,652 | ) | | — |
| | — |
| | (4,652 | ) | | — |
| | (4,652 | ) |
| Equity-based compensation, net | | — |
| | — |
| | — |
| | — |
| | 728,067 |
| | 10,728 |
| | — |
| | — |
| | 10,728 |
| | — |
| | 10,728 |
|
| Contributions from non-controlling interest holders | | — |
| | — |
| | — |
| | — |
| | — |
| | — |
| | — |
| | — |
| | — |
| | 675 |
| | 675 |
|
| Distributions to common OP Units and non-controlling interests —$0.55 per common unit | | — |
| | — |
| | — |
| | — |
| | — |
| | (515,935 | ) | | — |
| | (13,068 | ) | | (529,003 | ) | | (115 | ) | | (529,118 | ) |
| Dividend equivalents on awards granted under the Equity Plan | | — |
| | — |
| | — |
| | — |
| | — |
| | (1,260 | ) | | — |
| | — |
| | (1,260 | ) | | — |
| | (1,260 | ) |
| Distributions to preferred OP Units | | — |
| | (71,748 | ) | | — |
| | (144 | ) | | — |
| | — |
| | — |
| | — |
| | (71,892 | ) | | — |
| | (71,892 | ) |
| Net loss | | — |
| | — |
| | — |
| | — |
| | — |
| | (195,863 | ) | | — |
| | (4,947 | ) | | (200,810 | ) | | (14 | ) | | (200,824 | ) |
| Other comprehensive loss | | — |
| | — |
| | — |
| | — |
| | — |
| | (531 | ) | | — |
| | (28 | ) | | (559 | ) | | — |
| | (559 | ) |
| Balance, December 31, 2016 | | 42,834,138 |
|
| $ | 853,821 |
|
| 86,874 |
|
| $ | 3,171 |
|
| 974,146,650 |
|
| $ | 7,593,540 |
|
| 23,748,347 |
|
| $ | 166,598 |
|
| $ | 8,617,130 |
|
| $ | 2,403 |
|
| $ | 8,619,533 |
|
| Repurchases of common OP Units under the 2017 Share Repurchase Program | | — |
| | — |
| | — |
| | — |
| | (68,759 | ) | | (518 | ) | | — |
| | — |
| | (518 | ) | | — |
| | (518 | ) |
| Repurchases of common OP Units to settle tax obligation | | — |
| | — |
| | — |
| | — |
| | (268,550 | ) | | (2,148 | ) | | — |
| | — |
| | (2,148 | ) | | — |
| | (2,148 | ) |
| Equity-based compensation, net | | — |
| | — |
| | — |
| | — |
| | 399,242 |
| | 16,754 |
| | — |
| | — |
| | 16,754 |
| | — |
| | 16,754 |
|
| Contributions from non-controlling interest holders | | — |
| | — |
| | — |
| | — |
| | — |
| | — |
| | — |
| | — |
| | — |
| | 101 |
| | 101 |
|
| Distributions to common OP Units and non-controlling interests —$0.55 per common unit | | — |
| | — |
| | — |
| | — |
| | — |
| | (535,657 | ) | | — |
| | (13,060 | ) | | (548,717 | ) | | (167 | ) | | (548,884 | ) |
| Dividend equivalents on awards granted under the Equity Plan | | — |
| | — |
| | — |
| | — |
| | — |
| | (571 | ) | | — |
| | — |
| | (571 | ) | | — |
| | (571 | ) |
| Distributions to preferred OP Units | | — |
| | (71,748 | ) | | — |
| | (144 | ) | | — |
| | — |
| | — |
| | — |
| | (71,892 | ) | | — |
| | (71,892 | ) |
| Disposition of consolidated joint venture interest | | — |
| | — |
| | — |
| | — |
| | — |
| | — |
| | — |
| | — |
| | — |
| | (838 | ) | | (838 | ) |
| Net income (loss) | | — |
| | — |
| | — |
| | — |
| | — |
| | 31,818 |
| | — |
| | 754 |
| | 32,572 |
| | (194 | ) | | 32,378 |
|
| Other comprehensive loss | | — |
| | — |
| | — |
| | — |
| | — |
| | (1,013 | ) | | — |
| | (26 | ) | | (1,039 | ) | | — |
| | (1,039 | ) |
| Balance, December 31, 2017 | | 42,834,138 |
|
| $ | 782,073 |
|
| 86,874 |
|
| $ | 3,027 |
|
| 974,208,583 |
|
| $ | 7,102,205 |
|
| 23,748,347 |
|
| $ | 154,266 |
|
| $ | 8,041,571 |
|
| $ | 1,305 |
|
| $ | 8,042,876 |
|
| Conversion of limited partners' common OP Units to General Partner's common OP Units | | — |
| | — |
| | — |
| | — |
| | 32,439 |
| | 241 |
| | (32,439 | ) | | (241 | ) | | — |
| | — |
| | — |
|
| Repurchases of common OP Units under Share Repurchase Programs | | — |
| | — |
| | — |
| | — |
| | (7,206,876 | ) | | (50,154 | ) | | — |
| | — |
| | (50,154 | ) | | — |
| | (50,154 | ) |
| Repurchases of common OP Units to settle tax obligation | | — |
| | — |
| | — |
| | — |
| | (324,502 | ) | | (2,326 | ) | | — |
| | — |
| | (2,326 | ) | | — |
| | (2,326 | ) |
| Equity-based compensation, net | | — |
| | — |
| | — |
| | — |
| | 805,521 |
| | 13,314 |
| | — |
| | — |
| | 13,314 |
| | — |
| | 13,314 |
|
| Contributions from non-controlling interest holders | | — |
| | — |
| | — |
| | — |
| | — |
| | — |
| | — |
| | — |
| | — |
| | 120 |
| | 120 |
|
| Distributions to common OP Units and non-controlling interests —$0.55 per common unit | | — |
| | — |
| | — |
| | — |
| | — |
| | (532,144 | ) | | — |
| | (13,048 | ) | | (545,192 | ) | | — |
| | (545,192 | ) |
VEREIT OPERATING PARTNERSHIP, L.P.
CONSOLIDATED STATEMENTS OF CHANGES IN EQUITY – (Continued)
(In thousands, except for unit data)
|
| | | | | | | | | | | | | | | | | | | | | | | | | | | | | | | | | | | | | | | | |
| | | Preferred Units | | Common Units | | | | | | |
| | | General Partner | | Limited Partner | | General Partner | | Limited Partner | | | | | | |
| | | Number of Units | | Capital | | Number of Units | | Capital | | Number of Units | | Capital | | Number of Units | | Capital | | Total Partners' Capital | | Non-Controlling Interests | | Total Capital |
| Dividend equivalents on awards granted under the Equity Plan | | — |
| | $ | — |
| | — |
| | $ | — |
| | — |
| | $ | (917 | ) | | — |
| | $ | — |
| | $ | (917 | ) | | $ | — |
| | $ | (917 | ) |
| Distributions to preferred OP Units | | — |
| | (71,748 | ) | | — |
| | (144 | ) | | — |
| | — |
| | — |
| | — |
| | (71,892 | ) | | — |
| | (71,892 | ) |
| Net loss | | — |
| | — |
| | — |
| | — |
| | — |
| | (85,774 | ) | | — |
| | (2,102 | ) | | (87,876 | ) | | (154 | ) | | (88,030 | ) |
| Other comprehensive income | | — |
| | — |
| | — |
| | — |
| | — |
| | 2,289 |
| | — |
| | 56 |
| | 2,345 |
| | — |
| | 2,345 |
|
| Balance, December 31, 2018 | | 42,834,138 |
| | $ | 710,325 |
| | 86,874 |
| | $ | 2,883 |
| | 967,515,165 |
| | $ | 6,446,734 |
| | 23,715,908 |
| | $ | 138,931 |
| | $ | 7,298,873 |
| | $ | 1,271 |
| | $ | 7,300,144 |
|
The accompanying notes are an integral part of these statements.
VEREIT OPERATING PARTNERSHIP, L.P.
CONSOLIDATED STATEMENTS OF CASH FLOWS
(In thousands)
|
| | | | | | | | | | | | |
| | | Year Ended December 31, |
| | | 2018 | | 2017 | | 2016 |
| Cash flows from operating activities: | | | | | | |
| Net (loss) income | | $ | (88,030 | ) | | $ | 32,378 |
| | $ | (200,824 | ) |
| Adjustments to reconcile net (loss) income to net cash provided by operating activities: | | | | | | |
| Depreciation and amortization | | 659,948 |
| | 745,499 |
| | 806,548 |
|
| Gain on real estate assets, net | | (96,068 | ) | | (61,536 | ) | | (55,722 | ) |
| Impairments from held for sale | | — |
| | 20,027 |
| | — |
|
| Impairments | | 54,647 |
| | 50,548 |
| | 303,751 |
|
| Equity based compensation | | 13,314 |
| | 16,751 |
| | 10,728 |
|
| Equity in income of unconsolidated entities | | (1,869 | ) | | (2,726 | ) | | 415 |
|
| Distributions from unconsolidated entities | | 1,366 |
| | 3,646 |
| | 1,433 |
|
| Gain on investments | | (4,092 | ) | | (65 | ) | | — |
|
| (Gain) loss on derivative instruments, net | | (355 | ) | | (2,976 | ) | | 1,191 |
|
| (Gain) loss on extinguishment of debt and forgiveness of debt | | (5,360 | ) | | (18,373 | ) | | 771 |
|
| Changes in assets and liabilities: | | | | | | |
| Investment in direct financing leases | | 2,078 |
| | 2,097 |
| | 3,976 |
|
| Rent and tenant receivables and other assets, net | | (34,096 | ) | | (21,394 | ) | | (52,626 | ) |
| Due from affiliates | | — |
| | 1,163 |
| | (416 | ) |
| Assets held for sale classified as discontinued operations | | (2,492 | ) | | 13,812 |
| | — |
|
| Accounts payable and accrued expenses | | 1,688 |
| | 10,742 |
| | (3,323 | ) |
| Deferred rent and other liabilities | | 7,162 |
| | (395 | ) | | (17,740 | ) |
| Due to affiliates | | (66 | ) | | 50 |
| | (214 | ) |
| Liabilities related to discontinued operations | | (13,861 | ) | | 4,019 |
| | — |
|
| Net cash provided by operating activities | | 493,914 |
|
| 793,267 |
| | 797,948 |
|
| Cash flows from investing activities: | | | | | | |
| Investments in real estate assets | | (500,625 | ) | | (699,004 | ) | | (100,194 | ) |
| Capital expenditures and leasing costs | | (22,291 | ) | | (21,694 | ) | | (16,568 | ) |
| Real estate developments | | (9,221 | ) | | (14,850 | ) | | (17,411 | ) |
| Principal repayments received on investment securities and mortgage notes receivable | | 5,761 |
| | 6,796 |
| | 5,417 |
|
| Investments in unconsolidated entities | | (771 | ) | | — |
| | (25,777 | ) |
| Return of investment from unconsolidated entities | | 48 |
| | 1,972 |
| | 2,580 |
|
| Proceeds from disposition of real estate and joint venture | | 502,289 |
| | 445,525 |
| | 1,000,700 |
|
| Proceeds from disposition of discontinued operations | | 122,915 |
| | — |
| | — |
|
| Investment in leasehold improvements and other assets | | (841 | ) | | (1,191 | ) | | (2,259 | ) |
| Deposits for real estate assets | | (13,412 | ) | | (37,226 | ) | | (17,856 | ) |
| Proceeds from sale of investments and other assets | | 46,966 |
| | 400 |
| | — |
|
| Uses and refunds of deposits for real estate assets | | 17,267 |
| | 36,111 |
| | 13,305 |
|
| Proceeds from the settlement of property-related insurance claims | | 1,434 |
| | 355 |
| | — |
|
| Line of credit advances to Cole REITs | | (2,200 | ) | | (16,400 | ) | | (10,300 | ) |
| Line of credit repayments from Cole REITs | | 3,800 |
| | 25,100 |
| | 50,000 |
|
| Net cash provided by (used in) investing activities | | 151,119 |
| | (274,106 | ) | | 881,637 |
|
| Cash flows from financing activities: | | | | | | |
| Proceeds from mortgage notes payable | | 187 |
| | 4,652 |
| | 3,112 |
|
| Payments on mortgage notes payable and other debt, including debt extinguishment costs | | (137,887 | ) | | (424,385 | ) | | (337,022 | ) |
| Proceeds from credit facility | | 1,934,000 |
| | 329,000 |
| | 1,033,000 |
|
| Payments on credit facility | | (1,716,000 | ) | | (645,107 | ) | | (1,993,000 | ) |
| Proceeds from corporate bonds | | 546,304 |
| | 600,000 |
| | 1,000,000 |
|
| Payments on corporate bonds, including extinguishment costs | | — |
| | — |
| | (1,311,203 | ) |
| Repayment of convertible notes | | (597,500 | ) | | — |
| | — |
|
| Payments of deferred financing costs | | (25,471 | ) | | (9,575 | ) | | (19,872 | ) |
| Proceeds from 2016 term loan | | — |
| | — |
| | 300,000 |
|
| Repayment of 2016 term loan | | — |
| | — |
| | (300,000 | ) |
VEREIT OPERATING PARTNERSHIP, L.P.
CONSOLIDATED STATEMENTS OF CASH FLOWS – (Continued)
(In thousands)
|
| | | | | | | | | | | | |
| | | Year Ended December 31, |
| | | 2018 | | 2017 | | 2016 |
| Repurchases of Common Stock under the Share Repurchase Programs | | $ | (50,154 | ) | | $ | (518 | ) | | $ | — |
|
| Repurchases of Common Stock to settle tax obligations | | (2,326 | ) | | (2,148 | ) | | (4,652 | ) |
| Proceeds from the issuance of common OP Units, net of underwriters’ discount | | — |
| | — |
| | 702,765 |
|
| Payments of equity issuance costs | | — |
| | — |
| | (280 | ) |
| Contributions from non-controlling interest holders | | 120 |
| | 101 |
| | 675 |
|
| Distributions paid | | (606,679 | ) | | (608,615 | ) | | (580,508 | ) |
| Net cash used in financing activities | | (655,406 | ) |
| (756,595 | ) | | (1,506,985 | ) |
| Net change in cash and cash equivalents and restricted cash | | (10,373 | ) | | (237,434 | ) | | 172,600 |
|
| | | | | | | |
| Cash and cash equivalents and restricted cash, beginning of period | | $ | 64,036 |
| | $ | 301,470 |
| | $ | 128,870 |
|
| Less: cash and cash equivalents of discontinued operations | | (2,198 | ) | | (2,973 | ) | | (4,968 | ) |
| Cash and cash equivalents and restricted cash from continuing operations, beginning of period | | 61,838 |
| | 298,497 |
| | 123,902 |
|
| | | | | | | |
| Cash and cash equivalents, and restricted cash, end of period | | 53,663 |
| | 64,036 |
| | 301,470 |
|
| Less: cash and cash equivalents of discontinued operations | | — |
| | (2,198 | ) | | (2,973 | ) |
| Cash and cash equivalents and restricted cash from continuing operations, end of period | | $ | 53,663 |
| | $ | 61,838 |
| | $ | 298,497 |
|
| Reconciliation of Cash and Cash Equivalents and Restricted Cash | | | | | | |
| Cash and cash equivalents at beginning of period | | $ | 34,176 |
| | $ | 253,479 |
| | $ | 64,135 |
|
| Restricted cash at beginning of period | | 27,662 |
| | 45,018 |
| | 59,767 |
|
| Cash and cash equivalents and restricted cash at beginning of period | | 61,838 |
| | 298,497 |
| | 123,902 |
|
| | | | | | | |
| Cash and cash equivalents at end of period | | 30,758 |
| | 34,176 |
| | 253,479 |
|
| Restricted cash at end of period | | 22,905 |
| | 27,662 |
| | 45,018 |
|
| Cash and cash equivalents and restricted cash at end of period | | $ | 53,663 |
| | $ | 61,838 |
| | $ | 298,497 |
|
The accompanying notes are an integral part of these statements.
VEREIT, INC. and VEREIT OPERATING PARTNERSHIP, L.P.
NOTES TO CONSOLIDATED FINANCIAL STATEMENTS
December 31, 2016 – (Continued)2018
The following table summarizes
Note 1 – Organization
VEREIT is a Maryland corporation, incorporated on December 2, 2010, that qualified as a real estate investment trust (“REIT”) for U.S. federal income tax purposes beginning in the scheduled aggregate principal repayments due on mortgage notes subsequent totaxable year ended December 31, 2016 (in thousands):2011. The OP is a Delaware limited partnership of which the General Partner is the sole general partner. VEREIT’s common stock, par value $0.01 per share (“Common Stock”), and its 6.70% Series F Cumulative Redeemable Preferred Stock, par value $0.01 per share (“Series F Preferred Stock”) trade on the New York Stock Exchange (“NYSE”) under the trading symbols, “VER” and “VER PRF,” respectively. As used herein, the terms the “Company,” “we,” “our” and “us” refer to VEREIT, together with its consolidated subsidiaries, including the OP.
VEREIT is a full-service real estate operating company which owns and manages one of the largest portfolios of single-tenant commercial properties in the U.S. VEREIT’s business model provides equity capital to creditworthy corporations in return for long-term leases on their properties. The Company actively manages its portfolio considering a number of metrics including property type, concentration and key economic factors for appropriate balance and diversity. |
| | | | |
| | | Total |
| 2017 | | $ | 287,094 |
|
| 2018 | | 209,259 |
|
| 2019 | | 229,547 |
|
| 2020 | | 282,223 |
|
| 2021 | | 383,110 |
|
| Thereafter | | 1,238,716 |
|
| Total | | $ | 2,629,949 |
|
Other Debt
AsSubstantially all of the Company’s operations are conducted through the OP. VEREIT is the sole general partner and holder of 97.6% of the common equity interests in the OP as of December 31, 2016,2018 with the remaining 2.4% of the common equity interests owned by unaffiliated investors and certain former directors, officers and employees of ARC Properties Advisors, LLC (the “Former Manager”). Under the limited partnership agreement of the OP, as amended (the “LPA”), after holding units of limited partner interests in the OP (“OP Units”), including Series F Preferred Units, for a period of one year and meeting the other requirements in the LPA, unless an earlier redemption is otherwise consented to by VEREIT, holders of OP Units, including Series F Preferred Units, have the right to redeem the units for the cash value of a corresponding number of shares of VEREIT’s Common Stock or VEREIT’s Series F Preferred Stock, as applicable, or, at the option of VEREIT, a corresponding number of shares of VEREIT’s Common Stock or Series F Preferred Stock. The remaining rights of the holders of OP Units are limited, however, and do not include the ability to replace the General Partner or to approve the sale, purchase or refinancing of the OP’s assets.
The actions of the OP and its relationship with the General Partner are governed by the LPA. The General Partner does not have any significant assets other than its investment in the OP. Therefore, the assets and liabilities of the General Partner and the OP are the same. Additionally, pursuant to the LPA, all administrative expenses and expenses associated with the formation, continuity, existence and operation of the General Partner incurred by the General Partner on the OP’s behalf shall be treated as expenses of the OP. Further, when the General Partner issues any equity instrument that has been approved by the General Partner’s Board of Directors, the LPA requires the OP to issue to the General Partner equity instruments with substantially similar terms, to protect the integrity of the Company’s umbrella partnership REIT structure, pursuant to which each holder of interests in the OP has a proportionate economic interest in the OP reflecting its capital contributions thereto. OP Units and Series F Preferred Units issued to the General Partner are referred to as “General Partner OP Units” and “General Partner Series F Preferred Units,” respectively. OP Units and Series F Preferred Units issued to parties other than the General Partner are referred to as “Limited Partner OP Units” and “Limited Partner Series F Preferred Units,” respectively. The LPA also provides that the OP issue debt with terms and provisions consistent with debt issued by the General Partner. The LPA will be amended to provide for the issuance of any additional class of equivalent equity instruments to the extent the General Partner’s Board of Directors authorizes the issuance of any new class of equity securities.
As discussed in Note 4 —Discontinued Operations, on February 1, 2018, the Company had a secured term loan from KBC Bank, N.V. with an outstanding principal balancecompleted the sale of $20.9 millionits investment management segment, Cole Capital. The assets, liabilities and remaining unamortized premiumrelated financial results of $0.1 million (the “KBC Loan”). substantially all of the Cole Capital segment are reflected in the financial statements as discontinued operations.
Note 2 –Summary of Significant Accounting Policies
Basis of Accounting
The interest couponconsolidated financial statements of the Company presented herein include the accounts of the General Partner and its consolidated subsidiaries, including the OP. All intercompany transactions have been eliminated upon consolidation. The financial statements are prepared on the KBC Loan is fixed at 5.81% annually until its maturityaccrual basis of accounting in January 2018. accordance with generally accepted accounting principles in the United States (“U.S. GAAP”).
Principles of Consolidation and Basis of Presentation
The KBC Loan is non-recourse toconsolidated financial statements include the accounts of the Company subject to limited non-recourse exceptions.and its consolidated subsidiaries and consolidated joint venture arrangements. The KBC Loan provides for monthly paymentsportions of both principal and interest. The scheduled principal repayments subsequent to December 31, 2016 are $7.7 million and $13.2 million for the years ended 2017 and 2018, respectively.
The KBC Loan is secured by various investment assets heldconsolidated joint venture arrangements not owned by the Company. The following table is a summary of the outstanding balance and carrying value of the collateral by asset type as of December 31, 2016 (in thousands):
|
| | | | | | | | |
| | | Outstanding Balance | | Collateral Carrying Value |
| Mortgage notes receivable | | $ | 6,791 |
| | $ | 19,204 |
|
| Intercompany mortgage loans | | 1,046 |
| | 2,648 |
|
| CMBS | | 13,110 |
| | 34,114 |
|
| Total | | $ | 20,947 |
|
| $ | 55,966 |
|
Corporate Bonds
As of December 31, 2016, the OP had $2.25 billion aggregate principal amount of senior unsecured notes (the “Senior Notes”) outstanding comprised of the following (dollar amounts in thousands):
|
| | | | | | | | | |
| | | Outstanding Balance December 31, 2016 | | Interest Rate | | Maturity Date |
| 2019 Senior Notes | | 750,000 |
| | 3.000 | % | | February 6, 2019 |
| 2021 Senior Notes | | 400,000 |
| | 4.125 | % | | June 1, 2021 |
| 2024 Senior Notes | | 500,000 |
| | 4.600 | % | | February 6, 2024 |
| 2026 Senior Notes | | 600,000 |
| | 4.875 | % | | June 1, 2026 |
| Total balance and weighted-average interest rate | | $ | 2,250,000 |
| | 4.056 | % | | |
On February 6, 2014, the Operating Partnership issued, in a private offering, $2.55 billion aggregate principal amount of senior unsecured notes consisting of $1.3 billion aggregate principal amount of 2.000% senior notes due 2017 (the “2017 Senior Notes”), $750.0 million aggregate principal amount of 3.00% senior notes due 2019 (the “2019 Senior Notes”) and $500.0 million aggregate principal amount of 4.60% senior notes due 2024 (the “2024 Senior Notes”).
On June 2, 2016, the Company closed its senior note offering, consisting of (i) $0.4 billion aggregate principal amount of 4.125% Senior Notes due June 1, 2021 (the “2021 Senior Notes”) and (ii) $0.6 billion aggregate principal amount of 4.875% Senior Notes due June 1, 2026 (the “2026 Senior Notes”) (the offering of the 2021 Senior Notes, collectively with the 2026 Senior Notes, the “2016 Bond Offering”).
On July 5, 2016, the Company redeemed the 2017 Senior Notes, plus accrued and unpaid interest thereon and the required make-whole premium. Upon consummation of these transactions, the Company had no 2017 Senior Notes outstanding. The Company recorded a loss related to the early extinguishment of $13.2 million which is included in (loss) gain on extinguishment and forgiveness of debt, net in the accompanying consolidated statements of operations.are presented
VEREIT, INC. ANDand VEREIT OPERATING PARTNERSHIP, L.P.
NOTES TO CONSOLIDATED FINANCIAL STATEMENTS
December 31, 2018 – (Continued)
as non-controlling interests in VEREIT’s and the OP’s consolidated balance sheets, statements of operations, statements of comprehensive income (loss) and statements of changes in equity. In addition, as described in Note 1 – Organization, certain third parties have been issued OP Units. Holders of OP Units are considered to be non-controlling interest holders in the OP and their ownership interest in the limited partner’s share is presented as non-controlling interests in VEREIT’s consolidated balance sheets, statements of operations, statements of comprehensive income (loss) and statements of changes in equity. Further, a portion of the earnings and losses of the OP are allocated to non-controlling interest holders based on their respective ownership percentages. Upon conversion of OP Units to Common Stock, any difference between the fair value of shares of Common Stock issued and the carrying value of the OP Units converted is recorded as a component of equity. As of each of December 31, 2018 and 2017, there were approximately 23.7 million Limited Partner OP Units outstanding.
For legal entities being evaluated for consolidation, the Company must first determine whether the interests that it holds and fees it receives qualify as variable interests in the entity. A variable interest is an investment or other interest that will absorb portions of an entity’s expected losses or receive portions of the entity’s expected residual returns. The Company’s evaluation includes consideration of fees paid to the Company where the Company acts as a decision maker or service provider to the entity being evaluated. If the Company determines that it holds a variable interest in an entity, it evaluates whether that entity is a variable interest entity (“VIE”). VIEs are entities where investors lack sufficient equity at risk for the entity to finance its activities without additional subordinated financial support or where equity investors, as a group, lack one of the following characteristics: (a) the power to direct the activities that most significantly impact the entity’s economic performance, (b) the obligation to absorb the expected losses of the entity, or (c) the right to receive the expected returns of the entity.
The Company then qualitatively assesses whether it is (or is not) the primary beneficiary of a VIE, which is generally defined as the party who has a controlling financial interest in the VIE. Consideration of various factors include, but are not limited to, the Company’s ability to direct the activities that most significantly impact the entity’s economic performance and its obligation to absorb losses from or right to receive benefits of the VIE that could potentially be significant to the VIE. The Company consolidates any VIEs when the Company is determined to be the primary beneficiary of the VIE and the difference between consolidating the VIE and accounting for it using the equity method could be material to the Company’s consolidated financial statements. The Company continually evaluates the need to consolidate these VIEs based on standards set forth in U.S. GAAP.
Reclassification
As described below, the following items previously reported have been reclassified to conform with the current period’s presentation.
The operating expense reimbursements line item has been combined into rental revenue for prior periods presented to be consistent with the current year presentation.
The investment in direct financing leases, net, investment securities, at fair value and mortgage notes receivable, net line items from prior periods have been combined into the rent and tenant receivables and other assets, net caption on the consolidated balance sheets. Investments in the Cole REITs, as defined in “Investment in Cole REITs” section herein, has also been reclassified as of December 31, 2017 to rent and tenant receivables and other assets, net from investment in unconsolidated entities to be consistent with the current year presentation. Refer to Note 5 – Rent and Tenant Receivables and Other Assets, Netfor reclassification amounts and additional information.
The distributions declared on Common Stock line item from prior periods has been updated to exclude distributions on restricted stock units (“Restricted Stock Units”) and deferred stock units (“Deferred Stock Units”) on the consolidated statements of changes in equity for all periods presented. These amounts are now included in the line item dividend equivalents on awards granted under the Equity Plan (as defined in Note 12 – Equity-based Compensation), which also includes dividend equivalents on restricted shares of Common Stock (“Restricted Shares”). The dividend equivalents on Restricted Shares were previously included in the line item distributions to participating securities in the consolidated statements of changes in equity.
Use of Estimates
The preparation of financial statements in conformity with U.S. GAAP requires management to make estimates and assumptions that affect the reported amounts of assets and liabilities and disclosure of contingent assets and liabilities at the date of the financial statements and the reported amounts of revenues and expenses during the reporting period. Actual results could differ from those estimates. Management makes significant estimates regarding goodwill and intangible asset impairments, real estate investment impairment, allocation of purchase price of real estate asset acquisitions and income taxes.
VEREIT, INC. and VEREIT OPERATING PARTNERSHIP, L.P.
NOTES TO CONSOLIDATED FINANCIAL STATEMENTS
December 31, 2018 – (Continued)
Real Estate Investments
The Company records acquired real estate at cost and makes assessments as to the useful lives of depreciable assets. The Company considers the period of future benefit of the asset to determine the appropriate useful lives. Depreciation is computed using a straight-line method over the estimated useful life of 40 years for buildings, five to 15 years for building fixtures and improvements and the remaining lease term for intangible lease assets.
Allocation of Purchase Price of Real Estate Assets
The Company allocates the purchase price of acquired properties to tangible and identifiable intangible assets and liabilities acquired based on their relative fair values. Tangible assets include land, buildings, fixtures and improvements on an as-if vacant basis. The Company utilizes various estimates, processes and information to determine the as-if vacant property value. Identifiable intangible assets and liabilities include amounts allocated to acquired leases for above-market and below-market lease rates and the value of in-place leases. In estimating fair values for purposes of allocating purchase price, the Company utilizes a number of sources, including independent appraisals that may be obtained in connection with the acquisition or financing of the respective property and other market data. The Company also considers information obtained about each property as a result of its pre-acquisition due diligence, as well as subsequent marketing and leasing activities, in estimating the fair value of the tangible and intangible assets acquired and intangible liabilities assumed.
The aggregate value of intangible assets related to in-place leases is primarily the difference between the property valued with existing in-place leases adjusted to market rental rates and the property valued as if vacant. Factors considered by the Company in its analysis of the in-place lease intangibles include an estimate of carrying costs during the expected lease-up period for each property, taking into account current market conditions and costs to execute similar leases. In estimating carrying costs, the Company includes real estate taxes, insurance and other operating expenses and estimates of lost rentals at market rates during the expected lease-up period, which typically ranges from six to 18 months. The Company also estimates costs to execute similar leases, including leasing commissions, legal and other related expenses. The value of in-place leases is amortized over the initial term of the respective leases. If a tenant terminates its lease, then the unamortized portion of the in-place lease value is charged to expense.
Above-market and below-market in-place lease values for owned properties are recorded based on the present value (using an interest rate which reflects the risks associated with the leases acquired) of the difference between the contractual amounts to be paid pursuant to the in-place leases and management’s estimate of fair market lease rates for the corresponding in-place leases, measured over a period equal to the remaining non-cancelable term of the lease, including any bargain renewal periods. Above-market leases are amortized as a reduction to rental revenue over the remaining terms of the respective leases. Below-market leases are amortized as an increase to rental revenue over the remaining terms of the respective leases, including any bargain renewal periods.
The determination of the fair values of the real estate assets and liabilities acquired requires the use of significant assumptions with regard to the current market rental rates, rental growth rates, capitalization and discount rates, interest rates and other variables. The use of alternative estimates may result in a different allocation of the Company’s purchase price, which could materially impact the Company’s results of operations.
In January 2017, the Company elected to early adopt ASU 2017-01, Business Combinations (Topic 805): Clarifying the Definition of a Business (“ASU 2017-01”), which clarifies the definition of a business by adding guidance to assist entities in evaluating whether transactions should be accounted for as acquisitions of assets or businesses. During the years ended December 31, 2018 and 2017, all real estate acquisitions qualified as asset acquisitions, and external acquisition costs related to asset acquisitions were capitalized and allocated to tangible and intangible assets and liabilities as described above. Prior to January 1, 2017, external costs related to property acquisitions were expensed as incurred. Internal costs, such as employee salaries, related to activities necessary to complete, or affect, self-originating asset acquisitions or business combinations are classified as acquisition-related expenses in the accompanying consolidated statements of operations for all periods presented.
Assets Held for Sale
Upon classifying a real estate investment as held for sale, the Company will no longer recognize depreciation expense related to the depreciable assets of the property. Assets held for sale are recorded at the lower of carrying value or estimated fair value, less the estimated cost to dispose of the assets. See Note 3–Real Estate Investments and Related Intangibles for further discussion regarding properties held for sale.
If circumstances arise that the Company previously considered unlikely and, as a result, the Company decides not to sell a property previously classified as held for sale, the Company will reclassify the property as held and used. The Company measures and records a property that is reclassified as held and used at the lower of (i) its carrying value before the property was classified
VEREIT, INC. and VEREIT OPERATING PARTNERSHIP, L.P.
NOTES TO CONSOLIDATED FINANCIAL STATEMENTS
December 31, 2018 – (Continued)
as held for sale, adjusted for any depreciation expense that would have been recognized had the property been continuously classified as held and used or (ii) the estimated fair value at the date of the subsequent decision not to sell.
Development Activities
Project costs, which include interest expense, associated with the development, construction and lease-up of a real estate project are capitalized as construction in progress. Once the development and construction of the building is substantially completed, the amounts capitalized to construction in progress are transferred to (i) land and (ii) buildings, fixtures and improvements and are depreciated over their respective useful lives.
Discontinued Operations
The Company reports discontinued operations when a component of an entity or group of components that has been disposed of or classified as held for sale represents a strategic shift that has or will have a major effect on an entity’s operations and financial results. The results of operations for assets meeting the definition of discontinued operations are reflected in the Company’s consolidated statements of operations as discontinued operations for all periods presented. See Note 4 —Discontinued Operations for further discussion regarding discontinued operations.
Investment in Unconsolidated Entities
Unconsolidated Joint Ventures
The Company accounts for its investment in unconsolidated joint venture arrangements using the equity method of accounting as the Company has the ability to exercise significant influence, but not control, over operating and financing policies of these investments. The equity method of accounting requires the investment to be initially recorded at cost and subsequently adjusted for the Company’s share of equity in the joint ventures’ earnings and distributions. The Company records its proportionate share of net income (loss) from the unconsolidated joint ventures in equity in income and gain on disposition of unconsolidated entities in the consolidated statements of operations. See Note 3–Real Estate Investments and Related Intangiblesfor further discussion on investments in unconsolidated joint ventures.
Investment in Cole REITs
As of December 31, 2017, the Company owned equity investments in Cole Credit Property Trust IV, Inc. (“CCPT IV”), CIM Income NAV, Inc. (formerly known as Cole Real Estate Income Strategy (Daily NAV), Inc.) (“INAV”), Cole Office & Industrial REIT (CCIT II), Inc. (“CCIT II”), Cole Office & Industrial REIT (CCIT III), Inc. (“CCIT III”), and Cole Credit Property Trust V, Inc. (“CCPT V” and collectively with CCPT IV, INAV, CCIT II and CCIT III, the “Cole REITs”). On February 1, 2018, the Company sold certain of its equity investments to CCA Acquisition, LLC (the “Cole Purchaser”), an affiliate of CIM Group, LLC, retaining interests in CCIT II, CCIT III and CCPT V. Subsequent to the sale of Cole Capital and the adoption of ASU 2016-01 (as defined in “Recent Accounting Pronouncements” section below), the Company carries these investments at fair value, as the Company does not exert significant influence over CCIT II, CCIT III or CCPT V, and any changes in the fair value are recognized in other income, net in the accompanying consolidated statement of operations for the year ended December 31, 2018.Prior to the sale of Cole Capital, the Company accounted for these investments using the equity method of accounting, which required the investment to be initially recorded at cost and subsequently adjusted for the Company’s share of equity in the respective Cole REIT’s earnings and distributions. The Company recorded its proportionate share of net income or loss from the Cole REITs in equity in income and gain on disposition of unconsolidated entities in the consolidated statement of operations for the year ended December 31, 2018.
Leasehold Improvements and Property and Equipment
The Company leases its corporate office facilities under operating leases. Leasehold improvements related to these are recorded at cost less accumulated amortization. Leasehold improvements are amortized over the lesser of the estimated useful life or remaining lease term.
Property and equipment, which typically include computer hardware and software, furniture and fixtures, among other items, are stated at cost less accumulated depreciation. Property and equipment are depreciated on a straight-line method over the estimated useful lives of the assets, which range from three to seven years. The Company reassesses the useful lives of its property and equipment and adjusts the future monthly depreciation expense based on the new useful life, as applicable. If the Company disposes of an asset, the asset and related accumulated depreciation are written off upon disposal.
VEREIT, INC. and VEREIT OPERATING PARTNERSHIP, L.P.
NOTES TO CONSOLIDATED FINANCIAL STATEMENTS
December 31, 2018 – (Continued)
Goodwill
In the case of a business combination, after identifying all tangible and intangible assets and liabilities, the excess consideration paid over the fair value of the assets and liabilities acquired and assumed, respectively, represents goodwill. In connection with prior mergers, the Company recorded goodwill as a result of the merger consideration exceeding the net assets acquired. As of December 31, 2018 and 2017, the carrying value of goodwill was $1.3 billion.
Prior to the adoption of ASU 2017-01 in January 2017, in the event the Company disposed of a property, or classified a property as an asset held for sale, that constituted a business under U.S. GAAP, the Company allocated a portion of the real estate investments reporting unit’s goodwill to that property in determining the gain or loss on the disposal of the property. The amount of goodwill allocated to the business was based on the relative fair value of the business to the fair value of the reporting unit. During the year ended December 31, 2016, the Company allocated $73.2 million of goodwill to dispositions and held for sale assets, which included $2.3 million of goodwill allocated to the cost basis of two properties foreclosed upon. The allocated goodwill of $73.2 million was included in gain on disposition of real estate and real estate assets held for sale, net, in the consolidated statement of operations.
Impairments
Real Estate Assets
The Company performs quarterly impairment review procedures, primarily through continuous monitoring of events and changes in circumstances that could indicate the carrying value of its real estate assets may not be recoverable. Impairment indicators that the Company considers include, but are not limited to, decrease in net operating income, bankruptcy or other credit concerns of a property’s major tenant or tenants, such as history of late payments, rental concessions and other factors, as well as significant decreases in a property’s revenues due to lease terminations, vacancies, co-tenancy clauses or reduced lease rates. When impairment indicators are identified or if a property is considered to have a more likely than not probability of being disposed of within the next 12 to 24 months, the Company assesses the recoverability of the assets by determining whether the carrying value of the assets will be recovered through the undiscounted future cash flows expected from the use of the assets and their eventual disposition. U.S. GAAP requires us to utilize the Company’s expected holding period of our properties when assessing recoverability. In the event that such expected undiscounted future cash flows do not exceed the carrying value, the Company will adjust the real estate assets to their respective fair values and recognize an impairment loss. Generally, fair value is determined using a discounted cash flow analysis and recent comparable sales or leasing transactions. The assumptions and uncertainties utilized in the evaluation of the impairment of real estate assets are discussed in Note 6 – Fair Value Measures.
Goodwill
The Company evaluates goodwill for impairment annually or more frequently when an event occurs or circumstances change that indicate the carrying value may not be recoverable. The Company’s annual testing date is during the fourth quarter. In 2017, the Company adopted ASU 2017-04, Intangibles – Goodwill and Others (Topic 350): Simplifying the Test for Goodwill Impairment, which allows the Company to test goodwill for impairment by comparing the carrying value of net assets to their respective fair value. If the fair value is determined to be less than the carrying value, an impairment charge will be recorded for the difference between the fair value and the carrying value. The Company estimates the fair value using discounted cash flows and relevant competitor multiples. The evaluation of goodwill for potential impairment requires the Company’s management to exercise significant judgment and to make certain assumptions. While the Company believes its assumptions are reasonable, there are no guarantees as to actual results. Changes in assumptions based on actual results may have a material impact on the Company’s financial results. The analysis performed for the annual goodwill tests during the years ended December 31, 2018, 2017 and 2016 resulted in no impairment. Goodwill related to discontinued operations is discussed in Note 4 —Discontinued Operations.
VEREIT, INC. and VEREIT OPERATING PARTNERSHIP, L.P.
NOTES TO CONSOLIDATED FINANCIAL STATEMENTS
December 31, 2018 – (Continued)
Investment in Unconsolidated Entities
The Company is required to determine whether an event or change in circumstances has occurred that may have a significant adverse effect on the fair value of any of its investment in the unconsolidated entities. If an event or change in circumstance has occurred, the Company is required to evaluate its investment in the unconsolidated entity for potential impairment and determine if the carrying value of its investment exceeds its fair value. An impairment charge is recorded when an impairment is deemed to be other-than-temporary. To determine whether an impairment is other-than-temporary, the Company considers whether it has the ability and intent to hold the investment until the carrying value is fully recovered. The evaluation of an investment in an unconsolidated entity for potential impairment requires the Company’s management to exercise significant judgment and to make certain assumptions. The use of different judgments and assumptions could result in different conclusions. No impairments of unconsolidated entities were identified during the years ended December 31, 2018, 2017 and 2016.
Leasehold Improvements and Property and Equipment
Leasehold improvements and property and equipment are reviewed for impairment when events or changes in circumstances indicate that the carrying value of such assets may not be recoverable. If this review indicates that the carrying value of the asset is not recoverable, the Company records an impairment loss, measured at fair value by estimated discounted cash flows or market appraisals. The evaluation of leasehold improvements and property and equipment for potential impairment requires the Company’s management to exercise significant judgment and to make certain assumptions. The use of different judgments and assumptions could result in different conclusions. No impairments of leasehold improvements and property and equipment were identified during the years ended December 31, 2018, 2017 and 2016.
Cash and Cash Equivalents
Cash and cash equivalents include cash in bank accounts, as well as investments in highly-liquid money market funds with original maturities of three months or less. The Company deposits cash with several high quality financial institutions. These deposits are guaranteed by the Federal Deposit Insurance Corporation (“FDIC”) up to an insurance limit of $250,000. At times, the Company’s cash and cash equivalents may exceed federally insured levels. Although the Company bears risk on amounts in excess of those insured by the FDIC, it has not experienced and does not anticipate any losses due to the high quality of the institutions where the deposits are held.
Restricted Cash
The Company had $22.9 million and $27.7 million, respectively, in restricted cash as of December 31, 2018 and 2017. Restricted cash primarily consists of reserves related to lease expirations, as well as maintenance, structural and debt service reserves. In accordance with certain debt agreements, rent from certain of the Company’s tenants is deposited directly into a lockbox account, from which the monthly debt service payments are disbursed to the lender and the excess funds are then disbursed to the Company. Included in restricted cash at December 31, 2018 was $21.5 million in lender reserves and $1.4 million held in restricted lockbox accounts. Included in restricted cash at December 31, 2017 was $26.4 million in lender reserves and $1.3 million held in restricted lockbox accounts.
Investment in Direct Financing Leases
The Company has acquired certain properties that are subject to leases that qualify as direct financing leases in accordance with U.S. GAAP due to the significance of the lease payments from the inception of the leases compared to the fair value of the property or due to bargain purchase options. Investments in direct financing leases represent the fair value of the remaining lease payments on the leases and the estimated fair value of any expected residual property value at the end of the lease term. The fair value of the remaining lease payments is estimated using a discounted cash flow analysis based on interest rates that would represent the Company’s incremental borrowing rate for similar types of debt. The expected residual property value at the end of the lease term is estimated using market data and assessments of the remaining useful lives of the properties at the end of the lease terms, among other factors. Income from direct financing leases is calculated using the effective interest method over the remaining term of the lease.
VEREIT, INC. and VEREIT OPERATING PARTNERSHIP, L.P.
NOTES TO CONSOLIDATED FINANCIAL STATEMENTS
December 31, 2018 – (Continued)
Deferred Financing Costs
Deferred financing costs represent commitment fees, legal fees and other costs associated with obtaining commitments for financing. Deferred financing costs, other than those associated with the Revolving Credit Facility (as defined in Note 7 –Debt), are presented on the consolidated balance sheets as a direct deduction from the carrying amount of the related debt liability rather than as an asset. These costs are amortized to interest expense over the terms of the respective financing agreements using the effective interest method. Unamortized deferred financing costs are written off when the associated debt is refinanced or repaid before maturity. Costs incurred in connection with potential financial transactions that are not completed are expensed in the period in which it is determined the financing will not be completed.
Convertible Debt
The Company has an outstanding aggregate balance of $402.5 million related to the 2020 Convertible Notes (as defined in Note 7 –Debt). The 2020 Convertible Notes are convertible into cash or shares of the Company’s Common Stock at the Company’s option. In accordance with U.S GAAP, the 2020 Convertible Notes are accounted for as a liability with a separate equity component recorded for the conversion option. A liability was recorded for the 2020 Convertible Notes on the issuance date at fair value based on a discounted cash flow analysis using current market rates for debt instruments with similar terms. The difference between the initial proceeds from the 2020 Convertible Notes and the estimated fair value of the debt instruments resulted in a debt discount, with an offset recorded to additional paid-in capital representing the equity component. The debt discount is being amortized to interest expense over the respective term of the 2020 Convertible Notes.
Derivative Instruments
The Company may use derivative financial instruments, including interest rate swaps, caps, options, floors and other interest rate derivative contracts, to hedge all or a portion of the interest rate risk associated with its borrowings. The principal objective of such agreements is to minimize the risks and/or costs associated with the Company’s operating and financial structure as well as to hedge specific anticipated transactions. The Company does not intend to utilize derivatives for purposes other than interest rate risk management.
The Company records all derivatives on the consolidated balance sheets at fair value. The accounting for changes in the fair value of derivatives depends on the intended use of the derivative, whether the Company has elected to designate a derivative in a hedging relationship and apply hedge accounting and whether the hedging relationship has satisfied the criteria necessary to apply hedge accounting. Derivatives designated and qualifying as a hedge of the exposure to changes in the fair value of an asset, liability, or firm commitment attributable to a particular risk, such as interest rate risk, are considered fair value hedges. Derivatives designated and qualifying as a hedge of the exposure to variability in expected future cash flows, or other types of forecasted transactions, are considered cash flow hedges. Derivatives may also be designated as hedges of the foreign currency exposure of a net investment in a foreign operation. Hedge accounting generally provides for the matching of the timing of gain or loss recognition on the hedging instrument with the recognition of the changes in the fair value of the hedged asset or liability that are attributable to the hedged risk in a fair value hedge or the earnings effect of the hedged forecasted transactions in a cash flow hedge. The Company may enter into derivative contracts that are intended to economically hedge certain of its risk, even though hedge accounting does not apply or the Company elects not to apply hedge accounting.
The accounting for subsequent changes in the fair value of these derivatives depends on whether each has been designated and qualifies for hedge accounting treatment. If the Company elects not to apply hedge accounting treatment, any changes in the fair value of these derivative instruments is recognized immediately in gain (loss) on derivative instruments, net in the consolidated statements of operations and consolidated statements of comprehensive income (loss). If the derivative is designated and qualifies for hedge accounting treatment, the change in the estimated fair value of the derivative is recorded in other comprehensive income (loss) to the extent that it is effective. Any ineffective portion of a derivative’s change in fair value will be immediately recognized in earnings.
As of December 31, 2018, the Company had one interest rate derivative that was not designated as a qualifying hedging relationship with a fair value of $0.5 million associated with a loan with a notional value of $50.7 million. As of December 31, 2017, the Company had two interest rate derivatives that were not designated as qualifying hedging relationships with an aggregate fair value of $0.6 million associated with loans with an aggregate notional value of $78.9 million. The fair value of the interest rate derivatives is included in rent and tenant receivables and other assets, net in the accompanying consolidated balance sheets.
Revenue Recognition
In May 2014, the U.S. Financial Accounting Standards Board (“FASB”) issued ASU 2014-09, Revenue from Contracts with Customers (“ASU 2014-09”) (Topic 606), which supersedes the revenue recognition requirements in Revenue Recognition,
VEREIT, INC. and VEREIT OPERATING PARTNERSHIP, L.P.
NOTES TO CONSOLIDATED FINANCIAL STATEMENTS
December 31, 2018 – (Continued)
Accounting Standards Codification (“ASC”) (Topic 605) and requires an entity to recognize revenue in a way that depicts the transfer of promised goods or services to customers in an amount that reflects the consideration to which the entity expects to be entitled in exchange for those goods or services. The Company adopted ASU 2014-09 and the related ASUs (collectively, the “Revenue ASUs”) during the first quarter of 2018 using the modified retrospective approach, which allows a cumulative effect adjustment to beginning retained earnings equal to initially applying the Revenue ASUs to all contracts with customers not completed as of the date of adoption. Adoption of the Revenue ASUs did not result in a cumulative effect adjustment to retained earnings as all contracts not completed as of adoption within the scope of Topic 606 have the same revenue recognition timing and measurement under Topic 605. Revenues generated through leasing arrangements are excluded from the Revenue ASUs as discussed below.
Revenue Recognition - Real Estate
The Company’s rental revenue is recognized when earned and collectability is reasonably assured and includes rental revenues and property operating expense reimbursements that each tenant pays in accordance with the terms of each lease. Rental revenue also includes amortization of above and below-market leases. Many of the leases have rent escalations and the rental revenue is recognized on a straight-line basis, which requires the Company to record a receivable that will only be received if the tenant makes all rent payments required through the expiration of the initial lease term. Straight-line rent receivables are included in rent and tenant receivables and other assets, net, in the consolidated balance sheets. See Note 5 – Rent and Tenant Receivables and Other Assets, Net. For leases that have contingent rental revenue based on a percentage of the tenant’s sales, the Company recognizes contingent rental revenue when the specified target is achieved.
The Company continually reviews receivables related to rent and unbilled rent receivables and determines collectability by taking into consideration the tenant’s payment history, the financial condition of the tenant, business conditions in the industry in which the tenant operates and economic conditions in the area in which the property is located. In the event that the collectability of a receivable is uncertain, the Company will record an increase in the allowance for uncollectible accounts in the consolidated balance sheets and bad debt expense in property operating expenses in the consolidated statements of operations. The Company suspends revenue recognition when the collectability of amounts due pursuant to a lease is no longer reasonably assured.
Revenue Recognition - Cole Capital
As discussed in Note 4 —Discontinued Operations, on February 1, 2018, the Company completed the sale of its investment management segment, Cole Capital. The assets, liabilities and related financial results of substantially all of the Cole Capital segment are reflected in the financial statements as discontinued operations.
Cole Capital earned securities sales commissions, dealer manager fees, distribution and stockholder servicing fees, real estate acquisition fees, financing coordination fees, property management fees, advisory fees, asset management fees and performance fees for services relating to the Cole REITs’ offerings and the investment and management of their respective assets, in accordance with the respective dealer manager and advisory agreements. The Company was also reimbursed for certain costs incurred in providing these services, which were recorded as revenue as the expenses were incurred subject to revenue constraint due to the limitations on the amount that was reimbursable based on the terms of the respective dealer manager and advisory agreements. Refer to Note 13 –Related Party Transactions and Arrangements for a disaggregation of Cole Capital revenues.
Revenue Recognition - Other
The Company entered into a services agreement (the “Services Agreement”) with the Cole Purchaser, pursuant to which the Company will continue to provide certain services to the Cole Purchaser and the Cole REITs, including operational real estate support, (“Transition Services Revenues”) through March 31, 2019 (or, if later, the date of the last government filing other than a tax filing made by any of the Cole REITs with respect to its 2018 fiscal year). Under the terms of the Services Agreement, the Company will be entitled to receive reimbursement for certain of the services provided. The Company recorded Transition Services Revenues as costs associated with providing such services were incurred, which coincided with the timing in which the performance obligations of the contract had been met. During the period from February 1, 2018 through December 31, 2018, the Company incurred $15.0 million of such costs and recognized revenues of $15.0 million, which are recorded in other income, net in the consolidated statement of operations. The Company may also receive additional fees over the next six years if future revenues of Cole Capital exceed a specified dollar threshold (the “Net Revenue Payments”), up to an aggregate of $80.0 million in Net Revenue Payments.
VEREIT, INC. and VEREIT OPERATING PARTNERSHIP, L.P.
NOTES TO CONSOLIDATED FINANCIAL STATEMENTS
December 31, 2018 – (Continued)
Litigation, Merger and Other Non-Routine Costs, Net of Insurance Recoveries
External costs incurred in relation to prior mergers and litigation resulting therefrom are included in litigation, merger and other non-routine costs, net of insurance recoveries in the consolidated statements of operations. The Company has also incurred legal fees and other costs associated with litigations and investigations resulting from the Audit Committee Investigation (defined below), which are considered non-routine. The Company has directors’ and officers’ insurance and the insurance carriers have paid certain defense costs subject to standard reservation of rights under the respective policies.
Litigation, merger and other non-routine costs, net of insurance recoveries include the following costs (amounts in thousands):
|
| | | | | | | | | | | | |
| | | Year Ended December 31, |
| | | 2018 | | 2017 | | 2016 |
| Merger Related Costs: | | | | | | |
Transfer taxes(1) | | $ | — |
| | $ | (1,595 | ) | | $ | 562 |
|
| Litigation and other non-routine costs: | | | | | | |
Audit Committee Investigation and related matters (2) | | $ | 59,755 |
| | $ | 49,434 |
| | $ | 24,207 |
|
Legal fees and expenses (3) | | 530 |
| | 421 |
| | 311 |
|
Litigation settlements (4) | | 233,246 |
| | — |
| | — |
|
| Total costs | | 293,531 |
|
| 48,260 |
| | 25,080 |
|
Insurance recoveries (5) | | (2,568 | ) | | (300 | ) | | (21,196 | ) |
| Total | | $ | 290,963 |
| | $ | 47,960 |
| | $ | 3,884 |
|
| |
| (1) | The negative balance for the year ended December 31, 2017 is a result of estimated costs accrued in prior periods that exceeded actual expenses incurred. |
| |
| (2) | Includes all fees and costs associated with various litigations and investigations prompted by the results of the 2014 investigation conducted by the audit committee (the “Audit Committee”) of the Company’s Board of Directors (the “Audit Committee Investigation”), including fees and costs incurred pursuant to the Company’s advancement obligations, litigation related thereto and in connection with related insurance recovery matters, net of accrual reversals. During the year ended December 31, 2018, the Company reversed an accrual of $10.9 million, as the Company was legally released from certain advancement obligations, and the accrued amounts were paid directly by the Company’s insurers to the payees subsequent to December 31, 2018. There were no reversals in the years ended December 31, 2017 and 2016. |
| |
| (3) | Includes legal fees and expenses associated with litigation resulting from prior mergers and related insurance recovery matters and excludes amounts presented in income from discontinued operations, net of income taxes in the consolidated statements of operations for the year ended December 31, 2018. |
| |
| (4) | Refer to Note 10– Commitments and Contingencies for additional information. |
| |
| (5) | $2.3 million recorded during the year ended December 31, 2018 relates to litigation resulting from prior mergers. |
Loss Contingencies
The Company records a liability in the consolidated financial statements for loss contingencies when a loss is known or considered probable and the amount is reasonably estimable. If the reasonable estimate of a known or probable loss is a range, and no amount within the range is a better estimate than any other, the minimum amount of the range is accrued. If a material loss is reasonably possible but not known or probable, and is reasonably estimable, the estimated loss or range of loss is disclosed.
Equity-based Compensation
The Company has an equity-based incentive award plan for non-executive directors, officers, other employees and advisors or consultants who provide services to the Company, as applicable, and a non-executive director restricted share plan, which are accounted for under U.S. GAAP for share-based payments. The expense for such awards is recognized over the vesting period or when the requirements for exercise of the award have been met. See Note 12 – Equity-based Compensation for additional information on these plans.
Per Share Data
Income (loss) per basic share of Common Stock is calculated by dividing net income (loss) less dividends on unvested Restricted Shares of Common Stock and dividends on preferred stock by the weighted-average number of shares of Common Stock issued and outstanding during such period. Diluted income (loss) per share of Common Stock considers the effect of potentially dilutive shares of Common Stock outstanding during the period.
Income Taxes
The General Partner elected to be taxed as a REIT for U.S. federal income tax purposes under Sections 856 through 860 of the Internal Revenue Code commencing with the taxable year ended December 31, 2011. We believe we are organized and operating in such a manner as to qualify to be taxed as a REIT for the taxable year ended December 31, 2018. As a REIT, the
VEREIT, INC. and VEREIT OPERATING PARTNERSHIP, L.P.
NOTES TO CONSOLIDATED FINANCIAL STATEMENTS
December 31, 2018 – (Continued)
General Partner is generally not subject to federal income tax on taxable income that it distributes to its stockholders so long as it distributes at least 90% of its annual taxable income (computed without regard to the deduction for dividends paid and excluding net capital gains). However, the General Partner, its TRS entities, and the OP are still subject to certain state and local income, franchise and property taxes in the various jurisdictions in which they operate. The General Partner may also be subject to federal income taxes on certain income and excise taxes on its undistributed income.
The OP is classified as a partnership for U.S. federal income tax purposes. As a partnership, the OP is not a taxable entity for U.S. federal income tax purposes. Instead, each partner in the OP is required to include its allocable share of the OP’s income, gains, losses, deductions and credits for each taxable year. Under the LPA, the OP is to conduct business in such a manner as to permit the General Partner at all times to qualify as a REIT.
A TRS is a subsidiary of a REIT that is subject to federal, state and local income taxes, as applicable. The Company’s use of a TRS enables it to engage in certain business activities while complying with the REIT qualification requirements and to retain any income generated by these businesses for reinvestment without the requirement to distribute those earnings. The Company conducted substantially all of the Cole Capital business activities through a TRS until it sold the Cole Capital business on February 1, 2018.
During the year ended December 31, 2018, the Company conducted all of its business in the United States, Puerto Rico and Canada and filed income tax returns in the U.S. federal jurisdiction, the Canadian federal jurisdiction and various state and local jurisdictions. With few exceptions, the Company is no longer subject to routine examinations by taxing authorities for years before 2014. Certain of the Company’s intercompany transactions that have been eliminated in consolidation for financial accounting purposes are also subject to taxation.
The Company provides for income taxes in accordance with current authoritative accounting and tax guidance. The tax provision or benefit related to significant or unusual items is recognized in the quarter in which those items occur. In addition, the effect of changes in enacted tax laws, rates or tax status is recognized in the quarter in which the change occurs. The accounting estimates used to compute the provision for or benefit from income taxes may change as new events occur, additional information is obtained or the tax environment changes.
During the years ended December 31, 2018, 2017 and 2016, the Company recognized state and local income and franchise tax expense of $4.7 million, $6.9 million and $6.0 million, respectively, which are included in provision for income taxes in the accompanying consolidated statements of operations. In addition, the Company recorded a provision for federal income taxes of $0.4 million and $1.1 million for the years ended December 31, 2018 and 2016 related to a TRS entity, which is also included in provision for income taxes in the accompanying consolidated statements of operations. No provision for federal income taxes related to a TRS entity was recorded for the year ended December 31, 2017. The provision for or benefit from income taxes attributable to the Cole Capital business, substantially all of which was conducted through a TRS entity, is included in discontinued operations for all periods presented, as discussed in Note 4 —Discontinued Operations.
The Company had no unrecognized tax benefits as of or during the years ended December 31, 2018, 2017 or 2016. Any interest and penalties related to unrecognized tax benefits would be recognized in provision for income taxes in the accompanying consolidated statements of operations.
As of December 31, 2018, the OP and the General Partner had no material uncertain income tax positions.
Recent Accounting Pronouncements
Adopted Accounting Standards
In January 2016, the FASB issued ASU 2016-01, Financial Instruments – Overall (Subtopic 825-10), Recognition and Measurement of Financial Assets and Financial Liabilities (“ASU 2016-01”), which requires equity investments (except those accounted for under the equity method of accounting or those that result in consolidation of the investee) to be measured at fair value with changes in fair value recognized in net income (loss). An entity may choose to measure equity investments that do not have a readily determinable fair value at costs minus impairment, if any, plus or minus changes resulting from observable price changes in orderly transactions for the identical or a similar investment of the same issue. ASU 2016-01 is effective for fiscal years, and interim periods within, beginning after December 15, 2017 and requires prospective treatment of equity securities without readily determinable fair values. The Company adopted ASU 2016-01 as of January 1, 2018 and recorded a $5.1 million gain, which is included in other income, net in the accompanying consolidated statements of operations, on measuring the Company’s investments in the Cole REITs at fair value after the investments were no longer accounted for using the equity method.
VEREIT, INC. and VEREIT OPERATING PARTNERSHIP, L.P.
NOTES TO CONSOLIDATED FINANCIAL STATEMENTS
December 31, 2018 – (Continued)
In February 2017, the FASB issued ASU 2017-05, Other Income – Gains and Losses from the Derecognition of Nonfinancial Assets (Subtopic 610-20): Clarifying the Scope of Asset Derecognition Guidance and Accounting for Partial Sales of Nonfinancial Assets (“ASU 2017-05”), which clarifies the following: 1) nonfinancial assets within the scope of Subtopic 610-20 may include nonfinancial assets transferred within a legal entity to a counterparty; 2) an entity should allocate consideration to each distinct asset by applying the guidance in Topic 606 on allocating the transaction price to performance obligations; and 3) requires entities to derecognize a distinct nonfinancial asset or distinct in substance nonfinancial asset in a partial sale transaction when it (a) does not have (or ceases to have) a controlling financial interest in the legal entity that holds the asset in accordance with Subtopic 810 and (b) transfers control of the asset in accordance with Topic 606. The adoption of this standard will result in higher gains on the sale of partial real estate interests, including contributions of nonfinancial assets to a joint venture or other noncontrolling investee, due to recognizing the full gain when the derecognition criteria are met and recording the retained noncontrolling interest at its fair value. ASU 2017-05 is effective for annual periods, and interim periods therein, beginning after December 15, 2017. ASU 2017-05 was adopted during the first quarter of fiscal year 2018, in conjunction with the Revenue ASUs, using the modified retrospective approach. The Company also elected the practical expedient to only apply the guidance to contracts that were not completed upon adoption. At adoption, the Company did not have any contracts that were not completed within the scope of ASU 2017-05 and as such, the adoption of ASU 2017-05 did not impact the Company’s financial statements.
Accounting Standards Not Yet Adopted
In February 2016, the FASB issued ASU 2016-02, which will require that a lessee recognize assets and liabilities on the balance sheet for all leases with a lease term of more than 12 months, with the result being the recognition of a right of use (“ROU”) asset and a lease liability and the disclosure of key information about the entity’s leasing arrangements. The lessor accounting model under ASU 2016-02 is similar to existing guidance, however it limits the capitalization of initial direct leasing costs, such as internally generated costs. The Company expects to elect all practical expedients permitted under ASC Topic 842, other than the hindsight practical expedient, which permits entities to use hindsight in determining the lease terms. Accordingly, the Company will retain distinction between a finance lease (i.e., capital leases under existing guidance) and an operating lease and account for its existing operating leases as operating leases under the new guidance, without reassessing (a) whether the contracts contain a lease under ASC Topic 842, (b) whether classification of the operating leases would be different in accordance with ASC Topic 842, or (c) whether the unamortized initial direct costs before transition adjustments would have met the definition of initial direct costs in ASC Topic 842 at lease commencement.
In January 2018, the FASB issued ASU 2018-01, Leases (Topic 842): Land Easement Practical Expedient for Transition to Topic 842. The amendments help address transition guidance as it relates to land easements. As the Company plans to elect this practical expedient, it will only evaluate new or modified land easements upon adoption of Topic 842.
In July 2018, the FASB issued ASU 2018-10, Leases (Topic 842), which contained targeted improvements to amend inconsistencies and clarify guidance that were brought about by stakeholders. Additionally, in July 2018, the FASB issued ASU 2018-11, Leases (Topic 842), which provided the following practical expedients: (1) a transition method that allows entities to apply the new standard at the adoption date and to recognize a cumulative-effect adjustment to the opening balance of retained earnings effective at the adoption date; and (2) the option for lessors to not separate lease and non-lease components provided that certain criteria are met. The Company plans to elect the practical expedients included in ASU 2018-11. As the Company is not electing the hindsight practical expedient, the Company does not expect to have a cumulative effect adjustment to retained earnings upon adoption.
In December 2018, the FASB issued ASU 2018-20, Narrow-Scope Improvements for Lessors, Leases (Topic 842). This ASU 2018-20 provides an election for lessors to exclude sales and related taxes from consideration in the contract, requires lessors to exclude from revenue and expense lessor costs paid directly to a third party by lessees, and clarifies lessors’ accounting for variable payments related to both lease and nonlease components.
The Company is currently evaluating the impact of adoption, and anticipates this standard will have a material impact on its consolidated balance sheets. However, the Company does not expect adoption will have a material impact on its consolidated statements of operations. While the Company is continuing to assess potential impacts of the standard, it currently expects the most significant impact will be the recognition of ROU assets and lease liabilities for operating leases. Our initial ROU asset and liability will be approximately $223.0 million. The Company expects its accounting for capital leases to remain substantially unchanged. Leases pursuant to which the Company is the lessee primarily consist of approximately 200 leases, of which the majority are ground leases. The Company will adopt ASU 2016-12 and its related amendments beginning January 1, 2019.
In June 2016, the FASB issued ASU 2016-13, Financial Instruments – Credit Losses (Topic 326) (“ASU 2016-13”). ASU 2016-13 is intended to improve financial reporting by requiring more timely recognition of credit losses on loans and other financial instruments that are not accounted for at fair value through net income, including loans held for investment, held-to-maturity debt securities, trade and other receivables, net investment in leases and other such commitments. ASU 2016-13 requires that financial
VEREIT, INC. and VEREIT OPERATING PARTNERSHIP, L.P.
NOTES TO CONSOLIDATED FINANCIAL STATEMENTS
December 31, 2018 – (Continued)
assets measured at amortized cost be presented at the net amount expected to be collected, through an allowance for credit losses that is deducted from the amortized cost basis. The amendments in ASU 2016-13 require the Company to measure all expected credit losses based upon historical experience, current conditions, and reasonable and supportable forecasts that affect the collectability of the financial assets and eliminates the “incurred loss” methodology under current U.S. GAAP. In November 2018, the FASB issued ASU No. 2018-19, Codification Improvements to Topic 326, Financial Instruments—Credit Losses (“ASU 2018-19”). This ASU clarifies that receivables from operating leases are accounted for using the lease guidance and not as financial instruments. ASU 2016-13 and ASU 2018-19 are effective for fiscal years, and interim periods within, beginning after December 15, 2019. Early adoption is permitted for fiscal years, and interim periods within, beginning after December 15, 2018. The Company is currently evaluating the impact these amendments will have on its consolidated financial statements.
Note 3– Real Estate Investments and Related Intangibles
Property Acquisitions
During the year ended December 31, 2018, the Company acquired controlling financial interests in 52 commercial properties for an aggregate purchase price of $502.7 million (the “2018 Acquisitions”), which includes one land parcel for build-to-suit development, further discussed below, $2.1 million related to an outstanding tenant improvement allowance recorded as a payable as of the acquisition date and for which the Company received a credit at close, and $2.6 million of external acquisition-related expenses that were capitalized.
During the year ended December 31, 2017, the Company acquired a controlling interest in 88 commercial properties and three land parcels for an aggregate purchase price of $748.8 million (the “2017 Acquisitions”), which includes $3.3 million of external acquisition-related expenses that were capitalized and includes 22 properties acquired in a nonmonetary exchange discussed below.
During the year ended December 31, 2016, the Company acquired a controlling interest in eight commercial properties for an aggregate purchase price of $100.2 million (the “2016 Acquisitions”). Prior to the adoption of ASU 2017-01, costs related to property acquisitions were expensed as incurred. The Company has not included pro forma information for the Company's 2016 Acquisitions, which were acquired prior to the adoption of ASU 2017-01 and met the definition of a business combination, as they did not have a material impact on the Company's financial position or results of operations.
The following table presents the allocation of the fair values of the assets acquired and liabilities assumed during the periods presented (in thousands):
|
| | | | | | | | | | | | |
| | | Year Ended December 31, |
| | | 2018 | | 2017 | | 2016 |
| Real estate investments, at cost: | | | | | | |
| Land | | $ | 86,285 |
| | $ | 110,634 |
| | $ | 23,187 |
|
| Buildings, fixtures and improvements | | 350,942 |
| | 523,445 |
| | 67,865 |
|
| Total tangible assets | | 437,227 |
| | 634,079 |
| | 91,052 |
|
| Acquired intangible assets: | | | | | | |
In-place leases and other intangibles (1) | | 62,791 |
| | 105,940 |
| | 9,613 |
|
Above-market leases (2) | | 2,750 |
| | 10,445 |
| | — |
|
| Assumed intangible liabilities: | | | | | | |
Below-market leases (3) | | (116 | ) | | (1,680 | ) | | (471 | ) |
| Total purchase price of assets acquired | | $ | 502,652 |
| | $ | 748,784 |
| | $ | 100,194 |
|
| |
| (1) | The weighted average amortization period for acquired in-place leases and other intangibles is 16.3 years, 15.8 years and 13.8 years for 2018 Acquisitions, 2017 Acquisitions and 2016 Acquisitions, respectively. |
| |
| (2) | The weighted average amortization period for acquired above-market leases is 10.8 years and 18.0 years for 2018 Acquisitions and 2017 Acquisitions, respectively. There were no acquired above-market leases during the year ended December 31, 2016. |
| |
| (3) | The weighted average amortization period for acquired intangible lease liabilities is 9.9 years, 13.8 years and 10.0 years for 2018 Acquisitions, 2017 Acquisitions and 2016 Acquisitions, respectively. |
As of December 31, 2018, the Company invested $3.5 million, including $0.5 million of external acquisition-related expenses that were capitalized, in one build-to-suit development project. The Company’s estimated remaining committed investment is $24.9 million, and the project is expected to be completed within the next 12 months.
VEREIT, INC. and VEREIT OPERATING PARTNERSHIP, L.P.
NOTES TO CONSOLIDATED FINANCIAL STATEMENTS
December 31, 2018 – (Continued)
Future Lease Payments
The following table presents future minimum base rent payments due to the Company over the next five years and thereafter. These amounts exclude contingent rent payments, as applicable, that may be collected from certain tenants based on provisions related to sales thresholds and increases in annual rent based on exceeding certain economic indexes among other items (in thousands):
|
| | | | | | | | |
| | | Future Minimum Operating Lease
Base Rent Payments | | Future Minimum
Direct Financing Lease Payments (1) |
| 2019 | | $ | 1,107,610 |
| | $ | 2,448 |
|
| 2020 | | 1,080,639 |
| | 2,135 |
|
| 2021 | | 1,042,346 |
| | 2,014 |
|
| 2022 | | 972,564 |
| | 1,925 |
|
| 2023 | | 890,327 |
| | 1,541 |
|
| Thereafter | | 5,387,232 |
| | 707 |
|
| Total | | $ | 10,480,718 |
| | $ | 10,770 |
|
| |
| (1) | Related to25 properties which are subject to direct financing leases and, therefore, revenue is recognized as direct financing lease income on the discounted cash flows of the lease payments. Amounts reflected are the minimum base rental cash payments due to the Company under the lease agreements on these respective properties. |
Property Dispositions and Real Estate Assets Held for Sale
During the year ended December 31, 2018, the Company disposed of 149 properties, including one property conveyed to a lender in a deed-in-lieu of foreclosure transaction as discussed in Note 7 –Debt, for an aggregate gross sales price of $526.4 million, of which our share was $504.3 million after the profit participation payments related to the disposition of 34 Red Lobster properties. The dispositions resulted in proceeds of $496.7 million after closing costs. The Company recorded a gain of $96.2 million related to the sales which is included in gain on disposition of real estate and real estate assets held for sale, net in the accompanying consolidated statements of operations.
During the year ended December 31, 2018, the Company also disposed of one property owned by an unconsolidated joint venture for a gross sales price of $34.1 million, of which our share was $17.1 million based on our ownership interest in the joint venture, resulting in proceeds of $5.6 million after debt repayments of $20.4 million and closing costs. The Company recorded a gain of $0.7 million related to the sale and liquidation of the joint venture, which is included in equity in income and gain on disposition of unconsolidated entities in the accompanying consolidated statements of operations.
During the year ended December 31, 2017, the Company disposed of 137 properties, including one property owned by a consolidated joint venture, six properties transferred to the lender in either a deed-in-lieu of foreclosure or foreclosure sale transaction as discussed in Note 7 –Debt, and 15 properties disposed of in connection with a nonmonetary exchange discussed below, for an aggregate gross sales price of $594.9 million, of which our share was $574.4 million after the profit participation payment related to the disposition of 31 Red Lobster properties and the consolidated joint venture partner’s share of the sales price. The dispositions resulted in proceeds of $445.5 million after a mortgage loan assumption of $66.0 million and closing costs. Additionally, the Company’s tax provision for the year ended December 31, 2017 included $1.7 million of Canadian tax gain on the sale of certain Canadian properties. The Company recorded a gain of $64.7 million, which is included in gain on disposition of real estate and real estate assets held for sale, net in the accompanying consolidated statements of operations.
During the year ended December 31, 2016, the Company disposed of 301 properties, for an aggregate gross sales price of $1.08 billion, of which our share was $1.04 billion after the profit participation payment related to the disposition of 70 Red Lobster properties. The dispositions resulted in proceeds of $958.4 million after a mortgage loan assumption of $55.0 million and closing costs. The Company recorded a gain of $45.7 million, which included $67.8 million of goodwill allocated to the cost basis of such properties, which is included in gain on disposition of real estate and real estate assets held for sale, net in the accompanying consolidated statements of operations.
VEREIT, INC. and VEREIT OPERATING PARTNERSHIP, L.P.
NOTES TO CONSOLIDATED FINANCIAL STATEMENTS
December 31, 2018 – (Continued)
During the year ended December 31, 2016, the Company also disposed of one property owned by an unconsolidated joint venture for a gross sales price of $113.5 million, of which our share was $102.1 million based on our ownership interest in the joint venture, resulting in proceeds of $42.3 million after debt repayments of $57.0 million and closing costs. The Company recorded a gain of $10.2 million related to the sale, which is included in equity in income and gain on disposition of unconsolidated entities in the accompanying consolidated statements of operations.
As of December 31, 2018, there were five properties classified as held for sale with a carrying value of $2.6 million, included in assets related to real estate assets held for sale and discontinued operations, net in the accompanying consolidated balance sheet, which are expected to be sold in the next 12 months as part of the Company’s portfolio management strategy. As of December 31, 2017, there were 30 properties classified as held for sale. During the year ended December 31, 2018, the Company recorded a loss of $1.9 million related to held for sale properties. During the year ended December 31, 2017, the Company recorded a loss of $3.1 million related to held for sale properties. During the year ended December 31, 2016, the Company recorded a loss of $5.1 million related to held for sale properties, which included $3.2 million of goodwill allocated to the cost basis of such properties.
Intangible Lease Assets and Liabilities
Intangible lease assets and liabilities of the Company consisted of the following as of December 31, 2018 and 2017 (amounts in thousands, except weighted-average useful life):
|
| | | | | | | | | | |
| | | Weighted-Average Useful Life | | December 31, 2018 | | December 31, 2017 |
| Intangible lease assets: | | | | | | |
| In-place leases and other intangibles, net of accumulated amortization of $703,909 and $599,680, respectively | | 15.5 | | $ | 980,971 |
| | $ | 1,091,433 |
|
| Leasing commissions, net of accumulated amortization of $4,048 and $2,902, respectively | | 10.7 | | 15,660 |
| | 13,876 |
|
| Above-market lease assets and deferred lease incentives, net of accumulated amortization of $105,936 and $88,335, respectively | | 16.4 | | 201,875 |
| | 241,449 |
|
| Total intangible lease assets, net | | | | $ | 1,198,506 |
| | $ | 1,346,758 |
|
| | | | | | | |
| Intangible lease liabilities: | | | | | | |
| Below-market leases, net of accumulated amortization of $89,905 and $73,916, respectively | | 18.8 | | $ | 173,479 |
| | $ | 198,551 |
|
The aggregate amount of above‑ and below-market leases and deferred lease incentives amortized and included as a net decrease to rental revenue was $4.2 million for the year ended December 31, 2018 and $5.4 million for each of the years ended December 31, 2017 and 2016, respectively. The aggregate amount of in-place leases, leasing commissions and other lease intangibles amortized and included in depreciation and amortization expense was $139.6 million, $154.2 million and $170.0 million for the years ended December 31, 2018, 2017 and 2016, respectively.
The following table provides the projected amortization expense and adjustments to rental revenue related to the intangible lease assets and liabilities for the next five years as of December 31, 2018 (amounts in thousands):
|
| | | | | | | | | | | | | | | | | | | | |
| | | 2019 | | 2020 | | 2021 | | 2022 | | 2023 |
| In-place leases and other intangibles: | | | | | | | | | | |
| Total projected to be included in amortization expense | | $ | 126,457 |
| | $ | 119,161 |
| | $ | 111,335 |
| | $ | 97,159 |
| | $ | 86,311 |
|
| Leasing commissions: | | | | | | | | | | |
| Total projected to be included in amortization expense | | 1,911 |
| | 1,778 |
| | 1,620 |
| | 1,556 |
| | 1,359 |
|
| Above-market lease assets and deferred lease incentives: | | | | | | | | |
| Total projected to be deducted from rental revenue | | 20,870 |
| | 20,456 |
| | 20,027 |
| | 19,213 |
| | 18,270 |
|
| Below-market lease liabilities: | | | | | | | | | | |
| Total projected to be included in rental revenue | | 17,973 |
| | 16,821 |
| | 15,656 |
| | 14,809 |
| | 13,924 |
|
VEREIT, INC. and VEREIT OPERATING PARTNERSHIP, L.P.
NOTES TO CONSOLIDATED FINANCIAL STATEMENTS
December 31, 2018 – (Continued)
Nonmonetary Exchange
During the year ended December 31, 2017, the Company completed a nonmonetary exchange through the simultaneous acquisition of 22 Bob Evans properties and disposition of 15 Red Lobster properties. Pursuant to Nonmonetary Transactions, ASC (Topic 845), the cost of a nonmonetary asset acquired in exchange for another nonmonetary asset is the fair value of the asset surrendered to obtain the acquired nonmonetary asset, and a gain or loss should be recognized on the exchange. The fair value of the asset received should be used to measure the cost if the fair value of the asset received is more reliable than the fair value of the asset surrendered. The Company estimated the fair value of the Bob Evans and Red Lobster properties using valuation techniques consistent with the income approach and concluded that the fair value was $50.1 million. As the fair value of the assets received exceeded the book value of the assets surrendered, the Company recorded a gain of $7.4 million, which is included in gain on disposition of real estate and real estate assets held for sale, net in the accompanying consolidated statements of operations.
Consolidated Joint Ventures
The Company had an interest in one consolidated joint venture that owned one property as of December 31, 2018 and 2017. As of December 31, 2018 and 2017, the consolidated joint venture had total assets of $32.5 million and $33.7 million, of which $29.9 million and $30.7 million, respectively, were real estate investments, net of accumulated depreciation and amortization. The property was secured by a mortgage note payable, which was non-recourse to the Company and had a balance of $14.0 million and $14.9 million, as of December 31, 2018 and 2017, respectively. The Company has the ability to control operating and financing policies of the consolidated joint venture. There are restrictions on the use of these assets as the Company would generally be required to obtain the approval of the joint venture partner in accordance with the joint venture agreement for any major transactions. The Company and the joint venture partner are subject to the provisions of the joint venture agreement, which includes provisions for when additional contributions may be required to fund certain cash shortfalls.
Unconsolidated Joint Ventures
As of December 31, 2018, the Company held an investment in an unconsolidated joint venture that owned one property with a carrying value of $35.3 million. As of December 31, 2017, the Company held investments in two unconsolidated joint ventures that each owned one property with an aggregate carrying value of $39.5 million. During the year ended December 31, 2018, the Company disposed of one property owned by an unconsolidated joint venture as previously discussed in the “Property Dispositions and Real Estate Assets Held for Sale” section herein.
The Company had a 90% legal ownership interest in the unconsolidated joint venture at December 31, 2018 and December 31, 2017 and accounts for its investment using the equity method of accounting as the Company has the ability to exercise significant influence, but not control, over operating and financing policies of the investment. The equity method of accounting requires the investment to be initially recorded at cost and subsequently adjusted for the Company’s share of equity in earnings and distributions from the joint venture. During the year ended December 31, 2018 the Company recognized $1.2 million of net income from unconsolidated joint ventures. During the years ended December 31, 2017 and 2016 the Company recognized $3.3 million and $0.9 million of net income, respectively, from two unconsolidated joint ventures. The Company’s legal ownership interest may, at times, not equal the Company’s economic interest because of various provisions in certain joint venture agreements regarding distributions of cash flow based on capital account balances, allocations of profits and losses and payments of preferred returns.
The carrying amount of the unconsolidated joint venture was greater than the underlying equity in net assets by $4.7 million as of December 31, 2018. The carrying amount of the unconsolidated joint ventures was greater than the underlying equity in net assets by $8.6 million as of December 31, 2017. This difference relates to a purchase price allocation of goodwill and a step up in fair value of the investment assets acquired in connection with mergers. The step up in fair value was allocated to the individual investment assets and is being amortized in accordance with the Company’s depreciation policy. The Company and the unconsolidated joint venture partner are subject to the provisions of the applicable joint venture agreement, which includes provisions for when additional contributions may be required to fund certain cash shortfalls, including the Company’s share of expansion project capital expenditures.
VEREIT, INC. and VEREIT OPERATING PARTNERSHIP, L.P.
NOTES TO CONSOLIDATED FINANCIAL STATEMENTS
December 31, 2018 – (Continued)
Note 4 — Discontinued Operations
On November 13, 2017, the Company entered into a purchase and sale agreement (as amended by that certain First Amendment to the Purchase and Sale Agreement, dated as of February 1, 2018, the “Cole Capital Purchase and Sale Agreement”). On February 1, 2018, the Company completed the sale of its investment management segment, Cole Capital, under the terms of the Cole Capital Purchase and Sale Agreement. Substantially all of the Cole Capital segment’s operations were conducted through Cole Capital Advisors, Inc. (“CCA”), an Arizona corporation and a wholly owned subsidiary of the OP. The OP sold all of the issued and outstanding shares of common stock of CCA and certain of CCA’s subsidiaries to the Cole Purchaser, for approximately $120.0 million paid in cash at closing. The Company could also receive up to an aggregate of $80.0 million in Net Revenue Payments. There were no Net Revenue Payments received or earned for 2018. Substantially all of the Cole Capital segment financial results are reflected in the financial statements as discontinued operations.
The following is a summary of the assets and liabilities related to discontinued operations and real estate assets held for sale as of December 31, 2018 and 2017 (in thousands):
|
| | | | | | | | |
| | December 31, 2018 | | December 31, 2017 |
| Carrying amount of major classes of assets included in discontinued operations: | | | | |
| Cash | | $ | — |
| | $ | 2,198 |
|
Intangible assets, net (1) | | — |
| | 9,892 |
|
Other assets, net (2) | | — |
| | 6,975 |
|
Goodwill (3) | | — |
| | 124,812 |
|
| Due from Cole REITs, net | | — |
| | 1,284 |
|
Loss recognized on classification as held for sale (4) | | — |
| | (19,509 | ) |
| Assets related to discontinued operations, net | | $ | — |
| | $ | 125,652 |
|
| | | | | |
| Carrying amount of major classes of liabilities included in discontinued operations: | | | | |
| Accounts payable and accrued expenses | | $ | — |
| | $ | 14,269 |
|
| Other liabilities | | — |
| | 1,512 |
|
| Due to Cole REITs | | — |
| | 100 |
|
| Liabilities related to discontinued operations | | $ | — |
| | $ | 15,881 |
|
| |
| (1) | The intangible assets consisted of management and advisory contracts that the Company had with certain Cole REITs. Accumulated amortization was $44.1 million as of December 31, 2017. |
| |
| (2) | Includes program development costs of $3.3 million as of December 31, 2017, which were net of reserves of $7.6 million. |
| |
| (3) | The Company performed the annual goodwill test using the $120.0 million cash proceeds provided for under the Cole Capital Purchase and Sale Agreement, plus the estimated fair value of the Net Revenue Payments and determined the carrying amount exceeded the estimated fair value. As such, no goodwill impairment was recorded during the year ended December 31, 2017. |
| |
| (4) | The Company recognized a loss of $20.0 million on classification of the discontinued operations as held for sale, of which $0.5 million represented estimated costs to sell that were subsequently accrued in accounts payable and accrued expenses as of December 31, 2017. In determining the loss recognized on classification as held for sale, the Company elected to account for the future Net Revenue Payments as a gain contingency. Under this approach, the Company will not recognize any Net Revenue Payments until realized. |
VEREIT, INC. and VEREIT OPERATING PARTNERSHIP, L.P.
NOTES TO CONSOLIDATED FINANCIAL STATEMENTS
December 31, 2018 – (Continued)
The Senior Notes are guaranteed by the General Partner. The OP may redeem all orfollowing is a part of any seriessummary of the Senior Notes at any time, at its option,financial information for discontinued operations for the redemption prices set forthyears ended December 31, 2018, 2017 and 2016 (in thousands):
|
| | | | | | | | | | | | |
| | | Year Ended December 31, |
| Revenues: | | 2018 | | 2017 | | 2016 |
| Offering-related fees and reimbursements | | $ | 1,027 |
| | $ | 16,096 |
| | $ | 36,526 |
|
| Transaction service fees and reimbursements | | 334 |
| | 13,929 |
| | 12,533 |
|
| Management fees and reimbursements | | 6,452 |
| | 76,214 |
| | 68,686 |
|
| Total revenues | | $ | 7,813 |
|
| $ | 106,239 |
|
| $ | 117,745 |
|
| Operating expenses: | | | | | | |
| Cole Capital reallowed fees and commissions | | 602 |
| | 9,879 |
| | 23,174 |
|
Transaction costs (1) | | (654 | ) | | 3,802 |
| | — |
|
| General and administrative | | 4,450 |
| | 63,783 |
| | 82,558 |
|
| Amortization of intangible assets | | — |
| | 14,490 |
| | 26,148 |
|
| Goodwill and intangible asset impairments | | — |
| | — |
| | 120,931 |
|
| Total operating expenses | | 4,398 |
|
| 91,954 |
|
| 252,811 |
|
| Other income, net | | — |
| | 464 |
| | 292 |
|
| Loss on disposition and assets held for sale | | (1,815 | ) | | (20,027 | ) | | — |
|
| Income (loss) before taxes | | 1,600 |
|
| (5,278 | ) |
| (134,774 | ) |
| Benefit from (provision for) income taxes | | 2,095 |
| | (13,839 | ) | | 10,837 |
|
| Income (loss) from discontinued operations, net of income taxes | | $ | 3,695 |
|
| $ | (19,117 | ) |
| $ | (123,937 | ) |
| |
| (1) | The negative balance for the year ended December 31, 2018 is a result of estimated costs accrued in prior periods that exceeded actual expenses incurred. |
The following is a summary of cash flows related to discontinued operations for the indenture governingyears ended December 31, 2018, 2017 and 2016 (in thousands):
|
| | | | | | | | | | | |
| | | Year Ended December 31, |
| | | 2018 | | 2017 | 2016 |
| Cash flows related to discontinued operations: | | | | | |
| Cash flows (used in) provided by operating activities | | $ | (10,468 | ) | | $ | 33,232 |
| $ | 35,251 |
|
| Cash flows provided by investing activities | | $ | 122,915 |
| | $ | — |
| $ | — |
|
Income Taxes
Cole Capital’s business, substantially all of which was conducted through a TRS, recognized a benefit of $2.1 million for the Senior Notes. Ifyear ended December 31, 2018, a provision of $13.8 million the redemption date is 30 or fewer days prior toyear ended December 31, 2017 and a benefit of $10.8 million for the maturity date with respect toyear ended December 31, 2016.
VEREIT, INC. and VEREIT OPERATING PARTNERSHIP, L.P.
NOTES TO CONSOLIDATED FINANCIAL STATEMENTS
December 31, 2018 – (Continued)
The following table presents the 2019 Senior Notes and the 2021 Senior Notes or is 90 or fewer days prior to the maturity date with respect to the 2024 Senior Notes and the 2026 Senior Notes, the redemption price will equal 100%reconciliation of the principal(benefit from) provision for income taxes with the amount computed by applying the statutory federal income tax rate to loss before income taxes for the years ended December 31, 2018, 2017 and 2016 (in thousands):
|
| | | | | | | | | | | | |
| | | Year Ended December 31, |
| | | 2018 | | 2017 | | 2016 |
| Income (loss) before taxes | | $ | 1,600 |
| | $ | (5,278 | ) | | $ | (134,774 | ) |
| Less: Income from non-taxable entities | | (685 | ) | | (9,523 | ) | | (9,008 | ) |
| Income (loss) attributable to taxable subsidiaries before income taxes | | $ | 915 |
|
| $ | (14,801 | ) |
| $ | (143,782 | ) |
| | | | | | | |
| Federal provision at statutory rate | | 192 |
| | (5,180 | ) | | (50,324 | ) |
| Impairment of goodwill | | — |
| | — |
| | 42,327 |
|
| Nondeductible portion of transaction costs and loss recognized on classification as held for sale | | (719 | ) | | 8,283 |
| | — |
|
| Impact of change in federal tax rate | | — |
| | 3,481 |
| | — |
|
| Impact of valuation allowance | | (1,158 | ) | | 6,165 |
| | — |
|
| State income taxes and other | | (410 | ) | | 1,090 |
| | (2,840 | ) |
| Total (benefit from) provision for income taxes - Cole Capital | | $ | (2,095 | ) |
| $ | 13,839 |
|
| $ | (10,837 | ) |
The following table presents the components of the Senior Notes(benefit from) provision for income taxes for the years ended December 31, 2018, 2017 and 2016 (in thousands):
|
| | | | | | | | | | | | |
| | | Year Ended December 31, |
| | | 2018 | | 2017 | | 2016 |
| Current | | | | | | |
| Federal | | $ | (74 | ) | | $ | (120 | ) | | $ | 2,244 |
|
| State | | (166 | ) | | 602 |
| | (2,762 | ) |
| Total current (benefit from) provision for income taxes | | (240 | ) |
| 482 |
|
| (518 | ) |
| Deferred | | | | | | |
| Federal | | (1,756 | ) | | 12,016 |
| | (9,021 | ) |
| State | | (99 | ) | | 1,341 |
| | (1,298 | ) |
| Total deferred (benefit from) provision for income taxes | | (1,855 | ) |
| 13,357 |
| | (10,319 | ) |
| Total (benefit from) provision for income taxes - Cole Capital | | $ | (2,095 | ) |
| $ | 13,839 |
|
| $ | (10,837 | ) |
VEREIT, INC. and VEREIT OPERATING PARTNERSHIP, L.P.
NOTES TO CONSOLIDATED FINANCIAL STATEMENTS
December 31, 2018 – (Continued)
Note 5 – Rent and Tenant Receivables and Other Assets, Net
Rent and tenant receivables and other assets, net consisted of the applicable series to be redeemed, plus accrued and unpaid interest on the amount being redeemed to, but excluding, the applicable redemption date. The Senior Notes are registered under the Securities Act of 1933, as amended, (the “Securities Act”) and are freely transferable.
The indenture governing both our existing and new Senior Notes requires us to maintain financial ratios which include maintaining (i) a maximum limitation on incurrence of total debt less than or equal to 65% of Total Assets (as defined in the indenture), (ii) maximum limitation on incurrence of secured debt less than or equal to 40% of Total Assets (as defined in the indenture), (iii) a minimum debt service coverage ratio of at least 1.5x and (iv) a minimum unencumbered asset value of at least 150% of the aggregate principal amount of all of the outstanding Unsecured Debt (as defined in the indenture). The Company believes it was in compliance with the financial covenants pursuant to the indenture governing the Senior Notesfollowing as of December 31, 2016.2018 and 2017 (in thousands):
On January 22, 2015, |
| | | | | | | | |
| | | December 31, 2018 | | December 31, 2017 |
| | | | | |
Straight-line rent receivable, net (1) | | $ | 259,106 |
| | $ | 230,529 |
|
Accounts receivable, net (2) | | 36,939 |
| | 36,921 |
|
Deferred costs, net (3) | | 17,515 |
| | 5,746 |
|
| Investment in direct financing leases, net | | 13,254 |
| | 19,539 |
|
Mortgage notes receivable, net (4) | | 10,164 |
| | 20,294 |
|
Leasehold improvements, property and equipment, net (5) | | 9,754 |
| | 12,089 |
|
| Investment in Cole REITs | | 7,844 |
| | 3,264 |
|
| Prepaid expenses | | 5,022 |
| | 6,493 |
|
| Other assets, net | | 3,594 |
| | 5,003 |
|
| Income tax receivable | | 1,760 |
| | 3,213 |
|
| Restricted escrow deposits | | 1,140 |
| | 4,995 |
|
Investment securities, at fair value(6) | | — |
| | 40,974 |
|
| Total | | $ | 366,092 |
|
| $ | 389,060 |
|
| |
| (1) | Allowance for uncollectible accounts included in straight-line rent receivable, net was $1.0 million and $2.0 million as of December 31, 2018 and 2017, respectively. As of December 31, 2018, the allowance related to suspended revenue recognition was $0.1 million. As of December 31, 2017, there was no allowance related to suspended revenue recognition. |
| |
| (2) | In the event that the collectability of a receivable is uncertain, the Company will record an increase in the allowance for uncollectible accounts in the consolidated balance sheets and bad debt expense in property operating expenses in the consolidated statements of operations. Allowance for uncollectible accounts was $5.3 million and $6.3 million as of December 31, 2018 and 2017, respectively. The Company suspends revenue recognition when the collectability of amounts due pursuant to a lease is no longer reasonably assured. As of December 31, 2018 and 2017, the allowance related to suspended revenue recognition was $9.1 million and $12.6 million, respectively. |
| |
| (3) | Amortization expense for deferred costs related to the revolving credit facilities totaled $7.3 million for the year ended December 31, 2018 and $10.4 million for each of the years ended December 31, 2017 and 2016. Accumulated amortization for deferred costs related to the Revolving Credit Facility, as defined in Note 7 –Debt, was $47.6 million and $40.3 million as of December 31, 2018 and 2017, respectively. |
| |
| (4) | As of December 31, 2018, the Company owned five mortgage notes receivable with a weighted-average interest rate of 6.4% and weighted-average years to maturity of 12.1 years. During the year ended December 31, 2018, the Company sold three mortgage notes receivable with an aggregate carrying value of $8.8 million at December 31, 2017, resulting in a net gain of $1.7 million, which is included in other income, net in the accompanying consolidated statements of operations. |
| |
| (5) | Amortization expense for leasehold improvements totaled $1.2 million for each of the years ended December 31, 2018 and 2017, with no related write-offs. Amortization expense for leasehold improvements totaled $2.3 million for the year ended December 31, 2016, inclusive of write-offs of $1.0 million. Accumulated amortization was $5.9 million and $4.7 million as of December 31, 2018 and 2017, respectively. Depreciation expense for property and equipment totaled $2.3 million, $1.8 million and $3.4 million for the years ended December 31, 2018, 2017 and 2016, respectively, inclusive of write-offs of $0.8 million, $0.6 million and $1.2 million for the years ended December 31, 2018, 2017 and 2016, respectively. Accumulated depreciation was $7.0 million and $5.7 million as of December 31, 2018 and 2017, respectively. |
| |
| (6) | During the year ended December 31, 2018, two commercial mortgage-backed securities (“CMBS”) were repaid and six CMBS were sold for an aggregate gross sales price of $36.0 million for a net realized loss of $2.2 million, which is included in other income, net in the accompanying consolidated statements of operations. |
Note 6 – Fair Value Measures
The Company determines fair value based on quoted prices when available or through the use of alternative approaches, such as discounting the expected cash flows using market interest rates commensurate with the credit quality and duration of the investment. U.S. GAAP guidance defines three levels of inputs that may be used to measure fair value:
Level 1 – Quoted prices in active markets for identical assets and liabilities that the reporting entity has the ability to access at the measurement date.
Level 2 – Inputs other than quoted prices included within Level 1 that are observable for the asset and liability or can be corroborated with observable market data for substantially the entire contractual term of the asset or liability.
Level 3 – Unobservable inputs reflect the entity’s own assumptions about the assumptions that market participants would use in the pricing of the asset or liability and are consequently not based on market activity, but rather through particular valuation techniques.
VEREIT, INC. and VEREIT OPERATING PARTNERSHIP, L.P.
NOTES TO CONSOLIDATED FINANCIAL STATEMENTS
December 31, 2018 – (Continued)
The determination of where an asset or liability falls in the hierarchy requires significant judgment and considers factors specific to the asset or liability. In instances where the determination of the fair value measurement is based on inputs from different levels of the fair value hierarchy, the level in the fair value hierarchy within which the entire fair value measurement falls is based on the lowest level input that is significant to the fair value measurement in its entirety. The Company evaluates its hierarchy disclosures each quarter and depending on various factors, it is possible that an asset or liability may be classified differently from quarter to quarter. Changes in the type of inputs may result in a reclassification for certain assets. The Company does not expect that changes in classifications between levels will be frequent.
Items Measured at Fair Value on a Recurring Basis
The following tables present information about the Company’s assets and liabilities measured at fair value on a recurring basis as of December 31, 2018 and 2017, aggregated by the level in the fair value hierarchy within which those instruments fall (in thousands):
|
| | | | | | | | | | | | | | | | |
|
| Level 1 |
| Level 2 |
| Level 3 |
| Balance as of December 31, 2018 |
| Assets: |
|
|
|
|
|
|
|
|
| Derivative assets |
| $ | — |
| | $ | 544 |
| | $ | — |
|
| $ | 544 |
|
| Investment in Cole REITs | | — |
| | — |
| | 7,844 |
| | 7,844 |
|
| Total assets | | $ | — |
| | $ | 544 |
| | $ | 7,844 |
| | $ | 8,388 |
|
|
|
| Level 1 |
| Level 2 |
| Level 3 |
| Balance as of December 31, 2017 |
| Assets: | | | | | | | | |
| CMBS | | $ | — |
| | $ | — |
| | $ | 40,974 |
| | $ | 40,974 |
|
| Derivative assets | | — |
| | 627 |
| | — |
| | 627 |
|
| Total assets | | $ | — |
| | $ | 627 |
| | $ | 40,974 |
| | $ | 41,601 |
|
CMBS – The Company’s CMBS were carried at fair value and were valued using Level 3 inputs. The Company used estimated non-binding quoted market prices from the trading desks of financial institutions that are dealers in such securities for similar CMBS tranches that actively participate in the CMBS market. Broker quotes are only indicative of fair value and may not necessarily represent what the Company entered intowould receive in an agreementactual trade for the applicable instrument. Management determined that the prices were representative of fair value through its knowledge and experience in principle with an ad hoc groupthe market. The significant unobservable input used in valuing the CMBS was the discount rate or market yield used to discount the estimated future cash flows expected to be received from the underlying investment, which include both future principal and interest payments. Significant increases or decreases in the discount rate or market yield would result in a decrease or increase in the fair value measurement. The following risks were included in the consideration and selection of holders (the “Senior Noteholder Group”)discount rates or market yields: risk of default, rating of the Senior Notes,investment and comparable company investments.
Derivative Assets and Liabilities –The Company’s derivative financial instruments relate to interest rate swaps. The valuation of derivative instruments is determined using a discounted cash flow analysis on the expected cash flows of each derivative. This analysis reflects the contractual terms of the derivatives, including the period to maturity, as well as observable market-based inputs, including interest rate curves and implied volatilities. In addition, credit valuation adjustments are incorporated into the fair values to account for the Company’s potential nonperformance risk and the performance risk of the counterparties.
Although the Company determined that the majority of the inputs used to value its derivatives fall within Level 2 of the fair value hierarchy, the credit valuation adjustments associated with those derivatives utilize Level 3 inputs, such as estimates of current credit spreads to evaluate the likelihood of default by which the Senior Noteholder Group agreedCompany and its counterparties. However, as of December 31, 2018 and 2017, the Company assessed the significance of the impact of the credit valuation adjustments on the overall valuation of its derivative positions and determined that the credit valuation adjustments are not significant to the overall valuation of the Company’s derivatives. As a result, the Company determined that its derivative valuations in their entirety are classified in Level 2 of the fair value hierarchy.
VEREIT, INC. and VEREIT OPERATING PARTNERSHIP, L.P.
NOTES TO CONSOLIDATED FINANCIAL STATEMENTS
December 31, 2018 – (Continued)
Investment in Cole REITs –The fair values of CCIT II and CCPT V were estimated using the net asset value per share. The Company determined that the CCIT III per share primary offering price net of selling commissions and dealer manager fees approximated fair value. Each of the Cole REIT’s share redemption programs includes restrictions that limit the number of shares redeemed by the respective Cole REIT. CCIT II has estimated that it will commence a liquidity event over the next three to five years. CCPT V has estimated that it will commence a liquidity event over the next three to six years following the termination of its initial public offering. CCIT III has estimated that it will commence a liquidity event five to seven years following the termination of its initial public offering. Subsequent to December 31, 2018, CCIT III terminated its primary offering, however it continues to issue a noticeshares pursuant to its distribution reinvestment plan.
The following are reconciliations of default due to the Company’s failure to timely deliver certain financial statementschanges in 2014. assets and liabilities with Level 3 inputs in the fair value hierarchy for the year ended December 31, 2018 (in thousands):
|
| | | | | | | | |
| | | CMBS | | Investment in Cole REITs (1) |
| Beginning balance, January 1, 2018 | | $ | 40,974 |
| | $ | 3,264 |
|
| Total gains and losses | | | | |
| Unrealized loss included in other comprehensive income, net | | (205 | ) | | — |
|
| Realized loss included in other income, net | | (34 | ) | | — |
|
| Unrealized gain included in other income, net | | — |
| | 5,102 |
|
| Purchases, issuance, settlements | | | | |
| Return of principal received | | (4,864 | ) | | — |
|
| Amortization included in net income, net | | 157 |
| | — |
|
| Sale of investments | | (36,028 | ) | | (522 | ) |
| Ending Balance, December 31, 2018 | | $ | — |
| | $ | 7,844 |
|
| |
| (1) | As discussed in Note 2 – Summary of Significant Accounting Policies, as of December 31, 2017, the Company accounted for its investment in Cole REITs using the equity method of accounting. Subsequent to the sale of Cole Capital, the Company retained interests in CCIT II, CCIT III and CCPT V, which were carried at fair value as of December 31, 2018. |
The Companyfollowing are reconciliations of the changes in assets and liabilities with Level 3 inputs in the OP filedfair value hierarchy for the required financial statements with the SEC on March 2, 2015.year ended December 31, 2017 (in thousands):
|
| | | | |
| | | CMBS |
| Beginning balance, January 1, 2017 | | $ | 47,215 |
|
| Total gains and losses | | |
| Unrealized loss included in other comprehensive income, net | | (951 | ) |
| Purchases, issuance, settlements | | |
| Return of principal received | | (4,388 | ) |
| Amortization included in net income, net | | (902 | ) |
| Ending Balance, December 31, 2017 | | $ | 40,974 |
|
VEREIT, INC. and VEREIT OPERATING PARTNERSHIP, L.P.
NOTES TO CONSOLIDATED FINANCIAL STATEMENTS
December 31, 2018 – (Continued)
Convertible Debt
On July 29, 2013,Summary and Obligations
During the year ended December 31, 2018, the Company’s 2018 Convertible Notes matured and the principal outstanding of $597.5 million, plus accrued and unpaid interest thereon, was repaid with proceeds from the Revolving Credit Facility.
As of December 31, 2018, the Company issued $300.0had $402.5 million aggregate principal amount outstanding of convertible senior notes due 2018 (the “2018 Convertible Notes”) and, pursuant to an over-allotment exercise by the underwriters of such 2018 Convertible Notes offering, issued an additional $10.0 million aggregate principal amount of its 2018 Convertible Notes on August 1, 2013. On December 10, 2013, the Company issued an additional $287.5 million of the 2018 Convertible Notes by reopening the indenture governing the 2018 Convertible Notes. Also on December 10, 2013, the Company issued $402.5 million aggregate principal amount of convertible senior notes due15, 2020 (the “2020 Convertible Notes” and, together with the 2018 Convertible Notes, the “Convertible Notes”). As of December 31, 2016, the outstanding aggregate balance of the Convertible Notes was $1.0 billion. The OP has issued corresponding identical convertible notes to the General Partner. There were no changes to the terms of the 2020 Convertible Notes and the Company believes that it was in compliance with the financial covenants pursuant to the indenture governing the 2020 Convertible Notes as of December 31, 2018.
Mortgage Notes Payable and Other Debt
Summary and Obligations
As of December 31, 2018, we had non-recourse mortgage indebtedness of $1.9 billion, which was collateralized by 459 properties, reflecting a decrease from December 31, 2017 of $153.9 million derived primarily from our disposition activity during the year ended December 31, 2018. Our mortgage indebtedness bore interest at the weighted-average rate of 4.93% per annum and had a weighted-average maturity of 3.4 years. We may in the future incur additional mortgage debt on the properties we currently own or use long-term non-recourse financing to acquire additional properties.
The payment terms of our loan obligations vary. In general, only interest amounts are payable monthly with all unpaid principal and interest due at maturity. Some of our loan agreements require that we comply with specific reporting and financial covenants mainly related to debt coverage ratios and loan-to-value ratios. Each loan that has these requirements has specific ratio thresholds that must be met.
Restrictions on Loan Covenants
Our mortgage loan obligations generally restrict corporate guarantees and require the maintenance of financial covenants, including maintenance of certain financial ratios (such as specified debt to equity and debt service coverage ratios), as well as the maintenance of a minimum net worth. The mortgage loan agreements contain no dividend restrictions except in the event of default or when a distribution would drive liquidity below the applicable thresholds. At December 31, 2018, the Company believes that it was in compliance with the financial covenants under the mortgage loan agreements and had no restrictions on the payment of dividends.
Litigation
During the year ended December 31, 2018, we entered into settlement agreements with various plaintiffs in connection with litigation filed as a result of the findings of the Audit Committee Investigation for $217.5 million. The Company also entered into settlement agreements for $15.7 million subsequent to December 31, 2018, which was accrued and included in litigation, merger and other non-routine costs, net of insurance recoveries in the consolidated statements of operations for the year ended December 31, 2018.
Dividends
On November 5, 2018, the Company’s Board of Directors declared a quarterly cash dividend of $0.1375 per share of Common Stock (equaling an annualized dividend rate of $0.55 per share) for the fourth quarter of 2018 to stockholders of record as of December 31, 2018, which was paid on January 15, 2019. An equivalent distribution by the Operating Partnership is applicable per OP unit.
Our Series F Preferred Stock, as discussed in Note 11 – Equity to our consolidated financial statements, will pay cumulative cash dividends at the rate of 6.70% per annum on their liquidation preference of $25.00 per share (equivalent to $1.675 per share on an annual basis). As of December 31, 2018, there were approximately 42.8 million shares of Series F Preferred Stock (and approximately 42.8 million corresponding Series F Preferred Units that were issued to the General Partner) and 86,874 Limited Partner Series F Preferred Units that were issued and outstanding.
Contractual Obligations
The following table presents eachis a summary of our contractual obligations as of December 31, 2018 (in thousands):
|
| | | | | | | | | | | | | | | | | | | | |
| | | Total | | Less than 1 year | | 1-3 years | | 4-5 years | | More than 5 years |
| Principal payments - mortgage notes | | $ | 1,917,132 |
| | $ | 167,279 |
| | $ | 617,957 |
| | $ | 459,741 |
| | $ | 672,155 |
|
Interest payments - mortgage notes (1) (2) | | 321,914 |
| | 93,710 |
| | 144,935 |
| | 80,830 |
| | 2,439 |
|
| Principal payments - Credit Facility | | 403,000 |
| | — |
| | — |
| | 403,000 |
| | — |
|
Interest payments - Credit Facility (2) | | 58,702 |
| | 15,918 |
| | 30,990 |
| | 11,794 |
| | — |
|
| Principal payments - corporate bonds | | 3,400,000 |
| | 750,000 |
| | 400,000 |
| | — |
| | 2,250,000 |
|
| Interest payments - corporate bonds | | 754,473 |
| | 120,075 |
| | 226,151 |
| | 202,776 |
| | 205,471 |
|
| Principal payments - convertible debt | | 402,500 |
| | — |
| | 402,500 |
| | — |
| | — |
|
| Interest payments - convertible debt | | 29,517 |
| | 15,094 |
| | 14,423 |
| | — |
| | — |
|
| Operating and ground lease commitments | | 287,159 |
| | 18,479 |
| | 36,120 |
| | 35,890 |
| | 196,670 |
|
Build-to-suit and other commitments (3) | | 30,343 |
| | 30,343 |
| | — |
| | — |
| | — |
|
| Total | | $ | 7,604,740 |
| | $ | 1,210,898 |
| | $ | 1,873,076 |
| | $ | 1,194,031 |
| | $ | 3,326,735 |
|
| |
| (1) | As of December 31, 2018, we had $50.7 million of variable rate mortgage notes effectively fixed through the use of interest rate swap agreements. We used the effective interest rates fixed under our swap agreements to calculate the debt payment obligations in future periods. |
| |
| (2) | Interest payments due in future periods on the $14.0 million of variable rate debt and the Credit Facility payment obligations were calculated using a forward LIBOR curve. |
| |
| (3) | Includes one build-to-suit development project and the Company’s share of capital expenditures related an expansion project of the property held within an unconsolidated joint venture. |
Cash Flow Analysis for the year ended December 31, 2018
Operating Activities –During the year ended December 31, 2018, net cash provided by operating activities decreased $299.4 million to $493.9 million from $793.3 million during the same period in 2017. The decrease was primarily due to an increase in litigation and other non-routine costs, including litigation settlements, paid during the year ended December 31, 2018. In addition, there was a decrease in interest payments due to the repayment of the 2018 Convertible Notes and a reduction of secured debt, offset by the issuance of the 2025 Senior Notes and an increase in net borrowings under the credit facilities during the year ended December 31, 2018 as compared to the same period in 2017.
Investing Activities –Net cash provided by investing activities for the year ended December 31, 2018 increased $425.2 million to $151.1 million from $274.1 million net cash used in investing activities during the same period in 2017. The increase was primarily related to a decrease in investments in real estate assets of $198.4 million, net proceeds from disposition of discontinued operations of $122.9 million and an increase in cash proceeds from dispositions of real estate and joint ventures of $56.8 million.
Financing Activities –Net cash used in financing activities of $655.4 million decreased $101.2 million during the year ended December 31, 2018 from $756.6 million during the same period in 2017. The decrease was primarily related to a decrease in payments on mortgage notes payable and other debt, including debt extinguishment costs of $286.5 million, which was partially offset by a decrease of $117.1 million in net proceeds related to the credit facilities, corporate bonds and convertible notes and repurchases of Common Stock under the Share Repurchase Programs of $50.2 million with no comparable repurchases during the same period in 2017.
Cash Flow Analysis for the year ended December 31, 2017
Operating Activities –During the year ended December 31, 2017, net cash provided by operating activities decreased $4.7 million to $793.3 million from $797.9 million during the same period in 2016. The decrease was primarily due to a decrease in rental receipts related to the disposition of 438 consolidated properties subsequent to January 1, 2016 and an increase in litigation and other non-routine costs paid during the year ended December 31, 2017. This decrease was mostly offset by a decrease in interest payments and insurance recoveries received as compared to the same period in 2016, the receipt of an income tax refund during the year ended December 31, 2017, and an increase in rental receipts related to the acquisition of 96 consolidated properties subsequent to January 1, 2016.
Investing Activities –Net cash used in investing activities for the year ended December 31, 2017 changed $1.2 billion to $274.1 million from cash provided by investing activities of $881.6 million during the same period in 2016. The change was primarily related to an increase in investments in real estate assets of $598.8 million and decrease in cash proceeds from dispositions of real estate and joint ventures of $555.2 million.
Financing Activities –Net cash used in financing activities of $756.6 million decreased $750.4 million during the year ended December 31, 2017 from $1.5 billion during the same period in 2016. The decrease was primarily due to a decrease in repayments of debt, net of proceeds, of $1.5 billion, which was partially offset by the 2016 Common Stock offering resulting in net proceeds, after underwriting discounts and offering costs, of $702.8 million and an increase in distributions paid of $28.1 million.
Election as a REIT
The General Partner elected to be taxed as a REIT for U.S. federal income tax purposes under Sections 856 through 860 of the Internal Revenue Code commencing with the taxable year ended December 31, 2011. We believe we are organized and operating in such a manner as to qualify to be taxed as a REIT for the taxable year ended December 31, 2018. As a REIT, the General Partner is generally not subject to federal income tax on taxable income that it distributes to its stockholders so long as it distributes at least 90% of its annual taxable income (computed without regard to the deduction for dividends paid and excluding net capital gains). However, the General Partner, its TRS entities, and the OP are still subject to certain state and local income, franchise and property taxes in the various jurisdictions in which they operate. The General Partner may also be subject to federal income taxes on certain income and excise taxes on its undistributed income.
The OP is classified as a partnership for U.S. federal income tax purposes. As a partnership, the OP is not a taxable entity for U.S. federal income tax purposes. Instead, each partner in the OP is required to include its allocable share of the OP’s income, gains, losses, deductions and credits for each taxable year. Under the LPA, the OP is to conduct business in such a manner as to permit the General Partner at all times to qualify as a REIT.
A TRS is a subsidiary of a REIT that is subject to federal, state and local income taxes, as applicable. The Company’s use of a TRS enables it to engage in certain business activities while complying with the REIT qualification requirements and to retain any income generated by these businesses for reinvestment without the requirement to distribute those earnings. The Company conducted substantially all of the Cole Capital business activities through a TRS until it sold the Cole Capital business on February 1, 2018.
During the year ended December 31, 2018, the Company conducted all of its business in the United States, Puerto Rico and Canada and filed income tax returns in the U.S. federal jurisdiction, the Canadian federal jurisdiction and various state and local jurisdictions. With few exceptions, the Company is no longer subject to routine examinations by taxing authorities for years before 2014. Certain of the Company’s intercompany transactions that have been eliminated in consolidation for financial accounting purposes are also subject to taxation.
Inflation
We may be adversely impacted by inflation on any leases that do not contain indexed escalation provisions. However, net leases that require the tenant to pay its allocable share of operating expenses, including common area maintenance costs, real estate taxes and insurance, may reduce our exposure to increases in costs and operating expenses resulting from inflation.
Related Party Transactions and Agreements
Through the closing of the Cole Capital sale, we were contractually responsible for managing the Cole REITs’ affairs on a day-to-day basis, identifying and making acquisitions and investments on the Cole REITs’ behalf, and recommending to each of the Cole REIT’s respective board of directors an approach for providing investors with liquidity. In addition, we distributed the shares of common stock for certain of the Cole REITs and advised them regarding offerings, managed relationships with participating broker-dealers and financial advisors, and provided assistance in connection with compliance matters relating to the offerings. We received compensation and reimbursement for services relating to the Cole REITs’ offerings and the investment, management and disposition of their respective assets, as applicable. See Note 13 –Related Party Transactions and Arrangements to our consolidated financial statements in this report for a further explanation of the various related party transactions, agreements and fees.
Off-Balance Sheet Arrangements
We have no material off-balance sheet arrangements that have had or are reasonably likely to have a current or future effect on our financial condition, changes in financial condition, revenues or expenses, results of operations, liquidity, capital expenditures or capital resources.
Item 7A. Quantitative and Qualitative Disclosures About Market Risk.
Market Risk
The market risk associated with financial instruments and derivative financial instruments is the risk of loss from adverse changes in market prices or interest rates. Our market risk arises primarily from interest rate risk relating to variable-rate borrowings. To meet our short and long-term liquidity requirements, we borrow funds at a combination of fixed and variable rates. Our interest rate risk management objectives are to limit the impact of interest rate changes on earnings and cash flows and to manage our overall borrowing costs. To achieve these objectives, from time to time, we may enter into interest rate hedge contracts such as swaps, collars and treasury lock agreements in order to mitigate our interest rate risk with respect to various debt instruments. We would not hold or issue these derivative contracts for trading or speculative purposes.
Interest Rate Risk
As of December 31, 2018, our debt included fixed-rate debt, including debt that has interest rates that are fixed with the use of derivative instruments, with a fair value and carrying value each of $5.7 billion. Changes in market interest rates on our fixed rate debt impact the fair value of the debt, but they have no impact on interest incurred or cash flow. For instance, if interest rates rise 100 basis points, and the fixed rate debt balance remains constant, we expect the fair value of our debt to decrease, the same way the price of a bond declines as interest rates rise. The sensitivity analysis related to our fixed-rate debt assumes an immediate 100 basis point move in interest rates from their December 31, 2018 levels, with all other variables held constant. A 100 basis point increase in market interest rates would result in a decrease in the fair value of our fixed rate debt of $201.3 million. A 100 basis point decrease in market interest rates would result in an increase in the fair value of our fixed-rate debt of $213.8 million.
As of December 31, 2018, our debt included variable-rate debt with a fair value of $417.2 million and a carrying value of $417.0 million. The sensitivity analysis related to our variable-rate debt assumes an immediate 100 basis point move in interest rates from their December 31, 2018 levels, with all other variables held constant. A 100 basis point increase or decrease in variable interest rates on our variable-rate debt would increase or decrease our interest expense by $4.2 million annually. See Note 7 –Debt to our consolidated financial statements.
As of December 31, 2018, our interest rate swap had a fair value that resulted in assets of $0.5 million. See Note 2 – Summary of Significant Accounting Policies to our consolidated financial statements for further discussion.
As the information presented above includes only those exposures that existed as of December 31, 2018, it does not consider exposures or positions arising after that date. The information presented herein has limited predictive value. Future actual realized gains or losses with respect to interest rate fluctuations will depend on cumulative exposures, hedging strategies employed and the magnitude of the fluctuations.
These amounts were determined by considering the impact of hypothetical interest rate changes on our borrowing costs and assume no other changes in our capital structure.
Credit Risk
Concentrations of credit risk arise when a number of tenants are engaged in similar business activities, or activities in the same geographic region, or have similar economic features that would cause their ability to meet contractual obligations, including those to the Company, to be similarly affected by changes in economic conditions. The Company is subject to tenant, geographic and industry concentrations. Any downturn of the economic conditions in one or more of these tenants, geographies or industries could result in a material reduction of our cash flows or material losses to us.
The factors considered in determining the credit risk of our tenants include, but are not limited to: payment history; credit status and change in status (credit ratings for public companies are used as a primary metric); change in tenant space needs (i.e., expansion/downsize); tenant financial performance; economic conditions in a specific geographic region; and industry specific credit considerations. We believe that the credit risk of our portfolio is reduced by the high quality of our existing tenant base, reviews of prospective tenants’ risk profiles prior to lease execution and consistent monitoring of our portfolio to identify potential problem tenants.
Item 8. Financial Statements and Supplementary Data.
The information required by Item 8 is hereby incorporated by reference to our consolidated financial statements beginning on page F-1 of this document.
Item 9. Changes in and Disagreements with Accountants on Accounting and Financial Disclosure.
None.
Item 9A. Controls and Procedures.
I. Discussion of Controls and Procedures of the General Partner
For purposes of the discussion in this Part I of Item 9A, the “Company” refers to the General Partner.
Evaluation of Disclosure Controls and Procedures
We maintain disclosure controls and procedures (as defined in Rules 13a-15(e) and 15d-15(e) of the Exchange Act that are designed to provide reasonable assurance that information required to be disclosed in our Exchange Act reports is recorded, processed, summarized and reported within the time periods specified in the SEC’s rules and forms, and that such information is accumulated and communicated to our management, including our Chief Executive Officer and Chief Financial Officer, as appropriate, to allow timely decisions regarding required disclosure. In designing and evaluating the disclosure controls and procedures, we recognize that no controls and procedures, no matter how well designed and operated, can provide absolute assurance of achieving the desired control objectives.
In accordance with Rules 13a-15(b) and 15d-15(b) of the Exchange Act, management, under the supervision and with the participation of our Chief Executive Officer and Chief Financial Officer, carried out an evaluation of the effectiveness of our disclosure controls and procedures as of December 31, 2018 and determined that the disclosure controls and procedures were effective at a reasonable assurance level as of that date.
Management’s Annual Report on Internal Control over Financial Reporting
Our management is responsible for establishing and maintaining adequate internal control over financial reporting, as such term is defined in Rules 13a-15(f) and 15d-15(f) under the Exchange Act. Internal control over financial reporting is a process to provide reasonable assurance regarding the reliability of our financial reporting and the preparation of financial statements for external purposes in accordance with GAAP. Because of its inherent limitations, internal control over financial reporting is not intended to provide absolute assurance that a misstatement of our financial statements would be prevented or detected.
Under the supervision and with the participation of our management, including our Chief Executive Officer and Chief Financial Officer, we conducted an evaluation of the effectiveness of our internal control over financial reporting based on the framework in Internal Control — Integrated Framework (2013) issued by the Committee of Sponsoring Organizations of the Treadway Commission.
Based on this evaluation, management has concluded that our internal control over financial reporting was effective as of December 31, 2018.
The effectiveness of our internal control over financial reporting as of December 31, 2018 has been audited by Deloitte & Touche LLP, an independent registered public accounting firm, as stated in their report in this Annual Report on Form 10-K.
Changes in Internal Control Over Financial Reporting
No change occurred in our internal control over financial reporting (as defined in Rules 13a-15(f) and 15d -15(f) of the Exchange Act) during the three months ended December 31, 2018 that has materially affected, or is reasonably likely to materially affect, our internal control over financial reporting.
II. Discussion of Controls and Procedures of the Operating Partnership
In the information incorporated by reference into this Part II of Item 9A, the term “Company” refers to the Operating Partnership, except as the context otherwise requires.
Evaluation of Disclosure Controls and Procedures
We maintain disclosure controls and procedures (as defined in Rules 13a-15(e) and 15d-15(e) of the Exchange Act that are designed to provide reasonable assurance that information required to be disclosed in our Exchange Act reports is recorded, processed, summarized and reported within the time periods specified in the SEC’s rules and forms, and that such information is accumulated and communicated to our management, including our Chief Executive Officer and Chief Financial Officer, as
appropriate, to allow timely decisions regarding required disclosure. In designing and evaluating the disclosure controls and procedures, we recognize that no controls and procedures, no matter how well designed and operated, can provide absolute assurance of achieving the desired control objectives.
In accordance with Rules 13a-15(b) and 15d-15(b) of the Exchange Act, management, under the supervision and with the participation of our Chief Executive Officer and Chief Financial Officer, carried out an evaluation of the effectiveness of our disclosure controls and procedures as of December 31, 2018 and determined that the disclosure controls and procedures were effective at a reasonable assurance level as of that date.
Management’s Annual Report on Internal Control over Financial Reporting
Our management is responsible for establishing and maintaining adequate internal control over financial reporting, as such term is defined in Rules 13a-15(f) and 15d-15(f) under the Exchange Act. Internal control over financial reporting is a process to provide reasonable assurance regarding the reliability of our financial reporting and the preparation of financial statements for external purposes in accordance with GAAP. Because of its inherent limitations, internal control over financial reporting is not intended to provide absolute assurance that a misstatement of our financial statements would be prevented or detected.
Under the supervision and with the participation of our management, including our Chief Executive Officer and Chief Financial Officer, we conducted an evaluation of the effectiveness of our internal control over financial reporting based on the framework in Internal Control — Integrated Framework (2013) issued by the Committee of Sponsoring Organizations of the Treadway Commission.
Based on this evaluation, management has concluded that our internal control over financial reporting was effective as of December 31, 2018.
Changes in Internal Control Over Financial Reporting
No change occurred in our internal control over financial reporting (as defined in Rules 13a-15(f) and 15d -15(f) of the Exchange Act) during the three months ended December 31, 2018 that has materially affected, or is reasonably likely to materially affect, our internal control over financial reporting.
REPORT OF INDEPENDENT REGISTERED PUBLIC ACCOUNTING FIRM
To the shareholders and the Board of Directors of VEREIT, Inc.
Opinion on Internal Control over Financial Reporting
We have audited the internal control over financial reporting of VEREIT, Inc. and subsidiaries (the “Company”) as of December 31, 2018, based on criteria established in Internal Control - Integrated Framework (2013) issued by the Committee of Sponsoring Organizations of the Treadway Commission (COSO). In our opinion, the Company maintained, in all material respects, effective internal control over financial reporting as of December 31, 2018, based on criteria established in Internal Control - Integrated Framework (2013) issued by COSO.
We have also audited, in accordance with the standards of the Public Company Accounting Oversight Board (United States) (PCAOB), the consolidated financial statements and financial statement schedules as of and for the year ended December 31, 2018, of the Company and our report dated February 20, 2019, expressed an unqualified opinion on those financial statements.
Basis for Opinion
The Company’s management is responsible for maintaining effective internal control over financial reporting and for its assessment of the effectiveness of internal control over financial reporting included in the accompanying Management’s Annual Report on Internal Control over Financial Reporting. Our responsibility is to express an opinion on the Company’s internal control over financial reporting based on our audit. We are a public accounting firm registered with the PCAOB and are required to be independent with respect to the Company in accordance with the U.S. federal securities laws and the applicable rules and regulations of the Securities and Exchange Commission and the PCAOB.
We conducted our audit in accordance with the standards of the PCAOB. Those standards require that we plan and perform the audit to obtain reasonable assurance about whether effective internal control over financial reporting was maintained in all material respects. Our audit included obtaining an understanding of internal control over financial reporting, assessing the risk that a material weakness exists, testing and evaluating the design and operating effectiveness of internal control based on the assessed risk and performing such other procedures as we considered necessary in the circumstances. We believe that our audit provides a reasonable basis for our opinion.
Definition and Limitations of Internal Control over Financial Reporting
A company’s internal control over financial reporting is a process designed to provide reasonable assurance regarding the reliability of financial reporting and the preparation of financial statements for external purposes in accordance with generally accepted accounting principles. A company’s internal control over financial reporting includes policies and procedures that (1) pertain to the maintenance of records that, in reasonable detail, accurately and fairly reflect the transactions and dispositions of the assets of the company; (2) provide reasonable assurance that transactions are recorded as necessary to permit preparation of financial statements in accordance with generally accepted accounting principles, and that receipts and expenditures of the company are being made only in accordance with authorizations of management and directors of the company; and (3) provide reasonable assurance regarding prevention or timely detection of unauthorized acquisition, use, or disposition of the company’s assets that could have a material effect on the financial statements.
Because of its inherent limitations, internal control over financial reporting may not prevent or detect misstatements. Also, projections of any evaluation of effectiveness to future periods are subject to the risk that controls may become inadequate because of changes in conditions, or that the degree of compliance with the policies or procedures may deteriorate.
/s/ DELOITTE & TOUCHE LLP
Phoenix, Arizona
February 20, 2019
Item 9B. Other Information.
None
PART III
Item 10. Directors, Executive Officers and Corporate Governance.
The information required by this Item will be included in our definitive proxy statement for the 2019 Annual Meeting of Stockholders (the “Proxy Statement”), to be filed within 120 days following the end of our fiscal year, and is incorporated herein by reference.
Item 11. Executive Compensation.
The information required by this Item will be included in the Proxy Statement and is incorporated herein by reference.
Item 12. Security Ownership of Certain Beneficial Owners and Management and Related Stockholder Matters.
The information required by this Item will be included in the Proxy Statement and is incorporated herein by reference.
Item 13. Certain Relationships and Related Transactions, and Director Independence.
The information required by this Item will be included in the Proxy Statement and is incorporated herein by reference.
Item 14. Principal Accounting Fees and Services.
The information required by this Item will be included in the Proxy Statement and is incorporated herein by reference.
PART IV
Item 15. Exhibits and Financial Statement Schedules.
Financial Statements
The Financial Statements are included herein at pages F-1 through F-60.
Financial Statement Schedules
Schedule II - Valuation and Qualifying Accounts is included herein on page F-61.
Schedule III - Real Estate and Accumulated Depreciation is included herein on pages F-62 through F-194.
Schedule IV - Mortgage Loans Held for Investment is included herein on page F-195.
Exhibits
The following exhibits are included in this Annual Report on Form 10-K for the fiscal year ended December 31, 2018 (and are numbered in accordance with Item 601 of Regulation S-K):
|
| | |
| Exhibit No. | | Description |
| 2.1 | | Agreement and Plan of Merger by and among VEREIT, Inc., VEREIT Operating Partnership, L.P., Tiger Acquisition LLC, American Realty Capital Trust III, Inc. and American Realty Capital Operating Partnership III, L.P., dated as of December 14, 2012 (Incorporated by reference to the Company’s Current Report on Form 8-K (File No. 001-35263), filed with the SEC on December 17, 2012). |
| 2.2 | | Agreement and Plan of Merger, by and among, VEREIT, Inc., VEREIT Operating Partnership, L.P., Safari Acquisition, LLC, CapLease, Inc., CapLease, LP and CLF OP General Partner LLC, dated as of May 28, 2013 (Incorporated by reference to the Company’s Current Report on Form 8-K (File NO. 001-35263), filed with the SEC on May 28, 2013). |
| 2.3 | | Purchase and Sale Agreement, by and among, CNL APF Partners, LP and Certain Affiliates as Seller Parties, and VEREIT Operating Partnership, L.P., as Purchaser, dated May 31, 2013. (Incorporated by reference to the Company’s Amended Current Report on Form 8-K/A (File No. 001-35263), filed with the SEC on June 7,2013). |
| 2.4 | | Agreement and Plan of Merger, dated as of July 1, 2013, among VEREIT, Inc., American Realty Capital Trust IV, Inc., Thunder Acquisition, LLC, VEREIT Operating Partnership, L.P. and American Realty Capital Operating Partnership IV, L.P. (Incorporated by reference to the Company’s Current Report on Form 8-K (File No. 001-35263), filed with the SEC on July 2, 2013). |
| 2.4.1 | | Amendment dated as of October 6, 2013 to the Agreement and Plan of Merger, dated as of July 1, 2013, by and among VEREIT, Inc., VEREIT Operating Partnership, L.P., Thunder Acquisition, LLC, American Realty Capital Trust IV, Inc. and American Realty Capital Operating Partnership IV, L.P. (Incorporated by reference to the Company’s First Current Report on Form 8-K (File No. 001-35263), filed with the SEC on October 7, 2013). |
| 2.4.2 | | Second Amendment dated as of October 11, 2013 to the Agreement and Plan of Merger, dated as of July 1, 2013, by and among VEREIT, Inc., VEREIT Operating Partnership, L.P., Thunder Acquisition, LLC, American Realty Capital Trust IV, Inc. and American Realty Capital Operating Partnership IV, L.P. (Incorporated by reference as Annex E to the Company’s Final Prospectus filed Pursuant to Rule 424(b)(3) (Registration No. 333-190056), filed with the SEC on December 4, 2013). |
| 2.5 | | |
| 3.1 | | |
| 3.2 | | |
| 3.3 | | |
| 3.4 | | |
| 3.5 | | |
| 3.6 | | |
| 3.7 | | |
|
| | |
| Exhibit No. | | Description |
| 3.8 | | |
| 3.9 | | |
| 3.10 | | |
| 3.11 | | |
| 3.12 | | |
| 3.13 | | |
| 4.1 | | |
| 4.2 | | |
| 4.3 | | |
| 4.4 | | |
| 4.5 | | |
| 4.6 | | |
| 4.7 | | |
| 4.8 | | Indenture, dated as of February 6, 2014, among ARC Properties Operating Partnership, L.P., Clark Acquisition, LLC, the guarantors named therein and U.S. Bank National Association, as trustee (Incorporated by reference to the Company’s Current Report on Form 8-K (File No. 001-35263), filed with the SEC on February 7, 2014). |
| 4.9 | | |
| 4.10 | | |
| 4.11 | | |
| 4.12 | | |
| 4.13 | | |
| 4.14 | | |
| 4.15 | | |
| 4.16 | | |
| 4.17 | | |
|
| | |
| Exhibit No. | | Description |
| 10.1 | | |
| 10.2 | | |
| 10.3 | | |
| 10.4† | | |
| 10.5† | | |
| 10.6† | | |
| 10.7†* | | |
| 10.8†* | | |
| 10.9†* | | |
| 10.10†* | | |
| 10.11†* | | |
| 10.12†* | | |
| 10.13†* | | |
| 10.14† | | |
| 10.15† | | |
| 10.16† | | |
| 10.17† | | |
| 10.18† | | |
| 10.19† | | |
| 10.20† | | |
| 10.21† | | |
| 10.22† | | Amendment, effective February 21, 2018, to the Employment Agreement, dated as of October 5, 2015, by and between VEREIT, Inc. and Michael J. Bartolotta (Incorporated by reference to the Company’s Annual Report on Form 10-K (File No. 001-35263), for the year ended December 31, 2017 filed with the SEC on February 22, 2018). |
| 10.23† | | |
| 10.24† | | |
| 10.25† | | Amendment, effective February 21, 2018, to the Employment Agreement, dated as of May 21, 2015, by and between VEREIT, Inc. and Lauren Goldberg (Incorporated by reference to the Company’s Annual Report on Form 10-K (File No. 001-35263), for the year ended December 31, 2017 filed with the SEC on February 22, 2018). |
|
| | |
| Exhibit No. | | Description |
| 10.26† | | |
| 10.27† | | Amendment, effective February 21, 2018, to the Employment Agreement, dated as of February 23, 2016, by and between VEREIT, Inc. and Paul McDowell (Incorporated by reference to the Company’s Annual Report on Form 10-K (File No. 001-35263), for the year ended December 31, 2017 filed with the SEC on February 22, 2018). |
| 10.28† | | |
| 10.29† | | Amendment, effective February 21, 2018, to the Employment Agreement, dated as of February 23, 2016, by and between VEREIT, Inc. and Thomas Roberts (Incorporated by reference to the Company’s Annual Report on Form 10-K (File No. 001-35263), for the year ended December 31, 2017 filed with the SEC on February 22, 2018). |
| 10.30† | | |
| 21.1* | | |
| 23.1* | | |
| 23.2* | | |
| 31.1* | | |
| 31.2* | | |
| 31.3* | | |
| 31.4* | | |
| 32.1** | | |
| 32.2** | | |
| 32.3** | | |
| 32.4** | | |
| 101.INS* | | XBRL Instance Document. |
| 101.SCH* | | XBRL Taxonomy Extension Schema Document. |
| 101.CAL* | | XBRL Taxonomy Extension Calculation Linkbase Document. |
| 101.DEF* | | XBRL Taxonomy Extension Definition Linkbase Document. |
| 101.LAB* | | XBRL Taxonomy Extension Label Linkbase Document. |
| 101.PRE* | | XBRL Taxonomy Extension Presentation Linkbase Document. |
_____________________________
| |
| ** | In accordance with Item 601(b)(32) of Regulation S-K, this Exhibit is not deemed “filed” for purposes of Section 18 of the Exchange Act or otherwise subject to the liabilities of that section. Such certifications will not be deemed incorporated by reference into any filing under the Securities Act or the Exchange Act, except to the extent that the registrant specifically incorporates it by reference. |
† Management contract or compensatory plan or arrangement.
Item 16. Form 10-K Summary.
Not Applicable
SIGNATURES
Pursuant to the requirements of the Securities Exchange Act of 1934, as amended, each registrant has duly caused this Annual Report on Form 10-K to be signed on its behalf by the undersigned thereunto duly authorized.
|
| | |
| VEREIT, INC. |
| By: | /s/ Michael J. Bartolotta |
| Michael J. Bartolotta |
| Executive Vice President and Chief Financial Officer (Principal Financial Officer) |
|
| | |
| VEREIT OPERATING PARTNERSHIP, L.P. |
| By: VEREIT, Inc., its sole general partner |
| By: | /s/ Michael J. Bartolotta |
| Michael J. Bartolotta |
| Executive Vice President and Chief Financial Officer (Principal Financial Officer) |
Dated: February 20, 2019
Pursuant to the requirements of the Securities Exchange Act of 1934, as amended, this Form 10-K has been signed below by the following persons on behalf of each registrant and in the capacities and on the dates indicated.
|
| | | | |
| Name | | Capacity * | | Date |
| | | | |
| /s/ Glenn J. Rufrano | | Chief Executive Officer | | February 20, 2019 |
| Glenn J. Rufrano | | (Principal Executive Officer and Director) | | |
| | | | |
| /s/ Michael J. Bartolotta | | Executive Vice President and Chief Financial Officer | | February 20, 2019 |
| Michael J. Bartolotta | | (Principal Financial Officer) | | |
| | | | |
| /s/ Gavin B. Brandon | | Senior Vice President and Chief Accounting Officer | | February 20, 2019 |
| Gavin B. Brandon | | (Principal Accounting Officer) | | |
| | | | |
| /s/ Hugh R. Frater | | Director, Non-Executive Chairman | | February 20, 2019 |
| Hugh R. Frater | | | | |
| | | | |
| /s/ David B. Henry | | Director | | February 20, 2019 |
| David B. Henry | | | | |
| | | | |
| /s/ Mary Hogan Preusse | | Director | | February 20, 2019 |
| Mary Hogan Preusse | | | | |
| | | | |
| /s/ Richard J. Lieb | | Director | | February 20, 2019 |
| Richard J. Lieb | | | | |
| | | | |
| /s/ Mark S. Ordan | | Director | | February 20, 2019 |
| Mark S. Ordan | | | | |
| | | | |
| /s/ Eugene A. Pinover | | Director | | February 20, 2019 |
| Eugene A. Pinover | | | | |
| | | | |
| /s/ Julie G. Richardson | | Director | | February 20, 2019 |
| Julie G. Richardson | | | | |
|
| |
| * | Each person is signing in his or her capacity as an officer and/or director of VEREIT, Inc., which is the sole general partner of VEREIT Operating Partnership, L.P. |
INDEX TO CONSOLIDATED FINANCIAL STATEMENTS
|
| |
| Page |
| Financial Statements |
| |
| |
| |
| |
| |
| |
| |
| |
| |
| |
| |
| |
| F-61 |
| F-62 |
| F-195 |
REPORT OF INDEPENDENT REGISTERED PUBLIC ACCOUNTING FIRM
To the shareholders and the Board of Directors of VEREIT, Inc.
Opinion on the Financial Statements
We have audited the accompanying consolidated balance sheets of VEREIT, Inc. and subsidiaries (the “Company”) as of December 31, 2018 and 2017, the related consolidated statements of operations, comprehensive income (loss), changes in equity and cash flows for each of the three years in the period ended December 31, 2018, and the related notes and the schedules listed in the Index at Item 15 (collectively referred to as the “financial statements”). In our opinion, the financial statements present fairly, in all material respects, the financial position of the Company as of December 31, 2018 and 2017, and the results of its operations and its cash flows for each of the three years in the period ended December 31, 2018, in conformity with accounting principles generally accepted in the United States of America.
We have also audited, in accordance with the standards of the Public Company Accounting Oversight Board (United States) (PCAOB), the Company’s internal control over financial reporting as of December 31, 2018, based on criteria established in Internal Control - Integrated Framework (2013) issued by the Committee of Sponsoring Organizations of the Treadway Commission and our report dated February 20, 2019, expressed an unqualified opinion on the Company’s internal control over financial reporting.
Basis for Opinion
These financial statements are the responsibility of the Company’s management. Our responsibility is to express an opinion on the Company’s financial statements based on our audits. We are a public accounting firm registered with the PCAOB and are required to be independent with respect to the Company in accordance with the U.S. federal securities laws and the applicable rules and regulations of the Securities and Exchange Commission and the PCAOB.
We conducted our audits in accordance with the standards of the PCAOB. Those standards require that we plan and perform the audit to obtain reasonable assurance about whether the financial statements are free of material misstatement, whether due to error or fraud. Our audits included performing procedures to assess the risks of material misstatement of the financial statements, whether due to error or fraud, and performing procedures that respond to those risks. Such procedures included examining, on a test basis, evidence regarding the amounts and disclosures in the financial statements. Our audits also included evaluating the accounting principles used and significant estimates made by management, as well as evaluating the overall presentation of the financial statements. We believe that our audits provide a reasonable basis for our opinion.
/s/ DELOITTE & TOUCHE LLP
Phoenix, Arizona
February 20, 2019
We have served as the Company’s auditor since 2015.
REPORT OF INDEPENDENT REGISTERED PUBLIC ACCOUNTING FIRM
To the partners of VEREIT Operating Partnership, L.P.
Opinion on the Financial Statements
We have audited the accompanying consolidated balance sheets of VEREIT Operating Partnership, L.P and subsidiaries (the "Operating Partnership") as of December 31, 2018 and 2017, the related consolidated statements of operations, comprehensive income (loss), changes in equity, and cash flows, for each of the three years in the period ended December 31, 2018, and the related notes and the schedules listed in the Index at Item 15 (collectively referred to as the "financial statements"). In our opinion, the financial statements present fairly, in all material respects, the financial position of the Operating Partnership as of December 31, 2018 and 2017, and the results of its operations and its cash flows for each of the three years in the period ended December 31, 2018, in conformity with accounting principles generally accepted in the United States of America.
Basis for Opinion
These financial statements are the responsibility of the Operating Partnership's management. Our responsibility is to express an opinion on the Operating Partnership's financial statements based on our audits. We are a public accounting firm registered with the Public Company Accounting Oversight Board (United States) (PCAOB) and are required to be independent with respect to the Operating Partnership in accordance with the U.S. federal securities laws and the applicable rules and regulations of the Securities and Exchange Commission and the PCAOB.
We conducted our audits in accordance with the standards of the PCAOB. Those standards require that we plan and perform the audit to obtain reasonable assurance about whether the financial statements are free of material misstatement, whether due to error or fraud. The Operating Partnership is not required to have, nor were we engaged to perform, an audit of its internal control over financial reporting. As part of our audits, we are required to obtain an understanding of internal control over financial reporting but not for the purpose of expressing an opinion on the effectiveness of the Operating Partnership’s internal control over financial reporting. Accordingly, we express no such opinion.
Our audits included performing procedures to assess the risks of material misstatement of the financial statements, whether due to error or fraud, and performing procedures that respond to those risks. Such procedures included examining, on a test basis, evidence regarding the amounts and disclosures in the financial statements. Our audits also included evaluating the accounting principles used and significant estimates made by management, as well as evaluating the overall presentation of the financial statements. We believe that our audits provide a reasonable basis for our opinion.
/s/ DELOITTE & TOUCHE LLP
Phoenix, Arizona
February 20, 2019
We have served as the Operating Partnership’s auditor since 2015.
VEREIT, INC.
CONSOLIDATED BALANCE SHEETS
(In thousands, except for share and per share data)
|
| | | | | | | | |
| | | December 31, 2018 | | December 31, 2017 |
| ASSETS | | | | |
| Real estate investments, at cost: | | | | |
| Land | | $ | 2,843,212 |
| | $ | 2,865,855 |
|
| Buildings, fixtures and improvements | | 10,749,228 |
| | 10,711,845 |
|
| Intangible lease assets | | 2,012,399 |
| | 2,037,675 |
|
| Total real estate investments, at cost | | 15,604,839 |
| | 15,615,375 |
|
| Less: accumulated depreciation and amortization | | 3,436,772 |
| | 2,908,028 |
|
| Total real estate investments, net | | 12,168,067 |
| | 12,707,347 |
|
| Investment in unconsolidated entities | | 35,289 |
| | 39,520 |
|
| Cash and cash equivalents | | 30,758 |
| | 34,176 |
|
| Restricted cash | | 22,905 |
| | 27,662 |
|
| Rent and tenant receivables and other assets, net | | 366,092 |
| | 389,060 |
|
| Goodwill | | 1,337,773 |
| | 1,337,773 |
|
| Due from affiliates, net | | — |
| | 6,041 |
|
| Real estate assets held for sale and assets related to discontinued operations, net | | 2,609 |
| | 163,999 |
|
| Total assets | | $ | 13,963,493 |
|
| $ | 14,705,578 |
|
| | | | | |
| LIABILITIES AND EQUITY | | | | |
| Mortgage notes payable, net | | $ | 1,922,657 |
| | $ | 2,082,692 |
|
| Corporate bonds, net | | 3,368,609 |
| | 2,821,494 |
|
| Convertible debt, net | | 394,883 |
| | 984,258 |
|
| Credit facility, net | | 401,773 |
| | 185,000 |
|
| Below-market lease liabilities, net | | 173,479 |
| | 198,551 |
|
| Accounts payable and accrued expenses | | 145,611 |
| | 136,474 |
|
| Deferred rent and other liabilities | | 69,714 |
| | 62,985 |
|
| Distributions payable | | 186,623 |
| | 175,301 |
|
| Due to affiliates | | — |
| | 66 |
|
| Liabilities related to discontinued operations | | — |
| | 15,881 |
|
| Total liabilities | | 6,663,349 |
| | 6,662,702 |
|
| Commitments and contingencies (Note 10) | |
| |
|
|
| Preferred stock, $0.01 par value, 100,000,000 shares authorized and 42,834,138 issued and outstanding as of each of December 31, 2018 and December 31, 2017 | | 428 |
| | 428 |
|
| Common stock, $0.01 par value, 1,500,000,000 shares authorized and 967,515,165 and 974,208,583 issued and outstanding as of December 31, 2018 and December 31, 2017, respectively | | 9,675 |
| | 9,742 |
|
| Additional paid-in-capital | | 12,615,472 |
| | 12,654,258 |
|
| Accumulated other comprehensive loss | | (1,280 | ) | | (3,569 | ) |
| Accumulated deficit | | (5,467,236 | ) | | (4,776,581 | ) |
| Total stockholders’ equity | | 7,157,059 |
| | 7,884,278 |
|
| Non-controlling interests | | 143,085 |
| | 158,598 |
|
| Total equity | | 7,300,144 |
| | 8,042,876 |
|
| Total liabilities and equity | | $ | 13,963,493 |
|
| $ | 14,705,578 |
|
The accompanying notes are an integral part of these statements.
VEREIT, INC.
CONSOLIDATED STATEMENTS OF OPERATIONS
(In thousands, except for per share data)
|
| | | | | | | | | | | | |
| | | Year Ended December 31, |
| | | 2018 | | 2017 | | 2016 |
| Rental revenue | | $ | 1,257,867 |
| | $ | 1,252,285 |
| | $ | 1,335,447 |
|
| Operating expenses: | | | | | | |
| Acquisition-related | | 3,632 |
| | 3,402 |
| | 1,321 |
|
| Litigation, merger and other non-routine costs, net of insurance recoveries | | 290,963 |
| | 47,960 |
| | 3,884 |
|
| Property operating | | 126,461 |
| | 128,717 |
| | 144,428 |
|
| General and administrative | | 63,933 |
| | 58,603 |
| | 51,927 |
|
| Depreciation and amortization | | 640,618 |
| | 706,802 |
| | 762,038 |
|
| Impairments | | 54,647 |
| | 50,548 |
| | 182,820 |
|
| Total operating expenses | | 1,180,254 |
|
| 996,032 |
|
| 1,146,418 |
|
| Other (expense) income: | | | | | | |
| Interest expense | | (280,887 | ) | | (289,766 | ) | | (317,376 | ) |
| Gain (loss) on extinguishment and forgiveness of debt, net | | 5,360 |
| | 18,373 |
| | (771 | ) |
| Other income, net | | 14,735 |
| | 6,242 |
| | 5,251 |
|
| Equity in income and gain on disposition of unconsolidated entities | | 1,869 |
| | 2,763 |
| | 9,783 |
|
| Gain (loss) on derivative instruments, net | | 355 |
| | 2,976 |
| | (1,191 | ) |
| Gain on disposition of real estate and real estate assets held for sale, net | | 94,331 |
| | 61,536 |
| | 45,524 |
|
| Total other expenses, net | | (164,237 | ) |
| (197,876 | ) |
| (258,780 | ) |
| (Loss) income before taxes | | (86,624 | ) |
| 58,377 |
|
| (69,751 | ) |
| Provision for income taxes | | (5,101 | ) | | (6,882 | ) | | (7,136 | ) |
| (Loss) income from continuing operations | | (91,725 | ) |
| 51,495 |
|
| (76,887 | ) |
| Income (loss) from discontinued operations, net of income taxes | | 3,695 |
| | (19,117 | ) | | (123,937 | ) |
| Net (loss) income | | (88,030 | ) | | 32,378 |
| | (200,824 | ) |
Net loss (income) attributable to non-controlling interests (1) | | 2,256 |
| | (560 | ) | | 4,961 |
|
| Net (loss) income attributable to the General Partner | | $ | (85,774 | ) |
| $ | 31,818 |
|
| $ | (195,863 | ) |
| | | | | | | |
| Basic and diluted net loss per share from continuing operations attributable to common stockholders | | $ | (0.17 | ) | | $ | (0.02 | ) | | $ | (0.16 | ) |
| Basic and diluted net income (loss) per share from discontinued operations attributable to common stockholders | | $ | 0.00 |
| | $ | (0.02 | ) | | $ | (0.13 | ) |
Basic and diluted net loss per share attributable to common stockholders (2) | | $ | (0.16 | ) | | $ | (0.04 | ) | | $ | (0.29 | ) |
| |
| (1) | Represents net loss (income) attributable to limited partners and consolidated joint venture partners. |
| |
| (2) | Amounts may not total due to rounding. |
The accompanying notes are an integral part of these statements.
VEREIT, INC.
CONSOLIDATED STATEMENTS OF COMPREHENSIVE INCOME (LOSS)
(In thousands)
|
| | | | | | | | | | | | |
| | | Year Ended December 31, |
| | | 2018 | | 2017 | | 2016 |
| Net (loss) income | | $ | (88,030 | ) | | $ | 32,378 |
| | $ | (200,824 | ) |
| Other comprehensive income (loss): | | | | | | |
| Unrealized gain (loss) on interest rate derivatives | | — |
| | (18 | ) | | (7,685 | ) |
| Reclassification of previous unrealized loss (gain) on interest rate derivatives into net (loss) income | | 313 |
| | (70 | ) | | 9,397 |
|
| Unrealized loss on investment securities, net | | (205 | ) | | (951 | ) | | (2,271 | ) |
| Reclassification of previous unrealized loss (gain) on investment securities into net (loss) income as other income, net | | 2,237 |
| | — |
| | — |
|
| Total other comprehensive income (loss) | | 2,345 |
|
| (1,039 | ) | | (559 | ) |
| | | | | | | |
| Total comprehensive (loss) income | | (85,685 | ) | | 31,339 |
| | (201,383 | ) |
Comprehensive loss (income) attributable to non-controlling interests (1) | | 2,200 |
| | (534 | ) | | 4,989 |
|
| Total comprehensive (loss) income attributable to the General Partner | | $ | (83,485 | ) | | $ | 30,805 |
| | $ | (196,394 | ) |
| |
| (1) | Represents comprehensive loss (income)attributable to limited partners and consolidated joint venture partners. |
The accompanying notes are an integral part of these statements.
VEREIT, INC.
CONSOLIDATED STATEMENTS OF CHANGES IN EQUITY
(In thousands, except for share data)
|
| | | | | | | | | | | | | | | | | | | | | | | | | | | | | | | | | | | | | | |
| | | Preferred Stock | | Common Stock | | | | | | | | | | | | |
| | | Number
of Shares | | Par
Value | | Number
of Shares | | Par
Value | | Additional Paid-In Capital | | Accumulated Other Comprehensive Loss | | Accumulated
Deficit | | Total Stock-holders’ Equity | | Non-Controlling Interests | | Total Equity |
| Balance, January 1, 2016 | | 42,834,138 |
| | $ | 428 |
| | 904,884,394 |
| | $ | 9,049 |
| | $ | 11,931,768 |
| | $ | (2,025 | ) | | $ | (3,415,233 | ) | | $ | 8,523,987 |
| | $ | 189,972 |
| | $ | 8,713,959 |
|
| Issuance of Common Stock, net | | — |
| | — |
| | 69,000,000 |
| | 690 |
| | 701,786 |
| | — |
| | — |
| | 702,476 |
| | — |
| | 702,476 |
|
| Conversion of OP Units to Common Stock | | — |
| | — |
| | 15,450 |
| | — |
| | 159 |
| | — |
| | — |
| | 159 |
| | (159 | ) | | — |
|
| Repurchases of Common Stock to settle tax obligation | | — |
| | — |
| | (481,261 | ) | | (5 | ) | | (4,647 | ) | | — |
| | — |
| | (4,652 | ) | | — |
| | (4,652 | ) |
| Equity-based compensation, net | | — |
| | — |
| | 728,067 |
| | 7 |
| | 10,721 |
| | — |
| | — |
| | 10,728 |
| | — |
| | 10,728 |
|
| Contributions from non-controlling interest holders | | — |
| | — |
| | — |
| | — |
| | — |
| | — |
| | — |
| | — |
| | 675 |
| | 675 |
|
Distributions declared on Common Stock —
$0.55 per common share | | — |
| | — |
| | — |
| | — |
| | — |
| | — |
| | (515,935 | ) | | (515,935 | ) | | — |
| | (515,935 | ) |
| Distributions to non-controlling interest holders | | — |
| | — |
| | — |
| | — |
| | — |
| | — |
| | — |
| | — |
| | (13,183 | ) | | (13,183 | ) |
| Dividend equivalents on awards granted under the Equity Plan | | — |
| | — |
| | — |
| | — |
| | — |
| | — |
| | (1,260 | ) | | (1,260 | ) | | — |
| | (1,260 | ) |
| Distributions to preferred shareholders and unitholders | | — |
| | — |
| | — |
| | — |
| | — |
| | — |
| | (71,748 | ) | | (71,748 | ) | | (144 | ) | | (71,892 | ) |
| Cumulative effect adjustment for equity-based compensation forfeitures | | — |
| | — |
| | — |
| | — |
| | 384 |
| | — |
| | (384 | ) | | — |
| | — |
| | — |
|
| Net loss | | — |
| | — |
| | — |
| | — |
| | — |
| | — |
| | (195,863 | ) | | (195,863 | ) | | (4,961 | ) | | (200,824 | ) |
| Other comprehensive loss | | — |
| | — |
| | — |
| | — |
| | — |
| | (531 | ) | | — |
| | (531 | ) | | (28 | ) | | (559 | ) |
| Balance, December 31, 2016 | | 42,834,138 |
| | $ | 428 |
| | 974,146,650 |
| | $ | 9,741 |
| | $ | 12,640,171 |
| | $ | (2,556 | ) | | $ | (4,200,423 | ) | | $ | 8,447,361 |
| | $ | 172,172 |
| | $ | 8,619,533 |
|
| Repurchases of Common Stock under 2017 Share Repurchase Program | | — |
| | — |
| | (68,759 | ) | | (1 | ) | | (517 | ) | | — |
| | — |
| | (518 | ) | | — |
| | (518 | ) |
| Repurchases of Common Stock to settle tax obligation | | — |
| | — |
| | (268,550 | ) | | (2 | ) | | (2,146 | ) | | — |
| | — |
| | (2,148 | ) | | — |
| | (2,148 | ) |
| Equity-based compensation, net | | — |
| | — |
| | 399,242 |
| | 4 |
| | 16,750 |
| | — |
| | — |
| | 16,754 |
| | — |
| | 16,754 |
|
| Contributions from non-controlling interest holders | | — |
| | — |
| | — |
| | — |
| | — |
| | — |
| | — |
| | — |
| | 101 |
| | 101 |
|
Distributions declared on Common Stock —
$0.55 per common share | | — |
| | — |
| | — |
| | — |
| | — |
| | — |
| | (535,657 | ) | | (535,657 | ) | | — |
| | (535,657 | ) |
| Distributions to non-controlling interest holders | | — |
| | — |
| | — |
| | — |
| | — |
| | — |
| | — |
| | — |
| | (13,227 | ) | | (13,227 | ) |
| Dividend equivalents on awards granted under the Equity Plan | | — |
| | — |
| | — |
| | — |
| | — |
| | — |
| | (571 | ) | | (571 | ) | | — |
| | (571 | ) |
| Distributions to preferred shareholders and unitholders | | — |
| | — |
| | — |
| | — |
| | — |
| | — |
| | (71,748 | ) | | (71,748 | ) | | (144 | ) | | (71,892 | ) |
| Disposition of joint venture | | — |
| | — |
| | — |
| | — |
| | — |
| | — |
| | — |
| | — |
| | (838 | ) | | (838 | ) |
| Net income | | — |
| | — |
| | — |
| | — |
| | — |
| | — |
| | 31,818 |
| | 31,818 |
| | 560 |
| | 32,378 |
|
| Other comprehensive income | | — |
| | — |
| | — |
| | — |
| | — |
| | (1,013 | ) | | — |
| | (1,013 | ) | | (26 | ) | | (1,039 | ) |
| Balance, December 31, 2017 | | 42,834,138 |
| | $ | 428 |
| | 974,208,583 |
| | $ | 9,742 |
| | $ | 12,654,258 |
| | $ | (3,569 | ) | | $ | (4,776,581 | ) | | $ | 7,884,278 |
| | $ | 158,598 |
| | $ | 8,042,876 |
|
| Conversion of OP Units to Common Stock | | — |
| | — |
| | 32,439 |
| | — |
| | 241 |
| | — |
| | — |
| | 241 |
| | (241 | ) | | — |
|
VEREIT, INC.
CONSOLIDATED STATEMENTS OF CHANGES IN EQUITY – (Continued)
(In thousands, except for share data)
|
| | | | | | | | | | | | | | | | | | | | | | | | | | | | | | | | | | | | | | |
| | | Preferred Stock | | Common Stock | | | | | | | | | | | | |
| | | Number
of Shares | | Par
Value | | Number
of Shares | | Par
Value | | Additional Paid-In Capital | | Accumulated Other Comprehensive Loss | | Accumulated
Deficit | | Total Stock-holders’ Equity | | Non-Controlling Interests | | Total Equity |
| Repurchases of Common Stock under Share Repurchase Programs | | — |
| | $ | — |
| | (7,206,876 | ) | | $ | (72 | ) | | $ | (50,082 | ) | | $ | — |
| | $ | — |
| | $ | (50,154 | ) | | $ | — |
| | (50,154 | ) |
| Repurchases of Common Stock to settle tax obligation | | — |
| | — |
| | (324,502 | ) | | (2 | ) | | (2,324 | ) | | — |
| | — |
| | (2,326 | ) | | — |
| | (2,326 | ) |
| Equity-based compensation, net | | — |
| | — |
| | 805,521 |
| | 7 |
| | 13,307 |
| | — |
| | — |
| | 13,314 |
| | — |
| | 13,314 |
|
| Contributions from non-controlling interest holders | | — |
| | — |
| | — |
| | — |
| | — |
| | — |
| | — |
| | — |
| | 120 |
| | 120 |
|
Distributions declared on Common Stock —
$0.55 per common share | | — |
| | — |
| | — |
| | — |
| | — |
| | — |
| | (532,144 | ) | | (532,144 | ) | | — |
| | (532,144 | ) |
| Distributions to non-controlling interest holders | | — |
| | — |
| | — |
| | — |
| | — |
| | — |
| | — |
| | — |
| | (13,048 | ) | | (13,048 | ) |
| Dividend equivalents on awards granted under the Equity Plan | | — |
| | — |
| | — |
| | — |
| | 72 |
| | — |
| | (989 | ) | | (917 | ) | | — |
| | (917 | ) |
| Distributions to preferred shareholders and unitholders | | — |
| | — |
| | — |
| | — |
| | — |
| | — |
| | (71,748 | ) | | (71,748 | ) | | (144 | ) | | (71,892 | ) |
| Net loss | | — |
| | — |
| | — |
| | — |
| | — |
| | — |
| | (85,774 | ) | | (85,774 | ) | | (2,256 | ) | | (88,030 | ) |
| Other comprehensive loss | | — |
| | — |
| | — |
| | — |
| | — |
| | 2,289 |
| | — |
| | 2,289 |
| | 56 |
| | 2,345 |
|
| Balance, December 31, 2018 | | 42,834,138 |
|
| $ | 428 |
|
| 967,515,165 |
|
| $ | 9,675 |
|
| $ | 12,615,472 |
|
| $ | (1,280 | ) |
| $ | (5,467,236 | ) |
| $ | 7,157,059 |
|
| $ | 143,085 |
|
| $ | 7,300,144 |
|
The accompanying notes are an integral part of these statements.
VEREIT, INC.
CONSOLIDATED STATEMENTS OF CASH FLOWS
(In thousands)
|
| | | | | | | | | | | | |
| | | Year Ended December 31, |
| | | 2018 | | 2017 | | 2016 |
| Cash flows from operating activities: | | | | |
| | |
| Net (loss) income | | $ | (88,030 | ) | | $ | 32,378 |
| | $ | (200,824 | ) |
| Adjustments to reconcile net (loss) income to net cash provided by operating activities: | | | | | | |
| Depreciation and amortization | | 659,948 |
| | 745,499 |
| | 806,548 |
|
| Gain on real estate assets, net | | (96,068 | ) | | (61,536 | ) | | (55,722 | ) |
| Impairments from held for sale | | — |
| | 20,027 |
| | — |
|
| Impairments | | 54,647 |
| | 50,548 |
| | 303,751 |
|
| Equity-based compensation | | 13,314 |
| | 16,751 |
| | 10,728 |
|
| Equity in income of unconsolidated entities and gain on joint venture | | (1,869 | ) | | (2,726 | ) | | 415 |
|
| Distributions from unconsolidated entities | | 1,366 |
| | 3,646 |
| | 1,433 |
|
| Gain on investments | | (4,092 | ) | | (65 | ) | | — |
|
| (Gain) loss on derivative instruments, net | | (355 | ) | | (2,976 | ) | | 1,191 |
|
| (Gain) loss on extinguishment and forgiveness of debt, net | | (5,360 | ) | | (18,373 | ) | | 771 |
|
| Changes in assets and liabilities: | | | | | | |
| Investment in direct financing leases | | 2,078 |
| | 2,097 |
| | 3,976 |
|
| Rent and tenant receivables and other assets, net | | (34,096 | ) | | (21,394 | ) | | (52,626 | ) |
| Due from affiliates | | — |
| | 1,163 |
| | (416 | ) |
| Assets held for sale classified as discontinued operations | | (2,492 | ) | | 13,812 |
| | — |
|
| Accounts payable and accrued expenses | | 1,688 |
| | 10,742 |
| | (3,323 | ) |
| Deferred rent and other liabilities | | 7,162 |
| | (395 | ) | | (17,740 | ) |
| Due to affiliates | | (66 | ) | | 50 |
| | (214 | ) |
| Liabilities related to discontinued operations | | (13,861 | ) | | 4,019 |
| | — |
|
| Net cash provided by operating activities | | 493,914 |
| | 793,267 |
|
| 797,948 |
|
| Cash flows from investing activities: | | | | | | |
| Investments in real estate assets | | (500,625 | ) | | (699,004 | ) | | (100,194 | ) |
| Capital expenditures and leasing costs | | (22,291 | ) | | (21,694 | ) | | (16,568 | ) |
| Real estate developments | | (9,221 | ) | | (14,850 | ) | | (17,411 | ) |
| Principal repayments received on investment securities and mortgage notes receivable | | 5,761 |
| | 6,796 |
| | 5,417 |
|
| Investments in unconsolidated entities | | (771 | ) | | — |
| | (25,777 | ) |
| Return of investment from unconsolidated entities | | 48 |
| | 1,972 |
| | 2,580 |
|
| Proceeds from disposition of real estate and joint venture | | 502,289 |
| | 445,525 |
| | 1,000,700 |
|
| Proceeds from disposition of discontinued operations | | 122,915 |
| | — |
| | — |
|
| Investment in leasehold improvements and other assets | | (841 | ) | | (1,191 | ) | | (2,259 | ) |
| Deposits for real estate assets | | (13,412 | ) | | (37,226 | ) | | (17,856 | ) |
| Proceeds from sale of investments and other assets | | 46,966 |
| | 400 |
| | — |
|
| Uses and refunds of deposits for real estate assets | | 17,267 |
| | 36,111 |
| | 13,305 |
|
| Proceeds from the settlement of property-related insurance claims | | 1,434 |
| | 355 |
| | — |
|
| Line of credit advances to Cole REITs | | (2,200 | ) | | (16,400 | ) | | (10,300 | ) |
| Line of credit repayments from Cole REITs | | 3,800 |
| | 25,100 |
| | 50,000 |
|
| Net cash provided by (used in) investing activities | | 151,119 |
| | (274,106 | ) |
| 881,637 |
|
| Cash flows from financing activities: | | | | | | |
| Proceeds from mortgage notes payable | | 187 |
| | 4,652 |
| | 3,112 |
|
| Payments on mortgage notes payable and other debt, including debt extinguishment costs | | (137,887 | ) | | (424,385 | ) | | (337,022 | ) |
| Proceeds from credit facility | | 1,934,000 |
| | 329,000 |
| | 1,033,000 |
|
| Payments on credit facility | | (1,716,000 | ) | | (645,107 | ) | | (1,993,000 | ) |
| Proceeds from corporate bonds | | 546,304 |
| | 600,000 |
| | 1,000,000 |
|
| Payments on corporate bonds, including extinguishment costs | | — |
| | — |
| | (1,311,203 | ) |
| Repayment of convertible notes | | (597,500 | ) | | — |
| | — |
|
| Payments of deferred financing costs | | (25,471 | ) | | (9,575 | ) | | (19,872 | ) |
| Repurchases of Common Stock under the Share Repurchase Programs | | (50,154 | ) | | (518 | ) | | — |
|
| Proceeds from 2016 term loan | | — |
| | — |
| | 300,000 |
|
VEREIT, INC.
CONSOLIDATED STATEMENTS OF CASH FLOWS – (Continued)
(In thousands)
|
| | | | | | | | | | | | |
| | | Year Ended December 31, |
| | | 2018 | | 2017 | | 2016 |
| Repayment of 2016 term loan | | $ | — |
| | $ | — |
| | $ | (300,000 | ) |
| Repurchases of Common Stock to settle tax obligations | | (2,326 | ) | | (2,148 | ) | | (4,652 | ) |
| Proceeds from the issuance of Common Stock, net of underwriters’ discount | | — |
| | — |
| | 702,765 |
|
| Payments of equity issuance costs | | — |
| | — |
| | (280 | ) |
| Contributions from non-controlling interest holders | | 120 |
| | 101 |
| | 675 |
|
| Distributions paid | | (606,679 | ) | | (608,615 | ) | | (580,508 | ) |
| Net cash used in financing activities | | (655,406 | ) | | (756,595 | ) |
| (1,506,985 | ) |
| Net change in cash and cash equivalents and restricted cash | | (10,373 | ) | | (237,434 | ) | | 172,600 |
|
| | | | | | | |
| Cash and cash equivalents and restricted cash, beginning of period | | $ | 64,036 |
| | $ | 301,470 |
| | $ | 128,870 |
|
| Less: cash and cash equivalents of discontinued operations | | (2,198 | ) | | (2,973 | ) | | (4,968 | ) |
| Cash and cash equivalents and restricted cash from continuing operations, beginning of period | | 61,838 |
| | 298,497 |
| | 123,902 |
|
| | | | | | | |
| Cash and cash equivalents, and restricted cash, end of period | | 53,663 |
| | 64,036 |
| | 301,470 |
|
| Less: cash and cash equivalents of discontinued operations | | — |
| | (2,198 | ) | | (2,973 | ) |
| Cash and cash equivalents and restricted cash from continuing operations, end of period | | $ | 53,663 |
| | $ | 61,838 |
|
| $ | 298,497 |
|
| Reconciliation of Cash and Cash Equivalents and Restricted Cash | | | | | | |
| Cash and cash equivalents at beginning of period | | $ | 34,176 |
| | $ | 253,479 |
| | $ | 64,135 |
|
| Restricted cash at beginning of period | | 27,662 |
| | 45,018 |
| | 59,767 |
|
| Cash and cash equivalents and restricted cash at beginning of period | | 61,838 |
| | 298,497 |
| | 123,902 |
|
| | | | | | | |
| Cash and cash equivalents at end of period | | 30,758 |
| | 34,176 |
| | 253,479 |
|
| Restricted cash at end of period | | 22,905 |
| | 27,662 |
| | 45,018 |
|
| Cash and cash equivalents and restricted cash at end of period | | $ | 53,663 |
| | $ | 61,838 |
| | $ | 298,497 |
|
The accompanying notes are an integral part of these statements.
VEREIT OPERATING PARTNERSHIP, L.P.
CONSOLIDATED BALANCE SHEETS
(In thousands, except for unit data)
|
| | | | | | | | |
| | | December 31, 2018 | | December 31, 2017 |
| ASSETS | | | | |
| Real estate investments, at cost: | | | | |
| Land | | $ | 2,843,212 |
| | $ | 2,865,855 |
|
| Buildings, fixtures and improvements | | 10,749,228 |
| | 10,711,845 |
|
| Intangible lease assets | | 2,012,399 |
| | 2,037,675 |
|
| Total real estate investments, at cost | | 15,604,839 |
|
| 15,615,375 |
|
| Less: accumulated depreciation and amortization | | 3,436,772 |
| | 2,908,028 |
|
| Total real estate investments, net | | 12,168,067 |
|
| 12,707,347 |
|
| Investment in unconsolidated entities | | 35,289 |
| | 39,520 |
|
| Cash and cash equivalents | | 30,758 |
| | 34,176 |
|
| Restricted cash | | 22,905 |
| | 27,662 |
|
| Rent and tenant receivables and other assets, net | | 366,092 |
| | 389,060 |
|
| Goodwill | | 1,337,773 |
| | 1,337,773 |
|
| Due from affiliates, net | | — |
| | 6,041 |
|
| Real estate assets held for sale and assets related to discontinued operations, net | | 2,609 |
| | 163,999 |
|
| Total assets | | $ | 13,963,493 |
|
| $ | 14,705,578 |
|
| | | | | |
| LIABILITIES AND EQUITY | | | | |
|
| Mortgage notes payable, net | | $ | 1,922,657 |
| | $ | 2,082,692 |
|
| Corporate bonds, net | | 3,368,609 |
| | 2,821,494 |
|
| Convertible debt, net | | 394,883 |
| | 984,258 |
|
| Credit facility, net | | 401,773 |
| | 185,000 |
|
| Below-market lease liabilities, net | | 173,479 |
| | 198,551 |
|
| Accounts payable and accrued expenses | | 145,611 |
| | 136,474 |
|
| Deferred rent and other liabilities | | 69,714 |
| | 62,985 |
|
| Distributions payable | | 186,623 |
| | 175,301 |
|
| Due to affiliates | | — |
| | 66 |
|
| Liabilities related to discontinued operations | | — |
| | 15,881 |
|
| Total liabilities | | 6,663,349 |
|
| 6,662,702 |
|
| Commitments and contingencies (Note 10) | |
|
| |
|
|
| General Partner's preferred equity, 42,834,138 General Partner Series F Preferred Units issued and outstanding as of each of December 31, 2018 and December 31, 2017 | | 710,325 |
| | 782,073 |
|
| General Partner's common equity, 967,515,165 and 974,208,583 General Partner OP Units issued and outstanding as of December 31, 2018 and December 31, 2017, respectively | | 6,446,734 |
| | 7,102,205 |
|
| Limited Partner's preferred equity, 86,874 Limited Partner Series F Preferred Units issued and outstanding as of each of December 31, 2018 and December 31, 2017 | | 2,883 |
| | 3,027 |
|
| Limited Partner's common equity, 23,715,908 and 23,748,347 Limited Partner OP Units issued and outstanding as of December 31, 2018 and December 31, 2017, respectively | | 138,931 |
| | 154,266 |
|
| Total partners’ equity | | 7,298,873 |
|
| 8,041,571 |
|
| Non-controlling interests | | 1,271 |
| | 1,305 |
|
| Total equity | | 7,300,144 |
|
| 8,042,876 |
|
| Total liabilities and equity | | $ | 13,963,493 |
|
| $ | 14,705,578 |
|
The accompanying notes are an integral part of these statements.
VEREIT OPERATING PARTNERSHIP, L.P.
CONSOLIDATED STATEMENTS OF OPERATIONS
(In thousands, except for per unit data)
|
| | | | | | | | | | | | |
| | | Year Ended December 31, |
| | | 2018 | | 2017 | | 2016 |
| Rental revenue | | $ | 1,257,867 |
| | $ | 1,252,285 |
| | $ | 1,335,447 |
|
| Operating expenses: | | | | | | |
| Acquisition-related | | 3,632 |
| | 3,402 |
| | 1,321 |
|
| Litigation, merger and other non-routine costs, net of insurance recoveries | | 290,963 |
| | 47,960 |
| | 3,884 |
|
| Property operating | | 126,461 |
| | 128,717 |
| | 144,428 |
|
| General and administrative | | 63,933 |
| | 58,603 |
| | 51,927 |
|
| Depreciation and amortization | | 640,618 |
| | 706,802 |
| | 762,038 |
|
| Impairments | | 54,647 |
| | 50,548 |
| | 182,820 |
|
| Total operating expenses | | 1,180,254 |
|
| 996,032 |
| | 1,146,418 |
|
| Other (expense) income: | | | | | | |
| Interest expense | | (280,887 | ) | | (289,766 | ) | | (317,376 | ) |
| Gain (loss) on extinguishment and forgiveness of debt, net | | 5,360 |
| | 18,373 |
| | (771 | ) |
| Other income, net | | 14,735 |
| | 6,242 |
| | 5,251 |
|
| Equity in income and gain on disposition of unconsolidated entities | | 1,869 |
| | 2,763 |
| | 9,783 |
|
| Gain (loss) on derivative instruments, net | | 355 |
| | 2,976 |
| | (1,191 | ) |
| Gain on disposition of real estate and real estate assets held for sale, net | | 94,331 |
| | 61,536 |
| | 45,524 |
|
| Total other expenses, net | | (164,237 | ) |
| (197,876 | ) | | (258,780 | ) |
| (Loss) income before taxes | | (86,624 | ) |
| 58,377 |
| | (69,751 | ) |
| Provision for income taxes | | (5,101 | ) | | (6,882 | ) | | (7,136 | ) |
| (Loss) income from continuing operations | | (91,725 | ) | | 51,495 |
| | (76,887 | ) |
| Income (loss) from discontinued operations, net of income taxes | | 3,695 |
| | (19,117 | ) | | (123,937 | ) |
| Net (loss) income | | (88,030 | ) |
| 32,378 |
| | (200,824 | ) |
Net loss attributable to non-controlling interests (1) | | 154 |
| | 194 |
| | 14 |
|
| Net (loss) income attributable to the OP | | $ | (87,876 | ) |
| $ | 32,572 |
| | $ | (200,810 | ) |
| | | | | | | |
| Basic and diluted net loss per unit from continuing operations attributable to common unitholders | | $ | (0.17 | ) | | $ | (0.02 | ) | | $ | (0.16 | ) |
| Basic and diluted net income (loss) per unit from discontinued operations attributable to common unitholders | | $ | 0.00 |
| | $ | (0.02 | ) | | $ | (0.13 | ) |
Basic and diluted net loss per unit attributable to common unitholders (2) | | $ | (0.16 | ) | | $ | (0.04 | ) | | $ | (0.29 | ) |
| |
| (1) | Represents net loss attributable to consolidated joint venture partners. |
| |
| (2) | Amounts may not total due to rounding. |
The accompanying notes are an integral part of these statements.
VEREIT OPERATING PARTNERSHIP, L.P.
CONSOLIDATED STATEMENTS OF COMPREHENSIVE INCOME (LOSS)
(In thousands)
|
| | | | | | | | | | | | |
| | | Year Ended December 31, |
| | | 2018 | | 2017 | | 2016 |
| Net (loss) income | | $ | (88,030 | ) | | $ | 32,378 |
| | $ | (200,824 | ) |
| Other comprehensive income (loss): | | | | | | |
| Unrealized gain (loss) on interest rate derivatives | | — |
| | (18 | ) | | (7,685 | ) |
| Reclassification of previous unrealized loss (gain) on interest rate derivatives into net (loss) income | | 313 |
| | (70 | ) | | 9,397 |
|
| Unrealized loss on investment securities, net | | (205 | ) | | (951 | ) | | (2,271 | ) |
| Reclassification of previous unrealized loss (gain) on investment securities into net (loss) income as other income, net | | 2,237 |
| | — |
| | — |
|
| Total other comprehensive income (loss) | | 2,345 |
|
| (1,039 | ) | | (559 | ) |
| | | | | | | |
| Total comprehensive (loss) income | | (85,685 | ) |
| 31,339 |
| | (201,383 | ) |
Comprehensive loss attributable to non-controlling interests (1) | | 154 |
| | 194 |
| | 14 |
|
| Total comprehensive (loss) income attributable to the OP | | $ | (85,531 | ) |
| $ | 31,533 |
| | $ | (201,369 | ) |
| |
| (1) | Represents comprehensive loss attributable to consolidated joint venture partners. |
The accompanying notes are an integral part of these statements.
VEREIT OPERATING PARTNERSHIP, L.P.
CONSOLIDATED STATEMENTS OF CHANGES IN EQUITY
(In thousands, except for unit data)
|
| | | | | | | | | | | | | | | | | | | | | | | | | | | | | | | | | | | | | | | | |
| | | Preferred Units | | Common Units | | | | | | |
| | | General Partner | | Limited Partner | | General Partner | | Limited Partner | | | | | | |
| | | Number of Units | | Capital | | Number of Units | | Capital | | Number of Units | | Capital | | Number of Units | | Capital | | Total Partners' Capital | | Non-Controlling Interests | | Total Capital |
| Balance, January 1, 2016 | | 42,834,138 |
| | $ | 925,569 |
| | 86,874 |
| | $ | 3,315 |
| | 904,884,394 |
| | $ | 7,598,418 |
| | 23,763,797 |
| | $ | 184,800 |
|
| $ | 8,712,102 |
| | $ | 1,857 |
|
| $ | 8,713,959 |
|
| Issuance of common OP Units | | — |
| | — |
| | — |
| | — |
| | 69,000,000 |
| | 702,476 |
| | — |
| | — |
| | 702,476 |
| | — |
| | 702,476 |
|
| Conversion of limited partners' common OP Units to General Partner's common OP Units | | — |
| | — |
| | — |
| | — |
| | 15,450 |
| | 159 |
| | (15,450 | ) | | (159 | ) | | — |
| | — |
| | — |
|
| Repurchases of common OP Units to settle tax obligation | | — |
| | — |
| | — |
| | — |
| | (481,261 | ) | | (4,652 | ) | | — |
| | — |
| | (4,652 | ) | | — |
| | (4,652 | ) |
| Equity-based compensation, net | | — |
| | — |
| | — |
| | — |
| | 728,067 |
| | 10,728 |
| | — |
| | — |
| | 10,728 |
| | — |
| | 10,728 |
|
| Contributions from non-controlling interest holders | | — |
| | — |
| | — |
| | — |
| | — |
| | — |
| | — |
| | — |
| | — |
| | 675 |
| | 675 |
|
| Distributions to common OP Units and non-controlling interests —$0.55 per common unit | | — |
| | — |
| | — |
| | — |
| | — |
| | (515,935 | ) | | — |
| | (13,068 | ) | | (529,003 | ) | | (115 | ) | | (529,118 | ) |
| Dividend equivalents on awards granted under the Equity Plan | | — |
| | — |
| | — |
| | — |
| | — |
| | (1,260 | ) | | — |
| | — |
| | (1,260 | ) | | — |
| | (1,260 | ) |
| Distributions to preferred OP Units | | — |
| | (71,748 | ) | | — |
| | (144 | ) | | — |
| | — |
| | — |
| | — |
| | (71,892 | ) | | — |
| | (71,892 | ) |
| Net loss | | — |
| | — |
| | — |
| | — |
| | — |
| | (195,863 | ) | | — |
| | (4,947 | ) | | (200,810 | ) | | (14 | ) | | (200,824 | ) |
| Other comprehensive loss | | — |
| | — |
| | — |
| | — |
| | — |
| | (531 | ) | | — |
| | (28 | ) | | (559 | ) | | — |
| | (559 | ) |
| Balance, December 31, 2016 | | 42,834,138 |
|
| $ | 853,821 |
|
| 86,874 |
|
| $ | 3,171 |
|
| 974,146,650 |
|
| $ | 7,593,540 |
|
| 23,748,347 |
|
| $ | 166,598 |
|
| $ | 8,617,130 |
|
| $ | 2,403 |
|
| $ | 8,619,533 |
|
| Repurchases of common OP Units under the 2017 Share Repurchase Program | | — |
| | — |
| | — |
| | — |
| | (68,759 | ) | | (518 | ) | | — |
| | — |
| | (518 | ) | | — |
| | (518 | ) |
| Repurchases of common OP Units to settle tax obligation | | — |
| | — |
| | — |
| | — |
| | (268,550 | ) | | (2,148 | ) | | — |
| | — |
| | (2,148 | ) | | — |
| | (2,148 | ) |
| Equity-based compensation, net | | — |
| | — |
| | — |
| | — |
| | 399,242 |
| | 16,754 |
| | — |
| | — |
| | 16,754 |
| | — |
| | 16,754 |
|
| Contributions from non-controlling interest holders | | — |
| | — |
| | — |
| | — |
| | — |
| | — |
| | — |
| | — |
| | — |
| | 101 |
| | 101 |
|
| Distributions to common OP Units and non-controlling interests —$0.55 per common unit | | — |
| | — |
| | — |
| | — |
| | — |
| | (535,657 | ) | | — |
| | (13,060 | ) | | (548,717 | ) | | (167 | ) | | (548,884 | ) |
| Dividend equivalents on awards granted under the Equity Plan | | — |
| | — |
| | — |
| | — |
| | — |
| | (571 | ) | | — |
| | — |
| | (571 | ) | | — |
| | (571 | ) |
| Distributions to preferred OP Units | | — |
| | (71,748 | ) | | — |
| | (144 | ) | | — |
| | — |
| | — |
| | — |
| | (71,892 | ) | | — |
| | (71,892 | ) |
| Disposition of consolidated joint venture interest | | — |
| | — |
| | — |
| | — |
| | — |
| | — |
| | — |
| | — |
| | — |
| | (838 | ) | | (838 | ) |
| Net income (loss) | | — |
| | — |
| | — |
| | — |
| | — |
| | 31,818 |
| | — |
| | 754 |
| | 32,572 |
| | (194 | ) | | 32,378 |
|
| Other comprehensive loss | | — |
| | — |
| | — |
| | — |
| | — |
| | (1,013 | ) | | — |
| | (26 | ) | | (1,039 | ) | | — |
| | (1,039 | ) |
| Balance, December 31, 2017 | | 42,834,138 |
|
| $ | 782,073 |
|
| 86,874 |
|
| $ | 3,027 |
|
| 974,208,583 |
|
| $ | 7,102,205 |
|
| 23,748,347 |
|
| $ | 154,266 |
|
| $ | 8,041,571 |
|
| $ | 1,305 |
|
| $ | 8,042,876 |
|
| Conversion of limited partners' common OP Units to General Partner's common OP Units | | — |
| | — |
| | — |
| | — |
| | 32,439 |
| | 241 |
| | (32,439 | ) | | (241 | ) | | — |
| | — |
| | — |
|
| Repurchases of common OP Units under Share Repurchase Programs | | — |
| | — |
| | — |
| | — |
| | (7,206,876 | ) | | (50,154 | ) | | — |
| | — |
| | (50,154 | ) | | — |
| | (50,154 | ) |
| Repurchases of common OP Units to settle tax obligation | | — |
| | — |
| | — |
| | — |
| | (324,502 | ) | | (2,326 | ) | | — |
| | — |
| | (2,326 | ) | | — |
| | (2,326 | ) |
| Equity-based compensation, net | | — |
| | — |
| | — |
| | — |
| | 805,521 |
| | 13,314 |
| | — |
| | — |
| | 13,314 |
| | — |
| | 13,314 |
|
| Contributions from non-controlling interest holders | | — |
| | — |
| | — |
| | — |
| | — |
| | — |
| | — |
| | — |
| | — |
| | 120 |
| | 120 |
|
| Distributions to common OP Units and non-controlling interests —$0.55 per common unit | | — |
| | — |
| | — |
| | — |
| | — |
| | (532,144 | ) | | — |
| | (13,048 | ) | | (545,192 | ) | | — |
| | (545,192 | ) |
VEREIT OPERATING PARTNERSHIP, L.P.
CONSOLIDATED STATEMENTS OF CHANGES IN EQUITY – (Continued)
(In thousands, except for unit data)
|
| | | | | | | | | | | | | | | | | | | | | | | | | | | | | | | | | | | | | | | | |
| | | Preferred Units | | Common Units | | | | | | |
| | | General Partner | | Limited Partner | | General Partner | | Limited Partner | | | | | | |
| | | Number of Units | | Capital | | Number of Units | | Capital | | Number of Units | | Capital | | Number of Units | | Capital | | Total Partners' Capital | | Non-Controlling Interests | | Total Capital |
| Dividend equivalents on awards granted under the Equity Plan | | — |
| | $ | — |
| | — |
| | $ | — |
| | — |
| | $ | (917 | ) | | — |
| | $ | — |
| | $ | (917 | ) | | $ | — |
| | $ | (917 | ) |
| Distributions to preferred OP Units | | — |
| | (71,748 | ) | | — |
| | (144 | ) | | — |
| | — |
| | — |
| | — |
| | (71,892 | ) | | — |
| | (71,892 | ) |
| Net loss | | — |
| | — |
| | — |
| | — |
| | — |
| | (85,774 | ) | | — |
| | (2,102 | ) | | (87,876 | ) | | (154 | ) | | (88,030 | ) |
| Other comprehensive income | | — |
| | — |
| | — |
| | — |
| | — |
| | 2,289 |
| | — |
| | 56 |
| | 2,345 |
| | — |
| | 2,345 |
|
| Balance, December 31, 2018 | | 42,834,138 |
| | $ | 710,325 |
| | 86,874 |
| | $ | 2,883 |
| | 967,515,165 |
| | $ | 6,446,734 |
| | 23,715,908 |
| | $ | 138,931 |
| | $ | 7,298,873 |
| | $ | 1,271 |
| | $ | 7,300,144 |
|
The accompanying notes are an integral part of these statements.
VEREIT OPERATING PARTNERSHIP, L.P.
CONSOLIDATED STATEMENTS OF CASH FLOWS
(In thousands)
|
| | | | | | | | | | | | |
| | | Year Ended December 31, |
| | | 2018 | | 2017 | | 2016 |
| Cash flows from operating activities: | | | | | | |
| Net (loss) income | | $ | (88,030 | ) | | $ | 32,378 |
| | $ | (200,824 | ) |
| Adjustments to reconcile net (loss) income to net cash provided by operating activities: | | | | | | |
| Depreciation and amortization | | 659,948 |
| | 745,499 |
| | 806,548 |
|
| Gain on real estate assets, net | | (96,068 | ) | | (61,536 | ) | | (55,722 | ) |
| Impairments from held for sale | | — |
| | 20,027 |
| | — |
|
| Impairments | | 54,647 |
| | 50,548 |
| | 303,751 |
|
| Equity based compensation | | 13,314 |
| | 16,751 |
| | 10,728 |
|
| Equity in income of unconsolidated entities | | (1,869 | ) | | (2,726 | ) | | 415 |
|
| Distributions from unconsolidated entities | | 1,366 |
| | 3,646 |
| | 1,433 |
|
| Gain on investments | | (4,092 | ) | | (65 | ) | | — |
|
| (Gain) loss on derivative instruments, net | | (355 | ) | | (2,976 | ) | | 1,191 |
|
| (Gain) loss on extinguishment of debt and forgiveness of debt | | (5,360 | ) | | (18,373 | ) | | 771 |
|
| Changes in assets and liabilities: | | | | | | |
| Investment in direct financing leases | | 2,078 |
| | 2,097 |
| | 3,976 |
|
| Rent and tenant receivables and other assets, net | | (34,096 | ) | | (21,394 | ) | | (52,626 | ) |
| Due from affiliates | | — |
| | 1,163 |
| | (416 | ) |
| Assets held for sale classified as discontinued operations | | (2,492 | ) | | 13,812 |
| | — |
|
| Accounts payable and accrued expenses | | 1,688 |
| | 10,742 |
| | (3,323 | ) |
| Deferred rent and other liabilities | | 7,162 |
| | (395 | ) | | (17,740 | ) |
| Due to affiliates | | (66 | ) | | 50 |
| | (214 | ) |
| Liabilities related to discontinued operations | | (13,861 | ) | | 4,019 |
| | — |
|
| Net cash provided by operating activities | | 493,914 |
|
| 793,267 |
| | 797,948 |
|
| Cash flows from investing activities: | | | | | | |
| Investments in real estate assets | | (500,625 | ) | | (699,004 | ) | | (100,194 | ) |
| Capital expenditures and leasing costs | | (22,291 | ) | | (21,694 | ) | | (16,568 | ) |
| Real estate developments | | (9,221 | ) | | (14,850 | ) | | (17,411 | ) |
| Principal repayments received on investment securities and mortgage notes receivable | | 5,761 |
| | 6,796 |
| | 5,417 |
|
| Investments in unconsolidated entities | | (771 | ) | | — |
| | (25,777 | ) |
| Return of investment from unconsolidated entities | | 48 |
| | 1,972 |
| | 2,580 |
|
| Proceeds from disposition of real estate and joint venture | | 502,289 |
| | 445,525 |
| | 1,000,700 |
|
| Proceeds from disposition of discontinued operations | | 122,915 |
| | — |
| | — |
|
| Investment in leasehold improvements and other assets | | (841 | ) | | (1,191 | ) | | (2,259 | ) |
| Deposits for real estate assets | | (13,412 | ) | | (37,226 | ) | | (17,856 | ) |
| Proceeds from sale of investments and other assets | | 46,966 |
| | 400 |
| | — |
|
| Uses and refunds of deposits for real estate assets | | 17,267 |
| | 36,111 |
| | 13,305 |
|
| Proceeds from the settlement of property-related insurance claims | | 1,434 |
| | 355 |
| | — |
|
| Line of credit advances to Cole REITs | | (2,200 | ) | | (16,400 | ) | | (10,300 | ) |
| Line of credit repayments from Cole REITs | | 3,800 |
| | 25,100 |
| | 50,000 |
|
| Net cash provided by (used in) investing activities | | 151,119 |
| | (274,106 | ) | | 881,637 |
|
| Cash flows from financing activities: | | | | | | |
| Proceeds from mortgage notes payable | | 187 |
| | 4,652 |
| | 3,112 |
|
| Payments on mortgage notes payable and other debt, including debt extinguishment costs | | (137,887 | ) | | (424,385 | ) | | (337,022 | ) |
| Proceeds from credit facility | | 1,934,000 |
| | 329,000 |
| | 1,033,000 |
|
| Payments on credit facility | | (1,716,000 | ) | | (645,107 | ) | | (1,993,000 | ) |
| Proceeds from corporate bonds | | 546,304 |
| | 600,000 |
| | 1,000,000 |
|
| Payments on corporate bonds, including extinguishment costs | | — |
| | — |
| | (1,311,203 | ) |
| Repayment of convertible notes | | (597,500 | ) | | — |
| | — |
|
| Payments of deferred financing costs | | (25,471 | ) | | (9,575 | ) | | (19,872 | ) |
| Proceeds from 2016 term loan | | — |
| | — |
| | 300,000 |
|
| Repayment of 2016 term loan | | — |
| | — |
| | (300,000 | ) |
VEREIT OPERATING PARTNERSHIP, L.P.
CONSOLIDATED STATEMENTS OF CASH FLOWS – (Continued)
(In thousands)
|
| | | | | | | | | | | | |
| | | Year Ended December 31, |
| | | 2018 | | 2017 | | 2016 |
| Repurchases of Common Stock under the Share Repurchase Programs | | $ | (50,154 | ) | | $ | (518 | ) | | $ | — |
|
| Repurchases of Common Stock to settle tax obligations | | (2,326 | ) | | (2,148 | ) | | (4,652 | ) |
| Proceeds from the issuance of common OP Units, net of underwriters’ discount | | — |
| | — |
| | 702,765 |
|
| Payments of equity issuance costs | | — |
| | — |
| | (280 | ) |
| Contributions from non-controlling interest holders | | 120 |
| | 101 |
| | 675 |
|
| Distributions paid | | (606,679 | ) | | (608,615 | ) | | (580,508 | ) |
| Net cash used in financing activities | | (655,406 | ) |
| (756,595 | ) | | (1,506,985 | ) |
| Net change in cash and cash equivalents and restricted cash | | (10,373 | ) | | (237,434 | ) | | 172,600 |
|
| | | | | | | |
| Cash and cash equivalents and restricted cash, beginning of period | | $ | 64,036 |
| | $ | 301,470 |
| | $ | 128,870 |
|
| Less: cash and cash equivalents of discontinued operations | | (2,198 | ) | | (2,973 | ) | | (4,968 | ) |
| Cash and cash equivalents and restricted cash from continuing operations, beginning of period | | 61,838 |
| | 298,497 |
| | 123,902 |
|
| | | | | | | |
| Cash and cash equivalents, and restricted cash, end of period | | 53,663 |
| | 64,036 |
| | 301,470 |
|
| Less: cash and cash equivalents of discontinued operations | | — |
| | (2,198 | ) | | (2,973 | ) |
| Cash and cash equivalents and restricted cash from continuing operations, end of period | | $ | 53,663 |
| | $ | 61,838 |
| | $ | 298,497 |
|
| Reconciliation of Cash and Cash Equivalents and Restricted Cash | | | | | | |
| Cash and cash equivalents at beginning of period | | $ | 34,176 |
| | $ | 253,479 |
| | $ | 64,135 |
|
| Restricted cash at beginning of period | | 27,662 |
| | 45,018 |
| | 59,767 |
|
| Cash and cash equivalents and restricted cash at beginning of period | | 61,838 |
| | 298,497 |
| | 123,902 |
|
| | | | | | | |
| Cash and cash equivalents at end of period | | 30,758 |
| | 34,176 |
| | 253,479 |
|
| Restricted cash at end of period | | 22,905 |
| | 27,662 |
| | 45,018 |
|
| Cash and cash equivalents and restricted cash at end of period | | $ | 53,663 |
| | $ | 61,838 |
| | $ | 298,497 |
|
The accompanying notes are an integral part of these statements.
VEREIT, INC. and VEREIT OPERATING PARTNERSHIP, L.P.
NOTES TO CONSOLIDATED FINANCIAL STATEMENTS
December 31, 2018
Note 1 – Organization
VEREIT is a Maryland corporation, incorporated on December 2, 2010, that qualified as a real estate investment trust (“REIT”) for U.S. federal income tax purposes beginning in the taxable year ended December 31, 2011. The OP is a Delaware limited partnership of which the General Partner is the sole general partner. VEREIT’s common stock, par value $0.01 per share (“Common Stock”), and its 6.70% Series F Cumulative Redeemable Preferred Stock, par value $0.01 per share (“Series F Preferred Stock”) trade on the New York Stock Exchange (“NYSE”) under the trading symbols, “VER” and “VER PRF,” respectively. As used herein, the terms the “Company,” “we,” “our” and “us” refer to VEREIT, together with its consolidated subsidiaries, including the OP.
VEREIT is a full-service real estate operating company which owns and manages one of the largest portfolios of single-tenant commercial properties in the U.S. VEREIT’s business model provides equity capital to creditworthy corporations in return for long-term leases on their properties. The Company actively manages its portfolio considering a number of metrics including property type, concentration and key economic factors for appropriate balance and diversity.
Substantially all of the Company’s operations are conducted through the OP. VEREIT is the sole general partner and holder of 97.6% of the common equity interests in the OP as of December 31, 2018 with the remaining 2.4% of the common equity interests owned by unaffiliated investors and certain former directors, officers and employees of ARC Properties Advisors, LLC (the “Former Manager”). Under the limited partnership agreement of the OP, as amended (the “LPA”), after holding units of limited partner interests in the OP (“OP Units”), including Series F Preferred Units, for a period of one year and meeting the other requirements in the LPA, unless an earlier redemption is otherwise consented to by VEREIT, holders of OP Units, including Series F Preferred Units, have the right to redeem the units for the cash value of a corresponding number of shares of VEREIT’s Common Stock or VEREIT’s Series F Preferred Stock, as applicable, or, at the option of VEREIT, a corresponding number of shares of VEREIT’s Common Stock or Series F Preferred Stock. The remaining rights of the holders of OP Units are limited, however, and do not include the ability to replace the General Partner or to approve the sale, purchase or refinancing of the OP’s assets.
The actions of the OP and its relationship with the General Partner are governed by the LPA. The General Partner does not have any significant assets other than its investment in the OP. Therefore, the assets and liabilities of the General Partner and the OP are the same. Additionally, pursuant to the LPA, all administrative expenses and expenses associated with the formation, continuity, existence and operation of the General Partner incurred by the General Partner on the OP’s behalf shall be treated as expenses of the OP. Further, when the General Partner issues any equity instrument that has been approved by the General Partner’s Board of Directors, the LPA requires the OP to issue to the General Partner equity instruments with substantially similar terms, to protect the integrity of the Company’s umbrella partnership REIT structure, pursuant to which each holder of interests in the OP has a proportionate economic interest in the OP reflecting its capital contributions thereto. OP Units and Series F Preferred Units issued to the General Partner are referred to as “General Partner OP Units” and “General Partner Series F Preferred Units,” respectively. OP Units and Series F Preferred Units issued to parties other than the General Partner are referred to as “Limited Partner OP Units” and “Limited Partner Series F Preferred Units,” respectively. The LPA also provides that the OP issue debt with terms and provisions consistent with debt issued by the General Partner. The LPA will be amended to provide for the issuance of any additional class of equivalent equity instruments to the extent the General Partner’s Board of Directors authorizes the issuance of any new class of equity securities.
As discussed in Note 4 —Discontinued Operations, on February 1, 2018, the Company completed the sale of its investment management segment, Cole Capital. The assets, liabilities and related financial results of substantially all of the Cole Capital segment are reflected in the financial statements as discontinued operations.
Note 2 –Summary of Significant Accounting Policies
Basis of Accounting
The consolidated financial statements of the Company presented herein include the accounts of the General Partner and its consolidated subsidiaries, including the OP. All intercompany transactions have been eliminated upon consolidation. The financial statements are prepared on the accrual basis of accounting in accordance with generally accepted accounting principles in the United States (“U.S. GAAP”).
Principles of Consolidation and Basis of Presentation
The consolidated financial statements include the accounts of the Company and its consolidated subsidiaries and consolidated joint venture arrangements. The portions of the consolidated joint venture arrangements not owned by the Company are presented
VEREIT, INC. and VEREIT OPERATING PARTNERSHIP, L.P.
NOTES TO CONSOLIDATED FINANCIAL STATEMENTS
December 31, 2018 – (Continued)
as non-controlling interests in VEREIT’s and the OP’s consolidated balance sheets, statements of operations, statements of comprehensive income (loss) and statements of changes in equity. In addition, as described in Note 1 – Organization, certain third parties have been issued OP Units. Holders of OP Units are considered to be non-controlling interest holders in the OP and their ownership interest in the limited partner’s share is presented as non-controlling interests in VEREIT’s consolidated balance sheets, statements of operations, statements of comprehensive income (loss) and statements of changes in equity. Further, a portion of the earnings and losses of the OP are allocated to non-controlling interest holders based on their respective ownership percentages. Upon conversion of OP Units to Common Stock, any difference between the fair value of shares of Common Stock issued and the carrying value of the OP Units converted is recorded as a component of equity. As of each of December 31, 2018 and 2017, there were approximately 23.7 million Limited Partner OP Units outstanding.
For legal entities being evaluated for consolidation, the Company must first determine whether the interests that it holds and fees it receives qualify as variable interests in the entity. A variable interest is an investment or other interest that will absorb portions of an entity’s expected losses or receive portions of the entity’s expected residual returns. The Company’s evaluation includes consideration of fees paid to the Company where the Company acts as a decision maker or service provider to the entity being evaluated. If the Company determines that it holds a variable interest in an entity, it evaluates whether that entity is a variable interest entity (“VIE”). VIEs are entities where investors lack sufficient equity at risk for the entity to finance its activities without additional subordinated financial support or where equity investors, as a group, lack one of the following characteristics: (a) the power to direct the activities that most significantly impact the entity’s economic performance, (b) the obligation to absorb the expected losses of the entity, or (c) the right to receive the expected returns of the entity.
The Company then qualitatively assesses whether it is (or is not) the primary beneficiary of a VIE, which is generally defined as the party who has a controlling financial interest in the VIE. Consideration of various factors include, but are not limited to, the Company’s ability to direct the activities that most significantly impact the entity’s economic performance and its obligation to absorb losses from or right to receive benefits of the VIE that could potentially be significant to the VIE. The Company consolidates any VIEs when the Company is determined to be the primary beneficiary of the VIE and the difference between consolidating the VIE and accounting for it using the equity method could be material to the Company’s consolidated financial statements. The Company continually evaluates the need to consolidate these VIEs based on standards set forth in U.S. GAAP.
Reclassification
As described below, the following items previously reported have been reclassified to conform with the current period’s presentation.
The operating expense reimbursements line item has been combined into rental revenue for prior periods presented to be consistent with the current year presentation.
The investment in direct financing leases, net, investment securities, at fair value and mortgage notes receivable, net line items from prior periods have been combined into the rent and tenant receivables and other assets, net caption on the consolidated balance sheets. Investments in the Cole REITs, as defined in “Investment in Cole REITs” section herein, has also been reclassified as of December 31, 2017 to rent and tenant receivables and other assets, net from investment in unconsolidated entities to be consistent with the current year presentation. Refer to Note 5 – Rent and Tenant Receivables and Other Assets, Netfor reclassification amounts and additional information.
The distributions declared on Common Stock line item from prior periods has been updated to exclude distributions on restricted stock units (“Restricted Stock Units”) and deferred stock units (“Deferred Stock Units”) on the consolidated statements of changes in equity for all periods presented. These amounts are now included in the line item dividend equivalents on awards granted under the Equity Plan (as defined in Note 12 – Equity-based Compensation), which also includes dividend equivalents on restricted shares of Common Stock (“Restricted Shares”). The dividend equivalents on Restricted Shares were previously included in the line item distributions to participating securities in the consolidated statements of changes in equity.
Use of Estimates
The preparation of financial statements in conformity with U.S. GAAP requires management to make estimates and assumptions that affect the reported amounts of assets and liabilities and disclosure of contingent assets and liabilities at the date of the financial statements and the reported amounts of revenues and expenses during the reporting period. Actual results could differ from those estimates. Management makes significant estimates regarding goodwill and intangible asset impairments, real estate investment impairment, allocation of purchase price of real estate asset acquisitions and income taxes.
VEREIT, INC. and VEREIT OPERATING PARTNERSHIP, L.P.
NOTES TO CONSOLIDATED FINANCIAL STATEMENTS
December 31, 2018 – (Continued)
Real Estate Investments
The Company records acquired real estate at cost and makes assessments as to the useful lives of depreciable assets. The Company considers the period of future benefit of the asset to determine the appropriate useful lives. Depreciation is computed using a straight-line method over the estimated useful life of 40 years for buildings, five to 15 years for building fixtures and improvements and the remaining lease term for intangible lease assets.
Allocation of Purchase Price of Real Estate Assets
The Company allocates the purchase price of acquired properties to tangible and identifiable intangible assets and liabilities acquired based on their relative fair values. Tangible assets include land, buildings, fixtures and improvements on an as-if vacant basis. The Company utilizes various estimates, processes and information to determine the as-if vacant property value. Identifiable intangible assets and liabilities include amounts allocated to acquired leases for above-market and below-market lease rates and the value of in-place leases. In estimating fair values for purposes of allocating purchase price, the Company utilizes a number of sources, including independent appraisals that may be obtained in connection with the acquisition or financing of the respective property and other market data. The Company also considers information obtained about each property as a result of its pre-acquisition due diligence, as well as subsequent marketing and leasing activities, in estimating the fair value of the tangible and intangible assets acquired and intangible liabilities assumed.
The aggregate value of intangible assets related to in-place leases is primarily the difference between the property valued with existing in-place leases adjusted to market rental rates and the property valued as if vacant. Factors considered by the Company in its analysis of the in-place lease intangibles include an estimate of carrying costs during the expected lease-up period for each property, taking into account current market conditions and costs to execute similar leases. In estimating carrying costs, the Company includes real estate taxes, insurance and other operating expenses and estimates of lost rentals at market rates during the expected lease-up period, which typically ranges from six to 18 months. The Company also estimates costs to execute similar leases, including leasing commissions, legal and other related expenses. The value of in-place leases is amortized over the initial term of the respective leases. If a tenant terminates its lease, then the unamortized portion of the in-place lease value is charged to expense.
Above-market and below-market in-place lease values for owned properties are recorded based on the present value (using an interest rate which reflects the risks associated with the leases acquired) of the difference between the contractual amounts to be paid pursuant to the in-place leases and management’s estimate of fair market lease rates for the corresponding in-place leases, measured over a period equal to the remaining non-cancelable term of the lease, including any bargain renewal periods. Above-market leases are amortized as a reduction to rental revenue over the remaining terms of the respective leases. Below-market leases are amortized as an increase to rental revenue over the remaining terms of the respective leases, including any bargain renewal periods.
The determination of the fair values of the real estate assets and liabilities acquired requires the use of significant assumptions with regard to the current market rental rates, rental growth rates, capitalization and discount rates, interest rates and other variables. The use of alternative estimates may result in a different allocation of the Company’s purchase price, which could materially impact the Company’s results of operations.
In January 2017, the Company elected to early adopt ASU 2017-01, Business Combinations (Topic 805): Clarifying the Definition of a Business (“ASU 2017-01”), which clarifies the definition of a business by adding guidance to assist entities in evaluating whether transactions should be accounted for as acquisitions of assets or businesses. During the years ended December 31, 2018 and 2017, all real estate acquisitions qualified as asset acquisitions, and external acquisition costs related to asset acquisitions were capitalized and allocated to tangible and intangible assets and liabilities as described above. Prior to January 1, 2017, external costs related to property acquisitions were expensed as incurred. Internal costs, such as employee salaries, related to activities necessary to complete, or affect, self-originating asset acquisitions or business combinations are classified as acquisition-related expenses in the accompanying consolidated statements of operations for all periods presented.
Assets Held for Sale
Upon classifying a real estate investment as held for sale, the Company will no longer recognize depreciation expense related to the depreciable assets of the property. Assets held for sale are recorded at the lower of carrying value or estimated fair value, less the estimated cost to dispose of the assets. See Note 3–Real Estate Investments and Related Intangibles for further discussion regarding properties held for sale.
If circumstances arise that the Company previously considered unlikely and, as a result, the Company decides not to sell a property previously classified as held for sale, the Company will reclassify the property as held and used. The Company measures and records a property that is reclassified as held and used at the lower of (i) its carrying value before the property was classified
VEREIT, INC. and VEREIT OPERATING PARTNERSHIP, L.P.
NOTES TO CONSOLIDATED FINANCIAL STATEMENTS
December 31, 2018 – (Continued)
as held for sale, adjusted for any depreciation expense that would have been recognized had the property been continuously classified as held and used or (ii) the estimated fair value at the date of the subsequent decision not to sell.
Development Activities
Project costs, which include interest expense, associated with the development, construction and lease-up of a real estate project are capitalized as construction in progress. Once the development and construction of the building is substantially completed, the amounts capitalized to construction in progress are transferred to (i) land and (ii) buildings, fixtures and improvements and are depreciated over their respective useful lives.
Discontinued Operations
The Company reports discontinued operations when a component of an entity or group of components that has been disposed of or classified as held for sale represents a strategic shift that has or will have a major effect on an entity’s operations and financial results. The results of operations for assets meeting the definition of discontinued operations are reflected in the Company’s consolidated statements of operations as discontinued operations for all periods presented. See Note 4 —Discontinued Operations for further discussion regarding discontinued operations.
Investment in Unconsolidated Entities
Unconsolidated Joint Ventures
The Company accounts for its investment in unconsolidated joint venture arrangements using the equity method of accounting as the Company has the ability to exercise significant influence, but not control, over operating and financing policies of these investments. The equity method of accounting requires the investment to be initially recorded at cost and subsequently adjusted for the Company’s share of equity in the joint ventures’ earnings and distributions. The Company records its proportionate share of net income (loss) from the unconsolidated joint ventures in equity in income and gain on disposition of unconsolidated entities in the consolidated statements of operations. See Note 3–Real Estate Investments and Related Intangiblesfor further discussion on investments in unconsolidated joint ventures.
Investment in Cole REITs
As of December 31, 2017, the Company owned equity investments in Cole Credit Property Trust IV, Inc. (“CCPT IV”), CIM Income NAV, Inc. (formerly known as Cole Real Estate Income Strategy (Daily NAV), Inc.) (“INAV”), Cole Office & Industrial REIT (CCIT II), Inc. (“CCIT II”), Cole Office & Industrial REIT (CCIT III), Inc. (“CCIT III”), and Cole Credit Property Trust V, Inc. (“CCPT V” and collectively with CCPT IV, INAV, CCIT II and CCIT III, the “Cole REITs”). On February 1, 2018, the Company sold certain of its equity investments to CCA Acquisition, LLC (the “Cole Purchaser”), an affiliate of CIM Group, LLC, retaining interests in CCIT II, CCIT III and CCPT V. Subsequent to the sale of Cole Capital and the adoption of ASU 2016-01 (as defined in “Recent Accounting Pronouncements” section below), the Company carries these investments at fair value, as the Company does not exert significant influence over CCIT II, CCIT III or CCPT V, and any changes in the fair value are recognized in other income, net in the accompanying consolidated statement of operations for the year ended December 31, 2018.Prior to the sale of Cole Capital, the Company accounted for these investments using the equity method of accounting, which required the investment to be initially recorded at cost and subsequently adjusted for the Company’s share of equity in the respective Cole REIT’s earnings and distributions. The Company recorded its proportionate share of net income or loss from the Cole REITs in equity in income and gain on disposition of unconsolidated entities in the consolidated statement of operations for the year ended December 31, 2018.
Leasehold Improvements and Property and Equipment
The Company leases its corporate office facilities under operating leases. Leasehold improvements related to these are recorded at cost less accumulated amortization. Leasehold improvements are amortized over the lesser of the estimated useful life or remaining lease term.
Property and equipment, which typically include computer hardware and software, furniture and fixtures, among other items, are stated at cost less accumulated depreciation. Property and equipment are depreciated on a straight-line method over the estimated useful lives of the assets, which range from three to seven years. The Company reassesses the useful lives of its property and equipment and adjusts the future monthly depreciation expense based on the new useful life, as applicable. If the Company disposes of an asset, the asset and related accumulated depreciation are written off upon disposal.
VEREIT, INC. and VEREIT OPERATING PARTNERSHIP, L.P.
NOTES TO CONSOLIDATED FINANCIAL STATEMENTS
December 31, 2018 – (Continued)
Goodwill
In the case of a business combination, after identifying all tangible and intangible assets and liabilities, the excess consideration paid over the fair value of the assets and liabilities acquired and assumed, respectively, represents goodwill. In connection with prior mergers, the Company recorded goodwill as a result of the merger consideration exceeding the net assets acquired. As of December 31, 2018 and 2017, the carrying value of goodwill was $1.3 billion.
Prior to the adoption of ASU 2017-01 in January 2017, in the event the Company disposed of a property, or classified a property as an asset held for sale, that constituted a business under U.S. GAAP, the Company allocated a portion of the real estate investments reporting unit’s goodwill to that property in determining the gain or loss on the disposal of the property. The amount of goodwill allocated to the business was based on the relative fair value of the business to the fair value of the reporting unit. During the year ended December 31, 2016, the Company allocated $73.2 million of goodwill to dispositions and held for sale assets, which included $2.3 million of goodwill allocated to the cost basis of two properties foreclosed upon. The allocated goodwill of $73.2 million was included in gain on disposition of real estate and real estate assets held for sale, net, in the consolidated statement of operations.
Impairments
Real Estate Assets
The Company performs quarterly impairment review procedures, primarily through continuous monitoring of events and changes in circumstances that could indicate the carrying value of its real estate assets may not be recoverable. Impairment indicators that the Company considers include, but are not limited to, decrease in net operating income, bankruptcy or other credit concerns of a property’s major tenant or tenants, such as history of late payments, rental concessions and other factors, as well as significant decreases in a property’s revenues due to lease terminations, vacancies, co-tenancy clauses or reduced lease rates. When impairment indicators are identified or if a property is considered to have a more likely than not probability of being disposed of within the next 12 to 24 months, the Company assesses the recoverability of the assets by determining whether the carrying value of the assets will be recovered through the undiscounted future cash flows expected from the use of the assets and their eventual disposition. U.S. GAAP requires us to utilize the Company’s expected holding period of our properties when assessing recoverability. In the event that such expected undiscounted future cash flows do not exceed the carrying value, the Company will adjust the real estate assets to their respective fair values and recognize an impairment loss. Generally, fair value is determined using a discounted cash flow analysis and recent comparable sales or leasing transactions. The assumptions and uncertainties utilized in the evaluation of the impairment of real estate assets are discussed in Note 6 – Fair Value Measures.
Goodwill
The Company evaluates goodwill for impairment annually or more frequently when an event occurs or circumstances change that indicate the carrying value may not be recoverable. The Company’s annual testing date is during the fourth quarter. In 2017, the Company adopted ASU 2017-04, Intangibles – Goodwill and Others (Topic 350): Simplifying the Test for Goodwill Impairment, which allows the Company to test goodwill for impairment by comparing the carrying value of net assets to their respective fair value. If the fair value is determined to be less than the carrying value, an impairment charge will be recorded for the difference between the fair value and the carrying value. The Company estimates the fair value using discounted cash flows and relevant competitor multiples. The evaluation of goodwill for potential impairment requires the Company’s management to exercise significant judgment and to make certain assumptions. While the Company believes its assumptions are reasonable, there are no guarantees as to actual results. Changes in assumptions based on actual results may have a material impact on the Company’s financial results. The analysis performed for the annual goodwill tests during the years ended December 31, 2018, 2017 and 2016 resulted in no impairment. Goodwill related to discontinued operations is discussed in Note 4 —Discontinued Operations.
VEREIT, INC. and VEREIT OPERATING PARTNERSHIP, L.P.
NOTES TO CONSOLIDATED FINANCIAL STATEMENTS
December 31, 2018 – (Continued)
Investment in Unconsolidated Entities
The Company is required to determine whether an event or change in circumstances has occurred that may have a significant adverse effect on the fair value of any of its investment in the unconsolidated entities. If an event or change in circumstance has occurred, the Company is required to evaluate its investment in the unconsolidated entity for potential impairment and determine if the carrying value of its investment exceeds its fair value. An impairment charge is recorded when an impairment is deemed to be other-than-temporary. To determine whether an impairment is other-than-temporary, the Company considers whether it has the ability and intent to hold the investment until the carrying value is fully recovered. The evaluation of an investment in an unconsolidated entity for potential impairment requires the Company’s management to exercise significant judgment and to make certain assumptions. The use of different judgments and assumptions could result in different conclusions. No impairments of unconsolidated entities were identified during the years ended December 31, 2018, 2017 and 2016.
Leasehold Improvements and Property and Equipment
Leasehold improvements and property and equipment are reviewed for impairment when events or changes in circumstances indicate that the carrying value of such assets may not be recoverable. If this review indicates that the carrying value of the asset is not recoverable, the Company records an impairment loss, measured at fair value by estimated discounted cash flows or market appraisals. The evaluation of leasehold improvements and property and equipment for potential impairment requires the Company’s management to exercise significant judgment and to make certain assumptions. The use of different judgments and assumptions could result in different conclusions. No impairments of leasehold improvements and property and equipment were identified during the years ended December 31, 2018, 2017 and 2016.
Cash and Cash Equivalents
Cash and cash equivalents include cash in bank accounts, as well as investments in highly-liquid money market funds with original maturities of three months or less. The Company deposits cash with several high quality financial institutions. These deposits are guaranteed by the Federal Deposit Insurance Corporation (“FDIC”) up to an insurance limit of $250,000. At times, the Company’s cash and cash equivalents may exceed federally insured levels. Although the Company bears risk on amounts in excess of those insured by the FDIC, it has not experienced and does not anticipate any losses due to the high quality of the institutions where the deposits are held.
Restricted Cash
The Company had $22.9 million and $27.7 million, respectively, in restricted cash as of December 31, 2018 and 2017. Restricted cash primarily consists of reserves related to lease expirations, as well as maintenance, structural and debt service reserves. In accordance with certain debt agreements, rent from certain of the Company’s tenants is deposited directly into a lockbox account, from which the monthly debt service payments are disbursed to the lender and the excess funds are then disbursed to the Company. Included in restricted cash at December 31, 2018 was $21.5 million in lender reserves and $1.4 million held in restricted lockbox accounts. Included in restricted cash at December 31, 2017 was $26.4 million in lender reserves and $1.3 million held in restricted lockbox accounts.
Investment in Direct Financing Leases
The Company has acquired certain properties that are subject to leases that qualify as direct financing leases in accordance with U.S. GAAP due to the significance of the lease payments from the inception of the leases compared to the fair value of the property or due to bargain purchase options. Investments in direct financing leases represent the fair value of the remaining lease payments on the leases and the estimated fair value of any expected residual property value at the end of the lease term. The fair value of the remaining lease payments is estimated using a discounted cash flow analysis based on interest rates that would represent the Company’s incremental borrowing rate for similar types of debt. The expected residual property value at the end of the lease term is estimated using market data and assessments of the remaining useful lives of the properties at the end of the lease terms, among other factors. Income from direct financing leases is calculated using the effective interest method over the remaining term of the lease.
VEREIT, INC. and VEREIT OPERATING PARTNERSHIP, L.P.
NOTES TO CONSOLIDATED FINANCIAL STATEMENTS
December 31, 2018 – (Continued)
Deferred Financing Costs
Deferred financing costs represent commitment fees, legal fees and other costs associated with obtaining commitments for financing. Deferred financing costs, other than those associated with the Revolving Credit Facility (as defined in Note 7 –Debt), are presented on the consolidated balance sheets as a direct deduction from the carrying amount of the related debt liability rather than as an asset. These costs are amortized to interest expense over the terms of the respective financing agreements using the effective interest method. Unamortized deferred financing costs are written off when the associated debt is refinanced or repaid before maturity. Costs incurred in connection with potential financial transactions that are not completed are expensed in the period in which it is determined the financing will not be completed.
Convertible Debt
The Company has an outstanding aggregate balance of $402.5 million related to the 2020 Convertible Notes listed below(as defined in Note 7 –Debt). The 2020 Convertible Notes are convertible into cash or shares of the Company’s Common Stock at the Company’s option. In accordance with U.S GAAP, the 2020 Convertible Notes are accounted for as a liability with a separate equity component recorded for the conversion option. A liability was recorded for the 2020 Convertible Notes on the issuance date at fair value based on a discounted cash flow analysis using current market rates for debt instruments with similar terms. The difference between the initial proceeds from the 2020 Convertible Notes and the estimated fair value of the debt instruments resulted in a debt discount, with an offset recorded to additional paid-in capital representing the equity component. The debt discount is being amortized to interest expense over the respective term of the 2020 Convertible Notes.
Derivative Instruments
The Company may use derivative financial instruments, including interest rate swaps, caps, options, floors and other interest rate derivative contracts, to hedge all or a portion of the interest rate risk associated with its borrowings. The principal objective of such agreements is to minimize the risks and/or costs associated with the Company’s operating and financial structure as well as to hedge specific anticipated transactions. The Company does not intend to utilize derivatives for purposes other than interest rate risk management.
The Company records all derivatives on the consolidated balance sheets at fair value. The accounting for changes in the fair value of derivatives depends on the intended use of the derivative, whether the Company has elected to designate a derivative in a hedging relationship and apply hedge accounting and whether the hedging relationship has satisfied the criteria necessary to apply hedge accounting. Derivatives designated and qualifying as a hedge of the exposure to changes in the fair value of an asset, liability, or firm commitment attributable to a particular risk, such as interest rate risk, are considered fair value hedges. Derivatives designated and qualifying as a hedge of the exposure to variability in expected future cash flows, or other types of forecasted transactions, are considered cash flow hedges. Derivatives may also be designated as hedges of the foreign currency exposure of a net investment in a foreign operation. Hedge accounting generally provides for the matching of the timing of gain or loss recognition on the hedging instrument with the recognition of the changes in the fair value of the hedged asset or liability that are attributable to the hedged risk in a fair value hedge or the earnings effect of the hedged forecasted transactions in a cash flow hedge. The Company may enter into derivative contracts that are intended to economically hedge certain of its risk, even though hedge accounting does not apply or the Company elects not to apply hedge accounting.
The accounting for subsequent changes in the fair value of these derivatives depends on whether each has been designated and qualifies for hedge accounting treatment. If the Company elects not to apply hedge accounting treatment, any changes in the fair value of these derivative instruments is recognized immediately in gain (loss) on derivative instruments, net in the consolidated statements of operations and consolidated statements of comprehensive income (loss). If the derivative is designated and qualifies for hedge accounting treatment, the change in the estimated fair value of the derivative is recorded in other comprehensive income (loss) to the extent that it is effective. Any ineffective portion of a derivative’s change in fair value will be immediately recognized in earnings.
As of December 31, 2018, the Company had one interest rate derivative that was not designated as a qualifying hedging relationship with a fair value of $0.5 million associated with a loan with a notional value of $50.7 million. As of December 31, 2017, the Company had two interest rate derivatives that were not designated as qualifying hedging relationships with an aggregate fair value of $0.6 million associated with loans with an aggregate notional value of $78.9 million. The fair value of the interest rate derivatives is included in rent and tenant receivables and other assets, net in the accompanying consolidated balance sheets.
Revenue Recognition
In May 2014, the U.S. Financial Accounting Standards Board (“FASB”) issued ASU 2014-09, Revenue from Contracts with Customers (“ASU 2014-09”) (Topic 606), which supersedes the revenue recognition requirements in Revenue Recognition,
VEREIT, INC. and VEREIT OPERATING PARTNERSHIP, L.P.
NOTES TO CONSOLIDATED FINANCIAL STATEMENTS
December 31, 2018 – (Continued)
Accounting Standards Codification (“ASC”) (Topic 605) and requires an entity to recognize revenue in a way that depicts the transfer of promised goods or services to customers in an amount that reflects the consideration to which the entity expects to be entitled in exchange for those goods or services. The Company adopted ASU 2014-09 and the related ASUs (collectively, the “Revenue ASUs”) during the first quarter of 2018 using the modified retrospective approach, which allows a cumulative effect adjustment to beginning retained earnings equal to initially applying the Revenue ASUs to all contracts with customers not completed as of the date of adoption. Adoption of the Revenue ASUs did not result in a cumulative effect adjustment to retained earnings as all contracts not completed as of adoption within the scope of Topic 606 have the same revenue recognition timing and measurement under Topic 605. Revenues generated through leasing arrangements are excluded from the Revenue ASUs as discussed below.
Revenue Recognition - Real Estate
The Company’s rental revenue is recognized when earned and collectability is reasonably assured and includes rental revenues and property operating expense reimbursements that each tenant pays in accordance with the terms of each lease. Rental revenue also includes amortization of above and below-market leases. Many of the leases have rent escalations and the rental revenue is recognized on a straight-line basis, which requires the Company to record a receivable that will only be received if the tenant makes all rent payments required through the expiration of the initial lease term. Straight-line rent receivables are included in rent and tenant receivables and other assets, net, in the consolidated balance sheets. See Note 5 – Rent and Tenant Receivables and Other Assets, Net. For leases that have contingent rental revenue based on a percentage of the tenant’s sales, the Company recognizes contingent rental revenue when the specified target is achieved.
The Company continually reviews receivables related to rent and unbilled rent receivables and determines collectability by taking into consideration the tenant’s payment history, the financial condition of the tenant, business conditions in the industry in which the tenant operates and economic conditions in the area in which the property is located. In the event that the collectability of a receivable is uncertain, the Company will record an increase in the allowance for uncollectible accounts in the consolidated balance sheets and bad debt expense in property operating expenses in the consolidated statements of operations. The Company suspends revenue recognition when the collectability of amounts due pursuant to a lease is no longer reasonably assured.
Revenue Recognition - Cole Capital
As discussed in Note 4 —Discontinued Operations, on February 1, 2018, the Company completed the sale of its investment management segment, Cole Capital. The assets, liabilities and related financial results of substantially all of the Cole Capital segment are reflected in the financial statements as discontinued operations.
Cole Capital earned securities sales commissions, dealer manager fees, distribution and stockholder servicing fees, real estate acquisition fees, financing coordination fees, property management fees, advisory fees, asset management fees and performance fees for services relating to the Cole REITs’ offerings and the investment and management of their respective assets, in accordance with the respective dealer manager and advisory agreements. The Company was also reimbursed for certain costs incurred in providing these services, which were recorded as revenue as the expenses were incurred subject to revenue constraint due to the limitations on the amount that was reimbursable based on the terms of the respective dealer manager and advisory agreements. Refer to Note 13 –Related Party Transactions and Arrangements for a disaggregation of Cole Capital revenues.
Revenue Recognition - Other
The Company entered into a services agreement (the “Services Agreement”) with the Cole Purchaser, pursuant to which the Company will continue to provide certain services to the Cole Purchaser and the Cole REITs, including operational real estate support, (“Transition Services Revenues”) through March 31, 2019 (or, if later, the date of the last government filing other than a tax filing made by any of the Cole REITs with respect to its 2018 fiscal year). Under the terms of the Services Agreement, the Company will be entitled to receive reimbursement for certain of the services provided. The Company recorded Transition Services Revenues as costs associated with providing such services were incurred, which coincided with the timing in which the performance obligations of the contract had been met. During the period from February 1, 2018 through December 31, 2018, the Company incurred $15.0 million of such costs and recognized revenues of $15.0 million, which are recorded in other income, net in the consolidated statement of operations. The Company may also receive additional fees over the next six years if future revenues of Cole Capital exceed a specified dollar threshold (the “Net Revenue Payments”), up to an aggregate of $80.0 million in Net Revenue Payments.
VEREIT, INC. and VEREIT OPERATING PARTNERSHIP, L.P.
NOTES TO CONSOLIDATED FINANCIAL STATEMENTS
December 31, 2018 – (Continued)
Litigation, Merger and Other Non-Routine Costs, Net of Insurance Recoveries
External costs incurred in relation to prior mergers and litigation resulting therefrom are included in litigation, merger and other non-routine costs, net of insurance recoveries in the consolidated statements of operations. The Company has also incurred legal fees and other costs associated with litigations and investigations resulting from the Audit Committee Investigation (defined below), which are considered non-routine. The Company has directors’ and officers’ insurance and the insurance carriers have paid certain defense costs subject to standard reservation of rights under the respective policies.
Litigation, merger and other non-routine costs, net of insurance recoveries include the following costs (amounts in thousands):
|
| | | | | | | | | | | | |
| | | Year Ended December 31, |
| | | 2018 | | 2017 | | 2016 |
| Merger Related Costs: | | | | | | |
Transfer taxes(1) | | $ | — |
| | $ | (1,595 | ) | | $ | 562 |
|
| Litigation and other non-routine costs: | | | | | | |
Audit Committee Investigation and related matters (2) | | $ | 59,755 |
| | $ | 49,434 |
| | $ | 24,207 |
|
Legal fees and expenses (3) | | 530 |
| | 421 |
| | 311 |
|
Litigation settlements (4) | | 233,246 |
| | — |
| | — |
|
| Total costs | | 293,531 |
|
| 48,260 |
| | 25,080 |
|
Insurance recoveries (5) | | (2,568 | ) | | (300 | ) | | (21,196 | ) |
| Total | | $ | 290,963 |
| | $ | 47,960 |
| | $ | 3,884 |
|
| |
| (1) | The negative balance for the year ended December 31, 2017 is a result of estimated costs accrued in prior periods that exceeded actual expenses incurred. |
| |
| (2) | Includes all fees and costs associated with various litigations and investigations prompted by the results of the 2014 investigation conducted by the audit committee (the “Audit Committee”) of the Company’s Board of Directors (the “Audit Committee Investigation”), including fees and costs incurred pursuant to the Company’s advancement obligations, litigation related thereto and in connection with related insurance recovery matters, net of accrual reversals. During the year ended December 31, 2018, the Company reversed an accrual of $10.9 million, as the Company was legally released from certain advancement obligations, and the accrued amounts were paid directly by the Company’s insurers to the payees subsequent to December 31, 2018. There were no reversals in the years ended December 31, 2017 and 2016. |
| |
| (3) | Includes legal fees and expenses associated with litigation resulting from prior mergers and related insurance recovery matters and excludes amounts presented in income from discontinued operations, net of income taxes in the consolidated statements of operations for the year ended December 31, 2018. |
| |
| (4) | Refer to Note 10– Commitments and Contingencies for additional information. |
| |
| (5) | $2.3 million recorded during the year ended December 31, 2018 relates to litigation resulting from prior mergers. |
Loss Contingencies
The Company records a liability in the consolidated financial statements for loss contingencies when a loss is known or considered probable and the amount is reasonably estimable. If the reasonable estimate of a known or probable loss is a range, and no amount within the range is a better estimate than any other, the minimum amount of the range is accrued. If a material loss is reasonably possible but not known or probable, and is reasonably estimable, the estimated loss or range of loss is disclosed.
Equity-based Compensation
The Company has an equity-based incentive award plan for non-executive directors, officers, other employees and advisors or consultants who provide services to the Company, as applicable, and a non-executive director restricted share plan, which are accounted for under U.S. GAAP for share-based payments. The expense for such awards is recognized over the vesting period or when the requirements for exercise of the award have been met. See Note 12 – Equity-based Compensation for additional information on these plans.
Per Share Data
Income (loss) per basic share of Common Stock is calculated by dividing net income (loss) less dividends on unvested Restricted Shares of Common Stock and dividends on preferred stock by the weighted-average number of shares of Common Stock issued and outstanding during such period. Diluted income (loss) per share of Common Stock considers the effect of potentially dilutive shares of Common Stock outstanding during the period.
Income Taxes
The General Partner elected to be taxed as a REIT for U.S. federal income tax purposes under Sections 856 through 860 of the Internal Revenue Code commencing with the taxable year ended December 31, 2011. We believe we are organized and operating in such a manner as to qualify to be taxed as a REIT for the taxable year ended December 31, 2018. As a REIT, the
VEREIT, INC. and VEREIT OPERATING PARTNERSHIP, L.P.
NOTES TO CONSOLIDATED FINANCIAL STATEMENTS
December 31, 2018 – (Continued)
General Partner is generally not subject to federal income tax on taxable income that it distributes to its stockholders so long as it distributes at least 90% of its annual taxable income (computed without regard to the deduction for dividends paid and excluding net capital gains). However, the General Partner, its TRS entities, and the OP are still subject to certain state and local income, franchise and property taxes in the various jurisdictions in which they operate. The General Partner may also be subject to federal income taxes on certain income and excise taxes on its undistributed income.
The OP is classified as a partnership for U.S. federal income tax purposes. As a partnership, the OP is not a taxable entity for U.S. federal income tax purposes. Instead, each partner in the OP is required to include its allocable share of the OP’s income, gains, losses, deductions and credits for each taxable year. Under the LPA, the OP is to conduct business in such a manner as to permit the General Partner at all times to qualify as a REIT.
A TRS is a subsidiary of a REIT that is subject to federal, state and local income taxes, as applicable. The Company’s use of a TRS enables it to engage in certain business activities while complying with the REIT qualification requirements and to retain any income generated by these businesses for reinvestment without the requirement to distribute those earnings. The Company conducted substantially all of the Cole Capital business activities through a TRS until it sold the Cole Capital business on February 1, 2018.
During the year ended December 31, 2018, the Company conducted all of its business in the United States, Puerto Rico and Canada and filed income tax returns in the U.S. federal jurisdiction, the Canadian federal jurisdiction and various state and local jurisdictions. With few exceptions, the Company is no longer subject to routine examinations by taxing authorities for years before 2014. Certain of the Company’s intercompany transactions that have been eliminated in consolidation for financial accounting purposes are also subject to taxation.
The Company provides for income taxes in accordance with current authoritative accounting and tax guidance. The tax provision or benefit related to significant or unusual items is recognized in the quarter in which those items occur. In addition, the effect of changes in enacted tax laws, rates or tax status is recognized in the quarter in which the change occurs. The accounting estimates used to compute the provision for or benefit from income taxes may change as new events occur, additional information is obtained or the tax environment changes.
During the years ended December 31, 2018, 2017 and 2016, the Company recognized state and local income and franchise tax expense of $4.7 million, $6.9 million and $6.0 million, respectively, which are included in provision for income taxes in the accompanying consolidated statements of operations. In addition, the Company recorded a provision for federal income taxes of $0.4 million and $1.1 million for the years ended December 31, 2018 and 2016 related to a TRS entity, which is also included in provision for income taxes in the accompanying consolidated statements of operations. No provision for federal income taxes related to a TRS entity was recorded for the year ended December 31, 2017. The provision for or benefit from income taxes attributable to the Cole Capital business, substantially all of which was conducted through a TRS entity, is included in discontinued operations for all periods presented, as discussed in Note 4 —Discontinued Operations.
The Company had no unrecognized tax benefits as of or during the years ended December 31, 2018, 2017 or 2016. Any interest and penalties related to unrecognized tax benefits would be recognized in provision for income taxes in the accompanying consolidated statements of operations.
As of December 31, 2018, the OP and the General Partner had no material uncertain income tax positions.
Recent Accounting Pronouncements
Adopted Accounting Standards
In January 2016, the FASB issued ASU 2016-01, Financial Instruments – Overall (Subtopic 825-10), Recognition and Measurement of Financial Assets and Financial Liabilities (“ASU 2016-01”), which requires equity investments (except those accounted for under the equity method of accounting or those that result in consolidation of the investee) to be measured at fair value with changes in fair value recognized in net income (loss). An entity may choose to measure equity investments that do not have a readily determinable fair value at costs minus impairment, if any, plus or minus changes resulting from observable price changes in orderly transactions for the identical or a similar investment of the same issue. ASU 2016-01 is effective for fiscal years, and interim periods within, beginning after December 15, 2017 and requires prospective treatment of equity securities without readily determinable fair values. The Company adopted ASU 2016-01 as of January 1, 2018 and recorded a $5.1 million gain, which is included in other income, net in the accompanying consolidated statements of operations, on measuring the Company’s investments in the Cole REITs at fair value after the investments were no longer accounted for using the equity method.
VEREIT, INC. and VEREIT OPERATING PARTNERSHIP, L.P.
NOTES TO CONSOLIDATED FINANCIAL STATEMENTS
December 31, 2018 – (Continued)
In February 2017, the FASB issued ASU 2017-05, Other Income – Gains and Losses from the Derecognition of Nonfinancial Assets (Subtopic 610-20): Clarifying the Scope of Asset Derecognition Guidance and Accounting for Partial Sales of Nonfinancial Assets (“ASU 2017-05”), which clarifies the following: 1) nonfinancial assets within the scope of Subtopic 610-20 may include nonfinancial assets transferred within a legal entity to a counterparty; 2) an entity should allocate consideration to each distinct asset by applying the guidance in Topic 606 on allocating the transaction price to performance obligations; and 3) requires entities to derecognize a distinct nonfinancial asset or distinct in substance nonfinancial asset in a partial sale transaction when it (a) does not have (or ceases to have) a controlling financial interest in the legal entity that holds the asset in accordance with Subtopic 810 and (b) transfers control of the asset in accordance with Topic 606. The adoption of this standard will result in higher gains on the sale of partial real estate interests, including contributions of nonfinancial assets to a joint venture or other noncontrolling investee, due to recognizing the full gain when the derecognition criteria are met and recording the retained noncontrolling interest at its fair value. ASU 2017-05 is effective for annual periods, and interim periods therein, beginning after December 15, 2017. ASU 2017-05 was adopted during the first quarter of fiscal year 2018, in conjunction with the Revenue ASUs, using the modified retrospective approach. The Company also elected the practical expedient to only apply the guidance to contracts that were not completed upon adoption. At adoption, the Company did not have any contracts that were not completed within the scope of ASU 2017-05 and as such, the adoption of ASU 2017-05 did not impact the Company’s financial statements.
Accounting Standards Not Yet Adopted
In February 2016, the FASB issued ASU 2016-02, which will require that a lessee recognize assets and liabilities on the balance sheet for all leases with a lease term of more than 12 months, with the result being the recognition of a right of use (“ROU”) asset and a lease liability and the disclosure of key information about the entity’s leasing arrangements. The lessor accounting model under ASU 2016-02 is similar to existing guidance, however it limits the capitalization of initial direct leasing costs, such as internally generated costs. The Company expects to elect all practical expedients permitted under ASC Topic 842, other than the hindsight practical expedient, which permits entities to use hindsight in determining the lease terms. Accordingly, the Company will retain distinction between a finance lease (i.e., capital leases under existing guidance) and an operating lease and account for its existing operating leases as operating leases under the new guidance, without reassessing (a) whether the contracts contain a lease under ASC Topic 842, (b) whether classification of the operating leases would be different in accordance with ASC Topic 842, or (c) whether the unamortized initial direct costs before transition adjustments would have met the definition of initial direct costs in ASC Topic 842 at lease commencement.
In January 2018, the FASB issued ASU 2018-01, Leases (Topic 842): Land Easement Practical Expedient for Transition to Topic 842. The amendments help address transition guidance as it relates to land easements. As the Company plans to elect this practical expedient, it will only evaluate new or modified land easements upon adoption of Topic 842.
In July 2018, the FASB issued ASU 2018-10, Leases (Topic 842), which contained targeted improvements to amend inconsistencies and clarify guidance that were brought about by stakeholders. Additionally, in July 2018, the FASB issued ASU 2018-11, Leases (Topic 842), which provided the following practical expedients: (1) a transition method that allows entities to apply the new standard at the adoption date and to recognize a cumulative-effect adjustment to the opening balance of retained earnings effective at the adoption date; and (2) the option for lessors to not separate lease and non-lease components provided that certain criteria are met. The Company plans to elect the practical expedients included in ASU 2018-11. As the Company is not electing the hindsight practical expedient, the Company does not expect to have a cumulative effect adjustment to retained earnings upon adoption.
In December 2018, the FASB issued ASU 2018-20, Narrow-Scope Improvements for Lessors, Leases (Topic 842). This ASU 2018-20 provides an election for lessors to exclude sales and related taxes from consideration in the contract, requires lessors to exclude from revenue and expense lessor costs paid directly to a third party by lessees, and clarifies lessors’ accounting for variable payments related to both lease and nonlease components.
The Company is currently evaluating the impact of adoption, and anticipates this standard will have a material impact on its consolidated balance sheets. However, the Company does not expect adoption will have a material impact on its consolidated statements of operations. While the Company is continuing to assess potential impacts of the standard, it currently expects the most significant impact will be the recognition of ROU assets and lease liabilities for operating leases. Our initial ROU asset and liability will be approximately $223.0 million. The Company expects its accounting for capital leases to remain substantially unchanged. Leases pursuant to which the Company is the lessee primarily consist of approximately 200 leases, of which the majority are ground leases. The Company will adopt ASU 2016-12 and its related amendments beginning January 1, 2019.
In June 2016, the FASB issued ASU 2016-13, Financial Instruments – Credit Losses (Topic 326) (“ASU 2016-13”). ASU 2016-13 is intended to improve financial reporting by requiring more timely recognition of credit losses on loans and other financial instruments that are not accounted for at fair value through net income, including loans held for investment, held-to-maturity debt securities, trade and other receivables, net investment in leases and other such commitments. ASU 2016-13 requires that financial
VEREIT, INC. and VEREIT OPERATING PARTNERSHIP, L.P.
NOTES TO CONSOLIDATED FINANCIAL STATEMENTS
December 31, 2018 – (Continued)
assets measured at amortized cost be presented at the net amount expected to be collected, through an allowance for credit losses that is deducted from the amortized cost basis. The amendments in ASU 2016-13 require the Company to measure all expected credit losses based upon historical experience, current conditions, and reasonable and supportable forecasts that affect the collectability of the financial assets and eliminates the “incurred loss” methodology under current U.S. GAAP. In November 2018, the FASB issued ASU No. 2018-19, Codification Improvements to Topic 326, Financial Instruments—Credit Losses (“ASU 2018-19”). This ASU clarifies that receivables from operating leases are accounted for using the lease guidance and not as financial instruments. ASU 2016-13 and ASU 2018-19 are effective for fiscal years, and interim periods within, beginning after December 15, 2019. Early adoption is permitted for fiscal years, and interim periods within, beginning after December 15, 2018. The Company is currently evaluating the impact these amendments will have on its consolidated financial statements.
Note 3– Real Estate Investments and Related Intangibles
Property Acquisitions
During the year ended December 31, 2018, the Company acquired controlling financial interests in 52 commercial properties for an aggregate purchase price of $502.7 million (the “2018 Acquisitions”), which includes one land parcel for build-to-suit development, further discussed below, $2.1 million related to an outstanding tenant improvement allowance recorded as a payable as of the acquisition date and for which the Company received a credit at close, and $2.6 million of external acquisition-related expenses that were capitalized.
During the year ended December 31, 2017, the Company acquired a controlling interest in 88 commercial properties and three land parcels for an aggregate purchase price of $748.8 million (the “2017 Acquisitions”), which includes $3.3 million of external acquisition-related expenses that were capitalized and includes 22 properties acquired in a nonmonetary exchange discussed below.
During the year ended December 31, 2016, the Company acquired a controlling interest in eight commercial properties for an aggregate purchase price of $100.2 million (the “2016 Acquisitions”). Prior to the adoption of ASU 2017-01, costs related to property acquisitions were expensed as incurred. The Company has not included pro forma information for the Company's 2016 Acquisitions, which were acquired prior to the adoption of ASU 2017-01 and met the definition of a business combination, as they did not have a material impact on the Company's financial position or results of operations.
The following table presents the allocation of the fair values of the assets acquired and liabilities assumed during the periods presented (in thousands):
|
| | | | | | | | | | | | |
| | | Year Ended December 31, |
| | | 2018 | | 2017 | | 2016 |
| Real estate investments, at cost: | | | | | | |
| Land | | $ | 86,285 |
| | $ | 110,634 |
| | $ | 23,187 |
|
| Buildings, fixtures and improvements | | 350,942 |
| | 523,445 |
| | 67,865 |
|
| Total tangible assets | | 437,227 |
| | 634,079 |
| | 91,052 |
|
| Acquired intangible assets: | | | | | | |
In-place leases and other intangibles (1) | | 62,791 |
| | 105,940 |
| | 9,613 |
|
Above-market leases (2) | | 2,750 |
| | 10,445 |
| | — |
|
| Assumed intangible liabilities: | | | | | | |
Below-market leases (3) | | (116 | ) | | (1,680 | ) | | (471 | ) |
| Total purchase price of assets acquired | | $ | 502,652 |
| | $ | 748,784 |
| | $ | 100,194 |
|
| |
| (1) | The weighted average amortization period for acquired in-place leases and other intangibles is 16.3 years, 15.8 years and 13.8 years for 2018 Acquisitions, 2017 Acquisitions and 2016 Acquisitions, respectively. |
| |
| (2) | The weighted average amortization period for acquired above-market leases is 10.8 years and 18.0 years for 2018 Acquisitions and 2017 Acquisitions, respectively. There were no acquired above-market leases during the year ended December 31, 2016. |
| |
| (3) | The weighted average amortization period for acquired intangible lease liabilities is 9.9 years, 13.8 years and 10.0 years for 2018 Acquisitions, 2017 Acquisitions and 2016 Acquisitions, respectively. |
As of December 31, 2018, the Company invested $3.5 million, including $0.5 million of external acquisition-related expenses that were capitalized, in one build-to-suit development project. The Company’s estimated remaining committed investment is $24.9 million, and the project is expected to be completed within the next 12 months.
VEREIT, INC. and VEREIT OPERATING PARTNERSHIP, L.P.
NOTES TO CONSOLIDATED FINANCIAL STATEMENTS
December 31, 2018 – (Continued)
Future Lease Payments
The following table presents future minimum base rent payments due to the Company over the next five years and thereafter. These amounts exclude contingent rent payments, as applicable, that may be collected from certain tenants based on provisions related to sales thresholds and increases in annual rent based on exceeding certain economic indexes among other items (in thousands):
|
| | | | | | | | |
| | | Future Minimum Operating Lease
Base Rent Payments | | Future Minimum
Direct Financing Lease Payments (1) |
| 2019 | | $ | 1,107,610 |
| | $ | 2,448 |
|
| 2020 | | 1,080,639 |
| | 2,135 |
|
| 2021 | | 1,042,346 |
| | 2,014 |
|
| 2022 | | 972,564 |
| | 1,925 |
|
| 2023 | | 890,327 |
| | 1,541 |
|
| Thereafter | | 5,387,232 |
| | 707 |
|
| Total | | $ | 10,480,718 |
| | $ | 10,770 |
|
| |
| (1) | Related to25 properties which are subject to direct financing leases and, therefore, revenue is recognized as direct financing lease income on the discounted cash flows of the lease payments. Amounts reflected are the minimum base rental cash payments due to the Company under the lease agreements on these respective properties. |
Property Dispositions and Real Estate Assets Held for Sale
During the year ended December 31, 2018, the Company disposed of 149 properties, including one property conveyed to a lender in a deed-in-lieu of foreclosure transaction as discussed in Note 7 –Debt, for an aggregate gross sales price of $526.4 million, of which our share was $504.3 million after the profit participation payments related to the disposition of 34 Red Lobster properties. The dispositions resulted in proceeds of $496.7 million after closing costs. The Company recorded a gain of $96.2 million related to the sales which is included in gain on disposition of real estate and real estate assets held for sale, net in the accompanying consolidated statements of operations.
During the year ended December 31, 2018, the Company also disposed of one property owned by an unconsolidated joint venture for a gross sales price of $34.1 million, of which our share was $17.1 million based on our ownership interest in the joint venture, resulting in proceeds of $5.6 million after debt repayments of $20.4 million and closing costs. The Company recorded a gain of $0.7 million related to the sale and liquidation of the joint venture, which is included in equity in income and gain on disposition of unconsolidated entities in the accompanying consolidated statements of operations.
During the year ended December 31, 2017, the Company disposed of 137 properties, including one property owned by a consolidated joint venture, six properties transferred to the lender in either a deed-in-lieu of foreclosure or foreclosure sale transaction as discussed in Note 7 –Debt, and 15 properties disposed of in connection with a nonmonetary exchange discussed below, for an aggregate gross sales price of $594.9 million, of which our share was $574.4 million after the profit participation payment related to the disposition of 31 Red Lobster properties and the consolidated joint venture partner’s share of the sales price. The dispositions resulted in proceeds of $445.5 million after a mortgage loan assumption of $66.0 million and closing costs. Additionally, the Company’s tax provision for the year ended December 31, 2017 included $1.7 million of Canadian tax gain on the sale of certain Canadian properties. The Company recorded a gain of $64.7 million, which is included in gain on disposition of real estate and real estate assets held for sale, net in the accompanying consolidated statements of operations.
During the year ended December 31, 2016, the Company disposed of 301 properties, for an aggregate gross sales price of $1.08 billion, of which our share was $1.04 billion after the profit participation payment related to the disposition of 70 Red Lobster properties. The dispositions resulted in proceeds of $958.4 million after a mortgage loan assumption of $55.0 million and closing costs. The Company recorded a gain of $45.7 million, which included $67.8 million of goodwill allocated to the cost basis of such properties, which is included in gain on disposition of real estate and real estate assets held for sale, net in the accompanying consolidated statements of operations.
VEREIT, INC. and VEREIT OPERATING PARTNERSHIP, L.P.
NOTES TO CONSOLIDATED FINANCIAL STATEMENTS
December 31, 2018 – (Continued)
During the year ended December 31, 2016, the Company also disposed of one property owned by an unconsolidated joint venture for a gross sales price of $113.5 million, of which our share was $102.1 million based on our ownership interest in the joint venture, resulting in proceeds of $42.3 million after debt repayments of $57.0 million and closing costs. The Company recorded a gain of $10.2 million related to the sale, which is included in equity in income and gain on disposition of unconsolidated entities in the accompanying consolidated statements of operations.
As of December 31, 2018, there were five properties classified as held for sale with a carrying value of $2.6 million, included in assets related to real estate assets held for sale and discontinued operations, net in the accompanying consolidated balance sheet, which are expected to be sold in the next 12 months as part of the Company’s portfolio management strategy. As of December 31, 2017, there were 30 properties classified as held for sale. During the year ended December 31, 2018, the Company recorded a loss of $1.9 million related to held for sale properties. During the year ended December 31, 2017, the Company recorded a loss of $3.1 million related to held for sale properties. During the year ended December 31, 2016, the Company recorded a loss of $5.1 million related to held for sale properties, which included $3.2 million of goodwill allocated to the cost basis of such properties.
Intangible Lease Assets and Liabilities
Intangible lease assets and liabilities of the Company consisted of the following as of December 31, 2018 and 2017 (amounts in thousands, except weighted-average useful life):
|
| | | | | | | | | | |
| | | Weighted-Average Useful Life | | December 31, 2018 | | December 31, 2017 |
| Intangible lease assets: | | | | | | |
| In-place leases and other intangibles, net of accumulated amortization of $703,909 and $599,680, respectively | | 15.5 | | $ | 980,971 |
| | $ | 1,091,433 |
|
| Leasing commissions, net of accumulated amortization of $4,048 and $2,902, respectively | | 10.7 | | 15,660 |
| | 13,876 |
|
| Above-market lease assets and deferred lease incentives, net of accumulated amortization of $105,936 and $88,335, respectively | | 16.4 | | 201,875 |
| | 241,449 |
|
| Total intangible lease assets, net | | | | $ | 1,198,506 |
| | $ | 1,346,758 |
|
| | | | | | | |
| Intangible lease liabilities: | | | | | | |
| Below-market leases, net of accumulated amortization of $89,905 and $73,916, respectively | | 18.8 | | $ | 173,479 |
| | $ | 198,551 |
|
The aggregate amount of above‑ and below-market leases and deferred lease incentives amortized and included as a net decrease to rental revenue was $4.2 million for the year ended December 31, 2018 and $5.4 million for each of the years ended December 31, 2017 and 2016, respectively. The aggregate amount of in-place leases, leasing commissions and other lease intangibles amortized and included in depreciation and amortization expense was $139.6 million, $154.2 million and $170.0 million for the years ended December 31, 2018, 2017 and 2016, respectively.
The following table provides the projected amortization expense and adjustments to rental revenue related to the intangible lease assets and liabilities for the next five years as of December 31, 2018 (amounts in thousands):
|
| | | | | | | | | | | | | | | | | | | | |
| | | 2019 | | 2020 | | 2021 | | 2022 | | 2023 |
| In-place leases and other intangibles: | | | | | | | | | | |
| Total projected to be included in amortization expense | | $ | 126,457 |
| | $ | 119,161 |
| | $ | 111,335 |
| | $ | 97,159 |
| | $ | 86,311 |
|
| Leasing commissions: | | | | | | | | | | |
| Total projected to be included in amortization expense | | 1,911 |
| | 1,778 |
| | 1,620 |
| | 1,556 |
| | 1,359 |
|
| Above-market lease assets and deferred lease incentives: | | | | | | | | |
| Total projected to be deducted from rental revenue | | 20,870 |
| | 20,456 |
| | 20,027 |
| | 19,213 |
| | 18,270 |
|
| Below-market lease liabilities: | | | | | | | | | | |
| Total projected to be included in rental revenue | | 17,973 |
| | 16,821 |
| | 15,656 |
| | 14,809 |
| | 13,924 |
|
VEREIT, INC. and VEREIT OPERATING PARTNERSHIP, L.P.
NOTES TO CONSOLIDATED FINANCIAL STATEMENTS
December 31, 2018 – (Continued)
Nonmonetary Exchange
During the year ended December 31, 2017, the Company completed a nonmonetary exchange through the simultaneous acquisition of 22 Bob Evans properties and disposition of 15 Red Lobster properties. Pursuant to Nonmonetary Transactions, ASC (Topic 845), the cost of a nonmonetary asset acquired in exchange for another nonmonetary asset is the fair value of the asset surrendered to obtain the acquired nonmonetary asset, and a gain or loss should be recognized on the exchange. The fair value of the asset received should be used to measure the cost if the fair value of the asset received is more reliable than the fair value of the asset surrendered. The Company estimated the fair value of the Bob Evans and Red Lobster properties using valuation techniques consistent with the income approach and concluded that the fair value was $50.1 million. As the fair value of the assets received exceeded the book value of the assets surrendered, the Company recorded a gain of $7.4 million, which is included in gain on disposition of real estate and real estate assets held for sale, net in the accompanying consolidated statements of operations.
Consolidated Joint Ventures
The Company had an interest in one consolidated joint venture that owned one property as of December 31, 2018 and 2017. As of December 31, 2018 and 2017, the consolidated joint venture had total assets of $32.5 million and $33.7 million, of which $29.9 million and $30.7 million, respectively, were real estate investments, net of accumulated depreciation and amortization. The property was secured by a mortgage note payable, which was non-recourse to the Company and had a balance of $14.0 million and $14.9 million, as of December 31, 2018 and 2017, respectively. The Company has the ability to control operating and financing policies of the consolidated joint venture. There are restrictions on the use of these assets as the Company would generally be required to obtain the approval of the joint venture partner in accordance with the joint venture agreement for any major transactions. The Company and the joint venture partner are subject to the provisions of the joint venture agreement, which includes provisions for when additional contributions may be required to fund certain cash shortfalls.
Unconsolidated Joint Ventures
As of December 31, 2018, the Company held an investment in an unconsolidated joint venture that owned one property with a carrying value of $35.3 million. As of December 31, 2017, the Company held investments in two unconsolidated joint ventures that each owned one property with an aggregate carrying value of $39.5 million. During the year ended December 31, 2018, the Company disposed of one property owned by an unconsolidated joint venture as previously discussed in the “Property Dispositions and Real Estate Assets Held for Sale” section herein.
The Company had a 90% legal ownership interest in the unconsolidated joint venture at December 31, 2018 and December 31, 2017 and accounts for its investment using the equity method of accounting as the Company has the ability to exercise significant influence, but not control, over operating and financing policies of the investment. The equity method of accounting requires the investment to be initially recorded at cost and subsequently adjusted for the Company’s share of equity in earnings and distributions from the joint venture. During the year ended December 31, 2018 the Company recognized $1.2 million of net income from unconsolidated joint ventures. During the years ended December 31, 2017 and 2016 the Company recognized $3.3 million and $0.9 million of net income, respectively, from two unconsolidated joint ventures. The Company’s legal ownership interest may, at times, not equal the Company’s economic interest because of various provisions in certain joint venture agreements regarding distributions of cash flow based on capital account balances, allocations of profits and losses and payments of preferred returns.
The carrying amount of the unconsolidated joint venture was greater than the underlying equity in net assets by $4.7 million as of December 31, 2018. The carrying amount of the unconsolidated joint ventures was greater than the underlying equity in net assets by $8.6 million as of December 31, 2017. This difference relates to a purchase price allocation of goodwill and a step up in fair value of the investment assets acquired in connection with mergers. The step up in fair value was allocated to the individual investment assets and is being amortized in accordance with the Company’s depreciation policy. The Company and the unconsolidated joint venture partner are subject to the provisions of the applicable joint venture agreement, which includes provisions for when additional contributions may be required to fund certain cash shortfalls, including the Company’s share of expansion project capital expenditures.
VEREIT, INC. and VEREIT OPERATING PARTNERSHIP, L.P.
NOTES TO CONSOLIDATED FINANCIAL STATEMENTS
December 31, 2018 – (Continued)
Note 4 — Discontinued Operations
On November 13, 2017, the Company entered into a purchase and sale agreement (as amended by that certain First Amendment to the Purchase and Sale Agreement, dated as of February 1, 2018, the “Cole Capital Purchase and Sale Agreement”). On February 1, 2018, the Company completed the sale of its investment management segment, Cole Capital, under the terms of the Cole Capital Purchase and Sale Agreement. Substantially all of the Cole Capital segment’s operations were conducted through Cole Capital Advisors, Inc. (“CCA”), an Arizona corporation and a wholly owned subsidiary of the OP. The OP sold all of the issued and outstanding shares of common stock of CCA and certain of CCA’s subsidiaries to the Cole Purchaser, for approximately $120.0 million paid in cash at closing. The Company could also receive up to an aggregate of $80.0 million in Net Revenue Payments. There were no Net Revenue Payments received or earned for 2018. Substantially all of the Cole Capital segment financial results are reflected in the financial statements as discontinued operations.
The following is a summary of the assets and liabilities related to discontinued operations and real estate assets held for sale as of December 31, 2018 and 2017 (in thousands):
|
| | | | | | | | |
| | December 31, 2018 | | December 31, 2017 |
| Carrying amount of major classes of assets included in discontinued operations: | | | | |
| Cash | | $ | — |
| | $ | 2,198 |
|
Intangible assets, net (1) | | — |
| | 9,892 |
|
Other assets, net (2) | | — |
| | 6,975 |
|
Goodwill (3) | | — |
| | 124,812 |
|
| Due from Cole REITs, net | | — |
| | 1,284 |
|
Loss recognized on classification as held for sale (4) | | — |
| | (19,509 | ) |
| Assets related to discontinued operations, net | | $ | — |
| | $ | 125,652 |
|
| | | | | |
| Carrying amount of major classes of liabilities included in discontinued operations: | | | | |
| Accounts payable and accrued expenses | | $ | — |
| | $ | 14,269 |
|
| Other liabilities | | — |
| | 1,512 |
|
| Due to Cole REITs | | — |
| | 100 |
|
| Liabilities related to discontinued operations | | $ | — |
| | $ | 15,881 |
|
| |
| (1) | The intangible assets consisted of management and advisory contracts that the Company had with certain Cole REITs. Accumulated amortization was $44.1 million as of December 31, 2017. |
| |
| (2) | Includes program development costs of $3.3 million as of December 31, 2017, which were net of reserves of $7.6 million. |
| |
| (3) | The Company performed the annual goodwill test using the $120.0 million cash proceeds provided for under the Cole Capital Purchase and Sale Agreement, plus the estimated fair value of the Net Revenue Payments and determined the carrying amount exceeded the estimated fair value. As such, no goodwill impairment was recorded during the year ended December 31, 2017. |
| |
| (4) | The Company recognized a loss of $20.0 million on classification of the discontinued operations as held for sale, of which $0.5 million represented estimated costs to sell that were subsequently accrued in accounts payable and accrued expenses as of December 31, 2017. In determining the loss recognized on classification as held for sale, the Company elected to account for the future Net Revenue Payments as a gain contingency. Under this approach, the Company will not recognize any Net Revenue Payments until realized. |
VEREIT, INC. and VEREIT OPERATING PARTNERSHIP, L.P.
NOTES TO CONSOLIDATED FINANCIAL STATEMENTS
December 31, 2018 – (Continued)
The following is a summary of the financial information for discontinued operations for the years ended December 31, 2018, 2017 and 2016 (in thousands):
|
| | | | | | | | | | | | |
| | | Year Ended December 31, |
| Revenues: | | 2018 | | 2017 | | 2016 |
| Offering-related fees and reimbursements | | $ | 1,027 |
| | $ | 16,096 |
| | $ | 36,526 |
|
| Transaction service fees and reimbursements | | 334 |
| | 13,929 |
| | 12,533 |
|
| Management fees and reimbursements | | 6,452 |
| | 76,214 |
| | 68,686 |
|
| Total revenues | | $ | 7,813 |
|
| $ | 106,239 |
|
| $ | 117,745 |
|
| Operating expenses: | | | | | | |
| Cole Capital reallowed fees and commissions | | 602 |
| | 9,879 |
| | 23,174 |
|
Transaction costs (1) | | (654 | ) | | 3,802 |
| | — |
|
| General and administrative | | 4,450 |
| | 63,783 |
| | 82,558 |
|
| Amortization of intangible assets | | — |
| | 14,490 |
| | 26,148 |
|
| Goodwill and intangible asset impairments | | — |
| | — |
| | 120,931 |
|
| Total operating expenses | | 4,398 |
|
| 91,954 |
|
| 252,811 |
|
| Other income, net | | — |
| | 464 |
| | 292 |
|
| Loss on disposition and assets held for sale | | (1,815 | ) | | (20,027 | ) | | — |
|
| Income (loss) before taxes | | 1,600 |
|
| (5,278 | ) |
| (134,774 | ) |
| Benefit from (provision for) income taxes | | 2,095 |
| | (13,839 | ) | | 10,837 |
|
| Income (loss) from discontinued operations, net of income taxes | | $ | 3,695 |
|
| $ | (19,117 | ) |
| $ | (123,937 | ) |
| |
| (1) | The negative balance for the year ended December 31, 2018 is a result of estimated costs accrued in prior periods that exceeded actual expenses incurred. |
The following is a summary of cash flows related to discontinued operations for the years ended December 31, 2018, 2017 and 2016 (in thousands):
|
| | | | | | | | | | | |
| | | Year Ended December 31, |
| | | 2018 | | 2017 | 2016 |
| Cash flows related to discontinued operations: | | | | | |
| Cash flows (used in) provided by operating activities | | $ | (10,468 | ) | | $ | 33,232 |
| $ | 35,251 |
|
| Cash flows provided by investing activities | | $ | 122,915 |
| | $ | — |
| $ | — |
|
Income Taxes
Cole Capital’s business, substantially all of which was conducted through a TRS, recognized a benefit of $2.1 million for the year ended December 31, 2018, a provision of $13.8 million the year ended December 31, 2017 and a benefit of $10.8 million for the year ended December 31, 2016.
VEREIT, INC. and VEREIT OPERATING PARTNERSHIP, L.P.
NOTES TO CONSOLIDATED FINANCIAL STATEMENTS
December 31, 2018 – (Continued)
The following table presents the reconciliation of the (benefit from) provision for income taxes with the amount computed by applying the statutory federal income tax rate to loss before income taxes for the years ended December 31, 2018, 2017 and 2016 (in thousands):
|
| | | | | | | | | | | | |
| | | Year Ended December 31, |
| | | 2018 | | 2017 | | 2016 |
| Income (loss) before taxes | | $ | 1,600 |
| | $ | (5,278 | ) | | $ | (134,774 | ) |
| Less: Income from non-taxable entities | | (685 | ) | | (9,523 | ) | | (9,008 | ) |
| Income (loss) attributable to taxable subsidiaries before income taxes | | $ | 915 |
|
| $ | (14,801 | ) |
| $ | (143,782 | ) |
| | | | | | | |
| Federal provision at statutory rate | | 192 |
| | (5,180 | ) | | (50,324 | ) |
| Impairment of goodwill | | — |
| | — |
| | 42,327 |
|
| Nondeductible portion of transaction costs and loss recognized on classification as held for sale | | (719 | ) | | 8,283 |
| | — |
|
| Impact of change in federal tax rate | | — |
| | 3,481 |
| | — |
|
| Impact of valuation allowance | | (1,158 | ) | | 6,165 |
| | — |
|
| State income taxes and other | | (410 | ) | | 1,090 |
| | (2,840 | ) |
| Total (benefit from) provision for income taxes - Cole Capital | | $ | (2,095 | ) |
| $ | 13,839 |
|
| $ | (10,837 | ) |
The following table presents the components of the (benefit from) provision for income taxes for the years ended December 31, 2018, 2017 and 2016 (in thousands):
|
| | | | | | | | | | | | |
| | | Year Ended December 31, |
| | | 2018 | | 2017 | | 2016 |
| Current | | | | | | |
| Federal | | $ | (74 | ) | | $ | (120 | ) | | $ | 2,244 |
|
| State | | (166 | ) | | 602 |
| | (2,762 | ) |
| Total current (benefit from) provision for income taxes | | (240 | ) |
| 482 |
|
| (518 | ) |
| Deferred | | | | | | |
| Federal | | (1,756 | ) | | 12,016 |
| | (9,021 | ) |
| State | | (99 | ) | | 1,341 |
| | (1,298 | ) |
| Total deferred (benefit from) provision for income taxes | | (1,855 | ) |
| 13,357 |
| | (10,319 | ) |
| Total (benefit from) provision for income taxes - Cole Capital | | $ | (2,095 | ) |
| $ | 13,839 |
|
| $ | (10,837 | ) |
VEREIT, INC. and VEREIT OPERATING PARTNERSHIP, L.P.
NOTES TO CONSOLIDATED FINANCIAL STATEMENTS
December 31, 2018 – (Continued)
Note 5 – Rent and Tenant Receivables and Other Assets, Net
Rent and tenant receivables and other assets, net consisted of the following as of December 31, 2018 and 2017 (in thousands):
|
| | | | | | | | |
| | | December 31, 2018 | | December 31, 2017 |
| | | | | |
Straight-line rent receivable, net (1) | | $ | 259,106 |
| | $ | 230,529 |
|
Accounts receivable, net (2) | | 36,939 |
| | 36,921 |
|
Deferred costs, net (3) | | 17,515 |
| | 5,746 |
|
| Investment in direct financing leases, net | | 13,254 |
| | 19,539 |
|
Mortgage notes receivable, net (4) | | 10,164 |
| | 20,294 |
|
Leasehold improvements, property and equipment, net (5) | | 9,754 |
| | 12,089 |
|
| Investment in Cole REITs | | 7,844 |
| | 3,264 |
|
| Prepaid expenses | | 5,022 |
| | 6,493 |
|
| Other assets, net | | 3,594 |
| | 5,003 |
|
| Income tax receivable | | 1,760 |
| | 3,213 |
|
| Restricted escrow deposits | | 1,140 |
| | 4,995 |
|
Investment securities, at fair value(6) | | — |
| | 40,974 |
|
| Total | | $ | 366,092 |
|
| $ | 389,060 |
|
| |
| (1) | Allowance for uncollectible accounts included in straight-line rent receivable, net was $1.0 million and $2.0 million as of December 31, 2018 and 2017, respectively. As of December 31, 2018, the allowance related to suspended revenue recognition was $0.1 million. As of December 31, 2017, there was no allowance related to suspended revenue recognition. |
| |
| (2) | In the event that the collectability of a receivable is uncertain, the Company will record an increase in the allowance for uncollectible accounts in the consolidated balance sheets and bad debt expense in property operating expenses in the consolidated statements of operations. Allowance for uncollectible accounts was $5.3 million and $6.3 million as of December 31, 2018 and 2017, respectively. The Company suspends revenue recognition when the collectability of amounts due pursuant to a lease is no longer reasonably assured. As of December 31, 2018 and 2017, the allowance related to suspended revenue recognition was $9.1 million and $12.6 million, respectively. |
| |
| (3) | Amortization expense for deferred costs related to the revolving credit facilities totaled $7.3 million for the year ended December 31, 2018 and $10.4 million for each of the years ended December 31, 2017 and 2016. Accumulated amortization for deferred costs related to the Revolving Credit Facility, as defined in Note 7 –Debt, was $47.6 million and $40.3 million as of December 31, 2018 and 2017, respectively. |
| |
| (4) | As of December 31, 2018, the Company owned five mortgage notes receivable with a weighted-average interest rate of 6.4% and weighted-average years to maturity of 12.1 years. During the year ended December 31, 2018, the Company sold three mortgage notes receivable with an aggregate carrying value of $8.8 million at December 31, 2017, resulting in a net gain of $1.7 million, which is included in other income, net in the accompanying consolidated statements of operations. |
| |
| (5) | Amortization expense for leasehold improvements totaled $1.2 million for each of the years ended December 31, 2018 and 2017, with no related write-offs. Amortization expense for leasehold improvements totaled $2.3 million for the year ended December 31, 2016, inclusive of write-offs of $1.0 million. Accumulated amortization was $5.9 million and $4.7 million as of December 31, 2018 and 2017, respectively. Depreciation expense for property and equipment totaled $2.3 million, $1.8 million and $3.4 million for the years ended December 31, 2018, 2017 and 2016, respectively, inclusive of write-offs of $0.8 million, $0.6 million and $1.2 million for the years ended December 31, 2018, 2017 and 2016, respectively. Accumulated depreciation was $7.0 million and $5.7 million as of December 31, 2018 and 2017, respectively. |
| |
| (6) | During the year ended December 31, 2018, two commercial mortgage-backed securities (“CMBS”) were repaid and six CMBS were sold for an aggregate gross sales price of $36.0 million for a net realized loss of $2.2 million, which is included in other income, net in the accompanying consolidated statements of operations. |
Note 6 – Fair Value Measures
The Company determines fair value based on quoted prices when available or through the use of alternative approaches, such as discounting the expected cash flows using market interest rates commensurate with the credit quality and duration of the investment. U.S. GAAP guidance defines three levels of inputs that may be used to measure fair value:
Level 1 – Quoted prices in active markets for identical assets and liabilities that the reporting entity has the ability to access at the measurement date.
Level 2 – Inputs other than quoted prices included within Level 1 that are observable for the asset and liability or can be corroborated with observable market data for substantially the entire contractual term of the asset or liability.
Level 3 – Unobservable inputs reflect the entity’s own assumptions about the assumptions that market participants would use in the pricing of the asset or liability and are consequently not based on market activity, but rather through particular valuation techniques.
VEREIT, INC. and VEREIT OPERATING PARTNERSHIP, L.P.
NOTES TO CONSOLIDATED FINANCIAL STATEMENTS
December 31, 2018 – (Continued)
The determination of where an asset or liability falls in the hierarchy requires significant judgment and considers factors specific to the asset or liability. In instances where the determination of the fair value measurement is based on inputs from different levels of the fair value hierarchy, the level in the fair value hierarchy within which the entire fair value measurement falls is based on the lowest level input that is significant to the fair value measurement in its entirety. The Company evaluates its hierarchy disclosures each quarter and depending on various factors, it is possible that an asset or liability may be classified differently from quarter to quarter. Changes in the type of inputs may result in a reclassification for certain assets. The Company does not expect that changes in classifications between levels will be frequent.
Items Measured at Fair Value on a Recurring Basis
The following tables present information about the Company’s assets and liabilities measured at fair value on a recurring basis as of December 31, 2018 and 2017, aggregated by the level in the fair value hierarchy within which those instruments fall (in thousands):
|
| | | | | | | | | | | | | | | | |
|
| Level 1 |
| Level 2 |
| Level 3 |
| Balance as of December 31, 2018 |
| Assets: |
|
|
|
|
|
|
|
|
| Derivative assets |
| $ | — |
| | $ | 544 |
| | $ | — |
|
| $ | 544 |
|
| Investment in Cole REITs | | — |
| | — |
| | 7,844 |
| | 7,844 |
|
| Total assets | | $ | — |
| | $ | 544 |
| | $ | 7,844 |
| | $ | 8,388 |
|
|
|
| Level 1 |
| Level 2 |
| Level 3 |
| Balance as of December 31, 2017 |
| Assets: | | | | | | | | |
| CMBS | | $ | — |
| | $ | — |
| | $ | 40,974 |
| | $ | 40,974 |
|
| Derivative assets | | — |
| | 627 |
| | — |
| | 627 |
|
| Total assets | | $ | — |
| | $ | 627 |
| | $ | 40,974 |
| | $ | 41,601 |
|
CMBS – The Company’s CMBS were carried at fair value and were valued using Level 3 inputs. The Company used estimated non-binding quoted market prices from the trading desks of financial institutions that are dealers in such securities for similar CMBS tranches that actively participate in the CMBS market. Broker quotes are only indicative of fair value and may not necessarily represent what the Company would receive in an actual trade for the applicable instrument. Management determined that the prices were representative of fair value through its knowledge and experience in the market. The significant unobservable input used in valuing the CMBS was the discount rate or market yield used to discount the estimated future cash flows expected to be received from the underlying investment, which include both future principal and interest payments. Significant increases or decreases in the discount rate or market yield would result in a decrease or increase in the fair value measurement. The following risks were included in the consideration and selection of discount rates or market yields: risk of default, rating of the investment and comparable company investments.
Derivative Assets and Liabilities –The Company’s derivative financial instruments relate to interest rate swaps. The valuation of derivative instruments is determined using a discounted cash flow analysis on the expected cash flows of each derivative. This analysis reflects the contractual terms of the derivatives, including the period to maturity, as well as observable market-based inputs, including interest rate curves and implied volatilities. In addition, credit valuation adjustments are incorporated into the fair values to account for the Company’s potential nonperformance risk and the performance risk of the counterparties.
Although the Company determined that the majority of the inputs used to value its derivatives fall within Level 2 of the fair value hierarchy, the credit valuation adjustments associated with those derivatives utilize Level 3 inputs, such as estimates of current credit spreads to evaluate the likelihood of default by the Company and its counterparties. However, as of December 31, 2018 and 2017, the Company assessed the significance of the impact of the credit valuation adjustments on the overall valuation of its derivative positions and determined that the credit valuation adjustments are not significant to the overall valuation of the Company’s derivatives. As a result, the Company determined that its derivative valuations in their entirety are classified in Level 2 of the fair value hierarchy.
VEREIT, INC. and VEREIT OPERATING PARTNERSHIP, L.P.
NOTES TO CONSOLIDATED FINANCIAL STATEMENTS
December 31, 2018 – (Continued)
Investment in Cole REITs –The fair values of CCIT II and CCPT V were estimated using the net asset value per share. The Company determined that the CCIT III per share primary offering price net of selling commissions and dealer manager fees approximated fair value. Each of the Cole REIT’s share redemption programs includes restrictions that limit the number of shares redeemed by the respective Cole REIT. CCIT II has estimated that it will commence a liquidity event over the next three to five years. CCPT V has estimated that it will commence a liquidity event over the next three to six years following the termination of its initial public offering. CCIT III has estimated that it will commence a liquidity event five to seven years following the termination of its initial public offering. Subsequent to December 31, 2018, CCIT III terminated its primary offering, however it continues to issue shares pursuant to its distribution reinvestment plan.
The following are reconciliations of the changes in assets and liabilities with Level 3 inputs in the fair value hierarchy for the year ended December 31, 2018 (in thousands):
|
| | | | | | | | |
| | | CMBS | | Investment in Cole REITs (1) |
| Beginning balance, January 1, 2018 | | $ | 40,974 |
| | $ | 3,264 |
|
| Total gains and losses | | | | |
| Unrealized loss included in other comprehensive income, net | | (205 | ) | | — |
|
| Realized loss included in other income, net | | (34 | ) | | — |
|
| Unrealized gain included in other income, net | | — |
| | 5,102 |
|
| Purchases, issuance, settlements | | | | |
| Return of principal received | | (4,864 | ) | | — |
|
| Amortization included in net income, net | | 157 |
| | — |
|
| Sale of investments | | (36,028 | ) | | (522 | ) |
| Ending Balance, December 31, 2018 | | $ | — |
| | $ | 7,844 |
|
| |
| (1) | As discussed in Note 2 – Summary of Significant Accounting Policies, as of December 31, 2017, the Company accounted for its investment in Cole REITs using the equity method of accounting. Subsequent to the sale of Cole Capital, the Company retained interests in CCIT II, CCIT III and CCPT V, which were carried at fair value as of December 31, 2018. |
The following are reconciliations of the changes in assets and liabilities with Level 3 inputs in the fair value hierarchy for the year ended December 31, 2017 (in thousands):
|
| | | | |
| | | CMBS |
| Beginning balance, January 1, 2017 | | $ | 47,215 |
|
| Total gains and losses | | |
| Unrealized loss included in other comprehensive income, net | | (951 | ) |
| Purchases, issuance, settlements | | |
| Return of principal received | | (4,388 | ) |
| Amortization included in net income, net | | (902 | ) |
| Ending Balance, December 31, 2017 | | $ | 40,974 |
|
VEREIT, INC. and VEREIT OPERATING PARTNERSHIP, L.P.
NOTES TO CONSOLIDATED FINANCIAL STATEMENTS
December 31, 2018 – (Continued)
Items Measured at Fair Value on a Non-Recurring Basis
Certain financial and nonfinancial assets and liabilities are measured at fair value on a non-recurring basis and are subject to fair value adjustments in certain circumstances, such as when there is evidence of impairment.
Real Estate Investments –The Company performs quarterly impairment review procedures, primarily through continuous monitoring of events and changes in circumstances that could indicate the carrying value of its real estate assets may not be recoverable.
As part of the Company’s quarterly impairment review procedures, net real estate assets representing 70 properties were deemed to be impaired and their carrying values totaling $134.0 million were reduced to their estimated fair value of $79.4 million, resulting in impairment charges of $54.6 million during the year ended December 31, 2018. The impairment charges relate to certain office, retail and restaurant properties that, during 2018, management identified for potential sale or determined, based on discussions with the current tenants, would not be re-leased.
During the year ended December 31, 2017, net real estate assets related to 69 properties, with carrying values totaling $161.9 million, were deemed to be impaired and their carrying values were reduced to their estimated fair values of $111.4 million, resulting in impairment charges of $50.5 million. The majority of the impairment charges relate to certain office, restaurant and other properties that, during 2017, management identified for potential sale or determined, based on discussions with the current tenants, would not be re-leased.
During the year ended December 31, 2016 net real estate assets related to 153 properties, with carrying values totaling $668.2 million, were deemed to be impaired and their carrying values were reduced to their estimated fair values of $485.4 million, resulting in impairment charges of $182.8 million. A majority of the impairment charges related to properties identified by management for potential sale as part of its portfolio management strategy to reduce exposure to office properties. Additionally, a tenant of 59 restaurants filed for bankruptcy.
The Company estimates fair values using Level 3 inputs and uses a combined income and market approach, specifically using discounted cash flow analysis and recent comparable sales transactions. The evaluation of real estate assets for potential impairment requires the Company’s management to exercise significant judgment and make certain key assumptions, including, but not limited to, the following: (1) capitalization rate; (2) discount rates; (3) number of years property will be held; (4) property operating expenses; and (5) re-leasing assumptions including number of months to re-lease, market rental revenue and required tenant improvements. There are inherent uncertainties in making these estimates such as market conditions and performance and sustainability of the Company’s tenants. For the Company’s impairment tests for the real estate assets during the year ended December 31, 2018, the Company used a range of discount rates from 7.4% to 8.5% with a weighted-average rate of 7.9% and capitalization rates from 6.9% to 8.5% with a weighted-average rate of 7.8%.
The following table presents the impairment charges by asset class recorded during the years ended December 31, 2018, 2017 and 2016 (dollar amounts in thousands):
|
| | | | | | | | | | | | |
| | | Outstanding Balance (1) | | Interest Rate |
| | Conversion Rate (2) | | Maturity Date |
| 2018 Convertible Notes | | $ | 597,500 |
| | 3.00 | % | | 60.5997 |
| | August 1, 2018 |
| 2020 Convertible Notes | | 402,500 |
| | 3.75 | % | | 66.7249 |
| | December 15, 2020 |
| Total balance and weighted-average interest rate | | $ | 1,000,000 |
| | 3.30 | % | | | | |
|
| | | | | | | | | | | | |
| | | Year Ended December 31, |
| | | 2018 | | 2017 | | 2016 |
| Properties impaired | | 70 |
| | 69 |
| | 153 |
|
| | | | | | | |
| Asset classes impaired: | | | | | | |
| Investment in real estate assets, net | | $ | 53,562 |
| | $ | 50,087 |
| | $ | 183,240 |
|
| Investment in direct financing leases, net | | 1,381 |
| | 553 |
| | — |
|
| Below-market lease liabilities, net | | (296 | ) | | (92 | ) | | (421 | ) |
| Total impairment loss | | $ | 54,647 |
| | $ | 50,548 |
| | $ | 182,819 |
|
VEREIT, INC. and VEREIT OPERATING PARTNERSHIP, L.P.
NOTES TO CONSOLIDATED FINANCIAL STATEMENTS
December 31, 2018 – (Continued)
Fair Value of Financial Instruments
The fair value of short-term financial instruments such as cash and cash equivalents, restricted cash, due to affiliates and accounts payable approximate their carrying value in the accompanying consolidated balance sheets due to their short-term nature and are classified as Level 1 under the fair value hierarchy. The fair values of the Company’s financial instruments are reported below (dollar amounts in thousands):
|
| | | | | | | | | | | | | | | | | | |
| | | Level | | Carrying Amount at December 31, 2018 | | Fair Value at December 31, 2018 | | Carrying Amount at December 31, 2017 | | Fair Value at December 31, 2017 |
| Assets: | | | | | | | | | | |
| Mortgage notes receivable, net | | 1, 3 | | $ | 10,164 |
| | $ | 10,164 |
| | $ | 20,294 |
| | $ | 28,272 |
|
| | | | | | | | | | | |
Liabilities (1): | | | | | | | | | | |
| Mortgage notes payable and other debt, net | | 2 | | $ | 1,933,209 |
| | $ | 1,961,496 |
| | $ | 2,095,690 |
| | $ | 2,144,522 |
|
| Corporate bonds, net | | 2 | | 3,395,885 |
| | 3,368,928 |
| | 2,848,768 |
| | 2,922,027 |
|
| Convertible debt, net | | 2 | | 398,591 |
| | 396,905 |
| | 992,218 |
| | 1,012,349 |
|
| Credit facility | | 2 | | 403,000 |
| | 403,000 |
| | 185,000 |
| | 185,000 |
|
| Total liabilities | | | | $ | 6,130,685 |
| | $ | 6,130,329 |
| | $ | 6,121,676 |
| | $ | 6,263,898 |
|
| |
| (1) | ExcludesCurrent and prior period liabilities’ carrying and fair values exclude net deferred financing costs. |
Mortgage notes receivable, net –The fair value of the Company’s mortgage notes receivable at December 31, 2017 were valued using Level 3 inputs, which were estimated with a discounted cash flow analysis, utilizing scheduled cash flows and discount rates estimated by management to approximate market interest rates.
As discussed in Note 16 – Subsequent Events, the Company sold four of the remaining five mortgage notes receivable subsequent to December 31, 2018. In connection with the Company’s decision to sell and classify them as held for sale, the fair value of the Company’s mortgage notes receivable at December 31, 2018 were estimated using signed purchase and sale agreements for the four sold subsequent to December 31, 2018 and for the one remaining mortgage note receivable, the fair value was estimated using bids obtained by third-party valuation services that utilize observable market inputs. This resulted in transfers from Level 3 to Level 1.
Debt – The fair value is estimated by an independent third party using a discounted cash flow analysis, based on management’s estimates of observable market interest rates. Corporate bonds and convertible debt are valued using quoted market prices in active markets with limited trading volume when available.
VEREIT, INC. and VEREIT OPERATING PARTNERSHIP, L.P.
NOTES TO CONSOLIDATED FINANCIAL STATEMENTS
December 31, 2018 – (Continued)
Note 7 – Debt
As of December 31, 2018, the Company had $6.1 billion of debt outstanding, including net premiums and net deferred financing costs, with a weighted-average years to maturity of 4.2 years and a weighted-average interest rate of 4.3%. The following table summarizes the carrying value of debt as of December 31, 2018 and 2017, and the debt activity for the year ended December 31, 2018 (in thousands):
|
| | | | | | | | | | | | | | | | | | | | | |
| | | | | | Year Ended December 31, 2018 | | |
| | | | Balance as of December 31, 2017 | | Debt Issuances | | Repayments, Extinguishment and Assumptions | | Accretion and Amortization | | Balance as of December 31, 2018 |
| Mortgage notes payable: | | | | | | | | | | |
| | Outstanding balance | | $ | 2,071,038 |
| | $ | 187 |
| | $ | (154,093 | ) |
| $ | — |
| | $ | 1,917,132 |
|
| | Net premiums (1) | | 24,652 |
| | — |
| | (191 | ) | | (8,384 | ) | | 16,077 |
|
| | Deferred costs | | (12,998 | ) | | (43 | ) | | 30 |
| | 2,459 |
| | (10,552 | ) |
| Mortgages notes payable, net | | 2,082,692 |
|
| 144 |
|
| (154,254 | ) |
| (5,925 | ) |
| 1,922,657 |
|
| Corporate bonds: | | | | | | | | | |
|
|
| | Outstanding balance | | 2,850,000 |
| | 550,000 |
| | — |
| | — |
| | 3,400,000 |
|
| | Discount (2) | | (1,232 | ) | | (3,696 | ) | | — |
| | 813 |
| | (4,115 | ) |
| | Deferred costs | | (27,274 | ) | | (4,825 | ) | | — |
| | 4,823 |
| | (27,276 | ) |
| Corporate bonds, net | | 2,821,494 |
|
| 541,479 |
|
| — |
|
| 5,636 |
|
| 3,368,609 |
|
| Convertible debt: | | | | | | | | | |
|
|
| | Outstanding balance | | 1,000,000 |
| | — |
| | (597,500 | ) | | — |
| | 402,500 |
|
| | Discount (2) | | (7,782 | ) | | — |
| | — |
| | 3,873 |
| | (3,909 | ) |
| | Deferred costs | | (7,960 | ) | | — |
| | — |
| | 4,252 |
| | (3,708 | ) |
| Convertible debt, net | | 984,258 |
|
| — |
|
| (597,500 | ) |
| 8,125 |
|
| 394,883 |
|
| | | | | | | | | | | | |
| Credit facility: | | | | | | | | | |
|
|
| | Outstanding balance | | 185,000 |
| | 1,934,000 |
| | (1,716,000 | ) | | — |
| | 403,000 |
|
| | Deferred costs (3) | | — |
| | (1,236 | ) | | — |
| | 9 |
| | (1,227 | ) |
| Credit facility, net | | 185,000 |
|
| 1,932,764 |
|
| (1,716,000 | ) |
| 9 |
|
| 401,773 |
|
| | | | | | | | | | | |
|
|
| Total debt | | $ | 6,073,444 |
|
| $ | 2,474,387 |
|
| $ | (2,467,754 | ) |
| $ | 7,845 |
|
| $ | 6,087,922 |
|
| |
| (1) | Net premiums on mortgage notes payable were recorded upon the assumption of the conversion optionsrespective mortgage notes in relation to the various mergers and acquisitions. Amortization of these net premiums is recorded within additional paid-in capital of $28.6 million and the unamortized discount of $12.9 million as of December 31, 2016. The discount will be amortizeda reduction to interest expense over the remaining term of 2.5 years.the respective mortgage notes using the effective-interest method. |
| |
| (2) | ConversionDiscounts on the corporate bonds and convertible debt were recorded based upon the fair value of the respective debt instruments as of the respective issuance dates. Amortization of these discounts is recorded as an increase to interest expense over the remaining term of the respective debt instruments using the effective-interest method. |
| |
| (3) | Deferred costs relate to the Credit Facility Term Loan. |
VEREIT, INC. and VEREIT OPERATING PARTNERSHIP, L.P.
NOTES TO CONSOLIDATED FINANCIAL STATEMENTS
December 31, 2018 – (Continued)
Mortgage Notes Payable
The Company’s mortgage notes payable consisted of the following as of December 31, 2018 (dollar amounts in thousands):
|
| | | | | | | | | | | | | | | | |
| | | Encumbered Properties | | Gross Carrying Value of Collateralized Properties (1) | | Outstanding Balance | | Weighted-Average Interest Rate (2) | | Weighted-Average Years to Maturity (3) |
Fixed-rate debt (4) | | 458 |
| | $ | 3,760,194 |
| | $ | 1,903,095 |
| | 4.92 | % | | 3.5 |
| Variable-rate debt | | 1 |
| | 33,384 |
| | 14,037 |
| | 5.72 | % | (5) | 0.6 |
| Total | | 459 |
| | $ | 3,793,578 |
| | $ | 1,917,132 |
| | 4.93 | % | | 3.4 |
| |
| (1) | Gross carrying value is gross real estate assets, including investment in direct financing leases, net of gross real estate liabilities. |
| |
| (2) | Weighted average interest rate is computed using the interest rate in effect until the anticipated repayment date. Should the loan not be repaid at the anticipated repayment date, the applicable interest rate will increase as specified in the respective loan agreement until the extended maturity date. |
| |
| (3) | Weighted average years remaining to maturity is computed using the anticipated repayment date as specified in each loan agreement, where applicable. |
| |
| (4) | Includes $50.7 million of variable-rate debt fixed by way of interest rate swap arrangements. |
| |
| (5) | Weighted-average interest rate for variable-rate debt represents the amount of the General Partner OP Units per $1,000 principal amount of Convertible Notes convertedinterest rate in effect as of December 31, 2016, as adjusted in accordance with the applicable indentures as a result of cash dividend payments.2018. |
The Company’s mortgage loan agreements generally restrict corporate guarantees and require the maintenance of financial covenants, including maintenance of certain financial ratios (such as debt service coverage ratios and minimum net operating income). The mortgage loan agreements contain no dividend restrictions except in the event of default or when a distribution would drive liquidity below the applicable thresholds. At December 31, 2018, the Company believes that it was in compliance with the financial covenants under the mortgage loan agreements and had no restrictions on the payment of dividends.
On April 12, 2018, the Company entered into a deed-in-lieu of foreclosure agreement with the lender of a mortgage loan, secured by one property, with an outstanding balance of $16.2 million at the time of default and conveyed all interest in the property to satisfy the mortgage loan. As a result of the deed-in-lieu of foreclosure transaction, the Company recognized a gain on forgiveness of debt of $5.2 million, which is included in gain (loss) on extinguishment and forgiveness of debt, net in the accompanying consolidated statements of operations.
During the year ended December 31, 2017, the Company entered into deed-in-lieu of foreclosure agreements or completed the foreclosure with the lenders of three mortgage loans, secured by six properties, which resulted in a gain on forgiveness of debt of $20.5 million.
The following table summarizes the scheduled aggregate principal repayments due on mortgage notes subsequent to December 31, 2018 (in thousands):
|
| | | | |
| | | Total |
| 2019 | | $ | 167,279 |
|
| 2020 | | 265,189 |
|
| 2021 | | 352,768 |
|
| 2022 | | 314,898 |
|
| 2023 | | 144,843 |
|
| Thereafter | | 672,155 |
|
| Total | | $ | 1,917,132 |
|
VEREIT, INC. and VEREIT OPERATING PARTNERSHIP, L.P.
NOTES TO CONSOLIDATED FINANCIAL STATEMENTS
December 31, 2018 – (Continued)
Corporate Bonds
As of December 31, 2018, the OP had $3.40 billion aggregate principal amount of senior unsecured notes (the “Senior Notes”) outstanding comprised of the following (dollar amounts in thousands):
|
| | | | | | | | | |
| | | Outstanding Balance December 31, 2018 | | Interest Rate | | Maturity Date |
| 2019 Senior Notes | | $ | 750,000 |
| | 3.000 | % | | February 6, 2019 |
| 2021 Senior Notes | | 400,000 |
| | 4.125 | % | | June 1, 2021 |
| 2024 Senior Notes | | 500,000 |
| | 4.600 | % | | February 6, 2024 |
| 2025 Senior Notes | | 550,000 |
| | 4.625 | % | | November 1, 2025 |
| 2026 Senior Notes | | 600,000 |
| | 4.875 | % | | June 1, 2026 |
| 2027 Senior Notes | | 600,000 |
| | 3.950 | % | | August 15, 2027 |
| Total balance and weighted-average interest rate | | $ | 3,400,000 |
| | 4.129 | % | | |
On October 16, 2018, the Company closed a senior note offering, consisting of $550.0 million aggregate principal amount of the Operating Partnership’s 4.625% Senior Notes due 2025 (the “2025 Senior Notes”).
The Senior Notes are guaranteed by the General Partner. The OP may redeem all or a part of any series of the Senior Notes at any time, at its option, for the redemption prices set forth in the indenture governing the Senior Notes. If the redemption date is 30 or fewer days prior to the maturity date with respect to the 2019 Senior Notes and the 2021 Senior Notes, is 60 or fewer days prior to the maturity date with respect to the 2025 Senior Notes or is 90 or fewer days prior to the maturity date with respect to the 2024 Senior Notes, the 2026 Senior Notes and the 2027 Senior Notes, the redemption price will equal 100% of the principal amount of the Senior Notes of the applicable series to be redeemed, plus accrued and unpaid interest on the amount being redeemed to, but excluding, the applicable redemption date. The Senior Notes are registered under the Securities Act of 1933, as amended and are freely transferable.
The indenture governing our Senior Notes requires us to maintain financial ratios which include maintaining (i) a maximum limitation on incurrence of total debt less than or equal to 65% of Total Assets (as defined in the indenture), (ii) maximum limitation on incurrence of secured debt less than or equal to 40% of Total Assets (as defined in the indenture), (iii) a minimum debt service coverage ratio of at least 1.5x and (iv) a minimum unencumbered asset value of at least 150% of the aggregate principal amount of all of the outstanding Unsecured Debt (as defined in the indenture). As of December 31, 2018, the Company believes that it was in compliance with the financial covenants of our Senior Notes based on the covenant limits and calculations in place at that time.
Convertible Debt
During the year ended December 31, 2018, the Company’s convertible senior notes due August 1, 2018 (the “2018 Convertible Notes”) matured and the principal outstanding of $597.5 million, plus accrued and unpaid interest thereon, was repaid. The interest rate on the 2018 Convertible Notes may be converted into cash, shareswas 3.00% annually.
As of December 31, 2018, the Company had convertible senior notes due December 15, 2020 (the “2020 Convertible Notes”) with a balance of $402.5 million outstanding, which excludes the carrying value of the Company’s common stock or a combination thereofconversion options recorded within additional paid-in capital of $12.8 million and the unamortized discount of $3.9 million. The discount will be amortized over the remaining term of 2.0 years. The 2020 Convertible Notes bear interest at the Company’s option, in limited circumstances prior to February 1, 2018 and may be converted into such consideration at any time on or after February 1, 2018. an annual rate of 3.75%.
The 2020 Convertible Notes may be converted into cash, shares of the Company’s common stockCommon Stock or a combination thereof, in limited circumstances prior to June 15, 2020, and may be converted into such consideration at any time on or after June 15, 2020. As of December 31, 2018, the conversion rate was 66.7249 shares of the Company’s Common Stock per $1,000 principal amount of 2020 Convertible Notes, which reflects adjustments to the initial conversion rate pursuant to the terms of the applicable indenture as a result of cash dividend payments. There were no changes to the terms of the 2020 Convertible Notes during the year ended December 31, 2018 and the Company believes that it was in compliance with the financial covenants pursuant to the indenture governing the 2020 Convertible Notes as of December 31, 2016.
On January 22, 2015, the Company received a notice from the trustee of the indentures (the “Convertible Indentures”) governing each of the Convertible Notes of the Company’s failure to timely deliver certain financial statements in 2014. Pursuant to the terms of the Convertible Indentures, the Company had 60 days following its receipt of a notice of default to deliver the required financial statements, after which such failure would become an event of default under each of the Convertible Indentures. The Company and the OP filed the required financial statements with the SEC on March 2, 2015.2018.
VEREIT, INC. ANDand VEREIT OPERATING PARTNERSHIP, L.P.
NOTES TO CONSOLIDATED FINANCIAL STATEMENTS
December 31, 20162018 – (Continued)
Credit Facility
TheOn May 23, 2018, the General Partner, as guarantor, and the OP, as borrower, are parties to an unsecured credit facility (the “Credit Facility”) pursuant toentered into a credit agreement dated as of June 30, 2014, as amended, with Wells Fargo Bank, National Association (“Wells Fargo”), as administrative agent and other lenders party thereto (the “Credit Agreement”).
In 2014, the General Partner, as guarantor, and the OP, as borrower entered into certain agreements with respect to the The Credit Agreement which providedprovides for among other things, an extension of the delivery date of certain financial statements and other deliverables, the suspension of the payment of dividends until such financial statements and other deliverables were provided and a reduction to the maximum amount of indebtedness under the Credit Agreement to $3.6 billion. In connection with the agreements, the Company agreed to pay certain customary fees to the consenting lenders and agreed to reimburse certain customary expenses of the arrangers. The Company and the OP filed the required financial statements with the SEC on March 2, 2015.
On July 31, 2015, the General Partner and the OP entered into the Second Amendment to Credit Agreement (the “Second Amendment”) with Wells Fargo and other lenders party to the Credit Agreement. Pursuant to the Second Amendment, the maximum capacity under the Credit Facility was reduced from $3.6$2.0 billion to $3.3 billion, which included a reduction in the size of the $2.45 billionunsecured revolving credit facility to $2.3 billion(the “Revolving Credit Facility”) and the elimination of the $150.0a $900.0 million multicurrency revolving credit facility. The maximum aggregate dollar amount of letters of credit that was allowed outstanding at any one time under the Credit Facility was reduced from $50.0 million to $25.0 million. In respect of financial covenants, the Second Amendment reduced the Company’s minimum Unencumbered Asset Value (as defined in the Credit Agreement) from $10.5 billion to $8.0 billion.
As of December 31, 2016, the Credit Facility allowed for maximum borrowings of $2.8 billion, consisting of a $0.5 billionunsecured term loan facility (the “Credit Facility Term Loan”Loan,” together with the Revolving Credit Facility, the “Credit Facility”), which is available through February 23, 2019, for up to four borrowings of delayed-draw term loans. In connection with entering into the Credit Agreement, the OP repaid all of the outstanding obligations under the amended and restated credit agreement dated as of June 30, 2014 (as amended, the “2014 Credit Agreement”) and the 2014 Credit Agreement was terminated. The 2014 Credit Agreement provided for a $2.3 billion revolving credit facility.facility and was scheduled to terminate on June 30, 2018.
As of December 31, 2018, the outstanding balance under the Revolving Credit Facility was $253.0 million. As of December 31, 2018, $150.0 million had been drawn on the Credit Facility Term Loan. The maximum aggregate dollar amount of letters of credit that may be outstanding at any one time under the Credit Facility is $25.0$50.0 million. During the year ended December 31, 2016, the Company repaid all of the outstanding borrowings under its revolving credit facility. Additionally, the Company repaid $0.5 billion of the
The Revolving Credit Facility Term Loan, resulting in the write-off of unamortized deferred financing costs of $4.3 million, which is included in (loss) gain on extinguishment and forgiveness of debt, net in the accompanying consolidated statements of operations. As discussed in Note 12 –Derivatives and Hedging Activities, in connection with the early repayment of a portion of the Credit Facility Term Loan, the Company terminated two of its interest rate swaps, resulting in the reclassification of $3.3 million from accumulated other comprehensive loss to earnings, which is included in loss on derivative instruments, net in the accompanying consolidated statements of operations. The remaining outstanding balance on the Credit Facility Term Loan of $0.5 billion is, in effect, fixed through the use of derivative instruments used to hedge interest rate volatility. Including the spread, which can vary based on the General Partner’s credit rating, the interest rate on this portion was 3.25% at December 31, 2016. As of December 31, 2016, a maximum of $2.3 billion was available to the OP for future borrowings, subject to borrowing availability.
The revolving credit facility generally bears interest at an annual rate of LIBORLondon Inter-Bank Offer Rate (“LIBOR”) plus 1.00%0.775% to 1.80%1.55% or Base Rate plus 0.00% to 0.80%0.55% (based upon the General Partner’s then current credit rating). “Base Rate” is defined as the highest of the prime rate, the federal funds rate plus 0.50% or a floating rate based on one month LIBOR plus 1.0%, determined on a daily basis. The Credit Facility Term Loan generally bears interest at an annual rate of LIBOR plus 1.15%0.85% to 2.05%1.75%, or Base Rate plus 0.15%0.00% to 1.05%0.75% (based upon the General Partner’s then current credit rating). In addition, the Credit Agreement provides the flexibility for interest rate auctions, pursuant to which, at the Company’s election, the Company may request that lenders make competitive bids to provide revolving loans, which competitive bids may be at pricing levels that differ from the foregoing interest rates.
The Credit Agreement provides for monthly interest payments under the Credit Facility. In the event of default, at the election of a majority of the lenders (or automatically upon a bankruptcy event of default with respect to the OP or the General Partner), the commitments of the lenders under the Credit Facility will mature,terminate, and payment of any unpaid amounts in respect of the Credit Facility will be accelerated. The revolving credit facility and theRevolving Credit Facility Term Loan both terminateterminates on June 30, 2018, in each case,May 23, 2022, unless extended in accordance with the terms of the Credit Agreement. The Credit Agreement provides for a one-yeartwo six-month extension optionoptions with respect to each of the revolving credit facility and theRevolving Credit Facility, Term Loan, exercisable at the Company’sOP’s election and subject to certain customary conditions, as well as certain customary “amend and extend” provisions. Any term loans outstanding under the Credit Facility Term Loan mature on May 23, 2023. At any time, upon timely notice by the OP and subject to any breakage fees, the OP may prepay borrowings under the Credit Facility (subject to certain limitations applicable to the prepayment of any loans obtained through an interest rate auction, as described above). The OP incurs a facility fee equal to 0.15%0.10% to 0.25%0.30% per annum (based upon the General Partner’s then current credit rating) multiplied by the commitments (whether or not utilized) in respect of the revolving credit facility.Revolving Credit Facility. In addition, the OP incurs a ticking fee equal to 0.25% multiplied by unused commitments in respect of the Credit Facility Term Loan. The OP also incurs customary administrative agent, letter of credit issuance, letter of credit fronting, extension and other fees.
VEREIT, INC. AND VEREIT OPERATING PARTNERSHIP, L.P.
NOTES TO CONSOLIDATED FINANCIAL STATEMENTS
December 31, 2016 – (Continued)
The Credit Facility requires restrictions on corporate guarantees, as well as the maintenance of financial covenants, including the maintenance of certain financial ratios (such as specified debt to equity and debt service coverage ratios) and the maintenance of a minimum net worth.. The key financial covenants in the Credit Facility, as defined and calculated per the terms of the Credit Agreement, include maintaining (i) a maximum leverage ratio less than or equal to 60%, (ii) a minimum fixed charge coverage ratio of at least 1.5x, (iii) a secured leverage ratio less than or equal to 45%, (iv) a total unencumbered asset value ratio less than or equal to 60%, and (v) a minimum tangible net worth covenant of at least $5.5 billion, (vi) a minimum unencumbered interest coverage ratio of at least 1.75x and (vii) a minimum unencumbered asset value of at least $8.0 billion (up to 35% of which may be comprised of restaurant properties from June 30, 2016 to December 30, 2016 and up to 30% of which may be comprised of restaurant properties from December 31, 2016 on).1.75x. The Company believes that it was in compliance with the financial covenants pursuant to the Credit Agreement and is not restricted from accessing any borrowing availability under the Credit Facility as of December 31, 2016.2018.
2016 Term Loan
On June 2, 2016, the General Partner as guarantor, and the OP, as borrower, entered into a $300.0 million senior secured term loan facility (the “2016 Term Loan”), pursuant to a credit agreement (the “2016 Term Loan Agreement”) with JPMorgan Chase Bank, N.A., as the administrative agent, and certain other lenders party thereto. During the year ended December 31, 2016, the Company borrowed $300.0 million on the 2016 Term Loan and subsequently repaid the balance prior to December 31, 2016. In connection with entering into the prepayment,Credit Agreement, the Company wrote-offcapitalized an aggregate $20.7 million in lender fees and third-party costs in respect of the remaining unamortized deferredRevolving Credit Facility and the Credit Facility Term Loan, which will be amortized over the respective terms. Deferred financing costs, resulting in a lossnet of $2.6 million which isaccumulated amortization, related to the Revolving Credit Facility are included in (loss) gain on extinguishmentrent and forgiveness of debt,other tenant receivables and other assets, net in the accompanying consolidated statementsbalance sheets. Deferred financing costs, net of operations.
Note 12 – Derivatives and Hedging Activities
Risk Management Objective of Using Derivatives
The Company may use derivative financial instruments, including interest rate swaps, caps, options, floors and other interest rate derivative contracts, to hedge all or a portion of the interest rate risk associated with its borrowings. The principal objective of such arrangements is to minimize the risks and/or costs associated with the Company’s operating and financial structure as well as to hedge specific anticipated transactions. The Company does not intend to utilize derivatives for purposes other than interest rate risk management. The use of derivative financial instruments carries certain risks, including the risk that the counterparties to these contractual arrangements are not able to perform under the agreements. To mitigate this risk, the Company only enters into derivative financial instruments with counterparties with high credit ratings and with major financial institutions with which the Company and its affiliates may also have other financial relationships. The Company does not anticipate that any of the counterparties will fail to meet their obligations.
Cash Flow Hedges of Interest Rate Risk
The Company’s objectives in using interest rate derivatives are to add stability to interest expense and to manage its exposure to interest rate movements. To accomplish these objectives, the Company primarily uses interest rate swaps as part of its interest rate risk management strategy. Interest rate swaps designated as cash flow hedges involve the receipt of variable-rate amounts from a counterparty in exchange for the Company making fixed-rate payments over the life of the agreements without exchange of the underlying notional amount.
The effective portion of changes in the fair value of derivatives designated that qualify as cash flow hedges is recorded in accumulated other comprehensive income and is subsequently reclassified into earnings in the period that the hedged forecasted transaction affects earnings. During the year ended December 31, 2016 and 2015, such derivatives were used to hedge the variable cash flows associated with variable-rate debt. During the year ended December 31, 2016, the Company reclassified $5.5 million from accumulated other comprehensive income into interest expense as a result of the hedged forecasted transactions affecting earnings.
The ineffective portion of the change in fair value of the derivatives designated that qualify as cash flow hedges is recognized directly in earnings. During the year ended December 31, 2016, the Company recorded a gain of $2.5 million in earningsamortization, related to the ineffective portion of the change in fair value of derivatives designated that qualify as cash flow hedges which isCredit Facility Term Loan outstanding balance are included in loss on derivativescredit facility, net in the accompanying consolidated statements of operations. The ineffectiveness is primarily attributable to the designation of acquired interest rate swaps with a non-zero fair value at inception associated with the Cole Merger.balance sheets.
VEREIT, INC. ANDand VEREIT OPERATING PARTNERSHIP, L.P.
NOTES TO CONSOLIDATED FINANCIAL STATEMENTS
December 31, 20162018 – (Continued)
During the year ended December 31, 2016, the Company terminated two of its interest rate swaps in connection with the early repayment of a portion of the Credit Facility Term Loan, as discussed in Note 11 –Debt, and accelerated the reclassification of a portion of the amounts in other comprehensive income to earnings as a result of a portion of the hedged forecasted transactions becoming probable not to occur. A loss of $3.3 million was recorded in relation to the acceleration, which is included in loss on derivative instruments, net in the accompanying consolidated statements of operations.
Amounts reported in accumulated other comprehensive income related to derivatives will be reclassified to interest expense as interest payments are made on the Company’s variable-rate debt. During the next twelve months, the Company estimates that an additional $0.8 million will be reclassified from other comprehensive income as an increase to interest expense.
As of December 31, 2016 and December 31, 2015, the Company had the following outstanding interest rate derivatives that were designated as cash flow hedges of interest rate risk (dollar amounts in thousands):
|
| | | | | | | | |
| Interest Rate Swaps | | December 31, 2016 | | December 31, 2015 |
| Number of Instruments | | 14 |
| | 16 |
|
| Notional Amount | | $ | 690,816 |
| | $ | 1,211,651 |
|
The table below presents the fair value of the Company’s derivative financial instruments as well as their classification in the consolidated balance sheets as of December 31, 2016 and December 31, 2015 (in thousands):
|
| | | | | | | | | | |
| Derivatives Designated as Hedging Instruments | | Balance Sheet Location | | December 31, 2016 | | December 31, 2015 |
| Interest rate swaps | | Rent and tenant receivables and other assets, net | | $ | 3 |
| | $ | 1,794 |
|
| Interest rate swaps | | Deferred rent, derivative and other liabilities | | $ | (3,547 | ) | | $ | (6,922 | ) |
In January 2014, the Company entered into an interest rate lock agreement with a notional amount of $250.0 million (the “Treasury Lock Agreement”). The Treasury Lock Agreement, which had an original maturity date of February 12, 2014, was entered into to hedge part of the Company’s interest rate exposure associated with the variability in future cash flows attributable to changes in the 10-year U.S. treasury rates related to the planned issuance of debt securities in conjunction with the merger of Cole Capital with and into a wholly owned subsidiary of the Company. In connection with the Company’s offering of Senior Notes in February 2014, the Company settled the Treasury Lock Agreement for $3.9 million, which was accounted for as a cash flow hedge, recorded to other comprehensive loss and will be amortized into earnings over the 10-year term of the Treasury Lock. The Company recognized $0.5 million of interest expense for the year ended December 31, 2016 related to the Treasury Lock Agreement.
Derivatives Not Designated as Hedging Instruments
Derivatives not designated as hedges are not speculative and are used to manage the Company’s exposure to interest rate movements and other identified risks but do not meet the requirements to be classified as hedging instruments. A loss of $0.3 million related to the change in the fair value of derivatives not designated as hedging instruments was recorded in loss on derivative instruments, net in the accompanying consolidated statements of operations for the year ended December 31, 2016. The Company recorded a loss of $1.5 million for the year ended December 31, 2015.
As of December 31, 2016 and December 31, 2015, the Company had the following outstanding interest rate derivative that was not designated as a qualifying hedging relationship (dollar amounts in thousands):
|
| | | | | | | | |
| Interest Rate Swap | | December 31, 2016 | | December 31, 2015 |
| Number of Instruments | | 1 |
| | 1 |
|
| Notional Amount | | $ | 51,400 |
| | $ | 51,400 |
|
The table below presents the fair value of the Company’s derivative financial instrument not designated as a hedge as well as its classification in the consolidated balance sheets as of December 31, 2016 and December 31, 2015 (in thousands):
|
| | | | | | | | | | |
| Derivatives Not Designated as Hedging Instruments | | Balance Sheet Location | | December 31, 2016 | | December 31, 2015 |
| Interest rate swaps | | Rent and tenant receivables and other assets, net | | $ | 196 |
| | $ | 98 |
|
VEREIT, INC. AND VEREIT OPERATING PARTNERSHIP, L.P.
NOTES TO CONSOLIDATED FINANCIAL STATEMENTS
December 31, 2016 – (Continued)
Tabular Disclosure of Offsetting Derivatives
The table below details a gross presentation, the effects of offsetting and a net presentation of the Company’s derivatives as of December 31, 2016 and December 31, 2015 (in thousands). The net amounts of derivative assets or liabilities can be reconciled to the tabular disclosure of fair value.
|
| | | | | | | | | | | | | | | | | | | | | | | | | | | | | | | | |
| | | Offsetting of Derivative Assets and Liabilities |
| | | Gross Amounts of Recognized Assets | | Gross Amounts of Recognized Liabilities | | Gross Amounts Offset in the Consolidated Balance Sheets | | Net Amounts of Assets Presented in the Consolidated Balance Sheets | | Net Amounts of Liabilities Presented in the Consolidated Balance Sheets | | Financial Instruments | | Cash Collateral Received | | Net Amount |
| December 31, 2016 | | $ | 199 |
| | $ | (3,547 | ) | | $ | — |
| | $ | 199 |
| | $ | (3,547 | ) | | $ | — |
| | $ | — |
| | $ | (3,348 | ) |
| December 31, 2015 | | $ | 1,892 |
| | $ | (6,922 | ) | | $ | — |
| | $ | 1,892 |
| | $ | (6,922 | ) | | $ | — |
| | $ | — |
| | $ | (5,030 | ) |
Credit Risk Related Contingent Features
The Company has agreements with each of its derivative counterparties that contain a provision specifying that if the Company either defaults or is capable of being declared in default on any of its indebtedness, the Company could also be declared in default on its derivative obligations.
As of December 31, 2016, the fair value of the interest rate derivatives in a net liability position, including accrued interest but excluding any adjustment for nonperformance risk related to these agreements, was $4.3 million. As of December 31, 2016, the Company has not posted any collateral related to these agreements and was not in breach of any provisions in these agreements. If the Company had breached any of these provisions, it could have been required to settle its obligations under the agreements at their aggregate termination value of $4.3 million at December 31, 2016.
Note 138 – Supplemental Cash Flow Disclosures
Supplemental cash flow information was as follows for the years ended December 31, 2016, 20152018, 2017 and 20142016 (in thousands):
| | | | | Year Ended December 31, | | Year Ended December 31, |
| | | 2016 | | 2015 | | 2014 | | 2018 | | 2017 | | 2016 |
| Supplemental Disclosures: | | | | | | | |
| Supplemental disclosures: | | | | | | | |
| Cash paid for interest | | $ | 317,170 |
| | $ | 343,854 |
| | $ | 330,652 |
| | $ | 267,400 |
| | $ | 260,951 |
| | $ | 317,170 |
|
| Cash paid for income taxes | | $ | 20,279 |
| | $ | 14,179 |
| | $ | 7,616 |
| | $ | 5,589 |
| | $ | 11,280 |
| | $ | 20,279 |
|
| Cash received from federal income tax refund | | | $ | 2,939 |
| | $ | 16,686 |
| | $ | — |
|
| Non-cash investing and financing activities: | | | | | | | | | | | | |
| Common stock issued in merger with Cole | | $ | — |
| | $ | — |
| | $ | 7,285,868 |
| |
| Accrued capital expenditures and real estate developments | | $ | 7,701 |
| | $ | 1,499 |
| | $ | 6,868 |
| |
| Accrued capital expenditures, tenant improvements and real estate developments | | | $ | 12,648 |
| | $ | 6,578 |
| | $ | 7,701 |
|
| Accrued deferred financing costs | | $ | 3 |
| | $ | — |
| | $ | — |
| | $ | 67 |
| | $ | — |
| | $ | 3 |
|
| Distributions declared and unpaid | | $ | 149,281 |
| | $ | 133,817 |
| | $ | 9,200 |
| | $ | 148,383 |
| | $ | 149,768 |
| | $ | 149,281 |
|
| Accrued equity issuance costs | | $ | 9 |
| | $ | — |
| | $ | — |
| | $ | — |
| | $ | — |
| | $ | 9 |
|
| Mortgage note payable relieved by foreclosure | | $ | 38,050 |
| | $ | 53,798 |
| | $ | — |
| |
| Mortgage notes payable assumed in real estate acquisition | | $ | — |
| | $ | — |
| | $ | 301,532 |
| |
| Mortgage note payable relieved by foreclosure or a deed-in-lieu of foreclosure | | | $ | 16,200 |
| | $ | 100,388 |
| | $ | 38,050 |
|
| Mortgage notes payable assumed in real estate disposition | | $ | 55,000 |
| | $ | 425,021 |
| | $ | 461,111 |
| | $ | — |
| | $ | 66,000 |
| | $ | 55,000 |
|
| Real estate investments received from a ground lease expiration and other lease related transactions | | | $ | 1,386 |
| | $ | 259 |
| | $ | — |
|
| Real estate investments received from a property-related legal settlement | | | $ | — |
| | $ | 775 |
| | $ | — |
|
| Nonmonetary exchanges: | | | | | | | |
| Real estate investments received | | | $ | — |
| | $ | 50,204 |
| | $ | — |
|
| Real estate investments relinquished and gain on disposition | | | $ | — |
| | $ | (47,474 | ) | | $ | — |
|
| Rent and tenant receivables, intangible lease liability and other assets, net | | | $ | — |
| | $ | (2,511 | ) | | $ | — |
|
VEREIT, INC. AND VEREIT OPERATING PARTNERSHIP, L.P.
NOTES TO CONSOLIDATED FINANCIAL STATEMENTS
December 31, 2016 – (Continued)
Note 149 – Accounts Payable and Accrued Expenses
Accounts payable and accrued expenses consisted of the following as of December 31, 20162018 and December 31, 20152017 (in thousands):
| | | | | December 31, 2016 | | December 31, 2015 | | December 31, 2018 | | December 31, 2017 |
| Accrued interest | | $ | 43,188 |
| | $ | 56,273 |
| | $ | 43,916 |
| | $ | 47,116 |
|
| Accrued real estate taxes | | 38,877 |
| | 47,319 |
| | 25,208 |
| | 26,131 |
|
| Accrued legal fees | | 17,827 |
| | 9,212 |
| | 32,715 |
| | 30,854 |
|
| Accounts payable | | 5,030 |
| | 2,868 |
| | 2,673 |
| | 2,570 |
|
| Accrued other | | 41,215 |
| | 36,205 |
| | 41,099 |
| | 29,803 |
|
| Total | | $ | 146,137 |
| | $ | 151,877 |
| | $ | 145,611 |
| | $ | 136,474 |
|
Note 1510 – Commitments and Contingencies
Litigation
The Company is involved in various routine legal proceedings and claims incidental to the ordinary course of its business. There are no material legal proceedings pending against the Company, except as follows:
Government Investigations and Litigation Relating to the Audit Committee Investigation
As previously reported, on October 29, 2014, the Company filed a Current Report on Form 8-K (the “October 29 8-K”) reporting the Audit Committee’s conclusion, based on the preliminary findings of its investigation, that certain previously issued consolidated financial statements of the Company, including those included in the Company’s Annual Report on Form 10-K for the year ended December 31, 2013 and Quarterly Reports on Form 10-Q for the quarters ended March 31, 2014 and June 30, 2014, and related financial information should no longer be relied upon. The Company also reported that the Audit Committee had based its conclusion on the preliminary findings of its investigation into concerns regarding accounting practices and other matters that
VEREIT, INC. and VEREIT OPERATING PARTNERSHIP, L.P.
NOTES TO CONSOLIDATED FINANCIAL STATEMENTS
December 31, 2018 – (Continued)
were first reported to the Audit Committee in early September 2014 and that the Audit Committee believed that an error in the calculation of adjusted funds from operations for the first quarter of 2014 had been identified but intentionally not corrected when the Company reported its financial results for the three and six months ended June 30, 2014. Prior to the filing of the October 29 8-K, the Audit Committee previewed for the SEC the information contained in the filing. Subsequent to that filing, the SEC provided notice that it had commenced a formal investigation and issued subpoenas calling for the production of various documents. In addition, the United States Attorney’s Office for the Southern District of New York contacted counsel for the Audit Committee and counsel for the Company with respect to this matter, and the Secretary of the Commonwealth of Massachusetts issued a subpoena calling for the production of various documents. The Company has been cooperating with these regulators in their investigations.
In connection with these investigations, on September 8, 2016, the United States Attorney’s Office for the Southern District of New York announced the filing of criminal charges against the Company’s former Chief Financial Officer and former Chief Accounting Officer (the “Criminal Action”), as well as the fact that the former Chief Accounting Officer has pleaded guilty to the charges filed. The former Chief Financial Officer has pleaded not guilty, and his trial is currently scheduled to commence on June 12, 2017. Also on September 8, 2016, the SEC announced the filing of a civil complaint against the same two individuals in the United States District Court for the Southern District of New York (the “SEC Civil Action”).York. On October 12, 2016,June 30, 2017, following a jury trial, the former Chief Financial Officer was convicted of the charges filed. Both the former Chief Accounting Officer and the former Chief Financial Officer have entered into settlement agreements with the SEC resolving the charges brought against them.
The United States Attorney forAttorney’s Office has indicated that it does not intend to bring criminal charges against the Southern DistrictCompany arising from its investigation. In addition, the Company has not been in contact with the Massachusetts regulator since June 2015 and believes the investigation is concluded. In March 2018, investigative staff of New York filedthe SEC’s enforcement division inquired whether the Company wished to discuss a motion to intervene in and stayresolution of potential civil charges the SEC Civil Action until the conclusion of the Criminal Action. On November 1, 2016, the court in the SEC Civil Action granted the motion to intervene and granted the motion to staymay bring with respect to all witness-related discovery,certain matters investigated by the staff stemming from the announcement made on October 29, 2014. The Company has been cooperating with some limited exceptions, as clarifiedthe SEC staff’s investigation since its inception and is engaged in a subsequent ruling on December 15, 2016.such discussions with the staff. The timing and substance of the ultimate resolution of these discussions is unknown.
As discussed below, the Company and certain of its former officers and current and former directors have been named as defendants in a number of lawsuits filed following the October 29 8-K, including class actions, derivativeindividual actions and individualderivative actions seeking money damages and other relief under the federal securities laws and state laws in both federal and state courts in New York, Maryland and Arizona.
VEREIT, INC. AND VEREIT OPERATING PARTNERSHIP, L.P.
NOTES TO CONSOLIDATED FINANCIAL STATEMENTS
December 31, 2016 – (Continued)
Between October 30, 2014 and January 20, 2015, the Company and certain of its former officers and current and former directors, among other individuals and entities, were named as defendants in ten securities class action complaints filed in the United States District Court for the Southern District of New York. The court consolidated these actions under the caption In re American Realty Capital Properties, Inc. Litigation, No. 15-MC-00040 (AKH) (the “SDNY Consolidated Securities Class Action”). The plaintiffs filed a second amended class action complaint on December 11, 2015, which asserted claims for violations of Sections 11, 12(a)(2) and 15 of the Securities Act of 1933 and Sections 10(b) and 20(a) of the Securities Exchange Act of 1934 and Rule 10b-5 promulgated thereunder. Certain defendants, including the Company and the OP, filed motions to dismiss the second amended class action complaint (or portions thereof), which were granted in part and denied in part by the court at oral argument on June 1, 2016. The Company and the OP filed an answer to the second amended class action complaint on July 29, 2016. On September 8, 2016, the Courtcourt issued an order directing plaintiffs to file a third amended complaint to reflect certain prior rulings by the court.court in connection with various motions to dismiss. The third amended complaint was filed on September 30, 2016 and the defendants arewere not required to file new answers. In the September 8, 2016 order, the court also directed that document production should be substantially complete by December 15, 2016. On January 25,August 31, 2017, the court issued an order directing plaintiffs to file agranting plaintiffs’ motion for class certification. Defendants’ petitions seeking leave to appeal the court’s order granting class certification by March 15, 2017were denied on January 24, 2018. Fact depositions were concluded at the end of 2018 and defendants to file an opposition to the motion by May 5, 2017. The court scheduledat a status conference in November 2018, the court ordered all summary judgment motions to be filed by February 8, 2019, with briefing on May 16, 2017.all motions to be completed by April 5, 2019. The next status conference with the court is scheduled for April 17, 2019 and trial is scheduled for September 9, 2019.
VEREIT, INC. and VEREIT OPERATING PARTNERSHIP, L.P.
NOTES TO CONSOLIDATED FINANCIAL STATEMENTS
December 31, 2018 – (Continued)
The Company, certain of its former officers and current and former directors, and the OP, among others, havewere also been named as defendants in additionalthirteen individual securities fraud actions filed in the United States District Court for the Southern District of New York: Jet Capital Master Fund, L.P. v. American Realty Capital Properties, Inc., et al., No. 15-cv-307;15-cv-307 (the “Jet Capital Action”); Twin Securities, Inc. v. American Realty Capital Properties, Inc., et al., No. 15-cv-1291; HG Vora Special Opportunities Master Fund, Ltd v. American Realty Capital Properties, Inc., et al., No. 15-cv-4107; BlackRock ACS US Equity Tracker Fund, et al. v. American Realty Capital Properties, Inc. et al., No. 15-cv-08464; PIMCO Funds: PIMCO Diversified Income Fund, et al. v. American Realty Capital Properties, Inc. et al., No. 15-cv-08466; Clearline Capital Partners LP, et al. v. American Realty Capital Properties, Inc. et al., No. 15-cv-08467; Pentwater Equity Opportunities Master Fund Ltd., et al. v. American Realty Capital Properties, Inc. et al., No. 15-cv-08510; Archer Capital Master Fund, et al. v. American Realty Capital Properties, Inc. et al, No. 16-cv-05471; Atlas Master Fund et al. v. American Realty Capital Properties, Inc. et al., No. 16-cv-05475; and Eton Park Fund, L.P. v. American Realty Capital Properties, Inc., et al., No. 16-cv-09393 (the “Eton Park Action”)16-cv-09393; Reliance Standard Life Insurance Company, et al, v. American Realty Capital Properties, Inc. et al, No. 17-cv-02796; Fir Tree Capital Opportunity Master Fund, L.P. et al. v. American Realty Capital Properties, Inc. et al., No. 17-cv-04975; and Cohen & Steers Institutional Realty Shares, Inc. et al v. American Realty Capital Properties, Inc. et al., No. 18-cv-06770, (collectively, the “Opt-Out Actions”). The Opt-Out Actions assert claims arising out of allegedly false and misleading statements in connection with the purchase or sale of the Company’s securities. The Company has filed answersentered into a series of agreements dated September 30 through October 26, 2018, to the complaints in allsettle twelve of the thirteen pending Opt-Out Actions except(the “Opt Out Settlement Agreements”) brought by plaintiffs holding shares of common stock and swaps referencing common stock representing approximately 18% of VEREIT’s outstanding shares of common stock outstanding at the end of the period covered by the litigations, for an aggregate payment of $127.5 million. The Opt Out Settlement Agreements contain mutual releases by both Plaintiffs and the Eton ParkCompany, although the Company retains the right to pursue any and all claims against the other defendants in each Action in which it filed a motion to dismiss on February 10, 2017. Document productionand/or third parties, including claims for contribution for amounts paid in the Opt-Out Actionssettlement. The Opt Out Settlement Agreements do not contain any admission of liability, wrongdoing or responsibility by any of the parties. The only remaining opt out action is being coordinated with production inthe Jet Capital Action, which is proceeding on the same summary judgment and trial schedule as the SDNY Consolidated Securities Class Action.
On October 27, 2015, the Company and certain of its former officers, among others, were also named as defendants in an individual securities fraud action filed in the United States District Court for the District of Arizona, captioned Vanguard Specialized Funds, et al. v. VEREIT, Inc. et al., No. 15-cv-02157 (the “Vanguard Action”, and such plaintiffs, “Plaintiffs”). The Vanguard Action assertsasserted claims arising out of allegedly false and misleading statements in connection with the purchase or sale of the Company’s securities. On January 21, 2016,June 7, 2018, the Company entered into a Settlement Agreement and Release (the “Settlement Agreement”) to settle the Vanguard Action. Pursuant to the terms of the Settlement Agreement, the Plaintiffs filed a motion to transferdismiss all claims against the Company and the other defendants with prejudice, which was granted by the court on June 19, 2018, and the Company paid Plaintiffs the sum of $90 million in connection with the settlement of the claims. The Settlement Agreement contains mutual releases by both Plaintiffs and the Company, although the Company retains the right to pursue any and all claims against the other defendants in the Action and/or third parties, including claims for contribution for amounts paid in the settlement. The Settlement Agreement does not contain any admission of liability, wrongdoing or responsibility by any of the parties. Vanguard’s holdings accounted for approximately 13% of the Company’s outstanding shares of common stock held at the end of the period covered by the various pending shareholder actions.
In addition to the settlement of the opt-out actions and the Vanguard Action discussed above, on February 5, 2019, the Company entered into a series of agreements to settle claims with shareholders who decided not to participate as class members in the SDNY Consolidated Securities Class Action. Pursuant to the United States District Courtterms of the settlement agreements, the shareholders released all claims that were the subject matter of the SDNY Consolidated Securities Class Action and the Company made payments totaling $15.7 million. In total, the Company has now settled claims of shareholders who held shares of common stock and swaps referencing common stock representing approximately 33.5% of VEREIT’s outstanding shares of common stock held at the end of the period covered by the various pending shareholder actions for payments totaling $233.2 million, which is recorded in “Litigation, merger and other non-routine costs, net of insurance recoveries” in the accompanying consolidated statement of operations for the Southern District of New York and a motion to dismiss the complaint. On September 29, 2016, the court entered an order denying the Company’s motion to transfer and granting in part and denying in part the Company’s motion to dismiss. The Company filed an answer to the complaint on November 4, 2016. Discovery is ongoing.year ended December 31, 2018.
The Company was also named as a nominal defendant, and certain of its former officers and current and former directors were named as defendants, in shareholder derivative actions filed in the United States District Court for the Southern District of New York: Witchko v. Schorsch, et al., No. 15-cv-06043 (the “Witchko Action”); and Serafin, et al. v. Schorsch, et al., No. 15-cv-08563 (the “Serafin Action”). The court consolidated the Witchko Action and the Serafin Action (together “the SDNYthe “SDNY Derivative Action”) and the plaintiffs designated the complaint filed in the Witchko Action as the operative complaint in the SDNY Derivative Action. The SDNY Derivative Action seeks money damages and other relief on behalf of the Company for alleged breaches of fiduciary duty, among other claims. On February 12, 2016, the Company and other defendants filed a motion to dismiss the SDNY Derivative Action due to plaintiffs’ failure to plead facts demonstrating that the Board’s decision to refuse plaintiffs’ pre-suit demands was wrongful and not a protected
VEREIT, INC. and VEREIT OPERATING PARTNERSHIP, L.P.
NOTES TO CONSOLIDATED FINANCIAL STATEMENTS
December 31, 2018 – (Continued)
business judgment. On June 9, 2016, the court granted in part and denied in part the Company’s and other defendants’ motions to dismiss. Plaintiffs filed an amended complaint on June 30, 2016, and the Company and other defendants filed answers to the amended complaint on July 22, 2016. Document productionDiscovery and summary judgment briefing in the Witchko Action is being coordinated with production in the SDNY Consolidated Securities Class Action.
On December 3, 2015, the Company was named as a nominal defendant and certain of its former officers and directors were named as defendants in a shareholder derivative action filed in the Circuit Court for Baltimore City in Maryland, Frampton v. Schorsch, et al., No. 24-C-15-006269 (the “Frampton Action”). The Frampton Action seeks money damages and other relief on behalf of the Company for, among other things, alleged breaches of fiduciary duty and contribution and indemnification. By order dated November 4, 2016, the Frampton Action was stayed pending resolution of the SDNY Derivative Action.
VEREIT, INC. AND VEREIT OPERATING PARTNERSHIP, L.P.
NOTES TO CONSOLIDATED FINANCIAL STATEMENTS
December 31, 2016 – (Continued)
On June 10, 2016, the Company was named as a nominal defendant, and certain of its former officers and directors, among others, were named as defendants, in a shareholder derivative action filed in the Supreme Court of the State of New York, Kosky v. Schorsch, et al., No. 653093/2016 (the “Kosky Action”). The Kosky Action seeks money damages and other relief on behalf of the Company for, among other things, alleged breaches of fiduciary duty, negligence, and breach of contract. On October 6, 2016, the parties filed a stipulation staying the Kosky Action until resolution of the SDNY Consolidated Securities Class Action.
On October 6, 2016, the Company was named as a nominal defendant, and certain of its former officers and directors, among others, were named as defendants, in a shareholder derivative action filed in the United States District Court for the District of Maryland, captioned Meloche v. Schorsch, et al., 16-cv-03366 (the “Meloche Action”). An amended complaint was filed on January 17, 2017. The Meloche Action seeks money damages and other relief on behalf of the Company for alleged breaches of fiduciary duty and negligence. The Company is requiredBy order dated May 16, 2017, the Meloche Action was stayed until resolution of the SDNY Derivative Action.
There can be no assurance as to respond towhether or how the amended complaint by March 24, 2017.
completed settlements may affect any potential future resolution of any other pending lawsuit or claims, the timing of any such resolution, or the amount at which any other matter may be resolved. The Company has not reserved amounts for any of the litigation orSEC investigation, mattersthe on-going class action and the remaining opt out action discussed above either because it has not concluded that a loss is probable in the matter or because it believes that any probable loss or reasonably possible range of loss is not reasonably estimable at this time. TheWith respect to the class action specifically, which represents substantially all of the remaining shares with alleged claims, although the Company believes a loss is probable, it is currently unable to reasonably estimate a possible range of reasonably possible loss because these matters involvethe litigation involves significant uncertainties, including, but not limited to, the complexity of the facts, and the legal theorytheories and the nature of the claims.
CapLease Litigation Matters
Followingclaims, the announcementinformation to be produced in discovery, which has not yet concluded, the applicable methodology for determining any damages for each of the merger agreement with CapLease in May 2013, a numberdifferent types of lawsuits were filed by CapLease stockholders, with only one action remaining pending:
On June 25, 2013, a putative class action and derivative lawsuit was filed inclaims, the Circuit Court for Baltimore City against the Company, the OP, CapLease, andextent to which members of the CapLease board of directors, among others, captioned Tarver v. CapLease, Inc., et al., No. 24-C-13-004176 (the “Tarver Action”). The complaint alleged, among other things, that the merger agreement was the product of breaches of fiduciary duty by the CapLease directors because the transaction purportedly didclass would or would not provide for full and fair value for the CapLease shareholders and was not the result offile a competitive bidding process, the merger agreement allegedly contained coercive deal protection measuresclaim, and the merger was purportedly approved as a result of improper self-dealing by certain defendants who would receive certain alleged employment compensation benefits and continued employment pursuant to the merger agreement. In August 2013, counsel in the Tarver Action filed a motion for a stay in the Baltimore Court, informing the court that the plaintiff had agreed to join and participate in the prosecution of other actions concerning the CapLease transaction then pendinguncertainty inherent in a New York court (which were subsequently dismissed).class action where the trading history and other relevant characteristics of the claimants are not currently known. The stay was granted byultimate resolution of all of these matters, the Baltimore Courttiming and substance of which is unknown, may materially impact the parties have engaged in no subsequent activity in the Tarver Action. Consequently, the Tarver Action has been dismissed without prejudice for lackCompany’s business, financial condition, liquidity and results of prosecution.operations.
Cole Litigation Matter
In December 2013, Realistic Partners filed a putative class action lawsuit against the Company and the then-members of its board of directors in the Supreme Court for the State of New York, captioned Realistic Partners v. American Realty Capital Partners, et al., No. 654468/2013. Cole was later added as a defendant. The plaintiff alleged, among other things, that the board of the Company breached its fiduciary duties in connection with the transactions contemplated under the Cole Merger Agreement (in connection with the merger between a wholly owned subsidiary of Cole Credit Property Trust III, Inc. and Cole Holdings Corporation) and that Cole Credit Property Trust III, Inc. aided and abetted those breaches. In January 2014, the parties entered into a memorandum of understanding regarding settlement of all claims asserted on behalf of the alleged class of the Company’s stockholders. The proposed settlement terms required the Company to make certain additional disclosures related to the Cole Merger, which were included in a Current Report on Form 8-K filed by the Company with the SEC on January 17, 2014. The memorandum of understanding also contemplated that the parties would enter into a stipulation of settlement, which would be subject to customary conditions, including confirmatory discovery and court approval following notice to the Company’s stockholders, and provided that the defendants would not object to a payment of up to $625,000 for attorneys’ fees. If the parties enter into a stipulation of settlement, which has not occurred, a hearing will be scheduled at which the court will consider the fairness, reasonableness and adequacy of the settlement. There can be no assurance that the parties will enter into a stipulation of settlement, that the court will approve any proposed settlement, or that any eventual settlement will be under the same terms as those contemplated by the memorandum of understanding.
VEREIT, INC. ANDand VEREIT OPERATING PARTNERSHIP, L.P.
NOTES TO CONSOLIDATED FINANCIAL STATEMENTS
December 31, 20162018 – (Continued)
Contractual Lease Obligations
The following table reflects the minimum base rent payments due from the Company over the next five years and thereafter for certain ground lease obligations, which are substantially reimbursable by our tenants, and office lease obligations (in thousands):
| | | | | Future Minimum Base Rent Payments | | Future Minimum Base Rent Payments |
| | | Ground Leases | | Office Leases | | Ground Leases | | Office Leases |
| 2017 | | $ | 14,393 |
| | $ | 4,381 |
| |
| 2018 | | 14,217 |
| | 4,298 |
| |
| 2019 | | 14,069 |
| | 4,359 |
| | $ | 13,942 |
| | $ | 4,537 |
|
| 2020 | | 13,433 |
| | 4,381 |
| | 13,740 |
| | 4,451 |
|
| 2021 | | 12,662 |
| | 4,369 |
| | 13,542 |
| | 4,387 |
|
| 2022 | | | 13,699 |
| | 4,419 |
|
| 2023 | | | 14,077 |
| | 3,695 |
|
| Thereafter | | 212,000 |
| | 8,415 |
| | 196,369 |
| | 301 |
|
| Total | | $ | 280,774 |
| | $ | 30,203 |
| | $ | 265,369 |
| | $ | 21,790 |
|
Purchase Commitments
Cole CapitalThe Company enters into purchase and sale agreements and deposits funds into escrow towards the purchase of real estate assets, mostsome of which are expected to be assigned to one of the Cole REITs at or prior to the closing of the respective acquisition. As of December 31, 2016, Cole Capital2018, the Company was a party to eightfive purchase and sale agreements with unaffiliated third-party sellers to purchase a 100% interest in 20eight properties, subject to meeting certain criteria, for an aggregate purchase price of $489.1$81.7 million, exclusive of closing costs. As of December 31, 2016, Cole Capital2018, the Company had $3.7$1.1 million of property escrow deposits held by escrow agents in connection with these future property acquisitions, which may be forfeited if the transactions are not completed under certain circumstances. Cole CapitalIn accordance with the Services Agreement, the Company will be reimbursed by the assigned Cole REIT for amounts escrowed when the property is assigned to the respective Cole REIT.
Environmental Matters
In connection with the ownership and operation of real estate, the Company may potentially be liable for costs and damages related to environmental matters. The Company has not been notified by any governmental authority of any non-compliance, liability or other claim, and is not aware of any other environmental condition, in each case, that it believes will have a material adverse effect on the results of operations.
Note 1611 – Equity
Common Stock and General Partner OP Units
The General Partner is authorized to issue up to 1.5 billion shares of Common Stock. As of December 31, 2016,2018, the General Partner had approximately 974.1967.5 million shares of Common Stock issued and outstanding.
Additionally, the Operating Partnership had approximately 974.1967.5 million General Partner OP Units issued and outstanding as of December 31, 2016,2018, corresponding to the General Partner’s outstanding shares of Common Stock.
Common Stock Offerings
On August 10, 2016, the Company issued 69.0 million shares of Common Stock in a public offering for net proceeds, after underwriting discounts and offering costs, of $702.5 million, which were used in part to repay the 2016 Term Loan and amounts under the Credit Facility. Concurrently, the Operating Partnership issued the General Partner 69.0 million General Partner OP Units.
On May 28, 2014, the General Partner closed on a public offering of 138.0 million shares of Common Stock. The net proceeds to the General Partner were $1.6 billion after deducting underwriting discounts, commissions and offering-related expenses. Concurrently, the Operating Partnership issued the General Partner 138.0 million General Partner OP Units.
Common Stock Continuous Offering Program
On September 19, 2016, the Company registered a continuous equity offering program (the “Program”) pursuant to which the Company can offer and sell, from time to time through September 19, 2019 in “at-the-market” offerings or certain other
VEREIT, INC. AND VEREIT OPERATING PARTNERSHIP, L.P.
NOTES TO CONSOLIDATED FINANCIAL STATEMENTS
December 31, 2016 – (Continued)
transactions, shares of Common Stock with an aggregate gross sales price of up to $750.0 million, through its sales agents. As of December 31, 2016,2018, no shares of Common Stock have been issued pursuant to the Program.
Preferred Stock and Preferred OP Units
Series D Preferred Stock
During the year ended December 31, 2013, the Company issued approximately 21.7 million shares of convertible preferred stock (“Series D Preferred Stock”) and 15.1 million shares of common stock, for gross proceeds of $288.0 million and $186.0 million, respectively. The Company redeemed all outstanding Series D Preferred Stock and a corresponding number of Series D Preferred Units during the year ended December 31, 2014 for $316.1 million in cash.
Prior to the redemption, the Company concluded that the conversion option qualified as a derivative and should be bifurcated from the host instrument. At redemption, the Company recorded a loss of $13.6 million in relation to the conversion option in loss on derivative instruments, net in the consolidated statement of operations for the year ended December 31, 2014.
Series F Preferred Stock
As of December 31, 2016, the General Partner had2018, there were approximately 42.8 million shares of Series F Preferred Stock and(and approximately 42.8 million corresponding General Partner Series F Preferred UnitsUnits) and 86,874 Limited Partner Series F Preferred Units issued and outstanding.
The Series F Preferred Stock pays cumulative cash dividends at the rate of 6.70% per annum on their liquidation preference of $25.00 per share (equivalent to $1.675 per share on an annual basis). The Series F Preferred Stock iswas not redeemable by the
VEREIT, INC. and VEREIT OPERATING PARTNERSHIP, L.P.
NOTES TO CONSOLIDATED FINANCIAL STATEMENTS
December 31, 2018 – (Continued)
Company before January 3, 2019, the fifth anniversary of the date on which such Series F Preferred Stock was issued (the “Initial Redemption Date”), except under circumstances intended to preserve the General Partner’s status as a REIT for federal and/or state income tax purposes and except upon the occurrence of a change of control. On and after the Initial Redemption Date, the General Partner may, at its option, redeem shares of the Series F Preferred Stock, in whole or from time to time in part, at a redemption price of $25.00 per share plus, subject to exceptions, any accrued and unpaid dividends thereon to the date fixed for redemption. The shares of Series F Preferred Stock have no stated maturity, are not subject to any sinking fund or mandatory redemption and will remain outstanding indefinitely unless the General Partner redeems or otherwise repurchases them or they become convertible and are converted into Common Stock (or, if applicable, alternative consideration). The Series F Preferred Stock trades on the NYSE under the symbol “VER PRF”.VER PRF. The Series F Preferred Units contain the same terms as the Series F Preferred Stock.
For federal income tax purposes, distributions to stockholders are characterized as ordinary dividends, capital gain distributions, or nontaxable distributions. Nontaxable distributions will reduce U.S stockholders’ basis (but not below zero) in their shares. The following table shows the character of the Series F Preferred Stock distributions paid on a percentage basis for the years ended December 31, 2016, 20152018, 2017 and 2014:2016:
| | | | | Year Ended December 31, | | Year Ended December 31, |
| | | 2016 | | 2015 | | 2014 | | 2018 | | 2017 | | 2016 |
| Ordinary dividends | | 95.0 | % | | 75.9 | % | | 100.0 | % | | 100.0 | % | | 95.0 | % | | 95.0 | % |
| Nontaxable distributions | | — | % | | — | % | | — | % | |
| Capital gain distributions | | 5.0 | % | | 24.1 | % | | — | % | | — | % | | 5.0 | % | | 5.0 | % |
| Total | | 100 | % | | 100 | % |
| 100 | % | | 100 | % | | 100 | % | | 100 | % |
Limited Partner OP Units
As of December 31, 2016,2018 the Operating Partnership had approximately 23.75 million Limited Partner OP Units outstanding, following the conversion of 15,450 Limited Partner OP Units, owned by a party unaffiliated with the Former Manager, into shares of the Company's Common Stock pursuant to the terms of the LPA. As of December 31, 2015, the Operating Partnership had approximately 23.7623.7 million Limited Partner OP Units outstanding.
As of December 31, 2016,2018, the Company has received redemption requests totaling approximately 13.1 million Limited Partner OP Units from certain affiliates of the Former Manager, which would have been redeemable for a corresponding number of common shares.shares of Common Stock. The Company believes it has potential claims against recipients of those OP Units and has engaged in discussions with affiliates of the Former Manager regarding the redemption requests. Pending any resolution, the Company does not currently intend to satisfy any of the redemption requests. In light of the potential claims, since October 15, 2015, the OP has not paid distributions in respect of a substantial portion of the outstanding Limited Partner OP Units when the Common Stock dividends were otherwise paid.
VEREIT, INC. AND VEREIT OPERATING PARTNERSHIP, L.P.
NOTES TO CONSOLIDATED FINANCIAL STATEMENTS
December 31, 2016 – (Continued)
Common Stock Dividends
On December 23, 2014, in connection with the amendments to the Credit Facility, theThe Company agreed to suspend the payment of dividends on its common stock until it complied with periodic financial reporting and related requirements. On March 30, 2015, the Company satisfied these financial statement and other information requirements and subsequently declared quarterly dividends to stockholders of record each quarter from the thirdfirst quarter of the year ended December 31, 20152016 through the third quarter of the year ended December 31, 20162018 of $0.1375 per share of common stockCommon Stock (representing an annualized dividend rate of $0.55 per share). The Company’s boardBoard of directorsDirectors declared a quarterly cash dividend of $0.1375 per share of common stockCommon Stock (equaling an annualized dividend rate of $0.55 per share) for the fourth quarter of 20162018 on November 1, 20165, 2018 to stockholders of record as of December 30, 2016,31, 2018, which was paid on January 17, 2017.15, 2019. An equivalent distribution by the Operating Partnership is applicable per OP unit.
For federal income tax purposes, distributions to stockholders are characterized as ordinary dividends, capital gain distributions, or nontaxable distributions. Nontaxable distributions will reduce U.S stockholders’ basis (but not below zero) in their shares. The following table shows the character of the common stockCommon Stock distributions paid on a percentage basis for the years ended December 31, 2016, 20152018, 2017 and 2014:2016:
| | | | | Year Ended December 31, | | Year Ended December 31, |
| | | 2016 | | 2015 | | 2014 | | 2018 | | 2017 | | 2016 |
| Ordinary dividends | | 95.0 | % | | 75.9 | % | | 6.0 | % | | 13.8 | % | | 60.0 | % | | 95.0 | % |
| Nontaxable distributions | | — | % | | — | % | | 94.0 | % | |
| Nondividend distributions | | | 86.2 | % | | 37.0 | % | | — | % |
| Capital gain distributions | | 5.0 | % | | 24.1 | % | | — | % | | — | % | | 3.0 | % | | 5.0 | % |
| Total | | 100 | % |
| 100 | % | | 100 | % | | 100 | % | | 100 | % | | 100 | % |
VEREIT, INC. and VEREIT OPERATING PARTNERSHIP, L.P.
NOTES TO CONSOLIDATED FINANCIAL STATEMENTS
December 31, 2018 – (Continued)
Share Repurchase Program
On May 12, 2017, the Company’s Board of Directors authorized the repurchase of up to $200.0 million of the Company’s outstanding Common Stock over the subsequent 12 months, as market conditions warranted (the “2017 Share Repurchase Program”). On May 3, 2018, the Company’s Board of Directors terminated the 2017 Share Repurchase Program and authorized a new program (the “2018 Share Repurchase Program,” collectively with the 2017 Share Repurchase Program, the “Share Repurchase Programs”) that permits the Company to repurchase up to $200.0 million of its outstanding Common Stock through May 3, 2019, as market conditions warrant. Repurchases can be made through open market purchases, privately negotiated transactions, structured or derivative transactions, including accelerated stock repurchase transactions, or other methods of acquiring shares in accordance with applicable securities laws and other legal requirements. The Share Repurchase Programs do not obligate the Company to make any repurchases at a specific time or in a specific situation. Repurchases are subject to prevailing market conditions, the trading price of the stock, the Company’s financial performance and other conditions. Shares of Common Stock repurchased by the Company under the Share Repurchase Programs, if any, will be returned to the status of authorized but unissued shares of Common Stock.
During the period from May 12, 2017 through December 31, 2017, the Company repurchased approximately 69,000 shares of Common Stock in multiple open market transactions, at a weighted average share price of $7.50 for an aggregate purchase price of $0.5 million as part of the 2017 Share Repurchase Program. During the period from January 1, 2018 through May 2, 2018, the Company repurchased approximately 6.4 million shares of Common Stock in multiple open market transactions, at a weighted average share price of $6.94 for an aggregate purchase price of $44.6 million, for a total of $45.1 million of shares repurchased as part of the 2017 Share Repurchase Program.
From May 3, 2018 through December 31, 2018, the Company repurchased approximately 0.8 million shares of Common Stock in multiple open market transactions, at a weighted average share price of $6.95 for an aggregate purchase price of $5.6 million as part of the 2018 Share Repurchase Program, which are currently deemed to be authorized but unissued shares of Common Stock. As of December 31, 2018, the Company had $194.4 million available for share repurchases under the 2018 Share Repurchase Program.
Common Stock Repurchases to Settle Tax Obligations
Under the General Partner’s Equity Plan (defined below)(as defined in Note 12 – Equity-based Compensation), individualsparticipants have the option to have the General Partner repurchase shares vesting from awards made under the Equity Plan in order to satisfy the minimum federal and state tax withholding obligations. During the year ended December 31, 2016,2018, the General Partner repurchased 481,261approximately 0.3 million shares to satisfy the federal and state tax withholding obligations on behalf of individuals.employees that made this election.
Note 1712 – Equity-based Compensation
Equity PlanPlans
The General Partner has adopted an equityequity-based incentive award plan (the “Equity Plan”), which provides for the grant of stock options (“Stock Options”), stock appreciation rights, restricted shares of Common Stock (“Restricted Shares”), restricted stock units (“Shares, Restricted Stock Units”), deferred stock units (“Units, Deferred Stock Units”),Units, dividend equivalent rights and other stock-based awards to the General Partner’s and its affiliates’ non-executive directors, officers, and other employees and advisors or consultants who provide services to the General Partner or its affiliates. To date,Company, as applicable, and a non-executive director restricted share plan, which are accounted for under U.S. GAAP for share-based payments. The expense for such awards is recognized over the General Partner has granted fully vested shares of Common Stock, Restricted Shares, Restricted Stock Units and Deferred Stock Units under the Equity Plan.requisite service period. Restricted Shares provide for rights identical to those of Common Stock. Restricted Stock Units do not provide for any rights of a common stockholder prior to the vesting of such Restricted Stock Units. In accordance with U.S. GAAP, Restricted Shares are considered issued and outstanding. As is the case when fully vested shares of Common Stock are issued from the Equity Plan, for each Restricted Share awarded under the Equity Plan, the Operating Partnership issues a General Partner OP Unit to the General Partner with identical terms. Upon vesting or settlement of Restricted Stock Units or Deferred Stock Units, respectively, the Operating Partnership issues a General Partner OP Unit to the General Partner for each share of Common Stock issued as a result of such vesting.
VEREIT, INC. and VEREIT OPERATING PARTNERSHIP, L.P.
NOTES TO CONSOLIDATED FINANCIAL STATEMENTS
December 31, 2018 – (Continued)
The General Partner has authorized and reserved a total number of shares equal to 10.0% of the total number of issued and outstanding shares of Common Stock (on a fully diluted basis assuming the redemption of all OP Units for shares of Common Stock) to be issued at any time under the Equity Plan for equity incentive awards. As of December 31, 2016,2018, the General Partner had cumulatively awarded under its Equity Plan approximately 4.14.0 million Restricted Shares, net of the forfeiture of 3.63.7 million Restricted Shares through that date, 3.45.3 million Restricted Stock Units, net of the forfeitureforfeiture/cancellation of 0.51.8 million Restricted Stock Units through that date, and 0.20.5 million Deferred Stock Units, and 2.8 million Stock Options, net of forfeiture/cancellation of approximately 40,000 Stock Options through that date, collectively representing approximately 7.712.5 million shares of Common Stock. Accordingly, as of such date, approximately 92.186.6 million additional shares were available for future issuance.
VEREIT, INC. AND VEREIT OPERATING PARTNERSHIP, L.P.
NOTES TO CONSOLIDATED FINANCIAL STATEMENTS
At December 31, 2016 – (Continued)
During2018, a total of 45,000 shares were awarded under the years ended December 31, 2015 and 2014, the General Partner awarded 5,634 and 165,838 shares of Common Stock, respectively. The fair valuenon-executive director restricted share plan out of the awards was determined using the closing stock price on the grant date and expensed in full on the grant date. The Company recorded $0.1 million and $2.0 million of compensation expense related to the awards99,000 shares reserved for the years ended December 31, 2015 and 2014, respectively, which is recorded in general and administrative expense in the accompanying consolidated statements of operations. No such shares of Common Stock were awarded during the year ended December 31, 2016.issuance.
Restricted Shares
The Company has issued Restricted Shares to certain employees and non-executive directors beginning in 2011. In addition, the Company issued Restricted Shares to employees of affiliates of the Former Manager prior to 2015. The fair value of the Restricted Shares granted to employees under the Equity Plan is generally determined using the closing stock price on the grant date and is expensed over the requisite service period on a straight-line basis. The fair value of Restricted Shares granted to non-executive directors and employees of affiliates of the Former Manager under the Equity Plan was measured based upon the fair value of goods or services received or the equity instruments granted, whichever was more reliably determinable, and was expensed in full at the date of grant.
During the years ended December 31, 2016, 20152018, 2017 and 20142016, the Company recorded $2.7$0.6 million, $3.9$2.0 million and $29.7$2.7 million, respectively, of compensation expense related to the Restricted Shares, which is recorded in general and administrative expense in the accompanying consolidated statements of operations.Shares. As of December 31, 2016,2018, there was $3.6$0.1 million of unrecognized compensation expense related to the Restricted Shares with a weighted-average remaining term of 1.90.1 years.
The following table details the activity of the Restricted Shares during the year ended December 31, 2016:2018:
|
| | | | | | | |
| | | Restricted Shares | | Weighted-Average Grant Date Fair Value |
| Unvested shares, December 31, 2014 | | 2,684,062 |
| | $ | 13.84 |
|
| Granted | | 4,010 |
| | 9.76 |
|
| Vested | | (989,621 | ) | | 13.88 |
|
| Forfeited | | (458,789 | ) | | 13.68 |
|
| Unvested shares, December 31, 2015 | | 1,239,662 |
| | $ | 13.86 |
|
| Granted | | — |
| | — |
|
| Vested | | (586,863 | ) | | $ | 13.91 |
|
| Forfeited | | (90,393 | ) | | $ | 14.08 |
|
| Unvested shares, December 31, 2016 | | 562,406 |
| | $ | 13.78 |
|
|
| | | | | | | |
| | | Restricted Shares | | Weighted-Average Grant Date Fair Value |
| Unvested shares, December 31, 2017 | | 234,428 |
| | $ | 13.98 |
|
| Vested | | (159,210 | ) | | 13.97 |
|
| Forfeited | | (4,218 | ) | | 13.66 |
|
| Unvested shares, December 31, 2018 | | 71,000 |
| | $ | 14.04 |
|
Time-Based Restricted Stock Units
Under the Equity Plan, the Company may award Restricted Stock Units to employees that will vest if the recipient maintains his/her employment over the requisite service period (the “Time-Based Restricted Stock Units”). The fair value of the Time-Based Restricted Stock Units granted to employees under the Equity Plan is generally determined using the closing stock price on the grant date and is expensed over the requisite service period on a straight-line basis, which is generally three years. During the years ended December 31, 20162018, 2017 and 2015,2016, the Company recorded $3.4$5.1 million, $6.3 million and $1.8$3.4 million, respectively, of compensation expense related to the Time-Based Restricted Stock Units, which is recorded in general and administrative expense in the accompanying consolidated statements of operations. No Time-based Restricted Stock Units were awarded during the year ended December 31, 2014.Units. As of December 31, 2016,2018, there was $6.3$5.6 million of unrecognized compensation expense related to the Time-Based Restricted Stock Units with a weighted-average remaining term of 1.8 years.
VEREIT, INC. AND VEREIT OPERATING PARTNERSHIP, L.P.
NOTES TO CONSOLIDATED FINANCIAL STATEMENTS
December 31, 2016 – (Continued)
General and Administrative Expenses
2018 vs 2017 – The increase of $5.3 million during the year ended December 31, 2018 as compared to the same period in 2017 was primarily due to an increase of $5.5 million of compensation and benefits, including equity-based compensation.
2017 vs 2016 – The increase of $6.7 million during the year ended December 31, 2017 as compared to the same period in 2016 was primarily due to an increase of $6.8 million of compensation and benefits, including equity-based compensation.
Depreciation and Amortization Expenses
2018 vs 2017 – The decrease of $66.2 million during the year ended December 31, 2018 as compared to the same period in 2017 was primarily due to furniture and fixtures that were fully depreciated during 2017 and 2018, as they had reached the end of their useful lives.
2017 vs 2016 – The decrease of $55.2 million during the year ended December 31, 2017 as compared to the same period in 2016 was primarily related to the disposition of 438 consolidated properties subsequent to January 1, 2016. The Company also recorded $50.5 million and $182.8 million of impairment charges on real estate investments during the years ended December 31, 2017 and 2016, respectively, which reduced the carrying value being depreciated and amortized.
Impairments
2018 vs 2017 – The increase in impairments of $4.1 million during the year ended December 31, 2018 as compared to the same period in 2017 was primarily attributable to management’s change in strategy related to certain retail properties which management determined, based on discussions with the current tenants, will not be re-leased, offset by a decrease in impairments related to industrial properties. The Company impaired 70 properties during the year ended December 31, 2018 as compared to 69 properties during the year ended December 31, 2017.
2017 vs 2016 – The decrease in impairments of $132.3 million during the year ended December 31, 2017 as compared to the same period in 2016 was primarily due to a decrease in the number of properties impaired from 153 properties during the year ended December 31, 2016 to 69 properties during the year ended December 31, 2017. In addition, the decrease was also due to management identifying certain properties for potential sale as part of its portfolio management strategy to reduce exposure to office properties during the year ended December 31, 2016 as well as the Chapter 11 bankruptcy filed by Ovation Brands, Inc. during 2016.
Other (Expense) Income, Provision for Income Taxes and Income (Loss) from Discontinued Operations
The table below sets forth, for the periods presented, certain financial information and the dollar amount change year over year (dollar amounts in thousands):
|
| | | | | | | | | | | | | | | | | | | | |
| | | Year Ended December 31, |
| | | 2018 | | 2017 | | 2016 | | 2018 vs 2017
Increase/(Decrease) | | 2017 vs 2016
Increase/(Decrease) |
| Interest expense | | $ | (280,887 | ) | | $ | (289,766 | ) | | $ | (317,376 | ) | | $ | (8,879 | ) | | $ | (27,610 | ) |
| Gain (loss) on extinguishment and forgiveness of debt, net | | 5,360 |
| | 18,373 |
| | (771 | ) | | (13,013 | ) | | 19,144 |
|
| Other income, net | | 14,735 |
| | 6,242 |
| | 5,251 |
| | 8,493 |
| | 991 |
|
| Equity in income and gain on disposition of unconsolidated entities | | 1,869 |
| | 2,763 |
| | 9,783 |
| | (894 | ) | | (7,020 | ) |
| Gain (loss) on derivative instruments, net | | 355 |
| | 2,976 |
| | (1,191 | ) | | (2,621 | ) | | 4,167 |
|
| Gain on disposition of real estate and real estate assets held for sale, net | | 94,331 |
| | 61,536 |
| | 45,524 |
| | 32,795 |
| | 16,012 |
|
| Provision for income taxes | | (5,101 | ) | | (6,882 | ) | | (7,136 | ) | | (1,781 | ) | | (254 | ) |
| Income (loss) from discontinued operations, net of income taxes | | 3,695 |
| | (19,117 | ) | | (123,937 | ) | | 22,812 |
| | 104,820 |
|
Interest Expense
2018 vs 2017 – The decrease of $8.9 million during the year ended December 31, 2018 as compared to the same period in 2017 was primarily due to the repayment of the 2018 Convertible Notes of $597.5 million and a $153.9 million reduction of secured debt, partially offset by the issuance of $550.0 million of the 2025 Senior Notes and an increase in net borrowings under the credit facilities of $218.0 million. In addition, there was a decrease in amortization of deferred financing costs of $3.1 million related to the credit facilities during the year ended December 31, 2018 as compared to the same period in 2017, which was due to lower deferred financing costs incurred in connection with the entrance into the Credit Agreement during the year ended December 31, 2018 as compared to the deferred financing costs incurred in connection with the 2014 Credit Agreement.
2017 vs 2016 – The decrease of $27.6 million during the year ended December 31, 2017 as compared to the same period in 2016 was primarily due to a $579.9 million reduction of secured debt, partially offset by the issuance of $600.0 million of Senior Notes and a reduction in net borrowings under the credit facilities of $315.0 million.
Gain (Loss) on Extinguishment and Forgiveness of Debt, Net
2018 vs 2017 – Gain (loss) on extinguishment and forgiveness of debt, net decreased $13.0 million during the year ended December 31, 2018 as compared to the same period in 2017. During the year ended December 31, 2018, the Company entered into a deed-in-lieu of foreclosure agreement with the lender of a mortgage loan, secured by one property, which resulted in a gain on forgiveness of debt of $5.2 million. During the same period in 2017, the Company entered into deed-in-lieu of foreclosure agreements with the lenders of three mortgage loans, secured by six properties, which resulted in a gain on forgiveness of debt of $20.5 million, which was offset by the write-off of $2.0 million of deferred financing costs related to the termination of the 2014 Credit Agreement.
2017 vs 2016 – Gain (loss) on extinguishment and forgiveness of debt, net increased $19.1 million during the year ended December 31, 2017 as compared to the same period in 2016. During the year ended December 31, 2017, the Company entered into deed-in-lieu of foreclosure agreements with the lenders of three mortgage loans, secured by six properties, which resulted in a gain on forgiveness of debt of $20.5 million. There were no comparable transactions resulting in gains on forgiveness of debt during the year ended December 31, 2016.
Other Income, Net
2018 vs 2017 – The increase of $8.5 million during the year ended December 31, 2018 as compared to the same period in 2017 was primarily due to a $5.1 million gain on measuring the Company’s investments in the Cole REITs at fair value after the investments were no longer accounted for using the equity method, $4.8 million received related to a fully reserved loan receivable and a gain of $1.7 million related to the sale of three mortgage notes, offset by a loss of $2.2 million related to the sale of six CMBS and a reduction of $1.2 million in 1031 real estate program revenues during the year ended December 31, 2018.
2017 vs 2016 – The increase of $1.0 million during the year ended December 31, 2017 as compared to the same period in 2016 was primarily due to post-closing adjustments of $1.6 million, recorded in accordance with the purchase and sale agreement during the year ended December 31, 2016, related to a multi-tenant asset portfolio sale completed in 2014, offset by a decrease in interest income related to the Company’s investment securities and mortgage notes receivable of $0.6 million.
Equity in Income and Gain on Disposition of Unconsolidated Entities
2018 vs 2017 – Equity in income and gain on disposition of unconsolidated entities decreased $0.9 million during the year ended December 31, 2018 as compared to the same period in 2017. During the year ended December 31, 2018, the Company recorded a $0.7 million gain on the disposition and liquidation of one property owned by an unconsolidated joint venture. During the year ended December 31, 2017, the Company recorded a $1.9 million gain on the disposition of one land parcel owned by one unconsolidated joint venture.
2017 vs 2016 – Equity in income and gain on disposition of unconsolidated entities decreased $7.0 million during the year ended December 31, 2017 as compared to the same period in 2016. During the year ended December 31, 2017, the Company recorded a gain of $1.9 million related to the disposition of one land parcel owned by one unconsolidated joint venture. During the year ended December 31, 2016, the Company recorded a gain of $10.2 million related to the disposition of one unconsolidated joint venture owning one property.
Gain (Loss) on Derivative Instruments, Net
2018 vs 2017 – The $2.6 million decrease during the year ended December 31, 2018 as compared to the same period in 2017, was primarily a result of the termination of 13 derivative instruments with an aggregate notional value of $662.4 million and the de-designation of one derivative instrument with a notional value of $27.8 million during 2017.
2017 vs 2016 – The $4.2 million increase during the year ended December 31, 2017 as compared to the same period in 2016, was primarily the result of the termination of six interest rate swaps in connection with the early repayment of the outstanding borrowings under the 2014 Credit Agreement, which resulted in a gain of $1.1 million as compared to a loss of $3.3 million in 2016.
Gain on Disposition of Real Estate and Real Estate Assets Held For Sale, Net
2018 vs 2017 – The increase in gain on disposition of real estate and real estate assets held for sale, net of $32.8 million during the year ended December 31, 2018 as compared to the same period in 2017, was due to the Company’s disposition of 148 properties, excluding one property conveyed to the lender in a deed-in-lieu of foreclosure transaction, for an aggregate sales price of $526.4 million which resulted in a gain of $96.2 million during the year ended December 31, 2018, as compared to the disposal of 131 properties, excluding six properties transferred to the lender in either a deed-in-lieu of foreclosure or foreclosure sale transaction, for an aggregate sales price of $594.9 million during the same period in 2017 for a gain of $64.7 million. During the year ended December 31, 2018, the Company also recognized a loss of $1.9 million related to assets classified as held for sale, as compared to a loss of $3.1 million during the same period in 2017.
2017 vs 2016 – The increase in gain on disposition of real estate and real estate assets held for sale, net of $16.0 million during the year ended December 31, 2017 as compared to the same period in 2016, was due to the Company’s disposition of 131 properties, excluding six properties transferred to the lender in either a deed-in-lieu of foreclosure or foreclosure sale transaction, for an aggregate sales price of $594.9 million which resulted in a gain of $64.7 million during the year ended December 31, 2017, as compared to the disposal of 301 properties for an aggregate sales price of $1.1 billion during the same period in 2016 for a gain of $50.6 million, which included $28.8 million of goodwill allocation related to the sales. During the year ended December 31, 2017, the Company also recognized a loss of $3.1 million related to assets classified as held for sale, as compared to a loss of $5.1 million during the same period in 2016.
Provision for Income Taxes
2018 vs 2017 – The consolidated provision for income taxes of $5.1 million for the year ended December 31, 2018 as compared to a provision of $6.9 million for the same period in 2017 reflects an overall decrease in expense attributable to the tax impact related to the gain on the sale of certain Canadian properties in 2017.
2017 vs 2016 – The consolidated provision for income taxes of $6.9 million for the year ended December 31, 2017 as compared to a provision of $7.1 million for the same period in 2016 reflects an overall decrease in expense attributable to higher state taxes in 2016 and tax on net income from properties held in and sold by a TRS in 2016, which were partially offset by tax on the gain on the sale of certain Canadian properties in 2017.
Income (Loss) from Discontinued Operations, Net of Income Taxes
2018 vs 2017 – The decrease in loss from discontinued operations, net of income taxes of $22.8 million during the year ended December 31, 2018 was primarily due to the completion of the sale of Cole Capital on February 1, 2018.
2017 vs 2016 – During the fourth quarter of 2017, the Company entered into a purchase and sale agreement to sell substantially all of the Cole Capital segment. The decrease in loss from discontinued operations, net of income taxes of $104.8 million during the year ended December 31, 2017 was primarily due to decreases in impairment of goodwill of $120.9 million, in general and administrative expenses of $18.8 million and in amortization of intangible assets of $11.7 million, partially offset by the loss recognized on classification as held for sale of $20.0 million and an increase in the provision for income taxes of $24.7 million. Revenues, net of reallowed fees and commissions increased $1.8 million for the year ended December 31, 2017, as compared to the year ended December 31, 2016.
Non-GAAP Measures
Our results are presented in accordance with U.S. GAAP. We also disclose certain non-GAAP measures, as discussed further below. Management uses these non-GAAP financial measures in our internal analysis of results and believes these measures are useful to investors for the reasons explained below. These non-GAAP financial measures should not be considered as substitutes for any measures derived in accordance with U.S. GAAP.
Funds from Operations and Adjusted Funds from Operations
Due to certain unique operating characteristics of real estate companies, as discussed below, the National Association of Real Estate Investment Trusts, Inc. (“Nareit”), an industry trade group, has promulgated a supplemental performance measure known as funds from operations (“FFO”), which we believe to be an appropriate supplemental performance measure to reflect the operating performance of a REIT. FFO is not equivalent to our net income or loss as determined under U.S. GAAP.
Nareit defines FFO as net income or loss computed in accordance with U.S. GAAP, excluding gains or losses from disposition of property, depreciation and amortization of real estate assets, impairment write-downs on real estate, and our pro rata share of FFO adjustments related to unconsolidated partnerships and joint ventures. We calculated FFO in accordance with Nareit’s definition described above.
In addition to FFO, we use adjusted funds from operations (“AFFO”) as a non-GAAP supplemental financial performance measure to evaluate the operating performance of the Company. AFFO, as defined by the Company, excludes from FFO non-routine items such as acquisition-related expenses, litigation, merger and other non-routine costs, net of insurance recoveries, held for sale loss on discontinued operations, net revenue or expense earned or incurred that is related to the Services Agreement we entered into with Cole Capital on February 1, 2018, gains or losses on sale of investment securities or mortgage notes receivable, legal settlements and insurance recoveries not in the ordinary course of business and payments received on fully reserved loan receivables. We also exclude certain non-cash items such as impairments of goodwill and intangible assets, straight-line rent, net of bad debt expense related to straight-line rent, net direct financing lease adjustments, gains or losses on derivatives, reserves for loan loss, gains or losses on the extinguishment or forgiveness of debt, non-current portion of the tax benefit or expense, equity-based compensation and amortization of intangible assets, deferred financing costs, premiums and discounts on debt and investments, above-market lease assets and below-market lease liabilities. We omit the impact of the Excluded Properties and related non-recourse mortgage notes from FFO to calculate AFFO. Management believes that excluding these costs from FFO provides investors with supplemental performance information that is consistent with the performance models and analysis used by management, and provides investors a view of the performance of our portfolio over time. AFFO allows for a comparison of the performance of our operations with other publicly-traded REITs, as AFFO, or an equivalent measure, is routinely reported by publicly-traded REITs, and we believe often used by analysts and investors for comparison purposes.
For all of these reasons, we believe FFO and AFFO, in addition to net income (loss), as defined by U.S. GAAP, are helpful supplemental performance measures and useful in understanding the various ways in which our management evaluates the performance of the Company over time. However, not all REITs calculate FFO and AFFO the same way, so comparisons with other REITs may not be meaningful. FFO and AFFO should not be considered as alternatives to net income (loss) and are not intended to be used as a liquidity measure indicative of cash flow available to fund our cash needs. Neither the SEC, Nareit, nor any other regulatory body has evaluated the acceptability of the exclusions used to adjust FFO in order to calculate AFFO and its use as a non-GAAP financial performance measure.
The table below presents FFO and AFFO for the years ended December 31, 2018, 2017 and 2016 (in thousands, except share and per share data) and includes both continuing operations, which primarily represent the Company's real estate operations, and discontinued operations, which represent substantially all of Cole Capital.
|
| | | | | | | | | | | | |
| | | Year Ended December 31, |
| | | 2018 | | 2017 | | 2016 |
| Net (loss) income | | $ | (88,030 | ) | | $ | 32,378 |
| | $ | (200,824 | ) |
| Dividends on non-convertible preferred stock | | (71,892 | ) | | (71,892 | ) | | (71,892 | ) |
| Gain on disposition of real estate assets and interests in unconsolidated joint ventures, net | | (95,034 | ) | | (61,536 | ) | | (55,722 | ) |
| Depreciation and amortization of real estate assets | | 637,097 |
| | 703,133 |
| | 756,315 |
|
| Impairment of real estate | | 54,647 |
| | 50,548 |
| | 182,820 |
|
| Proportionate share of adjustments for unconsolidated entities | | 1,278 |
| | 477 |
| | 2,719 |
|
| FFO attributable to common stockholders and limited partners | | 438,066 |
| | 653,108 |
| | 613,416 |
|
| Acquisition-related expenses | | 3,632 |
| | 3,402 |
| | 1,321 |
|
| Litigation, merger and other non-routine costs, net of insurance recoveries | | 290,309 |
| | 51,762 |
| | 3,884 |
|
| Impairment of goodwill and intangible assets | | — |
| | — |
| | 120,931 |
|
| Loss on disposition and held for sale loss on discontinued operations | | 1,815 |
| | 20,027 |
| | — |
|
| Payments received on fully reserved loans | | (4,792 | ) | | — |
| | — |
|
| Gain on investment securities and mortgage notes receivable | | (4,092 | ) | | (65 | ) | | — |
|
| (Gain) loss on derivative instruments, net | | (355 | ) | | (2,976 | ) | | 1,191 |
|
| Amortization of premiums and discounts on debt and investments, net | | (3,486 | ) | | (4,616 | ) | | (14,693 | ) |
| Amortization of above-market lease assets and deferred lease incentives, net of amortization of below-market lease liabilities | | 4,178 |
| | 5,366 |
| | 5,396 |
|
| Net direct financing lease adjustments | | 2,023 |
| | 2,093 |
| | 2,264 |
|
| Amortization and write-off of deferred financing costs | | 19,166 |
| | 24,536 |
| | 28,063 |
|
| Amortization of management contracts | | — |
| | 14,514 |
| | 26,171 |
|
Deferred and other tax (benefit) expense (1) | | (1,855 | ) | | 8,671 |
| | (10,136 | ) |
| (Gain) loss on extinguishment and forgiveness of debt, net | | (5,360 | ) | | (18,373 | ) | | 771 |
|
| Straight-line rent, net of bad debt expense related to straight-line rent | | (39,723 | ) | | (44,903 | ) | | (54,190 | ) |
| Equity-based compensation | | 12,417 |
| | 16,751 |
| | 10,728 |
|
| Other amortization and non-cash charges, net | | 1,446 |
| | 2,566 |
| | 5,296 |
|
| Proportionate share of adjustments for unconsolidated entities | | 36 |
| | 378 |
| | 1,044 |
|
| Adjustments for Excluded Properties | | 465 |
| | 6,528 |
| | — |
|
| AFFO attributable to common stockholders and limited partners | | $ | 713,890 |
| | $ | 738,769 |
| | $ | 741,457 |
|
| | | | | | | |
| Weighted-average shares of Common Stock outstanding - basic | | 969,092,268 |
| | 974,098,652 |
| | 931,422,844 |
|
Effect of Limited Partner OP Units and dilutive securities(2) | | 24,145,875 |
| | 24,059,312 |
| | 24,626,646 |
|
Weighted-average shares of Common Stock outstanding - diluted (3) | | 993,238,143 |
| | 998,157,964 |
| | 956,049,490 |
|
| | | | | | | |
| AFFO attributable to common stockholders and limited partners per diluted share | | $ | 0.72 |
|
| $ | 0.74 |
| | $ | 0.78 |
|
| |
| (1) | This adjustment represents the non-current portion of the provision for or benefit from income taxes in order to show only the current portion of the provision for or benefit from income taxes as an impact to AFFO. For the three months ended December 31, 2017, this adjustment is net of a current tax benefit due to the acceleration of a bonus compensation-related deduction to take advantage of the Company’s higher effective tax rate in 2017. As the Company already recognized the prior year bonus compensation-related tax deduction during the three months ended March 31, 2017, the acceleration of the 2018 benefit was not included in the computation of AFFO. |
| |
| (2) | Dilutive securities include unvested restricted shares of Common Stock, unvested restricted stock units and stock options. |
| |
| (3) | Weighted-average shares for all periods presented exclude the effect of the convertible debt as the Company would expect to settle the debt with cash and any shares underlying restricted stock units that are not issuable based on the Company’s level of achievement of certain performance targets through the respective reporting period. |
Liquidity and Capital Resources
General
Our principal liquidity needs for the next twelve months and beyond are to:
fund normal operating expenses;
fund capital expenditures, tenant improvements and leasing costs
meet debt service and principal repayment obligations, including balloon payments on maturing debt;
pay dividends;
pay litigation costs and expenses (including any settlements or judgments); and
fund property and/or common stock acquisitions.
We expect to be able to satisfy these obligations using one or more of the following sources:
cash flow from operations;
proceeds from real estate dispositions;
utilization of Credit Facility;
cash and cash equivalents balance;
issuance of VEREIT debt and equity securities; and
cash flow from insurance recoveries.
Continuous Equity Offering Program
On September 19, 2016, the Company registered a continuous equity offering program (the “Program”) pursuant to which the Company can offer and sell, from time to time through September 19, 2019 in “at-the-market” offerings or certain other transactions, shares of Common Stock with an aggregate gross sales price of up to $750.0 million, through its sales agents. The Company intends to use the proceeds from any sale of shares for general corporate purposes, which may include funding potential acquisitions and repurchasing or repaying outstanding indebtedness. As of December 31, 2018, no shares of Common Stock have been issued pursuant to the Program.
Share Repurchase Program
On May 3, 2018, the Company’s Board of Directors terminated the 2017 Share Repurchase Program and authorized the 2018 Share Repurchase Program, which permits the Company to repurchase up to $200.0 million of its outstanding Common Stock through May 3, 2019, as market conditions warrant. As of December 31, 2018, the Company had $194.4 million available for share repurchases under the 2018 Share Repurchase Program. Additional shares of Common Stock repurchased by the Company, if any, will be returned to the status of authorized but unissued shares of Common Stock.
Disposition Activity
As part of our effort to optimize our real estate portfolio by focusing on holding core assets, during the year ended December 31, 2018, we disposed of 149 properties, including one property conveyed to a lender in a deed-in-lieu of foreclosure transaction, and one property owned by an unconsolidated joint venture for an aggregate sales price of $560.5 million, of which our share was $521.4 million, resulting in consolidated proceeds of $502.3 million after repayment of the unconsolidated joint venture’s mortgage loan and closing costs. We expect to continue to explore opportunities to sell additional properties to provide us further financial flexibility and fund property acquisitions.
Credit Facility
Summary and Obligations
On May 23, 2018, the Company, as guarantor, and the Operating Partnership, as borrower, entered into a Credit Agreement with Wells Fargo Bank, National Association, as administrative agent, and the other lenders party thereto that allows for maximum borrowings of $2.9 billion, consisting of a $2.0 billion Revolving Credit Facility and a $900.0 million Credit Facility Term Loan, available through February 23, 2019, for up to four borrowings of delayed-draw term loans. As of December 31, 2018, the Revolving Credit Facility had an outstanding balance of $253.0 million and $150.0 million had been drawn on the Credit Facility Term Loan. In connection with entering into the Credit Agreement, the OP repaid all of the outstanding obligations under the 2014 Credit Agreement.
The Revolving Credit Facility generally bears interest at an annual rate of London Inter-Bank Offer Rate (“LIBOR”) plus 0.775% to 1.55% or Base Rate plus 0.00% to 0.55% (based upon the General Partner’s then current credit rating). “Base Rate” is defined as the highest of the prime rate, the federal funds rate plus 0.50% or a floating rate based on one month LIBOR plus 1.0%, determined on a daily basis. The Credit Facility Term Loan generally bears interest at an annual rate of LIBOR plus 0.85% to 1.75%, or Base Rate plus 0.00% to 0.75% (based upon the General Partner’s then current credit rating). In addition, the Credit Agreement provides the flexibility for interest rate auctions, pursuant to which, at the Company’s election, the Company may request that lenders make competitive bids to provide revolving loans, which competitive bids may be at pricing levels that differ from the foregoing interest rates.
Credit Facility Covenants
The Credit Facility requires restrictions on corporate guarantees, as well as the maintenance of certain financial covenants. The key financial covenants in the Credit Facility, as defined and calculated per the terms of the Credit Agreement include maintaining the following:
|
| | |
| Unsecured Credit Facility Key Covenants | | Required |
| Ratio of total indebtedness to total asset value | | ≤ 60% |
| Ratio of adjusted EBITDA to fixed charges | | ≥ 1.5x |
| Ratio of secured indebtedness to total asset value | | ≤ 45% |
| Ratio of unsecured indebtedness to unencumbered asset value | | ≤ 60% |
| Ratio of unencumbered adjusted NOI to unsecured interest expense | | ≥ 1.75x |
The Company believes that it was in compliance with the financial covenants pursuant to the Credit Agreement and is not restricted from accessing any borrowing availability under the Credit Facility as of December 31, 2018.
Corporate Bonds
Summary and Obligations
During the year ended December 31, 2018, the Company closed the 2025 Senior Notes offering, consisting of $550.0 million aggregate principal amount of 4.625% Senior Notes due 2025. The OP used the net proceeds from the offering of the notes to repay borrowings under its Revolving Credit Facility.
As of December 31, 2018, the OP had $3.4 billion aggregate principal amount of Senior Notes outstanding, with a weighted-average maturity of 5.0 years. The indenture governing the Senior Notes requires that the Company be in compliance with certain key financial covenants, including maintaining the following:
|
| | |
| Corporate Bond Key Covenants | | Required |
| Limitation on incurrence of total debt | | ≤ 65% |
| Limitation on incurrence of secured debt | | ≤ 40% |
| Debt service coverage ratio | | ≥ 1.5x |
| Maintenance of total unencumbered assets | | ≥ 150% |
There were no material changes to the financial covenants of our Senior Notes during the year ended December 31, 2018. As of December 31, 2018, the Company believes that it was in compliance with these financial covenants based on the covenant limits and calculations in place at that time.
On February 6, 2019, the Company’s 2019 Senior Notes matured and the principal outstanding of $750.0 million, plus accrued and unpaid interest thereon, was repaid, utilizing borrowings under the Credit Facility.
Convertible Debt
Summary and Obligations
During the year ended December 31, 2018, the Company’s 2018 Convertible Notes matured and the principal outstanding of $597.5 million, plus accrued and unpaid interest thereon, was repaid with proceeds from the Revolving Credit Facility.
As of December 31, 2018, the Company had $402.5 million aggregate principal amount outstanding of convertible senior notes due December 15, 2020 (the “2020 Convertible Notes”). The OP has issued corresponding identical convertible notes to the General Partner. There were no changes to the terms of the 2020 Convertible Notes and the Company believes that it was in compliance with the financial covenants pursuant to the indenture governing the 2020 Convertible Notes as of December 31, 2018.
Mortgage Notes Payable and Other Debt
Summary and Obligations
As of December 31, 2018, we had non-recourse mortgage indebtedness of $1.9 billion, which was collateralized by 459 properties, reflecting a decrease from December 31, 2017 of $153.9 million derived primarily from our disposition activity during the year ended December 31, 2018. Our mortgage indebtedness bore interest at the weighted-average rate of 4.93% per annum and had a weighted-average maturity of 3.4 years. We may in the future incur additional mortgage debt on the properties we currently own or use long-term non-recourse financing to acquire additional properties.
The payment terms of our loan obligations vary. In general, only interest amounts are payable monthly with all unpaid principal and interest due at maturity. Some of our loan agreements require that we comply with specific reporting and financial covenants mainly related to debt coverage ratios and loan-to-value ratios. Each loan that has these requirements has specific ratio thresholds that must be met.
Restrictions on Loan Covenants
Our mortgage loan obligations generally restrict corporate guarantees and require the maintenance of financial covenants, including maintenance of certain financial ratios (such as specified debt to equity and debt service coverage ratios), as well as the maintenance of a minimum net worth. The mortgage loan agreements contain no dividend restrictions except in the event of default or when a distribution would drive liquidity below the applicable thresholds. At December 31, 2018, the Company believes that it was in compliance with the financial covenants under the mortgage loan agreements and had no restrictions on the payment of dividends.
Litigation
During the year ended December 31, 2018, we entered into settlement agreements with various plaintiffs in connection with litigation filed as a result of the findings of the Audit Committee Investigation for $217.5 million. The Company also entered into settlement agreements for $15.7 million subsequent to December 31, 2018, which was accrued and included in litigation, merger and other non-routine costs, net of insurance recoveries in the consolidated statements of operations for the year ended December 31, 2018.
Dividends
On November 5, 2018, the Company’s Board of Directors declared a quarterly cash dividend of $0.1375 per share of Common Stock (equaling an annualized dividend rate of $0.55 per share) for the fourth quarter of 2018 to stockholders of record as of December 31, 2018, which was paid on January 15, 2019. An equivalent distribution by the Operating Partnership is applicable per OP unit.
Our Series F Preferred Stock, as discussed in Note 11 – Equity to our consolidated financial statements, will pay cumulative cash dividends at the rate of 6.70% per annum on their liquidation preference of $25.00 per share (equivalent to $1.675 per share on an annual basis). As of December 31, 2018, there were approximately 42.8 million shares of Series F Preferred Stock (and approximately 42.8 million corresponding Series F Preferred Units that were issued to the General Partner) and 86,874 Limited Partner Series F Preferred Units that were issued and outstanding.
Contractual Obligations
The following is a summary of our contractual obligations as of December 31, 2018 (in thousands):
|
| | | | | | | | | | | | | | | | | | | | |
| | | Total | | Less than 1 year | | 1-3 years | | 4-5 years | | More than 5 years |
| Principal payments - mortgage notes | | $ | 1,917,132 |
| | $ | 167,279 |
| | $ | 617,957 |
| | $ | 459,741 |
| | $ | 672,155 |
|
Interest payments - mortgage notes (1) (2) | | 321,914 |
| | 93,710 |
| | 144,935 |
| | 80,830 |
| | 2,439 |
|
| Principal payments - Credit Facility | | 403,000 |
| | — |
| | — |
| | 403,000 |
| | — |
|
Interest payments - Credit Facility (2) | | 58,702 |
| | 15,918 |
| | 30,990 |
| | 11,794 |
| | — |
|
| Principal payments - corporate bonds | | 3,400,000 |
| | 750,000 |
| | 400,000 |
| | — |
| | 2,250,000 |
|
| Interest payments - corporate bonds | | 754,473 |
| | 120,075 |
| | 226,151 |
| | 202,776 |
| | 205,471 |
|
| Principal payments - convertible debt | | 402,500 |
| | — |
| | 402,500 |
| | — |
| | — |
|
| Interest payments - convertible debt | | 29,517 |
| | 15,094 |
| | 14,423 |
| | — |
| | — |
|
| Operating and ground lease commitments | | 287,159 |
| | 18,479 |
| | 36,120 |
| | 35,890 |
| | 196,670 |
|
Build-to-suit and other commitments (3) | | 30,343 |
| | 30,343 |
| | — |
| | — |
| | — |
|
| Total | | $ | 7,604,740 |
| | $ | 1,210,898 |
| | $ | 1,873,076 |
| | $ | 1,194,031 |
| | $ | 3,326,735 |
|
| |
| (1) | As of December 31, 2018, we had $50.7 million of variable rate mortgage notes effectively fixed through the use of interest rate swap agreements. We used the effective interest rates fixed under our swap agreements to calculate the debt payment obligations in future periods. |
| |
| (2) | Interest payments due in future periods on the $14.0 million of variable rate debt and the Credit Facility payment obligations were calculated using a forward LIBOR curve. |
| |
| (3) | Includes one build-to-suit development project and the Company’s share of capital expenditures related an expansion project of the property held within an unconsolidated joint venture. |
Cash Flow Analysis for the year ended December 31, 2018
Operating Activities –During the year ended December 31, 2018, net cash provided by operating activities decreased $299.4 million to $493.9 million from $793.3 million during the same period in 2017. The decrease was primarily due to an increase in litigation and other non-routine costs, including litigation settlements, paid during the year ended December 31, 2018. In addition, there was a decrease in interest payments due to the repayment of the 2018 Convertible Notes and a reduction of secured debt, offset by the issuance of the 2025 Senior Notes and an increase in net borrowings under the credit facilities during the year ended December 31, 2018 as compared to the same period in 2017.
Investing Activities –Net cash provided by investing activities for the year ended December 31, 2018 increased $425.2 million to $151.1 million from $274.1 million net cash used in investing activities during the same period in 2017. The increase was primarily related to a decrease in investments in real estate assets of $198.4 million, net proceeds from disposition of discontinued operations of $122.9 million and an increase in cash proceeds from dispositions of real estate and joint ventures of $56.8 million.
Financing Activities –Net cash used in financing activities of $655.4 million decreased $101.2 million during the year ended December 31, 2018 from $756.6 million during the same period in 2017. The decrease was primarily related to a decrease in payments on mortgage notes payable and other debt, including debt extinguishment costs of $286.5 million, which was partially offset by a decrease of $117.1 million in net proceeds related to the credit facilities, corporate bonds and convertible notes and repurchases of Common Stock under the Share Repurchase Programs of $50.2 million with no comparable repurchases during the same period in 2017.
Cash Flow Analysis for the year ended December 31, 2017
Operating Activities –During the year ended December 31, 2017, net cash provided by operating activities decreased $4.7 million to $793.3 million from $797.9 million during the same period in 2016. The decrease was primarily due to a decrease in rental receipts related to the disposition of 438 consolidated properties subsequent to January 1, 2016 and an increase in litigation and other non-routine costs paid during the year ended December 31, 2017. This decrease was mostly offset by a decrease in interest payments and insurance recoveries received as compared to the same period in 2016, the receipt of an income tax refund during the year ended December 31, 2017, and an increase in rental receipts related to the acquisition of 96 consolidated properties subsequent to January 1, 2016.
Investing Activities –Net cash used in investing activities for the year ended December 31, 2017 changed $1.2 billion to $274.1 million from cash provided by investing activities of $881.6 million during the same period in 2016. The change was primarily related to an increase in investments in real estate assets of $598.8 million and decrease in cash proceeds from dispositions of real estate and joint ventures of $555.2 million.
Financing Activities –Net cash used in financing activities of $756.6 million decreased $750.4 million during the year ended December 31, 2017 from $1.5 billion during the same period in 2016. The decrease was primarily due to a decrease in repayments of debt, net of proceeds, of $1.5 billion, which was partially offset by the 2016 Common Stock offering resulting in net proceeds, after underwriting discounts and offering costs, of $702.8 million and an increase in distributions paid of $28.1 million.
Election as a REIT
The General Partner elected to be taxed as a REIT for U.S. federal income tax purposes under Sections 856 through 860 of the Internal Revenue Code commencing with the taxable year ended December 31, 2011. We believe we are organized and operating in such a manner as to qualify to be taxed as a REIT for the taxable year ended December 31, 2018. As a REIT, the General Partner is generally not subject to federal income tax on taxable income that it distributes to its stockholders so long as it distributes at least 90% of its annual taxable income (computed without regard to the deduction for dividends paid and excluding net capital gains). However, the General Partner, its TRS entities, and the OP are still subject to certain state and local income, franchise and property taxes in the various jurisdictions in which they operate. The General Partner may also be subject to federal income taxes on certain income and excise taxes on its undistributed income.
The OP is classified as a partnership for U.S. federal income tax purposes. As a partnership, the OP is not a taxable entity for U.S. federal income tax purposes. Instead, each partner in the OP is required to include its allocable share of the OP’s income, gains, losses, deductions and credits for each taxable year. Under the LPA, the OP is to conduct business in such a manner as to permit the General Partner at all times to qualify as a REIT.
A TRS is a subsidiary of a REIT that is subject to federal, state and local income taxes, as applicable. The Company’s use of a TRS enables it to engage in certain business activities while complying with the REIT qualification requirements and to retain any income generated by these businesses for reinvestment without the requirement to distribute those earnings. The Company conducted substantially all of the Cole Capital business activities through a TRS until it sold the Cole Capital business on February 1, 2018.
During the year ended December 31, 2018, the Company conducted all of its business in the United States, Puerto Rico and Canada and filed income tax returns in the U.S. federal jurisdiction, the Canadian federal jurisdiction and various state and local jurisdictions. With few exceptions, the Company is no longer subject to routine examinations by taxing authorities for years before 2014. Certain of the Company’s intercompany transactions that have been eliminated in consolidation for financial accounting purposes are also subject to taxation.
Inflation
We may be adversely impacted by inflation on any leases that do not contain indexed escalation provisions. However, net leases that require the tenant to pay its allocable share of operating expenses, including common area maintenance costs, real estate taxes and insurance, may reduce our exposure to increases in costs and operating expenses resulting from inflation.
Related Party Transactions and Agreements
Through the closing of the Cole Capital sale, we were contractually responsible for managing the Cole REITs’ affairs on a day-to-day basis, identifying and making acquisitions and investments on the Cole REITs’ behalf, and recommending to each of the Cole REIT’s respective board of directors an approach for providing investors with liquidity. In addition, we distributed the shares of common stock for certain of the Cole REITs and advised them regarding offerings, managed relationships with participating broker-dealers and financial advisors, and provided assistance in connection with compliance matters relating to the offerings. We received compensation and reimbursement for services relating to the Cole REITs’ offerings and the investment, management and disposition of their respective assets, as applicable. See Note 13 –Related Party Transactions and Arrangements to our consolidated financial statements in this report for a further explanation of the various related party transactions, agreements and fees.
Off-Balance Sheet Arrangements
We have no material off-balance sheet arrangements that have had or are reasonably likely to have a current or future effect on our financial condition, changes in financial condition, revenues or expenses, results of operations, liquidity, capital expenditures or capital resources.
Item 7A. Quantitative and Qualitative Disclosures About Market Risk.
Market Risk
The market risk associated with financial instruments and derivative financial instruments is the risk of loss from adverse changes in market prices or interest rates. Our market risk arises primarily from interest rate risk relating to variable-rate borrowings. To meet our short and long-term liquidity requirements, we borrow funds at a combination of fixed and variable rates. Our interest rate risk management objectives are to limit the impact of interest rate changes on earnings and cash flows and to manage our overall borrowing costs. To achieve these objectives, from time to time, we may enter into interest rate hedge contracts such as swaps, collars and treasury lock agreements in order to mitigate our interest rate risk with respect to various debt instruments. We would not hold or issue these derivative contracts for trading or speculative purposes.
Interest Rate Risk
As of December 31, 2018, our debt included fixed-rate debt, including debt that has interest rates that are fixed with the use of derivative instruments, with a fair value and carrying value each of $5.7 billion. Changes in market interest rates on our fixed rate debt impact the fair value of the debt, but they have no impact on interest incurred or cash flow. For instance, if interest rates rise 100 basis points, and the fixed rate debt balance remains constant, we expect the fair value of our debt to decrease, the same way the price of a bond declines as interest rates rise. The sensitivity analysis related to our fixed-rate debt assumes an immediate 100 basis point move in interest rates from their December 31, 2018 levels, with all other variables held constant. A 100 basis point increase in market interest rates would result in a decrease in the fair value of our fixed rate debt of $201.3 million. A 100 basis point decrease in market interest rates would result in an increase in the fair value of our fixed-rate debt of $213.8 million.
As of December 31, 2018, our debt included variable-rate debt with a fair value of $417.2 million and a carrying value of $417.0 million. The sensitivity analysis related to our variable-rate debt assumes an immediate 100 basis point move in interest rates from their December 31, 2018 levels, with all other variables held constant. A 100 basis point increase or decrease in variable interest rates on our variable-rate debt would increase or decrease our interest expense by $4.2 million annually. See Note 7 –Debt to our consolidated financial statements.
As of December 31, 2018, our interest rate swap had a fair value that resulted in assets of $0.5 million. See Note 2 – Summary of Significant Accounting Policies to our consolidated financial statements for further discussion.
As the information presented above includes only those exposures that existed as of December 31, 2018, it does not consider exposures or positions arising after that date. The information presented herein has limited predictive value. Future actual realized gains or losses with respect to interest rate fluctuations will depend on cumulative exposures, hedging strategies employed and the magnitude of the fluctuations.
These amounts were determined by considering the impact of hypothetical interest rate changes on our borrowing costs and assume no other changes in our capital structure.
Credit Risk
Concentrations of credit risk arise when a number of tenants are engaged in similar business activities, or activities in the same geographic region, or have similar economic features that would cause their ability to meet contractual obligations, including those to the Company, to be similarly affected by changes in economic conditions. The Company is subject to tenant, geographic and industry concentrations. Any downturn of the economic conditions in one or more of these tenants, geographies or industries could result in a material reduction of our cash flows or material losses to us.
The factors considered in determining the credit risk of our tenants include, but are not limited to: payment history; credit status and change in status (credit ratings for public companies are used as a primary metric); change in tenant space needs (i.e., expansion/downsize); tenant financial performance; economic conditions in a specific geographic region; and industry specific credit considerations. We believe that the credit risk of our portfolio is reduced by the high quality of our existing tenant base, reviews of prospective tenants’ risk profiles prior to lease execution and consistent monitoring of our portfolio to identify potential problem tenants.
Item 8. Financial Statements and Supplementary Data.
The information required by Item 8 is hereby incorporated by reference to our consolidated financial statements beginning on page F-1 of this document.
Item 9. Changes in and Disagreements with Accountants on Accounting and Financial Disclosure.
None.
Item 9A. Controls and Procedures.
I. Discussion of Controls and Procedures of the General Partner
For purposes of the discussion in this Part I of Item 9A, the “Company” refers to the General Partner.
Evaluation of Disclosure Controls and Procedures
We maintain disclosure controls and procedures (as defined in Rules 13a-15(e) and 15d-15(e) of the Exchange Act that are designed to provide reasonable assurance that information required to be disclosed in our Exchange Act reports is recorded, processed, summarized and reported within the time periods specified in the SEC’s rules and forms, and that such information is accumulated and communicated to our management, including our Chief Executive Officer and Chief Financial Officer, as appropriate, to allow timely decisions regarding required disclosure. In designing and evaluating the disclosure controls and procedures, we recognize that no controls and procedures, no matter how well designed and operated, can provide absolute assurance of achieving the desired control objectives.
In accordance with Rules 13a-15(b) and 15d-15(b) of the Exchange Act, management, under the supervision and with the participation of our Chief Executive Officer and Chief Financial Officer, carried out an evaluation of the effectiveness of our disclosure controls and procedures as of December 31, 2018 and determined that the disclosure controls and procedures were effective at a reasonable assurance level as of that date.
Management’s Annual Report on Internal Control over Financial Reporting
Our management is responsible for establishing and maintaining adequate internal control over financial reporting, as such term is defined in Rules 13a-15(f) and 15d-15(f) under the Exchange Act. Internal control over financial reporting is a process to provide reasonable assurance regarding the reliability of our financial reporting and the preparation of financial statements for external purposes in accordance with GAAP. Because of its inherent limitations, internal control over financial reporting is not intended to provide absolute assurance that a misstatement of our financial statements would be prevented or detected.
Under the supervision and with the participation of our management, including our Chief Executive Officer and Chief Financial Officer, we conducted an evaluation of the effectiveness of our internal control over financial reporting based on the framework in Internal Control — Integrated Framework (2013) issued by the Committee of Sponsoring Organizations of the Treadway Commission.
Based on this evaluation, management has concluded that our internal control over financial reporting was effective as of December 31, 2018.
The effectiveness of our internal control over financial reporting as of December 31, 2018 has been audited by Deloitte & Touche LLP, an independent registered public accounting firm, as stated in their report in this Annual Report on Form 10-K.
Changes in Internal Control Over Financial Reporting
No change occurred in our internal control over financial reporting (as defined in Rules 13a-15(f) and 15d -15(f) of the Exchange Act) during the three months ended December 31, 2018 that has materially affected, or is reasonably likely to materially affect, our internal control over financial reporting.
II. Discussion of Controls and Procedures of the Operating Partnership
In the information incorporated by reference into this Part II of Item 9A, the term “Company” refers to the Operating Partnership, except as the context otherwise requires.
Evaluation of Disclosure Controls and Procedures
We maintain disclosure controls and procedures (as defined in Rules 13a-15(e) and 15d-15(e) of the Exchange Act that are designed to provide reasonable assurance that information required to be disclosed in our Exchange Act reports is recorded, processed, summarized and reported within the time periods specified in the SEC’s rules and forms, and that such information is accumulated and communicated to our management, including our Chief Executive Officer and Chief Financial Officer, as
appropriate, to allow timely decisions regarding required disclosure. In designing and evaluating the disclosure controls and procedures, we recognize that no controls and procedures, no matter how well designed and operated, can provide absolute assurance of achieving the desired control objectives.
In accordance with Rules 13a-15(b) and 15d-15(b) of the Exchange Act, management, under the supervision and with the participation of our Chief Executive Officer and Chief Financial Officer, carried out an evaluation of the effectiveness of our disclosure controls and procedures as of December 31, 2018 and determined that the disclosure controls and procedures were effective at a reasonable assurance level as of that date.
Management’s Annual Report on Internal Control over Financial Reporting
Our management is responsible for establishing and maintaining adequate internal control over financial reporting, as such term is defined in Rules 13a-15(f) and 15d-15(f) under the Exchange Act. Internal control over financial reporting is a process to provide reasonable assurance regarding the reliability of our financial reporting and the preparation of financial statements for external purposes in accordance with GAAP. Because of its inherent limitations, internal control over financial reporting is not intended to provide absolute assurance that a misstatement of our financial statements would be prevented or detected.
Under the supervision and with the participation of our management, including our Chief Executive Officer and Chief Financial Officer, we conducted an evaluation of the effectiveness of our internal control over financial reporting based on the framework in Internal Control — Integrated Framework (2013) issued by the Committee of Sponsoring Organizations of the Treadway Commission.
Based on this evaluation, management has concluded that our internal control over financial reporting was effective as of December 31, 2018.
Changes in Internal Control Over Financial Reporting
No change occurred in our internal control over financial reporting (as defined in Rules 13a-15(f) and 15d -15(f) of the Exchange Act) during the three months ended December 31, 2018 that has materially affected, or is reasonably likely to materially affect, our internal control over financial reporting.
REPORT OF INDEPENDENT REGISTERED PUBLIC ACCOUNTING FIRM
To the shareholders and the Board of Directors of VEREIT, Inc.
Opinion on Internal Control over Financial Reporting
We have audited the internal control over financial reporting of VEREIT, Inc. and subsidiaries (the “Company”) as of December 31, 2018, based on criteria established in Internal Control - Integrated Framework (2013) issued by the Committee of Sponsoring Organizations of the Treadway Commission (COSO). In our opinion, the Company maintained, in all material respects, effective internal control over financial reporting as of December 31, 2018, based on criteria established in Internal Control - Integrated Framework (2013) issued by COSO.
We have also audited, in accordance with the standards of the Public Company Accounting Oversight Board (United States) (PCAOB), the consolidated financial statements and financial statement schedules as of and for the year ended December 31, 2018, of the Company and our report dated February 20, 2019, expressed an unqualified opinion on those financial statements.
Basis for Opinion
The Company’s management is responsible for maintaining effective internal control over financial reporting and for its assessment of the effectiveness of internal control over financial reporting included in the accompanying Management’s Annual Report on Internal Control over Financial Reporting. Our responsibility is to express an opinion on the Company’s internal control over financial reporting based on our audit. We are a public accounting firm registered with the PCAOB and are required to be independent with respect to the Company in accordance with the U.S. federal securities laws and the applicable rules and regulations of the Securities and Exchange Commission and the PCAOB.
We conducted our audit in accordance with the standards of the PCAOB. Those standards require that we plan and perform the audit to obtain reasonable assurance about whether effective internal control over financial reporting was maintained in all material respects. Our audit included obtaining an understanding of internal control over financial reporting, assessing the risk that a material weakness exists, testing and evaluating the design and operating effectiveness of internal control based on the assessed risk and performing such other procedures as we considered necessary in the circumstances. We believe that our audit provides a reasonable basis for our opinion.
Definition and Limitations of Internal Control over Financial Reporting
A company’s internal control over financial reporting is a process designed to provide reasonable assurance regarding the reliability of financial reporting and the preparation of financial statements for external purposes in accordance with generally accepted accounting principles. A company’s internal control over financial reporting includes policies and procedures that (1) pertain to the maintenance of records that, in reasonable detail, accurately and fairly reflect the transactions and dispositions of the assets of the company; (2) provide reasonable assurance that transactions are recorded as necessary to permit preparation of financial statements in accordance with generally accepted accounting principles, and that receipts and expenditures of the company are being made only in accordance with authorizations of management and directors of the company; and (3) provide reasonable assurance regarding prevention or timely detection of unauthorized acquisition, use, or disposition of the company’s assets that could have a material effect on the financial statements.
Because of its inherent limitations, internal control over financial reporting may not prevent or detect misstatements. Also, projections of any evaluation of effectiveness to future periods are subject to the risk that controls may become inadequate because of changes in conditions, or that the degree of compliance with the policies or procedures may deteriorate.
/s/ DELOITTE & TOUCHE LLP
Phoenix, Arizona
February 20, 2019
Item 9B. Other Information.
None
PART III
Item 10. Directors, Executive Officers and Corporate Governance.
The information required by this Item will be included in our definitive proxy statement for the 2019 Annual Meeting of Stockholders (the “Proxy Statement”), to be filed within 120 days following the end of our fiscal year, and is incorporated herein by reference.
Item 11. Executive Compensation.
The information required by this Item will be included in the Proxy Statement and is incorporated herein by reference.
Item 12. Security Ownership of Certain Beneficial Owners and Management and Related Stockholder Matters.
The information required by this Item will be included in the Proxy Statement and is incorporated herein by reference.
Item 13. Certain Relationships and Related Transactions, and Director Independence.
The information required by this Item will be included in the Proxy Statement and is incorporated herein by reference.
Item 14. Principal Accounting Fees and Services.
The information required by this Item will be included in the Proxy Statement and is incorporated herein by reference.
PART IV
Item 15. Exhibits and Financial Statement Schedules.
Financial Statements
The Financial Statements are included herein at pages F-1 through F-60.
Financial Statement Schedules
Schedule II - Valuation and Qualifying Accounts is included herein on page F-61.
Schedule III - Real Estate and Accumulated Depreciation is included herein on pages F-62 through F-194.
Schedule IV - Mortgage Loans Held for Investment is included herein on page F-195.
Exhibits
The following exhibits are included in this Annual Report on Form 10-K for the fiscal year ended December 31, 2018 (and are numbered in accordance with Item 601 of Regulation S-K):
|
| | |
| Exhibit No. | | Description |
| 2.1 | | Agreement and Plan of Merger by and among VEREIT, Inc., VEREIT Operating Partnership, L.P., Tiger Acquisition LLC, American Realty Capital Trust III, Inc. and American Realty Capital Operating Partnership III, L.P., dated as of December 14, 2012 (Incorporated by reference to the Company’s Current Report on Form 8-K (File No. 001-35263), filed with the SEC on December 17, 2012). |
| 2.2 | | Agreement and Plan of Merger, by and among, VEREIT, Inc., VEREIT Operating Partnership, L.P., Safari Acquisition, LLC, CapLease, Inc., CapLease, LP and CLF OP General Partner LLC, dated as of May 28, 2013 (Incorporated by reference to the Company’s Current Report on Form 8-K (File NO. 001-35263), filed with the SEC on May 28, 2013). |
| 2.3 | | Purchase and Sale Agreement, by and among, CNL APF Partners, LP and Certain Affiliates as Seller Parties, and VEREIT Operating Partnership, L.P., as Purchaser, dated May 31, 2013. (Incorporated by reference to the Company’s Amended Current Report on Form 8-K/A (File No. 001-35263), filed with the SEC on June 7,2013). |
| 2.4 | | Agreement and Plan of Merger, dated as of July 1, 2013, among VEREIT, Inc., American Realty Capital Trust IV, Inc., Thunder Acquisition, LLC, VEREIT Operating Partnership, L.P. and American Realty Capital Operating Partnership IV, L.P. (Incorporated by reference to the Company’s Current Report on Form 8-K (File No. 001-35263), filed with the SEC on July 2, 2013). |
| 2.4.1 | | Amendment dated as of October 6, 2013 to the Agreement and Plan of Merger, dated as of July 1, 2013, by and among VEREIT, Inc., VEREIT Operating Partnership, L.P., Thunder Acquisition, LLC, American Realty Capital Trust IV, Inc. and American Realty Capital Operating Partnership IV, L.P. (Incorporated by reference to the Company’s First Current Report on Form 8-K (File No. 001-35263), filed with the SEC on October 7, 2013). |
| 2.4.2 | | Second Amendment dated as of October 11, 2013 to the Agreement and Plan of Merger, dated as of July 1, 2013, by and among VEREIT, Inc., VEREIT Operating Partnership, L.P., Thunder Acquisition, LLC, American Realty Capital Trust IV, Inc. and American Realty Capital Operating Partnership IV, L.P. (Incorporated by reference as Annex E to the Company’s Final Prospectus filed Pursuant to Rule 424(b)(3) (Registration No. 333-190056), filed with the SEC on December 4, 2013). |
| 2.5 | | |
| 3.1 | | |
| 3.2 | | |
| 3.3 | | |
| 3.4 | | |
| 3.5 | | |
| 3.6 | | |
| 3.7 | | |
|
| | |
| Exhibit No. | | Description |
| 3.8 | | |
| 3.9 | | |
| 3.10 | | |
| 3.11 | | |
| 3.12 | | |
| 3.13 | | |
| 4.1 | | |
| 4.2 | | |
| 4.3 | | |
| 4.4 | | |
| 4.5 | | |
| 4.6 | | |
| 4.7 | | |
| 4.8 | | Indenture, dated as of February 6, 2014, among ARC Properties Operating Partnership, L.P., Clark Acquisition, LLC, the guarantors named therein and U.S. Bank National Association, as trustee (Incorporated by reference to the Company’s Current Report on Form 8-K (File No. 001-35263), filed with the SEC on February 7, 2014). |
| 4.9 | | |
| 4.10 | | |
| 4.11 | | |
| 4.12 | | |
| 4.13 | | |
| 4.14 | | |
| 4.15 | | |
| 4.16 | | |
| 4.17 | | |
|
| | |
| Exhibit No. | | Description |
| 10.1 | | |
| 10.2 | | |
| 10.3 | | |
| 10.4† | | |
| 10.5† | | |
| 10.6† | | |
| 10.7†* | | |
| 10.8†* | | |
| 10.9†* | | |
| 10.10†* | | |
| 10.11†* | | |
| 10.12†* | | |
| 10.13†* | | |
| 10.14† | | |
| 10.15† | | |
| 10.16† | | |
| 10.17† | | |
| 10.18† | | |
| 10.19† | | |
| 10.20† | | |
| 10.21† | | |
| 10.22† | | Amendment, effective February 21, 2018, to the Employment Agreement, dated as of October 5, 2015, by and between VEREIT, Inc. and Michael J. Bartolotta (Incorporated by reference to the Company’s Annual Report on Form 10-K (File No. 001-35263), for the year ended December 31, 2017 filed with the SEC on February 22, 2018). |
| 10.23† | | |
| 10.24† | | |
| 10.25† | | Amendment, effective February 21, 2018, to the Employment Agreement, dated as of May 21, 2015, by and between VEREIT, Inc. and Lauren Goldberg (Incorporated by reference to the Company’s Annual Report on Form 10-K (File No. 001-35263), for the year ended December 31, 2017 filed with the SEC on February 22, 2018). |
|
| | |
| Exhibit No. | | Description |
| 10.26† | | |
| 10.27† | | Amendment, effective February 21, 2018, to the Employment Agreement, dated as of February 23, 2016, by and between VEREIT, Inc. and Paul McDowell (Incorporated by reference to the Company’s Annual Report on Form 10-K (File No. 001-35263), for the year ended December 31, 2017 filed with the SEC on February 22, 2018). |
| 10.28† | | |
| 10.29† | | Amendment, effective February 21, 2018, to the Employment Agreement, dated as of February 23, 2016, by and between VEREIT, Inc. and Thomas Roberts (Incorporated by reference to the Company’s Annual Report on Form 10-K (File No. 001-35263), for the year ended December 31, 2017 filed with the SEC on February 22, 2018). |
| 10.30† | | |
| 21.1* | | |
| 23.1* | | |
| 23.2* | | |
| 31.1* | | |
| 31.2* | | |
| 31.3* | | |
| 31.4* | | |
| 32.1** | | |
| 32.2** | | |
| 32.3** | | |
| 32.4** | | |
| 101.INS* | | XBRL Instance Document. |
| 101.SCH* | | XBRL Taxonomy Extension Schema Document. |
| 101.CAL* | | XBRL Taxonomy Extension Calculation Linkbase Document. |
| 101.DEF* | | XBRL Taxonomy Extension Definition Linkbase Document. |
| 101.LAB* | | XBRL Taxonomy Extension Label Linkbase Document. |
| 101.PRE* | | XBRL Taxonomy Extension Presentation Linkbase Document. |
_____________________________
| |
| ** | In accordance with Item 601(b)(32) of Regulation S-K, this Exhibit is not deemed “filed” for purposes of Section 18 of the Exchange Act or otherwise subject to the liabilities of that section. Such certifications will not be deemed incorporated by reference into any filing under the Securities Act or the Exchange Act, except to the extent that the registrant specifically incorporates it by reference. |
† Management contract or compensatory plan or arrangement.
Item 16. Form 10-K Summary.
Not Applicable
SIGNATURES
Pursuant to the requirements of the Securities Exchange Act of 1934, as amended, each registrant has duly caused this Annual Report on Form 10-K to be signed on its behalf by the undersigned thereunto duly authorized.
|
| | |
| VEREIT, INC. |
| By: | /s/ Michael J. Bartolotta |
| Michael J. Bartolotta |
| Executive Vice President and Chief Financial Officer (Principal Financial Officer) |
|
| | |
| VEREIT OPERATING PARTNERSHIP, L.P. |
| By: VEREIT, Inc., its sole general partner |
| By: | /s/ Michael J. Bartolotta |
| Michael J. Bartolotta |
| Executive Vice President and Chief Financial Officer (Principal Financial Officer) |
Dated: February 20, 2019
Pursuant to the requirements of the Securities Exchange Act of 1934, as amended, this Form 10-K has been signed below by the following persons on behalf of each registrant and in the capacities and on the dates indicated.
|
| | | | |
| Name | | Capacity * | | Date |
| | | | |
| /s/ Glenn J. Rufrano | | Chief Executive Officer | | February 20, 2019 |
| Glenn J. Rufrano | | (Principal Executive Officer and Director) | | |
| | | | |
| /s/ Michael J. Bartolotta | | Executive Vice President and Chief Financial Officer | | February 20, 2019 |
| Michael J. Bartolotta | | (Principal Financial Officer) | | |
| | | | |
| /s/ Gavin B. Brandon | | Senior Vice President and Chief Accounting Officer | | February 20, 2019 |
| Gavin B. Brandon | | (Principal Accounting Officer) | | |
| | | | |
| /s/ Hugh R. Frater | | Director, Non-Executive Chairman | | February 20, 2019 |
| Hugh R. Frater | | | | |
| | | | |
| /s/ David B. Henry | | Director | | February 20, 2019 |
| David B. Henry | | | | |
| | | | |
| /s/ Mary Hogan Preusse | | Director | | February 20, 2019 |
| Mary Hogan Preusse | | | | |
| | | | |
| /s/ Richard J. Lieb | | Director | | February 20, 2019 |
| Richard J. Lieb | | | | |
| | | | |
| /s/ Mark S. Ordan | | Director | | February 20, 2019 |
| Mark S. Ordan | | | | |
| | | | |
| /s/ Eugene A. Pinover | | Director | | February 20, 2019 |
| Eugene A. Pinover | | | | |
| | | | |
| /s/ Julie G. Richardson | | Director | | February 20, 2019 |
| Julie G. Richardson | | | | |
|
| |
| * | Each person is signing in his or her capacity as an officer and/or director of VEREIT, Inc., which is the sole general partner of VEREIT Operating Partnership, L.P. |
INDEX TO CONSOLIDATED FINANCIAL STATEMENTS
|
| |
| Page |
| Financial Statements |
| |
| |
| |
| |
| |
| |
| |
| |
| |
| |
| |
| |
| F-61 |
| F-62 |
| F-195 |
REPORT OF INDEPENDENT REGISTERED PUBLIC ACCOUNTING FIRM
To the shareholders and the Board of Directors of VEREIT, Inc.
Opinion on the Financial Statements
We have audited the accompanying consolidated balance sheets of VEREIT, Inc. and subsidiaries (the “Company”) as of December 31, 2018 and 2017, the related consolidated statements of operations, comprehensive income (loss), changes in equity and cash flows for each of the three years in the period ended December 31, 2018, and the related notes and the schedules listed in the Index at Item 15 (collectively referred to as the “financial statements”). In our opinion, the financial statements present fairly, in all material respects, the financial position of the Company as of December 31, 2018 and 2017, and the results of its operations and its cash flows for each of the three years in the period ended December 31, 2018, in conformity with accounting principles generally accepted in the United States of America.
We have also audited, in accordance with the standards of the Public Company Accounting Oversight Board (United States) (PCAOB), the Company’s internal control over financial reporting as of December 31, 2018, based on criteria established in Internal Control - Integrated Framework (2013) issued by the Committee of Sponsoring Organizations of the Treadway Commission and our report dated February 20, 2019, expressed an unqualified opinion on the Company’s internal control over financial reporting.
Basis for Opinion
These financial statements are the responsibility of the Company’s management. Our responsibility is to express an opinion on the Company’s financial statements based on our audits. We are a public accounting firm registered with the PCAOB and are required to be independent with respect to the Company in accordance with the U.S. federal securities laws and the applicable rules and regulations of the Securities and Exchange Commission and the PCAOB.
We conducted our audits in accordance with the standards of the PCAOB. Those standards require that we plan and perform the audit to obtain reasonable assurance about whether the financial statements are free of material misstatement, whether due to error or fraud. Our audits included performing procedures to assess the risks of material misstatement of the financial statements, whether due to error or fraud, and performing procedures that respond to those risks. Such procedures included examining, on a test basis, evidence regarding the amounts and disclosures in the financial statements. Our audits also included evaluating the accounting principles used and significant estimates made by management, as well as evaluating the overall presentation of the financial statements. We believe that our audits provide a reasonable basis for our opinion.
/s/ DELOITTE & TOUCHE LLP
Phoenix, Arizona
February 20, 2019
We have served as the Company’s auditor since 2015.
REPORT OF INDEPENDENT REGISTERED PUBLIC ACCOUNTING FIRM
To the partners of VEREIT Operating Partnership, L.P.
Opinion on the Financial Statements
We have audited the accompanying consolidated balance sheets of VEREIT Operating Partnership, L.P and subsidiaries (the "Operating Partnership") as of December 31, 2018 and 2017, the related consolidated statements of operations, comprehensive income (loss), changes in equity, and cash flows, for each of the three years in the period ended December 31, 2018, and the related notes and the schedules listed in the Index at Item 15 (collectively referred to as the "financial statements"). In our opinion, the financial statements present fairly, in all material respects, the financial position of the Operating Partnership as of December 31, 2018 and 2017, and the results of its operations and its cash flows for each of the three years in the period ended December 31, 2018, in conformity with accounting principles generally accepted in the United States of America.
Basis for Opinion
These financial statements are the responsibility of the Operating Partnership's management. Our responsibility is to express an opinion on the Operating Partnership's financial statements based on our audits. We are a public accounting firm registered with the Public Company Accounting Oversight Board (United States) (PCAOB) and are required to be independent with respect to the Operating Partnership in accordance with the U.S. federal securities laws and the applicable rules and regulations of the Securities and Exchange Commission and the PCAOB.
We conducted our audits in accordance with the standards of the PCAOB. Those standards require that we plan and perform the audit to obtain reasonable assurance about whether the financial statements are free of material misstatement, whether due to error or fraud. The Operating Partnership is not required to have, nor were we engaged to perform, an audit of its internal control over financial reporting. As part of our audits, we are required to obtain an understanding of internal control over financial reporting but not for the purpose of expressing an opinion on the effectiveness of the Operating Partnership’s internal control over financial reporting. Accordingly, we express no such opinion.
Our audits included performing procedures to assess the risks of material misstatement of the financial statements, whether due to error or fraud, and performing procedures that respond to those risks. Such procedures included examining, on a test basis, evidence regarding the amounts and disclosures in the financial statements. Our audits also included evaluating the accounting principles used and significant estimates made by management, as well as evaluating the overall presentation of the financial statements. We believe that our audits provide a reasonable basis for our opinion.
/s/ DELOITTE & TOUCHE LLP
Phoenix, Arizona
February 20, 2019
We have served as the Operating Partnership’s auditor since 2015.
VEREIT, INC.
CONSOLIDATED BALANCE SHEETS
(In thousands, except for share and per share data)
|
| | | | | | | | |
| | | December 31, 2018 | | December 31, 2017 |
| ASSETS | | | | |
| Real estate investments, at cost: | | | | |
| Land | | $ | 2,843,212 |
| | $ | 2,865,855 |
|
| Buildings, fixtures and improvements | | 10,749,228 |
| | 10,711,845 |
|
| Intangible lease assets | | 2,012,399 |
| | 2,037,675 |
|
| Total real estate investments, at cost | | 15,604,839 |
| | 15,615,375 |
|
| Less: accumulated depreciation and amortization | | 3,436,772 |
| | 2,908,028 |
|
| Total real estate investments, net | | 12,168,067 |
| | 12,707,347 |
|
| Investment in unconsolidated entities | | 35,289 |
| | 39,520 |
|
| Cash and cash equivalents | | 30,758 |
| | 34,176 |
|
| Restricted cash | | 22,905 |
| | 27,662 |
|
| Rent and tenant receivables and other assets, net | | 366,092 |
| | 389,060 |
|
| Goodwill | | 1,337,773 |
| | 1,337,773 |
|
| Due from affiliates, net | | — |
| | 6,041 |
|
| Real estate assets held for sale and assets related to discontinued operations, net | | 2,609 |
| | 163,999 |
|
| Total assets | | $ | 13,963,493 |
|
| $ | 14,705,578 |
|
| | | | | |
| LIABILITIES AND EQUITY | | | | |
| Mortgage notes payable, net | | $ | 1,922,657 |
| | $ | 2,082,692 |
|
| Corporate bonds, net | | 3,368,609 |
| | 2,821,494 |
|
| Convertible debt, net | | 394,883 |
| | 984,258 |
|
| Credit facility, net | | 401,773 |
| | 185,000 |
|
| Below-market lease liabilities, net | | 173,479 |
| | 198,551 |
|
| Accounts payable and accrued expenses | | 145,611 |
| | 136,474 |
|
| Deferred rent and other liabilities | | 69,714 |
| | 62,985 |
|
| Distributions payable | | 186,623 |
| | 175,301 |
|
| Due to affiliates | | — |
| | 66 |
|
| Liabilities related to discontinued operations | | — |
| | 15,881 |
|
| Total liabilities | | 6,663,349 |
| | 6,662,702 |
|
| Commitments and contingencies (Note 10) | |
| |
|
|
| Preferred stock, $0.01 par value, 100,000,000 shares authorized and 42,834,138 issued and outstanding as of each of December 31, 2018 and December 31, 2017 | | 428 |
| | 428 |
|
| Common stock, $0.01 par value, 1,500,000,000 shares authorized and 967,515,165 and 974,208,583 issued and outstanding as of December 31, 2018 and December 31, 2017, respectively | | 9,675 |
| | 9,742 |
|
| Additional paid-in-capital | | 12,615,472 |
| | 12,654,258 |
|
| Accumulated other comprehensive loss | | (1,280 | ) | | (3,569 | ) |
| Accumulated deficit | | (5,467,236 | ) | | (4,776,581 | ) |
| Total stockholders’ equity | | 7,157,059 |
| | 7,884,278 |
|
| Non-controlling interests | | 143,085 |
| | 158,598 |
|
| Total equity | | 7,300,144 |
| | 8,042,876 |
|
| Total liabilities and equity | | $ | 13,963,493 |
|
| $ | 14,705,578 |
|
The accompanying notes are an integral part of these statements.
VEREIT, INC.
CONSOLIDATED STATEMENTS OF OPERATIONS
(In thousands, except for per share data)
|
| | | | | | | | | | | | |
| | | Year Ended December 31, |
| | | 2018 | | 2017 | | 2016 |
| Rental revenue | | $ | 1,257,867 |
| | $ | 1,252,285 |
| | $ | 1,335,447 |
|
| Operating expenses: | | | | | | |
| Acquisition-related | | 3,632 |
| | 3,402 |
| | 1,321 |
|
| Litigation, merger and other non-routine costs, net of insurance recoveries | | 290,963 |
| | 47,960 |
| | 3,884 |
|
| Property operating | | 126,461 |
| | 128,717 |
| | 144,428 |
|
| General and administrative | | 63,933 |
| | 58,603 |
| | 51,927 |
|
| Depreciation and amortization | | 640,618 |
| | 706,802 |
| | 762,038 |
|
| Impairments | | 54,647 |
| | 50,548 |
| | 182,820 |
|
| Total operating expenses | | 1,180,254 |
|
| 996,032 |
|
| 1,146,418 |
|
| Other (expense) income: | | | | | | |
| Interest expense | | (280,887 | ) | | (289,766 | ) | | (317,376 | ) |
| Gain (loss) on extinguishment and forgiveness of debt, net | | 5,360 |
| | 18,373 |
| | (771 | ) |
| Other income, net | | 14,735 |
| | 6,242 |
| | 5,251 |
|
| Equity in income and gain on disposition of unconsolidated entities | | 1,869 |
| | 2,763 |
| | 9,783 |
|
| Gain (loss) on derivative instruments, net | | 355 |
| | 2,976 |
| | (1,191 | ) |
| Gain on disposition of real estate and real estate assets held for sale, net | | 94,331 |
| | 61,536 |
| | 45,524 |
|
| Total other expenses, net | | (164,237 | ) |
| (197,876 | ) |
| (258,780 | ) |
| (Loss) income before taxes | | (86,624 | ) |
| 58,377 |
|
| (69,751 | ) |
| Provision for income taxes | | (5,101 | ) | | (6,882 | ) | | (7,136 | ) |
| (Loss) income from continuing operations | | (91,725 | ) |
| 51,495 |
|
| (76,887 | ) |
| Income (loss) from discontinued operations, net of income taxes | | 3,695 |
| | (19,117 | ) | | (123,937 | ) |
| Net (loss) income | | (88,030 | ) | | 32,378 |
| | (200,824 | ) |
Net loss (income) attributable to non-controlling interests (1) | | 2,256 |
| | (560 | ) | | 4,961 |
|
| Net (loss) income attributable to the General Partner | | $ | (85,774 | ) |
| $ | 31,818 |
|
| $ | (195,863 | ) |
| | | | | | | |
| Basic and diluted net loss per share from continuing operations attributable to common stockholders | | $ | (0.17 | ) | | $ | (0.02 | ) | | $ | (0.16 | ) |
| Basic and diluted net income (loss) per share from discontinued operations attributable to common stockholders | | $ | 0.00 |
| | $ | (0.02 | ) | | $ | (0.13 | ) |
Basic and diluted net loss per share attributable to common stockholders (2) | | $ | (0.16 | ) | | $ | (0.04 | ) | | $ | (0.29 | ) |
| |
| (1) | Represents net loss (income) attributable to limited partners and consolidated joint venture partners. |
| |
| (2) | Amounts may not total due to rounding. |
The accompanying notes are an integral part of these statements.
VEREIT, INC.
CONSOLIDATED STATEMENTS OF COMPREHENSIVE INCOME (LOSS)
(In thousands)
|
| | | | | | | | | | | | |
| | | Year Ended December 31, |
| | | 2018 | | 2017 | | 2016 |
| Net (loss) income | | $ | (88,030 | ) | | $ | 32,378 |
| | $ | (200,824 | ) |
| Other comprehensive income (loss): | | | | | | |
| Unrealized gain (loss) on interest rate derivatives | | — |
| | (18 | ) | | (7,685 | ) |
| Reclassification of previous unrealized loss (gain) on interest rate derivatives into net (loss) income | | 313 |
| | (70 | ) | | 9,397 |
|
| Unrealized loss on investment securities, net | | (205 | ) | | (951 | ) | | (2,271 | ) |
| Reclassification of previous unrealized loss (gain) on investment securities into net (loss) income as other income, net | | 2,237 |
| | — |
| | — |
|
| Total other comprehensive income (loss) | | 2,345 |
|
| (1,039 | ) | | (559 | ) |
| | | | | | | |
| Total comprehensive (loss) income | | (85,685 | ) | | 31,339 |
| | (201,383 | ) |
Comprehensive loss (income) attributable to non-controlling interests (1) | | 2,200 |
| | (534 | ) | | 4,989 |
|
| Total comprehensive (loss) income attributable to the General Partner | | $ | (83,485 | ) | | $ | 30,805 |
| | $ | (196,394 | ) |
| |
| (1) | Represents comprehensive loss (income)attributable to limited partners and consolidated joint venture partners. |
The accompanying notes are an integral part of these statements.
VEREIT, INC.
CONSOLIDATED STATEMENTS OF CHANGES IN EQUITY
(In thousands, except for share data)
|
| | | | | | | | | | | | | | | | | | | | | | | | | | | | | | | | | | | | | | |
| | | Preferred Stock | | Common Stock | | | | | | | | | | | | |
| | | Number
of Shares | | Par
Value | | Number
of Shares | | Par
Value | | Additional Paid-In Capital | | Accumulated Other Comprehensive Loss | | Accumulated
Deficit | | Total Stock-holders’ Equity | | Non-Controlling Interests | | Total Equity |
| Balance, January 1, 2016 | | 42,834,138 |
| | $ | 428 |
| | 904,884,394 |
| | $ | 9,049 |
| | $ | 11,931,768 |
| | $ | (2,025 | ) | | $ | (3,415,233 | ) | | $ | 8,523,987 |
| | $ | 189,972 |
| | $ | 8,713,959 |
|
| Issuance of Common Stock, net | | — |
| | — |
| | 69,000,000 |
| | 690 |
| | 701,786 |
| | — |
| | — |
| | 702,476 |
| | — |
| | 702,476 |
|
| Conversion of OP Units to Common Stock | | — |
| | — |
| | 15,450 |
| | — |
| | 159 |
| | — |
| | — |
| | 159 |
| | (159 | ) | | — |
|
| Repurchases of Common Stock to settle tax obligation | | — |
| | — |
| | (481,261 | ) | | (5 | ) | | (4,647 | ) | | — |
| | — |
| | (4,652 | ) | | — |
| | (4,652 | ) |
| Equity-based compensation, net | | — |
| | — |
| | 728,067 |
| | 7 |
| | 10,721 |
| | — |
| | — |
| | 10,728 |
| | — |
| | 10,728 |
|
| Contributions from non-controlling interest holders | | — |
| | — |
| | — |
| | — |
| | — |
| | — |
| | — |
| | — |
| | 675 |
| | 675 |
|
Distributions declared on Common Stock —
$0.55 per common share | | — |
| | — |
| | — |
| | — |
| | — |
| | — |
| | (515,935 | ) | | (515,935 | ) | | — |
| | (515,935 | ) |
| Distributions to non-controlling interest holders | | — |
| | — |
| | — |
| | — |
| | — |
| | — |
| | — |
| | — |
| | (13,183 | ) | | (13,183 | ) |
| Dividend equivalents on awards granted under the Equity Plan | | — |
| | — |
| | — |
| | — |
| | — |
| | — |
| | (1,260 | ) | | (1,260 | ) | | — |
| | (1,260 | ) |
| Distributions to preferred shareholders and unitholders | | — |
| | — |
| | — |
| | — |
| | — |
| | — |
| | (71,748 | ) | | (71,748 | ) | | (144 | ) | | (71,892 | ) |
| Cumulative effect adjustment for equity-based compensation forfeitures | | — |
| | — |
| | — |
| | — |
| | 384 |
| | — |
| | (384 | ) | | — |
| | — |
| | — |
|
| Net loss | | — |
| | — |
| | — |
| | — |
| | — |
| | — |
| | (195,863 | ) | | (195,863 | ) | | (4,961 | ) | | (200,824 | ) |
| Other comprehensive loss | | — |
| | — |
| | — |
| | — |
| | — |
| | (531 | ) | | — |
| | (531 | ) | | (28 | ) | | (559 | ) |
| Balance, December 31, 2016 | | 42,834,138 |
| | $ | 428 |
| | 974,146,650 |
| | $ | 9,741 |
| | $ | 12,640,171 |
| | $ | (2,556 | ) | | $ | (4,200,423 | ) | | $ | 8,447,361 |
| | $ | 172,172 |
| | $ | 8,619,533 |
|
| Repurchases of Common Stock under 2017 Share Repurchase Program | | — |
| | — |
| | (68,759 | ) | | (1 | ) | | (517 | ) | | — |
| | — |
| | (518 | ) | | — |
| | (518 | ) |
| Repurchases of Common Stock to settle tax obligation | | — |
| | — |
| | (268,550 | ) | | (2 | ) | | (2,146 | ) | | — |
| | — |
| | (2,148 | ) | | — |
| | (2,148 | ) |
| Equity-based compensation, net | | — |
| | — |
| | 399,242 |
| | 4 |
| | 16,750 |
| | — |
| | — |
| | 16,754 |
| | — |
| | 16,754 |
|
| Contributions from non-controlling interest holders | | — |
| | — |
| | — |
| | — |
| | — |
| | — |
| | — |
| | — |
| | 101 |
| | 101 |
|
Distributions declared on Common Stock —
$0.55 per common share | | — |
| | — |
| | — |
| | — |
| | — |
| | — |
| | (535,657 | ) | | (535,657 | ) | | — |
| | (535,657 | ) |
| Distributions to non-controlling interest holders | | — |
| | — |
| | — |
| | — |
| | — |
| | — |
| | — |
| | — |
| | (13,227 | ) | | (13,227 | ) |
| Dividend equivalents on awards granted under the Equity Plan | | — |
| | — |
| | — |
| | — |
| | — |
| | — |
| | (571 | ) | | (571 | ) | | — |
| | (571 | ) |
| Distributions to preferred shareholders and unitholders | | — |
| | — |
| | — |
| | — |
| | — |
| | — |
| | (71,748 | ) | | (71,748 | ) | | (144 | ) | | (71,892 | ) |
| Disposition of joint venture | | — |
| | — |
| | — |
| | — |
| | — |
| | — |
| | — |
| | — |
| | (838 | ) | | (838 | ) |
| Net income | | — |
| | — |
| | — |
| | — |
| | — |
| | — |
| | 31,818 |
| | 31,818 |
| | 560 |
| | 32,378 |
|
| Other comprehensive income | | — |
| | — |
| | — |
| | — |
| | — |
| | (1,013 | ) | | — |
| | (1,013 | ) | | (26 | ) | | (1,039 | ) |
| Balance, December 31, 2017 | | 42,834,138 |
| | $ | 428 |
| | 974,208,583 |
| | $ | 9,742 |
| | $ | 12,654,258 |
| | $ | (3,569 | ) | | $ | (4,776,581 | ) | | $ | 7,884,278 |
| | $ | 158,598 |
| | $ | 8,042,876 |
|
| Conversion of OP Units to Common Stock | | — |
| | — |
| | 32,439 |
| | — |
| | 241 |
| | — |
| | — |
| | 241 |
| | (241 | ) | | — |
|
VEREIT, INC.
CONSOLIDATED STATEMENTS OF CHANGES IN EQUITY – (Continued)
(In thousands, except for share data)
|
| | | | | | | | | | | | | | | | | | | | | | | | | | | | | | | | | | | | | | |
| | | Preferred Stock | | Common Stock | | | | | | | | | | | | |
| | | Number
of Shares | | Par
Value | | Number
of Shares | | Par
Value | | Additional Paid-In Capital | | Accumulated Other Comprehensive Loss | | Accumulated
Deficit | | Total Stock-holders’ Equity | | Non-Controlling Interests | | Total Equity |
| Repurchases of Common Stock under Share Repurchase Programs | | — |
| | $ | — |
| | (7,206,876 | ) | | $ | (72 | ) | | $ | (50,082 | ) | | $ | — |
| | $ | — |
| | $ | (50,154 | ) | | $ | — |
| | (50,154 | ) |
| Repurchases of Common Stock to settle tax obligation | | — |
| | — |
| | (324,502 | ) | | (2 | ) | | (2,324 | ) | | — |
| | — |
| | (2,326 | ) | | — |
| | (2,326 | ) |
| Equity-based compensation, net | | — |
| | — |
| | 805,521 |
| | 7 |
| | 13,307 |
| | — |
| | — |
| | 13,314 |
| | — |
| | 13,314 |
|
| Contributions from non-controlling interest holders | | — |
| | — |
| | — |
| | — |
| | — |
| | — |
| | — |
| | — |
| | 120 |
| | 120 |
|
Distributions declared on Common Stock —
$0.55 per common share | | — |
| | — |
| | — |
| | — |
| | — |
| | — |
| | (532,144 | ) | | (532,144 | ) | | — |
| | (532,144 | ) |
| Distributions to non-controlling interest holders | | — |
| | — |
| | — |
| | — |
| | — |
| | — |
| | — |
| | — |
| | (13,048 | ) | | (13,048 | ) |
| Dividend equivalents on awards granted under the Equity Plan | | — |
| | — |
| | — |
| | — |
| | 72 |
| | — |
| | (989 | ) | | (917 | ) | | — |
| | (917 | ) |
| Distributions to preferred shareholders and unitholders | | — |
| | — |
| | — |
| | — |
| | — |
| | — |
| | (71,748 | ) | | (71,748 | ) | | (144 | ) | | (71,892 | ) |
| Net loss | | — |
| | — |
| | — |
| | — |
| | — |
| | — |
| | (85,774 | ) | | (85,774 | ) | | (2,256 | ) | | (88,030 | ) |
| Other comprehensive loss | | — |
| | — |
| | — |
| | — |
| | — |
| | 2,289 |
| | — |
| | 2,289 |
| | 56 |
| | 2,345 |
|
| Balance, December 31, 2018 | | 42,834,138 |
|
| $ | 428 |
|
| 967,515,165 |
|
| $ | 9,675 |
|
| $ | 12,615,472 |
|
| $ | (1,280 | ) |
| $ | (5,467,236 | ) |
| $ | 7,157,059 |
|
| $ | 143,085 |
|
| $ | 7,300,144 |
|
The accompanying notes are an integral part of these statements.
VEREIT, INC.
CONSOLIDATED STATEMENTS OF CASH FLOWS
(In thousands)
|
| | | | | | | | | | | | |
| | | Year Ended December 31, |
| | | 2018 | | 2017 | | 2016 |
| Cash flows from operating activities: | | | | |
| | |
| Net (loss) income | | $ | (88,030 | ) | | $ | 32,378 |
| | $ | (200,824 | ) |
| Adjustments to reconcile net (loss) income to net cash provided by operating activities: | | | | | | |
| Depreciation and amortization | | 659,948 |
| | 745,499 |
| | 806,548 |
|
| Gain on real estate assets, net | | (96,068 | ) | | (61,536 | ) | | (55,722 | ) |
| Impairments from held for sale | | — |
| | 20,027 |
| | — |
|
| Impairments | | 54,647 |
| | 50,548 |
| | 303,751 |
|
| Equity-based compensation | | 13,314 |
| | 16,751 |
| | 10,728 |
|
| Equity in income of unconsolidated entities and gain on joint venture | | (1,869 | ) | | (2,726 | ) | | 415 |
|
| Distributions from unconsolidated entities | | 1,366 |
| | 3,646 |
| | 1,433 |
|
| Gain on investments | | (4,092 | ) | | (65 | ) | | — |
|
| (Gain) loss on derivative instruments, net | | (355 | ) | | (2,976 | ) | | 1,191 |
|
| (Gain) loss on extinguishment and forgiveness of debt, net | | (5,360 | ) | | (18,373 | ) | | 771 |
|
| Changes in assets and liabilities: | | | | | | |
| Investment in direct financing leases | | 2,078 |
| | 2,097 |
| | 3,976 |
|
| Rent and tenant receivables and other assets, net | | (34,096 | ) | | (21,394 | ) | | (52,626 | ) |
| Due from affiliates | | — |
| | 1,163 |
| | (416 | ) |
| Assets held for sale classified as discontinued operations | | (2,492 | ) | | 13,812 |
| | — |
|
| Accounts payable and accrued expenses | | 1,688 |
| | 10,742 |
| | (3,323 | ) |
| Deferred rent and other liabilities | | 7,162 |
| | (395 | ) | | (17,740 | ) |
| Due to affiliates | | (66 | ) | | 50 |
| | (214 | ) |
| Liabilities related to discontinued operations | | (13,861 | ) | | 4,019 |
| | — |
|
| Net cash provided by operating activities | | 493,914 |
| | 793,267 |
|
| 797,948 |
|
| Cash flows from investing activities: | | | | | | |
| Investments in real estate assets | | (500,625 | ) | | (699,004 | ) | | (100,194 | ) |
| Capital expenditures and leasing costs | | (22,291 | ) | | (21,694 | ) | | (16,568 | ) |
| Real estate developments | | (9,221 | ) | | (14,850 | ) | | (17,411 | ) |
| Principal repayments received on investment securities and mortgage notes receivable | | 5,761 |
| | 6,796 |
| | 5,417 |
|
| Investments in unconsolidated entities | | (771 | ) | | — |
| | (25,777 | ) |
| Return of investment from unconsolidated entities | | 48 |
| | 1,972 |
| | 2,580 |
|
| Proceeds from disposition of real estate and joint venture | | 502,289 |
| | 445,525 |
| | 1,000,700 |
|
| Proceeds from disposition of discontinued operations | | 122,915 |
| | — |
| | — |
|
| Investment in leasehold improvements and other assets | | (841 | ) | | (1,191 | ) | | (2,259 | ) |
| Deposits for real estate assets | | (13,412 | ) | | (37,226 | ) | | (17,856 | ) |
| Proceeds from sale of investments and other assets | | 46,966 |
| | 400 |
| | — |
|
| Uses and refunds of deposits for real estate assets | | 17,267 |
| | 36,111 |
| | 13,305 |
|
| Proceeds from the settlement of property-related insurance claims | | 1,434 |
| | 355 |
| | — |
|
| Line of credit advances to Cole REITs | | (2,200 | ) | | (16,400 | ) | | (10,300 | ) |
| Line of credit repayments from Cole REITs | | 3,800 |
| | 25,100 |
| | 50,000 |
|
| Net cash provided by (used in) investing activities | | 151,119 |
| | (274,106 | ) |
| 881,637 |
|
| Cash flows from financing activities: | | | | | | |
| Proceeds from mortgage notes payable | | 187 |
| | 4,652 |
| | 3,112 |
|
| Payments on mortgage notes payable and other debt, including debt extinguishment costs | | (137,887 | ) | | (424,385 | ) | | (337,022 | ) |
| Proceeds from credit facility | | 1,934,000 |
| | 329,000 |
| | 1,033,000 |
|
| Payments on credit facility | | (1,716,000 | ) | | (645,107 | ) | | (1,993,000 | ) |
| Proceeds from corporate bonds | | 546,304 |
| | 600,000 |
| | 1,000,000 |
|
| Payments on corporate bonds, including extinguishment costs | | — |
| | — |
| | (1,311,203 | ) |
| Repayment of convertible notes | | (597,500 | ) | | — |
| | — |
|
| Payments of deferred financing costs | | (25,471 | ) | | (9,575 | ) | | (19,872 | ) |
| Repurchases of Common Stock under the Share Repurchase Programs | | (50,154 | ) | | (518 | ) | | — |
|
| Proceeds from 2016 term loan | | — |
| | — |
| | 300,000 |
|
VEREIT, INC.
CONSOLIDATED STATEMENTS OF CASH FLOWS – (Continued)
(In thousands)
|
| | | | | | | | | | | | |
| | | Year Ended December 31, |
| | | 2018 | | 2017 | | 2016 |
| Repayment of 2016 term loan | | $ | — |
| | $ | — |
| | $ | (300,000 | ) |
| Repurchases of Common Stock to settle tax obligations | | (2,326 | ) | | (2,148 | ) | | (4,652 | ) |
| Proceeds from the issuance of Common Stock, net of underwriters’ discount | | — |
| | — |
| | 702,765 |
|
| Payments of equity issuance costs | | — |
| | — |
| | (280 | ) |
| Contributions from non-controlling interest holders | | 120 |
| | 101 |
| | 675 |
|
| Distributions paid | | (606,679 | ) | | (608,615 | ) | | (580,508 | ) |
| Net cash used in financing activities | | (655,406 | ) | | (756,595 | ) |
| (1,506,985 | ) |
| Net change in cash and cash equivalents and restricted cash | | (10,373 | ) | | (237,434 | ) | | 172,600 |
|
| | | | | | | |
| Cash and cash equivalents and restricted cash, beginning of period | | $ | 64,036 |
| | $ | 301,470 |
| | $ | 128,870 |
|
| Less: cash and cash equivalents of discontinued operations | | (2,198 | ) | | (2,973 | ) | | (4,968 | ) |
| Cash and cash equivalents and restricted cash from continuing operations, beginning of period | | 61,838 |
| | 298,497 |
| | 123,902 |
|
| | | | | | | |
| Cash and cash equivalents, and restricted cash, end of period | | 53,663 |
| | 64,036 |
| | 301,470 |
|
| Less: cash and cash equivalents of discontinued operations | | — |
| | (2,198 | ) | | (2,973 | ) |
| Cash and cash equivalents and restricted cash from continuing operations, end of period | | $ | 53,663 |
| | $ | 61,838 |
|
| $ | 298,497 |
|
| Reconciliation of Cash and Cash Equivalents and Restricted Cash | | | | | | |
| Cash and cash equivalents at beginning of period | | $ | 34,176 |
| | $ | 253,479 |
| | $ | 64,135 |
|
| Restricted cash at beginning of period | | 27,662 |
| | 45,018 |
| | 59,767 |
|
| Cash and cash equivalents and restricted cash at beginning of period | | 61,838 |
| | 298,497 |
| | 123,902 |
|
| | | | | | | |
| Cash and cash equivalents at end of period | | 30,758 |
| | 34,176 |
| | 253,479 |
|
| Restricted cash at end of period | | 22,905 |
| | 27,662 |
| | 45,018 |
|
| Cash and cash equivalents and restricted cash at end of period | | $ | 53,663 |
| | $ | 61,838 |
| | $ | 298,497 |
|
The accompanying notes are an integral part of these statements.
VEREIT OPERATING PARTNERSHIP, L.P.
CONSOLIDATED BALANCE SHEETS
(In thousands, except for unit data)
|
| | | | | | | | |
| | | December 31, 2018 | | December 31, 2017 |
| ASSETS | | | | |
| Real estate investments, at cost: | | | | |
| Land | | $ | 2,843,212 |
| | $ | 2,865,855 |
|
| Buildings, fixtures and improvements | | 10,749,228 |
| | 10,711,845 |
|
| Intangible lease assets | | 2,012,399 |
| | 2,037,675 |
|
| Total real estate investments, at cost | | 15,604,839 |
|
| 15,615,375 |
|
| Less: accumulated depreciation and amortization | | 3,436,772 |
| | 2,908,028 |
|
| Total real estate investments, net | | 12,168,067 |
|
| 12,707,347 |
|
| Investment in unconsolidated entities | | 35,289 |
| | 39,520 |
|
| Cash and cash equivalents | | 30,758 |
| | 34,176 |
|
| Restricted cash | | 22,905 |
| | 27,662 |
|
| Rent and tenant receivables and other assets, net | | 366,092 |
| | 389,060 |
|
| Goodwill | | 1,337,773 |
| | 1,337,773 |
|
| Due from affiliates, net | | — |
| | 6,041 |
|
| Real estate assets held for sale and assets related to discontinued operations, net | | 2,609 |
| | 163,999 |
|
| Total assets | | $ | 13,963,493 |
|
| $ | 14,705,578 |
|
| | | | | |
| LIABILITIES AND EQUITY | | | | |
|
| Mortgage notes payable, net | | $ | 1,922,657 |
| | $ | 2,082,692 |
|
| Corporate bonds, net | | 3,368,609 |
| | 2,821,494 |
|
| Convertible debt, net | | 394,883 |
| | 984,258 |
|
| Credit facility, net | | 401,773 |
| | 185,000 |
|
| Below-market lease liabilities, net | | 173,479 |
| | 198,551 |
|
| Accounts payable and accrued expenses | | 145,611 |
| | 136,474 |
|
| Deferred rent and other liabilities | | 69,714 |
| | 62,985 |
|
| Distributions payable | | 186,623 |
| | 175,301 |
|
| Due to affiliates | | — |
| | 66 |
|
| Liabilities related to discontinued operations | | — |
| | 15,881 |
|
| Total liabilities | | 6,663,349 |
|
| 6,662,702 |
|
| Commitments and contingencies (Note 10) | |
|
| |
|
|
| General Partner's preferred equity, 42,834,138 General Partner Series F Preferred Units issued and outstanding as of each of December 31, 2018 and December 31, 2017 | | 710,325 |
| | 782,073 |
|
| General Partner's common equity, 967,515,165 and 974,208,583 General Partner OP Units issued and outstanding as of December 31, 2018 and December 31, 2017, respectively | | 6,446,734 |
| | 7,102,205 |
|
| Limited Partner's preferred equity, 86,874 Limited Partner Series F Preferred Units issued and outstanding as of each of December 31, 2018 and December 31, 2017 | | 2,883 |
| | 3,027 |
|
| Limited Partner's common equity, 23,715,908 and 23,748,347 Limited Partner OP Units issued and outstanding as of December 31, 2018 and December 31, 2017, respectively | | 138,931 |
| | 154,266 |
|
| Total partners’ equity | | 7,298,873 |
|
| 8,041,571 |
|
| Non-controlling interests | | 1,271 |
| | 1,305 |
|
| Total equity | | 7,300,144 |
|
| 8,042,876 |
|
| Total liabilities and equity | | $ | 13,963,493 |
|
| $ | 14,705,578 |
|
The accompanying notes are an integral part of these statements.
VEREIT OPERATING PARTNERSHIP, L.P.
CONSOLIDATED STATEMENTS OF OPERATIONS
(In thousands, except for per unit data)
|
| | | | | | | | | | | | |
| | | Year Ended December 31, |
| | | 2018 | | 2017 | | 2016 |
| Rental revenue | | $ | 1,257,867 |
| | $ | 1,252,285 |
| | $ | 1,335,447 |
|
| Operating expenses: | | | | | | |
| Acquisition-related | | 3,632 |
| | 3,402 |
| | 1,321 |
|
| Litigation, merger and other non-routine costs, net of insurance recoveries | | 290,963 |
| | 47,960 |
| | 3,884 |
|
| Property operating | | 126,461 |
| | 128,717 |
| | 144,428 |
|
| General and administrative | | 63,933 |
| | 58,603 |
| | 51,927 |
|
| Depreciation and amortization | | 640,618 |
| | 706,802 |
| | 762,038 |
|
| Impairments | | 54,647 |
| | 50,548 |
| | 182,820 |
|
| Total operating expenses | | 1,180,254 |
|
| 996,032 |
| | 1,146,418 |
|
| Other (expense) income: | | | | | | |
| Interest expense | | (280,887 | ) | | (289,766 | ) | | (317,376 | ) |
| Gain (loss) on extinguishment and forgiveness of debt, net | | 5,360 |
| | 18,373 |
| | (771 | ) |
| Other income, net | | 14,735 |
| | 6,242 |
| | 5,251 |
|
| Equity in income and gain on disposition of unconsolidated entities | | 1,869 |
| | 2,763 |
| | 9,783 |
|
| Gain (loss) on derivative instruments, net | | 355 |
| | 2,976 |
| | (1,191 | ) |
| Gain on disposition of real estate and real estate assets held for sale, net | | 94,331 |
| | 61,536 |
| | 45,524 |
|
| Total other expenses, net | | (164,237 | ) |
| (197,876 | ) | | (258,780 | ) |
| (Loss) income before taxes | | (86,624 | ) |
| 58,377 |
| | (69,751 | ) |
| Provision for income taxes | | (5,101 | ) | | (6,882 | ) | | (7,136 | ) |
| (Loss) income from continuing operations | | (91,725 | ) | | 51,495 |
| | (76,887 | ) |
| Income (loss) from discontinued operations, net of income taxes | | 3,695 |
| | (19,117 | ) | | (123,937 | ) |
| Net (loss) income | | (88,030 | ) |
| 32,378 |
| | (200,824 | ) |
Net loss attributable to non-controlling interests (1) | | 154 |
| | 194 |
| | 14 |
|
| Net (loss) income attributable to the OP | | $ | (87,876 | ) |
| $ | 32,572 |
| | $ | (200,810 | ) |
| | | | | | | |
| Basic and diluted net loss per unit from continuing operations attributable to common unitholders | | $ | (0.17 | ) | | $ | (0.02 | ) | | $ | (0.16 | ) |
| Basic and diluted net income (loss) per unit from discontinued operations attributable to common unitholders | | $ | 0.00 |
| | $ | (0.02 | ) | | $ | (0.13 | ) |
Basic and diluted net loss per unit attributable to common unitholders (2) | | $ | (0.16 | ) | | $ | (0.04 | ) | | $ | (0.29 | ) |
| |
| (1) | Represents net loss attributable to consolidated joint venture partners. |
| |
| (2) | Amounts may not total due to rounding. |
The accompanying notes are an integral part of these statements.
VEREIT OPERATING PARTNERSHIP, L.P.
CONSOLIDATED STATEMENTS OF COMPREHENSIVE INCOME (LOSS)
(In thousands)
|
| | | | | | | | | | | | |
| | | Year Ended December 31, |
| | | 2018 | | 2017 | | 2016 |
| Net (loss) income | | $ | (88,030 | ) | | $ | 32,378 |
| | $ | (200,824 | ) |
| Other comprehensive income (loss): | | | | | | |
| Unrealized gain (loss) on interest rate derivatives | | — |
| | (18 | ) | | (7,685 | ) |
| Reclassification of previous unrealized loss (gain) on interest rate derivatives into net (loss) income | | 313 |
| | (70 | ) | | 9,397 |
|
| Unrealized loss on investment securities, net | | (205 | ) | | (951 | ) | | (2,271 | ) |
| Reclassification of previous unrealized loss (gain) on investment securities into net (loss) income as other income, net | | 2,237 |
| | — |
| | — |
|
| Total other comprehensive income (loss) | | 2,345 |
|
| (1,039 | ) | | (559 | ) |
| | | | | | | |
| Total comprehensive (loss) income | | (85,685 | ) |
| 31,339 |
| | (201,383 | ) |
Comprehensive loss attributable to non-controlling interests (1) | | 154 |
| | 194 |
| | 14 |
|
| Total comprehensive (loss) income attributable to the OP | | $ | (85,531 | ) |
| $ | 31,533 |
| | $ | (201,369 | ) |
| |
| (1) | Represents comprehensive loss attributable to consolidated joint venture partners. |
The accompanying notes are an integral part of these statements.
VEREIT OPERATING PARTNERSHIP, L.P.
CONSOLIDATED STATEMENTS OF CHANGES IN EQUITY
(In thousands, except for unit data)
|
| | | | | | | | | | | | | | | | | | | | | | | | | | | | | | | | | | | | | | | | |
| | | Preferred Units | | Common Units | | | | | | |
| | | General Partner | | Limited Partner | | General Partner | | Limited Partner | | | | | | |
| | | Number of Units | | Capital | | Number of Units | | Capital | | Number of Units | | Capital | | Number of Units | | Capital | | Total Partners' Capital | | Non-Controlling Interests | | Total Capital |
| Balance, January 1, 2016 | | 42,834,138 |
| | $ | 925,569 |
| | 86,874 |
| | $ | 3,315 |
| | 904,884,394 |
| | $ | 7,598,418 |
| | 23,763,797 |
| | $ | 184,800 |
|
| $ | 8,712,102 |
| | $ | 1,857 |
|
| $ | 8,713,959 |
|
| Issuance of common OP Units | | — |
| | — |
| | — |
| | — |
| | 69,000,000 |
| | 702,476 |
| | — |
| | — |
| | 702,476 |
| | — |
| | 702,476 |
|
| Conversion of limited partners' common OP Units to General Partner's common OP Units | | — |
| | — |
| | — |
| | — |
| | 15,450 |
| | 159 |
| | (15,450 | ) | | (159 | ) | | — |
| | — |
| | — |
|
| Repurchases of common OP Units to settle tax obligation | | — |
| | — |
| | — |
| | — |
| | (481,261 | ) | | (4,652 | ) | | — |
| | — |
| | (4,652 | ) | | — |
| | (4,652 | ) |
| Equity-based compensation, net | | — |
| | — |
| | — |
| | — |
| | 728,067 |
| | 10,728 |
| | — |
| | — |
| | 10,728 |
| | — |
| | 10,728 |
|
| Contributions from non-controlling interest holders | | — |
| | — |
| | — |
| | — |
| | — |
| | — |
| | — |
| | — |
| | — |
| | 675 |
| | 675 |
|
| Distributions to common OP Units and non-controlling interests —$0.55 per common unit | | — |
| | — |
| | — |
| | — |
| | — |
| | (515,935 | ) | | — |
| | (13,068 | ) | | (529,003 | ) | | (115 | ) | | (529,118 | ) |
| Dividend equivalents on awards granted under the Equity Plan | | — |
| | — |
| | — |
| | — |
| | — |
| | (1,260 | ) | | — |
| | — |
| | (1,260 | ) | | — |
| | (1,260 | ) |
| Distributions to preferred OP Units | | — |
| | (71,748 | ) | | — |
| | (144 | ) | | — |
| | — |
| | — |
| | — |
| | (71,892 | ) | | — |
| | (71,892 | ) |
| Net loss | | — |
| | — |
| | — |
| | — |
| | — |
| | (195,863 | ) | | — |
| | (4,947 | ) | | (200,810 | ) | | (14 | ) | | (200,824 | ) |
| Other comprehensive loss | | — |
| | — |
| | — |
| | — |
| | — |
| | (531 | ) | | — |
| | (28 | ) | | (559 | ) | | — |
| | (559 | ) |
| Balance, December 31, 2016 | | 42,834,138 |
|
| $ | 853,821 |
|
| 86,874 |
|
| $ | 3,171 |
|
| 974,146,650 |
|
| $ | 7,593,540 |
|
| 23,748,347 |
|
| $ | 166,598 |
|
| $ | 8,617,130 |
|
| $ | 2,403 |
|
| $ | 8,619,533 |
|
| Repurchases of common OP Units under the 2017 Share Repurchase Program | | — |
| | — |
| | — |
| | — |
| | (68,759 | ) | | (518 | ) | | — |
| | — |
| | (518 | ) | | — |
| | (518 | ) |
| Repurchases of common OP Units to settle tax obligation | | — |
| | — |
| | — |
| | — |
| | (268,550 | ) | | (2,148 | ) | | — |
| | — |
| | (2,148 | ) | | — |
| | (2,148 | ) |
| Equity-based compensation, net | | — |
| | — |
| | — |
| | — |
| | 399,242 |
| | 16,754 |
| | — |
| | — |
| | 16,754 |
| | — |
| | 16,754 |
|
| Contributions from non-controlling interest holders | | — |
| | — |
| | — |
| | — |
| | — |
| | — |
| | — |
| | — |
| | — |
| | 101 |
| | 101 |
|
| Distributions to common OP Units and non-controlling interests —$0.55 per common unit | | — |
| | — |
| | — |
| | — |
| | — |
| | (535,657 | ) | | — |
| | (13,060 | ) | | (548,717 | ) | | (167 | ) | | (548,884 | ) |
| Dividend equivalents on awards granted under the Equity Plan | | — |
| | — |
| | — |
| | — |
| | — |
| | (571 | ) | | — |
| | — |
| | (571 | ) | | — |
| | (571 | ) |
| Distributions to preferred OP Units | | — |
| | (71,748 | ) | | — |
| | (144 | ) | | — |
| | — |
| | — |
| | — |
| | (71,892 | ) | | — |
| | (71,892 | ) |
| Disposition of consolidated joint venture interest | | — |
| | — |
| | — |
| | — |
| | — |
| | — |
| | — |
| | — |
| | — |
| | (838 | ) | | (838 | ) |
| Net income (loss) | | — |
| | — |
| | — |
| | — |
| | — |
| | 31,818 |
| | — |
| | 754 |
| | 32,572 |
| | (194 | ) | | 32,378 |
|
| Other comprehensive loss | | — |
| | — |
| | — |
| | — |
| | — |
| | (1,013 | ) | | — |
| | (26 | ) | | (1,039 | ) | | — |
| | (1,039 | ) |
| Balance, December 31, 2017 | | 42,834,138 |
|
| $ | 782,073 |
|
| 86,874 |
|
| $ | 3,027 |
|
| 974,208,583 |
|
| $ | 7,102,205 |
|
| 23,748,347 |
|
| $ | 154,266 |
|
| $ | 8,041,571 |
|
| $ | 1,305 |
|
| $ | 8,042,876 |
|
| Conversion of limited partners' common OP Units to General Partner's common OP Units | | — |
| | — |
| | — |
| | — |
| | 32,439 |
| | 241 |
| | (32,439 | ) | | (241 | ) | | — |
| | — |
| | — |
|
| Repurchases of common OP Units under Share Repurchase Programs | | — |
| | — |
| | — |
| | — |
| | (7,206,876 | ) | | (50,154 | ) | | — |
| | — |
| | (50,154 | ) | | — |
| | (50,154 | ) |
| Repurchases of common OP Units to settle tax obligation | | — |
| | — |
| | — |
| | — |
| | (324,502 | ) | | (2,326 | ) | | — |
| | — |
| | (2,326 | ) | | — |
| | (2,326 | ) |
| Equity-based compensation, net | | — |
| | — |
| | — |
| | — |
| | 805,521 |
| | 13,314 |
| | — |
| | — |
| | 13,314 |
| | — |
| | 13,314 |
|
| Contributions from non-controlling interest holders | | — |
| | — |
| | — |
| | — |
| | — |
| | — |
| | — |
| | — |
| | — |
| | 120 |
| | 120 |
|
| Distributions to common OP Units and non-controlling interests —$0.55 per common unit | | — |
| | — |
| | — |
| | — |
| | — |
| | (532,144 | ) | | — |
| | (13,048 | ) | | (545,192 | ) | | — |
| | (545,192 | ) |
VEREIT OPERATING PARTNERSHIP, L.P.
CONSOLIDATED STATEMENTS OF CHANGES IN EQUITY – (Continued)
(In thousands, except for unit data)
|
| | | | | | | | | | | | | | | | | | | | | | | | | | | | | | | | | | | | | | | | |
| | | Preferred Units | | Common Units | | | | | | |
| | | General Partner | | Limited Partner | | General Partner | | Limited Partner | | | | | | |
| | | Number of Units | | Capital | | Number of Units | | Capital | | Number of Units | | Capital | | Number of Units | | Capital | | Total Partners' Capital | | Non-Controlling Interests | | Total Capital |
| Dividend equivalents on awards granted under the Equity Plan | | — |
| | $ | — |
| | — |
| | $ | — |
| | — |
| | $ | (917 | ) | | — |
| | $ | — |
| | $ | (917 | ) | | $ | — |
| | $ | (917 | ) |
| Distributions to preferred OP Units | | — |
| | (71,748 | ) | | — |
| | (144 | ) | | — |
| | — |
| | — |
| | — |
| | (71,892 | ) | | — |
| | (71,892 | ) |
| Net loss | | — |
| | — |
| | — |
| | — |
| | — |
| | (85,774 | ) | | — |
| | (2,102 | ) | | (87,876 | ) | | (154 | ) | | (88,030 | ) |
| Other comprehensive income | | — |
| | — |
| | — |
| | — |
| | — |
| | 2,289 |
| | — |
| | 56 |
| | 2,345 |
| | — |
| | 2,345 |
|
| Balance, December 31, 2018 | | 42,834,138 |
| | $ | 710,325 |
| | 86,874 |
| | $ | 2,883 |
| | 967,515,165 |
| | $ | 6,446,734 |
| | 23,715,908 |
| | $ | 138,931 |
| | $ | 7,298,873 |
| | $ | 1,271 |
| | $ | 7,300,144 |
|
The accompanying notes are an integral part of these statements.
VEREIT OPERATING PARTNERSHIP, L.P.
CONSOLIDATED STATEMENTS OF CASH FLOWS
(In thousands)
|
| | | | | | | | | | | | |
| | | Year Ended December 31, |
| | | 2018 | | 2017 | | 2016 |
| Cash flows from operating activities: | | | | | | |
| Net (loss) income | | $ | (88,030 | ) | | $ | 32,378 |
| | $ | (200,824 | ) |
| Adjustments to reconcile net (loss) income to net cash provided by operating activities: | | | | | | |
| Depreciation and amortization | | 659,948 |
| | 745,499 |
| | 806,548 |
|
| Gain on real estate assets, net | | (96,068 | ) | | (61,536 | ) | | (55,722 | ) |
| Impairments from held for sale | | — |
| | 20,027 |
| | — |
|
| Impairments | | 54,647 |
| | 50,548 |
| | 303,751 |
|
| Equity based compensation | | 13,314 |
| | 16,751 |
| | 10,728 |
|
| Equity in income of unconsolidated entities | | (1,869 | ) | | (2,726 | ) | | 415 |
|
| Distributions from unconsolidated entities | | 1,366 |
| | 3,646 |
| | 1,433 |
|
| Gain on investments | | (4,092 | ) | | (65 | ) | | — |
|
| (Gain) loss on derivative instruments, net | | (355 | ) | | (2,976 | ) | | 1,191 |
|
| (Gain) loss on extinguishment of debt and forgiveness of debt | | (5,360 | ) | | (18,373 | ) | | 771 |
|
| Changes in assets and liabilities: | | | | | | |
| Investment in direct financing leases | | 2,078 |
| | 2,097 |
| | 3,976 |
|
| Rent and tenant receivables and other assets, net | | (34,096 | ) | | (21,394 | ) | | (52,626 | ) |
| Due from affiliates | | — |
| | 1,163 |
| | (416 | ) |
| Assets held for sale classified as discontinued operations | | (2,492 | ) | | 13,812 |
| | — |
|
| Accounts payable and accrued expenses | | 1,688 |
| | 10,742 |
| | (3,323 | ) |
| Deferred rent and other liabilities | | 7,162 |
| | (395 | ) | | (17,740 | ) |
| Due to affiliates | | (66 | ) | | 50 |
| | (214 | ) |
| Liabilities related to discontinued operations | | (13,861 | ) | | 4,019 |
| | — |
|
| Net cash provided by operating activities | | 493,914 |
|
| 793,267 |
| | 797,948 |
|
| Cash flows from investing activities: | | | | | | |
| Investments in real estate assets | | (500,625 | ) | | (699,004 | ) | | (100,194 | ) |
| Capital expenditures and leasing costs | | (22,291 | ) | | (21,694 | ) | | (16,568 | ) |
| Real estate developments | | (9,221 | ) | | (14,850 | ) | | (17,411 | ) |
| Principal repayments received on investment securities and mortgage notes receivable | | 5,761 |
| | 6,796 |
| | 5,417 |
|
| Investments in unconsolidated entities | | (771 | ) | | — |
| | (25,777 | ) |
| Return of investment from unconsolidated entities | | 48 |
| | 1,972 |
| | 2,580 |
|
| Proceeds from disposition of real estate and joint venture | | 502,289 |
| | 445,525 |
| | 1,000,700 |
|
| Proceeds from disposition of discontinued operations | | 122,915 |
| | — |
| | — |
|
| Investment in leasehold improvements and other assets | | (841 | ) | | (1,191 | ) | | (2,259 | ) |
| Deposits for real estate assets | | (13,412 | ) | | (37,226 | ) | | (17,856 | ) |
| Proceeds from sale of investments and other assets | | 46,966 |
| | 400 |
| | — |
|
| Uses and refunds of deposits for real estate assets | | 17,267 |
| | 36,111 |
| | 13,305 |
|
| Proceeds from the settlement of property-related insurance claims | | 1,434 |
| | 355 |
| | — |
|
| Line of credit advances to Cole REITs | | (2,200 | ) | | (16,400 | ) | | (10,300 | ) |
| Line of credit repayments from Cole REITs | | 3,800 |
| | 25,100 |
| | 50,000 |
|
| Net cash provided by (used in) investing activities | | 151,119 |
| | (274,106 | ) | | 881,637 |
|
| Cash flows from financing activities: | | | | | | |
| Proceeds from mortgage notes payable | | 187 |
| | 4,652 |
| | 3,112 |
|
| Payments on mortgage notes payable and other debt, including debt extinguishment costs | | (137,887 | ) | | (424,385 | ) | | (337,022 | ) |
| Proceeds from credit facility | | 1,934,000 |
| | 329,000 |
| | 1,033,000 |
|
| Payments on credit facility | | (1,716,000 | ) | | (645,107 | ) | | (1,993,000 | ) |
| Proceeds from corporate bonds | | 546,304 |
| | 600,000 |
| | 1,000,000 |
|
| Payments on corporate bonds, including extinguishment costs | | — |
| | — |
| | (1,311,203 | ) |
| Repayment of convertible notes | | (597,500 | ) | | — |
| | — |
|
| Payments of deferred financing costs | | (25,471 | ) | | (9,575 | ) | | (19,872 | ) |
| Proceeds from 2016 term loan | | — |
| | — |
| | 300,000 |
|
| Repayment of 2016 term loan | | — |
| | — |
| | (300,000 | ) |
VEREIT OPERATING PARTNERSHIP, L.P.
CONSOLIDATED STATEMENTS OF CASH FLOWS – (Continued)
(In thousands)
|
| | | | | | | | | | | | |
| | | Year Ended December 31, |
| | | 2018 | | 2017 | | 2016 |
| Repurchases of Common Stock under the Share Repurchase Programs | | $ | (50,154 | ) | | $ | (518 | ) | | $ | — |
|
| Repurchases of Common Stock to settle tax obligations | | (2,326 | ) | | (2,148 | ) | | (4,652 | ) |
| Proceeds from the issuance of common OP Units, net of underwriters’ discount | | — |
| | — |
| | 702,765 |
|
| Payments of equity issuance costs | | — |
| | — |
| | (280 | ) |
| Contributions from non-controlling interest holders | | 120 |
| | 101 |
| | 675 |
|
| Distributions paid | | (606,679 | ) | | (608,615 | ) | | (580,508 | ) |
| Net cash used in financing activities | | (655,406 | ) |
| (756,595 | ) | | (1,506,985 | ) |
| Net change in cash and cash equivalents and restricted cash | | (10,373 | ) | | (237,434 | ) | | 172,600 |
|
| | | | | | | |
| Cash and cash equivalents and restricted cash, beginning of period | | $ | 64,036 |
| | $ | 301,470 |
| | $ | 128,870 |
|
| Less: cash and cash equivalents of discontinued operations | | (2,198 | ) | | (2,973 | ) | | (4,968 | ) |
| Cash and cash equivalents and restricted cash from continuing operations, beginning of period | | 61,838 |
| | 298,497 |
| | 123,902 |
|
| | | | | | | |
| Cash and cash equivalents, and restricted cash, end of period | | 53,663 |
| | 64,036 |
| | 301,470 |
|
| Less: cash and cash equivalents of discontinued operations | | — |
| | (2,198 | ) | | (2,973 | ) |
| Cash and cash equivalents and restricted cash from continuing operations, end of period | | $ | 53,663 |
| | $ | 61,838 |
| | $ | 298,497 |
|
| Reconciliation of Cash and Cash Equivalents and Restricted Cash | | | | | | |
| Cash and cash equivalents at beginning of period | | $ | 34,176 |
| | $ | 253,479 |
| | $ | 64,135 |
|
| Restricted cash at beginning of period | | 27,662 |
| | 45,018 |
| | 59,767 |
|
| Cash and cash equivalents and restricted cash at beginning of period | | 61,838 |
| | 298,497 |
| | 123,902 |
|
| | | | | | | |
| Cash and cash equivalents at end of period | | 30,758 |
| | 34,176 |
| | 253,479 |
|
| Restricted cash at end of period | | 22,905 |
| | 27,662 |
| | 45,018 |
|
| Cash and cash equivalents and restricted cash at end of period | | $ | 53,663 |
| | $ | 61,838 |
| | $ | 298,497 |
|
The accompanying notes are an integral part of these statements.
VEREIT, INC. and VEREIT OPERATING PARTNERSHIP, L.P.
NOTES TO CONSOLIDATED FINANCIAL STATEMENTS
December 31, 2018
Note 1 – Organization
VEREIT is a Maryland corporation, incorporated on December 2, 2010, that qualified as a real estate investment trust (“REIT”) for U.S. federal income tax purposes beginning in the taxable year ended December 31, 2011. The OP is a Delaware limited partnership of which the General Partner is the sole general partner. VEREIT’s common stock, par value $0.01 per share (“Common Stock”), and its 6.70% Series F Cumulative Redeemable Preferred Stock, par value $0.01 per share (“Series F Preferred Stock”) trade on the New York Stock Exchange (“NYSE”) under the trading symbols, “VER” and “VER PRF,” respectively. As used herein, the terms the “Company,” “we,” “our” and “us” refer to VEREIT, together with its consolidated subsidiaries, including the OP.
VEREIT is a full-service real estate operating company which owns and manages one of the largest portfolios of single-tenant commercial properties in the U.S. VEREIT’s business model provides equity capital to creditworthy corporations in return for long-term leases on their properties. The Company actively manages its portfolio considering a number of metrics including property type, concentration and key economic factors for appropriate balance and diversity.
Substantially all of the Company’s operations are conducted through the OP. VEREIT is the sole general partner and holder of 97.6% of the common equity interests in the OP as of December 31, 2018 with the remaining 2.4% of the common equity interests owned by unaffiliated investors and certain former directors, officers and employees of ARC Properties Advisors, LLC (the “Former Manager”). Under the limited partnership agreement of the OP, as amended (the “LPA”), after holding units of limited partner interests in the OP (“OP Units”), including Series F Preferred Units, for a period of one year and meeting the other requirements in the LPA, unless an earlier redemption is otherwise consented to by VEREIT, holders of OP Units, including Series F Preferred Units, have the right to redeem the units for the cash value of a corresponding number of shares of VEREIT’s Common Stock or VEREIT’s Series F Preferred Stock, as applicable, or, at the option of VEREIT, a corresponding number of shares of VEREIT’s Common Stock or Series F Preferred Stock. The remaining rights of the holders of OP Units are limited, however, and do not include the ability to replace the General Partner or to approve the sale, purchase or refinancing of the OP’s assets.
The actions of the OP and its relationship with the General Partner are governed by the LPA. The General Partner does not have any significant assets other than its investment in the OP. Therefore, the assets and liabilities of the General Partner and the OP are the same. Additionally, pursuant to the LPA, all administrative expenses and expenses associated with the formation, continuity, existence and operation of the General Partner incurred by the General Partner on the OP’s behalf shall be treated as expenses of the OP. Further, when the General Partner issues any equity instrument that has been approved by the General Partner’s Board of Directors, the LPA requires the OP to issue to the General Partner equity instruments with substantially similar terms, to protect the integrity of the Company’s umbrella partnership REIT structure, pursuant to which each holder of interests in the OP has a proportionate economic interest in the OP reflecting its capital contributions thereto. OP Units and Series F Preferred Units issued to the General Partner are referred to as “General Partner OP Units” and “General Partner Series F Preferred Units,” respectively. OP Units and Series F Preferred Units issued to parties other than the General Partner are referred to as “Limited Partner OP Units” and “Limited Partner Series F Preferred Units,” respectively. The LPA also provides that the OP issue debt with terms and provisions consistent with debt issued by the General Partner. The LPA will be amended to provide for the issuance of any additional class of equivalent equity instruments to the extent the General Partner’s Board of Directors authorizes the issuance of any new class of equity securities.
As discussed in Note 4 —Discontinued Operations, on February 1, 2018, the Company completed the sale of its investment management segment, Cole Capital. The assets, liabilities and related financial results of substantially all of the Cole Capital segment are reflected in the financial statements as discontinued operations.
Note 2 –Summary of Significant Accounting Policies
Basis of Accounting
The consolidated financial statements of the Company presented herein include the accounts of the General Partner and its consolidated subsidiaries, including the OP. All intercompany transactions have been eliminated upon consolidation. The financial statements are prepared on the accrual basis of accounting in accordance with generally accepted accounting principles in the United States (“U.S. GAAP”).
Principles of Consolidation and Basis of Presentation
The consolidated financial statements include the accounts of the Company and its consolidated subsidiaries and consolidated joint venture arrangements. The portions of the consolidated joint venture arrangements not owned by the Company are presented
VEREIT, INC. and VEREIT OPERATING PARTNERSHIP, L.P.
NOTES TO CONSOLIDATED FINANCIAL STATEMENTS
December 31, 2018 – (Continued)
as non-controlling interests in VEREIT’s and the OP’s consolidated balance sheets, statements of operations, statements of comprehensive income (loss) and statements of changes in equity. In addition, as described in Note 1 – Organization, certain third parties have been issued OP Units. Holders of OP Units are considered to be non-controlling interest holders in the OP and their ownership interest in the limited partner’s share is presented as non-controlling interests in VEREIT’s consolidated balance sheets, statements of operations, statements of comprehensive income (loss) and statements of changes in equity. Further, a portion of the earnings and losses of the OP are allocated to non-controlling interest holders based on their respective ownership percentages. Upon conversion of OP Units to Common Stock, any difference between the fair value of shares of Common Stock issued and the carrying value of the OP Units converted is recorded as a component of equity. As of each of December 31, 2018 and 2017, there were approximately 23.7 million Limited Partner OP Units outstanding.
For legal entities being evaluated for consolidation, the Company must first determine whether the interests that it holds and fees it receives qualify as variable interests in the entity. A variable interest is an investment or other interest that will absorb portions of an entity’s expected losses or receive portions of the entity’s expected residual returns. The Company’s evaluation includes consideration of fees paid to the Company where the Company acts as a decision maker or service provider to the entity being evaluated. If the Company determines that it holds a variable interest in an entity, it evaluates whether that entity is a variable interest entity (“VIE”). VIEs are entities where investors lack sufficient equity at risk for the entity to finance its activities without additional subordinated financial support or where equity investors, as a group, lack one of the following characteristics: (a) the power to direct the activities that most significantly impact the entity’s economic performance, (b) the obligation to absorb the expected losses of the entity, or (c) the right to receive the expected returns of the entity.
The Company then qualitatively assesses whether it is (or is not) the primary beneficiary of a VIE, which is generally defined as the party who has a controlling financial interest in the VIE. Consideration of various factors include, but are not limited to, the Company’s ability to direct the activities that most significantly impact the entity’s economic performance and its obligation to absorb losses from or right to receive benefits of the VIE that could potentially be significant to the VIE. The Company consolidates any VIEs when the Company is determined to be the primary beneficiary of the VIE and the difference between consolidating the VIE and accounting for it using the equity method could be material to the Company’s consolidated financial statements. The Company continually evaluates the need to consolidate these VIEs based on standards set forth in U.S. GAAP.
Reclassification
As described below, the following items previously reported have been reclassified to conform with the current period’s presentation.
The operating expense reimbursements line item has been combined into rental revenue for prior periods presented to be consistent with the current year presentation.
The investment in direct financing leases, net, investment securities, at fair value and mortgage notes receivable, net line items from prior periods have been combined into the rent and tenant receivables and other assets, net caption on the consolidated balance sheets. Investments in the Cole REITs, as defined in “Investment in Cole REITs” section herein, has also been reclassified as of December 31, 2017 to rent and tenant receivables and other assets, net from investment in unconsolidated entities to be consistent with the current year presentation. Refer to Note 5 – Rent and Tenant Receivables and Other Assets, Netfor reclassification amounts and additional information.
The distributions declared on Common Stock line item from prior periods has been updated to exclude distributions on restricted stock units (“Restricted Stock Units”) and deferred stock units (“Deferred Stock UnitsUnits”) on the consolidated statements of changes in equity for all periods presented. These amounts are now included in the line item dividend equivalents on awards granted under the Equity Plan (as defined in Note 12 – Equity-based Compensation), which also includes dividend equivalents on restricted shares of Common Stock (“Restricted Shares”). The dividend equivalents on Restricted Shares were previously included in the line item distributions to participating securities in the consolidated statements of changes in equity.
Use of Estimates
The preparation of financial statements in conformity with U.S. GAAP requires management to make estimates and assumptions that affect the reported amounts of assets and liabilities and disclosure of contingent assets and liabilities at the date of the financial statements and the reported amounts of revenues and expenses during the reporting period. Actual results could differ from those estimates. Management makes significant estimates regarding goodwill and intangible asset impairments, real estate investment impairment, allocation of purchase price of real estate asset acquisitions and income taxes.
VEREIT, INC. and VEREIT OPERATING PARTNERSHIP, L.P.
NOTES TO CONSOLIDATED FINANCIAL STATEMENTS
December 31, 2018 – (Continued)
Real Estate Investments
The Company records acquired real estate at cost and makes assessments as to the useful lives of depreciable assets. The Company considers the period of future benefit of the asset to determine the appropriate useful lives. Depreciation is computed using a straight-line method over the estimated useful life of 40 years for buildings, five to 15 years for building fixtures and improvements and the remaining lease term for intangible lease assets.
Allocation of Purchase Price of Real Estate Assets
The Company allocates the purchase price of acquired properties to tangible and identifiable intangible assets and liabilities acquired based on their relative fair values. Tangible assets include land, buildings, fixtures and improvements on an as-if vacant basis. The Company utilizes various estimates, processes and information to determine the as-if vacant property value. Identifiable intangible assets and liabilities include amounts allocated to acquired leases for above-market and below-market lease rates and the value of in-place leases. In estimating fair values for purposes of allocating purchase price, the Company utilizes a number of sources, including independent appraisals that may be obtained in connection with the acquisition or financing of the respective property and other market data. The Company also considers information obtained about each property as a result of its pre-acquisition due diligence, as well as subsequent marketing and leasing activities, in estimating the fair value of the tangible and intangible assets acquired and intangible liabilities assumed.
The aggregate value of intangible assets related to in-place leases is primarily the difference between the property valued with existing in-place leases adjusted to market rental rates and the property valued as if vacant. Factors considered by the Company in its analysis of the in-place lease intangibles include an estimate of carrying costs during the expected lease-up period for each property, taking into account current market conditions and costs to execute similar leases. In estimating carrying costs, the Company includes real estate taxes, insurance and other operating expenses and estimates of lost rentals at market rates during the expected lease-up period, which typically ranges from six to 18 months. The Company also estimates costs to execute similar leases, including leasing commissions, legal and other related expenses. The value of in-place leases is amortized over the initial term of the respective leases. If a tenant terminates its lease, then the unamortized portion of the in-place lease value is charged to expense.
Above-market and below-market in-place lease values for owned properties are recorded based on the present value (using an interest rate which reflects the risks associated with the leases acquired) of the difference between the contractual amounts to be paid pursuant to the in-place leases and management’s estimate of fair market lease rates for the corresponding in-place leases, measured over a period equal to the remaining non-cancelable term of the lease, including any bargain renewal periods. Above-market leases are amortized as a reduction to rental revenue over the remaining terms of the respective leases. Below-market leases are amortized as an increase to rental revenue over the remaining terms of the respective leases, including any bargain renewal periods.
The determination of the fair values of the real estate assets and liabilities acquired requires the use of significant assumptions with regard to the current market rental rates, rental growth rates, capitalization and discount rates, interest rates and other variables. The use of alternative estimates may result in a different allocation of the Company’s purchase price, which could materially impact the Company’s results of operations.
In January 2017, the Company elected to early adopt ASU 2017-01, Business Combinations (Topic 805): Clarifying the Definition of a Business (“ASU 2017-01”), which clarifies the definition of a business by adding guidance to assist entities in evaluating whether transactions should be accounted for as acquisitions of assets or businesses. During the years ended December 31, 2018 and 2017, all real estate acquisitions qualified as asset acquisitions, and external acquisition costs related to asset acquisitions were capitalized and allocated to tangible and intangible assets and liabilities as described above. Prior to January 1, 2017, external costs related to property acquisitions were expensed as incurred. Internal costs, such as employee salaries, related to activities necessary to complete, or affect, self-originating asset acquisitions or business combinations are classified as acquisition-related expenses in the accompanying consolidated statements of operations for all periods presented.
Assets Held for Sale
Upon classifying a real estate investment as held for sale, the Company will no longer recognize depreciation expense related to the depreciable assets of the property. Assets held for sale are recorded at the lower of carrying value or estimated fair value, less the estimated cost to dispose of the assets. See Note 3–Real Estate Investments and Related Intangibles for further discussion regarding properties held for sale.
If circumstances arise that the Company previously considered unlikely and, as a result, the Company decides not to sell a property previously classified as held for sale, the Company will reclassify the property as held and used. The Company measures and records a property that is reclassified as held and used at the lower of (i) its carrying value before the property was classified
VEREIT, INC. and VEREIT OPERATING PARTNERSHIP, L.P.
NOTES TO CONSOLIDATED FINANCIAL STATEMENTS
December 31, 2018 – (Continued)
as held for sale, adjusted for any depreciation expense that would have been recognized had the property been continuously classified as held and used or (ii) the estimated fair value at the date of the subsequent decision not to sell.
Development Activities
Project costs, which include interest expense, associated with the development, construction and lease-up of a real estate project are capitalized as construction in progress. Once the development and construction of the building is substantially completed, the amounts capitalized to construction in progress are transferred to (i) land and (ii) buildings, fixtures and improvements and are depreciated over their respective useful lives.
Discontinued Operations
The Company reports discontinued operations when a component of an entity or group of components that has been disposed of or classified as held for sale represents a strategic shift that has or will have a major effect on an entity’s operations and financial results. The results of operations for assets meeting the definition of discontinued operations are reflected in the Company’s consolidated statements of operations as discontinued operations for all periods presented. See Note 4 —Discontinued Operations for further discussion regarding discontinued operations.
Investment in Unconsolidated Entities
Unconsolidated Joint Ventures
The Company accounts for its investment in unconsolidated joint venture arrangements using the equity method of accounting as the Company has the ability to exercise significant influence, but not control, over operating and financing policies of these investments. The equity method of accounting requires the investment to be initially recorded at cost and subsequently adjusted for the Company’s share of equity in the joint ventures’ earnings and distributions. The Company records its proportionate share of net income (loss) from the unconsolidated joint ventures in equity in income and gain on disposition of unconsolidated entities in the consolidated statements of operations. See Note 3–Real Estate Investments and Related Intangiblesfor further discussion on investments in unconsolidated joint ventures.
Investment in Cole REITs
As of December 31, 2017, the Company owned equity investments in Cole Credit Property Trust IV, Inc. (“CCPT IV”), CIM Income NAV, Inc. (formerly known as Cole Real Estate Income Strategy (Daily NAV), Inc.) (“INAV”), Cole Office & Industrial REIT (CCIT II), Inc. (“CCIT II”), Cole Office & Industrial REIT (CCIT III), Inc. (“CCIT III”), and Cole Credit Property Trust V, Inc. (“CCPT V” and collectively with CCPT IV, INAV, CCIT II and CCIT III, the “Cole REITs”). On February 1, 2018, the Company sold certain of its equity investments to CCA Acquisition, LLC (the “Cole Purchaser”), an affiliate of CIM Group, LLC, retaining interests in CCIT II, CCIT III and CCPT V. Subsequent to the sale of Cole Capital and the adoption of ASU 2016-01 (as defined in “Recent Accounting Pronouncements” section below), the Company carries these investments at fair value, as the Company does not exert significant influence over CCIT II, CCIT III or CCPT V, and any changes in the fair value are recognized in other income, net in the accompanying consolidated statement of operations for the year ended December 31, 2018.Prior to the sale of Cole Capital, the Company accounted for these investments using the equity method of accounting, which required the investment to be initially recorded at cost and subsequently adjusted for the Company’s share of equity in the respective Cole REIT’s earnings and distributions. The Company recorded its proportionate share of net income or loss from the Cole REITs in equity in income and gain on disposition of unconsolidated entities in the consolidated statement of operations for the year ended December 31, 2018.
Leasehold Improvements and Property and Equipment
The Company leases its corporate office facilities under operating leases. Leasehold improvements related to these are recorded at cost less accumulated amortization. Leasehold improvements are amortized over the lesser of the estimated useful life or remaining lease term.
Property and equipment, which typically include computer hardware and software, furniture and fixtures, among other items, are stated at cost less accumulated depreciation. Property and equipment are depreciated on a straight-line method over the estimated useful lives of the assets, which range from three to seven years. The Company reassesses the useful lives of its property and equipment and adjusts the future monthly depreciation expense based on the new useful life, as applicable. If the Company disposes of an asset, the asset and related accumulated depreciation are written off upon disposal.
VEREIT, INC. and VEREIT OPERATING PARTNERSHIP, L.P.
NOTES TO CONSOLIDATED FINANCIAL STATEMENTS
December 31, 2018 – (Continued)
Goodwill
In the case of a business combination, after identifying all tangible and intangible assets and liabilities, the excess consideration paid over the fair value of the assets and liabilities acquired and assumed, respectively, represents goodwill. In connection with prior mergers, the Company recorded goodwill as a result of the merger consideration exceeding the net assets acquired. As of December 31, 2018 and 2017, the carrying value of goodwill was $1.3 billion.
Prior to the adoption of ASU 2017-01 in January 2017, in the event the Company disposed of a property, or classified a property as an asset held for sale, that constituted a business under U.S. GAAP, the Company allocated a portion of the real estate investments reporting unit’s goodwill to that property in determining the gain or loss on the disposal of the property. The amount of goodwill allocated to the business was based on the relative fair value of the business to the fair value of the reporting unit. During the year ended December 31, 2016, the Company allocated $73.2 million of goodwill to dispositions and held for sale assets, which included $2.3 million of goodwill allocated to the cost basis of two properties foreclosed upon. The allocated goodwill of $73.2 million was included in gain on disposition of real estate and real estate assets held for sale, net, in the consolidated statement of operations.
Impairments
Real Estate Assets
The Company performs quarterly impairment review procedures, primarily through continuous monitoring of events and changes in circumstances that could indicate the carrying value of its real estate assets may not be recoverable. Impairment indicators that the Company considers include, but are not limited to, decrease in net operating income, bankruptcy or other credit concerns of a property’s major tenant or tenants, such as history of late payments, rental concessions and other factors, as well as significant decreases in a property’s revenues due to lease terminations, vacancies, co-tenancy clauses or reduced lease rates. When impairment indicators are identified or if a property is considered to have a more likely than not probability of being disposed of within the next 12 to 24 months, the Company assesses the recoverability of the assets by determining whether the carrying value of the assets will be recovered through the undiscounted future cash flows expected from the use of the assets and their eventual disposition. U.S. GAAP requires us to utilize the Company’s expected holding period of our properties when assessing recoverability. In the event that such expected undiscounted future cash flows do not exceed the carrying value, the Company will adjust the real estate assets to their respective fair values and recognize an impairment loss. Generally, fair value is determined using a discounted cash flow analysis and recent comparable sales or leasing transactions. The assumptions and uncertainties utilized in the evaluation of the impairment of real estate assets are discussed in Note 6 – Fair Value Measures.
Goodwill
The Company evaluates goodwill for impairment annually or more frequently when an event occurs or circumstances change that indicate the carrying value may not be recoverable. The Company’s annual testing date is during the fourth quarter. In 2017, the Company adopted ASU 2017-04, Intangibles – Goodwill and Others (Topic 350): Simplifying the Test for Goodwill Impairment, which allows the Company to test goodwill for impairment by comparing the carrying value of net assets to their respective fair value. If the fair value is determined to be less than the carrying value, an impairment charge will be recorded for the difference between the fair value and the carrying value. The Company estimates the fair value using discounted cash flows and relevant competitor multiples. The evaluation of goodwill for potential impairment requires the Company’s management to exercise significant judgment and to make certain assumptions. While the Company believes its assumptions are reasonable, there are no guarantees as to actual results. Changes in assumptions based on actual results may have a material impact on the Company’s financial results. The analysis performed for the annual goodwill tests during the years ended December 31, 2018, 2017 and 2016 resulted in no impairment. Goodwill related to discontinued operations is discussed in Note 4 —Discontinued Operations.
VEREIT, INC. and VEREIT OPERATING PARTNERSHIP, L.P.
NOTES TO CONSOLIDATED FINANCIAL STATEMENTS
December 31, 2018 – (Continued)
Investment in Unconsolidated Entities
The Company is required to determine whether an event or change in circumstances has occurred that may have a significant adverse effect on the fair value of any of its investment in the unconsolidated entities. If an event or change in circumstance has occurred, the Company is required to evaluate its investment in the unconsolidated entity for potential impairment and determine if the carrying value of its investment exceeds its fair value. An impairment charge is recorded when an impairment is deemed to be other-than-temporary. To determine whether an impairment is other-than-temporary, the Company considers whether it has the ability and intent to hold the investment until the carrying value is fully recovered. The evaluation of an investment in an unconsolidated entity for potential impairment requires the Company’s management to exercise significant judgment and to make certain assumptions. The use of different judgments and assumptions could result in different conclusions. No impairments of unconsolidated entities were identified during the years ended December 31, 2018, 2017 and 2016.
Leasehold Improvements and Property and Equipment
Leasehold improvements and property and equipment are reviewed for impairment when events or changes in circumstances indicate that the carrying value of such assets may not be recoverable. If this review indicates that the carrying value of the asset is not recoverable, the Company records an impairment loss, measured at fair value by estimated discounted cash flows or market appraisals. The evaluation of leasehold improvements and property and equipment for potential impairment requires the Company’s management to exercise significant judgment and to make certain assumptions. The use of different judgments and assumptions could result in different conclusions. No impairments of leasehold improvements and property and equipment were identified during the years ended December 31, 2018, 2017 and 2016.
Cash and Cash Equivalents
Cash and cash equivalents include cash in bank accounts, as well as investments in highly-liquid money market funds with original maturities of three months or less. The Company deposits cash with several high quality financial institutions. These deposits are guaranteed by the Federal Deposit Insurance Corporation (“FDIC”) up to an insurance limit of $250,000. At times, the Company’s cash and cash equivalents may exceed federally insured levels. Although the Company bears risk on amounts in excess of those insured by the FDIC, it has not experienced and does not anticipate any losses due to the high quality of the institutions where the deposits are held.
Restricted Cash
The Company had $22.9 million and $27.7 million, respectively, in restricted cash as of December 31, 2018 and 2017. Restricted cash primarily consists of reserves related to lease expirations, as well as maintenance, structural and debt service reserves. In accordance with certain debt agreements, rent from certain of the Company’s tenants is deposited directly into a lockbox account, from which the monthly debt service payments are disbursed to the lender and the excess funds are then disbursed to the Company. Included in restricted cash at December 31, 2018 was $21.5 million in lender reserves and $1.4 million held in restricted lockbox accounts. Included in restricted cash at December 31, 2017 was $26.4 million in lender reserves and $1.3 million held in restricted lockbox accounts.
Investment in Direct Financing Leases
The Company has acquired certain properties that are subject to leases that qualify as direct financing leases in accordance with U.S. GAAP due to the significance of the lease payments from the inception of the leases compared to the fair value of the property or due to bargain purchase options. Investments in direct financing leases represent the fair value of the remaining lease payments on the leases and the estimated fair value of any expected residual property value at the end of the lease term. The fair value of the remaining lease payments is estimated using a discounted cash flow analysis based on interest rates that would represent the Company’s incremental borrowing rate for similar types of debt. The expected residual property value at the end of the lease term is estimated using market data and assessments of the remaining useful lives of the properties at the end of the lease terms, among other factors. Income from direct financing leases is calculated using the effective interest method over the remaining term of the lease.
VEREIT, INC. and VEREIT OPERATING PARTNERSHIP, L.P.
NOTES TO CONSOLIDATED FINANCIAL STATEMENTS
December 31, 2018 – (Continued)
Deferred Financing Costs
Deferred financing costs represent commitment fees, legal fees and other costs associated with obtaining commitments for financing. Deferred financing costs, other than those associated with the Revolving Credit Facility (as defined in Note 7 –Debt), are presented on the consolidated balance sheets as a direct deduction from the carrying amount of the related debt liability rather than as an asset. These costs are amortized to interest expense over the terms of the respective financing agreements using the effective interest method. Unamortized deferred financing costs are written off when the associated debt is refinanced or repaid before maturity. Costs incurred in connection with potential financial transactions that are not completed are expensed in the period in which it is determined the financing will not be completed.
Convertible Debt
The Company has an outstanding aggregate balance of $402.5 million related to the 2020 Convertible Notes (as defined in Note 7 –Debt). The 2020 Convertible Notes are convertible into cash or shares of the Company’s Common Stock at the Company’s option. In accordance with U.S GAAP, the 2020 Convertible Notes are accounted for as a liability with a separate equity component recorded for the conversion option. A liability was recorded for the 2020 Convertible Notes on the issuance date at fair value based on a discounted cash flow analysis using current market rates for debt instruments with similar terms. The difference between the initial proceeds from the 2020 Convertible Notes and the estimated fair value of the debt instruments resulted in a debt discount, with an offset recorded to additional paid-in capital representing the equity component. The debt discount is being amortized to interest expense over the respective term of the 2020 Convertible Notes.
Derivative Instruments
The Company may use derivative financial instruments, including interest rate swaps, caps, options, floors and other interest rate derivative contracts, to hedge all or a portion of the interest rate risk associated with its borrowings. The principal objective of such agreements is to minimize the risks and/or costs associated with the Company’s operating and financial structure as well as to hedge specific anticipated transactions. The Company does not intend to utilize derivatives for purposes other than interest rate risk management.
The Company records all derivatives on the consolidated balance sheets at fair value. The accounting for changes in the fair value of derivatives depends on the intended use of the derivative, whether the Company has elected to designate a derivative in a hedging relationship and apply hedge accounting and whether the hedging relationship has satisfied the criteria necessary to apply hedge accounting. Derivatives designated and qualifying as a hedge of the exposure to changes in the fair value of an asset, liability, or firm commitment attributable to a particular risk, such as interest rate risk, are considered fair value hedges. Derivatives designated and qualifying as a hedge of the exposure to variability in expected future cash flows, or other types of forecasted transactions, are considered cash flow hedges. Derivatives may also be designated as hedges of the foreign currency exposure of a net investment in a foreign operation. Hedge accounting generally provides for the matching of the timing of gain or loss recognition on the hedging instrument with the recognition of the changes in the fair value of the hedged asset or liability that are attributable to the hedged risk in a fair value hedge or the earnings effect of the hedged forecasted transactions in a cash flow hedge. The Company may enter into derivative contracts that are intended to economically hedge certain of its risk, even though hedge accounting does not apply or the Company elects not to apply hedge accounting.
The accounting for subsequent changes in the fair value of these derivatives depends on whether each has been designated and qualifies for hedge accounting treatment. If the Company elects not to apply hedge accounting treatment, any changes in the fair value of these derivative instruments is recognized immediately in gain (loss) on derivative instruments, net in the consolidated statements of operations and consolidated statements of comprehensive income (loss). If the derivative is designated and qualifies for hedge accounting treatment, the change in the estimated fair value of the derivative is recorded in other comprehensive income (loss) to the extent that it is effective. Any ineffective portion of a derivative’s change in fair value will be immediately recognized in earnings.
As of December 31, 2018, the Company had one interest rate derivative that was not designated as a qualifying hedging relationship with a fair value of $0.5 million associated with a loan with a notional value of $50.7 million. As of December 31, 2017, the Company had two interest rate derivatives that were not designated as qualifying hedging relationships with an aggregate fair value of $0.6 million associated with loans with an aggregate notional value of $78.9 million. The fair value of the interest rate derivatives is included in rent and tenant receivables and other assets, net in the accompanying consolidated balance sheets.
Revenue Recognition
In May 2014, the U.S. Financial Accounting Standards Board (“FASB”) issued ASU 2014-09, Revenue from Contracts with Customers (“ASU 2014-09”) (Topic 606), which supersedes the revenue recognition requirements in Revenue Recognition,
VEREIT, INC. and VEREIT OPERATING PARTNERSHIP, L.P.
NOTES TO CONSOLIDATED FINANCIAL STATEMENTS
December 31, 2018 – (Continued)
Accounting Standards Codification (“ASC”) (Topic 605) and requires an entity to recognize revenue in a way that depicts the transfer of promised goods or services to customers in an amount that reflects the consideration to which the entity expects to be entitled in exchange for those goods or services. The Company adopted ASU 2014-09 and the related ASUs (collectively, the “Revenue ASUs”) during the first quarter of 2018 using the modified retrospective approach, which allows a cumulative effect adjustment to beginning retained earnings equal to initially applying the Revenue ASUs to all contracts with customers not completed as of the date of adoption. Adoption of the Revenue ASUs did not result in a cumulative effect adjustment to retained earnings as all contracts not completed as of adoption within the scope of Topic 606 have the same revenue recognition timing and measurement under Topic 605. Revenues generated through leasing arrangements are excluded from the Revenue ASUs as discussed below.
Revenue Recognition - Real Estate
The Company’s rental revenue is recognized when earned and collectability is reasonably assured and includes rental revenues and property operating expense reimbursements that each tenant pays in accordance with the terms of each lease. Rental revenue also includes amortization of above and below-market leases. Many of the leases have rent escalations and the rental revenue is recognized on a straight-line basis, which requires the Company to record a receivable that will only be received if the tenant makes all rent payments required through the expiration of the initial lease term. Straight-line rent receivables are included in rent and tenant receivables and other assets, net, in the consolidated balance sheets. See Note 5 – Rent and Tenant Receivables and Other Assets, Net. For leases that have contingent rental revenue based on a percentage of the tenant’s sales, the Company recognizes contingent rental revenue when the specified target is achieved.
The Company continually reviews receivables related to rent and unbilled rent receivables and determines collectability by taking into consideration the tenant’s payment history, the financial condition of the tenant, business conditions in the industry in which the tenant operates and economic conditions in the area in which the property is located. In the event that the collectability of a receivable is uncertain, the Company will record an increase in the allowance for uncollectible accounts in the consolidated balance sheets and bad debt expense in property operating expenses in the consolidated statements of operations. The Company suspends revenue recognition when the collectability of amounts due pursuant to a lease is no longer reasonably assured.
Revenue Recognition - Cole Capital
As discussed in Note 4 —Discontinued Operations, on February 1, 2018, the Company completed the sale of its investment management segment, Cole Capital. The assets, liabilities and related financial results of substantially all of the Cole Capital segment are reflected in the financial statements as discontinued operations.
Cole Capital earned securities sales commissions, dealer manager fees, distribution and stockholder servicing fees, real estate acquisition fees, financing coordination fees, property management fees, advisory fees, asset management fees and performance fees for services relating to the Cole REITs’ offerings and the investment and management of their respective assets, in accordance with the respective dealer manager and advisory agreements. The Company was also reimbursed for certain costs incurred in providing these services, which were recorded as revenue as the expenses were incurred subject to revenue constraint due to the limitations on the amount that was reimbursable based on the terms of the respective dealer manager and advisory agreements. Refer to Note 13 –Related Party Transactions and Arrangements for a disaggregation of Cole Capital revenues.
Revenue Recognition - Other
The Company entered into a services agreement (the “Services Agreement”) with the Cole Purchaser, pursuant to which the Company will continue to provide certain services to the Cole Purchaser and the Cole REITs, including operational real estate support, (“Transition Services Revenues”) through March 31, 2019 (or, if later, the date of the last government filing other than a tax filing made by any of the Cole REITs with respect to its 2018 fiscal year). Under the terms of the Services Agreement, the Company will be entitled to receive reimbursement for certain of the services provided. The Company recorded Transition Services Revenues as costs associated with providing such services were incurred, which coincided with the timing in which the performance obligations of the contract had been met. During the period from February 1, 2018 through December 31, 2018, the Company incurred $15.0 million of such costs and recognized revenues of $15.0 million, which are recorded in other income, net in the consolidated statement of operations. The Company may also receive additional fees over the next six years if future revenues of Cole Capital exceed a specified dollar threshold (the “Net Revenue Payments”), up to an aggregate of $80.0 million in Net Revenue Payments.
VEREIT, INC. and VEREIT OPERATING PARTNERSHIP, L.P.
NOTES TO CONSOLIDATED FINANCIAL STATEMENTS
December 31, 2018 – (Continued)
Litigation, Merger and Other Non-Routine Costs, Net of Insurance Recoveries
External costs incurred in relation to prior mergers and litigation resulting therefrom are included in litigation, merger and other non-routine costs, net of insurance recoveries in the consolidated statements of operations. The Company has also incurred legal fees and other costs associated with litigations and investigations resulting from the Audit Committee Investigation (defined below), which are considered non-routine. The Company has directors’ and officers’ insurance and the insurance carriers have paid certain defense costs subject to standard reservation of rights under the respective policies.
Litigation, merger and other non-routine costs, net of insurance recoveries include the following costs (amounts in thousands):
|
| | | | | | | | | | | | |
| | | Year Ended December 31, |
| | | 2018 | | 2017 | | 2016 |
| Merger Related Costs: | | | | | | |
Transfer taxes(1) | | $ | — |
| | $ | (1,595 | ) | | $ | 562 |
|
| Litigation and other non-routine costs: | | | | | | |
Audit Committee Investigation and related matters (2) | | $ | 59,755 |
| | $ | 49,434 |
| | $ | 24,207 |
|
Legal fees and expenses (3) | | 530 |
| | 421 |
| | 311 |
|
Litigation settlements (4) | | 233,246 |
| | — |
| | — |
|
| Total costs | | 293,531 |
|
| 48,260 |
| | 25,080 |
|
Insurance recoveries (5) | | (2,568 | ) | | (300 | ) | | (21,196 | ) |
| Total | | $ | 290,963 |
| | $ | 47,960 |
| | $ | 3,884 |
|
| |
| (1) | The negative balance for the year ended December 31, 2017 is a result of estimated costs accrued in prior periods that exceeded actual expenses incurred. |
| |
| (2) | Includes all fees and costs associated with various litigations and investigations prompted by the results of the 2014 investigation conducted by the audit committee (the “Audit Committee”) of the Company’s Board of Directors (the “Audit Committee Investigation”), including fees and costs incurred pursuant to the Company’s advancement obligations, litigation related thereto and in connection with related insurance recovery matters, net of accrual reversals. During the year ended December 31, 2018, the Company reversed an accrual of $10.9 million, as the Company was legally released from certain advancement obligations, and the accrued amounts were paid directly by the Company’s insurers to the payees subsequent to December 31, 2018. There were no reversals in the years ended December 31, 2017 and 2016. |
| |
| (3) | Includes legal fees and expenses associated with litigation resulting from prior mergers and related insurance recovery matters and excludes amounts presented in income from discontinued operations, net of income taxes in the consolidated statements of operations for the year ended December 31, 2018. |
| |
| (4) | Refer to Note 10– Commitments and Contingencies for additional information. |
| |
| (5) | $2.3 million recorded during the year ended December 31, 2018 relates to litigation resulting from prior mergers. |
Loss Contingencies
The Company records a liability in the consolidated financial statements for loss contingencies when a loss is known or considered probable and the amount is reasonably estimable. If the reasonable estimate of a known or probable loss is a range, and no amount within the range is a better estimate than any other, the minimum amount of the range is accrued. If a material loss is reasonably possible but not known or probable, and is reasonably estimable, the estimated loss or range of loss is disclosed.
Equity-based Compensation
The Company has an equity-based incentive award Deferred Stock Units toplan for non-executive directors, officers, other employees and advisors or consultants who provide services to the Company, as applicable, and a non-executive director restricted share plan, which are accounted for under U.S. GAAP for share-based payments. The expense for such awards is recognized over the vesting period or when the requirements for exercise of the award have been met. See Note 12 – Equity-based Compensation for additional information on these plans.
Per Share Data
Income (loss) per basic share of Common Stock is calculated by dividing net income (loss) less dividends on unvested Restricted Shares of Common Stock and dividends on preferred stock by the weighted-average number of shares of Common Stock issued and outstanding during such period. Diluted income (loss) per share of Common Stock considers the effect of potentially dilutive shares of Common Stock outstanding during the period.
Income Taxes
The General Partner elected to be taxed as a REIT for U.S. federal income tax purposes under Sections 856 through 860 of the Internal Revenue Code commencing with the taxable year ended December 31, 2011. We believe we are organized and operating in such a manner as to qualify to be taxed as a REIT for the taxable year ended December 31, 2018. As a REIT, the
VEREIT, INC. and VEREIT OPERATING PARTNERSHIP, L.P.
NOTES TO CONSOLIDATED FINANCIAL STATEMENTS
December 31, 2018 – (Continued)
General Partner is generally not subject to federal income tax on taxable income that it distributes to its stockholders so long as it distributes at least 90% of its annual taxable income (computed without regard to the deduction for dividends paid and excluding net capital gains). However, the General Partner, its TRS entities, and the OP are still subject to certain state and local income, franchise and property taxes in the various jurisdictions in which they operate. The General Partner may also be subject to federal income taxes on certain income and excise taxes on its undistributed income.
The OP is classified as a partnership for U.S. federal income tax purposes. As a partnership, the OP is not a taxable entity for U.S. federal income tax purposes. Instead, each partner in the OP is required to include its allocable share of the OP’s income, gains, losses, deductions and credits for each taxable year. Under the LPA, the OP is to conduct business in such a manner as to permit the General Partner at all times to qualify as a REIT.
A TRS is a subsidiary of a REIT that is subject to federal, state and local income taxes, as applicable. The Company’s use of a TRS enables it to engage in certain business activities while complying with the REIT qualification requirements and to retain any income generated by these businesses for reinvestment without the requirement to distribute those earnings. The Company conducted substantially all of the Cole Capital business activities through a TRS until it sold the Cole Capital business on February 1, 2018.
During the year ended December 31, 2018, the Company conducted all of its business in the United States, Puerto Rico and Canada and filed income tax returns in the U.S. federal jurisdiction, the Canadian federal jurisdiction and various state and local jurisdictions. With few exceptions, the Company is no longer subject to routine examinations by taxing authorities for years before 2014. Certain of the Company’s intercompany transactions that have been eliminated in consolidation for financial accounting purposes are also subject to taxation.
The Company provides for income taxes in accordance with current authoritative accounting and tax guidance. The tax provision or benefit related to significant or unusual items is recognized in the quarter in which those items occur. In addition, the effect of changes in enacted tax laws, rates or tax status is recognized in the quarter in which the change occurs. The accounting estimates used to compute the provision for or benefit from income taxes may change as new events occur, additional information is obtained or the tax environment changes.
During the years ended December 31, 2018, 2017 and 2016, the Company recognized state and local income and franchise tax expense of $4.7 million, $6.9 million and $6.0 million, respectively, which are included in provision for income taxes in the accompanying consolidated statements of operations. In addition, the Company recorded a provision for federal income taxes of $0.4 million and $1.1 million for the years ended December 31, 2018 and 2016 related to a TRS entity, which is also included in provision for income taxes in the accompanying consolidated statements of operations. No provision for federal income taxes related to a TRS entity was recorded for the year ended December 31, 2017. The provision for or benefit from income taxes attributable to the Cole Capital business, substantially all of which was conducted through a TRS entity, is included in discontinued operations for all periods presented, as discussed in Note 4 —Discontinued Operations.
The Company had no unrecognized tax benefits as of or during the years ended December 31, 2018, 2017 or 2016. Any interest and penalties related to unrecognized tax benefits would be recognized in provision for income taxes in the accompanying consolidated statements of operations.
As of December 31, 2018, the OP and the General Partner had no material uncertain income tax positions.
Recent Accounting Pronouncements
Adopted Accounting Standards
In January 2016, the FASB issued ASU 2016-01, Financial Instruments – Overall (Subtopic 825-10), Recognition and Measurement of Financial Assets and Financial Liabilities (“ASU 2016-01”), which requires equity investments (except those accounted for under the equity method of accounting or those that result in consolidation of the investee) to be measured at fair value with changes in fair value recognized in net income (loss). An entity may choose to measure equity investments that do not have a readily determinable fair value at costs minus impairment, if any, plus or minus changes resulting from observable price changes in orderly transactions for the identical or a similar investment of the same issue. ASU 2016-01 is effective for fiscal years, and interim periods within, beginning after December 15, 2017 and requires prospective treatment of equity securities without readily determinable fair values. The Company adopted ASU 2016-01 as of January 1, 2018 and recorded a $5.1 million gain, which is included in other income, net in the accompanying consolidated statements of operations, on measuring the Company’s investments in the Cole REITs at fair value after the investments were no longer accounted for using the equity method.
VEREIT, INC. and VEREIT OPERATING PARTNERSHIP, L.P.
NOTES TO CONSOLIDATED FINANCIAL STATEMENTS
December 31, 2018 – (Continued)
In February 2017, the FASB issued ASU 2017-05, Other Income – Gains and Losses from the Derecognition of Nonfinancial Assets (Subtopic 610-20): Clarifying the Scope of Asset Derecognition Guidance and Accounting for Partial Sales of Nonfinancial Assets (“ASU 2017-05”), which clarifies the following: 1) nonfinancial assets within the scope of Subtopic 610-20 may include nonfinancial assets transferred within a legal entity to a counterparty; 2) an entity should allocate consideration to each distinct asset by applying the guidance in Topic 606 on allocating the transaction price to performance obligations; and 3) requires entities to derecognize a distinct nonfinancial asset or distinct in substance nonfinancial asset in a partial sale transaction when it (a) does not have (or ceases to have) a controlling financial interest in the legal entity that holds the asset in accordance with Subtopic 810 and (b) transfers control of the asset in accordance with Topic 606. The adoption of this standard will result in higher gains on the sale of partial real estate interests, including contributions of nonfinancial assets to a joint venture or other noncontrolling investee, due to recognizing the full gain when the derecognition criteria are met and recording the retained noncontrolling interest at its fair value. ASU 2017-05 is effective for annual periods, and interim periods therein, beginning after December 15, 2017. ASU 2017-05 was adopted during the first quarter of fiscal year 2018, in conjunction with the Revenue ASUs, using the modified retrospective approach. The Company also elected the practical expedient to only apply the guidance to contracts that were not completed upon adoption. At adoption, the Company did not have any contracts that were not completed within the scope of ASU 2017-05 and as such, the adoption of ASU 2017-05 did not impact the Company’s financial statements.
Accounting Standards Not Yet Adopted
In February 2016, the FASB issued ASU 2016-02, which will require that a lessee recognize assets and liabilities on the balance sheet for all leases with a lease term of more than 12 months, with the result being the recognition of a right of use (“ROU”) asset and a lease liability and the disclosure of key information about the entity’s leasing arrangements. The lessor accounting model under ASU 2016-02 is similar to existing guidance, however it limits the capitalization of initial direct leasing costs, such as internally generated costs. The Company expects to elect all practical expedients permitted under ASC Topic 842, other than the hindsight practical expedient, which permits entities to use hindsight in determining the lease terms. Accordingly, the Company will retain distinction between a finance lease (i.e., capital leases under existing guidance) and an operating lease and account for its existing operating leases as operating leases under the new guidance, without reassessing (a) whether the contracts contain a lease under ASC Topic 842, (b) whether classification of the operating leases would be different in accordance with ASC Topic 842, or (c) whether the unamortized initial direct costs before transition adjustments would have met the definition of initial direct costs in ASC Topic 842 at lease commencement.
In January 2018, the FASB issued ASU 2018-01, Leases (Topic 842): Land Easement Practical Expedient for Transition to Topic 842. The amendments help address transition guidance as it relates to land easements. As the Company plans to elect this practical expedient, it will only evaluate new or modified land easements upon adoption of Topic 842.
In July 2018, the FASB issued ASU 2018-10, Leases (Topic 842), which contained targeted improvements to amend inconsistencies and clarify guidance that were brought about by stakeholders. Additionally, in July 2018, the FASB issued ASU 2018-11, Leases (Topic 842), which provided the following practical expedients: (1) a transition method that allows entities to apply the new standard at the adoption date and to recognize a cumulative-effect adjustment to the opening balance of retained earnings effective at the adoption date; and (2) the option for lessors to not separate lease and non-lease components provided that certain criteria are met. The Company plans to elect the practical expedients included in ASU 2018-11. As the Company is not electing the hindsight practical expedient, the Company does not expect to have a cumulative effect adjustment to retained earnings upon adoption.
In December 2018, the FASB issued ASU 2018-20, Narrow-Scope Improvements for Lessors, Leases (Topic 842). This ASU 2018-20 provides an election for lessors to exclude sales and related taxes from consideration in the contract, requires lessors to exclude from revenue and expense lessor costs paid directly to a third party by lessees, and clarifies lessors’ accounting for variable payments related to both lease and nonlease components.
The Company is currently evaluating the impact of adoption, and anticipates this standard will have a material impact on its consolidated balance sheets. However, the Company does not expect adoption will have a material impact on its consolidated statements of operations. While the Company is continuing to assess potential impacts of the standard, it currently expects the most significant impact will be the recognition of ROU assets and lease liabilities for operating leases. Our initial ROU asset and liability will be approximately $223.0 million. The Company expects its accounting for capital leases to remain substantially unchanged. Leases pursuant to which the Company is the lessee primarily consist of approximately 200 leases, of which the majority are ground leases. The Company will adopt ASU 2016-12 and its related amendments beginning January 1, 2019.
In June 2016, the FASB issued ASU 2016-13, Financial Instruments – Credit Losses (Topic 326) (“ASU 2016-13”). ASU 2016-13 is intended to improve financial reporting by requiring more timely recognition of credit losses on loans and other financial instruments that are not accounted for at fair value through net income, including loans held for investment, held-to-maturity debt securities, trade and other receivables, net investment in leases and other such commitments. ASU 2016-13 requires that financial
VEREIT, INC. and VEREIT OPERATING PARTNERSHIP, L.P.
NOTES TO CONSOLIDATED FINANCIAL STATEMENTS
December 31, 2018 – (Continued)
assets measured at amortized cost be presented at the net amount expected to be collected, through an allowance for credit losses that is deducted from the amortized cost basis. The amendments in ASU 2016-13 require the Company to measure all expected credit losses based upon historical experience, current conditions, and reasonable and supportable forecasts that affect the collectability of the financial assets and eliminates the “incurred loss” methodology under current U.S. GAAP. In November 2018, the FASB issued ASU No. 2018-19, Codification Improvements to Topic 326, Financial Instruments—Credit Losses (“ASU 2018-19”). This ASU clarifies that receivables from operating leases are accounted for using the lease guidance and not as financial instruments. ASU 2016-13 and ASU 2018-19 are effective for fiscal years, and interim periods within, beginning after December 15, 2019. Early adoption is permitted for fiscal years, and interim periods within, beginning after December 15, 2018. The Company is currently evaluating the impact these amendments will have on its consolidated financial statements.
Note 3– Real Estate Investments and Related Intangibles
Property Acquisitions
During the year ended December 31, 2018, the Company acquired controlling financial interests in 52 commercial properties for an aggregate purchase price of $502.7 million (the “2018 Acquisitions”), which includes one land parcel for build-to-suit development, further discussed below, $2.1 million related to an outstanding tenant improvement allowance recorded as a payable as of the acquisition date and for which the Company received a credit at close, and $2.6 million of external acquisition-related expenses that were capitalized.
During the year ended December 31, 2017, the Company acquired a controlling interest in 88 commercial properties and three land parcels for an aggregate purchase price of $748.8 million (the “2017 Acquisitions”), which includes $3.3 million of external acquisition-related expenses that were capitalized and includes 22 properties acquired in a nonmonetary exchange discussed below.
During the year ended December 31, 2016, the Company acquired a controlling interest in eight commercial properties for an aggregate purchase price of $100.2 million (the “2016 Acquisitions”). Prior to the adoption of ASU 2017-01, costs related to property acquisitions were expensed as incurred. The Company has not included pro forma information for the Company's 2016 Acquisitions, which were acquired prior to the adoption of ASU 2017-01 and met the definition of a business combination, as they did not have a material impact on the Company's financial position or results of operations.
The following table presents the allocation of the fair values of the assets acquired and liabilities assumed during the periods presented (in thousands):
|
| | | | | | | | | | | | |
| | | Year Ended December 31, |
| | | 2018 | | 2017 | | 2016 |
| Real estate investments, at cost: | | | | | | |
| Land | | $ | 86,285 |
| | $ | 110,634 |
| | $ | 23,187 |
|
| Buildings, fixtures and improvements | | 350,942 |
| | 523,445 |
| | 67,865 |
|
| Total tangible assets | | 437,227 |
| | 634,079 |
| | 91,052 |
|
| Acquired intangible assets: | | | | | | |
In-place leases and other intangibles (1) | | 62,791 |
| | 105,940 |
| | 9,613 |
|
Above-market leases (2) | | 2,750 |
| | 10,445 |
| | — |
|
| Assumed intangible liabilities: | | | | | | |
Below-market leases (3) | | (116 | ) | | (1,680 | ) | | (471 | ) |
| Total purchase price of assets acquired | | $ | 502,652 |
| | $ | 748,784 |
| | $ | 100,194 |
|
| |
| (1) | The weighted average amortization period for acquired in-place leases and other intangibles is 16.3 years, 15.8 years and 13.8 years for 2018 Acquisitions, 2017 Acquisitions and 2016 Acquisitions, respectively. |
| |
| (2) | The weighted average amortization period for acquired above-market leases is 10.8 years and 18.0 years for 2018 Acquisitions and 2017 Acquisitions, respectively. There were no acquired above-market leases during the year ended December 31, 2016. |
| |
| (3) | The weighted average amortization period for acquired intangible lease liabilities is 9.9 years, 13.8 years and 10.0 years for 2018 Acquisitions, 2017 Acquisitions and 2016 Acquisitions, respectively. |
As of December 31, 2018, the Company invested $3.5 million, including $0.5 million of external acquisition-related expenses that were capitalized, in one build-to-suit development project. The Company’s estimated remaining committed investment is $24.9 million, and the project is expected to be completed within the next 12 months.
VEREIT, INC. and VEREIT OPERATING PARTNERSHIP, L.P.
NOTES TO CONSOLIDATED FINANCIAL STATEMENTS
December 31, 2018 – (Continued)
Future Lease Payments
The following table presents future minimum base rent payments due to the Company over the next five years and thereafter. These amounts exclude contingent rent payments, as applicable, that may be collected from certain tenants based on provisions related to sales thresholds and increases in annual rent based on exceeding certain economic indexes among other items (in thousands):
|
| | | | | | | | |
| | | Future Minimum Operating Lease
Base Rent Payments | | Future Minimum
Direct Financing Lease Payments (1) |
| 2019 | | $ | 1,107,610 |
| | $ | 2,448 |
|
| 2020 | | 1,080,639 |
| | 2,135 |
|
| 2021 | | 1,042,346 |
| | 2,014 |
|
| 2022 | | 972,564 |
| | 1,925 |
|
| 2023 | | 890,327 |
| | 1,541 |
|
| Thereafter | | 5,387,232 |
| | 707 |
|
| Total | | $ | 10,480,718 |
| | $ | 10,770 |
|
| |
| (1) | Related to25 properties which are subject to direct financing leases and, therefore, revenue is recognized as direct financing lease income on the discounted cash flows of the lease payments. Amounts reflected are the minimum base rental cash payments due to the Company under the lease agreements on these respective properties. |
Property Dispositions and Real Estate Assets Held for Sale
During the year ended December 31, 2018, the Company disposed of 149 properties, including one property conveyed to a lender in a deed-in-lieu of foreclosure transaction as discussed in Note 7 –Debt, for an aggregate gross sales price of $526.4 million, of which our share was $504.3 million after the profit participation payments related to the disposition of 34 Red Lobster properties. The dispositions resulted in proceeds of $496.7 million after closing costs. The Company recorded a gain of $96.2 million related to the sales which is included in gain on disposition of real estate and real estate assets held for sale, net in the accompanying consolidated statements of operations.
During the year ended December 31, 2018, the Company also disposed of one property owned by an unconsolidated joint venture for a gross sales price of $34.1 million, of which our share was $17.1 million based on our ownership interest in the joint venture, resulting in proceeds of $5.6 million after debt repayments of $20.4 million and closing costs. The Company recorded a gain of $0.7 million related to the sale and liquidation of the joint venture, which is included in equity in income and gain on disposition of unconsolidated entities in the accompanying consolidated statements of operations.
During the year ended December 31, 2017, the Company disposed of 137 properties, including one property owned by a consolidated joint venture, six properties transferred to the lender in either a deed-in-lieu of foreclosure or foreclosure sale transaction as discussed in Note 7 –Debt, and 15 properties disposed of in connection with a nonmonetary exchange discussed below, for an aggregate gross sales price of $594.9 million, of which our share was $574.4 million after the profit participation payment related to the disposition of 31 Red Lobster properties and the consolidated joint venture partner’s share of the sales price. The dispositions resulted in proceeds of $445.5 million after a mortgage loan assumption of $66.0 million and closing costs. Additionally, the Company’s tax provision for the year ended December 31, 2017 included $1.7 million of Canadian tax gain on the sale of certain Canadian properties. The Company recorded a gain of $64.7 million, which is included in gain on disposition of real estate and real estate assets held for sale, net in the accompanying consolidated statements of operations.
During the year ended December 31, 2016, the Company disposed of 301 properties, for an aggregate gross sales price of $1.08 billion, of which our share was $1.04 billion after the profit participation payment related to the disposition of 70 Red Lobster properties. The dispositions resulted in proceeds of $958.4 million after a mortgage loan assumption of $55.0 million and closing costs. The Company recorded a gain of $45.7 million, which included $67.8 million of goodwill allocated to the cost basis of such properties, which is included in gain on disposition of real estate and real estate assets held for sale, net in the accompanying consolidated statements of operations.
VEREIT, INC. and VEREIT OPERATING PARTNERSHIP, L.P.
NOTES TO CONSOLIDATED FINANCIAL STATEMENTS
December 31, 2018 – (Continued)
During the year ended December 31, 2016, the Company also disposed of one property owned by an unconsolidated joint venture for a gross sales price of $113.5 million, of which our share was $102.1 million based on our ownership interest in the joint venture, resulting in proceeds of $42.3 million after debt repayments of $57.0 million and closing costs. The Company recorded a gain of $10.2 million related to the sale, which is included in equity in income and gain on disposition of unconsolidated entities in the accompanying consolidated statements of operations.
As of December 31, 2018, there were five properties classified as held for sale with a carrying value of $2.6 million, included in assets related to real estate assets held for sale and discontinued operations, net in the accompanying consolidated balance sheet, which are expected to be sold in the next 12 months as part of the Company’s portfolio management strategy. As of December 31, 2017, there were 30 properties classified as held for sale. During the year ended December 31, 2018, the Company recorded a loss of $1.9 million related to held for sale properties. During the year ended December 31, 2017, the Company recorded a loss of $3.1 million related to held for sale properties. During the year ended December 31, 2016, the Company recorded a loss of $5.1 million related to held for sale properties, which included $3.2 million of goodwill allocated to the cost basis of such properties.
Intangible Lease Assets and Liabilities
Intangible lease assets and liabilities of the Company consisted of the following as of December 31, 2018 and 2017 (amounts in thousands, except weighted-average useful life):
|
| | | | | | | | | | |
| | | Weighted-Average Useful Life | | December 31, 2018 | | December 31, 2017 |
| Intangible lease assets: | | | | | | |
| In-place leases and other intangibles, net of accumulated amortization of $703,909 and $599,680, respectively | | 15.5 | | $ | 980,971 |
| | $ | 1,091,433 |
|
| Leasing commissions, net of accumulated amortization of $4,048 and $2,902, respectively | | 10.7 | | 15,660 |
| | 13,876 |
|
| Above-market lease assets and deferred lease incentives, net of accumulated amortization of $105,936 and $88,335, respectively | | 16.4 | | 201,875 |
| | 241,449 |
|
| Total intangible lease assets, net | | | | $ | 1,198,506 |
| | $ | 1,346,758 |
|
| | | | | | | |
| Intangible lease liabilities: | | | | | | |
| Below-market leases, net of accumulated amortization of $89,905 and $73,916, respectively | | 18.8 | | $ | 173,479 |
| | $ | 198,551 |
|
The aggregate amount of above‑ and below-market leases and deferred lease incentives amortized and included as a net decrease to rental revenue was $4.2 million for the year ended December 31, 2018 and $5.4 million for each of the years ended December 31, 2017 and 2016, respectively. The aggregate amount of in-place leases, leasing commissions and other lease intangibles amortized and included in depreciation and amortization expense was $139.6 million, $154.2 million and $170.0 million for the years ended December 31, 2018, 2017 and 2016, respectively.
The following table provides the projected amortization expense and adjustments to rental revenue related to the intangible lease assets and liabilities for the next five years as of December 31, 2018 (amounts in thousands):
|
| | | | | | | | | | | | | | | | | | | | |
| | | 2019 | | 2020 | | 2021 | | 2022 | | 2023 |
| In-place leases and other intangibles: | | | | | | | | | | |
| Total projected to be included in amortization expense | | $ | 126,457 |
| | $ | 119,161 |
| | $ | 111,335 |
| | $ | 97,159 |
| | $ | 86,311 |
|
| Leasing commissions: | | | | | | | | | | |
| Total projected to be included in amortization expense | | 1,911 |
| | 1,778 |
| | 1,620 |
| | 1,556 |
| | 1,359 |
|
| Above-market lease assets and deferred lease incentives: | | | | | | | | |
| Total projected to be deducted from rental revenue | | 20,870 |
| | 20,456 |
| | 20,027 |
| | 19,213 |
| | 18,270 |
|
| Below-market lease liabilities: | | | | | | | | | | |
| Total projected to be included in rental revenue | | 17,973 |
| | 16,821 |
| | 15,656 |
| | 14,809 |
| | 13,924 |
|
VEREIT, INC. and VEREIT OPERATING PARTNERSHIP, L.P.
NOTES TO CONSOLIDATED FINANCIAL STATEMENTS
December 31, 2018 – (Continued)
Nonmonetary Exchange
During the year ended December 31, 2017, the Company completed a nonmonetary exchange through the simultaneous acquisition of 22 Bob Evans properties and disposition of 15 Red Lobster properties. Pursuant to Nonmonetary Transactions, ASC (Topic 845), the cost of a nonmonetary asset acquired in exchange for another nonmonetary asset is the fair value of the asset surrendered to obtain the acquired nonmonetary asset, and a gain or loss should be recognized on the exchange. The fair value of the asset received should be used to measure the cost if the fair value of the asset received is more reliable than the fair value of the asset surrendered. The Company estimated the fair value of the Bob Evans and Red Lobster properties using valuation techniques consistent with the income approach and concluded that the fair value was $50.1 million. As the fair value of the assets received exceeded the book value of the assets surrendered, the Company recorded a gain of $7.4 million, which is included in gain on disposition of real estate and real estate assets held for sale, net in the accompanying consolidated statements of operations.
Consolidated Joint Ventures
The Company had an interest in one consolidated joint venture that owned one property as of December 31, 2018 and 2017. As of December 31, 2018 and 2017, the consolidated joint venture had total assets of $32.5 million and $33.7 million, of which $29.9 million and $30.7 million, respectively, were real estate investments, net of accumulated depreciation and amortization. The property was secured by a mortgage note payable, which was non-recourse to the Company and had a balance of $14.0 million and $14.9 million, as of December 31, 2018 and 2017, respectively. The Company has the ability to control operating and financing policies of the consolidated joint venture. There are restrictions on the use of these assets as the Company would generally be required to obtain the approval of the joint venture partner in accordance with the joint venture agreement for any major transactions. The Company and the joint venture partner are subject to the provisions of the joint venture agreement, which includes provisions for when additional contributions may be required to fund certain cash shortfalls.
Unconsolidated Joint Ventures
As of December 31, 2018, the Company held an investment in an unconsolidated joint venture that owned one property with a carrying value of $35.3 million. As of December 31, 2017, the Company held investments in two unconsolidated joint ventures that each owned one property with an aggregate carrying value of $39.5 million. During the year ended December 31, 2018, the Company disposed of one property owned by an unconsolidated joint venture as previously discussed in the “Property Dispositions and Real Estate Assets Held for Sale” section herein.
The Company had a 90% legal ownership interest in the unconsolidated joint venture at December 31, 2018 and December 31, 2017 and accounts for its investment using the equity method of accounting as the Company has the ability to exercise significant influence, but not control, over operating and financing policies of the investment. The equity method of accounting requires the investment to be initially recorded at cost and subsequently adjusted for the Company’s share of equity in earnings and distributions from the joint venture. During the year ended December 31, 2018 the Company recognized $1.2 million of net income from unconsolidated joint ventures. During the years ended December 31, 2017 and 2016 the Company recognized $3.3 million and $0.9 million of net income, respectively, from two unconsolidated joint ventures. The Company’s legal ownership interest may, at times, not equal the Company’s economic interest because of various provisions in certain joint venture agreements regarding distributions of cash flow based on capital account balances, allocations of profits and losses and payments of preferred returns.
The carrying amount of the unconsolidated joint venture was greater than the underlying equity in net assets by $4.7 million as of December 31, 2018. The carrying amount of the unconsolidated joint ventures was greater than the underlying equity in net assets by $8.6 million as of December 31, 2017. This difference relates to a purchase price allocation of goodwill and a step up in fair value of the investment assets acquired in connection with mergers. The step up in fair value was allocated to the individual investment assets and is being amortized in accordance with the Company’s depreciation policy. The Company and the unconsolidated joint venture partner are subject to the provisions of the applicable joint venture agreement, which includes provisions for when additional contributions may be required to fund certain cash shortfalls, including the Company’s share of expansion project capital expenditures.
VEREIT, INC. and VEREIT OPERATING PARTNERSHIP, L.P.
NOTES TO CONSOLIDATED FINANCIAL STATEMENTS
December 31, 2018 – (Continued)
Note 4 — Discontinued Operations
On November 13, 2017, the Company entered into a purchase and sale agreement (as amended by that certain First Amendment to the Purchase and Sale Agreement, dated as of February 1, 2018, the “Cole Capital Purchase and Sale Agreement”). On February 1, 2018, the Company completed the sale of its investment management segment, Cole Capital, under the terms of the Cole Capital Purchase and Sale Agreement. Substantially all of the Cole Capital segment’s operations were conducted through Cole Capital Advisors, Inc. (“CCA”), an Arizona corporation and a wholly owned subsidiary of the OP. The OP sold all of the issued and outstanding shares of common stock of CCA and certain of CCA’s subsidiaries to the Cole Purchaser, for approximately $120.0 million paid in cash at closing. The Company could also receive up to an aggregate of $80.0 million in Net Revenue Payments. There were no Net Revenue Payments received or earned for 2018. Substantially all of the Cole Capital segment financial results are reflected in the financial statements as discontinued operations.
The following is a summary of the assets and liabilities related to discontinued operations and real estate assets held for sale as of December 31, 2018 and 2017 (in thousands):
|
| | | | | | | | |
| | December 31, 2018 | | December 31, 2017 |
| Carrying amount of major classes of assets included in discontinued operations: | | | | |
| Cash | | $ | — |
| | $ | 2,198 |
|
Intangible assets, net (1) | | — |
| | 9,892 |
|
Other assets, net (2) | | — |
| | 6,975 |
|
Goodwill (3) | | — |
| | 124,812 |
|
| Due from Cole REITs, net | | — |
| | 1,284 |
|
Loss recognized on classification as held for sale (4) | | — |
| | (19,509 | ) |
| Assets related to discontinued operations, net | | $ | — |
| | $ | 125,652 |
|
| | | | | |
| Carrying amount of major classes of liabilities included in discontinued operations: | | | | |
| Accounts payable and accrued expenses | | $ | — |
| | $ | 14,269 |
|
| Other liabilities | | — |
| | 1,512 |
|
| Due to Cole REITs | | — |
| | 100 |
|
| Liabilities related to discontinued operations | | $ | — |
| | $ | 15,881 |
|
| |
| (1) | The intangible assets consisted of management and advisory contracts that the Company had with certain Cole REITs. Accumulated amortization was $44.1 million as of December 31, 2017. |
| |
| (2) | Includes program development costs of $3.3 million as of December 31, 2017, which were net of reserves of $7.6 million. |
| |
| (3) | The Company performed the annual goodwill test using the $120.0 million cash proceeds provided for under the Cole Capital Purchase and Sale Agreement, plus the estimated fair value of the Net Revenue Payments and determined the carrying amount exceeded the estimated fair value. As such, no goodwill impairment was recorded during the year ended December 31, 2017. |
| |
| (4) | The Company recognized a loss of $20.0 million on classification of the discontinued operations as held for sale, of which $0.5 million represented estimated costs to sell that were subsequently accrued in accounts payable and accrued expenses as of December 31, 2017. In determining the loss recognized on classification as held for sale, the Company elected to account for the future Net Revenue Payments as a gain contingency. Under this approach, the Company will not recognize any Net Revenue Payments until realized. |
VEREIT, INC. and VEREIT OPERATING PARTNERSHIP, L.P.
NOTES TO CONSOLIDATED FINANCIAL STATEMENTS
December 31, 2018 – (Continued)
The following is a summary of the financial information for discontinued operations for the years ended December 31, 2018, 2017 and 2016 (in thousands):
|
| | | | | | | | | | | | |
| | | Year Ended December 31, |
| Revenues: | | 2018 | | 2017 | | 2016 |
| Offering-related fees and reimbursements | | $ | 1,027 |
| | $ | 16,096 |
| | $ | 36,526 |
|
| Transaction service fees and reimbursements | | 334 |
| | 13,929 |
| | 12,533 |
|
| Management fees and reimbursements | | 6,452 |
| | 76,214 |
| | 68,686 |
|
| Total revenues | | $ | 7,813 |
|
| $ | 106,239 |
|
| $ | 117,745 |
|
| Operating expenses: | | | | | | |
| Cole Capital reallowed fees and commissions | | 602 |
| | 9,879 |
| | 23,174 |
|
Transaction costs (1) | | (654 | ) | | 3,802 |
| | — |
|
| General and administrative | | 4,450 |
| | 63,783 |
| | 82,558 |
|
| Amortization of intangible assets | | — |
| | 14,490 |
| | 26,148 |
|
| Goodwill and intangible asset impairments | | — |
| | — |
| | 120,931 |
|
| Total operating expenses | | 4,398 |
|
| 91,954 |
|
| 252,811 |
|
| Other income, net | | — |
| | 464 |
| | 292 |
|
| Loss on disposition and assets held for sale | | (1,815 | ) | | (20,027 | ) | | — |
|
| Income (loss) before taxes | | 1,600 |
|
| (5,278 | ) |
| (134,774 | ) |
| Benefit from (provision for) income taxes | | 2,095 |
| | (13,839 | ) | | 10,837 |
|
| Income (loss) from discontinued operations, net of income taxes | | $ | 3,695 |
|
| $ | (19,117 | ) |
| $ | (123,937 | ) |
| |
| (1) | The negative balance for the year ended December 31, 2018 is a result of estimated costs accrued in prior periods that exceeded actual expenses incurred. |
The following is a summary of cash flows related to discontinued operations for the years ended December 31, 2018, 2017 and 2016 (in thousands):
|
| | | | | | | | | | | |
| | | Year Ended December 31, |
| | | 2018 | | 2017 | 2016 |
| Cash flows related to discontinued operations: | | | | | |
| Cash flows (used in) provided by operating activities | | $ | (10,468 | ) | | $ | 33,232 |
| $ | 35,251 |
|
| Cash flows provided by investing activities | | $ | 122,915 |
| | $ | — |
| $ | — |
|
Income Taxes
Cole Capital’s business, substantially all of which was conducted through a TRS, recognized a benefit of $2.1 million for the year ended December 31, 2018, a provision of $13.8 million the year ended December 31, 2017 and a benefit of $10.8 million for the year ended December 31, 2016.
VEREIT, INC. and VEREIT OPERATING PARTNERSHIP, L.P.
NOTES TO CONSOLIDATED FINANCIAL STATEMENTS
December 31, 2018 – (Continued)
The following table presents the reconciliation of the (benefit from) provision for income taxes with the amount computed by applying the statutory federal income tax rate to loss before income taxes for the years ended December 31, 2018, 2017 and 2016 (in thousands):
|
| | | | | | | | | | | | |
| | | Year Ended December 31, |
| | | 2018 | | 2017 | | 2016 |
| Income (loss) before taxes | | $ | 1,600 |
| | $ | (5,278 | ) | | $ | (134,774 | ) |
| Less: Income from non-taxable entities | | (685 | ) | | (9,523 | ) | | (9,008 | ) |
| Income (loss) attributable to taxable subsidiaries before income taxes | | $ | 915 |
|
| $ | (14,801 | ) |
| $ | (143,782 | ) |
| | | | | | | |
| Federal provision at statutory rate | | 192 |
| | (5,180 | ) | | (50,324 | ) |
| Impairment of goodwill | | — |
| | — |
| | 42,327 |
|
| Nondeductible portion of transaction costs and loss recognized on classification as held for sale | | (719 | ) | | 8,283 |
| | — |
|
| Impact of change in federal tax rate | | — |
| | 3,481 |
| | — |
|
| Impact of valuation allowance | | (1,158 | ) | | 6,165 |
| | — |
|
| State income taxes and other | | (410 | ) | | 1,090 |
| | (2,840 | ) |
| Total (benefit from) provision for income taxes - Cole Capital | | $ | (2,095 | ) |
| $ | 13,839 |
|
| $ | (10,837 | ) |
The following table presents the components of the (benefit from) provision for income taxes for the years ended December 31, 2018, 2017 and 2016 (in thousands):
|
| | | | | | | | | | | | |
| | | Year Ended December 31, |
| | | 2018 | | 2017 | | 2016 |
| Current | | | | | | |
| Federal | | $ | (74 | ) | | $ | (120 | ) | | $ | 2,244 |
|
| State | | (166 | ) | | 602 |
| | (2,762 | ) |
| Total current (benefit from) provision for income taxes | | (240 | ) |
| 482 |
|
| (518 | ) |
| Deferred | | | | | | |
| Federal | | (1,756 | ) | | 12,016 |
| | (9,021 | ) |
| State | | (99 | ) | | 1,341 |
| | (1,298 | ) |
| Total deferred (benefit from) provision for income taxes | | (1,855 | ) |
| 13,357 |
| | (10,319 | ) |
| Total (benefit from) provision for income taxes - Cole Capital | | $ | (2,095 | ) |
| $ | 13,839 |
|
| $ | (10,837 | ) |
VEREIT, INC. and VEREIT OPERATING PARTNERSHIP, L.P.
NOTES TO CONSOLIDATED FINANCIAL STATEMENTS
December 31, 2018 – (Continued)
Note 5 – Rent and Tenant Receivables and Other Assets, Net
Rent and tenant receivables and other assets, net consisted of the following as of December 31, 2018 and 2017 (in thousands):
|
| | | | | | | | |
| | | December 31, 2018 | | December 31, 2017 |
| | | | | |
Straight-line rent receivable, net (1) | | $ | 259,106 |
| | $ | 230,529 |
|
Accounts receivable, net (2) | | 36,939 |
| | 36,921 |
|
Deferred costs, net (3) | | 17,515 |
| | 5,746 |
|
| Investment in direct financing leases, net | | 13,254 |
| | 19,539 |
|
Mortgage notes receivable, net (4) | | 10,164 |
| | 20,294 |
|
Leasehold improvements, property and equipment, net (5) | | 9,754 |
| | 12,089 |
|
| Investment in Cole REITs | | 7,844 |
| | 3,264 |
|
| Prepaid expenses | | 5,022 |
| | 6,493 |
|
| Other assets, net | | 3,594 |
| | 5,003 |
|
| Income tax receivable | | 1,760 |
| | 3,213 |
|
| Restricted escrow deposits | | 1,140 |
| | 4,995 |
|
Investment securities, at fair value(6) | | — |
| | 40,974 |
|
| Total | | $ | 366,092 |
|
| $ | 389,060 |
|
| |
| (1) | Allowance for uncollectible accounts included in straight-line rent receivable, net was $1.0 million and $2.0 million as of December 31, 2018 and 2017, respectively. As of December 31, 2018, the allowance related to suspended revenue recognition was $0.1 million. As of December 31, 2017, there was no allowance related to suspended revenue recognition. |
| |
| (2) | In the event that the collectability of a receivable is uncertain, the Company will record an increase in the allowance for uncollectible accounts in the consolidated balance sheets and bad debt expense in property operating expenses in the consolidated statements of operations. Allowance for uncollectible accounts was $5.3 million and $6.3 million as of December 31, 2018 and 2017, respectively. The Company suspends revenue recognition when the collectability of amounts due pursuant to a lease is no longer reasonably assured. As of December 31, 2018 and 2017, the allowance related to suspended revenue recognition was $9.1 million and $12.6 million, respectively. |
| |
| (3) | Amortization expense for deferred costs related to the revolving credit facilities totaled $7.3 million for the year ended December 31, 2018 and $10.4 million for each of the years ended December 31, 2017 and 2016. Accumulated amortization for deferred costs related to the Revolving Credit Facility, as defined in Note 7 –Debt, was $47.6 million and $40.3 million as of December 31, 2018 and 2017, respectively. |
| |
| (4) | As of December 31, 2018, the Company owned five mortgage notes receivable with a weighted-average interest rate of 6.4% and weighted-average years to maturity of 12.1 years. During the year ended December 31, 2018, the Company sold three mortgage notes receivable with an aggregate carrying value of $8.8 million at December 31, 2017, resulting in a net gain of $1.7 million, which is included in other income, net in the accompanying consolidated statements of operations. |
| |
| (5) | Amortization expense for leasehold improvements totaled $1.2 million for each of the years ended December 31, 2018 and 2017, with no related write-offs. Amortization expense for leasehold improvements totaled $2.3 million for the year ended December 31, 2016, inclusive of write-offs of $1.0 million. Accumulated amortization was $5.9 million and $4.7 million as of December 31, 2018 and 2017, respectively. Depreciation expense for property and equipment totaled $2.3 million, $1.8 million and $3.4 million for the years ended December 31, 2018, 2017 and 2016, respectively, inclusive of write-offs of $0.8 million, $0.6 million and $1.2 million for the years ended December 31, 2018, 2017 and 2016, respectively. Accumulated depreciation was $7.0 million and $5.7 million as of December 31, 2018 and 2017, respectively. |
| |
| (6) | During the year ended December 31, 2018, two commercial mortgage-backed securities (“CMBS”) were repaid and six CMBS were sold for an aggregate gross sales price of $36.0 million for a net realized loss of $2.2 million, which is included in other income, net in the accompanying consolidated statements of operations. |
Note 6 – Fair Value Measures
The Company determines fair value based on quoted prices when available or through the use of alternative approaches, such as discounting the expected cash flows using market interest rates commensurate with the credit quality and duration of the investment. U.S. GAAP guidance defines three levels of inputs that may be used to measure fair value:
Level 1 – Quoted prices in active markets for identical assets and liabilities that the reporting entity has the ability to access at the measurement date.
Level 2 – Inputs other than quoted prices included within Level 1 that are observable for the asset and liability or can be corroborated with observable market data for substantially the entire contractual term of the asset or liability.
Level 3 – Unobservable inputs reflect the entity’s own assumptions about the assumptions that market participants would use in the pricing of the asset or liability and are consequently not based on market activity, but rather through particular valuation techniques.
VEREIT, INC. and VEREIT OPERATING PARTNERSHIP, L.P.
NOTES TO CONSOLIDATED FINANCIAL STATEMENTS
December 31, 2018 – (Continued)
The determination of where an asset or liability falls in the hierarchy requires significant judgment and considers factors specific to the asset or liability. In instances where the determination of the fair value measurement is based on inputs from different levels of the fair value hierarchy, the level in the fair value hierarchy within which the entire fair value measurement falls is based on the lowest level input that is significant to the fair value measurement in its entirety. The Company evaluates its hierarchy disclosures each quarter and depending on various factors, it is possible that an asset or liability may be classified differently from quarter to quarter. Changes in the type of inputs may result in a reclassification for certain assets. The Company does not expect that changes in classifications between levels will be frequent.
Items Measured at Fair Value on a Recurring Basis
The following tables present information about the Company’s assets and liabilities measured at fair value on a recurring basis as of December 31, 2018 and 2017, aggregated by the level in the fair value hierarchy within which those instruments fall (in thousands):
|
| | | | | | | | | | | | | | | | |
|
| Level 1 |
| Level 2 |
| Level 3 |
| Balance as of December 31, 2018 |
| Assets: |
|
|
|
|
|
|
|
|
| Derivative assets |
| $ | — |
| | $ | 544 |
| | $ | — |
|
| $ | 544 |
|
| Investment in Cole REITs | | — |
| | — |
| | 7,844 |
| | 7,844 |
|
| Total assets | | $ | — |
| | $ | 544 |
| | $ | 7,844 |
| | $ | 8,388 |
|
|
|
| Level 1 |
| Level 2 |
| Level 3 |
| Balance as of December 31, 2017 |
| Assets: | | | | | | | | |
| CMBS | | $ | — |
| | $ | — |
| | $ | 40,974 |
| | $ | 40,974 |
|
| Derivative assets | | — |
| | 627 |
| | — |
| | 627 |
|
| Total assets | | $ | — |
| | $ | 627 |
| | $ | 40,974 |
| | $ | 41,601 |
|
CMBS – The Company’s CMBS were carried at fair value and were valued using Level 3 inputs. The Company used estimated non-binding quoted market prices from the trading desks of financial institutions that are dealers in such securities for similar CMBS tranches that actively participate in the CMBS market. Broker quotes are only indicative of fair value and may not necessarily represent what the Company would receive in an actual trade for the applicable instrument. Management determined that the prices were representative of fair value through its knowledge and experience in the market. The significant unobservable input used in valuing the CMBS was the discount rate or market yield used to discount the estimated future cash flows expected to be received from the underlying investment, which include both future principal and interest payments. Significant increases or decreases in the discount rate or market yield would result in a decrease or increase in the fair value measurement. The following risks were included in the consideration and selection of discount rates or market yields: risk of default, rating of the investment and comparable company investments.
Derivative Assets and Liabilities –The Company’s derivative financial instruments relate to interest rate swaps. The valuation of derivative instruments is determined using a discounted cash flow analysis on the expected cash flows of each derivative. This analysis reflects the contractual terms of the derivatives, including the period to maturity, as well as observable market-based inputs, including interest rate curves and implied volatilities. In addition, credit valuation adjustments are incorporated into the fair values to account for the Company’s potential nonperformance risk and the performance risk of the counterparties.
Although the Company determined that the majority of the inputs used to value its derivatives fall within Level 2 of the fair value hierarchy, the credit valuation adjustments associated with those derivatives utilize Level 3 inputs, such as estimates of current credit spreads to evaluate the likelihood of default by the Company and its counterparties. However, as of December 31, 2018 and 2017, the Company assessed the significance of the impact of the credit valuation adjustments on the overall valuation of its derivative positions and determined that the credit valuation adjustments are not significant to the overall valuation of the Company’s derivatives. As a result, the Company determined that its derivative valuations in their entirety are classified in Level 2 of the fair value hierarchy.
VEREIT, INC. and VEREIT OPERATING PARTNERSHIP, L.P.
NOTES TO CONSOLIDATED FINANCIAL STATEMENTS
December 31, 2018 – (Continued)
Investment in Cole REITs –The fair values of CCIT II and CCPT V were estimated using the net asset value per share. The Company determined that the CCIT III per share primary offering price net of selling commissions and dealer manager fees approximated fair value. Each of the Cole REIT’s share redemption programs includes restrictions that limit the number of shares redeemed by the respective Cole REIT. CCIT II has estimated that it will commence a liquidity event over the next three to five years. CCPT V has estimated that it will commence a liquidity event over the next three to six years following the termination of its initial public offering. CCIT III has estimated that it will commence a liquidity event five to seven years following the termination of its initial public offering. Subsequent to December 31, 2018, CCIT III terminated its primary offering, however it continues to issue shares pursuant to its distribution reinvestment plan.
The following are reconciliations of the changes in assets and liabilities with Level 3 inputs in the fair value hierarchy for the year ended December 31, 2018 (in thousands):
|
| | | | | | | | |
| | | CMBS | | Investment in Cole REITs (1) |
| Beginning balance, January 1, 2018 | | $ | 40,974 |
| | $ | 3,264 |
|
| Total gains and losses | | | | |
| Unrealized loss included in other comprehensive income, net | | (205 | ) | | — |
|
| Realized loss included in other income, net | | (34 | ) | | — |
|
| Unrealized gain included in other income, net | | — |
| | 5,102 |
|
| Purchases, issuance, settlements | | | | |
| Return of principal received | | (4,864 | ) | | — |
|
| Amortization included in net income, net | | 157 |
| | — |
|
| Sale of investments | | (36,028 | ) | | (522 | ) |
| Ending Balance, December 31, 2018 | | $ | — |
| | $ | 7,844 |
|
| |
| (1) | As discussed in Note 2 – Summary of Significant Accounting Policies, as of December 31, 2017, the Company accounted for its investment in Cole REITs using the equity method of accounting. Subsequent to the sale of Cole Capital, the Company retained interests in CCIT II, CCIT III and CCPT V, which were carried at fair value as of December 31, 2018. |
The following are reconciliations of the changes in assets and liabilities with Level 3 inputs in the fair value hierarchy for the year ended December 31, 2017 (in thousands):
|
| | | | |
| | | CMBS |
| Beginning balance, January 1, 2017 | | $ | 47,215 |
|
| Total gains and losses | | |
| Unrealized loss included in other comprehensive income, net | | (951 | ) |
| Purchases, issuance, settlements | | |
| Return of principal received | | (4,388 | ) |
| Amortization included in net income, net | | (902 | ) |
| Ending Balance, December 31, 2017 | | $ | 40,974 |
|
VEREIT, INC. and VEREIT OPERATING PARTNERSHIP, L.P.
NOTES TO CONSOLIDATED FINANCIAL STATEMENTS
December 31, 2018 – (Continued)
Items Measured at Fair Value on a Non-Recurring Basis
Certain financial and nonfinancial assets and liabilities are measured at fair value on a non-recurring basis and are subject to fair value adjustments in certain circumstances, such as when there is evidence of impairment.
Real Estate Investments –The Company performs quarterly impairment review procedures, primarily through continuous monitoring of events and changes in circumstances that could indicate the carrying value of its real estate assets may not be recoverable.
As part of the Company’s quarterly impairment review procedures, net real estate assets representing 70 properties were deemed to be impaired and their carrying values totaling $134.0 million were reduced to their estimated fair value of $79.4 million, resulting in impairment charges of $54.6 million during the year ended December 31, 2018. The impairment charges relate to certain office, retail and restaurant properties that, during 2018, management identified for potential sale or determined, based on discussions with the current tenants, would not be re-leased.
During the year ended December 31, 2017, net real estate assets related to 69 properties, with carrying values totaling $161.9 million, were deemed to be impaired and their carrying values were reduced to their estimated fair values of $111.4 million, resulting in impairment charges of $50.5 million. The majority of the impairment charges relate to certain office, restaurant and other properties that, during 2017, management identified for potential sale or determined, based on discussions with the current tenants, would not be re-leased.
During the year ended December 31, 2016 net real estate assets related to 153 properties, with carrying values totaling $668.2 million, were deemed to be impaired and their carrying values were reduced to their estimated fair values of $485.4 million, resulting in impairment charges of $182.8 million. A majority of the impairment charges related to properties identified by management for potential sale as part of its portfolio management strategy to reduce exposure to office properties. Additionally, a tenant of 59 restaurants filed for bankruptcy.
The Company estimates fair values using Level 3 inputs and uses a combined income and market approach, specifically using discounted cash flow analysis and recent comparable sales transactions. The evaluation of real estate assets for potential impairment requires the Company’s management to exercise significant judgment and make certain key assumptions, including, but not limited to, the following: (1) capitalization rate; (2) discount rates; (3) number of years property will be held; (4) property operating expenses; and (5) re-leasing assumptions including number of months to re-lease, market rental revenue and required tenant improvements. There are inherent uncertainties in making these estimates such as market conditions and performance and sustainability of the Company’s tenants. For the Company’s impairment tests for the real estate assets during the year ended December 31, 2018, the Company used a range of discount rates from 7.4% to 8.5% with a weighted-average rate of 7.9% and capitalization rates from 6.9% to 8.5% with a weighted-average rate of 7.8%.
The following table presents the impairment charges by asset class recorded during the years ended December 31, 2018, 2017 and 2016 (dollar amounts in thousands):
|
| | | | | | | | | | | | |
| | | Year Ended December 31, |
| | | 2018 | | 2017 | | 2016 |
| Properties impaired | | 70 |
| | 69 |
| | 153 |
|
| | | | | | | |
| Asset classes impaired: | | | | | | |
| Investment in real estate assets, net | | $ | 53,562 |
| | $ | 50,087 |
| | $ | 183,240 |
|
| Investment in direct financing leases, net | | 1,381 |
| | 553 |
| | — |
|
| Below-market lease liabilities, net | | (296 | ) | | (92 | ) | | (421 | ) |
| Total impairment loss | | $ | 54,647 |
| | $ | 50,548 |
| | $ | 182,819 |
|
VEREIT, INC. and VEREIT OPERATING PARTNERSHIP, L.P.
NOTES TO CONSOLIDATED FINANCIAL STATEMENTS
December 31, 2018 – (Continued)
Fair Value of Financial Instruments
The fair value of short-term financial instruments such as cash and cash equivalents, restricted cash, due to affiliates and accounts payable approximate their carrying value in the accompanying consolidated balance sheets due to their short-term nature and are classified as Level 1 under the fair value hierarchy. The fair values of the Company’s financial instruments are reported below (dollar amounts in thousands):
|
| | | | | | | | | | | | | | | | | | |
| | | Level | | Carrying Amount at December 31, 2018 | | Fair Value at December 31, 2018 | | Carrying Amount at December 31, 2017 | | Fair Value at December 31, 2017 |
| Assets: | | | | | | | | | | |
| Mortgage notes receivable, net | | 1, 3 | | $ | 10,164 |
| | $ | 10,164 |
| | $ | 20,294 |
| | $ | 28,272 |
|
| | | | | | | | | | | |
Liabilities (1): | | | | | | | | | | |
| Mortgage notes payable and other debt, net | | 2 | | $ | 1,933,209 |
| | $ | 1,961,496 |
| | $ | 2,095,690 |
| | $ | 2,144,522 |
|
| Corporate bonds, net | | 2 | | 3,395,885 |
| | 3,368,928 |
| | 2,848,768 |
| | 2,922,027 |
|
| Convertible debt, net | | 2 | | 398,591 |
| | 396,905 |
| | 992,218 |
| | 1,012,349 |
|
| Credit facility | | 2 | | 403,000 |
| | 403,000 |
| | 185,000 |
| | 185,000 |
|
| Total liabilities | | | | $ | 6,130,685 |
| | $ | 6,130,329 |
| | $ | 6,121,676 |
| | $ | 6,263,898 |
|
| |
| (1) | Current and prior period liabilities’ carrying and fair values exclude net deferred financing costs. |
Mortgage notes receivable, net –The fair value of the Company’s mortgage notes receivable at December 31, 2017 were valued using Level 3 inputs, which were estimated with a discounted cash flow analysis, utilizing scheduled cash flows and discount rates estimated by management to approximate market interest rates.
As discussed in Note 16 – Subsequent Events, the Company sold four of the remaining five mortgage notes receivable subsequent to December 31, 2018. In connection with the Company’s decision to sell and classify them as held for sale, the fair value of the Company’s mortgage notes receivable at December 31, 2018 were estimated using signed purchase and sale agreements for the four sold subsequent to December 31, 2018 and for the one remaining mortgage note receivable, the fair value was estimated using bids obtained by third-party valuation services that utilize observable market inputs. This resulted in transfers from Level 3 to Level 1.
Debt – The fair value is estimated by an independent third party using a discounted cash flow analysis, based on management’s estimates of observable market interest rates. Corporate bonds and convertible debt are valued using quoted market prices in active markets with limited trading volume when available.
VEREIT, INC. and VEREIT OPERATING PARTNERSHIP, L.P.
NOTES TO CONSOLIDATED FINANCIAL STATEMENTS
December 31, 2018 – (Continued)
Note 7 – Debt
As of December 31, 2018, the Company had $6.1 billion of debt outstanding, including net premiums and net deferred financing costs, with a weighted-average years to maturity of 4.2 years and a weighted-average interest rate of 4.3%. The following table summarizes the carrying value of debt as of December 31, 2018 and 2017, and the debt activity for the year ended December 31, 2018 (in thousands):
|
| | | | | | | | | | | | | | | | | | | | | |
| | | | | | Year Ended December 31, 2018 | | |
| | | | Balance as of December 31, 2017 | | Debt Issuances | | Repayments, Extinguishment and Assumptions | | Accretion and Amortization | | Balance as of December 31, 2018 |
| Mortgage notes payable: | | | | | | | | | | |
| | Outstanding balance | | $ | 2,071,038 |
| | $ | 187 |
| | $ | (154,093 | ) |
| $ | — |
| | $ | 1,917,132 |
|
| | Net premiums (1) | | 24,652 |
| | — |
| | (191 | ) | | (8,384 | ) | | 16,077 |
|
| | Deferred costs | | (12,998 | ) | | (43 | ) | | 30 |
| | 2,459 |
| | (10,552 | ) |
| Mortgages notes payable, net | | 2,082,692 |
|
| 144 |
|
| (154,254 | ) |
| (5,925 | ) |
| 1,922,657 |
|
| Corporate bonds: | | | | | | | | | |
|
|
| | Outstanding balance | | 2,850,000 |
| | 550,000 |
| | — |
| | — |
| | 3,400,000 |
|
| | Discount (2) | | (1,232 | ) | | (3,696 | ) | | — |
| | 813 |
| | (4,115 | ) |
| | Deferred costs | | (27,274 | ) | | (4,825 | ) | | — |
| | 4,823 |
| | (27,276 | ) |
| Corporate bonds, net | | 2,821,494 |
|
| 541,479 |
|
| — |
|
| 5,636 |
|
| 3,368,609 |
|
| Convertible debt: | | | | | | | | | |
|
|
| | Outstanding balance | | 1,000,000 |
| | — |
| | (597,500 | ) | | — |
| | 402,500 |
|
| | Discount (2) | | (7,782 | ) | | — |
| | — |
| | 3,873 |
| | (3,909 | ) |
| | Deferred costs | | (7,960 | ) | | — |
| | — |
| | 4,252 |
| | (3,708 | ) |
| Convertible debt, net | | 984,258 |
|
| — |
|
| (597,500 | ) |
| 8,125 |
|
| 394,883 |
|
| | | | | | | | | | | | |
| Credit facility: | | | | | | | | | |
|
|
| | Outstanding balance | | 185,000 |
| | 1,934,000 |
| | (1,716,000 | ) | | — |
| | 403,000 |
|
| | Deferred costs (3) | | — |
| | (1,236 | ) | | — |
| | 9 |
| | (1,227 | ) |
| Credit facility, net | | 185,000 |
|
| 1,932,764 |
|
| (1,716,000 | ) |
| 9 |
|
| 401,773 |
|
| | | | | | | | | | | |
|
|
| Total debt | | $ | 6,073,444 |
|
| $ | 2,474,387 |
|
| $ | (2,467,754 | ) |
| $ | 7,845 |
|
| $ | 6,087,922 |
|
| |
| (1) | Net premiums on mortgage notes payable were recorded upon the assumption of the respective mortgage notes in relation to the various mergers and acquisitions. Amortization of these net premiums is recorded as a reduction to interest expense over the remaining term of the respective mortgage notes using the effective-interest method. |
| |
| (2) | Discounts on the corporate bonds and convertible debt were recorded based upon the fair value of the respective debt instruments as of the respective issuance dates. Amortization of these discounts is recorded as an increase to interest expense over the remaining term of the respective debt instruments using the effective-interest method. |
| |
| (3) | Deferred costs relate to the Credit Facility Term Loan. |
VEREIT, INC. and VEREIT OPERATING PARTNERSHIP, L.P.
NOTES TO CONSOLIDATED FINANCIAL STATEMENTS
December 31, 2018 – (Continued)
Mortgage Notes Payable
The Company’s mortgage notes payable consisted of the following as of December 31, 2018 (dollar amounts in thousands):
|
| | | | | | | | | | | | | | | | |
| | | Encumbered Properties | | Gross Carrying Value of Collateralized Properties (1) | | Outstanding Balance | | Weighted-Average Interest Rate (2) | | Weighted-Average Years to Maturity (3) |
Fixed-rate debt (4) | | 458 |
| | $ | 3,760,194 |
| | $ | 1,903,095 |
| | 4.92 | % | | 3.5 |
| Variable-rate debt | | 1 |
| | 33,384 |
| | 14,037 |
| | 5.72 | % | (5) | 0.6 |
| Total | | 459 |
| | $ | 3,793,578 |
| | $ | 1,917,132 |
| | 4.93 | % | | 3.4 |
| |
| (1) | Gross carrying value is gross real estate assets, including investment in direct financing leases, net of gross real estate liabilities. |
| |
| (2) | Weighted average interest rate is computed using the interest rate in effect until the anticipated repayment date. Should the loan not be repaid at the anticipated repayment date, the applicable interest rate will increase as specified in the respective loan agreement until the extended maturity date. |
| |
| (3) | Weighted average years remaining to maturity is computed using the anticipated repayment date as specified in each loan agreement, where applicable. |
| |
| (4) | Includes $50.7 million of variable-rate debt fixed by way of interest rate swap arrangements. |
| |
| (5) | Weighted-average interest rate for variable-rate debt represents the interest rate in effect as of December 31, 2018. |
The Company’s mortgage loan agreements generally restrict corporate guarantees and require the maintenance of financial covenants, including maintenance of certain financial ratios (such as debt service coverage ratios and minimum net operating income). The mortgage loan agreements contain no dividend restrictions except in the event of default or when a distribution would drive liquidity below the applicable thresholds. At December 31, 2018, the Company believes that it was in compliance with the financial covenants under the mortgage loan agreements and had no restrictions on the payment of dividends.
On April 12, 2018, the Company entered into a deed-in-lieu of foreclosure agreement with the lender of a mortgage loan, secured by one property, with an outstanding balance of $16.2 million at the time of default and conveyed all interest in the property to satisfy the mortgage loan. As a result of the deed-in-lieu of foreclosure transaction, the Company recognized a gain on forgiveness of debt of $5.2 million, which is included in gain (loss) on extinguishment and forgiveness of debt, net in the accompanying consolidated statements of operations.
During the year ended December 31, 2017, the Company entered into deed-in-lieu of foreclosure agreements or completed the foreclosure with the lenders of three mortgage loans, secured by six properties, which resulted in a gain on forgiveness of debt of $20.5 million.
The following table summarizes the scheduled aggregate principal repayments due on mortgage notes subsequent to December 31, 2018 (in thousands):
|
| | | | |
| | | Total |
| 2019 | | $ | 167,279 |
|
| 2020 | | 265,189 |
|
| 2021 | | 352,768 |
|
| 2022 | | 314,898 |
|
| 2023 | | 144,843 |
|
| Thereafter | | 672,155 |
|
| Total | | $ | 1,917,132 |
|
VEREIT, INC. and VEREIT OPERATING PARTNERSHIP, L.P.
NOTES TO CONSOLIDATED FINANCIAL STATEMENTS
December 31, 2018 – (Continued)
Corporate Bonds
As of December 31, 2018, the OP had $3.40 billion aggregate principal amount of senior unsecured notes (the “Senior Notes”) outstanding comprised of the following (dollar amounts in thousands):
|
| | | | | | | | | |
| | | Outstanding Balance December 31, 2018 | | Interest Rate | | Maturity Date |
| 2019 Senior Notes | | $ | 750,000 |
| | 3.000 | % | | February 6, 2019 |
| 2021 Senior Notes | | 400,000 |
| | 4.125 | % | | June 1, 2021 |
| 2024 Senior Notes | | 500,000 |
| | 4.600 | % | | February 6, 2024 |
| 2025 Senior Notes | | 550,000 |
| | 4.625 | % | | November 1, 2025 |
| 2026 Senior Notes | | 600,000 |
| | 4.875 | % | | June 1, 2026 |
| 2027 Senior Notes | | 600,000 |
| | 3.950 | % | | August 15, 2027 |
| Total balance and weighted-average interest rate | | $ | 3,400,000 |
| | 4.129 | % | | |
On October 16, 2018, the Company closed a senior note offering, consisting of $550.0 million aggregate principal amount of the Operating Partnership’s 4.625% Senior Notes due 2025 (the “2025 Senior Notes”).
The Senior Notes are guaranteed by the General Partner. The OP may redeem all or a part of any series of the Senior Notes at any time, at its option, for the redemption prices set forth in the indenture governing the Senior Notes. If the redemption date is 30 or fewer days prior to the maturity date with respect to the 2019 Senior Notes and the 2021 Senior Notes, is 60 or fewer days prior to the maturity date with respect to the 2025 Senior Notes or is 90 or fewer days prior to the maturity date with respect to the 2024 Senior Notes, the 2026 Senior Notes and the 2027 Senior Notes, the redemption price will equal 100% of the principal amount of the Senior Notes of the applicable series to be redeemed, plus accrued and unpaid interest on the amount being redeemed to, but excluding, the applicable redemption date. The Senior Notes are registered under the Securities Act of 1933, as amended and are freely transferable.
The indenture governing our Senior Notes requires us to maintain financial ratios which include maintaining (i) a maximum limitation on incurrence of total debt less than or equal to 65% of Total Assets (as defined in the indenture), (ii) maximum limitation on incurrence of secured debt less than or equal to 40% of Total Assets (as defined in the indenture), (iii) a minimum debt service coverage ratio of at least 1.5x and (iv) a minimum unencumbered asset value of at least 150% of the aggregate principal amount of all of the outstanding Unsecured Debt (as defined in the indenture). As of December 31, 2018, the Company believes that it was in compliance with the financial covenants of our Senior Notes based on the covenant limits and calculations in place at that time.
Convertible Debt
During the year ended December 31, 2018, the Company’s convertible senior notes due August 1, 2018 (the “2018 Convertible Notes”) matured and the principal outstanding of $597.5 million, plus accrued and unpaid interest thereon, was repaid. The interest rate on the 2018 Convertible Notes was 3.00% annually.
As of December 31, 2018, the Company had convertible senior notes due December 15, 2020 (the “2020 Convertible Notes”) with a balance of $402.5 million outstanding, which excludes the carrying value of the conversion options recorded within additional paid-in capital of $12.8 million and the unamortized discount of $3.9 million. The discount will be amortized over the remaining term of 2.0 years. The 2020 Convertible Notes bear interest at an annual rate of 3.75%.
The 2020 Convertible Notes may be converted into cash, shares of the Company’s Common Stock or a combination thereof, in limited circumstances prior to June 15, 2020, and may be converted into such consideration at any time on or after June 15, 2020. As of December 31, 2018, the conversion rate was 66.7249 shares of the Company’s Common Stock per $1,000 principal amount of 2020 Convertible Notes, which reflects adjustments to the initial conversion rate pursuant to the terms of the applicable indenture as a result of cash dividend payments. There were no changes to the terms of the 2020 Convertible Notes during the year ended December 31, 2018 and the Company believes that it was in compliance with the financial covenants pursuant to the indenture governing the 2020 Convertible Notes as of December 31, 2018.
VEREIT, INC. and VEREIT OPERATING PARTNERSHIP, L.P.
NOTES TO CONSOLIDATED FINANCIAL STATEMENTS
December 31, 2018 – (Continued)
Credit Facility
On May 23, 2018, the General Partner, as guarantor, and the OP, as borrower, entered into a credit agreement with Wells Fargo Bank, National Association as administrative agent and other lenders party thereto (the “Credit Agreement”). The Credit Agreement provides for a $2.0 billion unsecured revolving credit facility (the “Revolving Credit Facility”) and a $900.0 million unsecured term loan facility (the “Credit Facility Term Loan,” together with the Revolving Credit Facility, the “Credit Facility”), which is available through February 23, 2019, for up to four borrowings of delayed-draw term loans. In connection with entering into the Credit Agreement, the OP repaid all of the outstanding obligations under the amended and restated credit agreement dated as of June 30, 2014 (as amended, the “2014 Credit Agreement”) and the 2014 Credit Agreement was terminated. The 2014 Credit Agreement provided for a $2.3 billion revolving credit facility and was scheduled to terminate on June 30, 2018.
As of December 31, 2018, the outstanding balance under the Revolving Credit Facility was $253.0 million. As of December 31, 2018, $150.0 million had been drawn on the Credit Facility Term Loan. The maximum aggregate dollar amount of letters of credit that may be outstanding at any one time under the Credit Facility is $50.0 million.
The Revolving Credit Facility generally bears interest at an annual rate of London Inter-Bank Offer Rate (“LIBOR”) plus 0.775% to 1.55% or Base Rate plus 0.00% to 0.55% (based upon the General Partner’s then current credit rating). “Base Rate” is defined as the highest of the prime rate, the federal funds rate plus 0.50% or a floating rate based on one month LIBOR plus 1.0%, determined on a daily basis. The Credit Facility Term Loan generally bears interest at an annual rate of LIBOR plus 0.85% to 1.75%, or Base Rate plus 0.00% to 0.75% (based upon the General Partner’s then current credit rating). In addition, the Credit Agreement provides the flexibility for interest rate auctions, pursuant to which, at the Company’s election, the Company may request that lenders make competitive bids to provide revolving loans, which competitive bids may be at pricing levels that differ from the foregoing interest rates.
In the event of default, at the election of a majority of the lenders (or automatically upon a bankruptcy event of default with respect to the OP or the General Partner), the commitments of the lenders under the Credit Facility will terminate, and payment of any unpaid amounts in respect of the Credit Facility will be accelerated. The Revolving Credit Facility terminates on May 23, 2022, unless extended in accordance with the terms of the Credit Agreement. The Credit Agreement provides for two six-month extension options with respect to the Revolving Credit Facility, exercisable at the OP’s election and subject to certain customary conditions, as well as certain customary “amend and extend” provisions. Any term loans outstanding under the Credit Facility Term Loan mature on May 23, 2023. At any time, upon timely notice by the OP and subject to any breakage fees, the OP may prepay borrowings under the Credit Facility (subject to certain limitations applicable to the prepayment of any loans obtained through an interest rate auction, as described above). The OP incurs a facility fee equal to 0.10% to 0.30% per annum (based upon the General Partner’s then current credit rating) multiplied by the commitments (whether or not utilized) in respect of the Revolving Credit Facility. In addition, the OP incurs a ticking fee equal to 0.25% multiplied by unused commitments in respect of the Credit Facility Term Loan. The OP also incurs customary administrative agent, letter of credit issuance, letter of credit fronting, extension and other fees.
The Credit Facility requires restrictions on corporate guarantees, as well as the maintenance of financial covenants, including the maintenance of certain financial ratios (such as specified debt to equity and debt service coverage ratios). The key financial covenants in the Credit Facility, as defined and calculated per the terms of the Credit Agreement, include maintaining (i) a maximum leverage ratio less than or equal to 60%, (ii) a minimum fixed charge coverage ratio of at least 1.5x, (iii) a secured leverage ratio less than or equal to 45%, (iv) a total unencumbered asset value ratio less than or equal to 60% and (v) a minimum unencumbered interest coverage ratio of at least 1.75x. The Company believes that it was in compliance with the financial covenants pursuant to the Credit Agreement and is not restricted from accessing any borrowing availability under the Credit Facility as of December 31, 2018.
In connection with entering into the Credit Agreement, the Company capitalized an aggregate $20.7 million in lender fees and third-party costs in respect of the Revolving Credit Facility and the Credit Facility Term Loan, which will be amortized over the respective terms. Deferred financing costs, net of accumulated amortization, related to the Revolving Credit Facility are included in rent and other tenant receivables and other assets, net in the accompanying consolidated balance sheets. Deferred financing costs, net of accumulated amortization, related to the Credit Facility Term Loan outstanding balance are included in credit facility, net in the accompanying consolidated balance sheets.
VEREIT, INC. and VEREIT OPERATING PARTNERSHIP, L.P.
NOTES TO CONSOLIDATED FINANCIAL STATEMENTS
December 31, 2018 – (Continued)
Note 8 – Supplemental Cash Flow Disclosures
Supplemental cash flow information was as follows for the years ended December 31, 2018, 2017 and 2016 (in thousands):
|
| | | | | | | | | | | | |
| | | Year Ended December 31, |
| | | 2018 | | 2017 | | 2016 |
| Supplemental disclosures: | | | | | | |
| Cash paid for interest | | $ | 267,400 |
| | $ | 260,951 |
| | $ | 317,170 |
|
| Cash paid for income taxes | | $ | 5,589 |
| | $ | 11,280 |
| | $ | 20,279 |
|
| Cash received from federal income tax refund | | $ | 2,939 |
| | $ | 16,686 |
| | $ | — |
|
| Non-cash investing and financing activities: | | | | | | |
| Accrued capital expenditures, tenant improvements and real estate developments | | $ | 12,648 |
| | $ | 6,578 |
| | $ | 7,701 |
|
| Accrued deferred financing costs | | $ | 67 |
| | $ | — |
| | $ | 3 |
|
| Distributions declared and unpaid | | $ | 148,383 |
| | $ | 149,768 |
| | $ | 149,281 |
|
| Accrued equity issuance costs | | $ | — |
| | $ | — |
| | $ | 9 |
|
| Mortgage note payable relieved by foreclosure or a deed-in-lieu of foreclosure | | $ | 16,200 |
| | $ | 100,388 |
| | $ | 38,050 |
|
| Mortgage notes payable assumed in real estate disposition | | $ | — |
| | $ | 66,000 |
| | $ | 55,000 |
|
| Real estate investments received from a ground lease expiration and other lease related transactions | | $ | 1,386 |
| | $ | 259 |
| | $ | — |
|
| Real estate investments received from a property-related legal settlement | | $ | — |
| | $ | 775 |
| | $ | — |
|
| Nonmonetary exchanges: | | | | | | |
| Real estate investments received | | $ | — |
| | $ | 50,204 |
| | $ | — |
|
| Real estate investments relinquished and gain on disposition | | $ | — |
| | $ | (47,474 | ) | | $ | — |
|
| Rent and tenant receivables, intangible lease liability and other assets, net | | $ | — |
| | $ | (2,511 | ) | | $ | — |
|
Note 9 – Accounts Payable and Accrued Expenses
Accounts payable and accrued expenses consisted of the following as of December 31, 2018 and 2017 (in thousands):
|
| | | | | | | | |
| | | December 31, 2018 | | December 31, 2017 |
| Accrued interest | | $ | 43,916 |
| | $ | 47,116 |
|
| Accrued real estate taxes | | 25,208 |
| | 26,131 |
|
| Accrued legal fees | | 32,715 |
| | 30,854 |
|
| Accounts payable | | 2,673 |
| | 2,570 |
|
| Accrued other | | 41,099 |
| | 29,803 |
|
| Total | | $ | 145,611 |
| | $ | 136,474 |
|
Note 10 – Commitments and Contingencies
Litigation
The Company is involved in various routine legal proceedings and claims incidental to the ordinary course of its business. There are no material legal proceedings pending against the Company, except as follows:
Government Investigations and Litigation Relating to the Audit Committee Investigation
As previously reported, on October 29, 2014, the Company filed a Current Report on Form 8-K (the “October 29 8-K”) reporting the Audit Committee’s conclusion, based on the preliminary findings of its investigation, that certain previously issued consolidated financial statements of the Company, including those included in the Company’s Annual Report on Form 10-K for the year ended December 31, 2013 and Quarterly Reports on Form 10-Q for the quarters ended March 31, 2014 and June 30, 2014, and related financial information should no longer be relied upon. The Company also reported that the Audit Committee had based its conclusion on the preliminary findings of its investigation into concerns regarding accounting practices and other matters that
VEREIT, INC. and VEREIT OPERATING PARTNERSHIP, L.P.
NOTES TO CONSOLIDATED FINANCIAL STATEMENTS
December 31, 2018 – (Continued)
were first reported to the Audit Committee in early September 2014 and that the Audit Committee believed that an error in the calculation of adjusted funds from operations for the first quarter of 2014 had been identified but intentionally not corrected when the Company reported its financial results for the three and six months ended June 30, 2014. Prior to the filing of the October 29 8-K, the Audit Committee previewed for the SEC the information contained in the filing. Subsequent to that filing, the SEC provided notice that it had commenced a formal investigation and issued subpoenas calling for the production of various documents. In addition, the United States Attorney’s Office for the Southern District of New York contacted counsel for the Audit Committee and counsel for the Company with respect to this matter, and the Secretary of the Commonwealth of Massachusetts issued a subpoena calling for the production of various documents. The Company has been cooperating with these regulators in their investigations.
In connection with these investigations, on September 8, 2016, the United States Attorney’s Office for the Southern District of New York announced the filing of criminal charges against the Company’s former Chief Financial Officer and former Chief Accounting Officer (the “Criminal Action”), as well as the fact that the former Chief Accounting Officer pleaded guilty to the charges filed. Also on September 8, 2016, the SEC announced the filing of a civil complaint against the same two individuals in the United States District Court for the Southern District of New York. On June 30, 2017, following a jury trial, the former Chief Financial Officer was convicted of the charges filed. Both the former Chief Accounting Officer and the former Chief Financial Officer have entered into settlement agreements with the SEC resolving the charges brought against them.
The United States Attorney’s Office has indicated that it does not intend to bring criminal charges against the Company arising from its investigation. In addition, the Company has not been in contact with the Massachusetts regulator since June 2015 and believes the investigation is concluded. In March 2018, investigative staff of the SEC’s enforcement division inquired whether the Company wished to discuss a resolution of potential civil charges the SEC may bring with respect to certain matters investigated by the staff stemming from the announcement made on October 29, 2014. The Company has been cooperating with the SEC staff’s investigation since its inception and is engaged in such discussions with the staff. The timing and substance of the ultimate resolution of these discussions is unknown.
As discussed below, the Company and certain of its former officers and directors have been named as defendants in a number of lawsuits filed following the October 29 8-K, including class actions, individual actions and derivative actions seeking money damages and other relief under the federal securities laws and state laws in both federal and state courts in New York, Maryland and Arizona.
Between October 30, 2014 and January 20, 2015, the Company and certain of its former officers and directors, among other individuals and entities, were named as defendants in ten securities class action complaints filed in the United States District Court for the Southern District of New York. The court consolidated these actions under the caption In re American Realty Capital Properties, Inc. Litigation, No. 15-MC-00040 (AKH) (the “SDNY Consolidated Securities Class Action”). The plaintiffs filed a second amended class action complaint on December 11, 2015, which asserted claims for violations of Sections 11, 12(a)(2) and 15 of the Securities Act of 1933 and Sections 10(b) and 20(a) of the Securities Exchange Act of 1934 and Rule 10b-5 promulgated thereunder. On September 8, 2016, the court issued an order directing plaintiffs to file a third amended complaint to reflect certain prior rulings by the court in connection with various motions to dismiss. The third amended complaint was filed on September 30, 2016 and the defendants were not required to file new answers. On August 31, 2017, the court issued an order granting plaintiffs’ motion for class certification. Defendants’ petitions seeking leave to appeal the court’s order granting class certification were denied on January 24, 2018. Fact depositions were concluded at the end of 2018 and at a status conference in November 2018, the court ordered all summary judgment motions to be filed by February 8, 2019, with briefing on all motions to be completed by April 5, 2019. The next status conference with the court is scheduled for April 17, 2019 and trial is scheduled for September 9, 2019.
VEREIT, INC. and VEREIT OPERATING PARTNERSHIP, L.P.
NOTES TO CONSOLIDATED FINANCIAL STATEMENTS
December 31, 2018 – (Continued)
The Company, certain of its former officers and directors, and the OP, among others, were also named as defendants in thirteen individual securities fraud actions filed in the United States District Court for the Southern District of New York: Jet Capital Master Fund, L.P. v. American Realty Capital Properties, Inc., et al., No. 15-cv-307 (the “Jet Capital Action”); Twin Securities, Inc. v. American Realty Capital Properties, Inc., et al., No. 15-cv-1291; HG Vora Special Opportunities Master Fund, Ltd v. American Realty Capital Properties, Inc., et al., No. 15-cv-4107; BlackRock ACS US Equity Plan. Each Deferred Stock Unit representsTracker Fund, et al. v. American Realty Capital Properties, Inc. et al., No. 15-cv-08464; PIMCO Funds: PIMCO Diversified Income Fund, et al. v. American Realty Capital Properties, Inc. et al., No. 15-cv-08466; Clearline Capital Partners LP, et al. v. American Realty Capital Properties, Inc. et al., No. 15-cv-08467; Pentwater Equity Opportunities Master Fund Ltd., et al. v. American Realty Capital Properties, Inc. et al., No. 15-cv-08510; Archer Capital Master Fund, et al. v. American Realty Capital Properties, Inc. et al, No. 16-cv-05471; Atlas Master Fund et al. v. American Realty Capital Properties, Inc. et al., No. 16-cv-05475; Eton Park Fund, L.P. v. American Realty Capital Properties, Inc., et al., No. 16-cv-09393; Reliance Standard Life Insurance Company, et al, v. American Realty Capital Properties, Inc. et al, No. 17-cv-02796; Fir Tree Capital Opportunity Master Fund, L.P. et al. v. American Realty Capital Properties, Inc. et al., No. 17-cv-04975; and Cohen & Steers Institutional Realty Shares, Inc. et al v. American Realty Capital Properties, Inc. et al., No. 18-cv-06770, (collectively, the “Opt-Out Actions”). The Opt-Out Actions assert claims arising out of allegedly false and misleading statements in connection with the purchase or sale of the Company’s securities. The Company entered into a series of agreements dated September 30 through October 26, 2018, to settle twelve of the thirteen pending Opt-Out Actions (the “Opt Out Settlement Agreements”) brought by plaintiffs holding shares of common stock and swaps referencing common stock representing approximately 18% of VEREIT’s outstanding shares of common stock outstanding at the end of the period covered by the litigations, for an aggregate payment of $127.5 million. The Opt Out Settlement Agreements contain mutual releases by both Plaintiffs and the Company, although the Company retains the right to receivepursue any and all claims against the other defendants in each Action and/or third parties, including claims for contribution for amounts paid in the settlement. The Opt Out Settlement Agreements do not contain any admission of liability, wrongdoing or responsibility by any of the parties. The only remaining opt out action is the Jet Capital Action, which is proceeding on the same summary judgment and trial schedule as the SDNY Consolidated Securities Class Action.
On October 27, 2015, the Company and certain of its former officers, among others, were also named as defendants in an individual securities fraud action filed in the United States District Court for the District of Arizona, captioned Vanguard Specialized Funds, et al. v. VEREIT, Inc. et al., No. 15-cv-02157 (the “Vanguard Action”, and such plaintiffs, “Plaintiffs”). The Vanguard Action asserted claims arising out of allegedly false and misleading statements in connection with the purchase or sale of the Company’s securities. On June 7, 2018, the Company entered into a Settlement Agreement and Release (the “Settlement Agreement”) to settle the Vanguard Action. Pursuant to the terms of the Settlement Agreement, the Plaintiffs filed a motion to dismiss all claims against the Company and the other defendants with prejudice, which was granted by the court on June 19, 2018, and the Company paid Plaintiffs the sum of $90 million in connection with the settlement of the claims. The Settlement Agreement contains mutual releases by both Plaintiffs and the Company, although the Company retains the right to pursue any and all claims against the other defendants in the Action and/or third parties, including claims for contribution for amounts paid in the settlement. The Settlement Agreement does not contain any admission of liability, wrongdoing or responsibility by any of the parties. Vanguard’s holdings accounted for approximately 13% of the Company’s outstanding shares of common stock held at the end of the period covered by the various pending shareholder actions.
In addition to the settlement of the opt-out actions and the Vanguard Action discussed above, on February 5, 2019, the Company entered into a series of agreements to settle claims with shareholders who decided not to participate as class members in the SDNY Consolidated Securities Class Action. Pursuant to the terms of the settlement agreements, the shareholders released all claims that were the subject matter of the SDNY Consolidated Securities Class Action and the Company made payments totaling $15.7 million. In total, the Company has now settled claims of shareholders who held shares of common stock and swaps referencing common stock representing approximately 33.5% of VEREIT’s outstanding shares of common stock held at the end of the period covered by the various pending shareholder actions for payments totaling $233.2 million, which is recorded in “Litigation, merger and other non-routine costs, net of insurance recoveries” in the accompanying consolidated statement of operations for the year ended December 31, 2018.
The Company was also named as a nominal defendant, and certain of its former officers and directors were named as defendants, in shareholder derivative actions filed in the United States District Court for the Southern District of New York: Witchko v. Schorsch, et al., No. 15-cv-06043 (the “Witchko Action”); and Serafin, et al. v. Schorsch, et al., No. 15-cv-08563 (the “Serafin Action”). The court consolidated the Witchko Action and the Serafin Action (together the “SDNY Derivative Action”) and the plaintiffs designated the complaint filed in the Witchko Action as the operative complaint in the SDNY Derivative Action. The SDNY Derivative Action seeks money damages and other relief on behalf of the Company for alleged breaches of fiduciary duty, among other claims. On February 12, 2016, the Company and other defendants filed a motion to dismiss the SDNY Derivative Action due to plaintiffs’ failure to plead facts demonstrating that the Board’s decision to refuse plaintiffs’ pre-suit demands was wrongful and not a protected
VEREIT, INC. and VEREIT OPERATING PARTNERSHIP, L.P.
NOTES TO CONSOLIDATED FINANCIAL STATEMENTS
December 31, 2018 – (Continued)
business judgment. On June 9, 2016, the court granted in part and denied in part the Company’s and other defendants’ motions to dismiss. Plaintiffs filed an amended complaint on June 30, 2016, and the Company and other defendants filed answers to the amended complaint on July 22, 2016. Discovery and summary judgment briefing in the Witchko Action is being coordinated with the SDNY Consolidated Securities Class Action.
On December 3, 2015, the Company was named as a nominal defendant and certain of its former officers and directors were named as defendants in a shareholder derivative action filed in the Circuit Court for Baltimore City in Maryland, Frampton v. Schorsch, et al., No. 24-C-15-006269 (the “Frampton Action”). The Frampton Action seeks money damages and other relief on behalf of the Company for, among other things, alleged breaches of fiduciary duty and contribution and indemnification. By order dated November 4, 2016, the Frampton Action was stayed pending resolution of the SDNY Derivative Action.
On June 10, 2016, the Company was named as a nominal defendant, and certain of its former officers and directors, among others, were named as defendants, in a shareholder derivative action filed in the Supreme Court of the State of New York, Kosky v. Schorsch, et al., No. 653093/2016 (the “Kosky Action”). The Kosky Action seeks money damages and other relief on behalf of the Company for, among other things, alleged breaches of fiduciary duty, negligence, and breach of contract. On October 6, 2016, the parties filed a stipulation staying the Kosky Action until resolution of the SDNY Consolidated Securities Class Action.
On October 6, 2016, the Company was named as a nominal defendant, and certain of its former officers and directors, among others, were named as defendants, in a shareholder derivative action filed in the United States District Court for the District of Maryland, captioned Meloche v. Schorsch, et al., 16-cv-03366 (the “Meloche Action”). An amended complaint was filed on January 17, 2017. The Meloche Action seeks money damages and other relief on behalf of the Company for alleged breaches of fiduciary duty and negligence. By order dated May 16, 2017, the Meloche Action was stayed until resolution of the SDNY Derivative Action.
There can be no assurance as to whether or how the completed settlements may affect any potential future resolution of any other pending lawsuit or claims, the timing of any such resolution, or the amount at which any other matter may be resolved. The Company has not reserved amounts for the SEC investigation, the on-going class action and the remaining opt out action discussed above because it believes that any probable loss or reasonably possible range of loss is not reasonably estimable at this time. With respect to the class action specifically, which represents substantially all of the remaining shares with alleged claims, although the Company believes a loss is probable, it is currently unable to reasonably estimate a possible range of loss because the litigation involves significant uncertainties, including, but not limited to, the complexity of the facts, the legal theories and the nature of the claims, the information to be produced in discovery, which has not yet concluded, the applicable methodology for determining any damages for each of the different types of claims, the extent to which members of the class would or would not file a claim, and the uncertainty inherent in a class action where the trading history and other relevant characteristics of the claimants are not currently known. The ultimate resolution of all of these matters, the timing and substance of which is unknown, may materially impact the Company’s business, financial condition, liquidity and results of operations.
Cole Litigation Matter
In December 2013, Realistic Partners filed a putative class action lawsuit against the Company and the then-members of its board of directors in the Supreme Court for the State of New York, captioned Realistic Partners v. American Realty Capital Partners, et al., No. 654468/2013. The plaintiff alleged, among other things, that the board of the Company breached its fiduciary duties in connection with the transactions contemplated under the Cole Merger Agreement (in connection with the merger between a wholly owned subsidiary of Cole Credit Property Trust III, Inc. and Cole Holdings Corporation) and that Cole Credit Property Trust III, Inc. aided and abetted those breaches. In January 2014, the parties entered into a memorandum of understanding regarding settlement of all claims asserted on behalf of the alleged class of the Company’s stockholders. The proposed settlement terms required the Company to make certain additional disclosures related to the Cole Merger, which were included in a Current Report on Form 8-K filed by the Company with the SEC on January 17, 2014. The memorandum of understanding also contemplated that the parties would enter into a stipulation of settlement, which would be subject to customary conditions, including confirmatory discovery and court approval following notice to the Company’s stockholders, and provided that the defendants would not object to a payment of up to $625,000 for attorneys’ fees. If the parties enter into a stipulation of settlement, which has not occurred, a hearing will be scheduled at which the court will consider the fairness, reasonableness and adequacy of the settlement. There can be no assurance that the parties will enter into a stipulation of settlement, that the court will approve any proposed settlement, or that any eventual settlement will be under the same terms as those contemplated by the memorandum of understanding.
VEREIT, INC. and VEREIT OPERATING PARTNERSHIP, L.P.
NOTES TO CONSOLIDATED FINANCIAL STATEMENTS
December 31, 2018 – (Continued)
Contractual Lease Obligations
The following table reflects the minimum base rent payments due from the Company over the next five years and thereafter for certain ground lease obligations, which are substantially reimbursable by our tenants, and office lease obligations (in thousands):
|
| | | | | | | | |
| | | Future Minimum Base Rent Payments |
| | | Ground Leases | | Office Leases |
| 2019 | | $ | 13,942 |
| | $ | 4,537 |
|
| 2020 | | 13,740 |
| | 4,451 |
|
| 2021 | | 13,542 |
| | 4,387 |
|
| 2022 | | 13,699 |
| | 4,419 |
|
| 2023 | | 14,077 |
| | 3,695 |
|
| Thereafter | | 196,369 |
| | 301 |
|
| Total | | $ | 265,369 |
| | $ | 21,790 |
|
Purchase Commitments
The Company enters into purchase and sale agreements and deposits funds into escrow towards the purchase of real estate assets, some of which are expected to be assigned to one shareof the Cole REITs at or prior to the closing of the respective acquisition. As of December 31, 2018, the Company was a party to five purchase and sale agreements with unaffiliated third-party sellers to purchase a 100% interest in eight properties, subject to meeting certain criteria, for an aggregate purchase price of $81.7 million, exclusive of closing costs. As of December 31, 2018, the Company had $1.1 million of property escrow deposits held by escrow agents in connection with these future property acquisitions, which may be forfeited if the transactions are not completed under certain circumstances. In accordance with the Services Agreement, the Company will be reimbursed by the assigned Cole REIT for amounts escrowed when the property is assigned to the respective Cole REIT.
Environmental Matters
In connection with the ownership and operation of real estate, the Company may potentially be liable for costs and damages related to environmental matters. The Company has not been notified by any governmental authority of any non-compliance, liability or other claim, and is not aware of any other environmental condition, in each case, that it believes will have a material adverse effect on the results of operations.
Note 11 – Equity
Common Stock and General Partner OP Units
The General Partner is authorized to issue up to 1.5 billion shares of Common Stock. The Deferred Stock Units provide for immediate vesting onAs of December 31, 2018, the grant date and will be settled withGeneral Partner had approximately 967.5 million shares of Common Stock eitherissued and outstanding.
Additionally, the Operating Partnership had approximately 967.5 million General Partner OP Units issued and outstanding as of December 31, 2018, corresponding to the General Partner’s outstanding shares of Common Stock.
Common Stock Continuous Offering Program
On September 19, 2016, the Company registered a continuous equity offering program (the “Program”) pursuant to which the Company can offer and sell, from time to time through September 19, 2019 in “at-the-market” offerings or certain other transactions, shares of Common Stock with an aggregate gross sales price of up to $750.0 million, through its sales agents. As of December 31, 2018, no shares of Common Stock have been issued pursuant to the Program.
Preferred Stock and Preferred OP Units
Series F Preferred Stock
As of December 31, 2018, there were approximately 42.8 million shares of Series F Preferred Stock (and approximately 42.8 million corresponding General Partner Series F Preferred Units) and 86,874 Limited Partner Series F Preferred Units issued and outstanding.
The Series F Preferred Stock pays cumulative cash dividends at the rate of 6.70% per annum on their liquidation preference of $25.00 per share (equivalent to $1.675 per share on an annual basis). The Series F Preferred Stock was not redeemable by the
VEREIT, INC. and VEREIT OPERATING PARTNERSHIP, L.P.
NOTES TO CONSOLIDATED FINANCIAL STATEMENTS
December 31, 2018 – (Continued)
Company before January 3, 2019, the earlierfifth anniversary of the date on which such Series F Preferred Stock was issued (the “Initial Redemption Date”), except under circumstances intended to preserve the respective director separatesGeneral Partner’s status as a REIT for federal and/or state income tax purposes and except upon the occurrence of a change of control. On and after the Initial Redemption Date, the General Partner may, at its option, redeem shares of the Series F Preferred Stock, in whole or from time to time in part, at a redemption price of $25.00 per share plus, subject to exceptions, any accrued and unpaid dividends thereon to the date fixed for redemption. The shares of Series F Preferred Stock have no stated maturity, are not subject to any sinking fund or mandatory redemption and will remain outstanding indefinitely unless the General Partner redeems or otherwise repurchases them or they become convertible and are converted into Common Stock (or, if applicable, alternative consideration). The Series F Preferred Stock trades on the NYSE under the symbol VER PRF. The Series F Preferred Units contain the same terms as the Series F Preferred Stock.
For federal income tax purposes, distributions to stockholders are characterized as ordinary dividends, capital gain distributions, or nontaxable distributions. Nontaxable distributions will reduce U.S stockholders’ basis (but not below zero) in their shares. The following table shows the character of the Series F Preferred Stock distributions paid on a percentage basis for the years ended December 31, 2018, 2017 and 2016:
|
| | | | | | | | | |
| | | Year Ended December 31, |
| | | 2018 | | 2017 | | 2016 |
| Ordinary dividends | | 100.0 | % | | 95.0 | % | | 95.0 | % |
| Capital gain distributions | | — | % | | 5.0 | % | | 5.0 | % |
| Total | | 100 | % | | 100 | % | | 100 | % |
Limited Partner OP Units
As of December 31, 2018 the Operating Partnership had approximately 23.7 million Limited Partner OP Units outstanding.
As of December 31, 2018, the Company has received redemption requests totaling approximately 13.1 million Limited Partner OP Units from certain affiliates of the Former Manager, which would have been redeemable for a corresponding number of shares of Common Stock. The Company believes it has potential claims against recipients of those OP Units and has engaged in discussions with affiliates of the Former Manager regarding the redemption requests. Pending any resolution, the Company does not currently intend to satisfy any of the redemption requests. In light of the potential claims, since October 15, 2015, the OP has not paid distributions in respect of a substantial portion of the outstanding Limited Partner OP Units when the Common Stock dividends were otherwise paid.
Common Stock Dividends
The Company declared quarterly dividends to stockholders of record each quarter from the Company orfirst quarter of the year ended December 31, 2016 through the third anniversaryquarter of the grant date,year ended December 31, 2018 of $0.1375 per share of Common Stock (representing an annualized dividend rate of $0.55 per share). The Company’s Board of Directors declared a quarterly cash dividend of $0.1375 per share of Common Stock (equaling an annualized dividend rate of $0.55 per share) for the fourth quarter of 2018 on November 5, 2018 to stockholders of record as of December 31, 2018, which was paid on January 15, 2019. An equivalent distribution by the Operating Partnership is applicable per OP unit.
For federal income tax purposes, distributions to stockholders are characterized as ordinary dividends, capital gain distributions, or nontaxable distributions. Nontaxable distributions will reduce U.S stockholders’ basis (but not below zero) in their shares. The following table shows the character of the Common Stock distributions paid on a percentage basis for the years ended December 31, 2018, 2017 and 2016:
|
| | | | | | | | | |
| | | Year Ended December 31, |
| | | 2018 | | 2017 | | 2016 |
| Ordinary dividends | | 13.8 | % | | 60.0 | % | | 95.0 | % |
| Nondividend distributions | | 86.2 | % | | 37.0 | % | | — | % |
| Capital gain distributions | | — | % | | 3.0 | % | | 5.0 | % |
| Total | | 100 | % | | 100 | % | | 100 | % |
VEREIT, INC. and VEREIT OPERATING PARTNERSHIP, L.P.
NOTES TO CONSOLIDATED FINANCIAL STATEMENTS
December 31, 2018 – (Continued)
Share Repurchase Program
On May 12, 2017, the Company’s Board of Directors authorized the repurchase of up to $200.0 million of the Company’s outstanding Common Stock over the subsequent 12 months, as market conditions warranted (the “2017 Share Repurchase Program”). On May 3, 2018, the Company’s Board of Directors terminated the 2017 Share Repurchase Program and authorized a new program (the “2018 Share Repurchase Program,” collectively with the 2017 Share Repurchase Program, the “Share Repurchase Programs”) that permits the Company to repurchase up to $200.0 million of its outstanding Common Stock through May 3, 2019, as market conditions warrant. Repurchases can be made through open market purchases, privately negotiated transactions, structured or derivative transactions, including accelerated stock repurchase transactions, or other methods of acquiring shares in accordance with applicable securities laws and other legal requirements. The Share Repurchase Programs do not obligate the Company to make any repurchases at a specific time or in a specific situation. Repurchases are subject to prevailing market conditions, the trading price of the stock, the Company’s financial performance and other conditions. Shares of Common Stock repurchased by the Company under the Share Repurchase Programs, if granted pursuantany, will be returned to the director’s voluntary electionstatus of authorized but unissued shares of Common Stock.
During the period from May 12, 2017 through December 31, 2017, the Company repurchased approximately 69,000 shares of Common Stock in multiple open market transactions, at a weighted average share price of $7.50 for an aggregate purchase price of $0.5 million as part of the 2017 Share Repurchase Program. During the period from January 1, 2018 through May 2, 2018, the Company repurchased approximately 6.4 million shares of Common Stock in multiple open market transactions, at a weighted average share price of $6.94 for an aggregate purchase price of $44.6 million, for a total of $45.1 million of shares repurchased as part of the 2017 Share Repurchase Program.
From May 3, 2018 through December 31, 2018, the Company repurchased approximately 0.8 million shares of Common Stock in multiple open market transactions, at a weighted average share price of $6.95 for an aggregate purchase price of $5.6 million as part of the 2018 Share Repurchase Program, which are currently deemed to participatebe authorized but unissued shares of Common Stock. As of December 31, 2018, the Company had $194.4 million available for share repurchases under the 2018 Share Repurchase Program.
Common Stock Repurchases to Settle Tax Obligations
Under the General Partner’s Equity Plan (as defined in Note 12 – Equity-based Compensation), participants have the director’s deferred compensation program,option to have the General Partner repurchase shares vesting from awards made under the Equity Plan in order to satisfy the minimum federal and state tax withholding obligations. During the year ended December 31, 2018, the General Partner repurchased approximately 0.3 million shares to satisfy the federal and state tax withholding obligations on behalf of employees that made this election.
Note 12 – Equity-based Compensation
Equity Plans
The General Partner has an equity-based incentive award plan (the “Equity Plan”), which provides for the dategrant of stock options (“Stock Options”), stock appreciation rights, Restricted Shares, Restricted Stock Units, Deferred Stock Units, dividend equivalent rights and other stock-based awards to non-executive directors, officers, other employees and advisors or consultants who provide services to the Company, as applicable, and a non-executive director separatesrestricted share plan, which are accounted for under U.S. GAAP for share-based payments. The expense for such awards is recognized over the requisite service period. Restricted Shares provide for rights identical to those of Common Stock. Restricted Stock Units do not provide for any rights of a common stockholder prior to the vesting of such Restricted Stock Units. Restricted Shares are considered issued and outstanding. As is the case when fully vested shares of Common Stock are issued from the Company.Equity Plan, for each Restricted Share awarded under the Equity Plan, the Operating Partnership issues a General Partner OP Unit to the General Partner with identical terms. Upon vesting or settlement of Restricted Stock Units or Deferred Stock Units, respectively, the Operating Partnership issues a General Partner OP Unit to the General Partner for each share of Common Stock issued as a result of such vesting.
VEREIT, INC. and VEREIT OPERATING PARTNERSHIP, L.P.
NOTES TO CONSOLIDATED FINANCIAL STATEMENTS
December 31, 2018 – (Continued)
The General Partner has authorized and reserved a total number of shares equal to 10.0% of the total number of issued and outstanding shares of Common Stock (on a fully diluted basis assuming the redemption of all OP Units for shares of Common Stock) to be issued at any time under the Equity Plan for equity incentive awards. As of December 31, 2018, the General Partner had cumulatively awarded under its Equity Plan approximately 4.0 million Restricted Shares, net of the forfeiture of 3.7 million Restricted Shares through that date, 5.3 million Restricted Stock Units, net of the forfeiture/cancellation of 1.8 million Restricted Stock Units through that date, 0.5 million Deferred Stock Units, and 2.8 million Stock Options, net of forfeiture/cancellation of approximately 40,000 Stock Options through that date, collectively representing approximately 12.5 million shares of Common Stock. Accordingly, as of such date, approximately 86.6 million additional shares were available for future issuance. At December 31, 2018, a total of 45,000 shares were awarded under the non-executive director restricted share plan out of the 99,000 shares reserved for issuance.
Restricted Shares
The Company has issued Restricted Shares to certain employees and non-executive directors beginning in 2011. In addition, the Company issued Restricted Shares to employees of affiliates of the Former Manager prior to 2015. The fair value of the Deferred Stock UnitsRestricted Shares granted to employees under the Equity Plan is generally determined using the closing stock price on the grant date and is expensed over the requisite service period or on the grant date for awards with no requisite service period. During eacha straight-line basis. The fair value of Restricted Shares granted to non-executive directors and employees of affiliates of the years ended December 31, 2016 and 2015, the Company recorded $0.8 million of expense related to Deferred Stock Units, which is recorded in general and administrative expense in the accompanying consolidated statements of operations. No Deferred Stock Units were awarded during the year ended December 31, 2014. As of December 31, 2016, there is no unrecognized compensation expense related to the Deferred Stock Units.
The following table details the activity of the Time-Based Restricted Stock Units and Deferred Stock Units during the year ended December 31, 2016.
|
| | | | | | | | | | | | | | |
| | | Time-Based Restricted Stock Units | | Weighted-Average Grant Date Fair Value | | Deferred Stock Units | | Weighted-Average Grant Date Fair Value |
| Unvested units, December 31, 2014 | | — |
| | $ | — |
| | — |
| | $ | — |
|
| Granted | | 671,405 |
| | 9.61 |
| | 90,076 |
| | 8.75 |
|
| Vested | | (41,112 | ) | | 9.46 |
| | (90,076 | ) | | 8.75 |
|
| Forfeited | | (41,155 | ) | | 9.76 |
| | — |
| | — |
|
| Unvested units, December 31, 2015 | | 589,138 |
| | $ | 9.61 |
| | — |
| | $ | — |
|
| Granted | | 736,427 |
| | 7.82 |
| | 87,513 |
| | 9.18 |
|
| Vested | | (199,556 | ) | | 9.52 |
| | (87,513 | ) | | 9.18 |
|
| Forfeited | | (40,095 | ) | | 8.68 |
| | — |
| | — |
|
| Unvested units, December 31, 2016 | | 1,085,914 |
| | $ | 8.43 |
| | — |
| | $ | — |
|
Market-Based Restricted Stock Units
During the year ended December 31, 2015, the General Partner awarded Restricted Stock Units to certain employeesFormer Manager under the Equity Plan that were contingentwas measured based upon the Common Stock reaching a certain market price (the “Market-Based Restricted Stock Units”). The Market-Based Restricted Stock Units were contingent upon the closing price of the Common Stock equaling or exceeding $10 per share for 20 consecutive trading days (the “Market Condition”) and the grantee’s continued employment as of such date on which the Market Condition was met. On July 28, 2016, 610,839 Market-Based Restricted Stock Units vested, of which 199,858 shares were withheld to cover grantees’ tax withholding obligations, resulting in 410,981 shares being issued.
The fair value of goods or services received or the equity instruments granted, whichever was more reliably determinable, and derived service periodwas expensed in full at the date of the Market-Based Restricted Stock Units as of their grant date was determined using a Monte Carlo simulation, which took into account multiple input variables that determine the probability of satisfying the Market Condition. The method required the input of assumptions, including the future dividend yield and expected volatility of the Common Stock. Compensation expense was recognized on a straight-line basis over the derived service period regardless of whether the Market Condition was satisfied, provided that the requisite service condition had been achieved. The Market-Based Restricted Stock Units were fully expensed during the year ended December 31, 2015; however, the Company recorded contra-expense due to the forfeiture of such awards. grant.
During the years ended December 31, 20162018, 2017 and 2015,2016, the Company recorded contra-expense of $0.8$0.6 million, related to forfeitures$2.0 million and expense of $6.0$2.7 million, respectively, which is recorded in general and administrative expense in the accompanying consolidated statements of operations. There were no such expenses related to the Market-Based Restricted Stock Units for the year ended December 31, 2014. As of December 31, 2016, there is no unrecognized compensation expense related to the Market-Based Restricted Stock Units.
Long-Term Incentive Awards
The General Partner may award long-term incentive-based Restricted Stock Units (the “LTI Target Awards”) to employees under the Equity Plan. Vesting of the LTI Target Awards is based upon the General Partner’s level of achievement of total stockholder return (“TSR”), including both share price appreciation and Common Stock dividends, as measured equally against a market index and against a peer group generally over a three year period.
The fair value and derived service period of the LTI Target Awards as of their grant date is determined using a Monte Carlo simulation which takes into account multiple input variables that determine the probability of satisfying the required TSR, as
VEREIT, INC. AND VEREIT OPERATING PARTNERSHIP, L.P.
NOTES TO CONSOLIDATED FINANCIAL STATEMENTS
December 31, 2016 – (Continued)
outlined in the award agreements. This method requires the input of assumptions, including the future dividend yield, the expected volatility of the Common Stock and the expected volatility of the market index constituents and the peer group. Compensation expense is recognized on a straight-line basis over the derived service period regardless of whether the necessary TSR is attained, provided that the requisite service condition has been achieved. During the years ended December 31, 2016 and 2015, the Company recorded $4.6 million and $1.9 million, respectively, of expense related to the LTI Target Awards, which is recorded in general and administrative expense in the accompanying consolidated statements of operations. There were no such expenses related to the LTI Target Awards for the year ended December 31, 2014.Shares. As of December 31, 2016,2018, there is $7.1was $0.1 million of unrecognized compensation expense related to the LTI Target AwardsRestricted Shares with a weighted-average remaining term of 1.60.1 years.
The following table details the activity of the unvested Market-Based Restricted Stock Units and the LTI Target AwardsShares during the year ended December 31, 2016.2018:
|
| | | | | | | | | | | | | | |
| | | Market-Based Restricted Stock Units | | Weighted-Average Grant Date Fair Value | | LTI Target Awards | | Weighted-Average Grant Date Fair Value |
| Unvested units, December 31, 2014 | | — |
| | $ | — |
| | — |
| | $ | — |
|
| Granted | | 922,686 |
| | 8.57 |
| | 816,783 |
| | 11.42 |
|
| Vested | | — |
| | — |
| | (3,311 | ) | | 11.77 |
|
| Forfeited | | (217,882 | ) | | 8.53 |
| | (82,024 | ) | | 11.77 |
|
| Unvested units, December 31, 2015 | | 704,804 |
| | $ | 8.58 |
| | 731,448 |
| | $ | 11.38 |
|
| Granted | | — |
| | — |
| | 855,471 |
| | 7.14 |
|
| Vested | | (610,839 | ) | | 8.58 |
| | (8,065 | ) | | 11.44 |
|
| Forfeited | | (93,965 | ) | | 8.58 |
| | (56,367 | ) | | 11.15 |
|
| Unvested units, December 31, 2016 | | — |
| | $ | — |
| | 1,522,487 |
| | $ | 9.00 |
|
|
| | | | | | | |
| | | Restricted Shares | | Weighted-Average Grant Date Fair Value |
| Unvested shares, December 31, 2017 | | 234,428 |
| | $ | 13.98 |
|
| Vested | | (159,210 | ) | | 13.97 |
|
| Forfeited | | (4,218 | ) | | 13.66 |
|
| Unvested shares, December 31, 2018 | | 71,000 |
| | $ | 14.04 |
|
DirectorTime-Based Restricted Stock PlanUnits
The General Partner adoptedUnder the Non-Executive DirectorEquity Plan, the Company may award Restricted Stock PlanUnits to employees that will vest if the recipient maintains employment over the requisite service period (the “Director“Time-Based Restricted Stock Plan”Units”), which provided for the grant of Restricted Shares of Common Stock to each of the General Partner’s non-executive directors. As of December 31, 2014, a total of 99,000 shares of Common Stock was reserved for issuance under the Director Stock Plan and the General Partner had awarded 45,000 of such shares. As of December 31, 2015, all shares awarded by the General Partner have vested and there was no activity within the Director Stock Plan during the years ended December 31, 2016 or 2015. In accordance with the LPA, the Operating Partnership issued an equal number of General Partner OP Units when the General Partner awarded shares under the Director Stock Plan.
. The fair value of thesethe Time-Based Restricted Shares, as well as the corresponding General Partner OPStock Units issued by the Operating Partnership,granted to employees under the Director StockEquity Plan is generally determined based uponusing the closing stock price on the grant date.
Multi-Year Outperformance Plans
Upon consummation ofdate and is expensed over the the acquisition of American Realty Capital Trust III, Inc.requisite service period on February 28, 2013 (the “ARCT III Merger”), the Company entered into the 2013 Advisor Multi-Year Outperformance Agreement (the “OPP”) with the Former Manager, whereby the Former Manager was able to earn compensation upon the attainment of stockholder value creation targets.
Under the OPP, the Former Manager was granted long-term incentive plan units of the OP (“LTIP Units”), which could be earned or forfeited based on the General Partner’s total return to stockholders, as defined by the OPP, for the three-year period that commenced on December 11, 2012.
Pursuant to previous authorization from the General Partner’s board of directors, as a result of the termination of the management agreement with the Former Manager, all of the approximately 8.2 million LTIP Units were deemed vested and convertible into OP Units upon the consummation of the Company’s transition to self-management on January 8, 2014 and were converted into OP Units on such date. There are no awards outstanding under the OPP and the OPP has been terminated.
During the year ended December 31, 2014, the Operating Partnership recorded expenses of $1.6 million for the LTIP Units under the OPP,straight-line basis, which is recorded in general and administrative expense in the accompanying consolidated statements of operations. As of December 31, 2014, all LTIP Units under the OPP were earned and $93.9 million of the expense was allocated to the non-controlling interest on the consolidated balance sheet.
VEREIT, INC. AND VEREIT OPERATING PARTNERSHIP, L.P.
NOTES TO CONSOLIDATED FINANCIAL STATEMENTS
December 31, 2016 – (Continued)
On October 3, 2013, the General Partner���s board of directors approved a multi-year outperformance plan (the “2014 OPP”), which became effective upon the General Partner’s transition to self-management on January 8, 2014. Under the 2014 OPP, individual agreements were entered into between the General Partner and the participants selected by the General Partner’s board of directors (the “Participants”) that set forth the Participant’s participation percentage in the 2014 OPP and the number of LTIP Units of the OP subject to the award (“OPP Agreements”). Under the 2014 OPP and the OPP Agreements, the Participants were eligible to earn performance-based bonus awards equal to the Participant’s participation percentage of a pool that is funded up to a maximum award opportunity of approximately 5% of the General Partner’s equity market capitalization at the time of the approval of the 2014 OPP which, following the Audit Committee’s and Company’s review, was determined to be $120.0 million, not the $218.1 million pool which had been used originally to calculate and report the awards issued to the Participants.
During thegenerally three months ended December 31, 2014, all of the Participants in the 2014 OPP departed from the Company and forfeited all of their interests in the 2014 OPP. As such, all equity-based compensation expense related to the 2014 OPP was reversed in the three months ended December 31, 2014 and no expense was recorded during the year ended December 31, 2015 or 2016.
The Compensation Committee of the General Partner’s board of directors (the “Compensation Committee”) elected to terminate the 2014 OPP on April 23, 2015, which had zero LTIP Units outstanding following the departures of the Participants in the fourth quarter of 2014. During the first quarter of 2015, the Compensation Committee, with input from its independent compensation consultant, elected to adopt the LTI Target Award structure described above.
Note 18 – Related Party Transactions and Arrangements
Prior to January 8, 2014, the Former Manager managed the Company’s affairs on a day-to-day basis, with the exception of certain acquisition, accounting and portfolio management services performed by employees of the Company. In August 2013, the Company’s board of directors determined that it was in the best interest of the Company and its stockholders to become self-managed, and the Company transitioned to self-management on January 8, 2014. In connection with becoming self-managed, the General Partner terminated the management agreement with the Former Manager and the General Partner and the OP entered into employment and incentive compensation arrangements with certain former executives.
In 2014, the Company and ARCT IV incurred commissions, fees and expenses payable to the Former Manager and its affiliates including Realty Capital Securities, LLC (“RCS”), RCS Advisory Services, LLC (“RCS Advisory”), AR Capital, LLC (“ARC”), ARC Advisory Services, LLC (“ARC Advisory”), American Realty Capital Advisors IV, LLC (the “ARCT IV Advisor”), American National Stock Transfer, LLC (“ANST”) and ARC Real Estate Partners, LLC (“ARC Real Estate”). As a result of the departures of certain officers and directors in December 2014, the Former Manager and its affiliates are no longer affiliated with the Company.
The Audit Committee Investigation identified certain payments made by the Company to the Former Manager and its affiliates that were not sufficiently documented or that otherwise warranted scrutiny. As of December 31, 2014, the Company had recovered consideration valued at $8.5 million in respect of such payments. The Company is considering whether it has a right to seek recovery for any other such payments and, if so, its alternatives for seeking recovery. The Company believes it has potential claims against recipients of certain OP Units and has engaged in discussions with affiliates of the Former Manager regarding pending redemption requests. Prior to any resolution, the Company does not currently intend to satisfy any of the redemption requests. See Note 16 – Equity for further discussion. As of December 31, 2016 and 2015, no asset has been recognized in the accompanying consolidated financial statements related to any potential recovery.
The following table summarizes the related party fees and expenses incurred by the Company and ARCT IV by category and the aggregate amounts contained in such categories for the period presented (in thousands).years. During the years ended December 31, 20162018, 2017 and 2015, there were no transactions with the Former Manager or any of the Former Manager’s affiliates.
|
| | | | |
| | | Year Ended December 31, |
| | | 2014 |
| Expenses and capitalized costs: | | |
| Offering related costs | | $ | 2,150 |
|
| Acquisition related expenses | | 1,652 |
|
| Litigation, merger and other non-routine costs, net of insurance recoveries | | 137,778 |
|
| Management fees to affiliates | | 13,888 |
|
| General and administrative expenses | | 16,089 |
|
| Indirect affiliate expenses | | 10,975 |
|
| Total |
| $ | 182,532 |
|
VEREIT, INC. AND VEREIT OPERATING PARTNERSHIP, L.P.
NOTES TO CONSOLIDATED FINANCIAL STATEMENTS
December 31, 2016, – (Continued)
The following sections below further expand on the summarized related party transactions listed above. Unless otherwise indicated, all of the related party fees and expenses discussed below were incurred and recognized during the year ended December 31, 2014. No such expenses were incurred during the years ended December 31, 2016 and 2015.
Offering Related Costs
The Company and ARCT IV recorded commissions, fees and offering cost reimbursements for services provided to the Company recorded $5.1 million, $6.3 million and ARCT IV, as applicable, by affiliates$3.4 million, respectively, of the Former Manager during the period indicated (in thousands):
|
| | | | |
| | | Year Ended December 31, |
| | | 2014 |
| Offering related costs | | |
| Offering costs and other reimbursements | | $ | 2,150 |
|
RCS served as the dealer-manager of ARCT IV’s initial public offering and received fees and compensation in connection with those transactions. RCS received a selling commission of 7% of gross offering proceeds before reallowance of commissions earned by participating broker-dealers and 3% of the gross proceeds from the sale of common stock, before reallowance to participating broker-dealers, as a dealer manager fee in each of the initial public offerings. In addition, the Company reimbursed RCS for services relating to the Company’s at-the-market equity program during 2014. Offering related costs are included in offering costs in the accompanying consolidated statements of changes in equity.
Acquisition Related Expenses
During the year ended December 31, 2014, the Company paid a fee of $1.0 million (equal to 0.25% of the contract purchase price) to RCS for strategic advisory servicesexpense related to the Company’s acquisition of certain properties from Fortress Investment Group LLC and $0.6 million (equal to 0.25% of the contract purchase price) to RCS related to the Company’s acquisition of certain properties from Inland American Real Estate Trust, Inc.
Litigation, Merger and Other Non-Routine Costs, Net of Insurance Recoveries
The Company and ARCT IV incurred fees and expenses payable to the Former Manager and its affiliates for services related to mergers and other non-routine transactions, as discussed below.
The table below shows fees and expenses attributable to each merger and other non-routine transaction during the year ended December 31, 2014 (in thousands).
|
| | | | | | | | | | | | | | | | | | | | | | |
| | | Year Ended December 31, 2014 |
| | | ARCT IV Merger | | Internalization and Other | | Cole Merger | | Multi-tenant Spin Off | | Total |
| Merger related costs: | | | | | | | | | | | |
| Strategic advisory services | | $ | 8,400 |
| | $ | — |
| | $ | 17,115 |
| | $ | 1,750 |
| | $ | 27,265 | |
| Personnel costs and other reimbursements | | — |
| | — |
| | 72 |
| | — |
| | 72 | |
| Litigation and other non-routine costs: | | | | | | | | | | |
| Post-transaction support services | | 1,352 |
| | 10,000 |
| | — |
| | — |
| | 11,352 | |
| Subordinated distribution fees | | 78,244 |
| | — |
| | — |
| | — |
| | 78,244 | |
| Furniture, fixtures and equipment | | 5,800 |
| | 10,000 |
| | — |
| | — |
| | 15,800 | |
| Personnel costs and other reimbursements | | 417 |
| | — |
| | 1,728 |
| | — |
| | 2,145 | |
| Other fees and expenses | | — |
| | — |
| | 2,900 |
| | — |
| | 2,900 | |
| Total | | $ | 94,213 |
| | $ | 20,000 |
| | $ | 21,815 |
| | $ | 1,750 |
| | $ | 137,778 | |
VEREIT, INC. AND VEREIT OPERATING PARTNERSHIP, L.P.
NOTES TO CONSOLIDATED FINANCIAL STATEMENTS
December 31, 2016 – (Continued)
Merger Related Costs
ARCT IV Merger
Pursuant to ARCT IV’s advisory agreement with the ARCT IV Advisor, ARCT IV agreed to pay the ARCT IV Advisor a brokerage commission on the sale of property in connection with the ARCT IV Merger. At the time of the ARCT IV Merger, ARCT IV paid $8.4 million to the ARCT IV Advisor in connection with this agreement. These commissions were included in litigation, merger and other non-routine costs, net of insurance recoveries in the accompanying consolidated statements of operations for the year ended December 31, 2014.
Cole Merger
The Company entered into an agreement with RCS under which RCS agreed to provide strategic and financial advisory services to the Company in connection with the Cole Merger. The Company agreed to pay a fee equal to 0.25% of the transaction value upon the consummation of the transaction and reimburse out of pocket expenses. The Company incurred and recognized $14.2 million in expense from this agreement in the year ended December 31, 2014.
Pursuant to the transaction management services agreement, dated December 9, 2013, the Company and the OP paid RCS Advisory an aggregate fee of $2.9 million on January 8, 2014, in connection with providing the following services: transaction management support related to the Cole Merger up to the date of the transaction management services agreement and ongoing transaction management support, marketing support, due diligence coordination and event coordination up to the date of the termination of the transaction management services agreement. The transaction management services agreement expired on the consummation of the Company’s transition to self-management on January 8, 2014.
Multi-tenant Spin-off
The Company entered into an agreement with RCS, under which RCS agreed to provide strategic and financial advisory services to the Company in connection with a spin-off of the Company’s multi-tenant shopping center business. During the year ended December 31, 2014, the Company incurred $1.8 million of such fees, which are included in litigation, merger and other non-routine costs, net of insurance recoveries in the accompanying consolidated statements of operations.
Other Non-Routine Transactions
Post-Transaction Support Services
In connection with its entry into the ARCT IV Merger Agreement, ARCT IV agreed to pay additional asset management fees, which totaled $1.3 million, net of credits received from affiliates during the year ended December 31, 2014.
Effective January 8, 2014, the Former Manager agreed to provide certain transition services, including accounting support, acquisition support, investor relations support, public relations support, human resources and administration, general human resources duties, payroll services, benefits services, insurance and risk management, information technology, telecommunications and Internet and services relating to office supplies. The Company paid $10.0 million to the Former Manager on January 8, 2014. This arrangement was in effect for a 60-day term beginning on January 8, 2014.
ARCT IV Merger Subordinated Distribution Fee
On January 3, 2014, the OP entered into a contribution and exchange agreement with the ARCT IV OP, American Realty Capital Trust IV Special Limited Partner, LLC (the “ARCT IV Special Limited Partner”) and ARC Real Estate. The ARCT IV Special Limited Partner was entitled to receive certain distributions from the ARCT IV OP, including the subordinated distribution of net sales proceeds resulting from an “investment liquidity event” (as defined in the agreement of limited partnership of the ARCT IV OP). The ARCT IV Merger constituted an “investment liquidity event,” due to the attainment of the 6.0% performance hurdle and the return to ARCT IV’s stockholders of $358.3 million in addition to their initial investment. Pursuant to the contribution and exchange agreement, the ARCT IV Special Limited Partner contributed its interest in the ARCT IV OP, inclusive of the$78.2 million of subordinated distribution proceeds received, to the ARCT IV OP in exchange for 2.8 million ARCT IV OPTime-Based Restricted Stock Units. Upon consummation of the ARCT IV Merger, these ARCT IV OP Units were immediately converted into 6.7 million OP Units after application of the applicable ARCT IV Exchange Ratio. In conjunction with the ARCT IV Merger Agreement, the ARCT IV Special Limited Partner agreed to hold its OP Units for a minimum of two years before converting them into shares of the Company’s Common Stock.
VEREIT, INC. AND VEREIT OPERATING PARTNERSHIP, L.P.
NOTES TO CONSOLIDATED FINANCIAL STATEMENTS
December 31, 2016 – (Continued)
Furniture, Fixtures and Equipment and Other Assets
The Company entered into three agreements with affiliates of the Former Manager and the Former Manager (the “Sellers”), as applicable, pursuant to which, the Sellers sold the OP certain furniture, fixtures and equipment and other assets (“FF&E”) used by the Sellers in connection with managing the property-level business and operations and accounting functions of the Company and the OP. The Company incurred and recorded $15.8 million to purchase the FF&E and other assets during the year ended December 31, 2014. The Company has concluded that there was no evidence of the receipt and it could not support the value of the FF&E and other assets. As such, the Company expensed the amount originally capitalized and recognized the expense in litigation, merger and other non-routine costs, net of insurance recoveries during the fourth quarter of 2014.
Personnel Costs and Other Reimbursements
The Company and ARCT IV incurred expenses of and paid $1.4 million to RCS Advisory, $0.6 million to ANST and $0.1 million to RCS for personnel costs and reimbursements in connection with non-recurring transactions during the year ended December 31, 2014.
Other Fees and Expenses
In connection with the closing of the Cole Merger, the Company paid $2.9 million to RCS Advisory during the year ended December 31, 2014.
Management Fees to Affiliates
The Company and ARCT IV recorded fees and reimbursements for services provided by the Former Manager and its affiliates related to the operations of the Company and ARCT IV during the year ended December 31, 2014 (in thousands). No such fees were incurred during the years ended December 31, 2016 and 2015.
|
| | | | |
| | | Year Ended December 31, |
| | | 2014 |
| Management fees to affiliates: | | |
| Asset management fees | | $ | 13,888 |
|
Asset Management Fees
ARCT IV
In connection with the asset management services provided by the ARCT IV Advisor, ARCT IV issued (subject to periodic approval by ARCT IV’s board of directors) to the ARCT IV Advisor performance-based restricted partnership units of the ARCT IV OP designated as “ARCT IV Class B Units,” which were intended to be profit interests and to vest, and no longer be subject to forfeiture, at such time as: (x) the value of the ARCT IV OP’s assets plus all distributions equaled or exceeded the total amount of capital contributed by investors plus a 6.0% cumulative, pre-tax, non-compounded annual return thereon (the “economic hurdle”); (y) any one of the following occurs: (1) the termination of the advisory agreement by an affirmative vote of a majority of the Company’s independent directors without cause; (2) a listing; or (3) another liquidity event; and (z) the ARCT IV Advisor was still providing advisory services to ARCT IV.
The calculation of the ARCT IV asset management fees was equal to: (i) 0.1875% of the cost of ARCT IV’s assets; divided by (ii) the value of one share of ARCT IV common stock as of the last day of such calendar quarter. When approved by the board of directors, the ARCT IV Class B Units were issued to the ARCT IV Advisor quarterly in arrears pursuant to the terms of the ARCT IV Operating Partnership agreement. During the year ended December 31, 2013, ARCT IV’s board of directors approved the issuance of 492,483 ARCT IV Class B Units to the ARCT IV Advisor in connection with this arrangement. As of December 31, 2013, ARCT IV did not consider achievement2018, there was $5.6 million of the performance condition to be probable and nounrecognized compensation expense was recorded at that time. The ARCT IV Advisor received distributions on unvested ARCT IV Class B Units equal to the distribution rate received on the ARCT IV common stock. The performance condition related to the 498,857 ARCT IV Class BTime-Based Restricted Stock Units which includes units issued for the periodwith a weighted-average remaining term of January 1, 2014 through the ARCT IV Merger Date, was satisfied upon the completion of the ARCT IV Merger. These ARCT IV Class B Units immediately converted into OP Units at the 2.3961 exchange ratio and the Company recorded an expense of $13.9 million based on the fair value of the ARCT IV Class B Units during the year ended December 31, 2014. No expense was recognized during the years ended December 31, 2016 and 2015.1.8 years.
VEREIT, INC. AND VEREIT OPERATING PARTNERSHIP, L.P.
NOTES TO CONSOLIDATED FINANCIAL STATEMENTS
December 31, 2016 – (Continued)
General and Administrative Expenses
2018 vs 2017 – The Company and ARCT IV recorded general and administrative expenses as shown in the table below for services provided by the Former Manager and its affiliates related to the operationsincrease of the Company and ARCT IV during the period indicated (in thousands):
|
| | | | |
| | | Year Ended December 31, |
| | | 2014 |
| General and administrative expenses: | | |
| Advisory fees and reimbursements | | $ | 2,015 |
|
| Equity awards | | 14,074 |
|
| Total | | $ | 16,089 |
|
Advisory Fees and Reimbursements
The Company and ARCT IV agreed to pay certain fees and reimbursements$5.3 million during the year ended December 31, 20142018 as compared to the Former Managersame period in 2017 was primarily due to an increase of $5.5 million of compensation and benefits, including equity-based compensation.
2017 vs 2016 – The increase of $6.7 million during the year ended December 31, 2017 as compared to the same period in 2016 was primarily due to an increase of $6.8 million of compensation and benefits, including equity-based compensation.
Depreciation and Amortization Expenses
2018 vs 2017 – The decrease of $66.2 million during the year ended December 31, 2018 as compared to the same period in 2017 was primarily due to furniture and fixtures that were fully depreciated during 2017 and 2018, as they had reached the end of their useful lives.
2017 vs 2016 – The decrease of $55.2 million during the year ended December 31, 2017 as compared to the same period in 2016 was primarily related to the disposition of 438 consolidated properties subsequent to January 1, 2016. The Company also recorded $50.5 million and $182.8 million of impairment charges on real estate investments during the years ended December 31, 2017 and 2016, respectively, which reduced the carrying value being depreciated and amortized.
Impairments
2018 vs 2017 – The increase in impairments of $4.1 million during the year ended December 31, 2018 as compared to the same period in 2017 was primarily attributable to management’s change in strategy related to certain retail properties which management determined, based on discussions with the current tenants, will not be re-leased, offset by a decrease in impairments related to industrial properties. The Company impaired 70 properties during the year ended December 31, 2018 as compared to 69 properties during the year ended December 31, 2017.
2017 vs 2016 – The decrease in impairments of $132.3 million during the year ended December 31, 2017 as compared to the same period in 2016 was primarily due to a decrease in the number of properties impaired from 153 properties during the year ended December 31, 2016 to 69 properties during the year ended December 31, 2017. In addition, the decrease was also due to management identifying certain properties for potential sale as part of its affiliates,portfolio management strategy to reduce exposure to office properties during the year ended December 31, 2016 as applicable,well as the Chapter 11 bankruptcy filed by Ovation Brands, Inc. during 2016.
Other (Expense) Income, Provision for their out-of-pocket costs, including without limitation, legal feesIncome Taxes and expenses,Income (Loss) from Discontinued Operations
The table below sets forth, for the periods presented, certain financial information and the dollar amount change year over year (dollar amounts in thousands):
|
| | | | | | | | | | | | | | | | | | | | |
| | | Year Ended December 31, |
| | | 2018 | | 2017 | | 2016 | | 2018 vs 2017
Increase/(Decrease) | | 2017 vs 2016
Increase/(Decrease) |
| Interest expense | | $ | (280,887 | ) | | $ | (289,766 | ) | | $ | (317,376 | ) | | $ | (8,879 | ) | | $ | (27,610 | ) |
| Gain (loss) on extinguishment and forgiveness of debt, net | | 5,360 |
| | 18,373 |
| | (771 | ) | | (13,013 | ) | | 19,144 |
|
| Other income, net | | 14,735 |
| | 6,242 |
| | 5,251 |
| | 8,493 |
| | 991 |
|
| Equity in income and gain on disposition of unconsolidated entities | | 1,869 |
| | 2,763 |
| | 9,783 |
| | (894 | ) | | (7,020 | ) |
| Gain (loss) on derivative instruments, net | | 355 |
| | 2,976 |
| | (1,191 | ) | | (2,621 | ) | | 4,167 |
|
| Gain on disposition of real estate and real estate assets held for sale, net | | 94,331 |
| | 61,536 |
| | 45,524 |
| | 32,795 |
| | 16,012 |
|
| Provision for income taxes | | (5,101 | ) | | (6,882 | ) | | (7,136 | ) | | (1,781 | ) | | (254 | ) |
| Income (loss) from discontinued operations, net of income taxes | | 3,695 |
| | (19,117 | ) | | (123,937 | ) | | 22,812 |
| | 104,820 |
|
Interest Expense
2018 vs 2017 – The decrease of $8.9 million during the year ended December 31, 2018 as compared to the same period in 2017 was primarily due diligence feesto the repayment of the 2018 Convertible Notes of $597.5 million and expenses, other third party feesa $153.9 million reduction of secured debt, partially offset by the issuance of $550.0 million of the 2025 Senior Notes and expenses,an increase in net borrowings under the credit facilities of $218.0 million. In addition, there was a decrease in amortization of deferred financing costs of appraisals, travel expenses, nonrefundable option payments and deposits on properties not acquired, accounting fees and expenses, title insurance premiums and other closing costs, personnel costs and miscellaneous expenses relating$3.1 million related to the selection, acquisitioncredit facilities during the year ended December 31, 2018 as compared to the same period in 2017, which was due to lower deferred financing costs incurred in connection with the entrance into the Credit Agreement during the year ended December 31, 2018 as compared to the deferred financing costs incurred in connection with the 2014 Credit Agreement.
2017 vs 2016 – The decrease of $27.6 million during the year ended December 31, 2017 as compared to the same period in 2016 was primarily due to a $579.9 million reduction of secured debt, partially offset by the issuance of $600.0 million of Senior Notes and due diligencea reduction in net borrowings under the credit facilities of properties or general operation$315.0 million.
Gain (Loss) on Extinguishment and Forgiveness of Debt, Net
2018 vs 2017 – Gain (loss) on extinguishment and forgiveness of debt, net decreased $13.0 million during the Company.year ended December 31, 2018 as compared to the same period in 2017. During the year ended December 31, 2014, these expenses totaled $2.0 million. No such expenses were incurred during the years ended December 31, 2016 and 2015.
Equity Awards
Upon consummation of the ARCT III Merger,2018, the Company entered into the OPPa deed-in-lieu of foreclosure agreement with the Former Manager. The OPP gavelender of a mortgage loan, secured by one property, which resulted in a gain on forgiveness of debt of $5.2 million. During the Former Managersame period in 2017, the opportunityCompany entered into deed-in-lieu of foreclosure agreements with the lenders of three mortgage loans, secured by six properties, which resulted in a gain on forgiveness of debt of $20.5 million, which was offset by the write-off of $2.0 million of deferred financing costs related to earn compensation upon the attainmenttermination of certain stockholder value creation targets.the 2014 Credit Agreement.
2017 vs 2016 – Gain (loss) on extinguishment and forgiveness of debt, net increased $19.1 million during the year ended December 31, 2017 as compared to the same period in 2016. During the year ended December 31, 2014,2017, the Company entered into deed-in-lieu of foreclosure agreements with the lenders of three mortgage loans, secured by six properties, which resulted in a gain on forgiveness of debt of $20.5 million. There were no comparable transactions resulting in gains on forgiveness of debt during the year ended December 31, 2016.
Other Income, Net
2018 vs 2017 – The increase of $8.5 million during the year ended December 31, 2018 as compared to the same period in 2017 was primarily due to a $5.1 million gain on measuring the Company’s investments in the Cole REITs at fair value after the investments were no longer accounted for using the equity method, $4.8 million received related to a fully reserved loan receivable and a gain of $1.7 million related to the sale of three mortgage notes, offset by a loss of $2.2 million related to the sale of six CMBS and a reduction of $1.2 million in 1031 real estate program revenues during the year ended December 31, 2018.
2017 vs 2016 – The increase of $1.0 million during the year ended December 31, 2017 as compared to the same period in 2016 was primarily due to post-closing adjustments of $1.6 million, recorded in accordance with the purchase and sale agreement during the year ended December 31, 2016, related to a multi-tenant asset portfolio sale completed in 2014, offset by a decrease in interest income related to the Company’s investment securities and mortgage notes receivable of $0.6 million.
Equity in Income and Gain on Disposition of Unconsolidated Entities
2018 vs 2017 – Equity in income and gain on disposition of unconsolidated entities decreased $0.9 million during the year ended December 31, 2018 as compared to the same period in 2017. During the year ended December 31, 2018, the Company recorded a $0.7 million gain on the disposition and liquidation of one property owned by an unconsolidated joint venture. During the year ended December 31, 2017, the Company recorded a $1.9 million gain on the disposition of one land parcel owned by one unconsolidated joint venture.
2017 vs 2016 – Equity in income and gain on disposition of unconsolidated entities decreased $7.0 million during the year ended December 31, 2017 as compared to the same period in 2016. During the year ended December 31, 2017, the Company recorded a gain of $1.9 million related to the disposition of one land parcel owned by one unconsolidated joint venture. During the year ended December 31, 2016, the Company recorded a gain of $10.2 million related to the disposition of one unconsolidated joint venture owning one property.
Gain (Loss) on Derivative Instruments, Net
2018 vs 2017 – The $2.6 million decrease during the year ended December 31, 2018 as compared to the same period in 2017, was recordedprimarily a result of the termination of 13 derivative instruments with an aggregate notional value of $662.4 million and the de-designation of one derivative instrument with a notional value of $27.8 million during 2017.
2017 vs 2016 – The $4.2 million increase during the year ended December 31, 2017 as compared to the same period in 2016, was primarily the result of the termination of six interest rate swaps in connection with the early repayment of the outstanding borrowings under the 2014 Credit Agreement, which resulted in a gain of $1.1 million as compared to a loss of $3.3 million in 2016.
Gain on Disposition of Real Estate and Real Estate Assets Held For Sale, Net
2018 vs 2017 – The increase in gain on disposition of real estate and real estate assets held for sale, net of $32.8 million during the year ended December 31, 2018 as compared to the same period in 2017, was due to the Company’s disposition of 148 properties, excluding one property conveyed to the lender in a deed-in-lieu of foreclosure transaction, for an aggregate sales price of $526.4 million which resulted in a gain of $96.2 million during the year ended December 31, 2018, as compared to the disposal of 131 properties, excluding six properties transferred to the lender in either a deed-in-lieu of foreclosure or foreclosure sale transaction, for an aggregate sales price of $594.9 million during the same period in 2017 for a gain of $64.7 million. During the year ended December 31, 2018, the Company also recognized a loss of $1.9 million related to assets classified as held for sale, as compared to a loss of $3.1 million during the same period in 2017.
2017 vs 2016 – The increase in gain on disposition of real estate and real estate assets held for sale, net of $16.0 million during the year ended December 31, 2017 as compared to the same period in 2016, was due to the Company’s disposition of 131 properties, excluding six properties transferred to the lender in either a deed-in-lieu of foreclosure or foreclosure sale transaction, for an aggregate sales price of $594.9 million which resulted in a gain of $64.7 million during the year ended December 31, 2017, as compared to the disposal of 301 properties for an aggregate sales price of $1.1 billion during the same period in 2016 for a gain of $50.6 million, which included $28.8 million of goodwill allocation related to the sales. During the year ended December 31, 2017, the Company also recognized a loss of $3.1 million related to assets classified as held for sale, as compared to a loss of $5.1 million during the same period in 2016.
Provision for Income Taxes
2018 vs 2017 – The consolidated provision for income taxes of $5.1 million for the year ended December 31, 2018 as compared to a provision of $6.9 million for the same period in 2017 reflects an overall decrease in expense attributable to the tax impact related to the gain on the sale of certain Canadian properties in 2017.
2017 vs 2016 – The consolidated provision for income taxes of $6.9 million for the year ended December 31, 2017 as compared to a provision of $7.1 million for the same period in 2016 reflects an overall decrease in expense attributable to higher state taxes in 2016 and tax on net income from properties held in and sold by a TRS in 2016, which were partially offset by tax on the gain on the sale of certain Canadian properties in 2017.
Income (Loss) from Discontinued Operations, Net of Income Taxes
2018 vs 2017 – The decrease in loss from discontinued operations, net of income taxes of $22.8 million during the year ended December 31, 2018 was primarily due to the completion of the sale of Cole Capital on February 1, 2018.
2017 vs 2016 – During the fourth quarter of 2017, the Company entered into a purchase and sale agreement to sell substantially all of the Cole Capital segment. The decrease in loss from discontinued operations, net of income taxes of $104.8 million during the year ended December 31, 2017 was primarily due to decreases in impairment of goodwill of $120.9 million, in general and administrative expenses of $18.8 million and in amortization of intangible assets of $11.7 million, partially offset by the loss recognized on classification as held for sale of $20.0 million and an increase in the provision for income taxes of $24.7 million. Revenues, net of reallowed fees and commissions increased $1.8 million for the year ended December 31, 2017, as compared to the year ended December 31, 2016.
Non-GAAP Measures
Our results are presented in accordance with U.S. GAAP. We also disclose certain non-GAAP measures, as discussed further below. Management uses these non-GAAP financial measures in our internal analysis of results and believes these measures are useful to investors for the reasons explained below. These non-GAAP financial measures should not be considered as substitutes for any measures derived in accordance with U.S. GAAP.
Funds from Operations and Adjusted Funds from Operations
Due to certain unique operating characteristics of real estate companies, as discussed below, the National Association of Real Estate Investment Trusts, Inc. (“Nareit”), an industry trade group, has promulgated a supplemental performance measure known as funds from operations (“FFO”), which we believe to be an appropriate supplemental performance measure to reflect the operating performance of a REIT. FFO is not equivalent to our net income or loss as determined under U.S. GAAP.
Nareit defines FFO as net income or loss computed in accordance with U.S. GAAP, excluding gains or losses from disposition of property, depreciation and amortization of real estate assets, impairment write-downs on real estate, and our pro rata share of FFO adjustments related to unconsolidated partnerships and joint ventures. We calculated FFO in accordance with Nareit’s definition described above.
In addition to FFO, we use adjusted funds from operations (“AFFO”) as a non-GAAP supplemental financial performance measure to evaluate the operating performance of the Company. AFFO, as defined by the Company, excludes from FFO non-routine items such as acquisition-related expenses, litigation, merger and other non-routine costs, net of insurance recoveries, held for sale loss on discontinued operations, net revenue or expense earned or incurred that is related to the Services Agreement we entered into with Cole Capital on February 1, 2018, gains or losses on sale of investment securities or mortgage notes receivable, legal settlements and insurance recoveries not in the ordinary course of business and payments received on fully reserved loan receivables. We also exclude certain non-cash items such as impairments of goodwill and intangible assets, straight-line rent, net of bad debt expense related to straight-line rent, net direct financing lease adjustments, gains or losses on derivatives, reserves for loan loss, gains or losses on the extinguishment or forgiveness of debt, non-current portion of the tax benefit or expense, equity-based compensation relatingand amortization of intangible assets, deferred financing costs, premiums and discounts on debt and investments, above-market lease assets and below-market lease liabilities. We omit the impact of the Excluded Properties and related non-recourse mortgage notes from FFO to calculate AFFO. Management believes that excluding these costs from FFO provides investors with supplemental performance information that is consistent with the performance models and analysis used by management, and provides investors a view of the performance of our portfolio over time. AFFO allows for a comparison of the performance of our operations with other publicly-traded REITs, as AFFO, or an equivalent measure, is routinely reported by publicly-traded REITs, and we believe often used by analysts and investors for comparison purposes.
For all of these reasons, we believe FFO and AFFO, in addition to net income (loss), as defined by U.S. GAAP, are helpful supplemental performance measures and useful in understanding the various ways in which our management evaluates the performance of the Company over time. However, not all REITs calculate FFO and AFFO the same way, so comparisons with other REITs may not be meaningful. FFO and AFFO should not be considered as alternatives to net income (loss) and are not intended to be used as a liquidity measure indicative of cash flow available to fund our cash needs. Neither the SEC, Nareit, nor any other regulatory body has evaluated the acceptability of the exclusions used to adjust FFO in order to calculate AFFO and its use as a non-GAAP financial performance measure.
The table below presents FFO and AFFO for the years ended December 31, 2018, 2017 and 2016 (in thousands, except share and per share data) and includes both continuing operations, which primarily represent the Company's real estate operations, and discontinued operations, which represent substantially all of Cole Capital.
|
| | | | | | | | | | | | |
| | | Year Ended December 31, |
| | | 2018 | | 2017 | | 2016 |
| Net (loss) income | | $ | (88,030 | ) | | $ | 32,378 |
| | $ | (200,824 | ) |
| Dividends on non-convertible preferred stock | | (71,892 | ) | | (71,892 | ) | | (71,892 | ) |
| Gain on disposition of real estate assets and interests in unconsolidated joint ventures, net | | (95,034 | ) | | (61,536 | ) | | (55,722 | ) |
| Depreciation and amortization of real estate assets | | 637,097 |
| | 703,133 |
| | 756,315 |
|
| Impairment of real estate | | 54,647 |
| | 50,548 |
| | 182,820 |
|
| Proportionate share of adjustments for unconsolidated entities | | 1,278 |
| | 477 |
| | 2,719 |
|
| FFO attributable to common stockholders and limited partners | | 438,066 |
| | 653,108 |
| | 613,416 |
|
| Acquisition-related expenses | | 3,632 |
| | 3,402 |
| | 1,321 |
|
| Litigation, merger and other non-routine costs, net of insurance recoveries | | 290,309 |
| | 51,762 |
| | 3,884 |
|
| Impairment of goodwill and intangible assets | | — |
| | — |
| | 120,931 |
|
| Loss on disposition and held for sale loss on discontinued operations | | 1,815 |
| | 20,027 |
| | — |
|
| Payments received on fully reserved loans | | (4,792 | ) | | — |
| | — |
|
| Gain on investment securities and mortgage notes receivable | | (4,092 | ) | | (65 | ) | | — |
|
| (Gain) loss on derivative instruments, net | | (355 | ) | | (2,976 | ) | | 1,191 |
|
| Amortization of premiums and discounts on debt and investments, net | | (3,486 | ) | | (4,616 | ) | | (14,693 | ) |
| Amortization of above-market lease assets and deferred lease incentives, net of amortization of below-market lease liabilities | | 4,178 |
| | 5,366 |
| | 5,396 |
|
| Net direct financing lease adjustments | | 2,023 |
| | 2,093 |
| | 2,264 |
|
| Amortization and write-off of deferred financing costs | | 19,166 |
| | 24,536 |
| | 28,063 |
|
| Amortization of management contracts | | — |
| | 14,514 |
| | 26,171 |
|
Deferred and other tax (benefit) expense (1) | | (1,855 | ) | | 8,671 |
| | (10,136 | ) |
| (Gain) loss on extinguishment and forgiveness of debt, net | | (5,360 | ) | | (18,373 | ) | | 771 |
|
| Straight-line rent, net of bad debt expense related to straight-line rent | | (39,723 | ) | | (44,903 | ) | | (54,190 | ) |
| Equity-based compensation | | 12,417 |
| | 16,751 |
| | 10,728 |
|
| Other amortization and non-cash charges, net | | 1,446 |
| | 2,566 |
| | 5,296 |
|
| Proportionate share of adjustments for unconsolidated entities | | 36 |
| | 378 |
| | 1,044 |
|
| Adjustments for Excluded Properties | | 465 |
| | 6,528 |
| | — |
|
| AFFO attributable to common stockholders and limited partners | | $ | 713,890 |
| | $ | 738,769 |
| | $ | 741,457 |
|
| | | | | | | |
| Weighted-average shares of Common Stock outstanding - basic | | 969,092,268 |
| | 974,098,652 |
| | 931,422,844 |
|
Effect of Limited Partner OP Units and dilutive securities(2) | | 24,145,875 |
| | 24,059,312 |
| | 24,626,646 |
|
Weighted-average shares of Common Stock outstanding - diluted (3) | | 993,238,143 |
| | 998,157,964 |
| | 956,049,490 |
|
| | | | | | | |
| AFFO attributable to common stockholders and limited partners per diluted share | | $ | 0.72 |
|
| $ | 0.74 |
| | $ | 0.78 |
|
| |
| (1) | This adjustment represents the non-current portion of the provision for or benefit from income taxes in order to show only the current portion of the provision for or benefit from income taxes as an impact to AFFO. For the three months ended December 31, 2017, this adjustment is net of a current tax benefit due to the acceleration of a bonus compensation-related deduction to take advantage of the Company’s higher effective tax rate in 2017. As the Company already recognized the prior year bonus compensation-related tax deduction during the three months ended March 31, 2017, the acceleration of the 2018 benefit was not included in the computation of AFFO. |
| |
| (2) | Dilutive securities include unvested restricted shares of Common Stock, unvested restricted stock units and stock options. |
| |
| (3) | Weighted-average shares for all periods presented exclude the effect of the convertible debt as the Company would expect to settle the debt with cash and any shares underlying restricted stock units that are not issuable based on the Company’s level of achievement of certain performance targets through the respective reporting period. |
Liquidity and Capital Resources
General
Our principal liquidity needs for the next twelve months and beyond are to:
fund normal operating expenses;
fund capital expenditures, tenant improvements and leasing costs
meet debt service and principal repayment obligations, including balloon payments on maturing debt;
pay dividends;
pay litigation costs and expenses (including any settlements or judgments); and
fund property and/or common stock acquisitions.
We expect to be able to satisfy these obligations using one or more of the following sources:
cash flow from operations;
proceeds from real estate dispositions;
utilization of Credit Facility;
cash and cash equivalents balance;
issuance of VEREIT debt and equity securities; and
cash flow from insurance recoveries.
Continuous Equity Offering Program
On September 19, 2016, the Company registered a continuous equity offering program (the “Program”) pursuant to which the Company can offer and sell, from time to time through September 19, 2019 in “at-the-market” offerings or certain other transactions, shares of Common Stock with an aggregate gross sales price of up to $750.0 million, through its sales agents. The Company intends to use the proceeds from any sale of shares for general corporate purposes, which may include funding potential acquisitions and repurchasing or repaying outstanding indebtedness. As of December 31, 2018, no shares of Common Stock have been issued pursuant to the change in total returnProgram.
Share Repurchase Program
On May 3, 2018, the Company’s Board of Directors terminated the 2017 Share Repurchase Program and authorized the 2018 Share Repurchase Program, which permits the Company to stockholders used in computing the numberrepurchase up to $200.0 million of LTIP units earned betweenits outstanding Common Stock through May 3, 2019, as market conditions warrant. As of December 31, 20132018, the Company had $194.4 million available for share repurchases under the 2018 Share Repurchase Program. Additional shares of Common Stock repurchased by the Company, if any, will be returned to the status of authorized but unissued shares of Common Stock.
Disposition Activity
As part of our effort to optimize our real estate portfolio by focusing on holding core assets, during the year ended December 31, 2018, we disposed of 149 properties, including one property conveyed to a lender in a deed-in-lieu of foreclosure transaction, and January 8, 2014.one property owned by an unconsolidated joint venture for an aggregate sales price of $560.5 million, of which our share was $521.4 million, resulting in consolidated proceeds of $502.3 million after repayment of the unconsolidated joint venture’s mortgage loan and closing costs. We expect to continue to explore opportunities to sell additional properties to provide us further financial flexibility and fund property acquisitions.
Credit Facility
Summary and Obligations
On May 23, 2018, the Company, as guarantor, and the Operating Partnership, as borrower, entered into a Credit Agreement with Wells Fargo Bank, National Association, as administrative agent, and the other lenders party thereto that allows for maximum borrowings of $2.9 billion, consisting of a $2.0 billion Revolving Credit Facility and a $900.0 million Credit Facility Term Loan, available through February 23, 2019, for up to four borrowings of delayed-draw term loans. As of December 31, 2018, the Revolving Credit Facility had an outstanding balance of $253.0 million and $150.0 million had been drawn on the Credit Facility Term Loan. In connection with entering into the Credit Agreement, the OP repaid all of the outstanding obligations under the 2014 Credit Agreement.
The Revolving Credit Facility generally bears interest at an annual rate of London Inter-Bank Offer Rate (“LIBOR”) plus 0.775% to 1.55% or Base Rate plus 0.00% to 0.55% (based upon the General Partner’s then current credit rating). “Base Rate” is defined as the highest of the prime rate, the federal funds rate plus 0.50% or a floating rate based on one month LIBOR plus 1.0%, determined on a daily basis. The Credit Facility Term Loan generally bears interest at an annual rate of LIBOR plus 0.85% to 1.75%, or Base Rate plus 0.00% to 0.75% (based upon the General Partner’s then current credit rating). In addition, the Credit Agreement provides the flexibility for interest rate auctions, pursuant to which, at the Company’s election, the Company may request that lenders make competitive bids to provide revolving loans, which competitive bids may be at pricing levels that differ from the foregoing interest rates.
Credit Facility Covenants
The Credit Facility requires restrictions on corporate guarantees, as well as the maintenance of certain financial covenants. The key financial covenants in the Credit Facility, as defined and calculated per the terms of the Credit Agreement include maintaining the following:
|
| | |
| Unsecured Credit Facility Key Covenants | | Required |
| Ratio of total indebtedness to total asset value | | ≤ 60% |
| Ratio of adjusted EBITDA to fixed charges | | ≥ 1.5x |
| Ratio of secured indebtedness to total asset value | | ≤ 45% |
| Ratio of unsecured indebtedness to unencumbered asset value | | ≤ 60% |
| Ratio of unencumbered adjusted NOI to unsecured interest expense | | ≥ 1.75x |
The Company believes that it was in compliance with the financial covenants pursuant to the Credit Agreement and is not restricted from accessing any borrowing availability under the Credit Facility as of December 31, 2018.
Corporate Bonds
Summary and Obligations
During the year ended December 31, 2014,2018, the Company granted 796,075 restricted share awards to employeesclosed the 2025 Senior Notes offering, consisting of affiliates$550.0 million aggregate principal amount of 4.625% Senior Notes due 2025. The OP used the net proceeds from the offering of the Former Manager as compensation fornotes to repay borrowings under its Revolving Credit Facility.
As of December 31, 2018, the OP had $3.4 billion aggregate principal amount of Senior Notes outstanding, with a weighted-average maturity of 5.0 years. The indenture governing the Senior Notes requires that the Company be in compliance with certain serviceskey financial covenants, including maintaining the following:
|
| | |
| Corporate Bond Key Covenants | | Required |
| Limitation on incurrence of total debt | | ≤ 65% |
| Limitation on incurrence of secured debt | | ≤ 40% |
| Debt service coverage ratio | | ≥ 1.5x |
| Maintenance of total unencumbered assets | | ≥ 150% |
There were no material changes to the financial covenants of our Senior Notes during the year ended December 31, 2018. As of December 31, 2018, the Company believes that it was in compliance with these financial covenants based on the covenant limits and 87,702 restricted stock awardscalculations in place at that time.
On February 6, 2019, the Company’s 2019 Senior Notes matured and the principal outstanding of $750.0 million, plus accrued and unpaid interest thereon, was repaid, utilizing borrowings under the Credit Facility.
Convertible Debt
Summary and Obligations
During the year ended December 31, 2018, the Company’s 2018 Convertible Notes matured and the principal outstanding of $597.5 million, plus accrued and unpaid interest thereon, was repaid with proceeds from the Revolving Credit Facility.
As of December 31, 2018, the Company had $402.5 million aggregate principal amount outstanding of convertible senior notes due December 15, 2020 (the “2020 Convertible Notes”). The OP has issued corresponding identical convertible notes to two directors whothe General Partner. There were affiliatesno changes to the terms of the Former Manager. 2020 Convertible Notes and the Company believes that it was in compliance with the financial covenants pursuant to the indenture governing the 2020 Convertible Notes as of December 31, 2018.
Mortgage Notes Payable and Other Debt
Summary and Obligations
As of December 31, 2018, we had non-recourse mortgage indebtedness of $1.9 billion, which was collateralized by 459 properties, reflecting a decrease from December 31, 2017 of $153.9 million derived primarily from our disposition activity during the year ended December 31, 2018. Our mortgage indebtedness bore interest at the weighted-average rate of 4.93% per annum and had a weighted-average maturity of 3.4 years. We may in the future incur additional mortgage debt on the properties we currently own or use long-term non-recourse financing to acquire additional properties.
The grant date fair valuepayment terms of our loan obligations vary. In general, only interest amounts are payable monthly with all unpaid principal and interest due at maturity. Some of our loan agreements require that we comply with specific reporting and financial covenants mainly related to debt coverage ratios and loan-to-value ratios. Each loan that has these requirements has specific ratio thresholds that must be met.
Restrictions on Loan Covenants
Our mortgage loan obligations generally restrict corporate guarantees and require the maintenance of financial covenants, including maintenance of certain financial ratios (such as specified debt to equity and debt service coverage ratios), as well as the maintenance of a minimum net worth. The mortgage loan agreements contain no dividend restrictions except in the event of default or when a distribution would drive liquidity below the applicable thresholds. At December 31, 2018, the Company believes that it was in compliance with the financial covenants under the mortgage loan agreements and had no restrictions on the payment of dividends.
Litigation
During the year ended December 31, 2018, we entered into settlement agreements with various plaintiffs in connection with litigation filed as a result of the awardsfindings of $12.5the Audit Committee Investigation for $217.5 million. The Company also entered into settlement agreements for $15.7 million subsequent to December 31, 2018, which was accrued and included in litigation, merger and other non-routine costs, net of insurance recoveries in the consolidated statements of operations for the year ended December 31, 2014 was recorded in general and administrative expenses in2018.
Dividends
On November 5, 2018, the accompanying consolidated statementsCompany’s Board of operations. No such expenses or grants were madeDirectors declared a quarterly cash dividend of $0.1375 per share of Common Stock (equaling an annualized dividend rate of $0.55 per share) for the fourth quarter of 2018 to employeesstockholders of affiliatesrecord as of the Former Manager during the years ended December 31, 20162018, which was paid on January 15, 2019. An equivalent distribution by the Operating Partnership is applicable per OP unit.
Our Series F Preferred Stock, as discussed in Note 11 – Equity to our consolidated financial statements, will pay cumulative cash dividends at the rate of 6.70% per annum on their liquidation preference of $25.00 per share (equivalent to $1.675 per share on an annual basis). As of December 31, 2018, there were approximately 42.8 million shares of Series F Preferred Stock (and approximately 42.8 million corresponding Series F Preferred Units that were issued to the General Partner) and 2015.86,874 Limited Partner Series F Preferred Units that were issued and outstanding.
Indirect Affiliate Expenses
Contractual Obligations
The Company incurred fees and expenses payable to affiliatesfollowing is a summary of the Former Manager or payable to a third party on behalfour contractual obligations as of affiliates of the Former Manager for amenities related to certain buildings, as explained below. These expenses are depicted in the table belowDecember 31, 2018 (in thousands):
|
| | | | | | | | | | | | | | | | | | | | |
| | | Total | | Less than 1 year | | 1-3 years | | 4-5 years | | More than 5 years |
| Principal payments - mortgage notes | | $ | 1,917,132 |
| | $ | 167,279 |
| | $ | 617,957 |
| | $ | 459,741 |
| | $ | 672,155 |
|
Interest payments - mortgage notes (1) (2) | | 321,914 |
| | 93,710 |
| | 144,935 |
| | 80,830 |
| | 2,439 |
|
| Principal payments - Credit Facility | | 403,000 |
| | — |
| | — |
| | 403,000 |
| | — |
|
Interest payments - Credit Facility (2) | | 58,702 |
| | 15,918 |
| | 30,990 |
| | 11,794 |
| | — |
|
| Principal payments - corporate bonds | | 3,400,000 |
| | 750,000 |
| | 400,000 |
| | — |
| | 2,250,000 |
|
| Interest payments - corporate bonds | | 754,473 |
| | 120,075 |
| | 226,151 |
| | 202,776 |
| | 205,471 |
|
| Principal payments - convertible debt | | 402,500 |
| | — |
| | 402,500 |
| | — |
| | — |
|
| Interest payments - convertible debt | | 29,517 |
| | 15,094 |
| | 14,423 |
| | — |
| | — |
|
| Operating and ground lease commitments | | 287,159 |
| | 18,479 |
| | 36,120 |
| | 35,890 |
| | 196,670 |
|
Build-to-suit and other commitments (3) | | 30,343 |
| | 30,343 |
| | — |
| | — |
| | — |
|
| Total | | $ | 7,604,740 |
| | $ | 1,210,898 |
| | $ | 1,873,076 |
| | $ | 1,194,031 |
| | $ | 3,326,735 |
|
| |
| (1) | As of December 31, 2018, we had $50.7 million of variable rate mortgage notes effectively fixed through the use of interest rate swap agreements. We used the effective interest rates fixed under our swap agreements to calculate the debt payment obligations in future periods. |
| |
| (2) | Interest payments due in future periods on the $14.0 million of variable rate debt and the Credit Facility payment obligations were calculated using a forward LIBOR curve. |
| |
| (3) | Includes one build-to-suit development project and the Company’s share of capital expenditures related an expansion project of the property held within an unconsolidated joint venture. |
Cash Flow Analysis for the year ended December 31, 2014 (in thousands). No such expenses were incurred during2018
Operating Activities –During the yearsyear ended December 31, 2018, net cash provided by operating activities decreased $299.4 million to $493.9 million from $793.3 million during the same period in 2017. The decrease was primarily due to an increase in litigation and other non-routine costs, including litigation settlements, paid during the year ended December 31, 2018. In addition, there was a decrease in interest payments due to the repayment of the 2018 Convertible Notes and a reduction of secured debt, offset by the issuance of the 2025 Senior Notes and an increase in net borrowings under the credit facilities during the year ended December 31, 2018 as compared to the same period in 2017.
Investing Activities –Net cash provided by investing activities for the year ended December 31, 2018 increased $425.2 million to $151.1 million from $274.1 million net cash used in investing activities during the same period in 2017. The increase was primarily related to a decrease in investments in real estate assets of $198.4 million, net proceeds from disposition of discontinued operations of $122.9 million and an increase in cash proceeds from dispositions of real estate and joint ventures of $56.8 million.
Financing Activities –Net cash used in financing activities of $655.4 million decreased $101.2 million during the year ended December 31, 2018 from $756.6 million during the same period in 2017. The decrease was primarily related to a decrease in payments on mortgage notes payable and other debt, including debt extinguishment costs of $286.5 million, which was partially offset by a decrease of $117.1 million in net proceeds related to the credit facilities, corporate bonds and convertible notes and repurchases of Common Stock under the Share Repurchase Programs of $50.2 million with no comparable repurchases during the same period in 2017.
Cash Flow Analysis for the year ended December 31, 2017
Operating Activities –During the year ended December 31, 2017, net cash provided by operating activities decreased $4.7 million to $793.3 million from $797.9 million during the same period in 2016. The decrease was primarily due to a decrease in rental receipts related to the disposition of 438 consolidated properties subsequent to January 1, 2016 and 2015.an increase in litigation and other non-routine costs paid during the year ended December 31, 2017. This decrease was mostly offset by a decrease in interest payments and insurance recoveries received as compared to the same period in 2016, the receipt of an income tax refund during the year ended December 31, 2017, and an increase in rental receipts related to the acquisition of 96 consolidated properties subsequent to January 1, 2016.
Investing Activities –Net cash used in investing activities for the year ended December 31, 2017 changed $1.2 billion to $274.1 million from cash provided by investing activities of $881.6 million during the same period in 2016. The change was primarily related to an increase in investments in real estate assets of $598.8 million and decrease in cash proceeds from dispositions of real estate and joint ventures of $555.2 million.
Financing Activities –Net cash used in financing activities of $756.6 million decreased $750.4 million during the year ended December 31, 2017 from $1.5 billion during the same period in 2016. The decrease was primarily due to a decrease in repayments of debt, net of proceeds, of $1.5 billion, which was partially offset by the 2016 Common Stock offering resulting in net proceeds, after underwriting discounts and offering costs, of $702.8 million and an increase in distributions paid of $28.1 million.
Election as a REIT
The General Partner elected to be taxed as a REIT for U.S. federal income tax purposes under Sections 856 through 860 of the Internal Revenue Code commencing with the taxable year ended December 31, 2011. We believe we are organized and operating in such a manner as to qualify to be taxed as a REIT for the taxable year ended December 31, 2018. As a REIT, the General Partner is generally not subject to federal income tax on taxable income that it distributes to its stockholders so long as it distributes at least 90% of its annual taxable income (computed without regard to the deduction for dividends paid and excluding net capital gains). However, the General Partner, its TRS entities, and the OP are still subject to certain state and local income, franchise and property taxes in the various jurisdictions in which they operate. The General Partner may also be subject to federal income taxes on certain income and excise taxes on its undistributed income.
The OP is classified as a partnership for U.S. federal income tax purposes. As a partnership, the OP is not a taxable entity for U.S. federal income tax purposes. Instead, each partner in the OP is required to include its allocable share of the OP’s income, gains, losses, deductions and credits for each taxable year. Under the LPA, the OP is to conduct business in such a manner as to permit the General Partner at all times to qualify as a REIT.
A TRS is a subsidiary of a REIT that is subject to federal, state and local income taxes, as applicable. The Company’s use of a TRS enables it to engage in certain business activities while complying with the REIT qualification requirements and to retain any income generated by these businesses for reinvestment without the requirement to distribute those earnings. The Company conducted substantially all of the Cole Capital business activities through a TRS until it sold the Cole Capital business on February 1, 2018.
During the year ended December 31, 2018, the Company conducted all of its business in the United States, Puerto Rico and Canada and filed income tax returns in the U.S. federal jurisdiction, the Canadian federal jurisdiction and various state and local jurisdictions. With few exceptions, the Company is no longer subject to routine examinations by taxing authorities for years before 2014. Certain of the Company’s intercompany transactions that have been eliminated in consolidation for financial accounting purposes are also subject to taxation.
Inflation
We may be adversely impacted by inflation on any leases that do not contain indexed escalation provisions. However, net leases that require the tenant to pay its allocable share of operating expenses, including common area maintenance costs, real estate taxes and insurance, may reduce our exposure to increases in costs and operating expenses resulting from inflation.
Related Party Transactions and Agreements
Through the closing of the Cole Capital sale, we were contractually responsible for managing the Cole REITs’ affairs on a day-to-day basis, identifying and making acquisitions and investments on the Cole REITs’ behalf, and recommending to each of the Cole REIT’s respective board of directors an approach for providing investors with liquidity. In addition, we distributed the shares of common stock for certain of the Cole REITs and advised them regarding offerings, managed relationships with participating broker-dealers and financial advisors, and provided assistance in connection with compliance matters relating to the offerings. We received compensation and reimbursement for services relating to the Cole REITs’ offerings and the investment, management and disposition of their respective assets, as applicable. See Note 13 –Related Party Transactions and Arrangements to our consolidated financial statements in this report for a further explanation of the various related party transactions, agreements and fees.
Off-Balance Sheet Arrangements
We have no material off-balance sheet arrangements that have had or are reasonably likely to have a current or future effect on our financial condition, changes in financial condition, revenues or expenses, results of operations, liquidity, capital expenditures or capital resources.
Item 7A. Quantitative and Qualitative Disclosures About Market Risk.
Market Risk
The market risk associated with financial instruments and derivative financial instruments is the risk of loss from adverse changes in market prices or interest rates. Our market risk arises primarily from interest rate risk relating to variable-rate borrowings. To meet our short and long-term liquidity requirements, we borrow funds at a combination of fixed and variable rates. Our interest rate risk management objectives are to limit the impact of interest rate changes on earnings and cash flows and to manage our overall borrowing costs. To achieve these objectives, from time to time, we may enter into interest rate hedge contracts such as swaps, collars and treasury lock agreements in order to mitigate our interest rate risk with respect to various debt instruments. We would not hold or issue these derivative contracts for trading or speculative purposes.
Interest Rate Risk
As of December 31, 2018, our debt included fixed-rate debt, including debt that has interest rates that are fixed with the use of derivative instruments, with a fair value and carrying value each of $5.7 billion. Changes in market interest rates on our fixed rate debt impact the fair value of the debt, but they have no impact on interest incurred or cash flow. For instance, if interest rates rise 100 basis points, and the fixed rate debt balance remains constant, we expect the fair value of our debt to decrease, the same way the price of a bond declines as interest rates rise. The sensitivity analysis related to our fixed-rate debt assumes an immediate 100 basis point move in interest rates from their December 31, 2018 levels, with all other variables held constant. A 100 basis point increase in market interest rates would result in a decrease in the fair value of our fixed rate debt of $201.3 million. A 100 basis point decrease in market interest rates would result in an increase in the fair value of our fixed-rate debt of $213.8 million.
As of December 31, 2018, our debt included variable-rate debt with a fair value of $417.2 million and a carrying value of $417.0 million. The sensitivity analysis related to our variable-rate debt assumes an immediate 100 basis point move in interest rates from their December 31, 2018 levels, with all other variables held constant. A 100 basis point increase or decrease in variable interest rates on our variable-rate debt would increase or decrease our interest expense by $4.2 million annually. See Note 7 –Debt to our consolidated financial statements.
As of December 31, 2018, our interest rate swap had a fair value that resulted in assets of $0.5 million. See Note 2 – Summary of Significant Accounting Policies to our consolidated financial statements for further discussion.
As the information presented above includes only those exposures that existed as of December 31, 2018, it does not consider exposures or positions arising after that date. The information presented herein has limited predictive value. Future actual realized gains or losses with respect to interest rate fluctuations will depend on cumulative exposures, hedging strategies employed and the magnitude of the fluctuations.
These amounts were determined by considering the impact of hypothetical interest rate changes on our borrowing costs and assume no other changes in our capital structure.
Credit Risk
Concentrations of credit risk arise when a number of tenants are engaged in similar business activities, or activities in the same geographic region, or have similar economic features that would cause their ability to meet contractual obligations, including those to the Company, to be similarly affected by changes in economic conditions. The Company is subject to tenant, geographic and industry concentrations. Any downturn of the economic conditions in one or more of these tenants, geographies or industries could result in a material reduction of our cash flows or material losses to us.
The factors considered in determining the credit risk of our tenants include, but are not limited to: payment history; credit status and change in status (credit ratings for public companies are used as a primary metric); change in tenant space needs (i.e., expansion/downsize); tenant financial performance; economic conditions in a specific geographic region; and industry specific credit considerations. We believe that the credit risk of our portfolio is reduced by the high quality of our existing tenant base, reviews of prospective tenants’ risk profiles prior to lease execution and consistent monitoring of our portfolio to identify potential problem tenants.
Item 8. Financial Statements and Supplementary Data.
The information required by Item 8 is hereby incorporated by reference to our consolidated financial statements beginning on page F-1 of this document.
Item 9. Changes in and Disagreements with Accountants on Accounting and Financial Disclosure.
None.
Item 9A. Controls and Procedures.
I. Discussion of Controls and Procedures of the General Partner
For purposes of the discussion in this Part I of Item 9A, the “Company” refers to the General Partner.
Evaluation of Disclosure Controls and Procedures
We maintain disclosure controls and procedures (as defined in Rules 13a-15(e) and 15d-15(e) of the Exchange Act that are designed to provide reasonable assurance that information required to be disclosed in our Exchange Act reports is recorded, processed, summarized and reported within the time periods specified in the SEC’s rules and forms, and that such information is accumulated and communicated to our management, including our Chief Executive Officer and Chief Financial Officer, as appropriate, to allow timely decisions regarding required disclosure. In designing and evaluating the disclosure controls and procedures, we recognize that no controls and procedures, no matter how well designed and operated, can provide absolute assurance of achieving the desired control objectives.
In accordance with Rules 13a-15(b) and 15d-15(b) of the Exchange Act, management, under the supervision and with the participation of our Chief Executive Officer and Chief Financial Officer, carried out an evaluation of the effectiveness of our disclosure controls and procedures as of December 31, 2018 and determined that the disclosure controls and procedures were effective at a reasonable assurance level as of that date.
Management’s Annual Report on Internal Control over Financial Reporting
Our management is responsible for establishing and maintaining adequate internal control over financial reporting, as such term is defined in Rules 13a-15(f) and 15d-15(f) under the Exchange Act. Internal control over financial reporting is a process to provide reasonable assurance regarding the reliability of our financial reporting and the preparation of financial statements for external purposes in accordance with GAAP. Because of its inherent limitations, internal control over financial reporting is not intended to provide absolute assurance that a misstatement of our financial statements would be prevented or detected.
Under the supervision and with the participation of our management, including our Chief Executive Officer and Chief Financial Officer, we conducted an evaluation of the effectiveness of our internal control over financial reporting based on the framework in Internal Control — Integrated Framework (2013) issued by the Committee of Sponsoring Organizations of the Treadway Commission.
Based on this evaluation, management has concluded that our internal control over financial reporting was effective as of December 31, 2018.
The effectiveness of our internal control over financial reporting as of December 31, 2018 has been audited by Deloitte & Touche LLP, an independent registered public accounting firm, as stated in their report in this Annual Report on Form 10-K.
Changes in Internal Control Over Financial Reporting
No change occurred in our internal control over financial reporting (as defined in Rules 13a-15(f) and 15d -15(f) of the Exchange Act) during the three months ended December 31, 2018 that has materially affected, or is reasonably likely to materially affect, our internal control over financial reporting.
II. Discussion of Controls and Procedures of the Operating Partnership
In the information incorporated by reference into this Part II of Item 9A, the term “Company” refers to the Operating Partnership, except as the context otherwise requires.
Evaluation of Disclosure Controls and Procedures
We maintain disclosure controls and procedures (as defined in Rules 13a-15(e) and 15d-15(e) of the Exchange Act that are designed to provide reasonable assurance that information required to be disclosed in our Exchange Act reports is recorded, processed, summarized and reported within the time periods specified in the SEC’s rules and forms, and that such information is accumulated and communicated to our management, including our Chief Executive Officer and Chief Financial Officer, as
appropriate, to allow timely decisions regarding required disclosure. In designing and evaluating the disclosure controls and procedures, we recognize that no controls and procedures, no matter how well designed and operated, can provide absolute assurance of achieving the desired control objectives.
In accordance with Rules 13a-15(b) and 15d-15(b) of the Exchange Act, management, under the supervision and with the participation of our Chief Executive Officer and Chief Financial Officer, carried out an evaluation of the effectiveness of our disclosure controls and procedures as of December 31, 2018 and determined that the disclosure controls and procedures were effective at a reasonable assurance level as of that date.
Management’s Annual Report on Internal Control over Financial Reporting
Our management is responsible for establishing and maintaining adequate internal control over financial reporting, as such term is defined in Rules 13a-15(f) and 15d-15(f) under the Exchange Act. Internal control over financial reporting is a process to provide reasonable assurance regarding the reliability of our financial reporting and the preparation of financial statements for external purposes in accordance with GAAP. Because of its inherent limitations, internal control over financial reporting is not intended to provide absolute assurance that a misstatement of our financial statements would be prevented or detected.
Under the supervision and with the participation of our management, including our Chief Executive Officer and Chief Financial Officer, we conducted an evaluation of the effectiveness of our internal control over financial reporting based on the framework in Internal Control — Integrated Framework (2013) issued by the Committee of Sponsoring Organizations of the Treadway Commission.
Based on this evaluation, management has concluded that our internal control over financial reporting was effective as of December 31, 2018.
Changes in Internal Control Over Financial Reporting
No change occurred in our internal control over financial reporting (as defined in Rules 13a-15(f) and 15d -15(f) of the Exchange Act) during the three months ended December 31, 2018 that has materially affected, or is reasonably likely to materially affect, our internal control over financial reporting.
REPORT OF INDEPENDENT REGISTERED PUBLIC ACCOUNTING FIRM
To the shareholders and the Board of Directors of VEREIT, Inc.
Opinion on Internal Control over Financial Reporting
We have audited the internal control over financial reporting of VEREIT, Inc. and subsidiaries (the “Company”) as of December 31, 2018, based on criteria established in Internal Control - Integrated Framework (2013) issued by the Committee of Sponsoring Organizations of the Treadway Commission (COSO). In our opinion, the Company maintained, in all material respects, effective internal control over financial reporting as of December 31, 2018, based on criteria established in Internal Control - Integrated Framework (2013) issued by COSO.
We have also audited, in accordance with the standards of the Public Company Accounting Oversight Board (United States) (PCAOB), the consolidated financial statements and financial statement schedules as of and for the year ended December 31, 2018, of the Company and our report dated February 20, 2019, expressed an unqualified opinion on those financial statements.
Basis for Opinion
The Company’s management is responsible for maintaining effective internal control over financial reporting and for its assessment of the effectiveness of internal control over financial reporting included in the accompanying Management’s Annual Report on Internal Control over Financial Reporting. Our responsibility is to express an opinion on the Company’s internal control over financial reporting based on our audit. We are a public accounting firm registered with the PCAOB and are required to be independent with respect to the Company in accordance with the U.S. federal securities laws and the applicable rules and regulations of the Securities and Exchange Commission and the PCAOB.
We conducted our audit in accordance with the standards of the PCAOB. Those standards require that we plan and perform the audit to obtain reasonable assurance about whether effective internal control over financial reporting was maintained in all material respects. Our audit included obtaining an understanding of internal control over financial reporting, assessing the risk that a material weakness exists, testing and evaluating the design and operating effectiveness of internal control based on the assessed risk and performing such other procedures as we considered necessary in the circumstances. We believe that our audit provides a reasonable basis for our opinion.
Definition and Limitations of Internal Control over Financial Reporting
A company’s internal control over financial reporting is a process designed to provide reasonable assurance regarding the reliability of financial reporting and the preparation of financial statements for external purposes in accordance with generally accepted accounting principles. A company’s internal control over financial reporting includes policies and procedures that (1) pertain to the maintenance of records that, in reasonable detail, accurately and fairly reflect the transactions and dispositions of the assets of the company; (2) provide reasonable assurance that transactions are recorded as necessary to permit preparation of financial statements in accordance with generally accepted accounting principles, and that receipts and expenditures of the company are being made only in accordance with authorizations of management and directors of the company; and (3) provide reasonable assurance regarding prevention or timely detection of unauthorized acquisition, use, or disposition of the company’s assets that could have a material effect on the financial statements.
Because of its inherent limitations, internal control over financial reporting may not prevent or detect misstatements. Also, projections of any evaluation of effectiveness to future periods are subject to the risk that controls may become inadequate because of changes in conditions, or that the degree of compliance with the policies or procedures may deteriorate.
/s/ DELOITTE & TOUCHE LLP
Phoenix, Arizona
February 20, 2019
Item 9B. Other Information.
None
PART III
Item 10. Directors, Executive Officers and Corporate Governance.
The information required by this Item will be included in our definitive proxy statement for the 2019 Annual Meeting of Stockholders (the “Proxy Statement”), to be filed within 120 days following the end of our fiscal year, and is incorporated herein by reference.
Item 11. Executive Compensation.
The information required by this Item will be included in the Proxy Statement and is incorporated herein by reference.
Item 12. Security Ownership of Certain Beneficial Owners and Management and Related Stockholder Matters.
The information required by this Item will be included in the Proxy Statement and is incorporated herein by reference.
Item 13. Certain Relationships and Related Transactions, and Director Independence.
The information required by this Item will be included in the Proxy Statement and is incorporated herein by reference.
Item 14. Principal Accounting Fees and Services.
The information required by this Item will be included in the Proxy Statement and is incorporated herein by reference.
PART IV
Item 15. Exhibits and Financial Statement Schedules.
Financial Statements
The Financial Statements are included herein at pages F-1 through F-60.
Financial Statement Schedules
Schedule II - Valuation and Qualifying Accounts is included herein on page F-61.
Schedule III - Real Estate and Accumulated Depreciation is included herein on pages F-62 through F-194.
Schedule IV - Mortgage Loans Held for Investment is included herein on page F-195.
Exhibits
The following exhibits are included in this Annual Report on Form 10-K for the fiscal year ended December 31, 2018 (and are numbered in accordance with Item 601 of Regulation S-K):
|
| | | | |
| | | Year Ended December 31, |
| | | 2014 |
| Indirect affiliate expenses: | | |
| Audrain building | | $ | 8,724 |
|
| ANST office build-out | | 462 |
|
| New York (405 Park Ave.) office | | 1,659 |
|
| Dresher, PA office | | 92 |
|
| North Carolina office | | 38 |
|
| Total | | $ | 10,975 |
|
|
| | |
| Exhibit No. | | Description |
| 2.1 | | Agreement and Plan of Merger by and among VEREIT, Inc., VEREIT Operating Partnership, L.P., Tiger Acquisition LLC, American Realty Capital Trust III, Inc. and American Realty Capital Operating Partnership III, L.P., dated as of December 14, 2012 (Incorporated by reference to the Company’s Current Report on Form 8-K (File No. 001-35263), filed with the SEC on December 17, 2012). |
| 2.2 | | Agreement and Plan of Merger, by and among, VEREIT, Inc., VEREIT Operating Partnership, L.P., Safari Acquisition, LLC, CapLease, Inc., CapLease, LP and CLF OP General Partner LLC, dated as of May 28, 2013 (Incorporated by reference to the Company’s Current Report on Form 8-K (File NO. 001-35263), filed with the SEC on May 28, 2013). |
| 2.3 | | Purchase and Sale Agreement, by and among, CNL APF Partners, LP and Certain Affiliates as Seller Parties, and VEREIT Operating Partnership, L.P., as Purchaser, dated May 31, 2013. (Incorporated by reference to the Company’s Amended Current Report on Form 8-K/A (File No. 001-35263), filed with the SEC on June 7,2013). |
| 2.4 | | Agreement and Plan of Merger, dated as of July 1, 2013, among VEREIT, Inc., American Realty Capital Trust IV, Inc., Thunder Acquisition, LLC, VEREIT Operating Partnership, L.P. and American Realty Capital Operating Partnership IV, L.P. (Incorporated by reference to the Company’s Current Report on Form 8-K (File No. 001-35263), filed with the SEC on July 2, 2013). |
| 2.4.1 | | Amendment dated as of October 6, 2013 to the Agreement and Plan of Merger, dated as of July 1, 2013, by and among VEREIT, Inc., VEREIT Operating Partnership, L.P., Thunder Acquisition, LLC, American Realty Capital Trust IV, Inc. and American Realty Capital Operating Partnership IV, L.P. (Incorporated by reference to the Company’s First Current Report on Form 8-K (File No. 001-35263), filed with the SEC on October 7, 2013). |
| 2.4.2 | | Second Amendment dated as of October 11, 2013 to the Agreement and Plan of Merger, dated as of July 1, 2013, by and among VEREIT, Inc., VEREIT Operating Partnership, L.P., Thunder Acquisition, LLC, American Realty Capital Trust IV, Inc. and American Realty Capital Operating Partnership IV, L.P. (Incorporated by reference as Annex E to the Company’s Final Prospectus filed Pursuant to Rule 424(b)(3) (Registration No. 333-190056), filed with the SEC on December 4, 2013). |
| 2.5 | | |
| 3.1 | | |
| 3.2 | | |
| 3.3 | | |
| 3.4 | | |
| 3.5 | | |
| 3.6 | | |
| 3.7 | | |
|
| | |
| Exhibit No. | | Description |
| 3.8 | | |
| 3.9 | | |
| 3.10 | | |
| 3.11 | | |
| 3.12 | | |
| 3.13 | | |
| 4.1 | | |
| 4.2 | | |
| 4.3 | | |
| 4.4 | | |
| 4.5 | | |
| 4.6 | | |
| 4.7 | | |
| 4.8 | | Indenture, dated as of February 6, 2014, among ARC Properties Operating Partnership, L.P., Clark Acquisition, LLC, the guarantors named therein and U.S. Bank National Association, as trustee (Incorporated by reference to the Company’s Current Report on Form 8-K (File No. 001-35263), filed with the SEC on February 7, 2014). |
| 4.9 | | |
| 4.10 | | |
| 4.11 | | |
| 4.12 | | |
| 4.13 | | |
| 4.14 | | |
| 4.15 | | |
| 4.16 | | |
| 4.17 | | |
|
| | |
| Exhibit No. | | Description |
| 10.1 | | |
| 10.2 | | |
| 10.3 | | |
| 10.4† | | |
| 10.5† | | |
| 10.6† | | |
| 10.7†* | | |
| 10.8†* | | |
| 10.9†* | | |
| 10.10†* | | |
| 10.11†* | | |
| 10.12†* | | |
| 10.13†* | | |
| 10.14† | | |
| 10.15† | | |
| 10.16† | | |
| 10.17† | | |
| 10.18† | | |
| 10.19† | | |
| 10.20† | | |
| 10.21† | | |
| 10.22† | | Amendment, effective February 21, 2018, to the Employment Agreement, dated as of October 5, 2015, by and between VEREIT, Inc. and Michael J. Bartolotta (Incorporated by reference to the Company’s Annual Report on Form 10-K (File No. 001-35263), for the year ended December 31, 2017 filed with the SEC on February 22, 2018). |
| 10.23† | | |
| 10.24† | | |
| 10.25† | | Amendment, effective February 21, 2018, to the Employment Agreement, dated as of May 21, 2015, by and between VEREIT, Inc. and Lauren Goldberg (Incorporated by reference to the Company’s Annual Report on Form 10-K (File No. 001-35263), for the year ended December 31, 2017 filed with the SEC on February 22, 2018). |
|
| | |
| Exhibit No. | | Description |
| 10.26† | | |
| 10.27† | | Amendment, effective February 21, 2018, to the Employment Agreement, dated as of February 23, 2016, by and between VEREIT, Inc. and Paul McDowell (Incorporated by reference to the Company’s Annual Report on Form 10-K (File No. 001-35263), for the year ended December 31, 2017 filed with the SEC on February 22, 2018). |
| 10.28† | | |
| 10.29† | | Amendment, effective February 21, 2018, to the Employment Agreement, dated as of February 23, 2016, by and between VEREIT, Inc. and Thomas Roberts (Incorporated by reference to the Company’s Annual Report on Form 10-K (File No. 001-35263), for the year ended December 31, 2017 filed with the SEC on February 22, 2018). |
| 10.30† | | |
| 21.1* | | |
| 23.1* | | |
| 23.2* | | |
| 31.1* | | |
| 31.2* | | |
| 31.3* | | |
| 31.4* | | |
| 32.1** | | |
| 32.2** | | |
| 32.3** | | |
| 32.4** | | |
| 101.INS* | | XBRL Instance Document. |
| 101.SCH* | | XBRL Taxonomy Extension Schema Document. |
| 101.CAL* | | XBRL Taxonomy Extension Calculation Linkbase Document. |
| 101.DEF* | | XBRL Taxonomy Extension Definition Linkbase Document. |
| 101.LAB* | | XBRL Taxonomy Extension Label Linkbase Document. |
| 101.PRE* | | XBRL Taxonomy Extension Presentation Linkbase Document. |
_____________________________
| |
| ** | In accordance with Item 601(b)(32) of Regulation S-K, this Exhibit is not deemed “filed” for purposes of Section 18 of the Exchange Act or otherwise subject to the liabilities of that section. Such certifications will not be deemed incorporated by reference into any filing under the Securities Act or the Exchange Act, except to the extent that the registrant specifically incorporates it by reference. |
† Management contract or compensatory plan or arrangement.
Item 16. Form 10-K Summary.
Not Applicable
SIGNATURES
Pursuant to the requirements of the Securities Exchange Act of 1934, as amended, each registrant has duly caused this Annual Report on Form 10-K to be signed on its behalf by the undersigned thereunto duly authorized.
|
| | |
| VEREIT, INC. |
| By: | /s/ Michael J. Bartolotta |
| Michael J. Bartolotta |
| Executive Vice President and Chief Financial Officer (Principal Financial Officer) |
|
| | |
| VEREIT OPERATING PARTNERSHIP, L.P. |
| By: VEREIT, Inc., its sole general partner |
| By: | /s/ Michael J. Bartolotta |
| Michael J. Bartolotta |
| Executive Vice President and Chief Financial Officer (Principal Financial Officer) |
Dated: February 20, 2019
Pursuant to the requirements of the Securities Exchange Act of 1934, as amended, this Form 10-K has been signed below by the following persons on behalf of each registrant and in the capacities and on the dates indicated.
|
| | | | |
| Name | | Capacity * | | Date |
| | | | |
| /s/ Glenn J. Rufrano | | Chief Executive Officer | | February 20, 2019 |
| Glenn J. Rufrano | | (Principal Executive Officer and Director) | | |
| | | | |
| /s/ Michael J. Bartolotta | | Executive Vice President and Chief Financial Officer | | February 20, 2019 |
| Michael J. Bartolotta | | (Principal Financial Officer) | | |
| | | | |
| /s/ Gavin B. Brandon | | Senior Vice President and Chief Accounting Officer | | February 20, 2019 |
| Gavin B. Brandon | | (Principal Accounting Officer) | | |
| | | | |
| /s/ Hugh R. Frater | | Director, Non-Executive Chairman | | February 20, 2019 |
| Hugh R. Frater | | | | |
| | | | |
| /s/ David B. Henry | | Director | | February 20, 2019 |
| David B. Henry | | | | |
| | | | |
| /s/ Mary Hogan Preusse | | Director | | February 20, 2019 |
| Mary Hogan Preusse | | | | |
| | | | |
| /s/ Richard J. Lieb | | Director | | February 20, 2019 |
| Richard J. Lieb | | | | |
| | | | |
| /s/ Mark S. Ordan | | Director | | February 20, 2019 |
| Mark S. Ordan | | | | |
| | | | |
| /s/ Eugene A. Pinover | | Director | | February 20, 2019 |
| Eugene A. Pinover | | | | |
| | | | |
| /s/ Julie G. Richardson | | Director | | February 20, 2019 |
| Julie G. Richardson | | | | |
|
| |
| * | Each person is signing in his or her capacity as an officer and/or director of VEREIT, Inc., which is the sole general partner of VEREIT Operating Partnership, L.P. |
INDEX TO CONSOLIDATED FINANCIAL STATEMENTS
|
| |
| Page |
| Financial Statements |
| |
| |
| |
| |
| |
| |
| |
| |
| |
| |
| |
| |
| F-61 |
| F-62 |
| F-195 |
REPORT OF INDEPENDENT REGISTERED PUBLIC ACCOUNTING FIRM
To the shareholders and the Board of Directors of VEREIT, Inc.
Opinion on the Financial Statements
We have audited the accompanying consolidated balance sheets of VEREIT, Inc. and subsidiaries (the “Company”) as of December 31, 2018 and 2017, the related consolidated statements of operations, comprehensive income (loss), changes in equity and cash flows for each of the three years in the period ended December 31, 2018, and the related notes and the schedules listed in the Index at Item 15 (collectively referred to as the “financial statements”). In our opinion, the financial statements present fairly, in all material respects, the financial position of the Company as of December 31, 2018 and 2017, and the results of its operations and its cash flows for each of the three years in the period ended December 31, 2018, in conformity with accounting principles generally accepted in the United States of America.
We have also audited, in accordance with the standards of the Public Company Accounting Oversight Board (United States) (PCAOB), the Company’s internal control over financial reporting as of December 31, 2018, based on criteria established in Internal Control - Integrated Framework (2013) issued by the Committee of Sponsoring Organizations of the Treadway Commission and our report dated February 20, 2019, expressed an unqualified opinion on the Company’s internal control over financial reporting.
Basis for Opinion
These financial statements are the responsibility of the Company’s management. Our responsibility is to express an opinion on the Company’s financial statements based on our audits. We are a public accounting firm registered with the PCAOB and are required to be independent with respect to the Company in accordance with the U.S. federal securities laws and the applicable rules and regulations of the Securities and Exchange Commission and the PCAOB.
We conducted our audits in accordance with the standards of the PCAOB. Those standards require that we plan and perform the audit to obtain reasonable assurance about whether the financial statements are free of material misstatement, whether due to error or fraud. Our audits included performing procedures to assess the risks of material misstatement of the financial statements, whether due to error or fraud, and performing procedures that respond to those risks. Such procedures included examining, on a test basis, evidence regarding the amounts and disclosures in the financial statements. Our audits also included evaluating the accounting principles used and significant estimates made by management, as well as evaluating the overall presentation of the financial statements. We believe that our audits provide a reasonable basis for our opinion.
/s/ DELOITTE & TOUCHE LLP
Phoenix, Arizona
February 20, 2019
We have served as the Company’s auditor since 2015.
REPORT OF INDEPENDENT REGISTERED PUBLIC ACCOUNTING FIRM
To the partners of VEREIT Operating Partnership, L.P.
Opinion on the Financial Statements
We have audited the accompanying consolidated balance sheets of VEREIT Operating Partnership, L.P and subsidiaries (the "Operating Partnership") as of December 31, 2018 and 2017, the related consolidated statements of operations, comprehensive income (loss), changes in equity, and cash flows, for each of the three years in the period ended December 31, 2018, and the related notes and the schedules listed in the Index at Item 15 (collectively referred to as the "financial statements"). In our opinion, the financial statements present fairly, in all material respects, the financial position of the Operating Partnership as of December 31, 2018 and 2017, and the results of its operations and its cash flows for each of the three years in the period ended December 31, 2018, in conformity with accounting principles generally accepted in the United States of America.
Basis for Opinion
These financial statements are the responsibility of the Operating Partnership's management. Our responsibility is to express an opinion on the Operating Partnership's financial statements based on our audits. We are a public accounting firm registered with the Public Company Accounting Oversight Board (United States) (PCAOB) and are required to be independent with respect to the Operating Partnership in accordance with the U.S. federal securities laws and the applicable rules and regulations of the Securities and Exchange Commission and the PCAOB.
We conducted our audits in accordance with the standards of the PCAOB. Those standards require that we plan and perform the audit to obtain reasonable assurance about whether the financial statements are free of material misstatement, whether due to error or fraud. The Operating Partnership is not required to have, nor were we engaged to perform, an audit of its internal control over financial reporting. As part of our audits, we are required to obtain an understanding of internal control over financial reporting but not for the purpose of expressing an opinion on the effectiveness of the Operating Partnership’s internal control over financial reporting. Accordingly, we express no such opinion.
Our audits included performing procedures to assess the risks of material misstatement of the financial statements, whether due to error or fraud, and performing procedures that respond to those risks. Such procedures included examining, on a test basis, evidence regarding the amounts and disclosures in the financial statements. Our audits also included evaluating the accounting principles used and significant estimates made by management, as well as evaluating the overall presentation of the financial statements. We believe that our audits provide a reasonable basis for our opinion.
/s/ DELOITTE & TOUCHE LLP
Phoenix, Arizona
February 20, 2019
We have served as the Operating Partnership’s auditor since 2015.
VEREIT, INC.
CONSOLIDATED BALANCE SHEETS
(In thousands, except for share and per share data)
|
| | | | | | | | |
| | | December 31, 2018 | | December 31, 2017 |
| ASSETS | | | | |
| Real estate investments, at cost: | | | | |
| Land | | $ | 2,843,212 |
| | $ | 2,865,855 |
|
| Buildings, fixtures and improvements | | 10,749,228 |
| | 10,711,845 |
|
| Intangible lease assets | | 2,012,399 |
| | 2,037,675 |
|
| Total real estate investments, at cost | | 15,604,839 |
| | 15,615,375 |
|
| Less: accumulated depreciation and amortization | | 3,436,772 |
| | 2,908,028 |
|
| Total real estate investments, net | | 12,168,067 |
| | 12,707,347 |
|
| Investment in unconsolidated entities | | 35,289 |
| | 39,520 |
|
| Cash and cash equivalents | | 30,758 |
| | 34,176 |
|
| Restricted cash | | 22,905 |
| | 27,662 |
|
| Rent and tenant receivables and other assets, net | | 366,092 |
| | 389,060 |
|
| Goodwill | | 1,337,773 |
| | 1,337,773 |
|
| Due from affiliates, net | | — |
| | 6,041 |
|
| Real estate assets held for sale and assets related to discontinued operations, net | | 2,609 |
| | 163,999 |
|
| Total assets | | $ | 13,963,493 |
|
| $ | 14,705,578 |
|
| | | | | |
| LIABILITIES AND EQUITY | | | | |
| Mortgage notes payable, net | | $ | 1,922,657 |
| | $ | 2,082,692 |
|
| Corporate bonds, net | | 3,368,609 |
| | 2,821,494 |
|
| Convertible debt, net | | 394,883 |
| | 984,258 |
|
| Credit facility, net | | 401,773 |
| | 185,000 |
|
| Below-market lease liabilities, net | | 173,479 |
| | 198,551 |
|
| Accounts payable and accrued expenses | | 145,611 |
| | 136,474 |
|
| Deferred rent and other liabilities | | 69,714 |
| | 62,985 |
|
| Distributions payable | | 186,623 |
| | 175,301 |
|
| Due to affiliates | | — |
| | 66 |
|
| Liabilities related to discontinued operations | | — |
| | 15,881 |
|
| Total liabilities | | 6,663,349 |
| | 6,662,702 |
|
| Commitments and contingencies (Note 10) | |
| |
|
|
| Preferred stock, $0.01 par value, 100,000,000 shares authorized and 42,834,138 issued and outstanding as of each of December 31, 2018 and December 31, 2017 | | 428 |
| | 428 |
|
| Common stock, $0.01 par value, 1,500,000,000 shares authorized and 967,515,165 and 974,208,583 issued and outstanding as of December 31, 2018 and December 31, 2017, respectively | | 9,675 |
| | 9,742 |
|
| Additional paid-in-capital | | 12,615,472 |
| | 12,654,258 |
|
| Accumulated other comprehensive loss | | (1,280 | ) | | (3,569 | ) |
| Accumulated deficit | | (5,467,236 | ) | | (4,776,581 | ) |
| Total stockholders’ equity | | 7,157,059 |
| | 7,884,278 |
|
| Non-controlling interests | | 143,085 |
| | 158,598 |
|
| Total equity | | 7,300,144 |
| | 8,042,876 |
|
| Total liabilities and equity | | $ | 13,963,493 |
|
| $ | 14,705,578 |
|
The accompanying notes are an integral part of these statements.
VEREIT, INC.
CONSOLIDATED STATEMENTS OF OPERATIONS
(In thousands, except for per share data)
|
| | | | | | | | | | | | |
| | | Year Ended December 31, |
| | | 2018 | | 2017 | | 2016 |
| Rental revenue | | $ | 1,257,867 |
| | $ | 1,252,285 |
| | $ | 1,335,447 |
|
| Operating expenses: | | | | | | |
| Acquisition-related | | 3,632 |
| | 3,402 |
| | 1,321 |
|
| Litigation, merger and other non-routine costs, net of insurance recoveries | | 290,963 |
| | 47,960 |
| | 3,884 |
|
| Property operating | | 126,461 |
| | 128,717 |
| | 144,428 |
|
| General and administrative | | 63,933 |
| | 58,603 |
| | 51,927 |
|
| Depreciation and amortization | | 640,618 |
| | 706,802 |
| | 762,038 |
|
| Impairments | | 54,647 |
| | 50,548 |
| | 182,820 |
|
| Total operating expenses | | 1,180,254 |
|
| 996,032 |
|
| 1,146,418 |
|
| Other (expense) income: | | | | | | |
| Interest expense | | (280,887 | ) | | (289,766 | ) | | (317,376 | ) |
| Gain (loss) on extinguishment and forgiveness of debt, net | | 5,360 |
| | 18,373 |
| | (771 | ) |
| Other income, net | | 14,735 |
| | 6,242 |
| | 5,251 |
|
| Equity in income and gain on disposition of unconsolidated entities | | 1,869 |
| | 2,763 |
| | 9,783 |
|
| Gain (loss) on derivative instruments, net | | 355 |
| | 2,976 |
| | (1,191 | ) |
| Gain on disposition of real estate and real estate assets held for sale, net | | 94,331 |
| | 61,536 |
| | 45,524 |
|
| Total other expenses, net | | (164,237 | ) |
| (197,876 | ) |
| (258,780 | ) |
| (Loss) income before taxes | | (86,624 | ) |
| 58,377 |
|
| (69,751 | ) |
| Provision for income taxes | | (5,101 | ) | | (6,882 | ) | | (7,136 | ) |
| (Loss) income from continuing operations | | (91,725 | ) |
| 51,495 |
|
| (76,887 | ) |
| Income (loss) from discontinued operations, net of income taxes | | 3,695 |
| | (19,117 | ) | | (123,937 | ) |
| Net (loss) income | | (88,030 | ) | | 32,378 |
| | (200,824 | ) |
Net loss (income) attributable to non-controlling interests (1) | | 2,256 |
| | (560 | ) | | 4,961 |
|
| Net (loss) income attributable to the General Partner | | $ | (85,774 | ) |
| $ | 31,818 |
|
| $ | (195,863 | ) |
| | | | | | | |
| Basic and diluted net loss per share from continuing operations attributable to common stockholders | | $ | (0.17 | ) | | $ | (0.02 | ) | | $ | (0.16 | ) |
| Basic and diluted net income (loss) per share from discontinued operations attributable to common stockholders | | $ | 0.00 |
| | $ | (0.02 | ) | | $ | (0.13 | ) |
Basic and diluted net loss per share attributable to common stockholders (2) | | $ | (0.16 | ) | | $ | (0.04 | ) | | $ | (0.29 | ) |
| |
| (1) | Represents net loss (income) attributable to limited partners and consolidated joint venture partners. |
| |
| (2) | Amounts may not total due to rounding. |
The accompanying notes are an integral part of these statements.
VEREIT, INC.
CONSOLIDATED STATEMENTS OF COMPREHENSIVE INCOME (LOSS)
(In thousands)
|
| | | | | | | | | | | | |
| | | Year Ended December 31, |
| | | 2018 | | 2017 | | 2016 |
| Net (loss) income | | $ | (88,030 | ) | | $ | 32,378 |
| | $ | (200,824 | ) |
| Other comprehensive income (loss): | | | | | | |
| Unrealized gain (loss) on interest rate derivatives | | — |
| | (18 | ) | | (7,685 | ) |
| Reclassification of previous unrealized loss (gain) on interest rate derivatives into net (loss) income | | 313 |
| | (70 | ) | | 9,397 |
|
| Unrealized loss on investment securities, net | | (205 | ) | | (951 | ) | | (2,271 | ) |
| Reclassification of previous unrealized loss (gain) on investment securities into net (loss) income as other income, net | | 2,237 |
| | — |
| | — |
|
| Total other comprehensive income (loss) | | 2,345 |
|
| (1,039 | ) | | (559 | ) |
| | | | | | | |
| Total comprehensive (loss) income | | (85,685 | ) | | 31,339 |
| | (201,383 | ) |
Comprehensive loss (income) attributable to non-controlling interests (1) | | 2,200 |
| | (534 | ) | | 4,989 |
|
| Total comprehensive (loss) income attributable to the General Partner | | $ | (83,485 | ) | | $ | 30,805 |
| | $ | (196,394 | ) |
| |
| (1) | Represents comprehensive loss (income)attributable to limited partners and consolidated joint venture partners. |
The accompanying notes are an integral part of these statements.
VEREIT, INC.
CONSOLIDATED STATEMENTS OF CHANGES IN EQUITY
(In thousands, except for share data)
|
| | | | | | | | | | | | | | | | | | | | | | | | | | | | | | | | | | | | | | |
| | | Preferred Stock | | Common Stock | | | | | | | | | | | | |
| | | Number
of Shares | | Par
Value | | Number
of Shares | | Par
Value | | Additional Paid-In Capital | | Accumulated Other Comprehensive Loss | | Accumulated
Deficit | | Total Stock-holders’ Equity | | Non-Controlling Interests | | Total Equity |
| Balance, January 1, 2016 | | 42,834,138 |
| | $ | 428 |
| | 904,884,394 |
| | $ | 9,049 |
| | $ | 11,931,768 |
| | $ | (2,025 | ) | | $ | (3,415,233 | ) | | $ | 8,523,987 |
| | $ | 189,972 |
| | $ | 8,713,959 |
|
| Issuance of Common Stock, net | | — |
| | — |
| | 69,000,000 |
| | 690 |
| | 701,786 |
| | — |
| | — |
| | 702,476 |
| | — |
| | 702,476 |
|
| Conversion of OP Units to Common Stock | | — |
| | — |
| | 15,450 |
| | — |
| | 159 |
| | — |
| | — |
| | 159 |
| | (159 | ) | | — |
|
| Repurchases of Common Stock to settle tax obligation | | — |
| | — |
| | (481,261 | ) | | (5 | ) | | (4,647 | ) | | — |
| | — |
| | (4,652 | ) | | — |
| | (4,652 | ) |
| Equity-based compensation, net | | — |
| | — |
| | 728,067 |
| | 7 |
| | 10,721 |
| | — |
| | — |
| | 10,728 |
| | — |
| | 10,728 |
|
| Contributions from non-controlling interest holders | | — |
| | — |
| | — |
| | — |
| | — |
| | — |
| | — |
| | — |
| | 675 |
| | 675 |
|
Distributions declared on Common Stock —
$0.55 per common share | | — |
| | — |
| | — |
| | — |
| | — |
| | — |
| | (515,935 | ) | | (515,935 | ) | | — |
| | (515,935 | ) |
| Distributions to non-controlling interest holders | | — |
| | — |
| | — |
| | — |
| | — |
| | — |
| | — |
| | — |
| | (13,183 | ) | | (13,183 | ) |
| Dividend equivalents on awards granted under the Equity Plan | | — |
| | — |
| | — |
| | — |
| | — |
| | — |
| | (1,260 | ) | | (1,260 | ) | | — |
| | (1,260 | ) |
| Distributions to preferred shareholders and unitholders | | — |
| | — |
| | — |
| | — |
| | — |
| | — |
| | (71,748 | ) | | (71,748 | ) | | (144 | ) | | (71,892 | ) |
| Cumulative effect adjustment for equity-based compensation forfeitures | | — |
| | — |
| | — |
| | — |
| | 384 |
| | — |
| | (384 | ) | | — |
| | — |
| | — |
|
| Net loss | | — |
| | — |
| | — |
| | — |
| | — |
| | — |
| | (195,863 | ) | | (195,863 | ) | | (4,961 | ) | | (200,824 | ) |
| Other comprehensive loss | | — |
| | — |
| | — |
| | — |
| | — |
| | (531 | ) | | — |
| | (531 | ) | | (28 | ) | | (559 | ) |
| Balance, December 31, 2016 | | 42,834,138 |
| | $ | 428 |
| | 974,146,650 |
| | $ | 9,741 |
| | $ | 12,640,171 |
| | $ | (2,556 | ) | | $ | (4,200,423 | ) | | $ | 8,447,361 |
| | $ | 172,172 |
| | $ | 8,619,533 |
|
| Repurchases of Common Stock under 2017 Share Repurchase Program | | — |
| | — |
| | (68,759 | ) | | (1 | ) | | (517 | ) | | — |
| | — |
| | (518 | ) | | — |
| | (518 | ) |
| Repurchases of Common Stock to settle tax obligation | | — |
| | — |
| | (268,550 | ) | | (2 | ) | | (2,146 | ) | | — |
| | — |
| | (2,148 | ) | | — |
| | (2,148 | ) |
| Equity-based compensation, net | | — |
| | — |
| | 399,242 |
| | 4 |
| | 16,750 |
| | — |
| | — |
| | 16,754 |
| | — |
| | 16,754 |
|
| Contributions from non-controlling interest holders | | — |
| | — |
| | — |
| | — |
| | — |
| | — |
| | — |
| | — |
| | 101 |
| | 101 |
|
Distributions declared on Common Stock —
$0.55 per common share | | — |
| | — |
| | — |
| | — |
| | — |
| | — |
| | (535,657 | ) | | (535,657 | ) | | — |
| | (535,657 | ) |
| Distributions to non-controlling interest holders | | — |
| | — |
| | — |
| | — |
| | — |
| | — |
| | — |
| | — |
| | (13,227 | ) | | (13,227 | ) |
| Dividend equivalents on awards granted under the Equity Plan | | — |
| | — |
| | — |
| | — |
| | — |
| | — |
| | (571 | ) | | (571 | ) | | — |
| | (571 | ) |
| Distributions to preferred shareholders and unitholders | | — |
| | — |
| | — |
| | — |
| | — |
| | — |
| | (71,748 | ) | | (71,748 | ) | | (144 | ) | | (71,892 | ) |
| Disposition of joint venture | | — |
| | — |
| | — |
| | — |
| | — |
| | — |
| | — |
| | — |
| | (838 | ) | | (838 | ) |
| Net income | | — |
| | — |
| | — |
| | — |
| | — |
| | — |
| | 31,818 |
| | 31,818 |
| | 560 |
| | 32,378 |
|
| Other comprehensive income | | — |
| | — |
| | — |
| | — |
| | — |
| | (1,013 | ) | | — |
| | (1,013 | ) | | (26 | ) | | (1,039 | ) |
| Balance, December 31, 2017 | | 42,834,138 |
| | $ | 428 |
| | 974,208,583 |
| | $ | 9,742 |
| | $ | 12,654,258 |
| | $ | (3,569 | ) | | $ | (4,776,581 | ) | | $ | 7,884,278 |
| | $ | 158,598 |
| | $ | 8,042,876 |
|
| Conversion of OP Units to Common Stock | | — |
| | — |
| | 32,439 |
| | — |
| | 241 |
| | — |
| | — |
| | 241 |
| | (241 | ) | | — |
|
VEREIT, INC. AND
CONSOLIDATED STATEMENTS OF CHANGES IN EQUITY – (Continued)
(In thousands, except for share data)
|
| | | | | | | | | | | | | | | | | | | | | | | | | | | | | | | | | | | | | | |
| | | Preferred Stock | | Common Stock | | | | | | | | | | | | |
| | | Number
of Shares | | Par
Value | | Number
of Shares | | Par
Value | | Additional Paid-In Capital | | Accumulated Other Comprehensive Loss | | Accumulated
Deficit | | Total Stock-holders’ Equity | | Non-Controlling Interests | | Total Equity |
| Repurchases of Common Stock under Share Repurchase Programs | | — |
| | $ | — |
| | (7,206,876 | ) | | $ | (72 | ) | | $ | (50,082 | ) | | $ | — |
| | $ | — |
| | $ | (50,154 | ) | | $ | — |
| | (50,154 | ) |
| Repurchases of Common Stock to settle tax obligation | | — |
| | — |
| | (324,502 | ) | | (2 | ) | | (2,324 | ) | | — |
| | — |
| | (2,326 | ) | | — |
| | (2,326 | ) |
| Equity-based compensation, net | | — |
| | — |
| | 805,521 |
| | 7 |
| | 13,307 |
| | — |
| | — |
| | 13,314 |
| | — |
| | 13,314 |
|
| Contributions from non-controlling interest holders | | — |
| | — |
| | — |
| | — |
| | — |
| | — |
| | — |
| | — |
| | 120 |
| | 120 |
|
Distributions declared on Common Stock —
$0.55 per common share | | — |
| | — |
| | — |
| | — |
| | — |
| | — |
| | (532,144 | ) | | (532,144 | ) | | — |
| | (532,144 | ) |
| Distributions to non-controlling interest holders | | — |
| | — |
| | — |
| | — |
| | — |
| | — |
| | — |
| | — |
| | (13,048 | ) | | (13,048 | ) |
| Dividend equivalents on awards granted under the Equity Plan | | — |
| | — |
| | — |
| | — |
| | 72 |
| | — |
| | (989 | ) | | (917 | ) | | — |
| | (917 | ) |
| Distributions to preferred shareholders and unitholders | | — |
| | — |
| | — |
| | — |
| | — |
| | — |
| | (71,748 | ) | | (71,748 | ) | | (144 | ) | | (71,892 | ) |
| Net loss | | — |
| | — |
| | — |
| | — |
| | — |
| | — |
| | (85,774 | ) | | (85,774 | ) | | (2,256 | ) | | (88,030 | ) |
| Other comprehensive loss | | — |
| | — |
| | — |
| | — |
| | — |
| | 2,289 |
| | — |
| | 2,289 |
| | 56 |
| | 2,345 |
|
| Balance, December 31, 2018 | | 42,834,138 |
|
| $ | 428 |
|
| 967,515,165 |
|
| $ | 9,675 |
|
| $ | 12,615,472 |
|
| $ | (1,280 | ) |
| $ | (5,467,236 | ) |
| $ | 7,157,059 |
|
| $ | 143,085 |
|
| $ | 7,300,144 |
|
The accompanying notes are an integral part of these statements.
VEREIT, INC.
CONSOLIDATED STATEMENTS OF CASH FLOWS
(In thousands)
|
| | | | | | | | | | | | |
| | | Year Ended December 31, |
| | | 2018 | | 2017 | | 2016 |
| Cash flows from operating activities: | | | | |
| | |
| Net (loss) income | | $ | (88,030 | ) | | $ | 32,378 |
| | $ | (200,824 | ) |
| Adjustments to reconcile net (loss) income to net cash provided by operating activities: | | | | | | |
| Depreciation and amortization | | 659,948 |
| | 745,499 |
| | 806,548 |
|
| Gain on real estate assets, net | | (96,068 | ) | | (61,536 | ) | | (55,722 | ) |
| Impairments from held for sale | | — |
| | 20,027 |
| | — |
|
| Impairments | | 54,647 |
| | 50,548 |
| | 303,751 |
|
| Equity-based compensation | | 13,314 |
| | 16,751 |
| | 10,728 |
|
| Equity in income of unconsolidated entities and gain on joint venture | | (1,869 | ) | | (2,726 | ) | | 415 |
|
| Distributions from unconsolidated entities | | 1,366 |
| | 3,646 |
| | 1,433 |
|
| Gain on investments | | (4,092 | ) | | (65 | ) | | — |
|
| (Gain) loss on derivative instruments, net | | (355 | ) | | (2,976 | ) | | 1,191 |
|
| (Gain) loss on extinguishment and forgiveness of debt, net | | (5,360 | ) | | (18,373 | ) | | 771 |
|
| Changes in assets and liabilities: | | | | | | |
| Investment in direct financing leases | | 2,078 |
| | 2,097 |
| | 3,976 |
|
| Rent and tenant receivables and other assets, net | | (34,096 | ) | | (21,394 | ) | | (52,626 | ) |
| Due from affiliates | | — |
| | 1,163 |
| | (416 | ) |
| Assets held for sale classified as discontinued operations | | (2,492 | ) | | 13,812 |
| | — |
|
| Accounts payable and accrued expenses | | 1,688 |
| | 10,742 |
| | (3,323 | ) |
| Deferred rent and other liabilities | | 7,162 |
| | (395 | ) | | (17,740 | ) |
| Due to affiliates | | (66 | ) | | 50 |
| | (214 | ) |
| Liabilities related to discontinued operations | | (13,861 | ) | | 4,019 |
| | — |
|
| Net cash provided by operating activities | | 493,914 |
| | 793,267 |
|
| 797,948 |
|
| Cash flows from investing activities: | | | | | | |
| Investments in real estate assets | | (500,625 | ) | | (699,004 | ) | | (100,194 | ) |
| Capital expenditures and leasing costs | | (22,291 | ) | | (21,694 | ) | | (16,568 | ) |
| Real estate developments | | (9,221 | ) | | (14,850 | ) | | (17,411 | ) |
| Principal repayments received on investment securities and mortgage notes receivable | | 5,761 |
| | 6,796 |
| | 5,417 |
|
| Investments in unconsolidated entities | | (771 | ) | | — |
| | (25,777 | ) |
| Return of investment from unconsolidated entities | | 48 |
| | 1,972 |
| | 2,580 |
|
| Proceeds from disposition of real estate and joint venture | | 502,289 |
| | 445,525 |
| | 1,000,700 |
|
| Proceeds from disposition of discontinued operations | | 122,915 |
| | — |
| | — |
|
| Investment in leasehold improvements and other assets | | (841 | ) | | (1,191 | ) | | (2,259 | ) |
| Deposits for real estate assets | | (13,412 | ) | | (37,226 | ) | | (17,856 | ) |
| Proceeds from sale of investments and other assets | | 46,966 |
| | 400 |
| | — |
|
| Uses and refunds of deposits for real estate assets | | 17,267 |
| | 36,111 |
| | 13,305 |
|
| Proceeds from the settlement of property-related insurance claims | | 1,434 |
| | 355 |
| | — |
|
| Line of credit advances to Cole REITs | | (2,200 | ) | | (16,400 | ) | | (10,300 | ) |
| Line of credit repayments from Cole REITs | | 3,800 |
| | 25,100 |
| | 50,000 |
|
| Net cash provided by (used in) investing activities | | 151,119 |
| | (274,106 | ) |
| 881,637 |
|
| Cash flows from financing activities: | | | | | | |
| Proceeds from mortgage notes payable | | 187 |
| | 4,652 |
| | 3,112 |
|
| Payments on mortgage notes payable and other debt, including debt extinguishment costs | | (137,887 | ) | | (424,385 | ) | | (337,022 | ) |
| Proceeds from credit facility | | 1,934,000 |
| | 329,000 |
| | 1,033,000 |
|
| Payments on credit facility | | (1,716,000 | ) | | (645,107 | ) | | (1,993,000 | ) |
| Proceeds from corporate bonds | | 546,304 |
| | 600,000 |
| | 1,000,000 |
|
| Payments on corporate bonds, including extinguishment costs | | — |
| | — |
| | (1,311,203 | ) |
| Repayment of convertible notes | | (597,500 | ) | | — |
| | — |
|
| Payments of deferred financing costs | | (25,471 | ) | | (9,575 | ) | | (19,872 | ) |
| Repurchases of Common Stock under the Share Repurchase Programs | | (50,154 | ) | | (518 | ) | | — |
|
| Proceeds from 2016 term loan | | — |
| | — |
| | 300,000 |
|
VEREIT, INC.
CONSOLIDATED STATEMENTS OF CASH FLOWS – (Continued)
(In thousands)
|
| | | | | | | | | | | | |
| | | Year Ended December 31, |
| | | 2018 | | 2017 | | 2016 |
| Repayment of 2016 term loan | | $ | — |
| | $ | — |
| | $ | (300,000 | ) |
| Repurchases of Common Stock to settle tax obligations | | (2,326 | ) | | (2,148 | ) | | (4,652 | ) |
| Proceeds from the issuance of Common Stock, net of underwriters’ discount | | — |
| | — |
| | 702,765 |
|
| Payments of equity issuance costs | | — |
| | — |
| | (280 | ) |
| Contributions from non-controlling interest holders | | 120 |
| | 101 |
| | 675 |
|
| Distributions paid | | (606,679 | ) | | (608,615 | ) | | (580,508 | ) |
| Net cash used in financing activities | | (655,406 | ) | | (756,595 | ) |
| (1,506,985 | ) |
| Net change in cash and cash equivalents and restricted cash | | (10,373 | ) | | (237,434 | ) | | 172,600 |
|
| | | | | | | |
| Cash and cash equivalents and restricted cash, beginning of period | | $ | 64,036 |
| | $ | 301,470 |
| | $ | 128,870 |
|
| Less: cash and cash equivalents of discontinued operations | | (2,198 | ) | | (2,973 | ) | | (4,968 | ) |
| Cash and cash equivalents and restricted cash from continuing operations, beginning of period | | 61,838 |
| | 298,497 |
| | 123,902 |
|
| | | | | | | |
| Cash and cash equivalents, and restricted cash, end of period | | 53,663 |
| | 64,036 |
| | 301,470 |
|
| Less: cash and cash equivalents of discontinued operations | | — |
| | (2,198 | ) | | (2,973 | ) |
| Cash and cash equivalents and restricted cash from continuing operations, end of period | | $ | 53,663 |
| | $ | 61,838 |
|
| $ | 298,497 |
|
| Reconciliation of Cash and Cash Equivalents and Restricted Cash | | | | | | |
| Cash and cash equivalents at beginning of period | | $ | 34,176 |
| | $ | 253,479 |
| | $ | 64,135 |
|
| Restricted cash at beginning of period | | 27,662 |
| | 45,018 |
| | 59,767 |
|
| Cash and cash equivalents and restricted cash at beginning of period | | 61,838 |
| | 298,497 |
| | 123,902 |
|
| | | | | | | |
| Cash and cash equivalents at end of period | | 30,758 |
| | 34,176 |
| | 253,479 |
|
| Restricted cash at end of period | | 22,905 |
| | 27,662 |
| | 45,018 |
|
| Cash and cash equivalents and restricted cash at end of period | | $ | 53,663 |
| | $ | 61,838 |
| | $ | 298,497 |
|
The accompanying notes are an integral part of these statements.
VEREIT OPERATING PARTNERSHIP, L.P.
CONSOLIDATED BALANCE SHEETS
(In thousands, except for unit data)
|
| | | | | | | | |
| | | December 31, 2018 | | December 31, 2017 |
| ASSETS | | | | |
| Real estate investments, at cost: | | | | |
| Land | | $ | 2,843,212 |
| | $ | 2,865,855 |
|
| Buildings, fixtures and improvements | | 10,749,228 |
| | 10,711,845 |
|
| Intangible lease assets | | 2,012,399 |
| | 2,037,675 |
|
| Total real estate investments, at cost | | 15,604,839 |
|
| 15,615,375 |
|
| Less: accumulated depreciation and amortization | | 3,436,772 |
| | 2,908,028 |
|
| Total real estate investments, net | | 12,168,067 |
|
| 12,707,347 |
|
| Investment in unconsolidated entities | | 35,289 |
| | 39,520 |
|
| Cash and cash equivalents | | 30,758 |
| | 34,176 |
|
| Restricted cash | | 22,905 |
| | 27,662 |
|
| Rent and tenant receivables and other assets, net | | 366,092 |
| | 389,060 |
|
| Goodwill | | 1,337,773 |
| | 1,337,773 |
|
| Due from affiliates, net | | — |
| | 6,041 |
|
| Real estate assets held for sale and assets related to discontinued operations, net | | 2,609 |
| | 163,999 |
|
| Total assets | | $ | 13,963,493 |
|
| $ | 14,705,578 |
|
| | | | | |
| LIABILITIES AND EQUITY | | | | |
|
| Mortgage notes payable, net | | $ | 1,922,657 |
| | $ | 2,082,692 |
|
| Corporate bonds, net | | 3,368,609 |
| | 2,821,494 |
|
| Convertible debt, net | | 394,883 |
| | 984,258 |
|
| Credit facility, net | | 401,773 |
| | 185,000 |
|
| Below-market lease liabilities, net | | 173,479 |
| | 198,551 |
|
| Accounts payable and accrued expenses | | 145,611 |
| | 136,474 |
|
| Deferred rent and other liabilities | | 69,714 |
| | 62,985 |
|
| Distributions payable | | 186,623 |
| | 175,301 |
|
| Due to affiliates | | — |
| | 66 |
|
| Liabilities related to discontinued operations | | — |
| | 15,881 |
|
| Total liabilities | | 6,663,349 |
|
| 6,662,702 |
|
| Commitments and contingencies (Note 10) | |
|
| |
|
|
| General Partner's preferred equity, 42,834,138 General Partner Series F Preferred Units issued and outstanding as of each of December 31, 2018 and December 31, 2017 | | 710,325 |
| | 782,073 |
|
| General Partner's common equity, 967,515,165 and 974,208,583 General Partner OP Units issued and outstanding as of December 31, 2018 and December 31, 2017, respectively | | 6,446,734 |
| | 7,102,205 |
|
| Limited Partner's preferred equity, 86,874 Limited Partner Series F Preferred Units issued and outstanding as of each of December 31, 2018 and December 31, 2017 | | 2,883 |
| | 3,027 |
|
| Limited Partner's common equity, 23,715,908 and 23,748,347 Limited Partner OP Units issued and outstanding as of December 31, 2018 and December 31, 2017, respectively | | 138,931 |
| | 154,266 |
|
| Total partners’ equity | | 7,298,873 |
|
| 8,041,571 |
|
| Non-controlling interests | | 1,271 |
| | 1,305 |
|
| Total equity | | 7,300,144 |
|
| 8,042,876 |
|
| Total liabilities and equity | | $ | 13,963,493 |
|
| $ | 14,705,578 |
|
The accompanying notes are an integral part of these statements.
VEREIT OPERATING PARTNERSHIP, L.P.
CONSOLIDATED STATEMENTS OF OPERATIONS
(In thousands, except for per unit data)
|
| | | | | | | | | | | | |
| | | Year Ended December 31, |
| | | 2018 | | 2017 | | 2016 |
| Rental revenue | | $ | 1,257,867 |
| | $ | 1,252,285 |
| | $ | 1,335,447 |
|
| Operating expenses: | | | | | | |
| Acquisition-related | | 3,632 |
| | 3,402 |
| | 1,321 |
|
| Litigation, merger and other non-routine costs, net of insurance recoveries | | 290,963 |
| | 47,960 |
| | 3,884 |
|
| Property operating | | 126,461 |
| | 128,717 |
| | 144,428 |
|
| General and administrative | | 63,933 |
| | 58,603 |
| | 51,927 |
|
| Depreciation and amortization | | 640,618 |
| | 706,802 |
| | 762,038 |
|
| Impairments | | 54,647 |
| | 50,548 |
| | 182,820 |
|
| Total operating expenses | | 1,180,254 |
|
| 996,032 |
| | 1,146,418 |
|
| Other (expense) income: | | | | | | |
| Interest expense | | (280,887 | ) | | (289,766 | ) | | (317,376 | ) |
| Gain (loss) on extinguishment and forgiveness of debt, net | | 5,360 |
| | 18,373 |
| | (771 | ) |
| Other income, net | | 14,735 |
| | 6,242 |
| | 5,251 |
|
| Equity in income and gain on disposition of unconsolidated entities | | 1,869 |
| | 2,763 |
| | 9,783 |
|
| Gain (loss) on derivative instruments, net | | 355 |
| | 2,976 |
| | (1,191 | ) |
| Gain on disposition of real estate and real estate assets held for sale, net | | 94,331 |
| | 61,536 |
| | 45,524 |
|
| Total other expenses, net | | (164,237 | ) |
| (197,876 | ) | | (258,780 | ) |
| (Loss) income before taxes | | (86,624 | ) |
| 58,377 |
| | (69,751 | ) |
| Provision for income taxes | | (5,101 | ) | | (6,882 | ) | | (7,136 | ) |
| (Loss) income from continuing operations | | (91,725 | ) | | 51,495 |
| | (76,887 | ) |
| Income (loss) from discontinued operations, net of income taxes | | 3,695 |
| | (19,117 | ) | | (123,937 | ) |
| Net (loss) income | | (88,030 | ) |
| 32,378 |
| | (200,824 | ) |
Net loss attributable to non-controlling interests (1) | | 154 |
| | 194 |
| | 14 |
|
| Net (loss) income attributable to the OP | | $ | (87,876 | ) |
| $ | 32,572 |
| | $ | (200,810 | ) |
| | | | | | | |
| Basic and diluted net loss per unit from continuing operations attributable to common unitholders | | $ | (0.17 | ) | | $ | (0.02 | ) | | $ | (0.16 | ) |
| Basic and diluted net income (loss) per unit from discontinued operations attributable to common unitholders | | $ | 0.00 |
| | $ | (0.02 | ) | | $ | (0.13 | ) |
Basic and diluted net loss per unit attributable to common unitholders (2) | | $ | (0.16 | ) | | $ | (0.04 | ) | | $ | (0.29 | ) |
| |
| (1) | Represents net loss attributable to consolidated joint venture partners. |
| |
| (2) | Amounts may not total due to rounding. |
The accompanying notes are an integral part of these statements.
VEREIT OPERATING PARTNERSHIP, L.P.
CONSOLIDATED STATEMENTS OF COMPREHENSIVE INCOME (LOSS)
(In thousands)
|
| | | | | | | | | | | | |
| | | Year Ended December 31, |
| | | 2018 | | 2017 | | 2016 |
| Net (loss) income | | $ | (88,030 | ) | | $ | 32,378 |
| | $ | (200,824 | ) |
| Other comprehensive income (loss): | | | | | | |
| Unrealized gain (loss) on interest rate derivatives | | — |
| | (18 | ) | | (7,685 | ) |
| Reclassification of previous unrealized loss (gain) on interest rate derivatives into net (loss) income | | 313 |
| | (70 | ) | | 9,397 |
|
| Unrealized loss on investment securities, net | | (205 | ) | | (951 | ) | | (2,271 | ) |
| Reclassification of previous unrealized loss (gain) on investment securities into net (loss) income as other income, net | | 2,237 |
| | — |
| | — |
|
| Total other comprehensive income (loss) | | 2,345 |
|
| (1,039 | ) | | (559 | ) |
| | | | | | | |
| Total comprehensive (loss) income | | (85,685 | ) |
| 31,339 |
| | (201,383 | ) |
Comprehensive loss attributable to non-controlling interests (1) | | 154 |
| | 194 |
| | 14 |
|
| Total comprehensive (loss) income attributable to the OP | | $ | (85,531 | ) |
| $ | 31,533 |
| | $ | (201,369 | ) |
| |
| (1) | Represents comprehensive loss attributable to consolidated joint venture partners. |
The accompanying notes are an integral part of these statements.
VEREIT OPERATING PARTNERSHIP, L.P.
CONSOLIDATED STATEMENTS OF CHANGES IN EQUITY
(In thousands, except for unit data)
|
| | | | | | | | | | | | | | | | | | | | | | | | | | | | | | | | | | | | | | | | |
| | | Preferred Units | | Common Units | | | | | | |
| | | General Partner | | Limited Partner | | General Partner | | Limited Partner | | | | | | |
| | | Number of Units | | Capital | | Number of Units | | Capital | | Number of Units | | Capital | | Number of Units | | Capital | | Total Partners' Capital | | Non-Controlling Interests | | Total Capital |
| Balance, January 1, 2016 | | 42,834,138 |
| | $ | 925,569 |
| | 86,874 |
| | $ | 3,315 |
| | 904,884,394 |
| | $ | 7,598,418 |
| | 23,763,797 |
| | $ | 184,800 |
|
| $ | 8,712,102 |
| | $ | 1,857 |
|
| $ | 8,713,959 |
|
| Issuance of common OP Units | | — |
| | — |
| | — |
| | — |
| | 69,000,000 |
| | 702,476 |
| | — |
| | — |
| | 702,476 |
| | — |
| | 702,476 |
|
| Conversion of limited partners' common OP Units to General Partner's common OP Units | | — |
| | — |
| | — |
| | — |
| | 15,450 |
| | 159 |
| | (15,450 | ) | | (159 | ) | | — |
| | — |
| | — |
|
| Repurchases of common OP Units to settle tax obligation | | — |
| | — |
| | — |
| | — |
| | (481,261 | ) | | (4,652 | ) | | — |
| | — |
| | (4,652 | ) | | — |
| | (4,652 | ) |
| Equity-based compensation, net | | — |
| | — |
| | — |
| | — |
| | 728,067 |
| | 10,728 |
| | — |
| | — |
| | 10,728 |
| | — |
| | 10,728 |
|
| Contributions from non-controlling interest holders | | — |
| | — |
| | — |
| | — |
| | — |
| | — |
| | — |
| | — |
| | — |
| | 675 |
| | 675 |
|
| Distributions to common OP Units and non-controlling interests —$0.55 per common unit | | — |
| | — |
| | — |
| | — |
| | — |
| | (515,935 | ) | | — |
| | (13,068 | ) | | (529,003 | ) | | (115 | ) | | (529,118 | ) |
| Dividend equivalents on awards granted under the Equity Plan | | — |
| | — |
| | — |
| | — |
| | — |
| | (1,260 | ) | | — |
| | — |
| | (1,260 | ) | | — |
| | (1,260 | ) |
| Distributions to preferred OP Units | | — |
| | (71,748 | ) | | — |
| | (144 | ) | | — |
| | — |
| | — |
| | — |
| | (71,892 | ) | | — |
| | (71,892 | ) |
| Net loss | | — |
| | — |
| | — |
| | — |
| | — |
| | (195,863 | ) | | — |
| | (4,947 | ) | | (200,810 | ) | | (14 | ) | | (200,824 | ) |
| Other comprehensive loss | | — |
| | — |
| | — |
| | — |
| | — |
| | (531 | ) | | — |
| | (28 | ) | | (559 | ) | | — |
| | (559 | ) |
| Balance, December 31, 2016 | | 42,834,138 |
|
| $ | 853,821 |
|
| 86,874 |
|
| $ | 3,171 |
|
| 974,146,650 |
|
| $ | 7,593,540 |
|
| 23,748,347 |
|
| $ | 166,598 |
|
| $ | 8,617,130 |
|
| $ | 2,403 |
|
| $ | 8,619,533 |
|
| Repurchases of common OP Units under the 2017 Share Repurchase Program | | — |
| | — |
| | — |
| | — |
| | (68,759 | ) | | (518 | ) | | — |
| | — |
| | (518 | ) | | — |
| | (518 | ) |
| Repurchases of common OP Units to settle tax obligation | | — |
| | — |
| | — |
| | — |
| | (268,550 | ) | | (2,148 | ) | | — |
| | — |
| | (2,148 | ) | | — |
| | (2,148 | ) |
| Equity-based compensation, net | | — |
| | — |
| | — |
| | — |
| | 399,242 |
| | 16,754 |
| | — |
| | — |
| | 16,754 |
| | — |
| | 16,754 |
|
| Contributions from non-controlling interest holders | | — |
| | — |
| | — |
| | — |
| | — |
| | — |
| | — |
| | — |
| | — |
| | 101 |
| | 101 |
|
| Distributions to common OP Units and non-controlling interests —$0.55 per common unit | | — |
| | — |
| | — |
| | — |
| | — |
| | (535,657 | ) | | — |
| | (13,060 | ) | | (548,717 | ) | | (167 | ) | | (548,884 | ) |
| Dividend equivalents on awards granted under the Equity Plan | | — |
| | — |
| | — |
| | — |
| | — |
| | (571 | ) | | — |
| | — |
| | (571 | ) | | — |
| | (571 | ) |
| Distributions to preferred OP Units | | — |
| | (71,748 | ) | | — |
| | (144 | ) | | — |
| | — |
| | — |
| | — |
| | (71,892 | ) | | — |
| | (71,892 | ) |
| Disposition of consolidated joint venture interest | | — |
| | — |
| | — |
| | — |
| | — |
| | — |
| | — |
| | — |
| | — |
| | (838 | ) | | (838 | ) |
| Net income (loss) | | — |
| | — |
| | — |
| | — |
| | — |
| | 31,818 |
| | — |
| | 754 |
| | 32,572 |
| | (194 | ) | | 32,378 |
|
| Other comprehensive loss | | — |
| | — |
| | — |
| | — |
| | — |
| | (1,013 | ) | | — |
| | (26 | ) | | (1,039 | ) | | — |
| | (1,039 | ) |
| Balance, December 31, 2017 | | 42,834,138 |
|
| $ | 782,073 |
|
| 86,874 |
|
| $ | 3,027 |
|
| 974,208,583 |
|
| $ | 7,102,205 |
|
| 23,748,347 |
|
| $ | 154,266 |
|
| $ | 8,041,571 |
|
| $ | 1,305 |
|
| $ | 8,042,876 |
|
| Conversion of limited partners' common OP Units to General Partner's common OP Units | | — |
| | — |
| | — |
| | — |
| | 32,439 |
| | 241 |
| | (32,439 | ) | | (241 | ) | | — |
| | — |
| | — |
|
| Repurchases of common OP Units under Share Repurchase Programs | | — |
| | — |
| | — |
| | — |
| | (7,206,876 | ) | | (50,154 | ) | | — |
| | — |
| | (50,154 | ) | | — |
| | (50,154 | ) |
| Repurchases of common OP Units to settle tax obligation | | — |
| | — |
| | — |
| | — |
| | (324,502 | ) | | (2,326 | ) | | — |
| | — |
| | (2,326 | ) | | — |
| | (2,326 | ) |
| Equity-based compensation, net | | — |
| | — |
| | — |
| | — |
| | 805,521 |
| | 13,314 |
| | — |
| | — |
| | 13,314 |
| | — |
| | 13,314 |
|
| Contributions from non-controlling interest holders | | — |
| | — |
| | — |
| | — |
| | — |
| | — |
| | — |
| | — |
| | — |
| | 120 |
| | 120 |
|
| Distributions to common OP Units and non-controlling interests —$0.55 per common unit | | — |
| | — |
| | — |
| | — |
| | — |
| | (532,144 | ) | | — |
| | (13,048 | ) | | (545,192 | ) | | — |
| | (545,192 | ) |
VEREIT OPERATING PARTNERSHIP, L.P.
CONSOLIDATED STATEMENTS OF CHANGES IN EQUITY – (Continued)
(In thousands, except for unit data)
|
| | | | | | | | | | | | | | | | | | | | | | | | | | | | | | | | | | | | | | | | |
| | | Preferred Units | | Common Units | | | | | | |
| | | General Partner | | Limited Partner | | General Partner | | Limited Partner | | | | | | |
| | | Number of Units | | Capital | | Number of Units | | Capital | | Number of Units | | Capital | | Number of Units | | Capital | | Total Partners' Capital | | Non-Controlling Interests | | Total Capital |
| Dividend equivalents on awards granted under the Equity Plan | | — |
| | $ | — |
| | — |
| | $ | — |
| | — |
| | $ | (917 | ) | | — |
| | $ | — |
| | $ | (917 | ) | | $ | — |
| | $ | (917 | ) |
| Distributions to preferred OP Units | | — |
| | (71,748 | ) | | — |
| | (144 | ) | | — |
| | — |
| | — |
| | — |
| | (71,892 | ) | | — |
| | (71,892 | ) |
| Net loss | | — |
| | — |
| | — |
| | — |
| | — |
| | (85,774 | ) | | — |
| | (2,102 | ) | | (87,876 | ) | | (154 | ) | | (88,030 | ) |
| Other comprehensive income | | — |
| | — |
| | — |
| | — |
| | — |
| | 2,289 |
| | — |
| | 56 |
| | 2,345 |
| | — |
| | 2,345 |
|
| Balance, December 31, 2018 | | 42,834,138 |
| | $ | 710,325 |
| | 86,874 |
| | $ | 2,883 |
| | 967,515,165 |
| | $ | 6,446,734 |
| | 23,715,908 |
| | $ | 138,931 |
| | $ | 7,298,873 |
| | $ | 1,271 |
| | $ | 7,300,144 |
|
The accompanying notes are an integral part of these statements.
VEREIT OPERATING PARTNERSHIP, L.P.
CONSOLIDATED STATEMENTS OF CASH FLOWS
(In thousands)
|
| | | | | | | | | | | | |
| | | Year Ended December 31, |
| | | 2018 | | 2017 | | 2016 |
| Cash flows from operating activities: | | | | | | |
| Net (loss) income | | $ | (88,030 | ) | | $ | 32,378 |
| | $ | (200,824 | ) |
| Adjustments to reconcile net (loss) income to net cash provided by operating activities: | | | | | | |
| Depreciation and amortization | | 659,948 |
| | 745,499 |
| | 806,548 |
|
| Gain on real estate assets, net | | (96,068 | ) | | (61,536 | ) | | (55,722 | ) |
| Impairments from held for sale | | — |
| | 20,027 |
| | — |
|
| Impairments | | 54,647 |
| | 50,548 |
| | 303,751 |
|
| Equity based compensation | | 13,314 |
| | 16,751 |
| | 10,728 |
|
| Equity in income of unconsolidated entities | | (1,869 | ) | | (2,726 | ) | | 415 |
|
| Distributions from unconsolidated entities | | 1,366 |
| | 3,646 |
| | 1,433 |
|
| Gain on investments | | (4,092 | ) | | (65 | ) | | — |
|
| (Gain) loss on derivative instruments, net | | (355 | ) | | (2,976 | ) | | 1,191 |
|
| (Gain) loss on extinguishment of debt and forgiveness of debt | | (5,360 | ) | | (18,373 | ) | | 771 |
|
| Changes in assets and liabilities: | | | | | | |
| Investment in direct financing leases | | 2,078 |
| | 2,097 |
| | 3,976 |
|
| Rent and tenant receivables and other assets, net | | (34,096 | ) | | (21,394 | ) | | (52,626 | ) |
| Due from affiliates | | — |
| | 1,163 |
| | (416 | ) |
| Assets held for sale classified as discontinued operations | | (2,492 | ) | | 13,812 |
| | — |
|
| Accounts payable and accrued expenses | | 1,688 |
| | 10,742 |
| | (3,323 | ) |
| Deferred rent and other liabilities | | 7,162 |
| | (395 | ) | | (17,740 | ) |
| Due to affiliates | | (66 | ) | | 50 |
| | (214 | ) |
| Liabilities related to discontinued operations | | (13,861 | ) | | 4,019 |
| | — |
|
| Net cash provided by operating activities | | 493,914 |
|
| 793,267 |
| | 797,948 |
|
| Cash flows from investing activities: | | | | | | |
| Investments in real estate assets | | (500,625 | ) | | (699,004 | ) | | (100,194 | ) |
| Capital expenditures and leasing costs | | (22,291 | ) | | (21,694 | ) | | (16,568 | ) |
| Real estate developments | | (9,221 | ) | | (14,850 | ) | | (17,411 | ) |
| Principal repayments received on investment securities and mortgage notes receivable | | 5,761 |
| | 6,796 |
| | 5,417 |
|
| Investments in unconsolidated entities | | (771 | ) | | — |
| | (25,777 | ) |
| Return of investment from unconsolidated entities | | 48 |
| | 1,972 |
| | 2,580 |
|
| Proceeds from disposition of real estate and joint venture | | 502,289 |
| | 445,525 |
| | 1,000,700 |
|
| Proceeds from disposition of discontinued operations | | 122,915 |
| | — |
| | — |
|
| Investment in leasehold improvements and other assets | | (841 | ) | | (1,191 | ) | | (2,259 | ) |
| Deposits for real estate assets | | (13,412 | ) | | (37,226 | ) | | (17,856 | ) |
| Proceeds from sale of investments and other assets | | 46,966 |
| | 400 |
| | — |
|
| Uses and refunds of deposits for real estate assets | | 17,267 |
| | 36,111 |
| | 13,305 |
|
| Proceeds from the settlement of property-related insurance claims | | 1,434 |
| | 355 |
| | — |
|
| Line of credit advances to Cole REITs | | (2,200 | ) | | (16,400 | ) | | (10,300 | ) |
| Line of credit repayments from Cole REITs | | 3,800 |
| | 25,100 |
| | 50,000 |
|
| Net cash provided by (used in) investing activities | | 151,119 |
| | (274,106 | ) | | 881,637 |
|
| Cash flows from financing activities: | | | | | | |
| Proceeds from mortgage notes payable | | 187 |
| | 4,652 |
| | 3,112 |
|
| Payments on mortgage notes payable and other debt, including debt extinguishment costs | | (137,887 | ) | | (424,385 | ) | | (337,022 | ) |
| Proceeds from credit facility | | 1,934,000 |
| | 329,000 |
| | 1,033,000 |
|
| Payments on credit facility | | (1,716,000 | ) | | (645,107 | ) | | (1,993,000 | ) |
| Proceeds from corporate bonds | | 546,304 |
| | 600,000 |
| | 1,000,000 |
|
| Payments on corporate bonds, including extinguishment costs | | — |
| | — |
| | (1,311,203 | ) |
| Repayment of convertible notes | | (597,500 | ) | | — |
| | — |
|
| Payments of deferred financing costs | | (25,471 | ) | | (9,575 | ) | | (19,872 | ) |
| Proceeds from 2016 term loan | | — |
| | — |
| | 300,000 |
|
| Repayment of 2016 term loan | | — |
| | — |
| | (300,000 | ) |
VEREIT OPERATING PARTNERSHIP, L.P.
CONSOLIDATED STATEMENTS OF CASH FLOWS – (Continued)
(In thousands)
|
| | | | | | | | | | | | |
| | | Year Ended December 31, |
| | | 2018 | | 2017 | | 2016 |
| Repurchases of Common Stock under the Share Repurchase Programs | | $ | (50,154 | ) | | $ | (518 | ) | | $ | — |
|
| Repurchases of Common Stock to settle tax obligations | | (2,326 | ) | | (2,148 | ) | | (4,652 | ) |
| Proceeds from the issuance of common OP Units, net of underwriters’ discount | | — |
| | — |
| | 702,765 |
|
| Payments of equity issuance costs | | — |
| | — |
| | (280 | ) |
| Contributions from non-controlling interest holders | | 120 |
| | 101 |
| | 675 |
|
| Distributions paid | | (606,679 | ) | | (608,615 | ) | | (580,508 | ) |
| Net cash used in financing activities | | (655,406 | ) |
| (756,595 | ) | | (1,506,985 | ) |
| Net change in cash and cash equivalents and restricted cash | | (10,373 | ) | | (237,434 | ) | | 172,600 |
|
| | | | | | | |
| Cash and cash equivalents and restricted cash, beginning of period | | $ | 64,036 |
| | $ | 301,470 |
| | $ | 128,870 |
|
| Less: cash and cash equivalents of discontinued operations | | (2,198 | ) | | (2,973 | ) | | (4,968 | ) |
| Cash and cash equivalents and restricted cash from continuing operations, beginning of period | | 61,838 |
| | 298,497 |
| | 123,902 |
|
| | | | | | | |
| Cash and cash equivalents, and restricted cash, end of period | | 53,663 |
| | 64,036 |
| | 301,470 |
|
| Less: cash and cash equivalents of discontinued operations | | — |
| | (2,198 | ) | | (2,973 | ) |
| Cash and cash equivalents and restricted cash from continuing operations, end of period | | $ | 53,663 |
| | $ | 61,838 |
| | $ | 298,497 |
|
| Reconciliation of Cash and Cash Equivalents and Restricted Cash | | | | | | |
| Cash and cash equivalents at beginning of period | | $ | 34,176 |
| | $ | 253,479 |
| | $ | 64,135 |
|
| Restricted cash at beginning of period | | 27,662 |
| | 45,018 |
| | 59,767 |
|
| Cash and cash equivalents and restricted cash at beginning of period | | 61,838 |
| | 298,497 |
| | 123,902 |
|
| | | | | | | |
| Cash and cash equivalents at end of period | | 30,758 |
| | 34,176 |
| | 253,479 |
|
| Restricted cash at end of period | | 22,905 |
| | 27,662 |
| | 45,018 |
|
| Cash and cash equivalents and restricted cash at end of period | | $ | 53,663 |
| | $ | 61,838 |
| | $ | 298,497 |
|
The accompanying notes are an integral part of these statements.
VEREIT, INC. and VEREIT OPERATING PARTNERSHIP, L.P.
NOTES TO CONSOLIDATED FINANCIAL STATEMENTS
December 31, 2016 – (Continued)2018
Audrain BuildingNote 1 – Organization
DuringVEREIT is a Maryland corporation, incorporated on December 2, 2010, that qualified as a real estate investment trust (“REIT”) for U.S. federal income tax purposes beginning in the taxable year ended December 31, 2013,2011. The OP is a whollyDelaware limited partnership of which the General Partner is the sole general partner. VEREIT’s common stock, par value $0.01 per share (“Common Stock”), and its 6.70% Series F Cumulative Redeemable Preferred Stock, par value $0.01 per share (“Series F Preferred Stock”) trade on the New York Stock Exchange (“NYSE”) under the trading symbols, “VER” and “VER PRF,” respectively. As used herein, the terms the “Company,” “we,” “our” and “us” refer to VEREIT, together with its consolidated subsidiaries, including the OP.
VEREIT is a full-service real estate operating company which owns and manages one of the largest portfolios of single-tenant commercial properties in the U.S. VEREIT’s business model provides equity capital to creditworthy corporations in return for long-term leases on their properties. The Company actively manages its portfolio considering a number of metrics including property type, concentration and key economic factors for appropriate balance and diversity.
Substantially all of the Company’s operations are conducted through the OP. VEREIT is the sole general partner and holder of 97.6% of the common equity interests in the OP as of December 31, 2018 with the remaining 2.4% of the common equity interests owned subsidiaryby unaffiliated investors and certain former directors, officers and employees of ARC Real Estate purchased a historic building in Newport, Rhode Island (“Audrain”Properties Advisors, LLC (the “Former Manager”) with plans to renovate. Under the second floor to serve as offices for certain executiveslimited partnership agreement of the Company,OP, as amended (the “LPA”), after holding units of limited partner interests in the Former ManagerOP (“OP Units”), including Series F Preferred Units, for a period of one year and affiliatesmeeting the other requirements in the LPA, unless an earlier redemption is otherwise consented to by VEREIT, holders of OP Units, including Series F Preferred Units, have the right to redeem the units for the cash value of a corresponding number of shares of VEREIT’s Common Stock or VEREIT’s Series F Preferred Stock, as applicable, or, at the option of VEREIT, a corresponding number of shares of VEREIT’s Common Stock or Series F Preferred Stock. The remaining rights of the Former Manager. An affiliateholders of OP Units are limited, however, and do not include the ability to replace the General Partner or to approve the sale, purchase or refinancing of the Former Manager requested that invoices relatingOP’s assets.
The actions of the OP and its relationship with the General Partner are governed by the LPA. The General Partner does not have any significant assets other than its investment in the OP. Therefore, the assets and liabilities of the General Partner and the OP are the same. Additionally, pursuant to the second floor renovationLPA, all administrative expenses and tenant improvementsexpenses associated with the formation, continuity, existence and all building operating expenses either be reimbursed by the Company to ARC Advisory or be paid directly to the contractors and vendors. During the year ended December 31, 2014, the Company incurred $8.7 million for tenant improvements and furniture and fixtures relating to the renovation directly to third parties.
In addition, on October 4, 2013, the Company entered into a lease agreement with a subsidiary of ARC Real Estate for a term of 15 years with annual base rent of $0.4 million requiring monthly payments beginning on that date. As there were tenants occupying the building when it was purchased, these tenants subleased their premises from the Company until their leases terminated. During the year ended December 31, 2014, the Company incurred and paid $0.3 million for base rent, which was partially offset by $17,000 of rental revenue received from the subtenants. No rental revenue was received during the years ended December 31, 2016 and 2015.
As a result of findingsoperation of the Audit Committee Investigation, the Company terminated this lease agreement and was reimbursed for the tenant improvements and furniture costsGeneral Partner incurred by the Company, totaling $8.5 million, duringGeneral Partner on the year ended December 31, 2014. Reimbursement was madeOP’s behalf shall be treated as expenses of the OP. Further, when the General Partner issues any equity instrument that has been approved by delivery and retirementthe General Partner’s Board of 916,423Directors, the LPA requires the OP to issue to the General Partner equity instruments with substantially similar terms, to protect the integrity of the Company’s umbrella partnership REIT structure, pursuant to which each holder of interests in the OP has a proportionate economic interest in the OP reflecting its capital contributions thereto. OP Units heldand Series F Preferred Units issued to the General Partner are referred to as “General Partner OP Units” and “General Partner Series F Preferred Units,” respectively. OP Units and Series F Preferred Units issued to parties other than the General Partner are referred to as “Limited Partner OP Units” and “Limited Partner Series F Preferred Units,” respectively. The LPA also provides that the OP issue debt with terms and provisions consistent with debt issued by an affiliatethe General Partner. The LPA will be amended to provide for the issuance of any additional class of equivalent equity instruments to the Former Manager. The Company never moved into or occupiedextent the building.General Partner’s Board of Directors authorizes the issuance of any new class of equity securities.
American National Stock Transfer, LLC Office Build-out
During the year ended December 31, 2014, as a result of the Cole Merger,As discussed in Note 4 —Discontinued Operations, on February 1, 2018, the Company worked to develop a partnership with ANST. Plans were made to move ANST to partcompleted the sale of its investment management segment, Cole Capital. The assets, liabilities and related financial results of substantially all of the Cole Capital office building in 2014. In order to accommodate the ANST employees, the Cole Capital office building was remodeled. During the year ended December 31, 2014, the Company paid $0.5 million directly to third parties for leasehold improvements and furniture and fixtures relating to the renovation.
ANST never moved into the building. The Company is considering its options with regard to recovery of such payments, although no decisions have been made at this time. No asset has been recognizedsegment are reflected in the financial statements related to any potential recovery.as discontinued operations.
Shared Office SpaceNote 2 –Summary of Significant Accounting Policies
During the year ended December 31, 2014,Basis of Accounting
The consolidated financial statements of the Company paid $1.8 million to an affiliatepresented herein include the accounts of the Former Manager for rent, leasehold improvementsGeneral Partner and furnitureits consolidated subsidiaries, including the OP. All intercompany transactions have been eliminated upon consolidation. The financial statements are prepared on the accrual basis of accounting in accordance with generally accepted accounting principles in the United States (“U.S. GAAP”).
Principles of Consolidation and fixtures related to offices in New York, Pennsylvania, and North Carolina where certainBasis of Presentation
The consolidated financial statements include the accounts of the Company’s employees shared office space with an affiliateCompany and its consolidated subsidiaries and consolidated joint venture arrangements. The portions of the Former Manager. The Company no longer occupies the office space.
Additional Related Party Transactions
The following related party transactions wereconsolidated joint venture arrangements not included in the tables above.
Tax Protection Agreement
The Company is party to a tax protection agreement with ARC Real Estate, which contributed its 100% indirect ownership interests in 63 of the Company’s properties to the Operating Partnership in the formation transactions related to the Company’s initial public offering. Pursuant to the tax protection agreement,owned by the Company has agreed to indemnify ARC Real Estate for its tax liabilities (plus an additional amount equal to the taxes incurred as a result of such indemnity payment) attributable to its built-in gain, as of the closing of the formation transactions, with respect to its interests in the contributed properties (other than two vacant properties contributed), if the Company sells, conveys, transfers or otherwise disposes of all or any portion of these interests in a taxable transaction on or prior to September 6, 2021. The sole and exclusive rights and remedies of ARC Real Estate under the tax protection agreement will be a claim against the Operating Partnership for ARC Real Estate’s tax liabilities as calculated in the tax protection agreement, and ARC Real Estate shall not be entitled to pursue a claim for specific performance or bring a claim against any person that acquires a protected property from the Operating Partnership in violation of the tax protection agreement.
are presented
VEREIT, INC. ANDand VEREIT OPERATING PARTNERSHIP, L.P.
NOTES TO CONSOLIDATED FINANCIAL STATEMENTS
December 31, 2018 – (Continued)
as non-controlling interests in VEREIT’s and the OP’s consolidated balance sheets, statements of operations, statements of comprehensive income (loss) and statements of changes in equity. In addition, as described in Note 1 – Organization, certain third parties have been issued OP Units. Holders of OP Units are considered to be non-controlling interest holders in the OP and their ownership interest in the limited partner’s share is presented as non-controlling interests in VEREIT’s consolidated balance sheets, statements of operations, statements of comprehensive income (loss) and statements of changes in equity. Further, a portion of the earnings and losses of the OP are allocated to non-controlling interest holders based on their respective ownership percentages. Upon conversion of OP Units to Common Stock, any difference between the fair value of shares of Common Stock issued and the carrying value of the OP Units converted is recorded as a component of equity. As of each of December 31, 2018 and 2017, there were approximately 23.7 million Limited Partner OP Units outstanding.
For legal entities being evaluated for consolidation, the Company must first determine whether the interests that it holds and fees it receives qualify as variable interests in the entity. A variable interest is an investment or other interest that will absorb portions of an entity’s expected losses or receive portions of the entity’s expected residual returns. The Company’s evaluation includes consideration of fees paid to the Company where the Company acts as a decision maker or service provider to the entity being evaluated. If the Company determines that it holds a variable interest in an entity, it evaluates whether that entity is a variable interest entity (“VIE”). VIEs are entities where investors lack sufficient equity at risk for the entity to finance its activities without additional subordinated financial support or where equity investors, as a group, lack one of the following characteristics: (a) the power to direct the activities that most significantly impact the entity’s economic performance, (b) the obligation to absorb the expected losses of the entity, or (c) the right to receive the expected returns of the entity.
The Company then qualitatively assesses whether it is (or is not) the primary beneficiary of a VIE, which is generally defined as the party who has a controlling financial interest in the VIE. Consideration of various factors include, but are not limited to, the Company’s ability to direct the activities that most significantly impact the entity’s economic performance and its obligation to absorb losses from or right to receive benefits of the VIE that could potentially be significant to the VIE. The Company consolidates any VIEs when the Company is determined to be the primary beneficiary of the VIE and the difference between consolidating the VIE and accounting for it using the equity method could be material to the Company’s consolidated financial statements. The Company continually evaluates the need to consolidate these VIEs based on standards set forth in U.S. GAAP.
Reclassification
As described below, the following items previously reported have been reclassified to conform with the current period’s presentation.
The operating expense reimbursements line item has been combined into rental revenue for prior periods presented to be consistent with the current year presentation.
The investment in direct financing leases, net, investment securities, at fair value and mortgage notes receivable, net line items from prior periods have been combined into the rent and tenant receivables and other assets, net caption on the consolidated balance sheets. Investments in the Cole REITs, as defined in “Investment in Cole REITs” section herein, has also been reclassified as of December 31, 2017 to rent and tenant receivables and other assets, net from investment in unconsolidated entities to be consistent with the current year presentation. Refer to Note 5 – Rent and Tenant Receivables and Other Assets, Netfor reclassification amounts and additional information.
The distributions declared on Common Stock line item from prior periods has been updated to exclude distributions on restricted stock units (“Restricted Stock Units”) and deferred stock units (“Deferred Stock Units”) on the consolidated statements of changes in equity for all periods presented. These amounts are now included in the line item dividend equivalents on awards granted under the Equity Plan (as defined in Note 12 – Equity-based Compensation), which also includes dividend equivalents on restricted shares of Common Stock (“Restricted Shares”). The dividend equivalents on Restricted Shares were previously included in the line item distributions to participating securities in the consolidated statements of changes in equity.
Use of Estimates
The preparation of financial statements in conformity with U.S. GAAP requires management to make estimates and assumptions that affect the reported amounts of assets and liabilities and disclosure of contingent assets and liabilities at the date of the financial statements and the reported amounts of revenues and expenses during the reporting period. Actual results could differ from those estimates. Management makes significant estimates regarding goodwill and intangible asset impairments, real estate investment impairment, allocation of purchase price of real estate asset acquisitions and income taxes.
VEREIT, INC. and VEREIT OPERATING PARTNERSHIP, L.P.
NOTES TO CONSOLIDATED FINANCIAL STATEMENTS
December 31, 2018 – (Continued)
Real Estate Investments
The Company records acquired real estate at cost and makes assessments as to the useful lives of depreciable assets. The Company considers the period of future benefit of the asset to determine the appropriate useful lives. Depreciation is computed using a straight-line method over the estimated useful life of 40 years for buildings, five to 15 years for building fixtures and improvements and the remaining lease term for intangible lease assets.
Allocation of Purchase Price of Real Estate Assets
The Company allocates the purchase price of acquired properties to tangible and identifiable intangible assets and liabilities acquired based on their relative fair values. Tangible assets include land, buildings, fixtures and improvements on an as-if vacant basis. The Company utilizes various estimates, processes and information to determine the as-if vacant property value. Identifiable intangible assets and liabilities include amounts allocated to acquired leases for above-market and below-market lease rates and the value of in-place leases. In estimating fair values for purposes of allocating purchase price, the Company utilizes a number of sources, including independent appraisals that may be obtained in connection with the acquisition or financing of the respective property and other market data. The Company also considers information obtained about each property as a result of its pre-acquisition due diligence, as well as subsequent marketing and leasing activities, in estimating the fair value of the tangible and intangible assets acquired and intangible liabilities assumed.
The aggregate value of intangible assets related to in-place leases is primarily the difference between the property valued with existing in-place leases adjusted to market rental rates and the property valued as if vacant. Factors considered by the Company in its analysis of the in-place lease intangibles include an estimate of carrying costs during the expected lease-up period for each property, taking into account current market conditions and costs to execute similar leases. In estimating carrying costs, the Company includes real estate taxes, insurance and other operating expenses and estimates of lost rentals at market rates during the expected lease-up period, which typically ranges from six to 18 months. The Company also estimates costs to execute similar leases, including leasing commissions, legal and other related expenses. The value of in-place leases is amortized over the initial term of the respective leases. If a tenant terminates its lease, then the unamortized portion of the in-place lease value is charged to expense.
Above-market and below-market in-place lease values for owned properties are recorded based on the present value (using an interest rate which reflects the risks associated with the leases acquired) of the difference between the contractual amounts to be paid pursuant to the in-place leases and management’s estimate of fair market lease rates for the corresponding in-place leases, measured over a period equal to the remaining non-cancelable term of the lease, including any bargain renewal periods. Above-market leases are amortized as a reduction to rental revenue over the remaining terms of the respective leases. Below-market leases are amortized as an increase to rental revenue over the remaining terms of the respective leases, including any bargain renewal periods.
The determination of the fair values of the real estate assets and liabilities acquired requires the use of significant assumptions with regard to the current market rental rates, rental growth rates, capitalization and discount rates, interest rates and other variables. The use of alternative estimates may result in a different allocation of the Company’s purchase price, which could materially impact the Company’s results of operations.
In January 2017, the Company elected to early adopt ASU 2017-01, Business Combinations (Topic 805): Clarifying the Definition of a Business (“ASU 2017-01”), which clarifies the definition of a business by adding guidance to assist entities in evaluating whether transactions should be accounted for as acquisitions of assets or businesses. During the years ended December 31, 2018 and 2017, all real estate acquisitions qualified as asset acquisitions, and external acquisition costs related to asset acquisitions were capitalized and allocated to tangible and intangible assets and liabilities as described above. Prior to January 1, 2017, external costs related to property acquisitions were expensed as incurred. Internal costs, such as employee salaries, related to activities necessary to complete, or affect, self-originating asset acquisitions or business combinations are classified as acquisition-related expenses in the accompanying consolidated statements of operations for all periods presented.
Assets Held for Sale
Upon classifying a real estate investment as held for sale, the Company will no longer recognize depreciation expense related to the depreciable assets of the property. Assets held for sale are recorded at the lower of carrying value or estimated fair value, less the estimated cost to dispose of the assets. See Note 3–Real Estate Investments and Related Intangibles for further discussion regarding properties held for sale.
If circumstances arise that the Company previously considered unlikely and, as a result, the Company decides not to sell a property previously classified as held for sale, the Company will reclassify the property as held and used. The Company measures and records a property that is reclassified as held and used at the lower of (i) its carrying value before the property was classified
VEREIT, INC. and VEREIT OPERATING PARTNERSHIP, L.P.
NOTES TO CONSOLIDATED FINANCIAL STATEMENTS
December 31, 2018 – (Continued)
as held for sale, adjusted for any depreciation expense that would have been recognized had the property been continuously classified as held and used or (ii) the estimated fair value at the date of the subsequent decision not to sell.
Development Activities
Project costs, which include interest expense, associated with the development, construction and lease-up of a real estate project are capitalized as construction in progress. Once the development and construction of the building is substantially completed, the amounts capitalized to construction in progress are transferred to (i) land and (ii) buildings, fixtures and improvements and are depreciated over their respective useful lives.
Discontinued Operations
The Company reports discontinued operations when a component of an entity or group of components that has been disposed of or classified as held for sale represents a strategic shift that has or will have a major effect on an entity’s operations and financial results. The results of operations for assets meeting the definition of discontinued operations are reflected in the Company’s consolidated statements of operations as discontinued operations for all periods presented. See Note 4 —Discontinued Operations for further discussion regarding discontinued operations.
Investment in Unconsolidated Entities
Unconsolidated Joint Ventures
The Company accounts for its investment in unconsolidated joint venture arrangements using the equity method of accounting as the Company has the ability to exercise significant influence, but not control, over operating and financing policies of these investments. The equity method of accounting requires the investment to be initially recorded at cost and subsequently adjusted for the Company’s share of equity in the joint ventures’ earnings and distributions. The Company records its proportionate share of net income (loss) from the unconsolidated joint ventures in equity in income and gain on disposition of unconsolidated entities in the consolidated statements of operations. See Note 3–Real Estate Investments and Related Intangiblesfor further discussion on investments in unconsolidated joint ventures.
Investment in Cole REITs
As of December 31, 2017, the Company owned equity investments in Cole Credit Property Trust IV, Inc. (“CCPT IV”), CIM Income NAV, Inc. (formerly known as Cole Real Estate Income Strategy (Daily NAV), Inc.) (“INAV”), Cole Office & Industrial REIT (CCIT II), Inc. (“CCIT II”), Cole Office & Industrial REIT (CCIT III), Inc. (“CCIT III”), and Cole Credit Property Trust V, Inc. (“CCPT V” and collectively with CCPT IV, INAV, CCIT II and CCIT III, the “Cole REITs”). On February 1, 2018, the Company sold certain of its equity investments to CCA Acquisition, LLC (the “Cole Purchaser”), an affiliate of CIM Group, LLC, retaining interests in CCIT II, CCIT III and CCPT V. Subsequent to the sale of Cole Capital and the adoption of ASU 2016-01 (as defined in “Recent Accounting Pronouncements” section below), the Company carries these investments at fair value, as the Company does not exert significant influence over CCIT II, CCIT III or CCPT V, and any changes in the fair value are recognized in other income, net in the accompanying consolidated statement of operations for the year ended December 31, 2018.Prior to the sale of Cole Capital, the Company accounted for these investments using the equity method of accounting, which required the investment to be initially recorded at cost and subsequently adjusted for the Company’s share of equity in the respective Cole REIT’s earnings and distributions. The Company recorded its proportionate share of net income or loss from the Cole REITs in equity in income and gain on disposition of unconsolidated entities in the consolidated statement of operations for the year ended December 31, 2018.
Leasehold Improvements and Property and Equipment
The Company leases its corporate office facilities under operating leases. Leasehold improvements related to these are recorded at cost less accumulated amortization. Leasehold improvements are amortized over the lesser of the estimated useful life or remaining lease term.
Property and equipment, which typically include computer hardware and software, furniture and fixtures, among other items, are stated at cost less accumulated depreciation. Property and equipment are depreciated on a straight-line method over the estimated useful lives of the assets, which range from three to seven years. The Company reassesses the useful lives of its property and equipment and adjusts the future monthly depreciation expense based on the new useful life, as applicable. If the Company disposes of an asset, the asset and related accumulated depreciation are written off upon disposal.
VEREIT, INC. and VEREIT OPERATING PARTNERSHIP, L.P.
NOTES TO CONSOLIDATED FINANCIAL STATEMENTS
December 31, 2018 – (Continued)
Goodwill
In the case of a business combination, after identifying all tangible and intangible assets and liabilities, the excess consideration paid over the fair value of the assets and liabilities acquired and assumed, respectively, represents goodwill. In connection with prior mergers, the Company recorded goodwill as a result of the merger consideration exceeding the net assets acquired. As of December 31, 2018 and 2017, the carrying value of goodwill was $1.3 billion.
Prior to the adoption of ASU 2017-01 in January 2017, in the event the Company disposed of a property, or classified a property as an asset held for sale, that constituted a business under U.S. GAAP, the Company allocated a portion of the real estate investments reporting unit’s goodwill to that property in determining the gain or loss on the disposal of the property. The amount of goodwill allocated to the business was based on the relative fair value of the business to the fair value of the reporting unit. During the year ended December 31, 2016, the Company allocated $73.2 million of goodwill to dispositions and held for sale assets, which included $2.3 million of goodwill allocated to the cost basis of two properties foreclosed upon. The allocated goodwill of $73.2 million was included in gain on disposition of real estate and real estate assets held for sale, net, in the consolidated statement of operations.
Impairments
Real Estate Assets
The Company performs quarterly impairment review procedures, primarily through continuous monitoring of events and changes in circumstances that could indicate the carrying value of its real estate assets may not be recoverable. Impairment indicators that the Company considers include, but are not limited to, decrease in net operating income, bankruptcy or other credit concerns of a property’s major tenant or tenants, such as history of late payments, rental concessions and other factors, as well as significant decreases in a property’s revenues due to lease terminations, vacancies, co-tenancy clauses or reduced lease rates. When impairment indicators are identified or if a property is considered to have a more likely than not probability of being disposed of within the next 12 to 24 months, the Company assesses the recoverability of the assets by determining whether the carrying value of the assets will be recovered through the undiscounted future cash flows expected from the use of the assets and their eventual disposition. U.S. GAAP requires us to utilize the Company’s expected holding period of our properties when assessing recoverability. In the event that such expected undiscounted future cash flows do not exceed the carrying value, the Company will adjust the real estate assets to their respective fair values and recognize an impairment loss. Generally, fair value is determined using a discounted cash flow analysis and recent comparable sales or leasing transactions. The assumptions and uncertainties utilized in the evaluation of the impairment of real estate assets are discussed in Note 6 – Fair Value Measures.
Goodwill
The Company evaluates goodwill for impairment annually or more frequently when an event occurs or circumstances change that indicate the carrying value may not be recoverable. The Company’s annual testing date is during the fourth quarter. In 2017, the Company adopted ASU 2017-04, Intangibles – Goodwill and Others (Topic 350): Simplifying the Test for Goodwill Impairment, which allows the Company to test goodwill for impairment by comparing the carrying value of net assets to their respective fair value. If the fair value is determined to be less than the carrying value, an impairment charge will be recorded for the difference between the fair value and the carrying value. The Company estimates the fair value using discounted cash flows and relevant competitor multiples. The evaluation of goodwill for potential impairment requires the Company’s management to exercise significant judgment and to make certain assumptions. While the Company believes its assumptions are reasonable, there are no guarantees as to actual results. Changes in assumptions based on actual results may have a material impact on the Company’s financial results. The analysis performed for the annual goodwill tests during the years ended December 31, 2018, 2017 and 2016 resulted in no impairment. Goodwill related to discontinued operations is discussed in Note 4 —Discontinued Operations.
VEREIT, INC. and VEREIT OPERATING PARTNERSHIP, L.P.
NOTES TO CONSOLIDATED FINANCIAL STATEMENTS
December 31, 2018 – (Continued)
Investment in Unconsolidated Entities
The Company is required to determine whether an event or change in circumstances has occurred that may have a significant adverse effect on the fair value of any of its investment in the unconsolidated entities. If an event or change in circumstance has occurred, the Company is required to evaluate its investment in the unconsolidated entity for potential impairment and determine if the carrying value of its investment exceeds its fair value. An impairment charge is recorded when an impairment is deemed to be other-than-temporary. To determine whether an impairment is other-than-temporary, the Company considers whether it has the ability and intent to hold the investment until the carrying value is fully recovered. The evaluation of an investment in an unconsolidated entity for potential impairment requires the Company’s management to exercise significant judgment and to make certain assumptions. The use of different judgments and assumptions could result in different conclusions. No impairments of unconsolidated entities were identified during the years ended December 31, 2018, 2017 and 2016.
Leasehold Improvements and Property and Equipment
Leasehold improvements and property and equipment are reviewed for impairment when events or changes in circumstances indicate that the carrying value of such assets may not be recoverable. If this review indicates that the carrying value of the asset is not recoverable, the Company records an impairment loss, measured at fair value by estimated discounted cash flows or market appraisals. The evaluation of leasehold improvements and property and equipment for potential impairment requires the Company’s management to exercise significant judgment and to make certain assumptions. The use of different judgments and assumptions could result in different conclusions. No impairments of leasehold improvements and property and equipment were identified during the years ended December 31, 2018, 2017 and 2016.
Cash and Cash Equivalents
Cash and cash equivalents include cash in bank accounts, as well as investments in highly-liquid money market funds with original maturities of three months or less. The Company deposits cash with several high quality financial institutions. These deposits are guaranteed by the Federal Deposit Insurance Corporation (“FDIC”) up to an insurance limit of $250,000. At times, the Company’s cash and cash equivalents may exceed federally insured levels. Although the Company bears risk on amounts in excess of those insured by the FDIC, it has not experienced and does not anticipate any losses due to the high quality of the institutions where the deposits are held.
Restricted Cash
The Company had $22.9 million and $27.7 million, respectively, in restricted cash as of December 31, 2018 and 2017. Restricted cash primarily consists of reserves related to lease expirations, as well as maintenance, structural and debt service reserves. In accordance with certain debt agreements, rent from certain of the Company’s tenants is deposited directly into a lockbox account, from which the monthly debt service payments are disbursed to the lender and the excess funds are then disbursed to the Company. Included in restricted cash at December 31, 2018 was $21.5 million in lender reserves and $1.4 million held in restricted lockbox accounts. Included in restricted cash at December 31, 2017 was $26.4 million in lender reserves and $1.3 million held in restricted lockbox accounts.
Investment in Direct Financing Leases
The Company has acquired certain properties that are subject to leases that qualify as direct financing leases in accordance with U.S. GAAP due to the significance of the lease payments from the ARCT IV Special Limited Partnerinception of the leases compared to the fair value of the property or due to bargain purchase options. Investments in direct financing leases represent the fair value of the remaining lease payments on the leases and the estimated fair value of any expected residual property value at the end of the lease term. The fair value of the remaining lease payments is estimated using a discounted cash flow analysis based on interest rates that would represent the Company’s incremental borrowing rate for similar types of debt. The expected residual property value at the end of the lease term is estimated using market data and assessments of the remaining useful lives of the properties at the end of the lease terms, among other factors. Income from direct financing leases is calculated using the effective interest method over the remaining term of the lease.
In
VEREIT, INC. and VEREIT OPERATING PARTNERSHIP, L.P.
NOTES TO CONSOLIDATED FINANCIAL STATEMENTS
December 31, 2018 – (Continued)
Deferred Financing Costs
Deferred financing costs represent commitment fees, legal fees and other costs associated with obtaining commitments for financing. Deferred financing costs, other than those associated with the Revolving Credit Facility (as defined in Note 7 –Debt), are presented on the consolidated balance sheets as a direct deduction from the carrying amount of the related debt liability rather than as an asset. These costs are amortized to interest expense over the terms of the respective financing agreements using the effective interest method. Unamortized deferred financing costs are written off when the associated debt is refinanced or repaid before maturity. Costs incurred in connection with the ARCT IV Merger, the ARCT IV Special Limited Partner invested $0.8 millionpotential financial transactions that are not completed are expensed in the ARCT IV OP and was subsequently issued 79,870 OP Unitsperiod in respect thereof uponwhich it is determined the closingfinancing will not be completed.
Convertible Debt
The Company has an outstanding aggregate balance of $402.5 million related to the 2020 Convertible Notes (as defined in Note 7 –Debt). The 2020 Convertible Notes are convertible into cash or shares of the ARCT IV Merger after giving effectCompany’s Common Stock at the Company’s option. In accordance with U.S GAAP, the 2020 Convertible Notes are accounted for as a liability with a separate equity component recorded for the conversion option. A liability was recorded for the 2020 Convertible Notes on the issuance date at fair value based on a discounted cash flow analysis using current market rates for debt instruments with similar terms. The difference between the initial proceeds from the 2020 Convertible Notes and the estimated fair value of the debt instruments resulted in a debt discount, with an offset recorded to additional paid-in capital representing the equity component. The debt discount is being amortized to interest expense over the respective term of the 2020 Convertible Notes.
Derivative Instruments
The Company may use derivative financial instruments, including interest rate swaps, caps, options, floors and other interest rate derivative contracts, to hedge all or a portion of the interest rate risk associated with its borrowings. The principal objective of such agreements is to minimize the risks and/or costs associated with the Company’s operating and financial structure as well as to hedge specific anticipated transactions. The Company does not intend to utilize derivatives for purposes other than interest rate risk management.
The Company records all derivatives on the consolidated balance sheets at fair value. The accounting for changes in the fair value of derivatives depends on the intended use of the derivative, whether the Company has elected to designate a derivative in a hedging relationship and apply hedge accounting and whether the hedging relationship has satisfied the criteria necessary to apply hedge accounting. Derivatives designated and qualifying as a hedge of the exposure to changes in the fair value of an asset, liability, or firm commitment attributable to a particular risk, such as interest rate risk, are considered fair value hedges. Derivatives designated and qualifying as a hedge of the exposure to variability in expected future cash flows, or other types of forecasted transactions, are considered cash flow hedges. Derivatives may also be designated as hedges of the foreign currency exposure of a net investment in a foreign operation. Hedge accounting generally provides for the matching of the timing of gain or loss recognition on the hedging instrument with the recognition of the changes in the fair value of the hedged asset or liability that are attributable to the ARCT IV Exchange Ratio. This investmenthedged risk in a fair value hedge or the earnings effect of the hedged forecasted transactions in a cash flow hedge. The Company may enter into derivative contracts that are intended to economically hedge certain of its risk, even though hedge accounting does not apply or the Company elects not to apply hedge accounting.
The accounting for subsequent changes in the fair value of these derivatives depends on whether each has been designated and qualifies for hedge accounting treatment. If the Company elects not to apply hedge accounting treatment, any changes in the fair value of these derivative instruments is recognized immediately in gain (loss) on derivative instruments, net in the consolidated statements of operations and consolidated statements of comprehensive income (loss). If the derivative is designated and qualifies for hedge accounting treatment, the change in the estimated fair value of the derivative is recorded in other comprehensive income (loss) to the extent that it is effective. Any ineffective portion of a derivative’s change in fair value will be immediately recognized in earnings.
As of December 31, 2018, the Company had one interest rate derivative that was not designated as a qualifying hedging relationship with a fair value of $0.5 million associated with a loan with a notional value of $50.7 million. As of December 31, 2017, the Company had two interest rate derivatives that were not designated as qualifying hedging relationships with an aggregate fair value of $0.6 million associated with loans with an aggregate notional value of $78.9 million. The fair value of the interest rate derivatives is included in non-controlling interestsrent and tenant receivables and other assets, net in the accompanying consolidated balance sheets.
InvestmentRevenue Recognition
In May 2014, the U.S. Financial Accounting Standards Board (“FASB”) issued ASU 2014-09, Revenue from Contracts with Customers (“ASU 2014-09”) (Topic 606), which supersedes the revenue recognition requirements in Revenue Recognition,
VEREIT, INC. and VEREIT OPERATING PARTNERSHIP, L.P.
NOTES TO CONSOLIDATED FINANCIAL STATEMENTS
December 31, 2018 – (Continued)
Accounting Standards Codification (“ASC”) (Topic 605) and requires an entity to recognize revenue in a way that depicts the transfer of promised goods or services to customers in an Affiliateamount that reflects the consideration to which the entity expects to be entitled in exchange for those goods or services. The Company adopted ASU 2014-09 and the related ASUs (collectively, the “Revenue ASUs”) during the first quarter of 2018 using the modified retrospective approach, which allows a cumulative effect adjustment to beginning retained earnings equal to initially applying the Revenue ASUs to all contracts with customers not completed as of the Former Managerdate of adoption. Adoption of the Revenue ASUs did not result in a cumulative effect adjustment to retained earnings as all contracts not completed as of adoption within the scope of Topic 606 have the same revenue recognition timing and measurement under Topic 605. Revenues generated through leasing arrangements are excluded from the Revenue ASUs as discussed below.
Revenue Recognition - Real Estate
The Company’s rental revenue is recognized when earned and collectability is reasonably assured and includes rental revenues and property operating expense reimbursements that each tenant pays in accordance with the terms of each lease. Rental revenue also includes amortization of above and below-market leases. Many of the leases have rent escalations and the rental revenue is recognized on a straight-line basis, which requires the Company to record a receivable that will only be received if the tenant makes all rent payments required through the expiration of the initial lease term. Straight-line rent receivables are included in rent and tenant receivables and other assets, net, in the consolidated balance sheets. See Note 5 – Rent and Tenant Receivables and Other Assets, Net. For leases that have contingent rental revenue based on a percentage of the tenant’s sales, the Company recognizes contingent rental revenue when the specified target is achieved.
The Company continually reviews receivables related to rent and unbilled rent receivables and determines collectability by taking into consideration the tenant’s payment history, the financial condition of the tenant, business conditions in the industry in which the tenant operates and economic conditions in the area in which the property is located. In the event that the collectability of a receivable is uncertain, the Company will record an increase in the allowance for uncollectible accounts in the consolidated balance sheets and bad debt expense in property operating expenses in the consolidated statements of operations. The Company suspends revenue recognition when the collectability of amounts due pursuant to a lease is no longer reasonably assured.
Revenue Recognition - Cole Capital
As discussed in Note 4 —Discontinued Operations, on February 1, 2018, the Company completed the sale of its investment management segment, Cole Capital. The assets, liabilities and related financial results of substantially all of the Cole Capital segment are reflected in the financial statements as discontinued operations.
Cole Capital earned securities sales commissions, dealer manager fees, distribution and stockholder servicing fees, real estate acquisition fees, financing coordination fees, property management fees, advisory fees, asset management fees and performance fees for services relating to the Cole REITs’ offerings and the investment and management of their respective assets, in accordance with the respective dealer manager and advisory agreements. The Company was also reimbursed for certain costs incurred in providing these services, which were recorded as revenue as the expenses were incurred subject to revenue constraint due to the limitations on the amount that was reimbursable based on the terms of the respective dealer manager and advisory agreements. Refer to Note 13 –Related Party Transactions and Arrangements for a disaggregation of Cole Capital revenues.
Revenue Recognition - Other
The Company entered into a services agreement (the “Services Agreement”) with the Cole Purchaser, pursuant to which the Company will continue to provide certain services to the Cole Purchaser and the Cole REITs, including operational real estate support, (“Transition Services Revenues”) through March 31, 2019 (or, if later, the date of the last government filing other than a tax filing made by any of the Cole REITs with respect to its 2018 fiscal year). Under the terms of the Services Agreement, the Company will be entitled to receive reimbursement for certain of the services provided. The Company recorded Transition Services Revenues as costs associated with providing such services were incurred, which coincided with the timing in which the performance obligations of the contract had been met. During the period from February 1, 2018 through December 31, 2018, the Company incurred $15.0 million of such costs and recognized revenues of $15.0 million, which are recorded in other income, net in the consolidated statement of operations. The Company may also receive additional fees over the next six years if future revenues of Cole Capital exceed a specified dollar threshold (the “Net Revenue Payments”), up to an aggregate of $80.0 million in Net Revenue Payments.
VEREIT, INC. and VEREIT OPERATING PARTNERSHIP, L.P.
NOTES TO CONSOLIDATED FINANCIAL STATEMENTS
December 31, 2018 – (Continued)
Litigation, Merger and Other Non-Routine Costs, Net of Insurance Recoveries
External costs incurred in relation to prior mergers and litigation resulting therefrom are included in litigation, merger and other non-routine costs, net of insurance recoveries in the consolidated statements of operations. The Company has also incurred legal fees and other costs associated with litigations and investigations resulting from the Audit Committee Investigation (defined below), which are considered non-routine. The Company has directors’ and officers’ insurance and the insurance carriers have paid certain defense costs subject to standard reservation of rights under the respective policies.
Litigation, merger and other non-routine costs, net of insurance recoveries include the following costs (amounts in thousands):
|
| | | | | | | | | | | | |
| | | Year Ended December 31, |
| | | 2018 | | 2017 | | 2016 |
| Merger Related Costs: | | | | | | |
Transfer taxes(1) | | $ | — |
| | $ | (1,595 | ) | | $ | 562 |
|
| Litigation and other non-routine costs: | | | | | | |
Audit Committee Investigation and related matters (2) | | $ | 59,755 |
| | $ | 49,434 |
| | $ | 24,207 |
|
Legal fees and expenses (3) | | 530 |
| | 421 |
| | 311 |
|
Litigation settlements (4) | | 233,246 |
| | — |
| | — |
|
| Total costs | | 293,531 |
|
| 48,260 |
| | 25,080 |
|
Insurance recoveries (5) | | (2,568 | ) | | (300 | ) | | (21,196 | ) |
| Total | | $ | 290,963 |
| | $ | 47,960 |
| | $ | 3,884 |
|
| |
| (1) | The negative balance for the year ended December 31, 2017 is a result of estimated costs accrued in prior periods that exceeded actual expenses incurred. |
| |
| (2) | Includes all fees and costs associated with various litigations and investigations prompted by the results of the 2014 investigation conducted by the audit committee (the “Audit Committee”) of the Company’s Board of Directors (the “Audit Committee Investigation”), including fees and costs incurred pursuant to the Company’s advancement obligations, litigation related thereto and in connection with related insurance recovery matters, net of accrual reversals. During the year ended December 31, 2018, the Company reversed an accrual of $10.9 million, as the Company was legally released from certain advancement obligations, and the accrued amounts were paid directly by the Company’s insurers to the payees subsequent to December 31, 2018. There were no reversals in the years ended December 31, 2017 and 2016. |
| |
| (3) | Includes legal fees and expenses associated with litigation resulting from prior mergers and related insurance recovery matters and excludes amounts presented in income from discontinued operations, net of income taxes in the consolidated statements of operations for the year ended December 31, 2018. |
| |
| (4) | Refer to Note 10– Commitments and Contingencies for additional information. |
| |
| (5) | $2.3 million recorded during the year ended December 31, 2018 relates to litigation resulting from prior mergers. |
Loss Contingencies
The Company records a liability in the consolidated financial statements for loss contingencies when a loss is known or considered probable and the amount is reasonably estimable. If the reasonable estimate of a known or probable loss is a range, and no amount within the range is a better estimate than any other, the minimum amount of the range is accrued. If a material loss is reasonably possible but not known or probable, and is reasonably estimable, the estimated loss or range of loss is disclosed.
Equity-based Compensation
The Company has an equity-based incentive award plan for non-executive directors, officers, other employees and advisors or consultants who provide services to the Company, as applicable, and a non-executive director restricted share plan, which are accounted for under U.S. GAAP for share-based payments. The expense for such awards is recognized over the vesting period or when the requirements for exercise of the award have been met. See Note 12 – Equity-based Compensation for additional information on these plans.
Per Share Data
Income (loss) per basic share of Common Stock is calculated by dividing net income (loss) less dividends on unvested Restricted Shares of Common Stock and dividends on preferred stock by the weighted-average number of shares of Common Stock issued and outstanding during such period. Diluted income (loss) per share of Common Stock considers the effect of potentially dilutive shares of Common Stock outstanding during the period.
Income Taxes
The General Partner elected to be taxed as a REIT for U.S. federal income tax purposes under Sections 856 through 860 of the Internal Revenue Code commencing with the taxable year ended December 31, 2011. We believe we are organized and operating in such a manner as to qualify to be taxed as a REIT for the taxable year ended December 31, 2018. As a REIT, the
VEREIT, INC. and VEREIT OPERATING PARTNERSHIP, L.P.
NOTES TO CONSOLIDATED FINANCIAL STATEMENTS
December 31, 2018 – (Continued)
General Partner is generally not subject to federal income tax on taxable income that it distributes to its stockholders so long as it distributes at least 90% of its annual taxable income (computed without regard to the deduction for dividends paid and excluding net capital gains). However, the General Partner, its TRS entities, and the OP are still subject to certain state and local income, franchise and property taxes in the various jurisdictions in which they operate. The General Partner may also be subject to federal income taxes on certain income and excise taxes on its undistributed income.
The OP is classified as a partnership for U.S. federal income tax purposes. As a partnership, the OP is not a taxable entity for U.S. federal income tax purposes. Instead, each partner in the OP is required to include its allocable share of the OP’s income, gains, losses, deductions and credits for each taxable year. Under the LPA, the OP is to conduct business in such a manner as to permit the General Partner at all times to qualify as a REIT.
A TRS is a subsidiary of a REIT that is subject to federal, state and local income taxes, as applicable. The Company’s use of a TRS enables it to engage in certain business activities while complying with the REIT qualification requirements and to retain any income generated by these businesses for reinvestment without the requirement to distribute those earnings. The Company conducted substantially all of the Cole Capital business activities through a TRS until it sold the Cole Capital business on February 1, 2018.
During the year ended December 31, 2013,2018, the Company invested $10.0 millionconducted all of its business in a real estate fund advisedthe United States, Puerto Rico and Canada and filed income tax returns in the U.S. federal jurisdiction, the Canadian federal jurisdiction and various state and local jurisdictions. With few exceptions, the Company is no longer subject to routine examinations by an affiliatetaxing authorities for years before 2014. Certain of the Former Manager, American Real Estate Income Fund, which invests primarilyCompany’s intercompany transactions that have been eliminated in equity securities of other publicly traded REITs,consolidation for financial accounting purposes are also subject to taxation.
The Company provides for income taxes in accordance with current authoritative accounting and subsequently reinvested dividends totaling $0.1 milliontax guidance. The tax provision or benefit related to significant or unusual items is recognized in the fund. quarter in which those items occur. In addition, the effect of changes in enacted tax laws, rates or tax status is recognized in the quarter in which the change occurs. The accounting estimates used to compute the provision for or benefit from income taxes may change as new events occur, additional information is obtained or the tax environment changes.
During the years ended December 31, 2018, 2017 and 2016, the Company recognized state and local income and franchise tax expense of $4.7 million, $6.9 million and $6.0 million, respectively, which are included in provision for income taxes in the accompanying consolidated statements of operations. In addition, the Company recorded a provision for federal income taxes of $0.4 million and $1.1 million for the years ended December 31, 2018 and 2016 related to a TRS entity, which is also included in provision for income taxes in the accompanying consolidated statements of operations. No provision for federal income taxes related to a TRS entity was recorded for the year ended December 31, 2017. The provision for or benefit from income taxes attributable to the Cole Capital business, substantially all of which was conducted through a TRS entity, is included in discontinued operations for all periods presented, as discussed in Note 4 —Discontinued Operations.
The Company had no unrecognized tax benefits as of or during the years ended December 31, 2018, 2017 or 2016. Any interest and penalties related to unrecognized tax benefits would be recognized in provision for income taxes in the accompanying consolidated statements of operations.
As of December 31, 2014,2018, the OP and the General Partner had no material uncertain income tax positions.
Recent Accounting Pronouncements
Adopted Accounting Standards
In January 2016, the FASB issued ASU 2016-01, Financial Instruments – Overall (Subtopic 825-10), Recognition and Measurement of Financial Assets and Financial Liabilities (“ASU 2016-01”), which requires equity investments (except those accounted for under the equity method of accounting or those that result in consolidation of the investee) to be measured at fair value with changes in fair value recognized in net income (loss). An entity may choose to measure equity investments that do not have a readily determinable fair value at costs minus impairment, if any, plus or minus changes resulting from observable price changes in orderly transactions for the identical or a similar investment of the same issue. ASU 2016-01 is effective for fiscal years, and interim periods within, beginning after December 15, 2017 and requires prospective treatment of equity securities without readily determinable fair values. The Company adopted ASU 2016-01 as of January 1, 2018 and recorded a $5.1 million gain, which is included in other income, net in the accompanying consolidated statements of operations, on measuring the Company’s investments in the Cole REITs at fair value after the investments were no longer accounted for using the equity method.
VEREIT, INC. and VEREIT OPERATING PARTNERSHIP, L.P.
NOTES TO CONSOLIDATED FINANCIAL STATEMENTS
December 31, 2018 – (Continued)
In February 2017, the FASB issued ASU 2017-05, Other Income – Gains and Losses from the Derecognition of Nonfinancial Assets (Subtopic 610-20): Clarifying the Scope of Asset Derecognition Guidance and Accounting for Partial Sales of Nonfinancial Assets (“ASU 2017-05”), which clarifies the following: 1) nonfinancial assets within the scope of Subtopic 610-20 may include nonfinancial assets transferred within a legal entity to a counterparty; 2) an entity should allocate consideration to each distinct asset by applying the guidance in Topic 606 on allocating the transaction price to performance obligations; and 3) requires entities to derecognize a distinct nonfinancial asset or distinct in substance nonfinancial asset in a partial sale transaction when it (a) does not have (or ceases to have) a controlling financial interest in the legal entity that holds the asset in accordance with Subtopic 810 and (b) transfers control of the asset in accordance with Topic 606. The adoption of this standard will result in higher gains on the sale of partial real estate interests, including contributions of nonfinancial assets to a joint venture or other noncontrolling investee, due to recognizing the full gain when the derecognition criteria are met and recording the retained noncontrolling interest at its fair value. ASU 2017-05 is effective for annual periods, and interim periods therein, beginning after December 15, 2017. ASU 2017-05 was adopted during the first quarter of fiscal year 2018, in conjunction with the Revenue ASUs, using the modified retrospective approach. The Company also elected the practical expedient to only apply the guidance to contracts that were not completed upon adoption. At adoption, the Company sold substantiallydid not have any contracts that were not completed within the scope of ASU 2017-05 and as such, the adoption of ASU 2017-05 did not impact the Company’s financial statements.
Accounting Standards Not Yet Adopted
In February 2016, the FASB issued ASU 2016-02, which will require that a lessee recognize assets and liabilities on the balance sheet for all of its investment,leases with a lease term of more than 12 months, with the result being the recognition of a right of use (“ROU”) asset and a lease liability and the disclosure of key information about the entity’s leasing arrangements. The lessor accounting model under ASU 2016-02 is similar to existing guidance, however it limits the capitalization of initial direct leasing costs, such as internally generated costs. The Company expects to elect all practical expedients permitted under ASC Topic 842, other than the hindsight practical expedient, which permits entities to use hindsight in determining the lease terms. Accordingly, the Company will retain distinction between a finance lease (i.e., capital leases under existing guidance) and an operating lease and account for its existing operating leases as operating leases under the new guidance, without reassessing (a) whether the contracts contain a lease under ASC Topic 842, (b) whether classification of the operating leases would be different in accordance with ASC Topic 842, or (c) whether the unamortized initial direct costs before transition adjustments would have met the definition of initial direct costs in ASC Topic 842 at lease commencement.
In January 2018, the FASB issued ASU 2018-01, Leases (Topic 842): Land Easement Practical Expedient for Transition to Topic 842. The amendments help address transition guidance as it relates to land easements. As the Company plans to elect this practical expedient, it will only evaluate new or modified land easements upon adoption of Topic 842.
In July 2018, the FASB issued ASU 2018-10, Leases (Topic 842), which contained targeted improvements to amend inconsistencies and clarify guidance that were brought about by stakeholders. Additionally, in July 2018, the FASB issued ASU 2018-11, Leases (Topic 842), which provided the following practical expedients: (1) a transition method that allows entities to apply the new standard at the adoption date and to recognize a cumulative-effect adjustment to the opening balance of retained earnings effective at the adoption date; and (2) the option for lessors to not separate lease and non-lease components provided that certain criteria are met. The Company plans to elect the practical expedients included in ASU 2018-11. As the Company is not electing the hindsight practical expedient, the Company does not expect to have a cumulative effect adjustment to retained earnings upon adoption.
In December 2018, the FASB issued ASU 2018-20, Narrow-Scope Improvements for Lessors, Leases (Topic 842). This ASU 2018-20 provides an election for lessors to exclude sales and related taxes from consideration in the contract, requires lessors to exclude from revenue and expense lessor costs paid directly to a third party by lessees, and clarifies lessors’ accounting for variable payments related to both lease and nonlease components.
The Company is currently evaluating the impact of adoption, and anticipates this standard will have a material impact on its consolidated balance sheets. However, the Company does not expect adoption will have a material impact on its consolidated statements of operations. While the Company is continuing to assess potential impacts of the standard, it currently expects the most significant impact will be the recognition of ROU assets and lease liabilities for operating leases. Our initial ROU asset and liability will be approximately $223.0 million. The Company expects its accounting for capital leases to remain substantially unchanged. Leases pursuant to which the Company is the lessee primarily consist of approximately 200 leases, of which the majority are ground leases. The Company will adopt ASU 2016-12 and its related amendments beginning January 1, 2019.
In June 2016, the FASB issued ASU 2016-13, Financial Instruments – Credit Losses (Topic 326) (“ASU 2016-13”). ASU 2016-13 is intended to improve financial reporting by requiring more timely recognition of credit losses on loans and other financial instruments that are not accounted for at fair value through net income, including loans held for investment, held-to-maturity debt securities, trade and other receivables, net investment in leases and other such commitments. ASU 2016-13 requires that financial
VEREIT, INC. and VEREIT OPERATING PARTNERSHIP, L.P.
NOTES TO CONSOLIDATED FINANCIAL STATEMENTS
December 31, 2018 – (Continued)
assets measured at amortized cost be presented at the net amount expected to be collected, through an allowance for credit losses that is deducted from the amortized cost basis. The amendments in ASU 2016-13 require the Company to measure all expected credit losses based upon historical experience, current conditions, and reasonable and supportable forecasts that affect the collectability of the financial assets and eliminates the “incurred loss” methodology under current U.S. GAAP. In November 2018, the FASB issued ASU No. 2018-19, Codification Improvements to Topic 326, Financial Instruments—Credit Losses (“ASU 2018-19”). This ASU clarifies that receivables from operating leases are accounted for using the lease guidance and not as financial instruments. ASU 2016-13 and ASU 2018-19 are effective for fiscal years, and interim periods within, beginning after December 15, 2019. Early adoption is permitted for fiscal years, and interim periods within, beginning after December 15, 2018. The Company is currently evaluating the impact these amendments will have on its consolidated financial statements.
Note 3– Real Estate Investments and Related Intangibles
Property Acquisitions
During the year ended December 31, 2018, the Company acquired controlling financial interests in 52 commercial properties for an aggregate purchase price of $502.7 million (the “2018 Acquisitions”), which includes one land parcel for build-to-suit development, further discussed below, $2.1 million related to an outstanding tenant improvement allowance recorded as a payable as of the acquisition date and for which the Company received a credit at close, and $2.6 million of external acquisition-related expenses that were capitalized.
During the year ended December 31, 2017, the Company acquired a controlling interest in 88 commercial properties and three land parcels for an aggregate purchase price of $748.8 million (the “2017 Acquisitions”), which includes $3.3 million of external acquisition-related expenses that were capitalized and includes 22 properties acquired in a nonmonetary exchange discussed below.
During the year ended December 31, 2016, the Company acquired a controlling interest in eight commercial properties for an aggregate purchase price of $100.2 million (the “2016 Acquisitions”). Prior to the adoption of ASU 2017-01, costs related to property acquisitions were expensed as incurred. The Company has not included pro forma information for the Company's 2016 Acquisitions, which were acquired prior to the adoption of ASU 2017-01 and met the definition of a business combination, as they did not have a material impact on the Company's financial position or results of operations.
The following table presents the allocation of the fair values of the assets acquired and liabilities assumed during the periods presented (in thousands):
|
| | | | | | | | | | | | |
| | | Year Ended December 31, |
| | | 2018 | | 2017 | | 2016 |
| Real estate investments, at cost: | | | | | | |
| Land | | $ | 86,285 |
| | $ | 110,634 |
| | $ | 23,187 |
|
| Buildings, fixtures and improvements | | 350,942 |
| | 523,445 |
| | 67,865 |
|
| Total tangible assets | | 437,227 |
| | 634,079 |
| | 91,052 |
|
| Acquired intangible assets: | | | | | | |
In-place leases and other intangibles (1) | | 62,791 |
| | 105,940 |
| | 9,613 |
|
Above-market leases (2) | | 2,750 |
| | 10,445 |
| | — |
|
| Assumed intangible liabilities: | | | | | | |
Below-market leases (3) | | (116 | ) | | (1,680 | ) | | (471 | ) |
| Total purchase price of assets acquired | | $ | 502,652 |
| | $ | 748,784 |
| | $ | 100,194 |
|
| |
| (1) | The weighted average amortization period for acquired in-place leases and other intangibles is 16.3 years, 15.8 years and 13.8 years for 2018 Acquisitions, 2017 Acquisitions and 2016 Acquisitions, respectively. |
| |
| (2) | The weighted average amortization period for acquired above-market leases is 10.8 years and 18.0 years for 2018 Acquisitions and 2017 Acquisitions, respectively. There were no acquired above-market leases during the year ended December 31, 2016. |
| |
| (3) | The weighted average amortization period for acquired intangible lease liabilities is 9.9 years, 13.8 years and 10.0 years for 2018 Acquisitions, 2017 Acquisitions and 2016 Acquisitions, respectively. |
As of December 31, 2018, the Company invested $3.5 million, including $0.5 million of external acquisition-related expenses that were capitalized, in one build-to-suit development project. The Company’s estimated remaining committed investment is $24.9 million, and the project is expected to be completed within the next 12 months.
VEREIT, INC. and VEREIT OPERATING PARTNERSHIP, L.P.
NOTES TO CONSOLIDATED FINANCIAL STATEMENTS
December 31, 2018 – (Continued)
Future Lease Payments
The following table presents future minimum base rent payments due to the Company over the next five years and thereafter. These amounts exclude contingent rent payments, as applicable, that may be collected from certain tenants based on provisions related to sales thresholds and increases in annual rent based on exceeding certain economic indexes among other items (in thousands):
|
| | | | | | | | |
| | | Future Minimum Operating Lease
Base Rent Payments | | Future Minimum
Direct Financing Lease Payments (1) |
| 2019 | | $ | 1,107,610 |
| | $ | 2,448 |
|
| 2020 | | 1,080,639 |
| | 2,135 |
|
| 2021 | | 1,042,346 |
| | 2,014 |
|
| 2022 | | 972,564 |
| | 1,925 |
|
| 2023 | | 890,327 |
| | 1,541 |
|
| Thereafter | | 5,387,232 |
| | 707 |
|
| Total | | $ | 10,480,718 |
| | $ | 10,770 |
|
| |
| (1) | Related to25 properties which are subject to direct financing leases and, therefore, revenue is recognized as direct financing lease income on the discounted cash flows of the lease payments. Amounts reflected are the minimum base rental cash payments due to the Company under the lease agreements on these respective properties. |
Property Dispositions and Real Estate Assets Held for Sale
During the year ended December 31, 2018, the Company disposed of 149 properties, including one property conveyed to a lender in a deed-in-lieu of foreclosure transaction as discussed in Note 7 –Debt, for an aggregate gross sales price of $526.4 million, of which our share was $504.3 million after the profit participation payments related to the disposition of 34 Red Lobster properties. The dispositions resulted in proceeds of $496.7 million after closing costs. The Company recorded a gain of $96.2 million related to the sales which is included in gain on disposition of real estate and real estate assets held for sale, net in the accompanying consolidated statements of operations.
During the year ended December 31, 2018, the Company also disposed of one property owned by an unconsolidated joint venture for a gross sales price of $34.1 million, of which our share was $17.1 million based on our ownership interest in the joint venture, resulting in proceeds of $5.6 million after debt repayments of $20.4 million and closing costs. The Company recorded a gain of $0.7 million related to the sale and liquidation of the joint venture, which is included in equity in income and gain on disposition of unconsolidated entities in the accompanying consolidated statements of operations.
During the year ended December 31, 2017, the Company disposed of 137 properties, including one property owned by a consolidated joint venture, six properties transferred to the lender in either a deed-in-lieu of foreclosure or foreclosure sale transaction as discussed in Note 7 –Debt, and 15 properties disposed of in connection with a nonmonetary exchange discussed below, for an aggregate gross sales price of $594.9 million, of which our share was $574.4 million after the profit participation payment related to the disposition of 31 Red Lobster properties and the consolidated joint venture partner’s share of the sales price. The dispositions resulted in proceeds of $445.5 million after a mortgage loan assumption of $66.0 million and closing costs. Additionally, the Company’s tax provision for the year ended December 31, 2017 included $1.7 million of Canadian tax gain on the sale of certain Canadian properties. The Company recorded a gain of $64.7 million, which is included in gain on disposition of real estate and real estate assets held for sale, net in the accompanying consolidated statements of operations.
During the year ended December 31, 2016, the Company disposed of 301 properties, for an aggregate gross sales price of $1.08 billion, of which our share was $1.04 billion after the profit participation payment related to the disposition of 70 Red Lobster properties. The dispositions resulted in proceeds of $958.4 million after a mortgage loan assumption of $55.0 million and closing costs. The Company recorded a gain of $45.7 million, which included $67.8 million of goodwill allocated to the cost basis of such properties, which is included in gain on disposition of real estate and real estate assets held for sale, net in the accompanying consolidated statements of operations.
VEREIT, INC. and VEREIT OPERATING PARTNERSHIP, L.P.
NOTES TO CONSOLIDATED FINANCIAL STATEMENTS
December 31, 2018 – (Continued)
During the year ended December 31, 2016, the Company also disposed of one property owned by an unconsolidated joint venture for a gross sales price of $113.5 million, of which our share was $102.1 million based on our ownership interest in the joint venture, resulting in proceeds of $42.3 million after debt repayments of $57.0 million and closing costs. The Company recorded a gain of $10.2 million related to the sale, which is included in equity in income and gain on disposition of unconsolidated entities in the accompanying consolidated statements of operations.
As of December 31, 2018, there were five properties classified as held for sale with a carrying value of less$2.6 million, included in assets related to real estate assets held for sale and discontinued operations, net in the accompanying consolidated balance sheet, which are expected to be sold in the next 12 months as part of the Company’s portfolio management strategy. As of December 31, 2017, there were 30 properties classified as held for sale. During the year ended December 31, 2018, the Company recorded a loss of $1.9 million related to held for sale properties. During the year ended December 31, 2017, the Company recorded a loss of $3.1 million related to held for sale properties. During the year ended December 31, 2016, the Company recorded a loss of $5.1 million related to held for sale properties, which included $3.2 million of goodwill allocated to the cost basis of such properties.
Intangible Lease Assets and Liabilities
Intangible lease assets and liabilities of the Company consisted of the following as of December 31, 2018 and 2017 (amounts in thousands, except weighted-average useful life):
|
| | | | | | | | | | |
| | | Weighted-Average Useful Life | | December 31, 2018 | | December 31, 2017 |
| Intangible lease assets: | | | | | | |
| In-place leases and other intangibles, net of accumulated amortization of $703,909 and $599,680, respectively | | 15.5 | | $ | 980,971 |
| | $ | 1,091,433 |
|
| Leasing commissions, net of accumulated amortization of $4,048 and $2,902, respectively | | 10.7 | | 15,660 |
| | 13,876 |
|
| Above-market lease assets and deferred lease incentives, net of accumulated amortization of $105,936 and $88,335, respectively | | 16.4 | | 201,875 |
| | 241,449 |
|
| Total intangible lease assets, net | | | | $ | 1,198,506 |
| | $ | 1,346,758 |
|
| | | | | | | |
| Intangible lease liabilities: | | | | | | |
| Below-market leases, net of accumulated amortization of $89,905 and $73,916, respectively | | 18.8 | | $ | 173,479 |
| | $ | 198,551 |
|
The aggregate amount of above‑ and below-market leases and deferred lease incentives amortized and included as a net decrease to rental revenue was $4.2 million for the year ended December 31, 2018 and $5.4 million for each of the years ended December 31, 2017 and 2016, respectively. The aggregate amount of in-place leases, leasing commissions and other lease intangibles amortized and included in depreciation and amortization expense was $139.6 million, $154.2 million and $170.0 million for the years ended December 31, 2018, 2017 and 2016, respectively.
The following table provides the projected amortization expense and adjustments to rental revenue related to the intangible lease assets and liabilities for the next five years as of December 31, 2018 (amounts in thousands):
|
| | | | | | | | | | | | | | | | | | | | |
| | | 2019 | | 2020 | | 2021 | | 2022 | | 2023 |
| In-place leases and other intangibles: | | | | | | | | | | |
| Total projected to be included in amortization expense | | $ | 126,457 |
| | $ | 119,161 |
| | $ | 111,335 |
| | $ | 97,159 |
| | $ | 86,311 |
|
| Leasing commissions: | | | | | | | | | | |
| Total projected to be included in amortization expense | | 1,911 |
| | 1,778 |
| | 1,620 |
| | 1,556 |
| | 1,359 |
|
| Above-market lease assets and deferred lease incentives: | | | | | | | | |
| Total projected to be deducted from rental revenue | | 20,870 |
| | 20,456 |
| | 20,027 |
| | 19,213 |
| | 18,270 |
|
| Below-market lease liabilities: | | | | | | | | | | |
| Total projected to be included in rental revenue | | 17,973 |
| | 16,821 |
| | 15,656 |
| | 14,809 |
| | 13,924 |
|
VEREIT, INC. and VEREIT OPERATING PARTNERSHIP, L.P.
NOTES TO CONSOLIDATED FINANCIAL STATEMENTS
December 31, 2018 – (Continued)
Nonmonetary Exchange
During the year ended December 31, 2017, the Company completed a nonmonetary exchange through the simultaneous acquisition of 22 Bob Evans properties and disposition of 15 Red Lobster properties. Pursuant to Nonmonetary Transactions, ASC (Topic 845), the cost of a nonmonetary asset acquired in exchange for another nonmonetary asset is the fair value of the asset surrendered to obtain the acquired nonmonetary asset, and a gain or loss should be recognized on the exchange. The fair value of the asset received should be used to measure the cost if the fair value of the asset received is more reliable than $0.1the fair value of the asset surrendered. The Company estimated the fair value of the Bob Evans and Red Lobster properties using valuation techniques consistent with the income approach and concluded that the fair value was $50.1 million. As the fair value of the assets received exceeded the book value of the assets surrendered, the Company recorded a gain of $7.4 million, which is included in gain on disposition of real estate and real estate assets held for sale, net in the accompanying consolidated statements of operations.
Consolidated Joint Ventures
The Company had an interest in one consolidated joint venture that owned one property as of December 31, 2018 and 2017. As of December 31, 2018 and 2017, the consolidated joint venture had total assets of $32.5 million and $33.7 million, of which $29.9 million and $30.7 million, respectively, were real estate investments, net of accumulated depreciation and amortization. The property was secured by a mortgage note payable, which was non-recourse to the Company and had a balance of $14.0 million and $14.9 million, as of December 31, 2018 and 2017, respectively. The Company has the ability to control operating and financing policies of the consolidated joint venture. There are restrictions on the use of these assets as the Company would generally be required to obtain the approval of the joint venture partner in accordance with the joint venture agreement for any major transactions. The Company and the joint venture partner are subject to the provisions of the joint venture agreement, which includes provisions for when additional contributions may be required to fund certain cash shortfalls.
Unconsolidated Joint Ventures
As of December 31, 2018, the Company held an investment in an unconsolidated joint venture that owned one property with a carrying value of $35.3 million. As of December 31, 2017, the Company held investments in two unconsolidated joint ventures that each owned one property with an aggregate carrying value of $39.5 million. During the year ended December 31, 2018, the Company disposed of one property owned by an unconsolidated joint venture as previously discussed in the “Property Dispositions and Real Estate Assets Held for Sale” section herein.
The Company had a 90% legal ownership interest in the unconsolidated joint venture at December 31, 2018 and December 31, 2017 and accounts for its investment using the equity method of accounting as the Company has the ability to exercise significant influence, but not control, over operating and financing policies of the investment. The equity method of accounting requires the investment to be initially recorded at cost and subsequently adjusted for the Company’s share of equity in earnings and distributions from the joint venture. During the year ended December 31, 2018 the Company recognized $1.2 million of net income from unconsolidated joint ventures. During the years ended December 31, 2017 and 2016 the Company recognized $3.3 million and $0.9 million of net income, respectively, from two unconsolidated joint ventures. The Company’s legal ownership interest may, at times, not equal the Company’s economic interest because of various provisions in certain joint venture agreements regarding distributions of cash flow based on capital account balances, allocations of profits and losses and payments of preferred returns.
The carrying amount of the unconsolidated joint venture was greater than the underlying equity in net assets by $4.7 million as of December 31, 2018. The carrying amount of the unconsolidated joint ventures was greater than the underlying equity in net assets by $8.6 million as of December 31, 2017. This difference relates to a purchase price allocation of goodwill and a step up in fair value of the investment assets acquired in connection with mergers. The step up in fair value was allocated to the individual investment assets and is being amortized in accordance with the Company’s depreciation policy. The Company and the unconsolidated joint venture partner are subject to the provisions of the applicable joint venture agreement, which includes provisions for when additional contributions may be required to fund certain cash shortfalls, including the Company’s share of expansion project capital expenditures.
VEREIT, INC. and VEREIT OPERATING PARTNERSHIP, L.P.
NOTES TO CONSOLIDATED FINANCIAL STATEMENTS
December 31, 2018 – (Continued)
Note 4 — Discontinued Operations
On November 13, 2017, the Company entered into a purchase and sale agreement (as amended by that certain First Amendment to the Purchase and Sale Agreement, dated as of February 1, 2018, the “Cole Capital Purchase and Sale Agreement”). On February 1, 2018, the Company completed the sale of its investment management segment, Cole Capital, under the terms of the Cole Capital Purchase and Sale Agreement. Substantially all of the Cole Capital segment’s operations were conducted through Cole Capital Advisors, Inc. (“CCA”), an Arizona corporation and a wholly owned subsidiary of the OP. The OP sold all of the issued and outstanding shares of common stock of CCA and certain of CCA’s subsidiaries to the Cole Purchaser, for approximately $120.0 million paid in cash at closing. The Company could also receive up to an aggregate of $80.0 million in Net Revenue Payments. There were no Net Revenue Payments received or earned for 2018. Substantially all of the Cole Capital segment financial results are reflected in the financial statements as discontinued operations.
The following is a summary of the assets and liabilities related to discontinued operations and real estate assets held for sale as of December 31, 2018 and 2017 (in thousands):
|
| | | | | | | | |
| | December 31, 2018 | | December 31, 2017 |
| Carrying amount of major classes of assets included in discontinued operations: | | | | |
| Cash | | $ | — |
| | $ | 2,198 |
|
Intangible assets, net (1) | | — |
| | 9,892 |
|
Other assets, net (2) | | — |
| | 6,975 |
|
Goodwill (3) | | — |
| | 124,812 |
|
| Due from Cole REITs, net | | — |
| | 1,284 |
|
Loss recognized on classification as held for sale (4) | | — |
| | (19,509 | ) |
| Assets related to discontinued operations, net | | $ | — |
| | $ | 125,652 |
|
| | | | | |
| Carrying amount of major classes of liabilities included in discontinued operations: | | | | |
| Accounts payable and accrued expenses | | $ | — |
| | $ | 14,269 |
|
| Other liabilities | | — |
| | 1,512 |
|
| Due to Cole REITs | | — |
| | 100 |
|
| Liabilities related to discontinued operations | | $ | — |
| | $ | 15,881 |
|
| |
| (1) | The intangible assets consisted of management and advisory contracts that the Company had with certain Cole REITs. Accumulated amortization was $44.1 million as of December 31, 2017. |
| |
| (2) | Includes program development costs of $3.3 million as of December 31, 2017, which were net of reserves of $7.6 million. |
| |
| (3) | The Company performed the annual goodwill test using the $120.0 million cash proceeds provided for under the Cole Capital Purchase and Sale Agreement, plus the estimated fair value of the Net Revenue Payments and determined the carrying amount exceeded the estimated fair value. As such, no goodwill impairment was recorded during the year ended December 31, 2017. |
| |
| (4) | The Company recognized a loss of $20.0 million on classification of the discontinued operations as held for sale, of which $0.5 million represented estimated costs to sell that were subsequently accrued in accounts payable and accrued expenses as of December 31, 2017. In determining the loss recognized on classification as held for sale, the Company elected to account for the future Net Revenue Payments as a gain contingency. Under this approach, the Company will not recognize any Net Revenue Payments until realized. |
VEREIT, INC. and VEREIT OPERATING PARTNERSHIP, L.P.
NOTES TO CONSOLIDATED FINANCIAL STATEMENTS
December 31, 2018 – (Continued)
The following is a summary of the financial information for discontinued operations for the years ended December 31, 2018, 2017 and 2016 (in thousands):
|
| | | | | | | | | | | | |
| | | Year Ended December 31, |
| Revenues: | | 2018 | | 2017 | | 2016 |
| Offering-related fees and reimbursements | | $ | 1,027 |
| | $ | 16,096 |
| | $ | 36,526 |
|
| Transaction service fees and reimbursements | | 334 |
| | 13,929 |
| | 12,533 |
|
| Management fees and reimbursements | | 6,452 |
| | 76,214 |
| | 68,686 |
|
| Total revenues | | $ | 7,813 |
|
| $ | 106,239 |
|
| $ | 117,745 |
|
| Operating expenses: | | | | | | |
| Cole Capital reallowed fees and commissions | | 602 |
| | 9,879 |
| | 23,174 |
|
Transaction costs (1) | | (654 | ) | | 3,802 |
| | — |
|
| General and administrative | | 4,450 |
| | 63,783 |
| | 82,558 |
|
| Amortization of intangible assets | | — |
| | 14,490 |
| | 26,148 |
|
| Goodwill and intangible asset impairments | | — |
| | — |
| | 120,931 |
|
| Total operating expenses | | 4,398 |
|
| 91,954 |
|
| 252,811 |
|
| Other income, net | | — |
| | 464 |
| | 292 |
|
| Loss on disposition and assets held for sale | | (1,815 | ) | | (20,027 | ) | | — |
|
| Income (loss) before taxes | | 1,600 |
|
| (5,278 | ) |
| (134,774 | ) |
| Benefit from (provision for) income taxes | | 2,095 |
| | (13,839 | ) | | 10,837 |
|
| Income (loss) from discontinued operations, net of income taxes | | $ | 3,695 |
|
| $ | (19,117 | ) |
| $ | (123,937 | ) |
| |
| (1) | The negative balance for the year ended December 31, 2018 is a result of estimated costs accrued in prior periods that exceeded actual expenses incurred. |
The following is a summary of cash flows related to discontinued operations for the years ended December 31, 2018, 2017 and 2016 (in thousands):
|
| | | | | | | | | | | |
| | | Year Ended December 31, |
| | | 2018 | | 2017 | 2016 |
| Cash flows related to discontinued operations: | | | | | |
| Cash flows (used in) provided by operating activities | | $ | (10,468 | ) | | $ | 33,232 |
| $ | 35,251 |
|
| Cash flows provided by investing activities | | $ | 122,915 |
| | $ | — |
| $ | — |
|
Income Taxes
Cole Capital’s business, substantially all of which was conducted through a TRS, recognized a benefit of $2.1 million for the year ended December 31, 2018, a provision of $13.8 million the year ended December 31, 2017 and a benefit of $10.8 million for the year ended December 31, 2016.
VEREIT, INC. and VEREIT OPERATING PARTNERSHIP, L.P.
NOTES TO CONSOLIDATED FINANCIAL STATEMENTS
December 31, 2018 – (Continued)
The following table presents the reconciliation of the (benefit from) provision for income taxes with the amount computed by applying the statutory federal income tax rate to loss before income taxes for the years ended December 31, 2018, 2017 and 2016 (in thousands):
|
| | | | | | | | | | | | |
| | | Year Ended December 31, |
| | | 2018 | | 2017 | | 2016 |
| Income (loss) before taxes | | $ | 1,600 |
| | $ | (5,278 | ) | | $ | (134,774 | ) |
| Less: Income from non-taxable entities | | (685 | ) | | (9,523 | ) | | (9,008 | ) |
| Income (loss) attributable to taxable subsidiaries before income taxes | | $ | 915 |
|
| $ | (14,801 | ) |
| $ | (143,782 | ) |
| | | | | | | |
| Federal provision at statutory rate | | 192 |
| | (5,180 | ) | | (50,324 | ) |
| Impairment of goodwill | | — |
| | — |
| | 42,327 |
|
| Nondeductible portion of transaction costs and loss recognized on classification as held for sale | | (719 | ) | | 8,283 |
| | — |
|
| Impact of change in federal tax rate | | — |
| | 3,481 |
| | — |
|
| Impact of valuation allowance | | (1,158 | ) | | 6,165 |
| | — |
|
| State income taxes and other | | (410 | ) | | 1,090 |
| | (2,840 | ) |
| Total (benefit from) provision for income taxes - Cole Capital | | $ | (2,095 | ) |
| $ | 13,839 |
|
| $ | (10,837 | ) |
The following table presents the components of the (benefit from) provision for income taxes for the years ended December 31, 2018, 2017 and 2016 (in thousands):
|
| | | | | | | | | | | | |
| | | Year Ended December 31, |
| | | 2018 | | 2017 | | 2016 |
| Current | | | | | | |
| Federal | | $ | (74 | ) | | $ | (120 | ) | | $ | 2,244 |
|
| State | | (166 | ) | | 602 |
| | (2,762 | ) |
| Total current (benefit from) provision for income taxes | | (240 | ) |
| 482 |
|
| (518 | ) |
| Deferred | | | | | | |
| Federal | | (1,756 | ) | | 12,016 |
| | (9,021 | ) |
| State | | (99 | ) | | 1,341 |
| | (1,298 | ) |
| Total deferred (benefit from) provision for income taxes | | (1,855 | ) |
| 13,357 |
| | (10,319 | ) |
| Total (benefit from) provision for income taxes - Cole Capital | | $ | (2,095 | ) |
| $ | 13,839 |
|
| $ | (10,837 | ) |
VEREIT, INC. and VEREIT OPERATING PARTNERSHIP, L.P.
NOTES TO CONSOLIDATED FINANCIAL STATEMENTS
December 31, 2018 – (Continued)
Note 5 – Rent and Tenant Receivables and Other Assets, Net
Rent and tenant receivables and other assets, net consisted of the following as of December 31, 2018 and 2017 (in thousands):
|
| | | | | | | | |
| | | December 31, 2018 | | December 31, 2017 |
| | | | | |
Straight-line rent receivable, net (1) | | $ | 259,106 |
| | $ | 230,529 |
|
Accounts receivable, net (2) | | 36,939 |
| | 36,921 |
|
Deferred costs, net (3) | | 17,515 |
| | 5,746 |
|
| Investment in direct financing leases, net | | 13,254 |
| | 19,539 |
|
Mortgage notes receivable, net (4) | | 10,164 |
| | 20,294 |
|
Leasehold improvements, property and equipment, net (5) | | 9,754 |
| | 12,089 |
|
| Investment in Cole REITs | | 7,844 |
| | 3,264 |
|
| Prepaid expenses | | 5,022 |
| | 6,493 |
|
| Other assets, net | | 3,594 |
| | 5,003 |
|
| Income tax receivable | | 1,760 |
| | 3,213 |
|
| Restricted escrow deposits | | 1,140 |
| | 4,995 |
|
Investment securities, at fair value(6) | | — |
| | 40,974 |
|
| Total | | $ | 366,092 |
|
| $ | 389,060 |
|
| |
| (1) | Allowance for uncollectible accounts included in straight-line rent receivable, net was $1.0 million and $2.0 million as of December 31, 2018 and 2017, respectively. As of December 31, 2018, the allowance related to suspended revenue recognition was $0.1 million. As of December 31, 2017, there was no allowance related to suspended revenue recognition. |
| |
| (2) | In the event that the collectability of a receivable is uncertain, the Company will record an increase in the allowance for uncollectible accounts in the consolidated balance sheets and bad debt expense in property operating expenses in the consolidated statements of operations. Allowance for uncollectible accounts was $5.3 million and $6.3 million as of December 31, 2018 and 2017, respectively. The Company suspends revenue recognition when the collectability of amounts due pursuant to a lease is no longer reasonably assured. As of December 31, 2018 and 2017, the allowance related to suspended revenue recognition was $9.1 million and $12.6 million, respectively. |
| |
| (3) | Amortization expense for deferred costs related to the revolving credit facilities totaled $7.3 million for the year ended December 31, 2018 and $10.4 million for each of the years ended December 31, 2017 and 2016. Accumulated amortization for deferred costs related to the Revolving Credit Facility, as defined in Note 7 –Debt, was $47.6 million and $40.3 million as of December 31, 2018 and 2017, respectively. |
| |
| (4) | As of December 31, 2018, the Company owned five mortgage notes receivable with a weighted-average interest rate of 6.4% and weighted-average years to maturity of 12.1 years. During the year ended December 31, 2018, the Company sold three mortgage notes receivable with an aggregate carrying value of $8.8 million at December 31, 2017, resulting in a net gain of $1.7 million, which is included in other income, net in the accompanying consolidated statements of operations. |
| |
| (5) | Amortization expense for leasehold improvements totaled $1.2 million for each of the years ended December 31, 2018 and 2017, with no related write-offs. Amortization expense for leasehold improvements totaled $2.3 million for the year ended December 31, 2016, inclusive of write-offs of $1.0 million. Accumulated amortization was $5.9 million and $4.7 million as of December 31, 2018 and 2017, respectively. Depreciation expense for property and equipment totaled $2.3 million, $1.8 million and $3.4 million for the years ended December 31, 2018, 2017 and 2016, respectively, inclusive of write-offs of $0.8 million, $0.6 million and $1.2 million for the years ended December 31, 2018, 2017 and 2016, respectively. Accumulated depreciation was $7.0 million and $5.7 million as of December 31, 2018 and 2017, respectively. |
| |
| (6) | During the year ended December 31, 2018, two commercial mortgage-backed securities (“CMBS”) were repaid and six CMBS were sold for an aggregate gross sales price of $36.0 million for a net realized loss of $2.2 million, which is included in other income, net in the accompanying consolidated statements of operations. |
Note 6 – Fair Value Measures
The Company determines fair value based on quoted prices when available or through the use of alternative approaches, such as discounting the expected cash flows using market interest rates commensurate with the credit quality and duration of the investment. U.S. GAAP guidance defines three levels of inputs that may be used to measure fair value:
Level 1 – Quoted prices in active markets for identical assets and liabilities that the reporting entity has the ability to access at the measurement date.
Level 2 – Inputs other than quoted prices included within Level 1 that are observable for the asset and liability or can be corroborated with observable market data for substantially the entire contractual term of the asset or liability.
Level 3 – Unobservable inputs reflect the entity’s own assumptions about the assumptions that market participants would use in the pricing of the asset or liability and are consequently not based on market activity, but rather through particular valuation techniques.
VEREIT, INC. and VEREIT OPERATING PARTNERSHIP, L.P.
NOTES TO CONSOLIDATED FINANCIAL STATEMENTS
December 31, 2018 – (Continued)
The determination of where an asset or liability falls in the hierarchy requires significant judgment and considers factors specific to the asset or liability. In instances where the determination of the fair value measurement is based on inputs from different levels of the fair value hierarchy, the level in the fair value hierarchy within which the entire fair value measurement falls is based on the lowest level input that is significant to the fair value measurement in its entirety. The Company evaluates its hierarchy disclosures each quarter and depending on various factors, it is possible that an asset or liability may be classified differently from quarter to quarter. Changes in the type of inputs may result in a reclassification for certain assets. The Company does not expect that changes in classifications between levels will be frequent.
Items Measured at Fair Value on a Recurring Basis
The following tables present information about the Company’s assets and liabilities measured at fair value on a recurring basis as of December 31, 2018 and 2017, aggregated by the level in the fair value hierarchy within which those instruments fall (in thousands):
|
| | | | | | | | | | | | | | | | |
|
| Level 1 |
| Level 2 |
| Level 3 |
| Balance as of December 31, 2018 |
| Assets: |
|
|
|
|
|
|
|
|
| Derivative assets |
| $ | — |
| | $ | 544 |
| | $ | — |
|
| $ | 544 |
|
| Investment in Cole REITs | | — |
| | — |
| | 7,844 |
| | 7,844 |
|
| Total assets | | $ | — |
| | $ | 544 |
| | $ | 7,844 |
| | $ | 8,388 |
|
|
|
| Level 1 |
| Level 2 |
| Level 3 |
| Balance as of December 31, 2017 |
| Assets: | | | | | | | | |
| CMBS | | $ | — |
| | $ | — |
| | $ | 40,974 |
| | $ | 40,974 |
|
| Derivative assets | | — |
| | 627 |
| | — |
| | 627 |
|
| Total assets | | $ | — |
| | $ | 627 |
| | $ | 40,974 |
| | $ | 41,601 |
|
CMBS – The Company’s CMBS were carried at fair value and were valued using Level 3 inputs. The Company used estimated non-binding quoted market prices from the trading desks of financial institutions that are dealers in such securities for similar CMBS tranches that actively participate in the CMBS market. Broker quotes are only indicative of fair value and may not necessarily represent what the Company would receive in an actual trade for the applicable instrument. Management determined that the prices were representative of fair value through its knowledge and experience in the market. The significant unobservable input used in valuing the CMBS was the discount rate or market yield used to discount the estimated future cash flows expected to be received from the underlying investment, which include both future principal and interest payments. Significant increases or decreases in the discount rate or market yield would result in a decrease or increase in the fair value measurement. The following risks were included in the consideration and selection of discount rates or market yields: risk of default, rating of the investment and comparable company investments.
Derivative Assets and Liabilities –The Company’s derivative financial instruments relate to interest rate swaps. The valuation of derivative instruments is determined using a discounted cash flow analysis on the expected cash flows of each derivative. This analysis reflects the contractual terms of the derivatives, including the period to maturity, as well as observable market-based inputs, including interest rate curves and implied volatilities. In addition, credit valuation adjustments are incorporated into the fair values to account for the Company’s potential nonperformance risk and the performance risk of the counterparties.
Although the Company determined that the majority of the inputs used to value its derivatives fall within Level 2 of the fair value hierarchy, the credit valuation adjustments associated with those derivatives utilize Level 3 inputs, such as estimates of current credit spreads to evaluate the likelihood of default by the Company and its counterparties. However, as of December 31, 2018 and 2017, the Company assessed the significance of the impact of the credit valuation adjustments on the overall valuation of its derivative positions and determined that the credit valuation adjustments are not significant to the overall valuation of the Company’s derivatives. As a result, the Company determined that its derivative valuations in their entirety are classified in Level 2 of the fair value hierarchy.
VEREIT, INC. and VEREIT OPERATING PARTNERSHIP, L.P.
NOTES TO CONSOLIDATED FINANCIAL STATEMENTS
December 31, 2018 – (Continued)
Investment in Cole REITs –The fair values of CCIT II and CCPT V were estimated using the net asset value per share. The Company determined that the CCIT III per share primary offering price net of selling commissions and dealer manager fees approximated fair value. Each of the Cole REIT’s share redemption programs includes restrictions that limit the number of shares redeemed by the respective Cole REIT. CCIT II has estimated that it will commence a liquidity event over the next three to five years. CCPT V has estimated that it will commence a liquidity event over the next three to six years following the termination of its initial public offering. CCIT III has estimated that it will commence a liquidity event five to seven years following the termination of its initial public offering. Subsequent to December 31, 2018, CCIT III terminated its primary offering, however it continues to issue shares pursuant to its distribution reinvestment plan.
The following are reconciliations of the changes in assets and liabilities with Level 3 inputs in the fair value hierarchy for the year ended December 31, 2018 (in thousands):
|
| | | | | | | | |
| | | CMBS | | Investment in Cole REITs (1) |
| Beginning balance, January 1, 2018 | | $ | 40,974 |
| | $ | 3,264 |
|
| Total gains and losses | | | | |
| Unrealized loss included in other comprehensive income, net | | (205 | ) | | — |
|
| Realized loss included in other income, net | | (34 | ) | | — |
|
| Unrealized gain included in other income, net | | — |
| | 5,102 |
|
| Purchases, issuance, settlements | | | | |
| Return of principal received | | (4,864 | ) | | — |
|
| Amortization included in net income, net | | 157 |
| | — |
|
| Sale of investments | | (36,028 | ) | | (522 | ) |
| Ending Balance, December 31, 2018 | | $ | — |
| | $ | 7,844 |
|
| |
| (1) | As discussed in Note 2 – Summary of Significant Accounting Policies, as of December 31, 2017, the Company accounted for its investment in Cole REITs using the equity method of accounting. Subsequent to the sale of Cole Capital, the Company retained interests in CCIT II, CCIT III and CCPT V, which were carried at fair value as of December 31, 2018. |
The following are reconciliations of the changes in assets and liabilities with Level 3 inputs in the fair value hierarchy for the year ended December 31, 2017 (in thousands):
|
| | | | |
| | | CMBS |
| Beginning balance, January 1, 2017 | | $ | 47,215 |
|
| Total gains and losses | | |
| Unrealized loss included in other comprehensive income, net | | (951 | ) |
| Purchases, issuance, settlements | | |
| Return of principal received | | (4,388 | ) |
| Amortization included in net income, net | | (902 | ) |
| Ending Balance, December 31, 2017 | | $ | 40,974 |
|
VEREIT, INC. and VEREIT OPERATING PARTNERSHIP, L.P.
NOTES TO CONSOLIDATED FINANCIAL STATEMENTS
December 31, 2018 – (Continued)
Items Measured at Fair Value on a Non-Recurring Basis
Certain financial and nonfinancial assets and liabilities are measured at fair value on a non-recurring basis and are subject to fair value adjustments in certain circumstances, such as when there is evidence of impairment.
Real Estate Investments –The Company performs quarterly impairment review procedures, primarily through continuous monitoring of events and changes in circumstances that could indicate the carrying value of its real estate assets may not be recoverable.
As part of the Company’s quarterly impairment review procedures, net real estate assets representing 70 properties were deemed to be impaired and their carrying values totaling $134.0 million were reduced to their estimated fair value of $79.4 million, resulting in impairment charges of $54.6 million during the year ended December 31, 2018. The impairment charges relate to certain office, retail and restaurant properties that, during 2018, management identified for potential sale or determined, based on discussions with the current tenants, would not be re-leased.
During the year ended December 31, 2017, net real estate assets related to 69 properties, with carrying values totaling $161.9 million, were deemed to be impaired and their carrying values were reduced to their estimated fair values of $111.4 million, resulting in impairment charges of $50.5 million. The majority of the impairment charges relate to certain office, restaurant and other properties that, during 2017, management identified for potential sale or determined, based on discussions with the current tenants, would not be re-leased.
During the year ended December 31, 2016 net real estate assets related to 153 properties, with carrying values totaling $668.2 million, were deemed to be impaired and their carrying values were reduced to their estimated fair values of $485.4 million, resulting in impairment charges of $182.8 million. A majority of the impairment charges related to properties identified by management for potential sale as part of its portfolio management strategy to reduce exposure to office properties. Additionally, a tenant of 59 restaurants filed for bankruptcy.
The Company estimates fair values using Level 3 inputs and uses a combined income and market approach, specifically using discounted cash flow analysis and recent comparable sales transactions. The evaluation of real estate assets for potential impairment requires the Company’s management to exercise significant judgment and make certain key assumptions, including, but not limited to, the following: (1) capitalization rate; (2) discount rates; (3) number of years property will be held; (4) property operating expenses; and (5) re-leasing assumptions including number of months to re-lease, market rental revenue and required tenant improvements. There are inherent uncertainties in making these estimates such as market conditions and performance and sustainability of the Company’s tenants. For the Company’s impairment tests for the real estate assets during the year ended December 31, 2018, the Company used a range of discount rates from 7.4% to 8.5% with a weighted-average rate of 7.9% and capitalization rates from 6.9% to 8.5% with a weighted-average rate of 7.8%.
The following table presents the impairment charges by asset class recorded during the years ended December 31, 2018, 2017 and 2016 (dollar amounts in thousands):
|
| | | | | | | | | | | | |
| | | Year Ended December 31, |
| | | 2018 | | 2017 | | 2016 |
| Properties impaired | | 70 |
| | 69 |
| | 153 |
|
| | | | | | | |
| Asset classes impaired: | | | | | | |
| Investment in real estate assets, net | | $ | 53,562 |
| | $ | 50,087 |
| | $ | 183,240 |
|
| Investment in direct financing leases, net | | 1,381 |
| | 553 |
| | — |
|
| Below-market lease liabilities, net | | (296 | ) | | (92 | ) | | (421 | ) |
| Total impairment loss | | $ | 54,647 |
| | $ | 50,548 |
| | $ | 182,819 |
|
VEREIT, INC. and VEREIT OPERATING PARTNERSHIP, L.P.
NOTES TO CONSOLIDATED FINANCIAL STATEMENTS
December 31, 2018 – (Continued)
Fair Value of Financial Instruments
The fair value of short-term financial instruments such as cash and cash equivalents, restricted cash, due to affiliates and accounts payable approximate their carrying value in the accompanying consolidated balance sheets due to their short-term nature and are classified as Level 1 under the fair value hierarchy. The fair values of the Company’s financial instruments are reported below (dollar amounts in thousands):
|
| | | | | | | | | | | | | | | | | | |
| | | Level | | Carrying Amount at December 31, 2018 | | Fair Value at December 31, 2018 | | Carrying Amount at December 31, 2017 | | Fair Value at December 31, 2017 |
| Assets: | | | | | | | | | | |
| Mortgage notes receivable, net | | 1, 3 | | $ | 10,164 |
| | $ | 10,164 |
| | $ | 20,294 |
| | $ | 28,272 |
|
| | | | | | | | | | | |
Liabilities (1): | | | | | | | | | | |
| Mortgage notes payable and other debt, net | | 2 | | $ | 1,933,209 |
| | $ | 1,961,496 |
| | $ | 2,095,690 |
| | $ | 2,144,522 |
|
| Corporate bonds, net | | 2 | | 3,395,885 |
| | 3,368,928 |
| | 2,848,768 |
| | 2,922,027 |
|
| Convertible debt, net | | 2 | | 398,591 |
| | 396,905 |
| | 992,218 |
| | 1,012,349 |
|
| Credit facility | | 2 | | 403,000 |
| | 403,000 |
| | 185,000 |
| | 185,000 |
|
| Total liabilities | | | | $ | 6,130,685 |
| | $ | 6,130,329 |
| | $ | 6,121,676 |
| | $ | 6,263,898 |
|
| |
| (1) | Current and prior period liabilities’ carrying and fair values exclude net deferred financing costs. |
Mortgage notes receivable, net –The fair value of the Company’s mortgage notes receivable at December 31, 2017 were valued using Level 3 inputs, which were estimated with a discounted cash flow analysis, utilizing scheduled cash flows and discount rates estimated by management to approximate market interest rates.
As discussed in Note 16 – Subsequent Events, the Company sold four of the remaining five mortgage notes receivable subsequent to December 31, 2018. In connection with the Company’s decision to sell and classify them as held for sale, the fair value of the Company’s mortgage notes receivable at December 31, 2018 were estimated using signed purchase and sale agreements for the four sold subsequent to December 31, 2018 and for the one remaining mortgage note receivable, the fair value was estimated using bids obtained by third-party valuation services that utilize observable market inputs. This resulted in transfers from Level 3 to Level 1.
Debt – The fair value is estimated by an independent third party using a discounted cash flow analysis, based on management’s estimates of observable market interest rates. Corporate bonds and convertible debt are valued using quoted market prices in active markets with limited trading volume when available.
VEREIT, INC. and VEREIT OPERATING PARTNERSHIP, L.P.
NOTES TO CONSOLIDATED FINANCIAL STATEMENTS
December 31, 2018 – (Continued)
Note 7 – Debt
As of December 31, 2018, the Company had $6.1 billion of debt outstanding, including net premiums and net deferred financing costs, with a weighted-average years to maturity of 4.2 years and a weighted-average interest rate of 4.3%. The following table summarizes the carrying value of debt as of December 31, 2018 and 2017, and the debt activity for the year ended December 31, 2018 (in thousands):
|
| | | | | | | | | | | | | | | | | | | | | |
| | | | | | Year Ended December 31, 2018 | | |
| | | | Balance as of December 31, 2017 | | Debt Issuances | | Repayments, Extinguishment and Assumptions | | Accretion and Amortization | | Balance as of December 31, 2018 |
| Mortgage notes payable: | | | | | | | | | | |
| | Outstanding balance | | $ | 2,071,038 |
| | $ | 187 |
| | $ | (154,093 | ) |
| $ | — |
| | $ | 1,917,132 |
|
| | Net premiums (1) | | 24,652 |
| | — |
| | (191 | ) | | (8,384 | ) | | 16,077 |
|
| | Deferred costs | | (12,998 | ) | | (43 | ) | | 30 |
| | 2,459 |
| | (10,552 | ) |
| Mortgages notes payable, net | | 2,082,692 |
|
| 144 |
|
| (154,254 | ) |
| (5,925 | ) |
| 1,922,657 |
|
| Corporate bonds: | | | | | | | | | |
|
|
| | Outstanding balance | | 2,850,000 |
| | 550,000 |
| | — |
| | — |
| | 3,400,000 |
|
| | Discount (2) | | (1,232 | ) | | (3,696 | ) | | — |
| | 813 |
| | (4,115 | ) |
| | Deferred costs | | (27,274 | ) | | (4,825 | ) | | — |
| | 4,823 |
| | (27,276 | ) |
| Corporate bonds, net | | 2,821,494 |
|
| 541,479 |
|
| — |
|
| 5,636 |
|
| 3,368,609 |
|
| Convertible debt: | | | | | | | | | |
|
|
| | Outstanding balance | | 1,000,000 |
| | — |
| | (597,500 | ) | | — |
| | 402,500 |
|
| | Discount (2) | | (7,782 | ) | | — |
| | — |
| | 3,873 |
| | (3,909 | ) |
| | Deferred costs | | (7,960 | ) | | — |
| | — |
| | 4,252 |
| | (3,708 | ) |
| Convertible debt, net | | 984,258 |
|
| — |
|
| (597,500 | ) |
| 8,125 |
|
| 394,883 |
|
| | | | | | | | | | | | |
| Credit facility: | | | | | | | | | |
|
|
| | Outstanding balance | | 185,000 |
| | 1,934,000 |
| | (1,716,000 | ) | | — |
| | 403,000 |
|
| | Deferred costs (3) | | — |
| | (1,236 | ) | | — |
| | 9 |
| | (1,227 | ) |
| Credit facility, net | | 185,000 |
|
| 1,932,764 |
|
| (1,716,000 | ) |
| 9 |
|
| 401,773 |
|
| | | | | | | | | | | |
|
|
| Total debt | | $ | 6,073,444 |
|
| $ | 2,474,387 |
|
| $ | (2,467,754 | ) |
| $ | 7,845 |
|
| $ | 6,087,922 |
|
| |
| (1) | Net premiums on mortgage notes payable were recorded upon the assumption of the respective mortgage notes in relation to the various mergers and acquisitions. Amortization of these net premiums is recorded as a reduction to interest expense over the remaining term of the respective mortgage notes using the effective-interest method. |
| |
| (2) | Discounts on the corporate bonds and convertible debt were recorded based upon the fair value of the respective debt instruments as of the respective issuance dates. Amortization of these discounts is recorded as an increase to interest expense over the remaining term of the respective debt instruments using the effective-interest method. |
| |
| (3) | Deferred costs relate to the Credit Facility Term Loan. |
VEREIT, INC. and VEREIT OPERATING PARTNERSHIP, L.P.
NOTES TO CONSOLIDATED FINANCIAL STATEMENTS
December 31, 2018 – (Continued)
Mortgage Notes Payable
The Company’s mortgage notes payable consisted of the following as of December 31, 2018 (dollar amounts in thousands):
|
| | | | | | | | | | | | | | | | |
| | | Encumbered Properties | | Gross Carrying Value of Collateralized Properties (1) | | Outstanding Balance | | Weighted-Average Interest Rate (2) | | Weighted-Average Years to Maturity (3) |
Fixed-rate debt (4) | | 458 |
| | $ | 3,760,194 |
| | $ | 1,903,095 |
| | 4.92 | % | | 3.5 |
| Variable-rate debt | | 1 |
| | 33,384 |
| | 14,037 |
| | 5.72 | % | (5) | 0.6 |
| Total | | 459 |
| | $ | 3,793,578 |
| | $ | 1,917,132 |
| | 4.93 | % | | 3.4 |
| |
| (1) | Gross carrying value is gross real estate assets, including investment in direct financing leases, net of gross real estate liabilities. |
| |
| (2) | Weighted average interest rate is computed using the interest rate in effect until the anticipated repayment date. Should the loan not be repaid at the anticipated repayment date, the applicable interest rate will increase as specified in the respective loan agreement until the extended maturity date. |
| |
| (3) | Weighted average years remaining to maturity is computed using the anticipated repayment date as specified in each loan agreement, where applicable. |
| |
| (4) | Includes $50.7 million of variable-rate debt fixed by way of interest rate swap arrangements. |
| |
| (5) | Weighted-average interest rate for variable-rate debt represents the interest rate in effect as of December 31, 2018. |
The Company’s mortgage loan agreements generally restrict corporate guarantees and require the maintenance of financial covenants, including maintenance of certain financial ratios (such as debt service coverage ratios and minimum net operating income). The mortgage loan agreements contain no dividend restrictions except in the event of default or when a distribution would drive liquidity below the applicable thresholds. At December 31, 2018, the Company believes that it was in compliance with the financial covenants under the mortgage loan agreements and had no restrictions on the payment of dividends.
On April 12, 2018, the Company entered into a deed-in-lieu of foreclosure agreement with the lender of a mortgage loan, secured by one property, with an outstanding balance of $16.2 million at the time of default and conveyed all interest in the property to satisfy the mortgage loan. As a result of the deed-in-lieu of foreclosure transaction, the Company recognized a gain on forgiveness of debt of $5.2 million, which is included in gain (loss) on extinguishment and forgiveness of debt, net in the accompanying consolidated statements of operations.
During the year ended December 31, 2017, the Company entered into deed-in-lieu of foreclosure agreements or completed the foreclosure with the lenders of three mortgage loans, secured by six properties, which resulted in a gain on forgiveness of debt of $20.5 million.
The following table summarizes the scheduled aggregate principal repayments due on mortgage notes subsequent to December 31, 2018 (in thousands):
|
| | | | |
| | | Total |
| 2019 | | $ | 167,279 |
|
| 2020 | | 265,189 |
|
| 2021 | | 352,768 |
|
| 2022 | | 314,898 |
|
| 2023 | | 144,843 |
|
| Thereafter | | 672,155 |
|
| Total | | $ | 1,917,132 |
|
VEREIT, INC. and VEREIT OPERATING PARTNERSHIP, L.P.
NOTES TO CONSOLIDATED FINANCIAL STATEMENTS
December 31, 2018 – (Continued)
Corporate Bonds
As of December 31, 2018, the OP had $3.40 billion aggregate principal amount of senior unsecured notes (the “Senior Notes”) outstanding comprised of the following (dollar amounts in thousands):
|
| | | | | | | | | |
| | | Outstanding Balance December 31, 2018 | | Interest Rate | | Maturity Date |
| 2019 Senior Notes | | $ | 750,000 |
| | 3.000 | % | | February 6, 2019 |
| 2021 Senior Notes | | 400,000 |
| | 4.125 | % | | June 1, 2021 |
| 2024 Senior Notes | | 500,000 |
| | 4.600 | % | | February 6, 2024 |
| 2025 Senior Notes | | 550,000 |
| | 4.625 | % | | November 1, 2025 |
| 2026 Senior Notes | | 600,000 |
| | 4.875 | % | | June 1, 2026 |
| 2027 Senior Notes | | 600,000 |
| | 3.950 | % | | August 15, 2027 |
| Total balance and weighted-average interest rate | | $ | 3,400,000 |
| | 4.129 | % | | |
On October 16, 2018, the Company closed a senior note offering, consisting of $550.0 million aggregate principal amount of the Operating Partnership’s 4.625% Senior Notes due 2025 (the “2025 Senior Notes”).
The Senior Notes are guaranteed by the General Partner. The OP may redeem all or a part of any series of the Senior Notes at any time, at its option, for the redemption prices set forth in the indenture governing the Senior Notes. If the redemption date is 30 or fewer days prior to the maturity date with respect to the 2019 Senior Notes and the 2021 Senior Notes, is 60 or fewer days prior to the maturity date with respect to the 2025 Senior Notes or is 90 or fewer days prior to the maturity date with respect to the 2024 Senior Notes, the 2026 Senior Notes and the 2027 Senior Notes, the redemption price will equal 100% of the principal amount of the Senior Notes of the applicable series to be redeemed, plus accrued and unpaid interest on the amount being redeemed to, but excluding, the applicable redemption date. The Senior Notes are registered under the Securities Act of 1933, as amended and are freely transferable.
The indenture governing our Senior Notes requires us to maintain financial ratios which include maintaining (i) a maximum limitation on incurrence of total debt less than or equal to 65% of Total Assets (as defined in the indenture), (ii) maximum limitation on incurrence of secured debt less than or equal to 40% of Total Assets (as defined in the indenture), (iii) a minimum debt service coverage ratio of at least 1.5x and (iv) a minimum unencumbered asset value of at least 150% of the aggregate principal amount of all of the outstanding Unsecured Debt (as defined in the indenture). As of December 31, 2018, the Company believes that it was in compliance with the financial covenants of our Senior Notes based on the covenant limits and calculations in place at that time.
Convertible Debt
During the year ended December 31, 2018, the Company’s convertible senior notes due August 1, 2018 (the “2018 Convertible Notes”) matured and the principal outstanding of $597.5 million, plus accrued and unpaid interest thereon, was repaid. The interest rate on the 2018 Convertible Notes was 3.00% annually.
As of December 31, 2018, the Company had convertible senior notes due December 15, 2020 (the “2020 Convertible Notes”) with a balance of $402.5 million outstanding, which excludes the carrying value of the conversion options recorded within additional paid-in capital of $12.8 million and the unamortized discount of $3.9 million. The discount will be amortized over the remaining term of 2.0 years. The 2020 Convertible Notes bear interest at an annual rate of 3.75%.
The 2020 Convertible Notes may be converted into cash, shares of the Company’s Common Stock or a combination thereof, in limited circumstances prior to June 15, 2020, and may be converted into such consideration at any time on or after June 15, 2020. As of December 31, 2018, the conversion rate was 66.7249 shares of the Company’s Common Stock per $1,000 principal amount of 2020 Convertible Notes, which reflects adjustments to the initial conversion rate pursuant to the terms of the applicable indenture as a result of cash dividend payments. There were no changes to the terms of the 2020 Convertible Notes during the year ended December 31, 2018 and the Company believes that it was in compliance with the financial covenants pursuant to the indenture governing the 2020 Convertible Notes as of December 31, 2018.
VEREIT, INC. and VEREIT OPERATING PARTNERSHIP, L.P.
NOTES TO CONSOLIDATED FINANCIAL STATEMENTS
December 31, 2018 – (Continued)
Credit Facility
On May 23, 2018, the General Partner, as guarantor, and the OP, as borrower, entered into a credit agreement with Wells Fargo Bank, National Association as administrative agent and other lenders party thereto (the “Credit Agreement”). The Credit Agreement provides for a $2.0 billion unsecured revolving credit facility (the “Revolving Credit Facility”) and a $900.0 million unsecured term loan facility (the “Credit Facility Term Loan,” together with the Revolving Credit Facility, the “Credit Facility”), which is available through February 23, 2019, for up to four borrowings of delayed-draw term loans. In connection with entering into the Credit Agreement, the OP repaid all of the outstanding obligations under the amended and restated credit agreement dated as of June 30, 2014 (as amended, the “2014 Credit Agreement”) and the 2014 Credit Agreement was terminated. The 2014 Credit Agreement provided for a $2.3 billion revolving credit facility and was scheduled to terminate on June 30, 2018.
As of December 31, 2018, the outstanding balance under the Revolving Credit Facility was $253.0 million. As of December 31, 2018, $150.0 million had been drawn on the Credit Facility Term Loan. The maximum aggregate dollar amount of letters of credit that may be outstanding at any one time under the Credit Facility is $50.0 million.
The Revolving Credit Facility generally bears interest at an annual rate of London Inter-Bank Offer Rate (“LIBOR”) plus 0.775% to 1.55% or Base Rate plus 0.00% to 0.55% (based upon the General Partner’s then current credit rating). “Base Rate” is defined as the highest of the prime rate, the federal funds rate plus 0.50% or a floating rate based on one month LIBOR plus 1.0%, determined on a daily basis. The Credit Facility Term Loan generally bears interest at an annual rate of LIBOR plus 0.85% to 1.75%, or Base Rate plus 0.00% to 0.75% (based upon the General Partner’s then current credit rating). In addition, the Credit Agreement provides the flexibility for interest rate auctions, pursuant to which, at the Company’s election, the Company may request that lenders make competitive bids to provide revolving loans, which competitive bids may be at pricing levels that differ from the foregoing interest rates.
In the event of default, at the election of a majority of the lenders (or automatically upon a bankruptcy event of default with respect to the OP or the General Partner), the commitments of the lenders under the Credit Facility will terminate, and payment of any unpaid amounts in respect of the Credit Facility will be accelerated. The Revolving Credit Facility terminates on May 23, 2022, unless extended in accordance with the terms of the Credit Agreement. The Credit Agreement provides for two six-month extension options with respect to the Revolving Credit Facility, exercisable at the OP’s election and subject to certain customary conditions, as well as certain customary “amend and extend” provisions. Any term loans outstanding under the Credit Facility Term Loan mature on May 23, 2023. At any time, upon timely notice by the OP and subject to any breakage fees, the OP may prepay borrowings under the Credit Facility (subject to certain limitations applicable to the prepayment of any loans obtained through an interest rate auction, as described above). The OP incurs a facility fee equal to 0.10% to 0.30% per annum (based upon the General Partner’s then current credit rating) multiplied by the commitments (whether or not utilized) in respect of the Revolving Credit Facility. In addition, the OP incurs a ticking fee equal to 0.25% multiplied by unused commitments in respect of the Credit Facility Term Loan. The OP also incurs customary administrative agent, letter of credit issuance, letter of credit fronting, extension and other fees.
The Credit Facility requires restrictions on corporate guarantees, as well as the maintenance of financial covenants, including the maintenance of certain financial ratios (such as specified debt to equity and debt service coverage ratios). The key financial covenants in the Credit Facility, as defined and calculated per the terms of the Credit Agreement, include maintaining (i) a maximum leverage ratio less than or equal to 60%, (ii) a minimum fixed charge coverage ratio of at least 1.5x, (iii) a secured leverage ratio less than or equal to 45%, (iv) a total unencumbered asset value ratio less than or equal to 60% and (v) a minimum unencumbered interest coverage ratio of at least 1.75x. The Company believes that it was in compliance with the financial covenants pursuant to the Credit Agreement and is not restricted from accessing any borrowing availability under the Credit Facility as of December 31, 2018.
In connection with entering into the Credit Agreement, the Company capitalized an aggregate $20.7 million in lender fees and third-party costs in respect of the Revolving Credit Facility and the Credit Facility Term Loan, which will be amortized over the respective terms. Deferred financing costs, net of accumulated amortization, related to the Revolving Credit Facility are included in rent and other tenant receivables and other assets, net in the accompanying consolidated balance sheets. Deferred financing costs, net of accumulated amortization, related to the Credit Facility Term Loan outstanding balance are included in credit facility, net in the accompanying consolidated balance sheets.
VEREIT, INC. and VEREIT OPERATING PARTNERSHIP, L.P.
NOTES TO CONSOLIDATED FINANCIAL STATEMENTS
December 31, 2018 – (Continued)
Note 8 – Supplemental Cash Flow Disclosures
Supplemental cash flow information was as follows for the years ended December 31, 2018, 2017 and 2016 (in thousands):
|
| | | | | | | | | | | | |
| | | Year Ended December 31, |
| | | 2018 | | 2017 | | 2016 |
| Supplemental disclosures: | | | | | | |
| Cash paid for interest | | $ | 267,400 |
| | $ | 260,951 |
| | $ | 317,170 |
|
| Cash paid for income taxes | | $ | 5,589 |
| | $ | 11,280 |
| | $ | 20,279 |
|
| Cash received from federal income tax refund | | $ | 2,939 |
| | $ | 16,686 |
| | $ | — |
|
| Non-cash investing and financing activities: | | | | | | |
| Accrued capital expenditures, tenant improvements and real estate developments | | $ | 12,648 |
| | $ | 6,578 |
| | $ | 7,701 |
|
| Accrued deferred financing costs | | $ | 67 |
| | $ | — |
| | $ | 3 |
|
| Distributions declared and unpaid | | $ | 148,383 |
| | $ | 149,768 |
| | $ | 149,281 |
|
| Accrued equity issuance costs | | $ | — |
| | $ | — |
| | $ | 9 |
|
| Mortgage note payable relieved by foreclosure or a deed-in-lieu of foreclosure | | $ | 16,200 |
| | $ | 100,388 |
| | $ | 38,050 |
|
| Mortgage notes payable assumed in real estate disposition | | $ | — |
| | $ | 66,000 |
| | $ | 55,000 |
|
| Real estate investments received from a ground lease expiration and other lease related transactions | | $ | 1,386 |
| | $ | 259 |
| | $ | — |
|
| Real estate investments received from a property-related legal settlement | | $ | — |
| | $ | 775 |
| | $ | — |
|
| Nonmonetary exchanges: | | | | | | |
| Real estate investments received | | $ | — |
| | $ | 50,204 |
| | $ | — |
|
| Real estate investments relinquished and gain on disposition | | $ | — |
| | $ | (47,474 | ) | | $ | — |
|
| Rent and tenant receivables, intangible lease liability and other assets, net | | $ | — |
| | $ | (2,511 | ) | | $ | — |
|
Note 9 – Accounts Payable and Accrued Expenses
Accounts payable and accrued expenses consisted of the following as of December 31, 2018 and 2017 (in thousands):
|
| | | | | | | | |
| | | December 31, 2018 | | December 31, 2017 |
| Accrued interest | | $ | 43,916 |
| | $ | 47,116 |
|
| Accrued real estate taxes | | 25,208 |
| | 26,131 |
|
| Accrued legal fees | | 32,715 |
| | 30,854 |
|
| Accounts payable | | 2,673 |
| | 2,570 |
|
| Accrued other | | 41,099 |
| | 29,803 |
|
| Total | | $ | 145,611 |
| | $ | 136,474 |
|
Note 10 – Commitments and Contingencies
Litigation
The Company is involved in various routine legal proceedings and claims incidental to the ordinary course of its business. There are no material legal proceedings pending against the Company, except as follows:
Government Investigations and Litigation Relating to the Audit Committee Investigation
As previously reported, on October 29, 2014, the Company filed a Current Report on Form 8-K (the “October 29 8-K”) reporting the Audit Committee’s conclusion, based on the preliminary findings of its investigation, that certain previously issued consolidated financial statements of the Company, including those included in the Company’s Annual Report on Form 10-K for the year ended December 31, 2013 and Quarterly Reports on Form 10-Q for the quarters ended March 31, 2014 and June 30, 2014, and related financial information should no longer be relied upon. The Company also reported that the Audit Committee had based its conclusion on the preliminary findings of its investigation into concerns regarding accounting practices and other matters that
VEREIT, INC. and VEREIT OPERATING PARTNERSHIP, L.P.
NOTES TO CONSOLIDATED FINANCIAL STATEMENTS
December 31, 2018 – (Continued)
were first reported to the Audit Committee in early September 2014 and that the Audit Committee believed that an error in the calculation of adjusted funds from operations for the first quarter of 2014 had been identified but intentionally not corrected when the Company reported its financial results for the three and six months ended June 30, 2014. Prior to the filing of the October 29 8-K, the Audit Committee previewed for the SEC the information contained in the filing. Subsequent to that filing, the SEC provided notice that it had commenced a formal investigation and issued subpoenas calling for the production of various documents. In addition, the United States Attorney’s Office for the Southern District of New York contacted counsel for the Audit Committee and counsel for the Company with respect to this matter, and the Secretary of the Commonwealth of Massachusetts issued a subpoena calling for the production of various documents. The Company has been cooperating with these regulators in their investigations.
In connection with these investigations, on September 8, 2016, the United States Attorney’s Office for the Southern District of New York announced the filing of criminal charges against the Company’s former Chief Financial Officer and former Chief Accounting Officer (the “Criminal Action”), as well as the fact that the former Chief Accounting Officer pleaded guilty to the charges filed. Also on September 8, 2016, the SEC announced the filing of a civil complaint against the same two individuals in the United States District Court for the Southern District of New York. On June 30, 2017, following a jury trial, the former Chief Financial Officer was convicted of the charges filed. Both the former Chief Accounting Officer and the former Chief Financial Officer have entered into settlement agreements with the SEC resolving the charges brought against them.
The United States Attorney’s Office has indicated that it does not intend to bring criminal charges against the Company arising from its investigation. In addition, the Company has not been in contact with the Massachusetts regulator since June 2015 and believes the investigation is concluded. In March 2018, investigative staff of the SEC’s enforcement division inquired whether the Company wished to discuss a resolution of potential civil charges the SEC may bring with respect to certain matters investigated by the staff stemming from the announcement made on October 29, 2014. The Company has been cooperating with the SEC staff’s investigation since its inception and is engaged in such discussions with the staff. The timing and substance of the ultimate resolution of these discussions is unknown.
As discussed below, the Company and certain of its former officers and directors have been named as defendants in a number of lawsuits filed following the October 29 8-K, including class actions, individual actions and derivative actions seeking money damages and other relief under the federal securities laws and state laws in both federal and state courts in New York, Maryland and Arizona.
Between October 30, 2014 and January 20, 2015, the Company soldand certain of its former officers and directors, among other individuals and entities, were named as defendants in ten securities class action complaints filed in the United States District Court for the Southern District of New York. The court consolidated these actions under the caption In re American Realty Capital Properties, Inc. Litigation, No. 15-MC-00040 (AKH) (the “SDNY Consolidated Securities Class Action”). The plaintiffs filed a second amended class action complaint on December 11, 2015, which asserted claims for violations of Sections 11, 12(a)(2) and 15 of the Securities Act of 1933 and Sections 10(b) and 20(a) of the Securities Exchange Act of 1934 and Rule 10b-5 promulgated thereunder. On September 8, 2016, the court issued an order directing plaintiffs to file a third amended complaint to reflect certain prior rulings by the court in connection with various motions to dismiss. The third amended complaint was filed on September 30, 2016 and the defendants were not required to file new answers. On August 31, 2017, the court issued an order granting plaintiffs’ motion for class certification. Defendants’ petitions seeking leave to appeal the court’s order granting class certification were denied on January 24, 2018. Fact depositions were concluded at the end of 2018 and at a status conference in November 2018, the court ordered all summary judgment motions to be filed by February 8, 2019, with briefing on all motions to be completed by April 5, 2019. The next status conference with the court is scheduled for April 17, 2019 and trial is scheduled for September 9, 2019.
VEREIT, INC. and VEREIT OPERATING PARTNERSHIP, L.P.
NOTES TO CONSOLIDATED FINANCIAL STATEMENTS
December 31, 2018 – (Continued)
The Company, certain of its former officers and directors, and the OP, among others, were also named as defendants in thirteen individual securities fraud actions filed in the United States District Court for the Southern District of New York: Jet Capital Master Fund, L.P. v. American Realty Capital Properties, Inc., et al., No. 15-cv-307 (the “Jet Capital Action”); Twin Securities, Inc. v. American Realty Capital Properties, Inc., et al., No. 15-cv-1291; HG Vora Special Opportunities Master Fund, Ltd v. American Realty Capital Properties, Inc., et al., No. 15-cv-4107; BlackRock ACS US Equity Tracker Fund, et al. v. American Realty Capital Properties, Inc. et al., No. 15-cv-08464; PIMCO Funds: PIMCO Diversified Income Fund, et al. v. American Realty Capital Properties, Inc. et al., No. 15-cv-08466; Clearline Capital Partners LP, et al. v. American Realty Capital Properties, Inc. et al., No. 15-cv-08467; Pentwater Equity Opportunities Master Fund Ltd., et al. v. American Realty Capital Properties, Inc. et al., No. 15-cv-08510; Archer Capital Master Fund, et al. v. American Realty Capital Properties, Inc. et al, No. 16-cv-05471; Atlas Master Fund et al. v. American Realty Capital Properties, Inc. et al., No. 16-cv-05475; Eton Park Fund, L.P. v. American Realty Capital Properties, Inc., et al., No. 16-cv-09393; Reliance Standard Life Insurance Company, et al, v. American Realty Capital Properties, Inc. et al, No. 17-cv-02796; Fir Tree Capital Opportunity Master Fund, L.P. et al. v. American Realty Capital Properties, Inc. et al., No. 17-cv-04975; and Cohen & Steers Institutional Realty Shares, Inc. et al v. American Realty Capital Properties, Inc. et al., No. 18-cv-06770, (collectively, the “Opt-Out Actions”). The Opt-Out Actions assert claims arising out of allegedly false and misleading statements in connection with the purchase or sale of the Company’s securities. The Company entered into a series of agreements dated September 30 through October 26, 2018, to settle twelve of the thirteen pending Opt-Out Actions (the “Opt Out Settlement Agreements”) brought by plaintiffs holding shares of common stock and swaps referencing common stock representing approximately 18% of VEREIT’s outstanding shares of common stock outstanding at the end of the period covered by the litigations, for an aggregate payment of $127.5 million. The Opt Out Settlement Agreements contain mutual releases by both Plaintiffs and the Company, although the Company retains the right to pursue any and all claims against the other defendants in each Action and/or third parties, including claims for contribution for amounts paid in the settlement. The Opt Out Settlement Agreements do not contain any admission of liability, wrongdoing or responsibility by any of the parties. The only remaining opt out action is the Jet Capital Action, which is proceeding on the same summary judgment and trial schedule as the SDNY Consolidated Securities Class Action.
On October 27, 2015, the Company and certain of its former officers, among others, were also named as defendants in an individual securities fraud action filed in the United States District Court for the District of Arizona, captioned Vanguard Specialized Funds, et al. v. VEREIT, Inc. et al., No. 15-cv-02157 (the “Vanguard Action”, and such plaintiffs, “Plaintiffs”). The Vanguard Action asserted claims arising out of allegedly false and misleading statements in connection with the purchase or sale of the Company’s securities. On June 7, 2018, the Company entered into a Settlement Agreement and Release (the “Settlement Agreement”) to settle the Vanguard Action. Pursuant to the terms of the Settlement Agreement, the Plaintiffs filed a motion to dismiss all claims against the Company and the other defendants with prejudice, which was granted by the court on June 19, 2018, and the Company paid Plaintiffs the sum of $90 million in connection with the settlement of the claims. The Settlement Agreement contains mutual releases by both Plaintiffs and the Company, although the Company retains the right to pursue any and all claims against the other defendants in the Action and/or third parties, including claims for contribution for amounts paid in the settlement. The Settlement Agreement does not contain any admission of liability, wrongdoing or responsibility by any of the parties. Vanguard’s holdings accounted for approximately 13% of the Company’s outstanding shares of common stock held at the end of the period covered by the various pending shareholder actions.
In addition to the settlement of the opt-out actions and the Vanguard Action discussed above, on February 5, 2019, the Company entered into a series of agreements to settle claims with shareholders who decided not to participate as class members in the SDNY Consolidated Securities Class Action. Pursuant to the terms of the settlement agreements, the shareholders released all claims that were the subject matter of the SDNY Consolidated Securities Class Action and the Company made payments totaling $15.7 million. In total, the Company has now settled claims of shareholders who held shares of common stock and swaps referencing common stock representing approximately 33.5% of VEREIT’s outstanding shares of common stock held at the end of the period covered by the various pending shareholder actions for payments totaling $233.2 million, which is recorded in “Litigation, merger and other non-routine costs, net of insurance recoveries” in the accompanying consolidated statement of operations for the year ended December 31, 2018.
The Company was also named as a nominal defendant, and certain of its former officers and directors were named as defendants, in shareholder derivative actions filed in the United States District Court for the Southern District of New York: Witchko v. Schorsch, et al., No. 15-cv-06043 (the “Witchko Action”); and Serafin, et al. v. Schorsch, et al., No. 15-cv-08563 (the “Serafin Action”). The court consolidated the Witchko Action and the Serafin Action (together the “SDNY Derivative Action”) and the plaintiffs designated the complaint filed in the Witchko Action as the operative complaint in the SDNY Derivative Action. The SDNY Derivative Action seeks money damages and other relief on behalf of the Company for alleged breaches of fiduciary duty, among other claims. On February 12, 2016, the Company and other defendants filed a motion to dismiss the SDNY Derivative Action due to plaintiffs’ failure to plead facts demonstrating that the Board’s decision to refuse plaintiffs’ pre-suit demands was wrongful and not a protected
VEREIT, INC. and VEREIT OPERATING PARTNERSHIP, L.P.
NOTES TO CONSOLIDATED FINANCIAL STATEMENTS
December 31, 2018 – (Continued)
business judgment. On June 9, 2016, the court granted in part and denied in part the Company’s and other defendants’ motions to dismiss. Plaintiffs filed an amended complaint on June 30, 2016, and the Company and other defendants filed answers to the amended complaint on July 22, 2016. Discovery and summary judgment briefing in the Witchko Action is being coordinated with the SDNY Consolidated Securities Class Action.
On December 3, 2015, the Company was named as a nominal defendant and certain of its former officers and directors were named as defendants in a shareholder derivative action filed in the Circuit Court for Baltimore City in Maryland, Frampton v. Schorsch, et al., No. 24-C-15-006269 (the “Frampton Action”). The Frampton Action seeks money damages and other relief on behalf of the Company for, among other things, alleged breaches of fiduciary duty and contribution and indemnification. By order dated November 4, 2016, the Frampton Action was stayed pending resolution of the SDNY Derivative Action.
On June 10, 2016, the Company was named as a nominal defendant, and certain of its former officers and directors, among others, were named as defendants, in a shareholder derivative action filed in the Supreme Court of the State of New York, Kosky v. Schorsch, et al., No. 653093/2016 (the “Kosky Action”). The Kosky Action seeks money damages and other relief on behalf of the Company for, among other things, alleged breaches of fiduciary duty, negligence, and breach of contract. On October 6, 2016, the parties filed a stipulation staying the Kosky Action until resolution of the SDNY Consolidated Securities Class Action.
On October 6, 2016, the Company was named as a nominal defendant, and certain of its former officers and directors, among others, were named as defendants, in a shareholder derivative action filed in the United States District Court for the District of Maryland, captioned Meloche v. Schorsch, et al., 16-cv-03366 (the “Meloche Action”). An amended complaint was filed on January 17, 2017. The Meloche Action seeks money damages and other relief on behalf of the Company for alleged breaches of fiduciary duty and negligence. By order dated May 16, 2017, the Meloche Action was stayed until resolution of the SDNY Derivative Action.
There can be no assurance as to whether or how the completed settlements may affect any potential future resolution of any other pending lawsuit or claims, the timing of any such resolution, or the amount at which any other matter may be resolved. The Company has not reserved amounts for the SEC investigation, the on-going class action and the remaining opt out action discussed above because it believes that any probable loss or reasonably possible range of loss is not reasonably estimable at this time. With respect to the class action specifically, which represents substantially all of the remaining shares with alleged claims, although the Company believes a loss is probable, it is currently unable to reasonably estimate a possible range of loss because the litigation involves significant uncertainties, including, but not limited to, the complexity of the facts, the legal theories and the nature of the claims, the information to be produced in discovery, which has not yet concluded, the applicable methodology for determining any damages for each of the different types of claims, the extent to which members of the class would or would not file a claim, and the uncertainty inherent in a class action where the trading history and other relevant characteristics of the claimants are not currently known. The ultimate resolution of all of these matters, the timing and substance of which is unknown, may materially impact the Company’s business, financial condition, liquidity and results of operations.
Cole Litigation Matter
In December 2013, Realistic Partners filed a putative class action lawsuit against the Company and the then-members of its investmentsboard of directors in the fund.Supreme Court for the State of New York, captioned Realistic Partners v. American Realty Capital Partners, et al., No. 654468/2013. The plaintiff alleged, among other things, that the board of the Company breached its fiduciary duties in connection with the transactions contemplated under the Cole Merger Agreement (in connection with the merger between a wholly owned subsidiary of Cole Credit Property Trust III, Inc. and Cole Holdings Corporation) and that Cole Credit Property Trust III, Inc. aided and abetted those breaches. In January 2014, the parties entered into a memorandum of understanding regarding settlement of all claims asserted on behalf of the alleged class of the Company’s stockholders. The proposed settlement terms required the Company to make certain additional disclosures related to the Cole Merger, which were included in a Current Report on Form 8-K filed by the Company with the SEC on January 17, 2014. The memorandum of understanding also contemplated that the parties would enter into a stipulation of settlement, which would be subject to customary conditions, including confirmatory discovery and court approval following notice to the Company’s stockholders, and provided that the defendants would not object to a payment of up to $625,000 for attorneys’ fees. If the parties enter into a stipulation of settlement, which has not occurred, a hearing will be scheduled at which the court will consider the fairness, reasonableness and adequacy of the settlement. There can be no assurance that the parties will enter into a stipulation of settlement, that the court will approve any proposed settlement, or that any eventual settlement will be under the same terms as those contemplated by the memorandum of understanding.
VEREIT, INC. and VEREIT OPERATING PARTNERSHIP, L.P.
NOTES TO CONSOLIDATED FINANCIAL STATEMENTS
December 31, 2018 – (Continued)
Contractual Lease Obligations
The following table reflects the minimum base rent payments due from the Company over the next five years and thereafter for certain ground lease obligations, which are substantially reimbursable by our tenants, and office lease obligations (in thousands):
|
| | | | | | | | |
| | | Future Minimum Base Rent Payments |
| | | Ground Leases | | Office Leases |
| 2019 | | $ | 13,942 |
| | $ | 4,537 |
|
| 2020 | | 13,740 |
| | 4,451 |
|
| 2021 | | 13,542 |
| | 4,387 |
|
| 2022 | | 13,699 |
| | 4,419 |
|
| 2023 | | 14,077 |
| | 3,695 |
|
| Thereafter | | 196,369 |
| | 301 |
|
| Total | | $ | 265,369 |
| | $ | 21,790 |
|
Purchase Commitments
The Company enters into purchase and sale agreements and deposits funds into escrow towards the purchase of real estate assets, some of which are expected to be assigned to one of the Cole REITs at or prior to the closing of the respective acquisition. As of December 31, 2018, the Company was a party to five purchase and sale agreements with unaffiliated third-party sellers to purchase a 100% interest in eight properties, subject to meeting certain criteria, for an aggregate purchase price of $81.7 million, exclusive of closing costs. As of December 31, 2018, the Company had $1.1 million of property escrow deposits held by escrow agents in connection with these future property acquisitions, which may be forfeited if the transactions are not completed under certain circumstances. In accordance with the Services Agreement, the Company will be reimbursed by the assigned Cole REIT for amounts escrowed when the property is assigned to the respective Cole REIT.
Environmental Matters
In connection with the ownership and operation of real estate, the Company may potentially be liable for costs and damages related to environmental matters. The Company has not been notified by any governmental authority of any non-compliance, liability or other claim, and is not aware of any other environmental condition, in each case, that it believes will have a material adverse effect on the results of operations.
Note 11 – Equity
Common Stock and General Partner OP Units
The General Partner is authorized to issue up to 1.5 billion shares of Common Stock. As of December 31, 2018, the General Partner had approximately 967.5 million shares of Common Stock issued and outstanding.
Additionally, the Operating Partnership had approximately 967.5 million General Partner OP Units issued and outstanding as of December 31, 2018, corresponding to the General Partner’s outstanding shares of Common Stock.
Common Stock Continuous Offering Program
On September 19, 2016, the Company registered a continuous equity offering program (the “Program”) pursuant to which the Company can offer and sell, from time to time through September 19, 2019 in “at-the-market” offerings or certain other transactions, shares of Common Stock with an aggregate gross sales price of up to $750.0 million, through its sales agents. As of December 31, 2018, no shares of Common Stock have been issued pursuant to the Program.
Preferred Stock and Preferred OP Units
Series F Preferred Stock
As of December 31, 2018, there were approximately 42.8 million shares of Series F Preferred Stock (and approximately 42.8 million corresponding General Partner Series F Preferred Units) and 86,874 Limited Partner Series F Preferred Units issued and outstanding.
The Series F Preferred Stock pays cumulative cash dividends at the rate of 6.70% per annum on their liquidation preference of $25.00 per share (equivalent to $1.675 per share on an annual basis). The Series F Preferred Stock was not redeemable by the
VEREIT, INC. and VEREIT OPERATING PARTNERSHIP, L.P.
NOTES TO CONSOLIDATED FINANCIAL STATEMENTS
December 31, 2018 – (Continued)
Company before January 3, 2019, the fifth anniversary of the date on which such Series F Preferred Stock was issued (the “Initial Redemption Date”), except under circumstances intended to preserve the General Partner’s status as a REIT for federal and/or state income tax purposes and except upon the occurrence of a change of control. On and after the Initial Redemption Date, the General Partner may, at its option, redeem shares of the Series F Preferred Stock, in whole or from time to time in part, at a redemption price of $25.00 per share plus, subject to exceptions, any accrued and unpaid dividends thereon to the date fixed for redemption. The shares of Series F Preferred Stock have no stated maturity, are not subject to any sinking fund or mandatory redemption and will remain outstanding indefinitely unless the General Partner redeems or otherwise repurchases them or they become convertible and are converted into Common Stock (or, if applicable, alternative consideration). The Series F Preferred Stock trades on the NYSE under the symbol VER PRF. The Series F Preferred Units contain the same terms as the Series F Preferred Stock.
For federal income tax purposes, distributions to stockholders are characterized as ordinary dividends, capital gain distributions, or nontaxable distributions. Nontaxable distributions will reduce U.S stockholders’ basis (but not below zero) in their shares. The following table shows the character of the Series F Preferred Stock distributions paid on a percentage basis for the years ended December 31, 2018, 2017 and 2016:
|
| | | | | | | | | |
| | | Year Ended December 31, |
| | | 2018 | | 2017 | | 2016 |
| Ordinary dividends | | 100.0 | % | | 95.0 | % | | 95.0 | % |
| Capital gain distributions | | — | % | | 5.0 | % | | 5.0 | % |
| Total | | 100 | % | | 100 | % | | 100 | % |
Limited Partner OP Units
As of December 31, 2018 the Operating Partnership had approximately 23.7 million Limited Partner OP Units outstanding.
As of December 31, 2018, the Company has received redemption requests totaling approximately 13.1 million Limited Partner OP Units from certain affiliates of the Former Manager, which would have been redeemable for a corresponding number of shares of Common Stock. The Company believes it has potential claims against recipients of those OP Units and has engaged in discussions with affiliates of the Former Manager regarding the redemption requests. Pending any resolution, the Company does not currently intend to satisfy any of the redemption requests. In light of the potential claims, since October 15, 2015, the OP has not paid distributions in respect of a substantial portion of the outstanding Limited Partner OP Units when the Common Stock dividends were otherwise paid.
Common Stock Dividends
The Company declared quarterly dividends to stockholders of record each quarter from the first quarter of the year ended December 31, 2016 through the third quarter of the year ended December 31, 2018 of $0.1375 per share of Common Stock (representing an annualized dividend rate of $0.55 per share). The Company’s Board of Directors declared a quarterly cash dividend of $0.1375 per share of Common Stock (equaling an annualized dividend rate of $0.55 per share) for the fourth quarter of 2018 on November 5, 2018 to stockholders of record as of December 31, 2018, which was paid on January 15, 2019. An equivalent distribution by the Operating Partnership is applicable per OP unit.
For federal income tax purposes, distributions to stockholders are characterized as ordinary dividends, capital gain distributions, or nontaxable distributions. Nontaxable distributions will reduce U.S stockholders’ basis (but not below zero) in their shares. The following table shows the character of the Common Stock distributions paid on a percentage basis for the years ended December 31, 2018, 2017 and 2016:
|
| | | | | | | | | |
| | | Year Ended December 31, |
| | | 2018 | | 2017 | | 2016 |
| Ordinary dividends | | 13.8 | % | | 60.0 | % | | 95.0 | % |
| Nondividend distributions | | 86.2 | % | | 37.0 | % | | — | % |
| Capital gain distributions | | — | % | | 3.0 | % | | 5.0 | % |
| Total | | 100 | % | | 100 | % | | 100 | % |
VEREIT, INC. and VEREIT OPERATING PARTNERSHIP, L.P.
NOTES TO CONSOLIDATED FINANCIAL STATEMENTS
December 31, 2018 – (Continued)
Share Repurchase Program
On May 12, 2017, the Company’s Board of Directors authorized the repurchase of up to $200.0 million of the Company’s outstanding Common Stock over the subsequent 12 months, as market conditions warranted (the “2017 Share Repurchase Program”). On May 3, 2018, the Company’s Board of Directors terminated the 2017 Share Repurchase Program and authorized a new program (the “2018 Share Repurchase Program,” collectively with the 2017 Share Repurchase Program, the “Share Repurchase Programs”) that permits the Company to repurchase up to $200.0 million of its outstanding Common Stock through May 3, 2019, as market conditions warrant. Repurchases can be made through open market purchases, privately negotiated transactions, structured or derivative transactions, including accelerated stock repurchase transactions, or other methods of acquiring shares in accordance with applicable securities laws and other legal requirements. The Share Repurchase Programs do not obligate the Company to make any repurchases at a specific time or in a specific situation. Repurchases are subject to prevailing market conditions, the trading price of the stock, the Company’s financial performance and other conditions. Shares of Common Stock repurchased by the Company under the Share Repurchase Programs, if any, will be returned to the status of authorized but unissued shares of Common Stock.
During the period from May 12, 2017 through December 31, 2017, the Company repurchased approximately 69,000 shares of Common Stock in multiple open market transactions, at a weighted average share price of $7.50 for an aggregate purchase price of $0.5 million as part of the 2017 Share Repurchase Program. During the period from January 1, 2018 through May 2, 2018, the Company repurchased approximately 6.4 million shares of Common Stock in multiple open market transactions, at a weighted average share price of $6.94 for an aggregate purchase price of $44.6 million, for a total of $45.1 million of shares repurchased as part of the 2017 Share Repurchase Program.
From May 3, 2018 through December 31, 2018, the Company repurchased approximately 0.8 million shares of Common Stock in multiple open market transactions, at a weighted average share price of $6.95 for an aggregate purchase price of $5.6 million as part of the 2018 Share Repurchase Program, which are currently deemed to be authorized but unissued shares of Common Stock. As of December 31, 2018, the Company had $194.4 million available for share repurchases under the 2018 Share Repurchase Program.
Common Stock Repurchases to Settle Tax Obligations
Under the General Partner’s Equity Plan (as defined in Note 12 – Equity-based Compensation), participants have the option to have the General Partner repurchase shares vesting from awards made under the Equity Plan in order to satisfy the minimum federal and state tax withholding obligations. During the year ended December 31, 2018, the General Partner repurchased approximately 0.3 million shares to satisfy the federal and state tax withholding obligations on behalf of employees that made this election.
Note 12 – Equity-based Compensation
Equity Plans
The General Partner has an equity-based incentive award plan (the “Equity Plan”), which provides for the grant of stock options (“Stock Options”), stock appreciation rights, Restricted Shares, Restricted Stock Units, Deferred Stock Units, dividend equivalent rights and other stock-based awards to non-executive directors, officers, other employees and advisors or consultants who provide services to the Company, as applicable, and a non-executive director restricted share plan, which are accounted for under U.S. GAAP for share-based payments. The expense for such awards is recognized over the requisite service period. Restricted Shares provide for rights identical to those of Common Stock. Restricted Stock Units do not provide for any rights of a common stockholder prior to the vesting of such Restricted Stock Units. Restricted Shares are considered issued and outstanding. As is the case when fully vested shares of Common Stock are issued from the Equity Plan, for each Restricted Share awarded under the Equity Plan, the Operating Partnership issues a General Partner OP Unit to the General Partner with identical terms. Upon vesting or settlement of Restricted Stock Units or Deferred Stock Units, respectively, the Operating Partnership issues a General Partner OP Unit to the General Partner for each share of Common Stock issued as a result of such vesting.
VEREIT, INC. and VEREIT OPERATING PARTNERSHIP, L.P.
NOTES TO CONSOLIDATED FINANCIAL STATEMENTS
December 31, 2018 – (Continued)
The General Partner has authorized and reserved a total number of shares equal to 10.0% of the total number of issued and outstanding shares of Common Stock (on a fully diluted basis assuming the redemption of all OP Units for shares of Common Stock) to be issued at any time under the Equity Plan for equity incentive awards. As of December 31, 2018, the General Partner had cumulatively awarded under its Equity Plan approximately 4.0 million Restricted Shares, net of the forfeiture of 3.7 million Restricted Shares through that date, 5.3 million Restricted Stock Units, net of the forfeiture/cancellation of 1.8 million Restricted Stock Units through that date, 0.5 million Deferred Stock Units, and 2.8 million Stock Options, net of forfeiture/cancellation of approximately 40,000 Stock Options through that date, collectively representing approximately 12.5 million shares of Common Stock. Accordingly, as of such date, approximately 86.6 million additional shares were available for future issuance. At December 31, 2018, a total of 45,000 shares were awarded under the non-executive director restricted share plan out of the 99,000 shares reserved for issuance.
Restricted Shares
The Company has issued Restricted Shares to certain employees and non-executive directors beginning in 2011. In addition, the Company issued Restricted Shares to employees of affiliates of the Former Manager prior to 2015. The fair value of the Restricted Shares granted to employees under the Equity Plan is generally determined using the closing stock price on the grant date and is expensed over the requisite service period on a straight-line basis. The fair value of Restricted Shares granted to non-executive directors and employees of affiliates of the Former Manager under the Equity Plan was measured based upon the fair value of goods or services received or the equity instruments granted, whichever was more reliably determinable, and was expensed in full at the date of grant.
During the years ended December 31, 2018, 2017 and 2016, the Company recorded $0.6 million, $2.0 million and $2.7 million, respectively, of compensation expense related to the Restricted Shares. As of December 31, 2018, there was $0.1 million of unrecognized compensation expense related to the Restricted Shares with a weighted-average remaining term of 0.1 years.
The following table details the activity of the Restricted Shares during the year ended December 31, 2018:
|
| | | | | | | |
| | | Restricted Shares | | Weighted-Average Grant Date Fair Value |
| Unvested shares, December 31, 2017 | | 234,428 |
| | $ | 13.98 |
|
| Vested | | (159,210 | ) | | 13.97 |
|
| Forfeited | | (4,218 | ) | | 13.66 |
|
| Unvested shares, December 31, 2018 | | 71,000 |
| | $ | 14.04 |
|
Time-Based Restricted Stock Units
Under the Equity Plan, the Company may award Restricted Stock Units to employees that will vest if the recipient maintains employment over the requisite service period (the “Time-Based Restricted Stock Units”). The fair value of the Time-Based Restricted Stock Units granted to employees under the Equity Plan is generally determined using the closing stock price on the grant date and is expensed over the requisite service period on a straight-line basis, which is generally three years. During the years ended December 31, 2018, 2017 and 2016, the Company recorded $5.1 million, $6.3 million and $3.4 million, respectively, of compensation expense related to the Time-Based Restricted Stock Units. As of December 31, 2018, there was $5.6 million of unrecognized compensation expense related to the Time-Based Restricted Stock Units with a weighted-average remaining term of 1.8 years.
Deferred Stock Units
The Company may award Deferred Stock Units to non-executive directors under the Equity Plan. Each Deferred Stock Unit represents the right to receive one share of Common Stock. The Deferred Stock Units provide for immediate vesting on the grant date and will be settled with Common Stock either on the earlier of the date on which the respective director separates from the Company, dies or the third anniversary of the grant date, or if granted pursuant to the director’s voluntary election to participate in the director’s deferred compensation program, on the date the director separates from the Company (or upon a change of control or death). The fair value of the Deferred Stock Units is determined using the closing stock price on the grant date and is expensed over the requisite service period or on the grant date for awards with no requisite service period. During the years ended December 31, 2018, 2017 and 2016, the Company recorded approximately $1.2 million, $1.0 million and $0.8 million, respectively, of expense related to Deferred Stock Units. As of December 31, 2018, there is no unrecognized compensation expense related to the Deferred Stock Units.
VEREIT, INC. and VEREIT OPERATING PARTNERSHIP, L.P.
NOTES TO CONSOLIDATED FINANCIAL STATEMENTS
December 31, 2018 – (Continued)
The following table details the activity of the Time-Based Restricted Stock Units and Deferred Stock Units during the year ended December 31, 2018.
|
| | | | | | | | | | | | | | |
| | | Time-Based Restricted Stock Units | | Weighted-Average Grant Date Fair Value | | Deferred Stock Units | | Weighted-Average Grant Date Fair Value |
| Unvested units, December 31, 2017 | | 1,312,865 |
| | $ | 8.61 |
| | — |
| | $ | — |
|
| Granted | | 770,014 |
| | 6.76 |
| | 181,873 |
| | 6.95 |
|
| Vested | | (755,810 | ) | | 8.66 |
| | (181,873 | ) | | 6.95 |
|
| Forfeited | | (36,054 | ) | | 7.44 |
| | — |
| | — |
|
| Unvested units, December 31, 2018 | | 1,291,015 |
| | $ | 7.51 |
| | — |
| | $ | — |
|
Long-Term Incentive Awards
The General Partner may award long-term incentive-based Restricted Stock Units (the “LTI Target Awards”) to employees under the Equity Plan. Vesting of the LTI Target Awards is based upon the General Partner’s level of achievement of total stockholder return (“TSR”), including both share price appreciation and Common Stock dividends, as measured equally against a market index and against a peer group generally over a three year period.
The fair value and derived service period of the LTI Target Awards as of their grant date is determined using a Monte Carlo simulation which takes into account multiple input variables that determine the probability of satisfying the required TSR, as outlined in the award agreements. This method requires the input of assumptions, including the future dividend yield, the expected volatility of the Common Stock and the expected volatility of the market index constituents and the peer group. Compensation expense is recognized on a straight-line basis over the requisite service period regardless of whether the necessary TSR is attained, provided that the requisite service condition has been achieved. During the years ended December 31, 2018, 2017 and 2016, the Company recorded $5.8 million, $7.4 million and $4.6 million, respectively, of expense related to the LTI Target Awards. As of December 31, 2018, there was $6.1 million of unrecognized compensation expense related to the LTI Target Awards with a weighted-average remaining term of 1.7 years.
The following table details the activity of the LTI Target Awards during the year ended December 31, 2018.
|
| | | | | | | |
| | | LTI Target Awards | | Weighted-Average Grant Date Fair Value |
| Unvested units, December 31, 2017 | | 1,574,229 |
| | $ | 7.98 |
|
| Granted | | 894,441 |
| | 6.44 |
|
| Vested | | (327,693 | ) | | 7.14 |
|
| Forfeited | | (524,014 | ) | | 7.14 |
|
| Unvested units, December 31, 2018 | | 1,616,963 |
| | $ | 7.57 |
|
Stock Options
The General Partner may award Stock Options to employees that will vest if the recipient maintains constant employment through the end of the requisite service period.
The fair value of the Stock Options as of their grant date is determined using the Black-Scholes option pricing model, which requires the input of assumptions including expected terms, expected volatility, dividend yield and risk free rate. Expected term was calculated using the midpoint between the three year cliff vesting period and the 10-year contractual term. Expected volatilities were based on both historical and implied volatilities. The risk-free interest rate was based on zero-coupon yields derived from the U.S. Treasury Constant Maturity yield curve in effect as of the grant date.
VEREIT, INC. and VEREIT OPERATING PARTNERSHIP, L.P.
NOTES TO CONSOLIDATED FINANCIAL STATEMENTS
December 31, 2018 – (Continued)
The following inputs and assumptions were used to calculate the weighted-average fair values of the options granted:
|
| | | | |
| | | Year Ended December 31, 2018 |
| Expected term (in years) | | 6.5 |
|
| Volatility | | 27.39 | % |
| Dividend yield | | 7.21 | % |
| Risk-free rate | | 2.75 | % |
| Grant date fair value | | $ | 0.76 |
|
Compensation expense is recognized on a straight-line basis over the service period above. During the year ended December 31, 2018, the Company recorded $0.6 million of expense related to Stock Options. As of December 31, 2018, there was $1.5 million of unrecognized compensation expense related to Stock Options with a weighted-average remaining term of 2.1 years.
The following table details the activity of the Stock Options during the year ended December 31, 2018.
|
| | | | | | | | | | | | | | |
| | | Stock Options | | Weighted-Average Exercise Price | | Weighted-Average Remaining Contractual Term (Years) | | Aggregate Intrinsic Value |
| Outstanding, December 31, 2017 | | — |
| | $ | — |
| | — |
| | $ | — |
|
| Granted | | 2,802,639 |
| | 6.84 |
| | — |
| | — |
|
| Forfeited | | (39,474 | ) | | 6.84 |
| | — |
| | — |
|
| Outstanding, December 31, 2018 | | 2,763,165 |
| | $ | 6.84 |
| | 9.14 |
| | $ | 856,581 |
|
Note 13 – Related Party Transactions and Arrangements
Cole Capital
Cole Capital isThrough February 1, 2018, the Company was contractually responsible for managing the Cole REITs’ affairs on a day-to-day basis, identifying and making acquisitions and investments on the Cole REITs’ behalf, and recommending to the respective boardBoard of directorsDirectors of each of the Cole REITs an approach for providing investors with liquidity. In addition, the Company distributes the shares of common stockwas responsible for raising capital for certain Cole REITs, and advisesadvised them regarding offerings, managesmanaged relationships with participating broker-dealers and financial advisors, and providesprovided assistance in connection with compliance matters relating to the offerings. The Company receivesreceived compensation and reimbursement for services relating to the Cole REITs’ offerings and the investment, management and disposition of their respective assets, as applicable.
Offering-Related Revenue
The As discussed in Note 4 —Discontinued Operations, on February 1, 2018, the Company generally receives a selling commission, dealer manager fee and/or a distribution and stockholder servicing fee based on the gross offering proceeds related tocompleted the sale of shares ofCole Capital. The assets and liabilities transferred pursuant to the Cole REITs’ common stock in their primary offerings. The Company has reallowed 100% of selling commissions earned to participating broker-dealers. The Company, in its sole discretion, may reallow all or a portion of its dealer manager fee to such participating broker-dealers as a marketingCapital Purchase and due diligence expense reimbursement, based on factors such as the volume of shares issued by such participating broker-dealersSale Agreement and the amount of marketing support provided by such participating broker-dealers. No selling commissions or dealer manager fees are paid to the Company or other broker-dealers with respect to shares issued under the respective Cole REIT’s distribution reinvestment plan, under which the stockholders may elect to have distributions reinvested in additional shares.
All other organization and offering expenses associated with the sale of the Cole REITs’ common stock are paid for in advance by the Company and subject to reimbursement by the Cole REITs, up to certain limits in accordance with their respective advisory agreements and charters. As these costs are incurred, they are recorded as reimbursement revenue, up to the respective limit, and are included in offering-related revenues in therelated financial results for Cole Capital. Expenses paid on behalf of the Cole REITs in excess of these limits that are expected to be collected based on future estimated offering proceeds are recorded as program development costs, which are included in rent and tenant receivables and other assets, net in the accompanying consolidated balance sheets. The Company assesses the collectability of the program development costs, considering the offering period and historical and forecasted sales of shares under the Cole REITs’ respective offerings and reserves for any balances considered not collectible. Additional reserves are generally recorded if actual proceeds raised from the offerings and corresponding program development costs incurred differ from management’s assumptions. During the three months ended December 31, 2016 and 2015, the Company assessed the expected collectability of the program development costs based on assumptions used to evaluate goodwill and intangible asset impairments and recorded additional reserves for uncollectible amounts of $11.1 million and $11.3 million, respectively. The Company recorded an additional reserve for uncollectible amounts of $3.2 million during the year ended December 31, 2016, related to the closing of CCIT II’s primary offering. These amounts are recorded in general and administrative expenses in the accompanying statements of operations. As of December 31, 2016 and December 31, 2015, the Company had organization and offering costs recorded as program development costs, included in rent and tenant receivables and other assets, netreflected in the consolidated balance sheets and consolidated statements of $3.2 million and $12.9 million, respectively, which were netoperations as discontinued operations for all periods presented. As a result of reservesthe sale of $31.7 million and $34.8 million, respectively.Cole Capital, the Cole REITs are no longer affiliated with the Company.
VEREIT, INC. ANDand VEREIT OPERATING PARTNERSHIP, L.P.
NOTES TO CONSOLIDATED FINANCIAL STATEMENTS
December 31, 2016 – (Continued)
The following table shows the offering fee summary information for the Cole REITs as of December 31, 2016:
|
| | | | | | | |
| Program | | Selling Commissions (1) | | Dealer Manager Fees (2) | | Annual Distribution and Stockholder Servicing Fee (2) | |
Open Programs (3)(4) | | | | | | | |
CCPT V (5) | | | | | | | |
| Class A Shares | | 7% | | 2% | | —% | |
Class T Shares (6) | | 3% | | 2% | | 1.0% | (7) (8) |
| | | | | | | | |
| INAV | | | | | | | |
| Wrap Class Shares | | —% | | 0.55% | (8) | —% | |
| Advisor Class Shares | | up to 3.75% | | 0.55% | (8) | 0.5% | (8) |
| Institutional Class Shares | | —% | | 0.25% | (8) | —% | |
| | | | | | | | |
CCIT III (5)(9) | | | | | | | |
| Class A Shares | | 7% | | 2% | | —% | |
| Class T Shares | | 3% | | 2% | | 1% | (8) |
| |
(1) | The Company reallowed 100% of selling commissions earned to participating broker-dealers during the years ended December 31, 2016 and 2015 and 2014. |
| |
(2) | The Company may reallow all or a portion of its dealer manager fee and/or a distribution and stockholder servicing fee to participating broker-dealers as a marketing and due diligence expense reimbursement. |
| |
(3) | The Company receives selling commissions, an asset-based dealer manager fee and/or an asset-based distribution and stockholder servicing fee, all based on the net asset value for each class of common stock. |
| |
(4) | CCIT II closed its offering during the three months ended September 30, 2016. The program’s fee structure was similar to that of CCPT V. |
| |
(5) | The maximum amount of the distribution and stockholder servicing fee with respect to sales of Class T shares is 4.0% of the gross offering proceeds for CCPT V and CCIT III. |
| |
(6) | Commencing on April 29, 2016, CCPT V began offering Class T shares of common stock in addition to the class of shares of common stock previously offered (now referred to as Class A shares). |
| |
(7) | During the three months ended December 31, 2016, the annual distribution and stockholder servicing fee was amended to be 1.0%. Prior to the amendment, the distribution and stockholder servicing fee was 0.8% per annum. |
| |
(8) | Fees are accrued daily in the amount of 1/365th of a percentage of the estimated per share NAV and payable monthly in arrears. Distribution and stockholder servicing fees continue to be paid after the offering closes. |
| |
(9) | On September 22, 2016, the registration statement for the initial public offering of CCIT III was declared effective by the SEC, consisting of Class A shares of common stock and Class T shares of common stock. |
VEREIT, INC. AND VEREIT OPERATING PARTNERSHIP, L.P.
NOTES TO CONSOLIDATED FINANCIAL STATEMENTS
December 31, 2016 – (Continued)
Transaction Service Revenue
The Company earns acquisition fees related to the acquisition, development or construction of properties on behalf of certain of the Cole REITs. In addition, the Company is reimbursed for acquisition expenses incurred in the process of acquiring properties up to certain limits per the respective advisory agreement. The Company is not reimbursed for personnel costs in connection with services for which it receives acquisition fees or real estate commissions. In addition, the Company may earn disposition fees related to the sale of one or more properties, including those held indirectly through joint ventures, on behalf of a Cole REIT and other affiliates.
The following table shows the transaction-related fees for the Cole REITs and other real estate programs as of December 31, 2016:
|
| | | | | | | | |
| Program | | Acquisition Fees (1) | | Disposition Fees | | Performance Fees (2) | | Financing Coordination Fee (3) |
| Open Programs | | | | | | | | |
| CCPT V | | 2% | | 1% | | 15% | | — |
| INAV | | — | | — | | — | | — |
| CCIT III | | 2% | | 1% | | 15% | | 1% |
| | | | | | | | | |
| Closed Programs | | | | | | | | |
| CCIT II | | 2% | | 1% | | 15% | | — |
| CCPT IV | | 2% | | 1% | | 15% | | — |
| Other Programs | | Various | | Various | | Various | | — |
| |
(1) | Percent taken on gross purchase price. |
| |
(2) | Performance fee paid only under the following circumstances: (i) if shares are listed on a national securities exchange; (ii) if the respective Cole REIT is sold or the assets are liquidated; or (iii) upon termination of the advisory agreement. In connection with such events, the performance fee will only be earned upon the return to investors of their net capital invested and a 6% annual cumulative, non-compounded return (8% in the case of CCIT II and CCPT IV). |
| |
(3) | Financing coordination fee payable for services in connection with the origination, assumption, or refinancing for any debt (other than loans advanced by the Company) to acquire properties or make other permitted investments. |
Management Service Revenue
The Company earns advisory and asset and property management fees from certain Cole REITs and other real estate programs. The Company may also be reimbursed for expenses incurred in providing advisory and asset and property management services, subject to certain limitations. In addition, the Company earns a performance fee relating to INAV for any year in which the total return on stockholders’ capital exceeds 6% per annum on a calendar year basis.
The following table shows the management fees for the Cole REITs and other real estate programs as of December 31, 2016:
|
| | | | |
| Program | | Asset Management / Advisory Fees (1) | | Performance Fees (2) |
| Open Programs | | | | |
| CCPT V | | 0.65% - 0.75% | | — |
| INAV | | 0.90% | | 25% |
| CCIT III | | 0.65% - 0.75% | | — |
| | | | | |
| Closed Programs | | | | |
| CCIT II | | 0.65% - 0.75% | | — |
| CCPT IV | | 0.65% - 0.75% | | — |
| Other Programs | | Various | | — |
(1) Annualized fee based on the average monthly invested assets or net asset value, if available.
(2) The performance fee is limited to 10% of the aggregate total return, for each class, for any individual year.
VEREIT, INC. AND VEREIT OPERATING PARTNERSHIP, L.P.
NOTES TO CONSOLIDATED FINANCIAL STATEMENTS
December 31, 20162018 – (Continued)
The table below reflects the revenue earned from the Cole REITs (including closed programs, as applicable) and unconsolidated joint ventures for the years ended December 31, 2016, 20152018, 2017 and 20142016 (in thousands).
| | | | | Year Ended December 31, | | Year Ended December 31, |
| | | 2016 | | 2015 | | 2014 | | 2018 (1) | | 2017 | | 2016 |
| Offering-related fees and reimbursements | | | | | | | | | | | | |
Selling commissions (1)(2) | | $ | 19,943 |
| | $ | 14,101 |
| | $ | 57,023 |
| | $ | 407 |
| | $ | 7,746 |
| | $ | 19,943 |
|
Dealer manager and distribution fees (2)(3) | | 8,307 |
| | 5,131 |
| | 17,533 |
| | 431 |
| | 5,021 |
| | 8,300 |
|
| Reimbursement revenue | | 8,283 |
| | 5,178 |
| | 12,553 |
| | 189 |
| | 3,329 |
| | 8,283 |
|
| Offering-related fees and reimbursements | | 36,533 |
| | 24,410 |
|
| 87,109 |
| | 1,027 |
| | 16,096 |
| | 36,526 |
|
| | | | | | | | | | | | | |
| Transaction service fees and reimbursements | | | | | | | | | | | | |
| Acquisition fees | | 9,733 |
| | 18,742 |
| | 60,426 |
| | 119 |
| | 11,049 |
| | 9,513 |
|
Disposition fees (3) | | — |
| | 4,974 |
| | — |
| |
| Financing coordination fee | | | — |
| | 100 |
| | 220 |
|
| Reimbursement revenues | | 2,800 |
| | 2,165 |
| | 4,284 |
| | 215 |
| | 2,780 |
| | 2,800 |
|
| Transaction service fees and reimbursements | | 12,533 |
| | 25,881 |
|
| 64,710 |
| | 334 |
| | 13,929 |
| | 12,533 |
|
| | | | | | | | | | | | | |
| Management fees and reimbursements | | | | | | | | | | | | |
Asset and property management fees and leasing fees | | 220 |
| | 452 |
| | 596 |
| | 161 |
| | 220 |
| | 220 |
|
| Advisory and performance fee revenue | | 51,099 |
| | 44,948 |
| | 40,906 |
| | 5,023 |
| | 57,765 |
| | 51,099 |
|
| Reimbursement revenues | | 17,585 |
| | 13,843 |
| | 8,806 |
| | 1,429 |
| | 18,449 |
| | 17,587 |
|
| Management fees and reimbursements | | 68,904 |
| | 59,243 |
|
| 50,308 |
| | 6,613 |
| | 76,434 |
| | 68,906 |
|
| | | | | | | | | | | | | |
| Interest income on Affiliate Lines of Credit | | 453 |
| | 1,275 |
| | 307 |
| | 28 |
| | 262 |
| | 453 |
|
| | | | | | | | | | | | | |
Total related party revenues(4) | | $ | 118,423 |
| | $ | 110,809 |
|
| $ | 202,434 |
| | $ | 8,002 |
| | $ | 106,721 |
| | $ | 118,418 |
|
| |
| (1) | Represents the revenue earned during the period from January 1, 2018 through January 31, 2018, unless otherwise noted. |
| |
| (2) | The Company reallowed 100% of selling commissions earned to participating broker-dealers from January 1, 2018 through January 31, 2018 and during the years ended December 31, 2016, 20152017 and 2014.2016. |
| |
(2)(3) | During the years ended December 31, 2016, 20152018, 2017 and 2014,2016, the Company reallowed $3.2$0.2 million, $2.1 million, and$2.1 million and $9.23.2 million, respectively, of dealer manager fees and/or distribution and stockholder servicing fees to participating broker-dealers as a marketing and due diligence expense reimbursement. |
| |
(3) | The Company earned a disposition fee of $4.4 million on behalf of CCIT when CCIT merged with Select Income REIT on January 29, 2015. |
| |
| (4) | TotalRepresents asset and property management fees and leasing fees related party revenues excludes fees earned from 1031 real estate programs of $1.4 million, $5.3 million and $1.4 millionto properties owned through the Company’s unconsolidated joint ventures for the years ended December 31, 2016, 20152018, 2017 and 2014, respectively.2016. |
Investment in the Cole REITs
On February 1, 2018, the Company sold certain of its equity investments, recognizing a gain of $0.6 million, which is included in other income, net in the accompanying consolidated statement of operations for the year ended December 31, 2018, to the Cole Purchaser, retaining interests in CCIT II, CCIT III and CCPT V. As of December 31, 20162018 and 2015,2017, the Company owned aggregate equity investments of $4.7$7.8 million and $4.1$3.3 million, respectively, in the Cole REITs andREITs. During the year ended December 31, 2018, the Company recognized a gain of $5.1 million related to the change in fair value from the carrying value at December 31, 2017, which is included in other affiliated offerings. Theincome, net in the accompanying consolidated statement of operations. Prior to the sale of Cole Capital, the Company accountsaccounted for these investments using the equity method of accounting, which requiresrequired the investment to be initially recorded at cost and subsequently adjusted for the Company’s share of equity in the respective Cole REIT’s earnings and distributions. The Company recordsrecorded its proportionate share of net income (loss)or loss from the Cole REITs in equity in income (loss) and gain on disposition of unconsolidated entities in the consolidated statementsstatement of operations.operations for the years ended December 31, 2017 and 2016. During the years ended December 31, 2016, 20152017 and 2014,2016, the Company recognized $1.3 million ofa net loss $46,000 of net income$0.5 million and $1.6$1.3 million of net loss, respectively, from the Cole REITs.REITs, respectively.
The table below presents certain informationDue to Cole REITs
As of December 31, 2017, due to affiliates was $0.1 million, related to the Company’s investments inamounts due to the Cole REITs, as of December 31, 2016 (carrying amountwhich is included in thousands):
|
| | | | | | |
| | | December 31, 2016 |
| Cole REIT | | % of Outstanding Shares Owned | | Carrying Amount of Investment |
| CCPT V | | 0.93% | | $ | 1,396 |
|
| INAV | | 0.08% | | 140 |
|
| CCIT II | | 0.44% | | 1,259 |
|
| CCIT III | | 86.72% | | 1,440 |
|
| CCPT IV | | 0.01% | | 113 |
|
| Funds not yet in offering | | 100.00% | | 400 |
|
| | | | | $ | 4,748 |
|
VEREIT, INC. ANDand VEREIT OPERATING PARTNERSHIP, L.P.
NOTES TO CONSOLIDATED FINANCIAL STATEMENTS
December 31, 20162018 – (Continued)
Unconsummated Sale of Cole Capital to RCS Capital Corporation
On October 1, 2014, the Company announced that it had entered into a purchase agreement, pursuant to which RCS Capital Corporation (“RCAP”) would acquire Cole Capital for at least $700.0 million. As part of the transaction, the Company would be entitled to an earn-out of up to an additional $130.0 million based upon Cole Capital’s 2015 earnings before income taxes, depreciation and amortization. On November 3, 2014, the Company received notice from RCAP purporting to terminate the agreement. On December 4, 2014, the Company issued a press release announcing that it had entered into a settlement agreement with RCAP that resolved their dispute relating to the agreement.
The settlement included: $42.7 million in cash paid by RCAP to the Company; a $15.3 million unsecured note issued by RCAP to the Company; and a release of the Company from its obligation to pay $2.0 million to RCAP for services performed in relation to the Company’s Common Stock offering in 2014. This settlement is included in other income, net in the accompanying consolidated statements of operations. The Company and RCAP also agreed to work together to terminate, unwind or otherwise discontinue all agreements, arrangements and understandings between the two parties and any of their respective subsidiaries. See Note 8 – Mortgage Notes Receivable for further discussion on the unsecured note and the Company’s inclusion of the entire amount of the note in reserve for loan loss in 2015 in the accompanying consolidated statements of operations.
Due to Affiliates
Due to affiliates, as reported in the accompanying consolidated balance sheets, was $16,000 and $0.2 million as of December 31, 2016 and 2015, respectively, related to amounts due to the Cole REITs.
Due from AffiliatesCole REITs
As of December 31, 2016 and 2015, $11.02017, $4.4 million and $10.6 million, respectively, was expected to be collected from affiliates, excluding any outstanding balances from a line of credit with one of the Cole REITs’ lines of credit,REITs, discussed below, related to services provided by the Company and expenses subject to reimbursement by the Cole REITs in accordance with their respective advisory and property management agreements.
On September 23, 2016, the Company entered into a $30.0 million revolving line of credit (the “Subordinate Promissory Note”) with Cole Corporate Income Operating Partnership III, LP, (“CCI III OP”), the operating partnership of CCIT III, as modified on March 28, 2017 (the “Subordinate Promissory Note Agreement”Note”). The Subordinate Promissory Note bears variable interest rates of one month LIBOR plus the Credit Facility Margin (as defined in the Subordinate Promissory Note Agreement), which ranges from 2.20% to 2.75%, plus 1.75% and matures onmatured September 22, 2017. As of December 31, 2016, the Subordinate Promissory Note had an interest rate of 5.12% and $10.3 million was outstanding.
As of December 31, 2015, the Company had revolving line of credit agreements in place with CCIT II and CCPT V (the “Affiliate Lines of Credit”) that provided for maximum borrowings of $60.0 million to each of CCIT II and CCPT V and bore variable interest rates of one month LIBOR plus 2.20%. As of December 31, 2015, there was $50.0 million outstanding on the Affiliate Lines of Credit. During the year ended December 31, 2016, the Affiliate Lines of Credit matured30, 2018 and no amounts were outstanding as of December 31, 2016.2018. As of December 31, 2017, $1.6 million was outstanding, which is included in due from affiliates, net in the accompanying consolidated balance sheet.
Note 1914 – Net LossIncome (Loss) Per Share/Unit
The General Partner’s unvested Restricted Shares contain non-forfeitable rights to dividends and are considered to be participating securities in accordance with U.S. GAAP and, therefore, are included in the computation of earnings per share under the two-class computation method. Under the two-class computation method, net losses are not allocated to participating securities unless the holder of the security has a contractual obligation to share in the losses. The unvested Restricted Shares are not allocated losses as the awards do not have a contractual obligation to share in losses of the General Partner. The two-class computation method is an earnings allocation formula that determines earnings per share for each class of shares of Common Stock and participating securities according to dividends declared (or accumulated) and participation rights in undistributed earnings.
VEREIT, INC. AND VEREIT OPERATING PARTNERSHIP, L.P.
NOTES TO CONSOLIDATED FINANCIAL STATEMENTS
December 31, 2016 – (Continued)
Net Loss(Loss) Income Per Share
The following is a summary of the basic and diluted net loss(loss) income per share computation for the General Partner for the years ended December 31, 2018, 2017 and 2016 2015 and 2014 (in thousands,except share and per share amounts)(dollar amounts in thousands):
|
| | | | | | | | | | | | |
| | | Year Ended December 31, |
| | | 2016 |
| 2015 | | 2014 |
| Net loss attributable to the General Partner | | $ | (195,863 | ) | | $ | (316,353 | ) | | $ | (977,185 | ) |
| Dividends to preferred shares and units | | (71,892 | ) | | (71,892 | ) | | (98,722 | ) |
| Net loss available to the General Partner | | (267,755 | ) | | (388,245 | ) |
| (1,075,907 | ) |
| Earnings allocated to participating securities | | (492 | ) | | (410 | ) | | (5,335 | ) |
| Net loss available to common stockholders used in basic and diluted net loss per share | | $ | (268,247 | ) | | $ | (388,655 | ) |
| $ | (1,081,242 | ) |
| | | | | | | |
| Weighted average number of common stock outstanding - basic and diluted | | 931,422,844 |
| | 903,360,763 |
| | 793,150,098 |
|
| | | | | | | |
| Basic and diluted net loss per share attributable to common stockholders | | $ | (0.29 | ) |
| $ | (0.43 | ) |
| $ | (1.36 | ) |
|
| | | | | | | | | | | | |
| | | Year Ended December 31, |
| | | 2018 |
| 2017 | | 2016 |
| (Loss) income from continuing operations | | $ | (91,725 | ) | | $ | 51,495 |
| | $ | (76,887 | ) |
| Noncontrolling interests’ share in continuing operations | | 2,344 |
| | (1,005 | ) | | 1,908 |
|
| Net (loss) income from continuing operations attributable to the General Partner | | (89,381 | ) | | 50,490 |
| | (74,979 | ) |
| Dividends to preferred shares and units | | (71,892 | ) | | (71,892 | ) | | (71,892 | ) |
| Net loss from continuing operations available to the General Partner | | (161,273 | ) | | (21,402 | ) | | (146,871 | ) |
| Earnings allocated to participating securities | | (42 | ) | | (491 | ) | | (492 | ) |
| Income (loss) from discontinued operations, net of income taxes | | 3,695 |
| | (19,117 | ) | | (123,937 | ) |
| (Income) loss from discontinued operations attributable to limited partners | | (88 | ) | | 445 |
| | 3,053 |
|
| Net loss available to common stockholders used in basic and diluted net loss per share | | $ | (157,708 | ) | | $ | (40,565 | ) | | $ | (268,247 | ) |
| | | | | | | |
| Weighted average number of Common Stock outstanding - basic and diluted | | 969,092,268 |
| | 974,098,652 |
| | 931,422,844 |
|
| | | | | | | |
| Basic and diluted net loss per share from continuing operations attributable to common stockholders | | $ | (0.17 | ) | | $ | (0.02 | ) | | $ | (0.16 | ) |
| Basic and diluted net income (loss) per share from discontinued operations attributable to common stockholders | | $ | 0.00 |
| | $ | (0.02 | ) | | $ | (0.13 | ) |
Basic and diluted net loss per share attributable to common stockholders (1) | | $ | (0.16 | ) | | $ | (0.04 | ) | | $ | (0.29 | ) |
| |
| (1) | Amounts may not total due to rounding. |
VEREIT, INC. and VEREIT OPERATING PARTNERSHIP, L.P.
NOTES TO CONSOLIDATED FINANCIAL STATEMENTS
December 31, 2016,2018 – (Continued)
The following were excluded from diluted net loss per share attributable to common stockholders, excludes approximately 0.9 million of unvested Restricted Shares and Restricted Stock Units and approximately 23.8 million OP Units as the effect would have been antidilutive.antidilutive:
For the year ended December 31, 2015, diluted net loss attributable to common stockholders excludes approximately 3.3 million of unvested Restricted Shares and Restricted Stock Units and approximately 23.8 million OP Units as the effect would have been antidilutive. |
| | | | | | | | | |
| | | Year Ended December 31, |
| | | 2018 | | 2017 | | 2016 |
Weighted average unvested Restricted Shares and Restricted Stock Units (1) | | 420,369 |
| | 310,965 |
| | 868,252 |
|
Weighted average Stock Options (2) | | — |
| | — |
| | — |
|
| OP Units | | 23,725,506 |
| | 23,748,347 |
| | 23,763,797 |
|
For the year ended December 31, 2014, dilutive net loss attributable to common stockholders excludes approximately 5.4 million of unvested Restricted Shares and approximately 24.7 million OP Units as the effect would have been antidilutive. | |
| (1) | Net of assumed repurchases in accordance with the treasury stock method of 2.0 million for the year ended year ended December 31, 2018 and 1.6 million for each of the years ended December 31, 2017 and 2016. |
| |
| (2) | Net of assumed repurchases in accordance with the treasury stock method of 2.4 million for the year ended December 31, 2018. |
Net Loss(Loss) Income Per Unit
The following is a summary of the basic and diluted net loss(loss) income per unit attributable to common unitholders, which includes all common general partnerGeneral Partner unitholders and limited partner unitholders. The computation for the OPunitholders, for the years ended December 31, 2018, 2017 and 2016 2015 and 2014 (in thousands, except share and per share amounts)(dollar amounts in thousands):
|
| | | | | | | | | | | | |
| | | Year Ended December 31, |
| | | 2016 | | 2015 | | 2014 |
| Net loss attributable to the Operating Partnership | | $ | (200,810 | ) | | $ | (324,766 | ) |
| $ | (1,010,758 | ) |
| Dividends to preferred units | | (71,892 | ) | | (71,892 | ) | | (98,722 | ) |
| Net loss available to the Operating Partnership | | (272,702 | ) | | (396,658 | ) |
| (1,109,480 | ) |
| Earnings allocated to participating units | | (492 | ) | | (410 | ) | | (5,335 | ) |
| Net loss available to common unitholders used in basic and diluted net loss per unit | | $ | (273,194 | ) | | $ | (397,068 | ) |
| $ | (1,114,815 | ) |
| | | | | | | |
| Weighted average number of common units outstanding - basic and diluted | | 955,181,238 |
| | 927,124,560 |
| | 817,883,937 |
|
| | | | | | | |
| Basic and diluted net loss per unit attributable to common unitholders | | $ | (0.29 | ) |
| $ | (0.43 | ) |
| $ | (1.36 | ) |
|
| | | | | | | | | | | | |
| | | Year Ended December 31, |
| | 2018 | | 2017 | | 2016 |
| (Loss) income from continuing operations | | $ | (91,725 | ) | | $ | 51,495 |
| | $ | (76,887 | ) |
| Noncontrolling interests’ share in continuing operations | | 154 |
| | 194 |
| | 14 |
|
| Net (loss) income from continuing operations attributable to the Operating Partnership | | $ | (91,571 | ) | | $ | 51,689 |
| | $ | (76,873 | ) |
| Dividends to preferred units | | (71,892 | ) | | (71,892 | ) | | (71,892 | ) |
| Net loss from continuing operations available to the Operating Partnership | | (163,463 | ) | | (20,203 | ) | | (148,765 | ) |
| Earnings allocated to participating units | | (42 | ) | | (491 | ) | | (492 | ) |
| Income (loss) from discontinued operations, net of income taxes | | 3,695 |
| | (19,117 | ) | | (123,937 | ) |
| Net loss available to common unitholders used in basic and diluted net loss per unit | | $ | (159,810 | ) | | $ | (39,811 | ) | | $ | (273,194 | ) |
| | | | | | | |
| Weighted average number of common units outstanding - basic | | 992,817,774 |
| | 997,846,999 |
| | 955,181,238 |
|
| | | | | | | |
| Basic and diluted net loss per unit from continuing operations attributable to common unitholders | | $ | (0.17 | ) | | $ | (0.02 | ) | | $ | (0.16 | ) |
| Basic and diluted net income (loss) per unit from discontinued operations attributable to common unitholders | | $ | 0.00 |
| | $ | (0.02 | ) | | $ | (0.13 | ) |
Basic and diluted net loss per unit attributable to common unitholders (1) | | $ | (0.16 | ) |
| $ | (0.04 | ) | | $ | (0.29 | ) |
| |
| (1) | Amounts may not total due to rounding. |
For the year ended December 31, 2016,The following were excluded from diluted net loss per unit attributable to common unitholders, excludes approximately 0.9 million of unvested Restricted Shares and Restricted Stock Units as the effect would have been antidilutive.antidilutive:
For the year ended December 31, 2015, diluted net loss attributable to common unitholders excludes approximately 3.3 million of unvested Restricted Shares and Restricted Stock Units as the effect would have been antidilutive. |
| | | | | | | | | |
| | | Year Ended December 31, |
| | | 2018 | | 2017 | | 2016 |
Weighted average unvested Restricted Shares and Restricted Stock Units (1) | | 420,369 |
| | 310,965 |
| | 868,252 |
|
Weighted average Stock Options (2) | | — |
| | — |
| | — |
|
For the year ended December 31, 2014, dilutive net loss attributable to common unitholders excludes approximately 5.4 million of unvested Restricted Shares as the effect would have been antidilutive. | |
| (1) | Net of assumed repurchases in accordance with the treasury stock method of 2.0 million for the year ended year ended December 31, 2018 and 1.6 million for each of the years ended December 31, 2017 and 2016. |
| |
| (2) | Net of assumed repurchases in accordance with the treasury stock method of 2.4 million shares for the year ended December 31, 2018. |
VEREIT, INC. ANDand VEREIT OPERATING PARTNERSHIP, L.P.
NOTES TO CONSOLIDATED FINANCIAL STATEMENTS
December 31, 20162018 – (Continued)
Note 20 – Income Taxes
As a REIT, the General Partner generally is not subject to federal income tax on taxable income that it distributes to its shareholders as long as it distributes at least 90% of its annual taxable income (computed without regard to the deduction for dividends paid and excluding net capital gains), with the exception of its TRS entities. However, the General Partner, including its TRS entities, and the Operating Partnership are still subject to certain state and local income and franchise taxes in the various jurisdictions in which they operate.
Cole Capital Income Taxes
Based on the above, Cole Capital’s business, substantially all of which is conducted through a TRS, recognized a benefit from income taxes of $9.8 million, $39.9 million and $40.6 million for the years ended December 31, 2016, 2015 and 2014, respectively, which are included in benefit from income taxes in the accompanying consolidated statements of operations.
REI Income Taxes
The REI segment recognized a provision for income taxes of $6.1 million, $3.6 million and $7.3 million for the years ended December 31, 2016, 2015 and 2014, respectively, which are included in benefit from income taxes in the accompanying consolidated statements of operations.
The following table presents the reconciliation of the benefit from income taxes with the amount computed by applying the statutory federal income tax rate to loss before income taxes for the years ended December 31, 2016, 2015 and 2014 (in thousands):
|
| | | | | | | | | | | | | | | | | | | | | |
| | | Year Ended December 31, |
| | | 2016 | | 2015 | | 2014 |
| Consolidated loss before taxes | | $ | (204,525 | ) | | | | $ | (359,795 | ) | | | | $ | (1,044,176 | ) | | |
| Loss from non-taxable entities | | 64,081 |
|
|
|
|
| 128,545 |
| | | | 714,508 |
| | |
| Loss attributable to taxable subsidiaries before income taxes | | (140,444 | ) | | | | (231,250 | ) | | | | (329,668 | ) | | |
| Federal provision at statutory rate | | (49,155 | ) | | 35.0 | % | | (80,938 | ) | | 35.0 | % | | (115,384 | ) | | 35.0 | % |
| State income taxes and other | | (2,982 | ) | | 2.1 | % | | (7,813 | ) | | 3.4 | % | | (3,266 | ) | | 1.0 | % |
| Impairment of goodwill | | 42,326 |
| | (30.1 | )% | | 48,879 |
| | (21.1 | )% | | 78,073 |
| | (23.7 | )% |
| Total benefit from Cole Capital income taxes | | $ | (9,811 | ) |
| 7.0 | % |
| $ | (39,872 | ) | | 17.3 | % | | $ | (40,577 | ) | | 12.3 | % |
| REI state income taxes | | 6,110 |
| | | | 3,569 |
| | | | 7,313 |
| | |
| Total benefit from income taxes | | $ | (3,701 | ) |
|
|
|
| $ | (36,303 | ) | | | | $ | (33,264 | ) | | |
The following table presents the components of the benefit from income taxes for the years ended December 31, 2016, 2015 and 2014 (in thousands):
|
| | | | | | | | | | | | |
| | | Year Ended December 31, |
| | | 2016 | | 2015 | | 2014 |
| Current | | | | | | |
| Federal | | $ | 3,225 |
| | $ | 10,122 |
| | $ | (6,306 | ) |
| State | | (2,900 | ) | | 2,248 |
| | (947 | ) |
| Total current provision (benefit) | | 325 |
|
| 12,370 |
| | (7,253 | ) |
| Deferred | | | | | | |
| Federal | | (8,871 | ) | | (45,416 | ) | | (28,968 | ) |
| State | | (1,265 | ) | | (6,826 | ) | | (4,356 | ) |
| Total deferred benefit | | (10,136 | ) |
| (52,242 | ) | | (33,324 | ) |
| | | | | | | |
| REI state income taxes | | 6,110 |
| | 3,569 |
| | 7,313 |
|
| | | | | | | |
| Total benefit from income taxes | | $ | (3,701 | ) |
| $ | (36,303 | ) | | $ | (33,264 | ) |
VEREIT, INC. AND VEREIT OPERATING PARTNERSHIP, L.P.
NOTES TO CONSOLIDATED FINANCIAL STATEMENTS
December 31, 2016 – (Continued)
The components of the net deferred tax assets as of December 31, 2016 and 2015, which are included in the accompanying consolidated balance sheet, are as follows (in thousands):
|
| | | | | | | | |
| | | December 31, 2016 | | December 31, 2015 |
| Intangible assets | | $ | (7,858 | ) | | $ | (17,943 | ) |
| Accrued compensation | | 6,163 |
| | 6,251 |
|
| Fixed assets | | (3,155 | ) | | (5,192 | ) |
| Program development costs | | 11,668 |
| | 13,310 |
|
| Equity-based compensation | | 4,249 |
| | 4,700 |
|
| Other | | 1,228 |
| | 1,030 |
|
| Total net deferred tax asset | | $ | 12,295 |
|
| $ | 2,156 |
|
The Company had no unrecognized tax benefits as of or during the years ended December 31, 2016, 2015 or 2014. Any interest and penalties related to unrecognized tax benefits would be recognized in provision for income taxes in the accompanying consolidated statements of operations. The Company files income tax returns in the U.S. federal jurisdiction, Canadian federal jurisdiction and various state and local jurisdictions, and is subject to routine examinations by the respective tax authorities. With few exceptions, the Company is no longer subject to federal or state examinations by tax authorities for years before 2012.
Note 2115 – Quarterly Results (Unaudited)
Presented below is a summary of the unaudited quarterly financial information for the year ended December 31, 20162018 for the General Partner (in thousands, except share and per share amounts):
|
| | | | | | | | | | | | | | | | |
| | | Quarters Ended |
| | | March 31,
2016 | | June 30,
2016 | | September 30,
2016 | | December 31,
2016 |
| Revenues | | $ | 369,020 |
| | $ | 371,019 |
| | $ | 362,915 |
| | $ | 351,869 |
|
| Net (loss) income | | (116,080 | ) | | 3,233 |
| | 30,246 |
| | (118,223 | ) |
| | | | | | | | | |
| Net (loss) income attributable to the General Partner | | (113,086 | ) | | 3,146 |
| | 29,495 |
| | (115,418 | ) |
| Dividends to preferred shares and units | | (17,973 | ) | | (17,973 | ) | | (17,973 | ) | | (17,973 | ) |
Earnings allocated to participating securities (1) | | (125 | ) | | (210 | ) | | (154 | ) | | (89 | ) |
Net (loss) income available to common stockholders used in basic net (loss) income per share (1) | | (131,184 | ) | | (15,037 | ) | | 11,368 |
| | (133,480 | ) |
Income attributable to limited partners (1) | | — |
| | — |
| | 739 |
| | — |
|
Net (loss) income available to common stockholders and limited partners used in diluted net (loss) income per share(1) | | $ | (131,184 | ) |
| $ | (15,037 | ) |
| $ | 12,107 |
|
| $ | (133,480 | ) |
| | | | | | | | | |
| Weighted-average shares outstanding - basic | | 903,825,726 |
| | 904,107,378 |
| | 943,480,170 |
| | 973,681,227 |
|
| Effect of Limited Partner OP Units and dilutive securities | | — |
| | — |
| | 25,206,373 |
| | — |
|
| Weighted average number of common stock outstanding - diluted | | 903,825,726 |
|
| 904,107,378 |
|
| 968,686,543 |
|
| 973,681,227 |
|
| | | | | | | | | |
Basic and dilutive net (loss) income per share attributable to common stockholders (2) | | $ | (0.15 | ) |
| $ | (0.02 | ) |
| $ | 0.01 |
| (3) | $ | (0.14 | ) |
|
| | | | | | | | | | | | | | | | | |
| | | Quarters Ended | |
| | | March 31,
2018 | | June 30,
2018 | | September 30,
2018 | | December 31,
2018 | |
Rental revenue (1) | | $ | 315,074 |
| | $ | 315,664 |
| | $ | 313,866 |
| | $ | 313,263 |
| |
| Net income (loss) from continuing operations | | 29,036 |
| | (74,691 | ) | | (73,942 | ) | | 27,872 |
| |
| Income (loss) from discontinued operations, net of income taxes | | 3,501 |
| | 224 |
| | — |
| | (30 | ) | |
| Net income (loss) | | 32,537 |
| | (74,467 | ) | | (73,942 | ) | | 27,842 |
| |
| Net income (loss) attributable to the General Partner | | 31,795 |
| | (72,670 | ) | | (72,117 | ) | | 27,218 |
| |
Basic and diluted net income (loss) per share from continuing operations attributable to common stockholders (2) | | $ | 0.01 |
| (3) | $ | (0.09 | ) | | $ | (0.09 | ) | | $ | 0.01 |
| (3) |
Basic and diluted net income (loss) per share from discontinued operations attributable to common stockholders (2) | | $ | 0.00 |
| (3) | $ | 0.00 |
| | $ | — |
| | $ | (0.00 | ) | |
Basic and dilutive net income (loss) per share attributable to common stockholders (2) | | $ | 0.01 |
| (3) | $ | (0.09 | ) | | $ | (0.09 | ) | | $ | 0.01 |
| (3) |
| |
| (1) | AmountsRepresents revenue from continuing operations as presented on the statement of operations in accordance with U.S. GAAP. Substantially all of Cole Capital is presented as discontinued operations and the Company’s remaining financial results are reported as a single segment for each period are calculated independently. The sum of the quarters may differ from the annual amount.all periods presented. |
| |
| (2) | The sum of the quarterly net income (loss) per share amounts domay not agree to the full year net loss per share amounts. The Company calculates net lossincome (loss) per share based on the weighted-average number of outstanding shares of Common Stock during the reporting period. The average number of shares fluctuates throughout the year and can therefore produce a full year result that does not agree to the sum of the individual quarters. |
| |
| (3) | Represents dilutive net income per share attributable to common stockholders and limited partners.stockholders. |
VEREIT, INC. AND VEREIT OPERATING PARTNERSHIP, L.P.
NOTES TO CONSOLIDATED FINANCIAL STATEMENTS
December 31, 2016 – (Continued)
Presented below is a summary of the unaudited quarterly financial information for the year ended December 31, 20162018 for the OP (in thousands, except share and per share amounts):
|
| | | | | | | | | | | | | | | | |
| | | Quarters Ended |
| | | March 31,
2016 | | June 30,
2016 | | September 30,
2016 | | December 31,
2016 |
| Revenues | | $ | 369,020 |
| | $ | 371,019 |
| | $ | 362,915 |
| | $ | 351,869 |
|
| Net (loss) income | | (116,080 | ) | | 3,233 |
| | 30,246 |
| | (118,223 | ) |
| | | | | | | | | |
| Net (loss) income attributable to the OP | | (116,041 | ) | | 3,229 |
| | 30,234 |
| | (118,232 | ) |
| Dividends to preferred units | | (17,973 | ) | | (17,973 | ) | | (17,973 | ) | | (17,973 | ) |
Earnings allocated to participating units (1) | | (125 | ) | | (210 | ) | | (154 | ) | | (89 | ) |
Net (loss) income available to common unitholders used in basic and diluted net (loss) income per unit (1) | | $ | (134,139 | ) |
| $ | (14,954 | ) |
| $ | 12,107 |
|
| $ | (136,294 | ) |
| | | | | | | | | |
| Weighted-average shares outstanding - basic | | 927,589,523 |
| | 927,871,175 |
| | 967,237,921 |
| | 997,429,574 |
|
| Effect of dilutive securities | | — |
| | — |
| | 1,448,622 |
| | — |
|
| Weighted-average shares outstanding - diluted | | 927,589,523 |
|
| 927,871,175 |
|
| 968,686,543 |
|
| 997,429,574 |
|
| | | | | | | | | |
Basic and diluted net (loss) income per unit attributable to common unitholders (2) | | $ | (0.15 | ) |
| $ | (0.02 | ) |
| $ | 0.01 |
|
| $ | (0.14 | ) |
|
| | | | | | | | | | | | | | | | |
| | | Quarters Ended |
| | | March 31,
2018 | | June 30,
2018 | | September 30,
2018 | | December 31,
2018 |
Rental revenue (1) | | $ | 315,074 |
| | $ | 315,664 |
| | $ | 313,866 |
| | $ | 313,263 |
|
| Net income (loss) from continuing operations | | 29,036 |
| | (74,691 | ) | | (73,942 | ) | | 27,872 |
|
| Income (loss) from discontinued operations, net of income taxes | | 3,501 |
| | 224 |
| | — |
| | (30 | ) |
| Net income (loss) | | 32,537 |
| | (74,467 | ) | | (73,942 | ) | | 27,842 |
|
| Net income (loss) attributable to the OP | | 32,577 |
| | (74,451 | ) | | (73,885 | ) | | 27,883 |
|
Basic and diluted net income (loss) per unit from continuing operations attributable to common unitholders (2) | | $ | 0.01 |
| | $ | (0.09 | ) | | $ | (0.09 | ) | | $ | 0.01 |
|
Basic and diluted net income (loss) per unit from discontinued operations attributable to common unitholders (2) | | $ | 0.00 |
| | $ | 0.00 |
| | $ | — |
| | $ | (0.00 | ) |
Basic and dilutive net income (loss) per unit attributable to common unitholders (2) | | $ | 0.01 |
| | $ | (0.09 | ) | | $ | (0.09 | ) | | $ | 0.01 |
|
| |
| (1) | AmountsRepresents revenue from continuing operations as presented on the statement of operations in accordance with U.S. GAAP. Substantially all of Cole Capital is presented as discontinued operations and the Company’s remaining financial results are reported as a single segment for each period are calculated independently. The sum of the quarters may differ from the annual amount.all periods presented. |
| |
| (2) | The sum of the quarterly net income (loss) per unit amounts domay not agree to the full year net loss income per unit amounts. The Company calculates net lossincome (loss) per unit based on the weighted-average number of outstanding units during the reporting period. The average number of units fluctuates throughout the year and can therefore produce a full year result that does not agree to the sum of the individual quarters. |
VEREIT, INC. and VEREIT OPERATING PARTNERSHIP, L.P.
NOTES TO CONSOLIDATED FINANCIAL STATEMENTS
December 31, 2018 – (Continued)
Presented below is a summary of the unaudited quarterly financial information for the year ended December 31, 20152017 for VEREITthe General Partner (in thousands, except share and per share amounts):
|
| | | | | | | | | | | | | | | | |
| | | Quarters Ended |
| | | March 31,
2015 | | June 30,
2015 | | September 30,
2015 | | December 31,
2015 |
| Revenues | | $ | 393,968 |
| | $ | 393,721 |
| | $ | 384,954 |
| | $ | 383,374 |
|
| Net (loss) income | | (30,693 | ) | | (108,709 | ) | | 8,141 |
| | (192,231 | ) |
| | | | | | | | | |
| Net (loss) income attributable to the General Partner | | (29,970 | ) | | (106,522 | ) | | 7,529 |
| | (187,390 | ) |
| Dividends to preferred shares and units | | (17,973 | ) | | (17,973 | ) | | (17,974 | ) | | (17,972 | ) |
Earnings allocated to participating securities (1) | | (5 | ) | | — |
| | (217 | ) | | (188 | ) |
Net loss attributable to common stockholders used in basic and diluted net loss per share (1) | | $ | (47,948 | ) | | $ | (124,495 | ) | | $ | (10,662 | ) | | $ | (205,550 | ) |
| | | | | | | | | |
| Weighted-average shares outstanding - basic and diluted | | 902,996,270 |
| | 903,339,143 |
| | 903,461,323 |
| | 903,638,159 |
|
| | | | | | | | | |
Basic and diluted net loss per share attributable to common stockholders (2) | | $ | (0.05 | ) | | $ | (0.14 | ) | | $ | (0.01 | ) | | $ | (0.23 | ) |
|
| | | | | | | | | | | | | | | | |
| | | Quarters Ended |
| | | March 31,
2017 | | June 30,
2017 | | September 30,
2017 | | December 31,
2017 |
Rental revenue (1) | | $ | 320,898 |
| | $ | 308,245 |
| | $ | 306,543 |
| | $ | 316,599 |
|
| Net income (loss) from continuing operations | | 11,935 |
| | 29,550 |
| | 12,489 |
| | (2,479 | ) |
| Income (loss) from discontinued operations, net of income taxes | | 2,855 |
| | 4,636 |
| | 4,005 |
| | (30,613 | ) |
| Net income (loss) | | 14,790 |
| | 34,186 |
| | 16,494 |
| | (33,092 | ) |
| Net income (loss) attributable to the General Partner | | 14,438 |
| | 33,408 |
| | 16,094 |
| | (32,122 | ) |
Basic and diluted net (loss) income per share from continuing operations attributable to common stockholders (2) | | $ | (0.01 | ) | | $ | 0.01 |
| (3) | $ | (0.01 | ) | | $ | (0.02 | ) |
Basic and diluted net income (loss) per share from discontinued operations attributable to common stockholders (2) | | $ | 0.00 |
| | $ | 0.01 |
| (3) | $ | 0.00 |
| | $ | (0.03 | ) |
Basic and dilutive net (loss) income per share attributable to common stockholders (2) (4) | | $ | (0.00 | ) | | $ | 0.02 |
| (3) | $ | (0.00 | ) | | $ | (0.05 | ) |
| |
| (1) | AmountsRepresents revenue from continuing operations as presented on the statement of operations in accordance with U.S. GAAP. Substantially all of Cole Capital is presented as discontinued operations and the Company’s remaining financial results are reported as a single segment for each period are calculated independently. The sum of the quarters may differ from the annual amount.all periods presented. |
| |
| (2) | The sum of the quarterly net lossincome (loss) per share amounts domay not agree to the full year net loss per share amounts. The Company calculates net lossincome (loss) per share based on the weighted-average number of outstanding shares of Common Stock during the reporting period. The average number of shares fluctuates throughout the year and can therefore produce a full year result that does not agree to the sum of the individual quarters. |
VEREIT, INC. AND VEREIT OPERATING PARTNERSHIP, L.P.
NOTES TO CONSOLIDATED FINANCIAL STATEMENTS
December 31, 2016 – (Continued)
| |
| (3) | Represents dilutive net income per share attributable to common stockholders. |
| |
| (4) | Amounts may not total due to rounding. |
Presented below is a summary of the unaudited quarterly financial information for the year ended December 31, 20152017 for the OP (in thousands, except share and per share amounts):
|
| | | | | | | | | | | | | | | | |
| | | Quarters Ended |
| | | March 31,
2015 | | June 30,
2015 | | September 30,
2015 | | December 31,
2015 |
| Revenues | | $ | 393,968 |
| | $ | 393,721 |
| | $ | 384,954 |
| | $ | 383,374 |
|
| Net (loss) income | | (30,693 | ) | | (108,709 | ) | | 8,141 |
| | (192,231 | ) |
| | | | | | | | | |
| Net (loss) income attributable to the OP | | (30,873 | ) | | (109,322 | ) | | 7,737 |
| | (192,308 | ) |
| Dividends to preferred units | | (17,973 | ) | | (17,973 | ) | | (17,974 | ) | | (17,972 | ) |
Earnings allocated to participating units (1) | | (5 | ) | | — |
| | (217 | ) | | (188 | ) |
Net loss available to common unitholders used in basic and diluted net loss per unit (1) | | $ | (48,851 | ) | | $ | (127,295 | ) | | $ | (10,454 | ) | | $ | (210,468 | ) |
| | | | | | | | | |
| Weighted-average units outstanding - basic and diluted | | 926,760,067 |
| | 927,102,940 |
| | 927,225,120 |
| | 927,401,956 |
|
| | | | | | | | | |
Basic and diluted net loss per unit attributable to common unitholders (2) | | $ | (0.05 | ) | | $ | (0.14 | ) | | $ | (0.01 | ) | | $ | (0.23 | ) |
|
| | | | | | | | | | | | | | | | |
| | | Quarters Ended |
| | | March 31,
2017 | | June 30,
2017 | | September 30,
2017 | | December 31,
2017 |
Rental revenue (1) | | $ | 320,898 |
| | $ | 308,245 |
| | $ | 306,543 |
| | $ | 316,599 |
|
| Net income (loss) from continuing operations | | 11,935 |
| | 29,550 |
| | 12,489 |
| | (2,479 | ) |
| Income (loss) from discontinued operations, net of income taxes | | 2,855 |
| | 4,636 |
| | 4,005 |
| | (30,613 | ) |
| Net income (loss) | | 14,790 |
| | 34,186 |
| | 16,494 |
| | (33,092 | ) |
| Net income (loss) attributable to the OP | | 14,797 |
| | 34,200 |
| | 16,485 |
| | (32,910 | ) |
Basic and diluted net (loss) income per unit from continuing operations attributable to common unitholders (2) | | $ | (0.01 | ) | | $ | 0.01 |
| | $ | (0.01 | ) | | $ | (0.02 | ) |
Basic and diluted net income (loss) per unit from discontinued operations attributable to common unitholders (2) | | $ | 0.00 |
| | $ | 0.01 |
| | $ | 0.00 |
| | $ | (0.03 | ) |
Basic and dilutive net (loss) income per unit attributable to common unitholders (2) (3) | | $ | (0.00 | ) | | $ | 0.02 |
| | $ | (0.00 | ) | | $ | (0.05 | ) |
| |
| (1) | AmountsRepresents revenue from continuing operations as presented on the statement of operations in accordance with U.S. GAAP. Substantially all of Cole Capital is presented as discontinued operations and the Company’s remaining financial results are reported as a single segment for each period are calculated independently. The sum of the quarters may differ from the annual amount.all periods presented. |
| |
| (2) | The sum of the quarterly net lossincome (loss) per unit amounts domay not agree to the full year net loss per unit amounts. The Company calculates net lossincome (loss) per unit based on the weighted-average number of outstanding units during the reporting period. The average number of units fluctuates throughout the year and can therefore produce a full year result that does not agree to the sum of the individual quarters. |
| |
| (3) | Amounts may not total due to rounding. |
VEREIT, INC. and VEREIT OPERATING PARTNERSHIP, L.P.
NOTES TO CONSOLIDATED FINANCIAL STATEMENTS
December 31, 2018 – (Continued)
Note 2216 – Subsequent Events
The following events occurred subsequent to December 31, 2016:2018:
Insurance Settlement
On January 23, 2019, the Company signed a settlement and release agreement (the “Insurance Settlement and Release Agreement”) with certain insurance carriers and subsequently received $48.4 million of insurance recoveries. The Company did not record these insurance recoveries as a receivable prior to the finalization of the Insurance Settlement and Release Agreement in the accompanying consolidated balance sheets for the years ended December 31, 2018 and 2017, because it was not probable that the Company would receive these insurance recoveries as of December 31, 2018 and 2017.
Real Estate Investment Activity
From January 1, 20172019 through February 17, 2017,8, 2019 the Company sold 19disposed of eight properties for an aggregate gross sales price of $67.2$9.2 million, of which ourfour were held for sale with an aggregate carrying value of $1.9 million as of December 31, 2018. The Company’s share of the aggregate sales price was $62.3$8.6 million andwith an estimated gain of $5.1$2.5 million. In addition, the Company acquired one propertythree properties for aan aggregate purchase price of $46.0$36.8 million, excluding capitalized external acquisition-related expenses.
Debt Activity
On February 6, 2019, the Company’s 2019 Senior Notes matured and consolidated the feeprincipal outstanding of $750.0 million, plus accrued and leaseholdunpaid interest thereon, was repaid, utilizing borrowings under its Credit Facility.
On January 24, 2019, the Company entered into interest rate swap agreements with an aggregate $900.0 million notional amount, effective on February 6, 2019 and maturing on January 31, 2023. Based on the General Partner’s then credit rating and interest rate of three properties withLIBOR + 1.35%, the accompanying land purchases for $20.4 million.swap agreements effectively fixed the Credit Facility Term Loan interest rate at approximately 3.84%.
Mortgage Loan AgreementsNotes Receivable, Net
Subsequent to December 31, 2016,On January 15, 2019, the Company received two notices of default from the lenders of two non-recourse loans each secured by one property, which had an aggregate outstanding balance of $41.8 million on the notice date, due to the Company’s non-repayment of the respective loan balances at maturity.sold four mortgage notes receivable for $8.3 million.
Common Stock Dividend
On February 22, 2017,20, 2019, the Company’s boardBoard of directorsDirectors declared a quarterly cash dividend of $0.1375 per share of common stockCommon Stock (equaling an annualized dividend rate of $0.55 per share) for the first quarter of 20172019 to stockholders of record as of March 31, 2017,29, 2019, which will be paid on April 17, 2017.15, 2019. An equivalent distribution by the Operating Partnership is applicable per OP unit.Unit.
Preferred Stock Dividend
On February 22, 2017,20, 2019, the Company’s boardBoard of directorsDirectors declared a monthly cash dividend to holders of the Series F Preferred Stock for April 20172019 through June 2017 in2019 with respect to the periods included in the table below. The corresponding record and payment dates for each month's Series F Preferred Stock dividend are also shown in the table below. The dividend for the Series F Preferred Stock accrues daily on a 360-day annual basis equal to an annualized dividend rate of $1.675 per share, or $0.1395833 per 30-day month.
|
| | | | |
| Period | | Record Date | | Payment Date |
March 15, 20172019 - April 14, 20172019 | | April 1, 20172019 | | April 17, 201715, 2019 |
April 15, 20172019 - May 14, 20172019 | | May 1, 20172019 | | May 15, 20172019 |
May 15, 20172019 - June 14, 20172019 | | June 1, 20172019 | | June 15, 201717, 2019 |
VEREIT, INC. AND VEREIT OPERATING PARTNERSHIP, L.P.
SCHEDULE II – Valuation and Qualifying AccountsVALUATION AND QUALIFYING ACCOUNTS
December 31, 2016 (in2018 (in thousands)
Schedule II – Valuation and Qualifying Accounts
| | | Description | | Balance at Beginning of Year | | Additions | | Deductions | | Balance at End of Year | | Balance at Beginning of Year | | Additions | | Deductions | | Balance at End of Year | |
| Year Ended December 31, 2016 | |
| Reserve for program development costs | | $ | 34,798 |
| | $ | 26,191 |
| | $ | (29,337 | ) | (1) | $ | 31,652 |
| |
| Year Ended December 31, 2018 | | Year Ended December 31, 2018 | |
Reserve for program development costs (1) | | | $ | 7,632 |
| | $ | 651 |
| (2) | $ | (8,283 | ) | | $ | — |
| |
| Allowance for doubtful accounts and other reserves | | | 12,683 |
| (3) | 2,531 |
| | (8,905 | ) | | 6,309 |
| |
| Unsecured note reserve | | | 15,300 |
| | — |
| | (15,300 | ) | | — |
| |
| Total | | | $ | 35,615 |
| | $ | 3,182 |
| | $ | (32,488 | ) | | $ | 6,309 |
| |
| Year Ended December 31, 2017 | | Year Ended December 31, 2017 | |
Reserve for program development costs (1) | | | $ | 31,652 |
| | $ | 9,328 |
| | $ | (33,348 | ) | (4) | $ | 7,632 |
| |
| Allowance for doubtful accounts and other reserves | | 6,595 |
| | 2,318 |
| | (1,337 | ) | | 7,576 |
| | 7,576 |
| | 6,956 |
| | (1,849 | ) | | 12,683 |
| (3 | ) |
| Unsecured note reserve | | 15,300 |
| | — |
| | — |
| | 15,300 |
| | 15,300 |
| | — |
| | — |
| | 15,300 |
| |
| Total | | $ | 56,693 |
|
| $ | 28,509 |
|
| $ | (30,674 | ) |
| $ | 54,528 |
| | $ | 54,528 |
| | $ | 16,284 |
| | $ | (35,197 | ) | | $ | 35,615 |
| |
| | | | | | | | | | | | | | | | | | |
| Year Ended December 31, 2015 | |
| Reserve for program development costs | | $ | 13,109 |
| | $ | 21,689 |
| | $ | — |
| | $ | 34,798 |
| |
| Year Ended December 31, 2016 | | Year Ended December 31, 2016 | |
Reserve for program development costs (1) | | | $ | 34,798 |
| | $ | 26,191 |
| | $ | (29,337 | ) | (5) | $ | 31,652 |
| |
| Allowance for doubtful accounts and other reserves | | 2,475 |
| | 4,564 |
| | (444 | ) | | 6,595 |
| | 6,595 |
| | 2,318 |
| | (1,337 | ) | | 7,576 |
| |
| Unsecured note reserve | | — |
| | 15,300 |
| | — |
| | 15,300 |
| | 15,300 |
| | — |
| | — |
| | 15,300 |
| |
| Total | | $ | 15,584 |
|
| $ | 41,553 |
|
| $ | (444 | ) |
| $ | 56,693 |
| | $ | 56,693 |
| | $ | 28,509 |
| | $ | (30,674 | ) | | $ | 54,528 |
| |
| | | | | | | | | | | | | | | | | | |
| Year Ended December 31, 2014 | |
| Reserve for program development costs | | $ | — |
| | $ | 13,109 |
| | $ | — |
| | $ | 13,109 |
| |
| Allowance for doubtful accounts and other reserves | | 187 |
| | 3,312 |
| | (1,024 | ) | | 2,475 |
| |
| Total | | $ | 187 |
|
| $ | 16,421 |
|
| $ | (1,024 | ) |
| $ | 15,584 |
| |
| |
| (1) | Classified as discontinued operations. |
| |
| (2) | Represents additions to the reserve during the period from January 1, 2018 through January 31, 2018, prior to the sale of Cole Capital. |
| |
| (3) | Includes $1.0 million classified as discontinued operations. |
| |
| (4) | Deductions related to the return of the Company's interest in two funds not yet in offering ($1.3 million) and the closing of CCPT V's primary offering ($32.0 million). |
| |
| (5) | Deductions related to the closing of CCIT II’s primary offering. |
VEREIT, INC. AND VEREIT OPERATING PARTNERSHIP, L.P.
SCHEDULE III - REAL ESTATE AND ACCUMULATED DEPRECIATION
December 31, 20162018 (in thousands)
|
| | | | | | | | | | | | | | | | | | | | | | | | | | | | | | | | |
| | | | | | | | Initial Costs (1) | | Costs Capitalized Subsequent to Acquisition (2) | | Gross Amount
Carried at
December 31, 2016
(3) (4) | | | | | | |
| Property | | City | | State | | Encumbrances at
December 31, 2016 | | Land | | Buildings, Fixtures and Improvements | | | Accumulated Depreciation
(3) (5) | | Date Acquired | | Date of Construction |
| 24 Hour Fitness | | Woodlands | | TX | | $ | — |
| | $ | 2,690 |
| | $ | 7,463 |
| | $ | — |
| | $ | 10,153 |
| | $ | (1,726 | ) | | 9/24/2013 | | 2002 |
| 7-Eleven | | Sarasota | | FL | | — |
| | 1,312 |
| | 1,312 |
| | — |
| | 2,624 |
| | (304 | ) | | 11/19/2012 | | 2000 |
| 7-Eleven | | Gloucester | | VA | | — |
| | 144 |
| | 578 |
| | — |
| | 722 |
| | (131 | ) | | 12/24/2012 | | 1985 |
| 7-Eleven | | Hampton | | VA | | — |
| | 69 |
| | 624 |
| | — |
| | 693 |
| | (142 | ) | | 12/24/2012 | | 1986 |
| 7-Eleven | | Hampton | | VA | | — |
| | 161 |
| | 644 |
| | — |
| | 805 |
| | (146 | ) | | 12/24/2012 | | 1959 |
| AAA | | Oklahoma City | | OK | | — |
| | 3,639 |
| | 32,567 |
| | — |
| | 36,206 |
| | (4,739 | ) | | 2/7/2014 | | 2009 |
| Aaron Rents | | Oneonta | | AL | | 614 |
| | 205 |
| | 1,080 |
| | — |
| | 1,285 |
| | (173 | ) | | 2/7/2014 | | 2008 |
| Aaron Rents | | Oxford | | AL | | — |
| | 278 |
| | 748 |
| | — |
| | 1,026 |
| | (111 | ) | | 2/7/2014 | | 1989 |
| Aaron Rents | | Valley | | AL | | 409 |
| | 141 |
| | 827 |
| | — |
| | 968 |
| | (125 | ) | | 2/7/2014 | | 2009 |
| Aaron Rents | | El Dorado | | AR | | — |
| | 238 |
| | 743 |
| | — |
| | 981 |
| | (125 | ) | | 2/7/2014 | | 2000 |
| Aaron Rents | | Springdale | | AR | | 624 |
| | 513 |
| | 916 |
| | — |
| | 1,429 |
| | (152 | ) | | 2/7/2014 | | 2009 |
| Aaron Rents | | Auburndale | | FL | | 2,647 |
| | 1,351 |
| | 5,127 |
| | — |
| | 6,478 |
| | (809 | ) | | 2/7/2014 | | 2009 |
| Aaron Rents | | Pensacola | | FL | | — |
| | 159 |
| | 924 |
| | — |
| | 1,083 |
| | (140 | ) | | 2/7/2014 | | 1979 |
| Aaron Rents | | Statesboro | | GA | | — |
| | 351 |
| | 1,163 |
| | — |
| | 1,514 |
| | (181 | ) | | 2/7/2014 | | 2008 |
| Aaron Rents | | Indianapolis | | IN | | — |
| | 235 |
| | 1,071 |
| | — |
| | 1,306 |
| | (159 | ) | | 2/7/2014 | | 1998 |
| Aaron Rents | | Lafayette | | IN | | 550 |
| | 404 |
| | 652 |
| | — |
| | 1,056 |
| | (120 | ) | | 2/7/2014 | | 1989 |
| Aaron Rents | | Mansura | | LA | | — |
| | 81 |
| | 497 |
| | — |
| | 578 |
| | (86 | ) | | 2/7/2014 | | 2000 |
| Aaron Rents | | Minden | | LA | | — |
| | 323 |
| | 1,043 |
| | — |
| | 1,366 |
| | (189 | ) | | 2/7/2014 | | 2008 |
| Aaron Rents | | Battle Creek | | MI | | — |
| | 286 |
| | 843 |
| | — |
| | 1,129 |
| | (131 | ) | | 2/7/2014 | | 1995 |
| Aaron Rents | | Benton Harbor | | MI | | — |
| | 217 |
| | 924 |
| | — |
| | 1,141 |
| | (145 | ) | | 2/7/2014 | | 1997 |
| Aaron Rents | | Redford | | MI | | 434 |
| | 125 |
| | 698 |
| | — |
| | 823 |
| | (123 | ) | | 2/7/2014 | | 1972 |
| Aaron Rents | | Kennett | | MO | | 319 |
| | 203 |
| | 473 |
| | — |
| | 676 |
| | (80 | ) | | 2/7/2014 | | 1999 |
| Aaron Rents | | Greenwood | | MS | | — |
| | 156 |
| | 967 |
| | — |
| | 1,123 |
| | (157 | ) | | 2/19/2014 | | 2006 |
| Aaron Rents | | Magnolia | | MS | | 1,472 |
| | 287 |
| | 2,791 |
| | — |
| | 3,078 |
| | (405 | ) | | 2/7/2014 | | 2000 |
| Aaron Rents | | Charlotte | | NC | | 579 |
| | 308 |
| | 1,201 |
| | — |
| | 1,509 |
| | (176 | ) | | 2/7/2014 | | 1994 |
| Aaron Rents | | Bowling Green | | OH | | 564 |
| | 326 |
| | 928 |
| | — |
| | 1,254 |
| | (155 | ) | | 2/7/2014 | | 2009 |
| Aaron Rents | | Kent | | OH | | 614 |
| | 245 |
| | 1,080 |
| | — |
| | 1,325 |
| | (183 | ) | | 2/7/2014 | | 1999 |
| Aaron Rents | | North Olmsted | | OH | | 449 |
| | 218 |
| | 753 |
| | — |
| | 971 |
| | (132 | ) | | 2/7/2014 | | 1960 |
| Aaron Rents | | Shawnee | | OK | | — |
| | 303 |
| | 1,135 |
| | — |
| | 1,438 |
| | (184 | ) | | 2/7/2014 | | 2008 |
| Aaron Rents | | Bloomsburg | | PA | | 400 |
| | 224 |
| | 856 |
| | — |
| | 1,080 |
| | (129 | ) | | 2/7/2014 | | 1996 |
| Aaron Rents | | Meadville | | PA | | — |
| | 237 |
| | 1,224 |
| | — |
| | 1,461 |
| | (192 | ) | | 2/7/2014 | | 1994 |
|
| | | | | | | | | | | | | | | | | | | | | | | | | | | | | | | | |
| | | | | | | | Initial Costs (1) | | Costs Capitalized Subsequent to Acquisition (2) | | Gross Amount
Carried at
December 31, 2018
(3) (4) | | | | | | |
| Property | | City | | State | | Encumbrances at
December 31, 2018 | | Land | | Buildings, Fixtures and Improvements | | | Accumulated Depreciation
(3) (5) | | Date Acquired | | Date of Construction |
| 24 Hour Fitness | | Woodlands | | TX | | $ | — |
| | $ | 2,690 |
| | $ | 7,463 |
| | $ | 126 |
| | $ | 10,279 |
| | $ | (2,677 | ) | | 9/24/2013 | | 2002 |
| 7-Eleven | | Sarasota | | FL | | — |
| | 1,312 |
| | 1,312 |
| | — |
| | 2,624 |
| | (410 | ) | | 11/19/2012 | | 2000 |
| 7-Eleven | | La Feria | | TX | | — |
| | 219 |
| | 1,970 |
| | — |
| | 2,189 |
| | (602 | ) | | 2/15/2013 | | 2008 |
| 7-Eleven | | Pharr | | TX | | — |
| | 281 |
| | 2,531 |
| | — |
| | 2,812 |
| | (773 | ) | | 2/15/2013 | | 1995 |
| 7-Eleven | | Rio Hondo | | TX | | — |
| | 293 |
| | 2,640 |
| | — |
| | 2,933 |
| | (807 | ) | | 2/15/2013 | | 2008 |
| 7-Eleven | | Gloucester | | VA | | — |
| | 144 |
| | 578 |
| | — |
| | 722 |
| | (179 | ) | | 12/24/2012 | | 1985 |
| 7-Eleven | | Hampton | | VA | | — |
| | 69 |
| | 624 |
| | — |
| | 693 |
| | (193 | ) | | 12/24/2012 | | 1986 |
| 7-Eleven | | Hampton | | VA | | — |
| | 161 |
| | 644 |
| | — |
| | 805 |
| | (200 | ) | | 12/24/2012 | | 1959 |
| AAA | | Oklahoma City | | OK | | — |
| | 3,639 |
| | 32,567 |
| | — |
| | 36,206 |
| | (8,038 | ) | | 2/7/2014 | | 2009 |
| Aaron's | | Oneonta | | AL | | 614 |
| | 205 |
| | 1,080 |
| | — |
| | 1,285 |
| | (294 | ) | | 2/7/2014 | | 2008 |
| Aaron's | | Oxford | | AL | | — |
| | 278 |
| | 748 |
| | — |
| | 1,026 |
| | (189 | ) | | 2/7/2014 | | 1989 |
| Aaron's | | Valley | | AL | | 409 |
| | 141 |
| | 827 |
| | — |
| | 968 |
| | (213 | ) | | 2/7/2014 | | 2009 |
| Aaron's | | El Dorado | | AR | | — |
| | 238 |
| | 743 |
| | — |
| | 981 |
| | (212 | ) | | 2/7/2014 | | 2000 |
| Aaron's | | Springdale | | AR | | 624 |
| | 513 |
| | 916 |
| | — |
| | 1,429 |
| | (258 | ) | | 2/7/2014 | | 2009 |
| Aaron's | | Auburndale | | FL | | 2,647 |
| | 1,351 |
| | 5,127 |
| | — |
| | 6,478 |
| | (1,373 | ) | | 2/7/2014 | | 2009 |
| Aaron's | | Pensacola | | FL | | — |
| | 159 |
| | 924 |
| | — |
| | 1,083 |
| | (237 | ) | | 2/7/2014 | | 1979 |
| Aaron's | | Statesboro | | GA | | — |
| | 351 |
| | 1,163 |
| | — |
| | 1,514 |
| | (307 | ) | | 2/7/2014 | | 2008 |
| Aaron's | | Indianapolis | | IN | | — |
| | 235 |
| | 1,071 |
| | — |
| | 1,306 |
| | (270 | ) | | 2/7/2014 | | 1998 |
| Aaron's | | Lafayette | | IN | | 550 |
| | 404 |
| | 652 |
| | — |
| | 1,056 |
| | (203 | ) | | 2/7/2014 | | 1989 |
| Aaron's | | Mansura | | LA | | — |
| | 81 |
| | 497 |
| | — |
| | 578 |
| | (146 | ) | | 2/7/2014 | | 2000 |
| Aaron's | | Minden | | LA | | — |
| | 323 |
| | 1,043 |
| | — |
| | 1,366 |
| | (320 | ) | | 2/7/2014 | | 2008 |
| Aaron's | | Battle Creek | | MI | | — |
| | 286 |
| | 843 |
| | — |
| | 1,129 |
| | (222 | ) | | 2/7/2014 | | 1995 |
| Aaron's | | Benton Harbor | | MI | | — |
| | 217 |
| | 924 |
| | — |
| | 1,141 |
| | (246 | ) | | 2/7/2014 | | 1997 |
| Aaron's | | Redford | | MI | | 434 |
| | 125 |
| | 698 |
| | — |
| | 823 |
| | (209 | ) | | 2/7/2014 | | 1972 |
| Aaron's | | Kennett | | MO | | 319 |
| | 203 |
| | 473 |
| | — |
| | 676 |
| | (136 | ) | | 2/7/2014 | | 1999 |
| Aaron's | | Greenwood | | MS | | — |
| | 156 |
| | 967 |
| | — |
| | 1,123 |
| | (266 | ) | | 2/19/2014 | | 2006 |
| Aaron's | | Magnolia | | MS | | 1,473 |
| | 287 |
| | 2,791 |
| | — |
| | 3,078 |
| | (687 | ) | | 2/7/2014 | | 2000 |
| Aaron's | | Charlotte | | NC | | 579 |
| | 308 |
| | 1,201 |
| | — |
| | 1,509 |
| | (299 | ) | | 2/7/2014 | | 1994 |
| Aaron's | | Bowling Green | | OH | | 564 |
| | 326 |
| | 928 |
| | — |
| | 1,254 |
| | (262 | ) | | 2/7/2014 | | 2009 |
| Aaron's | | Kent | | OH | | 614 |
| | 245 |
| | 1,080 |
| | — |
| | 1,325 |
| | (311 | ) | | 2/7/2014 | | 1999 |
| Aaron's | | North Olmsted | | OH | | 449 |
| | 218 |
| | 753 |
| | — |
| | 971 |
| | (224 | ) | | 2/7/2014 | | 1960 |
|
| | | | | | | | | | | | | | | | | | | | | | | | | | | | | | | | |
| | | | | | | | Initial Costs (1) | | Costs Capitalized Subsequent to Acquisition (2) | | Gross Amount
Carried at
December 31, 2016
(3) (4) | | | | | | |
| Property | | City | | State | | Encumbrances at
December 31, 2016 | | Land | | Buildings, Fixtures and Improvements | | | Accumulated Depreciation
(3) (5) | | Date Acquired | | Date of Construction |
| Aaron Rents | | Columbia | | SC | | — |
| | 576 |
| | 1,010 |
| | — |
| | 1,586 |
| | (153 | ) | | 2/7/2014 | | 1977 |
| Aaron Rents | | Marion | | SC | | 319 |
| | 100 |
| | 685 |
| | — |
| | 785 |
| | (104 | ) | | 2/7/2014 | | 2008 |
| Aaron Rents | | Chattanooga | | TN | | — |
| | 480 |
| | 1,075 |
| | — |
| | 1,555 |
| | (149 | ) | | 2/7/2014 | | 1989 |
| Aaron Rents | | Copperas Cove | | TX | | — |
| | 423 |
| | 1,341 |
| | — |
| | 1,764 |
| | (205 | ) | | 2/7/2014 | | 2007 |
| Aaron Rents | | Haltom City | | TX | | — |
| | 858 |
| | 1,024 |
| | — |
| | 1,882 |
| | (172 | ) | | 2/7/2014 | | 2008 |
| Aaron Rents | | Humble | | TX | | — |
| | 548 |
| | 1,146 |
| | — |
| | 1,694 |
| | (179 | ) | | 2/7/2014 | | 2008 |
| Aaron Rents | | Killeen | | TX | | — |
| | 815 |
| | 3,244 |
| | — |
| | 4,059 |
| | (495 | ) | | 2/7/2014 | | 1981 |
| Aaron Rents | | Kingsville | | TX | | 599 |
| | 345 |
| | 1,040 |
| | — |
| | 1,385 |
| | (159 | ) | | 2/7/2014 | | 2009 |
| Aaron Rents | | Livingston | | TX | | — |
| | 173 |
| | 1,498 |
| | — |
| | 1,671 |
| | (229 | ) | | 2/7/2014 | | 2008 |
| Aaron Rents | | Mexia | | TX | | — |
| | 126 |
| | 1,186 |
| | — |
| | 1,312 |
| | (183 | ) | | 2/7/2014 | | 2007 |
| Aaron Rents | | Mission | | TX | | 549 |
| | 324 |
| | 954 |
| | — |
| | 1,278 |
| | (145 | ) | | 2/7/2014 | | 2009 |
| Aaron Rents | | Odessa | | TX | | — |
| | 99 |
| | 768 |
| | — |
| | 867 |
| | (121 | ) | | 2/7/2014 | | 2006 |
| Aaron Rents | | Pasadena | | TX | | — |
| | 444 |
| | 1,231 |
| | — |
| | 1,675 |
| | (192 | ) | | 2/7/2014 | | 2009 |
| Aaron Rents | | Port Lavaca | | TX | | — |
| | 160 |
| | 1,274 |
| | — |
| | 1,434 |
| | (196 | ) | | 2/7/2014 | | 2007 |
| Aaron Rents | | Texas City | | TX | | — |
| | 275 |
| | 2,156 |
| | — |
| | 2,431 |
| | (328 | ) | | 2/7/2014 | | 2008 |
| Aaron Rents | | Richmond | | VA | | — |
| | 508 |
| | 1,435 |
| | — |
| | 1,943 |
| | (249 | ) | | 2/7/2014 | | 1988 |
| Abbott Laboratories | | Waukegan | | IL | | — |
| | 4,734 |
| | 21,319 |
| | 601 |
| | 26,654 |
| | (3,636 | ) | | 11/5/2013 | | 1980 |
| Abbott Laboratories | | Columbus | | OH | | — |
| | 800 |
| | 11,385 |
| | (7,632 | ) | | 4,553 |
| | (183 | ) | | 11/5/2013 | | 1980 |
| Abuelo's | | Rogers | | AR | | — |
| | 825 |
| | 2,296 |
| | — |
| | 3,121 |
| | (466 | ) | | 6/27/2013 | | 2003 |
| Academy Sports | | Mobile | | AL | | — |
| | 1,311 |
| | 7,431 |
| | — |
| | 8,742 |
| | (1,117 | ) | | 11/1/2013 | | 2012 |
| Academy Sports | | Montgomery | | AL | | — |
| | 1,869 |
| | 6,385 |
| | — |
| | 8,254 |
| | (1,063 | ) | | 2/7/2014 | | 2009 |
| Academy Sports | | Fayetteville | | AR | | 7,290 |
| | 1,900 |
| | 7,601 |
| | — |
| | 9,501 |
| | (2,158 | ) | | 12/28/2012 | | 2012 |
| Academy Sports | | Dalton | | GA | | 4,965 |
| | 998 |
| | 5,656 |
| | — |
| | 6,654 |
| | (1,540 | ) | | 2/20/2013 | | 2012 |
| Academy Sports | | Bossier City | | LA | | — |
| | 2,906 |
| | 6,555 |
| | — |
| | 9,461 |
| | (1,004 | ) | | 2/7/2014 | | 2008 |
| Academy Sports | | Johnson City | | TN | | — |
| | 1,902 |
| | 6,440 |
| | — |
| | 8,342 |
| | (8 | ) | | 12/19/2016 | | 2015 |
| Academy Sports | | Smyrna | | TN | | — |
| | 2,109 |
| | 8,434 |
| | — |
| | 10,543 |
| | (1,267 | ) | | 11/1/2013 | | 2012 |
| Academy Sports | | Austin | | TX | | 5,043 |
| | 4,216 |
| | 8,755 |
| | — |
| | 12,971 |
| | (1,141 | ) | | 2/7/2014 | | 1988 |
| Academy Sports | | Fort Worth | | TX | | — |
| | 2,072 |
| | 8,329 |
| | — |
| | 10,401 |
| | (1,099 | ) | | 2/7/2014 | | 2009 |
| Academy Sports | | Killeen | | TX | | 3,256 |
| | 2,779 |
| | 5,321 |
| | — |
| | 8,100 |
| | (747 | ) | | 2/7/2014 | | 2009 |
| Academy Sports | | Laredo | | TX | | — |
| | 2,782 |
| | 8,111 |
| | — |
| | 10,893 |
| | (1,111 | ) | | 2/7/2014 | | 2008 |
| Advance Auto Parts | | Birmingham | | AL | | — |
| | 455 |
| | 373 |
| | — |
| | 828 |
| | (81 | ) | | 2/28/2013 | | 1997 |
| Advance Auto Parts | | Birmingham | | AL | | — |
| | 330 |
| | 494 |
| | — |
| | 824 |
| | (108 | ) | | 2/28/2013 | | 1999 |
|
| | | | | | | | | | | | | | | | | | | | | | | | | | | | | | | | |
| | | | | | | | Initial Costs (1) | | Costs Capitalized Subsequent to Acquisition (2) | | Gross Amount
Carried at
December 31, 2018
(3) (4) | | | | | | |
| Property | | City | | State | | Encumbrances at
December 31, 2018 | | Land | | Buildings, Fixtures and Improvements | | | Accumulated Depreciation
(3) (5) | | Date Acquired | | Date of Construction |
| Aaron's | | Shawnee | | OK | | — |
| | 303 |
| | 1,135 |
| | — |
| | 1,438 |
| | (311 | ) | | 2/7/2014 | | 2008 |
| Aaron's | | Bloomsburg | | PA | | 400 |
| | 224 |
| | 856 |
| | — |
| | 1,080 |
| | (219 | ) | | 2/7/2014 | | 1996 |
| Aaron's | | Meadville | | PA | | — |
| | 237 |
| | 1,224 |
| | — |
| | 1,461 |
| | (326 | ) | | 2/7/2014 | | 1994 |
| Aaron's | | Columbia | | SC | | — |
| | 576 |
| | 1,010 |
| | — |
| | 1,586 |
| | (259 | ) | | 2/7/2014 | | 1977 |
| Aaron's | | Marion | | SC | | 319 |
| | 100 |
| | 685 |
| | — |
| | 785 |
| | (177 | ) | | 2/7/2014 | | 2008 |
| Aaron's | | Chattanooga | | TN | | — |
| | 480 |
| | 1,075 |
| | — |
| | 1,555 |
| | (252 | ) | | 2/7/2014 | | 1989 |
| Aaron's | | Copperas Cove | | TX | | — |
| | 423 |
| | 1,341 |
| | — |
| | 1,764 |
| | (347 | ) | | 2/7/2014 | | 2007 |
| Aaron's | | Haltom City | | TX | | — |
| | 858 |
| | 1,024 |
| | — |
| | 1,882 |
| | (291 | ) | | 2/7/2014 | | 2008 |
| Aaron's | | Humble | | TX | | — |
| | 548 |
| | 1,146 |
| | — |
| | 1,694 |
| | (304 | ) | | 2/7/2014 | | 2008 |
| Aaron's | | Killeen | | TX | | — |
| | 815 |
| | 3,244 |
| | — |
| | 4,059 |
| | (840 | ) | | 2/7/2014 | | 1981 |
| Aaron's | | Kingsville | | TX | | 599 |
| | 345 |
| | 1,040 |
| | — |
| | 1,385 |
| | (270 | ) | | 2/7/2014 | | 2009 |
| Aaron's | | Livingston | | TX | | — |
| | 173 |
| | 1,498 |
| | — |
| | 1,671 |
| | (388 | ) | | 2/7/2014 | | 2008 |
| Aaron's | | Mexia | | TX | | — |
| | 126 |
| | 1,186 |
| | — |
| | 1,312 |
| | (309 | ) | | 2/7/2014 | | 2007 |
| Aaron's | | Mission | | TX | | 549 |
| | 324 |
| | 954 |
| | — |
| | 1,278 |
| | (246 | ) | | 2/7/2014 | | 2009 |
| Aaron's | | Odessa | | TX | | — |
| | 99 |
| | 768 |
| | — |
| | 867 |
| | (206 | ) | | 2/7/2014 | | 2006 |
| Aaron's | | Pasadena | | TX | | — |
| | 444 |
| | 1,231 |
| | — |
| | 1,675 |
| | (325 | ) | | 2/7/2014 | | 2009 |
| Aaron's | | Port Lavaca | | TX | | — |
| | 160 |
| | 1,274 |
| | — |
| | 1,434 |
| | (333 | ) | | 2/7/2014 | | 2007 |
| Aaron's | | Texas City | | TX | | — |
| | 275 |
| | 2,156 |
| | — |
| | 2,431 |
| | (556 | ) | | 2/7/2014 | | 2008 |
| Aaron's | | Richmond | | VA | | — |
| | 508 |
| | 1,435 |
| | — |
| | 1,943 |
| | (422 | ) | | 2/7/2014 | | 1988 |
| Abbott Laboratories | | Waukegan | | IL | | — |
| | 4,734 |
| | 21,319 |
| | 1,917 |
| | 27,970 |
| | (5,703 | ) | | 11/5/2013 | | 1980 |
| Abuelo's | | Rogers | | AR | | — |
| | 825 |
| | 2,296 |
| | — |
| | 3,121 |
| | (697 | ) | | 6/27/2013 | | 2003 |
| Academy Sports | | Mobile | | AL | | — |
| | 1,311 |
| | 7,431 |
| | — |
| | 8,742 |
| | (1,818 | ) | | 11/1/2013 | | 2012 |
| Academy Sports | | Montgomery | | AL | | — |
| | 1,869 |
| | 6,385 |
| | — |
| | 8,254 |
| | (1,802 | ) | | 2/7/2014 | | 2009 |
| Academy Sports | | Fayetteville | | AR | | 7,290 |
| | 1,900 |
| | 7,601 |
| | — |
| | 9,501 |
| | (2,862 | ) | | 12/28/2012 | | 2012 |
| Academy Sports | | Dalton | | GA | | 4,965 |
| | 998 |
| | 5,656 |
| | — |
| | 6,654 |
| | (2,107 | ) | | 2/20/2013 | | 2012 |
| Academy Sports | | Bossier City | | LA | | — |
| | 2,906 |
| | 6,555 |
| | — |
| | 9,461 |
| | (1,702 | ) | | 2/7/2014 | | 2008 |
| Academy Sports | | Johnson City | | TN | | — |
| | 1,902 |
| | 6,440 |
| | — |
| | 8,342 |
| | (399 | ) | | 12/19/2016 | | 2015 |
| Academy Sports | | Smyrna | | TN | | — |
| | 2,109 |
| | 8,434 |
| | — |
| | 10,543 |
| | (2,064 | ) | | 11/1/2013 | | 2012 |
| Academy Sports | | Austin | | TX | | 5,044 |
| | 4,216 |
| | 8,755 |
| | — |
| | 12,971 |
| | (1,935 | ) | | 2/7/2014 | | 1988 |
| Academy Sports | | Fort Worth | | TX | | — |
| | 2,072 |
| | 8,329 |
| | — |
| | 10,401 |
| | (1,863 | ) | | 2/7/2014 | | 2009 |
| Academy Sports | | Killeen | | TX | | 3,165 |
| | 2,779 |
| | 5,321 |
| | — |
| | 8,100 |
| | (1,266 | ) | | 2/7/2014 | | 2009 |
| Academy Sports | | Laredo | | TX | | — |
| | 2,782 |
| | 8,111 |
| | — |
| | 10,893 |
| | (1,884 | ) | | 2/7/2014 | | 2008 |
| | | | | | Initial Costs (1) | | Costs Capitalized Subsequent to Acquisition (2) | | Gross Amount
Carried at
December 31, 2016
(3) (4) | | | | | | Initial Costs (1) | | Costs Capitalized Subsequent to Acquisition (2) | | Gross Amount
Carried at
December 31, 2018
(3) (4) | | | |
| Property | | City | | State | | Encumbrances at
December 31, 2016 | | Land | | Buildings, Fixtures and Improvements | | Accumulated Depreciation
(3) (5) | | Date Acquired | | Date of Construction | | City | | State | | Encumbrances at
December 31, 2018 | | Land | | Buildings, Fixtures and Improvements | | Accumulated Depreciation
(3) (5) | | Date Acquired | | Date of Construction |
| Accomplishments Through People | | | Columbus | | GA | | — |
| | 170 |
| | — |
| | — |
| | 170 |
| | — |
| | 6/27/2013 | | 1987 |
| Advance Auto Parts | | Calera | | AL | | — |
| | 723 |
| | 723 |
| | — |
| | 1,446 |
| | (164 | ) | | 12/27/2012 | | 2008 | | Birmingham | | AL | | — |
| | 455 |
| | 373 |
| | 58 |
| | 886 |
| | (115 | ) | | 2/28/2013 | | 1997 |
| Advance Auto Parts | | Dothan | | AL | | — |
| | 326 |
| | 326 |
| | (7 | ) | | 645 |
| | (73 | ) | | 12/31/2012 | | 1997 | | Birmingham | | AL | | — |
| | 330 |
| | 494 |
| | — |
| | 824 |
| | (151 | ) | | 2/28/2013 | | 1999 |
| Advance Auto Parts | | Enterprise | | AL | | — |
| | 280 |
| | 420 |
| | (6 | ) | | 694 |
| | (95 | ) | | 12/31/2012 | | 1995 | | Calera | | AL | | — |
| | 723 |
| | 723 |
| | — |
| | 1,446 |
| | (224 | ) | | 12/27/2012 | | 2008 |
| Advance Auto Parts | | Opelika | | AL | | — |
| | 289 |
| | 1,156 |
| | — |
| | 1,445 |
| | (241 | ) | | 4/24/2013 | | 2013 | | Dothan | | AL | | — |
| | 326 |
| | 326 |
| | (7 | ) | | 645 |
| | (100 | ) | | 12/31/2012 | | 1997 |
| Advance Auto Parts | | Brooklyn | | CT | | — |
| | 324 |
| | 1,429 |
| | — |
| | 1,753 |
| | (125 | ) | | 11/7/2014 | | 2006 | | Enterprise | | AL | | — |
| | 280 |
| | 420 |
| | (6 | ) | | 694 |
| | (129 | ) | | 12/31/2012 | | 1995 |
| Advance Auto Parts | | Bonita Springs | | FL | | 1,561 |
| | 1,219 |
| | 1,552 |
| | — |
| | 2,771 |
| | (255 | ) | | 2/7/2014 | | 2007 | | Opelika | | AL | | — |
| | 289 |
| | 1,156 |
| | — |
| | 1,445 |
| | (348 | ) | | 4/24/2013 | | 2013 |
| Advance Auto Parts | | Lehigh Acres | | FL | | 1,425 |
| | 379 |
| | 2,016 |
| | — |
| | 2,395 |
| | (303 | ) | | 2/7/2014 | | 2008 | | Brooklyn | | CT | | — |
| | 324 |
| | 1,429 |
| | — |
| | 1,753 |
| | (242 | ) | | 11/7/2014 | | 2006 |
| Advance Auto Parts | | Albany | | GA | | — |
| | 210 |
| | 629 |
| | (1 | ) | | 838 |
| | (143 | ) | | 12/31/2012 | | 1995 | | Bonita Springs | | FL | | 1,561 |
| | 1,219 |
| | 1,552 |
| | — |
| | 2,771 |
| | (432 | ) | | 2/7/2014 | | 2007 |
| Advance Auto Parts | | Cairo | | GA | | — |
| | 140 |
| | 326 |
| | (24 | ) | | 442 |
| | (71 | ) | | 12/31/2012 | | 1993 | | Lehigh Acres | | FL | | 1,425 |
| | 379 |
| | 2,016 |
| | — |
| | 2,395 |
| | (513 | ) | | 2/7/2014 | | 2008 |
| Advance Auto Parts | | Hazlehurst | | GA | | — |
| | 113 |
| | 451 |
| | — |
| | 564 |
| | (102 | ) | | 12/31/2012 | | 1998 | | Albany | | GA | | — |
| | 210 |
| | 629 |
| | 65 |
| | 904 |
| | (196 | ) | | 12/31/2012 | | 1995 |
| Advance Auto Parts | | Hinesville | | GA | | — |
| | 352 |
| | 430 |
| | — |
| | 782 |
| | (98 | ) | | 12/31/2012 | | 1994 | | Cairo | | GA | | — |
| | 140 |
| | 326 |
| | (24 | ) | | 442 |
| | (97 | ) | | 12/31/2012 | | 1993 |
| Advance Auto Parts | | Perry | | GA | | — |
| | 209 |
| | 487 |
| | (1 | ) | | 695 |
| | (110 | ) | | 12/31/2012 | | 1994 | | Hazlehurst | | GA | | — |
| | 113 |
| | 451 |
| | 55 |
| | 619 |
| | (140 | ) | | 12/31/2012 | | 1998 |
| Advance Auto Parts | | Thomasville | | GA | | — |
| | 251 |
| | 377 |
| | (30 | ) | | 598 |
| | (83 | ) | | 12/31/2012 | | 1997 | | Hinesville | | GA | | — |
| | 352 |
| | 430 |
| | — |
| | 782 |
| | (133 | ) | | 12/31/2012 | | 1994 |
| Advance Auto Parts | | Auburn | | IN | | 802 |
| | 337 |
| | 1,347 |
| | — |
| | 1,684 |
| | (363 | ) | | 3/29/2012 | | 2007 | | Perry | | GA | | — |
| | 209 |
| | 487 |
| | (1 | ) | | 695 |
| | (151 | ) | | 12/31/2012 | | 1994 |
| Advance Auto Parts | | Bedford | | IN | | 760 |
| | 100 |
| | 1,386 |
| | — |
| | 1,486 |
| | (204 | ) | | 2/7/2014 | | 2007 | | Thomasville | | GA | | — |
| | 251 |
| | 377 |
| | (30 | ) | | 598 |
| | (112 | ) | | 12/31/2012 | | 1997 |
| Advance Auto Parts | | Clinton | | IN | | — |
| | 182 |
| | 729 |
| | — |
| | 911 |
| | (145 | ) | | 6/5/2013 | | 2004 | | Auburn | | IN | | — |
| | 337 |
| | 1,347 |
| | — |
| | 1,684 |
| | (446 | ) | | 3/29/2012 | | 2007 |
| Advance Auto Parts | | Fort Wayne | | IN | | — |
| | 193 |
| | 450 |
| | — |
| | 643 |
| | (98 | ) | | 2/28/2013 | | 1998 | | Bedford | | IN | | 760 |
| | 100 |
| | 1,386 |
| | — |
| | 1,486 |
| | (346 | ) | | 2/7/2014 | | 2007 |
| Advance Auto Parts | | Fort Wayne | | IN | | — |
| | 200 |
| | 371 |
| | — |
| | 571 |
| | (81 | ) | | 2/28/2013 | | 1998 | | Clinton | | IN | | — |
| | 182 |
| | 729 |
| | — |
| | 911 |
| | (216 | ) | | 6/5/2013 | | 2004 |
| Advance Auto Parts | | Franklin | | IN | | 738 |
| | 511 |
| | 1,256 |
| | — |
| | 1,767 |
| | (180 | ) | | 2/7/2014 | | 2010 | | Fort Wayne | | IN | | — |
| | 193 |
| | 450 |
| | — |
| | 643 |
| | (137 | ) | | 2/28/2013 | | 1998 |
| Advance Auto Parts | | Mishawaka | | IN | | — |
| | 429 |
| | 1,373 |
| | — |
| | 1,802 |
| | (202 | ) | | 2/7/2014 | | 2007 | | Fort Wayne | | IN | | — |
| | 200 |
| | 371 |
| | — |
| | 571 |
| | (113 | ) | | 2/28/2013 | | 1998 |
| Advance Auto Parts | | Richmond | | IN | | — |
| | 377 |
| | 1,616 |
| | — |
| | 1,993 |
| | (234 | ) | | 2/7/2014 | | 2007 | | Franklin | | IN | | 738 |
| | 511 |
| | 1,256 |
| | — |
| | 1,767 |
| | (305 | ) | | 2/7/2014 | | 2010 |
| Advance Auto Parts | | Salina | | KS | | — |
| | 195 |
| | 782 |
| | — |
| | 977 |
| | (163 | ) | | 4/30/2013 | | 2006 | | Mishawaka | | IN | | — |
| | 429 |
| | 1,373 |
| | — |
| | 1,802 |
| | (342 | ) | | 2/7/2014 | | 2007 |
| Advance Auto Parts | | Barbourville | | KY | | — |
| | 194 |
| | 1,098 |
| | — |
| | 1,292 |
| | (229 | ) | | 4/15/2013 | | 2006 | | Richmond | | IN | | — |
| | 377 |
| | 1,616 |
| | — |
| | 1,993 |
| | (396 | ) | | 2/7/2014 | | 2007 |
| Advance Auto Parts | | Bardstown | | KY | | — |
| | 272 |
| | 1,090 |
| | 236 |
| | 1,598 |
| | (246 | ) | | 12/10/2012 | | 2005 | | Salina | | KS | | — |
| | 195 |
| | 782 |
| | — |
| | 977 |
| | (235 | ) | | 4/30/2013 | | 2006 |
| Advance Auto Parts | | Brandenburg | | KY | | — |
| | 186 |
| | 742 |
| | — |
| | 928 |
| | (169 | ) | | 12/10/2012 | | 2005 | | Barbourville | | KY | | — |
| | 194 |
| | 1,098 |
| | — |
| | 1,292 |
| | (330 | ) | | 4/15/2013 | | 2006 |
| Advance Auto Parts | | Crestwood | | KY | | 1,030 |
| | 400 |
| | 1,546 |
| | — |
| | 1,946 |
| | (220 | ) | | 2/7/2014 | | 2009 | | Bardstown | | KY | | — |
| | 272 |
| | 1,090 |
| | 234 |
| | 1,596 |
| | (342 | ) | | 12/10/2012 | | 2005 |
| Advance Auto Parts | | Florence | | KY | | — |
| | 550 |
| | 1,280 |
| | — |
| | 1,830 |
| | (193 | ) | | 2/7/2014 | | 2008 | | Brandenburg | | KY | | — |
| | 186 |
| | 742 |
| | — |
| | 928 |
| | (230 | ) | | 12/10/2012 | | 2005 |
| Advance Auto Parts | | Frankfort | | KY | | — |
| | 833 |
| | 1,034 |
| | — |
| | 1,867 |
| | (150 | ) | | 2/7/2014 | | 2007 | | Crestwood | | KY | | 1,030 |
| | 400 |
| | 1,546 |
| | — |
| | 1,946 |
| | (374 | ) | | 2/7/2014 | | 2009 |
| Advance Auto Parts | | Georgetown | | KY | | — |
| | 510 |
| | 1,323 |
| | — |
| | 1,833 |
| | (186 | ) | | 2/7/2014 | | 2007 | | Florence | | KY | | — |
| | 550 |
| | 1,280 |
| | — |
| | 1,830 |
| | (328 | ) | | 2/7/2014 | | 2008 |
| Advance Auto Parts | | Hardinsburg | | KY | | — |
| | 94 |
| | 845 |
| | — |
| | 939 |
| | (192 | ) | | 12/10/2012 | | 2007 | | Frankfort | | KY | | — |
| | 833 |
| | 1,034 |
| | — |
| | 1,867 |
| | (254 | ) | | 2/7/2014 | | 2007 |
| Advance Auto Parts | | Inez | | KY | | — |
| | 130 |
| | 1,174 |
| | — |
| | 1,304 |
| | (288 | ) | | 8/22/2012 | | 2010 | | Georgetown | | KY | | — |
| | 510 |
| | 1,323 |
| | — |
| | 1,833 |
| | (315 | ) | | 2/7/2014 | | 2007 |
| Advance Auto Parts | | Leitchfield | | KY | | — |
| | 104 |
| | 939 |
| | (5 | ) | | 1,038 |
| | (212 | ) | | 12/10/2012 | | 2005 | |
| | | | | | Initial Costs (1) | | Costs Capitalized Subsequent to Acquisition (2) | | Gross Amount
Carried at
December 31, 2016
(3) (4) | | | | | | Initial Costs (1) | | Costs Capitalized Subsequent to Acquisition (2) | | Gross Amount
Carried at
December 31, 2018
(3) (4) | | | |
| Property | | City | | State | | Encumbrances at
December 31, 2016 | | Land | | Buildings, Fixtures and Improvements | | Accumulated Depreciation
(3) (5) | | Date Acquired | | Date of Construction | | City | | State | | Encumbrances at
December 31, 2018 | | Land | | Buildings, Fixtures and Improvements | | Accumulated Depreciation
(3) (5) | | Date Acquired | | Date of Construction |
| Advance Auto Parts | | Louisville | | KY | | 740 |
| | 336 |
| | 1,289 |
| | — |
| | 1,625 |
| | (184 | ) | | 2/7/2014 | | 2009 | | Hardinsburg | | KY | | — |
| | 94 |
| | 845 |
| | — |
| | 939 |
| | (262 | ) | | 12/10/2012 | | 2007 |
| Advance Auto Parts | | West Liberty | | KY | | — |
| | 249 |
| | 996 |
| | — |
| | 1,245 |
| | (208 | ) | | 4/15/2013 | | 2006 | | Inez | | KY | | — |
| | 130 |
| | 1,174 |
| | — |
| | 1,304 |
| | (375 | ) | | 8/22/2012 | | 2010 |
| Advance Auto Parts | | Rayne | | LA | | — |
| | 122 |
| | 490 |
| | 26 |
| | 638 |
| | (100 | ) | | 5/21/2013 | | 2000 | | Leitchfield | | KY | | — |
| | 104 |
| | 939 |
| | (5 | ) | | 1,038 |
| | (289 | ) | | 12/10/2012 | | 2005 |
| Advance Auto Parts | | Brownstown | | MI | | — |
| | 482 |
| | 1,760 |
| | — |
| | 2,242 |
| | (254 | ) | | 2/7/2014 | | 2008 | | Louisville | | KY | | 740 |
| | 336 |
| | 1,289 |
| | — |
| | 1,625 |
| | (312 | ) | | 2/7/2014 | | 2009 |
| Advance Auto Parts | | Caro | | MI | | — |
| | 117 |
| | 665 |
| | (9 | ) | | 773 |
| | (188 | ) | | 11/23/2011 | | 2002 | | West Liberty | | KY | | — |
| | 249 |
| | 996 |
| | — |
| | 1,245 |
| | (300 | ) | | 4/15/2013 | | 2006 |
| Advance Auto Parts | | Charlotte | | MI | | — |
| | 123 |
| | 697 |
| | (6 | ) | | 814 |
| | (197 | ) | | 11/23/2011 | | 2002 | | Rayne | | LA | | — |
| | 122 |
| | 490 |
| | 84 |
| | 696 |
| | (150 | ) | | 5/21/2013 | | 2000 |
| Advance Auto Parts | | Flint | | MI | | — |
| | 133 |
| | 534 |
| | (3 | ) | | 664 |
| | (151 | ) | | 11/23/2011 | | 2002 | | Brownstown | | MI | | — |
| | 482 |
| | 1,760 |
| | — |
| | 2,242 |
| | (430 | ) | | 2/7/2014 | | 2008 |
| Advance Auto Parts | | Grand Rapids | | MI | | 657 |
| | 368 |
| | 1,296 |
| | — |
| | 1,664 |
| | (181 | ) | | 2/7/2014 | | 2008 | | Caro | | MI | | — |
| | 117 |
| | 665 |
| | (9 | ) | | 773 |
| | (225 | ) | | 11/23/2011 | | 2002 |
| Advance Auto Parts | | Howell | | MI | | 830 |
| | 439 |
| | 1,471 |
| | — |
| | 1,910 |
| | (210 | ) | | 2/7/2014 | | 2008 | | Charlotte | | MI | | — |
| | 123 |
| | 697 |
| | 92 |
| | 912 |
| | (238 | ) | | 11/23/2011 | | 2002 |
| Advance Auto Parts | | Livonia | | MI | | — |
| | 210 |
| | 643 |
| | — |
| | 853 |
| | (181 | ) | | 12/12/2011 | | 2003 | | Flint | | MI | | — |
| | 133 |
| | 534 |
| | (3 | ) | | 664 |
| | (181 | ) | | 11/23/2011 | | 2002 |
| Advance Auto Parts | | Manistee | | MI | | — |
| | 348 |
| | 1,043 |
| | — |
| | 1,391 |
| | (217 | ) | | 4/15/2013 | | 2007 | | Grand Rapids | | MI | | 657 |
| | 368 |
| | 1,296 |
| | — |
| | 1,664 |
| | (307 | ) | | 2/7/2014 | | 2008 |
| Advance Auto Parts | | Monroe | | MI | | — |
| | 549 |
| | 1,434 |
| | — |
| | 1,983 |
| | (208 | ) | | 2/7/2014 | | 2007 | | Howell | | MI | | 830 |
| | 439 |
| | 1,471 |
| | — |
| | 1,910 |
| | (356 | ) | | 2/7/2014 | | 2008 |
| Advance Auto Parts | | Romulus | | MI | | — |
| | 422 |
| | 1,568 |
| | — |
| | 1,990 |
| | (232 | ) | | 2/7/2014 | | 2007 | | Livonia | | MI | | — |
| | 210 |
| | 643 |
| | 49 |
| | 902 |
| | (219 | ) | | 12/12/2011 | | 2003 |
| Advance Auto Parts | | Sault Ste. Marie | | MI | | — |
| | 75 |
| | 671 |
| | 80 |
| | 826 |
| | (190 | ) | | 11/23/2011 | | 2003 | | Manistee | | MI | | — |
| | 348 |
| | 1,043 |
| | — |
| | 1,391 |
| | (314 | ) | | 4/15/2013 | | 2007 |
| Advance Auto Parts | | South Lyon | | MI | | — |
| | 402 |
| | 1,607 |
| | — |
| | 2,009 |
| | (230 | ) | | 2/7/2014 | | 2008 | | Monroe | | MI | | — |
| | 549 |
| | 1,434 |
| | — |
| | 1,983 |
| | (353 | ) | | 2/7/2014 | | 2007 |
| Advance Auto Parts | | Tecumseh | | MI | | — |
| | 281 |
| | 1,214 |
| | — |
| | 1,495 |
| | (165 | ) | | 5/27/2014 | | 2009 | | Romulus | | MI | | — |
| | 422 |
| | 1,568 |
| | — |
| | 1,990 |
| | (394 | ) | | 2/7/2014 | | 2007 |
| Advance Auto Parts | | Washington Twnshp | | MI | | — |
| | 645 |
| | 1,711 |
| | — |
| | 2,356 |
| | (248 | ) | | 2/7/2014 | | 2008 | | Sault Ste. Marie | | MI | | — |
| | 75 |
| | 671 |
| | 80 |
| | 826 |
| | (240 | ) | | 11/23/2011 | | 2003 |
| Advance Auto Parts | | Tupelo | | MS | | — |
| | 258 |
| | 427 |
| | — |
| | 685 |
| | (81 | ) | | 2/20/2014 | | 1998 | | South Lyon | | MI | | — |
| | 402 |
| | 1,607 |
| | — |
| | 2,009 |
| | (390 | ) | | 2/7/2014 | | 2008 |
| Advance Auto Parts | | Candler | | NC | | — |
| | 399 |
| | 1,202 |
| | — |
| | 1,601 |
| | (176 | ) | | 2/7/2014 | | 2012 | | Tecumseh | | MI | | — |
| | 281 |
| | 1,214 |
| | — |
| | 1,495 |
| | (290 | ) | | 5/27/2014 | | 2009 |
| Advance Auto Parts | | Charlotte | | NC | | — |
| | 723 |
| | 883 |
| | — |
| | 1,606 |
| | (133 | ) | | 2/7/2014 | | 2001 | | Washington Twnshp | | MI | | — |
| | 645 |
| | 1,711 |
| | — |
| | 2,356 |
| | (421 | ) | | 2/7/2014 | | 2008 |
| Advance Auto Parts | | Eden | | NC | | — |
| | 320 |
| | 746 |
| | — |
| | 1,066 |
| | (145 | ) | | 7/16/2013 | | 2004 | | Tupelo | | MS | | — |
| | 258 |
| | 427 |
| | — |
| | 685 |
| | (136 | ) | | 2/20/2014 | | 1998 |
| Advance Auto Parts | | Granite Falls | | NC | | — |
| | 251 |
| | 1,005 |
| | — |
| | 1,256 |
| | (247 | ) | | 8/9/2012 | | 2010 | | Candler | | NC | | — |
| | 399 |
| | 1,202 |
| | — |
| | 1,601 |
| | (299 | ) | | 2/7/2014 | | 2012 |
| Advance Auto Parts | | Rocky Mount | | NC | | — |
| | 348 |
| | 836 |
| | — |
| | 1,184 |
| | (144 | ) | | 2/21/2014 | | 2005 | | Charlotte | | NC | | — |
| | 723 |
| | 883 |
| | — |
| | 1,606 |
| | (226 | ) | | 2/7/2014 | | 2001 |
| Advance Auto Parts | | Lakewood | | NJ | | — |
| | 750 |
| | 1,750 |
| | — |
| | 2,500 |
| | (430 | ) | | 8/22/2012 | | 2010 | | Eden | | NC | | — |
| | 320 |
| | 746 |
| | — |
| | 1,066 |
| | (219 | ) | | 7/16/2013 | | 2004 |
| Advance Auto Parts | | Woodbury | | NJ | | — |
| | 446 |
| | 1,784 |
| | — |
| | 2,230 |
| | (455 | ) | | 6/20/2012 | | 2007 | | Granite Falls | | NC | | — |
| | 251 |
| | 1,005 |
| | — |
| | 1,256 |
| | (321 | ) | | 8/9/2012 | | 2010 |
| Advance Auto Parts | | Bethel | | OH | | 730 |
| | 234 |
| | 1,305 |
| | — |
| | 1,539 |
| | (191 | ) | | 2/7/2014 | | 2008 | | Rocky Mount | | NC | | — |
| | 348 |
| | 836 |
| | — |
| | 1,184 |
| | (244 | ) | | 2/21/2014 | | 2005 |
| Advance Auto Parts | | Canton | | OH | | 647 |
| | 443 |
| | 1,206 |
| | — |
| | 1,649 |
| | (186 | ) | | 2/7/2014 | | 2008 | | Lakewood | | NJ | | — |
| | 750 |
| | 1,750 |
| | — |
| | 2,500 |
| | (559 | ) | | 8/22/2012 | | 2010 |
| Advance Auto Parts | | Dayton | | OH | | — |
| | 470 |
| | 1,349 |
| | — |
| | 1,819 |
| | (203 | ) | | 2/7/2014 | | 2007 | | Woodbury | | NJ | | — |
| | 446 |
| | 1,784 |
| | — |
| | 2,230 |
| | (578 | ) | | 6/20/2012 | | 2007 |
| Advance Auto Parts | | Delaware | | OH | | 716 |
| | 502 |
| | 1,274 |
| | — |
| | 1,776 |
| | (190 | ) | | 2/7/2014 | | 2008 | | Bethel | | OH | | 730 |
| | 234 |
| | 1,305 |
| | — |
| | 1,539 |
| | (325 | ) | | 2/7/2014 | | 2008 |
| Advance Auto Parts | | Eaton | | OH | | — |
| | 157 |
| | 471 |
| | — |
| | 628 |
| | (94 | ) | | 6/13/2013 | | 1987 | | Canton | | OH | | 629 |
| | 443 |
| | 1,206 |
| | — |
| | 1,649 |
| | (315 | ) | | 2/7/2014 | | 2008 |
| Advance Auto Parts | | Franklin | | OH | | — |
| | 218 |
| | 873 |
| | — |
| | 1,091 |
| | (215 | ) | | 8/9/2012 | | 1984 | | Dayton | | OH | | — |
| | 470 |
| | 1,349 |
| | — |
| | 1,819 |
| | (344 | ) | | 2/7/2014 | | 2007 |
| Advance Auto Parts | | Holland | | OH | | 656 |
| | 131 |
| | 1,453 |
| | — |
| | 1,584 |
| | (209 | ) | | 2/7/2014 | | 2008 | | Delaware | | OH | | 696 |
| | 502 |
| | 1,274 |
| | — |
| | 1,776 |
| | (322 | ) | | 2/7/2014 | | 2008 |
| | | | | | Initial Costs (1) | | Costs Capitalized Subsequent to Acquisition (2) | | Gross Amount
Carried at
December 31, 2016
(3) (4) | | | | | | Initial Costs (1) | | Costs Capitalized Subsequent to Acquisition (2) | | Gross Amount
Carried at
December 31, 2018
(3) (4) | | | |
| Property | | City | | State | | Encumbrances at
December 31, 2016 | | Land | | Buildings, Fixtures and Improvements | | Accumulated Depreciation
(3) (5) | | Date Acquired | | Date of Construction | | City | | State | | Encumbrances at
December 31, 2018 | | Land | | Buildings, Fixtures and Improvements | | Accumulated Depreciation
(3) (5) | | Date Acquired | | Date of Construction |
| Advance Auto Parts | | Massillon | | OH | | — |
| | 218 |
| | 1,987 |
| | — |
| | 2,205 |
| | (291 | ) | | 2/7/2014 | | 2007 | | Eaton | | OH | | — |
| | 157 |
| | 471 |
| | — |
| | 628 |
| | (140 | ) | | 6/13/2013 | | 1987 |
| Advance Auto Parts | | Salem | | OH | | 660 |
| | 267 |
| | 1,147 |
| | — |
| | 1,414 |
| | (169 | ) | | 2/7/2014 | | 2009 | | Franklin | | OH | | — |
| | 218 |
| | 873 |
| | — |
| | 1,091 |
| | (279 | ) | | 8/9/2012 | | 1984 |
| Advance Auto Parts | | Springfield | | OH | | — |
| | 461 |
| | 1,075 |
| | — |
| | 1,536 |
| | (244 | ) | | 12/31/2012 | | 2005 | | Holland | | OH | | 638 |
| | 131 |
| | 1,453 |
| | — |
| | 1,584 |
| | (355 | ) | | 2/7/2014 | | 2008 |
| Advance Auto Parts | | Toledo | | OH | | 626 |
| | 116 |
| | 1,375 |
| | — |
| | 1,491 |
| | (198 | ) | | 2/7/2014 | | 2009 | | Massillon | | OH | | — |
| | 218 |
| | 1,987 |
| | — |
| | 2,205 |
| | (493 | ) | | 2/7/2014 | | 2007 |
| Advance Auto Parts | | Twinsburg | | OH | | 627 |
| | 486 |
| | 1,004 |
| | — |
| | 1,490 |
| | (152 | ) | | 2/7/2014 | | 2009 | | Salem | | OH | | 660 |
| | 267 |
| | 1,147 |
| | — |
| | 1,414 |
| | (286 | ) | | 2/7/2014 | | 2009 |
| Advance Auto Parts | | Van Wert | | OH | | — |
| | 33 |
| | 630 |
| | — |
| | 663 |
| | (125 | ) | | 6/13/2013 | | 1995 | | Springfield | | OH | | — |
| | 461 |
| | 1,075 |
| | — |
| | 1,536 |
| | (333 | ) | | 12/31/2012 | | 2005 |
| Advance Auto Parts | | Vermilion | | OH | | — |
| | 337 |
| | 1,079 |
| | — |
| | 1,416 |
| | (169 | ) | | 2/7/2014 | | 2006 | | Toledo | | OH | | 610 |
| | 116 |
| | 1,375 |
| | — |
| | 1,491 |
| | (336 | ) | | 2/7/2014 | | 2009 |
| Advance Auto Parts | | Warren | | OH | | 405 |
| | 83 |
| | 745 |
| | (2 | ) | | 826 |
| | (196 | ) | | 4/12/2012 | | 2003 | | Twinsburg | | OH | | 610 |
| | 486 |
| | 1,004 |
| | — |
| | 1,490 |
| | (257 | ) | | 2/7/2014 | | 2009 |
| Advance Auto Parts | | Oklahoma City | | OK | | — |
| | 208 |
| | 1,178 |
| | — |
| | 1,386 |
| | (290 | ) | | 8/9/2012 | | 2007 | | Van Wert | | OH | | — |
| | 33 |
| | 630 |
| | — |
| | 663 |
| | (187 | ) | | 6/13/2013 | | 1995 |
| Advance Auto Parts | | Sapulpa | | OK | | 704 |
| | 362 |
| | 1,300 |
| | — |
| | 1,662 |
| | (182 | ) | | 2/7/2014 | | 2007 | | Vermilion | | OH | | — |
| | 337 |
| | 1,079 |
| | — |
| | 1,416 |
| | (287 | ) | | 2/7/2014 | | 2006 |
| Advance Auto Parts | | Chambersburg | | PA | | — |
| | 553 |
| | 830 |
| | — |
| | 1,383 |
| | (181 | ) | | 2/28/2013 | | 1997 | | Warren | | OH | | — |
| | 83 |
| | 745 |
| | (2 | ) | | 826 |
| | (244 | ) | | 4/12/2012 | | 2003 |
| Advance Auto Parts | | Selinsgrove | | PA | | — |
| | 99 |
| | 891 |
| | — |
| | 990 |
| | (177 | ) | | 6/3/2013 | | 2003 | | Oklahoma City | | OK | | — |
| | 208 |
| | 1,178 |
| | — |
| | 1,386 |
| | (377 | ) | | 8/9/2012 | | 2007 |
| Advance Auto Parts | | Titusville | | PA | | — |
| | 207 |
| | 1,172 |
| | — |
| | 1,379 |
| | (266 | ) | | 12/12/2012 | | 2010 | | Sapulpa | | OK | | 704 |
| | 362 |
| | 1,300 |
| | — |
| | 1,662 |
| | (308 | ) | | 2/7/2014 | | 2007 |
| Advance Auto Parts | | Chapin | | SC | | — |
| | 395 |
| | 922 |
| | — |
| | 1,317 |
| | (235 | ) | | 6/20/2012 | | 2007 | | Chambersburg | | PA | | — |
| | 553 |
| | 830 |
| | — |
| | 1,383 |
| | (253 | ) | | 2/28/2013 | | 1997 |
| Advance Auto Parts | | Chesterfield | | SC | | — |
| | 131 |
| | 745 |
| | — |
| | 876 |
| | (190 | ) | | 6/27/2012 | | 2008 | | Selinsgrove | | PA | | — |
| | 99 |
| | 891 |
| | — |
| | 990 |
| | (264 | ) | | 6/3/2013 | | 2003 |
| Advance Auto Parts | | Greenwood | | SC | | 411 |
| | 210 |
| | 630 |
| | — |
| | 840 |
| | (170 | ) | | 3/9/2012 | | 1995 | | Titusville | | PA | | — |
| | 207 |
| | 1,172 |
| | — |
| | 1,379 |
| | (364 | ) | | 12/12/2012 | | 2010 |
| Advance Auto Parts | | Rock Hill | | SC | | — |
| | 506 |
| | 915 |
| | 44 |
| | 1,465 |
| | (134 | ) | | 2/7/2014 | | 1995 | | Chapin | | SC | | — |
| | 395 |
| | 922 |
| | — |
| | 1,317 |
| | (299 | ) | | 6/20/2012 | | 2007 |
| Advance Auto Parts | | Sweetwater | | TN | | — |
| | 360 |
| | 839 |
| | — |
| | 1,199 |
| | (194 | ) | | 11/29/2012 | | 2006 | | Chesterfield | | SC | | — |
| | 131 |
| | 745 |
| | — |
| | 876 |
| | (241 | ) | | 6/27/2012 | | 2008 |
| Advance Auto Parts | | Alton | | TX | | — |
| | 169 |
| | 958 |
| | (3 | ) | | 1,124 |
| | (226 | ) | | 10/18/2012 | | 2006 | | Greenwood | | SC | | — |
| | 210 |
| | 630 |
| | — |
| | 840 |
| | (209 | ) | | 3/9/2012 | | 1995 |
| Advance Auto Parts | | Deer Park | | TX | | — |
| | 295 |
| | 1,507 |
| | — |
| | 1,802 |
| | (213 | ) | | 2/7/2014 | | 2008 | | Rock Hill | | SC | | — |
| | 506 |
| | 915 |
| | 44 |
| | 1,465 |
| | (229 | ) | | 2/7/2014 | | 1995 |
| Advance Auto Parts | | Houston | | TX | | 800 |
| | 343 |
| | 1,029 |
| | — |
| | 1,372 |
| | (297 | ) | | 9/30/2011 | | 2006 | | Sweetwater | | TN | | — |
| | 360 |
| | 839 |
| | — |
| | 1,199 |
| | (262 | ) | | 11/29/2012 | | 2006 |
| Advance Auto Parts | | Houston | | TX | | 800 |
| | 248 |
| | 991 |
| | — |
| | 1,239 |
| | (286 | ) | | 9/30/2011 | | 2006 | | Alton | | TX | | — |
| | 169 |
| | 958 |
| | (3 | ) | | 1,124 |
| | (301 | ) | | 10/18/2012 | | 2006 |
| Advance Auto Parts | | Houston | | TX | | — |
| | 837 |
| | 685 |
| | — |
| | 1,522 |
| | (168 | ) | | 8/21/2012 | | 2007 | | Deer Park | | TX | | — |
| | 295 |
| | 1,507 |
| | — |
| | 1,802 |
| | (361 | ) | | 2/7/2014 | | 2008 |
| Advance Auto Parts | | Houston | | TX | | — |
| | 285 |
| | 1,405 |
| | — |
| | 1,690 |
| | (199 | ) | | 2/7/2014 | | 2006 | | Houston | | TX | | 800 |
| | 343 |
| | 1,029 |
| | — |
| | 1,372 |
| | (355 | ) | | 9/30/2011 | | 2006 |
| Advance Auto Parts | | Houston | | TX | | — |
| | 225 |
| | 1,293 |
| | — |
| | 1,518 |
| | (183 | ) | | 2/7/2014 | | 2008 | | Houston | | TX | | 800 |
| | 248 |
| | 991 |
| | — |
| | 1,239 |
| | (342 | ) | | 9/30/2011 | | 2006 |
| Advance Auto Parts | | Houston | | TX | | — |
| | 189 |
| | 1,666 |
| | — |
| | 1,855 |
| | (234 | ) | | 2/7/2014 | | 2008 | | Houston | | TX | | — |
| | 837 |
| | 685 |
| | — |
| | 1,522 |
| | (219 | ) | | 8/21/2012 | | 2007 |
| Advance Auto Parts | | Humble | | TX | | — |
| | 420 |
| | 1,404 |
| | — |
| | 1,824 |
| | (200 | ) | | 2/7/2014 | | 2007 | | Houston | | TX | | — |
| | 285 |
| | 1,405 |
| | — |
| | 1,690 |
| | (338 | ) | | 2/7/2014 | | 2006 |
| Advance Auto Parts | | Huntsville | | TX | | — |
| | 327 |
| | 1,278 |
| | — |
| | 1,605 |
| | (182 | ) | | 2/7/2014 | | 2008 | | Houston | | TX | | — |
| | 225 |
| | 1,293 |
| | — |
| | 1,518 |
| | (310 | ) | | 2/7/2014 | | 2008 |
| Advance Auto Parts | | Kingwood | | TX | | — |
| | 419 |
| | 1,392 |
| | — |
| | 1,811 |
| | (198 | ) | | 2/7/2014 | | 2009 | | Houston | | TX | | — |
| | 189 |
| | 1,666 |
| | — |
| | 1,855 |
| | (397 | ) | | 2/7/2014 | | 2008 |
| Advance Auto Parts | | Lubbock | | TX | | — |
| | 265 |
| | 1,259 |
| | — |
| | 1,524 |
| | (181 | ) | | 2/7/2014 | | 2008 | | Humble | | TX | | — |
| | 420 |
| | 1,404 |
| | — |
| | 1,824 |
| | (338 | ) | | 2/7/2014 | | 2007 |
| Advance Auto Parts | | Pasadena | | TX | | — |
| | 382 |
| | 1,146 |
| | — |
| | 1,528 |
| | (287 | ) | | 7/6/2012 | | 2008 | | Huntsville | | TX | | — |
| | 327 |
| | 1,278 |
| | — |
| | 1,605 |
| | (308 | ) | | 2/7/2014 | | 2008 |
| Advance Auto Parts | | Spring | | TX | | — |
| | 388 |
| | 1,616 |
| | — |
| | 2,004 |
| | (215 | ) | | 2/7/2014 | | 2007 | | Kingwood | | TX | | — |
| | 419 |
| | 1,392 |
| | — |
| | 1,811 |
| | (336 | ) | | 2/7/2014 | | 2009 |
| | | | | | Initial Costs (1) | | Costs Capitalized Subsequent to Acquisition (2) | | Gross Amount
Carried at
December 31, 2016
(3) (4) | | | | | | Initial Costs (1) | | Costs Capitalized Subsequent to Acquisition (2) | | Gross Amount
Carried at
December 31, 2018
(3) (4) | | | |
| Property | | City | | State | | Encumbrances at
December 31, 2016 | | Land | | Buildings, Fixtures and Improvements | | Accumulated Depreciation
(3) (5) | | Date Acquired | | Date of Construction | | City | | State | | Encumbrances at
December 31, 2018 | | Land | | Buildings, Fixtures and Improvements | | Accumulated Depreciation
(3) (5) | | Date Acquired | | Date of Construction |
| Advance Auto Parts | | | Lubbock | | TX | | — |
| | 265 |
| | 1,259 |
| | — |
| | 1,524 |
| | (306 | ) | | 2/7/2014 | | 2008 |
| Advance Auto Parts | | | Pasadena | | TX | | — |
| | 382 |
| | 1,146 |
| | — |
| | 1,528 |
| | (369 | ) | | 7/6/2012 | | 2008 |
| Advance Auto Parts | | | Spring | | TX | | — |
| | 388 |
| | 1,616 |
| | — |
| | 2,004 |
| | (365 | ) | | 2/7/2014 | | 2007 |
| Advance Auto Parts | | Webster | | TX | | — |
| | 385 |
| | 1,452 |
| | — |
| | 1,837 |
| | (205 | ) | | 2/7/2014 | | 2008 | | Webster | | TX | | — |
| | 385 |
| | 1,452 |
| | — |
| | 1,837 |
| | (348 | ) | | 2/7/2014 | | 2008 |
| Advance Auto Parts | | Appleton | | WI | | — |
| | 498 |
| | 1,228 |
| | — |
| | 1,726 |
| | (184 | ) | | 2/7/2014 | | 2007 | | Appleton | | WI | | — |
| | 498 |
| | 1,228 |
| | — |
| | 1,726 |
| | (313 | ) | | 2/7/2014 | | 2007 |
| Advance Auto Parts | | Fort Atkinson | | WI | | — |
| | 353 |
| | 824 |
| | — |
| | 1,177 |
| | (156 | ) | | 8/26/2013 | | 2004 | | Fort Atkinson | | WI | | — |
| | 353 |
| | 824 |
| | — |
| | 1,177 |
| | (240 | ) | | 8/26/2013 | | 2004 |
| Advance Auto Parts | | Janesville | | WI | | 939 |
| | 299 |
| | 1,695 |
| | — |
| | 1,994 |
| | (248 | ) | | 2/7/2014 | | 2007 | | Janesville | | WI | | 939 |
| | 299 |
| | 1,695 |
| | — |
| | 1,994 |
| | (420 | ) | | 2/7/2014 | | 2007 |
| Advance Auto Parts | | Kenosha | | WI | | — |
| | 569 |
| | 465 |
| | — |
| | 1,034 |
| | (99 | ) | | 3/13/2013 | | 2004 | | Kenosha | | WI | | — |
| | 569 |
| | 465 |
| | — |
| | 1,034 |
| | (141 | ) | | 3/13/2013 | | 2004 |
| Advance Auto Parts | | Milwaukee | | WI | | — |
| | 610 |
| | 1,473 |
| | — |
| | 2,083 |
| | (214 | ) | | 2/7/2014 | | 2008 | | Milwaukee | | WI | | — |
| | 610 |
| | 1,473 |
| | — |
| | 2,083 |
| | (364 | ) | | 2/7/2014 | | 2008 |
| Advance Auto Parts | | St. Mary's | | WV | | — |
| | 309 |
| | 928 |
| | — |
| | 1,237 |
| | (211 | ) | | 12/28/2012 | | 2007 | | St. Mary's | | WV | | — |
| | 309 |
| | 928 |
| | — |
| | 1,237 |
| | (288 | ) | | 12/28/2012 | | 2007 |
| Aetna Life Insurance | | Fresno | | CA | | — |
| | 3,405 |
| | 22,343 |
| | (3,611 | ) | | 22,137 |
| | (704 | ) | | 11/5/2013 | | 1969 | | Fresno | | CA | | — |
| | 3,405 |
| | 22,343 |
| | 2,917 |
| | 28,665 |
| | (2,453 | ) | | 11/5/2013 | | 1969 |
| AGCO | | Duluth | | GA | | 8,600 |
| | 3,503 |
| | 14,842 |
| | — |
| | 18,345 |
| | (1,835 | ) | | 2/7/2014 | | 1999 | | Duluth | | GA | | 8,600 |
| | 3,503 |
| | 14,842 |
| | — |
| | 18,345 |
| | (3,112 | ) | | 2/7/2014 | | 1999 |
| Albertson's | | Lake Havasu City | | AZ | | 3,508 |
| | 1,275 |
| | 5,396 |
| | — |
| | 6,671 |
| | (912 | ) | | 2/7/2014 | | 2003 | | Lake Havasu City | | AZ | | — |
| | 1,275 |
| | 5,396 |
| | — |
| | 6,671 |
| | (1,546 | ) | | 2/7/2014 | | 2003 |
| Albertson's | | Mesa | | AZ | | 2,997 |
| | 1,944 |
| | 4,145 |
| | — |
| | 6,089 |
| | (675 | ) | | 2/7/2014 | | 1997 | | Mesa | | AZ | | — |
| | 1,944 |
| | 4,145 |
| | — |
| | 6,089 |
| | (1,145 | ) | | 2/7/2014 | | 1997 |
| Albertson's | | Phoenix | | AZ | | 3,457 |
| | 2,456 |
| | 4,628 |
| | — |
| | 7,084 |
| | (748 | ) | | 2/7/2014 | | 1998 | | Phoenix | | AZ | | — |
| | 2,456 |
| | 4,628 |
| | — |
| | 7,084 |
| | (1,268 | ) | | 2/7/2014 | | 1998 |
| Albertson's | | Scottsdale | | AZ | | 5,602 |
| | 2,872 |
| | 7,943 |
| | — |
| | 10,815 |
| | (1,293 | ) | | 2/7/2014 | | 1991 | | Scottsdale | | AZ | | — |
| | 2,872 |
| | 7,943 |
| | — |
| | 10,815 |
| | (2,193 | ) | | 2/7/2014 | | 1991 |
| Albertson's | | Tucson | | AZ | | 5,362 |
| | 2,710 |
| | 7,704 |
| | — |
| | 10,414 |
| | (1,261 | ) | | 2/7/2014 | | 2000 | | Tucson | | AZ | | — |
| | 2,710 |
| | 7,704 |
| | — |
| | 10,414 |
| | (2,138 | ) | | 2/7/2014 | | 2000 |
| Albertson's | | Tucson | | AZ | | 2,688 |
| | 1,642 |
| | 3,587 |
| | — |
| | 5,229 |
| | (603 | ) | | 2/7/2014 | | 1994 | | Tucson | | AZ | | — |
| | 1,642 |
| | 3,587 |
| | — |
| | 5,229 |
| | (1,023 | ) | | 2/7/2014 | | 1994 |
| Albertson's | | Yuma | | AZ | | 4,341 |
| | 1,574 |
| | 6,452 |
| | — |
| | 8,026 |
| | (1,063 | ) | | 2/7/2014 | | 2003 | | Yuma | | AZ | | — |
| | 1,574 |
| | 6,452 |
| | — |
| | 8,026 |
| | (1,802 | ) | | 2/7/2014 | | 2003 |
| Albertson's | | Denver | | CO | | 3,793 |
| | 2,058 |
| | 5,286 |
| | — |
| | 7,344 |
| | (843 | ) | | 2/7/2014 | | 2002 | | Denver | | CO | | — |
| | 2,058 |
| | 5,286 |
| | — |
| | 7,344 |
| | (1,429 | ) | | 2/7/2014 | | 2002 |
| Albertson's | | Durango | | CO | | 3,724 |
| | 3,520 |
| | 3,404 |
| | — |
| | 6,924 |
| | (584 | ) | | 2/7/2014 | | 1993 | | Fort Collins | | CO | | — |
| | 1,288 |
| | 6,612 |
| | — |
| | 7,900 |
| | (1,815 | ) | | 2/7/2014 | | 1996 |
| Albertson's | | Fort Collins | | CO | | 4,275 |
| | 1,288 |
| | 6,612 |
| | — |
| | 7,900 |
| | (1,070 | ) | | 2/7/2014 | | 1996 | | Alexandria | | LA | | — |
| | 1,423 |
| | 6,024 |
| | — |
| | 7,447 |
| | (1,729 | ) | | 2/7/2014 | | 1990 |
| Albertson's | | Alexandria | | LA | | 4,060 |
| | 1,423 |
| | 6,024 |
| | — |
| | 7,447 |
| | (1,020 | ) | | 2/7/2014 | | 1990 | | Baton Rouge | | LA | | — |
| | 1,711 |
| | 7,061 |
| | — |
| | 8,772 |
| | (1,998 | ) | | 2/7/2014 | | 1991 |
| Albertson's | | Baton Rouge | | LA | | 4,673 |
| | 1,711 |
| | 7,061 |
| | — |
| | 8,772 |
| | (1,179 | ) | | 2/7/2014 | | 1991 | | Baton Rouge | | LA | | — |
| | 1,932 |
| | 7,836 |
| | — |
| | 9,768 |
| | (2,253 | ) | | 2/7/2014 | | 1985 |
| Albertson's | | Baton Rouge | | LA | | 3,883 |
| | 1,681 |
| | 5,673 |
| | — |
| | 7,354 |
| | (953 | ) | | 2/7/2014 | | 1992 | | Bossier City | | LA | | — |
| | 1,949 |
| | 5,125 |
| | — |
| | 7,074 |
| | (1,421 | ) | | 2/7/2014 | | 1988 |
| Albertson's | | Baton Rouge | | LA | | 5,358 |
| | 1,932 |
| | 7,836 |
| | — |
| | 9,768 |
| | (1,329 | ) | | 2/7/2014 | | 1985 | | Lafayette | | LA | | — |
| | 1,556 |
| | 7,926 |
| | — |
| | 9,482 |
| | (2,300 | ) | | 2/7/2014 | | 2000 |
| Albertson's | | Bossier City | | LA | | 3,555 |
| | 1,949 |
| | 5,125 |
| | — |
| | 7,074 |
| | (838 | ) | | 2/7/2014 | | 1988 | | Albuquerque | | NM | | — |
| | 2,950 |
| | 3,388 |
| | — |
| | 6,338 |
| | (1,316 | ) | | 2/7/2014 | | 1978 |
| Albertson's | | Lafayette | | LA | | 5,314 |
| | 1,556 |
| | 7,926 |
| | — |
| | 9,482 |
| | (1,356 | ) | | 2/7/2014 | | 2000 | | Farmington | | NM | | — |
| | 1,442 |
| | 2,505 |
| | — |
| | 3,947 |
| | (889 | ) | | 2/7/2014 | | 2002 |
| Albertson's | | Albuquerque | | NM | | 4,445 |
| | 2,834 |
| | 3,682 |
| | — |
| | 6,516 |
| | (825 | ) | | 2/7/2014 | | 1997 | | Las Cruces | | NM | | — |
| | 1,588 |
| | 5,719 |
| | — |
| | 7,307 |
| | (1,996 | ) | | 2/7/2014 | | 1997 |
| Albertson's | | Albuquerque | | NM | | 4,356 |
| | 2,950 |
| | 3,388 |
| | — |
| | 6,338 |
| | (776 | ) | | 2/7/2014 | | 1978 | | Los Lunas | | NM | | — |
| | 1,105 |
| | 4,770 |
| | — |
| | 5,875 |
| | (1,602 | ) | | 2/7/2014 | | 1991 |
| Albertson's | | Clovis | | NM | | 3,879 |
| | 769 |
| | 4,865 |
| | — |
| | 5,634 |
| | (930 | ) | | 2/7/2014 | | 1984 | |
| Albertson's | | Farmington | | NM | | 2,535 |
| | 1,442 |
| | 2,505 |
| | — |
| | 3,947 |
| | (524 | ) | | 2/7/2014 | | 2002 | |
| Albertson's | | Las Cruces | | NM | | — |
| | 1,588 |
| | 5,719 |
| | — |
| | 7,307 |
| | (1,177 | ) | | 2/7/2014 | | 1997 | |
| Albertson's | | Los Lunas | | NM | | 4,033 |
| | 1,105 |
| | 4,770 |
| | — |
| | 5,875 |
| | (945 | ) | | 2/7/2014 | | 1991 | |
| Albertson's | | Silver City | | NM | | 3,516 |
| | 591 |
| | 3,824 |
| | — |
| | 4,415 |
| | (816 | ) | | 2/7/2014 | | 1982 | |
| | | | | | Initial Costs (1) | | Costs Capitalized Subsequent to Acquisition (2) | | Gross Amount
Carried at
December 31, 2016
(3) (4) | | | | | | Initial Costs (1) | | Costs Capitalized Subsequent to Acquisition (2) | | Gross Amount
Carried at
December 31, 2018
(3) (4) | | | |
| Property | | City | | State | | Encumbrances at
December 31, 2016 | | Land | | Buildings, Fixtures and Improvements | | Accumulated Depreciation
(3) (5) | | Date Acquired | | Date of Construction | | City | | State | | Encumbrances at
December 31, 2018 | | Land | | Buildings, Fixtures and Improvements | | Accumulated Depreciation
(3) (5) | | Date Acquired | | Date of Construction |
| Albertson's | | Abilene | | TX | | 3,931 |
| | 1,187 |
| | 6,373 |
| | — |
| | 7,560 |
| | (1,031 | ) | | 2/7/2014 | | 1984 | | Abilene | | TX | | — |
| | 1,187 |
| | 6,373 |
| | — |
| | 7,560 |
| | (1,748 | ) | | 2/7/2014 | | 1984 |
| Albertson's | | Arlington | | TX | | 4,154 |
| | 1,714 |
| | 6,560 |
| | — |
| | 8,274 |
| | (1,060 | ) | | 2/7/2014 | | 2002 | | El Paso | | TX | | — |
| | 1,375 |
| | 6,447 |
| | — |
| | 7,822 |
| | (1,835 | ) | | 2/7/2014 | | 1978 |
| Albertson's | | El Paso | | TX | | 4,384 |
| | 1,375 |
| | 6,447 |
| | — |
| | 7,822 |
| | (1,082 | ) | | 2/7/2014 | | 1978 | | Fort Worth | | TX | | — |
| | 2,146 |
| | 4,678 |
| | — |
| | 6,824 |
| | (1,353 | ) | | 2/7/2014 | | 2000 |
| Albertson's | | Fort Worth | | TX | | 3,509 |
| | 2,146 |
| | 4,678 |
| | — |
| | 6,824 |
| | (798 | ) | | 2/7/2014 | | 2000 | | Fort Worth | | TX | | — |
| | 1,833 |
| | 7,311 |
| | — |
| | 9,144 |
| | (1,977 | ) | | 2/7/2014 | | 2004 |
| Albertson's | | Fort Worth | | TX | | 4,682 |
| | 1,833 |
| | 7,311 |
| | — |
| | 9,144 |
| | (1,166 | ) | | 2/7/2014 | | 2004 | | Fort Worth | | TX | | — |
| | 1,833 |
| | 4,528 |
| | — |
| | 6,361 |
| | (1,267 | ) | | 2/7/2014 | | 2002 |
| Albertson's | | Fort Worth | | TX | | 3,110 |
| | 1,833 |
| | 4,528 |
| | — |
| | 6,361 |
| | (747 | ) | | 2/7/2014 | | 2002 | | Fort Worth | | TX | | — |
| | 1,174 |
| | 6,255 |
| | — |
| | 7,429 |
| | (1,659 | ) | | 2/7/2014 | | 1988 |
| Albertson's | | Fort Worth | | TX | | 3,793 |
| | 1,174 |
| | 6,255 |
| | — |
| | 7,429 |
| | (979 | ) | | 2/7/2014 | | 1988 | | Midland | | TX | | — |
| | 1,002 |
| | 9,885 |
| | — |
| | 10,887 |
| | (2,667 | ) | | 2/7/2014 | | 1984 |
| Albertson's | | Midland | | TX | | 5,571 |
| | 1,002 |
| | 9,885 |
| | — |
| | 10,887 |
| | (1,572 | ) | | 2/7/2014 | | 1984 | | Odessa | | TX | | — |
| | 947 |
| | 8,867 |
| | — |
| | 9,814 |
| | (2,364 | ) | | 2/7/2014 | | 1985 |
| Albertson's | | Odessa | | TX | | 5,017 |
| | 947 |
| | 8,867 |
| | — |
| | 9,814 |
| | (1,394 | ) | | 2/7/2014 | | 1985 | | Weatherford | | TX | | — |
| | 1,820 |
| | 5,771 |
| | — |
| | 7,591 |
| | (1,610 | ) | | 2/7/2014 | | 2001 |
| Albertson's | | Weatherford | | TX | | 3,886 |
| | 1,820 |
| | 5,771 |
| | — |
| | 7,591 |
| | (949 | ) | | 2/7/2014 | | 2001 | |
| Ale House | | Orlando | | FL | | — |
| | 290 |
| | 3,647 |
| | (1,300 | ) | | 2,637 |
| | (77 | ) | | 6/27/2013 | | 1995 | | Orlando | | FL | | — |
| | 290 |
| | 3,647 |
| | (1,300 | ) | | 2,637 |
| | (377 | ) | | 6/27/2013 | | 1995 |
| Ale House | | St. Petersburg | | FL | | — |
| | 930 |
| | 3,116 |
| | — |
| | 4,046 |
| | (618 | ) | | 6/27/2013 | | 1995 | | St. Petersburg | | FL | | — |
| | 930 |
| | 3,116 |
| | — |
| | 4,046 |
| | (938 | ) | | 6/27/2013 | | 1995 |
| Aliberto's Mexican Food | | Holbrook | | AZ | | — |
| | 32 |
| | 96 |
| | — |
| | 128 |
| | (19 | ) | | 6/27/2013 | | 1981 | | Holbrook | | AZ | | — |
| | 32 |
| | 96 |
| | — |
| | 128 |
| | (28 | ) | | 6/27/2013 | | 1981 |
| Allied Power Group | | Houston | | TX | | — |
| | 1,659 |
| | 13,161 |
| | — |
| | 14,820 |
| | (2,319 | ) | | 6/12/2014 | | 2009 | |
| AM General | | Fort Wayne | | IN | | — |
| | — |
| | 26,409 |
| | 3,148 |
| | 29,557 |
| | (5,117 | ) | | 11/5/2013 | | 1994 | |
| Amazon | | West Columbia | | SC | | — |
| | 3,112 |
| | 53,103 |
| | — |
| | 56,215 |
| | (7,350 | ) | | 2/7/2014 | | 2012 | | West Columbia | | SC | | — |
| | 3,112 |
| | 53,103 |
| | — |
| | 56,215 |
| | (12,464 | ) | | 2/7/2014 | | 2012 |
| Amazon | | Charleston | | TN | | 38,500 |
| | 2,678 |
| | 50,880 |
| | — |
| | 53,558 |
| | (6,965 | ) | | 2/7/2014 | | 2011 | | Charleston | | TN | | 38,500 |
| | 2,678 |
| | 50,880 |
| | — |
| | 53,558 |
| | (11,810 | ) | | 2/7/2014 | | 2011 |
| Amazon | | Chattanooga | | TN | | 40,800 |
| | 1,995 |
| | 54,332 |
| | — |
| | 56,327 |
| | (7,617 | ) | | 2/7/2014 | | 2011 | | Chattanooga | | TN | | 40,800 |
| | 1,995 |
| | 54,332 |
| | — |
| | 56,327 |
| | (12,917 | ) | | 2/7/2014 | | 2011 |
| Amcor Rigid Plastics USA, Inc | | Alhambra | | CA | | — |
| | 7,143 |
| | 8,730 |
| | — |
| | 15,873 |
| | (2,108 | ) | | 1/24/2013 | | 1966 | |
| AMEC Foster Wheeler Oil & Gas | | Houston | | TX | | — |
| | 2,524 |
| | 30,398 |
| | — |
| | 32,922 |
| | (4,779 | ) | | 11/5/2013 | | 1998 | |
| Amec Foster Wheeler | | | Houston | | TX | | — |
| | 2,524 |
| | 30,398 |
| | — |
| | 32,922 |
| | (7,773 | ) | | 11/5/2013 | | 1998 |
| Amega West | | West Alexander | | PA | | — |
| | 117 |
| | 1,787 |
| | — |
| | 1,904 |
| | (215 | ) | | 6/12/2014 | | 2010 | | West Alexander | | PA | | — |
| | 117 |
| | 1,787 |
| | — |
| | 1,904 |
| | (384 | ) | | 6/12/2014 | | 2010 |
| Amega West | | Midland | | TX | | — |
| | 591 |
| | 379 |
| | — |
| | 970 |
| | (48 | ) | | 6/12/2014 | | 1979 | | Midland | | TX | | — |
| | 591 |
| | 379 |
| | — |
| | 970 |
| | (86 | ) | | 6/12/2014 | | 1979 |
| Ameriprise | | Ashwaubenon | | WI | | 10,998 |
| | 751 |
| | 14,260 |
| | — |
| | 15,011 |
| | (2,724 | ) | | 1/25/2013 | | 2000 | | Ashwaubenon | | WI | | 10,998 |
| | 751 |
| | 14,260 |
| | — |
| | 15,011 |
| | (3,854 | ) | | 1/25/2013 | | 2000 |
| Amesbury Truth | | | Statesville | | NC | | — |
| | 424 |
| | 23,261 |
| | 19 |
| | 23,704 |
| | (762 | ) | | 10/24/2017 | | 2017 |
| AON | | Lincolnshire | | IL | | 92,517 |
| | 5,336 |
| | 124,777 |
| | — |
| | 130,113 |
| | (27,503 | ) | | 11/16/2012 | | 1998 | | Lincolnshire | | IL | | 92,517 |
| | 5,336 |
| | 124,777 |
| | — |
| | 130,113 |
| | (38,558 | ) | | 11/16/2012 | | 1998 |
| Apple Market | | St. Joseph | | MO | | — |
| | 639 |
| | 1,638 |
| | — |
| | 2,277 |
| | (237 | ) | | 3/28/2014 | | 1981 | | St. Joseph | | MO | | — |
| | 639 |
| | 1,638 |
| | — |
| | 2,277 |
| | (407 | ) | | 3/28/2014 | | 1981 |
| Applebee's | | Auburn | | AL | | — |
| | 1,155 |
| | 1,732 |
| | — |
| | 2,887 |
| | (356 | ) | | 7/31/2013 | | 1993 | | Auburn | | AL | | — |
| | 1,155 |
| | 1,732 |
| | — |
| | 2,887 |
| | (540 | ) | | 7/31/2013 | | 1993 |
| Applebee's | | Oxford | | AL | | — |
| | 1,162 |
| | 2,157 |
| | — |
| | 3,319 |
| | (417 | ) | | 8/30/2013 | | 1995 | | Oxford | | AL | | — |
| | 1,162 |
| | 2,157 |
| | — |
| | 3,319 |
| | (644 | ) | | 8/30/2013 | | 1995 |
| Applebee's | | Phenix City | | AL | | — |
| | 1,488 |
| | 2,232 |
| | — |
| | 3,720 |
| | (459 | ) | | 7/31/2013 | | 1999 | | Phenix City | | AL | | — |
| | 1,488 |
| | 2,232 |
| | — |
| | 3,720 |
| | (696 | ) | | 7/31/2013 | | 1999 |
| Applebee's | | West Memphis | | AR | | — |
| | 388 |
| | 1,536 |
| | — |
| | 1,924 |
| | (264 | ) | | 2/7/2014 | | 2006 | | West Memphis | | AR | | — |
| | 388 |
| | 1,536 |
| | — |
| | 1,924 |
| | (448 | ) | | 2/7/2014 | | 2006 |
| Applebee's | | Arvada | | CO | | — |
| | 754 |
| | 1,760 |
| | — |
| | 2,514 |
| | (362 | ) | | 7/31/2013 | | 1996 | | Arvada | | CO | | — |
| | 754 |
| | 1,760 |
| | — |
| | 2,514 |
| | (549 | ) | | 7/31/2013 | | 1996 |
| Applebee's | | Brighton | | CO | | — |
| | 657 |
| | 1,972 |
| | — |
| | 2,629 |
| | (406 | ) | | 7/31/2013 | | 1998 | | Brighton | | CO | | — |
| | 657 |
| | 1,972 |
| | — |
| | 2,629 |
| | (615 | ) | | 7/31/2013 | | 1998 |
| Applebee's | | Colorado Springs | | CO | | — |
| | 499 |
| | 1,996 |
| | — |
| | 2,495 |
| | (411 | ) | | 7/31/2013 | | 1995 | | Colorado Springs | | CO | | — |
| | 499 |
| | 1,996 |
| | — |
| | 2,495 |
| | (622 | ) | | 7/31/2013 | | 1995 |
| Applebee's | | | Colorado Springs | | CO | | — |
| | 629 |
| | 1,888 |
| | — |
| | 2,517 |
| | (589 | ) | | 7/31/2013 | | 1994 |
| Applebee's | | | Greeley | | CO | | — |
| | 559 |
| | 2,235 |
| | — |
| | 2,794 |
| | (697 | ) | | 7/31/2013 | | 1995 |
| Applebee's | | | Northglenn | | CO | | — |
| | 578 |
| | 1,734 |
| | — |
| | 2,312 |
| | (541 | ) | | 7/31/2013 | | 1993 |
| | | | | | Initial Costs (1) | | Costs Capitalized Subsequent to Acquisition (2) | | Gross Amount
Carried at
December 31, 2016
(3) (4) | | | | | | Initial Costs (1) | | Costs Capitalized Subsequent to Acquisition (2) | | Gross Amount
Carried at
December 31, 2018
(3) (4) | | | |
| Property | | City | | State | | Encumbrances at
December 31, 2016 | | Land | | Buildings, Fixtures and Improvements | | Accumulated Depreciation
(3) (5) | | Date Acquired | | Date of Construction | | City | | State | | Encumbrances at
December 31, 2018 | | Land | | Buildings, Fixtures and Improvements | | Accumulated Depreciation
(3) (5) | | Date Acquired | | Date of Construction |
| Applebee's | | Colorado Springs | | CO | | — |
| | 629 |
| | 1,888 |
| | — |
| | 2,517 |
| | (389 | ) | | 7/31/2013 | | 1994 | | Pueblo | | CO | | — |
| | 752 |
| | 2,257 |
| | — |
| | 3,009 |
| | (698 | ) | | 8/30/2013 | | 1998 |
| Applebee's | | Greeley | | CO | | — |
| | 559 |
| | 2,235 |
| | — |
| | 2,794 |
| | (460 | ) | | 7/31/2013 | | 1995 | | Pueblo | | CO | | — |
| | 960 |
| | 2,879 |
| | — |
| | 3,839 |
| | (898 | ) | | 7/31/2013 | | 1998 |
| Applebee's | | Northglenn | | CO | | — |
| | 578 |
| | 1,734 |
| | — |
| | 2,312 |
| | (357 | ) | | 7/31/2013 | | 1993 | | Thornton | | CO | | — |
| | 681 |
| | 2,043 |
| | — |
| | 2,724 |
| | (632 | ) | | 8/30/2013 | | 1994 |
| Applebee's | | Pueblo | | CO | | — |
| | 752 |
| | 2,257 |
| | — |
| | 3,009 |
| | (453 | ) | | 8/30/2013 | | 1998 | | Bradenton | | FL | | — |
| | 2,475 |
| | 3,713 |
| | — |
| | 6,188 |
| | (1,158 | ) | | 7/31/2013 | | 1994 |
| Applebee's | | Pueblo | | CO | | — |
| | 960 |
| | 2,879 |
| | — |
| | 3,839 |
| | (593 | ) | | 7/31/2013 | | 1998 | | Brandon | | FL | | — |
| | 2,453 |
| | 3,647 |
| | — |
| | 6,100 |
| | (1,107 | ) | | 6/27/2013 | | 1997 |
| Applebee's | | Thornton | | CO | | — |
| | 681 |
| | 2,043 |
| | — |
| | 2,724 |
| | (410 | ) | | 8/30/2013 | | 1994 | | Crestview | | FL | | — |
| | 943 |
| | 1,752 |
| | — |
| | 2,695 |
| | (546 | ) | | 7/31/2013 | | 2000 |
| Applebee's | | Bradenton | | FL | | — |
| | 2,475 |
| | 3,713 |
| | — |
| | 6,188 |
| | (764 | ) | | 7/31/2013 | | 1994 | | Crystal River | | FL | | — |
| | 1,328 |
| | 2,467 |
| | — |
| | 3,795 |
| | (770 | ) | | 7/31/2013 | | 2001 |
| Applebee's | | Brandon | | FL | | — |
| | 2,453 |
| | 3,647 |
| | — |
| | 6,100 |
| | (741 | ) | | 6/27/2013 | | 1997 | | Davenport | | FL | | — |
| | 1,506 |
| | 4,517 |
| | — |
| | 6,023 |
| | (1,409 | ) | | 7/31/2013 | | 2007 |
| Applebee's | | Crestview | | FL | | — |
| | 943 |
| | 1,752 |
| | — |
| | 2,695 |
| | (360 | ) | | 7/31/2013 | | 2000 | | Inverness | | FL | | — |
| | 1,977 |
| | 2,965 |
| | — |
| | 4,942 |
| | (925 | ) | | 7/31/2013 | | 2000 |
| Applebee's | | Crystal River | | FL | | — |
| | 1,328 |
| | 2,467 |
| | — |
| | 3,795 |
| | (508 | ) | | 7/31/2013 | | 2001 | | Lakeland | | FL | | — |
| | 1,283 |
| | 2,383 |
| | — |
| | 3,666 |
| | (743 | ) | | 7/31/2013 | | 1997 |
| Applebee's | | Davenport | | FL | | — |
| | 1,506 |
| | 4,517 |
| | — |
| | 6,023 |
| | (929 | ) | | 7/31/2013 | | 2007 | | Lakeland | | FL | | — |
| | 1,959 |
| | 3,638 |
| | — |
| | 5,597 |
| | (1,135 | ) | | 7/31/2013 | | 2000 |
| Applebee's | | Inverness | | FL | | — |
| | 1,977 |
| | 2,965 |
| | — |
| | 4,942 |
| | (610 | ) | | 7/31/2013 | | 2000 | | Largo | | FL | | — |
| | 2,334 |
| | 3,501 |
| | — |
| | 5,835 |
| | (1,092 | ) | | 7/31/2013 | | 1995 |
| Applebee's | | Lakeland | | FL | | — |
| | 1,283 |
| | 2,383 |
| | — |
| | 3,666 |
| | (490 | ) | | 7/31/2013 | | 1997 | | New Port Richey | | FL | | — |
| | 1,695 |
| | 3,147 |
| | — |
| | 4,842 |
| | (982 | ) | | 7/31/2013 | | 1998 |
| Applebee's | | Lakeland | | FL | | — |
| | 1,959 |
| | 3,638 |
| | — |
| | 5,597 |
| | (749 | ) | | 7/31/2013 | | 2000 | | Plant City | | FL | | — |
| | 2,079 |
| | 2,869 |
| | — |
| | 4,948 |
| | (871 | ) | | 6/27/2013 | | 2001 |
| Applebee's | | Largo | | FL | | — |
| | 2,334 |
| | 3,501 |
| | — |
| | 5,835 |
| | (720 | ) | | 7/31/2013 | | 1995 | | Riverview | | FL | | — |
| | 1,849 |
| | 3,434 |
| | — |
| | 5,283 |
| | (1,071 | ) | | 7/31/2013 | | 2006 |
| Applebee's | | New Port Richey | | FL | | — |
| | 1,695 |
| | 3,147 |
| | — |
| | 4,842 |
| | (648 | ) | | 7/31/2013 | | 1998 | | St. Petersburg | | FL | | — |
| | 2,329 |
| | 3,493 |
| | — |
| | 5,822 |
| | (1,090 | ) | | 7/31/2013 | | 1994 |
| Applebee's | | Plant City | | FL | | — |
| | 2,079 |
| | 2,869 |
| | — |
| | 4,948 |
| | (583 | ) | | 6/27/2013 | | 2001 | | Temple Terrace | | FL | | — |
| | 2,396 |
| | 3,594 |
| | — |
| | 5,990 |
| | (1,121 | ) | | 7/31/2013 | | 1993 |
| Applebee's | | Riverview | | FL | | — |
| | 1,849 |
| | 3,434 |
| | — |
| | 5,283 |
| | (707 | ) | | 7/31/2013 | | 2006 | | Valrico | | FL | | — |
| | 1,202 |
| | 3,274 |
| | — |
| | 4,476 |
| | (994 | ) | | 6/27/2013 | | 1998 |
| Applebee's | | St. Petersburg | | FL | | — |
| | 2,329 |
| | 3,493 |
| | — |
| | 5,822 |
| | (719 | ) | | 7/31/2013 | | 1994 | | Wesley Chapel | | FL | | — |
| | 3,272 |
| | 3,272 |
| | — |
| | 6,544 |
| | (1,021 | ) | | 7/31/2013 | | 2000 |
| Applebee's | | Temple Terrace | | FL | | — |
| | 2,396 |
| | 3,594 |
| | — |
| | 5,990 |
| | (739 | ) | | 7/31/2013 | | 1993 | | Winter Haven | | FL | | — |
| | 2,130 |
| | 2,603 |
| | — |
| | 4,733 |
| | (812 | ) | | 7/31/2013 | | 1999 |
| Applebee's | | Valrico | | FL | | — |
| | 1,202 |
| | 3,274 |
| | — |
| | 4,476 |
| | (665 | ) | | 6/27/2013 | | 1998 | | Augusta | | GA | | — |
| | 1,254 |
| | 2,329 |
| | — |
| | 3,583 |
| | (726 | ) | | 7/31/2013 | | 1987 |
| Applebee's | | Wesley Chapel | | FL | | — |
| | 3,272 |
| | 3,272 |
| | — |
| | 6,544 |
| | (673 | ) | | 7/31/2013 | | 2000 | | Dublin | | GA | | — |
| | 1,171 |
| | 1,431 |
| | — |
| | 2,602 |
| | (446 | ) | | 7/31/2013 | | 1998 |
| Applebee's | | Winter Haven | | FL | | — |
| | 2,130 |
| | 2,603 |
| | — |
| | 4,733 |
| | (536 | ) | | 7/31/2013 | | 1999 | | Evans | | GA | | — |
| | 1,426 |
| | 2,649 |
| | — |
| | 4,075 |
| | (826 | ) | | 7/31/2013 | | 2004 |
| Applebee's | | Augusta | | GA | | — |
| | 1,254 |
| | 2,329 |
| | — |
| | 3,583 |
| | (479 | ) | | 7/31/2013 | | 1987 | | Milledgeville | | GA | | — |
| | 1,174 |
| | 1,761 |
| | — |
| | 2,935 |
| | (549 | ) | | 7/31/2013 | | 1999 |
| Applebee's | | Dublin | | GA | | — |
| | 1,171 |
| | 1,431 |
| | — |
| | 2,602 |
| | (294 | ) | | 7/31/2013 | | 1998 | | Savannah | | GA | | — |
| | 1,329 |
| | 2,468 |
| | — |
| | 3,797 |
| | (770 | ) | | 7/31/2013 | | 1994 |
| Applebee's | | Evans | | GA | | — |
| | 1,426 |
| | 2,649 |
| | — |
| | 4,075 |
| | (545 | ) | | 7/31/2013 | | 2004 | | Clinton | | IA | | — |
| | 490 |
| | 1,184 |
| | — |
| | 1,674 |
| | (356 | ) | | 6/27/2013 | | 1995 |
| Applebee's | | Milledgeville | | GA | | — |
| | 1,174 |
| | 1,761 |
| | — |
| | 2,935 |
| | (362 | ) | | 7/31/2013 | | 1999 | | Fort Dodge | | IA | | — |
| | — |
| | 1,363 |
| | — |
| | 1,363 |
| | (655 | ) | | 6/27/2013 | | 1995 |
| Applebee's | | Savannah | | GA | | — |
| | 1,329 |
| | 2,468 |
| | — |
| | 3,797 |
| | (508 | ) | | 7/31/2013 | | 1994 | | Marshalltown | | IA | | — |
| | 660 |
| | 1,175 |
| | — |
| | 1,835 |
| | (354 | ) | | 6/27/2013 | | 1995 |
| Applebee's | | Clinton | | IA | | — |
| | 490 |
| | 1,184 |
| | — |
| | 1,674 |
| | (235 | ) | | 6/27/2013 | | 1995 | | Mason City | | IA | | — |
| | 340 |
| | 1,495 |
| | — |
| | 1,835 |
| | (450 | ) | | 6/27/2013 | | 1995 |
| Applebee's | | Fort Dodge | | IA | | — |
| | — |
| | 1,363 |
| | — |
| | 1,363 |
| | (425 | ) | | 6/27/2013 | | 1995 | | Muscatine | | IA | | — |
| | 330 |
| | 1,266 |
| | — |
| | 1,596 |
| | (381 | ) | | 6/27/2013 | | 1995 |
| Applebee's | | Marshalltown | | IA | | — |
| | 660 |
| | 1,175 |
| | — |
| | 1,835 |
| | (233 | ) | | 6/27/2013 | | 1995 | | Boise | | ID | | — |
| | 948 |
| | 1,761 |
| | — |
| | 2,709 |
| | (549 | ) | | 7/31/2013 | | 1998 |
| Applebee's | | Mason City | | IA | | — |
| | 340 |
| | 1,495 |
| | — |
| | 1,835 |
| | (297 | ) | | 6/27/2013 | | 1995 | | Garden City | | ID | | — |
| | 628 |
| | 2,512 |
| | — |
| | 3,140 |
| | (777 | ) | | 8/30/2013 | | 2003 |
| | | | | | Initial Costs (1) | | Costs Capitalized Subsequent to Acquisition (2) | | Gross Amount
Carried at
December 31, 2016
(3) (4) | | | | | | Initial Costs (1) | | Costs Capitalized Subsequent to Acquisition (2) | | Gross Amount
Carried at
December 31, 2018
(3) (4) | | | |
| Property | | City | | State | | Encumbrances at
December 31, 2016 | | Land | | Buildings, Fixtures and Improvements | | Accumulated Depreciation
(3) (5) | | Date Acquired | | Date of Construction | | City | | State | | Encumbrances at
December 31, 2018 | | Land | | Buildings, Fixtures and Improvements | | Accumulated Depreciation
(3) (5) | | Date Acquired | | Date of Construction |
| Applebee's | | Muscatine | | IA | | — |
| | 330 |
| | 1,266 |
| | — |
| | 1,596 |
| | (251 | ) | | 6/27/2013 | | 1995 | | Nampa | | ID | | — |
| | 729 |
| | 2,915 |
| | — |
| | 3,644 |
| | (909 | ) | | 7/31/2013 | | 2000 |
| Applebee's | | Boise | | ID | | — |
| | 948 |
| | 1,761 |
| | — |
| | 2,709 |
| | (362 | ) | | 7/31/2013 | | 1998 | | Pocatello | | ID | | — |
| | 612 |
| | 1,837 |
| | — |
| | 2,449 |
| | (573 | ) | | 7/31/2013 | | 1998 |
| Applebee's | | Garden City | | ID | | — |
| | 628 |
| | 2,512 |
| | — |
| | 3,140 |
| | (504 | ) | | 8/30/2013 | | 2003 | | Marion | | IL | | — |
| | 855 |
| | 1,527 |
| | — |
| | 2,382 |
| | (469 | ) | | 2/7/2014 | | 1998 |
| Applebee's | | Nampa | | ID | | — |
| | 729 |
| | 2,915 |
| | — |
| | 3,644 |
| | (600 | ) | | 7/31/2013 | | 2000 | | Sterling | | IL | | — |
| | 390 |
| | 1,291 |
| | — |
| | 1,681 |
| | (389 | ) | | 6/27/2013 | | 1995 |
| Applebee's | | Pocatello | | ID | | — |
| | 612 |
| | 1,837 |
| | — |
| | 2,449 |
| | (378 | ) | | 7/31/2013 | | 1998 | | Swansea | | IL | | — |
| | 727 |
| | 1,741 |
| | — |
| | 2,468 |
| | (518 | ) | | 2/7/2014 | | 1998 |
| Applebee's | | Marion | | IL | | — |
| | 855 |
| | 1,527 |
| | — |
| | 2,382 |
| | (276 | ) | | 2/7/2014 | | 1998 | | Newton | | KS | | — |
| | 504 |
| | 1,569 |
| | — |
| | 2,073 |
| | (476 | ) | | 6/27/2013 | | 1998 |
| Applebee's | | Sterling | | IL | | — |
| | 390 |
| | 1,291 |
| | — |
| | 1,681 |
| | (256 | ) | | 6/27/2013 | | 1995 | | Fall River | | MA | | — |
| | 275 |
| | 1,558 |
| | — |
| | 1,833 |
| | (486 | ) | | 7/31/2013 | | 1994 |
| Applebee's | | Swansea | | IL | | — |
| | 727 |
| | 1,741 |
| | — |
| | 2,468 |
| | (305 | ) | | 2/7/2014 | | 1998 | | Adrian | | MI | | — |
| | 407 |
| | 2,351 |
| | — |
| | 2,758 |
| | (701 | ) | | 2/7/2014 | | 1995 |
| Applebee's | | Newton | | KS | | — |
| | 504 |
| | 1,569 |
| | — |
| | 2,073 |
| | (319 | ) | | 6/27/2013 | | 1998 | | Kalamazoo | | MI | | — |
| | 575 |
| | 2,644 |
| | — |
| | 3,219 |
| | (691 | ) | | 2/7/2014 | | 1994 |
| Applebee's | | Fall River | | MA | | — |
| | 275 |
| | 1,558 |
| | — |
| | 1,833 |
| | (321 | ) | | 7/31/2013 | | 1994 | | Farmington | | MO | | — |
| | 574 |
| | 2,242 |
| | — |
| | 2,816 |
| | (664 | ) | | 2/7/2014 | | 1999 |
| Applebee's | | Adrian | | MI | | — |
| | 407 |
| | 2,351 |
| | — |
| | 2,758 |
| | (414 | ) | | 2/7/2014 | | 1995 | | Joplin | | MO | | — |
| | 754 |
| | 1,829 |
| | — |
| | 2,583 |
| | (587 | ) | | 2/7/2014 | | 1994 |
| Applebee's | | Kalamazoo | | MI | | — |
| | 575 |
| | 2,644 |
| | — |
| | 3,219 |
| | (408 | ) | | 2/7/2014 | | 1994 | | Rolla | | MO | | — |
| | 671 |
| | 2,272 |
| | — |
| | 2,943 |
| | (674 | ) | | 2/7/2014 | | 1997 |
| Applebee's | | Farmington | | MO | | — |
| | 574 |
| | 2,242 |
| | — |
| | 2,816 |
| | (392 | ) | | 2/7/2014 | | 1999 | | St. Charles | | MO | | — |
| | 781 |
| | 1,075 |
| | — |
| | 1,856 |
| | (261 | ) | | 6/23/2014 | | 1990 |
| Applebee's | | Joplin | | MO | | — |
| | 754 |
| | 1,829 |
| | — |
| | 2,583 |
| | (346 | ) | | 2/7/2014 | | 1994 | | Horn Lake | | MS | | — |
| | 584 |
| | 1,642 |
| | — |
| | 2,226 |
| | (473 | ) | | 2/7/2014 | | 2005 |
| Applebee's | | Rolla | | MO | | — |
| | 671 |
| | 2,272 |
| | — |
| | 2,943 |
| | (397 | ) | | 2/7/2014 | | 1997 | | Ocean Springs | | MS | | — |
| | 673 |
| | 1,708 |
| | (1,359 | ) | | 1,022 |
| | (13 | ) | | 6/27/2013 | | 2000 |
| Applebee's | | St. Charles | | MO | | — |
| | 781 |
| | 1,075 |
| | — |
| | 1,856 |
| | (146 | ) | | 6/23/2014 | | 1990 | | Alamogordo | | NM | | — |
| | 271 |
| | 2,438 |
| | — |
| | 2,709 |
| | (754 | ) | | 8/30/2013 | | 2000 |
| Applebee's | | Horn Lake | | MS | | — |
| | 584 |
| | 1,642 |
| | — |
| | 2,226 |
| | (279 | ) | | 2/7/2014 | | 2005 | | Hobbs | | NM | | — |
| | 600 |
| | 3,401 |
| | — |
| | 4,001 |
| | (1,061 | ) | | 7/31/2013 | | 2002 |
| Applebee's | | Ocean Springs | | MS | | — |
| | 673 |
| | 1,708 |
| | — |
| | 2,381 |
| | (347 | ) | | 6/27/2013 | | 2000 | | Rio Rancho | | NM | | — |
| | 645 |
| | 3,654 |
| | — |
| | 4,299 |
| | (1,140 | ) | | 7/31/2013 | | 1995 |
| Applebee's | | Alamogordo | | NM | | — |
| | 271 |
| | 2,438 |
| | — |
| | 2,709 |
| | (490 | ) | | 8/30/2013 | | 2000 | | Roswell | | NM | | — |
| | 405 |
| | 2,295 |
| | — |
| | 2,700 |
| | (716 | ) | | 7/31/2013 | | 1998 |
| Applebee's | | Hobbs | | NM | | — |
| | 600 |
| | 3,401 |
| | — |
| | 4,001 |
| | (700 | ) | | 7/31/2013 | | 2002 | | North Canton | | OH | | — |
| | 152 |
| | 838 |
| | — |
| | 990 |
| | (255 | ) | | 6/27/2013 | | 1992 |
| Applebee's | | Rio Rancho | | NM | | — |
| | 645 |
| | 3,654 |
| | — |
| | 4,299 |
| | (752 | ) | | 7/31/2013 | | 1995 | | Clackamas | | OR | | — |
| | 901 |
| | 2,103 |
| | — |
| | 3,004 |
| | (656 | ) | | 7/31/2013 | | 1997 |
| Applebee's | | Roswell | | NM | | — |
| | 405 |
| | 2,295 |
| | — |
| | 2,700 |
| | (472 | ) | | 7/31/2013 | | 1998 | | Gresham | | OR | | — |
| | 853 |
| | 2,560 |
| | — |
| | 3,413 |
| | (792 | ) | | 8/30/2013 | | 2004 |
| Applebee's | | North Canton | | OH | | — |
| | 152 |
| | 838 |
| | — |
| | 990 |
| | (170 | ) | | 6/27/2013 | | 1992 | | Lake Oswego | | OR | | — |
| | 1,352 |
| | 1,652 |
| | — |
| | 3,004 |
| | (515 | ) | | 7/31/2013 | | 1993 |
| Applebee's | | Clackamas | | OR | | — |
| | 901 |
| | 2,103 |
| | — |
| | 3,004 |
| | (433 | ) | | 7/31/2013 | | 1997 | | Roseburg | | OR | | — |
| | 717 |
| | 1,673 |
| | — |
| | 2,390 |
| | (518 | ) | | 8/30/2013 | | 2000 |
| Applebee's | | Gresham | | OR | | — |
| | 853 |
| | 2,560 |
| | — |
| | 3,413 |
| | (514 | ) | | 8/30/2013 | | 2004 | | Tualatin | | OR | | — |
| | 1,116 |
| | 2,072 |
| | — |
| | 3,188 |
| | (646 | ) | | 7/31/2013 | | 2002 |
| Applebee's | | Lake Oswego | | OR | | — |
| | 1,352 |
| | 1,652 |
| | — |
| | 3,004 |
| | (340 | ) | | 7/31/2013 | | 1993 | | Chambersburg | | PA | | — |
| | 591 |
| | 2,416 |
| | — |
| | 3,007 |
| | (628 | ) | | 2/7/2014 | | 1995 |
| Applebee's | | Roseburg | | OR | | — |
| | 717 |
| | 1,673 |
| | — |
| | 2,390 |
| | (336 | ) | | 8/30/2013 | | 2000 | | Greenville | | SC | | — |
| | 600 |
| | 2,166 |
| | (1,527 | ) | | 1,239 |
| | (70 | ) | | 6/27/2013 | | 1995 |
| Applebee's | | Tualatin | | OR | | — |
| | 1,116 |
| | 2,072 |
| | — |
| | 3,188 |
| | (426 | ) | | 7/31/2013 | | 2002 | | Bartlett | | TN | | — |
| | 315 |
| | 2,201 |
| | — |
| | 2,516 |
| | (615 | ) | | 2/7/2014 | | 2005 |
| Applebee's | | Chambersburg | | PA | | — |
| | 591 |
| | 2,416 |
| | — |
| | 3,007 |
| | (371 | ) | | 2/7/2014 | | 1995 | | Corpus Christi | | TX | | — |
| | 563 |
| | 2,926 |
| | — |
| | 3,489 |
| | (888 | ) | | 6/27/2013 | | 2000 |
| Applebee's | | Greenville | | SC | | — |
| | 600 |
| | 2,166 |
| | — |
| | 2,766 |
| | (429 | ) | | 6/27/2013 | | 1995 | | Edinburg | | TX | | — |
| | 898 |
| | 2,058 |
| | — |
| | 2,956 |
| | (625 | ) | | 6/27/2013 | | 2006 |
| Applebee's | | Bartlett | | TN | | — |
| | 315 |
| | 2,201 |
| | — |
| | 2,516 |
| | (363 | ) | | 2/7/2014 | | 2005 | | Mcallen | | TX | | — |
| | 1,114 |
| | 1,988 |
| | — |
| | 3,102 |
| | (603 | ) | | 6/27/2013 | | 1993 |
| Applebee's | | Corpus Christi | | TX | | — |
| | 563 |
| | 2,926 |
| | — |
| | 3,489 |
| | (594 | ) | | 6/27/2013 | | 2000 | | New Braunfels | | TX | | — |
| | 566 |
| | 1,486 |
| | — |
| | 2,052 |
| | (451 | ) | | 6/27/2013 | | 1995 |
| | | | | | Initial Costs (1) | | Costs Capitalized Subsequent to Acquisition (2) | | Gross Amount
Carried at
December 31, 2016
(3) (4) | | | | | | Initial Costs (1) | | Costs Capitalized Subsequent to Acquisition (2) | | Gross Amount
Carried at
December 31, 2018
(3) (4) | | | |
| Property | | City | | State | | Encumbrances at
December 31, 2016 | | Land | | Buildings, Fixtures and Improvements | | Accumulated Depreciation
(3) (5) | | Date Acquired | | Date of Construction | | City | | State | | Encumbrances at
December 31, 2018 | | Land | | Buildings, Fixtures and Improvements | | Accumulated Depreciation
(3) (5) | | Date Acquired | | Date of Construction |
| Applebee's | | Edinburg | | TX | | — |
| | 898 |
| | 2,058 |
| | — |
| | 2,956 |
| | (418 | ) | | 6/27/2013 | | 2006 | |
| Applebee's | | Mcallen | | TX | | — |
| | 1,114 |
| | 1,988 |
| | — |
| | 3,102 |
| | (404 | ) | | 6/27/2013 | | 1993 | |
| Applebee's | | New Braunfels | | TX | | — |
| | 566 |
| | 1,486 |
| | — |
| | 2,052 |
| | (302 | ) | | 6/27/2013 | | 1995 | |
| Applebee's | | San Antonio | | TX | | — |
| | 732 |
| | 1,796 |
| | — |
| | 2,528 |
| | (365 | ) | | 6/27/2013 | | 2003 | | San Antonio | | TX | | — |
| | 732 |
| | 1,796 |
| | — |
| | 2,528 |
| | (545 | ) | | 6/27/2013 | | 2003 |
| Applebee's | | Tyler | | TX | | — |
| | 696 |
| | 2,904 |
| | — |
| | 3,600 |
| | (490 | ) | | 2/7/2014 | | 1990 | | Tyler | | TX | | — |
| | 696 |
| | 2,904 |
| | — |
| | 3,600 |
| | (830 | ) | | 2/7/2014 | | 1990 |
| Applebee's | | Norton | | VA | | — |
| | 848 |
| | 433 |
| | — |
| | 1,281 |
| | (175 | ) | | 2/7/2014 | | 2006 | | Norton | | VA | | — |
| | 848 |
| | 433 |
| | — |
| | 1,281 |
| | (297 | ) | | 2/7/2014 | | 2006 |
| Applebee's | | Wytheville | | VA | | — |
| | 564 |
| | 923 |
| | — |
| | 1,487 |
| | (228 | ) | | 2/7/2014 | | 2000 | | Wytheville | | VA | | — |
| | 564 |
| | 923 |
| | — |
| | 1,487 |
| | (386 | ) | | 2/7/2014 | | 2000 |
| Applebee's | | Richland | | WA | | — |
| | 1,112 |
| | 2,064 |
| | — |
| | 3,176 |
| | (425 | ) | | 7/31/2013 | | 2003 | | Richland | | WA | | — |
| | 1,112 |
| | 2,064 |
| | — |
| | 3,176 |
| | (644 | ) | | 7/31/2013 | | 2003 |
| Applebee's | | Vancouver | | WA | | — |
| | 791 |
| | 1,846 |
| | — |
| | 2,637 |
| | (371 | ) | | 8/30/2013 | | 2001 | | Vancouver | | WA | | — |
| | 791 |
| | 1,846 |
| | — |
| | 2,637 |
| | (571 | ) | | 8/30/2013 | | 2001 |
| Applebee's | | Vancouver | | WA | | — |
| | 718 |
| | 1,675 |
| | — |
| | 2,393 |
| | (345 | ) | | 7/31/2013 | | 2001 | | Vancouver | | WA | | — |
| | 718 |
| | 1,675 |
| | — |
| | 2,393 |
| | (522 | ) | | 7/31/2013 | | 2001 |
| Apria Healthcare | | Indianapolis | | IN | | — |
| | 981 |
| | 3,922 |
| | 30 |
| | 4,933 |
| | (563 | ) | | 5/19/2014 | | 1993 | | Indianapolis | | IN | | — |
| | 981 |
| | 3,922 |
| | 775 |
| | 5,678 |
| | (1,077 | ) | | 5/19/2014 | | 1993 |
| Arby's | | Alexander City | | AL | | — |
| | 527 |
| | 401 |
| | — |
| | 928 |
| | (79 | ) | | 6/27/2013 | | 1999 | | Alexander City | | AL | | — |
| | 527 |
| | 401 |
| | — |
| | 928 |
| | (119 | ) | | 6/27/2013 | | 1999 |
| Arby's | | Arab | | AL | | — |
| | 40 |
| | 887 |
| | — |
| | 927 |
| | (170 | ) | | 6/27/2013 | | 1995 | | Arab | | AL | | — |
| | 40 |
| | 887 |
| | — |
| | 927 |
| | (260 | ) | | 6/27/2013 | | 1995 |
| Arby's | | Guntersville | | AL | | — |
| | 142 |
| | 503 |
| | — |
| | 645 |
| | (99 | ) | | 6/27/2013 | | 1995 | | Guntersville | | AL | | — |
| | 142 |
| | 503 |
| | — |
| | 645 |
| | (149 | ) | | 6/27/2013 | | 1995 |
| Arby's | | Hampton Cove | | AL | | — |
| | 310 |
| | 986 |
| | — |
| | 1,296 |
| | (189 | ) | | 6/27/2013 | | 1995 | | Hampton Cove | | AL | | — |
| | 310 |
| | 986 |
| | — |
| | 1,296 |
| | (289 | ) | | 6/27/2013 | | 1995 |
| Arby's | | Bullhead City | | AZ | | — |
| | 550 |
| | — |
| | — |
| | 550 |
| | — |
| | 6/27/2013 | | 1999 | | Phoenix | | AZ | | — |
| | 559 |
| | 618 |
| | 200 |
| | 1,377 |
| | (188 | ) | | 6/27/2013 | | 1995 |
| Arby's | | Fountain Hills | | AZ | | — |
| | 241 |
| | 597 |
| | — |
| | 838 |
| | (117 | ) | | 6/27/2013 | | 1994 | | Arvada | | CO | | — |
| | 190 |
| | 1,465 |
| | — |
| | 1,655 |
| | (430 | ) | | 6/27/2013 | | 1995 |
| Arby's | | Phoenix | | AZ | | — |
| | 559 |
| | 618 |
| | — |
| | 1,177 |
| | (121 | ) | | 6/27/2013 | | 1995 | | Apopka | | FL | | — |
| | 464 |
| | 697 |
| | — |
| | 1,161 |
| | (195 | ) | | 7/31/2013 | | 1985 |
| Arby's | | Arvada | | CO | | — |
| | 190 |
| | 1,465 |
| | — |
| | 1,655 |
| | (281 | ) | | 6/27/2013 | | 1995 | | Merritt Island | | FL | | — |
| | 297 |
| | 552 |
| | — |
| | 849 |
| | (155 | ) | | 7/31/2013 | | 1984 |
| Arby's | | Apopka | | FL | | — |
| | 464 |
| | 697 |
| | — |
| | 1,161 |
| | (127 | ) | | 7/31/2013 | | 1985 | | Orange Park | | FL | | — |
| | 420 |
| | 1,256 |
| | — |
| | 1,676 |
| | (368 | ) | | 6/27/2013 | | 1995 |
| Arby's | | Merritt Island | | FL | | — |
| | 297 |
| | 552 |
| | — |
| | 849 |
| | (101 | ) | | 7/31/2013 | | 1984 | | Orlando | | FL | | — |
| | 251 |
| | 585 |
| | — |
| | 836 |
| | (164 | ) | | 7/31/2013 | | 1985 |
| Arby's | | Orange Park | | FL | | — |
| | 420 |
| | 1,256 |
| | — |
| | 1,676 |
| | (241 | ) | | 6/27/2013 | | 1995 | | Rockledge | | FL | | — |
| | 381 |
| | 571 |
| | — |
| | 952 |
| | (160 | ) | | 7/31/2013 | | 1984 |
| Arby's | | Orlando | | FL | | — |
| | 251 |
| | 585 |
| | — |
| | 836 |
| | (107 | ) | | 7/31/2013 | | 1985 | | Atlanta | | GA | | — |
| | 1,207 |
| | 987 |
| | — |
| | 2,194 |
| | (277 | ) | | 7/31/2013 | | 1984 |
| Arby's | | Rockledge | | FL | | — |
| | 381 |
| | 571 |
| | — |
| | 952 |
| | (104 | ) | | 7/31/2013 | | 1984 | | Canton | | GA | | — |
| | 370 |
| | 1,200 |
| | — |
| | 1,570 |
| | (352 | ) | | 6/27/2013 | | 1995 |
| Arby's | | Atlanta | | GA | | — |
| | 1,207 |
| | 987 |
| | — |
| | 2,194 |
| | (180 | ) | | 7/31/2013 | | 1984 | | Douglasville | | GA | | — |
| | 370 |
| | 1,692 |
| | — |
| | 2,062 |
| | (496 | ) | | 6/27/2013 | | 1995 |
| Arby's | | Canton | | GA | | — |
| | 370 |
| | 1,200 |
| | — |
| | 1,570 |
| | (230 | ) | | 6/27/2013 | | 1995 | | Kennesaw | | GA | | — |
| | 583 |
| | 840 |
| | — |
| | 1,423 |
| | (249 | ) | | 6/27/2013 | | 1984 |
| Arby's | | Douglasville | | GA | | — |
| | 370 |
| | 1,692 |
| | — |
| | 2,062 |
| | (324 | ) | | 6/27/2013 | | 1995 | | Richmond Hill | | GA | | — |
| | 430 |
| | 755 |
| | — |
| | 1,185 |
| | (224 | ) | | 6/27/2013 | | 1984 |
| Arby's | | Kennesaw | | GA | | — |
| | 583 |
| | 840 |
| | — |
| | 1,423 |
| | (165 | ) | | 6/27/2013 | | 1984 | | Savannah | | GA | | — |
| | 293 |
| | 293 |
| | — |
| | 586 |
| | (82 | ) | | 7/31/2013 | | 1985 |
| Arby's | | Richmond Hill | | GA | | — |
| | 430 |
| | 755 |
| | — |
| | 1,185 |
| | (148 | ) | | 6/27/2013 | | 1984 | | Suwanee | | GA | | — |
| | 370 |
| | 1,561 |
| | — |
| | 1,931 |
| | (458 | ) | | 6/27/2013 | | 1995 |
| Arby's | | Savannah | | GA | | — |
| | 293 |
| | 293 |
| | — |
| | 586 |
| | (53 | ) | | 7/31/2013 | | 1985 | | Mount Vernon | | IL | | — |
| | 911 |
| | 764 |
| | — |
| | 1,675 |
| | (226 | ) | | 6/27/2013 | | 1999 |
| Arby's | | Suwanee | | GA | | — |
| | 370 |
| | 1,561 |
| | — |
| | 1,931 |
| | (299 | ) | | 6/27/2013 | | 1995 | | Avon | | IN | | — |
| | 500 |
| | 812 |
| | — |
| | 1,312 |
| | (238 | ) | | 6/27/2013 | | 1995 |
| Arby's | | Mount Vernon | | IL | | — |
| | 911 |
| | 764 |
| | — |
| | 1,675 |
| | (150 | ) | | 6/27/2013 | | 1999 | | Fort Wayne | | IN | | — |
| | 529 |
| | 647 |
| | — |
| | 1,176 |
| | (182 | ) | | 7/31/2013 | | 1987 |
| Arby's | | | Indianapolis | | IN | | — |
| | 530 |
| | 1,236 |
| | — |
| | 1,766 |
| | (362 | ) | | 6/27/2013 | | 1995 |
| Arby's | | | Indianapolis | | IN | | — |
| | 370 |
| | 1,130 |
| | — |
| | 1,500 |
| | (331 | ) | | 6/27/2013 | | 1995 |
| Arby's | | | New Albany | | IN | | — |
| | 456 |
| | 470 |
| | — |
| | 926 |
| | (139 | ) | | 6/27/2013 | | 2005 |
| | | | | | Initial Costs (1) | | Costs Capitalized Subsequent to Acquisition (2) | | Gross Amount
Carried at
December 31, 2016
(3) (4) | | | | | | Initial Costs (1) | | Costs Capitalized Subsequent to Acquisition (2) | | Gross Amount
Carried at
December 31, 2018
(3) (4) | | | |
| Property | | City | | State | | Encumbrances at
December 31, 2016 | | Land | | Buildings, Fixtures and Improvements | | Accumulated Depreciation
(3) (5) | | Date Acquired | | Date of Construction | | City | | State | | Encumbrances at
December 31, 2018 | | Land | | Buildings, Fixtures and Improvements | | Accumulated Depreciation
(3) (5) | | Date Acquired | | Date of Construction |
| Arby's | | Avon | | IN | | — |
| | 500 |
| | 812 |
| | — |
| | 1,312 |
| | (156 | ) | | 6/27/2013 | | 1995 | | New Albany | | IN | | — |
| | 325 |
| | 465 |
| | — |
| | 790 |
| | (138 | ) | | 6/27/2013 | | 1995 |
| Arby's | | Fort Wayne | | IN | | — |
| | 529 |
| | 647 |
| | — |
| | 1,176 |
| | (118 | ) | | 7/31/2013 | | 1987 | | Scottsburg | | IN | | — |
| | 526 |
| | 445 |
| | — |
| | 971 |
| | (132 | ) | | 6/27/2013 | | 1989 |
| Arby's | | Indianapolis | | IN | | — |
| | 530 |
| | 1,236 |
| | — |
| | 1,766 |
| | (237 | ) | | 6/27/2013 | | 1995 | | Winchester | | IN | | — |
| | 341 |
| | 511 |
| | — |
| | 852 |
| | (143 | ) | | 7/31/2013 | | 1988 |
| Arby's | | Indianapolis | | IN | | — |
| | 370 |
| | 1,130 |
| | — |
| | 1,500 |
| | (216 | ) | | 6/27/2013 | | 1995 | | Kansas City | | KS | | — |
| | 280 |
| | 364 |
| | — |
| | 644 |
| | (107 | ) | | 6/27/2013 | | 1995 |
| Arby's | | New Albany | | IN | | — |
| | 456 |
| | 470 |
| | — |
| | 926 |
| | (92 | ) | | 6/27/2013 | | 2005 | | Salina | | KS | | — |
| | 540 |
| | 300 |
| | 64 |
| | 904 |
| | (4 | ) | | 6/27/2013 | | 1995 |
| Arby's | | New Albany | | IN | | — |
| | 325 |
| | 465 |
| | — |
| | 790 |
| | (91 | ) | | 6/27/2013 | | 1995 | | Topeka | | KS | | — |
| | 270 |
| | 433 |
| | — |
| | 703 |
| | (127 | ) | | 6/27/2013 | | 1995 |
| Arby's | | Scottsburg | | IN | | — |
| | 526 |
| | 445 |
| | — |
| | 971 |
| | (87 | ) | | 6/27/2013 | | 1989 | | Hopkinsville | | KY | | — |
| | 432 |
| | 528 |
| | — |
| | 960 |
| | (148 | ) | | 7/31/2013 | | 1985 |
| Arby's | | Winchester | | IN | | — |
| | 341 |
| | 511 |
| | — |
| | 852 |
| | (93 | ) | | 7/31/2013 | | 1988 | | Louisville | | KY | | — |
| | 336 |
| | 625 |
| | — |
| | 961 |
| | (232 | ) | | 5/30/2013 | | 1979 |
| Arby's | | Kansas City | | KS | | — |
| | 280 |
| | 364 |
| | — |
| | 644 |
| | (70 | ) | | 6/27/2013 | | 1995 | | Alma | | MI | | — |
| | 380 |
| | 408 |
| | — |
| | 788 |
| | (120 | ) | | 6/27/2013 | | 1995 |
| Arby's | | Salina | | KS | | — |
| | 540 |
| | 300 |
| | — |
| | 840 |
| | (58 | ) | | 6/27/2013 | | 1995 | | Chesterfield | | MI | | — |
| | 210 |
| | 841 |
| | — |
| | 1,051 |
| | (247 | ) | | 6/27/2013 | | 1995 |
| Arby's | | Topeka | | KS | | — |
| | 270 |
| | 433 |
| | — |
| | 703 |
| | (83 | ) | | 6/27/2013 | | 1995 | | Davison | | MI | | — |
| | 420 |
| | 631 |
| | — |
| | 1,051 |
| | (185 | ) | | 6/27/2013 | | 1995 |
| Arby's | | Hopkinsville | | KY | | — |
| | 432 |
| | 528 |
| | — |
| | 960 |
| | (96 | ) | | 7/31/2013 | | 1985 | | Flint | | MI | | — |
| | 110 |
| | 1,422 |
| | — |
| | 1,532 |
| | (417 | ) | | 6/27/2013 | | 1995 |
| Arby's | | Louisville | | KY | | — |
| | 336 |
| | 625 |
| | — |
| | 961 |
| | (160 | ) | | 5/30/2013 | | 1979 | | Flint | | MI | | — |
| | 230 |
| | 1,428 |
| | — |
| | 1,658 |
| | (419 | ) | | 6/27/2013 | | 1995 |
| Arby's | | Alma | | MI | | — |
| | 380 |
| | 408 |
| | — |
| | 788 |
| | (78 | ) | | 6/27/2013 | | 1995 | | Grand Rapids | | MI | | — |
| | 230 |
| | 1,289 |
| | — |
| | 1,519 |
| | (44 | ) | | 6/27/2013 | | 1995 |
| Arby's | | Chesterfield | | MI | | — |
| | 210 |
| | 841 |
| | — |
| | 1,051 |
| | (161 | ) | | 6/27/2013 | | 1995 | | Grandville | | MI | | — |
| | 1,133 |
| | 755 |
| | — |
| | 1,888 |
| | (212 | ) | | 7/31/2013 | | 1982 |
| Arby's | | Davison | | MI | | — |
| | 420 |
| | 631 |
| | — |
| | 1,051 |
| | (121 | ) | | 6/27/2013 | | 1995 | | Midland | | MI | | — |
| | 340 |
| | 753 |
| | — |
| | 1,093 |
| | (221 | ) | | 6/27/2013 | | 1995 |
| Arby's | | Flint | | MI | | — |
| | 110 |
| | 1,422 |
| | — |
| | 1,532 |
| | (272 | ) | | 6/27/2013 | | 1995 | | Port Huron | | MI | | — |
| | 210 |
| | 868 |
| | — |
| | 1,078 |
| | (254 | ) | | 6/27/2013 | | 1995 |
| Arby's | | Flint | | MI | | — |
| | 230 |
| | 1,428 |
| | — |
| | 1,658 |
| | (274 | ) | | 6/27/2013 | | 1995 | | Saginaw | | MI | | — |
| | 310 |
| | 1,110 |
| | — |
| | 1,420 |
| | (326 | ) | | 6/27/2013 | | 1995 |
| Arby's | | Grandville | | MI | | — |
| | 1,133 |
| | 755 |
| | — |
| | 1,888 |
| | (138 | ) | | 7/31/2013 | | 1982 | | South Haven | | MI | | — |
| | 260 |
| | 573 |
| | — |
| | 833 |
| | (168 | ) | | 6/27/2013 | | 1995 |
| Arby's | | Midland | | MI | | — |
| | 340 |
| | 753 |
| | — |
| | 1,093 |
| | (144 | ) | | 6/27/2013 | | 1995 | | Walker | | MI | | — |
| | 360 |
| | 1,002 |
| | — |
| | 1,362 |
| | (294 | ) | | 6/27/2013 | | 1995 |
| Arby's | | Pontiac | | MI | | — |
| | 180 |
| | 962 |
| | — |
| | 1,142 |
| | (184 | ) | | 6/27/2013 | | 1995 | | Waterford | | MI | | — |
| | 180 |
| | 962 |
| | — |
| | 1,142 |
| | (282 | ) | | 6/27/2013 | | 1995 |
| Arby's | | Port Huron | | MI | | — |
| | 210 |
| | 868 |
| | — |
| | 1,078 |
| | (166 | ) | | 6/27/2013 | | 1995 | | Wyoming | | MI | | — |
| | 1,513 |
| | 648 |
| | — |
| | 2,161 |
| | (182 | ) | | 7/31/2013 | | 1970 |
| Arby's | | Saginaw | | MI | | — |
| | 310 |
| | 1,110 |
| | — |
| | 1,420 |
| | (213 | ) | | 6/27/2013 | | 1995 | | Corinth | | MS | | — |
| | 753 |
| | 429 |
| | — |
| | 1,182 |
| | (127 | ) | | 6/27/2013 | | 1984 |
| Arby's | | South Haven | | MI | | — |
| | 260 |
| | 573 |
| | — |
| | 833 |
| | (110 | ) | | 6/27/2013 | | 1995 | | Fayetteville | | NC | | — |
| | 420 |
| | 2,001 |
| | — |
| | 2,421 |
| | (587 | ) | | 6/27/2013 | | 1995 |
| Arby's | | Walker | | MI | | — |
| | 360 |
| | 1,002 |
| | — |
| | 1,362 |
| | (192 | ) | | 6/27/2013 | | 1995 | | Jonesville | | NC | | — |
| | 350 |
| | 908 |
| | — |
| | 1,258 |
| | (266 | ) | | 6/27/2013 | | 1995 |
| Arby's | | Wyoming | | MI | | — |
| | 1,513 |
| | 648 |
| | — |
| | 2,161 |
| | (118 | ) | | 7/31/2013 | | 1970 | | Kernersville | | NC | | — |
| | 280 |
| | 774 |
| | — |
| | 1,054 |
| | (227 | ) | | 6/27/2013 | | 1995 |
| Arby's | | Corinth | | MS | | — |
| | 753 |
| | 429 |
| | — |
| | 1,182 |
| | (84 | ) | | 6/27/2013 | | 1984 | | Columbus | | OH | | — |
| | 400 |
| | 1,155 |
| | — |
| | 1,555 |
| | (339 | ) | | 6/27/2013 | | 1995 |
| Arby's | | Fayetteville | | NC | | — |
| | 420 |
| | 2,001 |
| | — |
| | 2,421 |
| | (383 | ) | | 6/27/2013 | | 1995 | | Willard | | OH | | — |
| | 230 |
| | 599 |
| | — |
| | 829 |
| | (176 | ) | | 6/27/2013 | | 1995 |
| Arby's | | Greenville | | NC | | — |
| | 310 |
| | 681 |
| | (460 | ) | | 531 |
| | (33 | ) | | 6/27/2013 | | 1995 | | Allentown | | PA | | — |
| | 600 |
| | 1,652 |
| | — |
| | 2,252 |
| | (484 | ) | | 6/27/2013 | | 1995 |
| Arby's | | Jonesville | | NC | | — |
| | 350 |
| | 908 |
| | — |
| | 1,258 |
| | (174 | ) | | 6/27/2013 | | 1995 | | Carlisle | | PA | | — |
| | 200 |
| | 472 |
| | — |
| | 672 |
| | (139 | ) | | 6/27/2013 | | 1995 |
| Arby's | | Kernersville | | NC | | — |
| | 280 |
| | 774 |
| | — |
| | 1,054 |
| | (148 | ) | | 6/27/2013 | | 1995 | | Hanover | | PA | | — |
| | 400 |
| | 921 |
| | — |
| | 1,321 |
| | (270 | ) | | 6/27/2013 | | 1995 |
| Arby's | | Omaha | | NE | | — |
| | 359 |
| | — |
| | — |
| | 359 |
| | — |
| | 7/31/2013 | | 1984 | | Chattanooga | | TN | | — |
| | 201 |
| | 469 |
| | — |
| | 670 |
| | (132 | ) | | 7/31/2013 | | 1998 |
| | | | | | Initial Costs (1) | | Costs Capitalized Subsequent to Acquisition (2) | | Gross Amount
Carried at
December 31, 2016
(3) (4) | | | | | | Initial Costs (1) | | Costs Capitalized Subsequent to Acquisition (2) | | Gross Amount
Carried at
December 31, 2018
(3) (4) | | | |
| Property | | City | | State | | Encumbrances at
December 31, 2016 | | Land | | Buildings, Fixtures and Improvements | | Accumulated Depreciation
(3) (5) | | Date Acquired | | Date of Construction | | City | | State | | Encumbrances at
December 31, 2018 | | Land | | Buildings, Fixtures and Improvements | | Accumulated Depreciation
(3) (5) | | Date Acquired | | Date of Construction |
| Arby's | | Rochester | | NY | | — |
| | 128 |
| | 384 |
| | (172 | ) | | 340 |
| | (22 | ) | | 7/31/2013 | | 1985 | | Memphis | | TN | | — |
| | 449 |
| | 835 |
| | — |
| | 1,284 |
| | (234 | ) | | 7/31/2013 | | 1998 |
| Arby's | | Columbus | | OH | | — |
| | 400 |
| | 1,155 |
| | — |
| | 1,555 |
| | (221 | ) | | 6/27/2013 | | 1995 | | Amarillo | | TX | | — |
| | 260 |
| | 627 |
| | — |
| | 887 |
| | (184 | ) | | 6/27/2013 | | 1995 |
| Arby's | | Willard | | OH | | — |
| | 230 |
| | 599 |
| | — |
| | 829 |
| | (115 | ) | | 6/27/2013 | | 1995 | |
| Arby's | | Allentown | | PA | | — |
| | 600 |
| | 1,652 |
| | — |
| | 2,252 |
| | (317 | ) | | 6/27/2013 | | 1995 | |
| Arby's | | Carlisle | | PA | | — |
| | 200 |
| | 472 |
| | — |
| | 672 |
| | (91 | ) | | 6/27/2013 | | 1995 | |
| Arby's | | Erie | | PA | | — |
| | 188 |
| | 552 |
| | — |
| | 740 |
| | (108 | ) | | 6/27/2013 | | 1966 | |
| Arby's | | Hanover | | PA | | — |
| | 400 |
| | 921 |
| | — |
| | 1,321 |
| | (177 | ) | | 6/27/2013 | | 1995 | |
| Arby's | | Chattanooga | | TN | | — |
| | 201 |
| | 469 |
| | — |
| | 670 |
| | (85 | ) | | 7/31/2013 | | 1998 | |
| Arby's | | Memphis | | TN | | — |
| | 449 |
| | 835 |
| | — |
| | 1,284 |
| | (152 | ) | | 7/31/2013 | | 1998 | |
| Arby's | | Amarillo | | TX | | — |
| | 260 |
| | 627 |
| | — |
| | 887 |
| | (120 | ) | | 6/27/2013 | | 1995 | |
| Art Van Furniture | | | Avon | | OH | | — |
| | 925 |
| | 10,031 |
| | — |
| | 10,956 |
| | (330 | ) | | 11/22/2017 | | 2016 |
| Art Van Furniture | | | Mentor | | OH | | — |
| | 1,090 |
| | 9,582 |
| | — |
| | 10,672 |
| | (314 | ) | | 11/22/2017 | | 2009 |
| Art Van Furniture | | | Middleburg Heights | | OH | | — |
| | 1,440 |
| | 5,529 |
| | — |
| | 6,969 |
| | (178 | ) | | 11/22/2017 | | 1973 |
| Art Van Furniture | | | North Canton | | OH | | — |
| | 545 |
| | 8,636 |
| | — |
| | 9,181 |
| | (289 | ) | | 11/22/2017 | | 2007 |
| Art Van Furniture | | | Hanover | | PA | | — |
| | 703 |
| | 4,108 |
| | 178 |
| | 4,989 |
| | (132 | ) | | 11/22/2017 | | 1996 |
| Art Van Furniture | | | Johnstown | | PA | | — |
| | 386 |
| | 2,582 |
| | 174 |
| | 3,142 |
| | (93 | ) | | 11/22/2017 | | 1969 |
| Art Van Furniture | | | Lancaster | | PA | | — |
| | 2,156 |
| | 6,030 |
| | 384 |
| | 8,570 |
| | (202 | ) | | 11/22/2017 | | 1978 |
| Ashley Furniture | | Jeffersontown | | KY | | — |
| | 1,966 |
| | 2,368 |
| | — |
| | 4,334 |
| | (317 | ) | | 9/26/2014 | | 1970 | | Jeffersontown | | KY | | — |
| | 1,966 |
| | 2,368 |
| | — |
| | 4,334 |
| | (584 | ) | | 9/26/2014 | | 1970 |
| Assured Partners, Inc. | | Richfield | | OH | | — |
| | 1,414 |
| | — |
| | 17 |
| | 1,431 |
| | — |
| | 2/21/2014 | | 1995 | |
| At Home | | | Rogers | | AR | | — |
| | 2,589 |
| | 10,042 |
| | — |
| | 12,631 |
| | (64 | ) | | 10/3/2018 | | 2018 |
| At Home | | | Gilbert | | AZ | | — |
| | 4,053 |
| | 8,351 |
| | — |
| | 12,404 |
| | (54 | ) | | 10/3/2018 | | 2017 |
| At Home | | | Stockbridge | | GA | | — |
| | 2,057 |
| | 8,967 |
| | — |
| | 11,024 |
| | (2,391 | ) | | 2/7/2014 | | 1998 |
| At Home | | | Shreveport | | LA | | — |
| | 2,093 |
| | 12,311 |
| | — |
| | 14,404 |
| | (175 | ) | | 7/3/2018 | | 2018 |
| At Home | | | Wixom | | MI | | — |
| | 3,329 |
| | 11,339 |
| | — |
| | 14,668 |
| | (172 | ) | | 7/3/2018 | | 2017 |
| At Home | | | Blaine | | MN | | — |
| | 3,023 |
| | 9,220 |
| | — |
| | 12,243 |
| | (255 | ) | | 2/8/2018 | | 2001 |
| At Home | | | Jackson | | MS | | — |
| | 2,661 |
| | 7,245 |
| | — |
| | 9,906 |
| | (191 | ) | | 2/8/2018 | | 1995 |
| At Home | | | Clarksville | | TN | | — |
| | 1,649 |
| | 7,625 |
| | — |
| | 9,274 |
| | (112 | ) | | 7/3/2018 | | 1992 |
| At Home | | | Memphis | | TN | | — |
| | 4,790 |
| | 4,048 |
| | — |
| | 8,838 |
| | (130 | ) | | 2/8/2018 | | 2005 |
| At Home | | | Fort Worth | | TX | | — |
| | 2,641 |
| | 10,723 |
| | — |
| | 13,364 |
| | (280 | ) | | 2/8/2018 | | 2015 |
| At Home | | | Richmond | | TX | | — |
| | 4,605 |
| | 7,273 |
| | — |
| | 11,878 |
| | (48 | ) | | 10/3/2018 | | 2017 |
| At Home & Gabes | | Florence | | KY | | — |
| | 6,794 |
| | 5,968 |
| | — |
| | 12,762 |
| | (15 | ) | | 12/14/2016 | | 1992 | | Florence | | KY | | — |
| | 6,794 |
| | 5,968 |
| | — |
| | 12,762 |
| | (728 | ) | | 12/14/2016 | | 1992 |
| AT&T | | Schaumburg | | IL | | — |
| | 2,364 |
| | 9,305 |
| | 548 |
| | 12,217 |
| | (1,257 | ) | | 9/24/2014 | | 1989 | | Schaumburg | | IL | | — |
| | 2,364 |
| | 9,305 |
| | 635 |
| | 12,304 |
| | (2,371 | ) | | 9/24/2014 | | 1989 |
| AT&T | | Richardson | | TX | | 11,351 |
| | 1,891 |
| | 31,118 |
| | 13 |
| | 33,022 |
| | (4,902 | ) | | 11/5/2013 | | 1986 | | Richardson | | TX | | 10,882 |
| | 1,891 |
| | 31,118 |
| | 725 |
| | 33,734 |
| | (8,005 | ) | | 11/5/2013 | | 1986 |
| Auto Pawn | | Columbus | | GA | | — |
| | 170 |
| | — |
| | — |
| | 170 |
| | — |
| | 6/27/2013 | | 1987 | |
| AutoZone | | Chicago | | IL | | — |
| | 698 |
| | 1,047 |
| | — |
| | 1,745 |
| | (218 | ) | | 4/30/2013 | | 1995 | | Chicago | | IL | | — |
| | 698 |
| | 1,047 |
| | — |
| | 1,745 |
| | (315 | ) | | 4/30/2013 | | 1995 |
| AutoZone | | Yorkville | | IL | | — |
| | 383 |
| | 1,534 |
| | — |
| | 1,917 |
| | (232 | ) | | 5/19/2014 | | 2006 | | Yorkville | | IL | | — |
| | 383 |
| | 1,534 |
| | — |
| | 1,917 |
| | (411 | ) | | 5/19/2014 | | 2006 |
| AutoZone | | Pearl River | | LA | | 719 |
| | 239 |
| | 1,193 |
| | — |
| | 1,432 |
| | (184 | ) | | 2/7/2014 | | 2007 | | Pearl River | | LA | | 719 |
| | 239 |
| | 1,193 |
| | — |
| | 1,432 |
| | (311 | ) | | 2/7/2014 | | 2007 |
| AutoZone | | Hernando | | MS | | — |
| | 141 |
| | 833 |
| | — |
| | 974 |
| | (114 | ) | | 2/7/2014 | | 2003 | | Hernando | | MS | | — |
| | 141 |
| | 833 |
| | — |
| | 974 |
| | (194 | ) | | 2/7/2014 | | 2003 |
| AutoZone | | Blanchester | | OH | | 535 |
| | 341 |
| | 838 |
| | — |
| | 1,179 |
| | (128 | ) | | 2/7/2014 | | 2008 | | Blanchester | | OH | | 535 |
| | 341 |
| | 838 |
| | — |
| | 1,179 |
| | (217 | ) | | 2/7/2014 | | 2008 |
| AutoZone | | Hamilton | | OH | | 814 |
| | 507 |
| | 1,283 |
| | — |
| | 1,790 |
| | (192 | ) | | 2/7/2014 | | 2008 | | Hamilton | | OH | | 814 |
| | 507 |
| | 1,283 |
| | — |
| | 1,790 |
| | (326 | ) | | 2/7/2014 | | 2008 |
| AutoZone | | Hartville | | OH | | 614 |
| | 197 |
| | 1,156 |
| | — |
| | 1,353 |
| | (175 | ) | | 2/7/2014 | | 2008 | | Hartville | | OH | | 614 |
| | 197 |
| | 1,156 |
| | — |
| | 1,353 |
| | (297 | ) | | 2/7/2014 | | 2008 |
| AutoZone | | Mt. Orab | | OH | | 679 |
| | 258 |
| | 1,219 |
| | — |
| | 1,477 |
| | (181 | ) | | 2/7/2014 | | 2009 | | Mt. Orab | | OH | | 679 |
| | 258 |
| | 1,219 |
| | — |
| | 1,477 |
| | (307 | ) | | 2/7/2014 | | 2009 |
| AutoZone | | Trenton | | OH | | 504 |
| | 306 |
| | 812 |
| | — |
| | 1,118 |
| | (123 | ) | | 2/7/2014 | | 2008 | |
| AutoZone | | Rapid City | | SD | | 571 |
| | 375 |
| | 969 |
| | — |
| | 1,344 |
| | (142 | ) | | 2/7/2014 | | 2008 | |
| AutoZone | | Nashville | | TN | | 861 |
| | 555 |
| | 1,270 |
| | — |
| | 1,825 |
| | (190 | ) | | 2/7/2014 | | 2009 | |
| Bahama Breeze | | Pittsburgh | | PA | | — |
| | 1,590 |
| | 1,753 |
| | — |
| | 3,343 |
| | (155 | ) | | 7/28/2014 | | 2004 | |
| Bahama Breeze | | Memphis | | TN | | — |
| | 2,370 |
| | 1,313 |
| | — |
| | 3,683 |
| | (100 | ) | | 7/28/2014 | | 1998 | |
| Bandana's Bar-B-Q Restaurant | | Collinsville | | IL | | — |
| | 340 |
| | 627 |
| | — |
| | 967 |
| | (124 | ) | | 6/27/2013 | | 1995 | |
| Bandana's Bar-B-Q Restaurant | | Arnold | | MO | | — |
| | 460 |
| | 433 |
| | — |
| | 893 |
| | (86 | ) | | 6/27/2013 | | 1995 | |
| Bandana's Bar-B-Q Restaurant | | Fenton | | MO | | — |
| | 470 |
| | 314 |
| | — |
| | 784 |
| | (63 | ) | | 8/30/2013 | | 1986 | |
|
| | | | | | | | | | | | | | | | | | | | | | | | | | |
| | | | | | | | Initial Costs (1) | | Costs Capitalized Subsequent to Acquisition (2) | | Gross Amount
Carried at
December 31, 2018
(3) (4) | | | | | | |
| Property | | City | | State | | Encumbrances at
December 31, 2018 | | Land | | Buildings, Fixtures and Improvements | | | Accumulated Depreciation
(3) (5) | | Date Acquired | | Date of Construction |
| AutoZone | | Trenton | | OH | | 504 |
| | 306 |
| | 812 |
| | — |
| | 1,118 |
| | (208 | ) | | 2/7/2014 | | 2008 |
| AutoZone | | Rapid City | | SD | | 571 |
| | 375 |
| | 969 |
| | — |
| | 1,344 |
| | (240 | ) | | 2/7/2014 | | 2008 |
| AutoZone | | Nashville | | TN | | 861 |
| | 555 |
| | 1,270 |
| | — |
| | 1,825 |
| | (323 | ) | | 2/7/2014 | | 2009 |
| Bahama Breeze | | Pittsburgh | | PA | | — |
| | 1,590 |
| | 1,753 |
| | — |
| | 3,343 |
| | (281 | ) | | 7/28/2014 | | 2004 |
| Bahama Breeze | | Memphis | | TN | | — |
| | 2,370 |
| | 1,313 |
| | — |
| | 3,683 |
| | (181 | ) | | 7/28/2014 | | 1998 |
| Bandana's Bar-B-Q Restaurant | | Collinsville | | IL | | — |
| | 340 |
| | 627 |
| | — |
| | 967 |
| | (189 | ) | | 6/27/2013 | | 1995 |
| Bandana's Bar-B-Q Restaurant | | Arnold | | MO | | — |
| | 460 |
| | 433 |
| | — |
| | 893 |
| | (130 | ) | | 6/27/2013 | | 1995 |
| Bandana's Bar-B-Q Restaurant | | Fenton | | MO | | — |
| | 470 |
| | 314 |
| | — |
| | 784 |
| | (97 | ) | | 8/30/2013 | | 1986 |
| | | | | | Initial Costs (1) | | Costs Capitalized Subsequent to Acquisition (2) | | Gross Amount
Carried at
December 31, 2016
(3) (4) | | | | | | Initial Costs (1) | | Costs Capitalized Subsequent to Acquisition (2) | | Gross Amount
Carried at
December 31, 2018
(3) (4) | | | |
| Property | | City | | State | | Encumbrances at
December 31, 2016 | | Land | | Buildings, Fixtures and Improvements | | Accumulated Depreciation
(3) (5) | | Date Acquired | | Date of Construction | | City | | State | | Encumbrances at
December 31, 2018 | | Land | | Buildings, Fixtures and Improvements | | Accumulated Depreciation
(3) (5) | | Date Acquired | | Date of Construction |
| Bank of America | | Merced | | CA | | — |
| | 512 |
| | 2,195 |
| | 107 |
| | 2,814 |
| | (382 | ) | | 1/8/2014 | | 1980 | | Merced | | CA | | — |
| | 512 |
| | 2,195 |
| | 491 |
| | 3,198 |
| | (648 | ) | | 1/8/2014 | | 1980 |
| Bank of America | | Asheville | | NC | | — |
| | 383 |
| | 195 |
| | — |
| | 578 |
| | (33 | ) | | 1/8/2014 | | 1993 | | Asheville | | NC | | — |
| | 383 |
| | 195 |
| | — |
| | 578 |
| | (56 | ) | | 1/8/2014 | | 1993 |
| Bank of America | | Charlotte | | NC | | — |
| | 62 |
| | 642 |
| | — |
| | 704 |
| | (108 | ) | | 1/8/2014 | | 1983 | | Charlotte | | NC | | — |
| | 62 |
| | 642 |
| | — |
| | 704 |
| | (182 | ) | | 1/8/2014 | | 1983 |
| Bank of America | | Grants Pass | | OR | | — |
| | 393 |
| | 2,979 |
| | — |
| | 3,372 |
| | (504 | ) | | 1/8/2014 | | 1963 | |
| Banner Life Insurance | | Urbana | | MD | | 19,600 |
| | 2,733 |
| | 31,483 |
| | — |
| | 34,216 |
| | (4,200 | ) | | 2/7/2014 | | 2011 | | Urbana | | MD | | 19,600 |
| | 2,733 |
| | 31,483 |
| | — |
| | 34,216 |
| | (7,122 | ) | | 2/7/2014 | | 2011 |
| Baxter International | | Bloomington | | IN | | — |
| | 1,310 |
| | 8,216 |
| | 368 |
| | 9,894 |
| | (1,575 | ) | | 11/5/2013 | | 1995 | |
| Beall's | | Lakeland | | FL | | — |
| | 2,033 |
| | 4,809 |
| | — |
| | 6,842 |
| | (624 | ) | | 7/16/2014 | | 2006 | | Lakeland | | FL | | — |
| | 2,033 |
| | 4,809 |
| | — |
| | 6,842 |
| | (1,132 | ) | | 7/16/2014 | | 2006 |
| Becton, Dickinson and Company | | San Antonio | | TX | | 9,510 |
| | 1,666 |
| | 19,092 |
| | — |
| | 20,758 |
| | (2,903 | ) | | 11/5/2013 | | 2008 | | San Antonio | | TX | | 9,108 |
| | 1,666 |
| | 19,092 |
| | 94 |
| | 20,852 |
| | (4,750 | ) | | 11/5/2013 | | 2008 |
| Bed Bath & Beyond | | | Stockton | | CA | | 40,278 |
| | 2,761 |
| | 52,454 |
| | — |
| | 55,215 |
| | (18,668 | ) | | 8/17/2012 | | 2003 |
| Bed Bath & Beyond | | Stockton | | CA | | 40,278 |
| | 2,761 |
| | 52,454 |
| | — |
| | 55,215 |
| | (13,999 | ) | | 8/17/2012 | | 2003 | | Windsor | | VA | | — |
| | 3,032 |
| | 59,649 |
| | 3 |
| | 62,684 |
| | (1,586 | ) | | 12/20/2017 | | 2001 |
| Benihana | | Anchorage | | AK | | — |
| | 1,391 |
| | 1,877 |
| | — |
| | 3,268 |
| | (341 | ) | | 2/7/2014 | | 1998 | | Anchorage | | AK | | — |
| | 1,391 |
| | 1,877 |
| | — |
| | 3,268 |
| | (578 | ) | | 2/7/2014 | | 1998 |
| Benihana | | Miami Beach | | FL | | — |
| | 3,775 |
| | 433 |
| | — |
| | 4,208 |
| | (117 | ) | | 2/7/2014 | | 1972 | | Miami Beach | | FL | | — |
| | 3,775 |
| | 433 |
| | — |
| | 4,208 |
| | (199 | ) | | 2/7/2014 | | 1972 |
| Benihana | | Stuart | | FL | | — |
| | 1,661 |
| | 1,917 |
| | — |
| | 3,578 |
| | (363 | ) | | 2/7/2014 | | 1976 | | Stuart | | FL | | — |
| | 1,661 |
| | 1,917 |
| | — |
| | 3,578 |
| | (615 | ) | | 2/7/2014 | | 1976 |
| Benihana | | Alpharetta | | GA | | — |
| | 1,151 |
| | 1,485 |
| | — |
| | 2,636 |
| | (134 | ) | | 2/7/2014 | | 2003 | | Alpharetta | | GA | | — |
| | 1,151 |
| | 1,485 |
| | — |
| | 2,636 |
| | (227 | ) | | 2/7/2014 | | 2003 |
| Benihana | | Schaumburg | | IL | | — |
| | 2,319 |
| | 1,396 |
| | — |
| | 3,715 |
| | (265 | ) | | 2/7/2014 | | 1992 | | Schaumburg | | IL | | — |
| | 2,319 |
| | 1,396 |
| | — |
| | 3,715 |
| | (450 | ) | | 2/7/2014 | | 1992 |
| Benihana | | Wheeling | | IL | | — |
| | 1,896 |
| | 1,273 |
| | — |
| | 3,169 |
| | (152 | ) | | 2/7/2014 | | 2001 | | Wheeling | | IL | | — |
| | 1,896 |
| | 1,273 |
| | — |
| | 3,169 |
| | (258 | ) | | 2/7/2014 | | 2001 |
| Benihana | | Farmington Hills | | MI | | — |
| | 2,025 |
| | 2,049 |
| | — |
| | 4,074 |
| | (427 | ) | | 2/7/2014 | | 2012 | | Farmington Hills | | MI | | — |
| | 2,025 |
| | 2,049 |
| | — |
| | 4,074 |
| | (723 | ) | | 2/7/2014 | | 2012 |
| Benihana | | Maple Grove | | MN | | — |
| | 1,319 |
| | 2,604 |
| | — |
| | 3,923 |
| | (468 | ) | | 2/7/2014 | | 2006 | | Maple Grove | | MN | | — |
| | 1,319 |
| | 2,604 |
| | — |
| | 3,923 |
| | (794 | ) | | 2/7/2014 | | 2006 |
| Benihana | | Dallas | | TX | | — |
| | 2,988 |
| | 1,275 |
| | — |
| | 4,263 |
| | (273 | ) | | 2/7/2014 | | 1975 | | Dallas | | TX | | — |
| | 2,988 |
| | 1,275 |
| | — |
| | 4,263 |
| | (462 | ) | | 2/7/2014 | | 1975 |
| Best Buy | | Montgomery | | AL | | 3,148 |
| | 1,370 |
| | 5,749 |
| | — |
| | 7,119 |
| | (933 | ) | | 2/7/2014 | | 2003 | | Montgomery | | AL | | 3,148 |
| | 1,370 |
| | 5,749 |
| | (4,403 | ) | | 2,716 |
| | (74 | ) | | 2/7/2014 | | 2003 |
| Best Buy | | Coral Springs | | FL | | — |
| | 2,715 |
| | 4,843 |
| | — |
| | 7,558 |
| | (865 | ) | | 2/7/2014 | | 1993 | | Coral Springs | | FL | | — |
| | 2,715 |
| | 4,843 |
| | — |
| | 7,558 |
| | (1,466 | ) | | 2/7/2014 | | 1993 |
| Best Buy | | Bourbonnais | | IL | | — |
| | 1,724 |
| | 5,156 |
| | — |
| | 6,880 |
| | (923 | ) | | 2/7/2014 | | 1991 | | Bourbonnais | | IL | | — |
| | 1,724 |
| | 5,156 |
| | — |
| | 6,880 |
| | (1,566 | ) | | 2/7/2014 | | 1991 |
| Best Buy | | Indianapolis | | IN | | — |
| | 665 |
| | 4,775 |
| | — |
| | 5,440 |
| | (749 | ) | | 2/7/2014 | | 2009 | | Indianapolis | | IN | | — |
| | 665 |
| | 4,775 |
| | — |
| | 5,440 |
| | (1,270 | ) | | 2/7/2014 | | 2009 |
| Best Buy | | Richmond | | IN | | — |
| | 549 |
| | 4,429 |
| | — |
| | 4,978 |
| | (711 | ) | | 2/7/2014 | | 2011 | | Richmond | | IN | | — |
| | 549 |
| | 4,429 |
| | — |
| | 4,978 |
| | (1,206 | ) | | 2/7/2014 | | 2011 |
| Best Buy | | Marquette | | MI | | — |
| | 836 |
| | 4,207 |
| | 593 |
| | 5,636 |
| | (772 | ) | | 2/7/2014 | | 2010 | | Marquette | | MI | | — |
| | 836 |
| | 4,207 |
| | 614 |
| | 5,657 |
| | (1,362 | ) | | 2/7/2014 | | 2010 |
| Best Buy | | Norton Shores | | MI | | — |
| | 1,568 |
| | 4,099 |
| | — |
| | 5,667 |
| | (642 | ) | | 2/7/2014 | | 2001 | | Norton Shores | | MI | | — |
| | 1,568 |
| | 4,099 |
| | — |
| | 5,667 |
| | (1,088 | ) | | 2/7/2014 | | 2001 |
| Best Buy | | Southaven | | MS | | — |
| | 2,045 |
| | 4,318 |
| | 1 |
| | 6,364 |
| | (729 | ) | | 2/7/2014 | | 2007 | | Chesterfield | | MO | | — |
| | 1,537 |
| | 4,123 |
| | — |
| | 5,660 |
| | (1,138 | ) | | 2/7/2014 | | 2012 |
| Best Buy | | Tupelo | | MS | | — |
| | 484 |
| | 1,934 |
| | — |
| | 2,418 |
| | (298 | ) | | 5/19/2014 | | 2005 | | Southaven | | MS | | — |
| | 2,045 |
| | 4,318 |
| | — |
| | 6,363 |
| | (1,212 | ) | | 2/7/2014 | | 2007 |
| Best Buy | | Pineville | | NC | | — |
| | 1,818 |
| | 7,970 |
| | — |
| | 9,788 |
| | (1,251 | ) | | 2/7/2014 | | 1994 | | Tupelo | | MS | | — |
| | 484 |
| | 1,934 |
| | — |
| | 2,418 |
| | (489 | ) | | 5/19/2014 | | 2005 |
| Best Buy | | Kenosha | | WI | | — |
| | 1,925 |
| | 5,503 |
| | — |
| | 7,428 |
| | (862 | ) | | 2/7/2014 | | 2008 | | Pineville | | NC | | — |
| | 1,818 |
| | 7,970 |
| | — |
| | 9,788 |
| | (2,122 | ) | | 2/7/2014 | | 1994 |
| Best Buy | | | Findlay | | OH | | — |
| | 3,313 |
| | 37,568 |
| | 2,497 |
| | 43,378 |
| | (1,989 | ) | | 2/15/2017 | | 1996 |
| Best Buy | | | Kenosha | | WI | | — |
| | 1,925 |
| | 5,503 |
| | — |
| | 7,428 |
| | (1,462 | ) | | 2/7/2014 | | 2008 |
| Best Buy/Party City | | | Silverdale | | WA | | — |
| | 3,687 |
| | 10,570 |
| | — |
| | 14,257 |
| | (308 | ) | | 3/27/2018 | | 1991 |
| BHC Marketing | | The Woodlands | | TX | | — |
| | 4,724 |
| | 40,332 |
| | 20 |
| | 45,076 |
| | (6,018 | ) | | 11/5/2013 | | 2009 | | The Woodlands | | TX | | — |
| | 4,724 |
| | 40,332 |
| | 28 |
| | 45,084 |
| | (9,782 | ) | | 11/5/2013 | | 2009 |
| Big Lots | | Chester | | VA | | — |
| | 335 |
| | 3,373 |
| | 169 |
| | 3,877 |
| | (596 | ) | | 2/24/2014 | | 2013 | |
| Big O Tires | | Phoenix | | AZ | | 782 |
| | 206 |
| | 1,367 |
| | — |
| | 1,573 |
| | (197 | ) | | 2/7/2014 | | 2010 | |
| | | | | | Initial Costs (1) | | Costs Capitalized Subsequent to Acquisition (2) | | Gross Amount
Carried at
December 31, 2016
(3) (4) | | | | | | Initial Costs (1) | | Costs Capitalized Subsequent to Acquisition (2) | | Gross Amount
Carried at
December 31, 2018
(3) (4) | | | |
| Property | | City | | State | | Encumbrances at
December 31, 2016 | | Land | | Buildings, Fixtures and Improvements | | Accumulated Depreciation
(3) (5) | | Date Acquired | | Date of Construction | | City | | State | | Encumbrances at
December 31, 2018 | | Land | | Buildings, Fixtures and Improvements | | Accumulated Depreciation
(3) (5) | | Date Acquired | | Date of Construction |
| Big Lots | | | Chester | | VA | | — |
| | 335 |
| | 3,373 |
| | 169 |
| | 3,877 |
| | (1,014 | ) | | 2/24/2014 | | 2013 |
| Big O Tires | | | Phoenix | | AZ | | 782 |
| | 206 |
| | 1,367 |
| | — |
| | 1,573 |
| | (334 | ) | | 2/7/2014 | | 2010 |
| Big O Tires | | Los Lunas | | NM | | — |
| | 316 |
| | 1,265 |
| | — |
| | 1,581 |
| | (333 | ) | | 6/1/2012 | | 2006 | | Los Lunas | | NM | | — |
| | 316 |
| | 1,265 |
| | — |
| | 1,581 |
| | (437 | ) | | 6/1/2012 | | 2006 |
| Bi-Lo's Grocery | | Greenwood | | SC | | — |
| | 533 |
| | 4,212 |
| | — |
| | 4,745 |
| | (667 | ) | | 2/7/2014 | | 1999 | | Greenwood | | SC | | — |
| | 533 |
| | 4,212 |
| | — |
| | 4,745 |
| | (1,130 | ) | | 2/7/2014 | | 1999 |
| Bi-Lo's Grocery | | Mt Pleasant | | SC | | — |
| | 4,093 |
| | 8,594 |
| | — |
| | 12,687 |
| | (1,369 | ) | | 2/7/2014 | | 2003 | | Mt Pleasant | | SC | | — |
| | 4,093 |
| | 8,594 |
| | (2,968 | ) | | 9,719 |
| | — |
| | 2/7/2014 | | 2003 |
| Binny's Beverage Depot | | | Joliet | | IL | | — |
| | 1,834 |
| | 1,585 |
| | 775 |
| | 4,194 |
| | (523 | ) | | 2/7/2014 | | 2011 |
| BJ's Wholesale Club | | Boynton Beach | | FL | | — |
| | 5,569 |
| | 10,931 |
| | (15 | ) | | 16,485 |
| | (1,647 | ) | | 2/7/2014 | | 2001 | | Boynton Beach | | FL | | — |
| | 5,569 |
| | 10,931 |
| | (15 | ) | | 16,485 |
| | (2,793 | ) | | 2/7/2014 | | 2001 |
| BJ's Wholesale Club | | Jacksonville | | FL | | — |
| | 5,929 |
| | 16,348 |
| | — |
| | 22,277 |
| | (2,154 | ) | | 2/7/2014 | | 2003 | | Jacksonville | | FL | | — |
| | 5,929 |
| | 16,348 |
| | — |
| | 22,277 |
| | (3,653 | ) | | 2/7/2014 | | 2003 |
| BJ's Wholesale Club | | Pembroke Pines | | FL | | 8,446 |
| | 5,104 |
| | 7,661 |
| | — |
| | 12,765 |
| | (1,198 | ) | | 2/7/2014 | | 1997 | | Pembroke Pines | | FL | | 8,446 |
| | 5,104 |
| | 7,661 |
| | — |
| | 12,765 |
| | (2,031 | ) | | 2/7/2014 | | 1997 |
| BJ's Wholesale Club | | Greenfield | | MA | | 8,416 |
| | 2,168 |
| | 14,002 |
| | — |
| | 16,170 |
| | (1,768 | ) | | 2/7/2014 | | 1997 | | Greenfield | | MA | | 8,416 |
| | 2,168 |
| | 14,002 |
| | — |
| | 16,170 |
| | (2,997 | ) | | 2/7/2014 | | 1997 |
| BJ's Wholesale Club | | Leominster | | MA | | — |
| | 3,585 |
| | 21,344 |
| | — |
| | 24,929 |
| | (2,678 | ) | | 2/7/2014 | | 1993 | | Leominster | | MA | | — |
| | 3,585 |
| | 21,344 |
| | — |
| | 24,929 |
| | (4,541 | ) | | 2/7/2014 | | 1993 |
| BJ's Wholesale Club | | Uxbridge | | MA | | 12,645 |
| | 5,538 |
| | 36,445 |
| | — |
| | 41,983 |
| | (4,219 | ) | | 2/7/2014 | | 2006 | | Uxbridge | | MA | | 12,645 |
| | 5,538 |
| | 36,445 |
| | — |
| | 41,983 |
| | (7,153 | ) | | 2/7/2014 | | 2006 |
| BJ's Wholesale Club | | California | | MD | | — |
| | 6,882 |
| | 10,196 |
| | — |
| | 17,078 |
| | (1,504 | ) | | 2/7/2014 | | 2003 | | California | | MD | | — |
| | 6,882 |
| | 10,196 |
| | — |
| | 17,078 |
| | (2,550 | ) | | 2/7/2014 | | 2003 |
| BJ's Wholesale Club | | Westminster | | MD | | 13,978 |
| | 6,516 |
| | 13,860 |
| | — |
| | 20,376 |
| | (2,021 | ) | | 2/7/2014 | | 2001 | | Westminster | | MD | | 13,978 |
| | 6,516 |
| | 13,860 |
| | — |
| | 20,376 |
| | (3,427 | ) | | 2/7/2014 | | 2001 |
| BJ's Wholesale Club | | Auburn | | ME | | — |
| | 2,674 |
| | 16,510 |
| | — |
| | 19,184 |
| | (2,008 | ) | | 2/7/2014 | | 1995 | | Auburn | | ME | | — |
| | 2,674 |
| | 16,510 |
| | — |
| | 19,184 |
| | (3,406 | ) | | 2/7/2014 | | 1995 |
| BJ's Wholesale Club | | Portsmouth | | NH | | — |
| | 4,216 |
| | 25,454 |
| | — |
| | 29,670 |
| | (3,089 | ) | | 2/7/2014 | | 1993 | | Portsmouth | | NH | | — |
| | 4,216 |
| | 25,454 |
| | — |
| | 29,670 |
| | (5,237 | ) | | 2/7/2014 | | 1993 |
| BJ's Wholesale Club | | Deptford | | NJ | | 11,004 |
| | 6,558 |
| | 12,490 |
| | — |
| | 19,048 |
| | (1,633 | ) | | 2/7/2014 | | 1995 | | Deptford | | NJ | | 11,004 |
| | 6,558 |
| | 12,490 |
| | — |
| | 19,048 |
| | (2,770 | ) | | 2/7/2014 | | 1995 |
| BJ's Wholesale Club | | North Canton | | OH | | 6,787 |
| | 456 |
| | 8,668 |
| | 462 |
| | 9,586 |
| | (2,371 | ) | | 2/20/2013 | | 1998 | | North Canton | | OH | | 6,787 |
| | 456 |
| | 8,668 |
| | 422 |
| | 9,546 |
| | (3,260 | ) | | 2/20/2013 | | 1998 |
| BJ's Wholesale Club | | Lancaster | | PA | | 13,621 |
| | 3,400 |
| | 16,782 |
| | — |
| | 20,182 |
| | (2,361 | ) | | 2/7/2014 | | 1996 | | Lancaster | | PA | | 13,621 |
| | 3,400 |
| | 16,782 |
| | — |
| | 20,182 |
| | (4,003 | ) | | 2/7/2014 | | 1996 |
| Black Angus | | Dublin | | CA | | — |
| | 620 |
| | 2,467 |
| | — |
| | 3,087 |
| | (489 | ) | | 6/27/2013 | | 1995 | | Dublin | | CA | | — |
| | 620 |
| | 2,467 |
| | — |
| | 3,087 |
| | (743 | ) | | 6/27/2013 | | 1995 |
| Black Bear DIner | | Colorado Springs | | CO | | — |
| | 480 |
| | 809 |
| | — |
| | 1,289 |
| | (160 | ) | | 6/27/2013 | | 1995 | | Colorado Springs | | CO | | — |
| | 480 |
| | 809 |
| | — |
| | 1,289 |
| | (243 | ) | | 6/27/2013 | | 1995 |
| Black Meg 43 | | Copperas Cove | | TX | | — |
| | 151 |
| | 151 |
| | — |
| | 302 |
| | (30 | ) | | 6/27/2013 | | 1979 | | Copperas Cove | | TX | | — |
| | 151 |
| | 151 |
| | (106 | ) | | 196 |
| | (3 | ) | | 6/27/2013 | | 1979 |
| Blue Goose Cantina Mexican | | Grapevine | | TX | | — |
| | 572 |
| | 868 |
| | — |
| | 1,440 |
| | (176 | ) | | 6/27/2013 | | 1999 | | Grapevine | | TX | | — |
| | 572 |
| | 868 |
| | — |
| | 1,440 |
| | (264 | ) | | 6/27/2013 | | 1999 |
| Bob's Stores | | Randolph | | MA | | — |
| | 2,840 |
| | 6,826 |
| | — |
| | 9,666 |
| | (1,280 | ) | | 11/5/2013 | | 1965 | |
| Bojangles | | Winder | | GA | | — |
| | 645 |
| | 1,198 |
| | — |
| | 1,843 |
| | (376 | ) | | 7/30/2012 | | 2011 | |
| Bojangles | | Biscoe | | NC | | — |
| | 247 |
| | 986 |
| | — |
| | 1,233 |
| | (286 | ) | | 11/29/2012 | | 2010 | |
| Bojangles | | Boone | | NC | | — |
| | 278 |
| | 833 |
| | — |
| | 1,111 |
| | (261 | ) | | 7/27/2012 | | 1980 | |
| Bojangles | | Denver | | NC | | — |
| | 1,013 |
| | 1,881 |
| | — |
| | 2,894 |
| | (343 | ) | | 7/31/2013 | | 1997 | |
| Bojangles | | Dobson | | NC | | — |
| | 251 |
| | 1,004 |
| | — |
| | 1,255 |
| | (315 | ) | | 7/30/2012 | | 2010 | |
| Bojangles | | Hickory | | NC | | — |
| | 749 |
| | 1,789 |
| | — |
| | 2,538 |
| | (351 | ) | | 6/27/2013 | | 1973 | |
| Bojangles | | Indian Trail | | NC | | — |
| | 655 |
| | 1,217 |
| | — |
| | 1,872 |
| | (382 | ) | | 7/27/2012 | | 2011 | |
| Bojangles | | Morganton | | NC | | — |
| | 566 |
| | 1,321 |
| | — |
| | 1,887 |
| | (415 | ) | | 7/27/2012 | | 2010 | |
| Bojangles | | Roanoke Rapids | | NC | | — |
| | 442 |
| | 1,032 |
| | — |
| | 1,474 |
| | (324 | ) | | 7/27/2012 | | 2011 | |
| Bojangles | | Southport | | NC | | — |
| | 505 |
| | 1,179 |
| | — |
| | 1,684 |
| | (370 | ) | | 7/30/2012 | | 2011 | |
| Bojangles | | Statesville | | NC | | — |
| | 646 |
| | 1,937 |
| | — |
| | 2,583 |
| | (353 | ) | | 7/31/2013 | | 1988 | |
| Bob Evans | | | Newark | | DE | | — |
| | 869 |
| | 810 |
| | — |
| | 1,679 |
| | (37 | ) | | 6/26/2017 | | 1996 |
| Bob Evans | | | East Peoria | | IL | | — |
| | 717 |
| | 1,142 |
| | — |
| | 1,859 |
| | (60 | ) | | 6/26/2017 | | 1993 |
| Bob Evans | | | Indianapolis | | IN | | — |
| | 430 |
| | 708 |
| | — |
| | 1,138 |
| | (38 | ) | | 6/26/2017 | | 2002 |
| Bob Evans | | | Jackson | | MI | | — |
| | 980 |
| | 1,305 |
| | — |
| | 2,285 |
| | (62 | ) | | 6/26/2017 | | 2005 |
| Bob Evans | | | Muskegon | | MI | | — |
| | 550 |
| | 860 |
| | — |
| | 1,410 |
| | (42 | ) | | 6/26/2017 | | 2001 |
| Bob Evans | | | Amherst | | OH | | — |
| | 163 |
| | 1,557 |
| | — |
| | 1,720 |
| | (77 | ) | | 6/26/2017 | | 1987 |
| Bob Evans | | | Brunswick | | OH | | — |
| | 1,147 |
| | 1,088 |
| | — |
| | 2,235 |
| | (58 | ) | | 6/26/2017 | | 1992 |
| Bob Evans | | | Cincinnati | | OH | | — |
| | 563 |
| | 1,706 |
| | — |
| | 2,269 |
| | (91 | ) | | 6/26/2017 | | 2003 |
| Bob Evans | | | Cincinnati | | OH | | — |
| | 601 |
| | 1,529 |
| | — |
| | 2,130 |
| | (82 | ) | | 6/26/2017 | | 2002 |
|
| | | | | | | | | | | | | | | | | | | | | | | | | | |
| | | | | | | | Initial Costs (1) | | Costs Capitalized Subsequent to Acquisition (2) | | Gross Amount
Carried at
December 31, 2016
(3) (4) | | | | | | |
| Property | | City | | State | | Encumbrances at
December 31, 2016 | | Land | | Buildings, Fixtures and Improvements | | | Accumulated Depreciation
(3) (5) | | Date Acquired | | Date of Construction |
| Bojangles | | Taylorsville | | NC | | — |
| | 436 |
| | 1,108 |
| | — |
| | 1,544 |
| | (217 | ) | | 6/27/2013 | | 1987 |
| Bojangles | | Troutman | | NC | | — |
| | 718 |
| | 1,077 |
| | — |
| | 1,795 |
| | (243 | ) | | 10/10/2013 | | 2012 |
| Bojangles | | Chapin | | SC | | — |
| | 577 |
| | 1,071 |
| | — |
| | 1,648 |
| | (330 | ) | | 8/9/2012 | | 2009 |
| Bojangles | | Clinton | | SC | | — |
| | 397 |
| | 926 |
| | — |
| | 1,323 |
| | (291 | ) | | 7/27/2012 | | 2009 |
| Bojangles | | Fountain Inn | | SC | | — |
| | 287 |
| | 1,150 |
| | — |
| | 1,437 |
| | (260 | ) | | 10/10/2013 | | 2012 |
| Bojangles | | Greenwood | | SC | | — |
| | 440 |
| | 1,320 |
| | — |
| | 1,760 |
| | (360 | ) | | 2/28/2013 | | 1995 |
| Bojangles | | Moncks Corner | | SC | | — |
| | 505 |
| | 1,179 |
| | — |
| | 1,684 |
| | (343 | ) | | 11/29/2012 | | 2010 |
| Bojangles | | Walterboro | | SC | | — |
| | 454 |
| | 1,363 |
| | — |
| | 1,817 |
| | (396 | ) | | 11/29/2012 | | 2010 |
| Bonefish Grill | | Lakeland | | FL | | — |
| | 750 |
| | 1,897 |
| | — |
| | 2,647 |
| | (331 | ) | | 2/7/2014 | | 2003 |
| Bonefish Grill | | Independence | | OH | | — |
| | 895 |
| | 2,252 |
| | — |
| | 3,147 |
| | (408 | ) | | 2/7/2014 | | 2006 |
| Bonefish Grill | | Gainesville | | VA | | — |
| | 751 |
| | 1,325 |
| | — |
| | 2,076 |
| | (345 | ) | | 2/7/2014 | | 2004 |
| Boston Market | | Indianapolis | | IN | | — |
| | 930 |
| | — |
| | 350 |
| | 1,280 |
| | (28 | ) | | 6/27/2013 | | 1995 |
| Boston Market | | Indianapolis | | IN | | — |
| | 410 |
| | 1,070 |
| | — |
| | 1,480 |
| | (205 | ) | | 6/27/2013 | | 1995 |
| Boston Market | | Fayetteville | | NC | | — |
| | 460 |
| | 1,520 |
| | — |
| | 1,980 |
| | (291 | ) | | 6/27/2013 | | 1995 |
| Boston Market | | Raleigh | | NC | | — |
| | 280 |
| | 1,015 |
| | — |
| | 1,295 |
| | (195 | ) | | 6/27/2013 | | 1995 |
| Brangus Steakhouse | | Jasper | | AL | | — |
| | 140 |
| | 219 |
| | — |
| | 359 |
| | (43 | ) | | 6/27/2013 | | 1995 |
| Bridgestone Tire | | Kansas City | | MO | | — |
| | 651 |
| | 1,954 |
| | — |
| | 2,605 |
| | (411 | ) | | 5/31/2013 | | 2008 |
| Bruegger's Bagels | | Iowa City | | IA | | — |
| | 40 |
| | 379 |
| | (8 | ) | | 411 |
| | (73 | ) | | 6/27/2013 | | 1995 |
| Bruegger's Bagels | | Durham | | NC | | — |
| | 312 |
| | 728 |
| | — |
| | 1,040 |
| | (133 | ) | | 7/31/2013 | | 1926 |
| Bruegger's Bagels | | Raleigh | | NC | | — |
| | 230 |
| | 654 |
| | — |
| | 884 |
| | (125 | ) | | 6/27/2013 | | 1995 |
| Buca di Beppo Italian | | Wheeling | | IL | | — |
| | 450 |
| | 1,272 |
| | — |
| | 1,722 |
| | (252 | ) | | 6/27/2013 | | 1995 |
| Buca di Beppo Italian | | Westlake | | OH | | — |
| | 370 |
| | 887 |
| | — |
| | 1,257 |
| | (176 | ) | | 6/27/2013 | | 1995 |
| Buffalo Wild Wings | | Langhorne | | PA | | — |
| | 815 |
| | 815 |
| | — |
| | 1,630 |
| | (168 | ) | | 7/31/2013 | | 1999 |
| Bunge North America | | Fort Worth | | TX | | 6,262 |
| | 1,100 |
| | 8,433 |
| | — |
| | 9,533 |
| | (1,423 | ) | | 11/5/2013 | | 2005 |
| Burger King | | Anchorage | | AK | | — |
| | 427 |
| | 489 |
| | — |
| | 916 |
| | (96 | ) | | 6/27/2013 | | 1982 |
| Burger King | | Andalusia | | AL | | — |
| | 181 |
| | 1,025 |
| | — |
| | 1,206 |
| | (187 | ) | | 7/31/2013 | | 2000 |
| Burger King | | Atmore | | AL | | — |
| | 181 |
| | 723 |
| | — |
| | 904 |
| | (132 | ) | | 7/31/2013 | | 2000 |
| Burger King | | Brewton | | AL | | — |
| | 307 |
| | 920 |
| | — |
| | 1,227 |
| | (168 | ) | | 7/31/2013 | | 1993 |
| Burger King | | Dothan | | AL | | — |
| | 628 |
| | 1,167 |
| | — |
| | 1,795 |
| | (213 | ) | | 7/31/2013 | | 1983 |
| Burger King | | Dothan | | AL | | — |
| | 594 |
| | 1,104 |
| | — |
| | 1,698 |
| | (201 | ) | | 7/31/2013 | | 1999 |
| Burger King | | Enterprise | | AL | | — |
| | 437 |
| | 655 |
| | — |
| | 1,092 |
| | (120 | ) | | 7/31/2013 | | 1985 |
| Burger King | | Evergreen | | AL | | — |
| | 172 |
| | 689 |
| | — |
| | 861 |
| | (126 | ) | | 7/31/2013 | | 1997 |
|
| | | | | | | | | | | | | | | | | | | | | | | | | | |
| | | | | | | | Initial Costs (1) | | Costs Capitalized Subsequent to Acquisition (2) | | Gross Amount
Carried at
December 31, 2018
(3) (4) | | | | | | |
| Property | | City | | State | | Encumbrances at
December 31, 2018 | | Land | | Buildings, Fixtures and Improvements | | | Accumulated Depreciation
(3) (5) | | Date Acquired | | Date of Construction |
| Bob Evans | | Lancaster | | OH | | — |
| | 626 |
| | 1,546 |
| | — |
| | 2,172 |
| | (79 | ) | | 6/26/2017 | | 1998 |
| Bob Evans | | Lima | | OH | | — |
| | 366 |
| | 1,631 |
| | — |
| | 1,997 |
| | (84 | ) | | 6/26/2017 | | 2000 |
| Bob Evans | | Marion | | OH | | — |
| | 469 |
| | 1,657 |
| | — |
| | 2,126 |
| | (87 | ) | | 6/26/2017 | | 2008 |
| Bob Evans | | Medina | | OH | | — |
| | 496 |
| | 1,050 |
| | — |
| | 1,546 |
| | (57 | ) | | 6/26/2017 | | 2000 |
| Bob Evans | | Mentor | | OH | | — |
| | 626 |
| | 929 |
| | — |
| | 1,555 |
| | (49 | ) | | 6/26/2017 | | 1999 |
| Bob Evans | | Mount Vernon | | OH | | — |
| | 343 |
| | 1,338 |
| | — |
| | 1,681 |
| | (72 | ) | | 6/26/2017 | | 2011 |
| Bob Evans | | Stow | | OH | | — |
| | 418 |
| | 1,416 |
| | — |
| | 1,834 |
| | (76 | ) | | 6/26/2017 | | 2002 |
| Bob Evans | | Troy | | OH | | — |
| | 512 |
| | 1,255 |
| | — |
| | 1,767 |
| | (66 | ) | | 6/26/2017 | | 1992 |
| Bob Evans | | Wapakoneta | | OH | | — |
| | 253 |
| | 1,479 |
| | — |
| | 1,732 |
| | (80 | ) | | 6/26/2017 | | 2001 |
| Bob Evans | | Willoughby | | OH | | — |
| | 675 |
| | 1,262 |
| | — |
| | 1,937 |
| | (66 | ) | | 6/26/2017 | | 2005 |
| Bob Evans | | Xenia | | OH | | — |
| | 337 |
| | 1,433 |
| | — |
| | 1,770 |
| | (76 | ) | | 6/26/2017 | | 1988 |
| Bob Evans | | Phoenixville | | PA | | — |
| | 495 |
| | 438 |
| | — |
| | 933 |
| | (20 | ) | | 6/26/2017 | | 1999 |
| Bob Evans | | Wilkes-Barre | | PA | | — |
| | 373 |
| | 714 |
| | — |
| | 1,087 |
| | (34 | ) | | 6/26/2017 | | 2003 |
| Bob's Stores | | Randolph | | MA | | — |
| | 2,840 |
| | 6,826 |
| | — |
| | 9,666 |
| | (2,073 | ) | | 11/5/2013 | | 1965 |
| Bojangles | | Winder | | GA | | — |
| | 645 |
| | 1,198 |
| | — |
| | 1,843 |
| | (475 | ) | | 7/30/2012 | | 2011 |
| Bojangles | | Biscoe | | NC | | — |
| | 247 |
| | 986 |
| | — |
| | 1,233 |
| | (381 | ) | | 11/29/2012 | | 2010 |
| Bojangles | | Boone | | NC | | — |
| | 278 |
| | 833 |
| | — |
| | 1,111 |
| | (330 | ) | | 7/27/2012 | | 1980 |
| Bojangles | | Denver | | NC | | — |
| | 1,013 |
| | 1,881 |
| | — |
| | 2,894 |
| | (528 | ) | | 7/31/2013 | | 1997 |
| Bojangles | | Dobson | | NC | | — |
| | 251 |
| | 1,004 |
| | — |
| | 1,255 |
| | (398 | ) | | 7/30/2012 | | 2010 |
| Bojangles | | Hickory | | NC | | — |
| | 749 |
| | 1,789 |
| | — |
| | 2,538 |
| | (530 | ) | | 6/27/2013 | | 1973 |
| Bojangles | | Indian Trail | | NC | | — |
| | 655 |
| | 1,217 |
| | — |
| | 1,872 |
| | (483 | ) | | 7/27/2012 | | 2011 |
| Bojangles | | Morganton | | NC | | — |
| | 566 |
| | 1,321 |
| | — |
| | 1,887 |
| | (524 | ) | | 7/27/2012 | | 2010 |
| Bojangles | | Roanoke Rapids | | NC | | — |
| | 442 |
| | 1,032 |
| | — |
| | 1,474 |
| | (409 | ) | | 7/27/2012 | | 2011 |
| Bojangles | | Southport | | NC | | — |
| | 505 |
| | 1,179 |
| | — |
| | 1,684 |
| | (467 | ) | | 7/30/2012 | | 2011 |
| Bojangles | | Statesville | | NC | | — |
| | 646 |
| | 1,937 |
| | — |
| | 2,583 |
| | (544 | ) | | 7/31/2013 | | 1988 |
| Bojangles | | Taylorsville | | NC | | — |
| | 436 |
| | 1,108 |
| | — |
| | 1,544 |
| | (328 | ) | | 6/27/2013 | | 1987 |
| Bojangles | | Troutman | | NC | | — |
| | 718 |
| | 1,077 |
| | — |
| | 1,795 |
| | (386 | ) | | 10/10/2013 | | 2012 |
| Bojangles | | Chapin | | SC | | — |
| | 577 |
| | 1,071 |
| | — |
| | 1,648 |
| | (422 | ) | | 8/9/2012 | | 2009 |
| Bojangles | | Clinton | | SC | | — |
| | 397 |
| | 926 |
| | — |
| | 1,323 |
| | (367 | ) | | 7/27/2012 | | 2009 |
| Bojangles | | Fountain Inn | | SC | | — |
| | 287 |
| | 1,150 |
| | — |
| | 1,437 |
| | (412 | ) | | 10/10/2013 | | 2012 |
| Bojangles | | Greenwood | | SC | | — |
| | 440 |
| | 1,320 |
| | — |
| | 1,760 |
| | (500 | ) | | 2/28/2013 | | 1995 |
| Bojangles | | Moncks Corner | | SC | | — |
| | 505 |
| | 1,179 |
| | — |
| | 1,684 |
| | (456 | ) | | 11/29/2012 | | 2010 |
| | | | | | Initial Costs (1) | | Costs Capitalized Subsequent to Acquisition (2) | | Gross Amount
Carried at
December 31, 2016
(3) (4) | | | | | | Initial Costs (1) | | Costs Capitalized Subsequent to Acquisition (2) | | Gross Amount
Carried at
December 31, 2018
(3) (4) | | | |
| Property | | City | | State | | Encumbrances at
December 31, 2016 | | Land | | Buildings, Fixtures and Improvements | | Accumulated Depreciation
(3) (5) | | Date Acquired | | Date of Construction | | City | | State | | Encumbrances at
December 31, 2018 | | Land | | Buildings, Fixtures and Improvements | | Accumulated Depreciation
(3) (5) | | Date Acquired | | Date of Construction |
| Bojangles | | | Walterboro | | SC | | — |
| | 454 |
| | 1,363 |
| | — |
| | 1,817 |
| | (526 | ) | | 11/29/2012 | | 2010 |
| Bonefish Grill | | | Lakeland | | FL | | — |
| | 750 |
| | 1,897 |
| | — |
| | 2,647 |
| | (561 | ) | | 2/7/2014 | | 2003 |
| Bonefish Grill | | | Independence | | OH | | — |
| | 895 |
| | 2,252 |
| | — |
| | 3,147 |
| | (691 | ) | | 2/7/2014 | | 2006 |
| Bonefish Grill | | | Gainesville | | VA | | — |
| | 751 |
| | 1,325 |
| | — |
| | 2,076 |
| | (586 | ) | | 2/7/2014 | | 2004 |
| Boston Market | | | Indianapolis | | IN | | — |
| | 930 |
| | — |
| | 350 |
| | 1,280 |
| | (63 | ) | | 6/27/2013 | | 1995 |
| Boston Market | | | Indianapolis | | IN | | — |
| | 410 |
| | 1,070 |
| | — |
| | 1,480 |
| | (314 | ) | | 6/27/2013 | | 1995 |
| Boston Market | | | Fayetteville | | NC | | — |
| | 460 |
| | 1,520 |
| | — |
| | 1,980 |
| | (446 | ) | | 6/27/2013 | | 1995 |
| Boston Market | | | Raleigh | | NC | | — |
| | 280 |
| | 1,015 |
| | — |
| | 1,295 |
| | (298 | ) | | 6/27/2013 | | 1995 |
| Brick House Tavern & Tap | | | W. Windsor | | NJ | | 1,043 |
| | 1,307 |
| | 1,498 |
| | — |
| | 2,805 |
| | (356 | ) | | 2/7/2014 | | 1998 |
| Bridgestone Tire | | | Kansas City | | MO | | — |
| | 651 |
| | 1,954 |
| | — |
| | 2,605 |
| | (611 | ) | | 5/31/2013 | | 2008 |
| Bruegger's Bagels | | | Iowa City | | IA | | — |
| | 40 |
| | 379 |
| | (8 | ) | | 411 |
| | (111 | ) | | 6/27/2013 | | 1995 |
| Bruegger's Bagels | | | Durham | | NC | | — |
| | 312 |
| | 728 |
| | — |
| | 1,040 |
| | (204 | ) | | 7/31/2013 | | 1926 |
| Bruegger's Bagels | | | Raleigh | | NC | | — |
| | 230 |
| | 654 |
| | — |
| | 884 |
| | (192 | ) | | 6/27/2013 | | 1995 |
| Buca di Beppo Italian | | | Wheeling | | IL | | — |
| | 450 |
| | 1,272 |
| | — |
| | 1,722 |
| | (383 | ) | | 6/27/2013 | | 1995 |
| Buca di Beppo Italian | | | Westlake | | OH | | — |
| | 370 |
| | 887 |
| | — |
| | 1,257 |
| | (267 | ) | | 6/27/2013 | | 1995 |
| Buffalo Wild Wings | | | Langhorne | | PA | | — |
| | 815 |
| | 815 |
| | — |
| | 1,630 |
| | (254 | ) | | 7/31/2013 | | 1999 |
| Bunge North America | | | Fort Worth | | TX | | — |
| | 1,100 |
| | 8,433 |
| | — |
| | 9,533 |
| | (2,314 | ) | | 11/5/2013 | | 2005 |
| Burger King | | Monroeville | | AL | | — |
| | 325 |
| | 604 |
| | — |
| | 929 |
| | (110 | ) | | 7/31/2013 | | 1997 | | Anchorage | | AK | | — |
| | 427 |
| | 489 |
| | — |
| | 916 |
| | (145 | ) | | 6/27/2013 | | 1982 |
| Burger King | | Opp | | AL | | — |
| | 214 |
| | 857 |
| | — |
| | 1,071 |
| | (156 | ) | | 7/31/2013 | | 1994 | | Andalusia | | AL | | — |
| | 181 |
| | 1,025 |
| | — |
| | 1,206 |
| | (288 | ) | | 7/31/2013 | | 2000 |
| Burger King | | Troy | | AL | | — |
| | 461 |
| | 1,383 |
| | — |
| | 1,844 |
| | (252 | ) | | 7/31/2013 | | 1984 | | Atmore | | AL | | — |
| | 181 |
| | 723 |
| | — |
| | 904 |
| | (203 | ) | | 7/31/2013 | | 2000 |
| Burger King | | Sierra Vista | | AZ | | — |
| | 260 |
| | 1,041 |
| | — |
| | 1,301 |
| | (190 | ) | | 7/31/2013 | | 1994 | | Brewton | | AL | | — |
| | 307 |
| | 920 |
| | — |
| | 1,227 |
| | (258 | ) | | 7/31/2013 | | 1993 |
| Burger King | | Tucson | | AZ | | — |
| | 300 |
| | 1,307 |
| | — |
| | 1,607 |
| | (251 | ) | | 6/27/2013 | | 1995 | | Dothan | | AL | | — |
| | 628 |
| | 1,167 |
| | (15 | ) | | 1,780 |
| | (328 | ) | | 7/31/2013 | | 1983 |
| Burger King | | Denver | | CO | | — |
| | 872 |
| | 1,242 |
| | — |
| | 2,114 |
| | (244 | ) | | 6/27/2013 | | 1994 | | Dothan | | AL | | — |
| | 594 |
| | 1,104 |
| | — |
| | 1,698 |
| | (310 | ) | | 7/31/2013 | | 1999 |
| Burger King | | Clearwater | | FL | | — |
| | 981 |
| | 591 |
| | — |
| | 1,572 |
| | (116 | ) | | 6/27/2013 | | 1980 | | Enterprise | | AL | | — |
| | 437 |
| | 655 |
| | — |
| | 1,092 |
| | (184 | ) | | 7/31/2013 | | 1985 |
| Burger King | | Defuniak Springs | | FL | | — |
| | 362 |
| | 1,087 |
| | — |
| | 1,449 |
| | (198 | ) | | 7/31/2013 | | 1989 | | Evergreen | | AL | | — |
| | 172 |
| | 689 |
| | — |
| | 861 |
| | (193 | ) | | 7/31/2013 | | 1997 |
| Burger King | | Largo | | FL | | — |
| | 683 |
| | 412 |
| | — |
| | 1,095 |
| | (81 | ) | | 6/27/2013 | | 1984 | | Monroeville | | AL | | — |
| | 325 |
| | 604 |
| | — |
| | 929 |
| | (169 | ) | | 7/31/2013 | | 1997 |
| Burger King | | Niceville | | FL | | — |
| | 598 |
| | 399 |
| | — |
| | 997 |
| | (73 | ) | | 7/31/2013 | | 1994 | | Opp | | AL | | — |
| | 214 |
| | 857 |
| | — |
| | 1,071 |
| | (241 | ) | | 7/31/2013 | | 1994 |
| Burger King | | Panama City | | FL | | — |
| | 319 |
| | 956 |
| | — |
| | 1,275 |
| | (174 | ) | | 7/31/2013 | | 1998 | | Troy | | AL | | — |
| | 461 |
| | 1,383 |
| | — |
| | 1,844 |
| | (388 | ) | | 7/31/2013 | | 1984 |
| Burger King | | Springfield | | FL | | — |
| | 324 |
| | 971 |
| | — |
| | 1,295 |
| | (177 | ) | | 7/31/2013 | | 1995 | | Sierra Vista | | AZ | | — |
| | 260 |
| | 1,041 |
| | — |
| | 1,301 |
| | (292 | ) | | 7/31/2013 | | 1994 |
| Burger King | | Tallahassee | | FL | | — |
| | 720 |
| | 720 |
| | — |
| | 1,440 |
| | (131 | ) | | 7/31/2013 | | 1998 | | Tucson | | AZ | | — |
| | 300 |
| | 1,307 |
| | 250 |
| | 1,857 |
| | (387 | ) | | 6/27/2013 | | 1995 |
| Burger King | | Tallahassee | | FL | | — |
| | 843 |
| | 454 |
| | — |
| | 1,297 |
| | (83 | ) | | 7/31/2013 | | 1980 | | Denver | | CO | | — |
| | 872 |
| | 1,242 |
| | — |
| | 2,114 |
| | (368 | ) | | 6/27/2013 | | 1994 |
| Burger King | | Alpharetta | | GA | | — |
| | 635 |
| | 865 |
| | — |
| | 1,500 |
| | (170 | ) | | 6/27/2013 | | 1998 | | Clearwater | | FL | | — |
| | 981 |
| | 591 |
| | — |
| | 1,572 |
| | (175 | ) | | 6/27/2013 | | 1980 |
| Burger King | | Alpharetta | | GA | | — |
| | 1,128 |
| | 977 |
| | — |
| | 2,105 |
| | (192 | ) | | 6/27/2013 | | 1993 | |
| Burger King | | Alpharetta | | GA | | — |
| | 795 |
| | 943 |
| | — |
| | 1,738 |
| | (185 | ) | | 6/27/2013 | | 1997 | |
| Burger King | | Alpharetta | | GA | | — |
| | 501 |
| | 1,219 |
| | — |
| | 1,720 |
| | (239 | ) | | 6/27/2013 | | 2001 | |
| Burger King | | Atlanta | | GA | | — |
| | 380 |
| | 499 |
| | — |
| | 879 |
| | (96 | ) | | 6/27/2013 | | 1995 | |
| Burger King | | Augusta | | GA | | — |
| | 693 |
| | 2,080 |
| | — |
| | 2,773 |
| | (379 | ) | | 7/31/2013 | | 1986 | |
| Burger King | | Bainbridge | | GA | | — |
| | 347 |
| | 1,042 |
| | — |
| | 1,389 |
| | (190 | ) | | 7/31/2013 | | 1998 | |
| Burger King | | Cairo | | GA | | — |
| | 245 |
| | 981 |
| | — |
| | 1,226 |
| | (179 | ) | | 7/31/2013 | | 1997 | |
| Burger King | | Fort Oglethorpe | | GA | | — |
| | 170 |
| | 2,175 |
| | — |
| | 2,345 |
| | (417 | ) | | 6/27/2013 | | 1995 | |
| Burger King | | Martinez | | GA | | — |
| | 909 |
| | 1,350 |
| | — |
| | 2,259 |
| | (265 | ) | | 6/27/2013 | | 1998 | |
| Burger King | | Roswell | | GA | | — |
| | 495 |
| | 1,156 |
| | — |
| | 1,651 |
| | (211 | ) | | 7/31/2013 | | 1998 | |
| Burger King | | Thomson | | GA | | — |
| | 748 |
| | 876 |
| | — |
| | 1,624 |
| | (172 | ) | | 6/27/2013 | | 1988 | |
| Burger King | | Valdosta | | GA | | — |
| | 564 |
| | 376 |
| | — |
| | 940 |
| | (69 | ) | | 7/31/2013 | | 1987 | |
| Burger King | | Des Moines | | IA | | — |
| | 1,160 |
| | 949 |
| | — |
| | 2,109 |
| | (173 | ) | | 7/31/2013 | | 1987 | |
| Burger King | | Perry | | IA | | — |
| | 557 |
| | 680 |
| | — |
| | 1,237 |
| | (124 | ) | | 7/31/2013 | | 1997 | |
| Burger King | | Red Oak | | IA | | — |
| | 334 |
| | 1,002 |
| | — |
| | 1,336 |
| | (183 | ) | | 7/31/2013 | | 1988 | |
| Burger King | | Shenandoah | | IA | | — |
| | 313 |
| | 582 |
| | — |
| | 895 |
| | (106 | ) | | 7/31/2013 | | 1988 | |
| Burger King | | Stuart | | IA | | — |
| | 607 |
| | 911 |
| | — |
| | 1,518 |
| | (166 | ) | | 7/31/2013 | | 1997 | |
| | | | | | Initial Costs (1) | | Costs Capitalized Subsequent to Acquisition (2) | | Gross Amount
Carried at
December 31, 2016
(3) (4) | | | | | | Initial Costs (1) | | Costs Capitalized Subsequent to Acquisition (2) | | Gross Amount
Carried at
December 31, 2018
(3) (4) | | | |
| Property | | City | | State | | Encumbrances at
December 31, 2016 | | Land | | Buildings, Fixtures and Improvements | | Accumulated Depreciation
(3) (5) | | Date Acquired | | Date of Construction | | City | | State | | Encumbrances at
December 31, 2018 | | Land | | Buildings, Fixtures and Improvements | | Accumulated Depreciation
(3) (5) | | Date Acquired | | Date of Construction |
| Burger King | | Maywood | | IL | | — |
| | 860 |
| | 1,051 |
| | (357 | ) | | 1,554 |
| | (71 | ) | | 7/31/2013 | | 2003 | | Defuniak Springs | | FL | | — |
| | 362 |
| | 1,087 |
| | — |
| | 1,449 |
| | (305 | ) | | 7/31/2013 | | 1989 |
| Burger King | | Springfield | | IL | | — |
| | 354 |
| | 677 |
| | — |
| | 1,031 |
| | (133 | ) | | 6/27/2013 | | 1995 | | Largo | | FL | | — |
| | 683 |
| | 412 |
| | — |
| | 1,095 |
| | (122 | ) | | 6/27/2013 | | 1984 |
| Burger King | | Gary | | IN | | — |
| | 544 |
| | 606 |
| | — |
| | 1,150 |
| | (119 | ) | | 6/27/2013 | | 1987 | | Niceville | | FL | | — |
| | 598 |
| | 399 |
| | — |
| | 997 |
| | (112 | ) | | 7/31/2013 | | 1994 |
| Burger King | | Cut Off | | LA | | — |
| | 726 |
| | 1,088 |
| | — |
| | 1,814 |
| | (199 | ) | | 7/31/2013 | | 1990 | | Panama City | | FL | | — |
| | 319 |
| | 956 |
| | — |
| | 1,275 |
| | (268 | ) | | 7/31/2013 | | 1998 |
| Burger King | | Gonzales | | LA | | — |
| | 380 |
| | 465 |
| | — |
| | 845 |
| | (85 | ) | | 7/31/2013 | | 1990 | | Springfield | | FL | | — |
| | 324 |
| | 971 |
| | — |
| | 1,295 |
| | (272 | ) | | 7/31/2013 | | 1995 |
| Burger King | | Lake Charles | | LA | | — |
| | 456 |
| | 456 |
| | — |
| | 912 |
| | (83 | ) | | 7/31/2013 | | 1980 | | Tallahassee | | FL | | — |
| | 720 |
| | 720 |
| | — |
| | 1,440 |
| | (202 | ) | | 7/31/2013 | | 1998 |
| Burger King | | Lake Charles | | LA | | — |
| | 610 |
| | 746 |
| | — |
| | 1,356 |
| | (136 | ) | | 7/31/2013 | | 1990 | | Tallahassee | | FL | | — |
| | 843 |
| | 454 |
| | — |
| | 1,297 |
| | (127 | ) | | 7/31/2013 | | 1980 |
| Burger King | | Metairie | | LA | | — |
| | 728 |
| | 392 |
| | — |
| | 1,120 |
| | (72 | ) | | 7/31/2013 | | 1990 | | Alpharetta | | GA | | — |
| | 635 |
| | 865 |
| | — |
| | 1,500 |
| | (256 | ) | | 6/27/2013 | | 1998 |
| Burger King | | Opelousas | | LA | | — |
| | 964 |
| | 964 |
| | — |
| | 1,928 |
| | (176 | ) | | 7/31/2013 | | 1978 | | Alpharetta | | GA | | — |
| | 1,128 |
| | 977 |
| | — |
| | 2,105 |
| | (290 | ) | | 6/27/2013 | | 1993 |
| Burger King | | Raceland | | LA | | — |
| | 356 |
| | 533 |
| | — |
| | 889 |
| | (97 | ) | | 7/31/2013 | | 2000 | | Alpharetta | | GA | | — |
| | 795 |
| | 943 |
| | — |
| | 1,738 |
| | (279 | ) | | 6/27/2013 | | 1997 |
| Burger King | | Amesbury | | MA | | — |
| | 835 |
| | 1,217 |
| | — |
| | 2,052 |
| | (239 | ) | | 6/27/2013 | | 1977 | | Alpharetta | | GA | | — |
| | 501 |
| | 1,219 |
| | — |
| | 1,720 |
| | (361 | ) | | 6/27/2013 | | 2001 |
| Burger King | | Springfield | | MA | | — |
| | 983 |
| | 516 |
| | — |
| | 1,499 |
| | (101 | ) | | 6/27/2013 | | 1974 | | Atlanta | | GA | | — |
| | 380 |
| | 499 |
| | — |
| | 879 |
| | (146 | ) | | 6/27/2013 | | 1995 |
| Burger King | | Caribou | | ME | | — |
| | 770 |
| | 440 |
| | — |
| | 1,210 |
| | (84 | ) | | 6/27/2013 | | 1995 | | Augusta | | GA | | — |
| | 693 |
| | 2,080 |
| | — |
| | 2,773 |
| | (584 | ) | | 7/31/2013 | | 1986 |
| Burger King | | Belding | | MI | | — |
| | 221 |
| | 411 |
| | — |
| | 632 |
| | (75 | ) | | 7/31/2013 | | 1994 | | Bainbridge | | GA | | — |
| | 347 |
| | 1,042 |
| | — |
| | 1,389 |
| | (292 | ) | | 7/31/2013 | | 1998 |
| Burger King | | Detroit | | MI | | — |
| | 614 |
| | 331 |
| | — |
| | 945 |
| | (60 | ) | | 7/31/2013 | | 1988 | | Cairo | | GA | | — |
| | 245 |
| | 981 |
| | — |
| | 1,226 |
| | (275 | ) | | 7/31/2013 | | 1997 |
| Burger King | | Grand Rapids | | MI | | — |
| | 490 |
| | 545 |
| | — |
| | 1,035 |
| | (104 | ) | | 6/27/2013 | | 1995 | | Fort Oglethorpe | | GA | | — |
| | 170 |
| | 2,175 |
| | — |
| | 2,345 |
| | (638 | ) | | 6/27/2013 | | 1995 |
| Burger King | | Grand Rapids | | MI | | — |
| | 260 |
| | 780 |
| | — |
| | 1,040 |
| | (149 | ) | | 6/27/2013 | | 1995 | | Martinez | | GA | | — |
| | 909 |
| | 1,350 |
| | — |
| | 2,259 |
| | (400 | ) | | 6/27/2013 | | 1998 |
| Burger King | | Grand Rapids | | MI | | — |
| | 346 |
| | 807 |
| | — |
| | 1,153 |
| | (147 | ) | | 7/31/2013 | | 1985 | | Roswell | | GA | | — |
| | 495 |
| | 1,156 |
| | — |
| | 1,651 |
| | (324 | ) | | 7/31/2013 | | 1998 |
| Burger King | | Holland | | MI | | — |
| | 420 |
| | 707 |
| | — |
| | 1,127 |
| | (135 | ) | | 6/27/2013 | | 1995 | | Thomson | | GA | | — |
| | 748 |
| | 876 |
| | — |
| | 1,624 |
| | (260 | ) | | 6/27/2013 | | 1988 |
| Burger King | | Hudsonville | | MI | | — |
| | 451 |
| | 676 |
| | — |
| | 1,127 |
| | (123 | ) | | 7/31/2013 | | 1988 | | Valdosta | | GA | | — |
| | 564 |
| | 376 |
| | — |
| | 940 |
| | (106 | ) | | 7/31/2013 | | 1987 |
| Burger King | | L'Anse | | MI | | — |
| | 32 |
| | 616 |
| | — |
| | 648 |
| | (112 | ) | | 7/31/2013 | | 1999 | | Des Moines | | IA | | — |
| | 1,160 |
| | 949 |
| | — |
| | 2,109 |
| | (266 | ) | | 7/31/2013 | | 1987 |
| Burger King | | Sparta | | MI | | — |
| | 640 |
| | 570 |
| | — |
| | 1,210 |
| | (109 | ) | | 6/27/2013 | | 1995 | | Perry | | IA | | — |
| | 557 |
| | 680 |
| | — |
| | 1,237 |
| | (191 | ) | | 7/31/2013 | | 1997 |
| Burger King | | Spring Lake | | MI | | — |
| | 341 |
| | 512 |
| | — |
| | 853 |
| | (93 | ) | | 7/31/2013 | | 1994 | | Red Oak | | IA | | — |
| | 334 |
| | 1,002 |
| | — |
| | 1,336 |
| | (281 | ) | | 7/31/2013 | | 1988 |
| Burger King | | Walker | | MI | | — |
| | 305 |
| | 711 |
| | — |
| | 1,016 |
| | (130 | ) | | 7/31/2013 | | 1973 | | Shenandoah | | IA | | — |
| | 313 |
| | 582 |
| | — |
| | 895 |
| | (163 | ) | | 7/31/2013 | | 1988 |
| Burger King | | Warren | | MI | | — |
| | 248 |
| | 745 |
| | — |
| | 993 |
| | (136 | ) | | 7/31/2013 | | 1987 | | Stuart | | IA | | — |
| | 607 |
| | 911 |
| | — |
| | 1,518 |
| | (256 | ) | | 7/31/2013 | | 1997 |
| Burger King | | Hastings | | MN | | — |
| | 328 |
| | 608 |
| | — |
| | 936 |
| | (111 | ) | | 7/31/2013 | | 1990 | | Maywood | | IL | | — |
| | 860 |
| | 1,051 |
| | (357 | ) | | 1,554 |
| | (160 | ) | | 7/31/2013 | | 2003 |
| Burger King | | Kansas City | | MO | | — |
| | 444 |
| | 1,036 |
| | — |
| | 1,480 |
| | (189 | ) | | 7/31/2013 | | 1984 | | Springfield | | IL | | — |
| | 354 |
| | 677 |
| | (562 | ) | | 469 |
| | (6 | ) | | 6/27/2013 | | 1995 |
| Burger King | | Brandon | | MS | | — |
| | 649 |
| | 1,513 |
| | — |
| | 2,162 |
| | (297 | ) | | 6/27/2013 | | 1981 | | Gary | | IN | | — |
| | 544 |
| | 606 |
| | — |
| | 1,150 |
| | (179 | ) | | 6/27/2013 | | 1987 |
| Burger King | | Clarksdale | | MS | | — |
| | 865 |
| | 865 |
| | — |
| | 1,730 |
| | (158 | ) | | 7/31/2013 | | 1988 | | Cut Off | | LA | | — |
| | 726 |
| | 1,088 |
| | — |
| | 1,814 |
| | (305 | ) | | 7/31/2013 | | 1990 |
| Burger King | | Cleveland | | MS | | — |
| | 688 |
| | 1,606 |
| | — |
| | 2,294 |
| | (293 | ) | | 7/31/2013 | | 1985 | | Gonzales | | LA | | — |
| | 380 |
| | 465 |
| | — |
| | 845 |
| | (130 | ) | | 7/31/2013 | | 1990 |
| Burger King | | Greenville | | MS | | — |
| | 573 |
| | 1,337 |
| | — |
| | 1,910 |
| | (244 | ) | | 7/31/2013 | | 2004 | | Lake Charles | | LA | | — |
| | 456 |
| | 456 |
| | — |
| | 912 |
| | (128 | ) | | 7/31/2013 | | 1980 |
| Burger King | | Greenville | | MS | | — |
| | 351 |
| | 820 |
| | — |
| | 1,171 |
| | (150 | ) | | 7/31/2013 | | 1993 | | Lake Charles | | LA | | — |
| | 610 |
| | 746 |
| | — |
| | 1,356 |
| | (209 | ) | | 7/31/2013 | | 1990 |
| | | | | | Initial Costs (1) | | Costs Capitalized Subsequent to Acquisition (2) | | Gross Amount
Carried at
December 31, 2016
(3) (4) | | | | | | Initial Costs (1) | | Costs Capitalized Subsequent to Acquisition (2) | | Gross Amount
Carried at
December 31, 2018
(3) (4) | | | |
| Property | | City | | State | | Encumbrances at
December 31, 2016 | | Land | | Buildings, Fixtures and Improvements | | Accumulated Depreciation
(3) (5) | | Date Acquired | | Date of Construction | | City | | State | | Encumbrances at
December 31, 2018 | | Land | | Buildings, Fixtures and Improvements | | Accumulated Depreciation
(3) (5) | | Date Acquired | | Date of Construction |
| Burger King | | Greenwood | | MS | | — |
| | 692 |
| | 1,038 |
| | — |
| | 1,730 |
| | (189 | ) | | 7/31/2013 | | 1988 | | Metairie | | LA | | — |
| | 728 |
| | 392 |
| | — |
| | 1,120 |
| | (110 | ) | | 7/31/2013 | | 1990 |
| Burger King | | Grenada | | MS | | — |
| | 536 |
| | 805 |
| | — |
| | 1,341 |
| | (147 | ) | | 7/31/2013 | | 1989 | | Opelousas | | LA | | — |
| | 964 |
| | 964 |
| | — |
| | 1,928 |
| | (271 | ) | | 7/31/2013 | | 1978 |
| Burger King | | Philadelphia | | MS | | — |
| | 402 |
| | 939 |
| | — |
| | 1,341 |
| | (171 | ) | | 7/31/2013 | | 1993 | | Raceland | | LA | | — |
| | 356 |
| | 533 |
| | — |
| | 889 |
| | (150 | ) | | 7/31/2013 | | 2000 |
| Burger King | | Yazoo City | | MS | | — |
| | 489 |
| | 909 |
| | — |
| | 1,398 |
| | (166 | ) | | 7/31/2013 | | 1993 | | Amesbury | | MA | | — |
| | 835 |
| | 1,217 |
| | — |
| | 2,052 |
| | (360 | ) | | 6/27/2013 | | 1977 |
| Burger King | | Asheville | | NC | | — |
| | 728 |
| | 595 |
| | — |
| | 1,323 |
| | (109 | ) | | 7/31/2013 | | 1982 | | Springfield | | MA | | — |
| | 983 |
| | 516 |
| | — |
| | 1,499 |
| | (153 | ) | | 6/27/2013 | | 1974 |
| Burger King | | Chadbourn | | NC | | — |
| | 353 |
| | 797 |
| | — |
| | 1,150 |
| | (156 | ) | | 6/27/2013 | | 1999 | | Caribou | | ME | | — |
| | 770 |
| | 440 |
| | — |
| | 1,210 |
| | (129 | ) | | 6/27/2013 | | 1995 |
| Burger King | | Claremont | | NC | | — |
| | 646 |
| | 646 |
| | — |
| | 1,292 |
| | (127 | ) | | 6/27/2013 | | 2000 | | Belding | | MI | | — |
| | 221 |
| | 411 |
| | — |
| | 632 |
| | (115 | ) | | 7/31/2013 | | 1994 |
| Burger King | | Clinton | | NC | | — |
| | 494 |
| | 801 |
| | — |
| | 1,295 |
| | (157 | ) | | 6/27/2013 | | 1999 | | Detroit | | MI | | — |
| | 614 |
| | 331 |
| | — |
| | 945 |
| | (93 | ) | | 7/31/2013 | | 1988 |
| Burger King | | Dunn | | NC | | — |
| | 328 |
| | 268 |
| | (118 | ) | | 478 |
| | (18 | ) | | 7/31/2013 | | 1989 | | Grand Rapids | | MI | | — |
| | 490 |
| | 545 |
| | — |
| | 1,035 |
| | (160 | ) | | 6/27/2013 | | 1995 |
| Burger King | | Durham | | NC | | — |
| | 170 |
| | 352 |
| | — |
| | 522 |
| | (67 | ) | | 6/27/2013 | | 1995 | | Grand Rapids | | MI | | — |
| | 260 |
| | 780 |
| | — |
| | 1,040 |
| | (229 | ) | | 6/27/2013 | | 1995 |
| Burger King | | Wilmington | | NC | | — |
| | 573 |
| | 870 |
| | — |
| | 1,443 |
| | (171 | ) | | 6/27/2013 | | 1999 | | Grand Rapids | | MI | | — |
| | 346 |
| | 807 |
| | — |
| | 1,153 |
| | (226 | ) | | 7/31/2013 | | 1985 |
| Burger King | | Blair | | NE | | — |
| | 272 |
| | 1,087 |
| | — |
| | 1,359 |
| | (198 | ) | | 7/31/2013 | | 1987 | | Holland | | MI | | — |
| | 420 |
| | 707 |
| | (668 | ) | | 459 |
| | — |
| | 6/27/2013 | | 1995 |
| Burger King | | Wahoo | | NE | | — |
| | 196 |
| | 1,109 |
| | — |
| | 1,305 |
| | (202 | ) | | 7/31/2013 | | 1990 | | Hudsonville | | MI | | — |
| | 451 |
| | 676 |
| | — |
| | 1,127 |
| | (190 | ) | | 7/31/2013 | | 1988 |
| Burger King | | Dover | | NH | | — |
| | 1,159 |
| | 952 |
| | — |
| | 2,111 |
| | (187 | ) | | 6/27/2013 | | 1970 | | L'Anse | | MI | | — |
| | 32 |
| | 616 |
| | — |
| | 648 |
| | (173 | ) | | 7/31/2013 | | 1999 |
| Burger King | | Nashua | | NH | | — |
| | 655 |
| | 655 |
| | — |
| | 1,310 |
| | (119 | ) | | 7/31/2013 | | 2008 | | Sparta | | MI | | — |
| | 640 |
| | 570 |
| | — |
| | 1,210 |
| | (167 | ) | | 6/27/2013 | | 1995 |
| Burger King | | Edison | | NJ | | — |
| | 480 |
| | 1,075 |
| | — |
| | 1,555 |
| | (206 | ) | | 6/27/2013 | | 1995 | | Walker | | MI | | — |
| | 305 |
| | 711 |
| | — |
| | 1,016 |
| | (199 | ) | | 7/31/2013 | | 1973 |
| Burger King | | Elko | | NV | | — |
| | 260 |
| | 1,001 |
| | — |
| | 1,261 |
| | (192 | ) | | 6/27/2013 | | 1995 | | Warren | | MI | | — |
| | 248 |
| | 745 |
| | — |
| | 993 |
| | (209 | ) | | 7/31/2013 | | 1987 |
| Burger King | | Albany | | NY | | — |
| | 330 |
| | 850 |
| | — |
| | 1,180 |
| | (163 | ) | | 6/27/2013 | | 1995 | | Hastings | | MN | | — |
| | 328 |
| | 608 |
| | 200 |
| | 1,136 |
| | (179 | ) | | 7/31/2013 | | 1990 |
| Burger King | | Central Square | | NY | | — |
| | 500 |
| | 1,189 |
| | — |
| | 1,689 |
| | (228 | ) | | 6/27/2013 | | 1995 | | Kansas City | | MO | | — |
| | 444 |
| | 1,036 |
| | — |
| | 1,480 |
| | (291 | ) | | 7/31/2013 | | 1984 |
| Burger King | | Cohoes | | NY | | — |
| | 270 |
| | 563 |
| | — |
| | 833 |
| | (108 | ) | | 6/27/2013 | | 1995 | | Brandon | | MS | | — |
| | 649 |
| | 1,513 |
| | — |
| | 2,162 |
| | (448 | ) | | 6/27/2013 | | 1981 |
| Burger King | | East Greenbush | | NY | | — |
| | 404 |
| | 269 |
| | (159 | ) | | 514 |
| | (9 | ) | | 6/27/2013 | | 1980 | | Clarksdale | | MS | | — |
| | 865 |
| | 865 |
| | — |
| | 1,730 |
| | (243 | ) | | 7/31/2013 | | 1988 |
| Burger King | | Hamburg | | NY | | — |
| | 403 |
| | 383 |
| | — |
| | 786 |
| | (75 | ) | | 6/27/2013 | | 1974 | | Cleveland | | MS | | — |
| | 688 |
| | 1,606 |
| | — |
| | 2,294 |
| | (451 | ) | | 7/31/2013 | | 1985 |
| Burger King | | Irondequoit | | NY | | — |
| | 988 |
| | 659 |
| | — |
| | 1,647 |
| | (120 | ) | | 7/31/2013 | | 1980 | | Greenville | | MS | | — |
| | 573 |
| | 1,337 |
| | — |
| | 1,910 |
| | (375 | ) | | 7/31/2013 | | 2004 |
| Burger King | | Montgomery | | NY | | — |
| | 480 |
| | 1,042 |
| | — |
| | 1,522 |
| | (200 | ) | | 6/27/2013 | | 1995 | | Greenville | | MS | | — |
| | 351 |
| | 820 |
| | — |
| | 1,171 |
| | (230 | ) | | 7/31/2013 | | 1993 |
| Burger King | | Schenectady | | NY | | — |
| | 380 |
| | 936 |
| | — |
| | 1,316 |
| | (179 | ) | | 6/27/2013 | | 1995 | | Greenwood | | MS | | — |
| | 692 |
| | 1,038 |
| | — |
| | 1,730 |
| | (291 | ) | | 7/31/2013 | | 1988 |
| Burger King | | Syracuse | | NY | | — |
| | 606 |
| | 606 |
| | — |
| | 1,212 |
| | (111 | ) | | 7/31/2013 | | 1986 | | Grenada | | MS | | — |
| | 536 |
| | 805 |
| | — |
| | 1,341 |
| | (226 | ) | | 7/31/2013 | | 1989 |
| Burger King | | Cincinnati | | OH | | — |
| | 353 |
| | 824 |
| | — |
| | 1,177 |
| | (150 | ) | | 7/31/2013 | | 1969 | | Philadelphia | | MS | | — |
| | 402 |
| | 939 |
| | — |
| | 1,341 |
| | (263 | ) | | 7/31/2013 | | 1993 |
| Burger King | | Dayton | | OH | | — |
| | 569 |
| | 466 |
| | — |
| | 1,035 |
| | (85 | ) | | 7/31/2013 | | 1990 | | Yazoo City | | MS | | — |
| | 489 |
| | 909 |
| | — |
| | 1,398 |
| | (255 | ) | | 7/31/2013 | | 1993 |
| Burger King | | Mansfield | | OH | | — |
| | 191 |
| | 766 |
| | — |
| | 957 |
| | (140 | ) | | 7/31/2013 | | 1985 | | Asheville | | NC | | — |
| | 728 |
| | 595 |
| | — |
| | 1,323 |
| | (167 | ) | | 7/31/2013 | | 1982 |
| Burger King | | New Philadelphia | | OH | | — |
| | 419 |
| | 779 |
| | — |
| | 1,198 |
| | (142 | ) | | 7/31/2013 | | 1986 | | Chadbourn | | NC | | — |
| | 353 |
| | 797 |
| | — |
| | 1,150 |
| | (236 | ) | | 6/27/2013 | | 1999 |
| Burger King | | Willoughby | | OH | | — |
| | 410 |
| | 1,005 |
| | — |
| | 1,415 |
| | (193 | ) | | 6/27/2013 | | 1995 | | Claremont | | NC | | — |
| | 646 |
| | 646 |
| | — |
| | 1,292 |
| | (191 | ) | | 6/27/2013 | | 2000 |
| Burger King | | Ardmore | | OK | | — |
| | 270 |
| | 1,023 |
| | — |
| | 1,293 |
| | (196 | ) | | 6/27/2013 | | 1995 | | Clinton | | NC | | — |
| | 494 |
| | 801 |
| | — |
| | 1,295 |
| | (237 | ) | | 6/27/2013 | | 1999 |
|
| | | | | | | | | | | | | | | | | | | | | | | | | | |
| | | | | | | | Initial Costs (1) | | Costs Capitalized Subsequent to Acquisition (2) | | Gross Amount
Carried at
December 31, 2018
(3) (4) | | | | | | |
| Property | | City | | State | | Encumbrances at
December 31, 2018 | | Land | | Buildings, Fixtures and Improvements | | | Accumulated Depreciation
(3) (5) | | Date Acquired | | Date of Construction |
| Burger King | | Durham | | NC | | — |
| | 170 |
| | 352 |
| | — |
| | 522 |
| | (103 | ) | | 6/27/2013 | | 1995 |
| Burger King | | Wilmington | | NC | | — |
| | 573 |
| | 870 |
| | — |
| | 1,443 |
| | (258 | ) | | 6/27/2013 | | 1999 |
| Burger King | | Blair | | NE | | — |
| | 272 |
| | 1,087 |
| | — |
| | 1,359 |
| | (305 | ) | | 7/31/2013 | | 1987 |
| Burger King | | Wahoo | | NE | | — |
| | 196 |
| | 1,109 |
| | — |
| | 1,305 |
| | (311 | ) | | 7/31/2013 | | 1990 |
| Burger King | | Dover | | NH | | — |
| | 1,159 |
| | 952 |
| | — |
| | 2,111 |
| | (282 | ) | | 6/27/2013 | | 1970 |
| Burger King | | Nashua | | NH | | — |
| | 655 |
| | 655 |
| | — |
| | 1,310 |
| | (184 | ) | | 7/31/2013 | | 2008 |
| Burger King | | Edison | | NJ | | — |
| | 480 |
| | 1,075 |
| | — |
| | 1,555 |
| | (315 | ) | | 6/27/2013 | | 1995 |
| Burger King | | Elko | | NV | | — |
| | 260 |
| | 1,001 |
| | — |
| | 1,261 |
| | (294 | ) | | 6/27/2013 | | 1995 |
| Burger King | | Albany | | NY | | — |
| | 330 |
| | 850 |
| | — |
| | 1,180 |
| | (249 | ) | | 6/27/2013 | | 1995 |
| Burger King | | Central Square | | NY | | — |
| | 500 |
| | 1,189 |
| | — |
| | 1,689 |
| | (349 | ) | | 6/27/2013 | | 1995 |
| Burger King | | Cohoes | | NY | | — |
| | 270 |
| | 563 |
| | — |
| | 833 |
| | (165 | ) | | 6/27/2013 | | 1995 |
| Burger King | | Hamburg | | NY | | — |
| | 403 |
| | 383 |
| | — |
| | 786 |
| | (113 | ) | | 6/27/2013 | | 1974 |
| Burger King | | Irondequoit | | NY | | — |
| | 988 |
| | 659 |
| | — |
| | 1,647 |
| | (185 | ) | | 7/31/2013 | | 1980 |
| Burger King | | Montgomery | | NY | | — |
| | 480 |
| | 1,042 |
| | — |
| | 1,522 |
| | (306 | ) | | 6/27/2013 | | 1995 |
| Burger King | | Schenectady | | NY | | — |
| | 380 |
| | 936 |
| | — |
| | 1,316 |
| | (275 | ) | | 6/27/2013 | | 1995 |
| Burger King | | Syracuse | | NY | | — |
| | 606 |
| | 606 |
| | — |
| | 1,212 |
| | (170 | ) | | 7/31/2013 | | 1986 |
| Burger King | | Dayton | | OH | | — |
| | 569 |
| | 466 |
| | — |
| | 1,035 |
| | (131 | ) | | 7/31/2013 | | 1990 |
| Burger King | | Mansfield | | OH | | — |
| | 191 |
| | 766 |
| | — |
| | 957 |
| | (215 | ) | | 7/31/2013 | | 1985 |
| Burger King | | New Philadelphia | | OH | | — |
| | 419 |
| | 779 |
| | — |
| | 1,198 |
| | (219 | ) | | 7/31/2013 | | 1986 |
| Burger King | | Willoughby | | OH | | — |
| | 410 |
| | 1,005 |
| | — |
| | 1,415 |
| | (295 | ) | | 6/27/2013 | | 1995 |
| Burger King | | Ardmore | | OK | | — |
| | 270 |
| | 1,023 |
| | — |
| | 1,293 |
| | (300 | ) | | 6/27/2013 | | 1995 |
| | | | | | Initial Costs (1) | | Costs Capitalized Subsequent to Acquisition (2) | | Gross Amount
Carried at
December 31, 2016
(3) (4) | | | | | | Initial Costs (1) | | Costs Capitalized Subsequent to Acquisition (2) | | Gross Amount
Carried at
December 31, 2018
(3) (4) | | | |
| Property | | City | | State | | Encumbrances at
December 31, 2016 | | Land | | Buildings, Fixtures and Improvements | | Accumulated Depreciation
(3) (5) | | Date Acquired | | Date of Construction | | City | | State | | Encumbrances at
December 31, 2018 | | Land | | Buildings, Fixtures and Improvements | | Accumulated Depreciation
(3) (5) | | Date Acquired | | Date of Construction |
| Burger King | | Roseburg | | OR | | — |
| | 350 |
| | 886 |
| | — |
| | 1,236 |
| | (170 | ) | | 6/27/2013 | | 1995 | | Roseburg | | OR | | — |
| | 350 |
| | 886 |
| | — |
| | 1,236 |
| | (260 | ) | | 6/27/2013 | | 1995 |
| Burger King | | Harrisburg | | PA | | — |
| | 619 |
| | 412 |
| | — |
| | 1,031 |
| | (75 | ) | | 7/31/2013 | | 1985 | | Harrisburg | | PA | | — |
| | 619 |
| | 412 |
| | — |
| | 1,031 |
| | (116 | ) | | 7/31/2013 | | 1985 |
| Burger King | | Old Forge | | PA | | — |
| | 390 |
| | 905 |
| | — |
| | 1,295 |
| | (173 | ) | | 6/27/2013 | | 1995 | | Old Forge | | PA | | — |
| | 390 |
| | 905 |
| | 126 |
| | 1,421 |
| | (74 | ) | | 6/27/2013 | | 1995 |
| Burger King | | Gaffney | | SC | | — |
| | 370 |
| | 880 |
| | — |
| | 1,250 |
| | (169 | ) | | 6/27/2013 | | 1995 | | Gaffney | | SC | | — |
| | 370 |
| | 880 |
| | — |
| | 1,250 |
| | (258 | ) | | 6/27/2013 | | 1995 |
| Burger King | | Greenville | | SC | | — |
| | 420 |
| | 571 |
| | — |
| | 991 |
| | (109 | ) | | 6/27/2013 | | 1995 | | Greenville | | SC | | — |
| | 420 |
| | 571 |
| | — |
| | 991 |
| | (167 | ) | | 6/27/2013 | | 1995 |
| Burger King | | North Augusta | | SC | | — |
| | 256 |
| | 1,451 |
| | — |
| | 1,707 |
| | (265 | ) | | 7/31/2013 | | 1985 | | North Augusta | | SC | | — |
| | 256 |
| | 1,451 |
| | — |
| | 1,707 |
| | (407 | ) | | 7/31/2013 | | 1985 |
| Burger King | | North Augusta | | SC | | — |
| | 450 |
| | 1,050 |
| | — |
| | 1,500 |
| | (192 | ) | | 7/31/2013 | | 1985 | | North Augusta | | SC | | — |
| | 450 |
| | 1,050 |
| | — |
| | 1,500 |
| | (295 | ) | | 7/31/2013 | | 1985 |
| Burger King | | Chattanooga | | TN | | — |
| | 740 |
| | 1,591 |
| | — |
| | 2,331 |
| | (305 | ) | | 6/27/2013 | | 1995 | | Chattanooga | | TN | | — |
| | 740 |
| | 1,591 |
| | — |
| | 2,331 |
| | (467 | ) | | 6/27/2013 | | 1995 |
| Burger King | | Gallatin | | TN | | — |
| | 199 |
| | 463 |
| | — |
| | 662 |
| | (85 | ) | | 7/31/2013 | | 1984 | | Gallatin | | TN | | — |
| | 199 |
| | 463 |
| | — |
| | 662 |
| | (130 | ) | | 7/31/2013 | | 1984 |
| Burger King | | Austin | | TX | | — |
| | 666 |
| | 999 |
| | (517 | ) | | 1,148 |
| | (61 | ) | | 6/27/2013 | | 1998 | | Austin | | TX | | — |
| | 666 |
| | 999 |
| | (517 | ) | | 1,148 |
| | (135 | ) | | 6/27/2013 | | 1998 |
| Burger King | | Laredo | | TX | | — |
| | 684 |
| | 1,026 |
| | — |
| | 1,710 |
| | (187 | ) | | 7/31/2013 | | 2002 | | Laredo | | TX | | — |
| | 684 |
| | 1,026 |
| | — |
| | 1,710 |
| | (288 | ) | | 7/31/2013 | | 2002 |
| Burger King | | Texas City | | TX | | — |
| | 421 |
| | 782 |
| | — |
| | 1,203 |
| | (143 | ) | | 7/31/2013 | | 1984 | | Texas City | | TX | | — |
| | 421 |
| | 782 |
| | 300 |
| | 1,503 |
| | (241 | ) | | 7/31/2013 | | 1984 |
| Burger King | | Spanaway | | WA | | — |
| | 509 |
| | 1,628 |
| | — |
| | 2,137 |
| | (320 | ) | | 6/27/2013 | | 1997 | | Spanaway | | WA | | — |
| | 509 |
| | 1,628 |
| | — |
| | 2,137 |
| | (482 | ) | | 6/27/2013 | | 1997 |
| Burger King | | Germantown | | WI | | — |
| | 644 |
| | 1,300 |
| | — |
| | 1,944 |
| | (255 | ) | | 6/27/2013 | | 1986 | | Germantown | | WI | | — |
| | 644 |
| | 1,300 |
| | — |
| | 1,944 |
| | (385 | ) | | 6/27/2013 | | 1986 |
| Burger King | | Marshfield | | WI | | — |
| | 232 |
| | 885 |
| | — |
| | 1,117 |
| | (174 | ) | | 6/27/2013 | | 1986 | | Marshfield | | WI | | — |
| | 232 |
| | 885 |
| | — |
| | 1,117 |
| | (262 | ) | | 6/27/2013 | | 1986 |
| Burger King | | Rhinelander | | WI | | — |
| | 260 |
| | 606 |
| | — |
| | 866 |
| | (111 | ) | | 7/31/2013 | | 1986 | | Rhinelander | | WI | | — |
| | 260 |
| | 606 |
| | — |
| | 866 |
| | (170 | ) | | 7/31/2013 | | 1986 |
| Burger King | | Weston | | WI | | — |
| | 329 |
| | 718 |
| | — |
| | 1,047 |
| | (141 | ) | | 6/27/2013 | | 1987 | | Weston | | WI | | — |
| | 329 |
| | 718 |
| | — |
| | 1,047 |
| | (213 | ) | | 6/27/2013 | | 1987 |
| Burger King | | Bluefield | | WV | | — |
| | 210 |
| | 1,163 |
| | — |
| | 1,373 |
| | (223 | ) | | 6/27/2013 | | 1995 | | Bluefield | | WV | | — |
| | 210 |
| | 1,163 |
| | — |
| | 1,373 |
| | (341 | ) | | 6/27/2013 | | 1995 |
| Burlington | | | Rogers | | AR | | — |
| | 1,460 |
| | 6,379 |
| | — |
| | 7,839 |
| | (149 | ) | | 3/7/2018 | | 2015 |
| Burlington | | | West Valley City | | UT | | — |
| | 2,331 |
| | 5,821 |
| | — |
| | 8,152 |
| | (257 | ) | | 11/30/2017 | | 2017 |
| Cabela's | | | Rogers | | AR | | — |
| | 3,419 |
| | 17,605 |
| | — |
| | 21,024 |
| | (647 | ) | | 9/25/2017 | | 2012 |
| Cabela's | | | Thornton | | CO | | — |
| | 3,677 |
| | 19,099 |
| | — |
| | 22,776 |
| | (685 | ) | | 9/25/2017 | | 2012 |
| Cabela's | | | Grandville | | MI | | — |
| | 3,269 |
| | 20,328 |
| | — |
| | 23,597 |
| | (739 | ) | | 9/25/2017 | | 2013 |
| Cabela's | | | Oklahoma City | | OK | | — |
| | 3,383 |
| | 11,590 |
| | — |
| | 14,973 |
| | (421 | ) | | 9/25/2017 | | 2015 |
| Cabela's | | | Lacey | | WA | | — |
| | 3,393 |
| | 20,158 |
| | (29 | ) | | 23,522 |
| | (769 | ) | | 9/25/2017 | | 2007 |
| Cactus Wellhead | | Williston | | ND | | — |
| | 72 |
| | 3,735 |
| | — |
| | 3,807 |
| | (393 | ) | | 7/24/2014 | | 2011 | | Williston | | ND | | — |
| | 72 |
| | 3,735 |
| | — |
| | 3,807 |
| | (713 | ) | | 7/24/2014 | | 2011 |
| Cactus Wellhead | | Dubois | | PA | | — |
| | 129 |
| | 2,542 |
| | — |
| | 2,671 |
| | (287 | ) | | 6/12/2014 | | 2012 | | Dubois | | PA | | — |
| | 129 |
| | 2,542 |
| | — |
| | 2,671 |
| | (513 | ) | | 6/12/2014 | | 2012 |
| Cactus Wellhead | | Center | | TX | | — |
| | 115 |
| | 1,886 |
| | — |
| | 2,001 |
| | (213 | ) | | 6/12/2014 | | 2011 | | Center | | TX | | — |
| | 115 |
| | 1,886 |
| | — |
| | 2,001 |
| | (380 | ) | | 6/12/2014 | | 2011 |
| Cactus Wellhead | | Pleasanton | | TX | | — |
| | 144 |
| | 2,908 |
| | — |
| | 3,052 |
| | (331 | ) | | 6/12/2014 | | 2011 | | Pleasanton | | TX | | — |
| | 144 |
| | 2,908 |
| | — |
| | 3,052 |
| | (592 | ) | | 6/12/2014 | | 2011 |
| Cadbury Holdings | | Whippany | | NJ | | — |
| | 2,767 |
| | 38,018 |
| | — |
| | 40,785 |
| | (5,706 | ) | | 11/5/2013 | | 2004 | | Whippany | | NJ | | — |
| | 2,767 |
| | 38,018 |
| | — |
| | 40,785 |
| | (9,275 | ) | | 11/5/2013 | | 2004 |
| California Pizza Kitchen | | Paradise Valley | | AZ | | — |
| | 2,285 |
| | 1,480 |
| | — |
| | 3,765 |
| | (283 | ) | | 2/7/2014 | | 1994 | | Paradise Valley | | AZ | | — |
| | 2,285 |
| | 1,480 |
| | — |
| | 3,765 |
| | (480 | ) | | 2/7/2014 | | 1994 |
| California Pizza Kitchen | | Alpharetta | | GA | | — |
| | 1,279 |
| | 3,249 |
| | — |
| | 4,528 |
| | (558 | ) | | 2/7/2014 | | 1994 | | Alpharetta | | GA | | — |
| | 1,279 |
| | 3,249 |
| | — |
| | 4,528 |
| | (946 | ) | | 2/7/2014 | | 1994 |
| California Pizza Kitchen | | Atlanta | | GA | | — |
| | 2,307 |
| | 1,857 |
| | — |
| | 4,164 |
| | (346 | ) | | 2/7/2014 | | 1993 | |
| California Pizza Kitchen | | Schaumburg | | IL | | — |
| | 1,180 |
| �� | 3,179 |
| | — |
| | 4,359 |
| | (547 | ) | | 2/7/2014 | | 1995 | |
| California Pizza Kitchen | | Grapevine | | TX | | — |
| | 1,544 |
| | 2,250 |
| | — |
| | 3,794 |
| | (395 | ) | | 2/7/2014 | | 1994 | |
| Captain D's | | Statesboro | | GA | | — |
| | 350 |
| | 401 |
| | — |
| | 751 |
| | (77 | ) | | 6/27/2013 | | 1995 | |
| Captain D's | | Florence | | KY | | — |
| | 248 |
| | 325 |
| | — |
| | 573 |
| | (64 | ) | | 6/27/2013 | | 1981 | |
| Captain D's | | Southaven | | MS | | — |
| | 270 |
| | 564 |
| | — |
| | 834 |
| | (108 | ) | | 6/27/2013 | | 1995 | |
| Captain D's | | Memphis | | TN | | — |
| | 230 |
| | 338 |
| | — |
| | 568 |
| | (65 | ) | | 6/27/2013 | | 1995 | |
| | | | | | Initial Costs (1) | | Costs Capitalized Subsequent to Acquisition (2) | | Gross Amount
Carried at
December 31, 2016
(3) (4) | | | | | | Initial Costs (1) | | Costs Capitalized Subsequent to Acquisition (2) | | Gross Amount
Carried at
December 31, 2018
(3) (4) | | | |
| Property | | City | | State | | Encumbrances at
December 31, 2016 | | Land | | Buildings, Fixtures and Improvements | | Accumulated Depreciation
(3) (5) | | Date Acquired | | Date of Construction | | City | | State | | Encumbrances at
December 31, 2018 | | Land | | Buildings, Fixtures and Improvements | | Accumulated Depreciation
(3) (5) | | Date Acquired | | Date of Construction |
| California Pizza Kitchen | | | Atlanta | | GA | | — |
| | 2,307 |
| | 1,857 |
| | — |
| | 4,164 |
| | (587 | ) | | 2/7/2014 | | 1993 |
| California Pizza Kitchen | | | Schaumburg | | IL | | — |
| | 1,180 |
| | 3,179 |
| | — |
| | 4,359 |
| | (928 | ) | | 2/7/2014 | | 1995 |
| California Pizza Kitchen | | | Grapevine | | TX | | — |
| | 1,544 |
| | 2,250 |
| | — |
| | 3,794 |
| | (670 | ) | | 2/7/2014 | | 1994 |
| Captain D's | | | Statesboro | | GA | | — |
| | 350 |
| | 401 |
| | — |
| | 751 |
| | (118 | ) | | 6/27/2013 | | 1995 |
| Captain D's | | | Florence | | KY | | — |
| | 248 |
| | 325 |
| | — |
| | 573 |
| | (96 | ) | | 6/27/2013 | | 1981 |
| Captain D's | | | Southaven | | MS | | — |
| | 270 |
| | 564 |
| | — |
| | 834 |
| | (165 | ) | | 6/27/2013 | | 1995 |
| Captain D's | | | Memphis | | TN | | — |
| | 230 |
| | 338 |
| | — |
| | 568 |
| | (99 | ) | | 6/27/2013 | | 1995 |
| Captain D's | | Duncanville | | TX | | — |
| | 295 |
| | 246 |
| | — |
| | 541 |
| | (48 | ) | | 6/27/2013 | | 1982 | | Duncanville | | TX | | — |
| | 295 |
| | 246 |
| | — |
| | 541 |
| | (73 | ) | | 6/27/2013 | | 1982 |
| Cargill | | Blair | | NE | | 2,470 |
| | 627 |
| | 4,989 |
| | — |
| | 5,616 |
| | (637 | ) | | 2/7/2014 | | 2009 | | Blair | | NE | | 2,401 |
| | 627 |
| | 4,989 |
| | — |
| | 5,616 |
| | (1,080 | ) | | 2/7/2014 | | 2009 |
| Carlos O’Kelley’s Mexican Café | | Mason City | | IA | | — |
| | 290 |
| | 1,255 |
| | (192 | ) | | 1,353 |
| | (105 | ) | | 6/27/2013 | | 1995 | |
| Carl's Jr. | | Purcell | | OK | | — |
| | 77 |
| | 513 |
| | — |
| | 590 |
| | (101 | ) | | 6/27/2013 | | 1980 | | Purcell | | OK | | — |
| | 77 |
| | 513 |
| | — |
| | 590 |
| | (152 | ) | | 6/27/2013 | | 1980 |
| CarMax | | Henderson | | NV | | — |
| | 8,542 |
| | 10,396 |
| | — |
| | 18,938 |
| | (1,673 | ) | | 2/7/2014 | | 2002 | | Henderson | | NV | | — |
| | 8,542 |
| | 10,396 |
| | — |
| | 18,938 |
| | (2,837 | ) | | 2/7/2014 | | 2002 |
| CarMax | | Austin | | TX | | 9,900 |
| | 5,461 |
| | 16,940 |
| | — |
| | 22,401 |
| | (2,452 | ) | | 2/7/2014 | | 2004 | | Austin | | TX | | 9,900 |
| | 5,461 |
| | 16,940 |
| | — |
| | 22,401 |
| | (4,158 | ) | | 2/7/2014 | | 2004 |
| Carrabba's | | Scottsdale | | AZ | | — |
| | 1,350 |
| | 1,847 |
| | — |
| | 3,197 |
| | (235 | ) | | 2/7/2014 | | 2000 | | Scottsdale | | AZ | | — |
| | 1,350 |
| | 1,847 |
| | — |
| | 3,197 |
| | (398 | ) | | 2/7/2014 | | 2000 |
| Carrabba's | | Louisville | | CO | | — |
| | 1,083 |
| | 1,400 |
| | — |
| | 2,483 |
| | (240 | ) | | 2/7/2014 | | 2000 | | Louisville | | CO | | — |
| | 1,083 |
| | 1,400 |
| | — |
| | 2,483 |
| | (407 | ) | | 2/7/2014 | | 2000 |
| Carrabba's | | Tampa | | FL | | — |
| | 1,650 |
| | 2,085 |
| | — |
| | 3,735 |
| | (373 | ) | | 2/7/2014 | | 1994 | | Tampa | | FL | | — |
| | 1,650 |
| | 2,085 |
| | — |
| | 3,735 |
| | (632 | ) | | 2/7/2014 | | 1994 |
| Carrabba's | | Duluth | | GA | | — |
| | 836 |
| | 2,881 |
| | — |
| | 3,717 |
| | (501 | ) | | 2/7/2014 | | 2004 | | Duluth | | GA | | — |
| | 836 |
| | 2,881 |
| | — |
| | 3,717 |
| | (849 | ) | | 2/7/2014 | | 2004 |
| Carrabba's | | Bowie | | MD | | — |
| | 1,429 |
| | 1,036 |
| | — |
| | 2,465 |
| | (332 | ) | | 2/7/2014 | | 2003 | | Bowie | | MD | | — |
| | 1,429 |
| | 1,036 |
| | — |
| | 2,465 |
| | (563 | ) | | 2/7/2014 | | 2003 |
| Carrabba's | | Brooklyn | | OH | | — |
| | 1,187 |
| | 2,212 |
| | — |
| | 3,399 |
| | (365 | ) | | 2/7/2014 | | 2002 | | Brooklyn | | OH | | — |
| | 1,187 |
| | 2,212 |
| | — |
| | 3,399 |
| | (619 | ) | | 2/7/2014 | | 2002 |
| Carrabba's | | Washington Twnshp | | OH | | — |
| | 906 |
| | 1,859 |
| | — |
| | 2,765 |
| | (335 | ) | | 2/7/2014 | | 2001 | | Washington Twnshp | | OH | | — |
| | 906 |
| | 1,859 |
| | — |
| | 2,765 |
| | (568 | ) | | 2/7/2014 | | 2001 |
| Carrabba's | | Columbia | | SC | | — |
| | 1,159 |
| | 2,164 |
| | — |
| | 3,323 |
| | (369 | ) | | 2/7/2014 | | 2000 | | Columbia | | SC | | — |
| | 1,159 |
| | 2,164 |
| | — |
| | 3,323 |
| | (626 | ) | | 2/7/2014 | | 2000 |
| Carrabba's | | Johnson City | | TN | | — |
| | 771 |
| | 2,536 |
| | — |
| | 3,307 |
| | (469 | ) | | 2/7/2014 | | 2003 | | Johnson City | | TN | | — |
| | 771 |
| | 2,536 |
| | — |
| | 3,307 |
| | (795 | ) | | 2/7/2014 | | 2003 |
| Cashland | | Celina | | OH | | — |
| | 108 |
| | 132 |
| | — |
| | 240 |
| | (27 | ) | | 7/31/2013 | | 1995 | | Celina | | OH | | — |
| | 108 |
| | 132 |
| | — |
| | 240 |
| | (41 | ) | | 7/31/2013 | | 1995 |
| Castle Dental | | Murfreesboro | | TN | | — |
| | 256 |
| | 256 |
| | — |
| | 512 |
| | (53 | ) | | 7/31/2013 | | 1996 | | Murfreesboro | | TN | | — |
| | 256 |
| | 256 |
| | — |
| | 512 |
| | (80 | ) | | 7/31/2013 | | 1996 |
| Cequent | | | Mosinee | | WI | | — |
| | 1,416 |
| | 3,259 |
| | — |
| | 4,675 |
| | (499 | ) | | 2/21/2014 | | 1992 |
| Change Healthcare Operations | | | Nashville | | TN | | 4,700 |
| | 688 |
| | 10,417 |
| | — |
| | 11,105 |
| | (2,126 | ) | | 2/7/2014 | | 2010 |
| Charleston's | | Carmel | | IN | | — |
| | 140 |
| | 3,016 |
| | — |
| | 3,156 |
| | (598 | ) | | 6/27/2013 | | 1995 | | Carmel | | IN | | — |
| | 140 |
| | 3,016 |
| | — |
| | 3,156 |
| | (908 | ) | | 6/27/2013 | | 1995 |
| Checkers | | Huntsville | | AL | | — |
| | 689 |
| | — |
| | — |
| | 689 |
| | — |
| | 6/27/2013 | | 1995 | | Huntsville | | AL | | — |
| | 689 |
| | — |
| | — |
| | 689 |
| | — |
| | 6/27/2013 | | 1995 |
| Checkers | | Hollywood | | FL | | — |
| | 160 |
| | 2,220 |
| | — |
| | 2,380 |
| | (440 | ) | | 6/27/2013 | | 1995 | | Hollywood | | FL | | — |
| | 160 |
| | 2,220 |
| | — |
| | 2,380 |
| | (668 | ) | | 6/27/2013 | | 1995 |
| Checkers | | Jacksonville | | FL | | — |
| | 731 |
| | 1,096 |
| | — |
| | 1,827 |
| | (200 | ) | | 7/31/2013 | | 1993 | | Jacksonville | | FL | | — |
| | 731 |
| | 1,096 |
| | — |
| | 1,827 |
| | (308 | ) | | 7/31/2013 | | 1993 |
| Checkers | | Lauderhill | | FL | | — |
| | 280 |
| | 1,951 |
| | — |
| | 2,231 |
| | (387 | ) | | 6/27/2013 | | 1995 | | Lauderhill | | FL | | — |
| | 280 |
| | 1,951 |
| | — |
| | 2,231 |
| | (587 | ) | | 6/27/2013 | | 1995 |
| Checkers | | Miami | | FL | | — |
| | 621 |
| | — |
| | — |
| | 621 |
| | — |
| | 7/31/2013 | | 1993 | | Miami | | FL | | — |
| | 621 |
| | — |
| | — |
| | 621 |
| | — |
| | 7/31/2013 | | 1993 |
| Checkers | | Orlando | | FL | | — |
| | 1,033 |
| | — |
| | — |
| | 1,033 |
| | — |
| | 7/31/2013 | | 1995 | |
| Checkers | | Plantation | | FL | | — |
| | 220 |
| | 1,461 |
| | — |
| | 1,681 |
| | (290 | ) | | 6/27/2013 | | 1995 | |
| Checkers | | Tampa | | FL | | — |
| | 736 |
| | — |
| | — |
| | 736 |
| | — |
| | 6/27/2013 | | 1995 | |
| Checkers | | Fayetteville | | GA | | — |
| | 681 |
| | — |
| | — |
| | 681 |
| | — |
| | 6/27/2013 | | 1995 | |
| Chedder's Casual Cafe | | Brandon | | FL | | — |
| | 860 |
| | 3,071 |
| | (2,204 | ) | | 1,727 |
| | (18 | ) | | 6/27/2013 | | 2003 | |
| Chedder's Casual Cafe | | Bolingbrook | | IL | | — |
| | 1,344 |
| | 1,760 |
| | — |
| | 3,104 |
| | (357 | ) | | 6/27/2013 | | 1997 | |
| Chedder's Casual Cafe | | Lubbock | | TX | | — |
| | 1,053 |
| | 2,345 |
| | — |
| | 3,398 |
| | (476 | ) | | 6/27/2013 | | 1997 | |
| Chevy's | | Miami | | FL | | — |
| | 1,455 |
| | 783 |
| | — |
| | 2,238 |
| | (161 | ) | | 7/31/2013 | | 1995 | |
| Chevy's | | Greenbelt | | MD | | — |
| | 530 |
| | 2,399 |
| | — |
| | 2,929 |
| | (476 | ) | | 6/27/2013 | | 1995 | |
| | | | | | Initial Costs (1) | | Costs Capitalized Subsequent to Acquisition (2) | | Gross Amount
Carried at
December 31, 2016
(3) (4) | | | | | | Initial Costs (1) | | Costs Capitalized Subsequent to Acquisition (2) | | Gross Amount
Carried at
December 31, 2018
(3) (4) | | | |
| Property | | City | | State | | Encumbrances at
December 31, 2016 | | Land | | Buildings, Fixtures and Improvements | | Accumulated Depreciation
(3) (5) | | Date Acquired | | Date of Construction | | City | | State | | Encumbrances at
December 31, 2018 | | Land | | Buildings, Fixtures and Improvements | | Accumulated Depreciation
(3) (5) | | Date Acquired | | Date of Construction |
| Checkers | | | Orlando | | FL | | — |
| | 1,033 |
| | — |
| | — |
| | 1,033 |
| | — |
| | 7/31/2013 | | 1995 |
| Checkers | | | Plantation | | FL | | — |
| | 220 |
| | 1,461 |
| | — |
| | 1,681 |
| | (440 | ) | | 6/27/2013 | | 1995 |
| Checkers | | | Tampa | | FL | | — |
| | 736 |
| | — |
| | — |
| | 736 |
| | — |
| | 6/27/2013 | | 1995 |
| Checkers | | | Fayetteville | | GA | | — |
| | 681 |
| | — |
| | — |
| | 681 |
| | — |
| | 6/27/2013 | | 1995 |
| Chedder's Casual Cafe | | | Bolingbrook | | IL | | — |
| | 1,344 |
| | 1,760 |
| | — |
| | 3,104 |
| | (534 | ) | | 6/27/2013 | | 1997 |
| Chedder's Casual Cafe | | | Lubbock | | TX | | — |
| | 1,053 |
| | 2,345 |
| | — |
| | 3,398 |
| | (712 | ) | | 6/27/2013 | | 1997 |
| Chevy's | | Lake Oswego | | OR | | — |
| | 590 |
| | 1,693 |
| | — |
| | 2,283 |
| | (336 | ) | | 6/27/2013 | | 1995 | | Miami | | FL | | — |
| | 1,455 |
| | 783 |
| | — |
| | 2,238 |
| | (244 | ) | | 7/31/2013 | | 1995 |
| Chicago Bridge & Iron | | Baton Rouge | | LA | | — |
| | 1,695 |
| | 12,360 |
| | (1,567 | ) | | 12,488 |
| | (409 | ) | | 3/28/2014 | | 2006 | |
| Chevy's | | | Greenbelt | | MD | | — |
| | 530 |
| | 2,399 |
| | — |
| | 2,929 |
| | (722 | ) | | 6/27/2013 | | 1995 |
| Children's Courtyard | | Grand Prairie | | TX | | — |
| | 367 |
| | 1,055 |
| | — |
| | 1,422 |
| | (163 | ) | | 2/7/2014 | | 1999 | | Grand Prairie | | TX | | — |
| | 367 |
| | 1,055 |
| | — |
| | 1,422 |
| | (277 | ) | | 2/7/2014 | | 1999 |
| Childtime Childcare | | Modesto | | CA | | — |
| | 280 |
| | 1,524 |
| | — |
| | 1,804 |
| | (228 | ) | | 2/7/2014 | | 1988 | | Modesto | | CA | | — |
| | 280 |
| | 1,524 |
| | — |
| | 1,804 |
| | (387 | ) | | 2/7/2014 | | 1988 |
| Childtime Childcare | | Bedford | | OH | | — |
| | 111 |
| | 852 |
| | — |
| | 963 |
| | (141 | ) | | 2/7/2014 | | 1979 | | Bedford | | OH | | — |
| | 111 |
| | 852 |
| | — |
| | 963 |
| | (240 | ) | | 2/7/2014 | | 1979 |
| Childtime Childcare | | Oklahoma City | | OK | | — |
| | 124 |
| | 796 |
| | — |
| | 920 |
| | (131 | ) | | 2/7/2014 | | 1985 | | Oklahoma City | | OK | | — |
| | 124 |
| | 796 |
| | — |
| | 920 |
| | (222 | ) | | 2/7/2014 | | 1985 |
| Childtime Childcare | | Oklahoma City | | OK | | — |
| | 108 |
| | 793 |
| | — |
| | 901 |
| | (126 | ) | | 2/7/2014 | | 1986 | | Oklahoma City | | OK | | — |
| | 108 |
| | 793 |
| | — |
| | 901 |
| | (214 | ) | | 2/7/2014 | | 1986 |
| Chilis | | Fayetteville | | AR | | — |
| | 1,370 |
| | 1,714 |
| | — |
| | 3,084 |
| | (340 | ) | | 6/27/2013 | | 1995 | | East Peoria | | IL | | — |
| | 1,023 |
| | 2,347 |
| | — |
| | 3,370 |
| | (713 | ) | | 6/27/2013 | | 2003 |
| Chilis | | Boise | | ID | | — |
| | 400 |
| | 751 |
| | (3 | ) | | 1,148 |
| | (149 | ) | | 6/27/2013 | | 1995 | | Flanders | | NJ | | 1,508 |
| | 1,402 |
| | 842 |
| | — |
| | 2,244 |
| | (398 | ) | | 2/7/2014 | | 2003 |
| Chilis | | East Peoria | | IL | | — |
| | 1,023 |
| | 2,347 |
| | — |
| | 3,370 |
| | (476 | ) | | 6/27/2013 | | 2003 | | Mt. Laurel | | NJ | | 1,447 |
| | 1,332 |
| | 1,792 |
| | — |
| | 3,124 |
| | (360 | ) | | 2/7/2014 | | 2004 |
| Chilis | | Flanders | | NJ | | 1,508 |
| | 1,402 |
| | 842 |
| | — |
| | 2,244 |
| | (234 | ) | | 2/7/2014 | | 2003 | | Amarillo | | TX | | — |
| | 811 |
| | 1,893 |
| | — |
| | 2,704 |
| | (590 | ) | | 7/31/2013 | | 1984 |
| Chilis | | Mt. Laurel | | NJ | | 1,447 |
| | 1,332 |
| | 1,792 |
| | — |
| | 3,124 |
| | (212 | ) | | 2/7/2014 | | 2004 | |
| Chilis | | Amarillo | | TX | | — |
| | 811 |
| | 1,893 |
| | — |
| | 2,704 |
| | (390 | ) | | 7/31/2013 | | 1984 | |
| Chilis | | Riverdale | | UT | | — |
| | 800 |
| | 899 |
| | — |
| | 1,699 |
| | (178 | ) | | 6/27/2013 | | 1995 | |
| Chilis | | Cheyenne | | WY | | — |
| | 270 |
| | 815 |
| | — |
| | 1,085 |
| | (162 | ) | | 6/27/2013 | | 1995 | |
| China 1 | | Bay City | | TX | | — |
| | 229 |
| | 124 |
| | (220 | ) | | 133 |
| | (3 | ) | | 7/31/2013 | | 1985 | |
| China Buffet | | Alvin | | TX | | — |
| | 110 |
| | 299 |
| | — |
| | 409 |
| | (61 | ) | | 6/27/2013 | | 1982 | | Alvin | | TX | | — |
| | 110 |
| | 299 |
| | — |
| | 409 |
| | (91 | ) | | 6/27/2013 | | 1982 |
| China Buffet | | Angleton | | TX | | — |
| | 127 |
| | 272 |
| | — |
| | 399 |
| | (55 | ) | | 6/27/2013 | | 1982 | | Angleton | | TX | | — |
| | 127 |
| | 272 |
| | — |
| | 399 |
| | (82 | ) | | 6/27/2013 | | 1982 |
| China Town Buffet | | Bismarck | | ND | | — |
| | 1,038 |
| | 1,928 |
| | — |
| | 2,966 |
| | (397 | ) | | 7/31/2013 | | 2000 | | Bismarck | | ND | | — |
| | 1,038 |
| | 1,928 |
| | — |
| | 2,966 |
| | (601 | ) | | 7/31/2013 | | 2000 |
| Chipper's Grill | | Streator | | IL | | — |
| | 190 |
| | 255 |
| | — |
| | 445 |
| | (51 | ) | | 6/27/2013 | | 1995 | | Streator | | IL | | — |
| | 190 |
| | 255 |
| | — |
| | 445 |
| | (77 | ) | | 6/27/2013 | | 1995 |
| Church's Chicken | | Atmore | | AL | | — |
| | 144 |
| | 574 |
| | — |
| | 718 |
| | (105 | ) | | 7/31/2013 | | 1976 | | Atmore | | AL | | — |
| | 144 |
| | 574 |
| | — |
| | 718 |
| | (161 | ) | | 7/31/2013 | | 1976 |
| Church's Chicken | | Bay Minette | | AL | | — |
| | 134 |
| | 757 |
| | — |
| | 891 |
| | (138 | ) | | 7/31/2013 | | 2003 | | Bay Minette | | AL | | — |
| | 134 |
| | 757 |
| | — |
| | 891 |
| | (212 | ) | | 7/31/2013 | | 2003 |
| Church's Chicken | | Flomaton | | AL | | — |
| | 173 |
| | 518 |
| | — |
| | 691 |
| | (94 | ) | | 7/31/2013 | | 1981 | | Flomaton | | AL | | — |
| | 173 |
| | 518 |
| | — |
| | 691 |
| | (145 | ) | | 7/31/2013 | | 1981 |
| Church's Chicken | | Jackson | | AL | | — |
| | 127 |
| | 719 |
| | — |
| | 846 |
| | (131 | ) | | 7/31/2013 | | 1982 | | Jackson | | AL | | — |
| | 127 |
| | 719 |
| | — |
| | 846 |
| | (202 | ) | | 7/31/2013 | | 1982 |
| Church's Chicken | | Orlando | | FL | | — |
| | 254 |
| | 380 |
| | — |
| | 634 |
| | (69 | ) | | 7/31/2013 | | 1984 | | Orlando | | FL | | — |
| | 254 |
| | 380 |
| | — |
| | 634 |
| | (107 | ) | | 7/31/2013 | | 1984 |
| Church's Chicken | | Augusta | | GA | | — |
| | 178 |
| | 533 |
| | — |
| | 711 |
| | (97 | ) | | 7/31/2013 | | 1981 | | Augusta | | GA | | — |
| | 256 |
| | 597 |
| | — |
| | 853 |
| | (167 | ) | | 7/31/2013 | | 1976 |
| Church's Chicken | | Augusta | | GA | | — |
| | 256 |
| | 597 |
| | — |
| | 853 |
| | (109 | ) | | 7/31/2013 | | 1976 | | Augusta | | GA | | — |
| | 196 |
| | 458 |
| | — |
| | 654 |
| | (128 | ) | | 7/31/2013 | | 1984 |
| Church's Chicken | | Augusta | | GA | | — |
| | 178 |
| | 414 |
| | — |
| | 592 |
| | (76 | ) | | 7/31/2013 | | 1978 | | Charleston | | SC | | — |
| | 421 |
| | 344 |
| | — |
| | 765 |
| | (97 | ) | | 7/31/2013 | | 1973 |
| Church's Chicken | | Augusta | | GA | | — |
| | 196 |
| | 458 |
| | — |
| | 654 |
| | (83 | ) | | 7/31/2013 | | 1984 | | Charleston | | SC | | — |
| | 500 |
| | 167 |
| | — |
| | 667 |
| | (47 | ) | | 7/31/2013 | | 1979 |
| Church's Chicken | | Anderson | | SC | | — |
| | 647 |
| | 277 |
| | — |
| | 924 |
| | (51 | ) | | 7/31/2013 | | 1981 | | Columbia | | SC | | — |
| | 437 |
| | 437 |
| | (486 | ) | | 388 |
| | (6 | ) | | 7/31/2013 | | 1978 |
| Church's Chicken | | Charleston | | SC | | — |
| | 421 |
| | 344 |
| | — |
| | 765 |
| | (63 | ) | | 7/31/2013 | | 1973 | | Columbia | | SC | | — |
| | 231 |
| | 428 |
| | (393 | ) | | 266 |
| | (6 | ) | | 7/31/2013 | | 1977 |
| Church's Chicken | | Charleston | | SC | | — |
| | 500 |
| | 167 |
| | — |
| | 667 |
| | (30 | ) | | 7/31/2013 | | 1979 | |
| | | | | | Initial Costs (1) | | Costs Capitalized Subsequent to Acquisition (2) | | Gross Amount
Carried at
December 31, 2016
(3) (4) | | | | | | Initial Costs (1) | | Costs Capitalized Subsequent to Acquisition (2) | | Gross Amount
Carried at
December 31, 2018
(3) (4) | | | |
| Property | | City | | State | | Encumbrances at
December 31, 2016 | | Land | | Buildings, Fixtures and Improvements | | Accumulated Depreciation
(3) (5) | | Date Acquired | | Date of Construction | | City | | State | | Encumbrances at
December 31, 2018 | | Land | | Buildings, Fixtures and Improvements | | Accumulated Depreciation
(3) (5) | | Date Acquired | | Date of Construction |
| Church's Chicken | | Columbia | | SC | | — |
| | 437 |
| | 437 |
| | — |
| | 874 |
| | (80 | ) | | 7/31/2013 | | 1978 | | Greenville | | SC | | — |
| | 254 |
| | 472 |
| | — |
| | 726 |
| | (132 | ) | | 7/31/2013 | | 2009 |
| Church's Chicken | | Columbia | | SC | | — |
| | 231 |
| | 428 |
| | — |
| | 659 |
| | (78 | ) | | 7/31/2013 | | 1977 | | Greenville | | SC | | — |
| | 325 |
| | 487 |
| | (458 | ) | | 354 |
| | (7 | ) | | 7/31/2013 | | 1984 |
| Church's Chicken | | Greenville | | SC | | — |
| | 280 |
| | 342 |
| | — |
| | 622 |
| | (62 | ) | | 7/31/2013 | | 1970 | | North Charleston | | SC | | — |
| | 302 |
| | 302 |
| | — |
| | 604 |
| | (85 | ) | | 7/31/2013 | | 1976 |
| Church's Chicken | | Greenville | | SC | | — |
| | 254 |
| | 472 |
| | — |
| | 726 |
| | (86 | ) | | 7/31/2013 | | 2009 | | North Charleston | | SC | | — |
| | 407 |
| | 407 |
| | — |
| | 814 |
| | (114 | ) | | 7/31/2013 | | 1977 |
| Church's Chicken | | Greenville | | SC | | — |
| | 325 |
| | 487 |
| | — |
| | 812 |
| | (89 | ) | | 7/31/2013 | | 1984 | | Orangeburg | | SC | | — |
| | 407 |
| | 271 |
| | (299 | ) | | 379 |
| | (5 | ) | | 7/31/2013 | | 1985 |
| Church's Chicken | | Greenwood | | SC | | — |
| | 188 |
| | 349 |
| | — |
| | 537 |
| | (64 | ) | | 7/31/2013 | | 2002 | | Spartanburg | | SC | | — |
| | 350 |
| | 525 |
| | (431 | ) | | 444 |
| | (9 | ) | | 7/31/2013 | | 1978 |
| Church's Chicken | | North Charleston | | SC | | — |
| | 302 |
| | 302 |
| | — |
| | 604 |
| | (55 | ) | | 7/31/2013 | | 1976 | |
| Church's Chicken | | North Charleston | | SC | | — |
| | 407 |
| | 407 |
| | — |
| | 814 |
| | (74 | ) | | 7/31/2013 | | 1977 | |
| Church's Chicken | | Orangeburg | | SC | | — |
| | 407 |
| | 271 |
| | — |
| | 678 |
| | (49 | ) | | 7/31/2013 | | 1985 | |
| Church's Chicken | | Spartanburg | | SC | | — |
| | 411 |
| | 274 |
| | — |
| | 685 |
| | (50 | ) | | 7/31/2013 | | 1972 | |
| Church's Chicken | | Spartanburg | | SC | | — |
| | 350 |
| | 525 |
| | — |
| | 875 |
| | (96 | ) | | 7/31/2013 | | 1978 | |
| Chuze Fitness | | | Highlands Ranch | | CO | | — |
| | 2,850 |
| | 4,795 |
| | — |
| | 7,645 |
| | (1,168 | ) | | 2/7/2014 | | 2007 |
| Cigna | | Phoenix | | AZ | | — |
| | 6,194 |
| | 16,215 |
| | — |
| | 22,409 |
| | (2,239 | ) | | 2/7/2014 | | 2012 | | Phoenix | | AZ | | — |
| | 6,194 |
| | 16,215 |
| | — |
| | 22,409 |
| | (3,797 | ) | | 2/7/2014 | | 2012 |
| Cigna | | Plano | | TX | | — |
| | 10,036 |
| | 42,676 |
| | — |
| | 52,712 |
| | (5,962 | ) | | 2/7/2014 | | 2009 | | Plano | | TX | | — |
| | 10,036 |
| | 42,676 |
| | — |
| | 52,712 |
| | (10,111 | ) | | 2/7/2014 | | 2009 |
| Circle K | | Phoenix | | AZ | | — |
| | 344 |
| | 1,377 |
| | — |
| | 1,721 |
| | (358 | ) | | 5/4/2012 | | 1986 | | Phoenix | | AZ | | — |
| | 344 |
| | 1,377 |
| | — |
| | 1,721 |
| | (450 | ) | | 5/4/2012 | | 1986 |
| Circle K | | Martinez | | GA | | — |
| | 348 |
| | 813 |
| | — |
| | 1,161 |
| | (200 | ) | | 8/28/2012 | | 2003 | | Martinez | | GA | | — |
| | 348 |
| | 813 |
| | — |
| | 1,161 |
| | (260 | ) | | 8/28/2012 | | 2003 |
| Circle K | | Martinez | | GA | | — |
| | 293 |
| | 329 |
| | — |
| | 622 |
| | (44 | ) | | 9/26/2014 | | 1993 | | Martinez | | GA | | — |
| | 293 |
| | 329 |
| | — |
| | 622 |
| | (80 | ) | | 9/26/2014 | | 1993 |
| Circle K | | Thomson | | GA | | — |
| | 637 |
| | 340 |
| | — |
| | 977 |
| | (47 | ) | | 9/26/2014 | | 1990 | | Thomson | | GA | | — |
| | 637 |
| | 340 |
| | — |
| | 977 |
| | (86 | ) | | 9/26/2014 | | 1990 |
| Circle K | | Akron | | OH | | — |
| | 675 |
| | 1,254 |
| | — |
| | 1,929 |
| | (302 | ) | | 9/27/2012 | | 1996 | | Akron | | OH | | — |
| | 675 |
| | 1,254 |
| | — |
| | 1,929 |
| | (398 | ) | | 9/27/2012 | | 1996 |
| Citizens Bank | | Colchester | | CT | | — |
| | 185 |
| | 1,049 |
| | — |
| | 1,234 |
| | (241 | ) | | 9/28/2012 | | 2012 | | Colchester | | CT | | — |
| | 185 |
| | 1,049 |
| | — |
| | 1,234 |
| | (319 | ) | | 9/28/2012 | | 2012 |
| Citizens Bank | | Deep River | | CT | | — |
| | 453 |
| | 1,812 |
| | — |
| | 2,265 |
| | (417 | ) | | 9/28/2012 | | 1851 | | Deep River | | CT | | — |
| | 453 |
| | 1,812 |
| | — |
| | 2,265 |
| | (550 | ) | | 9/28/2012 | | 1851 |
| Citizens Bank | | East Hampton | | CT | | 765 |
| | 312 |
| | 935 |
| | — |
| | 1,247 |
| | (236 | ) | | 4/26/2012 | | 1984 | | East Lyme | | CT | | — |
| | 258 |
| | 1,032 |
| | — |
| | 1,290 |
| | (313 | ) | | 9/28/2012 | | 1972 |
| Citizens Bank | | East Lyme | | CT | | — |
| | 258 |
| | 1,032 |
| | — |
| | 1,290 |
| | (237 | ) | | 9/28/2012 | | 1972 | | Hamden | | CT | | — |
| | 581 |
| | 475 |
| | — |
| | 1,056 |
| | (144 | ) | | 9/28/2012 | | 1995 |
| Citizens Bank | | Hamden | | CT | | — |
| | 581 |
| | 475 |
| | — |
| | 1,056 |
| | (109 | ) | | 9/28/2012 | | 1995 | | Higganum | | CT | | — |
| | 171 |
| | 971 |
| | — |
| | 1,142 |
| | (358 | ) | | 8/1/2010 | | 1995 |
| Citizens Bank | | Higganum | | CT | | 613 |
| | 171 |
| | 971 |
| | — |
| | 1,142 |
| | (317 | ) | | 8/1/2010 | | 1995 | | Montville | | CT | | — |
| | 413 |
| | 2,342 |
| | — |
| | 2,755 |
| | (711 | ) | | 9/28/2012 | | 1984 |
| Citizens Bank | | Montville | | CT | | — |
| | 413 |
| | 2,342 |
| | — |
| | 2,755 |
| | (539 | ) | | 9/28/2012 | | 1984 | | Stonington | | CT | | — |
| | 190 |
| | 1,079 |
| | — |
| | 1,269 |
| | (328 | ) | | 9/28/2012 | | 1984 |
| Citizens Bank | | New London | | CT | | — |
| | 94 |
| | 534 |
| | — |
| | 628 |
| | (174 | ) | | 8/1/2010 | | 1995 | | Lewes | | DE | | — |
| | 102 |
| | 916 |
| | — |
| | 1,018 |
| | (267 | ) | | 2/22/2013 | | 1968 |
| Citizens Bank | | Stonington | | CT | | — |
| | 190 |
| | 1,079 |
| | — |
| | 1,269 |
| | (248 | ) | | 9/28/2012 | | 1984 | | Wilmington | | DE | | — |
| | 299 |
| | 299 |
| | — |
| | 598 |
| | (94 | ) | | 4/26/2012 | | 1967 |
| Citizens Bank | | Stonington | | CT | | — |
| | 104 |
| | 937 |
| | — |
| | 1,041 |
| | (203 | ) | | 12/14/2012 | | 1982 | | Ludlow | | MA | | — |
| | 810 |
| | 540 |
| | — |
| | 1,350 |
| | (164 | ) | | 9/28/2012 | | 1995 |
| Citizens Bank | | Lewes | | DE | | — |
| | 102 |
| | 916 |
| | — |
| | 1,018 |
| | (190 | ) | | 2/22/2013 | | 1968 | | Malden | | MA | | — |
| | 488 |
| | 596 |
| | — |
| | 1,084 |
| | (181 | ) | | 9/28/2012 | | 1920 |
| Citizens Bank | | Smyrna | | DE | | 654 |
| | 183 |
| | 1,036 |
| | (994 | ) | | 225 |
| | — |
| | 8/1/2010 | | 1995 | | Malden | | MA | | 1,697 |
| | 484 |
| | 1,935 |
| | — |
| | 2,419 |
| | (587 | ) | | 9/28/2012 | | 1988 |
| Citizens Bank | | Wilmington | | DE | | 431 |
| | 250 |
| | 464 |
| | — |
| | 714 |
| | (117 | ) | | 4/26/2012 | | 1950 | | Medford | | MA | | 1,194 |
| | 589 |
| | 1,094 |
| | — |
| | 1,683 |
| | (332 | ) | | 9/28/2012 | | 1938 |
| Citizens Bank | | Wilmington | | DE | | 366 |
| | 299 |
| | 299 |
| | — |
| | 598 |
| | (75 | ) | | 4/26/2012 | | 1967 | | Milton | | MA | | 2,244 |
| | 619 |
| | 2,476 |
| | — |
| | 3,095 |
| | (735 | ) | | 12/14/2012 | | 1968 |
| Citizens Bank | | | New Bedford | | MA | | — |
| | 297 |
| | 694 |
| | — |
| | 991 |
| | (211 | ) | | 9/28/2012 | | 1983 |
| Citizens Bank | | | Randolph | | MA | | 1,383 |
| | 480 |
| | 1,439 |
| | — |
| | 1,919 |
| | (437 | ) | | 9/28/2012 | | 1979 |
| Citizens Bank | | | Somerville | | MA | | — |
| | 561 |
| | 561 |
| | — |
| | 1,122 |
| | (170 | ) | | 9/28/2012 | | 1940 |
| Citizens Bank | | | South Dennis | | MA | | — |
| | — |
| | 1,294 |
| | — |
| | 1,294 |
| | (384 | ) | | 12/14/2012 | | 1986 |
| | | | | | Initial Costs (1) | | Costs Capitalized Subsequent to Acquisition (2) | | Gross Amount
Carried at
December 31, 2016
(3) (4) | | | | | | Initial Costs (1) | | Costs Capitalized Subsequent to Acquisition (2) | | Gross Amount
Carried at
December 31, 2018
(3) (4) | | | |
| Property | | City | | State | | Encumbrances at
December 31, 2016 | | Land | | Buildings, Fixtures and Improvements | | Accumulated Depreciation
(3) (5) | | Date Acquired | | Date of Construction | | City | | State | | Encumbrances at
December 31, 2018 | | Land | | Buildings, Fixtures and Improvements | | Accumulated Depreciation
(3) (5) | | Date Acquired | | Date of Construction |
| Citizens Bank | | Dorchester | | MA | | 485 |
| | 386 |
| | 386 |
| | — |
| | 772 |
| | (97 | ) | | 4/26/2012 | | 1960 | | Springfield | | MA | | — |
| | 187 |
| | 747 |
| | — |
| | 934 |
| | (213 | ) | | 5/10/2013 | | 1975 |
| Citizens Bank | | Ludlow | | MA | | — |
| | 810 |
| | 540 |
| | — |
| | 1,350 |
| | (124 | ) | | 9/28/2012 | | 1995 | | Winthrop | | MA | | — |
| | 390 |
| | 724 |
| | — |
| | 1,114 |
| | (220 | ) | | 9/28/2012 | | 1974 |
| Citizens Bank | | Malden | | MA | | — |
| | 488 |
| | 596 |
| | — |
| | 1,084 |
| | (137 | ) | | 9/28/2012 | | 1920 | | Woburn | | MA | | — |
| | 350 |
| | 816 |
| | — |
| | 1,166 |
| | (242 | ) | | 12/14/2012 | | 1991 |
| Citizens Bank | | Malden | | MA | | 1,697 |
| | 484 |
| | 1,935 |
| | — |
| | 2,419 |
| | (445 | ) | | 9/28/2012 | | 1988 | | Clinton Township | | MI | | — |
| | 574 |
| | 3,250 |
| | — |
| | 3,824 |
| | (1,205 | ) | | 8/1/2010 | | 1970 |
| Citizens Bank | | Medford | | MA | | 1,193 |
| | 589 |
| | 1,094 |
| | — |
| | 1,683 |
| | (252 | ) | | 9/28/2012 | | 1938 | | Dearborn | | MI | | — |
| | 434 |
| | 2,461 |
| | — |
| | 2,895 |
| | (861 | ) | | 8/1/2010 | | 1977 |
| Citizens Bank | | Milton | | MA | | 2,244 |
| | 619 |
| | 2,476 |
| | — |
| | 3,095 |
| | (536 | ) | | 12/14/2012 | | 1968 | | Dearborn | | MI | | — |
| | 385 |
| | 2,184 |
| | — |
| | 2,569 |
| | (764 | ) | | 8/1/2010 | | 1974 |
| Citizens Bank | | New Bedford | | MA | | — |
| | 297 |
| | 694 |
| | — |
| | 991 |
| | (160 | ) | | 9/28/2012 | | 1983 | | Farmington | | MI | | — |
| | 303 |
| | 707 |
| | — |
| | 1,010 |
| | (210 | ) | | 12/14/2012 | | 1962 |
| Citizens Bank | | Randolph | | MA | | 1,383 |
| | 480 |
| | 1,439 |
| | — |
| | 1,919 |
| | (331 | ) | | 9/28/2012 | | 1979 | | Grosse Pointe | | MI | | — |
| | 410 |
| | 2,322 |
| | — |
| | 2,732 |
| | (849 | ) | | 8/1/2010 | | 1975 |
| Citizens Bank | | Somerville | | MA | | — |
| | 561 |
| | 561 |
| | — |
| | 1,122 |
| | (129 | ) | | 9/28/2012 | | 1940 | | Lathrup Village | | MI | | — |
| | 283 |
| | 1,602 |
| | (1,227 | ) | | 658 |
| | (8 | ) | | 8/1/2010 | | 1980 |
| Citizens Bank | | South Dennis | | MA | | — |
| | — |
| | 1,294 |
| | — |
| | 1,294 |
| | (280 | ) | | 12/14/2012 | | 1986 | | Livonia | | MI | | — |
| | 261 |
| | 1,476 |
| | — |
| | 1,737 |
| | (550 | ) | | 8/1/2010 | | 1959 |
| Citizens Bank | | Springfield | | MA | | — |
| | 187 |
| | 747 |
| | — |
| | 934 |
| | (145 | ) | | 5/10/2013 | | 1975 | | Richmond | | MI | | — |
| | 168 |
| | 951 |
| | — |
| | 1,119 |
| | (354 | ) | | 8/1/2010 | | 1980 |
| Citizens Bank | | Tewksbury | | MA | | 813 |
| | 266 |
| | 1,063 |
| | — |
| | 1,329 |
| | (268 | ) | | 4/26/2012 | | 1998 | | St. Clair Shores | | MI | | — |
| | 309 |
| | 1,748 |
| | — |
| | 2,057 |
| | (651 | ) | | 8/1/2010 | | 1960 |
| Citizens Bank | | Wilbraham | | MA | | 458 |
| | 148 |
| | 591 |
| | — |
| | 739 |
| | (149 | ) | | 4/26/2012 | | 1967 | | Troy | | MI | | — |
| | 312 |
| | 935 |
| | — |
| | 1,247 |
| | (277 | ) | | 12/14/2012 | | 1980 |
| Citizens Bank | | Winthrop | | MA | | — |
| | 390 |
| | 724 |
| | — |
| | 1,114 |
| | (166 | ) | | 9/28/2012 | | 1974 | | Warren | | MI | | — |
| | 178 |
| | 1,009 |
| | — |
| | 1,187 |
| | (372 | ) | | 8/1/2010 | | 1963 |
| Citizens Bank | | Woburn | | MA | | — |
| | 350 |
| | 816 |
| | — |
| | 1,166 |
| | (177 | ) | | 12/14/2012 | | 1991 | |
| Citizens Bank | | Clinton Township | | MI | | — |
| | 574 |
| | 3,250 |
| | — |
| | 3,824 |
| | (1,068 | ) | | 8/1/2010 | | 1970 | |
| Citizens Bank | | Dearborn | | MI | | — |
| | 434 |
| | 2,461 |
| | — |
| | 2,895 |
| | (757 | ) | | 8/1/2010 | | 1977 | |
| Citizens Bank | | Dearborn | | MI | | — |
| | 385 |
| | 2,184 |
| | — |
| | 2,569 |
| | (671 | ) | | 8/1/2010 | | 1974 | |
| Citizens Bank | | Detroit | | MI | | — |
| | 112 |
| | 636 |
| | — |
| | 748 |
| | (210 | ) | | 8/1/2010 | | 1958 | |
| Citizens Bank | | Detroit | | MI | | — |
| | 204 |
| | 1,159 |
| | — |
| | 1,363 |
| | (383 | ) | | 8/1/2010 | | 1956 | |
| Citizens Bank | | Farmington | | MI | | — |
| | 303 |
| | 707 |
| | — |
| | 1,010 |
| | (153 | ) | | 12/14/2012 | | 1962 | |
| Citizens Bank | | Grosse Pointe | | MI | | — |
| | 410 |
| | 2,322 |
| | — |
| | 2,732 |
| | (751 | ) | | 8/1/2010 | | 1975 | |
| Citizens Bank | | Harper Woods | | MI | | — |
| | 207 |
| | 1,171 |
| | — |
| | 1,378 |
| | (387 | ) | | 8/1/2010 | | 1982 | |
| Citizens Bank | | Highland Park | | MI | | — |
| | 150 |
| | 848 |
| | — |
| | 998 |
| | (280 | ) | | 8/1/2010 | | 1967 | |
| Citizens Bank | | Lathrup Village | | MI | | — |
| | 283 |
| | 1,602 |
| | — |
| | 1,885 |
| | (524 | ) | | 8/1/2010 | | 1980 | |
| Citizens Bank | | Livonia | | MI | | — |
| | 261 |
| | 1,476 |
| | — |
| | 1,737 |
| | (488 | ) | | 8/1/2010 | | 1959 | |
| Citizens Bank | | Richmond | | MI | | — |
| | 168 |
| | 951 |
| | — |
| | 1,119 |
| | (314 | ) | | 8/1/2010 | | 1980 | |
| Citizens Bank | | Southfield | | MI | | — |
| | 283 |
| | 1,605 |
| | — |
| | 1,888 |
| | (527 | ) | | 8/1/2010 | | 1975 | |
| Citizens Bank | | St. Clair Shores | | MI | | — |
| | 309 |
| | 1,748 |
| | — |
| | 2,057 |
| | (577 | ) | | 8/1/2010 | | 1960 | |
| Citizens Bank | | Troy | | MI | | — |
| | 312 |
| | 935 |
| | — |
| | 1,247 |
| | (203 | ) | | 12/14/2012 | | 1980 | |
| Citizens Bank | | Utica | | MI | | — |
| | 376 |
| | 2,133 |
| | — |
| | 2,509 |
| | (689 | ) | | 8/1/2010 | | 1982 | |
| Citizens Bank | | Warren | | MI | | — |
| | 178 |
| | 1,009 |
| | — |
| | 1,187 |
| | (330 | ) | | 8/1/2010 | | 1963 | |
| | | | | | Initial Costs (1) | | Costs Capitalized Subsequent to Acquisition (2) | | Gross Amount
Carried at
December 31, 2016
(3) (4) | | | | | | Initial Costs (1) | | Costs Capitalized Subsequent to Acquisition (2) | | Gross Amount
Carried at
December 31, 2018
(3) (4) | | | |
| Property | | City | | State | | Encumbrances at
December 31, 2016 | | Land | | Buildings, Fixtures and Improvements | | Accumulated Depreciation
(3) (5) | | Date Acquired | | Date of Construction | | City | | State | | Encumbrances at
December 31, 2018 | | Land | | Buildings, Fixtures and Improvements | | Accumulated Depreciation
(3) (5) | | Date Acquired | | Date of Construction |
| Citizens Bank | | Keene | | NH | | 1,885 |
| | 132 |
| | 2,511 |
| | — |
| | 2,643 |
| | (544 | ) | | 12/14/2012 | | 1900 | | Keene | | NH | | 1,885 |
| | 132 |
| | 2,511 |
| | — |
| | 2,643 |
| | (745 | ) | | 12/14/2012 | | 1900 |
| Citizens Bank | | Manchester | | NH | | — |
| | 640 |
| | 782 |
| | — |
| | 1,422 |
| | (180 | ) | | 9/28/2012 | | 1941 | | Manchester | | NH | | — |
| | 640 |
| | 782 |
| | — |
| | 1,422 |
| | (237 | ) | | 9/28/2012 | | 1941 |
| Citizens Bank | | Manchester | | NH | | — |
| | — |
| | 1,568 |
| | — |
| | 1,568 |
| | (340 | ) | | 12/14/2012 | | 1995 | | Manchester | | NH | | — |
| | — |
| | 1,568 |
| | — |
| | 1,568 |
| | (465 | ) | | 12/14/2012 | | 1995 |
| Citizens Bank | | Ossipee | | NH | | 269 |
| | 176 |
| | 264 |
| | — |
| | 440 |
| | (67 | ) | | 4/26/2012 | | 1980 | | Pelham | | NH | | — |
| | 113 |
| | 340 |
| | — |
| | 453 |
| | (107 | ) | | 4/26/2012 | | 1983 |
| Citizens Bank | | Pelham | | NH | | 280 |
| | 113 |
| | 340 |
| | — |
| | 453 |
| | (86 | ) | | 4/26/2012 | | 1983 | | Pittsfield | | NH | | — |
| | 160 |
| | 908 |
| | — |
| | 1,068 |
| | (335 | ) | | 8/1/2010 | | 1976 |
| Citizens Bank | | Pittsfield | | NH | | — |
| | 160 |
| | 908 |
| | — |
| | 1,068 |
| | (297 | ) | | 8/1/2010 | | 1976 | | Rollinsford | | NH | | — |
| | 78 |
| | 444 |
| | — |
| | 522 |
| | (164 | ) | | 8/1/2010 | | 1977 |
| Citizens Bank | | Rollinsford | | NH | | — |
| | 78 |
| | 444 |
| | — |
| | 522 |
| | (145 | ) | | 8/1/2010 | | 1977 | | Salem | | NH | | — |
| | 328 |
| | 1,312 |
| | — |
| | 1,640 |
| | (389 | ) | | 12/14/2012 | | 1980 |
| Citizens Bank | | Salem | | NH | | — |
| | 328 |
| | 1,312 |
| | — |
| | 1,640 |
| | (284 | ) | | 12/14/2012 | | 1980 | | Haddon Heights | | NJ | | — |
| | 316 |
| | 948 |
| | — |
| | 1,264 |
| | (266 | ) | | 7/23/2013 | | 1965 |
| Citizens Bank | | Haddon Heights | | NJ | | — |
| | 316 |
| | 948 |
| | — |
| | 1,264 |
| | (176 | ) | | 7/23/2013 | | 1965 | | Albany | | NY | | — |
| | 232 |
| | 1,315 |
| | — |
| | 1,547 |
| | (460 | ) | | 8/1/2010 | | 1960 |
| Citizens Bank | | Marlton | | NJ | | 781 |
| | 444 |
| | 825 |
| | — |
| | 1,269 |
| | (208 | ) | | 4/26/2012 | | 1988 | | Amherst | | NY | | — |
| | 238 |
| | 1,348 |
| | — |
| | 1,586 |
| | (478 | ) | | 8/1/2010 | | 1965 |
| Citizens Bank | | Albany | | NY | | 799 |
| | 232 |
| | 1,315 |
| | — |
| | 1,547 |
| | (404 | ) | | 8/1/2010 | | 1960 | | East Aurora | | NY | | — |
| | 162 |
| | 919 |
| | — |
| | 1,081 |
| | (326 | ) | | 8/1/2010 | | 1996 |
| Citizens Bank | | Amherst | | NY | | 856 |
| | 238 |
| | 1,348 |
| | — |
| | 1,586 |
| | (421 | ) | | 8/1/2010 | | 1965 | | Johnstown | | NY | | — |
| | 163 |
| | 923 |
| | — |
| | 1,086 |
| | (323 | ) | | 8/1/2010 | | 1973 |
| Citizens Bank | | East Aurora | | NY | | 581 |
| | 162 |
| | 919 |
| | — |
| | 1,081 |
| | (287 | ) | | 8/1/2010 | | 1996 | | Port Jervis | | NY | | — |
| | 143 |
| | 811 |
| | — |
| | 954 |
| | (292 | ) | | 8/1/2010 | | 1995 |
| Citizens Bank | | Greene | | NY | | 746 |
| | 216 |
| | 1,227 |
| | — |
| | 1,443 |
| | (377 | ) | | 8/1/2010 | | 1981 | | Rochester | | NY | | — |
| | 166 |
| | 943 |
| | — |
| | 1,109 |
| | (335 | ) | | 8/1/2010 | | 1962 |
| Citizens Bank | | Johnstown | | NY | | 561 |
| | 163 |
| | 923 |
| | — |
| | 1,086 |
| | (284 | ) | | 8/1/2010 | | 1973 | | Vails Gate | | NY | | — |
| | 284 |
| | 1,610 |
| | — |
| | 1,894 |
| | (563 | ) | | 8/1/2010 | | 1995 |
| Citizens Bank | | Port Jervis | | NY | | 515 |
| | 143 |
| | 811 |
| | — |
| | 954 |
| | (258 | ) | | 8/1/2010 | | 1995 | | Whitesboro | | NY | | — |
| | 130 |
| | 739 |
| | — |
| | 869 |
| | (259 | ) | | 8/1/2010 | | 1995 |
| Citizens Bank | | Rochester | | NY | | 599 |
| | 166 |
| | 943 |
| | — |
| | 1,109 |
| | (295 | ) | | 8/1/2010 | | 1962 | | Alliance | | OH | | — |
| | 204 |
| | 1,156 |
| | — |
| | 1,360 |
| | (433 | ) | | 8/1/2010 | | 1972 |
| Citizens Bank | | Schenectady | | NY | | 1,006 |
| | 292 |
| | 1,655 |
| | — |
| | 1,947 |
| | (509 | ) | | 8/1/2010 | | 1974 | | Boardman | | OH | | — |
| | 280 |
| | 1,589 |
| | — |
| | 1,869 |
| | (595 | ) | | 8/1/2010 | | 1984 |
| Citizens Bank | | Vails Gate | | NY | | 979 |
| | 284 |
| | 1,610 |
| | — |
| | 1,894 |
| | (495 | ) | | 8/1/2010 | | 1995 | | Broadview Heights | | OH | | — |
| | 201 |
| | 1,140 |
| | — |
| | 1,341 |
| | (411 | ) | | 8/1/2010 | | 1982 |
| Citizens Bank | | Whitesboro | | NY | | 450 |
| | 130 |
| | 739 |
| | — |
| | 869 |
| | (227 | ) | | 8/1/2010 | | 1995 | | Brunswick | | OH | | — |
| | 186 |
| | 1,057 |
| | — |
| | 1,243 |
| | (396 | ) | | 8/1/2010 | | 2004 |
| Citizens Bank | | Alliance | | OH | | — |
| | 204 |
| | 1,156 |
| | — |
| | 1,360 |
| | (384 | ) | | 8/1/2010 | | 1972 | | Cleveland | | OH | | — |
| | 239 |
| | 1,357 |
| | — |
| | 1,596 |
| | (508 | ) | | 8/1/2010 | | 1973 |
| Citizens Bank | | Bedford | | OH | | 533 |
| | 175 |
| | 699 |
| | — |
| | 874 |
| | (176 | ) | | 4/26/2012 | | 2005 | | Cleveland | | OH | | — |
| | 210 |
| | 1,190 |
| | — |
| | 1,400 |
| | (446 | ) | | 8/1/2010 | | 1950 |
| Citizens Bank | | Boardman | | OH | | — |
| | 280 |
| | 1,589 |
| | — |
| | 1,869 |
| | (528 | ) | | 8/1/2010 | | 1984 | | Cleveland | | OH | | — |
| | 182 |
| | 1,031 |
| | — |
| | 1,213 |
| | (386 | ) | | 8/1/2010 | | 1930 |
| Citizens Bank | | Broadview Heights | | OH | | — |
| | 201 |
| | 1,140 |
| | — |
| | 1,341 |
| | (362 | ) | | 8/1/2010 | | 1982 | | Fairlawn | | OH | | 1,885 |
| | 511 |
| | 2,045 |
| | — |
| | 2,556 |
| | (607 | ) | | 12/14/2012 | | 1979 |
| Citizens Bank | | Brunswick | | OH | | — |
| | 186 |
| | 1,057 |
| | — |
| | 1,243 |
| | (351 | ) | | 8/1/2010 | | 2004 | | Lakewood | | OH | | — |
| | 196 |
| | 1,111 |
| | — |
| | 1,307 |
| | (389 | ) | | 8/1/2010 | | 1985 |
| Citizens Bank | | Cleveland | | OH | | — |
| | 239 |
| | 1,357 |
| | — |
| | 1,596 |
| | (451 | ) | | 8/1/2010 | | 1973 | | Louisville | | OH | | — |
| | 191 |
| | 1,080 |
| | — |
| | 1,271 |
| | (404 | ) | | 8/1/2010 | | 1960 |
| Citizens Bank | | Cleveland | | OH | | — |
| | 210 |
| | 1,190 |
| | — |
| | 1,400 |
| | (395 | ) | | 8/1/2010 | | 1950 | | Massillon | | OH | | — |
| | 287 |
| | 1,624 |
| | — |
| | 1,911 |
| | (608 | ) | | 8/1/2010 | | 1995 |
| Citizens Bank | | Cleveland | | OH | | — |
| | 182 |
| | 1,031 |
| | — |
| | 1,213 |
| | (342 | ) | | 8/1/2010 | | 1930 | | Northfield | | OH | | — |
| | 317 |
| | 1,797 |
| | — |
| | 2,114 |
| | (663 | ) | | 8/1/2010 | | 1969 |
| Citizens Bank | | Fairlawn | | OH | | 1,885 |
| | 511 |
| | 2,045 |
| | — |
| | 2,556 |
| | (443 | ) | | 12/14/2012 | | 1979 | | Parma | | OH | | — |
| | 475 |
| | 581 |
| | — |
| | 1,056 |
| | (172 | ) | | 12/14/2012 | | 1971 |
| Citizens Bank | | Lakewood | | OH | | — |
| | 196 |
| | 1,111 |
| | — |
| | 1,307 |
| | (342 | ) | | 8/1/2010 | | 1985 | | Parma Heights | | OH | | — |
| | 426 |
| | 638 |
| | — |
| | 1,064 |
| | (189 | ) | | 12/14/2012 | | 1957 |
| Citizens Bank | | Louisville | | OH | | — |
| | 191 |
| | 1,080 |
| | — |
| | 1,271 |
| | (358 | ) | | 8/1/2010 | | 1960 | | Rocky River | | OH | | — |
| | 283 |
| | 1,602 |
| | — |
| | 1,885 |
| | (560 | ) | | 8/1/2010 | | 1972 |
| Citizens Bank | | Massillon | | OH | | — |
| | 287 |
| | 1,624 |
| | — |
| | 1,911 |
| | (539 | ) | | 8/1/2010 | | 1995 | | South Russell | | OH | | — |
| | 106 |
| | 957 |
| | — |
| | 1,063 |
| | (284 | ) | | 12/14/2012 | | 1981 |
| | | | | | Initial Costs (1) | | Costs Capitalized Subsequent to Acquisition (2) | | Gross Amount
Carried at
December 31, 2016
(3) (4) | | | | | | Initial Costs (1) | | Costs Capitalized Subsequent to Acquisition (2) | | Gross Amount
Carried at
December 31, 2018
(3) (4) | | | |
| Property | | City | | State | | Encumbrances at
December 31, 2016 | | Land | | Buildings, Fixtures and Improvements | | Accumulated Depreciation
(3) (5) | | Date Acquired | | Date of Construction | | City | | State | | Encumbrances at
December 31, 2018 | | Land | | Buildings, Fixtures and Improvements | | Accumulated Depreciation
(3) (5) | | Date Acquired | | Date of Construction |
| Citizens Bank | | Massillon | | OH | | — |
| | 212 |
| | 1,202 |
| | — |
| | 1,414 |
| | (399 | ) | | 8/1/2010 | | 1958 | | Wadsworth | | OH | | — |
| | 158 |
| | 893 |
| | — |
| | 1,051 |
| | (334 | ) | | 8/1/2010 | | 1960 |
| Citizens Bank | | Mentor | | OH | | — |
| | 178 |
| | 1,011 |
| | — |
| | 1,189 |
| | (330 | ) | | 8/1/2010 | | 1976 | | Willoughby | | OH | | — |
| | 395 |
| | 2,239 |
| | (1,565 | ) | | 1,069 |
| | (6 | ) | | 8/1/2010 | | 1920 |
| Citizens Bank | | Northfield | | OH | | — |
| | 317 |
| | 1,797 |
| | — |
| | 2,114 |
| | (587 | ) | | 8/1/2010 | | 1969 | | Aliquippa | | PA | | — |
| | 138 |
| | 782 |
| | — |
| | 920 |
| | (232 | ) | | 12/14/2012 | | 1953 |
| Citizens Bank | | Parma | | OH | | 608 |
| | 248 |
| | 744 |
| | — |
| | 992 |
| | (188 | ) | | 4/26/2012 | | 1972 | | Allison Park | | PA | | — |
| | 314 |
| | 733 |
| | — |
| | 1,047 |
| | (222 | ) | | 9/28/2012 | | 1972 |
| Citizens Bank | | Parma | | OH | | — |
| | 475 |
| | 581 |
| | — |
| | 1,056 |
| | (126 | ) | | 12/14/2012 | | 1971 | | Altoona | | PA | | — |
| | 153 |
| | 459 |
| | — |
| | 612 |
| | (136 | ) | | 12/14/2012 | | 1971 |
| Citizens Bank | | Parma Heights | | OH | | — |
| | 426 |
| | 638 |
| | — |
| | 1,064 |
| | (138 | ) | | 12/14/2012 | | 1957 | | Ambridge | | PA | | — |
| | 215 |
| | 1,217 |
| | (1,282 | ) | | 150 |
| | (7 | ) | | 8/1/2010 | | 1925 |
| Citizens Bank | | Rocky River | | OH | | — |
| | 283 |
| | 1,602 |
| | — |
| | 1,885 |
| | (492 | ) | | 8/1/2010 | | 1972 | | Beaver Falls | | PA | | — |
| | 138 |
| | 553 |
| | — |
| | 691 |
| | (168 | ) | | 9/28/2012 | | 1995 |
| Citizens Bank | | South Russell | | OH | | — |
| | 106 |
| | 957 |
| | — |
| | 1,063 |
| | (207 | ) | | 12/14/2012 | | 1981 | | Butler | | PA | | — |
| | 286 |
| | 1,144 |
| | — |
| | 1,430 |
| | (339 | ) | | 12/14/2012 | | 1966 |
| Citizens Bank | | Wadsworth | | OH | | — |
| | 158 |
| | 893 |
| | — |
| | 1,051 |
| | (296 | ) | | 8/1/2010 | | 1960 | | Camp Hill | | PA | | — |
| | 430 |
| | 645 |
| | — |
| | 1,075 |
| | (191 | ) | | 12/14/2012 | | 1971 |
| Citizens Bank | | Willoughby | | OH | | — |
| | 395 |
| | 2,239 |
| | — |
| | 2,634 |
| | (732 | ) | | 8/1/2010 | | 1920 | | Carnegie | | PA | | — |
| | 73 |
| | 1,396 |
| | — |
| | 1,469 |
| | (414 | ) | | 12/14/2012 | | 1920 |
| Citizens Bank | | Aliquippa | | PA | | — |
| | 138 |
| | 782 |
| | — |
| | 920 |
| | (169 | ) | | 12/14/2012 | | 1953 | | Dallas | | PA | | — |
| | 213 |
| | 1,205 |
| | — |
| | 1,418 |
| | (366 | ) | | 9/28/2012 | | 1949 |
| Citizens Bank | | Allison Park | | PA | | — |
| | 314 |
| | 733 |
| | — |
| | 1,047 |
| | (169 | ) | | 9/28/2012 | | 1972 | | Dillsburg | | PA | | — |
| | 232 |
| | 926 |
| | — |
| | 1,158 |
| | (275 | ) | | 12/14/2012 | | 1935 |
| Citizens Bank | | Altoona | | PA | | — |
| | 153 |
| | 459 |
| | — |
| | 612 |
| | (99 | ) | | 12/14/2012 | | 1971 | | Erie | | PA | | — |
| | 168 |
| | 671 |
| | — |
| | 839 |
| | (199 | ) | | 12/14/2012 | | 1954 |
| Citizens Bank | | Ambridge | | PA | | 740 |
| | 215 |
| | 1,217 |
| | (1,282 | ) | | 150 |
| | — |
| | 8/1/2010 | | 1925 | | Glenside | | PA | | 1,257 |
| | 343 |
| | 1,370 |
| | — |
| | 1,713 |
| | (391 | ) | | 5/22/2013 | | 1958 |
| Citizens Bank | | Ashley | | PA | | — |
| | 225 |
| | 675 |
| | — |
| | 900 |
| | (146 | ) | | 12/14/2012 | | 1928 | | Greensburg | | PA | | — |
| | 45 |
| | 861 |
| | — |
| | 906 |
| | (255 | ) | | 12/14/2012 | | 1957 |
| Citizens Bank | | Beaver Falls | | PA | | — |
| | 138 |
| | 553 |
| | — |
| | 691 |
| | (127 | ) | | 9/28/2012 | | 1995 | | Havertown | | PA | | — |
| | 219 |
| | 875 |
| | — |
| | 1,094 |
| | (266 | ) | | 9/28/2012 | | 2003 |
| Citizens Bank | | Butler | | PA | | — |
| | 286 |
| | 1,144 |
| | — |
| | 1,430 |
| | (248 | ) | | 12/14/2012 | | 1966 | | Homestead | | PA | | — |
| | 202 |
| | 807 |
| | — |
| | 1,009 |
| | (245 | ) | | 9/28/2012 | | 1960 |
| Citizens Bank | | Camp Hill | | PA | | — |
| | 430 |
| | 645 |
| | — |
| | 1,075 |
| | (140 | ) | | 12/14/2012 | | 1971 | | Kingston | | PA | | — |
| | 404 |
| | 943 |
| | — |
| | 1,347 |
| | (280 | ) | | 12/14/2012 | | 1977 |
| Citizens Bank | | Carlisle | | PA | | 468 |
| | 234 |
| | 546 |
| | — |
| | 780 |
| | (138 | ) | | 4/26/2012 | | 1960 | | Kittanning | | PA | | — |
| | 56 |
| | 1,060 |
| | — |
| | 1,116 |
| | (314 | ) | | 12/14/2012 | | 1889 |
| Citizens Bank | | Carnegie | | PA | | — |
| | 73 |
| | 1,396 |
| | — |
| | 1,469 |
| | (302 | ) | | 12/14/2012 | | 1920 | | Lancaster | | PA | | — |
| | 383 |
| | 468 |
| | — |
| | 851 |
| | (142 | ) | | 9/28/2012 | | 1967 |
| Citizens Bank | | Dallas | | PA | | — |
| | 213 |
| | 1,205 |
| | — |
| | 1,418 |
| | (277 | ) | | 9/28/2012 | | 1949 | | Latrobe | | PA | | — |
| | 148 |
| | 591 |
| | — |
| | 739 |
| | (175 | ) | | 12/14/2012 | | 1969 |
| Citizens Bank | | Dillsburg | | PA | | — |
| | 232 |
| | 926 |
| | — |
| | 1,158 |
| | (201 | ) | | 12/14/2012 | | 1935 | | Lower Burrell | | PA | | — |
| | 180 |
| | 722 |
| | — |
| | 902 |
| | (214 | ) | | 12/14/2012 | | 1980 |
| Citizens Bank | | Drexel Hill | | PA | | — |
| | 266 |
| | 1,064 |
| | — |
| | 1,330 |
| | (230 | ) | | 12/14/2012 | | 1950 | | Mechanicsburg | | PA | | 1,620 |
| | 288 |
| | 2,590 |
| | — |
| | 2,878 |
| | (786 | ) | | 9/28/2012 | | 1900 |
| Citizens Bank | | Erie | | PA | | — |
| | 168 |
| | 671 |
| | — |
| | 839 |
| | (145 | ) | | 12/14/2012 | | 1954 | | Mercer | | PA | | — |
| | 105 |
| | 314 |
| | — |
| | 419 |
| | (93 | ) | | 12/14/2012 | | 1964 |
| Citizens Bank | | Ford City | | PA | | — |
| | 89 |
| | 802 |
| | — |
| | 891 |
| | (174 | ) | | 12/14/2012 | | 1975 | | Milford | | PA | | — |
| | 513 |
| | 769 |
| | — |
| | 1,282 |
| | (228 | ) | | 12/14/2012 | | 1981 |
| Citizens Bank | | Glenside | | PA | | 1,257 |
| | 343 |
| | 1,370 |
| | — |
| | 1,713 |
| | (266 | ) | | 5/22/2013 | | 1958 | | Mount Lebanon | | PA | | 1,577 |
| | 215 |
| | 1,939 |
| | — |
| | 2,154 |
| | (589 | ) | | 9/28/2012 | | 1960 |
| Citizens Bank | | Greensburg | | PA | | — |
| | 45 |
| | 861 |
| | — |
| | 906 |
| | (187 | ) | | 12/14/2012 | | 1957 | | Mountain Top | | PA | | — |
| | 111 |
| | 631 |
| | — |
| | 742 |
| | (187 | ) | | 12/14/2012 | | 1980 |
| Citizens Bank | | Grove City | | PA | | 323 |
| | 292 |
| | 239 |
| | — |
| | 531 |
| | (60 | ) | | 4/26/2012 | | 1977 | | Narberth | | PA | | — |
| | 420 |
| | 2,381 |
| | — |
| | 2,801 |
| | (833 | ) | | 8/1/2010 | | 1935 |
| Citizens Bank | | Grove City | | PA | | 506 |
| | 41 |
| | 782 |
| | — |
| | 823 |
| | (197 | ) | | 4/26/2012 | | 1920 | | Oakmont | | PA | | — |
| | 199 |
| | 1,127 |
| | — |
| | 1,326 |
| | (334 | ) | | 12/14/2012 | | 1967 |
| Citizens Bank | | Harrisburg | | PA | | 560 |
| | 512 |
| | 419 |
| | — |
| | 931 |
| | (106 | ) | | 4/26/2012 | | 1967 | | Oil City | | PA | | — |
| | 110 |
| | 623 |
| | — |
| | 733 |
| | (185 | ) | | 12/14/2012 | | 1965 |
| Citizens Bank | | Havertown | | PA | | — |
| | 219 |
| | 875 |
| | — |
| | 1,094 |
| | (201 | ) | | 9/28/2012 | | 2003 | | Philadelphia | | PA | | — |
| | 266 |
| | 1,065 |
| | — |
| | 1,331 |
| | (316 | ) | | 12/14/2012 | | 1971 |
| Citizens Bank | | Highspire | | PA | | — |
| | 216 |
| | 649 |
| | — |
| | 865 |
| | (141 | ) | | 12/14/2012 | | 1974 | | Pittsburgh | | PA | | — |
| | 215 |
| | 1,219 |
| | — |
| | 1,434 |
| | (370 | ) | | 9/28/2012 | | 1970 |
| | | | | | Initial Costs (1) | | Costs Capitalized Subsequent to Acquisition (2) | | Gross Amount
Carried at
December 31, 2016
(3) (4) | | | | | | Initial Costs (1) | | Costs Capitalized Subsequent to Acquisition (2) | | Gross Amount
Carried at
December 31, 2018
(3) (4) | | | |
| Property | | City | | State | | Encumbrances at
December 31, 2016 | | Land | | Buildings, Fixtures and Improvements | | Accumulated Depreciation
(3) (5) | | Date Acquired | | Date of Construction | | City | | State | | Encumbrances at
December 31, 2018 | | Land | | Buildings, Fixtures and Improvements | | Accumulated Depreciation
(3) (5) | | Date Acquired | | Date of Construction |
| Citizens Bank | | Homestead | | PA | | — |
| | 202 |
| | 807 |
| | — |
| | 1,009 |
| | (186 | ) | | 9/28/2012 | | 1960 | | Pittsburgh | | PA | | — |
| | 256 |
| | 767 |
| | — |
| | 1,023 |
| | (233 | ) | | 9/28/2012 | | 1970 |
| Citizens Bank | | Kingston | | PA | | — |
| | 404 |
| | 943 |
| | — |
| | 1,347 |
| | (204 | ) | | 12/14/2012 | | 1977 | | Pittsburgh | | PA | | — |
| | 389 |
| | 1,168 |
| | — |
| | 1,557 |
| | (346 | ) | | 12/14/2012 | | 1940 |
| Citizens Bank | | Kittanning | | PA | | — |
| | 56 |
| | 1,060 |
| | — |
| | 1,116 |
| | (230 | ) | | 12/14/2012 | | 1889 | | Pittsburgh | | PA | | — |
| | 146 |
| | 2,770 |
| | (1,725 | ) | | 1,191 |
| | (9 | ) | | 12/14/2012 | | 1900 |
| Citizens Bank | | Kutztown | | PA | | 490 |
| | 81 |
| | 725 |
| | — |
| | 806 |
| | (180 | ) | | 5/11/2012 | | 1974 | | Pittsburgh | | PA | | 2,262 |
| | 470 |
| | 2,661 |
| | — |
| | 3,131 |
| | (789 | ) | | 12/14/2012 | | 1979 |
| Citizens Bank | | Lancaster | | PA | | 555 |
| | 368 |
| | 552 |
| | — |
| | 920 |
| | (139 | ) | | 4/26/2012 | | 1965 | | Pittsburgh | | PA | | 1,244 |
| | 516 |
| | 1,204 |
| | — |
| | 1,720 |
| | (357 | ) | | 12/14/2012 | | 1970 |
| Citizens Bank | | Lancaster | | PA | | — |
| | 383 |
| | 468 |
| | — |
| | 851 |
| | (108 | ) | | 9/28/2012 | | 1967 | | Pittsburgh | | PA | | — |
| | 206 |
| | 1,852 |
| | — |
| | 2,058 |
| | (549 | ) | | 12/14/2012 | | 1923 |
| Citizens Bank | | Latrobe | | PA | | — |
| | 148 |
| | 591 |
| | — |
| | 739 |
| | (128 | ) | | 12/14/2012 | | 1969 | | Pittsburgh | | PA | | 918 |
| | 196 |
| | 1,110 |
| | — |
| | 1,306 |
| | (329 | ) | | 12/14/2012 | | 1980 |
| Citizens Bank | | Lititz | | PA | | 458 |
| | 37 |
| | 708 |
| | — |
| | 745 |
| | (179 | ) | | 4/26/2012 | | 1923 | | Pittsburgh | | PA | | — |
| | 268 |
| | 2,413 |
| | — |
| | 2,681 |
| | (716 | ) | | 12/14/2012 | | 1970 |
| Citizens Bank | | Lower Burrell | | PA | | — |
| | 180 |
| | 722 |
| | — |
| | 902 |
| | (156 | ) | | 12/14/2012 | | 1980 | | Reading | | PA | | — |
| | 269 |
| | 1,524 |
| | (1,542 | ) | | 251 |
| | — |
| | 4/12/2013 | | 1904 |
| Citizens Bank | | Matamoras | | PA | | — |
| | 509 |
| | 946 |
| | — |
| | 1,455 |
| | (205 | ) | | 12/14/2012 | | 1920 | | Reading | | PA | | — |
| | 267 |
| | 802 |
| | (586 | ) | | 483 |
| | — |
| | 12/14/2012 | | 1970 |
| Citizens Bank | | Mechanicsburg | | PA | | 1,620 |
| | 288 |
| | 2,590 |
| | — |
| | 2,878 |
| | (596 | ) | | 9/28/2012 | | 1900 | | Temple | | PA | | — |
| | 268 |
| | 626 |
| | — |
| | 894 |
| | (190 | ) | | 9/28/2012 | | 1936 |
| Citizens Bank | | Mercer | | PA | | — |
| | 105 |
| | 314 |
| | — |
| | 419 |
| | (68 | ) | | 12/14/2012 | | 1964 | | Turtle Creek | | PA | | — |
| | 308 |
| | 923 |
| | — |
| | 1,231 |
| | (280 | ) | | 9/28/2012 | | 1970 |
| Citizens Bank | | Milford | | PA | | — |
| | 513 |
| | 769 |
| | — |
| | 1,282 |
| | (167 | ) | | 12/14/2012 | | 1981 | | Tyrone | | PA | | — |
| | 146 |
| | 583 |
| | — |
| | 729 |
| | (173 | ) | | 12/14/2012 | | 1967 |
| Citizens Bank | | Monesson | | PA | | 683 |
| | 198 |
| | 1,123 |
| | (1,222 | ) | | 99 |
| | — |
| | 8/1/2010 | | 1930 | | Upper Darby | | PA | | — |
| | 411 |
| | 617 |
| | — |
| | 1,028 |
| | (183 | ) | | 12/14/2012 | | 1966 |
| Citizens Bank | | Mount Lebanon | | PA | | 1,577 |
| | 215 |
| | 1,939 |
| | — |
| | 2,154 |
| | (446 | ) | | 9/28/2012 | | 1960 | | Warrendale | | PA | | — |
| | 611 |
| | 916 |
| | — |
| | 1,527 |
| | (272 | ) | | 12/14/2012 | | 1981 |
| Citizens Bank | | Mountain Top | | PA | | — |
| | 111 |
| | 631 |
| | — |
| | 742 |
| | (137 | ) | | 12/14/2012 | | 1980 | | West Hazleton | | PA | | — |
| | 279 |
| | 2,509 |
| | — |
| | 2,788 |
| | (762 | ) | | 9/28/2012 | | 1900 |
| Citizens Bank | | Munhall | | PA | | 232 |
| | 191 |
| | 191 |
| | — |
| | 382 |
| | (48 | ) | | 4/26/2012 | | 1973 | | Wexford | | PA | | — |
| | 180 |
| | 719 |
| | — |
| | 899 |
| | (213 | ) | | 12/14/2012 | | 1975 |
| Citizens Bank | | Narberth | | PA | | 1,448 |
| | 420 |
| | 2,381 |
| | — |
| | 2,801 |
| | (732 | ) | | 8/1/2010 | | 1935 | | Coventry | | RI | | — |
| | 559 |
| | 559 |
| | — |
| | 1,118 |
| | (170 | ) | | 9/28/2012 | | 1968 |
| Citizens Bank | | New Stanton | | PA | | 581 |
| | 330 |
| | 612 |
| | — |
| | 942 |
| | (154 | ) | | 4/26/2012 | | 1975 | | Cranston | | RI | | — |
| | 411 |
| | 1,234 |
| | — |
| | 1,645 |
| | (366 | ) | | 12/14/2012 | | 1967 |
| Citizens Bank | | Oakmont | | PA | | — |
| | 199 |
| | 1,127 |
| | — |
| | 1,326 |
| | (244 | ) | | 12/14/2012 | | 1967 | | East Greenwich | | RI | | — |
| | 227 |
| | 680 |
| | — |
| | 907 |
| | (202 | ) | | 12/14/2012 | | 1959 |
| Citizens Bank | | Oil City | | PA | | — |
| | 110 |
| | 623 |
| | — |
| | 733 |
| | (135 | ) | | 12/14/2012 | | 1965 | | Johnston | | RI | | — |
| | 343 |
| | 1,030 |
| | — |
| | 1,373 |
| | (313 | ) | | 9/28/2012 | | 1972 |
| Citizens Bank | | Philadelphia | | PA | | 565 |
| | 184 |
| | 735 |
| | — |
| | 919 |
| | (186 | ) | | 4/26/2012 | | 1904 | | N. Providence | | RI | | 1,445 |
| | 200 |
| | 1,800 |
| | — |
| | 2,000 |
| | (534 | ) | | 12/31/2012 | | 1971 |
| Citizens Bank | | Philadelphia | | PA | | — |
| | 127 |
| | 722 |
| | (543 | ) | | 306 |
| | (8 | ) | | 12/14/2012 | | 1920 | | N. Providence | | RI | | — |
| | 223 |
| | 892 |
| | — |
| | 1,115 |
| | (265 | ) | | 12/14/2012 | | 1971 |
| Citizens Bank | | Philadelphia | | PA | | — |
| | 266 |
| | 1,065 |
| | — |
| | 1,331 |
| | (231 | ) | | 12/14/2012 | | 1971 | | Providence | | RI | | — |
| | 300 |
| | 899 |
| | — |
| | 1,199 |
| | (267 | ) | | 12/14/2012 | | 1960 |
| Citizens Bank | | Pitcairn | | PA | | — |
| | 46 |
| | 867 |
| | (567 | ) | | 346 |
| | (10 | ) | | 12/14/2012 | | 1985 | | Rumford | | RI | | — |
| | 352 |
| | 654 |
| | — |
| | 1,006 |
| | (194 | ) | | 12/14/2012 | | 1977 |
| Citizens Bank | | Pittsburgh | | PA | | — |
| | 215 |
| | 1,219 |
| | — |
| | 1,434 |
| | (280 | ) | | 9/28/2012 | | 1970 | | Wakefield | | RI | | — |
| | 517 |
| | 959 |
| | — |
| | 1,476 |
| | (291 | ) | | 9/28/2012 | | 1976 |
| Citizens Bank | | Pittsburgh | | PA | | — |
| | 256 |
| | 767 |
| | — |
| | 1,023 |
| | (176 | ) | | 9/28/2012 | | 1970 | | Warren | | RI | | — |
| | 328 |
| | 609 |
| | — |
| | 937 |
| | (185 | ) | | 9/28/2012 | | 1980 |
| Citizens Bank | | Pittsburgh | | PA | | — |
| | 185 |
| | 1,051 |
| | — |
| | 1,236 |
| | (228 | ) | | 12/14/2012 | | 1960 | | Warwick | | RI | | — |
| | 1,870 |
| | 8,828 |
| | 697 |
| | 11,395 |
| | (2,501 | ) | | 9/24/2013 | | 1995 |
| Citizens Bank | | Pittsburgh | | PA | | — |
| | 389 |
| | 1,168 |
| | — |
| | 1,557 |
| | (253 | ) | | 12/14/2012 | | 1940 | | Middlebury | | VT | | — |
| | 363 |
| | 544 |
| | — |
| | 907 |
| | (161 | ) | | 12/14/2012 | | 1969 |
| Citizens Bank | | Pittsburgh | | PA | | — |
| | 146 |
| | 2,770 |
| | — |
| | 2,916 |
| | (600 | ) | | 12/14/2012 | | 1900 | | St. Albans | | VT | | — |
| | 141 |
| | 798 |
| | — |
| | 939 |
| | (287 | ) | | 8/1/2010 | | 1989 |
| Citizens Bank | | Pittsburgh | | PA | | 2,262 |
| | 470 |
| | 2,661 |
| | — |
| | 3,131 |
| | (576 | ) | | 12/14/2012 | | 1979 | |
| Citizens Bank | | Pittsburgh | | PA | | 1,244 |
| | 516 |
| | 1,204 |
| | — |
| | 1,720 |
| | (261 | ) | | 12/14/2012 | | 1970 | |
| Coborn's Liquor Store | | | Stanley | | ND | | — |
| | 1,163 |
| | 5,037 |
| | — |
| | 6,200 |
| | (1,254 | ) | | 2/21/2014 | | 2014 |
| Coborn's Liquor Store | | | Tioga | | ND | | — |
| | 1,065 |
| | 4,581 |
| | — |
| | 5,646 |
| | (920 | ) | | 6/26/2014 | | 2014 |
|
| | | | | | | | | | | | | | | | | | | | | | | | | | |
| | | | | | | | Initial Costs (1) | | Costs Capitalized Subsequent to Acquisition (2) | | Gross Amount
Carried at
December 31, 2016
(3) (4) | | | | | | |
| Property | | City | | State | | Encumbrances at
December 31, 2016 | | Land | | Buildings, Fixtures and Improvements | | | Accumulated Depreciation
(3) (5) | | Date Acquired | | Date of Construction |
| Citizens Bank | | Pittsburgh | | PA | | — |
| | 206 |
| | 1,852 |
| | — |
| | 2,058 |
| | (401 | ) | | 12/14/2012 | | 1923 |
| Citizens Bank | | Pittsburgh | | PA | | 918 |
| | 196 |
| | 1,110 |
| | — |
| | 1,306 |
| | (240 | ) | | 12/14/2012 | | 1980 |
| Citizens Bank | | Pittsburgh | | PA | | — |
| | 255 |
| | 1,019 |
| | — |
| | 1,274 |
| | (221 | ) | | 12/14/2012 | | 1970 |
| Citizens Bank | | Pittsburgh | | PA | | — |
| | 268 |
| | 2,413 |
| | — |
| | 2,681 |
| | (523 | ) | | 12/14/2012 | | 1970 |
| Citizens Bank | | Reading | | PA | | — |
| | 269 |
| | 1,524 |
| | — |
| | 1,793 |
| | (303 | ) | | 4/12/2013 | | 1904 |
| Citizens Bank | | Reading | | PA | | — |
| | 267 |
| | 802 |
| | — |
| | 1,069 |
| | (174 | ) | | 12/14/2012 | | 1970 |
| Citizens Bank | | Shippensburg | | PA | | 345 |
| | 143 |
| | 429 |
| | — |
| | 572 |
| | (108 | ) | | 4/26/2012 | | 1985 |
| Citizens Bank | | Slovan | | PA | | 205 |
| | 217 |
| | 117 |
| | — |
| | 334 |
| | (29 | ) | | 4/26/2012 | | 1975 |
| Citizens Bank | | State College | | PA | | 452 |
| | 256 |
| | 475 |
| | — |
| | 731 |
| | (120 | ) | | 4/26/2012 | | 1966 |
| Citizens Bank | | Temple | | PA | | — |
| | 268 |
| | 626 |
| | — |
| | 894 |
| | (144 | ) | | 9/28/2012 | | 1936 |
| Citizens Bank | | Turtle Creek | | PA | | — |
| | 308 |
| | 923 |
| | — |
| | 1,231 |
| | (212 | ) | | 9/28/2012 | | 1970 |
| Citizens Bank | | Tyrone | | PA | | — |
| | 146 |
| | 583 |
| | — |
| | 729 |
| | (126 | ) | | 12/14/2012 | | 1967 |
| Citizens Bank | | Upper Darby | | PA | | — |
| | 411 |
| | 617 |
| | — |
| | 1,028 |
| | (134 | ) | | 12/14/2012 | | 1966 |
| Citizens Bank | | Verona | | PA | | 549 |
| | 264 |
| | 616 |
| | — |
| | 880 |
| | (155 | ) | | 4/26/2012 | | 1972 |
| Citizens Bank | | Warrendale | | PA | | — |
| | 611 |
| | 916 |
| | — |
| | 1,527 |
| | (198 | ) | | 12/14/2012 | | 1981 |
| Citizens Bank | | West Grove | | PA | | 544 |
| | 181 |
| | 725 |
| | — |
| | 906 |
| | (183 | ) | | 4/26/2012 | | 1880 |
| Citizens Bank | | West Hazleton | | PA | | — |
| | 279 |
| | 2,509 |
| | — |
| | 2,788 |
| | (577 | ) | | 9/28/2012 | | 1900 |
| Citizens Bank | | Wexford | | PA | | — |
| | 180 |
| | 719 |
| | — |
| | 899 |
| | (156 | ) | | 12/14/2012 | | 1975 |
| Citizens Bank | | York | | PA | | 581 |
| | 337 |
| | 626 |
| | — |
| | 963 |
| | (158 | ) | | 4/26/2012 | | 1955 |
| Citizens Bank | | Coventry | | RI | | — |
| | 559 |
| | 559 |
| | — |
| | 1,118 |
| | (129 | ) | | 9/28/2012 | | 1968 |
| Citizens Bank | | Cranston | | RI | | — |
| | 411 |
| | 1,234 |
| | — |
| | 1,645 |
| | (267 | ) | | 12/14/2012 | | 1967 |
| Citizens Bank | | East Greenwich | | RI | | — |
| | 227 |
| | 680 |
| | — |
| | 907 |
| | (147 | ) | | 12/14/2012 | | 1959 |
| Citizens Bank | | Johnston | | RI | | — |
| | 343 |
| | 1,030 |
| | — |
| | 1,373 |
| | (237 | ) | | 9/28/2012 | | 1972 |
| Citizens Bank | | N. Providence | | RI | | 1,445 |
| | 200 |
| | 1,800 |
| | — |
| | 2,000 |
| | (390 | ) | | 12/31/2012 | | 1971 |
| Citizens Bank | | N. Providence | | RI | | — |
| | 223 |
| | 892 |
| | — |
| | 1,115 |
| | (193 | ) | | 12/14/2012 | | 1971 |
| Citizens Bank | | Providence | | RI | | — |
| | 300 |
| | 899 |
| | — |
| | 1,199 |
| | (195 | ) | | 12/14/2012 | | 1960 |
| Citizens Bank | | Rumford | | RI | | — |
| | 352 |
| | 654 |
| | — |
| | 1,006 |
| | (142 | ) | | 12/14/2012 | | 1977 |
| Citizens Bank | | Wakefield | | RI | | — |
| | 517 |
| | 959 |
| | — |
| | 1,476 |
| | (221 | ) | | 9/28/2012 | | 1976 |
| Citizens Bank | | Warren | | RI | | — |
| | 328 |
| | 609 |
| | — |
| | 937 |
| | (140 | ) | | 9/28/2012 | | 1980 |
| Citizens Bank | | Warwick | | RI | | — |
| | 1,870 |
| | 8,828 |
| | 697 |
| | 11,395 |
| | (1,547 | ) | | 9/24/2013 | | 1995 |
| Citizens Bank | | Middlebury | | VT | | — |
| | 363 |
| | 544 |
| | — |
| | 907 |
| | (118 | ) | | 12/14/2012 | | 1969 |
| Citizens Bank | | Poultney | | VT | | — |
| | 149 |
| | 847 |
| | — |
| | 996 |
| | (269 | ) | | 8/1/2010 | | 1860 |
|
| | | | | | | | | | | | | | | | | | | | | | | | | | |
| | | | | | | | Initial Costs (1) | | Costs Capitalized Subsequent to Acquisition (2) | | Gross Amount
Carried at
December 31, 2018
(3) (4) | | | | | | |
| Property | | City | | State | | Encumbrances at
December 31, 2018 | | Land | | Buildings, Fixtures and Improvements | | | Accumulated Depreciation
(3) (5) | | Date Acquired | | Date of Construction |
| Codale | | Logan | | UT | | — |
| | 420 |
| | 3,007 |
| | — |
| | 3,427 |
| | (76 | ) | | 3/30/2018 | | 2010 |
| Codale | | Orem | | UT | | — |
| | 637 |
| | 5,171 |
| | — |
| | 5,808 |
| | (184 | ) | | 3/30/2018 | | 1995 |
| Codale | | West Valley | | UT | | — |
| | 2,684 |
| | 25,881 |
| | — |
| | 28,565 |
| | (575 | ) | | 3/30/2018 | | 2008 |
| Comcast | | Englewood | | CO | | — |
| | 1,490 |
| | 5,060 |
| | — |
| | 6,550 |
| | (1,368 | ) | | 11/5/2013 | | 1999 |
| Community Bank | | Whitehall | | NY | | — |
| | 106 |
| | 600 |
| | — |
| | 706 |
| | (210 | ) | | 8/1/2011 | | 1995 |
| CompUSA | | Arlington | | TX | | 1,770 |
| | 2,437 |
| | 1,467 |
| | 127 |
| | 4,031 |
| | (495 | ) | | 2/7/2014 | | 1992 |
| ConAgra Foods | | Milton | | PA | | — |
| | 5,656 |
| | 27,242 |
| | — |
| | 32,898 |
| | (6,218 | ) | | 2/7/2014 | | 1991 |
| Conn's | | Hurst | | TX | | — |
| | 497 |
| | 1,990 |
| | 117 |
| | 2,604 |
| | (548 | ) | | 5/19/2014 | | 1999 |
| Cooper Tire & Rubber | | Franklin | | IN | | 14,883 |
| | 4,438 |
| | 33,994 |
| | — |
| | 38,432 |
| | (10,526 | ) | | 11/5/2013 | | 2009 |
| Cork & Pig | | San Angelo | | TX | | — |
| | 769 |
| | 2,306 |
| | 43 |
| | 3,118 |
| | (721 | ) | | 7/31/2013 | | 2005 |
| Cost Plus | | La Quinta | | CA | | — |
| | 1,211 |
| | 4,786 |
| | — |
| | 5,997 |
| | (1,254 | ) | | 2/7/2014 | | 2007 |
| County of Yolo, CA | | Woodland | | CA | | — |
| | 2,640 |
| | 13,681 |
| | — |
| | 16,321 |
| | (3,299 | ) | | 11/5/2013 | | 2001 |
| Cracker Barrel | | Braselton | | GA | | 2,935 |
| | 1,294 |
| | 2,403 |
| | — |
| | 3,697 |
| | (928 | ) | | 11/13/2012 | | 2005 |
| Cracker Barrel | | Bremen | | GA | | 2,677 |
| | 1,012 |
| | 2,361 |
| | — |
| | 3,373 |
| | (912 | ) | | 11/13/2012 | | 2006 |
| Cracker Barrel | | Columbus | | GA | | — |
| | 912 |
| | 3,153 |
| | — |
| | 4,065 |
| | (896 | ) | | 2/7/2014 | | 2003 |
| Cracker Barrel | | Greensboro | | NC | | — |
| | 1,632 |
| | 2,495 |
| | — |
| | 4,127 |
| | (735 | ) | | 2/7/2014 | | 2005 |
| Cracker Barrel | | Mebane | | NC | | 2,514 |
| | 1,106 |
| | 2,054 |
| | — |
| | 3,160 |
| | (793 | ) | | 11/13/2012 | | 2004 |
| Cracker Barrel | | Rocky Mount | | NC | | — |
| | 1,274 |
| | 2,334 |
| | — |
| | 3,608 |
| | (707 | ) | | 2/7/2014 | | 2006 |
| Cracker Barrel | | Fort Mill | | SC | | — |
| | 1,301 |
| | 2,721 |
| | — |
| | 4,022 |
| | (810 | ) | | 2/7/2014 | | 2006 |
| Cracker Barrel | | Piedmont | | SC | | — |
| | 1,630 |
| | 2,927 |
| | — |
| | 4,557 |
| | (869 | ) | | 2/7/2014 | | 2005 |
| Cracker Barrel | | Abilene | | TX | | — |
| | 1,374 |
| | 2,933 |
| | — |
| | 4,307 |
| | (875 | ) | | 2/7/2014 | | 2005 |
| Cracker Barrel | | San Antonio | | TX | | — |
| | 1,725 |
| | 3,005 |
| | — |
| | 4,730 |
| | (840 | ) | | 2/7/2014 | | 2005 |
| Cracker Barrel | | Sherman | | TX | | — |
| | 557 |
| | 3,744 |
| | — |
| | 4,301 |
| | (1,065 | ) | | 2/7/2014 | | 2007 |
| Cracker Barrel | | Bristol | | VA | | — |
| | 1,241 |
| | 1,703 |
| | — |
| | 2,944 |
| | (615 | ) | | 2/7/2014 | | 2006 |
| Cracker Barrel | | Emporia | | VA | | 2,435 |
| | 972 |
| | 2,267 |
| | — |
| | 3,239 |
| | (876 | ) | | 11/13/2012 | | 2004 |
| Cracker Barrel | | Waynesboro | | VA | | — |
| | 1,536 |
| | 1,489 |
| | — |
| | 3,025 |
| | (653 | ) | | 2/7/2014 | | 2004 |
| Cracker Barrel | | Woodstock | | VA | | 2,262 |
| | 928 |
| | 2,164 |
| | — |
| | 3,092 |
| | (836 | ) | | 11/13/2012 | | 2005 |
| Crest Production Services | | Pleasanton | | TX | | — |
| | 519 |
| | 7,949 |
| | — |
| | 8,468 |
| | (2,892 | ) | | 6/12/2014 | | 2013 |
| Crozer-Keystone Health | | Ridley Park | | PA | | 176 |
| | — |
| | 6,114 |
| | — |
| | 6,114 |
| | (1,693 | ) | | 11/5/2013 | | 1976 |
| CVS | | Hoover | | AL | | — |
| | 1,239 |
| | 2,890 |
| | 84 |
| | 4,213 |
| | (922 | ) | | 5/31/2013 | | 2003 |
| CVS | | Meridianville | | AL | | 1,900 |
| | 1,045 |
| | 3,057 |
| | — |
| | 4,102 |
| | (908 | ) | | 2/7/2014 | | 2008 |
| CVS | | Phoenix | | AZ | | 5,025 |
| | 1,511 |
| | 4,533 |
| | 4 |
| | 6,048 |
| | (1,390 | ) | | 10/1/2013 | | 2012 |
|
| | | | | | | | | | | | | | | | | | | | | | | | | | |
| | | | | | | | Initial Costs (1) | | Costs Capitalized Subsequent to Acquisition (2) | | Gross Amount
Carried at
December 31, 2016
(3) (4) | | | | | | |
| Property | | City | | State | | Encumbrances at
December 31, 2016 | | Land | | Buildings, Fixtures and Improvements | | | Accumulated Depreciation
(3) (5) | | Date Acquired | | Date of Construction |
| Citizens Bank | | St. Albans | | VT | | — |
| | 141 |
| | 798 |
| | — |
| | 939 |
| | (254 | ) | | 8/1/2010 | | 1989 |
| Citizens Bank | | White River Jnct | | VT | | — |
| | 183 |
| | 1,039 |
| | — |
| | 1,222 |
| | (330 | ) | | 8/1/2010 | | 1975 |
| Coborn's Liquor Store | | Stanley | | ND | | — |
| | 1,163 |
| | 5,037 |
| | — |
| | 6,200 |
| | (740 | ) | | 2/21/2014 | | 2014 |
| Coborn's Liquor Store | | Tioga | | ND | | — |
| | 1,065 |
| | 4,581 |
| | — |
| | 5,646 |
| | (515 | ) | | 6/26/2014 | | 2014 |
| Comcast | | Englewood | | CO | | — |
| | 1,490 |
| | 5,060 |
| | — |
| | 6,550 |
| | (841 | ) | | 11/5/2013 | | 1999 |
| Community Bank | | Lake Mary | | FL | | — |
| | 1,230 |
| | 1,504 |
| | 4 |
| | 2,738 |
| | (259 | ) | | 10/1/2013 | | 1990 |
| Community Bank | | Whitehall | | NY | | 365 |
| | 106 |
| | 600 |
| | — |
| | 706 |
| | (184 | ) | | 8/1/2011 | | 1995 |
| CompUSA | | Arlington | | TX | | 1,770 |
| | 2,437 |
| | 1,467 |
| | 127 |
| | 4,031 |
| | (289 | ) | | 2/7/2014 | | 1992 |
| ConAgra Foods | | Omaha | | NE | | — |
| | 6,451 |
| | 30,697 |
| | — |
| | 37,148 |
| | (2,641 | ) | | 3/28/2014 | | 1989 |
| ConAgra Foods | | Milton | | PA | | 16,245 |
| | 5,656 |
| | 27,242 |
| | — |
| | 32,898 |
| | (3,667 | ) | | 2/7/2014 | | 1991 |
| Conn's | | Austin | | TX | | — |
| | 740 |
| | 2,958 |
| | — |
| | 3,698 |
| | (445 | ) | | 5/19/2014 | | 2002 |
| Conn's | | Hurst | | TX | | — |
| | 497 |
| | 1,990 |
| | — |
| | 2,487 |
| | (310 | ) | | 5/19/2014 | | 1999 |
| Cooper Tire & Rubber | | Franklin | | IN | | 15,802 |
| | 4,438 |
| | 33,994 |
| | — |
| | 38,432 |
| | (6,480 | ) | | 11/5/2013 | | 2009 |
| Cost Plus | | La Quinta | | CA | | — |
| | 1,211 |
| | 4,786 |
| | — |
| | 5,997 |
| | (740 | ) | | 2/7/2014 | | 2007 |
| County of Yolo, CA | | Woodland | | CA | | 10,332 |
| | 2,640 |
| | 13,681 |
| | — |
| | 16,321 |
| | (2,030 | ) | | 11/5/2013 | | 2001 |
| Cracker Barrel | | Braselton | | GA | | 2,935 |
| | 1,294 |
| | 2,403 |
| | — |
| | 3,697 |
| | (698 | ) | | 11/13/2012 | | 2005 |
| Cracker Barrel | | Bremen | | GA | | 2,677 |
| | 1,012 |
| | 2,361 |
| | — |
| | 3,373 |
| | (686 | ) | | 11/13/2012 | | 2006 |
| Cracker Barrel | | Columbus | | GA | | — |
| | 912 |
| | 3,153 |
| | — |
| | 4,065 |
| | (529 | ) | | 2/7/2014 | | 2003 |
| Cracker Barrel | | Greensboro | | NC | | — |
| | 1,632 |
| | 2,495 |
| | — |
| | 4,127 |
| | (434 | ) | | 2/7/2014 | | 2005 |
| Cracker Barrel | | Mebane | | NC | | 2,514 |
| | 1,106 |
| | 2,054 |
| | — |
| | 3,160 |
| | (596 | ) | | 11/13/2012 | | 2004 |
| Cracker Barrel | | Rocky Mount | | NC | | — |
| | 1,274 |
| | 2,334 |
| | — |
| | 3,608 |
| | (417 | ) | | 2/7/2014 | | 2006 |
| Cracker Barrel | | Fort Mill | | SC | | — |
| | 1,301 |
| | 2,721 |
| | — |
| | 4,022 |
| | (478 | ) | | 2/7/2014 | | 2006 |
| Cracker Barrel | | Piedmont | | SC | | — |
| | 1,630 |
| | 2,927 |
| | — |
| | 4,557 |
| | (513 | ) | | 2/7/2014 | | 2005 |
| Cracker Barrel | | Abilene | | TX | | — |
| | 1,374 |
| | 2,933 |
| | — |
| | 4,307 |
| | (516 | ) | | 2/7/2014 | | 2005 |
| Cracker Barrel | | San Antonio | | TX | | — |
| | 1,725 |
| | 3,005 |
| | — |
| | 4,730 |
| | (495 | ) | | 2/7/2014 | | 2005 |
| Cracker Barrel | | Sherman | | TX | | — |
| | 557 |
| | 3,744 |
| | — |
| | 4,301 |
| | (628 | ) | | 2/7/2014 | | 2007 |
| Cracker Barrel | | Bristol | | VA | | — |
| | 1,241 |
| | 1,703 |
| | — |
| | 2,944 |
| | (363 | ) | | 2/7/2014 | | 2006 |
| Cracker Barrel | | Emporia | | VA | | 2,435 |
| | 972 |
| | 2,267 |
| | — |
| | 3,239 |
| | (659 | ) | | 11/13/2012 | | 2004 |
| Cracker Barrel | | Waynesboro | | VA | | — |
| | 1,536 |
| | 1,489 |
| | — |
| | 3,025 |
| | (385 | ) | | 2/7/2014 | | 2004 |
| Cracker Barrel | | Woodstock | | VA | | 2,261 |
| | 928 |
| | 2,164 |
| | — |
| | 3,092 |
| | (629 | ) | | 11/13/2012 | | 2005 |
| Crest Production Services | | Pleasanton | | TX | | — |
| | 519 |
| | 7,949 |
| | — |
| | 8,468 |
| | (1,618 | ) | | 6/12/2014 | | 2013 |
| Crozer-Keystone Health | | Ridley Park | | PA | | 1,147 |
| | — |
| | 6,114 |
| | — |
| | 6,114 |
| | (1,041 | ) | | 11/5/2013 | | 1976 |
| | | | | | Initial Costs (1) | | Costs Capitalized Subsequent to Acquisition (2) | | Gross Amount
Carried at
December 31, 2016
(3) (4) | | | | | | Initial Costs (1) | | Costs Capitalized Subsequent to Acquisition (2) | | Gross Amount
Carried at
December 31, 2018
(3) (4) | | | |
| Property | | City | | State | | Encumbrances at
December 31, 2016 | | Land | | Buildings, Fixtures and Improvements | | Accumulated Depreciation
(3) (5) | | Date Acquired | | Date of Construction | | City | | State | | Encumbrances at
December 31, 2018 | | Land | | Buildings, Fixtures and Improvements | | Accumulated Depreciation
(3) (5) | | Date Acquired | | Date of Construction |
| CVS | | Hoover | | AL | | — |
| | 1,239 |
| | 2,890 |
| | — |
| | 4,129 |
| | (629 | ) | | 5/31/2013 | | 2003 | | Phoenix | | AZ | | 3,015 |
| | 901 |
| | 2,704 |
| | 15 |
| | 3,620 |
| | (830 | ) | | 10/1/2013 | | 2012 |
| CVS | | Meridianville | | AL | | 1,954 |
| | 1,045 |
| | 3,057 |
| | — |
| | 4,102 |
| | (535 | ) | | 2/7/2014 | | 2008 | | City Of Industry | | CA | | 2,500 |
| | 1,224 |
| | 3,202 |
| | — |
| | 4,426 |
| | (819 | ) | | 2/7/2014 | | 2009 |
| CVS | | Phoenix | | AZ | | 5,025 |
| | 1,511 |
| | 4,533 |
| | 15 |
| | 6,059 |
| | (874 | ) | | 10/1/2013 | | 2012 | | Fresno | | CA | | 5,045 |
| | 1,890 |
| | 4,409 |
| | 16 |
| | 6,315 |
| | (1,352 | ) | | 10/1/2013 | | 2012 |
| CVS | | Phoenix | | AZ | | 3,015 |
| | 901 |
| | 2,704 |
| | 15 |
| | 3,620 |
| | (522 | ) | | 10/1/2013 | | 2012 | | Palmdale | | CA | | 5,226 |
| | 2,493 |
| | 4,630 |
| | 17 |
| | 7,140 |
| | (1,420 | ) | | 10/1/2013 | | 2012 |
| CVS | | City Of Industry | | CA | | 2,500 |
| | 1,224 |
| | 3,202 |
| | — |
| | 4,426 |
| | (483 | ) | | 2/7/2014 | | 2009 | | Sacramento | | CA | | 4,724 |
| | 2,163 |
| | 4,016 |
| | 19 |
| | 6,198 |
| | (1,232 | ) | | 10/1/2013 | | 2012 |
| CVS | | Fresno | | CA | | 5,045 |
| | 1,890 |
| | 4,409 |
| | 16 |
| | 6,315 |
| | (850 | ) | | 10/1/2013 | | 2012 | | Norwich | | CT | | 5,454 |
| | 1,998 |
| | 5,995 |
| | 15 |
| | 8,008 |
| | (1,838 | ) | | 10/1/2013 | | 2011 |
| CVS | | Palmdale | | CA | | 5,226 |
| | 2,493 |
| | 4,630 |
| | 17 |
| | 7,140 |
| | (893 | ) | | 10/1/2013 | | 2012 | | Dover | | DE | | 2,046 |
| | 4,081 |
| | — |
| | — |
| | 4,081 |
| | — |
| | 2/7/2014 | | 2010 |
| CVS | | Sacramento | | CA | | 4,724 |
| | 2,163 |
| | 4,016 |
| | 19 |
| | 6,198 |
| | (775 | ) | | 10/1/2013 | | 2012 | | Auburndale | | FL | | 1,565 |
| | 1,418 |
| | 2,038 |
| | — |
| | 3,456 |
| | (557 | ) | | 2/7/2014 | | 1999 |
| CVS | | Norwich | | CT | | 5,454 |
| | 1,998 |
| | 5,995 |
| | 15 |
| | 8,008 |
| | (1,155 | ) | | 10/1/2013 | | 2011 | | Boca Raton | | FL | | 2,625 |
| | — |
| | 3,560 |
| | — |
| | 3,560 |
| | (1,069 | ) | | 2/7/2014 | | 2009 |
| CVS | | Dover | | DE | | 2,046 |
| | 4,081 |
| | — |
| | — |
| | 4,081 |
| | — |
| | 2/7/2014 | | 2010 | | Ft. Myers | | FL | | 3,025 |
| | 2,335 |
| | 3,502 |
| | — |
| | 5,837 |
| | (1,054 | ) | | 2/7/2014 | | 2009 |
| CVS | | Auburndale | | FL | | 1,565 |
| | 1,418 |
| | 2,038 |
| | — |
| | 3,456 |
| | (329 | ) | | 2/7/2014 | | 1999 | | Gulf Breeze | | FL | | 1,079 |
| | 545 |
| | — |
| | — |
| | 545 |
| | — |
| | 2/7/2014 | | 2009 |
| CVS | | Boca Raton | | FL | | 2,625 |
| | — |
| | 3,560 |
| | — |
| | 3,560 |
| | (631 | ) | | 2/7/2014 | | 2009 | | Jacksonville | | FL | | 3,715 |
| | 2,240 |
| | 4,323 |
| | — |
| | 6,563 |
| | (1,197 | ) | | 2/7/2014 | | 2009 |
| CVS | | Ft. Myers | | FL | | 3,025 |
| | 2,335 |
| | 3,502 |
| | — |
| | 5,837 |
| | (622 | ) | | 2/7/2014 | | 2009 | | Lakeland | | FL | | 2,258 |
| | 587 |
| | 2,347 |
| | 16 |
| | 2,950 |
| | (721 | ) | | 10/1/2013 | | 2012 |
| CVS | | Gulf Breeze | | FL | | 1,079 |
| | 545 |
| | — |
| | — |
| | 545 |
| | — |
| | 2/7/2014 | | 2009 | | Naples | | FL | | 2,675 |
| | — |
| | 4,164 |
| | — |
| | 4,164 |
| | (1,149 | ) | | 2/7/2014 | | 2009 |
| CVS | | Jacksonville | | FL | | 3,715 |
| | 2,240 |
| | 4,323 |
| | — |
| | 6,563 |
| | (706 | ) | | 2/7/2014 | | 2009 | | New Port Richey | | FL | | 1,595 |
| | 1,149 |
| | 2,966 |
| | — |
| | 4,115 |
| | (802 | ) | | 2/7/2014 | | 2004 |
| CVS | | Lakeland | | FL | | 2,258 |
| | 587 |
| | 2,347 |
| | 16 |
| | 2,950 |
| | (453 | ) | | 10/1/2013 | | 2012 | | St. Cloud | | FL | | 2,626 |
| | 1,534 |
| | 1,875 |
| | 78 |
| | 3,487 |
| | (603 | ) | | 4/12/2013 | | 2002 |
| CVS | | Naples | | FL | | 2,675 |
| | — |
| | 4,164 |
| | — |
| | 4,164 |
| | (678 | ) | | 2/7/2014 | | 2009 | | Alpharetta | | GA | | — |
| | 572 |
| | 858 |
| | (9 | ) | | 1,421 |
| | (289 | ) | | 9/28/2012 | | 1994 |
| CVS | | New Port Richey | | FL | | 1,640 |
| | 1,149 |
| | 2,966 |
| | — |
| | 4,115 |
| | (473 | ) | | 2/7/2014 | | 2004 | | Ringgold | | GA | | 1,948 |
| | 1,346 |
| | 2,939 |
| | — |
| | 4,285 |
| | (868 | ) | | 2/7/2014 | | 2007 |
| CVS | | St. Augustine | | FL | | — |
| | 1,264 |
| | 3,674 |
| | — |
| | 4,938 |
| | (597 | ) | | 2/7/2014 | | 2008 | | Stockbridge | | GA | | — |
| | 855 |
| | 1,283 |
| | — |
| | 2,138 |
| | (419 | ) | | 2/28/2013 | | 1998 |
| CVS | | St. Cloud | | FL | | 2,626 |
| | 1,534 |
| | 1,875 |
| | — |
| | 3,409 |
| | (417 | ) | | 4/12/2013 | | 2002 | | Vidalia | | GA | | — |
| | 368 |
| | 1,105 |
| | 3 |
| | 1,476 |
| | (374 | ) | | 9/28/2012 | | 2000 |
| CVS | | Alpharetta | | GA | | — |
| | 572 |
| | 858 |
| | (12 | ) | | 1,418 |
| | (220 | ) | | 9/28/2012 | | 1994 | | Northbrook | | IL | | — |
| | 3,471 |
| | 41,765 |
| | 1,139 |
| | 46,375 |
| | (9,396 | ) | | 2/7/2014 | | 1980 |
| CVS | | Ringgold | | GA | | 1,948 |
| | 1,346 |
| | 2,939 |
| | — |
| | 4,285 |
| | (515 | ) | | 2/7/2014 | | 2007 | | Edinburgh | | IN | | — |
| | 420 |
| | 1,530 |
| | 55 |
| | 2,005 |
| | (457 | ) | | 2/24/2014 | | 1998 |
| CVS | | Stockbridge | | GA | | — |
| | 855 |
| | 1,283 |
| | — |
| | 2,138 |
| | (298 | ) | | 2/28/2013 | | 1998 | | Evansville | | IN | | — |
| | 227 |
| | 3,060 |
| | — |
| | 3,287 |
| | (830 | ) | | 2/7/2014 | | 2000 |
| CVS | | Vidalia | | GA | | — |
| | 368 |
| | 1,105 |
| | — |
| | 1,473 |
| | (285 | ) | | 9/28/2012 | | 2000 | | Franklin | | IN | | — |
| | 310 |
| | 2,787 |
| | (5 | ) | | 3,092 |
| | (986 | ) | | 3/29/2012 | | 1999 |
| CVS | | Northbrook | | IL | | 25,155 |
| | 3,471 |
| | 41,765 |
| | 69 |
| | 45,305 |
| | (5,539 | ) | | 2/7/2014 | | 1980 | | Mishawaka | | IN | | 2,258 |
| | 409 |
| | 4,532 |
| | — |
| | 4,941 |
| | (1,241 | ) | | 2/7/2014 | | 2007 |
| CVS | | Edinburgh | | IN | | — |
| | 420 |
| | 1,530 |
| | — |
| | 1,950 |
| | (269 | ) | | 2/24/2014 | | 1998 | | Tipton | | IN | | — |
| | 311 |
| | 1,726 |
| | 68 |
| | 2,105 |
| | (514 | ) | | 2/24/2014 | | 1998 |
| CVS | | Evansville | | IN | | 1,850 |
| | 227 |
| | 3,060 |
| | — |
| | 3,287 |
| | (490 | ) | | 2/7/2014 | | 2000 | | Lawrence | | KS | | 2,908 |
| | 837 |
| | 4,392 |
| | — |
| | 5,229 |
| | (1,206 | ) | | 2/7/2014 | | 2009 |
| CVS | | Franklin | | IN | | — |
| | 310 |
| | 2,787 |
| | (5 | ) | | 3,092 |
| | (801 | ) | | 3/29/2012 | | 1999 | | Mandeville | | LA | | 4,020 |
| | 2,385 |
| | 2,915 |
| | 16 |
| | 5,316 |
| | (895 | ) | | 10/1/2013 | | 2012 |
| CVS | | Mishawaka | | IN | | 2,258 |
| | 409 |
| | 4,532 |
| | — |
| | 4,941 |
| | (735 | ) | | 2/7/2014 | | 2007 | |
| CVS | | Tipton | | IN | | — |
| | 311 |
| | 1,726 |
| | — |
| | 2,037 |
| | (303 | ) | | 2/24/2014 | | 1998 | |
| CVS | | Lawrence | | KS | | 2,908 |
| | 837 |
| | 4,392 |
| | — |
| | 5,229 |
| | (711 | ) | | 2/7/2014 | | 2009 | |
| CVS | | Mandeville | | LA | | 4,020 |
| | 2,385 |
| | 2,915 |
| | 16 |
| | 5,316 |
| | (562 | ) | | 10/1/2013 | | 2012 | |
| | | | | | Initial Costs (1) | | Costs Capitalized Subsequent to Acquisition (2) | | Gross Amount
Carried at
December 31, 2016
(3) (4) | | | | | | Initial Costs (1) | | Costs Capitalized Subsequent to Acquisition (2) | | Gross Amount
Carried at
December 31, 2018
(3) (4) | | | |
| Property | | City | | State | | Encumbrances at
December 31, 2016 | | Land | | Buildings, Fixtures and Improvements | | Accumulated Depreciation
(3) (5) | | Date Acquired | | Date of Construction | | City | | State | | Encumbrances at
December 31, 2018 | | Land | | Buildings, Fixtures and Improvements | | Accumulated Depreciation
(3) (5) | | Date Acquired | | Date of Construction |
| CVS | | Metairie | | LA | | 4,121 |
| | 1,895 |
| | 3,519 |
| | 16 |
| | 5,430 |
| | (679 | ) | | 10/1/2013 | | 2012 | | Metairie | | LA | | 4,121 |
| | 1,895 |
| | 3,519 |
| | 16 |
| | 5,430 |
| | (1,080 | ) | | 10/1/2013 | | 2012 |
| CVS | | New Orleans | | LA | | 3,719 |
| | 2,439 |
| | 2,439 |
| | 16 |
| | 4,894 |
| | (471 | ) | | 10/1/2013 | | 2012 | | New Orleans | | LA | | 3,719 |
| | 2,439 |
| | 2,439 |
| | 16 |
| | 4,894 |
| | (749 | ) | | 10/1/2013 | | 2012 |
| CVS | | Slidell | | LA | | 4,355 |
| | 1,142 |
| | 4,568 |
| | 16 |
| | 5,726 |
| | (881 | ) | | 10/1/2013 | | 2012 | | Slidell | | LA | | 4,355 |
| | 1,142 |
| | 4,568 |
| | 16 |
| | 5,726 |
| | (1,401 | ) | | 10/1/2013 | | 2012 |
| CVS | | Hingham | | MA | | 5,695 |
| | 1,873 |
| | 5,619 |
| | 15 |
| | 7,507 |
| | (1,083 | ) | | 10/1/2013 | | 2012 | | Hingham | | MA | | 5,695 |
| | 1,873 |
| | 5,619 |
| | 15 |
| | 7,507 |
| | (1,723 | ) | | 10/1/2013 | | 2012 |
| CVS | | Malden | | MA | | 5,360 |
| | 1,757 |
| | 5,271 |
| | 14 |
| | 7,042 |
| | (1,016 | ) | | 10/1/2013 | | 2012 | | Malden | | MA | | 5,360 |
| | 1,757 |
| | 5,271 |
| | 14 |
| | 7,042 |
| | (1,616 | ) | | 10/1/2013 | | 2012 |
| CVS | | Detroit | | MI | | — |
| | 270 |
| | 2,427 |
| | (5 | ) | | 2,692 |
| | (564 | ) | | 2/28/2013 | | 1999 | | Detroit | | MI | | — |
| | 270 |
| | 2,427 |
| | (5 | ) | | 2,692 |
| | (791 | ) | | 2/28/2013 | | 1999 |
| CVS | | Harper Woods | | MI | | — |
| | 499 |
| | 2,829 |
| | — |
| | 3,328 |
| | (658 | ) | | 2/28/2013 | | 1999 | | Harper Woods | | MI | | — |
| | 499 |
| | 2,829 |
| | — |
| | 3,328 |
| | (923 | ) | | 2/28/2013 | | 1999 |
| CVS | | Minneapolis | | MN | | — |
| | 266 |
| | 4,693 |
| | — |
| | 4,959 |
| | (676 | ) | | 2/7/2014 | | 2009 | | Independence | | MO | | — |
| | 780 |
| | 3,121 |
| | — |
| | 3,901 |
| | (877 | ) | | 5/19/2014 | | 2000 |
| CVS | | Independence | | MO | | — |
| | 780 |
| | 3,121 |
| | — |
| | 3,901 |
| | (495 | ) | | 5/19/2014 | | 2000 | | St. Joseph | | MO | | 3,015 |
| | 1,022 |
| | 3,067 |
| | 16 |
| | 4,105 |
| | (941 | ) | | 10/1/2013 | | 2012 |
| CVS | | St. Joseph | | MO | | 3,015 |
| | 1,022 |
| | 3,067 |
| | 16 |
| | 4,105 |
| | (592 | ) | | 10/1/2013 | | 2012 | | Southaven | | MS | | 3,030 |
| | 1,849 |
| | 3,217 |
| | — |
| | 5,066 |
| | (1,044 | ) | | 2/7/2014 | | 2009 |
| CVS | | Southaven | | MS | | 3,030 |
| | 1,849 |
| | 3,217 |
| | — |
| | 5,066 |
| | (616 | ) | | 2/7/2014 | | 2009 | | Southaven | | MS | | 4,270 |
| | 1,281 |
| | 4,100 |
| | — |
| | 5,381 |
| | (1,303 | ) | | 2/7/2014 | | 2009 |
| CVS | | Southaven | | MS | | 4,270 |
| | 1,281 |
| | 4,100 |
| | — |
| | 5,381 |
| | (769 | ) | | 2/7/2014 | | 2009 | | Beaufort | | NC | | 2,781 |
| | 378 |
| | 3,404 |
| | 16 |
| | 3,798 |
| | (1,044 | ) | | 10/1/2013 | | 2011 |
| CVS | | Beaufort | | NC | | 2,781 |
| | 378 |
| | 3,404 |
| | 16 |
| | 3,798 |
| | (656 | ) | | 10/1/2013 | | 2011 | | Eden | | NC | | — |
| | 836 |
| | 1,450 |
| | — |
| | 2,286 |
| | (399 | ) | | 2/7/2014 | | 1998 |
| CVS | | Charlotte | | NC | | — |
| | 1,185 |
| | 2,176 |
| | — |
| | 3,361 |
| | (335 | ) | | 2/7/2014 | | 2008 | | Kernersville | | NC | | — |
| | 960 |
| | 1,313 |
| | — |
| | 2,273 |
| | (359 | ) | | 2/7/2014 | | 1998 |
| CVS | | Eden | | NC | | — |
| | 836 |
| | 1,450 |
| | — |
| | 2,286 |
| | (235 | ) | | 2/7/2014 | | 1998 | | Weaverville | | NC | | 3,098 |
| | 1,998 |
| | 4,307 |
| | — |
| | 6,305 |
| | (1,268 | ) | | 2/7/2014 | | 2009 |
| CVS | | Kernersville | | NC | | — |
| | 960 |
| | 1,313 |
| | — |
| | 2,273 |
| | (212 | ) | | 2/7/2014 | | 1998 | | Cherry Hill | | NJ | | — |
| | 2,255 |
| | — |
| | — |
| | 2,255 |
| | — |
| | 2/7/2014 | | 2011 |
| CVS | | Weaverville | | NC | | 3,098 |
| | 1,998 |
| | 4,307 |
| | — |
| | 6,305 |
| | (748 | ) | | 2/7/2014 | | 2009 | | Edison | | NJ | | — |
| | 3,318 |
| | — |
| | — |
| | 3,318 |
| | — |
| | 2/7/2014 | | 2008 |
| CVS | | Cherry Hill | | NJ | | — |
| | 2,255 |
| | — |
| | — |
| | 2,255 |
| | — |
| | 2/7/2014 | | 2011 | | Lawrenceville | | NJ | | 5,170 |
| | 2,674 |
| | 6,412 |
| | — |
| | 9,086 |
| | (1,733 | ) | | 2/7/2014 | | 2009 |
| CVS | | Edison | | NJ | | — |
| | 3,318 |
| | — |
| | — |
| | 3,318 |
| | — |
| | 2/7/2014 | | 2008 | | Albuquerque | | NM | | 3,719 |
| | 975 |
| | 3,899 |
| | 16 |
| | 4,890 |
| | (1,196 | ) | | 10/1/2013 | | 2011 |
| CVS | | Lawrenceville | | NJ | | 5,170 |
| | 2,674 |
| | 6,412 |
| | — |
| | 9,086 |
| | (1,022 | ) | | 2/7/2014 | | 2009 | | Albuquerque | | NM | | 3,920 |
| | 1,029 |
| | 4,118 |
| | 17 |
| | 5,164 |
| | (1,263 | ) | | 10/1/2013 | | 2011 |
| CVS | | Albuquerque | | NM | | 3,719 |
| | 975 |
| | 3,899 |
| | 16 |
| | 4,890 |
| | (752 | ) | | 10/1/2013 | | 2011 | | Las Cruces | | NM | | 4,925 |
| | 1,295 |
| | 5,178 |
| | 17 |
| | 6,490 |
| | (1,588 | ) | | 10/1/2013 | | 2012 |
| CVS | | Albuquerque | | NM | | 3,920 |
| | 1,029 |
| | 4,118 |
| | 17 |
| | 5,164 |
| | (794 | ) | | 10/1/2013 | | 2011 | | North Las Vegas | | NV | | 3,268 |
| | 1,374 |
| | 3,207 |
| | — |
| | 4,581 |
| | (1,094 | ) | | 8/22/2012 | | 2004 |
| CVS | | Las Cruces | | NM | | 4,925 |
| | 1,295 |
| | 5,178 |
| | 17 |
| | 6,490 |
| | (998 | ) | | 10/1/2013 | | 2012 | | Sparks | | NV | | — |
| | 486 |
| | 5,894 |
| | — |
| | 6,380 |
| | (1,633 | ) | | 2/7/2014 | | 2009 |
| CVS | | North Las Vegas | | NV | | 3,268 |
| | 1,374 |
| | 3,207 |
| | — |
| | 4,581 |
| | (842 | ) | | 8/22/2012 | | 2004 | | Henrietta | | NY | | — |
| | 965 |
| | 1,180 |
| | 63 |
| | 2,208 |
| | (394 | ) | | 11/8/2012 | | 1997 |
| CVS | | Sparks | | NV | | — |
| | 486 |
| | 5,894 |
| | — |
| | 6,380 |
| | (963 | ) | | 2/7/2014 | | 2009 | | Mineola | | NY | | 2,280 |
| | — |
| | 5,120 |
| | — |
| | 5,120 |
| | (1,354 | ) | | 2/7/2014 | | 2008 |
| CVS | | Henrietta | | NY | | — |
| | 965 |
| | 1,180 |
| | (2 | ) | | 2,143 |
| | (292 | ) | | 11/8/2012 | | 1997 | | Warren | | OH | | — |
| | 560 |
| | 1,622 |
| | — |
| | 2,182 |
| | (440 | ) | | 2/7/2014 | | 2008 |
| CVS | | Mineola | | NY | | 2,280 |
| | — |
| | 5,120 |
| | — |
| | 5,120 |
| | (798 | ) | | 2/7/2014 | | 2008 | | Oklahoma City | | OK | | — |
| | 569 |
| | 1,609 |
| | — |
| | 2,178 |
| | (417 | ) | | 2/7/2014 | | 1996 |
| CVS | | Warren | | OH | | — |
| | 560 |
| | 1,622 |
| | — |
| | 2,182 |
| | (261 | ) | | 2/7/2014 | | 2008 | | The Village | | OK | | 3,425 |
| | 520 |
| | 4,730 |
| | — |
| | 5,250 |
| | (1,290 | ) | | 2/7/2014 | | 2009 |
| CVS | | Oklahoma City | | OK | | — |
| | 569 |
| | 1,609 |
| | — |
| | 2,178 |
| | (246 | ) | | 2/7/2014 | | 1996 | | Tulsa | | OK | | 2,446 |
| | 950 |
| | 2,216 |
| | 16 |
| | 3,182 |
| | (681 | ) | | 10/1/2013 | | 2010 |
| CVS | | The Village | | OK | | 3,425 |
| | 520 |
| | 4,730 |
| | — |
| | 5,250 |
| | (761 | ) | | 2/7/2014 | | 2009 | | Freeland | | PA | | 982 |
| | 122 |
| | 1,096 |
| | — |
| | 1,218 |
| | (374 | ) | | 8/8/2012 | | 2004 |
| CVS | | Tulsa | | OK | | 2,446 |
| | 950 |
| | 2,216 |
| | 16 |
| | 3,182 |
| | (428 | ) | | 10/1/2013 | | 2010 | | Mechanicsburg | | PA | | 3,582 |
| | 1,155 |
| | 3,465 |
| | — |
| | 4,620 |
| | (1,156 | ) | | 11/29/2012 | | 2008 |
| CVS | | Freeland | | PA | | 982 |
| | 122 |
| | 1,096 |
| | — |
| | 1,218 |
| | (288 | ) | | 8/8/2012 | | 2004 | | New Castle | | PA | | — |
| | 412 |
| | 2,337 |
| | 45 |
| | 2,794 |
| | (786 | ) | | 10/31/2012 | | 1999 |
| | | | | | Initial Costs (1) | | Costs Capitalized Subsequent to Acquisition (2) | | Gross Amount
Carried at
December 31, 2016
(3) (4) | | | | | | Initial Costs (1) | | Costs Capitalized Subsequent to Acquisition (2) | | Gross Amount
Carried at
December 31, 2018
(3) (4) | | | |
| Property | | City | | State | | Encumbrances at
December 31, 2016 | | Land | | Buildings, Fixtures and Improvements | | Accumulated Depreciation
(3) (5) | | Date Acquired | | Date of Construction | | City | | State | | Encumbrances at
December 31, 2018 | | Land | | Buildings, Fixtures and Improvements | | Accumulated Depreciation
(3) (5) | | Date Acquired | | Date of Construction |
| CVS | | Mechanicsburg | | PA | | 3,582 |
| | 1,155 |
| | 3,465 |
| | — |
| | 4,620 |
| | (858 | ) | | 11/29/2012 | | 2008 | | Shippensburg | | PA | | 1,859 |
| | 351 |
| | 1,988 |
| | — |
| | 2,339 |
| | (649 | ) | | 2/8/2013 | | 2002 |
| CVS | | New Castle | | PA | | 1,562 |
| | 412 |
| | 2,337 |
| | — |
| | 2,749 |
| | (590 | ) | | 10/31/2012 | | 1999 | | Titusville | | PA | | — |
| | 670 |
| | 683 |
| | 68 |
| | 1,421 |
| | (389 | ) | | 2/7/2014 | | 1998 |
| CVS | | Shippensburg | | PA | | 1,859 |
| | 351 |
| | 1,988 |
| | — |
| | 2,339 |
| | (462 | ) | | 2/8/2013 | | 2002 | | Towanda | | PA | | 878 |
| | — |
| | 877 |
| | — |
| | 877 |
| | (282 | ) | | 4/24/2013 | | 2003 |
| CVS | | Titusville | | PA | | — |
| | 670 |
| | 683 |
| | — |
| | 1,353 |
| | (230 | ) | | 2/7/2014 | | 1998 | | Anderson | | SC | | — |
| | 623 |
| | 1,389 |
| | — |
| | 2,012 |
| | (367 | ) | | 2/7/2014 | | 1998 |
| CVS | | Towanda | | PA | | 878 |
| | — |
| | 877 |
| | — |
| | 877 |
| | (195 | ) | | 4/24/2013 | | 2003 | | Cayce | | SC | | — |
| | 1,750 |
| | 2,701 |
| | — |
| | 4,451 |
| | (819 | ) | | 2/7/2014 | | 2009 |
| CVS | | Anderson | | SC | | — |
| | 623 |
| | 1,389 |
| | — |
| | 2,012 |
| | (216 | ) | | 2/7/2014 | | 1998 | | Columbia | | SC | | 2,278 |
| | — |
| | 2,811 |
| | — |
| | 2,811 |
| | (882 | ) | | 7/2/2013 | | 2006 |
| CVS | | Cayce | | SC | | — |
| | 1,750 |
| | 2,701 |
| | — |
| | 4,451 |
| | (483 | ) | | 2/7/2014 | | 2009 | | Greenville | | SC | | — |
| | 169 |
| | 1,520 |
| | — |
| | 1,689 |
| | (496 | ) | | 2/28/2013 | | 1997 |
| CVS | | Columbia | | SC | | 2,278 |
| | — |
| | 2,811 |
| | — |
| | 2,811 |
| | (583 | ) | | 7/2/2013 | | 2006 | | Greenville | | SC | | — |
| | 1,108 |
| | 1,816 |
| | — |
| | 2,924 |
| | (517 | ) | | 2/7/2014 | | 1998 |
| CVS | | Greenville | | SC | | — |
| | 169 |
| | 1,520 |
| | — |
| | 1,689 |
| | (353 | ) | | 2/28/2013 | | 1997 | | Piedmont | | SC | | — |
| | 836 |
| | 1,206 |
| | — |
| | 2,042 |
| | (314 | ) | | 2/7/2014 | | 1998 |
| CVS | | Greenville | | SC | | — |
| | 1,108 |
| | 1,816 |
| | — |
| | 2,924 |
| | (305 | ) | | 2/7/2014 | | 1998 | | Jackson | | TN | | 3,082 |
| | 1,209 |
| | 2,822 |
| | 16 |
| | 4,047 |
| | (866 | ) | | 10/1/2013 | | 2012 |
| CVS | | Piedmont | | SC | | — |
| | 836 |
| | 1,206 |
| | — |
| | 2,042 |
| | (185 | ) | | 2/7/2014 | | 1998 | | Knoxville | | TN | | 2,613 |
| | 1,190 |
| | 2,210 |
| | 16 |
| | 3,416 |
| | (679 | ) | | 10/1/2013 | | 2011 |
| CVS | | Jackson | | TN | | 3,082 |
| | 1,209 |
| | 2,822 |
| | 16 |
| | 4,047 |
| | (544 | ) | | 10/1/2013 | | 2012 | | Nashville | | TN | | — |
| | 203 |
| | 1,148 |
| | 83 |
| | 1,434 |
| | (389 | ) | | 9/28/2012 | | 1996 |
| CVS | | Knoxville | | TN | | 2,613 |
| | 1,190 |
| | 2,210 |
| | 16 |
| | 3,416 |
| | (427 | ) | | 10/1/2013 | | 2011 | | Converse | | TX | | 3,538 |
| | 1,390 |
| | 3,243 |
| | 15 |
| | 4,648 |
| | (995 | ) | | 10/1/2013 | | 2011 |
| CVS | | Nashville | | TN | | — |
| | 203 |
| | 1,148 |
| | (4 | ) | | 1,347 |
| | (295 | ) | | 9/28/2012 | | 1996 | | Dumas | | TX | | 2,312 |
| | 846 |
| | 2,537 |
| | 16 |
| | 3,399 |
| | (779 | ) | | 10/1/2013 | | 2011 |
| CVS | | Converse | | TX | | 3,538 |
| | 1,390 |
| | 3,243 |
| | 15 |
| | 4,648 |
| | (626 | ) | | 10/1/2013 | | 2011 | | Duncanville | | TX | | — |
| | 670 |
| | 2,681 |
| | — |
| | 3,351 |
| | (759 | ) | | 5/19/2014 | | 2000 |
| CVS | | Dumas | | TX | | 2,312 |
| | 846 |
| | 2,537 |
| | 16 |
| | 3,399 |
| | (490 | ) | | 10/1/2013 | | 2011 | | Edinburg | | TX | | — |
| | 1,179 |
| | 3,060 |
| | — |
| | 4,239 |
| | (877 | ) | | 2/7/2014 | | 2008 |
| CVS | | Duncanville | | TX | | — |
| | 670 |
| | 2,681 |
| | — |
| | 3,351 |
| | (429 | ) | | 5/19/2014 | | 2000 | | Elsa | | TX | | 2,814 |
| | 915 |
| | 2,744 |
| | 16 |
| | 3,675 |
| | (842 | ) | | 10/1/2013 | | 2011 |
| CVS | | Edinburg | | TX | | — |
| | 1,179 |
| | 3,060 |
| | — |
| | 4,239 |
| | (517 | ) | | 2/7/2014 | | 2008 | | Ft . Worth | | TX | | 4,147 |
| | 2,453 |
| | 3,679 |
| | 15 |
| | 6,147 |
| | (1,129 | ) | | 10/1/2013 | | 2011 |
| CVS | | Elsa | | TX | | 2,814 |
| | 915 |
| | 2,744 |
| | 16 |
| | 3,675 |
| | (529 | ) | | 10/1/2013 | | 2011 | | Gainesville | | TX | | 2,215 |
| | 341 |
| | 3,334 |
| | — |
| | 3,675 |
| | (882 | ) | | 2/7/2014 | | 2003 |
| CVS | | Ft . Worth | | TX | | 4,147 |
| | 2,453 |
| | 3,679 |
| | 15 |
| | 6,147 |
| | (709 | ) | | 10/1/2013 | | 2011 | | San Antonio | | TX | | 3,806 |
| | 1,996 |
| | 2,993 |
| | 15 |
| | 5,004 |
| | (919 | ) | | 10/1/2013 | | 2011 |
| CVS | | Gainesville | | TX | | 2,215 |
| | 341 |
| | 3,334 |
| | — |
| | 3,675 |
| | (520 | ) | | 2/7/2014 | | 2003 | | San Antonio | | TX | | 4,422 |
| | 2,034 |
| | 3,778 |
| | 15 |
| | 5,827 |
| | (1,159 | ) | | 10/1/2013 | | 2011 |
| CVS | | San Antonio | | TX | | 3,806 |
| | 1,996 |
| | 2,993 |
| | 15 |
| | 5,004 |
| | (577 | ) | | 10/1/2013 | | 2011 | | San Antonio | | TX | | 2,660 |
| | 868 |
| | 2,605 |
| | 16 |
| | 3,489 |
| | (800 | ) | | 10/1/2013 | | 2012 |
| CVS | | San Antonio | | TX | | 4,422 |
| | 2,034 |
| | 3,778 |
| | 15 |
| | 5,827 |
| | (728 | ) | | 10/1/2013 | | 2011 | | San Juan | | TX | | 2,345 |
| | 610 |
| | 2,441 |
| | 16 |
| | 3,067 |
| | (750 | ) | | 10/1/2013 | | 2012 |
| CVS | | San Antonio | | TX | | 2,660 |
| | 868 |
| | 2,605 |
| | 16 |
| | 3,489 |
| | (503 | ) | | 10/1/2013 | | 2012 | | Hardy | | VA | | 2,035 |
| | 686 |
| | 2,059 |
| | — |
| | 2,745 |
| | (656 | ) | | 5/16/2013 | | 2005 |
| CVS | | San Juan | | TX | | 2,345 |
| | 610 |
| | 2,441 |
| | 16 |
| | 3,067 |
| | (471 | ) | | 10/1/2013 | | 2012 | | Lynchburg | | VA | | 1,748 |
| | 914 |
| | 2,987 |
| | 99 |
| | 4,000 |
| | (829 | ) | | 2/7/2014 | | 1999 |
| CVS | | Hardy | | VA | | 2,035 |
| | 686 |
| | 2,059 |
| | — |
| | 2,745 |
| | (448 | ) | | 5/16/2013 | | 2005 | | Madison Heights | | VA | | 1,592 |
| | 1,015 |
| | 2,589 |
| | 68 |
| | 3,672 |
| | (707 | ) | | 2/7/2014 | | 1997 |
| CVS | | Lynchburg | | VA | | 1,748 |
| | 914 |
| | 2,987 |
| | 4 |
| | 3,905 |
| | (486 | ) | | 2/7/2014 | | 1999 | | Norfolk | | VA | | 2,399 |
| | 697 |
| | 2,789 |
| | 16 |
| | 3,502 |
| | (856 | ) | | 10/1/2013 | | 2011 |
| CVS | | Madison Heights | | VA | | 1,592 |
| | 1,015 |
| | 2,589 |
| | — |
| | 3,604 |
| | (416 | ) | | 2/7/2014 | | 1997 | | Portsmouth | | VA | | 3,367 |
| | 1,230 |
| | 3,690 |
| | 16 |
| | 4,936 |
| | (1,132 | ) | | 10/1/2013 | | 2012 |
| CVS | | Norfolk | | VA | | 2,399 |
| | 697 |
| | 2,789 |
| | 16 |
| | 3,502 |
| | (538 | ) | | 10/1/2013 | | 2011 | | Roanoke | | VA | | 2,269 |
| | 825 |
| | 2,474 |
| | 14 |
| | 3,313 |
| | (760 | ) | | 10/1/2013 | | 2011 |
| CVS | | Portsmouth | | VA | | 3,367 |
| | 1,230 |
| | 3,690 |
| | 16 |
| | 4,936 |
| | (712 | ) | | 10/1/2013 | | 2012 | | Virginia Beach | | VA | | 3,114 |
| | 683 |
| | 3,868 |
| | 14 |
| | 4,565 |
| | (1,186 | ) | | 10/1/2013 | | 2012 |
| CVS | | Roanoke | | VA | | 2,269 |
| | 825 |
| | 2,474 |
| | 14 |
| | 3,313 |
| | (477 | ) | | 10/1/2013 | | 2011 | | Williamsburg | | VA | | 4,115 |
| | 907 |
| | 5,137 |
| | 16 |
| | 6,060 |
| | (1,575 | ) | | 10/1/2013 | | 2011 |
| CVS | | Virginia Beach | | VA | | 3,114 |
| | 683 |
| | 3,868 |
| | 14 |
| | 4,565 |
| | (746 | ) | | 10/1/2013 | | 2012 | |
| Dahl's | | | Des Moines | | IA | | — |
| | 628 |
| | 3,947 |
| | — |
| | 4,575 |
| | (1,078 | ) | | 2/7/2014 | | 1947 |
| | | | | | Initial Costs (1) | | Costs Capitalized Subsequent to Acquisition (2) | | Gross Amount
Carried at
December 31, 2016
(3) (4) | | | | | | Initial Costs (1) | | Costs Capitalized Subsequent to Acquisition (2) | | Gross Amount
Carried at
December 31, 2018
(3) (4) | | | |
| Property | | City | | State | | Encumbrances at
December 31, 2016 | | Land | | Buildings, Fixtures and Improvements | | Accumulated Depreciation
(3) (5) | | Date Acquired | | Date of Construction | | City | | State | | Encumbrances at
December 31, 2018 | | Land | | Buildings, Fixtures and Improvements | | Accumulated Depreciation
(3) (5) | | Date Acquired | | Date of Construction |
| CVS | | Williamsburg | | VA | | 4,115 |
| | 907 |
| | 5,137 |
| | 16 |
| | 6,060 |
| | (990 | ) | | 10/1/2013 | | 2011 | |
| Dahl's | | Des Moines | | IA | | — |
| | 628 |
| | 3,947 |
| | — |
| | 4,575 |
| | (636 | ) | | 2/7/2014 | | 1947 | |
| Dahl's | | Des Moines | | IA | | — |
| | 1,163 |
| | 1,649 |
| | — |
| | 2,812 |
| | (268 | ) | | 2/7/2014 | | 1959 | | Des Moines | | IA | | — |
| | 1,163 |
| | 1,649 |
| | — |
| | 2,812 |
| | (454 | ) | | 2/7/2014 | | 1959 |
| Dahl's | | Des Moines | | IA | | — |
| | 2,871 |
| | 11,761 |
| | — |
| | 14,632 |
| | (1,847 | ) | | 2/7/2014 | | 2011 | | Des Moines | | IA | | — |
| | 2,871 |
| | 11,761 |
| | — |
| | 14,632 |
| | (3,132 | ) | | 2/7/2014 | | 2011 |
| Dahl's | | Johnston | | IA | | — |
| | 3,202 |
| | 6,644 |
| | — |
| | 9,846 |
| | (1,071 | ) | | 2/7/2014 | | 2000 | | Johnston | | IA | | — |
| | 3,202 |
| | 6,644 |
| | — |
| | 9,846 |
| | (1,817 | ) | | 2/7/2014 | | 2000 |
| Dairy Queen | | Mauldin | | SC | | — |
| | 133 |
| | — |
| | — |
| | 133 |
| | — |
| | 6/27/2013 | | 1995 | | Mauldin | | SC | | — |
| | 133 |
| | — |
| | — |
| | 133 |
| | — |
| | 6/27/2013 | | 1995 |
| Dairy Queen | | Alto | | TX | | — |
| | 50 |
| | 110 |
| | — |
| | 160 |
| | (21 | ) | | 6/27/2013 | | 1995 | | Alto | | TX | | — |
| | 50 |
| | 110 |
| | — |
| | 160 |
| | (32 | ) | | 6/27/2013 | | 1995 |
| Dairy Queen | | Pineland | | TX | | — |
| | 40 |
| | 120 |
| | — |
| | 160 |
| | (23 | ) | | 6/27/2013 | | 1995 | | Pineland | | TX | | — |
| | 40 |
| | 120 |
| | — |
| | 160 |
| | (35 | ) | | 6/27/2013 | | 1995 |
| Dairy Queen | | Silsbee | | TX | | — |
| | 60 |
| | 100 |
| | — |
| | 160 |
| | (19 | ) | | 6/27/2013 | | 1995 | | Silsbee | | TX | | — |
| | 60 |
| | 100 |
| | — |
| | 160 |
| | (29 | ) | | 6/27/2013 | | 1995 |
| Dairy Queen | | Woodville | | TX | | — |
| | 98 |
| | 65 |
| | — |
| | 163 |
| | (12 | ) | | 7/31/2013 | | 1980 | | Woodville | | TX | | — |
| | 98 |
| | 65 |
| | — |
| | 163 |
| | (18 | ) | | 7/31/2013 | | 1980 |
| DaVita Dialysis | | Osceola | | AR | | — |
| | 137 |
| | 1,232 |
| | — |
| | 1,369 |
| | (220 | ) | | 3/28/2013 | | 2009 | | Osceola | | AR | | — |
| | 137 |
| | 1,232 |
| | — |
| | 1,369 |
| | (318 | ) | | 3/28/2013 | | 2009 |
| DaVita Dialysis | | Casselberry | | FL | | — |
| | 392 |
| | 2,320 |
| | — |
| | 2,712 |
| | (317 | ) | | 2/7/2014 | | 2007 | | Casselberry | | FL | | — |
| | 392 |
| | 2,320 |
| | — |
| | 2,712 |
| | (537 | ) | | 2/7/2014 | | 2007 |
| DaVita Dialysis | | Palatka | | FL | | — |
| | 207 |
| | 1,173 |
| | — |
| | 1,380 |
| | (195 | ) | | 6/5/2013 | | 2013 | | Palatka | | FL | | — |
| | 207 |
| | 1,173 |
| | — |
| | 1,380 |
| | (294 | ) | | 6/5/2013 | | 2013 |
| DaVita Dialysis | | Sanford | | FL | | — |
| | 530 |
| | 2,793 |
| | — |
| | 3,323 |
| | (355 | ) | | 2/7/2014 | | 2005 | | Sanford | | FL | | — |
| | 530 |
| | 2,793 |
| | — |
| | 3,323 |
| | (602 | ) | | 2/7/2014 | | 2005 |
| DaVita Dialysis | | Augusta | | GA | | — |
| | 118 |
| | 1,818 |
| | — |
| | 1,936 |
| | (204 | ) | | 2/7/2014 | | 2000 | | Augusta | | GA | | — |
| | 118 |
| | 1,818 |
| | 47 |
| | 1,983 |
| | (346 | ) | | 2/7/2014 | | 2000 |
| DaVita Dialysis | | Douglasville | | GA | | — |
| | 119 |
| | 1,858 |
| | — |
| | 1,977 |
| | (209 | ) | | 2/7/2014 | | 2001 | | Douglasville | | GA | | — |
| | 119 |
| | 1,858 |
| | — |
| | 1,977 |
| | (354 | ) | | 2/7/2014 | | 2001 |
| DaVita Dialysis | | Ft. Wayne | | IN | | — |
| | 394 |
| | 2,963 |
| | — |
| | 3,357 |
| | (349 | ) | | 2/7/2014 | | 2008 | | Ft. Wayne | | IN | | — |
| | 394 |
| | 2,963 |
| | (7 | ) | | 3,350 |
| | (592 | ) | | 2/7/2014 | | 2008 |
| DaVita Dialysis | | Hiawatha | | KS | | — |
| | 69 |
| | 1,302 |
| | — |
| | 1,371 |
| | (222 | ) | | 5/30/2013 | | 2012 | | Hiawatha | | KS | | — |
| | 69 |
| | 1,302 |
| | — |
| | 1,371 |
| | (330 | ) | | 5/30/2013 | | 2012 |
| DaVita Dialysis | | New Orleans | | LA | | — |
| | 511 |
| | 2,237 |
| | — |
| | 2,748 |
| | (210 | ) | | 9/30/2014 | | 2010 | | New Orleans | | LA | | — |
| | 511 |
| | 2,237 |
| | — |
| | 2,748 |
| | (392 | ) | | 9/30/2014 | | 2010 |
| DaVita Dialysis | | Allen Park | | MI | | — |
| | 209 |
| | 1,885 |
| | — |
| | 2,094 |
| | (412 | ) | | 12/31/2012 | | 1955 | | Allen Park | | MI | | — |
| | 209 |
| | 1,885 |
| | 151 |
| | 2,245 |
| | (563 | ) | | 12/31/2012 | | 1955 |
| DaVita Dialysis | | Grand Rapids | | MI | | — |
| | 215 |
| | 1,794 |
| | — |
| | 2,009 |
| | (232 | ) | | 2/7/2014 | | 1997 | | Grand Rapids | | MI | | — |
| | 215 |
| | 1,794 |
| | — |
| | 2,009 |
| | (393 | ) | | 2/7/2014 | | 1997 |
| DaVita Dialysis | | Clinton | | MO | | — |
| | 128 |
| | 896 |
| | — |
| | 1,024 |
| | (124 | ) | | 2/26/2014 | | 2003 | | Clinton | | MO | | — |
| | 128 |
| | 896 |
| | — |
| | 1,024 |
| | (211 | ) | | 2/26/2014 | | 2003 |
| DaVita Dialysis | | St. Pauls | | NC | | — |
| | 138 |
| | 1,246 |
| | — |
| | 1,384 |
| | (198 | ) | | 8/2/2013 | | 2006 | | St. Pauls | | NC | | — |
| | 138 |
| | 1,246 |
| | — |
| | 1,384 |
| | (306 | ) | | 8/2/2013 | | 2006 |
| DaVita Dialysis | | Lawrenceville | | NJ | | — |
| | 633 |
| | 2,757 |
| | — |
| | 3,390 |
| | (347 | ) | | 2/7/2014 | | 2009 | | Akron | | OH | | — |
| | 312 |
| | 1,994 |
| | — |
| | 2,306 |
| | (433 | ) | | 3/31/2014 | | 1932 |
| DaVita Dialysis | | Akron | | OH | | — |
| | 312 |
| | 1,994 |
| | — |
| | 2,306 |
| | (252 | ) | | 3/31/2014 | | 1932 | | Cincinnati | | OH | | — |
| | 219 |
| | 878 |
| | 55 |
| | 1,152 |
| | (229 | ) | | 3/28/2013 | | 2008 |
| DaVita Dialysis | | Cincinnati | | OH | | — |
| | 219 |
| | 878 |
| | (3 | ) | | 1,094 |
| | (156 | ) | | 3/28/2013 | | 2008 | | Georgetown | | OH | | — |
| | 125 |
| | 706 |
| | (1 | ) | | 830 |
| | (182 | ) | | 3/28/2013 | | 2009 |
| DaVita Dialysis | | Georgetown | | OH | | — |
| | 125 |
| | 706 |
| | (1 | ) | | 830 |
| | (125 | ) | | 3/28/2013 | | 2009 | | Willow Grove | | PA | | — |
| | 311 |
| | 3,886 |
| | 51 |
| | 4,248 |
| | (776 | ) | | 2/7/2014 | | 1989 |
| DaVita Dialysis | | Willow Grove | | PA | | — |
| | 311 |
| | 3,886 |
| | 14 |
| | 4,211 |
| | (457 | ) | | 2/7/2014 | | 1989 | | Hartsville | | SC | | — |
| | 126 |
| | 1,136 |
| | — |
| | 1,262 |
| | (288 | ) | | 5/30/2013 | | 2013 |
| DaVita Dialysis | | Hartsville | | SC | | — |
| | 126 |
| | 1,136 |
| | — |
| | 1,262 |
| | (194 | ) | | 5/30/2013 | | 2013 | | Beeville | | TX | | — |
| | 99 |
| | 1,879 |
| | — |
| | 1,978 |
| | (559 | ) | | 12/31/2012 | | 1979 |
| DaVita Dialysis | | Beeville | | TX | | — |
| | 99 |
| | 1,879 |
| | — |
| | 1,978 |
| | (411 | ) | | 12/31/2012 | | 1979 | | Federal Way | | WA | | 17,751 |
| | 1,929 |
| | 22,357 |
| | — |
| | 24,286 |
| | (7,988 | ) | | 11/21/2012 | | 2000 |
| DaVita Dialysis | | Federal Way | | WA | | 17,751 |
| | 1,929 |
| | 22,357 |
| | — |
| | 24,286 |
| | (5,747 | ) | | 11/21/2012 | | 2000 | |
| Deals R Us | | Virginia Beach | | VA | | — |
| | 934 |
| | — |
| | (405 | ) | | 529 |
| | (1 | ) | | 2/21/2014 | | 1997 | |
| Denny's | | | Mesa | | AZ | | — |
| | 1,089 |
| | 891 |
| | — |
| | 1,980 |
| | (278 | ) | | 7/31/2013 | | 1994 |
| Denny's | | | Peoria | | AZ | | — |
| | 310 |
| | 457 |
| | — |
| | 767 |
| | (139 | ) | | 6/27/2013 | | 1995 |
| Denny's | | | Phoenix | | AZ | | — |
| | 825 |
| | 1,237 |
| | — |
| | 2,062 |
| | (386 | ) | | 7/31/2013 | | 2005 |
| Denny's | | | Scottsdale | | AZ | | — |
| | 736 |
| | 491 |
| | — |
| | 1,227 |
| | (153 | ) | | 7/31/2013 | | 1980 |
| | | | | | Initial Costs (1) | | Costs Capitalized Subsequent to Acquisition (2) | | Gross Amount
Carried at
December 31, 2016
(3) (4) | | | | | | Initial Costs (1) | | Costs Capitalized Subsequent to Acquisition (2) | | Gross Amount
Carried at
December 31, 2018
(3) (4) | | | |
| Property | | City | | State | | Encumbrances at
December 31, 2016 | | Land | | Buildings, Fixtures and Improvements | | Accumulated Depreciation
(3) (5) | | Date Acquired | | Date of Construction | | City | | State | | Encumbrances at
December 31, 2018 | | Land | | Buildings, Fixtures and Improvements | | Accumulated Depreciation
(3) (5) | | Date Acquired | | Date of Construction |
| Del Monte | | Lathrop | | CA | | — |
| | — |
| | 41,318 |
| | — |
| | 41,318 |
| | (7,876 | ) | | 11/5/2013 | | 1993 | |
| Dell Perot Systems | | Lincoln | | NE | | — |
| | 2,812 |
| | 25,566 |
| | — |
| | 28,378 |
| | (3,442 | ) | | 2/7/2014 | | 2009 | |
| Denny's | | Mesa | | AZ | | — |
| | 1,089 |
| | 891 |
| | — |
| | 1,980 |
| | (183 | ) | | 7/31/2013 | | 1994 | |
| Denny's | | Peoria | | AZ | | — |
| | 310 |
| | 457 |
| | — |
| | 767 |
| | (93 | ) | | 6/27/2013 | | 1995 | |
| Denny's | | Phoenix | | AZ | | — |
| | 825 |
| | 1,237 |
| | — |
| | 2,062 |
| | (255 | ) | | 7/31/2013 | | 2005 | |
| Denny's | | Scottsdale | | AZ | | — |
| | 736 |
| | 491 |
| | — |
| | 1,227 |
| | (101 | ) | | 7/31/2013 | | 1980 | |
| Denny's | | Tempe | | AZ | | — |
| | 378 |
| | 245 |
| | — |
| | 623 |
| | (46 | ) | | 6/27/2013 | | 1980 | | Tempe | | AZ | | — |
| | 378 |
| | 245 |
| | — |
| | 623 |
| | (73 | ) | | 6/27/2013 | | 1980 |
| Denny's | | Tempe | | AZ | | — |
| | 1,567 |
| | 844 |
| | — |
| | 2,411 |
| | (174 | ) | | 7/31/2013 | | 1995 | | Tempe | | AZ | | — |
| | 1,567 |
| | 844 |
| | — |
| | 2,411 |
| | (263 | ) | | 7/31/2013 | | 1995 |
| Denny's | | Idaho Falls | | ID | | — |
| | 196 |
| | 432 |
| | — |
| | 628 |
| | (75 | ) | | 6/27/2013 | | 1995 | | Idaho Falls | | ID | | — |
| | 196 |
| | 432 |
| | — |
| | 628 |
| | (124 | ) | | 6/27/2013 | | 1995 |
| Denny's | | Merriam | | KS | | — |
| | 390 |
| | 1,150 |
| | — |
| | 1,540 |
| | (228 | ) | | 6/27/2013 | | 1995 | | Merriam | | KS | | — |
| | 390 |
| | 1,150 |
| | — |
| | 1,540 |
| | (346 | ) | | 6/27/2013 | | 1995 |
| Denny's | | Topeka | | KS | | — |
| | 630 |
| | 446 |
| | — |
| | 1,076 |
| | (89 | ) | | 6/27/2013 | | 1995 | | Topeka | | KS | | — |
| | 630 |
| | 446 |
| | — |
| | 1,076 |
| | (134 | ) | | 6/27/2013 | | 1995 |
| Denny's | | Bloomington | | MN | | — |
| | 1,184 |
| | — |
| | — |
| | 1,184 |
| | — |
| | 7/31/2013 | | 1995 | | Bloomington | | MN | | — |
| | 1,184 |
| | — |
| | — |
| | 1,184 |
| | — |
| | 7/31/2013 | | 1995 |
| Denny's | | Branson | | MO | | — |
| | 620 |
| | 2,209 |
| | — |
| | 2,829 |
| | (438 | ) | | 6/27/2013 | | 1995 | | Branson | | MO | | — |
| | 620 |
| | 2,209 |
| | — |
| | 2,829 |
| | (665 | ) | | 6/27/2013 | | 1995 |
| Denny's | | Kansas City | | MO | | — |
| | 750 |
| | 686 |
| | — |
| | 1,436 |
| | (136 | ) | | 6/27/2013 | | 1995 | | Kansas City | | MO | | — |
| | 750 |
| | 686 |
| | — |
| | 1,436 |
| | (207 | ) | | 6/27/2013 | | 1995 |
| Denny's | | N. Kansas City | | MO | | — |
| | 630 |
| | 937 |
| | — |
| | 1,567 |
| | (186 | ) | | 6/27/2013 | | 1995 | | N. Kansas City | | MO | | — |
| | 630 |
| | 937 |
| | — |
| | 1,567 |
| | (282 | ) | | 6/27/2013 | | 1995 |
| Denny's | | Sedalia | | MO | | — |
| | 500 |
| | 783 |
| | — |
| | 1,283 |
| | (155 | ) | | 6/27/2013 | | 1995 | | Sedalia | | MO | | — |
| | 500 |
| | 783 |
| | — |
| | 1,283 |
| | (236 | ) | | 6/27/2013 | | 1995 |
| Denny's | | Black Mountain | | NC | | — |
| | 210 |
| | 505 |
| | — |
| | 715 |
| | (100 | ) | | 6/27/2013 | | 1995 | | Black Mountain | | NC | | — |
| | 210 |
| | 505 |
| | — |
| | 715 |
| | (152 | ) | | 6/27/2013 | | 1995 |
| Denny's | | Mooresville | | NC | | — |
| | 250 |
| | 841 |
| | — |
| | 1,091 |
| | (167 | ) | | 6/27/2013 | | 1995 | | Mooresville | | NC | | — |
| | 250 |
| | 841 |
| | — |
| | 1,091 |
| | (253 | ) | | 6/27/2013 | | 1995 |
| Denny's | | Henrietta | | NY | | — |
| | 361 |
| | 241 |
| | — |
| | 602 |
| | (50 | ) | | 7/31/2013 | | 1970 | | Henrietta | | NY | | — |
| | 361 |
| | 241 |
| | — |
| | 602 |
| | (75 | ) | | 7/31/2013 | | 1970 |
| Denny's | | Watertown | | NY | | — |
| | 330 |
| | 1,107 |
| | — |
| | 1,437 |
| | (220 | ) | | 6/27/2013 | | 1995 | | Watertown | | NY | | — |
| | 330 |
| | 1,107 |
| | — |
| | 1,437 |
| | (333 | ) | | 6/27/2013 | | 1995 |
| Denny's | | Fremont | | OH | | — |
| | 320 |
| | 975 |
| | — |
| | 1,295 |
| | (193 | ) | | 6/27/2013 | | 1995 | | Fremont | | OH | | — |
| | 320 |
| | 975 |
| | — |
| | 1,295 |
| | (293 | ) | | 6/27/2013 | | 1995 |
| Denny's | | Marion | | OH | | — |
| | 115 |
| | 390 |
| | — |
| | 505 |
| | (79 | ) | | 6/27/2013 | | 1989 | | Marion | | OH | | — |
| | 115 |
| | 390 |
| | — |
| | 505 |
| | (118 | ) | | 6/27/2013 | | 1989 |
| Denny's | | Ontario | | OR | | — |
| | 240 |
| | 1,067 |
| | — |
| | 1,307 |
| | (212 | ) | | 6/27/2013 | | 1995 | | Ontario | | OR | | — |
| | 240 |
| | 1,067 |
| | — |
| | 1,307 |
| | (321 | ) | | 6/27/2013 | | 1995 |
| Denny's | | Greenville | | SC | | — |
| | 570 |
| | 554 |
| | — |
| | 1,124 |
| | (110 | ) | | 6/27/2013 | | 1995 | | Greenville | | SC | | — |
| | 570 |
| | 554 |
| | — |
| | 1,124 |
| | (167 | ) | | 6/27/2013 | | 1995 |
| Denny's | | Pasadena | | TX | | — |
| | 500 |
| | 1,316 |
| | — |
| | 1,816 |
| | (261 | ) | | 6/27/2013 | | 1995 | | Pasadena | | TX | | — |
| | 500 |
| | 1,316 |
| | — |
| | 1,816 |
| | (396 | ) | | 6/27/2013 | | 1995 |
| Dick's Sporting Goods | | Fort Gratiot | | MI | | — |
| | 722 |
| | 7,743 |
| | — |
| | 8,465 |
| | (1,246 | ) | | 2/7/2014 | | 2010 | | Fort Gratiot | | MI | | — |
| | 722 |
| | 7,743 |
| | — |
| | 8,465 |
| | (2,113 | ) | | 2/7/2014 | | 2010 |
| Dick's Sporting Goods | | Moore | | OK | | — |
| | 1,243 |
| | 10,426 |
| | — |
| | 11,669 |
| | (1,650 | ) | | 2/7/2014 | | 2012 | | Moore | | OK | | — |
| | 1,243 |
| | 10,426 |
| | — |
| | 11,669 |
| | (2,798 | ) | | 2/7/2014 | | 2012 |
| Dick's Sporting Goods | | Charleston | | SC | | — |
| | 3,733 |
| | 5,025 |
| | — |
| | 8,758 |
| | (837 | ) | | 2/7/2014 | | 2005 | | Charleston | | SC | | — |
| | 3,733 |
| | 5,025 |
| | — |
| | 8,758 |
| | (1,419 | ) | | 2/7/2014 | | 2005 |
| Dick's Sporting Goods | | Jackson | | TN | | — |
| | 1,346 |
| | 6,106 |
| | — |
| | 7,452 |
| | (975 | ) | | 2/7/2014 | | 2007 | | Jackson | | TN | | — |
| | 1,346 |
| | 6,106 |
| | — |
| | 7,452 |
| | (1,633 | ) | | 2/7/2014 | | 2007 |
| DJO, LLC | | Vista | | CA | | — |
| | 3,732 |
| | 16,868 |
| | — |
| | 20,600 |
| | (5,642 | ) | | 8/15/2014 | | 2006 | | Vista | | CA | | — |
| | 3,732 |
| | 16,868 |
| | — |
| | 20,600 |
| | (10,384 | ) | | 8/15/2014 | | 2006 |
| Dollar General | | Andalusia | | AL | | — |
| | 317 |
| | 914 |
| | — |
| | 1,231 |
| | (61 | ) | | 7/24/2014 | | 2014 | | Andalusia | | AL | | — |
| | 317 |
| | 914 |
| | 9 |
| | 1,240 |
| | (111 | ) | | 7/24/2014 | | 2014 |
| Dollar General | | Birmingham | | AL | | — |
| | 156 |
| | 882 |
| | — |
| | 1,038 |
| | (225 | ) | | 6/6/2012 | | 2012 | | Birmingham | | AL | | — |
| | 156 |
| | 882 |
| | — |
| | 1,038 |
| | (286 | ) | | 6/6/2012 | | 2012 |
| Dollar General | | | Bremen | | AL | | — |
| | 59 |
| | 1,017 |
| | — |
| | 1,076 |
| | (214 | ) | | 9/29/2014 | | 2014 |
| Dollar General | | | Butler | | AL | | — |
| | 338 |
| | 1,093 |
| | — |
| | 1,431 |
| | (297 | ) | | 3/28/2014 | | 2014 |
| Dollar General | | | Childersburg | | AL | | — |
| | 328 |
| | 986 |
| | — |
| | 1,314 |
| | (273 | ) | | 2/7/2014 | | 2013 |
| Dollar General | | | Chunchula | | AL | | — |
| | 174 |
| | 697 |
| | — |
| | 871 |
| | (229 | ) | | 4/26/2012 | | 2012 |
| Dollar General | | | Cullman | | AL | | — |
| | 331 |
| | 780 |
| | — |
| | 1,111 |
| | (212 | ) | | 3/28/2014 | | 2013 |
| Dollar General | | | Cullman | | AL | | — |
| | 221 |
| | 861 |
| | — |
| | 1,082 |
| | (165 | ) | | 9/26/2014 | | 2014 |
| | | | | | Initial Costs (1) | | Costs Capitalized Subsequent to Acquisition (2) | | Gross Amount
Carried at
December 31, 2016
(3) (4) | | | | | | Initial Costs (1) | | Costs Capitalized Subsequent to Acquisition (2) | | Gross Amount
Carried at
December 31, 2018
(3) (4) | | | |
| Property | | City | | State | | Encumbrances at
December 31, 2016 | | Land | | Buildings, Fixtures and Improvements | | Accumulated Depreciation
(3) (5) | | Date Acquired | | Date of Construction | | City | | State | | Encumbrances at
December 31, 2018 | | Land | | Buildings, Fixtures and Improvements | | Accumulated Depreciation
(3) (5) | | Date Acquired | | Date of Construction |
| Dollar General | | Bremen | | AL | | — |
| | 59 |
| | 1,017 |
| | — |
| | 1,076 |
| | (116 | ) | | 9/29/2014 | | 2014 | | Frisco City | | AL | | — |
| | 121 |
| | 836 |
| | — |
| | 957 |
| | (231 | ) | | 2/26/2014 | | 2014 |
| Dollar General | | Butler | | AL | | — |
| | 338 |
| | 1,093 |
| | — |
| | 1,431 |
| | (173 | ) | | 3/28/2014 | | 2014 | | Gardendale | | AL | | — |
| | 142 |
| | 805 |
| | — |
| | 947 |
| | (257 | ) | | 8/9/2012 | | 2012 |
| Dollar General | | Childersburg | | AL | | — |
| | 328 |
| | 986 |
| | — |
| | 1,314 |
| | (161 | ) | | 2/7/2014 | | 2013 | | Hartselle | | AL | | — |
| | 473 |
| | 983 |
| | — |
| | 1,456 |
| | (273 | ) | | 2/7/2014 | | 2013 |
| Dollar General | | Chunchula | | AL | | — |
| | 174 |
| | 697 |
| | — |
| | 871 |
| | (184 | ) | | 4/26/2012 | | 2012 | | Headland | | AL | | — |
| | 387 |
| | 1,091 |
| | — |
| | 1,478 |
| | (222 | ) | | 8/13/2014 | | 2014 |
| Dollar General | | Cullman | | AL | | — |
| | 331 |
| | 780 |
| | — |
| | 1,111 |
| | (124 | ) | | 3/28/2014 | | 2013 | | Mobile | | AL | | — |
| | 207 |
| | 1,039 |
| | — |
| | 1,246 |
| | (284 | ) | | 2/7/2014 | | 2013 |
| Dollar General | | Cullman | | AL | | — |
| | 221 |
| | 861 |
| | — |
| | 1,082 |
| | (89 | ) | | 9/26/2014 | | 2014 | | Moulton | | AL | | — |
| | 517 |
| | 1,207 |
| | — |
| | 1,724 |
| | (397 | ) | | 4/26/2012 | | 2012 |
| Dollar General | | Frisco City | | AL | | — |
| | 121 |
| | 836 |
| | — |
| | 957 |
| | (136 | ) | | 2/26/2014 | | 2014 | | Mt. Vernon | | AL | | — |
| | 260 |
| | 1,402 |
| | — |
| | 1,662 |
| | (386 | ) | | 2/7/2014 | | 2013 |
| Dollar General | | Gardendale | | AL | | — |
| | 142 |
| | 805 |
| | — |
| | 947 |
| | (198 | ) | | 8/9/2012 | | 2012 | | Ohatchee | | AL | | — |
| | 97 |
| | 942 |
| | — |
| | 1,039 |
| | (207 | ) | | 4/17/2014 | | 2014 |
| Dollar General | | Hartselle | | AL | | — |
| | 473 |
| | 983 |
| | — |
| | 1,456 |
| | (161 | ) | | 2/7/2014 | | 2013 | | Phenix City | | AL | | — |
| | 267 |
| | 929 |
| | — |
| | 1,196 |
| | (252 | ) | | 2/7/2014 | | 2012 |
| Dollar General | | Headland | | AL | | — |
| | 387 |
| | 1,091 |
| | — |
| | 1,478 |
| | (120 | ) | | 8/13/2014 | | 2014 | | Phenix City | | AL | | — |
| | 386 |
| | 1,104 |
| | — |
| | 1,490 |
| | (304 | ) | | 2/7/2014 | | 2013 |
| Dollar General | | Mobile | | AL | | — |
| | 207 |
| | 1,039 |
| | — |
| | 1,246 |
| | (167 | ) | | 2/7/2014 | | 2013 | | Red Level | | AL | | 300 |
| | 120 |
| | 680 |
| | — |
| | 800 |
| | (233 | ) | | 10/31/2011 | | 2010 |
| Dollar General | | Moulton | | AL | | — |
| | 517 |
| | 1,207 |
| | — |
| | 1,724 |
| | (319 | ) | | 4/26/2012 | | 2012 | | Sylacauga | | AL | | — |
| | 120 |
| | 968 |
| | — |
| | 1,088 |
| | (262 | ) | | 2/7/2014 | | 2013 |
| Dollar General | | Mt. Vernon | | AL | | — |
| | 260 |
| | 1,402 |
| | — |
| | 1,662 |
| | (228 | ) | | 2/7/2014 | | 2013 | | Tarrant | | AL | | — |
| | 217 |
| | 869 |
| | — |
| | 1,086 |
| | (294 | ) | | 12/12/2011 | | 2011 |
| Dollar General | | Ohatchee | | AL | | — |
| | 97 |
| | 942 |
| | — |
| | 1,039 |
| | (119 | ) | | 4/17/2014 | | 2014 | | Troy | | AL | | — |
| | 67 |
| | 963 |
| | — |
| | 1,030 |
| | (263 | ) | | 2/7/2014 | | 2013 |
| Dollar General | | Phenix City | | AL | | — |
| | 267 |
| | 929 |
| | — |
| | 1,196 |
| | (149 | ) | | 2/7/2014 | | 2012 | | Tuscaloosa | | AL | | 300 |
| | 133 |
| | 756 |
| | — |
| | 889 |
| | (256 | ) | | 12/30/2011 | | 2011 |
| Dollar General | | Phenix City | | AL | | — |
| | 386 |
| | 1,104 |
| | — |
| | 1,490 |
| | (179 | ) | | 2/7/2014 | | 2013 | | Vance | | AL | | — |
| | 191 |
| | 731 |
| | — |
| | 922 |
| | (199 | ) | | 3/28/2014 | | 2014 |
| Dollar General | | Red Level | | AL | | 300 |
| | 120 |
| | 680 |
| | — |
| | 800 |
| | (195 | ) | | 10/31/2011 | | 2010 | | Ash Flat | | AR | | — |
| | 44 |
| | 132 |
| | 25 |
| | 201 |
| | (43 | ) | | 6/19/2012 | | 1997 |
| Dollar General | | Sylacauga | | AL | | — |
| | 120 |
| | 968 |
| | — |
| | 1,088 |
| | (155 | ) | | 2/7/2014 | | 2013 | | Batesville | | AR | | — |
| | 32 |
| | 285 |
| | 7 |
| | 324 |
| | (84 | ) | | 7/25/2013 | | 1998 |
| Dollar General | | Tarrant | | AL | | — |
| | 217 |
| | 869 |
| | — |
| | 1,086 |
| | (245 | ) | | 12/12/2011 | | 2011 | | Batesville | | AR | | — |
| | 42 |
| | 374 |
| | 78 |
| | 494 |
| | (112 | ) | | 7/25/2013 | | 1999 |
| Dollar General | | Troy | | AL | | — |
| | 67 |
| | 963 |
| | — |
| | 1,030 |
| | (155 | ) | | 2/7/2014 | | 2013 | | Beebe | | AR | | — |
| | 51 |
| | 478 |
| | 52 |
| | 581 |
| | (138 | ) | | 7/25/2013 | | 1999 |
| Dollar General | | Tuscaloosa | | AL | | 300 |
| | 133 |
| | 756 |
| | — |
| | 889 |
| | (213 | ) | | 12/30/2011 | | 2011 | | Bella Vista | | AR | | — |
| | 129 |
| | 302 |
| | 35 |
| | 466 |
| | (103 | ) | | 11/10/2011 | | 2005 |
| Dollar General | | Vance | | AL | | — |
| | 191 |
| | 731 |
| | — |
| | 922 |
| | (116 | ) | | 3/28/2014 | | 2014 | | Bergman | | AR | | — |
| | 113 |
| | 639 |
| | — |
| | 752 |
| | (206 | ) | | 7/2/2012 | | 2011 |
| Dollar General | | Ash Flat | | AR | | — |
| | 44 |
| | 132 |
| | (2 | ) | | 174 |
| | (33 | ) | | 6/19/2012 | | 1997 | | Blytheville | | AR | | — |
| | 30 |
| | 285 |
| | 50 |
| | 365 |
| | (85 | ) | | 7/25/2013 | | 2000 |
| Dollar General | | Batesville | | AR | | — |
| | 32 |
| | 285 |
| | — |
| | 317 |
| | (55 | ) | | 7/25/2013 | | 1998 | | Carlisle | | AR | | — |
| | 13 |
| | 245 |
| | (2 | ) | | 256 |
| | (83 | ) | | 11/10/2011 | | 2005 |
| Dollar General | | Batesville | | AR | | — |
| | 42 |
| | 374 |
| | 11 |
| | 427 |
| | (73 | ) | | 7/25/2013 | | 1999 | | Des Arc | | AR | | — |
| | 56 |
| | 508 |
| | 53 |
| | 617 |
| | (153 | ) | | 7/25/2013 | | 1999 |
| Dollar General | | Beebe | | AR | | — |
| | 51 |
| | 478 |
| | — |
| | 529 |
| | (90 | ) | | 7/25/2013 | | 1999 | | Dumas | | AR | | — |
| | 46 |
| | 412 |
| | 24 |
| | 482 |
| | (122 | ) | | 7/25/2013 | | 2000 |
| Dollar General | | Bella Vista | | AR | | — |
| | 129 |
| | 302 |
| | — |
| | 431 |
| | (86 | ) | | 11/10/2011 | | 2005 | | Flippin | | AR | | — |
| | 53 |
| | 64 |
| | 1 |
| | 118 |
| | (21 | ) | | 6/19/2012 | | 1994 |
| Dollar General | | Bergman | | AR | | — |
| | 113 |
| | 639 |
| | — |
| | 752 |
| | (160 | ) | | 7/2/2012 | | 2011 | | Gassville | | AR | | — |
| | 54 |
| | 325 |
| | 21 |
| | 400 |
| | (94 | ) | | 7/25/2013 | | 1999 |
| Dollar General | | Blytheville | | AR | | — |
| | 30 |
| | 285 |
| | — |
| | 315 |
| | (54 | ) | | 7/25/2013 | | 2000 | | Green Forest | | AR | | — |
| | 52 |
| | 303 |
| | 38 |
| | 393 |
| | (104 | ) | | 11/10/2011 | | 2005 |
| Dollar General | | Carlisle | | AR | | — |
| | 13 |
| | 245 |
| | (2 | ) | | 256 |
| | (69 | ) | | 11/10/2011 | | 2005 | | Higden | | AR | | — |
| | 52 |
| | 469 |
| | 80 |
| | 601 |
| | (142 | ) | | 7/25/2013 | | 1995 |
| Dollar General | | Des Arc | | AR | | — |
| | 56 |
| | 508 |
| | — |
| | 564 |
| | (99 | ) | | 7/25/2013 | | 1999 | | Lake Village | | AR | | — |
| | 64 |
| | 362 |
| | 29 |
| | 455 |
| | (108 | ) | | 7/25/2013 | | 1995 |
| Dollar General | | Dumas | | AR | | — |
| | 46 |
| | 412 |
| | — |
| | 458 |
| | (80 | ) | | 7/25/2013 | | 2000 | | Lepanto | | AR | | — |
| | 43 |
| | 389 |
| | — |
| | 432 |
| | (114 | ) | | 7/25/2013 | | 1995 |
| | | | | | Initial Costs (1) | | Costs Capitalized Subsequent to Acquisition (2) | | Gross Amount
Carried at
December 31, 2016
(3) (4) | | | | | | Initial Costs (1) | | Costs Capitalized Subsequent to Acquisition (2) | | Gross Amount
Carried at
December 31, 2018
(3) (4) | | | |
| Property | | City | | State | | Encumbrances at
December 31, 2016 | | Land | | Buildings, Fixtures and Improvements | | Accumulated Depreciation
(3) (5) | | Date Acquired | | Date of Construction | | City | | State | | Encumbrances at
December 31, 2018 | | Land | | Buildings, Fixtures and Improvements | | Accumulated Depreciation
(3) (5) | | Date Acquired | | Date of Construction |
| Dollar General | | Flippin | | AR | | — |
| | 53 |
| | 64 |
| | (1 | ) | | 116 |
| | (16 | ) | | 6/19/2012 | | 1994 | | Little Rock | | AR | | — |
| | 73 |
| | 412 |
| | 13 |
| | 498 |
| | (121 | ) | | 7/25/2013 | | 1995 |
| Dollar General | | Gassville | | AR | | — |
| | 54 |
| | 325 |
| | — |
| | 379 |
| | (62 | ) | | 7/25/2013 | | 1999 | | Marvell | | AR | | — |
| | 40 |
| | 364 |
| | 107 |
| | 511 |
| | (112 | ) | | 7/25/2013 | | 1995 |
| Dollar General | | Green Forest | | AR | | — |
| | 52 |
| | 303 |
| | — |
| | 355 |
| | (85 | ) | | 11/10/2011 | | 2005 | | Maynard | | AR | | — |
| | 73 |
| | 654 |
| | — |
| | 727 |
| | (203 | ) | | 12/4/2012 | | 1995 |
| Dollar General | | Higden | | AR | | — |
| | 52 |
| | 469 |
| | — |
| | 521 |
| | (91 | ) | | 7/25/2013 | | 1995 | | Mcgehee | | AR | | — |
| | 25 |
| | 228 |
| | 29 |
| | 282 |
| | (69 | ) | | 7/25/2013 | | 1998 |
| Dollar General | | Lake Village | | AR | | — |
| | 64 |
| | 362 |
| | — |
| | 426 |
| | (70 | ) | | 7/25/2013 | | 1995 | | Quitman | | AR | | — |
| | 45 |
| | 426 |
| | — |
| | 471 |
| | (122 | ) | | 7/25/2013 | | 2001 |
| Dollar General | | Lepanto | | AR | | — |
| | 43 |
| | 389 |
| | — |
| | 432 |
| | (76 | ) | | 7/25/2013 | | 1995 | | Searcy | | AR | | — |
| | 29 |
| | 263 |
| | 65 |
| | 357 |
| | (79 | ) | | 7/25/2013 | | 1998 |
| Dollar General | | Little Rock | | AR | | — |
| | 73 |
| | 412 |
| | — |
| | 485 |
| | (80 | ) | | 7/25/2013 | | 1995 | | Tuckerman | | AR | | — |
| | 49 |
| | 280 |
| | 80 |
| | 409 |
| | (88 | ) | | 7/25/2013 | | 1999 |
| Dollar General | | Marvell | | AR | | — |
| | 40 |
| | 364 |
| | — |
| | 404 |
| | (70 | ) | | 7/25/2013 | | 1995 | | White Hall | | AR | | — |
| | 43 |
| | 388 |
| | — |
| | 431 |
| | (114 | ) | | 7/25/2013 | | 1999 |
| Dollar General | | Maynard | | AR | | — |
| | 73 |
| | 654 |
| | — |
| | 727 |
| | (149 | ) | | 12/4/2012 | | 1995 | | Wooster | | AR | | — |
| | 74 |
| | 664 |
| | — |
| | 738 |
| | (206 | ) | | 12/4/2012 | | 1995 |
| Dollar General | | Mcgehee | | AR | | — |
| | 25 |
| | 228 |
| | — |
| | 253 |
| | (44 | ) | | 7/25/2013 | | 1998 | | Grand Ridge | | FL | | 300 |
| | 76 |
| | 684 |
| | — |
| | 760 |
| | (231 | ) | | 12/30/2011 | | 2010 |
| Dollar General | | Quitman | | AR | | — |
| | 45 |
| | 426 |
| | — |
| | 471 |
| | (80 | ) | | 7/25/2013 | | 2001 | | Kissimmee | | FL | | 970 |
| | 643 |
| | 1,071 |
| | — |
| | 1,714 |
| | (268 | ) | | 2/7/2014 | | 2011 |
| Dollar General | | Searcy | | AR | | — |
| | 29 |
| | 263 |
| | — |
| | 292 |
| | (51 | ) | | 7/25/2013 | | 1998 | | Lakeland | | FL | | — |
| | 413 |
| | 1,810 |
| | — |
| | 2,223 |
| | (484 | ) | | 2/7/2014 | | 2012 |
| Dollar General | | Tuckerman | | AR | | — |
| | 49 |
| | 280 |
| | — |
| | 329 |
| | (54 | ) | | 7/25/2013 | | 1999 | | Molino | | FL | | 400 |
| | 178 |
| | 1,007 |
| | — |
| | 1,185 |
| | (345 | ) | | 10/31/2011 | | 2011 |
| Dollar General | | White Hall | | AR | | — |
| | 43 |
| | 388 |
| | — |
| | 431 |
| | (75 | ) | | 7/25/2013 | | 1999 | | Palatka | | FL | | — |
| | 113 |
| | 1,196 |
| | — |
| | 1,309 |
| | (311 | ) | | 5/7/2014 | | 2013 |
| Dollar General | | Wooster | | AR | | — |
| | 74 |
| | 664 |
| | — |
| | 738 |
| | (151 | ) | | 12/4/2012 | | 1995 | | Panama City | | FL | | — |
| | 139 |
| | 312 |
| | 1 |
| | 452 |
| | (92 | ) | | 6/19/2012 | | 1987 |
| Dollar General | | Grand Ridge | | FL | | 300 |
| | 76 |
| | 684 |
| | — |
| | 760 |
| | (193 | ) | | 12/30/2011 | | 2010 | | Guyton | | GA | | — |
| | 213 |
| | 852 |
| | — |
| | 1,065 |
| | (252 | ) | | 6/3/2013 | | 2011 |
| Dollar General | | Lakeland | | FL | | — |
| | 413 |
| | 1,810 |
| | — |
| | 2,223 |
| | (286 | ) | | 2/7/2014 | | 2012 | | Lyerly | | GA | | — |
| | 251 |
| | 992 |
| | — |
| | 1,243 |
| | (267 | ) | | 2/7/2014 | | 2012 |
| Dollar General | | Molino | | FL | | 400 |
| | 178 |
| | 1,007 |
| | — |
| | 1,185 |
| | (289 | ) | | 10/31/2011 | | 2011 | | Shiloh | | GA | | — |
| | 150 |
| | 743 |
| | — |
| | 893 |
| | (218 | ) | | 8/13/2014 | | 2014 |
| Dollar General | | Palatka | | FL | | — |
| | 113 |
| | 1,196 |
| | — |
| | 1,309 |
| | (176 | ) | | 5/7/2014 | | 2013 | | Thomaston | | GA | | — |
| | 308 |
| | 972 |
| | — |
| | 1,280 |
| | (268 | ) | | 2/7/2014 | | 2013 |
| Dollar General | | Panama City | | FL | | — |
| | 139 |
| | 312 |
| | — |
| | 451 |
| | (71 | ) | | 6/19/2012 | | 1987 | | Cedar Falls | | IA | | — |
| | 96 |
| | 862 |
| | — |
| | 958 |
| | (251 | ) | | 8/28/2013 | | 2013 |
| Dollar General | | Guyton | | GA | | — |
| | 213 |
| | 852 |
| | — |
| | 1,065 |
| | (169 | ) | | 6/3/2013 | | 2011 | | Center Point | | IA | | — |
| | 136 |
| | 772 |
| | — |
| | 908 |
| | (240 | ) | | 12/31/2012 | | 2012 |
| Dollar General | | Lyerly | | GA | | — |
| | 251 |
| | 992 |
| | — |
| | 1,243 |
| | (158 | ) | | 2/7/2014 | | 2012 | | Chariton | | IA | | — |
| | 165 |
| | 934 |
| | — |
| | 1,099 |
| | (298 | ) | | 8/31/2012 | | 2012 |
| Dollar General | | Shiloh | | GA | | — |
| | 150 |
| | 743 |
| | — |
| | 893 |
| | (118 | ) | | 8/13/2014 | | 2014 | | Eagle Grove | | IA | | — |
| | 100 |
| | 902 |
| | — |
| | 1,002 |
| | (265 | ) | | 7/9/2013 | | 2013 |
| Dollar General | | Thomaston | | GA | | — |
| | 308 |
| | 972 |
| | — |
| | 1,280 |
| | (158 | ) | | 2/7/2014 | | 2013 | | Estherville | | IA | | — |
| | 226 |
| | 903 |
| | — |
| | 1,129 |
| | (284 | ) | | 10/25/2012 | | 2012 |
| Dollar General | | Cedar Falls | | IA | | — |
| | 96 |
| | 862 |
| | — |
| | 958 |
| | (163 | ) | | 8/28/2013 | | 2013 | | Hampton | | IA | | — |
| | 188 |
| | 751 |
| | — |
| | 939 |
| | (250 | ) | | 2/1/2012 | | 2012 |
| Dollar General | | Center Point | | IA | | — |
| | 136 |
| | 772 |
| | — |
| | 908 |
| | (175 | ) | | 12/31/2012 | | 2012 | | Lake Mills | | IA | | — |
| | 81 |
| | 728 |
| | — |
| | 809 |
| | (243 | ) | | 2/1/2012 | | 2012 |
| Dollar General | | Chariton | | IA | | — |
| | 165 |
| | 934 |
| | — |
| | 1,099 |
| | (229 | ) | | 8/31/2012 | | 2012 | | Nashua | | IA | | — |
| | 136 |
| | 768 |
| | — |
| | 904 |
| | (244 | ) | | 9/6/2012 | | 2012 |
| Dollar General | | Eagle Grove | | IA | | — |
| | 100 |
| | 902 |
| | — |
| | 1,002 |
| | (175 | ) | | 7/9/2013 | | 2013 | |
| Dollar General | | Estherville | | IA | | — |
| | 226 |
| | 903 |
| | — |
| | 1,129 |
| | (213 | ) | | 10/25/2012 | | 2012 | |
| Dollar General | | Hampton | | IA | | — |
| | 188 |
| | 751 |
| | — |
| | 939 |
| | (206 | ) | | 2/1/2012 | | 2012 | |
| Dollar General | | Lake Mills | | IA | | — |
| | 81 |
| | 728 |
| | — |
| | 809 |
| | (199 | ) | | 2/1/2012 | | 2012 | |
| Dollar General | | Nashua | | IA | | — |
| | 136 |
| | 768 |
| | — |
| | 904 |
| | (185 | ) | | 9/6/2012 | | 2012 | |
| | | | | | Initial Costs (1) | | Costs Capitalized Subsequent to Acquisition (2) | | Gross Amount
Carried at
December 31, 2016
(3) (4) | | | | | | Initial Costs (1) | | Costs Capitalized Subsequent to Acquisition (2) | | Gross Amount
Carried at
December 31, 2018
(3) (4) | | | |
| Property | | City | | State | | Encumbrances at
December 31, 2016 | | Land | | Buildings, Fixtures and Improvements | | Accumulated Depreciation
(3) (5) | | Date Acquired | | Date of Construction | | City | | State | | Encumbrances at
December 31, 2018 | | Land | | Buildings, Fixtures and Improvements | | Accumulated Depreciation
(3) (5) | | Date Acquired | | Date of Construction |
| Dollar General | | Ottumwa | | IA | | — |
| | 143 |
| | 812 |
| | — |
| | 955 |
| | (181 | ) | | 1/31/2013 | | 2012 | | Ottumwa | | IA | | — |
| | 143 |
| | 812 |
| | — |
| | 955 |
| | (250 | ) | | 1/31/2013 | | 2012 |
| Dollar General | | Altamont | | IL | | 531 |
| | 211 |
| | 844 |
| | — |
| | 1,055 |
| | (227 | ) | | 3/9/2012 | | 2012 | | Altamont | | IL | | — |
| | 211 |
| | 844 |
| | — |
| | 1,055 |
| | (280 | ) | | 3/9/2012 | | 2012 |
| Dollar General | | Carthage | | IL | | — |
| | 48 |
| | 908 |
| | — |
| | 956 |
| | (223 | ) | | 8/31/2012 | | 2012 | | Carthage | | IL | | — |
| | 48 |
| | 908 |
| | — |
| | 956 |
| | (290 | ) | | 8/31/2012 | | 2012 |
| Dollar General | | Desoto | | IL | | — |
| | 138 |
| | 784 |
| | — |
| | 922 |
| | (167 | ) | | 3/26/2013 | | 2013 | | Desoto | | IL | | — |
| | 138 |
| | 784 |
| | — |
| | 922 |
| | (238 | ) | | 3/26/2013 | | 2013 |
| Dollar General | | Fairbury | | IL | | — |
| | 96 |
| | 867 |
| | — |
| | 963 |
| | (173 | ) | | 6/7/2013 | | 2013 | | Fairbury | | IL | | — |
| | 96 |
| | 867 |
| | — |
| | 963 |
| | (257 | ) | | 6/7/2013 | | 2013 |
| Dollar General | | Galatia | | IL | | — |
| | 87 |
| | 1,008 |
| | — |
| | 1,095 |
| | (103 | ) | | 7/29/2014 | | 2014 | | Galatia | | IL | | — |
| | 87 |
| | 1,008 |
| | — |
| | 1,095 |
| | (186 | ) | | 7/29/2014 | | 2014 |
| Dollar General | | Henry | | IL | | — |
| | 104 |
| | 934 |
| | — |
| | 1,038 |
| | (190 | ) | | 5/23/2013 | | 2013 | | Henry | | IL | | — |
| | 104 |
| | 934 |
| | — |
| | 1,038 |
| | (279 | ) | | 5/23/2013 | | 2013 |
| Dollar General | | Jacksonville | | IL | | — |
| | 145 |
| | 823 |
| | — |
| | 968 |
| | (202 | ) | | 8/31/2012 | | 2012 | | Jacksonville | | IL | | — |
| | 145 |
| | 823 |
| | — |
| | 968 |
| | (263 | ) | | 8/31/2012 | | 2012 |
| Dollar General | | Jonesboro | | IL | | — |
| | 77 |
| | 309 |
| | — |
| | 386 |
| | (88 | ) | | 11/10/2011 | | 2007 | | Jonesboro | | IL | | — |
| | 77 |
| | 309 |
| | — |
| | 386 |
| | (105 | ) | | 11/10/2011 | | 2007 |
| Dollar General | | Lexington | | IL | | — |
| | 100 |
| | 899 |
| | — |
| | 999 |
| | (217 | ) | | 9/21/2012 | | 2012 | | Lexington | | IL | | — |
| | 100 |
| | 899 |
| | — |
| | 999 |
| | (285 | ) | | 9/21/2012 | | 2012 |
| Dollar General | | Mackinaw | | IL | | — |
| | 149 |
| | 1,011 |
| | — |
| | 1,160 |
| | (165 | ) | | 2/25/2014 | | 2013 | | Mackinaw | | IL | | — |
| | 149 |
| | 1,011 |
| | — |
| | 1,160 |
| | (280 | ) | | 2/25/2014 | | 2013 |
| Dollar General | | Mahomet | | IL | | — |
| | 292 |
| | 877 |
| | — |
| | 1,169 |
| | (166 | ) | | 8/22/2013 | | 2013 | | Mahomet | | IL | | — |
| | 292 |
| | 877 |
| | — |
| | 1,169 |
| | (255 | ) | | 8/22/2013 | | 2013 |
| Dollar General | | Marion | | IL | | — |
| | 153 |
| | 867 |
| | — |
| | 1,020 |
| | (209 | ) | | 9/24/2012 | | 1995 | | Marion | | IL | | — |
| | 153 |
| | 867 |
| | — |
| | 1,020 |
| | (275 | ) | | 9/24/2012 | | 1995 |
| Dollar General | | Minonk | | IL | | — |
| | 56 |
| | 1,034 |
| | — |
| | 1,090 |
| | (108 | ) | | 7/2/2014 | | 2014 | | Minonk | | IL | | — |
| | 56 |
| | 1,034 |
| | — |
| | 1,090 |
| | (196 | ) | | 7/2/2014 | | 2014 |
| Dollar General | | Mount Morris | | IL | | — |
| | 97 |
| | 877 |
| | — |
| | 974 |
| | (199 | ) | | 12/17/2012 | | 2012 | | Mount Morris | | IL | | — |
| | 97 |
| | 877 |
| | — |
| | 974 |
| | (272 | ) | | 12/17/2012 | | 2012 |
| Dollar General | | Park Forest | | IL | | — |
| | 390 |
| | 1,036 |
| | — |
| | 1,426 |
| | (99 | ) | | 8/1/2014 | | 2013 | | Park Forest | | IL | | — |
| | 390 |
| | 1,036 |
| | — |
| | 1,426 |
| | (183 | ) | | 8/1/2014 | | 2013 |
| Dollar General | | Pittsburg | | IL | | — |
| | 97 |
| | 915 |
| | — |
| | 1,012 |
| | (144 | ) | | 3/31/2014 | | 2014 | | Pittsburg | | IL | | — |
| | 97 |
| | 915 |
| | — |
| | 1,012 |
| | (248 | ) | | 3/31/2014 | | 2014 |
| Dollar General | | Rockford | | IL | | — |
| | 464 |
| | 597 |
| | 27 |
| | 1,088 |
| | (68 | ) | | 6/18/2014 | | 2014 | | Rockford | | IL | | — |
| | 464 |
| | 597 |
| | 27 |
| | 1,088 |
| | (125 | ) | | 6/18/2014 | | 2014 |
| Dollar General | | Roodhouse | | IL | | — |
| | 207 |
| | 829 |
| | — |
| | 1,036 |
| | (188 | ) | | 12/31/2012 | | 1995 | | Roodhouse | | IL | | — |
| | 207 |
| | 829 |
| | — |
| | 1,036 |
| | (257 | ) | | 12/31/2012 | | 1995 |
| Dollar General | | Savanna | | IL | | — |
| | 273 |
| | 1,093 |
| | — |
| | 1,366 |
| | (248 | ) | | 12/31/2012 | | 2012 | | Savanna | | IL | | — |
| | 273 |
| | 1,093 |
| | — |
| | 1,366 |
| | (339 | ) | | 12/31/2012 | | 2012 |
| Dollar General | | South Pekin | | IL | | — |
| | 104 |
| | 933 |
| | — |
| | 1,037 |
| | (177 | ) | | 8/14/2013 | | 2013 | | South Pekin | | IL | | — |
| | 104 |
| | 933 |
| | — |
| | 1,037 |
| | (272 | ) | | 8/14/2013 | | 2013 |
| Dollar General | | Bainbridge | | IN | | — |
| | 131 |
| | 765 |
| | — |
| | 896 |
| | (77 | ) | | 9/22/2014 | | 2010 | | Bainbridge | | IN | | — |
| | 131 |
| | 765 |
| | — |
| | 896 |
| | (144 | ) | | 9/22/2014 | | 2010 |
| Dollar General | | Medaryville | | IN | | — |
| | 96 |
| | 914 |
| | — |
| | 1,010 |
| | (151 | ) | | 7/31/2014 | | 2014 | | Medaryville | | IN | | — |
| | 96 |
| | 914 |
| | — |
| | 1,010 |
| | (273 | ) | | 7/31/2014 | | 2014 |
| Dollar General | | Monroeville | | IN | | — |
| | 112 |
| | 636 |
| | — |
| | 748 |
| | (179 | ) | | 12/22/2011 | | 2011 | | Monroeville | | IN | | — |
| | 112 |
| | 636 |
| | — |
| | 748 |
| | (215 | ) | | 12/22/2011 | | 2011 |
| Dollar General | | Porter | | IN | | — |
| | 243 |
| | 995 |
| | — |
| | 1,238 |
| | (70 | ) | | 5/29/2014 | | 2014 | | Porter | | IN | | — |
| | 243 |
| | 995 |
| | — |
| | 1,238 |
| | (124 | ) | | 5/29/2014 | | 2014 |
| Dollar General | | Rensselaer | | IN | | — |
| | 111 |
| | 957 |
| | — |
| | 1,068 |
| | (111 | ) | | 7/30/2014 | | 2014 | | Rensselaer | | IN | | — |
| | 111 |
| | 957 |
| | — |
| | 1,068 |
| | (202 | ) | | 7/30/2014 | | 2014 |
| Dollar General | | Richland | | IN | | — |
| | 156 |
| | 887 |
| | — |
| | 1,043 |
| | (70 | ) | | 4/30/2014 | | 2014 | | Richland | | IN | | — |
| | 156 |
| | 887 |
| | — |
| | 1,043 |
| | (122 | ) | | 4/30/2014 | | 2014 |
| Dollar General | | Schneider | | IN | | — |
| | 124 |
| | 1,010 |
| | — |
| | 1,134 |
| | (100 | ) | | 9/17/2014 | | 2014 | | Schneider | | IN | | — |
| | 124 |
| | 1,010 |
| | — |
| | 1,134 |
| | (186 | ) | | 9/17/2014 | | 2014 |
| Dollar General | | Auburn | | KS | | — |
| | 42 |
| | 801 |
| | — |
| | 843 |
| | (197 | ) | | 8/31/2012 | | 2009 | | Auburn | | KS | | — |
| | 42 |
| | 801 |
| | — |
| | 843 |
| | (256 | ) | | 8/31/2012 | | 2009 |
| Dollar General | | Cottonwood Falls | | KS | | — |
| | 89 |
| | 802 |
| | — |
| | 891 |
| | (197 | ) | | 8/31/2012 | | 2009 | | Cottonwood Falls | | KS | | — |
| | 89 |
| | 802 |
| | — |
| | 891 |
| | (256 | ) | | 8/31/2012 | | 2009 |
| Dollar General | | Erie | | KS | | — |
| | 42 |
| | 790 |
| | — |
| | 832 |
| | (194 | ) | | 8/31/2012 | | 2009 | | Erie | | KS | | — |
| | 42 |
| | 790 |
| | — |
| | 832 |
| | (252 | ) | | 8/31/2012 | | 2009 |
| Dollar General | | Garden City | | KS | | — |
| | 136 |
| | 771 |
| | — |
| | 907 |
| | (189 | ) | | 8/31/2012 | | 2010 | | Garden City | | KS | | — |
| | 136 |
| | 771 |
| | — |
| | 907 |
| | (246 | ) | | 8/31/2012 | | 2010 |
| | | | | | Initial Costs (1) | | Costs Capitalized Subsequent to Acquisition (2) | | Gross Amount
Carried at
December 31, 2016
(3) (4) | | | | | | Initial Costs (1) | | Costs Capitalized Subsequent to Acquisition (2) | | Gross Amount
Carried at
December 31, 2018
(3) (4) | | | |
| Property | | City | | State | | Encumbrances at
December 31, 2016 | | Land | | Buildings, Fixtures and Improvements | | Accumulated Depreciation
(3) (5) | | Date Acquired | | Date of Construction | | City | | State | | Encumbrances at
December 31, 2018 | | Land | | Buildings, Fixtures and Improvements | | Accumulated Depreciation
(3) (5) | | Date Acquired | | Date of Construction |
| Dollar General | | Harper | | KS | | — |
| | 91 |
| | 818 |
| | — |
| | 909 |
| | (201 | ) | | 8/31/2012 | | 2009 | | Harper | | KS | | — |
| | 91 |
| | 818 |
| | — |
| | 909 |
| | (261 | ) | | 8/31/2012 | | 2009 |
| Dollar General | | Humboldt | | KS | | — |
| | 44 |
| | 828 |
| | — |
| | 872 |
| | (203 | ) | | 8/31/2012 | | 2010 | | Humboldt | | KS | | — |
| | 44 |
| | 828 |
| | — |
| | 872 |
| | (264 | ) | | 8/31/2012 | | 2010 |
| Dollar General | | Kingman | | KS | | — |
| | 142 |
| | 804 |
| | — |
| | 946 |
| | (198 | ) | | 8/31/2012 | | 2010 | | Kingman | | KS | | — |
| | 142 |
| | 804 |
| | — |
| | 946 |
| | (257 | ) | | 8/31/2012 | | 2010 |
| Dollar General | | Medicine Lodge | | KS | | — |
| | 40 |
| | 765 |
| | — |
| | 805 |
| | (188 | ) | | 8/31/2012 | | 2010 | | Medicine Lodge | | KS | | — |
| | 40 |
| | 765 |
| | — |
| | 805 |
| | (244 | ) | | 8/31/2012 | | 2010 |
| Dollar General | | Minneapolis | | KS | | — |
| | 43 |
| | 816 |
| | — |
| | 859 |
| | (200 | ) | | 8/31/2012 | | 2010 | | Minneapolis | | KS | | — |
| | 43 |
| | 816 |
| | — |
| | 859 |
| | (261 | ) | | 8/31/2012 | | 2010 |
| Dollar General | | Pomona | | KS | | — |
| | 42 |
| | 796 |
| | — |
| | 838 |
| | (195 | ) | | 8/31/2012 | | 2010 | | Pomona | | KS | | — |
| | 42 |
| | 796 |
| | — |
| | 838 |
| | (254 | ) | | 8/31/2012 | | 2010 |
| Dollar General | | Sedan | | KS | | — |
| | 42 |
| | 792 |
| | — |
| | 834 |
| | (195 | ) | | 8/31/2012 | | 2009 | | Sedan | | KS | | — |
| | 42 |
| | 792 |
| | — |
| | 834 |
| | (253 | ) | | 8/31/2012 | | 2009 |
| Dollar General | | Syracuse | | KS | | — |
| | 43 |
| | 817 |
| | — |
| | 860 |
| | (201 | ) | | 8/31/2012 | | 2010 | | Syracuse | | KS | | — |
| | 43 |
| | 817 |
| | — |
| | 860 |
| | (261 | ) | | 8/31/2012 | | 2010 |
| Dollar General | | Berea | | KY | | — |
| | 138 |
| | 781 |
| | — |
| | 919 |
| | (159 | ) | | 5/30/2013 | | 2012 | | Berea | | KY | | — |
| | 138 |
| | 781 |
| | — |
| | 919 |
| | (233 | ) | | 5/30/2013 | | 2012 |
| Dollar General | | Coldiron | | KY | | — |
| | 187 |
| | 747 |
| | — |
| | 934 |
| | (152 | ) | | 5/30/2013 | | 2013 | | Coldiron | | KY | | — |
| | 187 |
| | 747 |
| | — |
| | 934 |
| | (223 | ) | | 5/30/2013 | | 2013 |
| Dollar General | | East Bernstadt | | KY | | — |
| | 141 |
| | 799 |
| | — |
| | 940 |
| | (163 | ) | | 5/30/2013 | | 2012 | | East Bernstadt | | KY | | — |
| | 141 |
| | 799 |
| | — |
| | 940 |
| | (238 | ) | | 5/30/2013 | | 2012 |
| Dollar General | | Eubank | | KY | | — |
| | 137 |
| | 775 |
| | — |
| | 912 |
| | (158 | ) | | 5/30/2013 | | 2013 | | Eubank | | KY | | — |
| | 137 |
| | 775 |
| | — |
| | 912 |
| | (231 | ) | | 5/30/2013 | | 2013 |
| Dollar General | | Monticello | | KY | | — |
| | 251 |
| | 867 |
| | — |
| | 1,118 |
| | (132 | ) | | 4/25/2014 | | 2012 | | Monticello | | KY | | — |
| | 251 |
| | 867 |
| | — |
| | 1,118 |
| | (229 | ) | | 4/25/2014 | | 2012 |
| Dollar General | | Nancy | | KY | | — |
| | 81 |
| | 733 |
| | — |
| | 814 |
| | (194 | ) | | 4/26/2012 | | 2011 | | Nancy | | KY | | — |
| | 81 |
| | 733 |
| | — |
| | 814 |
| | (241 | ) | | 4/26/2012 | | 2011 |
| Dollar General | | Whitesburg | | KY | | — |
| | 211 |
| | 845 |
| | — |
| | 1,056 |
| | (172 | ) | | 5/30/2013 | | 2012 | | Whitesburg | | KY | | — |
| | 211 |
| | 845 |
| | — |
| | 1,056 |
| | (252 | ) | | 5/30/2013 | | 2012 |
| Dollar General | | Bastrop | | LA | | — |
| | 148 |
| | 838 |
| | — |
| | 986 |
| | (163 | ) | | 7/1/2013 | | 2013 | | Bastrop | | LA | | — |
| | 148 |
| | 838 |
| | — |
| | 986 |
| | (246 | ) | | 7/1/2013 | | 2013 |
| Dollar General | | Choudrant | | LA | | 300 |
| | 83 |
| | 745 |
| | — |
| | 828 |
| | (204 | ) | | 2/6/2012 | | 2011 | | Choudrant | | LA | | 300 |
| | 83 |
| | 745 |
| | — |
| | 828 |
| | (249 | ) | | 2/6/2012 | | 2011 |
| Dollar General | | Converse | | LA | | — |
| | 84 |
| | 756 |
| | — |
| | 840 |
| | (182 | ) | | 9/26/2012 | | 2012 | | Converse | | LA | | — |
| | 84 |
| | 756 |
| | — |
| | 840 |
| | (240 | ) | | 9/26/2012 | | 2012 |
| Dollar General | | Doyline | | LA | | — |
| | 88 |
| | 793 |
| | — |
| | 881 |
| | (184 | ) | | 11/27/2012 | | 2012 | | Doyline | | LA | | — |
| | 88 |
| | 793 |
| | — |
| | 881 |
| | (248 | ) | | 11/27/2012 | | 2012 |
| Dollar General | | Gardner | | LA | | 457 |
| | 138 |
| | 784 |
| | — |
| | 922 |
| | (211 | ) | | 3/8/2012 | | 2012 | | Gardner | | LA | | — |
| | 138 |
| | 784 |
| | — |
| | 922 |
| | (260 | ) | | 3/8/2012 | | 2012 |
| Dollar General | | Grambling | | LA | | — |
| | 597 |
| | 719 |
| | — |
| | 1,316 |
| | (122 | ) | | 2/7/2014 | | 2012 | | Grambling | | LA | | — |
| | 597 |
| | 719 |
| | — |
| | 1,316 |
| | (208 | ) | | 2/7/2014 | | 2012 |
| Dollar General | | Jonesville | | LA | | — |
| | 103 |
| | 929 |
| | — |
| | 1,032 |
| | (224 | ) | | 9/27/2012 | | 2012 | | Jonesville | | LA | | — |
| | 103 |
| | 929 |
| | — |
| | 1,032 |
| | (295 | ) | | 9/27/2012 | | 2012 |
| Dollar General | | Keithville | | LA | | — |
| | 83 |
| | 750 |
| | — |
| | 833 |
| | (188 | ) | | 7/26/2012 | | 2012 | | Keithville | | LA | | — |
| | 83 |
| | 750 |
| | — |
| | 833 |
| | (242 | ) | | 7/26/2012 | | 2012 |
| Dollar General | | Lake Charles | | LA | | — |
| | 102 |
| | 919 |
| | — |
| | 1,021 |
| | (252 | ) | | 2/29/2012 | | 2012 | | Lake Charles | | LA | | — |
| | 102 |
| | 919 |
| | — |
| | 1,021 |
| | (306 | ) | | 2/29/2012 | | 2012 |
| Dollar General | | Lake Charles | | LA | | — |
| | 406 |
| | 770 |
| | — |
| | 1,176 |
| | (126 | ) | | 2/7/2014 | | 2012 | | Lake Charles | | LA | | — |
| | 406 |
| | 770 |
| | — |
| | 1,176 |
| | (213 | ) | | 2/7/2014 | | 2012 |
| Dollar General | | Mangham | | LA | | 300 |
| | 40 |
| | 759 |
| | — |
| | 799 |
| | (208 | ) | | 2/6/2012 | | 2011 | | Mangham | | LA | | 300 |
| | 40 |
| | 759 |
| | — |
| | 799 |
| | (253 | ) | | 2/6/2012 | | 2011 |
| Dollar General | | Mount Hermon | | LA | | 400 |
| | 94 |
| | 842 |
| | — |
| | 936 |
| | (231 | ) | | 2/6/2012 | | 2009 | | Monroe | | LA | | 400 |
| | 97 |
| | 869 |
| | — |
| | 966 |
| | (290 | ) | | 2/6/2012 | | 2011 |
| Dollar General | | New Iberia | | LA | | — |
| | 315 |
| | 736 |
| | — |
| | 1,051 |
| | (195 | ) | | 4/26/2012 | | 2011 | | Mount Hermon | | LA | | 400 |
| | 94 |
| | 842 |
| | — |
| | 936 |
| | (281 | ) | | 2/6/2012 | | 2009 |
| Dollar General | | Patterson | | LA | | — |
| | 259 |
| | 1,035 |
| | — |
| | 1,294 |
| | (274 | ) | | 4/26/2012 | | 2011 | | New Iberia | | LA | | — |
| | 315 |
| | 736 |
| | — |
| | 1,051 |
| | (242 | ) | | 4/26/2012 | | 2011 |
| Dollar General | | Monroe | | LA | | 400 |
| | 97 |
| | 869 |
| | — |
| | 966 |
| | (238 | ) | | 2/6/2012 | | 2011 | | Patterson | | LA | | — |
| | 259 |
| | 1,035 |
| | — |
| | 1,294 |
| | (340 | ) | | 4/26/2012 | | 2011 |
| Dollar General | | Sarepta | | LA | | — |
| | 131 |
| | 743 |
| | — |
| | 874 |
| | (183 | ) | | 8/9/2012 | | 2011 | | Sarepta | | LA | | — |
| | 131 |
| | 743 |
| | — |
| | 874 |
| | (238 | ) | | 8/9/2012 | | 2011 |
| Dollar General | | St. Martinville | | LA | | — |
| | 175 |
| | 1,028 |
| | — |
| | 1,203 |
| | (167 | ) | | 2/7/2014 | | 2012 | | St. Martinville | | LA | | — |
| | 175 |
| | 1,028 |
| | — |
| | 1,203 |
| | (284 | ) | | 2/7/2014 | | 2012 |
| | | | | | Initial Costs (1) | | Costs Capitalized Subsequent to Acquisition (2) | | Gross Amount
Carried at
December 31, 2016
(3) (4) | | | | | | Initial Costs (1) | | Costs Capitalized Subsequent to Acquisition (2) | | Gross Amount
Carried at
December 31, 2018
(3) (4) | | | |
| Property | | City | | State | | Encumbrances at
December 31, 2016 | | Land | | Buildings, Fixtures and Improvements | | Accumulated Depreciation
(3) (5) | | Date Acquired | | Date of Construction | | City | | State | | Encumbrances at
December 31, 2018 | | Land | | Buildings, Fixtures and Improvements | | Accumulated Depreciation
(3) (5) | | Date Acquired | | Date of Construction |
| Dollar General | | Thibodaux | | LA | | — |
| | 234 |
| | 1,146 |
| | — |
| | 1,380 |
| | (188 | ) | | 2/7/2014 | | 2012 | | Thibodaux | | LA | | — |
| | 234 |
| | 1,146 |
| | — |
| | 1,380 |
| | (318 | ) | | 2/7/2014 | | 2012 |
| Dollar General | | West Monroe | | LA | | — |
| | 153 |
| | 869 |
| | — |
| | 1,022 |
| | (234 | ) | | 3/9/2012 | | 1995 | | West Monroe | | LA | | — |
| | 153 |
| | 869 |
| | — |
| | 1,022 |
| | (288 | ) | | 3/9/2012 | | 1995 |
| Dollar General | | Zachary | | LA | | — |
| | 248 |
| | 743 |
| | — |
| | 991 |
| | (197 | ) | | 4/26/2012 | | 2011 | | Zachary | | LA | | — |
| | 248 |
| | 743 |
| | — |
| | 991 |
| | (244 | ) | | 4/26/2012 | | 2011 |
| Dollar General | | Adams | | MA | | — |
| | 254 |
| | 1,016 |
| | — |
| | 1,270 |
| | (183 | ) | | 10/10/2013 | | 2012 | | Adams | | MA | | — |
| | 254 |
| | 1,016 |
| | — |
| | 1,270 |
| | (291 | ) | | 10/10/2013 | | 2012 |
| Dollar General | | Bangor | | MI | | — |
| | 173 |
| | 691 |
| | — |
| | 864 |
| | (173 | ) | | 7/10/2012 | | 2012 | | Bangor | | MI | | — |
| | 173 |
| | 691 |
| | — |
| | 864 |
| | (222 | ) | | 7/10/2012 | | 2012 |
| Dollar General | | Bronson | | MI | | — |
| | 97 |
| | 436 |
| | — |
| | 533 |
| | (115 | ) | | 8/6/2014 | | 1965 | | Bronson | | MI | | — |
| | 97 |
| | 436 |
| | — |
| | 533 |
| | (211 | ) | | 8/6/2014 | | 1965 |
| Dollar General | | Cadillac | | MI | | 467 |
| | 187 |
| | 747 |
| | — |
| | 934 |
| | (201 | ) | | 3/16/2012 | | 2012 | | Cadillac | | MI | | — |
| | 187 |
| | 747 |
| | — |
| | 934 |
| | (247 | ) | | 3/16/2012 | | 2012 |
| Dollar General | | Camden | | MI | | — |
| | 138 |
| | 781 |
| | — |
| | 919 |
| | (170 | ) | | 2/27/2013 | | 2013 | | Camden | | MI | | — |
| | 138 |
| | 781 |
| | — |
| | 919 |
| | (238 | ) | | 2/27/2013 | | 2013 |
| Dollar General | | Carleton | | MI | | 445 |
| | 222 |
| | 666 |
| | — |
| | 888 |
| | (179 | ) | | 3/16/2012 | | 2011 | | Carleton | | MI | | — |
| | 222 |
| | 666 |
| | — |
| | 888 |
| | (221 | ) | | 3/16/2012 | | 2011 |
| Dollar General | | Covert | | MI | | — |
| | 37 |
| | 704 |
| | — |
| | 741 |
| | (173 | ) | | 8/30/2012 | | 2012 | | Covert | | MI | | — |
| | 37 |
| | 704 |
| | — |
| | 741 |
| | (225 | ) | | 8/30/2012 | | 2012 |
| Dollar General | | Durand | | MI | | 455 |
| | 181 |
| | 726 |
| | — |
| | 907 |
| | (189 | ) | | 5/18/2012 | | 2012 | | Durand | | MI | | — |
| | 181 |
| | 726 |
| | — |
| | 907 |
| | (237 | ) | | 5/18/2012 | | 2012 |
| Dollar General | | East Jordan | | MI | | — |
| | 125 |
| | 709 |
| | — |
| | 834 |
| | (178 | ) | | 7/10/2012 | | 2012 | | East Jordan | | MI | | — |
| | 125 |
| | 709 |
| | — |
| | 834 |
| | (228 | ) | | 7/10/2012 | | 2012 |
| Dollar General | | Flint | | MI | | 416 |
| | 83 |
| | 743 |
| | — |
| | 826 |
| | (193 | ) | | 5/18/2012 | | 2012 | | Flint | | MI | | — |
| | 83 |
| | 743 |
| | — |
| | 826 |
| | (243 | ) | | 5/18/2012 | | 2012 |
| Dollar General | | Flint | | MI | | — |
| | 91 |
| | 820 |
| | — |
| | 911 |
| | (194 | ) | | 10/31/2012 | | 2012 | | Flint | | MI | | — |
| | 91 |
| | 820 |
| | — |
| | 911 |
| | (258 | ) | | 10/31/2012 | | 2012 |
| Dollar General | | Gaylord | | MI | | — |
| | 172 |
| | 687 |
| | — |
| | 859 |
| | (172 | ) | | 7/10/2012 | | 2012 | | Gaylord | | MI | | — |
| | 172 |
| | 687 |
| | — |
| | 859 |
| | (221 | ) | | 7/10/2012 | | 2012 |
| Dollar General | | Iron River | | MI | | — |
| | 86 |
| | 777 |
| | — |
| | 863 |
| | (191 | ) | | 8/30/2012 | | 2012 | | Iron River | | MI | | — |
| | 86 |
| | 777 |
| | — |
| | 863 |
| | (248 | ) | | 8/30/2012 | | 2012 |
| Dollar General | | Manchester | | MI | | — |
| | 213 |
| | 853 |
| | — |
| | 1,066 |
| | (186 | ) | | 2/27/2013 | | 2013 | | Manchester | | MI | | — |
| | 213 |
| | 853 |
| | — |
| | 1,066 |
| | (261 | ) | | 2/27/2013 | | 2013 |
| Dollar General | | Manistique | | MI | | — |
| | 155 |
| | 876 |
| | — |
| | 1,031 |
| | (191 | ) | | 2/27/2013 | | 2012 | | Manistique | | MI | | — |
| | 155 |
| | 876 |
| | — |
| | 1,031 |
| | (268 | ) | | 2/27/2013 | | 2012 |
| Dollar General | | Melvindale | | MI | | — |
| | 242 |
| | 967 |
| | — |
| | 1,209 |
| | (247 | ) | | 6/26/2012 | | 2012 | | Melvindale | | MI | | — |
| | 242 |
| | 967 |
| | — |
| | 1,209 |
| | (314 | ) | | 6/26/2012 | | 2012 |
| Dollar General | | Mount Morris | | MI | | — |
| | 110 |
| | 988 |
| | — |
| | 1,098 |
| | (215 | ) | | 2/27/2013 | | 2012 | | Mount Morris | | MI | | — |
| | 110 |
| | 988 |
| | — |
| | 1,098 |
| | (302 | ) | | 2/27/2013 | | 2012 |
| Dollar General | | Negaunee | | MI | | — |
| | 87 |
| | 779 |
| | — |
| | 866 |
| | (191 | ) | | 8/30/2012 | | 2012 | | Negaunee | | MI | | — |
| | 87 |
| | 779 |
| | — |
| | 866 |
| | (249 | ) | | 8/30/2012 | | 2012 |
| Dollar General | | Rapid City | | MI | | — |
| | 179 |
| | 716 |
| | — |
| | 895 |
| | (156 | ) | | 2/27/2013 | | 2012 | | Rapid City | | MI | | — |
| | 179 |
| | 716 |
| | — |
| | 895 |
| | (219 | ) | | 2/27/2013 | | 2012 |
| Dollar General | | Romulus | | MI | | — |
| | 199 |
| | 794 |
| | — |
| | 993 |
| | (173 | ) | | 2/27/2013 | | 2011 | | Romulus | | MI | | — |
| | 199 |
| | 794 |
| | — |
| | 993 |
| | (243 | ) | | 2/27/2013 | | 2011 |
| Dollar General | | Roscommon | | MI | | — |
| | 87 |
| | 781 |
| | — |
| | 868 |
| | (192 | ) | | 8/30/2012 | | 2012 | | Roscommon | | MI | | — |
| | 87 |
| | 781 |
| | — |
| | 868 |
| | (250 | ) | | 8/30/2012 | | 2012 |
| Dollar General | | Wakefield | | MI | | — |
| | 88 |
| | 794 |
| | — |
| | 882 |
| | (180 | ) | | 12/19/2012 | | 2012 | | Wakefield | | MI | | — |
| | 88 |
| | 794 |
| | — |
| | 882 |
| | (246 | ) | | 12/19/2012 | | 2012 |
| Dollar General | | Albert Lea | | MN | | — |
| | 223 |
| | 551 |
| | (46 | ) | | 728 |
| | (64 | ) | | 5/30/2014 | | 1960 | | Albert Lea | | MN | | — |
| | 223 |
| | 551 |
| | 161 |
| | 935 |
| | (115 | ) | | 5/30/2014 | | 1960 |
| Dollar General | | Annandale | | MN | | — |
| | 212 |
| | 848 |
| | — |
| | 1,060 |
| | (161 | ) | | 8/2/2013 | | 2013 | | Annandale | | MN | | — |
| | 212 |
| | 848 |
| | — |
| | 1,060 |
| | (247 | ) | | 8/2/2013 | | 2013 |
| Dollar General | | Barnesville | | MN | | — |
| | 86 |
| | 841 |
| | — |
| | 927 |
| | (136 | ) | | 2/26/2014 | | 2014 | | Barnesville | | MN | | — |
| | 86 |
| | 841 |
| | — |
| | 927 |
| | (231 | ) | | 2/26/2014 | | 2014 |
| Dollar General | | Cohasset | | MN | | — |
| | 87 |
| | 964 |
| | — |
| | 1,051 |
| | (142 | ) | | 5/2/2014 | | 2013 | | Cohasset | | MN | | — |
| | 87 |
| | 964 |
| | — |
| | 1,051 |
| | (250 | ) | | 5/2/2014 | | 2013 |
| Dollar General | | Ely | | MN | | — |
| | 174 |
| | 944 |
| | — |
| | 1,118 |
| | (74 | ) | | 4/30/2014 | | 2014 | | Ely | | MN | | — |
| | 174 |
| | 944 |
| | — |
| | 1,118 |
| | (128 | ) | | 4/30/2014 | | 2014 |
| Dollar General | | Hawley | | MN | | — |
| | 89 |
| | 803 |
| | — |
| | 892 |
| | (145 | ) | | 10/16/2013 | | 2013 | | Hawley | | MN | | — |
| | 89 |
| | 803 |
| | — |
| | 892 |
| | (230 | ) | | 10/16/2013 | | 2013 |
| Dollar General | | Melrose | | MN | | — |
| | 96 |
| | 863 |
| | — |
| | 959 |
| | (196 | ) | | 12/17/2012 | | 2012 | | Melrose | | MN | | — |
| | 96 |
| | 863 |
| | — |
| | 959 |
| | (268 | ) | | 12/17/2012 | | 2012 |
| | | | | | Initial Costs (1) | | Costs Capitalized Subsequent to Acquisition (2) | | Gross Amount
Carried at
December 31, 2016
(3) (4) | | | | | | Initial Costs (1) | | Costs Capitalized Subsequent to Acquisition (2) | | Gross Amount
Carried at
December 31, 2018
(3) (4) | | | |
| Property | | City | | State | | Encumbrances at
December 31, 2016 | | Land | | Buildings, Fixtures and Improvements | | Accumulated Depreciation
(3) (5) | | Date Acquired | | Date of Construction | | City | | State | | Encumbrances at
December 31, 2018 | | Land | | Buildings, Fixtures and Improvements | | Accumulated Depreciation
(3) (5) | | Date Acquired | | Date of Construction |
| Dollar General | | Milaca | | MN | | — |
| | 102 |
| | 916 |
| | — |
| | 1,018 |
| | (169 | ) | | 9/24/2013 | | 2013 | | Milaca | | MN | | — |
| | 102 |
| | 916 |
| | — |
| | 1,018 |
| | (265 | ) | | 9/24/2013 | | 2013 |
| Dollar General | | Montgomery | | MN | | — |
| | 87 |
| | 783 |
| | — |
| | 870 |
| | (178 | ) | | 12/17/2012 | | 2012 | | Montgomery | | MN | | — |
| | 87 |
| | 783 |
| | — |
| | 870 |
| | (243 | ) | | 12/17/2012 | | 2012 |
| Dollar General | | Olivia | | MN | | — |
| | 98 |
| | 884 |
| | — |
| | 982 |
| | (197 | ) | | 1/31/2013 | | 2012 | | Olivia | | MN | | — |
| | 98 |
| | 884 |
| | — |
| | 982 |
| | (272 | ) | | 1/31/2013 | | 2012 |
| Dollar General | | Pequot Lakes | | MN | | — |
| | 155 |
| | 880 |
| | — |
| | 1,035 |
| | (167 | ) | | 8/22/2013 | | 2013 | | Pequot Lakes | | MN | | — |
| | 155 |
| | 880 |
| | — |
| | 1,035 |
| | (257 | ) | | 8/22/2013 | | 2013 |
| Dollar General | | Richmond | | MN | | — |
| | 96 |
| | 836 |
| | — |
| | 932 |
| | (135 | ) | | 2/20/2014 | | 2014 | | Richmond | | MN | | — |
| | 96 |
| | 836 |
| �� | — |
| | 932 |
| | (230 | ) | | 2/20/2014 | | 2014 |
| Dollar General | | Roseau | | MN | | — |
| | 143 |
| | 808 |
| | — |
| | 951 |
| | (146 | ) | | 10/30/2013 | | 2013 | | Roseau | | MN | | — |
| | 143 |
| | 808 |
| | — |
| | 951 |
| | (232 | ) | | 10/30/2013 | | 2013 |
| Dollar General | | Rush City | | MN | | — |
| | 126 |
| | 716 |
| | — |
| | 842 |
| | (179 | ) | | 7/25/2012 | | 2012 | | Rush City | | MN | | — |
| | 126 |
| | 716 |
| | — |
| | 842 |
| | (230 | ) | | 7/25/2012 | | 2012 |
| Dollar General | | Springfield | | MN | | — |
| | 88 |
| | 795 |
| | — |
| | 883 |
| | (180 | ) | | 12/26/2012 | | 2012 | | Springfield | | MN | | — |
| | 88 |
| | 795 |
| | — |
| | 883 |
| | (247 | ) | | 12/26/2012 | | 2012 |
| Dollar General | | Staples | | MN | | — |
| | 150 |
| | 848 |
| | — |
| | 998 |
| | (157 | ) | | 9/4/2013 | | 2013 | | Staples | | MN | | — |
| | 150 |
| | 848 |
| | — |
| | 998 |
| | (245 | ) | | 9/4/2013 | | 2013 |
| Dollar General | | Virginia | | MN | | — |
| | 147 |
| | 831 |
| | — |
| | 978 |
| | (185 | ) | | 1/14/2013 | | 2012 | | Virginia | | MN | | — |
| | 147 |
| | 831 |
| | — |
| | 978 |
| | (256 | ) | | 1/14/2013 | | 2012 |
| Dollar General | | Appleton City | | MO | | — |
| | 22 |
| | 124 |
| | — |
| | 146 |
| | (35 | ) | | 11/10/2011 | | 2004 | | Appleton City | | MO | | — |
| | 22 |
| | 124 |
| | — |
| | 146 |
| | (42 | ) | | 11/10/2011 | | 2004 |
| Dollar General | | Ash Grove | | MO | | — |
| | 35 |
| | 315 |
| | — |
| | 350 |
| | (90 | ) | | 11/10/2011 | | 2006 | | Ash Grove | | MO | | — |
| | 35 |
| | 315 |
| | — |
| | 350 |
| | (107 | ) | | 11/10/2011 | | 2006 |
| Dollar General | | Ashland | | MO | | — |
| | 70 |
| | 398 |
| | (5 | ) | | 463 |
| | (112 | ) | | 11/10/2011 | | 2006 | | Ashland | | MO | | — |
| | 70 |
| | 398 |
| | 135 |
| | 603 |
| | (139 | ) | | 11/10/2011 | | 2006 |
| Dollar General | | Aurora | | MO | | — |
| | 98 |
| | 881 |
| | — |
| | 979 |
| | (192 | ) | | 2/28/2013 | | 2013 | | Aurora | | MO | | — |
| | 98 |
| | 881 |
| | — |
| | 979 |
| | (269 | ) | | 2/28/2013 | | 2013 |
| Dollar General | | Auxvasse | | MO | | 300 |
| | 72 |
| | 650 |
| | — |
| | 722 |
| | (185 | ) | | 11/22/2011 | | 2011 | | Auxvasse | | MO | | 300 |
| | 72 |
| | 650 |
| | — |
| | 722 |
| | (221 | ) | | 11/22/2011 | | 2011 |
| Dollar General | | Belton | | MO | | — |
| | 105 |
| | 948 |
| | — |
| | 1,053 |
| | (233 | ) | | 8/3/2012 | | 2012 | | Belton | | MO | | — |
| | 105 |
| | 948 |
| | — |
| | 1,053 |
| | (303 | ) | | 8/3/2012 | | 2012 |
| Dollar General | | Berkeley | | MO | | — |
| | 132 |
| | 748 |
| | — |
| | 880 |
| | (177 | ) | | 10/9/2012 | | 2012 | | Berkeley | | MO | | — |
| | 132 |
| | 748 |
| | — |
| | 880 |
| | (236 | ) | | 10/9/2012 | | 2012 |
| Dollar General | | Bernie | | MO | | — |
| | 35 |
| | 314 |
| | — |
| | 349 |
| | (89 | ) | | 11/10/2011 | | 2007 | | Bernie | | MO | | — |
| | 35 |
| | 314 |
| | — |
| | 349 |
| | (107 | ) | | 11/10/2011 | | 2007 |
| Dollar General | | Billings | | MO | | — |
| | 139 |
| | 790 |
| | — |
| | 929 |
| | (142 | ) | | 10/17/2013 | | 2013 | | Billings | | MO | | — |
| | 139 |
| | 790 |
| | — |
| | 929 |
| | (226 | ) | | 10/17/2013 | | 2013 |
| Dollar General | | Bloomfield | | MO | | — |
| | 23 |
| | 215 |
| | — |
| | 238 |
| | (60 | ) | | 11/10/2011 | | 2005 | | Bloomfield | | MO | | — |
| | 23 |
| | 215 |
| | — |
| | 238 |
| | (72 | ) | | 11/10/2011 | | 2005 |
| Dollar General | | Cardwell | | MO | | — |
| | 89 |
| | 805 |
| | — |
| | 894 |
| | (198 | ) | | 8/24/2012 | | 2012 | | Cardwell | | MO | | — |
| | 89 |
| | 805 |
| | — |
| | 894 |
| | (257 | ) | | 8/24/2012 | | 2012 |
| Dollar General | | Carterville | | MO | | — |
| | 10 |
| | 192 |
| | — |
| | 202 |
| | (55 | ) | | 11/10/2011 | | 2004 | | Carterville | | MO | | — |
| | 10 |
| | 192 |
| | — |
| | 202 |
| | (65 | ) | | 11/10/2011 | | 2004 |
| Dollar General | | Caruthersville | | MO | | — |
| | 98 |
| | 878 |
| | — |
| | 976 |
| | (212 | ) | | 9/27/2012 | | 2012 | | Caruthersville | | MO | | — |
| | 98 |
| | 878 |
| | — |
| | 976 |
| | (279 | ) | | 9/27/2012 | | 2012 |
| Dollar General | | Caulfield | | MO | | — |
| | 139 |
| | 789 |
| | — |
| | 928 |
| | (179 | ) | | 12/31/2012 | | 2012 | | Caulfield | | MO | | — |
| | 139 |
| | 789 |
| | — |
| | 928 |
| | (245 | ) | | 12/31/2012 | | 2012 |
| Dollar General | | Clarkton | | MO | | — |
| | 19 |
| | 354 |
| | — |
| | 373 |
| | (101 | ) | | 11/10/2011 | | 2007 | | Clarkton | | MO | | — |
| | 19 |
| | 354 |
| | — |
| | 373 |
| | (121 | ) | | 11/10/2011 | | 2007 |
| Dollar General | | Clever | | MO | | — |
| | 136 |
| | 542 |
| | — |
| | 678 |
| | (138 | ) | | 6/19/2012 | | 2010 | | Clever | | MO | | — |
| | 136 |
| | 542 |
| | — |
| | 678 |
| | (176 | ) | | 6/19/2012 | | 2010 |
| Dollar General | | Conway | | MO | | 300 |
| | 37 |
| | 694 |
| | — |
| | 731 |
| | (197 | ) | | 11/22/2011 | | 2011 | | Conway | | MO | | 300 |
| | 37 |
| | 694 |
| | — |
| | 731 |
| | (236 | ) | | 11/22/2011 | | 2011 |
| Dollar General | | De Soto | | MO | | — |
| | 101 |
| | 912 |
| | — |
| | 1,013 |
| | (199 | ) | | 2/14/2013 | | 2013 | | De Soto | | MO | | — |
| | 101 |
| | 912 |
| | — |
| | 1,013 |
| | (279 | ) | | 2/14/2013 | | 2013 |
| Dollar General | | Diamond | | MO | | — |
| | 44 |
| | 175 |
| | — |
| | 219 |
| | (50 | ) | | 11/10/2011 | | 2005 | | Diamond | | MO | | — |
| | 44 |
| | 175 |
| | — |
| | 219 |
| | (60 | ) | | 11/10/2011 | | 2005 |
| Dollar General | | Doolittle | | MO | | — |
| | 137 |
| | 778 |
| | — |
| | 915 |
| | (148 | ) | | 8/2/2013 | | 2013 | | Doolittle | | MO | | — |
| | 137 |
| | 778 |
| | — |
| | 915 |
| | (227 | ) | | 8/2/2013 | | 2013 |
| Dollar General | | Eagle Rock | | MO | | — |
| | 133 |
| | 786 |
| | — |
| | 919 |
| | (127 | ) | | 2/26/2014 | | 2014 | | Eagle Rock | | MO | | — |
| | 133 |
| | 786 |
| | — |
| | 919 |
| | (216 | ) | | 2/26/2014 | | 2014 |
| Dollar General | �� | Edina | | MO | | — |
| | 127 |
| | 722 |
| | — |
| | 849 |
| | (174 | ) | | 9/13/2012 | | 2012 | | Edina | | MO | | — |
| | 127 |
| | 722 |
| | — |
| | 849 |
| | (229 | ) | | 9/13/2012 | | 2012 |
| | | | | | Initial Costs (1) | | Costs Capitalized Subsequent to Acquisition (2) | | Gross Amount
Carried at
December 31, 2016
(3) (4) | | | | | | Initial Costs (1) | | Costs Capitalized Subsequent to Acquisition (2) | | Gross Amount
Carried at
December 31, 2018
(3) (4) | | | |
| Property | | City | | State | | Encumbrances at
December 31, 2016 | | Land | | Buildings, Fixtures and Improvements | | Accumulated Depreciation
(3) (5) | | Date Acquired | | Date of Construction | | City | | State | | Encumbrances at
December 31, 2018 | | Land | | Buildings, Fixtures and Improvements | | Accumulated Depreciation
(3) (5) | | Date Acquired | | Date of Construction |
| Dollar General | | Eldon | | MO | | — |
| | 52 |
| | 986 |
| | — |
| | 1,038 |
| | (215 | ) | | 2/14/2013 | | 2013 | | Eldon | | MO | | — |
| | 52 |
| | 986 |
| | — |
| | 1,038 |
| | (301 | ) | | 2/14/2013 | | 2013 |
| Dollar General | | Ellsinore | | MO | | — |
| | 30 |
| | 579 |
| | — |
| | 609 |
| | (165 | ) | | 11/10/2011 | | 2010 | | Ellsinore | | MO | | — |
| | 30 |
| | 579 |
| | — |
| | 609 |
| | (197 | ) | | 11/10/2011 | | 2010 |
| Dollar General | | Gower | | MO | | — |
| | 118 |
| | 668 |
| | — |
| | 786 |
| | (164 | ) | | 8/31/2012 | | 2012 | | Gower | | MO | | — |
| | 118 |
| | 668 |
| | — |
| | 786 |
| | (214 | ) | | 8/31/2012 | | 2012 |
| Dollar General | | Hallsville | | MO | | — |
| | 29 |
| | 263 |
| | (6 | ) | | 286 |
| | (74 | ) | | 11/10/2011 | | 2004 | | Hallsville | | MO | | — |
| | 29 |
| | 263 |
| | (6 | ) | | 286 |
| | (88 | ) | | 11/10/2011 | | 2004 |
| Dollar General | | Hawk Point | | MO | | — |
| | 177 |
| | 709 |
| | — |
| | 886 |
| | (174 | ) | | 8/24/2012 | | 2012 | | Hawk Point | | MO | | — |
| | 177 |
| | 709 |
| | — |
| | 886 |
| | (226 | ) | | 8/24/2012 | | 2012 |
| Dollar General | | Humansville | | MO | | — |
| | 69 |
| | 277 |
| | — |
| | 346 |
| | (71 | ) | | 6/19/2012 | | 2007 | | Humansville | | MO | | — |
| | 69 |
| | 277 |
| | — |
| | 346 |
| | (90 | ) | | 6/19/2012 | | 2007 |
| Dollar General | | Jennings | | MO | | — |
| | 445 |
| | 826 |
| | — |
| | 1,271 |
| | (207 | ) | | 7/13/2012 | | 2012 | | Jennings | | MO | | — |
| | 445 |
| | 826 |
| | — |
| | 1,271 |
| | (266 | ) | | 7/13/2012 | | 2012 |
| Dollar General | | Joplin | | MO | | — |
| | 144 |
| | 816 |
| | — |
| | 960 |
| | (143 | ) | | 11/12/2013 | | 2013 | | Joplin | | MO | | — |
| | 144 |
| | 816 |
| | — |
| | 960 |
| | (232 | ) | | 11/12/2013 | | 2013 |
| Dollar General | | Kansas City | | MO | | — |
| | 313 |
| | 731 |
| | — |
| | 1,044 |
| | (176 | ) | | 9/21/2012 | | 2012 | | Kansas City | | MO | | — |
| | 313 |
| | 731 |
| | — |
| | 1,044 |
| | (232 | ) | | 9/21/2012 | | 2012 |
| Dollar General | | King City | | MO | | 300 |
| | 33 |
| | 625 |
| | — |
| | 658 |
| | (178 | ) | | 11/22/2011 | | 2010 | | King City | | MO | | 300 |
| | 33 |
| | 625 |
| | — |
| | 658 |
| | (213 | ) | | 11/22/2011 | | 2010 |
| Dollar General | | Laurie | | MO | | — |
| | 102 |
| | 918 |
| | — |
| | 1,020 |
| | (161 | ) | | 11/15/2013 | | 2013 | | Laurie | | MO | | — |
| | 102 |
| | 918 |
| | — |
| | 1,020 |
| | (261 | ) | | 11/15/2013 | | 2013 |
| Dollar General | | Lawson | | MO | | — |
| | 29 |
| | 162 |
| | (3 | ) | | 188 |
| | (46 | ) | | 11/10/2011 | | 2003 | | Lawson | | MO | | — |
| | 29 |
| | 162 |
| | 6 |
| | 197 |
| | (55 | ) | | 11/10/2011 | | 2003 |
| Dollar General | | Lebanon | | MO | | — |
| | 177 |
| | 708 |
| | — |
| | 885 |
| | (171 | ) | | 9/24/2012 | | 2012 | | Lebanon | | MO | | — |
| | 177 |
| | 708 |
| | — |
| | 885 |
| | (224 | ) | | 9/24/2012 | | 2012 |
| Dollar General | | Lebanon | | MO | | — |
| | 278 |
| | 835 |
| | — |
| | 1,113 |
| | (201 | ) | | 9/21/2012 | | 2012 | | Lebanon | | MO | | — |
| | 278 |
| | 835 |
| | — |
| | 1,113 |
| | (265 | ) | | 9/21/2012 | | 2012 |
| Dollar General | | Lexington | | MO | | — |
| | 149 |
| | 846 |
| | — |
| | 995 |
| | (156 | ) | | 9/13/2013 | | 2013 | | Lexington | | MO | | — |
| | 149 |
| | 846 |
| | — |
| | 995 |
| | (244 | ) | | 9/13/2013 | | 2013 |
| Dollar General | | Licking | | MO | | 300 |
| | 76 |
| | 688 |
| | — |
| | 764 |
| | (196 | ) | | 11/22/2011 | | 2010 | | Licking | | MO | | 300 |
| | 76 |
| | 688 |
| | — |
| | 764 |
| | (234 | ) | | 11/22/2011 | | 2010 |
| Dollar General | | Lilbourn | | MO | | — |
| | 62 |
| | 554 |
| | — |
| | 616 |
| | (157 | ) | | 11/10/2011 | | 2010 | | Lilbourn | | MO | | — |
| | 62 |
| | 554 |
| | — |
| | 616 |
| | (189 | ) | | 11/10/2011 | | 2010 |
| Dollar General | | Lonedell | | MO | | — |
| | 208 |
| | 833 |
| | — |
| | 1,041 |
| | (173 | ) | | 4/26/2013 | | 2013 | | Lonedell | | MO | | — |
| | 208 |
| | 833 |
| | — |
| | 1,041 |
| | (251 | ) | | 4/26/2013 | | 2013 |
| Dollar General | | Malden | | MO | | — |
| | 108 |
| | 974 |
| | — |
| | 1,082 |
| | (185 | ) | | 8/2/2013 | | 2013 | | Malden | | MO | | — |
| | 108 |
| | 974 |
| | — |
| | 1,082 |
| | (284 | ) | | 8/2/2013 | | 2013 |
| Dollar General | | Marble Hill | | MO | | — |
| | 104 |
| | 935 |
| | — |
| | 1,039 |
| | (225 | ) | | 9/11/2012 | | 2012 | | Marble Hill | | MO | | — |
| | 104 |
| | 935 |
| | — |
| | 1,039 |
| | (297 | ) | | 9/11/2012 | | 2012 |
| Dollar General | | Marionville | | MO | | — |
| | 89 |
| | 797 |
| | — |
| | 886 |
| | (188 | ) | | 10/31/2012 | | 2012 | | Marionville | | MO | | — |
| | 89 |
| | 797 |
| | — |
| | 886 |
| | (251 | ) | | 10/31/2012 | | 2012 |
| Dollar General | | Marthasville | | MO | | 300 |
| | 41 |
| | 782 |
| | — |
| | 823 |
| | (214 | ) | | 2/1/2012 | | 2011 | | Marthasville | | MO | | 300 |
| | 41 |
| | 782 |
| | — |
| | 823 |
| | (261 | ) | | 2/1/2012 | | 2011 |
| Dollar General | | Maysville | | MO | | 300 |
| | 107 |
| | 607 |
| | — |
| | 714 |
| | (174 | ) | | 10/31/2011 | | 2010 | | Maysville | | MO | | 300 |
| | 107 |
| | 607 |
| | — |
| | 714 |
| | (208 | ) | | 10/31/2011 | | 2010 |
| Dollar General | | Morehouse | | MO | | — |
| | 87 |
| | 783 |
| | — |
| | 870 |
| | (189 | ) | | 9/7/2012 | | 2012 | | Morehouse | | MO | | — |
| | 87 |
| | 783 |
| | — |
| | 870 |
| | (248 | ) | | 9/7/2012 | | 2012 |
| Dollar General | | New Haven | | MO | | — |
| | 176 |
| | 702 |
| | — |
| | 878 |
| | (186 | ) | | 4/27/2012 | | 2012 | | New Haven | | MO | | — |
| | 176 |
| | 702 |
| | — |
| | 878 |
| | (231 | ) | | 4/27/2012 | | 2012 |
| Dollar General | | Oak Grove | | MO | | — |
| | 27 |
| | 106 |
| | (3 | ) | | 130 |
| | (27 | ) | | 6/19/2012 | | 1999 | | Oak Grove | | MO | | — |
| | 27 |
| | 106 |
| | 64 |
| | 197 |
| | (37 | ) | | 6/19/2012 | | 1999 |
| Dollar General | | Oran | | MO | | 419 |
| | 83 |
| | 747 |
| | — |
| | 830 |
| | (201 | ) | | 3/30/2012 | | 2012 | | Oran | | MO | | — |
| | 83 |
| | 747 |
| | — |
| | 830 |
| | (247 | ) | | 3/30/2012 | | 2012 |
| Dollar General | | Osceola | | MO | | — |
| | 93 |
| | 835 |
| | — |
| | 928 |
| | (182 | ) | | 2/19/2013 | | 2012 | | Osceola | | MO | | — |
| | 93 |
| | 835 |
| | — |
| | 928 |
| | (255 | ) | | 2/19/2013 | | 2012 |
| Dollar General | | Ozark | | MO | | 474 |
| | 190 |
| | 758 |
| | — |
| | 948 |
| | (200 | ) | | 4/27/2012 | | 2012 | | Ozark | | MO | | — |
| | 190 |
| | 758 |
| | — |
| | 948 |
| | (249 | ) | | 4/27/2012 | | 2012 |
| Dollar General | | Ozark | | MO | | — |
| | 149 |
| | 842 |
| | — |
| | 991 |
| | (203 | ) | | 9/24/2012 | | 2012 | | Ozark | | MO | | — |
| | 149 |
| | 842 |
| | — |
| | 991 |
| | (267 | ) | | 9/24/2012 | | 2012 |
| Dollar General | | Pacific | | MO | | — |
| | 151 |
| | 853 |
| | — |
| | 1,004 |
| | (218 | ) | | 6/6/2012 | | 2012 | | Pacific | | MO | | — |
| | 151 |
| | 853 |
| | — |
| | 1,004 |
| | (277 | ) | | 6/6/2012 | | 2012 |
| Dollar General | | Palmyra | | MO | | — |
| | 40 |
| | 225 |
| | (3 | ) | | 262 |
| | (57 | ) | | 6/19/2012 | | 2003 | | Palmyra | | MO | | — |
| | 40 |
| | 225 |
| | (3 | ) | | 262 |
| | (73 | ) | | 6/19/2012 | | 2003 |
| | | | | | Initial Costs (1) | | Costs Capitalized Subsequent to Acquisition (2) | | Gross Amount
Carried at
December 31, 2016
(3) (4) | | | | | | Initial Costs (1) | | Costs Capitalized Subsequent to Acquisition (2) | | Gross Amount
Carried at
December 31, 2018
(3) (4) | | | |
| Property | | City | | State | | Encumbrances at
December 31, 2016 | | Land | | Buildings, Fixtures and Improvements | | Accumulated Depreciation
(3) (5) | | Date Acquired | | Date of Construction | | City | | State | | Encumbrances at
December 31, 2018 | | Land | | Buildings, Fixtures and Improvements | | Accumulated Depreciation
(3) (5) | | Date Acquired | | Date of Construction |
| Dollar General | | Plattsburg | | MO | | — |
| | 44 |
| | 843 |
| | — |
| | 887 |
| | (207 | ) | | 8/9/2012 | | 2012 | | Plattsburg | | MO | | — |
| | 44 |
| | 843 |
| | — |
| | 887 |
| | (269 | ) | | 8/9/2012 | | 2012 |
| Dollar General | | Qulin | | MO | | — |
| | 30 |
| | 573 |
| | (8 | ) | | 595 |
| | (162 | ) | | 11/10/2011 | | 2009 | | Qulin | | MO | | — |
| | 30 |
| | 573 |
| | (8 | ) | | 595 |
| | (194 | ) | | 11/10/2011 | | 2009 |
| Dollar General | | Robertsville | | MO | | — |
| | 131 |
| | 744 |
| | — |
| | 875 |
| | (183 | ) | | 8/24/2012 | | 2011 | | Robertsville | | MO | | — |
| | 131 |
| | 744 |
| | — |
| | 875 |
| | (238 | ) | | 8/24/2012 | | 2011 |
| Dollar General | | Rocky Mount | | MO | | — |
| | 88 |
| | 789 |
| | — |
| | 877 |
| | (194 | ) | | 8/31/2012 | | 2012 | | Rocky Mount | | MO | | — |
| | 88 |
| | 789 |
| | — |
| | 877 |
| | (252 | ) | | 8/31/2012 | | 2012 |
| Dollar General | | Rolla | | MO | | — |
| | 209 |
| | 835 |
| | — |
| | 1,044 |
| | (158 | ) | | 8/21/2013 | | 2013 | | Rolla | | MO | | — |
| | 209 |
| | 835 |
| | — |
| | 1,044 |
| | (243 | ) | | 8/21/2013 | | 2013 |
| Dollar General | | Savannah | | MO | | — |
| | 270 |
| | 811 |
| | — |
| | 1,081 |
| | (154 | ) | | 8/23/2013 | | 2013 | | Savannah | | MO | | — |
| | 270 |
| | 811 |
| | — |
| | 1,081 |
| | (236 | ) | | 8/23/2013 | | 2013 |
| Dollar General | | Sedadia | | MO | | — |
| | 273 |
| | 637 |
| | — |
| | 910 |
| | (154 | ) | | 9/7/2012 | | 2012 | | Sedadia | | MO | | — |
| | 273 |
| | 637 |
| | — |
| | 910 |
| | (202 | ) | | 9/7/2012 | | 2012 |
| Dollar General | | Senath | | MO | | — |
| | 61 |
| | 552 |
| | — |
| | 613 |
| | (141 | ) | | 6/19/2012 | | 2010 | | Senath | | MO | | — |
| | 61 |
| | 552 |
| | — |
| | 613 |
| | (179 | ) | | 6/19/2012 | | 2010 |
| Dollar General | | Seneca | | MO | | — |
| | 47 |
| | 189 |
| | 7 |
| | 243 |
| | (48 | ) | | 6/19/2012 | | 1962 | | Seneca | | MO | | — |
| | 47 |
| | 189 |
| | 180 |
| | 416 |
| | (73 | ) | | 6/19/2012 | | 1962 |
| Dollar General | | Shelbina | | MO | | — |
| | 101 |
| | 911 |
| | — |
| | 1,012 |
| | (185 | ) | | 5/22/2013 | | 2013 | | Shelbina | | MO | | — |
| | 101 |
| | 911 |
| | — |
| | 1,012 |
| | (272 | ) | | 5/22/2013 | | 2013 |
| Dollar General | | Sikeston | | MO | | 555 |
| | 56 |
| | 1,056 |
| | — |
| | 1,112 |
| | (289 | ) | | 2/24/2012 | | 2011 | | Sikeston | | MO | | — |
| | 56 |
| | 1,056 |
| | — |
| | 1,112 |
| | (352 | ) | | 2/24/2012 | | 2011 |
| Dollar General | | Sikeston | | MO | | — |
| | 144 |
| | 819 |
| | — |
| | 963 |
| | (201 | ) | | 8/24/2012 | | 2012 | | Sikeston | | MO | | — |
| | 144 |
| | 819 |
| | — |
| | 963 |
| | (262 | ) | | 8/24/2012 | | 2012 |
| Dollar General | | Springfield | | MO | | — |
| | 378 |
| | 702 |
| | — |
| | 1,080 |
| | (179 | ) | | 6/14/2012 | | 2012 | | Springfield | | MO | | — |
| | 378 |
| | 702 |
| | — |
| | 1,080 |
| | (228 | ) | | 6/14/2012 | | 2012 |
| Dollar General | | St. Clair | | MO | | 400 |
| | 220 |
| | 879 |
| | — |
| | 1,099 |
| | (248 | ) | | 12/30/2011 | | 1995 | | St. Clair | | MO | | 400 |
| | 220 |
| | 879 |
| | — |
| | 1,099 |
| | (297 | ) | | 12/30/2011 | | 1995 |
| Dollar General | | St. James | | MO | | — |
| | 81 |
| | 244 |
| | — |
| | 325 |
| | (62 | ) | | 6/19/2012 | | 1999 | | St. James | | MO | | — |
| | 81 |
| | 244 |
| | — |
| | 325 |
| | (79 | ) | | 6/19/2012 | | 1999 |
| Dollar General | | St. Louis | | MO | | — |
| | 372 |
| | 692 |
| | — |
| | 1,064 |
| | (170 | ) | | 8/31/2012 | | 2012 | | St. Louis | | MO | | — |
| | 372 |
| | 692 |
| | — |
| | 1,064 |
| | (221 | ) | | 8/31/2012 | | 2012 |
| Dollar General | | St. Louis | | MO | | — |
| | 260 |
| | 606 |
| | — |
| | 866 |
| | (146 | ) | | 9/26/2012 | | 2012 | | St. Louis | | MO | | — |
| | 260 |
| | 606 |
| | — |
| | 866 |
| | (192 | ) | | 9/26/2012 | | 2012 |
| Dollar General | | Stanberry | | MO | | 300 |
| | 111 |
| | 629 |
| | — |
| | 740 |
| | (179 | ) | | 11/22/2011 | | 2010 | | St. Louis | | MO | | — |
| | 215 |
| | 1,219 |
| | — |
| | 1,434 |
| | (367 | ) | | 4/30/2013 | | 1995 |
| Dollar General | | Steele | | MO | | — |
| | 31 |
| | 598 |
| | — |
| | 629 |
| | (170 | ) | | 11/10/2011 | | 2009 | | St. Louis | | MO | | — |
| | 445 |
| | 1,039 |
| | — |
| | 1,484 |
| | (322 | ) | | 12/14/2012 | | 2012 |
| Dollar General | | Strafford | | MO | | — |
| | 51 |
| | 471 |
| | — |
| | 522 |
| | (132 | ) | | 11/10/2011 | | 2009 | | Stanberry | | MO | | 300 |
| | 111 |
| | 629 |
| | — |
| | 740 |
| | (214 | ) | | 11/22/2011 | | 2010 |
| Dollar General | | Vienna | | MO | | 394 |
| | 78 |
| | 704 |
| | — |
| | 782 |
| | (193 | ) | | 2/24/2012 | | 2011 | | Steele | | MO | | — |
| | 31 |
| | 598 |
| | — |
| | 629 |
| | (204 | ) | | 11/10/2011 | | 2009 |
| Dollar General | | West Plains | | MO | | — |
| | 90 |
| | 769 |
| | — |
| | 859 |
| | (125 | ) | | 2/20/2014 | | 2014 | | Strafford | | MO | | — |
| | 51 |
| | 471 |
| | — |
| | 522 |
| | (158 | ) | | 11/10/2011 | | 2009 |
| Dollar General | | Willow Springs | | MO | | — |
| | 24 |
| | 213 |
| | (4 | ) | | 233 |
| | (54 | ) | | 6/19/2012 | | 2002 | | Vienna | | MO | | — |
| | 78 |
| | 704 |
| | — |
| | 782 |
| | (235 | ) | | 2/24/2012 | | 2011 |
| Dollar General | | Windsor | | MO | | — |
| | 86 |
| | 829 |
| | — |
| | 915 |
| | (134 | ) | | 2/20/2014 | | 2014 | | West Plains | | MO | | — |
| | 90 |
| | 769 |
| | — |
| | 859 |
| | (211 | ) | | 2/20/2014 | | 2014 |
| Dollar General | | Edwards | | MS | | 300 |
| | 75 |
| | 671 |
| | — |
| | 746 |
| | (189 | ) | | 12/30/2011 | | 2011 | | Willow Springs | | MO | | — |
| | 24 |
| | 213 |
| | 23 |
| | 260 |
| | (69 | ) | | 6/19/2012 | | 2002 |
| Dollar General | | Greenville | | MS | | 300 |
| | 82 |
| | 739 |
| | — |
| | 821 |
| | (208 | ) | | 12/30/2011 | | 2011 | | Windsor | | MO | | — |
| | 86 |
| | 829 |
| | — |
| | 915 |
| | (228 | ) | | 2/20/2014 | | 2014 |
| Dollar General | | Hickory | | MS | | — |
| | 77 |
| | 692 |
| | — |
| | 769 |
| | (173 | ) | | 7/2/2012 | | 2011 | | Edwards | | MS | | 300 |
| | 75 |
| | 671 |
| | — |
| | 746 |
| | (227 | ) | | 12/30/2011 | | 2011 |
| Dollar General | | Jackson | | MS | | — |
| | 198 |
| | 793 |
| | — |
| | 991 |
| | (191 | ) | | 9/27/2012 | | 2011 | | Greenville | | MS | | 300 |
| | 82 |
| | 739 |
| | — |
| | 821 |
| | (250 | ) | | 12/30/2011 | | 2011 |
| Dollar General | | Meridian | | MS | | — |
| | 178 |
| | 713 |
| | — |
| | 891 |
| | (172 | ) | | 9/13/2012 | | 2011 | | Hickory | | MS | | — |
| | 77 |
| | 692 |
| | — |
| | 769 |
| | (223 | ) | | 7/2/2012 | | 2011 |
| Dollar General | | Meridian | | MS | | — |
| | 40 |
| | 754 |
| | — |
| | 794 |
| | (182 | ) | | 9/13/2012 | | 2011 | | Jackson | | MS | | — |
| | 198 |
| | 793 |
| | — |
| | 991 |
| | (252 | ) | | 9/27/2012 | | 2011 |
| Dollar General | | Moorhead | | MS | | 356 |
| | 107 |
| | 606 |
| | — |
| | 713 |
| | (157 | ) | | 5/1/2012 | | 2011 | | Meridian | | MS | | — |
| | 178 |
| | 713 |
| | — |
| | 891 |
| | (226 | ) | | 9/13/2012 | | 2011 |
| Dollar General | | Natchez | | MS | | — |
| | 166 |
| | 664 |
| | — |
| | 830 |
| | (169 | ) | | 6/12/2012 | | 2012 | | Meridian | | MS | | — |
| | 40 |
| | 754 |
| | — |
| | 794 |
| | (239 | ) | | 9/13/2012 | | 2011 |
|
| | | | | | | | | | | | | | | | | | | | | | | | | | |
| | | | | | | | Initial Costs (1) | | Costs Capitalized Subsequent to Acquisition (2) | | Gross Amount
Carried at
December 31, 2018
(3) (4) | | | | | | |
| Property | | City | | State | | Encumbrances at
December 31, 2018 | | Land | | Buildings, Fixtures and Improvements | | | Accumulated Depreciation
(3) (5) | | Date Acquired | | Date of Construction |
| Dollar General | | Moorhead | | MS | | — |
| | 107 |
| | 606 |
| | — |
| | 713 |
| | (198 | ) | | 5/1/2012 | | 2011 |
| Dollar General | | Natchez | | MS | | — |
| | 166 |
| | 664 |
| | — |
| | 830 |
| | (215 | ) | | 6/12/2012 | | 2012 |
| | | | | | Initial Costs (1) | | Costs Capitalized Subsequent to Acquisition (2) | | Gross Amount
Carried at
December 31, 2016
(3) (4) | | | | | | Initial Costs (1) | | Costs Capitalized Subsequent to Acquisition (2) | | Gross Amount
Carried at
December 31, 2018
(3) (4) | | | |
| Property | | City | | State | | Encumbrances at
December 31, 2016 | | Land | | Buildings, Fixtures and Improvements | | Accumulated Depreciation
(3) (5) | | Date Acquired | | Date of Construction | | City | | State | | Encumbrances at
December 31, 2018 | | Land | | Buildings, Fixtures and Improvements | | Accumulated Depreciation
(3) (5) | | Date Acquired | | Date of Construction |
| Dollar General | | Soso | | MS | | 385 |
| | 116 |
| | 658 |
| | — |
| | 774 |
| | (174 | ) | | 4/12/2012 | | 2011 | | Soso | | MS | | — |
| | 116 |
| | 658 |
| | — |
| | 774 |
| | (216 | ) | | 4/12/2012 | | 2011 |
| Dollar General | | Stonewall | | MS | | — |
| | 116 |
| | 655 |
| | — |
| | 771 |
| | (164 | ) | | 7/2/2012 | | 2011 | | Stonewall | | MS | | — |
| | 116 |
| | 655 |
| | — |
| | 771 |
| | (211 | ) | | 7/2/2012 | | 2011 |
| Dollar General | | Stringer | | MS | | — |
| | 116 |
| | 655 |
| | — |
| | 771 |
| | (164 | ) | | 7/2/2012 | | 2011 | | Stringer | | MS | | — |
| | 116 |
| | 655 |
| | — |
| | 771 |
| | (211 | ) | | 7/2/2012 | | 2011 |
| Dollar General | | Walnut Grove | | MS | | 300 |
| | 71 |
| | 641 |
| | — |
| | 712 |
| | (181 | ) | | 12/30/2011 | | 2011 | | Walnut Grove | | MS | | 300 |
| | 71 |
| | 641 |
| | — |
| | 712 |
| | (217 | ) | | 12/30/2011 | | 2011 |
| Dollar General | | Edenton | | NC | | — |
| | 240 |
| | 1,025 |
| | — |
| | 1,265 |
| | (167 | ) | | 2/28/2014 | | 2013 | | Edenton | | NC | | — |
| | 240 |
| | 1,025 |
| | — |
| | 1,265 |
| | (283 | ) | | 2/28/2014 | | 2013 |
| Dollar General | | Fayetteville | | NC | | 300 |
| | 216 |
| | 647 |
| | — |
| | 863 |
| | (177 | ) | | 2/6/2012 | | 2011 | | Fayetteville | | NC | | 300 |
| | 216 |
| | 647 |
| | — |
| | 863 |
| | (216 | ) | | 2/6/2012 | | 2011 |
| Dollar General | | Hendersonville | | NC | | — |
| | 360 |
| | 1,034 |
| | — |
| | 1,394 |
| | (166 | ) | | 2/7/2014 | | 2013 | | Hendersonville | | NC | | — |
| | 360 |
| | 1,034 |
| | — |
| | 1,394 |
| | (282 | ) | | 2/7/2014 | | 2013 |
| Dollar General | | Hickory | | NC | | — |
| | 89 |
| | 804 |
| | — |
| | 893 |
| | (198 | ) | | 8/13/2012 | | 2012 | | Hickory | | NC | | — |
| | 89 |
| | 804 |
| | — |
| | 893 |
| | (257 | ) | | 8/13/2012 | | 2012 |
| Dollar General | | Morganton | | NC | | — |
| | 472 |
| | 1,108 |
| | — |
| | 1,580 |
| | (180 | ) | | 2/7/2014 | | 2013 | | Morganton | | NC | | — |
| | 472 |
| | 1,108 |
| | — |
| | 1,580 |
| | (306 | ) | | 2/7/2014 | | 2013 |
| Dollar General | | Ocean Isle Beach | | NC | | 400 |
| | 341 |
| | 633 |
| | — |
| | 974 |
| | (173 | ) | | 2/6/2012 | | 2011 | | Ocean Isle Beach | | NC | | 400 |
| | 341 |
| | 633 |
| | — |
| | 974 |
| | (211 | ) | | 2/6/2012 | | 2011 |
| Dollar General | | Tryon | | NC | | — |
| | 139 |
| | 789 |
| | — |
| | 928 |
| | (194 | ) | | 8/13/2012 | | 2012 | | Tryon | | NC | | — |
| | 139 |
| | 789 |
| | — |
| | 928 |
| | (252 | ) | | 8/13/2012 | | 2012 |
| Dollar General | | Vass | | NC | | 300 |
| | 226 |
| | 528 |
| | — |
| | 754 |
| | (144 | ) | | 2/6/2012 | | 2011 | | Vass | | NC | | 300 |
| | 226 |
| | 528 |
| | — |
| | 754 |
| | (176 | ) | | 2/6/2012 | | 2011 |
| Dollar General | | Farmington | | NM | | — |
| | 269 |
| | 807 |
| | — |
| | 1,076 |
| | (195 | ) | | 9/6/2012 | | 2012 | | Farmington | | NM | | — |
| | 269 |
| | 807 |
| | — |
| | 1,076 |
| | (256 | ) | | 9/6/2012 | | 2012 |
| Dollar General | | Farmington | | NM | | — |
| | 224 |
| | 898 |
| | — |
| | 1,122 |
| | (174 | ) | | 7/11/2013 | | 2013 | | Farmington | | NM | | — |
| | 224 |
| | 898 |
| | — |
| | 1,122 |
| | (264 | ) | | 7/11/2013 | | 2013 |
| Dollar General | | Modena | | NY | | — |
| | 249 |
| | 996 |
| | — |
| | 1,245 |
| | (179 | ) | | 10/10/2013 | | 2012 | | Modena | | NY | | — |
| | 249 |
| | 996 |
| | — |
| | 1,245 |
| | (286 | ) | | 10/10/2013 | | 2012 |
| Dollar General | | Fairfield | | OH | | — |
| | 131 |
| | 1,272 |
| | — |
| | 1,403 |
| | (195 | ) | | 2/7/2014 | | 2013 | | Fairfield | | OH | | — |
| | 131 |
| | 1,272 |
| | — |
| | 1,403 |
| | (330 | ) | | 2/7/2014 | | 2013 |
| Dollar General | | Forest | | OH | | 300 |
| | 76 |
| | 681 |
| | — |
| | 757 |
| | (195 | ) | | 10/31/2011 | | 2010 | | Forest | | OH | | 300 |
| | 76 |
| | 681 |
| | — |
| | 757 |
| | (234 | ) | | 10/31/2011 | | 2010 |
| Dollar General | | Gratis | | OH | | — |
| | 161 |
| | 1,042 |
| | — |
| | 1,203 |
| | (170 | ) | | 2/18/2014 | | 2013 | | Gratis | | OH | | — |
| | 161 |
| | 1,042 |
| | — |
| | 1,203 |
| | (288 | ) | | 2/18/2014 | | 2013 |
| Dollar General | | Greenfield | | OH | | 400 |
| | 110 |
| | 986 |
| | — |
| | 1,096 |
| | (270 | ) | | 2/23/2012 | | 2011 | | Greenfield | | OH | | 400 |
| | 110 |
| | 986 |
| | — |
| | 1,096 |
| | (329 | ) | | 2/23/2012 | | 2011 |
| Dollar General | | Hicksville | | OH | | — |
| | 156 |
| | 1,490 |
| | — |
| | 1,646 |
| | (230 | ) | | 2/7/2014 | | 2012 | | Hicksville | | OH | | — |
| | 156 |
| | 1,490 |
| | — |
| | 1,646 |
| | (389 | ) | | 2/7/2014 | | 2012 |
| Dollar General | | Loudonville | | OH | | — |
| | 236 |
| | 945 |
| | — |
| | 1,181 |
| | (241 | ) | | 6/6/2012 | | 2012 | | Loudonville | | OH | | — |
| | 236 |
| | 945 |
| | — |
| | 1,181 |
| | (307 | ) | | 6/6/2012 | | 2012 |
| Dollar General | | Lowell | | OH | | — |
| | 157 |
| | 1,114 |
| | — |
| | 1,271 |
| | (172 | ) | | 2/7/2014 | | 2012 | | Lowell | | OH | | — |
| | 157 |
| | 1,114 |
| | — |
| | 1,271 |
| | (292 | ) | | 2/7/2014 | | 2012 |
| Dollar General | | Lucasville | | OH | | — |
| | 223 |
| | 893 |
| | — |
| | 1,116 |
| | (232 | ) | | 5/16/2012 | | 2012 | | Lucasville | | OH | | — |
| | 223 |
| | 893 |
| | — |
| | 1,116 |
| | (292 | ) | | 5/16/2012 | | 2012 |
| Dollar General | | New Charlisle | | OH | | — |
| | 215 |
| | 860 |
| | — |
| | 1,075 |
| | (215 | ) | | 7/10/2012 | | 2012 | | New Charlisle | | OH | | — |
| | 215 |
| | 860 |
| | — |
| | 1,075 |
| | (277 | ) | | 7/10/2012 | | 2012 |
| Dollar General | | New Matamoras | | OH | | 300 |
| | 123 |
| | 696 |
| | — |
| | 819 |
| | (200 | ) | | 10/31/2011 | | 2010 | | New Matamoras | | OH | | 300 |
| | 123 |
| | 696 |
| | — |
| | 819 |
| | (239 | ) | | 10/31/2011 | | 2010 |
| Dollar General | | Payne | | OH | | 300 |
| | 81 |
| | 729 |
| | — |
| | 810 |
| | (209 | ) | | 10/31/2011 | | 2010 | | Payne | | OH | | 300 |
| | 81 |
| | 729 |
| | — |
| | 810 |
| | (250 | ) | | 10/31/2011 | | 2010 |
| Dollar General | | Pemberville | | OH | | — |
| | 146 |
| | 1,059 |
| | — |
| | 1,205 |
| | (166 | ) | | 2/7/2014 | | 2012 | | Pemberville | | OH | | — |
| | 146 |
| | 1,059 |
| | — |
| | 1,205 |
| | (282 | ) | | 2/7/2014 | | 2012 |
| Dollar General | | Pleasant City | | OH | | 300 |
| | 131 |
| | 740 |
| | — |
| | 871 |
| | (212 | ) | | 10/31/2011 | | 2010 | | Pleasant City | | OH | | 300 |
| | 131 |
| | 740 |
| | — |
| | 871 |
| | (254 | ) | | 10/31/2011 | | 2010 |
| Dollar General | | Sandusky | | OH | | — |
| | 210 |
| | 1,700 |
| | — |
| | 1,910 |
| | (262 | ) | | 2/7/2014 | | 2012 | | Powhatan Point | | OH | | — |
| | 138 |
| | 784 |
| | — |
| | 922 |
| | (230 | ) | | 7/2/2013 | | 2014 |
| Dollar General | | Toledo | | OH | | — |
| | 252 |
| | 1,149 |
| | — |
| | 1,401 |
| | (178 | ) | | 2/7/2014 | | 2012 | | Sandusky | | OH | | — |
| | 210 |
| | 1,700 |
| | — |
| | 1,910 |
| | (443 | ) | | 2/7/2014 | | 2012 |
| Dollar General | | Wheelersburg | | OH | | — |
| | 395 |
| | 1,132 |
| | — |
| | 1,527 |
| | (183 | ) | | 2/25/2014 | | 1925 | | Toledo | | OH | | — |
| | 252 |
| | 1,149 |
| | — |
| | 1,401 |
| | (303 | ) | | 2/7/2014 | | 2012 |
| Dollar General | | Broken Bow | | OK | | — |
| | 331 |
| | 1,325 |
| | — |
| | 1,656 |
| | (175 | ) | | 5/19/2014 | | 2012 | | Wheelersburg | | OH | | — |
| | 395 |
| | 1,132 |
| | — |
| | 1,527 |
| | (311 | ) | | 2/25/2014 | | 1925 |
| | | | | | Initial Costs (1) | | Costs Capitalized Subsequent to Acquisition (2) | | Gross Amount
Carried at
December 31, 2016
(3) (4) | | | | | | Initial Costs (1) | | Costs Capitalized Subsequent to Acquisition (2) | | Gross Amount
Carried at
December 31, 2018
(3) (4) | | | |
| Property | | City | | State | | Encumbrances at
December 31, 2016 | | Land | | Buildings, Fixtures and Improvements | | Accumulated Depreciation
(3) (5) | | Date Acquired | | Date of Construction | | City | | State | | Encumbrances at
December 31, 2018 | | Land | | Buildings, Fixtures and Improvements | | Accumulated Depreciation
(3) (5) | | Date Acquired | | Date of Construction |
| Dollar General | | Calera | | OK | | — |
| | 136 |
| | 770 |
| | — |
| | 906 |
| | (189 | ) | | 8/31/2012 | | 2010 | | Broken Bow | | OK | | — |
| | 331 |
| | 1,325 |
| | — |
| | 1,656 |
| | (309 | ) | | 5/19/2014 | | 2012 |
| Dollar General | | Commerce | | OK | | — |
| | 38 |
| | 341 |
| | (6 | ) | | 373 |
| | (96 | ) | | 11/10/2011 | | 2006 | | Calera | | OK | | — |
| | 136 |
| | 770 |
| | — |
| | 906 |
| | (246 | ) | | 8/31/2012 | | 2010 |
| Dollar General | | Hartshorne | | OK | | — |
| | 100 |
| | 898 |
| | — |
| | 998 |
| | (221 | ) | | 8/31/2012 | | 2010 | | Commerce | | OK | | — |
| | 38 |
| | 341 |
| | (6 | ) | | 373 |
| | (115 | ) | | 11/10/2011 | | 2006 |
| Dollar General | | Lexington | | OK | | — |
| | 85 |
| | 761 |
| | — |
| | 846 |
| | (187 | ) | | 8/31/2012 | | 2010 | | Hartshorne | | OK | | — |
| | 100 |
| | 898 |
| | — |
| | 998 |
| | (287 | ) | | 8/31/2012 | | 2010 |
| Dollar General | | Maud | | OK | | — |
| | 76 |
| | 688 |
| | — |
| | 764 |
| | (169 | ) | | 8/31/2012 | | 2010 | | Lexington | | OK | | — |
| | 85 |
| | 761 |
| | — |
| | 846 |
| | (243 | ) | | 8/31/2012 | | 2010 |
| Dollar General | | Maysville | | OK | | — |
| | 41 |
| | 785 |
| | — |
| | 826 |
| | (193 | ) | | 8/31/2012 | | 2010 | | Maud | | OK | | — |
| | 76 |
| | 688 |
| | — |
| | 764 |
| | (220 | ) | | 8/31/2012 | | 2010 |
| Dollar General | | Ponca City | | OK | | — |
| | 145 |
| | 1,161 |
| | — |
| | 1,306 |
| | (178 | ) | | 2/7/2014 | | 2012 | | Maysville | | OK | | — |
| | 41 |
| | 785 |
| | — |
| | 826 |
| | (251 | ) | | 8/31/2012 | | 2010 |
| Dollar General | | Rush Spring | | OK | | — |
| | 87 |
| | 779 |
| | — |
| | 866 |
| | (191 | ) | | 8/31/2012 | | 2010 | | Ponca City | | OK | | — |
| | 145 |
| | 1,161 |
| | — |
| | 1,306 |
| | (302 | ) | | 2/7/2014 | | 2012 |
| Dollar General | | Sand Springs | | OK | | — |
| | 143 |
| | 811 |
| | — |
| | 954 |
| | (150 | ) | | 9/3/2013 | | 2013 | | Rush Spring | | OK | | — |
| | 87 |
| | 779 |
| | — |
| | 866 |
| | (249 | ) | | 8/31/2012 | | 2010 |
| Dollar General | | Sand Springs | | OK | | — |
| | 43 |
| | 819 |
| | — |
| | 862 |
| | (151 | ) | | 9/3/2013 | | 2013 | | Sand Springs | | OK | | — |
| | 143 |
| | 811 |
| | — |
| | 954 |
| | (234 | ) | | 9/3/2013 | | 2013 |
| Dollar General | | Sand Springs | | OK | | — |
| | 198 |
| | 791 |
| | — |
| | 989 |
| | (146 | ) | | 9/3/2013 | | 2012 | | Sand Springs | | OK | | — |
| | 43 |
| | 819 |
| | — |
| | 862 |
| | (237 | ) | | 9/3/2013 | | 2013 |
| Dollar General | | Tahlequah | | OK | | — |
| | 123 |
| | 1,101 |
| | — |
| | 1,224 |
| | (168 | ) | | 2/7/2014 | | 2012 | | Sand Springs | | OK | | — |
| | 198 |
| | 791 |
| | — |
| | 989 |
| | (229 | ) | | 9/3/2013 | | 2012 |
| Dollar General | | Wagoner | | OK | | — |
| | 31 |
| | 1,076 |
| | — |
| | 1,107 |
| | (165 | ) | | 2/7/2014 | | 2012 | | Tahlequah | | OK | | — |
| | 123 |
| | 1,101 |
| | — |
| | 1,224 |
| | (285 | ) | | 2/7/2014 | | 2012 |
| Dollar General | | Pleasantville | | PA | | — |
| | 163 |
| | 941 |
| | — |
| | 1,104 |
| | (148 | ) | | 3/24/2014 | | 2013 | | Wagoner | | OK | | — |
| | 31 |
| | 1,076 |
| | — |
| | 1,107 |
| | (280 | ) | | 2/7/2014 | | 2012 |
| Dollar General | | Sykesville | | PA | | — |
| | 68 |
| | 1,075 |
| | — |
| | 1,143 |
| | (169 | ) | | 3/24/2014 | | 2013 | | Pleasantville | | PA | | — |
| | 163 |
| | 941 |
| | — |
| | 1,104 |
| | (254 | ) | | 3/24/2014 | | 2013 |
| Dollar General | | Wattsburg | | PA | | — |
| | 96 |
| | 1,031 |
| | — |
| | 1,127 |
| | (162 | ) | | 3/24/2014 | | 2014 | | Sykesville | | PA | | — |
| | 68 |
| | 1,075 |
| | — |
| | 1,143 |
| | (289 | ) | | 3/24/2014 | | 2013 |
| Dollar General | | Holly Hill | | SC | | 1,983 |
| | 259 |
| | 2,333 |
| | — |
| | 2,592 |
| | (497 | ) | | 3/6/2013 | | 2013 | | Wattsburg | | PA | | — |
| | 96 |
| | 1,031 |
| | — |
| | 1,127 |
| | (277 | ) | | 3/24/2014 | | 2014 |
| Dollar General | | West Union | | SC | | — |
| | 46 |
| | 868 |
| | — |
| | 914 |
| | (169 | ) | | 7/3/2013 | | 2011 | | Holly Hill | | SC | | 1,983 |
| | 259 |
| | 2,333 |
| | — |
| | 2,592 |
| | (707 | ) | | 3/6/2013 | | 2013 |
| Dollar General | | Doyle | | TN | | — |
| | 75 |
| | 679 |
| | — |
| | 754 |
| | (167 | ) | | 8/22/2012 | | 2012 | | West Union | | SC | | — |
| | 46 |
| | 868 |
| | — |
| | 914 |
| | (255 | ) | | 7/3/2013 | | 2011 |
| Dollar General | | Manchester | | TN | | — |
| | 114 |
| | 646 |
| | — |
| | 760 |
| | (162 | ) | | 7/26/2012 | | 2012 | | Doyle | | TN | | — |
| | 75 |
| | 679 |
| | — |
| | 754 |
| | (217 | ) | | 8/22/2012 | | 2012 |
| Dollar General | | Mcminnville | | TN | | — |
| | 120 |
| | 679 |
| | — |
| | 799 |
| | (170 | ) | | 7/12/2012 | | 2012 | | Manchester | | TN | | — |
| | 114 |
| | 646 |
| | — |
| | 760 |
| | (208 | ) | | 7/26/2012 | | 2012 |
| Dollar General | | Pleasant Hill | | TN | | 300 |
| | 39 |
| | 747 |
| | — |
| | 786 |
| | (211 | ) | | 12/30/2011 | | 2011 | | Mcminnville | | TN | | — |
| | 120 |
| | 679 |
| | — |
| | 799 |
| | (219 | ) | | 7/12/2012 | | 2012 |
| Dollar General | | Littleriver Acdmy | | TX | | — |
| | 122 |
| | 693 |
| | — |
| | 815 |
| | (183 | ) | | 4/27/2012 | | 2012 | | Pleasant Hill | | TN | | 300 |
| | 39 |
| | 747 |
| | — |
| | 786 |
| | (253 | ) | | 12/30/2011 | | 2011 |
| Dollar General | | Adkins | | TX | | — |
| | 157 |
| | 889 |
| | — |
| | 1,046 |
| | (202 | ) | | 12/31/2012 | | 2012 | | Adkins | | TX | | — |
| | 157 |
| | 889 |
| | — |
| | 1,046 |
| | (276 | ) | | 12/31/2012 | | 2012 |
| Dollar General | | Amarillo | | TX | | — |
| | 97 |
| | 877 |
| | — |
| | 974 |
| | (166 | ) | | 8/13/2013 | | 2013 | | Amarillo | | TX | | — |
| | 97 |
| | 877 |
| | — |
| | 974 |
| | (255 | ) | | 8/13/2013 | | 2013 |
| Dollar General | | Amarillo | | TX | | — |
| | 153 |
| | 866 |
| | — |
| | 1,019 |
| | (164 | ) | | 8/2/2013 | | 2013 | | Amarillo | | TX | | — |
| | 153 |
| | 866 |
| | — |
| | 1,019 |
| | (252 | ) | | 8/2/2013 | | 2013 |
| Dollar General | | Amarillo | | TX | | — |
| | 198 |
| | 794 |
| | — |
| | 992 |
| | (154 | ) | | 7/11/2013 | | 2013 | | Amarillo | | TX | | — |
| | 198 |
| | 794 |
| | — |
| | 992 |
| | (233 | ) | | 7/11/2013 | | 2013 |
| Dollar General | | Avinger | | TX | | — |
| | 44 |
| | 830 |
| | — |
| | 874 |
| | (157 | ) | | 8/8/2013 | | 2013 | | Avinger | | TX | | — |
| | 44 |
| | 830 |
| | — |
| | 874 |
| | (242 | ) | | 8/8/2013 | | 2013 |
| Dollar General | | Beeville | | TX | | — |
| | 90 |
| | 810 |
| | — |
| | 900 |
| | (188 | ) | | 11/19/2012 | | 2012 | | Beeville | | TX | | — |
| | 90 |
| | 810 |
| | — |
| | 900 |
| | (253 | ) | | 11/19/2012 | | 2012 |
| Dollar General | | Belton | | TX | | — |
| | 89 |
| | 804 |
| | — |
| | 893 |
| | (175 | ) | | 2/28/2013 | | 2013 | | Belton | | TX | | — |
| | 89 |
| | 804 |
| | — |
| | 893 |
| | (246 | ) | | 2/28/2013 | | 2013 |
| Dollar General | | Blessing | | TX | | — |
| | 83 |
| | 745 |
| | — |
| | 828 |
| | (169 | ) | | 12/18/2012 | | 2012 | | Belton | | TX | | — |
| | 145 |
| | 821 |
| | — |
| | 966 |
| | (260 | ) | | 9/13/2012 | | 2012 |
| Dollar General | | Boling | | TX | | — |
| | 92 |
| | 831 |
| | — |
| | 923 |
| | (158 | ) | | 8/13/2013 | | 2013 | | Blessing | | TX | | — |
| | 83 |
| | 745 |
| | — |
| | 828 |
| | (231 | ) | | 12/18/2012 | | 2012 |
| | | | | | Initial Costs (1) | | Costs Capitalized Subsequent to Acquisition (2) | | Gross Amount
Carried at
December 31, 2016
(3) (4) | | | | | | Initial Costs (1) | | Costs Capitalized Subsequent to Acquisition (2) | | Gross Amount
Carried at
December 31, 2018
(3) (4) | | | |
| Property | | City | | State | | Encumbrances at
December 31, 2016 | | Land | | Buildings, Fixtures and Improvements | | Accumulated Depreciation
(3) (5) | | Date Acquired | | Date of Construction | | City | | State | | Encumbrances at
December 31, 2018 | | Land | | Buildings, Fixtures and Improvements | | Accumulated Depreciation
(3) (5) | | Date Acquired | | Date of Construction |
| Dollar General | | Brookeland | | TX | | — |
| | 93 |
| | 840 |
| | — |
| | 933 |
| | (159 | ) | | 8/15/2013 | | 2013 | | Boling | | TX | | — |
| | 92 |
| | 831 |
| | — |
| | 923 |
| | (242 | ) | | 8/13/2013 | | 2013 |
| Dollar General | | Bryan | | TX | | — |
| | 148 |
| | 840 |
| | — |
| | 988 |
| | (202 | ) | | 9/14/2012 | | 2012 | | Brookeland | | TX | | — |
| | 93 |
| | 840 |
| | — |
| | 933 |
| | (245 | ) | | 8/15/2013 | | 2013 |
| Dollar General | | Bryan | | TX | | — |
| | 193 |
| | 772 |
| | — |
| | 965 |
| | (186 | ) | | 9/14/2012 | | 2012 | | Bryan | | TX | | — |
| | 148 |
| | 840 |
| | — |
| | 988 |
| | (266 | ) | | 9/14/2012 | | 2012 |
| Dollar General | | Bryan | | TX | | — |
| | 185 |
| | 740 |
| | — |
| | 925 |
| | (182 | ) | | 8/31/2012 | | 2009 | | Bryan | | TX | | — |
| | 193 |
| | 772 |
| | — |
| | 965 |
| | (245 | ) | | 9/14/2012 | | 2012 |
| Dollar General | | Buchanan Dam | | TX | | 562 |
| | 145 |
| | 820 |
| | — |
| | 965 |
| | (198 | ) | | 9/28/2012 | | 2012 | | Bryan | | TX | | — |
| | 185 |
| | 740 |
| | — |
| | 925 |
| | (236 | ) | | 8/31/2012 | | 2009 |
| Dollar General | | Canyon Lake | | TX | | — |
| | 149 |
| | 843 |
| | — |
| | 992 |
| | (199 | ) | | 10/12/2012 | | 2012 | | Buchanan Dam | | TX | | — |
| | 145 |
| | 820 |
| | — |
| | 965 |
| | (260 | ) | | 9/28/2012 | | 2012 |
| Dollar General | | Cedar Creek | | TX | | — |
| | 291 |
| | 680 |
| | — |
| | 971 |
| | (158 | ) | | 11/16/2012 | | 2012 | | Canyon Lake | | TX | | — |
| | 149 |
| | 843 |
| | — |
| | 992 |
| | (265 | ) | | 10/12/2012 | | 2012 |
| Dollar General | | Como | | TX | | 386 |
| | 76 |
| | 683 |
| | — |
| | 759 |
| | (181 | ) | | 4/20/2012 | | 2012 | | Cedar Creek | | TX | | — |
| | 291 |
| | 680 |
| | — |
| | 971 |
| | (213 | ) | | 11/16/2012 | | 2012 |
| Dollar General | | Corpus Christi | | TX | | — |
| | 270 |
| | 809 |
| | — |
| | 1,079 |
| | (184 | ) | | 12/26/2012 | | 2012 | | Como | | TX | | — |
| | 76 |
| | 683 |
| | — |
| | 759 |
| | (225 | ) | | 4/20/2012 | | 2012 |
| Dollar General | | Diana | | TX | | — |
| | 186 |
| | 743 |
| | — |
| | 929 |
| | (141 | ) | | 8/27/2013 | | 2013 | | Corpus Christi | | TX | | — |
| | 270 |
| | 809 |
| | — |
| | 1,079 |
| | (251 | ) | | 12/26/2012 | | 2012 |
| Dollar General | | San Leon | | TX | | — |
| | 87 |
| | 786 |
| | — |
| | 873 |
| | (190 | ) | | 9/25/2012 | | 2012 | | Diana | | TX | | — |
| | 186 |
| | 743 |
| | — |
| | 929 |
| | (217 | ) | | 8/27/2013 | | 2013 |
| Dollar General | | Donna | | TX | | — |
| | 136 |
| | 768 |
| | — |
| | 904 |
| | (185 | ) | | 9/11/2012 | | 2012 | | Donna | | TX | | — |
| | 136 |
| | 768 |
| | — |
| | 904 |
| | (244 | ) | | 9/11/2012 | | 2012 |
| Dollar General | | Donna | | TX | | — |
| | 200 |
| | 799 |
| | — |
| | 999 |
| | (189 | ) | | 10/12/2012 | | 2012 | | Donna | | TX | | — |
| | 200 |
| | 799 |
| | — |
| | 999 |
| | (252 | ) | | 10/12/2012 | | 2012 |
| Dollar General | | Donna | | TX | | — |
| | 145 |
| | 820 |
| | — |
| | 965 |
| | (182 | ) | | 1/31/2013 | | 2012 | | Donna | | TX | | — |
| | 145 |
| | 820 |
| | — |
| | 965 |
| | (252 | ) | | 1/31/2013 | | 2012 |
| Dollar General | | Edinburg | | TX | | — |
| | 136 |
| | 769 |
| | — |
| | 905 |
| | (185 | ) | | 9/7/2012 | | 2012 | | Edinburg | | TX | | — |
| | 136 |
| | 769 |
| | — |
| | 905 |
| | (244 | ) | | 9/7/2012 | | 2012 |
| Dollar General | | Edinburg | | TX | | — |
| | 102 |
| | 914 |
| | — |
| | 1,016 |
| | (177 | ) | | 7/16/2013 | | 2013 | | Edinburg | | TX | | — |
| | 102 |
| | 914 |
| | — |
| | 1,016 |
| | (268 | ) | | 7/16/2013 | | 2013 |
| Dollar General | | Elmendorf | | TX | | — |
| | 94 |
| | 847 |
| | — |
| | 941 |
| | (200 | ) | | 10/23/2012 | | 2012 | | Elmendorf | | TX | | — |
| | 94 |
| | 847 |
| | — |
| | 941 |
| | (267 | ) | | 10/23/2012 | | 2012 |
| Dollar General | | Ganado | | TX | | — |
| | 95 |
| | 857 |
| | — |
| | 952 |
| | (162 | ) | | 8/13/2013 | | 2013 | | Ganado | | TX | | — |
| | 95 |
| | 857 |
| | — |
| | 952 |
| | (250 | ) | | 8/13/2013 | | 2013 |
| Dollar General | | Gladewater | | TX | | — |
| | 184 |
| | 736 |
| | — |
| | 920 |
| | (181 | ) | | 8/31/2012 | | 2009 | | Gladewater | | TX | | — |
| | 184 |
| | 736 |
| | — |
| | 920 |
| | (235 | ) | | 8/31/2012 | | 2009 |
| Dollar General | | Gordonville | | TX | | 384 |
| | 38 |
| | 717 |
| | — |
| | 755 |
| | (190 | ) | | 4/20/2012 | | 2012 | | Gordonville | | TX | | — |
| | 38 |
| | 717 |
| | — |
| | 755 |
| | (236 | ) | | 4/20/2012 | | 2012 |
| Dollar General | | Kyle | | TX | | — |
| | 132 |
| | 747 |
| | — |
| | 879 |
| | (180 | ) | | 9/26/2012 | | 2012 | | Kyle | | TX | | — |
| | 132 |
| | 747 |
| | — |
| | 879 |
| | (237 | ) | | 9/26/2012 | | 2012 |
| Dollar General | | Kyle | | TX | | — |
| | 101 |
| | 910 |
| | — |
| | 1,011 |
| | (155 | ) | | 12/6/2013 | | 2013 | | Kyle | | TX | | — |
| | 101 |
| | 910 |
| | — |
| | 1,011 |
| | (257 | ) | | 12/6/2013 | | 2013 |
| Dollar General | | La Marque | | TX | | — |
| | 102 |
| | 917 |
| | — |
| | 1,019 |
| | (225 | ) | | 8/31/2012 | | 2010 | | La Marque | | TX | | — |
| | 102 |
| | 917 |
| | — |
| | 1,019 |
| | (293 | ) | | 8/31/2012 | | 2010 |
| Dollar General | | Lacy Lakeview | | TX | | — |
| | 146 |
| | 826 |
| | — |
| | 972 |
| | (191 | ) | | 11/16/2012 | | 2012 | | Lacy Lakeview | | TX | | — |
| | 146 |
| | 826 |
| | — |
| | 972 |
| | (258 | ) | | 11/16/2012 | | 2012 |
| Dollar General | | Laredo | | TX | | — |
| | 253 |
| | 758 |
| | — |
| | 1,011 |
| | (190 | ) | | 7/31/2012 | | 2012 | | Laredo | | TX | | — |
| | 253 |
| | 758 |
| | — |
| | 1,011 |
| | (244 | ) | | 7/31/2012 | | 2012 |
| Dollar General | | Lubbock | | TX | | — |
| | 267 |
| | 801 |
| | — |
| | 1,068 |
| | (197 | ) | | 8/31/2012 | | 2010 | | Littleriver Acdmy | | TX | | — |
| | 122 |
| | 693 |
| | — |
| | 815 |
| | (228 | ) | | 4/27/2012 | | 2012 |
| Dollar General | | Lubbock | | TX | | — |
| | 199 |
| | 796 |
| | — |
| | 995 |
| | (151 | ) | | 8/28/2013 | | 2013 | | Lubbock | | TX | | — |
| | 267 |
| | 801 |
| | — |
| | 1,068 |
| | (256 | ) | | 8/31/2012 | | 2010 |
| Dollar General | | Lubbock | | TX | | — |
| | 148 |
| | 841 |
| | — |
| | 989 |
| | (171 | ) | | 5/16/2013 | | 2013 | | Lubbock | | TX | | — |
| | 199 |
| | 796 |
| | — |
| | 995 |
| | (232 | ) | | 8/28/2013 | | 2013 |
| Dollar General | | Lubbock | | TX | | — |
| | 41 |
| | 825 |
| | — |
| | 866 |
| | (134 | ) | | 2/20/2014 | | 2014 | | Lubbock | | TX | | — |
| | 148 |
| | 841 |
| | — |
| | 989 |
| | (251 | ) | | 5/16/2013 | | 2013 |
| Dollar General | | Lyford | | TX | | 300 |
| | 80 |
| | 724 |
| | — |
| | 804 |
| | (204 | ) | | 12/30/2011 | | 2010 | | Lubbock | | TX | | — |
| | 41 |
| | 825 |
| | — |
| | 866 |
| | (226 | ) | | 2/20/2014 | | 2014 |
| Dollar General | | Lytle | | TX | | — |
| | 243 |
| | 971 |
| | — |
| | 1,214 |
| | (175 | ) | | 10/30/2013 | | 2013 | | Lyford | | TX | | 300 |
| | 80 |
| | 724 |
| | — |
| | 804 |
| | (245 | ) | | 12/30/2011 | | 2010 |
| Dollar General | | Mercedes | | TX | | — |
| | 215 |
| | 859 |
| | — |
| | 1,074 |
| | (163 | ) | | 8/2/2013 | | 2013 | | Lytle | | TX | | — |
| | 243 |
| | 971 |
| | — |
| | 1,214 |
| | (278 | ) | | 10/30/2013 | | 2013 |
| | | | | | Initial Costs (1) | | Costs Capitalized Subsequent to Acquisition (2) | | Gross Amount
Carried at
December 31, 2016
(3) (4) | | | | | | Initial Costs (1) | | Costs Capitalized Subsequent to Acquisition (2) | | Gross Amount
Carried at
December 31, 2018
(3) (4) | | | |
| Property | | City | | State | | Encumbrances at
December 31, 2016 | | Land | | Buildings, Fixtures and Improvements | | Accumulated Depreciation
(3) (5) | | Date Acquired | | Date of Construction | | City | | State | | Encumbrances at
December 31, 2018 | | Land | | Buildings, Fixtures and Improvements | | Accumulated Depreciation
(3) (5) | | Date Acquired | | Date of Construction |
| Dollar General | | Mission | | TX | | — |
| | 158 |
| | 894 |
| | — |
| | 1,052 |
| | (190 | ) | | 3/27/2013 | | 2013 | | Mercedes | | TX | | — |
| | 215 |
| | 859 |
| | — |
| | 1,074 |
| | (250 | ) | | 8/2/2013 | | 2013 |
| Dollar General | | Moody | | TX | | — |
| | 41 |
| | 781 |
| | — |
| | 822 |
| | (155 | ) | | 6/11/2013 | | 2013 | | Mission | | TX | | — |
| | 158 |
| | 894 |
| | — |
| | 1,052 |
| | (271 | ) | | 3/27/2013 | | 2013 |
| Dollar General | | Belton | | TX | | — |
| | 145 |
| | 821 |
| | — |
| | 966 |
| | (198 | ) | | 9/13/2012 | | 2012 | | Moody | | TX | | — |
| | 41 |
| | 781 |
| | — |
| | 822 |
| | (231 | ) | | 6/11/2013 | | 2013 |
| Dollar General | | Mount Pleasant | | TX | | — |
| | 214 |
| | 858 |
| | — |
| | 1,072 |
| | (211 | ) | | 8/31/2012 | | 2009 | | Mount Pleasant | | TX | | — |
| | 214 |
| | 858 |
| | — |
| | 1,072 |
| | (274 | ) | | 8/31/2012 | | 2009 |
| Dollar General | | New Braunfels | | TX | | — |
| | 205 |
| | 818 |
| | — |
| | 1,023 |
| | (201 | ) | | 8/31/2012 | | 2012 | | New Braunfels | | TX | | — |
| | 205 |
| | 818 |
| | — |
| | 1,023 |
| | (261 | ) | | 8/31/2012 | | 2012 |
| Dollar General | | New Braunfels | | TX | | — |
| | 95 |
| | 855 |
| | — |
| | 950 |
| | (186 | ) | | 2/14/2013 | | 2013 | | New Braunfels | | TX | | — |
| | 95 |
| | 855 |
| | — |
| | 950 |
| | (261 | ) | | 2/14/2013 | | 2013 |
| Dollar General | | New Braunfels | | TX | | — |
| | 156 |
| | 883 |
| | — |
| | 1,039 |
| | (159 | ) | | 10/30/2013 | | 2013 | | New Braunfels | | TX | | — |
| | 156 |
| | 883 |
| | — |
| | 1,039 |
| | (253 | ) | | 10/30/2013 | | 2013 |
| Dollar General | | Orange | | TX | | — |
| | 277 |
| | 1,150 |
| | — |
| | 1,427 |
| | (171 | ) | | 2/7/2014 | | 2012 | | Orange | | TX | | — |
| | 277 |
| | 1,150 |
| | — |
| | 1,427 |
| | (290 | ) | | 2/7/2014 | | 2012 |
| Dollar General | | Poteet | | TX | | 400 |
| | 96 |
| | 864 |
| | — |
| | 960 |
| | (248 | ) | | 10/31/2011 | | 2010 | | Poteet | | TX | | 400 |
| | 96 |
| | 864 |
| | — |
| | 960 |
| | (296 | ) | | 10/31/2011 | | 2010 |
| Dollar General | | Presidio | | TX | | — |
| | 72 |
| | 1,370 |
| | — |
| | 1,442 |
| | (292 | ) | | 3/28/2013 | | 2013 | | Presidio | | TX | | — |
| | 72 |
| | 1,370 |
| | — |
| | 1,442 |
| | (415 | ) | | 3/28/2013 | | 2013 |
| Dollar General | | Progreso | | TX | | 400 |
| | 169 |
| | 957 |
| | — |
| | 1,126 |
| | (274 | ) | | 10/31/2011 | | 2010 | | Progreso | | TX | | 400 |
| | 169 |
| | 957 |
| | — |
| | 1,126 |
| | (328 | ) | | 10/31/2011 | | 2010 |
| Dollar General | | Rio Grande City | | TX | | 300 |
| | 137 |
| | 779 |
| | — |
| | 916 |
| | (223 | ) | | 10/31/2011 | | 2010 | | Rio Grande City | | TX | | 300 |
| | 137 |
| | 779 |
| | — |
| | 916 |
| | (267 | ) | | 10/31/2011 | | 2010 |
| Dollar General | | Rio Grande City | | TX | | — |
| | 163 |
| | 652 |
| | — |
| | 815 |
| | (179 | ) | | 2/1/2012 | | 2011 | | Rio Grande City | | TX | | — |
| | 163 |
| | 652 |
| | — |
| | 815 |
| | (218 | ) | | 2/1/2012 | | 2011 |
| Dollar General | | Roma | | TX | | 500 |
| | 253 |
| | 1,010 |
| | — |
| | 1,263 |
| | (290 | ) | | 10/31/2011 | | 2010 | | Roma | | TX | | 500 |
| | 253 |
| | 1,010 |
| | — |
| | 1,263 |
| | (347 | ) | | 10/31/2011 | | 2010 |
| Dollar General | | San Antonio | | TX | | — |
| | 252 |
| | 756 |
| | — |
| | 1,008 |
| | (179 | ) | | 10/22/2012 | | 2012 | | San Antonio | | TX | | — |
| | 252 |
| | 756 |
| | — |
| | 1,008 |
| | (238 | ) | | 10/22/2012 | | 2012 |
| Dollar General | | San Antonio | | TX | | — |
| | 222 |
| | 888 |
| | — |
| | 1,110 |
| | (210 | ) | | 10/22/2012 | | 2012 | | San Antonio | | TX | | — |
| | 222 |
| | 888 |
| | — |
| | 1,110 |
| | (280 | ) | | 10/22/2012 | | 2012 |
| Dollar General | | San Antonio | | TX | | — |
| | 163 |
| | 926 |
| | — |
| | 1,089 |
| | (202 | ) | | 2/14/2013 | | 2013 | | San Antonio | | TX | | — |
| | 163 |
| | 926 |
| | — |
| | 1,089 |
| | (283 | ) | | 2/14/2013 | | 2013 |
| Dollar General | | San Antonio | | TX | | — |
| | 271 |
| | 812 |
| | — |
| | 1,083 |
| | (165 | ) | | 5/23/2013 | | 2013 | | San Antonio | | TX | | — |
| | 271 |
| | 812 |
| | — |
| | 1,083 |
| | (242 | ) | | 5/23/2013 | | 2013 |
| Dollar General | | San Antonio | | TX | | — |
| | 239 |
| | 956 |
| | — |
| | 1,195 |
| | (204 | ) | | 3/11/2013 | | 2013 | | San Antonio | | TX | | — |
| | 239 |
| | 956 |
| | — |
| | 1,195 |
| | (290 | ) | | 3/11/2013 | | 2013 |
| Dollar General | | San Antonio | | TX | | — |
| | 220 |
| | 880 |
| | — |
| | 1,100 |
| | (171 | ) | | 7/9/2013 | | 2013 | | San Antonio | | TX | | — |
| | 220 |
| | 880 |
| | — |
| | 1,100 |
| | (259 | ) | | 7/9/2013 | | 2013 |
| Dollar General | | San Antonio | | TX | | — |
| | 333 |
| | 776 |
| | — |
| | 1,109 |
| | (147 | ) | | 8/13/2013 | | 2013 | | San Antonio | | TX | | — |
| | 333 |
| | 776 |
| | — |
| | 1,109 |
| | (226 | ) | | 8/13/2013 | | 2013 |
| Dollar General | | San Benito | | TX | | — |
| | 202 |
| | 807 |
| | — |
| | 1,009 |
| | (153 | ) | | 8/23/2013 | | 2013 | | San Benito | | TX | | — |
| | 202 |
| | 807 |
| | — |
| | 1,009 |
| | (235 | ) | | 8/23/2013 | | 2013 |
| Dollar General | | San Juan | | TX | | — |
| | 169 |
| | 956 |
| | — |
| | 1,125 |
| | (168 | ) | | 11/15/2013 | | 2013 | | San Juan | | TX | | — |
| | 169 |
| | 956 |
| | — |
| | 1,125 |
| | (272 | ) | | 11/15/2013 | | 2013 |
| Dollar General | | Silsbee | | TX | | — |
| | 43 |
| | 810 |
| | — |
| | 853 |
| | (203 | ) | | 7/6/2012 | | 2012 | | San Leon | | TX | | — |
| | 87 |
| | 786 |
| | — |
| | 873 |
| | (249 | ) | | 9/25/2012 | | 2012 |
| Dollar General | | Skidmore | | TX | | — |
| | 90 |
| | 811 |
| | — |
| | 901 |
| | (177 | ) | | 2/14/2013 | | 2013 | | Silsbee | | TX | | — |
| | 43 |
| | 810 |
| | — |
| | 853 |
| | (261 | ) | | 7/6/2012 | | 2012 |
| Dollar General | | Sullivan City | | TX | | — |
| | 165 |
| | 876 |
| | — |
| | 1,041 |
| | (142 | ) | | 2/26/2014 | | 2014 | | Skidmore | | TX | | — |
| | 90 |
| | 811 |
| | — |
| | 901 |
| | (248 | ) | | 2/14/2013 | | 2013 |
| Dollar General | | Texarkana | | TX | | — |
| | 136 |
| | 772 |
| | — |
| | 908 |
| | (139 | ) | | 10/25/2013 | | 2013 | | Sullivan City | | TX | | — |
| | 165 |
| | 876 |
| | — |
| | 1,041 |
| | (240 | ) | | 2/26/2014 | | 2014 |
| Dollar General | | Troy | | TX | | — |
| | 93 |
| | 841 |
| | — |
| | 934 |
| | (203 | ) | | 9/12/2012 | | 2012 | | Texarkana | | TX | | — |
| | 136 |
| | 772 |
| | — |
| | 908 |
| | (221 | ) | | 10/25/2013 | | 2013 |
| Dollar General | | Tyler | | TX | | — |
| | 219 |
| | 875 |
| | — |
| | 1,094 |
| | (215 | ) | | 8/31/2012 | | 2010 | | Troy | | TX | | — |
| | 93 |
| | 841 |
| | — |
| | 934 |
| | (267 | ) | | 9/12/2012 | | 2012 |
| Dollar General | | Tyler | | TX | | — |
| | 602 |
| | 956 |
| | — |
| | 1,558 |
| | (157 | ) | | 2/7/2014 | | 2013 | | Tyler | | TX | | — |
| | 219 |
| | 875 |
| | — |
| | 1,094 |
| | (280 | ) | | 8/31/2012 | | 2010 |
| Dollar General | | Victoria | | TX | | — |
| | 91 |
| | 817 |
| | — |
| | 908 |
| | (182 | ) | | 1/31/2013 | | 2013 | | Tyler | | TX | | — |
| | 602 |
| | 956 |
| | — |
| | 1,558 |
| | (266 | ) | | 2/7/2014 | | 2013 |
| Dollar General | | Vidor | | TX | | — |
| | — |
| | 1,182 |
| | — |
| | 1,182 |
| | (176 | ) | | 2/7/2014 | | 2012 | | Victoria | | TX | | — |
| | 91 |
| | 817 |
| | — |
| | 908 |
| | (252 | ) | | 1/31/2013 | | 2013 |
| | | | | | Initial Costs (1) | | Costs Capitalized Subsequent to Acquisition (2) | | Gross Amount
Carried at
December 31, 2016
(3) (4) | | | | | | Initial Costs (1) | | Costs Capitalized Subsequent to Acquisition (2) | | Gross Amount
Carried at
December 31, 2018
(3) (4) | | | |
| Property | | City | | State | | Encumbrances at
December 31, 2016 | | Land | | Buildings, Fixtures and Improvements | | Accumulated Depreciation
(3) (5) | | Date Acquired | | Date of Construction | | City | | State | | Encumbrances at
December 31, 2018 | | Land | | Buildings, Fixtures and Improvements | | Accumulated Depreciation
(3) (5) | | Date Acquired | | Date of Construction |
| Dollar General | | Waco | | TX | | — |
| | 192 |
| | 767 |
| | — |
| | 959 |
| | (188 | ) | | 8/31/2012 | | 2012 | | Vidor | | TX | | — |
| | — |
| | 1,182 |
| | — |
| | 1,182 |
| | (298 | ) | | 2/7/2014 | | 2012 |
| Dollar General | | Weslaco | | TX | | — |
| | 215 |
| | 862 |
| | — |
| | 1,077 |
| | (208 | ) | | 9/24/2012 | | 2012 | | Waco | | TX | | — |
| | 192 |
| | 767 |
| | — |
| | 959 |
| | (245 | ) | | 8/31/2012 | | 2012 |
| Dollar General | | Weslaco | | TX | | — |
| | 205 |
| | 822 |
| | — |
| | 1,027 |
| | (148 | ) | | 10/16/2013 | | 2013 | | Weslaco | | TX | | — |
| | 215 |
| | 862 |
| | — |
| | 1,077 |
| | (273 | ) | | 9/24/2012 | | 2012 |
| Dollar General | | Burkeville | | VA | | — |
| | 160 |
| | 906 |
| | — |
| | 1,066 |
| | (235 | ) | | 5/8/2012 | | 2012 | | Weslaco | | TX | | — |
| | 205 |
| | 822 |
| | — |
| | 1,027 |
| | (236 | ) | | 10/16/2013 | | 2013 |
| Dollar General | | Richmond | | VA | | 400 |
| | 242 |
| | 726 |
| | — |
| | 968 |
| | (199 | ) | | 2/6/2012 | | 2011 | | Burkeville | | VA | | — |
| | 160 |
| | 906 |
| | — |
| | 1,066 |
| | (296 | ) | | 5/8/2012 | | 2012 |
| Dollar General | | Danville | | VA | | 300 |
| | 155 |
| | 621 |
| | — |
| | 776 |
| | (170 | ) | | 2/6/2012 | | 2011 | | Danville | | VA | | 300 |
| | 155 |
| | 621 |
| | — |
| | 776 |
| | (207 | ) | | 2/6/2012 | | 2011 |
| Dollar General | | Hopewell | | VA | | 500 |
| | 584 |
| | 713 |
| | — |
| | 1,297 |
| | (195 | ) | | 2/6/2012 | | 2011 | | Hopewell | | VA | | 500 |
| | 584 |
| | 713 |
| | — |
| | 1,297 |
| | (238 | ) | | 2/6/2012 | | 2011 |
| Dollar General | | Hot Springs | | VA | | 400 |
| | 283 |
| | 661 |
| | — |
| | 944 |
| | (181 | ) | | 2/6/2012 | | 2011 | | Hot Springs | | VA | | 400 |
| | 283 |
| | 661 |
| | — |
| | 944 |
| | (220 | ) | | 2/6/2012 | | 2011 |
| Dollar General | | Mellen | | WI | | 300 |
| | 79 |
| | 711 |
| | — |
| | 790 |
| | (201 | ) | | 12/30/2011 | | 2011 | | Richmond | | VA | | 400 |
| | 242 |
| | 726 |
| | — |
| | 968 |
| | (242 | ) | | 2/6/2012 | | 2011 |
| Dollar General | | Minong | | WI | | 300 |
| | 38 |
| | 727 |
| | — |
| | 765 |
| | (205 | ) | | 12/30/2011 | | 2011 | | Mellen | | WI | | 300 |
| | 79 |
| | 711 |
| | — |
| | 790 |
| | (241 | ) | | 12/30/2011 | | 2011 |
| Dollar General | | Solon Springs | | WI | | 300 |
| | 76 |
| | 685 |
| | — |
| | 761 |
| | (193 | ) | | 12/30/2011 | | 2011 | | Minong | | WI | | 300 |
| | 38 |
| | 727 |
| | — |
| | 765 |
| | (246 | ) | | 12/30/2011 | | 2011 |
| Dollar General | | Chelyan | | WV | | — |
| | 273 |
| | 1,092 |
| | — |
| | 1,365 |
| | (202 | ) | | 9/27/2013 | | 2013 | | Solon Springs | | WI | | 300 |
| | 76 |
| | 685 |
| | — |
| | 761 |
| | (232 | ) | | 12/30/2011 | | 2011 |
| Dollar General | | Cowen | | WV | | — |
| | 196 |
| | 783 |
| | — |
| | 979 |
| | (174 | ) | | 1/16/2013 | | 2012 | | Chelyan | | WV | | — |
| | 273 |
| | 1,092 |
| | — |
| | 1,365 |
| | (316 | ) | | 9/27/2013 | | 2013 |
| Dollar General | | Elkview | | WV | | — |
| | 274 |
| | 823 |
| | — |
| | 1,097 |
| | (156 | ) | | 8/2/2013 | | 2013 | | Cowen | | WV | | — |
| | 196 |
| | 783 |
| | — |
| | 979 |
| | (241 | ) | | 1/16/2013 | | 2012 |
| Dollar General | | Mcmechen | | WV | | — |
| | 91 |
| | 819 |
| | — |
| | 910 |
| | (182 | ) | | 1/9/2013 | | 2012 | | Elkview | | WV | | — |
| | 274 |
| | 823 |
| | — |
| | 1,097 |
| | (240 | ) | | 8/2/2013 | | 2013 |
| Dollar General | | Millwood | | WV | | — |
| | 98 |
| | 881 |
| | — |
| | 979 |
| | (171 | ) | | 7/2/2013 | | 2013 | | Mcmechen | | WV | | — |
| | 91 |
| | 819 |
| | — |
| | 910 |
| | (252 | ) | | 1/9/2013 | | 2012 |
| Dollar General | | Oceana | | WV | | — |
| | 317 |
| | 1,023 |
| | — |
| | 1,340 |
| | (101 | ) | | 11/20/2014 | | 2014 | | Millwood | | WV | | — |
| | 98 |
| | 881 |
| | — |
| | 979 |
| | (259 | ) | | 7/2/2013 | | 2013 |
| Dollar General | | Powhatan Point | | OH | | — |
| | 138 |
| | 784 |
| | — |
| | 922 |
| | (152 | ) | | 7/2/2013 | | 2014 | | Oceana | | WV | | — |
| | 317 |
| | 1,023 |
| | — |
| | 1,340 |
| | (192 | ) | | 11/20/2014 | | 2014 |
| Dollar Tree | | Chiefland | | FL | | — |
| | 322 |
| | 1,123 |
| | — |
| | 1,445 |
| | (176 | ) | | 3/31/2014 | | 2013 | | Huntsville | | AL | | — |
| | 476 |
| | 1,092 |
| | — |
| | 1,568 |
| | (199 | ) | | 8/29/2014 | | 2014 |
| Dunkin Donuts/Baskin-Robbins | | Dearborn Heights | | MI | | — |
| | 230 |
| | 846 |
| | — |
| | 1,076 |
| | (162 | ) | | 6/27/2013 | | 1995 | |
| Earhart Corporate Center | | Ann Arbor | | MI | | 27,678 |
| | 3,520 |
| | 39,639 |
| | (7,268 | ) | | 35,891 |
| | (1,013 | ) | | 11/5/2013 | | 2006 | |
| Eegee's | | Tucson | | AZ | | — |
| | 357 |
| | 436 |
| | — |
| | 793 |
| | (80 | ) | | 7/31/2013 | | 1990 | |
| Einstein Bros. Bagels | | Dearborn | | MI | | — |
| | 190 |
| | 724 |
| | — |
| | 914 |
| | (139 | ) | | 6/27/2013 | | 1995 | |
| El Chico | | Killeen | | TX | | — |
| | 534 |
| | 992 |
| | (803 | ) | | 723 |
| | (45 | ) | | 7/31/2013 | | 1993 | |
| Elite Production Services | | Cuero | | TX | | — |
| | 127 |
| | 982 |
| | — |
| | 1,109 |
| | (111 | ) | | 6/25/2014 | | 2014 | |
| EMC Corporation | | Bedford | | MA | | 51,400 |
| | 16,594 |
| | 75,137 |
| | 203 |
| | 91,934 |
| | (10,030 | ) | | 2/7/2014 | | 2001 | |
| Emdeon Business Services | | Nashville | | TN | | 4,700 |
| | 688 |
| | 10,417 |
| | — |
| | 11,105 |
| | (1,254 | ) | | 2/7/2014 | | 2010 | |
| Encana Oil & Gas | | Plano | | TX | | 66,000 |
| | 2,493 |
| | 95,231 |
| | — |
| | 97,724 |
| | (11,369 | ) | | 2/7/2014 | | 2012 | |
| Energy Maintenance Services US | | Pasadena | | TX | | — |
| | 393 |
| | 2,878 |
| | — |
| | 3,271 |
| | (326 | ) | | 6/12/2014 | | 2011 | |
| Evans Exchange | | Evans | | GA | | 6,610 |
| | 3,452 |
| | 9,821 |
| | 18 |
| | 13,291 |
| | (1,490 | ) | | 2/7/2014 | | 2009 | |
| Exelis | | Herndon | | VA | | — |
| | 1,384 |
| | 53,584 |
| | — |
| | 54,968 |
| | (8,133 | ) | | 11/5/2013 | | 1999 | |
| Experian | | Schaumburg | | IL | | — |
| | 5,935 |
| | 26,003 |
| | (5,778 | ) | | 26,160 |
| | (818 | ) | | 2/7/2014 | | 1986 | |
| Express Energy Services | | Pleasanton | | TX | | — |
| | 413 |
| | 5,541 |
| | — |
| | 5,954 |
| | (630 | ) | | 6/12/2014 | | 2012 | |
| Dollar Tree | | | Beverly Hills | | FL | | — |
| | 409 |
| | 965 |
| | — |
| | 1,374 |
| | (182 | ) | | 8/28/2014 | | 2013 |
| Dollar Tree | | | Bonita Springs | | FL | | — |
| | 672 |
| | 918 |
| | — |
| | 1,590 |
| | (261 | ) | | 2/7/2014 | | 2013 |
| Dollar Tree | | | Chiefland | | FL | | — |
| | 322 |
| | 1,123 |
| | — |
| | 1,445 |
| | (302 | ) | | 3/31/2014 | | 2013 |
| Dollar Tree | | | Fort Myers | | FL | | 973 |
| | 189 |
| | 1,344 |
| | — |
| | 1,533 |
| | (353 | ) | | 2/7/2014 | | 2002 |
| Dollar Tree | | | Ormond Beach | | FL | | — |
| | 573 |
| | 860 |
| | — |
| | 1,433 |
| | (255 | ) | | 6/4/2013 | | 2008 |
| Dollar Tree | | | Oviedo | | FL | | — |
| | 469 |
| | 848 |
| | — |
| | 1,317 |
| | (234 | ) | | 2/19/2014 | | 2013 |
| Dollar Tree | | | Des Moines | | IA | | — |
| | 152 |
| | 863 |
| | 6 |
| | 1,021 |
| | (252 | ) | | 8/30/2013 | | 1995 |
| Dollar Tree | | | Lombard | | IL | | — |
| | 1,008 |
| | 543 |
| | — |
| | 1,551 |
| | (153 | ) | | 12/12/2013 | | 1967 |
| Dollar Tree | | | Baton Rouge | | LA | | — |
| | 377 |
| | 716 |
| | — |
| | 1,093 |
| | (202 | ) | | 2/7/2014 | | 2003 |
| Dollar Tree | | | Burton | | MI | | 866 |
| | 131 |
| | 1,164 |
| | — |
| | 1,295 |
| | (317 | ) | | 2/7/2014 | | 2003 |
| Dollar Tree | | | Winona | | MS | | — |
| | 146 |
| | 585 |
| | — |
| | 731 |
| | (188 | ) | | 7/31/2012 | | 2012 |
| Dollar Tree | | | Hoosick Falls | | NY | | — |
| | 181 |
| | 724 |
| | — |
| | 905 |
| | (218 | ) | | 4/26/2013 | | 2013 |
| Dollar Tree | | | Caldwell | | TX | | — |
| | 138 |
| | 552 |
| | 387 |
| | 1,077 |
| | (180 | ) | | 5/29/2012 | | 2012 |
| | | | | | Initial Costs (1) | | Costs Capitalized Subsequent to Acquisition (2) | | Gross Amount
Carried at
December 31, 2016
(3) (4) | | | | | | Initial Costs (1) | | Costs Capitalized Subsequent to Acquisition (2) | | Gross Amount
Carried at
December 31, 2018
(3) (4) | | | |
| Property | | City | | State | | Encumbrances at
December 31, 2016 | | Land | | Buildings, Fixtures and Improvements | | Accumulated Depreciation
(3) (5) | | Date Acquired | | Date of Construction | | City | | State | | Encumbrances at
December 31, 2018 | | Land | | Buildings, Fixtures and Improvements | | Accumulated Depreciation
(3) (5) | | Date Acquired | | Date of Construction |
| Duluth Trading Co | | | South Portland | | ME | | — |
| | 811 |
| | 3,254 |
| | — |
| | 4,065 |
| | (4 | ) | | 12/13/2018 | | 2018 |
| Duluth Trading Co | | | West Fargo | | ND | | — |
| | 1,099 |
| | 3,208 |
| | — |
| | 4,307 |
| | (68 | ) | | 4/27/2018 | | 2018 |
| Duluth Trading Co | | | Avon | | OH | | — |
| | 1,088 |
| | 3,671 |
| | — |
| | 4,759 |
| | (159 | ) | | 10/20/2017 | | 2017 |
| Duluth Trading Co | | | Waukesha | | WI | | — |
| | 857 |
| | 4,067 |
| | — |
| | 4,924 |
| | (123 | ) | | 12/14/2017 | | 2017 |
| Dunkin Donuts/Baskin-Robbins | | | Dearborn Heights | | MI | | — |
| | 230 |
| | 846 |
| | — |
| | 1,076 |
| | (248 | ) | | 6/27/2013 | | 1995 |
| Earhart Corporate Center | | | Ann Arbor | | MI | | 26,437 |
| | 3,520 |
| | 39,639 |
| | (6,281 | ) | | 36,878 |
| | (3,778 | ) | | 11/5/2013 | | 2006 |
| Eastchase Central | | | Montgomery | | AL | | — |
| | 1,480 |
| | 9,117 |
| | 314 |
| | 10,911 |
| | (379 | ) | | 11/17/2017 | | 2017 |
| Eegee's | | | Tucson | | AZ | | — |
| | 357 |
| | 436 |
| | — |
| | 793 |
| | (122 | ) | | 7/31/2013 | | 1990 |
| Einstein Bros. Bagels | | | Dearborn | | MI | | — |
| | 190 |
| | 724 |
| | — |
| | 914 |
| | (212 | ) | | 6/27/2013 | | 1995 |
| Elite Production Services | | | Cuero | | TX | | — |
| | 127 |
| | 982 |
| | — |
| | 1,109 |
| | (199 | ) | | 6/25/2014 | | 2014 |
| EMC Corporation | | | Bedford | | MA | | 50,684 |
| | 16,594 |
| | 75,137 |
| | 203 |
| | 91,934 |
| | (17,067 | ) | | 2/7/2014 | | 2001 |
| Energy Maintenance Services US | | | Pasadena | | TX | | — |
| | 393 |
| | 2,878 |
| | — |
| | 3,271 |
| | (583 | ) | | 6/12/2014 | | 2011 |
| Evans Exchange | | | Evans | | GA | | 6,420 |
| | 3,452 |
| | 9,821 |
| | 18 |
| | 13,291 |
| | (2,530 | ) | | 2/7/2014 | | 2009 |
| Experian | | | Schaumburg | | IL | | — |
| | 5,935 |
| | 26,003 |
| | (5,777 | ) | | 26,161 |
| | (3,003 | ) | | 2/7/2014 | | 1986 |
| Express Energy Services | | | Pleasanton | | TX | | — |
| | 413 |
| | 5,541 |
| | — |
| | 5,954 |
| | (1,125 | ) | | 6/12/2014 | | 2012 |
| Express Scripts | | St. Louis | | MO | | 22,620 |
| | 5,706 |
| | 32,333 |
| | — |
| | 38,039 |
| | (9,472 | ) | | 1/25/2012 | | 2011 | | St. Louis | | MO | | — |
| | 5,706 |
| | 32,333 |
| | — |
| | 38,039 |
| | (11,521 | ) | | 1/25/2012 | | 2011 |
| Exterran Energy Solutions | | Fort Worth | | TX | | — |
| | 1,360 |
| | 5,704 |
| | — |
| | 7,064 |
| | (627 | ) | | 9/5/2014 | | 2011 | | Fort Worth | | TX | | — |
| | 1,360 |
| | 5,704 |
| | — |
| | 7,064 |
| | (1,164 | ) | | 9/5/2014 | | 2011 |
| Eyemart Express | | | Port Arthur | | TX | | 8,077 |
| | 3,331 |
| | 14,992 |
| | 152 |
| | 18,475 |
| | (3,619 | ) | | 2/7/2014 | | 2008 |
| Family Dollar | | Bessemer | | AL | | — |
| | 295 |
| | 1,301 |
| | — |
| | 1,596 |
| | (163 | ) | | 6/16/2014 | | 2014 | | Bessemer | | AL | | — |
| | 295 |
| | 1,301 |
| | — |
| | 1,596 |
| | (292 | ) | | 6/16/2014 | | 2014 |
| Family Dollar | | Camden | | AL | | — |
| | 137 |
| | 851 |
| | — |
| | 988 |
| | (117 | ) | | 5/29/2014 | | 2014 | | Camden | | AL | | — |
| | 137 |
| | 851 |
| | — |
| | 988 |
| | (206 | ) | | 5/29/2014 | | 2014 |
| Family Dollar | | Grove Hill | | AL | | — |
| | 144 |
| | 741 |
| | — |
| | 885 |
| | (77 | ) | | 7/24/2014 | | 2013 | | Grove Hill | | AL | | — |
| | 144 |
| | 741 |
| | — |
| | 885 |
| | (139 | ) | | 7/24/2014 | | 2013 |
| Family Dollar | | Hayneville | | AL | | — |
| | 172 |
| | 722 |
| | — |
| | 894 |
| | (107 | ) | | 5/7/2014 | | 2013 | | Hayneville | | AL | | — |
| | 172 |
| | 722 |
| | — |
| | 894 |
| | (189 | ) | | 5/7/2014 | | 2013 |
| Family Dollar | | Hoover | | AL | | — |
| | 368 |
| | 1,153 |
| | — |
| | 1,521 |
| | (118 | ) | | 8/29/2014 | | 2014 | | Hoover | | AL | | — |
| | 368 |
| | 1,153 |
| | — |
| | 1,521 |
| | (218 | ) | | 8/29/2014 | | 2014 |
| Family Dollar | | Huntsville | | AL | | — |
| | 476 |
| | 1,092 |
| | — |
| | 1,568 |
| | (108 | ) | | 8/29/2014 | | 2014 | | Huntsville | | AL | | — |
| | 628 |
| | 924 |
| | — |
| | 1,552 |
| | (154 | ) | | 1/12/2015 | | 2014 |
| Family Dollar | | Huntsville | | AL | | — |
| | 628 |
| | 924 |
| | — |
| | 1,552 |
| | (76 | ) | | 1/12/2015 | | 2014 | | Jemison | | AL | | 757 |
| | 143 |
| | 997 |
| | — |
| | 1,140 |
| | (273 | ) | | 2/7/2014 | | 2011 |
| Family Dollar | | Jemison | | AL | | 757 |
| | 143 |
| | 997 |
| | — |
| | 1,140 |
| | (161 | ) | | 2/7/2014 | | 2011 | | Marion | | AL | | — |
| | 247 |
| | 780 |
| | — |
| | 1,027 |
| | (148 | ) | | 7/30/2014 | | 2014 |
| Family Dollar | | Marion | | AL | | — |
| | 247 |
| | 780 |
| | — |
| | 1,027 |
| | (82 | ) | | 7/30/2014 | | 2014 | | Millbrook | | AL | | — |
| | 316 |
| | 1,052 |
| | — |
| | 1,368 |
| | (197 | ) | | 8/28/2014 | | 2013 |
| Family Dollar | | Millbrook | | AL | | — |
| | 316 |
| | 1,052 |
| | — |
| | 1,368 |
| | (107 | ) | | 8/28/2014 | | 2013 | | Montgomery | | AL | | — |
| | 218 |
| | 847 |
| | — |
| | 1,065 |
| | (160 | ) | | 8/28/2014 | | 2013 |
| Family Dollar | | Montgomery | | AL | | — |
| | 218 |
| | 847 |
| | — |
| | 1,065 |
| | (87 | ) | | 8/28/2014 | | 2013 | | Montgomery | | AL | | 959 |
| | 533 |
| | 936 |
| | — |
| | 1,469 |
| | (261 | ) | | 2/7/2014 | | 2010 |
| Family Dollar | | Montgomery | | AL | | 959 |
| | 533 |
| | 936 |
| | — |
| | 1,469 |
| | (154 | ) | | 2/7/2014 | | 2010 | | Wilmer | | AL | | — |
| | 221 |
| | 791 |
| | — |
| | 1,012 |
| | (190 | ) | | 5/29/2014 | | 2014 |
| Family Dollar | | Wilmer | | AL | | — |
| | 221 |
| | 791 |
| | — |
| | 1,012 |
| | (108 | ) | | 5/29/2014 | | 2014 | | El Dorado | | AR | | — |
| | 151 |
| | 806 |
| | — |
| | 957 |
| | (175 | ) | | 8/28/2014 | | 1988 |
| Family Dollar | | El Dorado | | AR | | — |
| | 151 |
| | 806 |
| | — |
| | 957 |
| | (96 | ) | | 8/28/2014 | | 1988 | | El Dorado | | AR | | 663 |
| | 49 |
| | 1,003 |
| | — |
| | 1,052 |
| | (257 | ) | | 2/7/2014 | | 2002 |
| Family Dollar | | El Dorado | | AR | | 663 |
| | 49 |
| | 1,003 |
| | — |
| | 1,052 |
| | (151 | ) | | 2/7/2014 | | 2002 | |
| Family Dollar | | Hot Springs | | AR | | — |
| | 247 |
| | 845 |
| | — |
| | 1,092 |
| | (133 | ) | | 2/7/2014 | | 2011 | |
| Family Dollar | | Jacksonville | | AR | | 571 |
| | 155 |
| | 758 |
| | — |
| | 913 |
| | (115 | ) | | 2/7/2014 | | 2002 | |
| Family Dollar | | Little Rock | | AR | | 467 |
| | 125 |
| | 629 |
| | — |
| | 754 |
| | (95 | ) | | 2/7/2014 | | 2002 | |
| Family Dollar | | Ash Fork | | AZ | | — |
| | 123 |
| | 1,015 |
| | — |
| | 1,138 |
| | (104 | ) | | 8/28/2014 | | 2013 | |
| Family Dollar | | Avondale | | AZ | | 974 |
| | 603 |
| | 882 |
| | — |
| | 1,485 |
| | (146 | ) | | 2/7/2014 | | 2002 | |
| Family Dollar | | Casa Grande | | AZ | | — |
| | 454 |
| | 313 |
| | — |
| | 767 |
| | (58 | ) | | 2/7/2014 | | 2003 | |
| Family Dollar | | Coolidge | | AZ | | 603 |
| | 126 |
| | 785 |
| | — |
| | 911 |
| | (126 | ) | | 2/7/2014 | | 2000 | |
| Family Dollar | | Duncan | | AZ | | — |
| | 98 |
| | 895 |
| | — |
| | 993 |
| | (91 | ) | | 8/28/2014 | | 2013 | |
| Family Dollar | | Fort Mohave | | AZ | | — |
| | 302 |
| | 571 |
| | — |
| | 873 |
| | (97 | ) | | 2/7/2014 | | 2001 | |
| Family Dollar | | Golden Valley | | AZ | | — |
| | 110 |
| | 772 |
| | — |
| | 882 |
| | (92 | ) | | 8/28/2014 | | 2001 | |
| Family Dollar | | Guadalupe | | AZ | | — |
| | 400 |
| | 584 |
| | — |
| | 984 |
| | (99 | ) | | 2/7/2014 | | 2004 | |
| Family Dollar | | Mohave Valley | | AZ | | — |
| | 302 |
| | 281 |
| | — |
| | 583 |
| | (52 | ) | | 2/7/2014 | | 2003 | |
| Family Dollar | | Phoenix | | AZ | | — |
| | 303 |
| | 712 |
| | — |
| | 1,015 |
| | (83 | ) | | 8/28/2014 | | 2004 | |
| Family Dollar | | Phoenix | | AZ | | — |
| | 416 |
| | 1,229 |
| | — |
| | 1,645 |
| | (123 | ) | | 8/28/2014 | | 2013 | |
|
| | | | | | | | | | | | | | | | | | | | | | | | | | |
| | | | | | | | Initial Costs (1) | | Costs Capitalized Subsequent to Acquisition (2) | | Gross Amount
Carried at
December 31, 2018
(3) (4) | | | | | | |
| Property | | City | | State | | Encumbrances at
December 31, 2018 | | Land | | Buildings, Fixtures and Improvements | | | Accumulated Depreciation
(3) (5) | | Date Acquired | | Date of Construction |
| Family Dollar | | Hot Springs | | AR | | — |
| | 247 |
| | 845 |
| | — |
| | 1,092 |
| | (226 | ) | | 2/7/2014 | | 2011 |
| Family Dollar | | Jacksonville | | AR | | 571 |
| | 155 |
| | 758 |
| | — |
| | 913 |
| | (195 | ) | | 2/7/2014 | | 2002 |
| Family Dollar | | Little Rock | | AR | | 467 |
| | 125 |
| | 629 |
| | — |
| | 754 |
| | (161 | ) | | 2/7/2014 | | 2002 |
| Family Dollar | | Ash Fork | | AZ | | — |
| | 123 |
| | 1,015 |
| | — |
| | 1,138 |
| | (190 | ) | | 8/28/2014 | | 2013 |
| Family Dollar | | Avondale | | AZ | | 974 |
| | 603 |
| | 882 |
| | — |
| | 1,485 |
| | (248 | ) | | 2/7/2014 | | 2002 |
| Family Dollar | | Casa Grande | | AZ | | — |
| | 454 |
| | 313 |
| | — |
| | 767 |
| | (98 | ) | | 2/7/2014 | | 2003 |
| Family Dollar | | Coolidge | | AZ | | 603 |
| | 126 |
| | 785 |
| | — |
| | 911 |
| | (214 | ) | | 2/7/2014 | | 2000 |
| Family Dollar | | Duncan | | AZ | | — |
| | 98 |
| | 895 |
| | — |
| | 993 |
| | (168 | ) | | 8/28/2014 | | 2013 |
| Family Dollar | | Fort Mohave | | AZ | | — |
| | 302 |
| | 571 |
| | — |
| | 873 |
| | (164 | ) | | 2/7/2014 | | 2001 |
| Family Dollar | | Golden Valley | | AZ | | — |
| | 110 |
| | 772 |
| | — |
| | 882 |
| | (169 | ) | | 8/28/2014 | | 2001 |
| Family Dollar | | Guadalupe | | AZ | | — |
| | 400 |
| | 584 |
| | — |
| | 984 |
| | (168 | ) | | 2/7/2014 | | 2004 |
| Family Dollar | | Mohave Valley | | AZ | | — |
| | 302 |
| | 281 |
| | — |
| | 583 |
| | (88 | ) | | 2/7/2014 | | 2003 |
| Family Dollar | | Phoenix | | AZ | | — |
| | 303 |
| | 712 |
| | — |
| | 1,015 |
| | (153 | ) | | 8/28/2014 | | 2004 |
| Family Dollar | | Phoenix | | AZ | | — |
| | 416 |
| | 1,229 |
| | — |
| | 1,645 |
| | (226 | ) | | 8/28/2014 | | 2013 |
| | | | | | Initial Costs (1) | | Costs Capitalized Subsequent to Acquisition (2) | | Gross Amount
Carried at
December 31, 2016
(3) (4) | | | | | | Initial Costs (1) | | Costs Capitalized Subsequent to Acquisition (2) | | Gross Amount
Carried at
December 31, 2018
(3) (4) | | | |
| Property | | City | | State | | Encumbrances at
December 31, 2016 | | Land | | Buildings, Fixtures and Improvements | | Accumulated Depreciation
(3) (5) | | Date Acquired | | Date of Construction | | City | | State | | Encumbrances at
December 31, 2018 | | Land | | Buildings, Fixtures and Improvements | | Accumulated Depreciation
(3) (5) | | Date Acquired | | Date of Construction |
| Family Dollar | | Phoenix | | AZ | | — |
| | 1,109 |
| | 767 |
| | — |
| | 1,876 |
| | (134 | ) | | 2/7/2014 | | 2003 | | Phoenix | | AZ | | — |
| | 1,109 |
| | 767 |
| | — |
| | 1,876 |
| | (228 | ) | | 2/7/2014 | | 2003 |
| Family Dollar | | Phoenix | | AZ | | 1,040 |
| | 504 |
| | 1,079 |
| | — |
| | 1,583 |
| | (176 | ) | | 2/7/2014 | | 2003 | | Phoenix | | AZ | | 1,040 |
| | 504 |
| | 1,079 |
| | — |
| | 1,583 |
| | (298 | ) | | 2/7/2014 | | 2003 |
| Family Dollar | | Dacano | | CO | | 757 |
| | 155 |
| | 959 |
| | — |
| | 1,114 |
| | (157 | ) | | 2/7/2014 | | 2003 | | Dacano | | CO | | 757 |
| | 155 |
| | 959 |
| | — |
| | 1,114 |
| | (267 | ) | | 2/7/2014 | | 2003 |
| Family Dollar | | Fort Lupton | | CO | | 916 |
| | 154 |
| | 1,180 |
| | — |
| | 1,334 |
| | (192 | ) | | 2/7/2014 | | 1961 | | Fort Lupton | | CO | | 916 |
| | 154 |
| | 1,180 |
| | — |
| | 1,334 |
| | (326 | ) | | 2/7/2014 | | 1961 |
| Family Dollar | | Rangeley | | CO | | 323 |
| | 66 |
| | 593 |
| | — |
| | 659 |
| | (154 | ) | | 5/4/2012 | | 2010 | | Rangely | | CO | | — |
| | 66 |
| | 593 |
| | — |
| | 659 |
| | (194 | ) | | 5/4/2012 | | 2010 |
| Family Dollar | | New Britain | | CT | | — |
| | 484 |
| | 1,280 |
| | 26 |
| | 1,790 |
| | (122 | ) | | 10/14/2014 | | 2013 | | New Britain | | CT | | — |
| | 484 |
| | 1,280 |
| | 26 |
| | 1,790 |
| | (231 | ) | | 10/14/2014 | | 2013 |
| Family Dollar | | Wilmington | | DE | | — |
| | 540 |
| | 1,218 |
| | — |
| | 1,758 |
| | (92 | ) | | 4/21/2015 | | 2015 | | Wilmington | | DE | | — |
| | 540 |
| | 1,218 |
| | — |
| | 1,758 |
| | (199 | ) | | 4/21/2015 | | 2015 |
| Family Dollar | | Altha | | FL | | — |
| | 126 |
| | 727 |
| | — |
| | 853 |
| | (121 | ) | | 2/7/2014 | | 2011 | | Altha | | FL | | — |
| | 126 |
| | 727 |
| | — |
| | 853 |
| | (206 | ) | | 2/7/2014 | | 2011 |
| Family Dollar | | Anthony | | FL | | — |
| | 242 |
| | 1,037 |
| | — |
| | 1,279 |
| | (107 | ) | | 10/30/2014 | | 2014 | | Anthony | | FL | | — |
| | 242 |
| | 1,037 |
| | — |
| | 1,279 |
| | (200 | ) | | 10/30/2014 | | 2014 |
| Family Dollar | | Apopka | | FL | | 1,127 |
| | 518 |
| | 1,402 |
| | — |
| | 1,920 |
| | (209 | ) | | 2/7/2014 | | 2011 | | Apopka | | FL | | 1,127 |
| | 518 |
| | 1,402 |
| | — |
| | 1,920 |
| | (355 | ) | | 2/7/2014 | | 2011 |
| Family Dollar | | Auburndale | | FL | | — |
| | 314 |
| | 951 |
| | — |
| | 1,265 |
| | (97 | ) | | 8/28/2014 | | 2013 | | Auburndale | | FL | | — |
| | 314 |
| | 951 |
| | — |
| | 1,265 |
| | (177 | ) | | 8/28/2014 | | 2013 |
| Family Dollar | | Belleview | | FL | | — |
| | 332 |
| | 829 |
| | — |
| | 1,161 |
| | (129 | ) | | 2/7/2014 | | 2013 | | Belleview | | FL | | — |
| | 332 |
| | 829 |
| | — |
| | 1,161 |
| | (219 | ) | | 2/7/2014 | | 2013 |
| Family Dollar | | Beverly Hills | | FL | | — |
| | 409 |
| | 965 |
| | — |
| | 1,374 |
| | (99 | ) | | 8/28/2014 | | 2013 | | Bristol | | FL | | 631 |
| | 202 |
| | 727 |
| | — |
| | 929 |
| | (208 | ) | | 2/7/2014 | | 2011 |
| Family Dollar | | Bonita Springs | | FL | | — |
| | 672 |
| | 918 |
| | — |
| | 1,590 |
| | (154 | ) | | 2/7/2014 | | 2013 | | Bunnell | | FL | | — |
| | 188 |
| | 936 |
| | — |
| | 1,124 |
| | (178 | ) | | 8/28/2014 | | 2013 |
| Family Dollar | | Bristol | | FL | | 631 |
| | 202 |
| | 727 |
| | — |
| | 929 |
| | (123 | ) | | 2/7/2014 | | 2011 | | Cape Coral | | FL | | — |
| | 675 |
| | 1,190 |
| | — |
| | 1,865 |
| | (322 | ) | | 3/5/2014 | | 2013 |
| Family Dollar | | Bunnell | | FL | | — |
| | 188 |
| | 936 |
| | — |
| | 1,124 |
| | (97 | ) | | 8/28/2014 | | 2013 | | Citra | | FL | | — |
| | 47 |
| | 1,038 |
| | — |
| | 1,085 |
| | (192 | ) | | 8/28/2014 | | 2013 |
| Family Dollar | | Cape Coral | | FL | | — |
| | 675 |
| | 1,190 |
| | — |
| | 1,865 |
| | (188 | ) | | 3/5/2014 | | 2013 | | Clearwater | | FL | | — |
| | 425 |
| | 1,006 |
| | — |
| | 1,431 |
| | (183 | ) | | 8/22/2014 | | 2014 |
| Family Dollar | | Citra | | FL | | — |
| | 47 |
| | 1,038 |
| | — |
| | 1,085 |
| | (105 | ) | | 8/28/2014 | | 2013 | | Deland | | FL | | 1,057 |
| | 492 |
| | 1,293 |
| | — |
| | 1,785 |
| | (333 | ) | | 2/7/2014 | | 2011 |
| Family Dollar | | Clearwater | | FL | | — |
| | 425 |
| | 1,006 |
| | — |
| | 1,431 |
| | (99 | ) | | 8/22/2014 | | 2014 | | Deltona | | FL | | 686 |
| | 171 |
| | 1,074 |
| | — |
| | 1,245 |
| | (262 | ) | | 2/7/2014 | | 2004 |
| Family Dollar | | Deland | | FL | | 1,057 |
| | 492 |
| | 1,293 |
| | — |
| | 1,785 |
| | (196 | ) | | 2/7/2014 | | 2011 | | Deltona | | FL | | 1,042 |
| | 206 |
| | 1,578 |
| | — |
| | 1,784 |
| | (397 | ) | | 2/7/2014 | | 2011 |
| Family Dollar | | Deltona | | FL | | 686 |
| | 171 |
| | 1,074 |
| | — |
| | 1,245 |
| | (155 | ) | | 2/7/2014 | | 2004 | | Fort Meade | | FL | | 417 |
| | 211 |
| | 606 |
| | — |
| | 817 |
| | (144 | ) | | 2/7/2014 | | 2000 |
| Family Dollar | | Deltona | | FL | | 1,042 |
| | 206 |
| | 1,578 |
| | — |
| | 1,784 |
| | (234 | ) | | 2/7/2014 | | 2011 | | Fountain | | FL | | — |
| | 202 |
| | 825 |
| | — |
| | 1,027 |
| | (157 | ) | | 8/28/2014 | | 2014 |
| Family Dollar | | Fort Meade | | FL | | 417 |
| | 211 |
| | 606 |
| | — |
| | 817 |
| | (85 | ) | | 2/7/2014 | | 2000 | | Gainesville | | FL | | 1,002 |
| | 423 |
| | 1,263 |
| | (16 | ) | | 1,670 |
| | (322 | ) | | 2/7/2014 | | 2011 |
| Family Dollar | | Fort Myers | | FL | | 973 |
| | 189 |
| | 1,344 |
| | — |
| | 1,533 |
| | (208 | ) | | 2/7/2014 | | 2002 | | Graceville | | FL | | — |
| | 367 |
| | 810 |
| | — |
| | 1,177 |
| | (217 | ) | | 4/30/2014 | | 2013 |
| Family Dollar | | Fountain | | FL | | — |
| | 202 |
| | 825 |
| | — |
| | 1,027 |
| | (85 | ) | | 8/28/2014 | | 2014 | | Jacksonville | | FL | | 1,028 |
| | 271 |
| | 1,121 |
| | — |
| | 1,392 |
| | (278 | ) | | 2/7/2014 | | 2011 |
| Family Dollar | | Gainesville | | FL | | 1,002 |
| | 423 |
| | 1,263 |
| | — |
| | 1,686 |
| | (190 | ) | | 2/7/2014 | | 2011 | | Jacksonville | | FL | | 789 |
| | 545 |
| | 1,173 |
| | — |
| | 1,718 |
| | (303 | ) | | 2/7/2014 | | 2008 |
| Family Dollar | | Graceville | | FL | | — |
| | 367 |
| | 810 |
| | — |
| | 1,177 |
| | (125 | ) | | 4/30/2014 | | 2013 | | Lake Alfred | | FL | | — |
| | 484 |
| | 1,006 |
| | — |
| | 1,490 |
| | (151 | ) | | 12/23/2014 | | 2014 |
| Family Dollar | | Jacksonville | | FL | | 1,028 |
| | 271 |
| | 1,121 |
| | — |
| | 1,392 |
| | (164 | ) | | 2/7/2014 | | 2011 | | Lake City | | FL | | 622 |
| | 186 |
| | 872 |
| | — |
| | 1,058 |
| | (224 | ) | | 2/7/2014 | | 2011 |
| Family Dollar | | Jacksonville | | FL | | 789 |
| | 545 |
| | 1,173 |
| | — |
| | 1,718 |
| | (179 | ) | | 2/7/2014 | | 2008 | | Lake Panasoffkee | | FL | | — |
| | 237 |
| | 696 |
| | — |
| | 933 |
| | (189 | ) | | 3/25/2014 | | 2013 |
| Family Dollar | | Kissimmee | | FL | | 970 |
| | 643 |
| | 1,071 |
| | — |
| | 1,714 |
| | (158 | ) | | 2/7/2014 | | 2011 | | Lakeland | | FL | | 732 |
| | 339 |
| | 785 |
| | — |
| | 1,124 |
| | (217 | ) | | 2/7/2014 | | 2003 |
| Family Dollar | | Lake Alfred | | FL | | — |
| | 484 |
| | 1,006 |
| | — |
| | 1,490 |
| | (76 | ) | | 12/23/2014 | | 2014 | | Largo | | FL | | — |
| | 844 |
| | 962 |
| | — |
| | 1,806 |
| | (266 | ) | | 2/7/2014 | | 2013 |
| Family Dollar | | Lake City | | FL | | 622 |
| | 186 |
| | 872 |
| | — |
| | 1,058 |
| | (132 | ) | | 2/7/2014 | | 2011 | | Middleburg | | FL | | — |
| | 274 |
| | 822 |
| | — |
| | 1,096 |
| | (243 | ) | | 6/4/2013 | | 2008 |
| | | | | | Initial Costs (1) | | Costs Capitalized Subsequent to Acquisition (2) | | Gross Amount
Carried at
December 31, 2016
(3) (4) | | | | | | Initial Costs (1) | | Costs Capitalized Subsequent to Acquisition (2) | | Gross Amount
Carried at
December 31, 2018
(3) (4) | | | |
| Property | | City | | State | | Encumbrances at
December 31, 2016 | | Land | | Buildings, Fixtures and Improvements | | Accumulated Depreciation
(3) (5) | | Date Acquired | | Date of Construction | | City | | State | | Encumbrances at
December 31, 2018 | | Land | | Buildings, Fixtures and Improvements | | Accumulated Depreciation
(3) (5) | | Date Acquired | | Date of Construction |
| Family Dollar | | Lake Panasoffkee | | FL | | — |
| | 237 |
| | 696 |
| | — |
| | 933 |
| | (110 | ) | | 3/25/2014 | | 2013 | | Milton | | FL | | 644 |
| | 544 |
| | 683 |
| | — |
| | 1,227 |
| | (163 | ) | | 2/7/2014 | | 2010 |
| Family Dollar | | Lakeland | | FL | | 732 |
| | 339 |
| | 785 |
| | — |
| | 1,124 |
| | (128 | ) | | 2/7/2014 | | 2003 | | Mulberry | | FL | | — |
| | 131 |
| | 1,156 |
| | — |
| | 1,287 |
| | (214 | ) | | 8/28/2014 | | 2013 |
| Family Dollar | | Largo | | FL | | — |
| | 844 |
| | 962 |
| | — |
| | 1,806 |
| | (157 | ) | | 2/7/2014 | | 2013 | | Ocala | | FL | | — |
| | 108 |
| | 816 |
| | — |
| | 924 |
| | (161 | ) | | 8/28/2014 | | 2005 |
| Family Dollar | | Middleburg | | FL | | — |
| | 274 |
| | 822 |
| | — |
| | 1,096 |
| | (163 | ) | | 6/4/2013 | | 2008 | | Ocala | | FL | | — |
| | 344 |
| | 1,251 |
| | — |
| | 1,595 |
| | (316 | ) | | 2/7/2014 | | 2006 |
| Family Dollar | | Milton | | FL | | 644 |
| | 544 |
| | 683 |
| | — |
| | 1,227 |
| | (96 | ) | | 2/7/2014 | | 2010 | | Ocala | | FL | | 968 |
| | 554 |
| | 984 |
| | — |
| | 1,538 |
| | (266 | ) | | 2/7/2014 | | 2011 |
| Family Dollar | | Mulberry | | FL | | — |
| | 131 |
| | 1,156 |
| | — |
| | 1,287 |
| | (116 | ) | | 8/28/2014 | | 2013 | | Okeechobee | | FL | | 894 |
| | 655 |
| | 580 |
| | — |
| | 1,235 |
| | (187 | ) | | 2/7/2014 | | 2011 |
| Family Dollar | | Ocala | | FL | | — |
| | 108 |
| | 816 |
| | — |
| | 924 |
| | (88 | ) | | 8/28/2014 | | 2005 | | Orlando | | FL | | — |
| | 349 |
| | 1,294 |
| | — |
| | 1,643 |
| | (236 | ) | | 8/28/2014 | | 2014 |
| Family Dollar | | Ocala | | FL | | — |
| | 344 |
| | 1,251 |
| | — |
| | 1,595 |
| | (186 | ) | | 2/7/2014 | | 2006 | | Orlando | | FL | | — |
| | 291 |
| | 1,286 |
| | — |
| | 1,577 |
| | (235 | ) | | 8/28/2014 | | 2013 |
| Family Dollar | | Ocala | | FL | | 968 |
| | 554 |
| | 984 |
| | — |
| | 1,538 |
| | (157 | ) | | 2/7/2014 | | 2011 | | Ormond Beach | | FL | | — |
| | 675 |
| | 1,152 |
| | — |
| | 1,827 |
| | (294 | ) | | 2/7/2014 | | 2011 |
| Family Dollar | | Okeechobee | | FL | | 894 |
| | 655 |
| | 580 |
| | — |
| | 1,235 |
| | (110 | ) | | 2/7/2014 | | 2011 | | Palatka | | FL | | — |
| | 316 |
| | 1,054 |
| | — |
| | 1,370 |
| | (281 | ) | | 4/25/2014 | | 2014 |
| Family Dollar | | Orlando | | FL | | — |
| | 349 |
| | 1,294 |
| | — |
| | 1,643 |
| | (128 | ) | | 8/28/2014 | | 2014 | | Pembroke Park | | FL | | 1,141 |
| | 656 |
| | 944 |
| | — |
| | 1,600 |
| | (284 | ) | | 2/7/2014 | | 2006 |
| Family Dollar | | Orlando | | FL | | — |
| | 291 |
| | 1,286 |
| | — |
| | 1,577 |
| | (128 | ) | | 8/28/2014 | | 2013 | | Pensacola | | FL | | — |
| | 69 |
| | 1,085 |
| | — |
| | 1,154 |
| | (198 | ) | | 8/28/2014 | | 2013 |
| Family Dollar | | Ormond Beach | | FL | | — |
| | 573 |
| | 860 |
| | — |
| | 1,433 |
| | (171 | ) | | 6/4/2013 | | 2008 | | Pensacola | | FL | | 559 |
| | 146 |
| | 907 |
| | — |
| | 1,053 |
| | (218 | ) | | 2/7/2014 | | 2003 |
| Family Dollar | | Ormond Beach | | FL | | — |
| | 675 |
| | 1,152 |
| | — |
| | 1,827 |
| | (173 | ) | | 2/7/2014 | | 2011 | | Plant City | | FL | | — |
| | 279 |
| | 1,040 |
| | — |
| | 1,319 |
| | (264 | ) | | 2/7/2014 | | 2004 |
| Family Dollar | | Oviedo | | FL | | — |
| | 469 |
| | 848 |
| | — |
| | 1,317 |
| | (138 | ) | | 2/19/2014 | | 2013 | | Plant City | | FL | | 1,173 |
| | 712 |
| | 1,113 |
| | — |
| | 1,825 |
| | (307 | ) | | 2/7/2014 | | 2005 |
| Family Dollar | | Palatka | | FL | | — |
| | 316 |
| | 1,054 |
| | — |
| | 1,370 |
| | (162 | ) | | 4/25/2014 | | 2014 | | Sebring | | FL | | — |
| | 492 |
| | 1,063 |
| | — |
| | 1,555 |
| | (208 | ) | | 6/24/2014 | | 2014 |
| Family Dollar | | Pembroke Park | | FL | | 1,141 |
| | 656 |
| | 944 |
| | — |
| | 1,600 |
| | (167 | ) | | 2/7/2014 | | 2006 | | St Petersburg | | FL | | 1,093 |
| | 690 |
| | 1,000 |
| | — |
| | 1,690 |
| | (279 | ) | | 2/7/2014 | | 2011 |
| Family Dollar | | Pensacola | | FL | | — |
| | 69 |
| | 1,085 |
| | — |
| | 1,154 |
| | (107 | ) | | 8/28/2014 | | 2013 | | Tallahassee | | FL | | — |
| | 632 |
| | 871 |
| | — |
| | 1,503 |
| | (249 | ) | | 2/7/2014 | | 2011 |
| Family Dollar | | Pensacola | | FL | | 559 |
| | 146 |
| | 907 |
| | — |
| | 1,053 |
| | (129 | ) | | 2/7/2014 | | 2003 | | Tampa | | FL | | 1,005 |
| | 531 |
| | 1,062 |
| | — |
| | 1,593 |
| | (287 | ) | | 2/7/2014 | | 2008 |
| Family Dollar | | Plant City | | FL | | — |
| | 279 |
| | 1,040 |
| | — |
| | 1,319 |
| | (156 | ) | | 2/7/2014 | | 2004 | | Tampa | | FL | | 1,168 |
| | 773 |
| | 1,057 |
| | — |
| | 1,830 |
| | (291 | ) | | 2/7/2014 | | 2011 |
| Family Dollar | | Plant City | | FL | | 1,173 |
| | 712 |
| | 1,113 |
| | — |
| | 1,825 |
| | (181 | ) | | 2/7/2014 | | 2005 | | Tampa | | FL | | — |
| | 552 |
| | 792 |
| | — |
| | 1,344 |
| | (212 | ) | | 2/7/2014 | | 2013 |
| Family Dollar | | Sebring | | FL | | — |
| | 492 |
| | 1,063 |
| | — |
| | 1,555 |
| | (117 | ) | | 6/24/2014 | | 2014 | | Winter Haven | | FL | | — |
| | 534 |
| | 942 |
| | — |
| | 1,476 |
| | (117 | ) | | 8/8/2014 | | 2014 |
| Family Dollar | | St Petersburg | | FL | | 1,093 |
| | 690 |
| | 1,000 |
| | — |
| | 1,690 |
| | (165 | ) | | 2/7/2014 | | 2011 | | Zellwood | | FL | | — |
| | 272 |
| | 1,005 |
| | — |
| | 1,277 |
| | (183 | ) | | 8/22/2014 | | 2014 |
| Family Dollar | | Tallahassee | | FL | | — |
| | 632 |
| | 871 |
| | — |
| | 1,503 |
| | (147 | ) | | 2/7/2014 | | 2011 | | Abbeville | | GA | | — |
| | 163 |
| | 768 |
| | — |
| | 931 |
| | (152 | ) | | 5/29/2014 | | 2014 |
| Family Dollar | | Tampa | | FL | | 1,005 |
| | 531 |
| | 1,062 |
| | — |
| | 1,593 |
| | (169 | ) | | 2/7/2014 | | 2008 | | Acworth | | GA | | — |
| | 489 |
| | 901 |
| | — |
| | 1,390 |
| | (172 | ) | | 8/28/2014 | | 2013 |
| Family Dollar | | Tampa | | FL | | 1,168 |
| | 773 |
| | 1,057 |
| | — |
| | 1,830 |
| | (172 | ) | | 2/7/2014 | | 2011 | | Alma | | GA | | — |
| | 79 |
| | 954 |
| | — |
| | 1,033 |
| | (177 | ) | | 8/28/2014 | | 1982 |
| Family Dollar | | Tampa | | FL | | — |
| | 552 |
| | 792 |
| | — |
| | 1,344 |
| | (125 | ) | | 2/7/2014 | | 2013 | | Claxton | | GA | | — |
| | 322 |
| | 665 |
| | — |
| | 987 |
| | (175 | ) | | 5/14/2014 | | 2014 |
| Family Dollar | | Winter Haven | | FL | | — |
| | 534 |
| | 942 |
| | — |
| | 1,476 |
| | (64 | ) | | 8/8/2014 | | 2014 | | Cordele | | GA | | — |
| | 136 |
| | 1,049 |
| | — |
| | 1,185 |
| | (204 | ) | | 4/30/2014 | | 2014 |
| Family Dollar | | Zellwood | | FL | | — |
| | 272 |
| | 1,005 |
| | — |
| | 1,277 |
| | (99 | ) | | 8/22/2014 | | 2014 | | Fayetteville | | GA | | — |
| | 217 |
| | 1,203 |
| | — |
| | 1,420 |
| | (208 | ) | | 11/20/2014 | | 2014 |
| Family Dollar | | Abbeville | | GA | | — |
| | 163 |
| | 768 |
| | — |
| | 931 |
| | (86 | ) | | 5/29/2014 | | 2014 | | Helena | | GA | | — |
| | 242 |
| | 790 |
| | — |
| | 1,032 |
| | (218 | ) | | 2/19/2014 | | 2013 |
| Family Dollar | | Acworth | | GA | | — |
| | 489 |
| | 901 |
| | — |
| | 1,390 |
| | (94 | ) | | 8/28/2014 | | 2013 | | Jeffersonville | | GA | | — |
| | 153 |
| | 926 |
| | — |
| | 1,079 |
| | (171 | ) | | 8/15/2014 | | 2014 |
| Family Dollar | | Alma | | GA | | — |
| | 79 |
| | 954 |
| | — |
| | 1,033 |
| | (96 | ) | | 8/28/2014 | | 1982 | | Lenox | | GA | | — |
| | 90 |
| | 809 |
| | — |
| | 899 |
| | (253 | ) | | 11/9/2012 | | 2012 |
| | | | | | Initial Costs (1) | | Costs Capitalized Subsequent to Acquisition (2) | | Gross Amount
Carried at
December 31, 2016
(3) (4) | | | | | | Initial Costs (1) | | Costs Capitalized Subsequent to Acquisition (2) | | Gross Amount
Carried at
December 31, 2018
(3) (4) | | | |
| Property | | City | | State | | Encumbrances at
December 31, 2016 | | Land | | Buildings, Fixtures and Improvements | | Accumulated Depreciation
(3) (5) | | Date Acquired | | Date of Construction | | City | | State | | Encumbrances at
December 31, 2018 | | Land | | Buildings, Fixtures and Improvements | | Accumulated Depreciation
(3) (5) | | Date Acquired | | Date of Construction |
| Family Dollar | | Claxton | | GA | | — |
| | 322 |
| | 665 |
| | — |
| | 987 |
| | (99 | ) | | 5/14/2014 | | 2014 | | Lindale | | GA | | — |
| | 227 |
| | 966 |
| | — |
| | 1,193 |
| | (184 | ) | | 8/28/2014 | | 2014 |
| Family Dollar | | Cordele | | GA | | — |
| | 136 |
| | 1,049 |
| | — |
| | 1,185 |
| | (117 | ) | | 4/30/2014 | | 2014 | | Macon | | GA | | — |
| | 300 |
| | 893 |
| | — |
| | 1,193 |
| | (169 | ) | | 8/28/2014 | | 2013 |
| Family Dollar | | Fayetteville | | GA | | — |
| | 217 |
| | 1,203 |
| | — |
| | 1,420 |
| | (108 | ) | | 11/20/2014 | | 2014 | | Macon | | GA | | 673 |
| | 230 |
| | 851 |
| | — |
| | 1,081 |
| | (230 | ) | | 2/7/2014 | | 2011 |
| Family Dollar | | Helena | | GA | | — |
| | 242 |
| | 790 |
| | — |
| | 1,032 |
| | (129 | ) | | 2/19/2014 | | 2013 | | Marietta | | GA | | — |
| | 366 |
| | 749 |
| | — |
| | 1,115 |
| | (207 | ) | | 2/19/2014 | | 2013 |
| Family Dollar | | Jeffersonville | | GA | | — |
| | 153 |
| | 926 |
| | — |
| | 1,079 |
| | (93 | ) | | 8/15/2014 | | 2014 | | Marietta | | GA | | — |
| | 582 |
| | 1,126 |
| | — |
| | 1,708 |
| | (210 | ) | | 8/28/2014 | | 2013 |
| Family Dollar | | Lenox | | GA | | — |
| | 90 |
| | 809 |
| | — |
| | 899 |
| | (187 | ) | | 11/9/2012 | | 2012 | | Omega | | GA | | — |
| | 167 |
| | 716 |
| | — |
| | 883 |
| | (194 | ) | | 3/12/2014 | | 2013 |
| Family Dollar | | Lindale | | GA | | — |
| | 227 |
| | 966 |
| | — |
| | 1,193 |
| | (100 | ) | | 8/28/2014 | | 2014 | | Richland | | GA | | — |
| | 125 |
| | 859 |
| | — |
| | 984 |
| | (162 | ) | | 8/28/2014 | | 2014 |
| Family Dollar | | Macon | | GA | | — |
| | 300 |
| | 893 |
| | — |
| | 1,193 |
| | (92 | ) | | 8/28/2014 | | 2013 | | Riverdale | | GA | | — |
| | 310 |
| | 1,188 |
| | — |
| | 1,498 |
| | (213 | ) | | 9/26/2014 | | 2014 |
| Family Dollar | | Macon | | GA | | 673 |
| | 230 |
| | 851 |
| | — |
| | 1,081 |
| | (135 | ) | | 2/7/2014 | | 2011 | | Vienna | | GA | | — |
| | 62 |
| | 721 |
| | — |
| | 783 |
| | (196 | ) | | 3/12/2014 | | 2013 |
| Family Dollar | | Marietta | | GA | | — |
| | 366 |
| | 749 |
| | — |
| | 1,115 |
| | (122 | ) | | 2/19/2014 | | 2013 | | Des Moines | | IA | | 822 |
| | 411 |
| | 871 |
| | — |
| | 1,282 |
| | (241 | ) | | 2/7/2014 | | 2003 |
| Family Dollar | | Marietta | | GA | | — |
| | 582 |
| | 1,126 |
| | — |
| | 1,708 |
| | (114 | ) | | 8/28/2014 | | 2013 | | Fort Dodge | | IA | | 408 |
| | 152 |
| | 449 |
| | — |
| | 601 |
| | (131 | ) | | 2/7/2014 | | 2002 |
| Family Dollar | | Omega | | GA | | — |
| | 167 |
| | 716 |
| | — |
| | 883 |
| | (113 | ) | | 3/12/2014 | | 2013 | | Arco | | ID | | — |
| | 76 |
| | 684 |
| | — |
| | 760 |
| | (217 | ) | | 9/18/2012 | | 2012 |
| Family Dollar | | Richland | | GA | | — |
| | 125 |
| | 859 |
| | — |
| | 984 |
| | (88 | ) | | 8/28/2014 | | 2014 | | Homedale | | ID | | 973 |
| | 59 |
| | 1,387 |
| | — |
| | 1,446 |
| | (376 | ) | | 2/7/2014 | | 2006 |
| Family Dollar | | Riverdale | | GA | | — |
| | 310 |
| | 1,188 |
| | — |
| | 1,498 |
| | (114 | ) | | 9/26/2014 | | 2014 | | Kimberly | | ID | | — |
| | 219 |
| | 657 |
| | — |
| | 876 |
| | (197 | ) | | 4/10/2013 | | 2013 |
| Family Dollar | | Vienna | | GA | | — |
| | 62 |
| | 721 |
| | — |
| | 783 |
| | (114 | ) | | 3/12/2014 | | 2013 | | Mount Vernon | | IL | | — |
| | 117 |
| | 1,050 |
| | — |
| | 1,167 |
| | (309 | ) | | 7/11/2013 | | 2012 |
| Family Dollar | | Des Moines | | IA | | — |
| | 152 |
| | 863 |
| | 6 |
| | 1,021 |
| | (164 | ) | | 8/30/2013 | | 1995 | | Pulaski | | IL | | — |
| | 31 |
| | 588 |
| | — |
| | 619 |
| | (182 | ) | | 12/31/2012 | | 2012 |
| Family Dollar | | Des Moines | | IA | | 822 |
| | 411 |
| | 871 |
| | — |
| | 1,282 |
| | (142 | ) | | 2/7/2014 | | 2003 | | University Park | | IL | | — |
| | 295 |
| | 688 |
| | — |
| | 983 |
| | (197 | ) | | 10/29/2013 | | 2013 |
| Family Dollar | | Fort Dodge | | IA | | 408 |
| | 152 |
| | 449 |
| | — |
| | 601 |
| | (77 | ) | | 2/7/2014 | | 2002 | | Brookston | | IN | | — |
| | 126 |
| | 715 |
| | — |
| | 841 |
| | (225 | ) | | 10/1/2012 | | 2012 |
| Family Dollar | | Arco | | ID | | — |
| | 76 |
| | 684 |
| | — |
| | 760 |
| | (165 | ) | | 9/18/2012 | | 2012 | | Indianapolis | | IN | | 613 |
| | 375 |
| | 707 |
| | — |
| | 1,082 |
| | (175 | ) | | 2/7/2014 | | 2003 |
| Family Dollar | | Homedale | | ID | | 973 |
| | 59 |
| | 1,387 |
| | — |
| | 1,446 |
| | (222 | ) | | 2/7/2014 | | 2006 | | Lake Village | | IN | | — |
| | 154 |
| | 752 |
| | — |
| | 906 |
| | (393 | ) | | 4/30/2014 | | 2013 |
| Family Dollar | | Kimberly | | ID | | — |
| | 219 |
| | 657 |
| | — |
| | 876 |
| | (137 | ) | | 4/10/2013 | | 2013 | | Mitchell | | IN | | — |
| | 101 |
| | 1,119 |
| | — |
| | 1,220 |
| | (214 | ) | | 8/28/2014 | | 2014 |
| Family Dollar | | Lombard | | IL | | — |
| | 1,008 |
| | 543 |
| | — |
| | 1,551 |
| | (93 | ) | | 12/12/2013 | | 1967 | | Princeton | | IN | | 526 |
| | 300 |
| | 486 |
| | — |
| | 786 |
| | (137 | ) | | 2/7/2014 | | 2000 |
| Family Dollar | | Mount Vernon | | IL | | — |
| | 117 |
| | 1,050 |
| | — |
| | 1,167 |
| | (204 | ) | | 7/11/2013 | | 2012 | | Seymour | | IN | | — |
| | 238 |
| | 764 |
| | — |
| | 1,002 |
| | (213 | ) | | 2/7/2014 | | 2003 |
| Family Dollar | | Pulaski | | IL | | — |
| | 31 |
| | 588 |
| | — |
| | 619 |
| | (134 | ) | | 12/31/2012 | | 2012 | | Terre Haute | | IN | | 394 |
| | 235 |
| | 427 |
| | — |
| | 662 |
| | (115 | ) | | 2/7/2014 | | 2011 |
| Family Dollar | | University Park | | IL | | — |
| | 295 |
| | 688 |
| | — |
| | 983 |
| | (124 | ) | | 10/29/2013 | | 2013 | | Greensburg | | KS | | — |
| | 80 |
| | 718 |
| | — |
| | 798 |
| | (208 | ) | | 9/9/2013 | | 2012 |
| Family Dollar | | Brookston | | IN | | — |
| | 126 |
| | 715 |
| | — |
| | 841 |
| | (169 | ) | | 10/1/2012 | | 2012 | | Kansas City | | KS | | — |
| | 290 |
| | 1,170 |
| | (5 | ) | | 1,455 |
| | (225 | ) | | 11/6/2014 | | 1995 |
| Family Dollar | | Indianapolis | | IN | | 613 |
| | 375 |
| | 707 |
| | — |
| | 1,082 |
| | (103 | ) | | 2/7/2014 | | 2003 | | Kansas City | | KS | | — |
| | 352 |
| | 1,026 |
| | — |
| | 1,378 |
| | (200 | ) | | 12/18/2014 | | 1995 |
| Family Dollar | | Lake Village | | IN | | — |
| | 154 |
| | 752 |
| | — |
| | 906 |
| | (225 | ) | | 4/30/2014 | | 2013 | | Kansas City | | KS | | 982 |
| | 154 |
| | 1,367 |
| | — |
| | 1,521 |
| | (361 | ) | | 2/7/2014 | | 2002 |
| Family Dollar | | Mitchell | | IN | | — |
| | 101 |
| | 1,119 |
| | — |
| | 1,220 |
| | (117 | ) | | 8/28/2014 | | 2014 | | Topeka | | KS | | — |
| | 177 |
| | 1,405 |
| | — |
| | 1,582 |
| | (383 | ) | | 2/7/2014 | | 2004 |
| Family Dollar | | Princeton | | IN | | 526 |
| | 300 |
| | 486 |
| | — |
| | 786 |
| | (81 | ) | | 2/7/2014 | | 2000 | | Wichita | | KS | | — |
| | 216 |
| | 1,035 |
| | — |
| | 1,251 |
| | (191 | ) | | 8/28/2014 | | 2013 |
| Family Dollar | | Seymour | | IN | | — |
| | 238 |
| | 764 |
| | — |
| | 1,002 |
| | (125 | ) | | 2/7/2014 | | 2003 | | Bowling Green | | KY | | — |
| | 334 |
| | 951 |
| | — |
| | 1,285 |
| | (178 | ) | | 8/28/2014 | | 2013 |
| Family Dollar | | Terre Haute | | IN | | 394 |
| | 235 |
| | 427 |
| | — |
| | 662 |
| | (68 | ) | | 2/7/2014 | | 2011 | | Carlisle | | KY | | — |
| | 157 |
| | 871 |
| | — |
| | 1,028 |
| | (166 | ) | | 8/28/2014 | | 2014 |
| | | | | | Initial Costs (1) | | Costs Capitalized Subsequent to Acquisition (2) | | Gross Amount
Carried at
December 31, 2016
(3) (4) | | | | | | Initial Costs (1) | | Costs Capitalized Subsequent to Acquisition (2) | | Gross Amount
Carried at
December 31, 2018
(3) (4) | | | |
| Property | | City | | State | | Encumbrances at
December 31, 2016 | | Land | | Buildings, Fixtures and Improvements | | Accumulated Depreciation
(3) (5) | | Date Acquired | | Date of Construction | | City | | State | | Encumbrances at
December 31, 2018 | | Land | | Buildings, Fixtures and Improvements | | Accumulated Depreciation
(3) (5) | | Date Acquired | | Date of Construction |
| Family Dollar | | Greensburg | | KS | | — |
| | 80 |
| | 718 |
| | — |
| | 798 |
| | (133 | ) | | 9/9/2013 | | 2012 | | Garrison | | KY | | — |
| | 134 |
| | 737 |
| | — |
| | 871 |
| | (214 | ) | | 2/20/2014 | | 2012 |
| Family Dollar | | Kansas City | | KS | | — |
| | 290 |
| | 1,170 |
| | (5 | ) | | 1,455 |
| | (131 | ) | | 11/6/2014 | | 1995 | | Rockholds | | KY | | — |
| | 121 |
| | 988 |
| | — |
| | 1,109 |
| | (190 | ) | | 8/28/2014 | | 2014 |
| Family Dollar | | Kansas City | | KS | | — |
| | 352 |
| | 1,026 |
| | — |
| | 1,378 |
| | (117 | ) | | 12/18/2014 | | 1995 | | Abbeville | | LA | | 740 |
| | 141 |
| | 949 |
| | — |
| | 1,090 |
| | (263 | ) | | 2/7/2014 | | 2005 |
| Family Dollar | | Kansas City | | KS | | 982 |
| | 154 |
| | 1,367 |
| | — |
| | 1,521 |
| | (213 | ) | | 2/7/2014 | | 2002 | | Alexandria | | LA | | 458 |
| | 168 |
| | 579 |
| | — |
| | 747 |
| | (155 | ) | | 2/7/2014 | | 2005 |
| Family Dollar | | Topeka | | KS | | — |
| | 177 |
| | 1,405 |
| | — |
| | 1,582 |
| | (226 | ) | | 2/7/2014 | | 2004 | | Arcadia | | LA | | — |
| | 51 |
| | 704 |
| | — |
| | 755 |
| | (207 | ) | | 2/20/2014 | | 2010 |
| Family Dollar | | Wichita | | KS | | — |
| | 216 |
| | 1,035 |
| | — |
| | 1,251 |
| | (104 | ) | | 8/28/2014 | | 2013 | | Avondale | | LA | | — |
| | 381 |
| | 1,255 |
| | — |
| | 1,636 |
| | (234 | ) | | 8/28/2014 | | 2013 |
| Family Dollar | | Bowling Green | | KY | | — |
| | 334 |
| | 951 |
| | — |
| | 1,285 |
| | (97 | ) | | 8/28/2014 | | 2013 | | Chalmette | | LA | | — |
| | 751 |
| | 615 |
| | — |
| | 1,366 |
| | (201 | ) | | 5/3/2012 | | 2011 |
| Family Dollar | | Carlisle | | KY | | — |
| | 157 |
| | 871 |
| | — |
| | 1,028 |
| | (91 | ) | | 8/28/2014 | | 2014 | | Farmerville | | LA | | 722 |
| | 110 |
| | 968 |
| | — |
| | 1,078 |
| | (263 | ) | | 2/7/2014 | | 2003 |
| Family Dollar | | Garrison | | KY | | — |
| | 134 |
| | 737 |
| | — |
| | 871 |
| | (126 | ) | | 2/20/2014 | | 2012 | | Kentwood | | LA | | 683 |
| | 117 |
| | 877 |
| | — |
| | 994 |
| | (244 | ) | | 2/7/2014 | | 2003 |
| Family Dollar | | Rockholds | | KY | | — |
| | 121 |
| | 988 |
| | — |
| | 1,109 |
| | (104 | ) | | 8/28/2014 | | 2014 | | New Orleans | | LA | | 1,146 |
| | 547 |
| | 1,252 |
| | — |
| | 1,799 |
| | (337 | ) | | 2/7/2014 | | 2005 |
| Family Dollar | | Abbeville | | LA | | 740 |
| | 141 |
| | 949 |
| | — |
| | 1,090 |
| | (155 | ) | | 2/7/2014 | | 2005 | | Shreveport | | LA | | 892 |
| | 177 |
| | 1,177 |
| | — |
| | 1,354 |
| | (317 | ) | | 2/7/2014 | | 2005 |
| Family Dollar | | Alexandria | | LA | | 458 |
| | 168 |
| | 579 |
| | — |
| | 747 |
| | (92 | ) | | 2/7/2014 | | 2005 | | Tickfaw | | LA | | — |
| | 181 |
| | 543 |
| | — |
| | 724 |
| | (180 | ) | | 3/30/2012 | | 2011 |
| Family Dollar | | Arcadia | | LA | | — |
| | 51 |
| | 704 |
| | — |
| | 755 |
| | (122 | ) | | 2/20/2014 | | 2010 | | Westwego | | LA | | — |
| | 332 |
| | 1,052 |
| | — |
| | 1,384 |
| | (201 | ) | | 8/28/2014 | | 2013 |
| Family Dollar | | Avondale | | LA | | — |
| | 381 |
| | 1,255 |
| | — |
| | 1,636 |
| | (127 | ) | | 8/28/2014 | | 2013 | | Lynn | | MA | | 1,222 |
| | 400 |
| | 1,547 |
| | — |
| | 1,947 |
| | (407 | ) | | 2/7/2014 | | 2003 |
| Family Dollar | | Baton Rouge | | LA | | — |
| | 377 |
| | 716 |
| | — |
| | 1,093 |
| | (119 | ) | | 2/7/2014 | | 2003 | | Barryton | | MI | | — |
| | 32 |
| | 599 |
| | — |
| | 631 |
| | (186 | ) | | 12/18/2012 | | 2012 |
| Family Dollar | | Chalmette | | LA | | — |
| | 751 |
| | 615 |
| | — |
| | 1,366 |
| | (160 | ) | | 5/3/2012 | | 2011 | | Birch Run | | MI | | — |
| | 81 |
| | 729 |
| | 86 |
| | 896 |
| | (227 | ) | | 7/11/2013 | | 1950 |
| Family Dollar | | Farmerville | | LA | | 722 |
| | 110 |
| | 968 |
| | — |
| | 1,078 |
| | (155 | ) | | 2/7/2014 | | 2003 | | Brooklyn | | MI | | — |
| | 150 |
| | 634 |
| | — |
| | 784 |
| | (176 | ) | | 2/7/2014 | | 2002 |
| Family Dollar | | Kentwood | | LA | | 683 |
| | 117 |
| | 877 |
| | — |
| | 994 |
| | (144 | ) | | 2/7/2014 | | 2003 | | Detroit | | MI | | — |
| | 130 |
| | 1,169 |
| | — |
| | 1,299 |
| | (365 | ) | | 11/27/2012 | | 2011 |
| Family Dollar | | New Orleans | | LA | | 1,146 |
| | 547 |
| | 1,252 |
| | — |
| | 1,799 |
| | (199 | ) | | 2/7/2014 | | 2005 | | Detroit | | MI | | — |
| | 106 |
| | 956 |
| | — |
| | 1,062 |
| | (285 | ) | | 5/2/2013 | | 1964 |
| Family Dollar | | Shreveport | | LA | | 892 |
| | 177 |
| | 1,177 |
| | — |
| | 1,354 |
| | (187 | ) | | 2/7/2014 | | 2005 | | Detroit | | MI | | — |
| | 110 |
| | 1,051 |
| | — |
| | 1,161 |
| | (205 | ) | | 8/28/2014 | | 2005 |
| Family Dollar | | Tickfaw | | LA | | — |
| | 181 |
| | 543 |
| | — |
| | 724 |
| | (146 | ) | | 3/30/2012 | | 2011 | | Flint | | MI | | — |
| | 162 |
| | 1,027 |
| | — |
| | 1,189 |
| | (306 | ) | | 2/26/2014 | | 2014 |
| Family Dollar | | Westwego | | LA | | — |
| | 332 |
| | 1,052 |
| | — |
| | 1,384 |
| | (109 | ) | | 8/28/2014 | | 2013 | | Hudson | | MI | | 833 |
| | 108 |
| | 1,020 |
| | — |
| | 1,128 |
| | (295 | ) | | 2/7/2014 | | 2005 |
| Family Dollar | | Lynn | | MA | | 1,222 |
| | 400 |
| | 1,547 |
| | — |
| | 1,947 |
| | (240 | ) | | 2/7/2014 | | 2003 | | Jackson | | MI | | — |
| | 93 |
| | 525 |
| | — |
| | 618 |
| | (152 | ) | | 9/12/2013 | | 2007 |
| Family Dollar | | Barryton | | MI | | — |
| | 32 |
| | 599 |
| | — |
| | 631 |
| | (136 | ) | | 12/18/2012 | | 2012 | | Kentwood | | MI | | 739 |
| | 389 |
| | 919 |
| | — |
| | 1,308 |
| | (227 | ) | | 2/7/2014 | | 2001 |
| Family Dollar | | Birch Run | | MI | | — |
| | 81 |
| | 729 |
| | 86 |
| | 896 |
| | (143 | ) | | 7/11/2013 | | 1950 | | Monroe | | MI | | — |
| | 243 |
| | 1,061 |
| | — |
| | 1,304 |
| | (200 | ) | | 8/28/2014 | | 2013 |
| Family Dollar | | Brooklyn | | MI | | — |
| | 150 |
| | 634 |
| | — |
| | 784 |
| | (104 | ) | | 2/7/2014 | | 2002 | | Newaygo | | MI | | 689 |
| | 317 |
| | 677 |
| | — |
| | 994 |
| | (197 | ) | | 2/7/2014 | | 2002 |
| Family Dollar | | Burton | | MI | | 866 |
| | 131 |
| | 1,164 |
| | — |
| | 1,295 |
| | (187 | ) | | 2/7/2014 | | 2003 | | Pontiac | | MI | | 962 |
| | 136 |
| | 1,249 |
| | — |
| | 1,385 |
| | (347 | ) | | 2/7/2014 | | 2003 |
| Family Dollar | | Detroit | | MI | | — |
| | 130 |
| | 1,169 |
| | — |
| | 1,299 |
| | (271 | ) | | 11/27/2012 | | 2011 | | Remus | | MI | | — |
| | 49 |
| | 992 |
| | — |
| | 1,041 |
| | (289 | ) | | 1/2/2014 | | 2012 |
| Family Dollar | | Detroit | | MI | | — |
| | 106 |
| | 956 |
| | — |
| | 1,062 |
| | (195 | ) | | 5/2/2013 | | 1964 | | Saginaw | | MI | | — |
| | 164 |
| | 1,086 |
| | — |
| | 1,250 |
| | (304 | ) | | 2/7/2014 | | 2003 |
| Family Dollar | | Detroit | | MI | | — |
| | 110 |
| | 1,051 |
| | — |
| | 1,161 |
| | (112 | ) | | 8/28/2014 | | 2005 | | Tustin | | MI | | — |
| | 33 |
| | 633 |
| | — |
| | 666 |
| | (196 | ) | | 12/18/2012 | | 1995 |
| Family Dollar | | Flint | | MI | | — |
| | 162 |
| | 1,027 |
| | — |
| | 1,189 |
| | (180 | ) | | 2/26/2014 | | 2014 | | Crosby | | MN | | — |
| | 49 |
| | 928 |
| | — |
| | 977 |
| | (273 | ) | | 7/11/2013 | | 1985 |
| Family Dollar | | Hudson | | MI | | 833 |
| | 108 |
| | 1,020 |
| | — |
| | 1,128 |
| | (174 | ) | | 2/7/2014 | | 2005 | | Ely | | MN | | — |
| | 231 |
| | 1,008 |
| | — |
| | 1,239 |
| | (286 | ) | | 2/27/2014 | | 2014 |
| | | | | | Initial Costs (1) | | Costs Capitalized Subsequent to Acquisition (2) | | Gross Amount
Carried at
December 31, 2016
(3) (4) | | | | | | Initial Costs (1) | | Costs Capitalized Subsequent to Acquisition (2) | | Gross Amount
Carried at
December 31, 2018
(3) (4) | | | |
| Property | | City | | State | | Encumbrances at
December 31, 2016 | | Land | | Buildings, Fixtures and Improvements | | Accumulated Depreciation
(3) (5) | | Date Acquired | | Date of Construction | | City | | State | | Encumbrances at
December 31, 2018 | | Land | | Buildings, Fixtures and Improvements | | Accumulated Depreciation
(3) (5) | | Date Acquired | | Date of Construction |
| Family Dollar | | Jackson | | MI | | — |
| | 93 |
| | 525 |
| | — |
| | 618 |
| | (97 | ) | | 9/12/2013 | | 2007 | | Intrnatnl Falls | | MN | | — |
| | 32 |
| | 608 |
| | — |
| | 640 |
| | (176 | ) | | 9/30/2013 | | 1966 |
| Family Dollar | | Kentwood | | MI | | 739 |
| | 389 |
| | 919 |
| | — |
| | 1,308 |
| | (134 | ) | | 2/7/2014 | | 2001 | | St. Peter | | MN | | 409 |
| | 93 |
| | 566 |
| | — |
| | 659 |
| | (146 | ) | | 2/7/2014 | | 1960 |
| Family Dollar | | Monroe | | MI | | — |
| | 243 |
| | 1,061 |
| | — |
| | 1,304 |
| | (109 | ) | | 8/28/2014 | | 2013 | | Berkeley | | MO | | 969 |
| | 179 |
| | 1,391 |
| | — |
| | 1,570 |
| | (357 | ) | | 2/7/2014 | | 2003 |
| Family Dollar | | Newaygo | | MI | | 689 |
| | 317 |
| | 677 |
| | — |
| | 994 |
| | (116 | ) | | 2/7/2014 | | 2002 | | Kansas City | | MO | | 683 |
| | 277 |
| | 812 |
| | — |
| | 1,089 |
| | (215 | ) | | 2/7/2014 | | 2003 |
| Family Dollar | | Pontiac | | MI | | 962 |
| | 136 |
| | 1,249 |
| | — |
| | 1,385 |
| | (205 | ) | | 2/7/2014 | | 2003 | | Kansas City | | MO | | 1,211 |
| | 119 |
| | 1,705 |
| | — |
| | 1,824 |
| | (458 | ) | | 2/7/2014 | | 2004 |
| Family Dollar | | Remus | | MI | | — |
| | 49 |
| | 992 |
| | — |
| | 1,041 |
| | (172 | ) | | 1/2/2014 | | 2012 | | Kansas City | | MO | | 970 |
| | 142 |
| | 1,338 |
| | — |
| | 1,480 |
| | (357 | ) | | 2/7/2014 | | 2004 |
| Family Dollar | | Saginaw | | MI | | — |
| | 164 |
| | 1,086 |
| | — |
| | 1,250 |
| | (180 | ) | | 2/7/2014 | | 2003 | | Marble Hill | | MO | | — |
| | 38 |
| | 719 |
| | — |
| | 757 |
| | (210 | ) | | 8/29/2013 | | 2013 |
| Family Dollar | | Tustin | | MI | | — |
| | 33 |
| | 633 |
| | — |
| | 666 |
| | (144 | ) | | 12/18/2012 | | 1995 | | Raytown | | MO | | — |
| | 415 |
| | — |
| | 1,287 |
| | 1,702 |
| | (203 | ) | | 2/20/2015 | | 2014 |
| Family Dollar | | Crosby | | MN | | — |
| | 49 |
| | 928 |
| | — |
| | 977 |
| | (180 | ) | | 7/11/2013 | | 1985 | | St Louis | | MO | | — |
| | 168 |
| | 671 |
| | (4 | ) | | 835 |
| | (219 | ) | | 4/2/2012 | | 2006 |
| Family Dollar | | Ely | | MN | | — |
| | 231 |
| | 1,008 |
| | — |
| | 1,239 |
| | (169 | ) | | 2/27/2014 | | 2014 | | St Louis | | MO | | 972 |
| | 215 |
| | 1,357 |
| | — |
| | 1,572 |
| | (351 | ) | | 2/7/2014 | | 2003 |
| Family Dollar | | Intrnatnl Falls | | MN | | — |
| | 32 |
| | 608 |
| | — |
| | 640 |
| | (112 | ) | | 9/30/2013 | | 1966 | | St Louis | | MO | | — |
| | 258 |
| | 1,310 |
| | — |
| | 1,568 |
| | (339 | ) | | 2/7/2014 | | 2003 |
| Family Dollar | | St. Peter | | MN | | 409 |
| | 93 |
| | 566 |
| | — |
| | 659 |
| | (86 | ) | | 2/7/2014 | | 1960 | | St. Louis | | MO | | — |
| | 445 |
| | 1,038 |
| | — |
| | 1,483 |
| | (327 | ) | | 10/23/2012 | | 2012 |
| Family Dollar | | Berkeley | | MO | | 969 |
| | 179 |
| | 1,391 |
| | — |
| | 1,570 |
| | (210 | ) | | 2/7/2014 | | 2003 | | Bassfield | | MS | | — |
| | 96 |
| | 752 |
| | — |
| | 848 |
| | (217 | ) | | 2/19/2014 | | 2013 |
| Family Dollar | | Kansas City | | MO | | 683 |
| | 277 |
| | 812 |
| | — |
| | 1,089 |
| | (127 | ) | | 2/7/2014 | | 2003 | | Biloxi | | MS | | — |
| | 310 |
| | 575 |
| | — |
| | 885 |
| | (190 | ) | | 3/30/2012 | | 2012 |
| Family Dollar | | Kansas City | | MO | | 1,211 |
| | 119 |
| | 1,705 |
| | — |
| | 1,824 |
| | (270 | ) | | 2/7/2014 | | 2004 | | Canton | | MS | | — |
| | 210 |
| | 1,142 |
| | — |
| | 1,352 |
| | (213 | ) | | 8/28/2014 | | 2013 |
| Family Dollar | | Kansas City | | MO | | 970 |
| | 142 |
| | 1,338 |
| | — |
| | 1,480 |
| | (210 | ) | | 2/7/2014 | | 2004 | | Carriere | | MS | | — |
| | 200 |
| | 599 |
| | — |
| | 799 |
| | (199 | ) | | 3/30/2012 | | 2012 |
| Family Dollar | | Marble Hill | | MO | | — |
| | 38 |
| | 719 |
| | — |
| | 757 |
| | (136 | ) | | 8/29/2013 | | 2013 | | D'Iberville | | MS | | — |
| | 241 |
| | 561 |
| | 1 |
| | 803 |
| | (183 | ) | | 5/21/2012 | | 2012 |
| Family Dollar | | Raytown | | MO | | — |
| | 415 |
| | — |
| | 1,287 |
| | 1,702 |
| | (76 | ) | | 2/20/2015 | | 2014 | | Drew | | MS | | — |
| | 11 |
| | 1,039 |
| | — |
| | 1,050 |
| | (228 | ) | | 8/28/2014 | | 1989 |
| Family Dollar | | St Louis | | MO | | — |
| | 168 |
| | 671 |
| | (4 | ) | | 835 |
| | (176 | ) | | 4/2/2012 | | 2006 | | Greenville | | MS | | — |
| | 125 |
| | 872 |
| | — |
| | 997 |
| | (238 | ) | | 2/7/2014 | | 2011 |
| Family Dollar | | St Louis | | MO | | 972 |
| | 215 |
| | 1,357 |
| | — |
| | 1,572 |
| | (207 | ) | | 2/7/2014 | | 2003 | | Gulfport | | MS | | — |
| | 209 |
| | 626 |
| | — |
| | 835 |
| | (204 | ) | | 5/21/2012 | | 2012 |
| Family Dollar | | St Louis | | MO | | — |
| | 258 |
| | 1,310 |
| | — |
| | 1,568 |
| | (200 | ) | | 2/7/2014 | | 2003 | | Gulfport | | MS | | — |
| | 270 |
| | 629 |
| | — |
| | 899 |
| | (200 | ) | | 9/20/2012 | | 2012 |
| Family Dollar | | St. Louis | | MO | | — |
| | 445 |
| | 1,038 |
| | — |
| | 1,483 |
| | (245 | ) | | 10/23/2012 | | 2012 | | Gulfport | | MS | | — |
| | 218 |
| | 654 |
| | — |
| | 872 |
| | (204 | ) | | 11/15/2012 | | 2012 |
| Family Dollar | | St. Louis | | MO | | — |
| | 215 |
| | 1,219 |
| | — |
| | 1,434 |
| | (254 | ) | | 4/30/2013 | | 1995 | | Gulfport | | MS | | — |
| | 312 |
| | 1,237 |
| | — |
| | 1,549 |
| | (338 | ) | | 2/7/2014 | | 2007 |
| Family Dollar | | St. Louis | | MO | | — |
| | 445 |
| | 1,039 |
| | — |
| | 1,484 |
| | (236 | ) | | 12/14/2012 | | 2012 | | Hattiesburg | | MS | | — |
| | 225 |
| | 674 |
| | — |
| | 899 |
| | (207 | ) | | 1/30/2013 | | 2012 |
| Family Dollar | | Bassfield | | MS | | — |
| | 96 |
| | 752 |
| | — |
| | 848 |
| | (128 | ) | | 2/19/2014 | | 2013 | | Horn Lake | | MS | | — |
| | 225 |
| | 676 |
| | — |
| | 901 |
| | (216 | ) | | 8/22/2012 | | 2012 |
| Family Dollar | | Biloxi | | MS | | 434 |
| | 310 |
| | 575 |
| | — |
| | 885 |
| | (155 | ) | | 3/30/2012 | | 2012 | | Kiln | | MS | | — |
| | 106 |
| | 650 |
| | — |
| | 756 |
| | (203 | ) | | 11/14/2012 | | 2012 |
| Family Dollar | | Canton | | MS | | — |
| | 210 |
| | 1,142 |
| | — |
| | 1,352 |
| | (116 | ) | | 8/28/2014 | | 2013 | | Laurel | | MS | | — |
| | 225 |
| | 723 |
| | — |
| | 948 |
| | (209 | ) | | 2/19/2014 | | 2013 |
| Family Dollar | | Carriere | | MS | | 399 |
| | 200 |
| | 599 |
| | — |
| | 799 |
| | (161 | ) | | 3/30/2012 | | 2012 | | Natchez | | MS | | — |
| | 289 |
| | 749 |
| | — |
| | 1,038 |
| | (184 | ) | | 8/28/2014 | | 1982 |
| Family Dollar | | D'Iberville | | MS | | — |
| | 241 |
| | 561 |
| | — |
| | 802 |
| | (146 | ) | | 5/21/2012 | | 2012 | | Okolona | | MS | | — |
| | 64 |
| | 578 |
| | — |
| | 642 |
| | (186 | ) | | 7/31/2012 | | 2012 |
| Family Dollar | | Drew | | MS | | — |
| | 11 |
| | 1,039 |
| | — |
| | 1,050 |
| | (125 | ) | | 8/28/2014 | | 1989 | | Pearl | | MS | | — |
| | 342 |
| | 1,001 |
| | — |
| | 1,343 |
| | (186 | ) | | 8/28/2014 | | 2013 |
| Family Dollar | | Greenville | | MS | | — |
| | 125 |
| | 872 |
| | — |
| | 997 |
| | (140 | ) | | 2/7/2014 | | 2011 | | Philadelphia | | MS | | — |
| | 53 |
| | 897 |
| | — |
| | 950 |
| | (171 | ) | | 8/28/2014 | | 2014 |
| Family Dollar | | Gulfport | | MS | | 411 |
| | 209 |
| | 626 |
| | — |
| | 835 |
| | (163 | ) | | 5/21/2012 | | 2012 | | Anaconda | | MT | | — |
| | 164 |
| | 1,058 |
| | — |
| | 1,222 |
| | (207 | ) | | 9/30/2014 | | 2014 |
| | | | | | Initial Costs (1) | | Costs Capitalized Subsequent to Acquisition (2) | | Gross Amount
Carried at
December 31, 2016
(3) (4) | | | | | | Initial Costs (1) | | Costs Capitalized Subsequent to Acquisition (2) | | Gross Amount
Carried at
December 31, 2018
(3) (4) | | | |
| Property | | City | | State | | Encumbrances at
December 31, 2016 | | Land | | Buildings, Fixtures and Improvements | | Accumulated Depreciation
(3) (5) | | Date Acquired | | Date of Construction | | City | | State | | Encumbrances at
December 31, 2018 | | Land | | Buildings, Fixtures and Improvements | | Accumulated Depreciation
(3) (5) | | Date Acquired | | Date of Construction |
| Family Dollar | | Gulfport | | MS | | — |
| | 270 |
| | 629 |
| | — |
| | 899 |
| | (152 | ) | | 9/20/2012 | | 2012 | | Ennis | | MT | | — |
| | 246 |
| | — |
| | 773 |
| | 1,019 |
| | (182 | ) | | 1/8/2015 | | 2014 |
| Family Dollar | | Gulfport | | MS | | — |
| | 218 |
| | 654 |
| | — |
| | 872 |
| | (151 | ) | | 11/15/2012 | | 2012 | | Three Forks | | MT | | — |
| | 250 |
| | — |
| | 953 |
| | 1,203 |
| | (134 | ) | | 8/20/2014 | | 2014 |
| Family Dollar | | Gulfport | | MS | | — |
| | 312 |
| | 1,237 |
| | — |
| | 1,549 |
| | (200 | ) | | 2/7/2014 | | 2007 | | Whitehall | | MT | | — |
| | 132 |
| | — |
| | 1,064 |
| | 1,196 |
| | (247 | ) | | 3/19/2015 | | 1995 |
| Family Dollar | | Hattiesburg | | MS | | — |
| | 225 |
| | 674 |
| | — |
| | 899 |
| | (150 | ) | | 1/30/2013 | | 2012 | | Asheboro | | NC | | — |
| | 251 |
| | 932 |
| | — |
| | 1,183 |
| | (180 | ) | | 8/28/2014 | | 2014 |
| Family Dollar | | Horn Lake | | MS | | — |
| | 225 |
| | 676 |
| | — |
| | 901 |
| | (166 | ) | | 8/22/2012 | | 2012 | | Boiling Springs | | NC | | — |
| | 322 |
| | 767 |
| | — |
| | 1,089 |
| | (141 | ) | | 8/28/2014 | | 2013 |
| Family Dollar | | Kiln | | MS | | — |
| | 106 |
| | 650 |
| | — |
| | 756 |
| | (151 | ) | | 11/14/2012 | | 2012 | | Burlington | | NC | | — |
| | 291 |
| | 694 |
| | — |
| | 985 |
| | (132 | ) | | 8/28/2014 | | 2012 |
| Family Dollar | | Laurel | | MS | | — |
| | 225 |
| | 723 |
| | — |
| | 948 |
| | (123 | ) | | 2/19/2014 | | 2013 | | Charlotte | | NC | | — |
| | 352 |
| | 985 |
| | — |
| | 1,337 |
| | (262 | ) | | 4/15/2014 | | 2014 |
| Family Dollar | | Natchez | | MS | | — |
| | 289 |
| | 749 |
| | — |
| | 1,038 |
| | (101 | ) | | 8/28/2014 | | 1982 | | Charlotte | | NC | | — |
| | 490 |
| | 1,066 |
| | — |
| | 1,556 |
| | (198 | ) | | 7/2/2014 | | 2014 |
| Family Dollar | | Okolona | | MS | | — |
| | 64 |
| | 578 |
| | — |
| | 642 |
| | (145 | ) | | 7/31/2012 | | 2012 | | Charlotte | | NC | | — |
| | 412 |
| | 992 |
| | — |
| | 1,404 |
| | (186 | ) | | 6/25/2014 | | 2014 |
| Family Dollar | | Pearl | | MS | | — |
| | 342 |
| | 1,001 |
| | — |
| | 1,343 |
| | (101 | ) | | 8/28/2014 | | 2013 | | Ellerbe | | NC | | — |
| | 225 |
| | 781 |
| | — |
| | 1,006 |
| | (186 | ) | | 5/29/2014 | | 2014 |
| Family Dollar | | Philadelphia | | MS | | — |
| | 53 |
| | 897 |
| | — |
| | 950 |
| | (93 | ) | | 8/28/2014 | | 2014 | | Fayetteville | | NC | | — |
| | 267 |
| | 682 |
| | — |
| | 949 |
| | (185 | ) | | 3/14/2014 | | 2013 |
| Family Dollar | | Winona | | MS | | — |
| | 146 |
| | 585 |
| | — |
| | 731 |
| | (147 | ) | | 7/31/2012 | | 2012 | | Hickory | | NC | | — |
| | 215 |
| | 785 |
| | — |
| | 1,000 |
| | (149 | ) | | 8/28/2014 | | 2014 |
| Family Dollar | | Anaconda | | MT | | — |
| | 164 |
| | 1,058 |
| | — |
| | 1,222 |
| | (112 | ) | | 9/30/2014 | | 2014 | | Hiddenite | | NC | | — |
| | 221 |
| | 832 |
| | — |
| | 1,053 |
| | (158 | ) | | 8/28/2014 | | 2013 |
| Family Dollar | | Ennis | | MT | | — |
| | 246 |
| | — |
| | 773 |
| | 1,019 |
| | (102 | ) | | 1/8/2015 | | 2014 | | Liberty | | NC | | — |
| | 243 |
| | 802 |
| | — |
| | 1,045 |
| | (152 | ) | | 8/28/2014 | | 2013 |
| Family Dollar | | Three Forks | | MT | | — |
| | 250 |
| | — |
| | 953 |
| | 1,203 |
| | (43 | ) | | 8/20/2014 | | 2014 | | Lumberton | | NC | | — |
| | 151 |
| | 603 |
| | — |
| | 754 |
| | (174 | ) | | 9/11/2013 | | 1995 |
| Family Dollar | | Whitehall | | MT | | — |
| | 132 |
| | — |
| | 1,064 |
| | 1,196 |
| | (140 | ) | | 3/19/2015 | | 1995 | | Lumberton | | NC | | — |
| | 146 |
| | 1,013 |
| | — |
| | 1,159 |
| | (195 | ) | | 6/20/2014 | | 2014 |
| Family Dollar | | Asheboro | | NC | | — |
| | 251 |
| | 932 |
| | — |
| | 1,183 |
| | (98 | ) | | 8/28/2014 | | 2014 | | Parkton | | NC | | — |
| | 164 |
| | 894 |
| | — |
| | 1,058 |
| | (165 | ) | | 9/19/2014 | | 2014 |
| Family Dollar | | Boiling Springs | | NC | | — |
| | 322 |
| | 767 |
| | — |
| | 1,089 |
| | (77 | ) | | 8/28/2014 | | 2013 | | Raeford | | NC | | — |
| | 428 |
| | 900 |
| | — |
| | 1,328 |
| | (240 | ) | | 4/17/2014 | | 2014 |
| Family Dollar | | Burlington | | NC | | — |
| | 291 |
| | 694 |
| | — |
| | 985 |
| | (72 | ) | | 8/28/2014 | | 2012 | | Raeford | | NC | | — |
| | 185 |
| | 935 |
| | — |
| | 1,120 |
| | (222 | ) | | 5/29/2014 | | 2014 |
| Family Dollar | | Charlotte | | NC | | — |
| | 352 |
| | 985 |
| | — |
| | 1,337 |
| | (151 | ) | | 4/15/2014 | | 2014 | |
| Family Dollar | | Charlotte | | NC | | — |
| | 490 |
| | 1,066 |
| | — |
| | 1,556 |
| | (109 | ) | | 7/2/2014 | | 2014 | |
| Family Dollar | | Ellerbe | | NC | | — |
| | 225 |
| | 781 |
| | — |
| | 1,006 |
| | (106 | ) | | 5/29/2014 | | 2014 | |
| Family Dollar | | Fayetteville | | NC | | — |
| | 267 |
| | 682 |
| | — |
| | 949 |
| | (108 | ) | | 3/14/2014 | | 2013 | |
| Family Dollar | | Hickory | | NC | | — |
| | 215 |
| | 785 |
| | — |
| | 1,000 |
| | (81 | ) | | 8/28/2014 | | 2014 | |
| Family Dollar | | Hiddenite | | NC | | — |
| | 221 |
| | 832 |
| | — |
| | 1,053 |
| | (86 | ) | | 8/28/2014 | | 2013 | |
| Family Dollar | | Liberty | | NC | | — |
| | 243 |
| | 802 |
| | — |
| | 1,045 |
| | (83 | ) | | 8/28/2014 | | 2013 | |
| Family Dollar | | Lumberton | | NC | | — |
| | 151 |
| | 603 |
| | — |
| | 754 |
| | (112 | ) | | 9/11/2013 | | 1995 | |
| Family Dollar | | Lumberton | | NC | | — |
| | 146 |
| | 1,013 |
| | — |
| | 1,159 |
| | (109 | ) | | 6/20/2014 | | 2014 | |
| Family Dollar | | Charlotte | | NC | | — |
| | 412 |
| | 992 |
| | — |
| | 1,404 |
| | (104 | ) | | 6/25/2014 | | 2014 | |
| Family Dollar | | Parkton | | NC | | — |
| | 164 |
| | 894 |
| | — |
| | 1,058 |
| | (89 | ) | | 9/19/2014 | | 2014 | |
| Family Dollar | | Raeford | | NC | | — |
| | 428 |
| | 900 |
| | — |
| | 1,328 |
| | (138 | ) | | 4/17/2014 | | 2014 | |
| Family Dollar | | Raeford | | NC | | — |
| | 185 |
| | 935 |
| | — |
| | 1,120 |
| | (126 | ) | | 5/29/2014 | | 2014 | |
| | | | | | Initial Costs (1) | | Costs Capitalized Subsequent to Acquisition (2) | | Gross Amount
Carried at
December 31, 2016
(3) (4) | | | | | | Initial Costs (1) | | Costs Capitalized Subsequent to Acquisition (2) | | Gross Amount
Carried at
December 31, 2018
(3) (4) | | | |
| Property | | City | | State | | Encumbrances at
December 31, 2016 | | Land | | Buildings, Fixtures and Improvements | | Accumulated Depreciation
(3) (5) | | Date Acquired | | Date of Construction | | City | | State | | Encumbrances at
December 31, 2018 | | Land | | Buildings, Fixtures and Improvements | | Accumulated Depreciation
(3) (5) | | Date Acquired | | Date of Construction |
| Family Dollar | | Troy | | NC | | — |
| | 341 |
| | 621 |
| | — |
| | 962 |
| | (72 | ) | | 6/17/2014 | | 2014 | | Troy | | NC | | — |
| | 341 |
| | 621 |
| | — |
| | 962 |
| | (128 | ) | | 6/17/2014 | | 2014 |
| Family Dollar | | Fort Yates | | ND | | — |
| | 126 |
| | 715 |
| | — |
| | 841 |
| | (199 | ) | | 1/31/2012 | | 2010 | | Fort Yates | | ND | | — |
| | 126 |
| | 715 |
| | — |
| | 841 |
| | (240 | ) | | 1/31/2012 | | 2010 |
| Family Dollar | | New Town | | ND | | — |
| | 105 |
| | 942 |
| | 24 |
| | 1,071 |
| | (263 | ) | | 1/31/2012 | | 2011 | | New Town | | ND | | — |
| | 105 |
| | 942 |
| | 24 |
| | 1,071 |
| | (318 | ) | | 1/31/2012 | | 2011 |
| Family Dollar | | Rolla | | ND | | — |
| | 83 |
| | 749 |
| | — |
| | 832 |
| | (209 | ) | | 1/31/2012 | | 2010 | | Rolla | | ND | | — |
| | 83 |
| | 749 |
| | — |
| | 832 |
| | (252 | ) | | 1/31/2012 | | 2010 |
| Family Dollar | | Madison | | NE | | — |
| | 37 |
| | 703 |
| | — |
| | 740 |
| | (198 | ) | | 12/30/2011 | | 2011 | | Madison | | NE | | — |
| | 37 |
| | 703 |
| | — |
| | 740 |
| | (238 | ) | | 12/30/2011 | | 2011 |
| Family Dollar | | Omaha | | NE | | — |
| | 196 |
| | 1,334 |
| | — |
| | 1,530 |
| | (170 | ) | | 12/19/2014 | | 1995 | | Omaha | | NE | | — |
| | 196 |
| | 1,334 |
| | — |
| | 1,530 |
| | (292 | ) | | 12/19/2014 | | 1995 |
| Family Dollar | | Omaha | | NE | | — |
| | 141 |
| | 1,159 |
| | 3 |
| | 1,303 |
| | (139 | ) | | 12/18/2014 | | 1995 | | Omaha | | NE | | — |
| | 141 |
| | 1,159 |
| | 3 |
| | 1,303 |
| | (241 | ) | | 12/18/2014 | | 1995 |
| Family Dollar | | Rushville | | NE | | — |
| | 125 |
| | 499 |
| | — |
| | 624 |
| | (104 | ) | | 4/26/2013 | | 2007 | | Rushville | | NE | | — |
| | 125 |
| | 499 |
| | — |
| | 624 |
| | (150 | ) | | 4/26/2013 | | 2007 |
| Family Dollar | | Lancaster | | NH | | — |
| | 456 |
| | 1,294 |
| | (2 | ) | | 1,748 |
| | (116 | ) | | 12/12/2014 | | 1989 | | Lancaster | | NH | | — |
| | 456 |
| | 1,294 |
| | (2 | ) | | 1,748 |
| | (231 | ) | | 12/12/2014 | | 1989 |
| Family Dollar | | Stratford | | NJ | | — |
| | 378 |
| | 1,511 |
| | (174 | ) | | 1,715 |
| | (114 | ) | | 12/31/2014 | | 2014 | | Stratford | | NJ | | — |
| | 378 |
| | 1,511 |
| | (174 | ) | | 1,715 |
| | (226 | ) | | 12/31/2014 | | 2014 |
| Family Dollar | | Alamorgordo | | NM | | 524 |
| | 161 |
| | 675 |
| | — |
| | 836 |
| | (103 | ) | | 2/7/2014 | | 2001 | | Alamorgordo | | NM | | 524 |
| | 161 |
| | 675 |
| | — |
| | 836 |
| | (175 | ) | | 2/7/2014 | | 2001 |
| Family Dollar | | Belen | | NM | | — |
| | 350 |
| | — |
| | 969 |
| | 1,319 |
| | (75 | ) | | 5/29/2015 | | 2014 | | Belen | | NM | | — |
| | 350 |
| | — |
| | 969 |
| | 1,319 |
| | (168 | ) | | 5/29/2015 | | 2014 |
| Family Dollar | | Carrizozo | | NM | | — |
| | 250 |
| | — |
| | 1,113 |
| | 1,363 |
| | (66 | ) | | 3/6/2015 | | 2014 | | Carrizozo | | NM | | — |
| | 250 |
| | — |
| | 1,113 |
| | 1,363 |
| | (174 | ) | | 3/6/2015 | | 2014 |
| Family Dollar | | Chimayo | | NM | | — |
| | 158 |
| | 632 |
| | (15 | ) | | 775 |
| | (139 | ) | | 1/30/2013 | | 2009 | | Chimayo | | NM | | — |
| | 158 |
| | 632 |
| | (15 | ) | | 775 |
| | (192 | ) | | 1/30/2013 | | 2009 |
| Family Dollar | | Cloudcroft | | NM | | — |
| | 184 |
| | 1,344 |
| | — |
| | 1,528 |
| | (155 | ) | | 12/18/2014 | | 1995 | | Cloudcroft | | NM | | — |
| | 184 |
| | 1,344 |
| | — |
| | 1,528 |
| | (269 | ) | | 12/18/2014 | | 1995 |
| Family Dollar | | Clovis | | NM | | 657 |
| | 119 |
| | 854 |
| | — |
| | 973 |
| | (136 | ) | | 2/7/2014 | | 2004 | | Clovis | | NM | | 657 |
| | 119 |
| | 854 |
| | — |
| | 973 |
| | (231 | ) | | 2/7/2014 | | 2004 |
| Family Dollar | | Gallup | | NM | | — |
| | 221 |
| | 1,366 |
| | — |
| | 1,587 |
| | (227 | ) | | 2/7/2014 | | 2007 | | Gallup | | NM | | — |
| | 221 |
| | 1,366 |
| | — |
| | 1,587 |
| | (386 | ) | | 2/7/2014 | | 2007 |
| Family Dollar | | Hernandez | | NM | | 1,152 |
| | 140 |
| | 1,434 |
| | — |
| | 1,574 |
| | (238 | ) | | 2/7/2014 | | 2008 | | Hernandez | | NM | | 1,152 |
| | 140 |
| | 1,434 |
| | — |
| | 1,574 |
| | (404 | ) | | 2/7/2014 | | 2008 |
| Family Dollar | | Logan | | NM | | — |
| | 80 |
| | — |
| | 1,147 |
| | 1,227 |
| | (77 | ) | | 5/29/2015 | | 2015 | | Logan | | NM | | — |
| | 80 |
| | — |
| | 1,147 |
| | 1,227 |
| | (171 | ) | | 5/29/2015 | | 2015 |
| Family Dollar | | Lovington | | NM | | — |
| | 54 |
| | 722 |
| | — |
| | 776 |
| | (77 | ) | | 6/30/2014 | | 2014 | | Lovington | | NM | | — |
| | 54 |
| | 722 |
| | — |
| | 776 |
| | (137 | ) | | 6/30/2014 | | 2014 |
| Family Dollar | | Mountainair | | NM | | — |
| | 84 |
| | 752 |
| | — |
| | 836 |
| | (188 | ) | | 7/16/2012 | | 2011 | | Mountainair | | NM | | — |
| | 84 |
| | 752 |
| | — |
| | 836 |
| | (242 | ) | | 7/16/2012 | | 2011 |
| Family Dollar | | Roswell | | NM | | 766 |
| | 140 |
| | 953 |
| | — |
| | 1,093 |
| | (155 | ) | | 2/7/2014 | | 2004 | | Roswell | | NM | | 766 |
| | 140 |
| | 953 |
| | — |
| | 1,093 |
| | (263 | ) | | 2/7/2014 | | 2004 |
| Family Dollar | | Springer | | NM | | — |
| | 106 |
| | — |
| | 1,199 |
| | 1,305 |
| | (122 | ) | | 2/11/2015 | | 2014 | | Springer | | NM | | — |
| | 106 |
| | — |
| | 1,199 |
| | 1,305 |
| | (212 | ) | | 2/11/2015 | | 2014 |
| Family Dollar | | Velarde | | NM | | — |
| | 183 |
| | — |
| | 1,122 |
| | 1,305 |
| | (70 | ) | | 2/25/2015 | | 2015 | | Velarde | | NM | | — |
| | 183 |
| | — |
| | 1,122 |
| | 1,305 |
| | (172 | ) | | 2/25/2015 | | 2015 |
| Family Dollar | | Waterflow | | NM | | — |
| | 175 |
| | — |
| | 1,294 |
| | 1,469 |
| | (33 | ) | | 2/5/2015 | | 2014 | | Waterflow | | NM | | — |
| | 175 |
| | — |
| | 1,294 |
| | 1,469 |
| | (137 | ) | | 2/5/2015 | | 2014 |
| Family Dollar | | Battle Mountain | | NV | | — |
| | 116 |
| | 1,431 |
| | — |
| | 1,547 |
| | (228 | ) | | 2/7/2014 | | 2009 | | Battle Mountain | | NV | | — |
| | 116 |
| | 1,431 |
| | — |
| | 1,547 |
| | (387 | ) | | 2/7/2014 | | 2009 |
| Family Dollar | | Carlin | | NV | | — |
| | 99 |
| | 895 |
| | — |
| | 994 |
| | (165 | ) | | 9/13/2013 | | 2012 | | Carlin | | NV | | — |
| | 99 |
| | 895 |
| | — |
| | 994 |
| | (259 | ) | | 9/13/2013 | | 2012 |
| Family Dollar | | Cold Springs | | NV | | — |
| | 217 |
| | 869 |
| | — |
| | 1,086 |
| | (161 | ) | | 9/13/2013 | | 2013 | | Cold Springs | | NV | | — |
| | 217 |
| | 869 |
| | — |
| | 1,086 |
| | (251 | ) | | 9/13/2013 | | 2013 |
| Family Dollar | | Hawthorne | | NV | | 471 |
| | 191 |
| | 764 |
| | — |
| | 955 |
| | (195 | ) | | 6/1/2012 | | 2012 | | Hawthorne | | NV | | — |
| | 191 |
| | 764 |
| | — |
| | 955 |
| | (248 | ) | | 6/1/2012 | | 2012 |
| Family Dollar | | Las Vegas | | NV | | 876 |
| | 689 |
| | 612 |
| | — |
| | 1,301 |
| | (114 | ) | | 2/7/2014 | | 2005 | | Las Vegas | | NV | | 876 |
| | 689 |
| | 612 |
| | — |
| | 1,301 |
| | (193 | ) | | 2/7/2014 | | 2005 |
| Family Dollar | | Lovelock | | NV | | 457 |
| | 185 |
| | 742 |
| | — |
| | 927 |
| | (193 | ) | | 5/4/2012 | | 2012 | | Lovelock | | NV | | — |
| | 185 |
| | 742 |
| | — |
| | 927 |
| | (242 | ) | | 5/4/2012 | | 2012 |
| Family Dollar | | Silver Spring | | NV | | — |
| | 202 |
| | 808 |
| | — |
| | 1,010 |
| | (195 | ) | | 9/21/2012 | | 2012 | | Silver Spring | | NV | | — |
| | 202 |
| | 808 |
| | — |
| | 1,010 |
| | (256 | ) | | 9/21/2012 | | 2012 |
| | | | | | Initial Costs (1) | | Costs Capitalized Subsequent to Acquisition (2) | | Gross Amount
Carried at
December 31, 2016
(3) (4) | | | | | | Initial Costs (1) | | Costs Capitalized Subsequent to Acquisition (2) | | Gross Amount
Carried at
December 31, 2018
(3) (4) | | | |
| Property | | City | | State | | Encumbrances at
December 31, 2016 | | Land | | Buildings, Fixtures and Improvements | | Accumulated Depreciation
(3) (5) | | Date Acquired | | Date of Construction | | City | | State | | Encumbrances at
December 31, 2018 | | Land | | Buildings, Fixtures and Improvements | | Accumulated Depreciation
(3) (5) | | Date Acquired | | Date of Construction |
| Family Dollar | | Wells | | NV | | 415 |
| | 84 |
| | 755 |
| | — |
| | 839 |
| | (196 | ) | | 5/11/2012 | | 2011 | | Wells | | NV | | — |
| | 84 |
| | 755 |
| | — |
| | 839 |
| | (246 | ) | | 5/11/2012 | | 2011 |
| Family Dollar | | Altona | | NY | | — |
| | 94 |
| | 923 |
| | — |
| | 1,017 |
| | (156 | ) | | 2/21/2014 | | 2014 | | Altona | | NY | | — |
| | 94 |
| | 923 |
| | — |
| | 1,017 |
| | (265 | ) | | 2/21/2014 | | 2014 |
| Family Dollar | | Chateaugay | | NY | | — |
| | 133 |
| | 910 |
| | — |
| | 1,043 |
| | (154 | ) | | 2/20/2014 | | 2014 | | Chateaugay | | NY | | — |
| | 133 |
| | 910 |
| | — |
| | 1,043 |
| | (261 | ) | | 2/20/2014 | | 2014 |
| Family Dollar | | Cincinnatus | | NY | | — |
| | 287 |
| | 862 |
| | — |
| | 1,149 |
| | (147 | ) | | 12/30/2013 | | 2013 | | Cincinnatus | | NY | | — |
| | 287 |
| | 862 |
| | — |
| | 1,149 |
| | (243 | ) | | 12/30/2013 | | 2013 |
| Family Dollar | | Hoosick Falls | | NY | | — |
| | 181 |
| | 724 |
| | — |
| | 905 |
| | (151 | ) | | 4/26/2013 | | 2013 | | Penn Yan | | NY | | 525 |
| | 23 |
| | 760 |
| | — |
| | 783 |
| | (203 | ) | | 2/7/2014 | | 2003 |
| Family Dollar | | Penn Yan | | NY | | 525 |
| | 23 |
| | 760 |
| | — |
| | 783 |
| | (119 | ) | | 2/7/2014 | | 2003 | | Sodus | | NY | | — |
| | 54 |
| | 1,441 |
| | — |
| | 1,495 |
| | (378 | ) | | 5/7/2014 | | 2013 |
| Family Dollar | | Sodus | | NY | | — |
| | 54 |
| | 1,441 |
| | — |
| | 1,495 |
| | (214 | ) | | 5/7/2014 | | 2013 | | Wolcott | | NY | | — |
| | 197 |
| | 1,193 |
| | — |
| | 1,390 |
| | (211 | ) | | 3/25/2015 | | 2014 |
| Family Dollar | | Wolcott | | NY | | — |
| | 197 |
| | 1,193 |
| | — |
| | 1,390 |
| | (100 | ) | | 3/25/2015 | | 2014 | | Bethel | | OH | | 852 |
| | 139 |
| | 1,099 |
| | — |
| | 1,238 |
| | (306 | ) | | 2/7/2014 | | 2005 |
| Family Dollar | | Bethel | | OH | | 852 |
| | 139 |
| | 1,099 |
| | — |
| | 1,238 |
| | (180 | ) | | 2/7/2014 | | 2005 | | Canal Winchester | | OH | | — |
| | 218 |
| | 1,116 |
| | — |
| | 1,334 |
| | (207 | ) | | 8/28/2014 | | 2012 |
| Family Dollar | | Canal Winchester | | OH | | — |
| | 218 |
| | 1,116 |
| | — |
| | 1,334 |
| | (113 | ) | | 8/28/2014 | | 2012 | | Canton | | OH | | 460 |
| | 93 |
| | 766 |
| | — |
| | 859 |
| | (198 | ) | | 2/7/2014 | | 2002 |
| Family Dollar | | Canton | | OH | | 460 |
| | 93 |
| | 766 |
| | — |
| | 859 |
| | (117 | ) | | 2/7/2014 | | 2002 | | Cincinnati | | OH | | — |
| | 221 |
| | 1,055 |
| | — |
| | 1,276 |
| | (211 | ) | | 8/28/2014 | | 2001 |
| Family Dollar | | Cincinnati | | OH | | — |
| | 221 |
| | 1,055 |
| | — |
| | 1,276 |
| | (115 | ) | | 8/28/2014 | | 2001 | | Cleveland | | OH | | 1,079 |
| | 39 |
| | 1,614 |
| | — |
| | 1,653 |
| | (425 | ) | | 2/7/2014 | | 2003 |
| Family Dollar | | Cleveland | | OH | | 1,079 |
| | 39 |
| | 1,614 |
| | — |
| | 1,653 |
| | (251 | ) | | 2/7/2014 | | 2003 | | Cleveland | | OH | | 1,370 |
| | 216 |
| | 1,818 |
| | — |
| | 2,034 |
| | (493 | ) | | 2/7/2014 | | 1994 |
| Family Dollar | | Cleveland | | OH | | 1,370 |
| | 216 |
| | 1,818 |
| | — |
| | 2,034 |
| | (291 | ) | | 2/7/2014 | | 1994 | | Cortland | | OH | | — |
| | 188 |
| | 963 |
| | — |
| | 1,151 |
| | (184 | ) | | 8/28/2014 | | 2013 |
| Family Dollar | | Cortland | | OH | | — |
| | 188 |
| | 963 |
| | — |
| | 1,151 |
| | (100 | ) | | 8/28/2014 | | 2013 | | Dayton | | OH | | — |
| | 107 |
| | 899 |
| | — |
| | 1,006 |
| | (212 | ) | | 8/28/2014 | | 1940 |
| Family Dollar | | Dayton | | OH | | — |
| | 107 |
| | 899 |
| | — |
| | 1,006 |
| | (116 | ) | | 8/28/2014 | | 1940 | | Dayton | | OH | | — |
| | 129 |
| | 618 |
| | — |
| | 747 |
| | (136 | ) | | 8/28/2014 | | 2002 |
| Family Dollar | | Dayton | | OH | | — |
| | 129 |
| | 618 |
| | — |
| | 747 |
| | (74 | ) | | 8/28/2014 | | 2002 | | Hamilton | | OH | | — |
| | 131 |
| | 1,215 |
| | — |
| | 1,346 |
| | (222 | ) | | 8/28/2014 | | 2013 |
| Family Dollar | | Hamilton | | OH | | — |
| | 131 |
| | 1,215 |
| | — |
| | 1,346 |
| | (121 | ) | | 8/28/2014 | | 2013 | | Jackson Center | | OH | | — |
| | 97 |
| | 764 |
| | — |
| | 861 |
| | (146 | ) | | 4/28/2014 | | 1989 |
| Family Dollar | | Jackson Center | | OH | | — |
| | 97 |
| | 764 |
| | — |
| | 861 |
| | (84 | ) | | 4/28/2014 | | 1989 | | Loveland | | OH | | 798 |
| | 179 |
| | 986 |
| | — |
| | 1,165 |
| | (273 | ) | | 2/7/2014 | | 2002 |
| Family Dollar | | Loveland | | OH | | 798 |
| | 179 |
| | 986 |
| | — |
| | 1,165 |
| | (161 | ) | | 2/7/2014 | | 2002 | | Middleton | | OH | | 660 |
| | 137 |
| | 869 |
| | — |
| | 1,006 |
| | (235 | ) | | 2/7/2014 | | 2001 |
| Family Dollar | | Middleton | | OH | | 660 |
| | 137 |
| | 869 |
| | — |
| | 1,006 |
| | (139 | ) | | 2/7/2014 | | 2001 | | Toledo | | OH | | — |
| | 306 |
| | 917 |
| | — |
| | 1,223 |
| | (280 | ) | | 2/25/2013 | | 2012 |
| Family Dollar | | Toledo | | OH | | — |
| | 306 |
| | 917 |
| | — |
| | 1,223 |
| | (200 | ) | | 2/25/2013 | | 2012 | | Toledo | | OH | | — |
| | 226 |
| | 905 |
| | — |
| | 1,131 |
| | (266 | ) | | 7/11/2013 | | 1942 |
| Family Dollar | | Toledo | | OH | | — |
| | 226 |
| | 905 |
| | — |
| | 1,131 |
| | (176 | ) | | 7/11/2013 | | 1942 | | Warren | | OH | | — |
| | 170 |
| | 681 |
| | (2 | ) | | 849 |
| | (216 | ) | | 9/11/2012 | | 2012 |
| Family Dollar | | Warren | | OH | | — |
| | 170 |
| | 681 |
| | (2 | ) | | 849 |
| | (164 | ) | | 9/11/2012 | | 2012 | | Durant | | OK | | — |
| | 164 |
| | 1,223 |
| | — |
| | 1,387 |
| | (239 | ) | | 8/28/2014 | | 2000 |
| Family Dollar | | Durant | | OK | | — |
| | 164 |
| | 1,223 |
| | — |
| | 1,387 |
| | (130 | ) | | 8/28/2014 | | 2000 | | El Reno | | OK | | — |
| | 225 |
| | — |
| | 968 |
| | 1,193 |
| | (197 | ) | | 3/2/2015 | | 1995 |
| Family Dollar | | El Reno | | OK | | — |
| | 225 |
| | — |
| | 968 |
| | 1,193 |
| | (113 | ) | | 3/2/2015 | | 1995 | | Geary | | OK | | — |
| | 167 |
| | 882 |
| | — |
| | 1,049 |
| | (128 | ) | | 10/14/2015 | | 2015 |
| Family Dollar | | Geary | | OK | | — |
| | 167 |
| | 882 |
| | — |
| | 1,049 |
| | (54 | ) | | 10/14/2015 | | 2015 | | Keota | | OK | | — |
| | 279 |
| | 872 |
| | — |
| | 1,151 |
| | (168 | ) | | 10/16/2014 | | 2014 |
| Family Dollar | | Keota | | OK | | — |
| | 279 |
| | 872 |
| | — |
| | 1,151 |
| | (97 | ) | | 10/16/2014 | | 2014 | | Kingston | | OK | | — |
| | 28 |
| | 660 |
| | — |
| | 688 |
| | (165 | ) | | 2/7/2014 | | 2000 |
| Family Dollar | | Kingston | | OK | | — |
| | 28 |
| | 660 |
| | — |
| | 688 |
| | (97 | ) | | 2/7/2014 | | 2000 | | Oklahoma City | | OK | | — |
| | 403 |
| | — |
| | 988 |
| | 1,391 |
| | (146 | ) | | 5/15/2015 | | 2015 |
| Family Dollar | | Oklahoma City | | OK | | — |
| | 403 |
| | — |
| | 988 |
| | 1,391 |
| | (65 | ) | | 5/15/2015 | | 2015 | | Oklahoma City | | OK | | — |
| | 390 |
| | 990 |
| | — |
| | 1,380 |
| | (187 | ) | | 8/28/2014 | | 2013 |
| Family Dollar | | Oklahoma City | | OK | | — |
| | 390 |
| | 990 |
| | — |
| | 1,380 |
| | (102 | ) | | 8/28/2014 | | 2013 | | Porum | | OK | | — |
| | 18 |
| | — |
| | 995 |
| | 1,013 |
| | (153 | ) | | 11/5/2015 | | 2015 |
| Family Dollar | | Porum | | OK | | — |
| | 18 |
| | — |
| | 995 |
| | 1,013 |
| | (65 | ) | | 11/5/2015 | | 2015 | | Poteau | | OK | | — |
| | 310 |
| | — |
| | 924 |
| | 1,234 |
| | (146 | ) | | 8/7/2015 | | 2015 |
| | | | | | Initial Costs (1) | | Costs Capitalized Subsequent to Acquisition (2) | | Gross Amount
Carried at
December 31, 2016
(3) (4) | | | | | | Initial Costs (1) | | Costs Capitalized Subsequent to Acquisition (2) | | Gross Amount
Carried at
December 31, 2018
(3) (4) | | | |
| Property | | City | | State | | Encumbrances at
December 31, 2016 | | Land | | Buildings, Fixtures and Improvements | | Accumulated Depreciation
(3) (5) | | Date Acquired | | Date of Construction | | City | | State | | Encumbrances at
December 31, 2018 | | Land | | Buildings, Fixtures and Improvements | | Accumulated Depreciation
(3) (5) | | Date Acquired | | Date of Construction |
| Family Dollar | | Poteau | | OK | | — |
| | 310 |
| | — |
| | 924 |
| | 1,234 |
| | (63 | ) | | 8/7/2015 | | 2015 | | Stilwell | | OK | | — |
| | 40 |
| | 768 |
| | — |
| | 808 |
| | (258 | ) | | 1/6/2012 | | 2011 |
| Family Dollar | | Stilwell | | OK | | — |
| | 40 |
| | 768 |
| | — |
| | 808 |
| | (214 | ) | | 1/6/2012 | | 2011 | | Texhoma | | OK | | — |
| | 150 |
| | — |
| | 912 |
| | 1,062 |
| | (120 | ) | | 4/15/2015 | | 2015 |
| Family Dollar | | Texhoma | | OK | | — |
| | 150 |
| | — |
| | 912 |
| | 1,062 |
| | (39 | ) | | 4/15/2015 | | 2015 | | Tulsa | | OK | | — |
| | 220 |
| | 878 |
| | — |
| | 1,098 |
| | (283 | ) | | 7/30/2012 | | 2012 |
| Family Dollar | | Tulsa | | OK | | 536 |
| | 220 |
| | 878 |
| | — |
| | 1,098 |
| | (220 | ) | | 7/30/2012 | | 2012 | | Broad Top | | PA | | — |
| | 196 |
| | 954 |
| | — |
| | 1,150 |
| | (181 | ) | | 5/30/2014 | | 2013 |
| Family Dollar | | Broad Top | | PA | | — |
| | 196 |
| | 954 |
| | — |
| | 1,150 |
| | (103 | ) | | 5/30/2014 | | 2013 | | Abbeville | | SC | | — |
| | 146 |
| | 734 |
| | — |
| | 880 |
| | (148 | ) | | 5/23/2014 | | 2014 |
| Family Dollar | | Abbeville | | SC | | — |
| | 146 |
| | 734 |
| | — |
| | 880 |
| | (84 | ) | | 5/23/2014 | | 2014 | | Columbia | | SC | | — |
| | 429 |
| | 719 |
| | (35 | ) | | 1,113 |
| | (195 | ) | | 3/12/2014 | | 2014 |
| Family Dollar | | Columbia | | SC | | — |
| | 429 |
| | 719 |
| | — |
| | 1,148 |
| | (114 | ) | | 3/12/2014 | | 2014 | | Columbia | | SC | | — |
| | 489 |
| | 943 |
| | — |
| | 1,432 |
| | (154 | ) | | 2/3/2015 | | 2013 |
| Family Dollar | | Columbia | | SC | | — |
| | 489 |
| | 943 |
| | — |
| | 1,432 |
| | (75 | ) | | 2/3/2015 | | 2013 | | Estill | | SC | | — |
| | 244 |
| | 757 |
| | — |
| | 1,001 |
| | (150 | ) | | 6/4/2014 | | 2014 |
| Family Dollar | | Estill | | SC | | — |
| | 244 |
| | 757 |
| | — |
| | 1,001 |
| | (84 | ) | | 6/4/2014 | | 2014 | | Lancaster | | SC | | — |
| | 249 |
| | 725 |
| | — |
| | 974 |
| | (140 | ) | | 8/28/2014 | | 2013 |
| Family Dollar | | Lancaster | | SC | | — |
| | 249 |
| | 725 |
| | — |
| | 974 |
| | (76 | ) | | 8/28/2014 | | 2013 | | Manning | | SC | | — |
| | 313 |
| | 960 |
| | — |
| | 1,273 |
| | (178 | ) | | 9/30/2014 | | 2014 |
| Family Dollar | | Manning | | SC | | — |
| | 313 |
| | 960 |
| | — |
| | 1,273 |
| | (95 | ) | | 9/30/2014 | | 2014 | | Mccormick | | SC | | — |
| | 167 |
| | 791 |
| | — |
| | 958 |
| | (211 | ) | | 4/30/2014 | | 2014 |
| Family Dollar | | Mccormick | | SC | | — |
| | 167 |
| | 791 |
| | — |
| | 958 |
| | (122 | ) | | 4/30/2014 | | 2014 | | Newberry | | SC | | — |
| | 231 |
| | 935 |
| | — |
| | 1,166 |
| | (252 | ) | | 3/27/2014 | | 2013 |
| Family Dollar | | Newberry | | SC | | — |
| | 231 |
| | 935 |
| | — |
| | 1,166 |
| | (147 | ) | | 3/27/2014 | | 2013 | | North | | SC | | — |
| | 193 |
| | 979 |
| | — |
| | 1,172 |
| | (161 | ) | | 2/23/2015 | | 2013 |
| Family Dollar | | North | | SC | | — |
| | 193 |
| | 979 |
| | — |
| | 1,172 |
| | (78 | ) | | 2/23/2015 | | 2013 | | St. Matthews | | SC | | — |
| | 175 |
| | 828 |
| | — |
| | 1,003 |
| | (155 | ) | | 9/3/2014 | | 2014 |
| Family Dollar | | St. Matthews | | SC | | — |
| | 175 |
| | 828 |
| | — |
| | 1,003 |
| | (83 | ) | | 9/3/2014 | | 2014 | | Woodruff | | SC | | — |
| | 229 |
| | 1,125 |
| | — |
| | 1,354 |
| | (207 | ) | | 8/28/2014 | | 2010 |
| Family Dollar | | Woodruff | | SC | | — |
| | 229 |
| | 1,125 |
| | — |
| | 1,354 |
| | (113 | ) | | 8/28/2014 | | 2010 | | Blackhawk | | SD | | — |
| | 115 |
| | 585 |
| | — |
| | 700 |
| | (117 | ) | | 8/6/2014 | | 2006 |
| Family Dollar | | Blackhawk | | SD | | — |
| | 115 |
| | 585 |
| | — |
| | 700 |
| | (63 | ) | | 8/6/2014 | | 2006 | | Custer | | SD | | — |
| | 32 |
| | 617 |
| | — |
| | 649 |
| | (183 | ) | | 6/14/2013 | | 1995 |
| Family Dollar | | Custer | | SD | | — |
| | 32 |
| | 617 |
| | — |
| | 649 |
| | (123 | ) | | 6/14/2013 | | 1995 | | Lemmon | | SD | | — |
| | 140 |
| | — |
| | 1,021 |
| | 1,161 |
| | (144 | ) | | 5/1/2015 | | 2014 |
| Family Dollar | | Lemmon | | SD | | — |
| | 140 |
| | — |
| | 1,021 |
| | 1,161 |
| | (64 | ) | | 5/1/2015 | | 2014 | | Martin | | SD | | — |
| | 85 |
| | 764 |
| | — |
| | 849 |
| | (257 | ) | | 1/31/2012 | | 2010 |
| Family Dollar | | Martin | | SD | | — |
| | 85 |
| | 764 |
| | — |
| | 849 |
| | (213 | ) | | 1/31/2012 | | 2010 | | Mclaughlin | | SD | | — |
| | 35 |
| | — |
| | 1,092 |
| | 1,127 |
| | (141 | ) | | 5/12/2015 | | 2015 |
| Family Dollar | | Mclaughlin | | SD | | — |
| | 35 |
| | — |
| | 1,092 |
| | 1,127 |
| | (46 | ) | | 5/12/2015 | | 2015 | | Parker | | SD | | — |
| | 117 |
| | 828 |
| | 1 |
| | 946 |
| | (182 | ) | | 10/10/2014 | | 2014 |
| Family Dollar | | Parker | | SD | | — |
| | 117 |
| | 828 |
| | 1 |
| | 946 |
| | (104 | ) | | 10/10/2014 | | 2014 | | Tyndall | | SD | | — |
| | 72 |
| | — |
| | 1,072 |
| | 1,144 |
| | (170 | ) | | 3/31/2015 | | 2015 |
| Family Dollar | | Tyndall | | SD | | — |
| | 72 |
| | — |
| | 1,072 |
| | 1,144 |
| | (80 | ) | | 3/31/2015 | | 2015 | | Harrison | | TN | | — |
| | 74 |
| | 420 |
| | — |
| | 494 |
| | (123 | ) | | 7/23/2013 | | 2006 |
| Family Dollar | | Harrison | | TN | | — |
| | 74 |
| | 420 |
| | — |
| | 494 |
| | (81 | ) | | 7/23/2013 | | 2006 | | Lexington | | TN | | — |
| | 323 |
| | 838 |
| | — |
| | 1,161 |
| | (159 | ) | | 8/28/2014 | | 2013 |
| Family Dollar | | Lexington | | TN | | — |
| | 323 |
| | 838 |
| | — |
| | 1,161 |
| | (87 | ) | | 8/28/2014 | | 2013 | | Memphis | | TN | | — |
| | 248 |
| | 1,039 |
| | — |
| | 1,287 |
| | (277 | ) | | 2/7/2014 | | 2004 |
| Family Dollar | | Memphis | | TN | | — |
| | 248 |
| | 1,039 |
| | — |
| | 1,287 |
| | (163 | ) | | 2/7/2014 | | 2004 | | Memphis | | TN | | 638 |
| | 215 |
| | 811 |
| | — |
| | 1,026 |
| | (216 | ) | | 2/7/2014 | | 2003 |
| Family Dollar | | Memphis | | TN | | 638 |
| | 215 |
| | 811 |
| | — |
| | 1,026 |
| | (127 | ) | | 2/7/2014 | | 2003 | | Memphis | | TN | | 1,251 |
| | 376 |
| | 1,508 |
| | — |
| | 1,884 |
| | (411 | ) | | 2/7/2014 | | 2005 |
| Family Dollar | | Memphis | | TN | | 1,251 |
| | 376 |
| | 1,508 |
| | — |
| | 1,884 |
| | (242 | ) | | 2/7/2014 | | 2005 | | Memphis | | TN | | 973 |
| | 336 |
| | 1,156 |
| | — |
| | 1,492 |
| | (312 | ) | | 2/7/2014 | | 2003 |
| Family Dollar | | Memphis | | TN | | 973 |
| | 336 |
| | 1,156 |
| | — |
| | 1,492 |
| | (184 | ) | | 2/7/2014 | | 2003 | | Nashville | | TN | | — |
| | 334 |
| | 1,275 |
| | — |
| | 1,609 |
| | (259 | ) | | 8/28/2014 | | 1976 |
| Family Dollar | | Nashville | | TN | | — |
| | 334 |
| | 1,275 |
| | — |
| | 1,609 |
| | (141 | ) | | 8/28/2014 | | 1976 | | Piney Flats | | TN | | — |
| | 200 |
| | 953 |
| | — |
| | 1,153 |
| | (180 | ) | | 8/28/2014 | | 2014 |
| Family Dollar | | Piney Flats | | TN | | — |
| | 200 |
| | 953 |
| | — |
| | 1,153 |
| | (98 | ) | | 8/28/2014 | | 2014 | | Alton | | TX | | — |
| | 134 |
| | 908 |
| | — |
| | 1,042 |
| | (170 | ) | | 8/28/2014 | | 2013 |
| Family Dollar | | Alton | | TX | | — |
| | 134 |
| | 908 |
| | — |
| | 1,042 |
| | (92 | ) | | 8/28/2014 | | 2013 | | Arlington | | TX | | — |
| | 300 |
| | — |
| | 1,058 |
| | 1,358 |
| | (145 | ) | | 12/4/2015 | | 1995 |
| | | | | | Initial Costs (1) | | Costs Capitalized Subsequent to Acquisition (2) | | Gross Amount
Carried at
December 31, 2016
(3) (4) | | | | | | Initial Costs (1) | | Costs Capitalized Subsequent to Acquisition (2) | | Gross Amount
Carried at
December 31, 2018
(3) (4) | | | |
| Property | | City | | State | | Encumbrances at
December 31, 2016 | | Land | | Buildings, Fixtures and Improvements | | Accumulated Depreciation
(3) (5) | | Date Acquired | | Date of Construction | | City | | State | | Encumbrances at
December 31, 2018 | | Land | | Buildings, Fixtures and Improvements | | Accumulated Depreciation
(3) (5) | | Date Acquired | | Date of Construction |
| Family Dollar | | Arlington | | TX | | — |
| | 300 |
| | — |
| | 1,058 |
| | 1,358 |
| | (57 | ) | | 12/4/2015 | | 1995 | | Arlington | | TX | | — |
| | 425 |
| | — |
| | 1,112 |
| | 1,537 |
| | (63 | ) | | 2/13/2015 | | 2014 |
| Family Dollar | | Arlington | | TX | | — |
| | 425 |
| | — |
| | 1,206 |
| | 1,631 |
| | — |
| | 2/13/2015 | | 2014 | | Avinger | | TX | | — |
| | 40 |
| | 761 |
| | — |
| | 801 |
| | (240 | ) | | 10/22/2012 | | 2012 |
| Family Dollar | | Avinger | | TX | | — |
| | 40 |
| | 761 |
| | — |
| | 801 |
| | (180 | ) | | 10/22/2012 | | 2012 | | Balch Springs | | TX | | — |
| | 318 |
| | — |
| | 1,209 |
| | 1,527 |
| | (160 | ) | | 4/10/2015 | | 2015 |
| Family Dollar | | Balch Springs | | TX | | — |
| | 318 |
| | — |
| | 1,209 |
| | 1,527 |
| | (60 | ) | | 4/10/2015 | | 2015 | | Beaumont | | TX | | — |
| | 215 |
| | 1,511 |
| | — |
| | 1,726 |
| | (365 | ) | | 2/7/2014 | | 2003 |
| Family Dollar | | Beaumont | | TX | | — |
| | 215 |
| | 1,511 |
| | — |
| | 1,726 |
| | (215 | ) | | 2/7/2014 | | 2003 | | Beaumont | | TX | | — |
| | 235 |
| | 810 |
| | — |
| | 1,045 |
| | (214 | ) | | 2/7/2014 | | 2003 |
| Family Dollar | | Beaumont | | TX | | — |
| | 235 |
| | 810 |
| | — |
| | 1,045 |
| | (126 | ) | | 2/7/2014 | | 2003 | | Beaumont | | TX | | 654 |
| | 225 |
| | 806 |
| | — |
| | 1,031 |
| | (211 | ) | | 2/7/2014 | | 2003 |
| Family Dollar | | Beaumont | | TX | | 654 |
| | 225 |
| | 806 |
| | — |
| | 1,031 |
| | (124 | ) | | 2/7/2014 | | 2003 | | Blooming Grove | | TX | | — |
| | 70 |
| | 753 |
| | — |
| | 823 |
| | (144 | ) | | 8/28/2014 | | 2014 |
| Family Dollar | | Blooming Grove | | TX | | — |
| | 70 |
| | 753 |
| | — |
| | 823 |
| | (79 | ) | | 8/28/2014 | | 2014 | | Brazoria | | TX | | — |
| | 216 |
| | 966 |
| | — |
| | 1,182 |
| | (252 | ) | | 2/7/2014 | | 2002 |
| Family Dollar | | Brazoria | | TX | | — |
| | 216 |
| | 966 |
| | — |
| | 1,182 |
| | (149 | ) | | 2/7/2014 | | 2002 | | Broaddus | | TX | | — |
| | 75 |
| | — |
| | 922 |
| | 997 |
| | (177 | ) | | 2/6/2015 | | 1995 |
| Family Dollar | | Broaddus | | TX | | — |
| | 75 |
| | — |
| | 922 |
| | 997 |
| | (102 | ) | | 2/6/2015 | | 1995 | | Centerville | | TX | | — |
| | 226 |
| | 679 |
| | — |
| | 905 |
| | (196 | ) | | 9/10/2013 | | 2013 |
| Family Dollar | | Caldwell | | TX | | — |
| | 138 |
| | 552 |
| | 1 |
| | 691 |
| | (143 | ) | | 5/29/2012 | | 2012 | | Chireno | | TX | | — |
| | 50 |
| | 943 |
| | — |
| | 993 |
| | (293 | ) | | 12/10/2012 | | 2012 |
| Family Dollar | | Centerville | | TX | | — |
| | 226 |
| | 679 |
| | — |
| | 905 |
| | (125 | ) | | 9/10/2013 | | 2013 | | Clarendon | | TX | | — |
| | 83 |
| | 749 |
| | — |
| | 832 |
| | (216 | ) | | 9/17/2013 | | 2013 |
| Family Dollar | | Chireno | | TX | | — |
| | 50 |
| | 943 |
| | — |
| | 993 |
| | (214 | ) | | 12/10/2012 | | 2012 | | Cockrell Hill | | TX | | 970 |
| | 369 |
| | 1,156 |
| | — |
| | 1,525 |
| | (308 | ) | | 2/7/2014 | | 2002 |
| Family Dollar | | Clarendon | | TX | | — |
| | 83 |
| | 749 |
| | — |
| | 832 |
| | (138 | ) | | 9/17/2013 | | 2013 | | Converse | | TX | | 409 |
| | 148 |
| | 469 |
| | — |
| | 617 |
| | (127 | ) | | 2/7/2014 | | 2003 |
| Family Dollar | | Cockrell Hill | | TX | | 970 |
| | 369 |
| | 1,156 |
| | — |
| | 1,525 |
| | (182 | ) | | 2/7/2014 | | 2002 | | Dallas | | TX | | 627 |
| | 292 |
| | 676 |
| | — |
| | 968 |
| | (188 | ) | | 2/7/2014 | | 2004 |
| Family Dollar | | Converse | | TX | | 409 |
| | 148 |
| | 469 |
| | — |
| | 617 |
| | (75 | ) | | 2/7/2014 | | 2003 | | Dickinson | | TX | | 681 |
| | 182 |
| | 876 |
| | — |
| | 1,058 |
| | (232 | ) | | 2/7/2014 | | 2010 |
| Family Dollar | | Dallas | | TX | | 627 |
| | 292 |
| | 676 |
| | — |
| | 968 |
| | (111 | ) | | 2/7/2014 | | 2004 | | Donna | | TX | | — |
| | 194 |
| | 855 |
| | — |
| | 1,049 |
| | (164 | ) | | 8/28/2014 | | 2013 |
| Family Dollar | | Dickinson | | TX | | 681 |
| | 182 |
| | 876 |
| | — |
| | 1,058 |
| | (137 | ) | | 2/7/2014 | | 2010 | | Eagle Lake | | TX | | — |
| | 100 |
| | 566 |
| | 100 |
| | 766 |
| | (193 | ) | | 7/6/2012 | | 2012 |
| Family Dollar | | Donna | | TX | | — |
| | 194 |
| | 855 |
| | — |
| | 1,049 |
| | (89 | ) | | 8/28/2014 | | 2013 | | Etoile | | TX | | — |
| | 45 |
| | 850 |
| | — |
| | 895 |
| | (248 | ) | | 8/6/2013 | | 2013 |
| Family Dollar | | Eagle Lake | | TX | | — |
| | 100 |
| | 566 |
| | 10 |
| | 676 |
| | (142 | ) | | 7/6/2012 | | 2012 | | Floydada | | TX | | — |
| | 36 |
| | 681 |
| | — |
| | 717 |
| | (231 | ) | | 12/30/2011 | | 2010 |
| Family Dollar | | Etoile | | TX | | — |
| | 45 |
| | 850 |
| | — |
| | 895 |
| | (161 | ) | | 8/6/2013 | | 2013 | | Fort Worth | | TX | | — |
| | 276 |
| | 935 |
| | — |
| | 1,211 |
| | (136 | ) | | 8/21/2015 | | 1995 |
| Family Dollar | | Floydada | | TX | | — |
| | 36 |
| | 681 |
| | — |
| | 717 |
| | (192 | ) | | 12/30/2011 | | 2010 | | Fort Worth | | TX | | — |
| | 350 |
| | — |
| | 1,015 |
| | 1,365 |
| | (122 | ) | | 11/3/2014 | | 2015 |
| Family Dollar | | Fort Worth | | TX | | — |
| | 276 |
| | 935 |
| | — |
| | 1,211 |
| | (58 | ) | | 8/21/2015 | | 1995 | | Houston | | TX | | — |
| | 174 |
| | 696 |
| | — |
| | 870 |
| | (209 | ) | | 4/26/2013 | | 1995 |
| Family Dollar | | Fort Worth | | TX | | — |
| | 350 |
| | — |
| | 1,015 |
| | 1,365 |
| | (39 | ) | | 11/3/2014 | | 2015 | | Houston | | TX | | 886 |
| | 297 |
| | 1,081 |
| | — |
| | 1,378 |
| | (284 | ) | | 2/7/2014 | | 2002 |
| Family Dollar | | Houston | | TX | | — |
| | 174 |
| | 696 |
| | — |
| | 870 |
| | (145 | ) | | 4/26/2013 | | 1995 | | Houston | | TX | | — |
| | 565 |
| | 1,223 |
| | — |
| | 1,788 |
| | (327 | ) | | 2/7/2014 | | 2009 |
| Family Dollar | | Houston | | TX | | 886 |
| | 297 |
| | 1,081 |
| | — |
| | 1,378 |
| | (167 | ) | | 2/7/2014 | | 2002 | | Houston | | TX | | — |
| | 138 |
| | 1,052 |
| | — |
| | 1,190 |
| | (274 | ) | | 2/7/2014 | | 2002 |
| Family Dollar | | Houston | | TX | | — |
| | 565 |
| | 1,223 |
| | — |
| | 1,788 |
| | (193 | ) | | 2/7/2014 | | 2009 | | Houston | | TX | | — |
| | 128 |
| | 769 |
| | — |
| | 897 |
| | (187 | ) | | 2/7/2014 | | 2002 |
| Family Dollar | | Houston | | TX | | — |
| | 138 |
| | 1,052 |
| | — |
| | 1,190 |
| | (161 | ) | | 2/7/2014 | | 2002 | | Houston | | TX | | 911 |
| | 277 |
| | 1,144 |
| | — |
| | 1,421 |
| | (299 | ) | | 2/7/2014 | | 2002 |
| Family Dollar | | Houston | | TX | | — |
| | 128 |
| | 769 |
| | — |
| | 897 |
| | (110 | ) | | 2/7/2014 | | 2002 | | Houston | | TX | | 920 |
| | 1,355 |
| | 95 |
| | — |
| | 1,450 |
| | (44 | ) | | 2/7/2014 | | 1981 |
| Family Dollar | | Houston | | TX | | 911 |
| | 277 |
| | 1,144 |
| | — |
| | 1,421 |
| | (176 | ) | | 2/7/2014 | | 2002 | | Industry | | TX | | — |
| | 190 |
| | — |
| | 902 |
| | 1,092 |
| | (155 | ) | | 1/5/2015 | | 2014 |
| Family Dollar | | Houston | | TX | | 920 |
| | 1,355 |
| | 95 |
| | — |
| | 1,450 |
| | (26 | ) | | 2/7/2014 | | 1981 | | Jacksonville | | TX | | — |
| | 195 |
| | 1,003 |
| | — |
| | 1,198 |
| | (279 | ) | | 3/21/2014 | | 2014 |
| Family Dollar | | Industry | | TX | | — |
| | 190 |
| | — |
| | 902 |
| | 1,092 |
| | (65 | ) | | 1/5/2015 | | 2014 | | Kerens | | TX | | — |
| | 73 |
| | 658 |
| | — |
| | 731 |
| | (220 | ) | | 2/29/2012 | | 2011 |
| | | | | | Initial Costs (1) | | Costs Capitalized Subsequent to Acquisition (2) | | Gross Amount
Carried at
December 31, 2016
(3) (4) | | | | | | Initial Costs (1) | | Costs Capitalized Subsequent to Acquisition (2) | | Gross Amount
Carried at
December 31, 2018
(3) (4) | | | |
| Property | | City | | State | | Encumbrances at
December 31, 2016 | | Land | | Buildings, Fixtures and Improvements | | Accumulated Depreciation
(3) (5) | | Date Acquired | | Date of Construction | | City | | State | | Encumbrances at
December 31, 2018 | | Land | | Buildings, Fixtures and Improvements | | Accumulated Depreciation
(3) (5) | | Date Acquired | | Date of Construction |
| Family Dollar | | Jacksonville | | TX | | — |
| | 195 |
| | 1,003 |
| | — |
| | 1,198 |
| | (163 | ) | | 3/21/2014 | | 2014 | | La Pryor | | TX | | — |
| | 74 |
| | 817 |
| | — |
| | 891 |
| | (154 | ) | | 8/28/2014 | | 2013 |
| Family Dollar | | Kerens | | TX | | 365 |
| | 73 |
| | 658 |
| | — |
| | 731 |
| | (180 | ) | | 2/29/2012 | | 2011 | | Leander | | TX | | 557 |
| | 355 |
| | 489 |
| | — |
| | 844 |
| | (136 | ) | | 2/7/2014 | | 2004 |
| Family Dollar | | La Pryor | | TX | | — |
| | 74 |
| | 817 |
| | — |
| | 891 |
| | (84 | ) | | 8/28/2014 | | 2013 | | Lovelady | | TX | | — |
| | 82 |
| | 740 |
| | — |
| | 822 |
| | (224 | ) | | 3/27/2013 | | 1995 |
| Family Dollar | | Leander | | TX | | 557 |
| | 355 |
| | 489 |
| | — |
| | 844 |
| | (80 | ) | | 2/7/2014 | | 2004 | | Lufkin | | TX | | 1,153 |
| | 198 |
| | 1,600 |
| | — |
| | 1,798 |
| | (416 | ) | | 2/7/2014 | | 2004 |
| Family Dollar | | Lovelady | | TX | | — |
| | 82 |
| | 740 |
| | — |
| | 822 |
| | (158 | ) | | 3/27/2013 | | 1995 | | Marshall | | TX | | — |
| | 85 |
| | 662 |
| | — |
| | 747 |
| | (182 | ) | | 2/7/2014 | | 2001 |
| Family Dollar | | Lufkin | | TX | | 1,153 |
| | 198 |
| | 1,600 |
| | — |
| | 1,798 |
| | (246 | ) | | 2/7/2014 | | 2004 | | Mcallen | | TX | | — |
| | 445 |
| | 896 |
| | — |
| | 1,341 |
| | (168 | ) | | 8/28/2014 | | 2013 |
| Family Dollar | | Marshall | | TX | | — |
| | 85 |
| | 662 |
| | — |
| | 747 |
| | (107 | ) | | 2/7/2014 | | 2001 | | Mcallen | | TX | | 857 |
| | 219 |
| | 1,093 |
| | — |
| | 1,312 |
| | (289 | ) | | 2/7/2014 | | 2004 |
| Family Dollar | | Mcallen | | TX | | — |
| | 445 |
| | 896 |
| | — |
| | 1,341 |
| | (92 | ) | | 8/28/2014 | | 2013 | | Mesquite | | TX | | — |
| | 426 |
| | — |
| | 1,146 |
| | 1,572 |
| | (178 | ) | | 5/29/2015 | | 1995 |
| Family Dollar | | Mcallen | | TX | | 857 |
| | 219 |
| | 1,093 |
| | — |
| | 1,312 |
| | (170 | ) | | 2/7/2014 | | 2004 | | Mesquite | | TX | | — |
| | 1,414 |
| | — |
| | (8 | ) | | 1,406 |
| | (165 | ) | | 9/1/2015 | | 2015 |
| Family Dollar | | Mesquite | | TX | | — |
| | 426 |
| | — |
| | 1,146 |
| | 1,572 |
| | (80 | ) | | 5/29/2015 | | 1995 | | Mesquite | | TX | | — |
| | 1,460 |
| | — |
| | (184 | ) | | 1,276 |
| | (167 | ) | | 7/9/2015 | | 2015 |
| Family Dollar | | Mesquite | | TX | | — |
| | 1,414 |
| | — |
| | (8 | ) | | 1,406 |
| | (70 | ) | | 9/1/2015 | | 2015 | | Mexia | | TX | | — |
| | 112 |
| | 495 |
| | — |
| | 607 |
| | (137 | ) | | 2/7/2014 | | 2000 |
| Family Dollar | | Mesquite | | TX | | — |
| | 1,460 |
| | — |
| | (184 | ) | | 1,276 |
| | (75 | ) | | 7/9/2015 | | 2015 | | Noonday | | TX | | 625 |
| | 103 |
| | 895 |
| | — |
| | 998 |
| | (236 | ) | | 2/7/2014 | | 2004 |
| Family Dollar | | Mexia | | TX | | — |
| | 112 |
| | 495 |
| | — |
| | 607 |
| | (81 | ) | | 2/7/2014 | | 2000 | | Oakhurst | | TX | | — |
| | 36 |
| | 683 |
| | — |
| | 719 |
| | (212 | ) | | 12/12/2012 | | 2012 |
| Family Dollar | | Noonday | | TX | | 625 |
| | 103 |
| | 895 |
| | — |
| | 998 |
| | (139 | ) | | 2/7/2014 | | 2004 | | Oakwood | | TX | | — |
| | 133 |
| | 752 |
| | — |
| | 885 |
| | (214 | ) | | 11/20/2013 | | 2013 |
| Family Dollar | | Oakhurst | | TX | | — |
| | 36 |
| | 683 |
| | — |
| | 719 |
| | (155 | ) | | 12/12/2012 | | 2012 | | Ore City | | TX | | — |
| | 27 |
| | 744 |
| | — |
| | 771 |
| | (142 | ) | | 8/28/2014 | | 2013 |
| Family Dollar | | Oakwood | | TX | | — |
| | 133 |
| | 752 |
| | — |
| | 885 |
| | (132 | ) | | 11/20/2013 | | 2013 | | Palestine | | TX | | 671 |
| | 120 |
| | 914 |
| | — |
| | 1,034 |
| | (245 | ) | | 2/7/2014 | | 2000 |
| Family Dollar | | Ore City | | TX | | — |
| | 27 |
| | 744 |
| | — |
| | 771 |
| | (77 | ) | | 8/28/2014 | | 2013 | | Pharr | | TX | | 969 |
| | 219 |
| | 1,253 |
| | — |
| | 1,472 |
| | (332 | ) | | 2/7/2014 | | 2002 |
| Family Dollar | | Palestine | | TX | | 671 |
| | 120 |
| | 914 |
| | — |
| | 1,034 |
| | (145 | ) | | 2/7/2014 | | 2000 | | Plano | | TX | | — |
| | 468 |
| | 869 |
| | — |
| | 1,337 |
| | (253 | ) | | 8/1/2013 | | 2013 |
| Family Dollar | | Pharr | | TX | | 969 |
| | 219 |
| | 1,253 |
| | — |
| | 1,472 |
| | (196 | ) | | 2/7/2014 | | 2002 | | Port Arthur | | TX | | 1,044 |
| | 178 |
| | 1,452 |
| | — |
| | 1,630 |
| | (376 | ) | | 2/7/2014 | | 2005 |
| Family Dollar | | Plano | | TX | | — |
| | 468 |
| | 869 |
| | — |
| | 1,337 |
| | (165 | ) | | 8/1/2013 | | 2013 | | Raymondville | | TX | | 542 |
| | 117 |
| | 707 |
| | — |
| | 824 |
| | (188 | ) | | 2/7/2014 | | 2002 |
| Family Dollar | | Port Arthur | | TX | | 1,044 |
| | 178 |
| | 1,452 |
| | — |
| | 1,630 |
| | (222 | ) | | 2/7/2014 | | 2005 | | Refugio | | TX | | — |
| | 110 |
| | 982 |
| | — |
| | 1,092 |
| | (183 | ) | | 8/28/2014 | | 2013 |
| Family Dollar | | Raymondville | | TX | | 542 |
| | 117 |
| | 707 |
| | — |
| | 824 |
| | (111 | ) | | 2/7/2014 | | 2002 | | Rio Grande | | TX | | — |
| | 133 |
| | 1,284 |
| | — |
| | 1,417 |
| | (338 | ) | | 2/7/2014 | | 2003 |
| Family Dollar | | Refugio | | TX | | — |
| | 110 |
| | 982 |
| | — |
| | 1,092 |
| | (99 | ) | | 8/28/2014 | | 2013 | | Robstown | | TX | | 550 |
| | 44 |
| | 852 |
| | — |
| | 896 |
| | (216 | ) | | 2/7/2014 | | 2003 |
| Family Dollar | | Rio Grande | | TX | | — |
| | 133 |
| | 1,284 |
| | — |
| | 1,417 |
| | (199 | ) | | 2/7/2014 | | 2003 | | Royse City | | TX | | 972 |
| | 411 |
| | 1,078 |
| | — |
| | 1,489 |
| | (288 | ) | | 2/7/2014 | | 2002 |
| Family Dollar | | Robstown | | TX | | 550 |
| | 44 |
| | 852 |
| | — |
| | 896 |
| | (127 | ) | | 2/7/2014 | | 2003 | | Sabinal | | TX | | — |
| | 35 |
| | 952 |
| | — |
| | 987 |
| | (176 | ) | | 8/28/2014 | | 2013 |
| Family Dollar | | Royse City | | TX | | 972 |
| | 411 |
| | 1,078 |
| | — |
| | 1,489 |
| | (170 | ) | | 2/7/2014 | | 2002 | | San Angelo | | TX | | 891 |
| | 232 |
| | 1,118 |
| | — |
| | 1,350 |
| | (300 | ) | | 2/7/2014 | | 2011 |
| Family Dollar | | Sabinal | | TX | | — |
| | 35 |
| | 952 |
| | — |
| | 987 |
| | (96 | ) | | 8/28/2014 | | 2013 | | San Antonio | | TX | | 800 |
| | 198 |
| | 1,018 |
| | — |
| | 1,216 |
| | (270 | ) | | 2/7/2014 | | 2002 |
| Family Dollar | | San Angelo | | TX | | 891 |
| | 232 |
| | 1,118 |
| | — |
| | 1,350 |
| | (177 | ) | | 2/7/2014 | | 2011 | | San Antonio | | TX | | 864 |
| | 299 |
| | 1,039 |
| | — |
| | 1,338 |
| | (274 | ) | | 2/7/2014 | | 2004 |
| Family Dollar | | San Antonio | | TX | | 800 |
| | 198 |
| | 1,018 |
| | — |
| | 1,216 |
| | (159 | ) | | 2/7/2014 | | 2002 | | San Antonio | | TX | | 598 |
| | 260 |
| | 653 |
| | — |
| | 913 |
| | (176 | ) | | 2/7/2014 | | 2004 |
| Family Dollar | | San Antonio | | TX | | 864 |
| | 299 |
| | 1,039 |
| | — |
| | 1,338 |
| | (162 | ) | | 2/7/2014 | | 2004 | | San Antonio | | TX | | 506 |
| | 211 |
| | 567 |
| | — |
| | 778 |
| | (153 | ) | | 2/7/2014 | | 2004 |
| Family Dollar | | San Antonio | | TX | | 598 |
| | 260 |
| | 653 |
| | — |
| | 913 |
| | (104 | ) | | 2/7/2014 | | 2004 | |
| Family Dollar | | San Antonio | | TX | | 506 |
| | 211 |
| | 567 |
| | — |
| | 778 |
| | (90 | ) | | 2/7/2014 | | 2004 | |
| | | | | | Initial Costs (1) | | Costs Capitalized Subsequent to Acquisition (2) | | Gross Amount
Carried at
December 31, 2016
(3) (4) | | | | | | Initial Costs (1) | | Costs Capitalized Subsequent to Acquisition (2) | | Gross Amount
Carried at
December 31, 2018
(3) (4) | | | |
| Property | | City | | State | | Encumbrances at
December 31, 2016 | | Land | | Buildings, Fixtures and Improvements | | Accumulated Depreciation
(3) (5) | | Date Acquired | | Date of Construction | | City | | State | | Encumbrances at
December 31, 2018 | | Land | | Buildings, Fixtures and Improvements | | Accumulated Depreciation
(3) (5) | | Date Acquired | | Date of Construction |
| Family Dollar | | San Antonio | | TX | | 728 |
| | 214 |
| | 911 |
| | — |
| | 1,125 |
| | (142 | ) | | 2/7/2014 | | 2004 | | San Antonio | | TX | | 728 |
| | 214 |
| | 911 |
| | — |
| | 1,125 |
| | (240 | ) | | 2/7/2014 | | 2004 |
| Family Dollar | | San Antonio | | TX | | 1,143 |
| | 117 |
| | 1,619 |
| | — |
| | 1,736 |
| | (251 | ) | | 2/7/2014 | | 2004 | | San Antonio | | TX | | 1,143 |
| | 117 |
| | 1,619 |
| | — |
| | 1,736 |
| | (425 | ) | | 2/7/2014 | | 2004 |
| Family Dollar | | San Benito | | TX | | 598 |
| | 132 |
| | 772 |
| | — |
| | 904 |
| | (121 | ) | | 2/7/2014 | | 2004 | | San Benito | | TX | | 598 |
| | 132 |
| | 772 |
| | — |
| | 904 |
| | (206 | ) | | 2/7/2014 | | 2004 |
| Family Dollar | | San Diego | | TX | | 602 |
| | 55 |
| | 855 |
| | — |
| | 910 |
| | (133 | ) | | 2/7/2014 | | 2004 | | San Diego | | TX | | 602 |
| | 55 |
| | 855 |
| | — |
| | 910 |
| | (226 | ) | | 2/7/2014 | | 2004 |
| Family Dollar | | Seadrift | | TX | | — |
| | 51 |
| | 832 |
| | — |
| | 883 |
| | (85 | ) | | 8/28/2014 | | 2013 | | Seadrift | | TX | | — |
| | 51 |
| | 832 |
| | — |
| | 883 |
| | (156 | ) | | 8/28/2014 | | 2013 |
| Family Dollar | | Somerville | | TX | | — |
| | 131 |
| | 743 |
| | — |
| | 874 |
| | (169 | ) | | 12/31/2012 | | 1995 | | Somerville | | TX | | — |
| | 131 |
| | 743 |
| | — |
| | 874 |
| | (230 | ) | | 12/31/2012 | | 1995 |
| Family Dollar | | Sonora | | TX | | — |
| | 49 |
| | 548 |
| | — |
| | 597 |
| | (68 | ) | | 8/28/2014 | | 2001 | | Sonora | | TX | | — |
| | 49 |
| | 548 |
| | — |
| | 597 |
| | (124 | ) | | 8/28/2014 | | 2001 |
| Family Dollar | | Tyler | | TX | | 416 |
| | 132 |
| | 554 |
| | — |
| | 686 |
| | (86 | ) | | 2/7/2014 | | 2003 | | Tyler | | TX | | 416 |
| | 132 |
| | 554 |
| | — |
| | 686 |
| | (146 | ) | | 2/7/2014 | | 2003 |
| Family Dollar | | Victoria | | TX | | — |
| | 441 |
| | 144 |
| | — |
| | 585 |
| | (28 | ) | | 2/7/2014 | | 2003 | | Victoria | | TX | | — |
| | 441 |
| | 144 |
| | — |
| | 585 |
| | (48 | ) | | 2/7/2014 | | 2003 |
| Family Dollar | | Waco | | TX | | 440 |
| | 125 |
| | 544 |
| | — |
| | 669 |
| | (86 | ) | | 2/7/2014 | | 2001 | | Waco | | TX | | 440 |
| | 125 |
| | 544 |
| | — |
| | 669 |
| | (146 | ) | | 2/7/2014 | | 2001 |
| Family Dollar | | Weatherford | | TX | | — |
| | 218 |
| | 1,057 |
| | (5 | ) | | 1,270 |
| | (127 | ) | | 10/10/2014 | | 2014 | | Weatherford | | TX | | — |
| | 218 |
| | 1,057 |
| | (5 | ) | | 1,270 |
| | (220 | ) | | 10/10/2014 | | 2014 |
| Family Dollar | | Beaver | | UT | | 646 |
| | 107 |
| | 913 |
| | — |
| | 1,020 |
| | (144 | ) | | 2/7/2014 | | 2007 | | Beaver | | UT | | 646 |
| | 107 |
| | 913 |
| | — |
| | 1,020 |
| | (244 | ) | | 2/7/2014 | | 2007 |
| Family Dollar | | Bristol | | VA | | 608 |
| | 104 |
| | 837 |
| | — |
| | 941 |
| | (138 | ) | | 2/7/2014 | | 1978 | | Bristol | | VA | | 608 |
| | 104 |
| | 837 |
| | — |
| | 941 |
| | (234 | ) | | 2/7/2014 | | 1978 |
| Family Dollar | | Gretna | | VA | | — |
| | 131 |
| | 744 |
| | — |
| | 875 |
| | (145 | ) | | 7/2/2013 | | 2012 | | Gretna | | VA | | — |
| | 131 |
| | 744 |
| | — |
| | 875 |
| | (219 | ) | | 7/2/2013 | | 2012 |
| Family Dollar | | Hopewell | | VA | | — |
| | 430 |
| | 987 |
| | — |
| | 1,417 |
| | (165 | ) | | 2/26/2014 | | 2014 | | Hopewell | | VA | | — |
| | 430 |
| | 987 |
| | — |
| | 1,417 |
| | (279 | ) | | 2/26/2014 | | 2014 |
| Family Dollar | | Petersburg | | VA | | 948 |
| | 142 |
| | 1,209 |
| | — |
| | 1,351 |
| | (199 | ) | | 2/7/2014 | | 2003 | | Petersburg | | VA | | 948 |
| | 142 |
| | 1,209 |
| | — |
| | 1,351 |
| | (338 | ) | | 2/7/2014 | | 2003 |
| Family Dollar | | Stuart | | VA | | — |
| | 204 |
| | 750 |
| | — |
| | 954 |
| | (60 | ) | | 4/18/2014 | | 2013 | | Stuart | | VA | | — |
| | 204 |
| | 750 |
| | — |
| | 954 |
| | (104 | ) | | 4/18/2014 | | 2013 |
| Family Dollar | | Wirtz | | VA | | — |
| | 148 |
| | 919 |
| | — |
| | 1,067 |
| | (95 | ) | | 8/28/2014 | | 2013 | | Wirtz | | VA | | — |
| | 148 |
| | 919 |
| | — |
| | 1,067 |
| | (174 | ) | | 8/28/2014 | | 2013 |
| Family Dollar | | Green Bay | | WI | | — |
| | 304 |
| | 1,072 |
| | — |
| | 1,376 |
| | (171 | ) | | 2/7/2014 | | 2011 | | Green Bay | | WI | | — |
| | 304 |
| | 1,072 |
| | — |
| | 1,376 |
| | (290 | ) | | 2/7/2014 | | 2011 |
| Family Dollar | | Markesan | | WI | | — |
| | 92 |
| | 831 |
| | — |
| | 923 |
| | (142 | ) | | 12/12/2013 | | 2013 | | Markesan | | WI | | — |
| | 92 |
| | 831 |
| | — |
| | 923 |
| | (234 | ) | | 12/12/2013 | | 2013 |
| Family Dollar | | Mayville | | WI | | — |
| | 128 |
| | 1,023 |
| | — |
| | 1,151 |
| | (169 | ) | | 2/26/2014 | | 2014 | | Mayville | | WI | | — |
| | 128 |
| | 1,023 |
| | — |
| | 1,151 |
| | (287 | ) | | 2/26/2014 | | 2014 |
| Family Dollar | | Milwaukee | | WI | | 970 |
| | 161 |
| | 1,397 |
| | — |
| | 1,558 |
| | (213 | ) | | 2/7/2014 | | 2003 | | Milwaukee | | WI | | 970 |
| | 161 |
| | 1,397 |
| | — |
| | 1,558 |
| | (362 | ) | | 2/7/2014 | | 2003 |
| Family Dollar | | Thorp | | WI | | — |
| | 90 |
| | 810 |
| | — |
| | 900 |
| | (154 | ) | | 8/30/2013 | | 2013 | | Thorp | | WI | | — |
| | 90 |
| | 810 |
| | — |
| | 900 |
| | (236 | ) | | 8/30/2013 | | 2013 |
| Family Dollar | | Webster | | WI | | — |
| | 43 |
| | 808 |
| | — |
| | 851 |
| | (157 | ) | | 7/11/2013 | | 2013 | | Webster | | WI | | — |
| | 43 |
| | 808 |
| | — |
| | 851 |
| | (237 | ) | | 7/11/2013 | | 2013 |
| Family Dollar | | Alderson | | WV | | — |
| | 166 |
| | 663 |
| | — |
| | 829 |
| | (129 | ) | | 7/11/2013 | | 2012 | | Alderson | | WV | | — |
| | 166 |
| | 663 |
| | — |
| | 829 |
| | (195 | ) | | 7/11/2013 | | 2012 |
| Family Dollar | | Kemmerer | | WY | | — |
| | 45 |
| | 853 |
| | — |
| | 898 |
| | (186 | ) | | 2/22/2013 | | 2013 | | Kemmerer | | WY | | — |
| | 45 |
| | 853 |
| | — |
| | 898 |
| | (261 | ) | | 2/22/2013 | | 2013 |
| Family Dollar | | Mountain View | | WY | | — |
| | 44 |
| | 838 |
| | — |
| | 882 |
| | (155 | ) | | 9/13/2013 | | 2013 | | Mountain View | | WY | | — |
| | 44 |
| | 838 |
| | — |
| | 882 |
| | (242 | ) | | 9/13/2013 | | 2013 |
| Family Dollar | | Torrington | | WY | | — |
| | 72 |
| | 645 |
| | — |
| | 717 |
| | (131 | ) | | 5/9/2013 | | 1995 | | Torrington | | WY | | — |
| | 72 |
| | 645 |
| | — |
| | 717 |
| | (192 | ) | | 5/9/2013 | | 1995 |
| Family Fare Supermarket | | Battle Creek | | MI | | — |
| | 1,393 |
| | 7,950 |
| | — |
| | 9,343 |
| | (1,273 | ) | | 2/7/2014 | | 2010 | | Battle Creek | | MI | | — |
| | 1,393 |
| | 7,950 |
| | — |
| | 9,343 |
| | (2,159 | ) | | 2/7/2014 | | 2010 |
| Famous Dave's | | Independence | | MO | | — |
| | 620 |
| | 422 |
| | — |
| | 1,042 |
| | (84 | ) | | 6/27/2013 | | 1995 | |
| Farmers Insurance | | Simi Valley | | CA | | 25,620 |
| | 5,158 |
| | 12,614 |
| | 15 |
| | 17,787 |
| | (1,316 | ) | | 11/5/2013 | | 1982 | | Mercer Island | | WA | | — |
| | 24,285 |
| | 28,210 |
| | — |
| | 52,495 |
| | (7,038 | ) | | 11/5/2013 | | 1982 |
| Farmers Insurance | | Mercer Island | | WA | | — |
| | 24,285 |
| | 28,210 |
| | — |
| | 52,495 |
| | (4,329 | ) | | 11/5/2013 | | 1982 | |
| Fazoli's | | | Carmel | | IN | | — |
| | 427 |
| | 522 |
| | — |
| | 949 |
| | (146 | ) | | 7/31/2013 | | 1986 |
| FedEx | | | Homewood | | AL | | — |
| | 522 |
| | 779 |
| | — |
| | 1,301 |
| | (231 | ) | | 6/27/2013 | | 2000 |
| | | | | | Initial Costs (1) | | Costs Capitalized Subsequent to Acquisition (2) | | Gross Amount
Carried at
December 31, 2016
(3) (4) | | | | | | Initial Costs (1) | | Costs Capitalized Subsequent to Acquisition (2) | | Gross Amount
Carried at
December 31, 2018
(3) (4) | | | |
| Property | | City | | State | | Encumbrances at
December 31, 2016 | | Land | | Buildings, Fixtures and Improvements | | Accumulated Depreciation
(3) (5) | | Date Acquired | | Date of Construction | | City | | State | | Encumbrances at
December 31, 2018 | | Land | | Buildings, Fixtures and Improvements | | Accumulated Depreciation
(3) (5) | | Date Acquired | | Date of Construction |
| Fazoli's | | Carmel | | IN | | — |
| | 427 |
| | 522 |
| | — |
| | 949 |
| | (95 | ) | | 7/31/2013 | | 1986 | |
| FedEx | | Homewood | | AL | | — |
| | 522 |
| | 779 |
| | — |
| | 1,301 |
| | (155 | ) | | 6/27/2013 | | 2000 | | Tempe | | AZ | | — |
| | 2,914 |
| | 12,300 |
| | 159 |
| | 15,373 |
| | (2,826 | ) | | 6/25/2014 | | 2004 |
| FedEx | | Lowell | | AR | | — |
| | 396 |
| | 7,521 |
| | — |
| | 7,917 |
| | (1,740 | ) | | 3/15/2013 | | 2007 | | Yuma | | AZ | | — |
| | — |
| | 2,076 |
| | — |
| | 2,076 |
| | (736 | ) | | 10/17/2012 | | 2011 |
| FedEx | | Tempe | | AZ | | — |
| | 2,914 |
| | 12,300 |
| | 133 |
| | 15,347 |
| | (1,579 | ) | | 6/25/2014 | | 2004 | | Chico | | CA | | — |
| | 308 |
| | 2,776 |
| | 130 |
| | 3,214 |
| | (967 | ) | | 11/9/2012 | | 2006 |
| FedEx | | Yuma | | AZ | | 1,296 |
| | — |
| | 2,076 |
| | — |
| | 2,076 |
| | (540 | ) | | 10/17/2012 | | 2011 | | Commerce City | | CO | | — |
| | 6,556 |
| | 26,224 |
| | 393 |
| | 33,173 |
| | (9,770 | ) | | 3/20/2012 | | 2007 |
| FedEx | | Chico | | CA | | — |
| | 308 |
| | 2,776 |
| | — |
| | 3,084 |
| | (699 | ) | | 11/9/2012 | | 2006 | | Melbourne | | FL | | — |
| | 159 |
| | 1,433 |
| | — |
| | 1,592 |
| | (461 | ) | | 7/26/2013 | | 2001 |
| FedEx | | Commerce City | | CO | | 20,394 |
| | 6,556 |
| | 26,224 |
| | 206 |
| | 32,986 |
| | (7,666 | ) | | 3/20/2012 | | 2007 | | Des Moines | | IA | | — |
| | 733 |
| | 1,361 |
| | 183 |
| | 2,277 |
| | (468 | ) | | 4/18/2013 | | 1986 |
| FedEx | | Melbourne | | FL | | — |
| | 159 |
| | 1,433 |
| | — |
| | 1,592 |
| | (302 | ) | | 7/26/2013 | | 2001 | | Ottumwa | | IA | | — |
| | 205 |
| | 2,552 |
| | 2,749 |
| | 5,506 |
| | (1,182 | ) | | 10/30/2012 | | 2012 |
| FedEx | | Des Moines | | IA | | 1,318 |
| | 733 |
| | 1,361 |
| | 183 |
| | 2,277 |
| | (316 | ) | | 4/18/2013 | | 1986 | | Waterloo | | IA | | — |
| | 152 |
| | 2,882 |
| | — |
| | 3,034 |
| | (963 | ) | | 3/22/2013 | | 2006 |
| FedEx | | Ottumwa | | IA | | 1,658 |
| | 205 |
| | 2,552 |
| | 2,749 |
| | 5,506 |
| | (807 | ) | | 10/30/2012 | | 2012 | | Effingham | | IL | | 6,712 |
| | 1,875 |
| | 14,827 |
| | 34 |
| | 16,736 |
| | (3,449 | ) | | 2/7/2014 | | 2008 |
| FedEx | | Waterloo | | IA | | 1,867 |
| | 152 |
| | 2,882 |
| | — |
| | 3,034 |
| | (667 | ) | | 3/22/2013 | | 2006 | | Kankakee | | IL | | — |
| | 195 |
| | 1,103 |
| | 176 |
| | 1,474 |
| | (430 | ) | | 5/31/2012 | | 2003 |
| FedEx | | Effingham | | IL | | 6,905 |
| | 1,875 |
| | 14,827 |
| | — |
| | 16,702 |
| | (2,014 | ) | | 2/7/2014 | | 2008 | | Quincy | | IL | | — |
| | 371 |
| | 2,101 |
| | 3,011 |
| | 5,483 |
| | (1,150 | ) | | 9/28/2012 | | 2012 |
| FedEx | | Kankakee | | IL | | — |
| | 195 |
| | 1,103 |
| | 176 |
| | 1,474 |
| | (313 | ) | | 5/31/2012 | | 2003 | | Evansville | | IN | | — |
| | 665 |
| | 2,661 |
| | — |
| | 3,326 |
| | (972 | ) | | 5/31/2012 | | 1998 |
| FedEx | | Quincy | | IL | | 1,514 |
| | 371 |
| | 2,101 |
| | 3,011 |
| | 5,483 |
| | (683 | ) | | 9/28/2012 | | 2012 | | Kokomo | | IN | | — |
| | 186 |
| | 3,541 |
| | 3,442 |
| | 7,169 |
| | (1,631 | ) | | 3/16/2012 | | 2012 |
| FedEx | | Evansville | | IN | | — |
| | 665 |
| | 2,661 |
| | — |
| | 3,326 |
| | (751 | ) | | 5/31/2012 | | 1998 | | Lafayette | | IN | | 2,126 |
| | 768 |
| | 4,128 |
| | — |
| | 4,896 |
| | (923 | ) | | 2/7/2014 | | 2008 |
| FedEx | | Kokomo | | IN | | 2,296 |
| | 186 |
| | 3,541 |
| | 3,422 |
| | 7,149 |
| | (1,085 | ) | | 3/16/2012 | | 2012 | | Independence | | KS | | — |
| | 114 |
| | 2,166 |
| | — |
| | 2,280 |
| | (757 | ) | | 10/30/2012 | | 2012 |
| FedEx | | Lafayette | | IN | | 2,187 |
| | 768 |
| | 4,128 |
| | — |
| | 4,896 |
| | (545 | ) | | 2/7/2014 | | 2008 | | Hazard | | KY | | — |
| | 215 |
| | 4,085 |
| | — |
| | 4,300 |
| | (1,441 | ) | | 9/28/2012 | | 2012 |
| FedEx | | Independence | | KS | | 1,406 |
| | 114 |
| | 2,166 |
| | — |
| | 2,280 |
| | (556 | ) | | 10/30/2012 | | 2012 | | London | | KY | | — |
| | 350 |
| | 3,151 |
| | — |
| | 3,501 |
| | (985 | ) | | 10/11/2013 | | 2013 |
| FedEx | | Hazard | | KY | | 2,625 |
| | 215 |
| | 4,085 |
| | — |
| | 4,300 |
| | (1,069 | ) | | 9/28/2012 | | 2012 | | Bossier City | | LA | | — |
| | 295 |
| | 6,223 |
| | — |
| | 6,518 |
| | (1,507 | ) | | 2/7/2014 | | 2009 |
| FedEx | | London | | KY | | — |
| | 350 |
| | 3,151 |
| | — |
| | 3,501 |
| | (617 | ) | | 10/11/2013 | | 2013 | | Grand Rapids | | MI | | — |
| | 1,797 |
| | 7,189 |
| | — |
| | 8,986 |
| | (2,603 | ) | | 6/14/2012 | | 2012 |
| FedEx | | Bossier City | | LA | | — |
| | 295 |
| | 6,223 |
| | — |
| | 6,518 |
| | (889 | ) | | 2/7/2014 | | 2009 | | Port Huron | | MI | | — |
| | 125 |
| | 1,121 |
| | — |
| | 1,246 |
| | (368 | ) | | 5/31/2013 | | 2003 |
| FedEx | | Grand Rapids | | MI | | 4,800 |
| | 1,797 |
| | 7,189 |
| | — |
| | 8,986 |
| | (1,992 | ) | | 6/14/2012 | | 2012 | | Roseville | | MN | | — |
| | 1,462 |
| | 8,282 |
| | — |
| | 9,744 |
| | (2,871 | ) | | 11/30/2012 | | 2012 |
| FedEx | | Port Huron | | MI | | — |
| | 125 |
| | 1,121 |
| | — |
| | 1,246 |
| | (248 | ) | | 5/31/2013 | | 2003 | | Mccomb | | MS | | — |
| | 548 |
| | 3,268 |
| | 2,212 |
| | 6,028 |
| | (966 | ) | | 2/7/2014 | | 2008 |
| FedEx | | Roseville | | MN | | 6,073 |
| | 1,462 |
| | 8,282 |
| | — |
| | 9,744 |
| | (2,084 | ) | | 11/30/2012 | | 2012 | | Butte | | MT | | — |
| | 403 |
| | 7,653 |
| | 4,049 |
| | 12,105 |
| | (3,251 | ) | | 9/27/2011 | | 2001 |
| FedEx | | Columbia | | MO | | — |
| | 1,402 |
| | 7,794 |
| | — |
| | 9,196 |
| | (845 | ) | | 9/30/2014 | | 2007 | | Greenville | | NC | | — |
| | 363 |
| | 6,903 |
| | — |
| | 7,266 |
| | (2,584 | ) | | 2/22/2012 | | 2006 |
| FedEx | | Mccomb | | MS | | — |
| | 548 |
| | 3,268 |
| | 2,212 |
| | 6,028 |
| | (505 | ) | | 2/7/2014 | | 2008 | | Belmont | | NH | | — |
| | 265 |
| | 2,386 |
| | — |
| | 2,651 |
| | (908 | ) | | 12/29/2011 | | 1991 |
| FedEx | | Butte | | MT | | — |
| | 403 |
| | 7,653 |
| | 2,763 |
| | 10,819 |
| | (2,546 | ) | | 9/27/2011 | | 2001 | | Wendover | | NV | | — |
| | 262 |
| | 1,483 |
| | — |
| | 1,745 |
| | (500 | ) | | 2/25/2013 | | 2012 |
| FedEx | | Greenville | | NC | | — |
| | 363 |
| | 6,903 |
| | — |
| | 7,266 |
| | (2,053 | ) | | 2/22/2012 | | 2006 | | Blauvelt | | NY | | 26,100 |
| | 14,420 |
| | 26,779 |
| | — |
| | 41,199 |
| | (9,861 | ) | | 4/5/2012 | | 2012 |
| FedEx | | Belmont | | NH | | 1,786 |
| | 265 |
| | 2,386 |
| | — |
| | 2,651 |
| | (731 | ) | | 12/29/2011 | | 1991 | | Marcy | | NY | | — |
| | 339 |
| | 5,795 |
| | — |
| | 6,134 |
| | (1,946 | ) | | 9/5/2014 | | 2006 |
| FedEx | | Wendover | | NV | | — |
| | 262 |
| | 1,483 |
| | — |
| | 1,745 |
| | (351 | ) | | 2/25/2013 | | 2012 | | Plattsburg | | NY | | 2,614 |
| | 801 |
| | 3,982 |
| | — |
| | 4,783 |
| | (1,044 | ) | | 2/7/2014 | | 2008 |
| FedEx | | Blauvelt | | NY | | 26,100 |
| | 14,420 |
| | 26,779 |
| | — |
| | 41,199 |
| | (7,691 | ) | | 4/5/2012 | | 2012 | | Lebanon | | OH | | — |
| | 1,492 |
| | 8,452 |
| | — |
| | 9,944 |
| | (2,849 | ) | | 8/26/2013 | | 2013 |
| FedEx | | Marcy | | NY | | — |
| | 339 |
| | 5,795 |
| | — |
| | 6,134 |
| | (1,046 | ) | | 9/5/2014 | | 2006 | | Northwood | | OH | | 2,410 |
| | 674 |
| | 5,497 |
| | 486 |
| | 6,657 |
| | (1,282 | ) | | 2/7/2014 | | 1998 |
| FedEx | | | Tulsa | | OK | | — |
| | 458 |
| | 8,695 |
| | — |
| | 9,153 |
| | (3,255 | ) | | 2/22/2012 | | 2008 |
| | | | | | Initial Costs (1) | | Costs Capitalized Subsequent to Acquisition (2) | | Gross Amount
Carried at
December 31, 2016
(3) (4) | | | | | | Initial Costs (1) | | Costs Capitalized Subsequent to Acquisition (2) | | Gross Amount
Carried at
December 31, 2018
(3) (4) | | | |
| Property | | City | | State | | Encumbrances at
December 31, 2016 | | Land | | Buildings, Fixtures and Improvements | | Accumulated Depreciation
(3) (5) | | Date Acquired | | Date of Construction | | City | | State | | Encumbrances at
December 31, 2018 | | Land | | Buildings, Fixtures and Improvements | | Accumulated Depreciation
(3) (5) | | Date Acquired | | Date of Construction |
| FedEx | | Plattsburg | | NY | | 2,614 |
| | 801 |
| | 3,982 |
| | — |
| | 4,783 |
| | (616 | ) | | 2/7/2014 | | 2008 | | Tulsa | | OK | | — |
| | 1,476 |
| | 18,054 |
| | 555 |
| | 20,085 |
| | (5,684 | ) | | 3/31/2014 | | 1999 |
| FedEx | | Lebanon | | OH | | 6,034 |
| | 1,492 |
| | 8,452 |
| | — |
| | 9,944 |
| | (1,836 | ) | | 8/26/2013 | | 2013 | | Tinicum | | PA | | — |
| | — |
| | 32,180 |
| | 549 |
| | 32,729 |
| | (10,380 | ) | | 8/15/2013 | | 2013 |
| FedEx | | Northwood | | OH | | 2,410 |
| | 674 |
| | 5,497 |
| | 15 |
| | 6,186 |
| | (733 | ) | | 2/7/2014 | | 1998 | | Rapid City | | SD | | — |
| | 305 |
| | 2,741 |
| | 4,584 |
| | 7,630 |
| | (1,428 | ) | | 5/8/2015 | | 2007 |
| FedEx | | Tulsa | | OK | | — |
| | 458 |
| | 8,695 |
| | — |
| | 9,153 |
| | (2,586 | ) | | 2/22/2012 | | 2008 | | Blountville | | TN | | — |
| | 562 |
| | 5,056 |
| | — |
| | 5,618 |
| | (1,893 | ) | | 2/3/2012 | | 2009 |
| FedEx | | Tulsa | | OK | | — |
| | 1,476 |
| | 18,054 |
| | 234 |
| | 19,764 |
| | (3,286 | ) | | 3/31/2014 | | 1999 | | Humboldt | | TN | | — |
| | 239 |
| | 4,543 |
| | — |
| | 4,782 |
| | (1,631 | ) | | 7/11/2012 | | 2008 |
| FedEx | | Tinicum | | PA | | — |
| | — |
| | 32,180 |
| | 549 |
| | 32,729 |
| | (6,669 | ) | | 8/15/2013 | | 2013 | | Bryan | | TX | | — |
| | 1,422 |
| | 4,763 |
| | 34 |
| | 6,219 |
| | (1,363 | ) | | 6/15/2012 | | 1995 |
| FedEx | | Rapid City | | SD | | 1,868 |
| | 305 |
| | 2,741 |
| | 4,584 |
| | 7,630 |
| | (833 | ) | | 5/8/2015 | | 2007 | | Omak | | WA | | — |
| | 252 |
| | 1,425 |
| | — |
| | 1,677 |
| | (503 | ) | | 9/27/2012 | | 2012 |
| FedEx | | Blountville | | TN | | 3,700 |
| | 562 |
| | 5,056 |
| | — |
| | 5,618 |
| | (1,504 | ) | | 2/3/2012 | | 2009 | | Wenatchee | | WA | | — |
| | 266 |
| | 2,393 |
| | — |
| | 2,659 |
| | (844 | ) | | 9/27/2012 | | 1995 |
| FedEx | | Humboldt | | TN | | 2,930 |
| | 239 |
| | 4,543 |
| | — |
| | 4,782 |
| | (1,236 | ) | | 7/11/2012 | | 2008 | | Menomonee Falls | | WI | | — |
| | 4,215 |
| | 14,555 |
| | — |
| | 18,770 |
| | (2,016 | ) | | 2/18/2016 | | 2015 |
| FedEx | | Bryan | | TX | | — |
| | 1,422 |
| | 4,763 |
| | 41 |
| | 6,226 |
| | (1,007 | ) | | 6/15/2012 | | 1995 | | Parkersburg | | WV | | — |
| | 193 |
| | 3,671 |
| | — |
| | 3,864 |
| | (1,295 | ) | | 9/20/2012 | | 2012 |
| FedEx | | Omak | | WA | | 1,023 |
| | 252 |
| | 1,425 |
| | — |
| | 1,677 |
| | (373 | ) | | 9/27/2012 | | 2012 | |
| FedEx | | Wenatchee | | WA | | 1,630 |
| | 266 |
| | 2,393 |
| | — |
| | 2,659 |
| | (627 | ) | | 9/27/2012 | | 1995 | |
| FedEx | | Menomonee Falls | | WI | | — |
| | 4,215 |
| | 14,555 |
| | — |
| | 18,770 |
| | (613 | ) | | 2/18/2016 | | 2015 | |
| FedEx | | Parkersburg | | WV | | 2,379 |
| | 193 |
| | 3,671 |
| | — |
| | 3,864 |
| | (961 | ) | | 9/20/2012 | | 2012 | |
| Filibertos | | | Payson | | AZ | | — |
| | 679 |
| | 829 |
| | (719 | ) | | 789 |
| | (26 | ) | | 7/31/2013 | | 1986 |
| Fire Mountain Buffet | | Summerville | | SC | | — |
| | 245 |
| | 1,308 |
| | (1,241 | ) | | 312 |
| | (20 | ) | | 1/8/2014 | | 1997 | | Summerville | | SC | | — |
| | 245 |
| | 1,308 |
| | (1,241 | ) | | 312 |
| | (73 | ) | | 1/8/2014 | | 1997 |
| Fire Mountain Buffet | | Charleston | | WV | | — |
| | 243 |
| | 1,305 |
| | (1,228 | ) | | 320 |
| | (25 | ) | | 1/8/2014 | | 2000 | | Charleston | | WV | | — |
| | 243 |
| | 1,305 |
| | (1,228 | ) | | 320 |
| | (90 | ) | | 1/8/2014 | | 2000 |
| First Bank | | Pinellas Park | | FL | | — |
| | 630 |
| | 1,470 |
| | 4 |
| | 2,104 |
| | (253 | ) | | 10/1/2013 | | 1980 | | Lake Mary | | FL | | — |
| | 1,230 |
| | 1,504 |
| | 4 |
| | 2,738 |
| | (412 | ) | | 10/1/2013 | | 1990 |
| First Bank | | | Pinellas Park | | FL | | — |
| | 630 |
| | 1,470 |
| | 4 |
| | 2,104 |
| | (403 | ) | | 10/1/2013 | | 1980 |
| Fleming's Steakhouse | | Englewood | | CO | | — |
| | 1,152 |
| | 3,055 |
| | — |
| | 4,207 |
| | (533 | ) | | 2/7/2014 | | 2004 | | Englewood | | CO | | — |
| | 1,152 |
| | 3,055 |
| | — |
| | 4,207 |
| | (904 | ) | | 2/7/2014 | | 2004 |
| Flint Energy Technologies | | Rhome | | TX | | — |
| | 284 |
| | 1,752 |
| | — |
| | 2,036 |
| | (198 | ) | | 9/19/2014 | | 2014 | |
| Floor & Decor | | | Overland Park | | KS | | — |
| | 2,943 |
| | 5,832 |
| | — |
| | 8,775 |
| | (22 | ) | | 11/26/2018 | | 1963 |
| Floor & Decor | | | Mcdonough | | GA | | — |
| | 1,859 |
| | 7,711 |
| | — |
| | 9,570 |
| | (487 | ) | | 12/13/2016 | | 2015 |
| Floor & Decor | | | Oklahoma City | | OK | | — |
| | 3,069 |
| | 6,666 |
| | — |
| | 9,735 |
| | (39 | ) | | 10/25/2018 | | 2018 |
| Floor & Decor | | McDonough | | GA | | — |
| | 1,859 |
| | 7,711 |
| | — |
| | 9,570 |
| | (10 | ) | | 12/13/2016 | | 2015 | | Riverdale | | UT | | — |
| | 2,920 |
| | 5,734 |
| | — |
| | 8,654 |
| | (160 | ) | | 6/28/2018 | | 1992 |
| Folsom Gateway II | | Folsom | | CA | | 21,600 |
| | 10,314 |
| | 27,983 |
| | 141 |
| | 38,438 |
| | (4,063 | ) | | 2/7/2014 | | 2006 | | Folsom | | CA | | 21,600 |
| | 10,314 |
| | 27,983 |
| | 372 |
| | 38,669 |
| | (6,857 | ) | | 2/7/2014 | | 2006 |
| Food Lion | | Moyock | | NC | | — |
| | 1,269 |
| | 2,950 |
| | — |
| | 4,219 |
| | (512 | ) | | 2/7/2014 | | 1999 | | Moyock | | NC | | — |
| | 1,269 |
| | 2,950 |
| | 265 |
| | 4,484 |
| | (871 | ) | | 2/7/2014 | | 1999 |
| Forum Energy Technology | | Guthrie | | OK | | — |
| | 393 |
| | 1,305 |
| | — |
| | 1,698 |
| | (159 | ) | | 6/25/2014 | | 1979 | |
| Forum Energy Technology | | Gainesville | | TX | | — |
| | 123 |
| | 6,019 |
| | — |
| | 6,142 |
| | (698 | ) | | 6/25/2014 | | 2008 | | Guthrie | | OK | | — |
| | 393 |
| | 1,305 |
| | — |
| | 1,698 |
| | (278 | ) | | 6/25/2014 | | 1979 |
| Forum Energy Technology | | Gainesville | | TX | | — |
| | 158 |
| | — |
| | — |
| | 158 |
| | — |
| | 6/25/2014 | | 1995 | | Gainesville | | TX | | — |
| | 123 |
| | 6,019 |
| | — |
| | 6,142 |
| | (1,248 | ) | | 6/25/2014 | | 2008 |
| Fresenius Medical Care | | Fairhope | | AL | | — |
| | — |
| | 2,035 |
| | — |
| | 2,035 |
| | (331 | ) | | 7/8/2013 | | 2006 | | Fairhope | | AL | | — |
| | — |
| | 2,035 |
| | — |
| | 2,035 |
| | (505 | ) | | 7/8/2013 | | 2006 |
| Fresenius Medical Care | | Foley | | AL | | — |
| | 287 |
| | 2,580 |
| | — |
| | 2,867 |
| | (419 | ) | | 7/8/2013 | | 2009 | | Foley | | AL | | — |
| | 287 |
| | 2,580 |
| | (9 | ) | | 2,858 |
| | (641 | ) | | 7/8/2013 | | 2009 |
| Fresenius Medical Care | | Mobile | | AL | | — |
| | 278 |
| | 2,505 |
| | — |
| | 2,783 |
| | (407 | ) | | 7/8/2013 | | 2009 | | Mobile | | AL | | — |
| | 278 |
| | 2,505 |
| | — |
| | 2,783 |
| | (622 | ) | | 7/8/2013 | | 2009 |
| Fresenius Medical Care | | Defuniak Springs | | FL | | — |
| | 115 |
| | 2,180 |
| | — |
| | 2,295 |
| | (354 | ) | | 7/8/2013 | | 2008 | | Defuniak Springs | | FL | | — |
| | 115 |
| | 2,180 |
| | 10 |
| | 2,305 |
| | (541 | ) | | 7/8/2013 | | 2008 |
| Fresenius Medical Care | | Aurora | | IL | | 2,294 |
| | 287 |
| | 2,584 |
| | 15 |
| | 2,886 |
| | (540 | ) | | 7/13/2012 | | 1996 | | Aurora | | IL | | 2,294 |
| | 287 |
| | 2,584 |
| | 15 |
| | 2,886 |
| | (719 | ) | | 7/13/2012 | | 1996 |
| Fresenius Medical Care | | Chicago | | IL | | — |
| | 588 |
| | 1,764 |
| | — |
| | 2,352 |
| | (370 | ) | | 7/31/2012 | | 1960 | | Chicago | | IL | | — |
| | 588 |
| | 1,764 |
| | — |
| | 2,352 |
| | (489 | ) | | 7/31/2012 | | 1960 |
| Fresenius Medical Care | | Waukegan | | IL | | — |
| | 94 |
| | 1,792 |
| | 61 |
| | 1,947 |
| | (380 | ) | | 7/31/2012 | | 1980 | | Waukegan | | IL | | — |
| | 94 |
| | 1,792 |
| | 61 |
| | 1,947 |
| | (509 | ) | | 7/31/2012 | | 1980 |
| Fresenius Medical Care | | | Peru | | IN | | — |
| | 69 |
| | 1,305 |
| | — |
| | 1,374 |
| | (365 | ) | | 6/27/2012 | | 1982 |
| | | | | | Initial Costs (1) | | Costs Capitalized Subsequent to Acquisition (2) | | Gross Amount
Carried at
December 31, 2016
(3) (4) | | | | | | Initial Costs (1) | | Costs Capitalized Subsequent to Acquisition (2) | | Gross Amount
Carried at
December 31, 2018
(3) (4) | | | |
| Property | | City | | State | | Encumbrances at
December 31, 2016 | | Land | | Buildings, Fixtures and Improvements | | Accumulated Depreciation
(3) (5) | | Date Acquired | | Date of Construction | | City | | State | | Encumbrances at
December 31, 2018 | | Land | | Buildings, Fixtures and Improvements | | Accumulated Depreciation
(3) (5) | | Date Acquired | | Date of Construction |
| Fresenius Medical Care | | Peru | | IN | | — |
| | 69 |
| | 1,305 |
| | — |
| | 1,374 |
| | (279 | ) | | 6/27/2012 | | 1982 | | Bossier City | | LA | | — |
| | 120 |
| | 682 |
| | — |
| | 802 |
| | (179 | ) | | 1/30/2013 | | 2008 |
| Fresenius Medical Care | | Bossier City | | LA | | — |
| | 120 |
| | 682 |
| | — |
| | 802 |
| | (127 | ) | | 1/30/2013 | | 2008 | | Caro | | MI | | — |
| | 92 |
| | 1,744 |
| | — |
| | 1,836 |
| | (488 | ) | | 6/5/2012 | | 1995 |
| Fresenius Medical Care | | Caro | | MI | | — |
| | 92 |
| | 1,744 |
| | — |
| | 1,836 |
| | (372 | ) | | 6/5/2012 | | 1995 | | Jackson | | MI | | 1,948 |
| | 137 |
| | 2,603 |
| | — |
| | 2,740 |
| | (728 | ) | | 6/5/2012 | | 1995 |
| Fresenius Medical Care | | Jackson | | MI | | 1,948 |
| | 137 |
| | 2,603 |
| | — |
| | 2,740 |
| | (556 | ) | | 6/5/2012 | | 1995 | | Albemarle | | NC | | — |
| | 139 |
| | 1,253 |
| | — |
| | 1,392 |
| | (320 | ) | | 4/30/2013 | | 2008 |
| Fresenius Medical Care | | Albemarle | | NC | | — |
| | 139 |
| | 1,253 |
| | — |
| | 1,392 |
| | (218 | ) | | 4/30/2013 | | 2008 | | Angiers | | NC | | — |
| | 203 |
| | 1,152 |
| | — |
| | 1,355 |
| | (294 | ) | | 4/30/2013 | | 2012 |
| Fresenius Medical Care | | Angiers | | NC | | — |
| | 203 |
| | 1,152 |
| | — |
| | 1,355 |
| | (201 | ) | | 4/30/2013 | | 2012 | | Asheboro | | NC | | 2,373 |
| | 323 |
| | 2,903 |
| | — |
| | 3,226 |
| | (742 | ) | | 4/30/2013 | | 2012 |
| Fresenius Medical Care | | Asheboro | | NC | | 2,373 |
| | 323 |
| | 2,903 |
| | — |
| | 3,226 |
| | (506 | ) | | 4/30/2013 | | 2012 | | Clinton | | NC | | — |
| | 139 |
| | 2,655 |
| | — |
| | 2,794 |
| | (664 | ) | | 6/28/2013 | | 1995 |
| Fresenius Medical Care | | Clinton | | NC | | — |
| | 139 |
| | 2,655 |
| | — |
| | 2,794 |
| | (441 | ) | | 6/28/2013 | | 1995 | | Fairmont | | NC | | — |
| | 201 |
| | 1,819 |
| | 6 |
| | 2,026 |
| | (455 | ) | | 6/28/2013 | | 2002 |
| Fresenius Medical Care | | Fairmont | | NC | | — |
| | 201 |
| | 1,819 |
| | — |
| | 2,020 |
| | (302 | ) | | 6/28/2013 | | 2002 | | Fayetteville | | NC | | — |
| | 420 |
| | 2,379 |
| | — |
| | 2,799 |
| | (596 | ) | | 6/28/2013 | | 1995 |
| Fresenius Medical Care | | Fayetteville | | NC | | — |
| | 420 |
| | 2,379 |
| | — |
| | 2,799 |
| | (396 | ) | | 6/28/2013 | | 1995 | | Fayetteville | | NC | | — |
| | 134 |
| | 2,551 |
| | — |
| | 2,685 |
| | (640 | ) | | 6/28/2013 | | 2004 |
| Fresenius Medical Care | | Fayetteville | | NC | | — |
| | 134 |
| | 2,551 |
| | — |
| | 2,685 |
| | (425 | ) | | 6/28/2013 | | 2004 | | Fayetteville | | NC | | — |
| | 178 |
| | 3,379 |
| | — |
| | 3,557 |
| | (847 | ) | | 6/28/2013 | | 1999 |
| Fresenius Medical Care | | Fayetteville | | NC | | — |
| | 178 |
| | 3,379 |
| | — |
| | 3,557 |
| | (562 | ) | | 6/28/2013 | | 1999 | | Lumberton | | NC | | — |
| | 117 |
| | 2,216 |
| | — |
| | 2,333 |
| | (556 | ) | | 6/28/2013 | | 1986 |
| Fresenius Medical Care | | Lumberton | | NC | | — |
| | 117 |
| | 2,216 |
| | — |
| | 2,333 |
| | (369 | ) | | 6/28/2013 | | 1986 | | Pembroke | | NC | | — |
| | 81 |
| | 1,547 |
| | — |
| | 1,628 |
| | (388 | ) | | 6/28/2013 | | 2009 |
| Fresenius Medical Care | | Pembroke | | NC | | — |
| | 81 |
| | 1,547 |
| | — |
| | 1,628 |
| | (257 | ) | | 6/28/2013 | | 2009 | | Red Springs | | NC | | — |
| | 101 |
| | 1,913 |
| | — |
| | 2,014 |
| | (480 | ) | | 6/28/2013 | | 2000 |
| Fresenius Medical Care | | Red Springs | | NC | | — |
| | 101 |
| | 1,913 |
| | — |
| | 2,014 |
| | (318 | ) | | 6/28/2013 | | 2000 | | Roseboro | | NC | | — |
| | 74 |
| | 1,404 |
| | — |
| | 1,478 |
| | (352 | ) | | 6/28/2013 | | 2010 |
| Fresenius Medical Care | | Roseboro | | NC | | — |
| | 74 |
| | 1,404 |
| | — |
| | 1,478 |
| | (234 | ) | | 6/28/2013 | | 2010 | | St. Pauls | | NC | | — |
| | 73 |
| | 1,389 |
| | — |
| | 1,462 |
| | (348 | ) | | 6/28/2013 | | 2008 |
| Fresenius Medical Care | | St. Pauls | | NC | | — |
| | 73 |
| | 1,389 |
| | — |
| | 1,462 |
| | (231 | ) | | 6/28/2013 | | 2008 | | Taylorsville | | NC | | — |
| | 275 |
| | 1,099 |
| | — |
| | 1,374 |
| | (281 | ) | | 4/30/2013 | | 2011 |
| Fresenius Medical Care | | Taylorsville | | NC | | — |
| | 275 |
| | 1,099 |
| | — |
| | 1,374 |
| | (191 | ) | | 4/30/2013 | | 2011 | | Kings Mills | | OH | | ��� |
| | 399 |
| | 598 |
| | 6 |
| | 1,003 |
| | (171 | ) | | 6/5/2012 | | 1995 |
| Fresenius Medical Care | | Warsaw | | NC | | — |
| | 75 |
| | 1,428 |
| | — |
| | 1,503 |
| | (277 | ) | | 11/13/2012 | | 2003 | | Dallas | | TX | | — |
| | 377 |
| | 1,132 |
| | 81 |
| | 1,590 |
| | (282 | ) | | 2/28/2013 | | 1958 |
| Fresenius Medical Care | | Kings Mills | | OH | | — |
| | 399 |
| | 598 |
| | 6 |
| | 1,003 |
| | (127 | ) | | 6/5/2012 | | 1995 | |
| Fresenius Medical Care | | Dallas | | TX | | — |
| | 377 |
| | 1,132 |
| | (42 | ) | | 1,467 |
| | (195 | ) | | 2/28/2013 | | 1958 | |
| Front Range Community College | | Longmont | | CO | | — |
| | 407 |
| | 2,428 |
| | 13 |
| | 2,848 |
| | (449 | ) | | 1/8/2014 | | 1987 | |
| Front Range Community College | | Longmont | | CO | | — |
| | 1,150 |
| | 9,067 |
| | 531 |
| | 10,748 |
| | (1,686 | ) | | 1/8/2014 | | 1988 | |
| The Fresh Market | | | Winston-Salem | | NC | | — |
| | 196 |
| | 4,562 |
| | — |
| | 4,758 |
| | (1,061 | ) | | 2/7/2014 | | 2007 |
| Fresh Thyme Farmers Market | | | Canton | | MI | | — |
| | 1,361 |
| | 6,976 |
| | — |
| | 8,337 |
| | (350 | ) | | 5/18/2017 | | 2017 |
| Fun Town RV | | | Cleburne | | TX | | — |
| | 262 |
| | 369 |
| | — |
| | 631 |
| | (85 | ) | | 6/25/2014 | | 2008 |
| Fun Town RV | | | Cleburne | | TX | | — |
| | 70 |
| | — |
| | — |
| | 70 |
| | — |
| | 6/25/2014 | | 2009 |
| Furr's | | Garland | | TX | | — |
| | 1,529 |
| | 3,715 |
| | — |
| | 5,244 |
| | (754 | ) | | 6/27/2013 | | 2008 | | Garland | | TX | | — |
| | 1,529 |
| | 3,715 |
| | — |
| | 5,244 |
| | (1,128 | ) | | 6/27/2013 | | 2008 |
| Gainsville Fuel | | Cleburne | | TX | | — |
| | 70 |
| | — |
| | — |
| | 70 |
| | — |
| | 6/25/2014 | | 2009 | |
| Gander Mountain | | Houston | | TX | | — |
| | 2,640 |
| | 10,559 |
| | — |
| | 13,199 |
| | (1,561 | ) | | 5/19/2014 | | 2004 | |
| Garden Ridge | | Stockbridge | | GA | | — |
| | 2,057 |
| | 8,967 |
| | — |
| | 11,024 |
| | (1,410 | ) | | 2/7/2014 | | 1998 | |
| Gastro Pub | | Tulsa | | OK | | 28,425 |
| | 1,253 |
| | 70,274 |
| | 1,869 |
| | 73,396 |
| | (10,557 | ) | | 11/5/2013 | | 1995 | | Tulsa | | OK | | — |
| | 1,253 |
| | 70,274 |
| | 1,869 |
| | 73,396 |
| | (17,333 | ) | | 11/5/2013 | | 1995 |
| GE Aviation | | Auburn | | AL | | 24,133 |
| | 1,627 |
| | 30,920 |
| | — |
| | 32,547 |
| | (6,728 | ) | | 11/21/2012 | | 1995 | | Auburn | | AL | | 24,133 |
| | 1,627 |
| | 30,920 |
| | — |
| | 32,547 |
| | (9,087 | ) | | 11/21/2012 | | 1995 |
| GE Engine | | Winfield | | KS | | — |
| | 1,078 |
| | 5,087 |
| | — |
| | 6,165 |
| | (2,322 | ) | | 5/6/2014 | | 1951 | | Winfield | | KS | | — |
| | 1,078 |
| | 5,087 |
| | — |
| | 6,165 |
| | (4,092 | ) | | 5/6/2014 | | 1951 |
| General Electric | | Longmont | | CO | | — |
| | 1,402 |
| | 15,640 |
| | 827 |
| | 17,869 |
| | (2,981 | ) | | 1/8/2014 | | 1993 | | Longmont | | CO | | — |
| | 1,402 |
| | 15,640 |
| | 1,258 |
| | 18,300 |
| | (5,022 | ) | | 1/8/2014 | | 1993 |
| General Mills | | Geneva | | IL | | 16,555 |
| | 7,457 |
| | 22,371 |
| | — |
| | 29,828 |
| | (6,311 | ) | | 5/23/2012 | | 1998 | | Geneva | | IL | | — |
| | 7,457 |
| | 22,371 |
| | — |
| | 29,828 |
| | (8,169 | ) | | 5/23/2012 | | 1998 |
| General Mills | | | Fort Wayne | | IN | | — |
| | 2,533 |
| | 48,130 |
| | — |
| | 50,663 |
| | (16,832 | ) | | 10/18/2012 | | 2012 |
| General Service Administration | | | Mobile | | AL | | — |
| | 268 |
| | 5,095 |
| | 49 |
| | 5,412 |
| | (1,681 | ) | | 6/19/2012 | | 1995 |
| General Service Administration | | | Craig | | CO | | — |
| | 129 |
| | 1,159 |
| | 16 |
| | 1,304 |
| | (404 | ) | | 12/30/2011 | | 1995 |
| | | | | | Initial Costs (1) | | Costs Capitalized Subsequent to Acquisition (2) | | Gross Amount
Carried at
December 31, 2016
(3) (4) | | | | | | Initial Costs (1) | | Costs Capitalized Subsequent to Acquisition (2) | | Gross Amount
Carried at
December 31, 2018
(3) (4) | | | |
| Property | | City | | State | | Encumbrances at
December 31, 2016 | | Land | | Buildings, Fixtures and Improvements | | Accumulated Depreciation
(3) (5) | | Date Acquired | | Date of Construction | | City | | State | | Encumbrances at
December 31, 2018 | | Land | | Buildings, Fixtures and Improvements | | Accumulated Depreciation
(3) (5) | | Date Acquired | | Date of Construction |
| General Mills | | Fort Wayne | | IN | | — |
| | 2,533 |
| | 48,130 |
| | — |
| | 50,663 |
| | (12,355 | ) | | 10/18/2012 | | 2012 | |
| General Service Administration | | Mobile | | AL | | — |
| | 268 |
| | 5,095 |
| | 49 |
| | 5,412 |
| | (1,275 | ) | | 6/19/2012 | | 1995 | | Cocoa | | FL | | 500 |
| | 253 |
| | 1,435 |
| | 15 |
| | 1,703 |
| | (501 | ) | | 12/13/2011 | | 1995 |
| General Service Administration | | Springerville | | AZ | | — |
| | 148 |
| | 2,810 |
| | (572 | ) | | 2,386 |
| | (88 | ) | | 7/2/2012 | | 2006 | | Grangeville | | ID | | 2,100 |
| | 317 |
| | 6,023 |
| | 27 |
| | 6,367 |
| | (2,036 | ) | | 3/5/2012 | | 2007 |
| General Service Administration | | Craig | | CO | | — |
| | 129 |
| | 1,159 |
| | 16 |
| | 1,304 |
| | (321 | ) | | 12/30/2011 | | 1995 | | Freeport | | NY | | — |
| | 843 |
| | 3,372 |
| | — |
| | 4,215 |
| | (1,158 | ) | | 1/10/2012 | | 1995 |
| General Service Administration | | Cocoa | | FL | | 500 |
| | 253 |
| | 1,435 |
| | 15 |
| | 1,703 |
| | (399 | ) | | 12/13/2011 | | 1995 | | Plattsburgh | | NY | | — |
| | 508 |
| | 4,572 |
| | — |
| | 5,080 |
| | (1,504 | ) | | 6/19/2012 | | 2008 |
| General Service Administration | | Stuart | | FL | | — |
| | 900 |
| | 3,600 |
| | 6 |
| | 4,506 |
| | (949 | ) | | 3/5/2012 | | 2011 | | Warren | | PA | | — |
| | 341 |
| | 3,114 |
| | — |
| | 3,455 |
| | (1,030 | ) | | 6/19/2012 | | 2008 |
| General Service Administration | | Grangeville | | ID | | 2,100 |
| | 317 |
| | 6,023 |
| | 31 |
| | 6,371 |
| | (1,587 | ) | | 3/5/2012 | | 2007 | | Ponce | | PR | | — |
| | 1,780 |
| | 9,313 |
| | (4,565 | ) | | 6,528 |
| | (698 | ) | | 11/5/2013 | | 1995 |
| General Service Administration | | Springfield | | MO | | — |
| | 131 |
| | 2,489 |
| | — |
| | 2,620 |
| | (633 | ) | | 5/15/2012 | | 2011 | | Fort Worth | | TX | | — |
| | 477 |
| | 4,294 |
| | (4 | ) | | 4,767 |
| | (1,424 | ) | | 5/9/2012 | | 2010 |
| General Service Administration | | Freeport | | NY | | — |
| | 843 |
| | 3,372 |
| | 1 |
| | 4,216 |
| | (919 | ) | | 1/10/2012 | | 1995 | | Gloucester | | VA | | — |
| | 287 |
| | 1,628 |
| | 8 |
| | 1,923 |
| | (536 | ) | | 6/20/2012 | | 1995 |
| General Service Administration | | Plattsburgh | | NY | | — |
| | 508 |
| | 4,572 |
| | — |
| | 5,080 |
| | (1,142 | ) | | 6/19/2012 | | 2008 | |
| General Service Administration | | Warren | | PA | | — |
| | 341 |
| | 3,114 |
| | — |
| | 3,455 |
| | (780 | ) | | 6/19/2012 | | 2008 | |
| General Service Administration | | Ponce | | PR | | — |
| | 1,780 |
| | 9,313 |
| | (4,561 | ) | | 6,532 |
| | (189 | ) | | 11/5/2013 | | 1995 | |
| General Service Administration | | Austin | | TX | | — |
| | 1,570 |
| | 3,057 |
| | — |
| | 4,627 |
| | (651 | ) | | 11/5/2013 | | 2005 | |
| General Service Administration | | Fort Worth | | TX | | — |
| | 477 |
| | 4,294 |
| | (4 | ) | | 4,767 |
| | (1,091 | ) | | 5/9/2012 | | 2010 | |
| General Service Administration | | Gloucester | | VA | | — |
| | 287 |
| | 1,628 |
| | — |
| | 1,915 |
| | (407 | ) | | 6/20/2012 | | 1995 | |
| Genlyte Thomas Group, LLC. | | Franklin Park | | IL | | 4,561 |
| | 958 |
| | 3,176 |
| | (1,337 | ) | | 2,797 |
| | (65 | ) | | 3/28/2014 | | 1969 | |
| Giant | | | Levittown | | PA | | — |
| | 4,716 |
| | 9,955 |
| | — |
| | 14,671 |
| | (2,524 | ) | | 11/5/2013 | | 1995 |
| Giant Eagle | | Gahanna | | OH | | — |
| | 3,549 |
| | 16,736 |
| | — |
| | 20,285 |
| | (2,269 | ) | | 2/7/2014 | | 2002 | | Gahanna | | OH | | — |
| | 3,549 |
| | 16,736 |
| | — |
| | 20,285 |
| | (3,848 | ) | | 2/7/2014 | | 2002 |
| Giant Eagle | | Lancaster | | OH | | — |
| | 2,210 |
| | 15,649 |
| | — |
| | 17,859 |
| | (2,063 | ) | | 2/7/2014 | | 2008 | | Lancaster | | OH | | — |
| | 2,210 |
| | 15,649 |
| | — |
| | 17,859 |
| | (3,498 | ) | | 2/7/2014 | | 2008 |
| Glen's Market | | Manistee | | MI | | — |
| | 294 |
| | 6,694 |
| | — |
| | 6,988 |
| | (1,008 | ) | | 2/7/2014 | | 2009 | | Manistee | | MI | | — |
| | 294 |
| | 6,694 |
| | — |
| | 6,988 |
| | (1,709 | ) | | 2/7/2014 | | 2009 |
| Globe Energy Services | | Hobbs | | NM | | — |
| | 358 |
| | 1,129 |
| | — |
| | 1,487 |
| | (153 | ) | | 6/12/2014 | | 2013 | |
| Globe Energy Services | | Big Springs | | TX | | — |
| | 426 |
| | 599 |
| | — |
| | 1,025 |
| | (84 | ) | | 6/25/2014 | | 2012 | |
| Globe Energy Services | | Levelland | | TX | | — |
| | 42 |
| | 1,887 |
| | — |
| | 1,929 |
| | (253 | ) | | 6/25/2014 | | 1997 | |
| Globe Energy Services | | Midland | | TX | | — |
| | 1,063 |
| | 528 |
| | — |
| | 1,591 |
| | (74 | ) | | 6/12/2014 | | 2009 | |
| Globe Energy Services | | Midland | | TX | | — |
| | 1,013 |
| | 968 |
| | — |
| | 1,981 |
| | (120 | ) | | 6/12/2014 | | 2010 | |
| Globe Energy Services | | Monahans | | TX | | — |
| | 50 |
| | 538 |
| | — |
| | 588 |
| | (73 | ) | | 6/12/2014 | | 2011 | |
| Globe Energy Services | | Odessa | | TX | | — |
| | 104 |
| | 1,259 |
| | — |
| | 1,363 |
| | (139 | ) | | 6/25/2014 | | 1963 | |
| Globe Energy Services | | Odessa | | TX | | — |
| | 500 |
| | 3,891 |
| | — |
| | 4,391 |
| | (532 | ) | | 6/12/2014 | | 1963 | |
| Globe Energy Services | | San Angelo | | TX | | — |
| | 821 |
| | 1,658 |
| | — |
| | 2,479 |
| | (203 | ) | | 6/12/2014 | | 2012 | |
| Globe Energy Services | | Snyder | | TX | | — |
| | 466 |
| | 588 |
| | — |
| | 1,054 |
| | (86 | ) | | 6/12/2014 | | 2005 | |
| Globe Energy Services | | Snyder | | TX | | — |
| | 174 |
| | 1,189 |
| | — |
| | 1,363 |
| | (136 | ) | | 6/12/2014 | | 1975 | |
| GM Financial | | Arlington | | TX | | 23,628 |
| | 7,901 |
| | 35,553 |
| | — |
| | 43,454 |
| | (6,158 | ) | | 11/5/2013 | | 1998 | | Arlington | | TX | | — |
| | 7,901 |
| | 35,553 |
| | — |
| | 43,454 |
| | (9,485 | ) | | 11/5/2013 | | 1998 |
| GoFrac, LLC | | Weatherford | | TX | | — |
| | 102 |
| | 3,386 |
| | (2,912 | ) | | 576 |
| | (32 | ) | | 6/12/2014 | | 2011 | |
| Golden Corral | | | Cullman | | AL | | — |
| | 847 |
| | 2,390 |
| | (2,143 | ) | | 1,094 |
| | (150 | ) | | 2/7/2014 | | 1996 |
| Golden Corral | | | Gilbert | | AZ | | — |
| | 871 |
| | 2,910 |
| | — |
| | 3,781 |
| | (884 | ) | | 6/27/2013 | | 2006 |
| Golden Corral | | | Goodyear | | AZ | | — |
| | 686 |
| | 1,939 |
| | — |
| | 2,625 |
| | (589 | ) | | 6/27/2013 | | 2006 |
| Golden Corral | | | Surprise | | AZ | | — |
| | 1,258 |
| | 4,068 |
| | — |
| | 5,326 |
| | (1,235 | ) | | 6/27/2013 | | 2007 |
| Golden Corral | | | Bakersfield | | CA | | — |
| | 2,664 |
| | 2,078 |
| | — |
| | 4,742 |
| | (671 | ) | | 2/7/2014 | | 2011 |
| Golden Corral | | | Palatka | | FL | | — |
| | 853 |
| | 1,048 |
| | (471 | ) | | 1,430 |
| | (157 | ) | | 6/27/2013 | | 1997 |
| Golden Corral | | | Albany | | GA | | — |
| | 460 |
| | 1,863 |
| | — |
| | 2,323 |
| | (561 | ) | | 6/27/2013 | | 1995 |
| Golden Corral | | | Brunswick | | GA | | — |
| | 390 |
| | 2,093 |
| | — |
| | 2,483 |
| | (630 | ) | | 6/27/2013 | | 1995 |
| Golden Corral | | | Council Bluffs | | IA | | — |
| | 1,140 |
| | 1,460 |
| | — |
| | 2,600 |
| | (440 | ) | | 6/27/2013 | | 1995 |
| Golden Corral | | | Clarksville | | IN | | — |
| | 1,061 |
| | 1,344 |
| | — |
| | 2,405 |
| | (502 | ) | | 2/7/2014 | | 2002 |
| Golden Corral | | | Evansville | | IN | | — |
| | 670 |
| | 2,707 |
| | — |
| | 3,377 |
| | (815 | ) | | 6/27/2013 | | 1995 |
| Golden Corral | | | Kokomo | | IN | | — |
| | 780 |
| | 2,107 |
| | — |
| | 2,887 |
| | (634 | ) | | 6/27/2013 | | 1995 |
| Golden Corral | | | Richmond | | IN | | — |
| | 728 |
| | 723 |
| | — |
| | 1,451 |
| | (233 | ) | | 2/7/2014 | | 2002 |
| Golden Corral | | | Wichita | | KS | | — |
| | 560 |
| | 1,306 |
| | — |
| | 1,866 |
| | (366 | ) | | 7/31/2013 | | 2000 |
| Golden Corral | | | Henderson | | KY | | — |
| | 600 |
| | 1,586 |
| | — |
| | 2,186 |
| | (477 | ) | | 6/27/2013 | | 1995 |
| Golden Corral | | | Louisville | | KY | | — |
| | 1,020 |
| | 1,173 |
| | — |
| | 2,193 |
| | (347 | ) | | 2/7/2014 | | 2001 |
| Golden Corral | | | Owensboro | | KY | | — |
| | 1,244 |
| | 1,656 |
| | (1,941 | ) | | 959 |
| | (112 | ) | | 2/7/2014 | | 1997 |
| Golden Corral | | | Coon Rapids | | MN | | — |
| | 1,611 |
| | 2,188 |
| | (2,893 | ) | | 906 |
| | (94 | ) | | 2/7/2014 | | 2003 |
| Golden Corral | | | Independence | | MO | | — |
| | 1,425 |
| | 2,437 |
| | — |
| | 3,862 |
| | (722 | ) | | 2/7/2014 | | 2010 |
| | | | | | Initial Costs (1) | | Costs Capitalized Subsequent to Acquisition (2) | | Gross Amount
Carried at
December 31, 2016
(3) (4) | | | | | | Initial Costs (1) | | Costs Capitalized Subsequent to Acquisition (2) | | Gross Amount
Carried at
December 31, 2018
(3) (4) | | | |
| Property | | City | | State | | Encumbrances at
December 31, 2016 | | Land | | Buildings, Fixtures and Improvements | | Accumulated Depreciation
(3) (5) | | Date Acquired | | Date of Construction | | City | | State | | Encumbrances at
December 31, 2018 | | Land | | Buildings, Fixtures and Improvements | | Accumulated Depreciation
(3) (5) | | Date Acquired | | Date of Construction |
| Golden Corral | | Gilbert | | AZ | | — |
| | 871 |
| | 2,910 |
| | — |
| | 3,781 |
| | (591 | ) | | 6/27/2013 | | 2006 | | Flowood | | MS | | — |
| | 680 |
| | 2,730 |
| | — |
| | 3,410 |
| | (822 | ) | | 6/27/2013 | | 1995 |
| Golden Corral | | Goodyear | | AZ | | — |
| | 686 |
| | 1,939 |
| | — |
| | 2,625 |
| | (394 | ) | | 6/27/2013 | | 2006 | | Horn Lake | | MS | | — |
| | 925 |
| | 2,463 |
| | (2,319 | ) | | 1,069 |
| | (147 | ) | | 2/7/2014 | | 1995 |
| Golden Corral | | Surprise | | AZ | | — |
| | 1,258 |
| | 4,068 |
| | — |
| | 5,326 |
| | (826 | ) | | 6/27/2013 | | 2007 | | Aberdeen | | NC | | — |
| | 690 |
| | 1,566 |
| | — |
| | 2,256 |
| | (471 | ) | | 6/27/2013 | | 1995 |
| Golden Corral | | Bakersfield | | CA | | — |
| | 2,664 |
| | 2,078 |
| | — |
| | 4,742 |
| | (396 | ) | | 2/7/2014 | | 2011 | | Bellevue | | NE | | — |
| | 520 |
| | 1,433 |
| | — |
| | 1,953 |
| | (431 | ) | | 6/27/2013 | | 1995 |
| Golden Corral | | Palatka | | FL | | — |
| | 853 |
| | 1,048 |
| | (471 | ) | | 1,430 |
| | (72 | ) | | 6/27/2013 | | 1997 | | Lincoln | | NE | | — |
| | 300 |
| | 2,930 |
| | — |
| | 3,230 |
| | (882 | ) | | 6/27/2013 | | 1995 |
| Golden Corral | | Albany | | GA | | — |
| | 460 |
| | 1,863 |
| | — |
| | 2,323 |
| | (369 | ) | | 6/27/2013 | | 1995 | | Farmington | | NM | | — |
| | 270 |
| | 3,174 |
| | (2,023 | ) | | 1,421 |
| | (166 | ) | | 6/27/2013 | | 1995 |
| Golden Corral | | Brunswick | | GA | | — |
| | 390 |
| | 2,093 |
| | — |
| | 2,483 |
| | (415 | ) | | 6/27/2013 | | 1995 | | Akron | | OH | | — |
| | 640 |
| | 2,133 |
| | — |
| | 2,773 |
| | (550 | ) | | 2/7/2014 | | 2003 |
| Golden Corral | | Council Bluffs | | IA | | — |
| | 1,140 |
| | 1,460 |
| | — |
| | 2,600 |
| | (290 | ) | | 6/27/2013 | | 1995 | | Beavercreek | | OH | | — |
| | 713 |
| | 1,858 |
| | — |
| | 2,571 |
| | (462 | ) | | 2/7/2014 | | 2000 |
| Golden Corral | | Clarksville | | IN | | — |
| | 1,061 |
| | 1,344 |
| | — |
| | 2,405 |
| | (296 | ) | | 2/7/2014 | | 2002 | | Canton | | OH | | — |
| | 647 |
| | 2,135 |
| | — |
| | 2,782 |
| | (584 | ) | | 2/7/2014 | | 2002 |
| Golden Corral | | Evansville | | IN | | — |
| | 670 |
| | 2,707 |
| | — |
| | 3,377 |
| | (537 | ) | | 6/27/2013 | | 1995 | | Cincinnati | | OH | | — |
| | 694 |
| | 2,066 |
| | — |
| | 2,760 |
| | (558 | ) | | 2/7/2014 | | 1999 |
| Golden Corral | | Kokomo | | IN | | — |
| | 780 |
| | 2,107 |
| | — |
| | 2,887 |
| | (418 | ) | | 6/27/2013 | | 1995 | | Cleveland | | OH | | — |
| | 1,109 |
| | 2,315 |
| | — |
| | 3,424 |
| | (581 | ) | | 2/7/2014 | | 2004 |
| Golden Corral | | Richmond | | IN | | — |
| | 728 |
| | 723 |
| | — |
| | 1,451 |
| | (137 | ) | | 2/7/2014 | | 2002 | | Columbus | | OH | | — |
| | 770 |
| | 2,476 |
| | — |
| | 3,246 |
| | (745 | ) | | 6/27/2013 | | 1995 |
| Golden Corral | | Wichita | | KS | | — |
| | 560 |
| | 1,306 |
| | — |
| | 1,866 |
| | (238 | ) | | 7/31/2013 | | 2000 | | Dayton | | OH | | — |
| | 579 |
| | 1,429 |
| | — |
| | 2,008 |
| | (388 | ) | | 2/7/2014 | | 2000 |
| Golden Corral | | Henderson | | KY | | — |
| | 600 |
| | 1,586 |
| | — |
| | 2,186 |
| | (315 | ) | | 6/27/2013 | | 1995 | | Dayton | | OH | | — |
| | 774 |
| | 2,766 |
| | — |
| | 3,540 |
| | (734 | ) | | 2/7/2014 | | 2002 |
| Golden Corral | | Louisville | | KY | | — |
| | 1,020 |
| | 1,173 |
| | — |
| | 2,193 |
| | (205 | ) | | 2/7/2014 | | 2001 | |
| Golden Corral | | Independence | | MO | | — |
| | 1,425 |
| | 2,437 |
| | — |
| | 3,862 |
| | (426 | ) | | 2/7/2014 | | 2010 | |
| Golden Corral | | Flowood | | MS | | — |
| | 680 |
| | 2,730 |
| | — |
| | 3,410 |
| | (541 | ) | | 6/27/2013 | | 1995 | |
| Golden Corral | | Aberdeen | | NC | | — |
| | 690 |
| | 1,566 |
| | — |
| | 2,256 |
| | (310 | ) | | 6/27/2013 | | 1995 | |
| Golden Corral | | Burlington | | NC | | — |
| | 840 |
| | 2,319 |
| | — |
| | 3,159 |
| | (460 | ) | | 6/27/2013 | | 1995 | |
| Golden Corral | | Hickory | | NC | | — |
| | 260 |
| | 2,658 |
| | — |
| | 2,918 |
| | (527 | ) | | 6/27/2013 | | 1995 | |
| Golden Corral | | Bellevue | | NE | | — |
| | 520 |
| | 1,433 |
| | — |
| | 1,953 |
| | (284 | ) | | 6/27/2013 | | 1995 | |
| Golden Corral | | Lincoln | | NE | | — |
| | 300 |
| | 2,930 |
| | — |
| | 3,230 |
| | (581 | ) | | 6/27/2013 | | 1995 | |
| Golden Corral | | Farmington | | NM | | — |
| | 270 |
| | 3,174 |
| | (2,024 | ) | | 1,420 |
| | (44 | ) | | 6/27/2013 | | 1995 | |
| Golden Corral | | Roswell | | NM | | — |
| | 203 |
| | 600 |
| | — |
| | 803 |
| | (122 | ) | | 6/27/2013 | | 2000 | |
| Golden Corral | | Akron | | OH | | — |
| | 640 |
| | 2,133 |
| | — |
| | 2,773 |
| | (325 | ) | | 2/7/2014 | | 2003 | |
| Golden Corral | | Beavercreek | | OH | | — |
| | 713 |
| | 1,858 |
| | — |
| | 2,571 |
| | (272 | ) | | 2/7/2014 | | 2000 | |
| Golden Corral | | Canton | | OH | | — |
| | 647 |
| | 2,135 |
| | — |
| | 2,782 |
| | (345 | ) | | 2/7/2014 | | 2002 | |
| Golden Corral | | Cincinnati | | OH | | — |
| | 694 |
| | 2,066 |
| | — |
| | 2,760 |
| | (329 | ) | | 2/7/2014 | | 1999 | |
| Golden Corral | | Cleveland | | OH | | — |
| | 1,109 |
| | 2,315 |
| | — |
| | 3,424 |
| | (343 | ) | | 2/7/2014 | | 2004 | |
| Golden Corral | | Columbus | | OH | | — |
| | 770 |
| | 2,476 |
| | — |
| | 3,246 |
| | (491 | ) | | 6/27/2013 | | 1995 | |
| Golden Corral | | Dayton | | OH | | — |
| | 579 |
| | 1,429 |
| | — |
| | 2,008 |
| | (229 | ) | | 2/7/2014 | | 2000 | |
| Golden Corral | | Dayton | | OH | | — |
| | 774 |
| | 2,766 |
| | — |
| | 3,540 |
| | (433 | ) | | 2/7/2014 | | 2002 | |
| | | | | | Initial Costs (1) | | Costs Capitalized Subsequent to Acquisition (2) | | Gross Amount
Carried at
December 31, 2016
(3) (4) | | | | | | Initial Costs (1) | | Costs Capitalized Subsequent to Acquisition (2) | | Gross Amount
Carried at
December 31, 2018
(3) (4) | | | |
| Property | | City | | State | | Encumbrances at
December 31, 2016 | | Land | | Buildings, Fixtures and Improvements | | Accumulated Depreciation
(3) (5) | | Date Acquired | | Date of Construction | | City | | State | | Encumbrances at
December 31, 2018 | | Land | | Buildings, Fixtures and Improvements | | Accumulated Depreciation
(3) (5) | | Date Acquired | | Date of Construction |
| Golden Corral | | Elyria | | OH | | — |
| | 1,167 |
| | 1,599 |
| | — |
| | 2,766 |
| | (241 | ) | | 2/7/2014 | | 2004 | | Elyria | | OH | | — |
| | 1,167 |
| | 1,599 |
| | — |
| | 2,766 |
| | (409 | ) | | 2/7/2014 | | 2004 |
| Golden Corral | | Fairfield | | OH | | — |
| | 859 |
| | 1,135 |
| | — |
| | 1,994 |
| | (178 | ) | | 2/7/2014 | | 1999 | | Fairfield | | OH | | — |
| | 859 |
| | 1,135 |
| | — |
| | 1,994 |
| | (302 | ) | | 2/7/2014 | | 1999 |
| Golden Corral | | Grove City | | OH | | — |
| | 926 |
| | 1,859 |
| | — |
| | 2,785 |
| | (282 | ) | | 2/7/2014 | | 2007 | | Grove City | | OH | | — |
| | 926 |
| | 1,859 |
| | — |
| | 2,785 |
| | (478 | ) | | 2/7/2014 | | 2007 |
| Golden Corral | | Northfield | | OH | | — |
| | 947 |
| | 1,061 |
| | — |
| | 2,008 |
| | (156 | ) | | 2/7/2014 | | 2004 | | Northfield | | OH | | — |
| | 947 |
| | 1,061 |
| | — |
| | 2,008 |
| | (264 | ) | | 2/7/2014 | | 2004 |
| Golden Corral | | Ontario | | OH | | — |
| | 616 |
| | 2,412 |
| | — |
| | 3,028 |
| | (384 | ) | | 2/7/2014 | | 2004 | | Ontario | | OH | | — |
| | 616 |
| | 2,412 |
| | — |
| | 3,028 |
| | (652 | ) | | 2/7/2014 | | 2004 |
| Golden Corral | | Springfield | | OH | | — |
| | 619 |
| | 1,142 |
| | — |
| | 1,761 |
| | (168 | ) | | 2/7/2014 | | 2000 | | Springfield | | OH | | — |
| | 619 |
| | 1,142 |
| | — |
| | 1,761 |
| | (285 | ) | | 2/7/2014 | | 2000 |
| Golden Corral | | Toledo | | OH | | — |
| | 838 |
| | 3,333 |
| | — |
| | 4,171 |
| | (493 | ) | | 2/7/2014 | | 2004 | | Toledo | | OH | | — |
| | 838 |
| | 3,333 |
| | — |
| | 4,171 |
| | (836 | ) | | 2/7/2014 | | 2004 |
| Golden Corral | | Zanesville | | OH | | — |
| | 487 |
| | 2,030 |
| | — |
| | 2,517 |
| | (412 | ) | | 6/27/2013 | | 2002 | | Zanesville | | OH | | — |
| | 487 |
| | 2,030 |
| | — |
| | 2,517 |
| | (616 | ) | | 6/27/2013 | | 2002 |
| Golden Corral | | Midwest City | | OK | | — |
| | 1,175 |
| | 1,708 |
| | (983 | ) | | 1,900 |
| | (103 | ) | | 6/27/2013 | | 1991 | | Midwest City | | OK | | — |
| | 1,175 |
| | 1,708 |
| | (983 | ) | | 1,900 |
| | (225 | ) | | 6/27/2013 | | 1991 |
| Golden Corral | | Norman | | OK | | — |
| | 345 |
| | 2,107 |
| | — |
| | 2,452 |
| | (428 | ) | | 6/27/2013 | | 1994 | | Norman | | OK | | — |
| | 345 |
| | 2,107 |
| | — |
| | 2,452 |
| | (640 | ) | | 6/27/2013 | | 1994 |
| Golden Corral | | Tulsa | | OK | | — |
| | 280 |
| | 3,890 |
| | — |
| | 4,170 |
| | (771 | ) | | 6/27/2013 | | 1995 | | Tulsa | | OK | | — |
| | 280 |
| | 3,890 |
| | — |
| | 4,170 |
| | (1,171 | ) | | 6/27/2013 | | 1995 |
| Golden Corral | | Monroeville | | PA | | — |
| | 1,647 |
| | 849 |
| | — |
| | 2,496 |
| | (97 | ) | | 2/7/2014 | | 1982 | | Monroeville | | PA | | — |
| | 1,647 |
| | 849 |
| | — |
| | 2,496 |
| | (164 | ) | | 2/7/2014 | | 1982 |
| Golden Corral | | Rock Hill | | SC | | — |
| | 320 |
| | 2,130 |
| | — |
| | 2,450 |
| | (422 | ) | | 6/27/2013 | | 1995 | | Rock Hill | | SC | | — |
| | 320 |
| | 2,130 |
| | — |
| | 2,450 |
| | (641 | ) | | 6/27/2013 | | 1995 |
| Golden Corral | | Cookeville | | TN | | — |
| | 800 |
| | 1,937 |
| | — |
| | 2,737 |
| | (384 | ) | | 6/27/2013 | | 1995 | | Cookeville | | TN | | — |
| | 800 |
| | 1,937 |
| | — |
| | 2,737 |
| | (583 | ) | | 6/27/2013 | | 1995 |
| Golden Corral | | Baytown | | TX | | — |
| | 596 |
| | 1,788 |
| | — |
| | 2,384 |
| | (326 | ) | | 7/31/2013 | | 1998 | | Baytown | | TX | | — |
| | 596 |
| | 1,788 |
| | — |
| | 2,384 |
| | (502 | ) | | 7/31/2013 | | 1998 |
| Golden Corral | | College Station | | TX | | — |
| | 1,265 |
| | 1,718 |
| | — |
| | 2,983 |
| | (349 | ) | | 6/27/2013 | | 1990 | | College Station | | TX | | — |
| | 1,265 |
| | 1,718 |
| | — |
| | 2,983 |
| | (522 | ) | | 6/27/2013 | | 1990 |
| Golden Corral | | Houston | | TX | | — |
| | 1,147 |
| | 2,447 |
| | (64 | ) | | 3,530 |
| | (497 | ) | | 6/27/2013 | | 1995 | | Houston | | TX | | — |
| | 1,147 |
| | 2,447 |
| | (64 | ) | | 3,530 |
| | (743 | ) | | 6/27/2013 | | 1995 |
| Golden Corral | | San Angelo | | TX | | — |
| | 644 |
| | 1,702 |
| | — |
| | 2,346 |
| | (281 | ) | | 2/7/2014 | | 2012 | | San Angelo | | TX | | — |
| | 644 |
| | 1,702 |
| | — |
| | 2,346 |
| | (476 | ) | | 2/7/2014 | | 2012 |
| Golden Corral | | Spring | | TX | | — |
| | 3,342 |
| | 1,207 |
| | — |
| | 4,549 |
| | (246 | ) | | 2/7/2014 | | 2011 | | Spring | | TX | | — |
| | 3,342 |
| | 1,207 |
| | — |
| | 4,549 |
| | (416 | ) | | 2/7/2014 | | 2011 |
| Golden Corral | | Texarkana | | TX | | — |
| | 758 |
| | 3,031 |
| | — |
| | 3,789 |
| | (553 | ) | | 7/31/2013 | | 2001 | | Texarkana | | TX | | — |
| | 758 |
| | 3,031 |
| | — |
| | 3,789 |
| | (850 | ) | | 7/31/2013 | | 2001 |
| Golden Corral | | Bristol | | VA | | — |
| | 750 |
| | 2,276 |
| | — |
| | 3,026 |
| | (451 | ) | | 6/27/2013 | | 1995 | | Bristol | | VA | | — |
| | 750 |
| | 2,276 |
| | — |
| | 3,026 |
| | (685 | ) | | 6/27/2013 | | 1995 |
| Gold's Gym | | Broken Arrow | | OK | | — |
| | 1,661 |
| | 6,565 |
| | — |
| | 8,226 |
| | (1,079 | ) | | 2/7/2014 | | 2009 | |
| Golden Corral | | | Beckley | | WV | | — |
| | 1,248 |
| | 2,258 |
| | (2,507 | ) | | 999 |
| | (129 | ) | | 2/7/2014 | | 1995 |
| Goodyear | | Cumming | | GA | | — |
| | 534 |
| | 2,516 |
| | — |
| | 3,050 |
| | (364 | ) | | 2/7/2014 | | 2010 | | Cumming | | GA | | — |
| | 534 |
| | 2,516 |
| | — |
| | 3,050 |
| | (617 | ) | | 2/7/2014 | | 2010 |
| Goodyear | | Cumming | | GA | | — |
| | 1,085 |
| | 1,915 |
| | — |
| | 3,000 |
| | (294 | ) | | 2/7/2014 | | 2010 | | Cumming | | GA | | — |
| | 1,085 |
| | 1,915 |
| | (11 | ) | | 2,989 |
| | (499 | ) | | 2/7/2014 | | 2010 |
| Goodyear | | Mcdonough | | GA | | 11,373 |
| | 1,797 |
| | 21,264 |
| | — |
| | 23,061 |
| | (3,885 | ) | | 1/8/2014 | | 1995 | | Mcdonough | | GA | | 10,674 |
| | 1,797 |
| | 21,264 |
| | — |
| | 23,061 |
| | (6,512 | ) | | 1/8/2014 | | 1995 |
| Goodyear | | Stockbridge | | GA | | 13,845 |
| | 1,222 |
| | 32,119 |
| | — |
| | 33,341 |
| | (6,067 | ) | | 1/8/2014 | | 1995 | | Stockbridge | | GA | | 12,994 |
| | 1,222 |
| | 32,119 |
| | — |
| | 33,341 |
| | (10,169 | ) | | 1/8/2014 | | 1995 |
| Goodyear | | Dekalb | | IL | | 20,767 |
| | 4,476 |
| | 44,516 |
| | — |
| | 48,992 |
| | (8,404 | ) | | 1/8/2014 | | 1999 | | Dekalb | | IL | | 19,491 |
| | 4,476 |
| | 44,516 |
| | — |
| | 48,992 |
| | (14,086 | ) | | 1/8/2014 | | 1999 |
| Goodyear | | Lockbourne | | OH | | 13,548 |
| | 3,107 |
| | 28,868 |
| | — |
| | 31,975 |
| | (5,220 | ) | | 1/8/2014 | | 1998 | | Lockbourne | | OH | | 12,716 |
| | 3,107 |
| | 28,868 |
| | — |
| | 31,975 |
| | (8,750 | ) | | 1/8/2014 | | 1998 |
| Goodyear | | York | | PA | | 23,536 |
| | 1,980 |
| | 53,396 |
| | — |
| | 55,376 |
| | (9,541 | ) | | 1/8/2014 | | 2001 | | York | | PA | | 22,090 |
| | 1,980 |
| | 53,396 |
| | — |
| | 55,376 |
| | (15,992 | ) | | 1/8/2014 | | 2001 |
| Goodyear | | Columbia | | SC | | — |
| | 656 |
| | 2,077 |
| | — |
| | 2,733 |
| | (306 | ) | | 2/7/2014 | | 2010 | | Columbia | | SC | | — |
| | 656 |
| | 2,077 |
| | — |
| | 2,733 |
| | (519 | ) | | 2/7/2014 | | 2010 |
| Goodyear | | Corpus Christi | | TX | | — |
| | 753 |
| | 1,737 |
| | — |
| | 2,490 |
| | (250 | ) | | 2/7/2014 | | 2008 | | Corpus Christi | | TX | | — |
| | 753 |
| | 1,737 |
| | — |
| | 2,490 |
| | (425 | ) | | 2/7/2014 | | 2008 |
| Goodyear | | Terrell | | TX | | 15,823 |
| | 2,516 |
| | 34,804 |
| | — |
| | 37,320 |
| | (6,561 | ) | | 1/8/2014 | | 1998 | | Terrell | | TX | | 14,851 |
| | 2,516 |
| | 34,804 |
| | — |
| | 37,320 |
| | (10,998 | ) | | 1/8/2014 | | 1998 |
| | | | | | Initial Costs (1) | | Costs Capitalized Subsequent to Acquisition (2) | | Gross Amount
Carried at
December 31, 2016
(3) (4) | | | | | | Initial Costs (1) | | Costs Capitalized Subsequent to Acquisition (2) | | Gross Amount
Carried at
December 31, 2018
(3) (4) | | | |
| Property | | City | | State | | Encumbrances at
December 31, 2016 | | Land | | Buildings, Fixtures and Improvements | | Accumulated Depreciation
(3) (5) | | Date Acquired | | Date of Construction | | City | | State | | Encumbrances at
December 31, 2018 | | Land | | Buildings, Fixtures and Improvements | | Accumulated Depreciation
(3) (5) | | Date Acquired | | Date of Construction |
| The Gorilla Glue Company | | | Cincinnati | | OH | | — |
| | 5,563 |
| | 34,887 |
| | — |
| | 40,450 |
| | (1,491 | ) | | 7/28/2017 | | 1978 |
| Grandy's | | Ardmore | | OK | | ��� |
| | 454 |
| | — |
| | — |
| | 454 |
| | — |
| | 6/27/2013 | | 1995 | | Ardmore | | OK | | — |
| | 454 |
| | — |
| | — |
| | 454 |
| | — |
| | 6/27/2013 | | 1995 |
| Grandy's | | Moore | | OK | | — |
| | 320 |
| | 428 |
| | — |
| | 748 |
| | — |
| | 6/27/2013 | | 1995 | | Moore | | OK | | — |
| | 320 |
| | 428 |
| | — |
| | 748 |
| | — |
| | 6/27/2013 | | 1995 |
| Grandy's | | Oklahoma City | | OK | | — |
| | 260 |
| | 380 |
| | — |
| | 640 |
| | — |
| | 6/27/2013 | | 1995 | | Oklahoma City | | OK | | — |
| | 260 |
| | 380 |
| | — |
| | 640 |
| | — |
| | 6/27/2013 | | 1995 |
| Grandy's | | Oklahoma City | | OK | | — |
| | 320 |
| | 289 |
| | — |
| | 609 |
| | — |
| | 6/27/2013 | | 1995 | | Oklahoma City | | OK | | — |
| | 320 |
| | 289 |
| | — |
| | 609 |
| | — |
| | 6/27/2013 | | 1995 |
| Grandy's | | Arlington | | TX | | — |
| | 734 |
| | — |
| | — |
| | 734 |
| | — |
| | 6/27/2013 | | 1995 | | Arlington | | TX | | — |
| | 734 |
| | — |
| | — |
| | 734 |
| | — |
| | 6/27/2013 | | 1995 |
| Grandy's | | Carrollton | | TX | | — |
| | 773 |
| | — |
| | — |
| | 773 |
| | — |
| | 6/27/2013 | | 1995 | | Carrollton | | TX | | — |
| | 847 |
| | — |
| | — |
| | 847 |
| | — |
| | 6/27/2013 | | 1986 |
| Grandy's | | Carrollton | | TX | | — |
| | 847 |
| | — |
| | — |
| | 847 |
| | — |
| | 6/27/2013 | | 1986 | | Dallas | | TX | | — |
| | 725 |
| | — |
| | — |
| | 725 |
| | — |
| | 7/31/2013 | | 1981 |
| Grandy's | | Dallas | | TX | | — |
| | 725 |
| | — |
| | — |
| | 725 |
| | — |
| | 7/31/2013 | | 1981 | | Dallas | | TX | | — |
| | 357 |
| | — |
| | — |
| | 357 |
| | — |
| | 7/31/2013 | | 1984 |
| Grandy's | | Dallas | | TX | | — |
| | 357 |
| | — |
| | — |
| | 357 |
| | — |
| | 7/31/2013 | | 1984 | | Fort Worth | | TX | | — |
| | 777 |
| | — |
| | — |
| | 777 |
| | — |
| | 6/27/2013 | | 1995 |
| Grandy's | | Fort Worth | | TX | | — |
| | 777 |
| | — |
| | — |
| | 777 |
| | — |
| | 6/27/2013 | | 1995 | | Fort Worth | | TX | | — |
| | 811 |
| | — |
| | — |
| | 811 |
| | — |
| | 6/27/2013 | | 1985 |
| Grandy's | | Fort Worth | | TX | | — |
| | 811 |
| | — |
| | — |
| | 811 |
| | — |
| | 6/27/2013 | | 1985 | | Garland | | TX | | — |
| | 623 |
| | — |
| | — |
| | 623 |
| | — |
| | 6/27/2013 | | 1980 |
| Grandy's | | Garland | | TX | | — |
| | 623 |
| | — |
| | — |
| | 623 |
| | — |
| | 6/27/2013 | | 1980 | | Garland | | TX | | — |
| | 859 |
| | — |
| | — |
| | 859 |
| | — |
| | 6/27/2013 | | 1985 |
| Grandy's | | Garland | | TX | | — |
| | 859 |
| | — |
| | — |
| | 859 |
| | — |
| | 6/27/2013 | | 1985 | | Greenville | | TX | | — |
| | 847 |
| | — |
| | — |
| | 847 |
| | — |
| | 7/31/2013 | | 1979 |
| Grandy's | | Greenville | | TX | | — |
| | 847 |
| | — |
| | — |
| | 847 |
| | — |
| | 7/31/2013 | | 1979 | | Irving | | TX | | — |
| | 871 |
| | — |
| | — |
| | 871 |
| | — |
| | 6/27/2013 | | 1983 |
| Grandy's | | Irving | | TX | | — |
| | 871 |
| | — |
| | — |
| | 871 |
| | — |
| | 6/27/2013 | | 1983 | | Lancaster | | TX | | — |
| | 780 |
| | — |
| | — |
| | 780 |
| | — |
| | 6/27/2013 | | 1984 |
| Grandy's | | Lancaster | | TX | | — |
| | 780 |
| | — |
| | — |
| | 780 |
| | — |
| | 6/27/2013 | | 1984 | | Mesquite | | TX | | — |
| | 871 |
| | — |
| | — |
| | 871 |
| | — |
| | 6/27/2013 | | 1983 |
| Grandy's | | Mesquite | | TX | | — |
| | 871 |
| | — |
| | — |
| | 871 |
| | — |
| | 6/27/2013 | | 1983 | | Plano | | TX | | — |
| | 871 |
| | — |
| | — |
| | 871 |
| | — |
| | 6/27/2013 | | 1980 |
| Grandy's | | Plano | | TX | | — |
| | 871 |
| | — |
| | — |
| | 871 |
| | — |
| | 6/27/2013 | | 1980 | |
| Graphic Packaging | | | Monroe | | LA | | — |
| | 637 |
| | 91,313 |
| | — |
| | 91,950 |
| | (111 | ) | | 12/28/2018 | | 2018 |
| Gravity Oilfield Services | | | Hobbs | | NM | | — |
| | 358 |
| | 1,129 |
| | — |
| | 1,487 |
| | (274 | ) | | 6/12/2014 | | 2013 |
| Gravity Oilfield Services | | | Big Springs | | TX | | — |
| | 426 |
| | 599 |
| | — |
| | 1,025 |
| | (150 | ) | | 6/25/2014 | | 2012 |
| Gravity Oilfield Services | | | Levelland | | TX | | — |
| | 42 |
| | 1,887 |
| | — |
| | 1,929 |
| | (453 | ) | | 6/25/2014 | | 1997 |
| Gravity Oilfield Services | | | Midland | | TX | | — |
| | 1,063 |
| | 528 |
| | — |
| | 1,591 |
| | (131 | ) | | 6/12/2014 | | 2009 |
| Gravity Oilfield Services | | | Midland | | TX | | — |
| | 1,013 |
| | 968 |
| | — |
| | 1,981 |
| | (214 | ) | | 6/12/2014 | | 2010 |
| Gravity Oilfield Services | | | Monahans | | TX | | — |
| | 50 |
| | 538 |
| | — |
| | 588 |
| | (131 | ) | | 6/12/2014 | | 2011 |
| Gravity Oilfield Services | | | Odessa | | TX | | — |
| | 104 |
| | 1,259 |
| | — |
| | 1,363 |
| | (248 | ) | | 6/25/2014 | | 1963 |
| Gravity Oilfield Services | | | Odessa | | TX | | — |
| | 500 |
| | 3,891 |
| | — |
| | 4,391 |
| | (951 | ) | | 6/12/2014 | | 1963 |
| Gravity Oilfield Services | | | San Angelo | | TX | | — |
| | 821 |
| | 1,658 |
| | — |
| | 2,479 |
| | (364 | ) | | 6/12/2014 | | 2012 |
| Gravity Oilfield Services | | | Snyder | | TX | | — |
| | 466 |
| | 588 |
| | — |
| | 1,054 |
| | (153 | ) | | 6/12/2014 | | 2005 |
| Gravity Oilfield Services | | | Snyder | | TX | | — |
| | 174 |
| | 1,189 |
| | — |
| | 1,363 |
| | (243 | ) | | 6/12/2014 | | 1975 |
| Greene's Energy Group | | Broussard | | LA | | — |
| | 455 |
| | 6,022 |
| | — |
| | 6,477 |
| | (598 | ) | | 6/12/2014 | | 1980 | | Broussard | | LA | | — |
| | 455 |
| | 6,022 |
| | — |
| | 6,477 |
| | (1,068 | ) | | 6/12/2014 | | 1980 |
| Habanero's Mexican Grill | | Hueytown | | AL | | — |
| | 60 |
| | 639 |
| | — |
| | 699 |
| | (127 | ) | | 6/27/2013 | | 1995 | |
| Hanesbrands | | Rural Hall | | NC | | 18,100 |
| | 1,798 |
| | 41,214 |
| | (50 | ) | | 42,962 |
| | (5,407 | ) | | 2/7/2014 | | 1992 | | Rural Hall | | NC | | — |
| | 1,798 |
| | 41,214 |
| | (50 | ) | | 42,962 |
| | (9,406 | ) | | 2/7/2014 | | 1992 |
| Hanesbrands | | Rural Hall | | NC | | 17,990 |
| | 1,082 |
| | 22,565 |
| | — |
| | 23,647 |
| | (5,763 | ) | | 12/21/2012 | | 1989 | |
| Hardee's | | Morrilton | | AR | | — |
| | 175 |
| | 937 |
| | — |
| | 1,112 |
| | (145 | ) | | 3/28/2014 | | 1986 | |
| Hardee's | | Jacksonville | | FL | | — |
| | 875 |
| | 583 |
| | — |
| | 1,458 |
| | (106 | ) | | 7/31/2013 | | 1993 | |
| Hardee's | | Pace | | FL | | — |
| | 419 |
| | 435 |
| | — |
| | 854 |
| | (85 | ) | | 6/27/2013 | | 1991 | |
| Hardee's | | Williston | | FL | | — |
| | 395 |
| | 553 |
| | — |
| | 948 |
| | (109 | ) | | 6/27/2013 | | 1992 | |
| Hardee's | | Bremen | | GA | | — |
| | 129 |
| | 518 |
| | — |
| | 647 |
| | (94 | ) | | 7/31/2013 | | 1980 | |
| Hardee's | | Canton | | GA | | — |
| | 488 |
| | 539 |
| | — |
| | 1,027 |
| | (106 | ) | | 6/27/2013 | | 1983 | |
| Hardee's | | Mount Vernon | | IA | | — |
| | 320 |
| | 480 |
| | (6 | ) | | 794 |
| | (94 | ) | | 6/27/2013 | | 1987 | |
| Hardee's | | Indian Trail | | NC | | — |
| | 777 |
| | 553 |
| | — |
| | 1,330 |
| | (103 | ) | | 6/27/2013 | | 1992 | |
| Hardee's | | Old Fort | | NC | | — |
| | 300 |
| | 904 |
| | — |
| | 1,204 |
| | (173 | ) | | 6/27/2013 | | 1995 | |
| Hardee's | | Sparta | | NC | | — |
| | 372 |
| | 346 |
| | — |
| | 718 |
| | (68 | ) | | 6/27/2013 | | 1983 | |
| | | | | | Initial Costs (1) | | Costs Capitalized Subsequent to Acquisition (2) | | Gross Amount
Carried at
December 31, 2016
(3) (4) | | | | | | Initial Costs (1) | | Costs Capitalized Subsequent to Acquisition (2) | | Gross Amount
Carried at
December 31, 2018
(3) (4) | | | |
| Property | | City | | State | | Encumbrances at
December 31, 2016 | | Land | | Buildings, Fixtures and Improvements | | Accumulated Depreciation
(3) (5) | | Date Acquired | | Date of Construction | | City | | State | | Encumbrances at
December 31, 2018 | | Land | | Buildings, Fixtures and Improvements | | Accumulated Depreciation
(3) (5) | | Date Acquired | | Date of Construction |
| Hanesbrands | | | Rural Hall | | NC | | 17,990 |
| | 1,082 |
| | 22,565 |
| | (203 | ) | | 23,444 |
| | (7,997 | ) | | 12/21/2012 | | 1989 |
| Hardee's | | | Morrilton | | AR | | — |
| | 175 |
| | 937 |
| | — |
| | 1,112 |
| | (249 | ) | | 3/28/2014 | | 1986 |
| Hardee's | | | Jacksonville | | FL | | — |
| | 875 |
| | 583 |
| | — |
| | 1,458 |
| | (164 | ) | | 7/31/2013 | | 1993 |
| Hardee's | | | Pace | | FL | | — |
| | 419 |
| | 435 |
| | — |
| | 854 |
| | (129 | ) | | 6/27/2013 | | 1991 |
| Hardee's | | | Williston | | FL | | — |
| | 395 |
| | 553 |
| | — |
| | 948 |
| | (164 | ) | | 6/27/2013 | | 1992 |
| Hardee's | | | Bremen | | GA | | — |
| | 129 |
| | 518 |
| | — |
| | 647 |
| | (145 | ) | | 7/31/2013 | | 1980 |
| Hardee's | | | Canton | | GA | | — |
| | 488 |
| | 539 |
| | — |
| | 1,027 |
| | (160 | ) | | 6/27/2013 | | 1983 |
| Hardee's | | | Mount Vernon | | IA | | — |
| | 320 |
| | 480 |
| | (6 | ) | | 794 |
| | (142 | ) | | 6/27/2013 | | 1987 |
| Hardee's | | | Old Fort | | NC | | — |
| | 300 |
| | 904 |
| | — |
| | 1,204 |
| | (265 | ) | | 6/27/2013 | | 1995 |
| Hardee's | | | Sparta | | NC | | — |
| | 372 |
| | 346 |
| | — |
| | 718 |
| | (103 | ) | | 6/27/2013 | | 1983 |
| Hardee's | | Akron | | OH | | — |
| | 207 |
| | 483 |
| | — |
| | 690 |
| | (88 | ) | | 7/31/2013 | | 1990 | | Akron | | OH | | — |
| | 207 |
| | 483 |
| | — |
| | 690 |
| | (135 | ) | | 7/31/2013 | | 1990 |
| Hardee's | | Jefferson | | OH | | — |
| | 242 |
| | 363 |
| | — |
| | 605 |
| | (66 | ) | | 7/31/2013 | | 1989 | | Jefferson | | OH | | — |
| | 242 |
| | 363 |
| | — |
| | 605 |
| | (102 | ) | | 7/31/2013 | | 1989 |
| Hardee's | | Minerva | | OH | | — |
| | 214 |
| | 321 |
| | — |
| | 535 |
| | (59 | ) | | 7/31/2013 | | 1990 | | Minerva | | OH | | — |
| | 214 |
| | 321 |
| | — |
| | 535 |
| | (90 | ) | | 7/31/2013 | | 1990 |
| Hardee's | | Seville | | OH | | — |
| | 151 |
| | 454 |
| | — |
| | 605 |
| | (83 | ) | | 7/31/2013 | | 1989 | | Seville | | OH | | — |
| | 151 |
| | 454 |
| | — |
| | 605 |
| | (127 | ) | | 7/31/2013 | | 1989 |
| Hardee's | | Aiken | | SC | | — |
| | 220 |
| | 450 |
| | — |
| | 670 |
| | (86 | ) | | 6/27/2013 | | 1995 | | Aiken | | SC | | — |
| | 220 |
| | 450 |
| | — |
| | 670 |
| | (132 | ) | | 6/27/2013 | | 1995 |
| Hardee's | | Chapin | | SC | | — |
| | 380 |
| | 741 |
| | — |
| | 1,121 |
| | (142 | ) | | 6/27/2013 | | 1995 | | Chapin | | SC | | — |
| | 380 |
| | 741 |
| | — |
| | 1,121 |
| | (217 | ) | | 6/27/2013 | | 1995 |
| Hardee's | | Chester | | SC | | — |
| | 586 |
| | 563 |
| | — |
| | 1,149 |
| | (75 | ) | | 7/31/2013 | | 1994 | | Chester | | SC | | — |
| | 586 |
| | 563 |
| | — |
| | 1,149 |
| | (133 | ) | | 7/31/2013 | | 1994 |
| Hardee's | | Bloomingdale | | TN | | — |
| | 270 |
| | 844 |
| | — |
| | 1,114 |
| | (162 | ) | | 6/27/2013 | | 1995 | | Bloomingdale | | TN | | — |
| | 270 |
| | 844 |
| | — |
| | 1,114 |
| | (247 | ) | | 6/27/2013 | | 1995 |
| Hardee's | | Clinton | | TN | | — |
| | 390 |
| | 893 |
| | — |
| | 1,283 |
| | (171 | ) | | 6/27/2013 | | 1995 | | Clinton | | TN | | — |
| | 390 |
| | 893 |
| | — |
| | 1,283 |
| | (262 | ) | | 6/27/2013 | | 1995 |
| Hardee's | | Crossville | | TN | | — |
| | 300 |
| | 689 |
| | — |
| | 989 |
| | (132 | ) | | 6/27/2013 | | 1995 | | Crossville | | TN | | — |
| | 300 |
| | 689 |
| | — |
| | 989 |
| | (202 | ) | | 6/27/2013 | | 1995 |
| Hardee's | | Erwin | | TN | | — |
| | 346 |
| | 406 |
| | — |
| | 752 |
| | (80 | ) | | 6/27/2013 | | 1982 | | Erwin | | TN | | — |
| | 346 |
| | 406 |
| | — |
| | 752 |
| | (120 | ) | | 6/27/2013 | | 1982 |
| Hardee's | | Morristown | | TN | | — |
| | 353 |
| | 431 |
| | — |
| | 784 |
| | (79 | ) | | 7/31/2013 | | 1991 | | Morristown | | TN | | — |
| | 353 |
| | 431 |
| | — |
| | 784 |
| | (121 | ) | | 7/31/2013 | | 1991 |
| Hardee's | | Springfield | | TN | | — |
| | 343 |
| | 515 |
| | — |
| | 858 |
| | (94 | ) | | 7/31/2013 | | 1990 | | Springfield | | TN | | — |
| | 343 |
| | 515 |
| | — |
| | 858 |
| | (145 | ) | | 7/31/2013 | | 1990 |
| Hardee's / Red Burrito | | Attalla | | AL | | — |
| | 220 |
| | 896 |
| | — |
| | 1,116 |
| | (172 | ) | | 6/27/2013 | | 1995 | | Attalla | | AL | | — |
| | 220 |
| | 896 |
| | — |
| | 1,116 |
| | (263 | ) | | 6/27/2013 | | 1995 |
| Harley Davidson | | Round Rock | | TX | | — |
| | 1,688 |
| | 9,563 |
| | — |
| | 11,251 |
| | (1,968 | ) | | 7/31/2013 | | 2008 | | Round Rock | | TX | | — |
| | 1,688 |
| | 9,563 |
| | — |
| | 11,251 |
| | (2,983 | ) | | 7/31/2013 | | 2008 |
| Harps Grocery | | Cabot | | AR | | — |
| | 270 |
| | 4,664 |
| | — |
| | 4,934 |
| | (734 | ) | | 2/7/2014 | | 2014 | | Cabot | | AR | | — |
| | 270 |
| | 4,664 |
| | — |
| | 4,934 |
| | (1,244 | ) | | 2/7/2014 | | 2014 |
| Harps Grocery | | Haskell | | AR | | — |
| | 499 |
| | 3,281 |
| | — |
| | 3,780 |
| | (508 | ) | | 2/7/2014 | | 2012 | | Haskell | | AR | | — |
| | 499 |
| | 3,281 |
| | — |
| | 3,780 |
| | (862 | ) | | 2/7/2014 | | 2012 |
| Harps Grocery | | Hot Springs | | AR | | — |
| | 592 |
| | 4,353 |
| | — |
| | 4,945 |
| | (670 | ) | | 2/7/2014 | | 2013 | | Hot Springs | | AR | | — |
| | 592 |
| | 4,353 |
| | — |
| | 4,945 |
| | (1,137 | ) | | 2/7/2014 | | 2013 |
| Harps Grocery | | Hot Springs | | AR | | — |
| | 839 |
| | 4,486 |
| | — |
| | 5,325 |
| | (658 | ) | | 2/7/2014 | | 2013 | | Hot Springs | | AR | | — |
| | 839 |
| | 4,486 |
| | (6 | ) | | 5,319 |
| | (1,116 | ) | | 2/7/2014 | | 2013 |
| Harps Grocery | | Searcy | | AR | | — |
| | 705 |
| | 4,159 |
| | — |
| | 4,864 |
| | (620 | ) | | 2/7/2014 | | 2008 | | Searcy | | AR | | — |
| | 705 |
| | 4,159 |
| | — |
| | 4,864 |
| | (1,051 | ) | | 2/7/2014 | | 2008 |
| Harps Grocery | | West Fork | | AR | | — |
| | 635 |
| | 4,708 |
| | — |
| | 5,343 |
| | (705 | ) | | 2/7/2014 | | 2013 | | West Fork | | AR | | — |
| | 635 |
| | 4,708 |
| | — |
| | 5,343 |
| | (1,196 | ) | | 2/7/2014 | | 2013 |
| Harps Grocery | | Poplar Bluff | | MO | | — |
| | 572 |
| | 2,991 |
| | 4 |
| | 3,567 |
| | (215 | ) | | 2/21/2014 | | 2014 | | Poplar Bluff | | MO | | — |
| | 572 |
| | 2,991 |
| | 4 |
| | 3,567 |
| | (365 | ) | | 2/21/2014 | | 2014 |
| Harps Grocery | | Inola | | OK | | — |
| | 130 |
| | 3,387 |
| | — |
| | 3,517 |
| | (500 | ) | | 3/5/2014 | | 2014 | |
| Harris Teeter | | Durham | | NC | | 1,910 |
| | 3,239 |
| | — |
| | — |
| | 3,239 |
| | — |
| | 2/7/2014 | | 2009 | |
| Hartford Insurance | | Santee | | CA | | — |
| | 2,400 |
| | 7,312 |
| | 44 |
| | 9,756 |
| | (1,556 | ) | | 2/21/2014 | | 1995 | |
| Healthnow | | Buffalo | | NY | | 42,135 |
| | 2,569 |
| | 89,399 |
| | — |
| | 91,968 |
| | (10,292 | ) | | 2/7/2014 | | 2007 | |
| Heritage Cove Center | | Gun Barrel City | | TX | | — |
| | 241 |
| | 383 |
| | — |
| | 624 |
| | (75 | ) | | 6/27/2013 | | 2008 | |
| HH Gregg | | Joliet | | IL | | — |
| | 1,834 |
| | 1,585 |
| | — |
| | 3,419 |
| | (308 | ) | | 2/7/2014 | | 2011 | |
| HH Gregg | | Merrillville | | IN | | — |
| | 511 |
| | 4,768 |
| | — |
| | 5,279 |
| | (773 | ) | | 2/7/2014 | | 2011 | |
| HH Gregg | | Chesterfield | | MO | | — |
| | 1,537 |
| | 4,123 |
| | — |
| | 5,660 |
| | (671 | ) | | 2/7/2014 | | 2012 | |
| HH Gregg | | North Fayette | | PA | | — |
| | 1,990 |
| | 2,700 |
| | — |
| | 4,690 |
| | (387 | ) | | 2/7/2014 | | 1999 | |
| HH Gregg | | North Charleston | | SC | | — |
| | 2,193 |
| | 4,636 |
| | — |
| | 6,829 |
| | (761 | ) | | 2/7/2014 | | 2008 | |
| | | | | | Initial Costs (1) | | Costs Capitalized Subsequent to Acquisition (2) | | Gross Amount
Carried at
December 31, 2016
(3) (4) | | | | | | Initial Costs (1) | | Costs Capitalized Subsequent to Acquisition (2) | | Gross Amount
Carried at
December 31, 2018
(3) (4) | | | |
| Property | | City | | State | | Encumbrances at
December 31, 2016 | | Land | | Buildings, Fixtures and Improvements | | Accumulated Depreciation
(3) (5) | | Date Acquired | | Date of Construction | | City | | State | | Encumbrances at
December 31, 2018 | | Land | | Buildings, Fixtures and Improvements | | Accumulated Depreciation
(3) (5) | | Date Acquired | | Date of Construction |
| Harps Grocery | | | Inola | | OK | | — |
| | 130 |
| | 3,387 |
| | — |
| | 3,517 |
| | (859 | ) | | 3/5/2014 | | 2014 |
| Harris Teeter | | | Durham | | NC | | 1,910 |
| | 3,239 |
| | — |
| | — |
| | 3,239 |
| | — |
| | 2/7/2014 | | 2009 |
| HD Supply | | | Santee | | CA | | — |
| | 2,400 |
| | 7,312 |
| | 430 |
| | 10,142 |
| | (2,262 | ) | | 2/21/2014 | | 1995 |
| Healthnow | | | Buffalo | | NY | | 40,953 |
| | 2,569 |
| | 89,399 |
| | — |
| | 91,968 |
| | (17,452 | ) | | 2/7/2014 | | 2007 |
| Helmer Scientific | | | Noblesville | | IN | | — |
| | 1,431 |
| | 10,699 |
| | — |
| | 12,130 |
| | (428 | ) | | 7/27/2017 | | 2012 |
| Hobby Lobby | | Avon | | IN | | — |
| | 1,439 |
| | 5,855 |
| | — |
| | 7,294 |
| | (838 | ) | | 2/7/2014 | | 2007 | | Algonquin | | IL | | — |
| | 998 |
| | 4,580 |
| | — |
| | 5,578 |
| | (217 | ) | | 6/23/2017 | | 2012 |
| Hobby Lobby | | Kannapolis | | NC | | — |
| | 1,929 |
| | 4,227 |
| | — |
| | 6,156 |
| | (630 | ) | | 2/7/2014 | | 2004 | | Avon | | IN | | — |
| | 1,439 |
| | 5,855 |
| | — |
| | 7,294 |
| | (1,421 | ) | | 2/7/2014 | | 2007 |
| Hobby Lobby | | Columbia | | TN | | — |
| | 951 |
| | 2,467 |
| | 38 |
| | 3,456 |
| | (417 | ) | | 2/26/2014 | | 1986 | | Auburn | | ME | | — |
| | 2,606 |
| | 3,566 |
| | — |
| | 6,172 |
| | (83 | ) | | 3/7/2018 | | 2014 |
| Hobby Lobby | | Logan | | UT | | — |
| | 2,683 |
| | 3,079 |
| | — |
| | 5,762 |
| | (498 | ) | | 2/7/2014 | | 2008 | | Kannapolis | | NC | | — |
| | 1,929 |
| | 4,227 |
| | — |
| | 6,156 |
| | (1,068 | ) | | 2/7/2014 | | 2004 |
| Hobby Lobby | | | Columbia | | TN | | — |
| | 951 |
| | 2,467 |
| | 38 |
| | 3,456 |
| | (710 | ) | | 2/26/2014 | | 1986 |
| Hobby Lobby | | | Logan | | UT | | — |
| | 2,683 |
| | 3,079 |
| | — |
| | 5,762 |
| | (845 | ) | | 2/7/2014 | | 2008 |
| Hobby Lobby & Big Lots | | | Foley | | AL | | — |
| | 1,770 |
| | 6,842 |
| | — |
| | 8,612 |
| | (123 | ) | | 5/24/2018 | | 2014 |
| Home Depot | | Tucson | | AZ | | — |
| | 6,251 |
| | — |
| | — |
| | 6,251 |
| | — |
| | 2/7/2014 | | 2005 | | Tucson | | AZ | | — |
| | 6,251 |
| | — |
| | — |
| | 6,251 |
| | — |
| | 2/7/2014 | | 2005 |
| Home Depot | | San Diego | | CA | | 6,650 |
| | 12,518 |
| | — |
| | — |
| | 12,518 |
| | — |
| | 2/7/2014 | | 1998 | | San Diego | | CA | | 6,650 |
| | 12,518 |
| | — |
| | — |
| | 12,518 |
| | — |
| | 2/7/2014 | | 1998 |
| Home Depot | | Evans | | GA | | — |
| | 4,583 |
| | — |
| | — |
| | 4,583 |
| | — |
| | 2/7/2014 | | 2009 | | Evans | | GA | | — |
| | 4,583 |
| | — |
| | — |
| | 4,583 |
| | — |
| | 2/7/2014 | | 2009 |
| Home Depot | | Kennesaw | | GA | | — |
| | 1,809 |
| | 12,331 |
| | — |
| | 14,140 |
| | (1,634 | ) | | 2/7/2014 | | 2012 | | Kennesaw | | GA | | — |
| | 1,809 |
| | 12,331 |
| | 1 |
| | 14,141 |
| | (2,771 | ) | | 2/7/2014 | | 2012 |
| Home Depot | | Slidell | | LA | | 1,996 |
| | 5,131 |
| | — |
| | — |
| | 5,131 |
| | — |
| | 2/7/2014 | | 1998 | | Slidell | | LA | | 1,996 |
| | 5,131 |
| | — |
| | — |
| | 5,131 |
| | — |
| | 2/7/2014 | | 1998 |
| Home Depot | | Las Vegas | | NV | | — |
| | 7,907 |
| | — |
| | — |
| | 7,907 |
| | — |
| | 2/7/2014 | | 1998 | | Las Vegas | | NV | | — |
| | 7,907 |
| | — |
| | — |
| | 7,907 |
| | — |
| | 2/7/2014 | | 1998 |
| Home Depot | | Columbia | | SC | | — |
| | 2,911 |
| | 15,463 |
| | — |
| | 18,374 |
| | (4,658 | ) | | 11/9/2009 | | 2009 | | Columbia | | SC | | — |
| | 2,911 |
| | 15,463 |
| | — |
| | 18,374 |
| | (5,315 | ) | | 11/9/2009 | | 2009 |
| Home Depot | | Odessa | | TX | | — |
| | 1,599 |
| | — |
| | — |
| | 1,599 |
| | — |
| | 2/7/2014 | | 1998 | | Odessa | | TX | | — |
| | 1,599 |
| | — |
| | — |
| | 1,599 |
| | — |
| | 2/7/2014 | | 1998 |
| Home Depot | | Winchester | | VA | | — |
| | 3,955 |
| | 18,405 |
| | 1 |
| | 22,361 |
| | (3,119 | ) | | 2/7/2014 | | 2008 | | Winchester | | VA | | — |
| | 3,955 |
| | 18,405 |
| | 1,136 |
| | 23,496 |
| | (6,424 | ) | | 2/7/2014 | | 2008 |
| Home Town Buffet | | Oxnard | | CA | | — |
| | 195 |
| | 1,044 |
| | (901 | ) | | 338 |
| | (21 | ) | | 1/8/2014 | | 1998 | | Rialto | | CA | | — |
| | 265 |
| | 1,261 |
| | (1,046 | ) | | 480 |
| | (170 | ) | | 1/8/2014 | | 1998 |
| Home Town Buffet | | Rialto | | CA | | — |
| | 265 |
| | 1,261 |
| | (1,046 | ) | | 480 |
| | (46 | ) | | 1/8/2014 | | 1998 | | Santa Maria | | CA | | — |
| | 191 |
| | 1,006 |
| | (763 | ) | | 434 |
| | (86 | ) | | 1/8/2014 | | 2002 |
| Home Town Buffet | | Santa Maria | | CA | | — |
| | 191 |
| | 1,006 |
| | (763 | ) | | 434 |
| | (23 | ) | | 1/8/2014 | | 2002 | | Newark | | DE | | — |
| | 177 |
| | 1,129 |
| | (739 | ) | | 567 |
| | (150 | ) | | 1/8/2014 | | 1983 |
| Home Town Buffet | | Newark | | DE | | — |
| | 177 |
| | 1,129 |
| | (739 | ) | | 567 |
| | (41 | ) | | 1/8/2014 | | 1983 | | Union Gap | | WA | | — |
| | 253 |
| | 1,320 |
| | (1,223 | ) | | 350 |
| | (117 | ) | | 1/8/2014 | | 2002 |
| Home Town Buffet | | Union Gap | | WA | | — |
| | 253 |
| | 1,320 |
| | (1,223 | ) | | 350 |
| | (32 | ) | | 1/8/2014 | | 2002 | |
| Hooters | | | Grand Prairie | | TX | | — |
| | 997 |
| | 2,327 |
| | 250 |
| | 3,574 |
| | (731 | ) | | 7/31/2013 | | 2001 |
| Houghton Town Center | | | Tucson | | AZ | | — |
| | 1,176 |
| | 8,565 |
| | — |
| | 9,741 |
| | (318 | ) | | 12/28/2017 | | 2017 |
| Huntington National Bank | | Conneaut | | OH | | — |
| | 205 |
| | 477 |
| | 6 |
| | 688 |
| | (83 | ) | | 10/1/2013 | | 1971 | | Conneaut | | OH | | — |
| | 205 |
| | 477 |
| | 6 |
| | 688 |
| | (131 | ) | | 10/1/2013 | | 1971 |
| Huntington National Bank | | Jefferson | | OH | | — |
| | 255 |
| | 765 |
| | 7 |
| | 1,027 |
| | (132 | ) | | 10/1/2013 | | 1963 | | Jefferson | | OH | | — |
| | 255 |
| | 765 |
| | 7 |
| | 1,027 |
| | (210 | ) | | 10/1/2013 | | 1963 |
| Hy-Vee | | Vermillion | | SD | | 2,922 |
| | 409 |
| | 3,684 |
| | — |
| | 4,093 |
| | (960 | ) | | 4/8/2013 | | 1986 | | Vermillion | | SD | | 2,922 |
| | 409 |
| | 3,684 |
| | — |
| | 4,093 |
| | (1,357 | ) | | 4/8/2013 | | 1986 |
| IFM Efectors | | Malvern | | PA | | — |
| | 1,816 |
| | — |
| | 9,747 |
| | 11,563 |
| | (498 | ) | | 8/27/2014 | | 2014 | | Malvern | | PA | | — |
| | 1,816 |
| | — |
| | 9,747 |
| | 11,563 |
| | (1,181 | ) | | 8/27/2014 | | 2014 |
| Igloo | | Katy | | TX | | — |
| | 5,617 |
| | 38,470 |
| | — |
| | 44,087 |
| | (5,110 | ) | | 2/7/2014 | | 2004 | | Katy | | TX | | — |
| | 5,617 |
| | 38,470 |
| | — |
| | 44,087 |
| | (8,666 | ) | | 2/7/2014 | | 2004 |
| IHOP | | Auburn | | AL | | — |
| | 1,111 |
| | 933 |
| | — |
| | 2,044 |
| | (190 | ) | | 6/27/2013 | | 1998 | |
| IHOP | | Homewood | | AL | | — |
| | 610 |
| | 1,762 |
| | — |
| | 2,372 |
| | (349 | ) | | 6/27/2013 | | 1995 | |
| IHOP | | Montgomery | | AL | | — |
| | 941 |
| | — |
| | — |
| | 941 |
| | — |
| | 6/27/2013 | | 1998 | |
| IHOP | | Castle Rock | | CO | | — |
| | 320 |
| | 2,334 |
| | — |
| | 2,654 |
| | (463 | ) | | 6/27/2013 | | 1995 | |
| IHOP | | Greeley | | CO | | — |
| | 120 |
| | 1,538 |
| | — |
| | 1,658 |
| | (305 | ) | | 6/27/2013 | | 1995 | |
| IHOP | | Pueblo | | CO | | — |
| | 330 |
| | 1,589 |
| | — |
| | 1,919 |
| | (315 | ) | | 6/27/2013 | | 1995 | |
| IHOP | | Bossier City | | LA | | — |
| | 541 |
| | 1,342 |
| | — |
| | 1,883 |
| | (272 | ) | | 6/27/2013 | | 1998 | |
| IHOP | | Natchitoches | | LA | | — |
| | 750 |
| | 89 |
| | — |
| | 839 |
| | (18 | ) | | 6/27/2013 | | 1995 | |
| IHOP | | Roseville | | MI | | — |
| | 340 |
| | 1,071 |
| | — |
| | 1,411 |
| | (212 | ) | | 6/27/2013 | | 1995 | |
| | | | | | Initial Costs (1) | | Costs Capitalized Subsequent to Acquisition (2) | | Gross Amount
Carried at
December 31, 2016
(3) (4) | | | | | | Initial Costs (1) | | Costs Capitalized Subsequent to Acquisition (2) | | Gross Amount
Carried at
December 31, 2018
(3) (4) | | | |
| Property | | City | | State | | Encumbrances at
December 31, 2016 | | Land | | Buildings, Fixtures and Improvements | | Accumulated Depreciation
(3) (5) | | Date Acquired | | Date of Construction | | City | | State | | Encumbrances at
December 31, 2018 | | Land | | Buildings, Fixtures and Improvements | | Accumulated Depreciation
(3) (5) | | Date Acquired | | Date of Construction |
| IHOP | | Warren | | MI | | — |
| | 605 |
| | 830 |
| | (531 | ) | | 904 |
| | (25 | ) | | 6/27/2013 | | 1996 | | Auburn | | AL | | — |
| | 1,111 |
| | 933 |
| | — |
| | 2,044 |
| | (283 | ) | | 6/27/2013 | | 1998 |
| IHOP | | Kansas City | | MO | | — |
| | 630 |
| | 1,002 |
| | — |
| | 1,632 |
| | (199 | ) | | 6/27/2013 | | 1995 | | Homewood | | AL | | — |
| | 610 |
| | 1,762 |
| | — |
| | 2,372 |
| | (530 | ) | | 6/27/2013 | | 1995 |
| IHOP | | Southaven | | MS | | — |
| | 350 |
| | 2,108 |
| | — |
| | 2,458 |
| | (418 | ) | | 6/27/2013 | | 1995 | | Montgomery | | AL | | — |
| | 941 |
| | — |
| | (772 | ) | | 169 |
| | — |
| | 6/27/2013 | | 1998 |
| IHOP | | Greenville | | SC | | — |
| | 610 |
| | 1,551 |
| | — |
| | 2,161 |
| | (308 | ) | | 6/27/2013 | | 1995 | | Castle Rock | | CO | | — |
| | 320 |
| | 2,334 |
| | — |
| | 2,654 |
| | (703 | ) | | 6/27/2013 | | 1995 |
| IHOP | | Clarksville | | TN | | — |
| | 530 |
| | 1,346 |
| | — |
| | 1,876 |
| | (267 | ) | | 6/27/2013 | | 1995 | | Greeley | | CO | | — |
| | 120 |
| | 1,538 |
| | — |
| | 1,658 |
| | (463 | ) | | 6/27/2013 | | 1995 |
| IHOP | | Memphis | | TN | | — |
| | 750 |
| | 2,009 |
| | (809 | ) | | 1,950 |
| | (134 | ) | | 6/27/2013 | | 1995 | | Loveland | | CO | | — |
| | 181 |
| | 1,534 |
| | — |
| | 1,715 |
| | (113 | ) | | 6/27/2013 | | 1995 |
| IHOP | | Murfreesboro | | TN | | — |
| | 600 |
| | 1,687 |
| | — |
| | 2,287 |
| | (334 | ) | | 6/27/2013 | | 1995 | | Pueblo | | CO | | — |
| | 330 |
| | 1,589 |
| | — |
| | 1,919 |
| | (478 | ) | | 6/27/2013 | | 1995 |
| IHOP | | Baytown | | TX | | — |
| | 698 |
| | 1,297 |
| | — |
| | 1,995 |
| | (237 | ) | | 7/31/2013 | | 1998 | | Bossier City | | LA | | — |
| | 541 |
| | 1,342 |
| | — |
| | 1,883 |
| | (407 | ) | | 6/27/2013 | | 1998 |
| IHOP | | Corpus Christi | | TX | | — |
| | 1,176 |
| | — |
| | — |
| | 1,176 |
| | — |
| | 7/31/2013 | | 1995 | | Natchitoches | | LA | | — |
| | 750 |
| | 89 |
| | — |
| | 839 |
| | (27 | ) | | 6/27/2013 | | 1995 |
| IHOP | | Fort Worth | | TX | | — |
| | 560 |
| | 1,879 |
| | — |
| | 2,439 |
| | (373 | ) | | 6/27/2013 | | 1995 | | Roseville | | MI | | — |
| | 340 |
| | 1,071 |
| | 125 |
| | 1,536 |
| | (330 | ) | | 6/27/2013 | | 1995 |
| IHOP | | Houston | | TX | | — |
| | 760 |
| | 2,462 |
| | — |
| | 3,222 |
| | (488 | ) | | 6/27/2013 | | 1995 | | Kansas City | | MO | | — |
| | 630 |
| | 1,002 |
| | — |
| | 1,632 |
| | (302 | ) | | 6/27/2013 | | 1995 |
| IHOP | | Killeen | | TX | | — |
| | 380 |
| | 1,028 |
| | — |
| | 1,408 |
| | (204 | ) | | 6/27/2013 | | 1995 | | Southaven | | MS | | — |
| | 350 |
| | 2,108 |
| | — |
| | 2,458 |
| | (635 | ) | | 6/27/2013 | | 1995 |
| IHOP | | Lake Jackson | | TX | | — |
| | 370 |
| | 2,018 |
| | — |
| | 2,388 |
| | (400 | ) | | 6/27/2013 | | 1995 | | Greenville | | SC | | — |
| | 610 |
| | 1,551 |
| | — |
| | 2,161 |
| | (467 | ) | | 6/27/2013 | | 1995 |
| IHOP | | Leon Valley | | TX | | — |
| | 650 |
| | 2,055 |
| | — |
| | 2,705 |
| | (516 | ) | | 6/27/2013 | | 1995 | | Clarksville | | TN | | — |
| | 530 |
| | 1,346 |
| | — |
| | 1,876 |
| | (405 | ) | | 6/27/2013 | | 1995 |
| IHOP | | Auburn | | WA | | — |
| | 780 |
| | 1,878 |
| | — |
| | 2,658 |
| | (372 | ) | | 6/27/2013 | | 1995 | | Murfreesboro | | TN | | — |
| | 600 |
| | 1,687 |
| | — |
| | 2,287 |
| | (508 | ) | | 6/27/2013 | | 1995 |
| IHOP | | | Baytown | | TX | | — |
| | 698 |
| | 1,297 |
| | — |
| | 1,995 |
| | (364 | ) | | 7/31/2013 | | 1998 |
| IHOP | | | Corpus Christi | | TX | | — |
| | 1,176 |
| | — |
| | — |
| | 1,176 |
| | — |
| | 7/31/2013 | | 1995 |
| IHOP | | | Fort Worth | | TX | | — |
| | 560 |
| | 1,879 |
| | — |
| | 2,439 |
| | (566 | ) | | 6/27/2013 | | 1995 |
| IHOP | | | Houston | | TX | | — |
| | 760 |
| | 2,462 |
| | — |
| | 3,222 |
| | (741 | ) | | 6/27/2013 | | 1995 |
| IHOP | | | Killeen | | TX | | — |
| | 380 |
| | 1,028 |
| | — |
| | 1,408 |
| | (309 | ) | | 6/27/2013 | | 1995 |
| IHOP | | | Lake Jackson | | TX | | — |
| | 370 |
| | 2,018 |
| | — |
| | 2,388 |
| | (608 | ) | | 6/27/2013 | | 1995 |
| IHOP | | | Leon Valley | | TX | | — |
| | 650 |
| | 2,055 |
| | — |
| | 2,705 |
| | (789 | ) | | 6/27/2013 | | 1995 |
| IHOP | | | Auburn | | WA | | — |
| | 780 |
| | 1,878 |
| | — |
| | 2,658 |
| | (565 | ) | | 6/27/2013 | | 1995 |
| Inform Diagnostics | | | Irving | | TX | | — |
| | 3,237 |
| | 37,297 |
| | 341 |
| | 40,875 |
| | (9,055 | ) | | 4/28/2014 | | 1997 |
| Ingersoll Rand | | Annandale | | NJ | | — |
| | 1,367 |
| | 14,223 |
| | (90 | ) | | 15,500 |
| | (3,827 | ) | | 4/30/2014 | | 1999 | | Annandale | | NJ | | — |
| | 1,367 |
| | 14,223 |
| | (90 | ) | | 15,500 |
| | (6,672 | ) | | 4/30/2014 | | 1999 |
| Ingram Micro | | Amherst | | NY | | — |
| | 4,107 |
| | 20,347 |
| | — |
| | 24,454 |
| | (2,919 | ) | | 6/25/2014 | | 1986 | | Amherst | | NY | | — |
| | 4,107 |
| | 20,347 |
| | — |
| | 24,454 |
| | (5,216 | ) | | 6/25/2014 | | 1986 |
| Invensys Systems | | Foxboro | | MA | | — |
| | 11,784 |
| | — |
| | 27,888 |
| | 39,672 |
| | (2,125 | ) | | 6/27/2014 | | 1965 | |
| Insurance Auto Auctions | | | Hudson | | FL | | — |
| | 1,062 |
| | 11,203 |
| | — |
| | 12,265 |
| | (141 | ) | | 10/9/2018 | | 2018 |
| Iron Mountain | | Columbus | | OH | | — |
| | 405 |
| | 3,642 |
| | 1,261 |
| | 5,308 |
| | (989 | ) | | 9/28/2012 | | 1954 | | Columbus | | OH | | — |
| | 405 |
| | 3,642 |
| | 1,263 |
| | 5,310 |
| | (1,384 | ) | | 9/28/2012 | | 1954 |
| Iron Mountain | | Mohnton | | PA | | — |
| | 197 |
| | 6,152 |
| | — |
| | 6,349 |
| | (733 | ) | | 7/2/2014 | | 1979 | | Mohnton | | PA | | — |
| | 197 |
| | 6,152 |
| | — |
| | 6,349 |
| | (1,330 | ) | | 7/2/2014 | | 1979 |
| IRS Gateway Center | | Covington | | KY | | — |
| | 3,120 |
| | 80,689 |
| | 1,278 |
| | 85,087 |
| | (8,653 | ) | | 6/5/2014 | | 1994 | | Covington | | KY | | — |
| | 3,120 |
| | 80,689 |
| | 1,582 |
| | 85,391 |
| | (15,546 | ) | | 6/5/2014 | | 1994 |
| Irving Oil | | Belfast | | ME | | — |
| | 339 |
| | 698 |
| | — |
| | 1,037 |
| | (126 | ) | | 2/7/2014 | | 1997 | | Belfast | | ME | | — |
| | 339 |
| | 698 |
| | — |
| | 1,037 |
| | (213 | ) | | 2/7/2014 | | 1997 |
| Irving Oil | | Bethel | | ME | | — |
| | 182 |
| | 331 |
| | — |
| | 513 |
| | (62 | ) | | 2/7/2014 | | 1990 | | Bethel | | ME | | — |
| | 182 |
| | 331 |
| | — |
| | 513 |
| | (105 | ) | | 2/7/2014 | | 1990 |
| Irving Oil | | Boothbay Harbor | | ME | | — |
| | 413 |
| | 550 |
| | — |
| | 963 |
| | (106 | ) | | 2/7/2014 | | 1993 | |
| Irving Oil | | Caribou | | ME | | — |
| | 187 |
| | 404 |
| | — |
| | 591 |
| | (72 | ) | | 2/7/2014 | | 1990 | |
| Irving Oil | | Fort Kent | | ME | | — |
| | 358 |
| | 352 |
| | — |
| | 710 |
| | (74 | ) | | 2/7/2014 | | 1973 | |
| Irving Oil | | Kennebunk | | ME | | — |
| | 469 |
| | 541 |
| | — |
| | 1,010 |
| | (108 | ) | | 2/7/2014 | | 1980 | |
| Irving Oil | | Lincoln | | ME | | — |
| | 360 |
| | 360 |
| | — |
| | 720 |
| | (67 | ) | | 2/7/2014 | | 1994 | |
| Irving Oil | | Orono | | ME | | — |
| | 228 |
| | 272 |
| | — |
| | 500 |
| | (49 | ) | | 2/7/2014 | | 1984 | |
| Irving Oil | | Saco | | ME | | — |
| | 619 |
| | 222 |
| | — |
| | 841 |
| | (58 | ) | | 2/7/2014 | | 1995 | |
| Irving Oil | | Skowhegan | | ME | | — |
| | 541 |
| | 492 |
| | — |
| | 1,033 |
| | (100 | ) | | 2/7/2014 | | 1988 | |
| Irving Oil | | Conway | | NH | | — |
| | 173 |
| | 525 |
| | — |
| | 698 |
| | (88 | ) | | 2/7/2014 | | 2004 | |
| | | | | | Initial Costs (1) | | Costs Capitalized Subsequent to Acquisition (2) | | Gross Amount
Carried at
December 31, 2016
(3) (4) | | | | | | Initial Costs (1) | | Costs Capitalized Subsequent to Acquisition (2) | | Gross Amount
Carried at
December 31, 2018
(3) (4) | | | |
| Property | | City | | State | | Encumbrances at
December 31, 2016 | | Land | | Buildings, Fixtures and Improvements | | Accumulated Depreciation
(3) (5) | | Date Acquired | | Date of Construction | | City | | State | | Encumbrances at
December 31, 2018 | | Land | | Buildings, Fixtures and Improvements | | Accumulated Depreciation
(3) (5) | | Date Acquired | | Date of Construction |
| Irving Oil | | | Boothbay Harbor | | ME | | — |
| | 413 |
| | 550 |
| | — |
| | 963 |
| | (180 | ) | | 2/7/2014 | | 1993 |
| Irving Oil | | | Caribou | | ME | | — |
| | 187 |
| | 404 |
| | — |
| | 591 |
| | (121 | ) | | 2/7/2014 | | 1990 |
| Irving Oil | | | Fort Kent | | ME | | — |
| | 358 |
| | 352 |
| | — |
| | 710 |
| | (126 | ) | | 2/7/2014 | | 1973 |
| Irving Oil | | | Kennebunk | | ME | | — |
| | 469 |
| | 541 |
| | — |
| | 1,010 |
| | (184 | ) | | 2/7/2014 | | 1980 |
| Irving Oil | | | Lincoln | | ME | | — |
| | 360 |
| | 360 |
| | — |
| | 720 |
| | (114 | ) | | 2/7/2014 | | 1994 |
| Irving Oil | | | Orono | | ME | | — |
| | 228 |
| | 272 |
| | — |
| | 500 |
| | (84 | ) | | 2/7/2014 | | 1984 |
| Irving Oil | | | Saco | | ME | | — |
| | 619 |
| | 222 |
| | — |
| | 841 |
| | (98 | ) | | 2/7/2014 | | 1995 |
| Irving Oil | | | Skowhegan | | ME | | — |
| | 541 |
| | 492 |
| | — |
| | 1,033 |
| | (170 | ) | | 2/7/2014 | | 1988 |
| Irving Oil | | | Conway | | NH | | — |
| | 173 |
| | 525 |
| | — |
| | 698 |
| | (150 | ) | | 2/7/2014 | | 2004 |
| Irving Oil | | Dover | | NH | | — |
| | 380 |
| | 717 |
| | — |
| | 1,097 |
| | (126 | ) | | 2/7/2014 | | 1988 | | Dover | | NH | | — |
| | 380 |
| | 717 |
| | — |
| | 1,097 |
| | (213 | ) | | 2/7/2014 | | 1988 |
| Irving Oil | | Rochester | | NH | | — |
| | 290 |
| | 747 |
| | — |
| | 1,037 |
| | (127 | ) | | 2/7/2014 | | 1970 | | Rochester | | NH | | — |
| | 290 |
| | 747 |
| | — |
| | 1,037 |
| | (215 | ) | | 2/7/2014 | | 1970 |
| Irving Oil | | Dummerston | | VT | | — |
| | 185 |
| | 353 |
| | — |
| | 538 |
| | (71 | ) | | 2/7/2014 | | 1993 | | Dummerston | | VT | | — |
| | 185 |
| | 353 |
| | — |
| | 538 |
| | (120 | ) | | 2/7/2014 | | 1993 |
| Irving Oil | | Rutland | | VT | | — |
| | 249 |
| | 220 |
| | — |
| | 469 |
| | (40 | ) | | 2/7/2014 | | 1984 | | Rutland | | VT | | — |
| | 249 |
| | 220 |
| | — |
| | 469 |
| | (68 | ) | | 2/7/2014 | | 1984 |
| Irving Oil | | Westminster | | VT | | — |
| | 108 |
| | 437 |
| | — |
| | 545 |
| | (78 | ) | | 2/7/2014 | | 1990 | | Westminster | | VT | | — |
| | 108 |
| | 437 |
| | — |
| | 545 |
| | (131 | ) | | 2/7/2014 | | 1990 |
| Jack in the Box | | Avondale | | AZ | | — |
| | 110 |
| | 2,237 |
| | — |
| | 2,347 |
| | (429 | ) | | 6/27/2013 | | 1995 | | Avondale | | AZ | | — |
| | 110 |
| | 2,237 |
| | — |
| | 2,347 |
| | (656 | ) | | 6/27/2013 | | 1995 |
| Jack in the Box | | Chandler | | AZ | | — |
| | 450 |
| | 1,447 |
| | — |
| | 1,897 |
| | (277 | ) | | 6/27/2013 | | 1995 | | Chandler | | AZ | | — |
| | 450 |
| | 1,447 |
| | — |
| | 1,897 |
| | (425 | ) | | 6/27/2013 | | 1995 |
| Jack in the Box | | Folsom | | CA | | — |
| | 280 |
| | 2,423 |
| | — |
| | 2,703 |
| | (464 | ) | | 6/27/2013 | | 1995 | | Folsom | | CA | | — |
| | 280 |
| | 2,423 |
| | — |
| | 2,703 |
| | (711 | ) | | 6/27/2013 | | 1995 |
| Jack in the Box | | Sacramento | | CA | | — |
| | 476 |
| | 1,110 |
| | — |
| | 1,586 |
| | (203 | ) | | 7/31/2013 | | 1991 | | Sacramento | | CA | | — |
| | 476 |
| | 1,110 |
| | — |
| | 1,586 |
| | (312 | ) | | 7/31/2013 | | 1991 |
| Jack in the Box | | West Sacramento | | CA | | — |
| | 590 |
| | 1,710 |
| | — |
| | 2,300 |
| | (328 | ) | | 6/27/2013 | | 1995 | | West Sacramento | | CA | | — |
| | 590 |
| | 1,710 |
| | — |
| | 2,300 |
| | (502 | ) | | 6/27/2013 | | 1995 |
| Jack in the Box | | Burley | | ID | | — |
| | 240 |
| | 1,430 |
| | — |
| | 1,670 |
| | (274 | ) | | 6/27/2013 | | 1995 | | Burley | | ID | | — |
| | 240 |
| | 1,430 |
| | — |
| | 1,670 |
| | (420 | ) | | 6/27/2013 | | 1995 |
| Jack in the Box | | Belleville | | IL | | — |
| | 200 |
| | 966 |
| | — |
| | 1,166 |
| | (185 | ) | | 6/27/2013 | | 1995 | | Belleville | | IL | | — |
| | 200 |
| | 966 |
| | — |
| | 1,166 |
| | (283 | ) | | 6/27/2013 | | 1995 |
| Jack in the Box | | Florissant | | MO | | — |
| | 502 |
| | 1,515 |
| | — |
| | 2,017 |
| | (290 | ) | | 6/27/2013 | | 1995 | | Florissant | | MO | | — |
| | 502 |
| | 1,515 |
| | — |
| | 2,017 |
| | (444 | ) | | 6/27/2013 | | 1995 |
| Jack in the Box | | St. Louis | | MO | | — |
| | 420 |
| | 1,494 |
| | — |
| | 1,914 |
| | (286 | ) | | 6/27/2013 | | 1995 | | St. Louis | | MO | | — |
| | 420 |
| | 1,494 |
| | — |
| | 1,914 |
| | (438 | ) | | 6/27/2013 | | 1995 |
| Jack in the Box | | Salem | | OR | | — |
| | 580 |
| | 1,301 |
| | — |
| | 1,881 |
| | (249 | ) | | 6/27/2013 | | 1995 | | Salem | | OR | | — |
| | 580 |
| | 1,301 |
| | — |
| | 1,881 |
| | (382 | ) | | 6/27/2013 | | 1995 |
| Jack in the Box | | Tigard | | OR | | — |
| | 620 |
| | 1,361 |
| | — |
| | 1,981 |
| | (261 | ) | | 6/27/2013 | | 1995 | | Tigard | | OR | | — |
| | 620 |
| | 1,361 |
| | — |
| | 1,981 |
| | (399 | ) | | 6/27/2013 | | 1995 |
| Jack in the Box | | Arlington | | TX | | — |
| | 420 |
| | 1,325 |
| | — |
| | 1,745 |
| | (254 | ) | | 6/27/2013 | | 1995 | | Arlington | | TX | | — |
| | 420 |
| | 1,325 |
| | — |
| | 1,745 |
| | (389 | ) | | 6/27/2013 | | 1995 |
| Jack in the Box | | Arlington | | TX | | — |
| | 420 |
| | 1,365 |
| | — |
| | 1,785 |
| | (262 | ) | | 6/27/2013 | | 1995 | | Arlington | | TX | | — |
| | 420 |
| | 1,365 |
| | — |
| | 1,785 |
| | (400 | ) | | 6/27/2013 | | 1995 |
| Jack in the Box | | Cleburne | | TX | | — |
| | 291 |
| | 1,647 |
| | — |
| | 1,938 |
| | (300 | ) | | 7/31/2013 | | 2000 | | Cleburne | | TX | | — |
| | 291 |
| | 1,647 |
| | — |
| | 1,938 |
| | (462 | ) | | 7/31/2013 | | 2000 |
| Jack in the Box | | Corinth | | TX | | — |
| | 400 |
| | 1,416 |
| | — |
| | 1,816 |
| | (271 | ) | | 6/27/2013 | | 1995 | | Corinth | | TX | | — |
| | 400 |
| | 1,416 |
| | — |
| | 1,816 |
| | (415 | ) | | 6/27/2013 | | 1995 |
| Jack in the Box | | Farmers Branch | | TX | | — |
| | 460 |
| | 1,640 |
| | — |
| | 2,100 |
| | (314 | ) | | 6/27/2013 | | 1995 | | Farmers Branch | | TX | | — |
| | 460 |
| | 1,640 |
| | — |
| | 2,100 |
| | (481 | ) | | 6/27/2013 | | 1995 |
| Jack in the Box | | Fort Worth | | TX | | — |
| | 490 |
| | 1,702 |
| | — |
| | 2,192 |
| | (326 | ) | | 6/27/2013 | | 1995 | | Fort Worth | | TX | | — |
| | 490 |
| | 1,702 |
| | — |
| | 2,192 |
| | (499 | ) | | 6/27/2013 | | 1995 |
| Jack in the Box | | Georgetown | | TX | | — |
| | 600 |
| | 1,508 |
| | — |
| | 2,108 |
| | (289 | ) | | 6/27/2013 | | 1995 | | Georgetown | | TX | | — |
| | 600 |
| | 1,508 |
| | — |
| | 2,108 |
| | (442 | ) | | 6/27/2013 | | 1995 |
| Jack in the Box | | Granbury | | TX | | — |
| | 380 |
| | 1,449 |
| | — |
| | 1,829 |
| | (278 | ) | | 6/27/2013 | | 1995 | |
| Jack in the Box | | Grand Prairie | | TX | | — |
| | 600 |
| | 1,856 |
| | — |
| | 2,456 |
| | (356 | ) | | 6/27/2013 | | 1995 | |
| Jack in the Box | | Grapevine | | TX | | — |
| | 470 |
| | 1,344 |
| | — |
| | 1,814 |
| | (258 | ) | | 6/27/2013 | | 1995 | |
| Jack in the Box | | Gun Barrel City | | TX | | — |
| | 300 |
| | 961 |
| | — |
| | 1,261 |
| | (184 | ) | | 6/27/2013 | | 1995 | |
| Jack in the Box | | Houston | | TX | | — |
| | 460 |
| | 1,437 |
| | — |
| | 1,897 |
| | (275 | ) | | 6/27/2013 | | 1995 | |
| Jack in the Box | | Houston | | TX | | — |
| | 390 |
| | 1,172 |
| | — |
| | 1,562 |
| | (225 | ) | | 6/27/2013 | | 1995 | |
| Jack in the Box | | Houston | | TX | | — |
| | 330 |
| | 1,845 |
| | — |
| | 2,175 |
| | (354 | ) | | 6/27/2013 | | 1995 | |
| Jack in the Box | | Houston | | TX | | — |
| | 410 |
| | 1,621 |
| | — |
| | 2,031 |
| | (311 | ) | | 6/27/2013 | | 1995 | |
| Jack in the Box | | Houston | | TX | | — |
| | 450 |
| | 1,396 |
| | — |
| | 1,846 |
| | (268 | ) | | 6/27/2013 | | 1995 | |
|
| | | | | | | | | | | | | | | | | | | | | | | | | | |
| | | | | | | | Initial Costs (1) | | Costs Capitalized Subsequent to Acquisition (2) | | Gross Amount
Carried at
December 31, 2018
(3) (4) | | | | | | |
| Property | | City | | State | | Encumbrances at
December 31, 2018 | | Land | | Buildings, Fixtures and Improvements | | | Accumulated Depreciation
(3) (5) | | Date Acquired | | Date of Construction |
| Jack in the Box | | Granbury | | TX | | — |
| | 380 |
| | 1,449 |
| | — |
| | 1,829 |
| | (425 | ) | | 6/27/2013 | | 1995 |
| Jack in the Box | | Grand Prairie | | TX | | — |
| | 600 |
| | 1,856 |
| | — |
| | 2,456 |
| | (544 | ) | | 6/27/2013 | | 1995 |
| Jack in the Box | | Grapevine | | TX | | — |
| | 470 |
| | 1,344 |
| | — |
| | 1,814 |
| | (394 | ) | | 6/27/2013 | | 1995 |
| Jack in the Box | | Houston | | TX | | — |
| | 460 |
| | 1,437 |
| | — |
| | 1,897 |
| | (422 | ) | | 6/27/2013 | | 1995 |
| Jack in the Box | | Houston | | TX | | — |
| | 390 |
| | 1,172 |
| | — |
| | 1,562 |
| | (344 | ) | | 6/27/2013 | | 1995 |
| Jack in the Box | | Houston | | TX | | — |
| | 330 |
| | 1,845 |
| | — |
| | 2,175 |
| | (541 | ) | | 6/27/2013 | | 1995 |
| Jack in the Box | | Houston | | TX | | — |
| | 410 |
| | 1,621 |
| | — |
| | 2,031 |
| | (475 | ) | | 6/27/2013 | | 1995 |
| Jack in the Box | | Houston | | TX | | — |
| | 450 |
| | 1,396 |
| | — |
| | 1,846 |
| | (409 | ) | | 6/27/2013 | | 1995 |
| | | | | | Initial Costs (1) | | Costs Capitalized Subsequent to Acquisition (2) | | Gross Amount
Carried at
December 31, 2016
(3) (4) | | | | | | Initial Costs (1) | | Costs Capitalized Subsequent to Acquisition (2) | | Gross Amount
Carried at
December 31, 2018
(3) (4) | | | |
| Property | | City | | State | | Encumbrances at
December 31, 2016 | | Land | | Buildings, Fixtures and Improvements | | Accumulated Depreciation
(3) (5) | | Date Acquired | | Date of Construction | | City | | State | | Encumbrances at
December 31, 2018 | | Land | | Buildings, Fixtures and Improvements | | Accumulated Depreciation
(3) (5) | | Date Acquired | | Date of Construction |
| Jack in the Box | | Hutchins | | TX | | — |
| | 330 |
| | 1,363 |
| | — |
| | 1,693 |
| | (261 | ) | | 6/27/2013 | | 1995 | | Hutchins | | TX | | — |
| | 330 |
| | 1,363 |
| | — |
| | 1,693 |
| | (400 | ) | | 6/27/2013 | | 1995 |
| Jack in the Box | | Lufkin | | TX | | — |
| | 440 |
| | 1,544 |
| | — |
| | 1,984 |
| | (296 | ) | | 6/27/2013 | | 1995 | | Lufkin | | TX | | — |
| | 440 |
| | 1,544 |
| | — |
| | 1,984 |
| | (453 | ) | | 6/27/2013 | | 1995 |
| Jack in the Box | | Lufkin | | TX | | — |
| | 450 |
| | 1,563 |
| | — |
| | 2,013 |
| | (300 | ) | | 6/27/2013 | | 1995 | | Lufkin | | TX | | — |
| | 450 |
| | 1,563 |
| | — |
| | 2,013 |
| | (458 | ) | | 6/27/2013 | | 1995 |
| Jack in the Box | | Mesquite | | TX | | — |
| | 560 |
| | 1,652 |
| | — |
| | 2,212 |
| | (317 | ) | | 6/27/2013 | | 1995 | | Mesquite | | TX | | — |
| | 560 |
| | 1,652 |
| | — |
| | 2,212 |
| | (485 | ) | | 6/27/2013 | | 1995 |
| Jack in the Box | | Missouri City | | TX | | — |
| | 451 |
| | 837 |
| | — |
| | 1,288 |
| | (153 | ) | | 7/31/2013 | | 1991 | | Missouri City | | TX | | — |
| | 451 |
| | 837 |
| | — |
| | 1,288 |
| | (235 | ) | | 7/31/2013 | | 1991 |
| Jack in the Box | | Nacogdoches | | TX | | — |
| | 340 |
| | 1,320 |
| | — |
| | 1,660 |
| | (253 | ) | | 6/27/2013 | | 1995 | | Nacogdoches | | TX | | — |
| | 340 |
| | 1,320 |
| | — |
| | 1,660 |
| | (387 | ) | | 6/27/2013 | | 1995 |
| Jack in the Box | | Orange | | TX | | — |
| | 270 |
| | 1,661 |
| | — |
| | 1,931 |
| | (318 | ) | | 6/27/2013 | | 1995 | | Orange | | TX | | — |
| | 270 |
| | 1,661 |
| | — |
| | 1,931 |
| | (487 | ) | | 6/27/2013 | | 1995 |
| Jack in the Box | | Port Arthur | | TX | | — |
| | 460 |
| | 1,405 |
| | — |
| | 1,865 |
| | (269 | ) | | 6/27/2013 | | 1995 | | Port Arthur | | TX | | — |
| | 460 |
| | 1,405 |
| | — |
| | 1,865 |
| | (412 | ) | | 6/27/2013 | | 1995 |
| Jack in the Box | | San Antonio | | TX | | — |
| | 400 |
| | 1,244 |
| | — |
| | 1,644 |
| | (238 | ) | | 6/27/2013 | | 1995 | | San Antonio | | TX | | — |
| | 400 |
| | 1,244 |
| | — |
| | 1,644 |
| | (365 | ) | | 6/27/2013 | | 1995 |
| Jack in the Box | | San Antonio | | TX | | — |
| | 470 |
| | 1,256 |
| | — |
| | 1,726 |
| | (241 | ) | | 6/27/2013 | | 1995 | | San Antonio | | TX | | — |
| | 470 |
| | 1,256 |
| | — |
| | 1,726 |
| | (368 | ) | | 6/27/2013 | | 1995 |
| Jack in the Box | | San Antonio | | TX | | — |
| | 350 |
| | 1,249 |
| | — |
| | 1,599 |
| | (239 | ) | | 6/27/2013 | | 1995 | | San Antonio | | TX | | — |
| | 350 |
| | 1,249 |
| | — |
| | 1,599 |
| | (366 | ) | | 6/27/2013 | | 1995 |
| Jack in the Box | | Spring | | TX | | — |
| | 570 |
| | 1,340 |
| | — |
| | 1,910 |
| | (257 | ) | | 6/27/2013 | | 1995 | | Spring | | TX | | — |
| | 570 |
| | 1,340 |
| | — |
| | 1,910 |
| | (393 | ) | | 6/27/2013 | | 1995 |
| Jack in the Box | | Spring | | TX | | — |
| | 450 |
| | 1,487 |
| | — |
| | 1,937 |
| | (285 | ) | | 6/27/2013 | | 1995 | | Spring | | TX | | — |
| | 450 |
| | 1,487 |
| | — |
| | 1,937 |
| | (436 | ) | | 6/27/2013 | | 1995 |
| Jack in the Box | | Texas City | | TX | | ��� |
| | 454 |
| | 844 |
| | — |
| | 1,298 |
| | (166 | ) | | 6/27/2013 | | 1991 | | Texas City | | TX | | — |
| | 454 |
| | 844 |
| | — |
| | 1,298 |
| | (250 | ) | | 6/27/2013 | | 1991 |
| Jack in the Box | | Tyler | | TX | | — |
| | 450 |
| | 1,025 |
| | — |
| | 1,475 |
| | (197 | ) | | 6/27/2013 | | 1995 | | Tyler | | TX | | — |
| | 450 |
| | 1,025 |
| | — |
| | 1,475 |
| | (301 | ) | | 6/27/2013 | | 1995 |
| Jack in the Box | | Weatherford | | TX | | — |
| | 480 |
| | 1,329 |
| | — |
| | 1,809 |
| | (255 | ) | | 6/27/2013 | | 1995 | | Weatherford | | TX | | — |
| | 480 |
| | 1,329 |
| | — |
| | 1,809 |
| | (390 | ) | | 6/27/2013 | | 1995 |
| Jack in the Box | | Enumclaw | | WA | | — |
| | 380 |
| | 1,238 |
| | — |
| | 1,618 |
| | (237 | ) | | 6/27/2013 | | 1995 | | Enumclaw | | WA | | — |
| | 380 |
| | 1,238 |
| | — |
| | 1,618 |
| | (363 | ) | | 6/27/2013 | | 1995 |
| Jeremiah's Italian Ice | | Winter Springs | | FL | | — |
| | 734 |
| | — |
| | — |
| | 734 |
| | — |
| | 7/31/2013 | | 1995 | | Winter Springs | | FL | | — |
| | 734 |
| | — |
| | — |
| | 734 |
| | — |
| | 7/31/2013 | | 1995 |
| Jiffy Lube | | Houston | | TX | | — |
| | 423 |
| | 1,037 |
| | — |
| | 1,460 |
| | (129 | ) | | 6/9/2014 | | 2008 | | Houston | | TX | | — |
| | 423 |
| | 1,037 |
| | — |
| | 1,460 |
| | (231 | ) | | 6/9/2014 | | 2008 |
| Jo-Ann's | | Shakopee | | MN | | — |
| | 994 |
| | 1,807 |
| | — |
| | 2,801 |
| | (260 | ) | | 2/7/2014 | | 2012 | | Shakopee | | MN | | — |
| | 994 |
| | 1,807 |
| | — |
| | 2,801 |
| | (441 | ) | | 2/7/2014 | | 2012 |
| Joe's Crab Shack | | Houston | | TX | | — |
| | 900 |
| | 1,749 |
| | — |
| | 2,649 |
| | (347 | ) | | 6/27/2013 | | 1995 | |
| John Deere | | Davenport | | IA | | — |
| | 1,161 |
| | 22,052 |
| | (14 | ) | | 23,199 |
| | (6,220 | ) | | 5/31/2012 | | 2003 | |
| Johnny Carinos | | Rogers | | AR | | — |
| | 997 |
| | 2,540 |
| | — |
| | 3,537 |
| | (516 | ) | | 6/27/2013 | | 2001 | | Rogers | | AR | | — |
| | 997 |
| | 2,540 |
| | — |
| | 3,537 |
| | (771 | ) | | 6/27/2013 | | 2001 |
| Johnny Carinos | | Columbus | | IN | | — |
| | 809 |
| | 1,888 |
| | — |
| | 2,697 |
| | (379 | ) | | 8/30/2013 | | 2004 | | Columbus | | IN | | — |
| | 809 |
| | 1,888 |
| | — |
| | 2,697 |
| | (584 | ) | | 8/30/2013 | | 2004 |
| Johnny Carinos | | Muncie | | IN | | — |
| | 540 |
| | 2,160 |
| | — |
| | 2,700 |
| | (434 | ) | | 8/30/2013 | | 2003 | | Muncie | | IN | | — |
| | 540 |
| | 2,160 |
| | — |
| | 2,700 |
| | (668 | ) | | 8/30/2013 | | 2003 |
| Johnny Carinos | | Amarillo | | TX | | — |
| | 993 |
| | 2,317 |
| | (1,848 | ) | | 1,462 |
| | (14 | ) | | 7/31/2013 | | 2001 | | Houston | | TX | | — |
| | 1,328 |
| | 2,656 |
| | — |
| | 3,984 |
| | (806 | ) | | 6/27/2013 | | 2002 |
| Johnny Carinos | | Grand Prairie | | TX | | — |
| | 997 |
| | 2,327 |
| | — |
| | 3,324 |
| | (479 | ) | | 7/31/2013 | | 2001 | | Midland | | TX | | — |
| | 998 |
| | 2,329 |
| | — |
| | 3,327 |
| | (726 | ) | | 7/31/2013 | | 2000 |
| Johnny Carinos | | Houston | | TX | | — |
| | 1,328 |
| | 2,656 |
| | — |
| | 3,984 |
| | (539 | ) | | 6/27/2013 | | 2002 | |
| Johnny Carinos | | Midland | | TX | | — |
| | 998 |
| | 2,329 |
| | — |
| | 3,327 |
| | (479 | ) | | 7/31/2013 | | 2000 | |
| Johnny Carinos | | San Angelo | | TX | | — |
| | 769 |
| | 2,306 |
| | — |
| | 3,075 |
| | (474 | ) | | 7/31/2013 | | 2005 | |
| Johnson Controls | | Pinellas Park | | FL | | 16,200 |
| | 4,538 |
| | 23,842 |
| | (17,727 | ) | | 10,653 |
| | (346 | ) | | 11/5/2013 | | 2001 | |
| Katun Corp. | | Davenport | | IA | | — |
| | 454 |
| | 7,485 |
| | — |
| | 7,939 |
| | (838 | ) | | 5/6/2014 | | 1993 | | Davenport | | IA | | — |
| | 454 |
| | 7,485 |
| | — |
| | 7,939 |
| | (1,477 | ) | | 5/6/2014 | | 1993 |
| Keane Frac | | | Pleasanton | | TX | | — |
| | 328 |
| | 4,804 |
| | (2,858 | ) | | 2,274 |
| | (250 | ) | | 9/25/2014 | | 2014 |
| Kentucky Fried Chicken | | | Bloomington | | IL | | — |
| | 576 |
| | 1,466 |
| | — |
| | 2,042 |
| | (434 | ) | | 6/27/2013 | | 2004 |
| Kentucky Fried Chicken | | | Charleston | | IL | | — |
| | 282 |
| | 1,514 |
| | — |
| | 1,796 |
| | (448 | ) | | 6/27/2013 | | 2003 |
| Kentucky Fried Chicken | | | Decatur | | IL | | — |
| | 276 |
| | 1,619 |
| | — |
| | 1,895 |
| | (480 | ) | | 6/27/2013 | | 2001 |
| Kentucky Fried Chicken | | | Dolton | | IL | | — |
| | 167 |
| | 946 |
| | — |
| | 1,113 |
| | (266 | ) | | 7/31/2013 | | 1975 |
| Kentucky Fried Chicken | | | Elmhurst | | IL | | — |
| | 242 |
| | 969 |
| | — |
| | 1,211 |
| | (272 | ) | | 7/31/2013 | | 1990 |
| | | | | | Initial Costs (1) | | Costs Capitalized Subsequent to Acquisition (2) | | Gross Amount
Carried at
December 31, 2016
(3) (4) | | | | | | Initial Costs (1) | | Costs Capitalized Subsequent to Acquisition (2) | | Gross Amount
Carried at
December 31, 2018
(3) (4) | | | |
| Property | | City | | State | | Encumbrances at
December 31, 2016 | | Land | | Buildings, Fixtures and Improvements | | Accumulated Depreciation
(3) (5) | | Date Acquired | | Date of Construction | | City | | State | | Encumbrances at
December 31, 2018 | | Land | | Buildings, Fixtures and Improvements | | Accumulated Depreciation
(3) (5) | | Date Acquired | | Date of Construction |
| Kentucky Fried Chicken | | Bloomington | | IL | | — |
| | 576 |
| | 1,466 |
| | — |
| | 2,042 |
| | (288 | ) | | 6/27/2013 | | 2004 | |
| Kentucky Fried Chicken | | Charleston | | IL | | — |
| | 282 |
| | 1,514 |
| | — |
| | 1,796 |
| | (297 | ) | | 6/27/2013 | | 2003 | |
| Kentucky Fried Chicken | | Decatur | | IL | | — |
| | 276 |
| | 1,619 |
| | — |
| | 1,895 |
| | (318 | ) | | 6/27/2013 | | 2001 | |
| Kentucky Fried Chicken | | Mattoon | | IL | | — |
| | 113 |
| | 1,019 |
| | — |
| | 1,132 |
| | (186 | ) | | 7/31/2013 | | 1973 | | Hazel Crest | | IL | | — |
| | 153 |
| | 1,376 |
| | — |
| | 1,529 |
| | (386 | ) | | 7/31/2013 | | 1982 |
| Kentucky Fried Chicken | | Rockford | | IL | | — |
| | 201 |
| | 1,142 |
| | — |
| | 1,343 |
| | (208 | ) | | 7/31/2013 | | 1995 | | Homewood | | IL | | — |
| | 660 |
| | 1,541 |
| | — |
| | 2,201 |
| | (432 | ) | | 7/31/2013 | | 1992 |
| Kentucky Fried Chicken | | Springfield | | IL | | — |
| | 267 |
| | 1,068 |
| | — |
| | 1,335 |
| | (195 | ) | | 7/31/2013 | | 1987 | | Matteson | | IL | | — |
| | 399 |
| | 2,259 |
| | — |
| | 2,658 |
| | (634 | ) | | 7/31/2013 | | 1973 |
| Kentucky Fried Chicken | | Springfield | | IL | | — |
| | 212 |
| | 1,203 |
| | — |
| | 1,415 |
| | (219 | ) | | 7/31/2013 | | 1987 | | Mattoon | | IL | | — |
| | 113 |
| | 1,019 |
| | — |
| | 1,132 |
| | (286 | ) | | 7/31/2013 | | 1973 |
| Kentucky Fried Chicken | | Dolton | | IL | | — |
| | 167 |
| | 946 |
| | — |
| | 1,113 |
| | (173 | ) | | 7/31/2013 | | 1975 | | Oak Forest | | IL | | — |
| | 185 |
| | 1,047 |
| | — |
| | 1,232 |
| | (294 | ) | | 7/31/2013 | | 1955 |
| Kentucky Fried Chicken | | Elmhurst | | IL | | — |
| | 242 |
| | 969 |
| | — |
| | 1,211 |
| | (177 | ) | | 7/31/2013 | | 1990 | | Rockford | | IL | | — |
| | 201 |
| | 1,142 |
| | — |
| | 1,343 |
| | (320 | ) | | 7/31/2013 | | 1995 |
| Kentucky Fried Chicken | | Hazel Crest | | IL | | — |
| | 153 |
| | 1,376 |
| | — |
| | 1,529 |
| | (251 | ) | | 7/31/2013 | | 1982 | | Springfield | | IL | | — |
| | 267 |
| | 1,068 |
| | — |
| | 1,335 |
| | (300 | ) | | 7/31/2013 | | 1987 |
| Kentucky Fried Chicken | | Homewood | | IL | | — |
| | 660 |
| | 1,541 |
| | — |
| | 2,201 |
| | (281 | ) | | 7/31/2013 | | 1992 | | Springfield | | IL | | — |
| | 212 |
| | 1,203 |
| | — |
| | 1,415 |
| | (338 | ) | | 7/31/2013 | | 1987 |
| Kentucky Fried Chicken | | Matteson | | IL | | — |
| | 399 |
| | 2,259 |
| | — |
| | 2,658 |
| | (412 | ) | | 7/31/2013 | | 1973 | | Westchester | | IL | | — |
| | 238 |
| | 952 |
| | — |
| | 1,190 |
| | (267 | ) | | 7/31/2013 | | 1973 |
| Kentucky Fried Chicken | | Oak Forest | | IL | | — |
| | 185 |
| | 1,047 |
| | — |
| | 1,232 |
| | (191 | ) | | 7/31/2013 | | 1955 | | Crawfordsville | | IN | | — |
| | 159 |
| | 1,068 |
| | — |
| | 1,227 |
| | (316 | ) | | 6/27/2013 | | 1979 |
| Kentucky Fried Chicken | | Westchester | | IL | | — |
| | 238 |
| | 952 |
| | — |
| | 1,190 |
| | (174 | ) | | 7/31/2013 | | 1973 | | Frankfort | | IN | | — |
| | 99 |
| | 893 |
| | — |
| | 992 |
| | (251 | ) | | 7/31/2013 | | 1985 |
| Kentucky Fried Chicken | | Crawfordsville | | IN | | — |
| | 159 |
| | 1,068 |
| | — |
| | 1,227 |
| | (210 | ) | | 6/27/2013 | | 1979 | | Franklin | | IN | | — |
| | 205 |
| | 1,375 |
| | — |
| | 1,580 |
| | (408 | ) | | 6/27/2013 | | 1976 |
| Kentucky Fried Chicken | | Franklin | | IN | | — |
| | 205 |
| | 1,375 |
| | — |
| | 1,580 |
| | (270 | ) | | 6/27/2013 | | 1976 | | Greenwood | | IN | | — |
| | 339 |
| | 1,405 |
| | — |
| | 1,744 |
| | (416 | ) | | 6/27/2013 | | 1976 |
| Kentucky Fried Chicken | | Greenwood | | IN | | — |
| | 339 |
| | 1,405 |
| | — |
| | 1,744 |
| | (276 | ) | | 6/27/2013 | | 1976 | | Lebanon | | IN | | — |
| | 337 |
| | 1,348 |
| | — |
| | 1,685 |
| | (378 | ) | | 7/31/2013 | | 1983 |
| Kentucky Fried Chicken | | Deming | | NM | | — |
| | 220 |
| | 691 |
| | — |
| | 911 |
| | (133 | ) | | 6/27/2013 | | 1995 | | Deming | | NM | | — |
| | 220 |
| | 691 |
| | — |
| | 911 |
| | (203 | ) | | 6/27/2013 | | 1995 |
| Kentucky Fried Chicken | | Las Cruces | | NM | | — |
| | 270 |
| | 498 |
| | — |
| | 768 |
| | (95 | ) | | 6/27/2013 | | 1995 | | Las Cruces | | NM | | — |
| | 270 |
| | 498 |
| | — |
| | 768 |
| | (146 | ) | | 6/27/2013 | | 1995 |
| Kentucky Fried Chicken | | Warren | | OH | | — |
| | 426 |
| | 640 |
| | (421 | ) | | 645 |
| | (13 | ) | | 7/31/2013 | | 1987 | | Warren | | OH | | — |
| | 426 |
| | 640 |
| | (421 | ) | | 645 |
| | (49 | ) | | 7/31/2013 | | 1987 |
| Kentucky Fried Chicken | | New Kensington | | PA | | — |
| | 324 |
| | 487 |
| | (260 | ) | | 551 |
| | (11 | ) | | 7/31/2013 | | 1967 | | New Kensington | | PA | | — |
| | 324 |
| | 487 |
| | (260 | ) | | 551 |
| | (41 | ) | | 7/31/2013 | | 1967 |
| Kentucky Fried Chicken | | Appleton | | WI | | — |
| | 350 |
| | 874 |
| | — |
| | 1,224 |
| | (167 | ) | | 6/27/2013 | | 1995 | | Appleton | | WI | | — |
| | 350 |
| | 874 |
| | — |
| | 1,224 |
| | (256 | ) | | 6/27/2013 | | 1995 |
| Kentucky Fried Chicken / A&W | | Granite City | | IL | | — |
| | 102 |
| | 1,083 |
| | — |
| | 1,185 |
| | (213 | ) | | 6/27/2013 | | 1987 | | Granite City | | IL | | — |
| | 102 |
| | 1,083 |
| | — |
| | 1,185 |
| | (321 | ) | | 6/27/2013 | | 1987 |
| Kentucky Fried Chicken / A&W | | Allison Park | | PA | | — |
| | 246 |
| | 683 |
| | — |
| | 929 |
| | (134 | ) | | 6/27/2013 | | 1978 | | Allison Park | | PA | | — |
| | 246 |
| | 683 |
| | — |
| | 929 |
| | (202 | ) | | 6/27/2013 | | 1978 |
| Kentucky Fried Chicken / A&W | | Germantown | | WI | | — |
| | 368 |
| | 913 |
| | — |
| | 1,281 |
| | (179 | ) | | 6/27/2013 | | 1989 | | Germantown | | WI | | — |
| | 368 |
| | 913 |
| | — |
| | 1,281 |
| | (270 | ) | | 6/27/2013 | | 1989 |
| Kentucky Fried Chicken / A&W | | Green Bay | | WI | | — |
| | 208 |
| | 1,022 |
| | — |
| | 1,230 |
| | (201 | ) | | 6/27/2013 | | 1986 | | Green Bay | | WI | | — |
| | 208 |
| | 1,022 |
| | — |
| | 1,230 |
| | (303 | ) | | 6/27/2013 | | 1986 |
| Kentucky Fried Chicken / A&W | | Milwaukee | | WI | | — |
| | 396 |
| | 773 |
| | — |
| | 1,169 |
| | (152 | ) | | 6/27/2013 | | 1991 | | Milwaukee | | WI | | — |
| | 396 |
| | 773 |
| | — |
| | 1,169 |
| | (229 | ) | | 6/27/2013 | | 1991 |
| Kentucky Fried Chicken / A&W | | Milwaukee | | WI | | — |
| | 281 |
| | 795 |
| | — |
| | 1,076 |
| | (156 | ) | | 6/27/2013 | | 1992 | | Milwaukee | | WI | | — |
| | 281 |
| | 795 |
| | — |
| | 1,076 |
| | (236 | ) | | 6/27/2013 | | 1992 |
| Kentucky Fried Chicken / A&W | | Milwaukee | | WI | | — |
| | 89 |
| | 750 |
| | — |
| | 839 |
| | (147 | ) | | 6/27/2013 | | 1989 | | Milwaukee | | WI | | — |
| | 89 |
| | 750 |
| | — |
| | 839 |
| | (222 | ) | | 6/27/2013 | | 1989 |
| Kentucky Fried Chicken / A&W | | Milwaukee | | WI | | — |
| | 197 |
| | 975 |
| | — |
| | 1,172 |
| | (191 | ) | | 6/27/2013 | | 1991 | | Milwaukee | | WI | | — |
| | 197 |
| | 975 |
| | — |
| | 1,172 |
| | (289 | ) | | 6/27/2013 | | 1991 |
| Kentucky Fried Chicken / A&W | | Milwaukee | | WI | | — |
| | 138 |
| | 924 |
| | — |
| | 1,062 |
| | (181 | ) | | 6/27/2013 | | 1992 | | Milwaukee | | WI | | — |
| | 138 |
| | 924 |
| | — |
| | 1,062 |
| | (274 | ) | | 6/27/2013 | | 1992 |
| Kentucky Fried Chicken / A&W | | South Milwaukee | | WI | | — |
| | 197 |
| | 695 |
| | — |
| | 892 |
| | (136 | ) | | 6/27/2013 | | 1993 | | South Milwaukee | | WI | | — |
| | 197 |
| | 695 |
| | — |
| | 892 |
| | (206 | ) | | 6/27/2013 | | 1993 |
| Kentucky Fried Chicken / A&W | | | Wauwatosa | | WI | | — |
| | 135 |
| | 615 |
| | — |
| | 750 |
| | (182 | ) | | 6/27/2013 | | 1992 |
| Kentucky Fried Chicken / A&W | | | West Bend | | WI | | — |
| | 185 |
| | 705 |
| | — |
| | 890 |
| | (209 | ) | | 6/27/2013 | | 1972 |
| Ker's WingHouse Bar and Grill | | | Brandon | | FL | | — |
| | 340 |
| | 654 |
| | — |
| | 994 |
| | (197 | ) | | 6/27/2013 | | 1995 |
| | | | | | Initial Costs (1) | | Costs Capitalized Subsequent to Acquisition (2) | | Gross Amount
Carried at
December 31, 2016
(3) (4) | | | | | | Initial Costs (1) | | Costs Capitalized Subsequent to Acquisition (2) | | Gross Amount
Carried at
December 31, 2018
(3) (4) | | | |
| Property | | City | | State | | Encumbrances at
December 31, 2016 | | Land | | Buildings, Fixtures and Improvements | | Accumulated Depreciation
(3) (5) | | Date Acquired | | Date of Construction | | City | | State | | Encumbrances at
December 31, 2018 | | Land | | Buildings, Fixtures and Improvements | | Accumulated Depreciation
(3) (5) | | Date Acquired | | Date of Construction |
| Kentucky Fried Chicken / A&W | | Wauwatosa | | WI | | — |
| | 135 |
| | 615 |
| | — |
| | 750 |
| | (121 | ) | | 6/27/2013 | | 1992 | |
| Kentucky Fried Chicken / A&W | | West Bend | | WI | | — |
| | 185 |
| | 705 |
| | — |
| | 890 |
| | (138 | ) | | 6/27/2013 | | 1972 | |
| Ker's WingHouse Bar and Grill | | Brandon | | FL | | — |
| | 340 |
| | 654 |
| | — |
| | 994 |
| | (130 | ) | | 6/27/2013 | | 1995 | | Clearwater | | FL | | — |
| | 550 |
| | 627 |
| | — |
| | 1,177 |
| | (189 | ) | | 6/27/2013 | | 1995 |
| Ker's WingHouse Bar and Grill | | Clearwater | | FL | | — |
| | 550 |
| | 627 |
| | — |
| | 1,177 |
| | (124 | ) | | 6/27/2013 | | 1995 | |
| Kettle Restaurant | | San Antonio | | TX | | — |
| | 168 |
| | 206 |
| | — |
| | 374 |
| | (38 | ) | | 7/31/2013 | | 1965 | |
| Key Bank | | Spencerport | | NY | | — |
| | 59 |
| | 1,112 |
| | — |
| | 1,171 |
| | (211 | ) | | 6/5/2013 | | 1960 | |
| Key Bank | | Berea | | OH | | — |
| | 234 |
| | 1,326 |
| | 8 |
| | 1,568 |
| | (229 | ) | | 10/1/2013 | | 1958 | | Spencerport | | NY | | — |
| | 59 |
| | 1,112 |
| | — |
| | 1,171 |
| | (315 | ) | | 6/5/2013 | | 1960 |
| Kirklands | | Wilmington | | NC | | — |
| | 1,127 |
| | 1,061 |
| | — |
| | 2,188 |
| | (165 | ) | | 2/7/2014 | | 2004 | | Wilmington | | NC | | — |
| | 1,127 |
| | 1,061 |
| | — |
| | 2,188 |
| | (279 | ) | | 2/7/2014 | | 2004 |
| Kohl's | | Monrovia | | CA | | 8,700 |
| | 8,052 |
| | 7,891 |
| | — |
| | 15,943 |
| | (1,144 | ) | | 2/7/2014 | | 1982 | | Monrovia | | CA | | 8,700 |
| | 8,052 |
| | 7,891 |
| | — |
| | 15,943 |
| | (1,941 | ) | | 2/7/2014 | | 1982 |
| Kohl's | | Tavares | | FL | | 4,670 |
| | 4,173 |
| | — |
| | — |
| | 4,173 |
| | — |
| | 2/7/2014 | | 2008 | | Tavares | | FL | | 4,670 |
| | 4,173 |
| | — |
| | — |
| | 4,173 |
| | — |
| | 2/7/2014 | | 2008 |
| Kohl's | | Fort Dodge | | IA | | — |
| | 1,431 |
| | 3,109 |
| | — |
| | 4,540 |
| | (452 | ) | | 2/7/2014 | | 2011 | | Fort Dodge | | IA | | — |
| | 1,431 |
| | 3,109 |
| | — |
| | 4,540 |
| | (766 | ) | | 2/7/2014 | | 2011 |
| Kohl's | | Salina | | KS | | — |
| | 964 |
| | 5,009 |
| | — |
| | 5,973 |
| | (651 | ) | | 2/7/2014 | | 2009 | | Salina | | KS | | — |
| | 964 |
| | 5,009 |
| | 60 |
| | 6,033 |
| | (1,105 | ) | | 2/7/2014 | | 2009 |
| Kohl's | | Howell | | MI | | 7,705 |
| | 547 |
| | 10,399 |
| | — |
| | 10,946 |
| | (2,770 | ) | | 3/28/2013 | | 2003 | | Howell | | MI | | 7,705 |
| | 547 |
| | 10,399 |
| | — |
| | 10,946 |
| | (3,852 | ) | | 3/28/2013 | | 2003 |
| Kohl's | | Saginaw | | MI | | — |
| | 1,110 |
| | 6,932 |
| | — |
| | 8,042 |
| | (899 | ) | | 2/7/2014 | | 2011 | | Saginaw | | MI | | — |
| | 1,110 |
| | 6,932 |
| | — |
| | 8,042 |
| | (1,525 | ) | | 2/7/2014 | | 2011 |
| Kohl's | | Columbia | | SC | | — |
| | 1,532 |
| | 14,561 |
| | — |
| | 16,093 |
| | (1,790 | ) | | 2/7/2014 | | 2007 | | Columbia | | SC | | — |
| | 1,532 |
| | 14,561 |
| | — |
| | 16,093 |
| | (3,036 | ) | | 2/7/2014 | | 2007 |
| Kohl's | | Spartanburg | | SC | | — |
| | 2,984 |
| | 5,842 |
| | — |
| | 8,826 |
| | (808 | ) | | 2/7/2014 | | 2006 | | Spartanburg | | SC | | — |
| | 2,984 |
| | 5,842 |
| | — |
| | 8,826 |
| | (1,369 | ) | | 2/7/2014 | | 2006 |
| Kohl's | | Brownsville | | TX | | — |
| | 2,756 |
| | 3,423 |
| | — |
| | 6,179 |
| | (22 | ) | | 2/7/2014 | | 2007 | | Brownsville | | TX | | — |
| | 2,756 |
| | 3,423 |
| | — |
| | 6,179 |
| | (38 | ) | | 2/7/2014 | | 2007 |
| Kohl's | | Mcallen | | TX | | 3,526 |
| | 1,286 |
| | 7,321 |
| | — |
| | 8,607 |
| | (979 | ) | | 2/7/2014 | | 2005 | | Mcallen | | TX | | 3,429 |
| | 1,286 |
| | 7,321 |
| | — |
| | 8,607 |
| | (1,660 | ) | | 2/7/2014 | | 2005 |
| Kohl's | | Rice Lake | | WI | | — |
| | 1,268 |
| | 7,788 |
| | — |
| | 9,056 |
| | (1,013 | ) | | 2/7/2014 | | 2011 | | Rice Lake | | WI | | — |
| | 1,268 |
| | 7,788 |
| | — |
| | 9,056 |
| | (1,717 | ) | | 2/7/2014 | | 2011 |
| Kroger | | Calhoun | | GA | | — |
| | — |
| | 6,279 |
| | — |
| | 6,279 |
| | (979 | ) | | 11/5/2013 | | 1996 | | Calhoun | | GA | | — |
| | — |
| | 6,279 |
| | — |
| | 6,279 |
| | (1,592 | ) | | 11/5/2013 | | 1996 |
| Kroger | | Lithonia | | GA | | — |
| | — |
| | 6,250 |
| | — |
| | 6,250 |
| | (975 | ) | | 11/5/2013 | | 1995 | | Lithonia | | GA | | — |
| | — |
| | 6,250 |
| | — |
| | 6,250 |
| | (1,585 | ) | | 11/5/2013 | | 1995 |
| Kroger | | Suwanee | | GA | | — |
| | — |
| | 7,574 |
| | — |
| | 7,574 |
| | (1,182 | ) | | 11/5/2013 | | 1995 | | Suwanee | | GA | | — |
| | — |
| | 7,574 |
| | — |
| | 7,574 |
| | (1,921 | ) | | 11/5/2013 | | 1995 |
| Kroger | | Suwanee | | GA | | — |
| | — |
| | 7,691 |
| | — |
| | 7,691 |
| | (1,200 | ) | | 11/5/2013 | | 1993 | | Suwanee | | GA | | — |
| | — |
| | 7,691 |
| | — |
| | 7,691 |
| | (1,950 | ) | | 11/5/2013 | | 1993 |
| Kroger | | Frankfort | | KY | | — |
| | — |
| | 5,794 |
| | — |
| | 5,794 |
| | (904 | ) | | 11/5/2013 | | 1995 | | Frankfort | | KY | | — |
| | — |
| | 5,794 |
| | — |
| | 5,794 |
| | (1,469 | ) | | 11/5/2013 | | 1995 |
| Kroger | | Georgetown | | KY | | — |
| | — |
| | 6,742 |
| | — |
| | 6,742 |
| | (1,052 | ) | | 11/5/2013 | | 1995 | | Madisonville | | KY | | — |
| | — |
| | 5,715 |
| | — |
| | 5,715 |
| | (1,449 | ) | | 11/5/2013 | | 1996 |
| Kroger | | Madisonville | | KY | | — |
| | — |
| | 5,715 |
| | — |
| | 5,715 |
| | (891 | ) | | 11/5/2013 | | 1996 | | Murray | | KY | | — |
| | — |
| | 6,165 |
| | — |
| | 6,165 |
| | (1,563 | ) | | 11/5/2013 | | 1995 |
| Kroger | | Murray | | KY | | — |
| | — |
| | 6,165 |
| | — |
| | 6,165 |
| | (962 | ) | | 11/5/2013 | | 1995 | | Owensboro | | KY | | — |
| | — |
| | 6,073 |
| | — |
| | 6,073 |
| | (1,540 | ) | | 11/5/2013 | | 1996 |
| Kroger | | Owensboro | | KY | | — |
| | — |
| | 6,073 |
| | — |
| | 6,073 |
| | (947 | ) | | 11/5/2013 | | 1996 | | Franklin | | TN | | — |
| | — |
| | 7,782 |
| | — |
| | 7,782 |
| | (1,973 | ) | | 11/5/2013 | | 1996 |
| Kroger | | Franklin | | TN | | — |
| | — |
| | 7,782 |
| | — |
| | 7,782 |
| | (1,214 | ) | | 11/5/2013 | | 1996 | | Knoxville | | TN | | — |
| | — |
| | 7,642 |
| | — |
| | 7,642 |
| | (1,938 | ) | | 11/5/2013 | | 1996 |
| Kroger | | Knoxville | | TN | | — |
| | — |
| | 7,642 |
| | — |
| | 7,642 |
| | (1,192 | ) | | 11/5/2013 | | 1996 | |
| Krystal | | Greenville | | AL | | — |
| | 195 |
| | 1,147 |
| | — |
| | 1,342 |
| | (220 | ) | | 6/27/2013 | | 1995 | | Greenville | | AL | | — |
| | 195 |
| | 1,147 |
| | 182 |
| | 1,524 |
| | (385 | ) | | 6/27/2013 | | 1995 |
| Krystal | | Huntsville | | AL | | — |
| | 348 |
| | 811 |
| | — |
| | 1,159 |
| | (212 | ) | | 4/23/2013 | | 1960 | | Huntsville | | AL | | — |
| | 348 |
| | 811 |
| | — |
| | 1,159 |
| | (303 | ) | | 4/23/2013 | | 1960 |
| Krystal | | | Huntsville | | AL | | — |
| | 352 |
| | 654 |
| | 125 |
| | 1,131 |
| | (256 | ) | | 4/23/2013 | | 1971 |
| Krystal | | | Huntsville | | AL | | — |
| | 305 |
| | 712 |
| | 125 |
| | 1,142 |
| | (274 | ) | | 6/10/2013 | | 1985 |
| Krystal | | | Montgomery | | AL | | — |
| | 259 |
| | 1,036 |
| | — |
| | 1,295 |
| | (405 | ) | | 9/21/2012 | | 1964 |
| Krystal | | | Montgomery | | AL | | — |
| | 560 |
| | 829 |
| | 175 |
| | 1,564 |
| | (290 | ) | | 6/27/2013 | | 1995 |
| Krystal | | | Montgomery | | AL | | — |
| | 303 |
| | 562 |
| | 125 |
| | 990 |
| | (222 | ) | | 4/23/2013 | | 1962 |
| Krystal | | | Montgomery | | AL | | — |
| | 502 |
| | 613 |
| | — |
| | 1,115 |
| | (229 | ) | | 4/23/2013 | | 1962 |
| | | | | | Initial Costs (1) | | Costs Capitalized Subsequent to Acquisition (2) | | Gross Amount
Carried at
December 31, 2016
(3) (4) | | | | | | Initial Costs (1) | | Costs Capitalized Subsequent to Acquisition (2) | | Gross Amount
Carried at
December 31, 2018
(3) (4) | | | |
| Property | | City | | State | | Encumbrances at
December 31, 2016 | | Land | | Buildings, Fixtures and Improvements | | Accumulated Depreciation
(3) (5) | | Date Acquired | | Date of Construction | | City | | State | | Encumbrances at
December 31, 2018 | | Land | | Buildings, Fixtures and Improvements | | Accumulated Depreciation
(3) (5) | | Date Acquired | | Date of Construction |
| Krystal | | Huntsville | | AL | | — |
| | 352 |
| | 654 |
| | — |
| | 1,006 |
| | (171 | ) | | 4/23/2013 | | 1971 | | Scottsboro | | AL | | — |
| | 20 |
| | 1,157 |
| | 172 |
| | 1,349 |
| | (385 | ) | | 6/27/2013 | | 1995 |
| Krystal | | Huntsville | | AL | | — |
| | 305 |
| | 712 |
| | — |
| | 1,017 |
| | (178 | ) | | 6/10/2013 | | 1985 | | Tuscaloosa | | AL | | — |
| | 206 |
| | 1,165 |
| | 454 |
| | 1,825 |
| | (254 | ) | | 9/21/2012 | | 1976 |
| Krystal | | Montgomery | | AL | | — |
| | 259 |
| | 1,036 |
| | — |
| | 1,295 |
| | (313 | ) | | 9/21/2012 | | 1964 | | Valley | | AL | | — |
| | 297 |
| | 694 |
| | 125 |
| | 1,116 |
| | (270 | ) | | 4/23/2013 | | 1979 |
| Krystal | | Montgomery | | AL | | — |
| | 560 |
| | 829 |
| | — |
| | 1,389 |
| | (159 | ) | | 6/27/2013 | | 1995 | | Vestavia Hills | | AL | | — |
| | 342 |
| | 513 |
| | — |
| | 855 |
| | (192 | ) | | 4/23/2013 | | 1995 |
| Krystal | | Montgomery | | AL | | — |
| | 303 |
| | 562 |
| | — |
| | 865 |
| | (147 | ) | | 4/23/2013 | | 1962 | | Jacksonville | | FL | | — |
| | 574 |
| | 574 |
| | — |
| | 1,148 |
| | (225 | ) | | 9/21/2012 | | 1990 |
| Krystal | | Montgomery | | AL | | — |
| | 502 |
| | 613 |
| | — |
| | 1,115 |
| | (160 | ) | | 4/23/2013 | | 1962 | | Orlando | | FL | | — |
| | 372 |
| | 372 |
| | 125 |
| | 869 |
| | (154 | ) | | 9/21/2012 | | 1994 |
| Krystal | | Scottsboro | | AL | | — |
| | 20 |
| | 1,157 |
| | — |
| | 1,177 |
| | (222 | ) | | 6/27/2013 | | 1995 | | Orlando | | FL | | — |
| | 669 |
| | 446 |
| | — |
| | 1,115 |
| | (175 | ) | | 9/21/2012 | | 1995 |
| Krystal | | Tuscaloosa | | AL | | — |
| | 206 |
| | 1,165 |
| | — |
| | 1,371 |
| | (352 | ) | | 9/21/2012 | | 1976 | | Plant City | | FL | | — |
| | 355 |
| | 533 |
| | — |
| | 888 |
| | (209 | ) | | 9/21/2012 | | 2012 |
| Krystal | | Valley | | AL | | — |
| | 297 |
| | 694 |
| | — |
| | 991 |
| | (181 | ) | | 4/23/2013 | | 1979 | | St. Augustine | | FL | | — |
| | 411 |
| | 411 |
| | 125 |
| | 947 |
| | (170 | ) | | 9/21/2012 | | 2012 |
| Krystal | | Vestavia Hills | | AL | | — |
| | 342 |
| | 513 |
| | — |
| | 855 |
| | (134 | ) | | 4/23/2013 | | 1995 | | Albany | | GA | | — |
| | 309 |
| | 721 |
| | — |
| | 1,030 |
| | (282 | ) | | 9/21/2012 | | 1962 |
| Krystal | | Jacksonville | | FL | | — |
| | 574 |
| | 574 |
| | — |
| | 1,148 |
| | (174 | ) | | 9/21/2012 | | 1990 | | Atlanta | | GA | | — |
| | 166 |
| | 664 |
| | — |
| | 830 |
| | (260 | ) | | 9/21/2012 | | 1973 |
| Krystal | | Orlando | | FL | | — |
| | 372 |
| | 372 |
| | — |
| | 744 |
| | (112 | ) | | 9/21/2012 | | 1994 | | Augusta | | GA | | — |
| | 365 |
| | 851 |
| | — |
| | 1,216 |
| | (333 | ) | | 9/21/2012 | | 1979 |
| Krystal | | Orlando | | FL | | — |
| | 669 |
| | 446 |
| | — |
| | 1,115 |
| | (135 | ) | | 9/21/2012 | | 1995 | | Columbus | | GA | | — |
| | 622 |
| | 934 |
| | — |
| | 1,556 |
| | (365 | ) | | 9/21/2012 | | 1977 |
| Krystal | | Plant City | | FL | | — |
| | 355 |
| | 533 |
| | — |
| | 888 |
| | (161 | ) | | 9/21/2012 | | 2012 | | Decatur | | GA | | — |
| | 94 |
| | 533 |
| | — |
| | 627 |
| | (208 | ) | | 9/21/2012 | | 1965 |
| Krystal | | St. Augustine | | FL | | — |
| | 411 |
| | 411 |
| | — |
| | 822 |
| | (124 | ) | | 9/21/2012 | | 2012 | | East Point | | GA | | — |
| | 221 |
| | 664 |
| | — |
| | 885 |
| | (258 | ) | | 10/26/2012 | | 1984 |
| Krystal | | Albany | | GA | | — |
| | 309 |
| | 721 |
| | — |
| | 1,030 |
| | (218 | ) | | 9/21/2012 | | 1962 | | Macon | | GA | | — |
| | 325 |
| | 759 |
| | — |
| | 1,084 |
| | (297 | ) | | 9/21/2012 | | 1962 |
| Krystal | | Atlanta | | GA | | — |
| | 166 |
| | 664 |
| | — |
| | 830 |
| | (201 | ) | | 9/21/2012 | | 1973 | | Milledgeville | | GA | | — |
| | 261 |
| | 609 |
| | — |
| | 870 |
| | (238 | ) | | 9/21/2012 | | 2011 |
| Krystal | | Augusta | | GA | | — |
| | 365 |
| | 851 |
| | — |
| | 1,216 |
| | (257 | ) | | 9/21/2012 | | 1979 | | Snellville | | GA | | — |
| | 466 |
| | 466 |
| | — |
| | 932 |
| | (182 | ) | | 9/21/2012 | | 1981 |
| Krystal | | Columbus | | GA | | — |
| | 622 |
| | 934 |
| | — |
| | 1,556 |
| | (282 | ) | | 9/21/2012 | | 1977 | | Corinth | | MS | | — |
| | 279 |
| | 652 |
| | 125 |
| | 1,056 |
| | (254 | ) | | 4/23/2013 | | 2007 |
| Krystal | | Decatur | | GA | | — |
| | 94 |
| | 533 |
| | — |
| | 627 |
| | (161 | ) | | 9/21/2012 | | 1965 | | Gulfport | | MS | | — |
| | 215 |
| | 861 |
| | — |
| | 1,076 |
| | (337 | ) | | 9/21/2012 | | 2011 |
| Krystal | | East Point | | GA | | — |
| | 221 |
| | 664 |
| | — |
| | 885 |
| | (197 | ) | | 10/26/2012 | | 1984 | | Pearl | | MS | | — |
| | 426 |
| | 638 |
| | — |
| | 1,064 |
| | (250 | ) | | 9/21/2012 | | 1976 |
| Krystal | | Macon | | GA | | — |
| | 325 |
| | 759 |
| | — |
| | 1,084 |
| | (229 | ) | | 9/21/2012 | | 1962 | | Chattanooga | | TN | | — |
| | 336 |
| | 784 |
| | — |
| | 1,120 |
| | (307 | ) | | 9/21/2012 | | 2010 |
| Krystal | | Milledgeville | | GA | | — |
| | 261 |
| | 609 |
| | — |
| | 870 |
| | (184 | ) | | 9/21/2012 | | 2011 | | Chattanooga | | TN | | — |
| | 186 |
| | 328 |
| | — |
| | 514 |
| | (73 | ) | | 6/27/2013 | | 1995 |
| Krystal | | Snellville | | GA | | — |
| | 466 |
| | 466 |
| | — |
| | 932 |
| | (141 | ) | | 9/21/2012 | | 1981 | | Chattanooga | | TN | | — |
| | 440 |
| | 659 |
| | — |
| | 1,099 |
| | (246 | ) | | 4/23/2013 | | 1983 |
| Krystal | | Corinth | | MS | | — |
| | 279 |
| | 652 |
| | — |
| | 931 |
| | (170 | ) | | 4/23/2013 | | 2007 | | Knoxville | | TN | | — |
| | 369 |
| | 246 |
| | — |
| | 615 |
| | (96 | ) | | 9/21/2012 | | 1970 |
| Krystal | | Gulfport | | MS | | — |
| | 215 |
| | 861 |
| | — |
| | 1,076 |
| | (260 | ) | | 9/21/2012 | | 2011 | | Lawrenceburg | | TN | | — |
| | 304 |
| | 709 |
| | — |
| | 1,013 |
| | (265 | ) | | 4/23/2013 | | 1980 |
| Krystal | | Pearl | | MS | | — |
| | 426 |
| | 638 |
| | — |
| | 1,064 |
| | (193 | ) | | 9/21/2012 | | 1976 | | Memphis | | TN | | — |
| | 257 |
| | 1,029 |
| | — |
| | 1,286 |
| | (384 | ) | | 4/23/2013 | | 1975 |
| Krystal | | Chattanooga | | TN | | — |
| | 336 |
| | 784 |
| | — |
| | 1,120 |
| | (237 | ) | | 9/21/2012 | | 2010 | | Memphis | | TN | | — |
| | 181 |
| | 723 |
| | — |
| | 904 |
| | (270 | ) | | 4/23/2013 | | 1972 |
| Krystal | | Chattanooga | | TN | | — |
| | 186 |
| | 328 |
| | — |
| | 514 |
| | (39 | ) | | 6/27/2013 | | 1995 | | Murfreesboro | | TN | | — |
| | 465 |
| | 698 |
| | — |
| | 1,163 |
| | (261 | ) | | 4/23/2013 | | 2008 |
| Krystal | | Chattanooga | | TN | | — |
| | 440 |
| | 659 |
| | — |
| | 1,099 |
| | (172 | ) | | 4/23/2013 | | 1983 | |
| Krystal | | Knoxville | | TN | | — |
| | 369 |
| | 246 |
| | — |
| | 615 |
| | (74 | ) | | 9/21/2012 | | 1970 | |
| Krystal | | Lawrenceburg | | TN | | — |
| | 304 |
| | 709 |
| | — |
| | 1,013 |
| | (185 | ) | | 4/23/2013 | | 1980 | |
| Kum & Go | | | Bentonville | | AR | | — |
| | 587 |
| | 1,370 |
| | (52 | ) | | 1,905 |
| | (428 | ) | | 11/20/2012 | | 2009 |
| Kum & Go | | | Lowell | | AR | | — |
| | 774 |
| | 1,437 |
| | (27 | ) | | 2,184 |
| | (449 | ) | | 11/20/2012 | | 2009 |
| Kum & Go | | | Paragould | | AR | | — |
| | 708 |
| | 2,123 |
| | — |
| | 2,831 |
| | (674 | ) | | 9/28/2012 | | 2012 |
| | | | | | Initial Costs (1) | | Costs Capitalized Subsequent to Acquisition (2) | | Gross Amount
Carried at
December 31, 2016
(3) (4) | | | | | | Initial Costs (1) | | Costs Capitalized Subsequent to Acquisition (2) | | Gross Amount
Carried at
December 31, 2018
(3) (4) | | | |
| Property | | City | | State | | Encumbrances at
December 31, 2016 | | Land | | Buildings, Fixtures and Improvements | | Accumulated Depreciation
(3) (5) | | Date Acquired | | Date of Construction | | City | | State | | Encumbrances at
December 31, 2018 | | Land | | Buildings, Fixtures and Improvements | | Accumulated Depreciation
(3) (5) | | Date Acquired | | Date of Construction |
| Krystal | | Memphis | | TN | | — |
| | 257 |
| | 1,029 |
| | — |
| | 1,286 |
| | (269 | ) | | 4/23/2013 | | 1975 | |
| Krystal | | Memphis | | TN | | — |
| | 181 |
| | 723 |
| | — |
| | 904 |
| | (189 | ) | | 4/23/2013 | | 1972 | |
| Krystal | | Murfreesboro | | TN | | — |
| | 465 |
| | 698 |
| | — |
| | 1,163 |
| | (182 | ) | | 4/23/2013 | | 2008 | |
| Kum & Go | | Bentonville | | AR | | — |
| | 587 |
| | 1,370 |
| | (13 | ) | | 1,944 |
| | (317 | ) | | 11/20/2012 | | 2009 | | Rogers | | AR | | — |
| | 668 |
| | 1,559 |
| | — |
| | 2,227 |
| | (487 | ) | | 11/20/2012 | | 2008 |
| Kum & Go | | Lowell | | AR | | — |
| | 774 |
| | 1,437 |
| | — |
| | 2,211 |
| | (333 | ) | | 11/20/2012 | | 2009 | | Sherwood | | AR | | — |
| | 866 |
| | 1,609 |
| | — |
| | 2,475 |
| | (510 | ) | | 9/28/2012 | | 2012 |
| Kum & Go | | Paragould | | AR | | — |
| | 708 |
| | 2,123 |
| | — |
| | 2,831 |
| | (512 | ) | | 9/28/2012 | | 2012 | | Fountain | | CO | | — |
| | 1,131 |
| | 1,696 |
| | — |
| | 2,827 |
| | (526 | ) | | 12/24/2012 | | 2012 |
| Kum & Go | | Rogers | | AR | | — |
| | 668 |
| | 1,559 |
| | — |
| | 2,227 |
| | (361 | ) | | 11/20/2012 | | 2008 | | Monument | | CO | | — |
| | 1,192 |
| | 1,457 |
| | — |
| | 2,649 |
| | (452 | ) | | 12/24/2012 | | 2012 |
| Kum & Go | | Sherwood | | AR | | — |
| | 866 |
| | 1,609 |
| | — |
| | 2,475 |
| | (388 | ) | | 9/28/2012 | | 2012 | | Muscatine | | IA | | — |
| | 794 |
| | 1,853 |
| | — |
| | 2,647 |
| | (575 | ) | | 12/27/2012 | | 2012 |
| Kum & Go | | Fountain | | CO | | — |
| | 1,131 |
| | 1,696 |
| | — |
| | 2,827 |
| | (385 | ) | | 12/24/2012 | | 2012 | | Ottumwa | | IA | | — |
| | 586 |
| | 1,368 |
| | — |
| | 1,954 |
| | (428 | ) | | 11/20/2012 | | 1998 |
| Kum & Go | | Monument | | CO | | — |
| | 1,192 |
| | 1,457 |
| | — |
| | 2,649 |
| | (331 | ) | | 12/24/2012 | | 2012 | | Sloan | | IA | | — |
| | 447 |
| | 2,162 |
| | — |
| | 2,609 |
| | (668 | ) | | 2/7/2014 | | 2008 |
| Kum & Go | | Muscatine | | IA | | — |
| | 794 |
| | 1,853 |
| | — |
| | 2,647 |
| | (421 | ) | | 12/27/2012 | | 2012 | | Story City | | IA | | — |
| | 223 |
| | 2,089 |
| | — |
| | 2,312 |
| | (574 | ) | | 2/7/2014 | | 2006 |
| Kum & Go | | Ottumwa | | IA | | — |
| | 586 |
| | 1,368 |
| | — |
| | 1,954 |
| | (317 | ) | | 11/20/2012 | | 1998 | | Tipton | | IA | | — |
| | 507 |
| | 1,945 |
| | — |
| | 2,452 |
| | (629 | ) | | 2/7/2014 | | 2008 |
| Kum & Go | | Sloan | | IA | | — |
| | 447 |
| | 2,162 |
| | — |
| | 2,609 |
| | (394 | ) | | 2/7/2014 | | 2008 | | Waukee | | IA | | — |
| | 1,280 |
| | 1,280 |
| | — |
| | 2,560 |
| | (388 | ) | | 3/28/2013 | | 2012 |
| Kum & Go | | Story City | | IA | | — |
| | 223 |
| | 2,089 |
| | — |
| | 2,312 |
| | (339 | ) | | 2/7/2014 | | 2006 | | West Branch | | IA | | — |
| | 219 |
| | 1,089 |
| | — |
| | 1,308 |
| | (296 | ) | | 2/7/2014 | | 1997 |
| Kum & Go | | Tipton | | IA | | — |
| | 507 |
| | 1,945 |
| | — |
| | 2,452 |
| | (371 | ) | | 2/7/2014 | | 2008 | | Joplin | | MO | | — |
| | 218 |
| | 782 |
| | — |
| | 1,000 |
| | (281 | ) | | 2/11/2014 | | 1987 |
| Kum & Go | | Waukee | | IA | | — |
| | 1,280 |
| | 1,280 |
| | — |
| | 2,560 |
| | (273 | ) | | 3/28/2013 | | 2012 | | Joplin | | MO | | — |
| | 205 |
| | 594 |
| | — |
| | 799 |
| | (216 | ) | | 2/11/2014 | | 1986 |
| Kum & Go | | West Branch | | IA | | — |
| | 219 |
| | 1,089 |
| | — |
| | 1,308 |
| | (174 | ) | | 2/7/2014 | | 1997 | | Neosho | | MO | | — |
| | 504 |
| | 1,144 |
| | — |
| | 1,648 |
| | (319 | ) | | 2/11/2014 | | 1997 |
| Kum & Go | | Joplin | | MO | | — |
| | 218 |
| | 782 |
| | — |
| | 1,000 |
| | (167 | ) | | 2/11/2014 | | 1987 | | Tioga | | ND | | — |
| | 318 |
| | 2,863 |
| | — |
| | 3,181 |
| | (895 | ) | | 11/8/2012 | | 2012 |
| Kum & Go | | Joplin | | MO | | — |
| | 314 |
| | 1,610 |
| | — |
| | 1,924 |
| | (267 | ) | | 2/11/2014 | | 1984 | | Muskogee | | OK | | — |
| | 423 |
| | 1,691 |
| | — |
| | 2,114 |
| | (497 | ) | | 7/22/2013 | | 2013 |
| Kum & Go | | Joplin | | MO | | — |
| | 127 |
| | 300 |
| | — |
| | 427 |
| | (66 | ) | | 2/11/2014 | | 1973 | | Muskogee | | OK | | — |
| | 97 |
| | 973 |
| | — |
| | 1,070 |
| | (210 | ) | | 9/30/2014 | | 1999 |
| Kum & Go | | Joplin | | MO | | — |
| | 205 |
| | 594 |
| | — |
| | 799 |
| | (128 | ) | | 2/11/2014 | | 1986 | | Cheyenne | | WY | | — |
| | 411 |
| | 2,327 |
| | — |
| | 2,738 |
| | (722 | ) | | 12/27/2012 | | 2012 |
| Kum & Go | | Neosho | | MO | | — |
| | 504 |
| | 1,144 |
| | — |
| | 1,648 |
| | (190 | ) | | 2/11/2014 | | 1997 | | Gillette | | WY | | — |
| | 878 |
| | 2,048 |
| | — |
| | 2,926 |
| | (606 | ) | | 6/28/2013 | | 2013 |
| Kum & Go | | Tioga | | ND | | — |
| | 318 |
| | 2,863 |
| | — |
| | 3,181 |
| | (663 | ) | | 11/8/2012 | | 2012 | |
| Kum & Go | | Muskogee | | OK | | — |
| | 423 |
| | 1,691 |
| | — |
| | 2,114 |
| | (328 | ) | | 7/22/2013 | | 2013 | |
| Kum & Go | | Muskogee | | OK | | — |
| | 97 |
| | 973 |
| | — |
| | 1,070 |
| | (112 | ) | | 9/30/2014 | | 1999 | |
| Kum & Go | | Cheyenne | | WY | | — |
| | 411 |
| | 2,327 |
| | — |
| | 2,738 |
| | (528 | ) | | 12/27/2012 | | 2012 | |
| Kum & Go | | Gillette | | WY | | — |
| | 878 |
| | 2,048 |
| | — |
| | 2,926 |
| | (407 | ) | | 6/28/2013 | | 2013 | |
| L.A. Fitness | | Avondale | | AZ | | — |
| | 2,253 |
| | 9,040 |
| | — |
| | 11,293 |
| | (1,405 | ) | | 2/7/2014 | | 2006 | |
| L.A. Fitness | | Glendale | | AZ | | 3,135 |
| | 2,177 |
| | 7,568 |
| | 20 |
| | 9,765 |
| | (1,277 | ) | | 2/7/2014 | | 2005 | |
| L.A. Fitness | | Marana | | AZ | | — |
| | 1,284 |
| | 8,322 |
| | — |
| | 9,606 |
| | (1,346 | ) | | 2/7/2014 | | 2011 | |
| L.A. Fitness | | Highland | | CA | | 4,610 |
| | 2,274 |
| | 8,673 |
| | — |
| | 10,947 |
| | (1,491 | ) | | 2/7/2014 | | 2009 | |
| L.A. Fitness | | Boynton | | FL | | — |
| | 1,485 |
| | 9,945 |
| | — |
| | 11,430 |
| | (37 | ) | | 11/22/2016 | | 2005 | |
| LA Fitness | | | Avondale | | AZ | | — |
| | 2,253 |
| | 9,040 |
| | — |
| | 11,293 |
| | (2,382 | ) | | 2/7/2014 | | 2006 |
| LA Fitness | | | Glendale | | AZ | | 3,049 |
| | 2,177 |
| | 7,568 |
| | 20 |
| | 9,765 |
| | (2,166 | ) | | 2/7/2014 | | 2005 |
| LA Fitness | | | Marana | | AZ | | — |
| | 1,284 |
| | 8,322 |
| | — |
| | 9,606 |
| | (2,282 | ) | | 2/7/2014 | | 2011 |
| LA Fitness | | | Highland | | CA | | 4,481 |
| | 2,274 |
| | 8,673 |
| | — |
| | 10,947 |
| | (2,528 | ) | | 2/7/2014 | | 2009 |
| LA Fitness | | | Boynton Beach | | FL | | — |
| | 1,485 |
| | 9,945 |
| | — |
| | 11,430 |
| | (631 | ) | | 11/22/2016 | | 2005 |
| LA Fitness | | | Miami | | FL | | — |
| | 2,730 |
| | 8,671 |
| | — |
| | 11,401 |
| | (566 | ) | | 11/22/2016 | | 2015 |
| LA Fitness | | | Tampa | | FL | | — |
| | 1,084 |
| | 6,500 |
| | — |
| | 7,584 |
| | (254 | ) | | 11/13/2017 | | 2016 |
| LA Fitness | | | Broadview | | IL | | — |
| | 3,345 |
| | 8,763 |
| | 276 |
| | 12,384 |
| | (2,349 | ) | | 2/7/2014 | | 2010 |
| LA Fitness | | | Oswego | | IL | | — |
| | 3,163 |
| | 8,749 |
| | — |
| | 11,912 |
| | (2,433 | ) | | 2/7/2014 | | 2008 |
| LA Fitness | | | Tinley Park | | IL | | — |
| | 1,722 |
| | 8,976 |
| | — |
| | 10,698 |
| | (260 | ) | | 12/22/2017 | | 2006 |
| LA Fitness | | | Carmel | | IN | | — |
| | 1,457 |
| | 9,562 |
| | — |
| | 11,019 |
| | (2,526 | ) | | 2/7/2014 | | 2008 |
| LA Fitness | | | Indianapolis | | IN | | — |
| | 1,279 |
| | 8,970 |
| | — |
| | 10,249 |
| | (2,370 | ) | | 2/7/2014 | | 2009 |
| LA Fitness | | | St. Clair Shores | | MI | | — |
| | 2,163 |
| | 6,787 |
| | — |
| | 8,950 |
| | (480 | ) | | 11/22/2016 | | 1982 |
| | | | | | Initial Costs (1) | | Costs Capitalized Subsequent to Acquisition (2) | | Gross Amount
Carried at
December 31, 2016
(3) (4) | | | | | | Initial Costs (1) | | Costs Capitalized Subsequent to Acquisition (2) | | Gross Amount
Carried at
December 31, 2018
(3) (4) | | | |
| Property | | City | | State | | Encumbrances at
December 31, 2016 | | Land | | Buildings, Fixtures and Improvements | | Accumulated Depreciation
(3) (5) | | Date Acquired | | Date of Construction | | City | | State | | Encumbrances at
December 31, 2018 | | Land | | Buildings, Fixtures and Improvements | | Accumulated Depreciation
(3) (5) | | Date Acquired | | Date of Construction |
| L.A. Fitness | | Miami | | FL | | — |
| | 2,730 |
| | 8,671 |
| | — |
| | 11,401 |
| | (33 | ) | | 11/22/2016 | | 2015 | |
| L.A. Fitness | | Broadview | | IL | | — |
| | 3,345 |
| | 8,763 |
| | — |
| | 12,108 |
| | (1,380 | ) | | 2/7/2014 | | 2010 | |
| L.A. Fitness | | Oswego | | IL | | — |
| | 3,163 |
| | 8,749 |
| | — |
| | 11,912 |
| | (1,435 | ) | | 2/7/2014 | | 2008 | |
| L.A. Fitness | | Carmel | | IN | | — |
| | 1,457 |
| | 9,562 |
| | — |
| | 11,019 |
| | (1,490 | ) | | 2/7/2014 | | 2008 | |
| L.A. Fitness | | Indianapolis | | IN | | — |
| | 1,279 |
| | 8,970 |
| | — |
| | 10,249 |
| | (1,398 | ) | | 2/7/2014 | | 2009 | |
| L.A. Fitness | | St. Clair Shores | | MI | | — |
| | 2,163 |
| | 6,787 |
| | — |
| | 8,950 |
| | (28 | ) | | 11/22/2016 | | 1982 | |
| L.A. Fitness | | Oakdale | | MN | | 4,749 |
| | 2,315 |
| | 8,315 |
| | — |
| | 10,630 |
| | (1,351 | ) | | 2/7/2014 | | 2009 | |
| L.A. Fitness | | Edmond | | OK | | — |
| | 962 |
| | 6,916 |
| | — |
| | 7,878 |
| | (972 | ) | | 3/31/2014 | | 2014 | |
| L.A. Fitness | | Easton | | PA | | — |
| | 938 |
| | 10,600 |
| | — |
| | 11,538 |
| | (1,659 | ) | | 2/7/2014 | | 1979 | |
| L.A. Fitness | | Dallas | | TX | | 4,712 |
| | 2,629 |
| | 10,413 |
| | — |
| | 13,042 |
| | (1,542 | ) | | 2/7/2014 | | 2008 | |
| L.A. Fitness | | Denton | | TX | | 3,884 |
| | 1,888 |
| | 9,568 |
| | (6 | ) | | 11,450 |
| | (1,458 | ) | | 2/7/2014 | | 2009 | |
| L.A. Fitness | | Duncanville | | TX | | — |
| | 1,538 |
| | 10,023 |
| | — |
| | 11,561 |
| | (1,502 | ) | | 2/7/2014 | | 2007 | |
| L.A. Fitness | | McKinney | | TX | | — |
| | 2,039 |
| | 7,787 |
| | — |
| | 9,826 |
| | (30 | ) | | 11/22/2016 | | 2005 | |
| L.A. Fitness | | Spring | | TX | | — |
| | 1,970 |
| | 9,290 |
| | — |
| | 11,260 |
| | (1,412 | ) | | 2/7/2014 | | 2006 | |
| LA Fitness | | | Oakdale | | MN | | 4,749 |
| | 2,315 |
| | 8,315 |
| | — |
| | 10,630 |
| | (2,291 | ) | | 2/7/2014 | | 2009 |
| LA Fitness | | | Webster | | NY | | — |
| | 2,922 |
| | 5,102 |
| | — |
| | 8,024 |
| | (227 | ) | | 8/1/2017 | | 2014 |
| LA Fitness | | | Edmond | | OK | | — |
| | 962 |
| | 6,916 |
| | — |
| | 7,878 |
| | (1,668 | ) | | 3/31/2014 | | 2014 |
| LA Fitness | | | Easton | | PA | | — |
| | 938 |
| | 10,600 |
| | 139 |
| | 11,677 |
| | (2,818 | ) | | 2/7/2014 | | 1979 |
| LA Fitness | | | Memphis | | TN | | — |
| | 1,466 |
| | 7,348 |
| | — |
| | 8,814 |
| | (109 | ) | | 7/26/2018 | | 2014 |
| LA Fitness | | | Dallas | | TX | | 4,712 |
| | 2,629 |
| | 10,413 |
| | — |
| | 13,042 |
| | (2,615 | ) | | 2/7/2014 | | 2008 |
| LA Fitness | | | Denton | | TX | | 3,775 |
| | 1,888 |
| | 9,568 |
| | (6 | ) | | 11,450 |
| | (2,473 | ) | | 2/7/2014 | | 2009 |
| LA Fitness | | | Duncanville | | TX | | — |
| | 1,538 |
| | 10,023 |
| | — |
| | 11,561 |
| | (2,548 | ) | | 2/7/2014 | | 2007 |
| LA Fitness | | | Mckinney | | TX | | — |
| | 2,039 |
| | 7,787 |
| | — |
| | 9,826 |
| | (516 | ) | | 11/22/2016 | | 2005 |
| LA Fitness | | | Rowlett | | TX | | — |
| | 2,539 |
| | 7,668 |
| | 406 |
| | 10,613 |
| | (403 | ) | | 4/11/2017 | | 2006 |
| LA Fitness | | | Spring | | TX | | — |
| | 1,970 |
| | 9,290 |
| | — |
| | 11,260 |
| | (2,394 | ) | | 2/7/2014 | | 2006 |
| Lamrite West | | | Strongsville | | OH | | — |
| | 3,078 |
| | 34,076 |
| | — |
| | 37,154 |
| | (1,238 | ) | | 8/21/2017 | | 1999 |
| Leeann Chin | | Blaine | | MN | | — |
| | 480 |
| | 528 |
| | — |
| | 1,008 |
| | (101 | ) | | 6/27/2013 | | 1995 | | Blaine | | MN | | — |
| | 480 |
| | 528 |
| | — |
| | 1,008 |
| | (155 | ) | | 6/27/2013 | | 1995 |
| Leeann Chin | | Chanhassen | | MN | | — |
| | 450 |
| | 763 |
| | — |
| | 1,213 |
| | (146 | ) | | 6/27/2013 | | 1995 | | Chanhassen | | MN | | — |
| | 450 |
| | 763 |
| | — |
| | 1,213 |
| | (224 | ) | | 6/27/2013 | | 1995 |
| Leeann Chin | | Golden Valley | | MN | | — |
| | 270 |
| | 776 |
| | — |
| | 1,046 |
| | (149 | ) | | 6/27/2013 | | 1995 | | Golden Valley | | MN | | — |
| | 270 |
| | 776 |
| | — |
| | 1,046 |
| | (228 | ) | | 6/27/2013 | | 1995 |
| Lee's Famous Recipe Chicken | | Florissant | | MO | | — |
| | 306 |
| | 560 |
| | — |
| | 866 |
| | (110 | ) | | 6/27/2013 | | 1984 | | Florissant | | MO | | — |
| | 306 |
| | 560 |
| | — |
| | 866 |
| | (166 | ) | | 6/27/2013 | | 1984 |
| Lee's Famous Recipe Chicken | | St. Ann | | MO | | — |
| | 187 |
| | 571 |
| | — |
| | 758 |
| | (112 | ) | | 6/27/2013 | | 1984 | | St. Ann | | MO | | — |
| | 187 |
| | 571 |
| | — |
| | 758 |
| | (169 | ) | | 6/27/2013 | | 1984 |
| Lee's Famous Recipe Chicken | | St. Louis | | MO | | — |
| | 107 |
| | 874 |
| | — |
| | 981 |
| | (172 | ) | | 6/27/2013 | | 1984 | | St. Louis | | MO | | — |
| | 107 |
| | 874 |
| | — |
| | 981 |
| | (259 | ) | | 6/27/2013 | | 1984 |
| Lifetime Dentistry Chickasha | | | Chickasha | | OK | | — |
| | 100 |
| | 186 |
| | — |
| | 286 |
| | (58 | ) | | 6/27/2013 | | 1995 |
| Logan's Roadhouse | | Huntsville | | AL | | — |
| | 520 |
| | 4,797 |
| | (1,363 | ) | | 3,954 |
| | (344 | ) | | 6/27/2013 | | 1995 | | Huntsville | | AL | | — |
| | 520 |
| | 4,797 |
| | (1,363 | ) | | 3,954 |
| | (750 | ) | | 6/27/2013 | | 1995 |
| Logan's Roadhouse | | Fayetteville | | AR | | — |
| | 1,570 |
| | 2,182 |
| | (953 | ) | | 2,799 |
| | (151 | ) | | 6/27/2013 | | 1995 | | Fayetteville | | AR | | — |
| | 1,570 |
| | 2,182 |
| | (953 | ) | | 2,799 |
| | (329 | ) | | 6/27/2013 | | 1995 |
| Logan's Roadhouse | | Hattiesburg | | MS | | — |
| | 890 |
| | 4,012 |
| | (803 | ) | | 4,099 |
| | (320 | ) | | 6/27/2013 | | 1995 | | Hattiesburg | | MS | | — |
| | 890 |
| | 4,012 |
| | (803 | ) | | 4,099 |
| | (698 | ) | | 6/27/2013 | | 1995 |
| Logan's Roadhouse | | Owasso | | OK | | — |
| | 1,449 |
| | 2,173 |
| | (568 | ) | | 3,054 |
| | (175 | ) | | 7/31/2013 | | 2006 | | Owasso | | OK | | ��� |
| | 1,449 |
| | 2,173 |
| | (568 | ) | | 3,054 |
| | (385 | ) | | 7/31/2013 | | 2006 |
| Logan's Roadhouse | | Clarksville | | TN | | — |
| | 1,010 |
| | 4,424 |
| | (1,264 | ) | | 4,170 |
| | (324 | ) | | 6/27/2013 | | 1995 | | Clarksville | | TN | | — |
| | 1,010 |
| | 4,424 |
| | (1,264 | ) | | 4,170 |
| | (706 | ) | | 6/27/2013 | | 1995 |
| Logan's Roadhouse | | Cleveland | | TN | | — |
| | 890 |
| | 3,902 |
| | (1,225 | ) | | 3,567 |
| | (277 | ) | | 6/27/2013 | | 1995 | | Cleveland | | TN | | — |
| | 890 |
| | 3,902 |
| | (1,225 | ) | | 3,567 |
| | (604 | ) | | 6/27/2013 | | 1995 |
| Logan's Roadhouse | | El Paso | | TX | | — |
| | 320 |
| | 4,731 |
| | (1,558 | ) | | 3,493 |
| | (317 | ) | | 6/27/2013 | | 1995 | | El Paso | | TX | | — |
| | 320 |
| | 4,731 |
| | (1,558 | ) | | 3,493 |
| | (691 | ) | | 6/27/2013 | | 1995 |
| Long John Silver's / A&W | | Merced | | CA | | — |
| | 174 |
| | 695 |
| | — |
| | 869 |
| | (127 | ) | | 7/31/2013 | | 1982 | | Merced | | CA | | — |
| | 174 |
| | 695 |
| | — |
| | 869 |
| | (195 | ) | | 7/31/2013 | | 1982 |
| Long John Silver's / A&W | | Collinsville | | IL | | — |
| | 220 |
| | 940 |
| | — |
| | 1,160 |
| | (184 | ) | | 6/27/2013 | | 2006 | | Collinsville | | IL | | — |
| | 220 |
| | 940 |
| | — |
| | 1,160 |
| | (278 | ) | | 6/27/2013 | | 2006 |
| Long John Silver's / A&W | | Fairview Heights | | IL | | — |
| | 258 |
| | 525 |
| | — |
| | 783 |
| | (103 | ) | | 6/27/2013 | | 1976 | | Fairview Heights | | IL | | — |
| | 258 |
| | 525 |
| | — |
| | 783 |
| | (155 | ) | | 6/27/2013 | | 1976 |
| Long John Silver's / A&W | | Jacksonville | | IL | | — |
| | 171 |
| | 431 |
| | — |
| | 602 |
| | (85 | ) | | 6/27/2013 | | 1978 | | Jacksonville | | IL | | — |
| | 171 |
| | 431 |
| | — |
| | 602 |
| | (128 | ) | | 6/27/2013 | | 1978 |
| Long John Silver's / A&W | | Litchfield | | IL | | — |
| | 194 |
| | 996 |
| | — |
| | 1,190 |
| | (195 | ) | | 6/27/2013 | | 1986 | | Litchfield | | IL | | — |
| | 194 |
| | 996 |
| | — |
| | 1,190 |
| | (295 | ) | | 6/27/2013 | | 1986 |
| | | | | | Initial Costs (1) | | Costs Capitalized Subsequent to Acquisition (2) | | Gross Amount
Carried at
December 31, 2016
(3) (4) | | | | | | Initial Costs (1) | | Costs Capitalized Subsequent to Acquisition (2) | | Gross Amount
Carried at
December 31, 2018
(3) (4) | | | |
| Property | | City | | State | | Encumbrances at
December 31, 2016 | | Land | | Buildings, Fixtures and Improvements | | Accumulated Depreciation
(3) (5) | | Date Acquired | | Date of Construction | | City | | State | | Encumbrances at
December 31, 2018 | | Land | | Buildings, Fixtures and Improvements | | Accumulated Depreciation
(3) (5) | | Date Acquired | | Date of Construction |
| Long John Silver's / A&W | | Marion | | IL | | — |
| | 305 |
| | 1,059 |
| | — |
| | 1,364 |
| | (208 | ) | | 6/27/2013 | | 1983 | | Marion | | IL | | — |
| | 305 |
| | 1,059 |
| | (925 | ) | | 439 |
| | — |
| | 6/27/2013 | | 1983 |
| Long John Silver's / A&W | | Mount Carmel | | IL | | — |
| | 105 |
| | 484 |
| | — |
| | 589 |
| | (95 | ) | | 6/27/2013 | | 1977 | | Mount Carmel | | IL | | — |
| | 105 |
| | 484 |
| | — |
| | 589 |
| | (143 | ) | | 6/27/2013 | | 1977 |
| Long John Silver's / A&W | | Vandalia | | IL | | — |
| | 101 |
| | 484 |
| | — |
| | 585 |
| | (95 | ) | | 6/27/2013 | | 1976 | | Vandalia | | IL | | — |
| | 101 |
| | 484 |
| | (375 | ) | | 210 |
| | — |
| | 6/27/2013 | | 1976 |
| Long John Silver's / A&W | | West Frankfort | | IL | | — |
| | 244 |
| | 996 |
| | — |
| | 1,240 |
| | (195 | ) | | 6/27/2013 | | 1977 | | West Frankfort | | IL | | — |
| | 244 |
| | 996 |
| | (836 | ) | | 404 |
| | — |
| | 6/27/2013 | | 1977 |
| Long John Silver's / A&W | | Wood River | | IL | | — |
| | 251 |
| | 314 |
| | — |
| | 565 |
| | (62 | ) | | 6/27/2013 | | 1975 | | Wood River | | IL | | — |
| | 251 |
| | 314 |
| | — |
| | 565 |
| | (93 | ) | | 6/27/2013 | | 1975 |
| Long John Silver's / A&W | | Garden City | | KS | | — |
| | 120 |
| | 530 |
| | — |
| | 650 |
| | (104 | ) | | 6/27/2013 | | 1978 | | Garden City | | KS | | — |
| | 120 |
| | 530 |
| | — |
| | 650 |
| | (157 | ) | | 6/27/2013 | | 1978 |
| Long John Silver's / A&W | | Hays | | KS | | — |
| | 160 |
| | 624 |
| | — |
| | 784 |
| | (122 | ) | | 6/27/2013 | | 1994 | | Hays | | KS | | — |
| | 160 |
| | 624 |
| | — |
| | 784 |
| | (185 | ) | | 6/27/2013 | | 1994 |
| Long John Silver's / A&W | | Clovis | | NM | | — |
| | 210 |
| | 705 |
| | (377 | ) | | 538 |
| | (17 | ) | | 6/27/2013 | | 1995 | | Clovis | | NM | | — |
| | 210 |
| | 705 |
| | (377 | ) | | 538 |
| | (63 | ) | | 6/27/2013 | | 1995 |
| Long John Silver's / A&W | | Las Cruces | | NM | | — |
| | 242 |
| | 565 |
| | (277 | ) | | 530 |
| | (13 | ) | | 7/31/2013 | | 1975 | | Fairborn | | OH | | — |
| | 103 |
| | 300 |
| | — |
| | 403 |
| | (89 | ) | | 6/27/2013 | | 1976 |
| Long John Silver's / A&W | | Englewood | | OH | | — |
| | 547 |
| | — |
| | — |
| | 547 |
| | — |
| | 6/27/2013 | | 1974 | | Penn Hills | | PA | | — |
| | 438 |
| | 656 |
| | — |
| | 1,094 |
| | (184 | ) | | 7/31/2013 | | 1993 |
| Long John Silver's / A&W | | Fairborn | | OH | | — |
| | 103 |
| | 300 |
| | — |
| | 403 |
| | (59 | ) | | 6/27/2013 | | 1976 | | Austin | | TX | | — |
| | 459 |
| | 477 |
| | — |
| | 936 |
| | (141 | ) | | 6/27/2013 | | 1993 |
| Long John Silver's / A&W | | Penn Hills | | PA | | — |
| | 438 |
| | 656 |
| | — |
| | 1,094 |
| | (120 | ) | | 7/31/2013 | | 1993 | |
| Long John Silver's / A&W | | Austin | | TX | | — |
| | 459 |
| | 477 |
| | — |
| | 936 |
| | (94 | ) | | 6/27/2013 | | 1993 | |
| Long John Silver's / KFC | | Green Bay | | WI | | — |
| | 748 |
| | 563 |
| | — |
| | 1,311 |
| | (111 | ) | | 6/27/2013 | | 1978 | | Green Bay | | WI | | — |
| | 748 |
| | 563 |
| | — |
| | 1,311 |
| | (167 | ) | | 6/27/2013 | | 1978 |
| Long John Silver's / Taco Bell | | Ashtabula | | OH | | — |
| | 440 |
| | 1,640 |
| | — |
| | 2,080 |
| | (314 | ) | | 6/27/2013 | | 1995 | | Ashtabula | | OH | | — |
| | 440 |
| | 1,640 |
| | — |
| | 2,080 |
| | (481 | ) | | 6/27/2013 | | 1995 |
| LongHorn Steakhouse | | Tampa | | FL | | — |
| | 370 |
| | 1,852 |
| | — |
| | 2,222 |
| | (367 | ) | | 6/27/2013 | | 1995 | |
| Longhorn Steakhouse | | | Tampa | | FL | | — |
| | 370 |
| | 1,852 |
| | — |
| | 2,222 |
| | (557 | ) | | 6/27/2013 | | 1995 |
| Longhorn Steakhouse | | | Paducah | | KY | | — |
| | 1,121 |
| | 1,443 |
| | (2,072 | ) | | 492 |
| | (6 | ) | | 2/7/2014 | | 1995 |
| Los Tios Mexican Restaurant | | Dalton | | OH | | — |
| | 18 |
| | 30 |
| | — |
| | 48 |
| | (6 | ) | | 6/27/2013 | | 1990 | | Dalton | | OH | | — |
| | 18 |
| | 30 |
| | — |
| | 48 |
| | (9 | ) | | 6/27/2013 | | 1990 |
| Lowe's | | Jonesboro | | AR | | — |
| | 2,101 |
| | 8,405 |
| | 85 |
| | 10,591 |
| | (1,124 | ) | | 5/19/2014 | | 1994 | | Jonesboro | | AR | | — |
| | 2,101 |
| | 8,405 |
| | 185 |
| | 10,691 |
| | (2,011 | ) | | 5/19/2014 | | 1994 |
| Lowe's | | Burlington | | IA | | — |
| | 2,775 |
| | 8,191 |
| | 760 |
| | 11,726 |
| | (1,123 | ) | | 2/7/2014 | | 1996 | | Burlington | | IA | | — |
| | 2,775 |
| | 8,191 |
| | 819 |
| | 11,785 |
| | (1,932 | ) | | 2/7/2014 | | 1996 |
| Lowe's | | Florence | | KY | | — |
| | 4,814 |
| | 10,189 |
| | — |
| | 15,003 |
| | (1,393 | ) | | 2/7/2014 | | 1997 | | Florence | | KY | | — |
| | 4,814 |
| | 10,189 |
| | 250 |
| | 15,253 |
| | (2,368 | ) | | 2/7/2014 | | 1997 |
| Lowe's | | New Orleans | | LA | | 13,766 |
| | 10,315 |
| | 20,728 |
| | — |
| | 31,043 |
| | (3,233 | ) | | 11/5/2013 | | 2005 | | New Orleans | | LA | | 12,332 |
| | 10,315 |
| | 20,728 |
| | — |
| | 31,043 |
| | (5,256 | ) | | 11/5/2013 | | 2005 |
| Lowe's | | Sanford | | ME | | 4,672 |
| | 4,045 |
| | — |
| | — |
| | 4,045 |
| | — |
| | 2/7/2014 | | 2009 | | Sanford | | ME | | 4,672 |
| | 4,045 |
| | — |
| | — |
| | 4,045 |
| | — |
| | 2/7/2014 | | 2009 |
| Lowe's | | Windham | | ME | | 7,930 |
| | 12,640 |
| | — |
| | — |
| | 12,640 |
| | — |
| | 6/3/2013 | | 2006 | | Windham | | ME | | 7,930 |
| | 12,640 |
| | — |
| | — |
| | 12,640 |
| | — |
| | 6/3/2013 | | 2006 |
| Lowe's | | Benton Harbor | | MI | | — |
| | 1,011 |
| | 7,851 |
| | 206 |
| | 9,068 |
| | (1,105 | ) | | 3/17/2014 | | 1994 | | Benton Harbor | | MI | | — |
| | 1,011 |
| | 7,851 |
| | 245 |
| | 9,107 |
| | (1,934 | ) | | 3/17/2014 | | 1994 |
| Lowe's | | Kansas City | | MO | | — |
| | 3,729 |
| | — |
| | — |
| | 3,729 |
| | — |
| | 2/7/2014 | | 2009 | | Kansas City | | MO | | — |
| | 3,729 |
| | — |
| | — |
| | 3,729 |
| | — |
| | 2/7/2014 | | 2009 |
| Lowe's | | Las Vegas | | NV | | — |
| | 11,499 |
| | — |
| | — |
| | 11,499 |
| | — |
| | 2/7/2014 | | 2002 | | Las Vegas | | NV | | — |
| | 11,499 |
| | — |
| | — |
| | 11,499 |
| | — |
| | 2/7/2014 | | 2002 |
| Lowe's | | Ticonderoga | | NY | | 4,345 |
| | 1,812 |
| | — |
| | — |
| | 1,812 |
| | — |
| | 2/7/2014 | | 2009 | | Ticonderoga | | NY | | 4,345 |
| | 1,812 |
| | — |
| | — |
| | 1,812 |
| | — |
| | 2/7/2014 | | 2009 |
| Lowe's | | West Carrollton | | OH | | 6,375 |
| | 2,864 |
| | 9,883 |
| | — |
| | 12,747 |
| | (1,272 | ) | | 2/7/2014 | | 1994 | | West Carrollton | | OH | | — |
| | 2,864 |
| | 9,883 |
| | — |
| | 12,747 |
| | (2,157 | ) | | 2/7/2014 | | 1994 |
| Lowe's | | Columbia | | SC | | — |
| | 5,485 |
| | — |
| | — |
| | 5,485 |
| | — |
| | 2/7/2014 | | 1994 | | Columbia | | SC | | — |
| | 5,485 |
| | — |
| | — |
| | 5,485 |
| | — |
| | 2/7/2014 | | 1994 |
| Lowe's | | Texas City | | TX | | — |
| | 2,313 |
| | 9,253 |
| | — |
| | 11,566 |
| | (1,688 | ) | | 5/19/2014 | | 1995 | | Texas City | | TX | | — |
| | 2,313 |
| | 9,253 |
| | — |
| | 11,566 |
| | (2,984 | ) | | 5/19/2014 | | 1995 |
| Lube Stop | | Akron | | OH | | — |
| | 79 |
| | 287 |
| | — |
| | 366 |
| | (31 | ) | | 9/2/2014 | | 1988 | |
| Lube Stop | | Akron | | OH | | — |
| | 135 |
| | 761 |
| | — |
| | 896 |
| | (85 | ) | | 9/2/2014 | | 1995 | |
| Lumber Liquidators | | | Saginaw | | MI | | — |
| | 287 |
| | 502 |
| | — |
| | 789 |
| | (128 | ) | | 5/28/2014 | | 2000 |
| Mad Max | | | Fond Du Lac | | WI | | — |
| | 303 |
| | 1,212 |
| | — |
| | 1,515 |
| | (20 | ) | | 7/17/2018 | | 2007 |
| Mad Max | | | Fond Du Lac | | WI | | — |
| | 1,484 |
| | 2,511 |
| | — |
| | 3,995 |
| | (27 | ) | | 7/17/2018 | | 1974 |
|
| | | | | | | | | | | | | | | | | | | | | | | | | | |
| | | | | | | | Initial Costs (1) | | Costs Capitalized Subsequent to Acquisition (2) | | Gross Amount
Carried at
December 31, 2016
(3) (4) | | | | | | |
| Property | | City | | State | | Encumbrances at
December 31, 2016 | | Land | | Buildings, Fixtures and Improvements | | | Accumulated Depreciation
(3) (5) | | Date Acquired | | Date of Construction |
| Lube Stop | | Akron | | OH | | — |
| | 205 |
| | 1,043 |
| | — |
| | 1,248 |
| | (113 | ) | | 9/2/2014 | | 1992 |
| Lube Stop | | Bedford Heights | | OH | | — |
| | 156 |
| | 529 |
| | — |
| | 685 |
| | (63 | ) | | 9/2/2014 | | 1986 |
| Lube Stop | | Cleveland | | OH | | — |
| | 127 |
| | 559 |
| | — |
| | 686 |
| | (61 | ) | | 9/2/2014 | | 1988 |
| Lube Stop | | Fairview Park | | OH | | — |
| | 205 |
| | 179 |
| | — |
| | 384 |
| | (29 | ) | | 9/2/2014 | | 1988 |
| Lube Stop | | Lakewood | | OH | | — |
| | 205 |
| | 765 |
| | — |
| | 970 |
| | (85 | ) | | 9/2/2014 | | 1993 |
| Lube Stop | | Mayfield Heights | | OH | | — |
| | 201 |
| | 430 |
| | — |
| | 631 |
| | (50 | ) | | 9/2/2014 | | 1988 |
| Lube Stop | | Medina | | OH | | — |
| | 135 |
| | 414 |
| | — |
| | 549 |
| | (50 | ) | | 9/2/2014 | | 1995 |
| Lube Stop | | N. Barberton | | OH | | — |
| | 140 |
| | 502 |
| | — |
| | 642 |
| | (54 | ) | | 9/2/2014 | | 1998 |
| Lube Stop | | Painesville | | OH | | — |
| | 276 |
| | 208 |
| | — |
| | 484 |
| | (30 | ) | | 9/2/2014 | | 1988 |
| Lube Stop | | Parma | | OH | | — |
| | 124 |
| | 390 |
| | — |
| | 514 |
| | (41 | ) | | 9/2/2014 | | 1986 |
| Lube Stop | | Parma | | OH | | — |
| | 306 |
| | 502 |
| | — |
| | 808 |
| | (61 | ) | | 9/2/2014 | | 1986 |
| Lube Stop | | Seven Hills | | OH | | — |
| | 182 |
| | 201 |
| | — |
| | 383 |
| | (28 | ) | | 9/2/2014 | | 1987 |
| Lube Stop | | Solon | | OH | | — |
| | 233 |
| | 487 |
| | — |
| | 720 |
| | (55 | ) | | 9/2/2014 | | 1992 |
| Lube Stop | | South Euclid | | OH | | — |
| | 109 |
| | 561 |
| | — |
| | 670 |
| | (56 | ) | | 9/2/2014 | | 1986 |
| Lube Stop | | Stow | | OH | | — |
| | 230 |
| | 132 |
| | — |
| | 362 |
| | (20 | ) | | 9/2/2014 | | 1988 |
| Lube Stop | | Westlake | | OH | | — |
| | 85 |
| | 525 |
| | — |
| | 610 |
| | (52 | ) | | 9/2/2014 | | 1999 |
| Lube Stop | | Willoughby | | OH | | — |
| | 168 |
| | 425 |
| | — |
| | 593 |
| | (46 | ) | | 9/2/2014 | | 1986 |
| Lumber Liquidators | | Saginaw | | MI | | — |
| | 287 |
| | 502 |
| | — |
| | 789 |
| | (73 | ) | | 5/28/2014 | | 2000 |
| Macaroni Grill | | Flanders | | NJ | | 915 |
| | 1,468 |
| | 883 |
| | — |
| | 2,351 |
| | (130 | ) | | 2/7/2014 | | 2003 |
| Macaroni Grill | | W. Windsor | | NJ | | 1,043 |
| | 1,307 |
| | 1,498 |
| | — |
| | 2,805 |
| | (210 | ) | | 2/7/2014 | | 1998 |
| Mars Petcare | | Columbia | | SC | | — |
| | 1,875 |
| | 19,591 |
| | (987 | ) | | 20,479 |
| | (2,438 | ) | | 11/5/2013 | | 2014 |
| Mattress Firm | | Daphne | | AL | | — |
| | 528 |
| | 1,233 |
| | — |
| | 1,761 |
| | (222 | ) | | 10/1/2013 | | 2013 |
| Mattress Firm | | Dothan | | AL | | — |
| | 406 |
| | 1,217 |
| | — |
| | 1,623 |
| | (248 | ) | | 5/14/2013 | | 2013 |
| Mattress Firm | | Rogers | | AR | | — |
| | 321 |
| | 1,284 |
| | — |
| | 1,605 |
| | (279 | ) | | 2/6/2013 | | 2012 |
| Mattress Firm | | Destin | | FL | | — |
| | 693 |
| | 1,287 |
| | — |
| | 1,980 |
| | (256 | ) | | 6/5/2013 | | 2013 |
| Mattress Firm | | Melbourne | | FL | | — |
| | 405 |
| | 1,237 |
| | — |
| | 1,642 |
| | (192 | ) | | 2/7/2014 | | 2011 |
| Mattress Firm | | Tallahassee | | FL | | — |
| | 924 |
| | 1,386 |
| | — |
| | 2,310 |
| | (282 | ) | | 5/14/2013 | | 2013 |
| Mattress Firm | | Boise | | ID | | — |
| | 335 |
| | 1,339 |
| | — |
| | 1,674 |
| | (291 | ) | | 2/22/2013 | | 2013 |
| Mattress Firm | | Garden City | | ID | | — |
| | 492 |
| | 1,305 |
| | — |
| | 1,797 |
| | (191 | ) | | 2/26/2014 | | 2003 |
| Mattress Firm | | Fairview Heights | | IL | | — |
| | 231 |
| | 958 |
| | — |
| | 1,189 |
| | (163 | ) | | 2/7/2014 | | 1977 |
| Mattress Firm | | Columbus | | IN | | — |
| | 157 |
| | 891 |
| | — |
| | 1,048 |
| | (206 | ) | | 11/6/2012 | | 1964 |
| Mattress Firm | | Evansville | | IN | | — |
| | 117 |
| | 2,227 |
| | — |
| | 2,344 |
| | (485 | ) | | 2/11/2013 | | 1995 |
|
| | | | | | | | | | | | | | | | | | | | | | | | | | |
| | | | | | | | Initial Costs (1) | | Costs Capitalized Subsequent to Acquisition (2) | | Gross Amount
Carried at
December 31, 2018
(3) (4) | | | | | | |
| Property | | City | | State | | Encumbrances at
December 31, 2018 | | Land | | Buildings, Fixtures and Improvements | | | Accumulated Depreciation
(3) (5) | | Date Acquired | | Date of Construction |
| Mad Max | | Fond Du Lac | | WI | | — |
| | 133 |
| | 272 |
| | — |
| | 405 |
| | (6 | ) | | 7/17/2018 | | 1952 |
| Mad Max | | Port Washington | | WI | | — |
| | 191 |
| | 568 |
| | — |
| | 759 |
| | (11 | ) | | 7/17/2018 | | 1991 |
| Mad Max | | Port Washington | | WI | | — |
| | 533 |
| | 733 |
| | — |
| | 1,266 |
| | (14 | ) | | 7/17/2018 | | 1996 |
| Mad Max | | Sheboygan | | WI | | — |
| | 354 |
| | 318 |
| | — |
| | 672 |
| | (7 | ) | | 7/17/2018 | | 1996 |
| Mad Max | | West Bend | | WI | | — |
| | 463 |
| | 710 |
| | — |
| | 1,173 |
| | (13 | ) | | 7/17/2018 | | 2012 |
| Mad Max | | West Bend | | WI | | — |
| | 483 |
| | 965 |
| | — |
| | 1,448 |
| | (16 | ) | | 7/17/2018 | | 2016 |
| Mad Max | | West Bend | | WI | | — |
| | 278 |
| | 315 |
| | — |
| | 593 |
| | (7 | ) | | 7/17/2018 | | 1986 |
| Mad Max | | West Bend | | WI | | — |
| | 333 |
| | 570 |
| | — |
| | 903 |
| | (10 | ) | | 7/17/2018 | | 1999 |
| Mars Petcare | | Columbia | | SC | | — |
| | 1,875 |
| | 19,591 |
| | (985 | ) | | 20,481 |
| | (3,634 | ) | | 11/5/2013 | | 2014 |
| Marshall's Convenience Stores | | Cascade | | WI | | — |
| | 32 |
| | 436 |
| | — |
| | 468 |
| | (6 | ) | | 8/30/2018 | | 1991 |
| Marshall's Convenience Stores | | Elkhart Lake | | WI | | — |
| | 283 |
| | 955 |
| | — |
| | 1,238 |
| | (14 | ) | | 8/30/2018 | | 1985 |
| Marshall's Convenience Stores | | Glenbeulah | | WI | | — |
| | 45 |
| | 605 |
| | — |
| | 650 |
| | (9 | ) | | 8/30/2018 | | 2008 |
| Marshall's Convenience Stores | | Kewaskum | | WI | | — |
| | 253 |
| | 468 |
| | — |
| | 721 |
| | (7 | ) | | 8/30/2018 | | 1999 |
| Marshall's Convenience Stores | | Plymouth | | WI | | — |
| | 82 |
| | 318 |
| | — |
| | 400 |
| | (5 | ) | | 8/30/2018 | | 1984 |
| Marshall's Convenience Stores | | Plymouth | | WI | | — |
| | 199 |
| | 539 |
| | — |
| | 738 |
| | (9 | ) | | 8/30/2018 | | 2005 |
| Mastec | | Houston | | TX | | — |
| | 369 |
| | 2,669 |
| | — |
| | 3,038 |
| | (550 | ) | | 6/12/2014 | | 2012 |
| Mattress Firm | | Daphne | | AL | | — |
| | 528 |
| | 1,233 |
| | — |
| | 1,761 |
| | (353 | ) | | 10/1/2013 | | 2013 |
| Mattress Firm | | Dothan | | AL | | — |
| | 406 |
| | 1,217 |
| | — |
| | 1,623 |
| | (363 | ) | | 5/14/2013 | | 2013 |
| Mattress Firm | | Rogers | | AR | | — |
| | 321 |
| | 1,284 |
| | — |
| | 1,605 |
| | (392 | ) | | 2/6/2013 | | 2012 |
| Mattress Firm | | Destin | | FL | | — |
| | 693 |
| | 1,287 |
| | — |
| | 1,980 |
| | (381 | ) | | 6/5/2013 | | 2013 |
| Mattress Firm | | Tallahassee | | FL | | — |
| | 924 |
| | 1,386 |
| | — |
| | 2,310 |
| | (414 | ) | | 5/14/2013 | | 2013 |
| Mattress Firm | | Fairview Heights | | IL | | — |
| | 231 |
| | 958 |
| | — |
| | 1,189 |
| | (276 | ) | | 2/7/2014 | | 1977 |
| Mattress Firm | | Columbus | | IN | | — |
| | 157 |
| | 891 |
| | — |
| | 1,048 |
| | (278 | ) | | 11/6/2012 | | 1964 |
| Mattress Firm | | Evansville | | IN | | — |
| | 117 |
| | 2,227 |
| | — |
| | 2,344 |
| | (680 | ) | | 2/11/2013 | | 1995 |
| Mattress Firm | | Goshen | | IN | | — |
| | 211 |
| | 1,555 |
| | — |
| | 1,766 |
| | (381 | ) | | 3/20/2014 | | 2013 |
| Mattress Firm | | South Bend | | IN | | — |
| | 289 |
| | 2,445 |
| | — |
| | 2,734 |
| | (611 | ) | | 2/24/2014 | | 2013 |
| Mattress Firm | | Lafayette | | LA | | 1,194 |
| | — |
| | 1,251 |
| | — |
| | 1,251 |
| | (373 | ) | | 5/2/2013 | | 1995 |
| Mattress Firm | | Flint | | MI | | — |
| | 467 |
| | 1,323 |
| | — |
| | 1,790 |
| | (272 | ) | | 8/19/2014 | | 2014 |
| Mattress Firm | | Flint | | MI | | — |
| | 409 |
| | 1,164 |
| | — |
| | 1,573 |
| | (208 | ) | | 10/3/2014 | | 2014 |
| Mattress Firm | | Goldsboro | | NC | | — |
| | 349 |
| | 1,385 |
| | — |
| | 1,734 |
| | (274 | ) | | 5/29/2014 | | 2014 |
| Mattress Firm | | Painesville | | OH | | — |
| | 437 |
| | 1,318 |
| | — |
| | 1,755 |
| | (286 | ) | | 7/10/2014 | | 2014 |
| | | | | | Initial Costs (1) | | Costs Capitalized Subsequent to Acquisition (2) | | Gross Amount
Carried at
December 31, 2016
(3) (4) | | | | | | Initial Costs (1) | | Costs Capitalized Subsequent to Acquisition (2) | | Gross Amount
Carried at
December 31, 2018
(3) (4) | | | |
| Property | | City | | State | | Encumbrances at
December 31, 2016 | | Land | | Buildings, Fixtures and Improvements | | Accumulated Depreciation
(3) (5) | | Date Acquired | | Date of Construction | | City | | State | | Encumbrances at
December 31, 2018 | | Land | | Buildings, Fixtures and Improvements | | Accumulated Depreciation
(3) (5) | | Date Acquired | | Date of Construction |
| Mattress Firm | | Goshen | | IN | | — |
| | 211 |
| | 1,555 |
| | — |
| | 1,766 |
| | (222 | ) | | 3/20/2014 | | 2013 | | Johnstown | | PA | | — |
| | 389 |
| | 906 |
| | 745 |
| | 2,040 |
| | (281 | ) | | 7/31/2013 | | 1995 |
| Mattress Firm | | Mishawaka | | IN | | — |
| | 375 |
| | 1,500 |
| | — |
| | 1,875 |
| | (291 | ) | | 7/30/2013 | | 2013 | | Florence | | SC | | — |
| | 398 |
| | 929 |
| | (8 | ) | | 1,319 |
| | (287 | ) | | 12/7/2012 | | 2012 |
| Mattress Firm | | South Bend | | IN | | — |
| | 289 |
| | 2,445 |
| | — |
| | 2,734 |
| | (360 | ) | | 2/24/2014 | | 2013 | | Rock Hill | | SC | | — |
| | 385 |
| | 898 |
| | — |
| | 1,283 |
| | (262 | ) | | 8/21/2013 | | 2008 |
| Mattress Firm | | Bowling Green | | KY | | — |
| | 648 |
| | 973 |
| | — |
| | 1,621 |
| | (203 | ) | | 4/25/2013 | | 2012 | | Knoxville | | TN | | — |
| | 586 |
| | 1,088 |
| | — |
| | 1,674 |
| | (330 | ) | | 3/19/2013 | | 2012 |
| Mattress Firm | | Lafayette | | LA | | 1,194 |
| | — |
| | 1,251 |
| | — |
| | 1,251 |
| | (255 | ) | | 5/2/2013 | | 1995 | | Nederland | | TX | | — |
| | 311 |
| | 1,245 |
| | — |
| | 1,556 |
| | (395 | ) | | 9/26/2012 | | 1997 |
| Mattress Firm | | Flint | | MI | | — |
| | 467 |
| | 1,323 |
| | — |
| | 1,790 |
| | (147 | ) | | 8/19/2014 | | 2014 | | Bountiful | | UT | | — |
| | 736 |
| | 1,367 |
| | — |
| | 2,103 |
| | (424 | ) | | 12/31/2012 | | 2012 |
| Mattress Firm | | Flint | | MI | | — |
| | 409 |
| | 1,164 |
| | — |
| | 1,573 |
| | (110 | ) | | 10/3/2014 | | 2014 | | Spokane | | WA | | — |
| | 409 |
| | 1,685 |
| | — |
| | 2,094 |
| | (517 | ) | | 4/4/2013 | | 2013 |
| Mattress Firm | | Goldsboro | | NC | | — |
| | 349 |
| | 1,385 |
| | — |
| | 1,734 |
| | (156 | ) | | 5/29/2014 | | 2014 | | Spokane | | WA | | — |
| | 511 |
| | 1,582 |
| | — |
| | 2,093 |
| | (490 | ) | | 3/28/2013 | | 2013 |
| Mattress Firm | | Greenville | | NC | | — |
| | 1,085 |
| | 1,085 |
| | — |
| | 2,170 |
| | (246 | ) | | 12/12/2012 | | 2012 | |
| Mattress Firm | | Raleigh | | NC | | — |
| | 1,091 |
| | 1,091 |
| | — |
| | 2,182 |
| | (263 | ) | | 9/28/2012 | | 1997 | |
| Mattress Firm | | Wilmington | | NC | | — |
| | 412 |
| | 1,257 |
| | — |
| | 1,669 |
| | (270 | ) | | 3/29/2013 | | 2013 | |
| Mattress Firm | | Wilson | | NC | | — |
| | 373 |
| | 692 |
| | — |
| | 1,065 |
| | (167 | ) | | 9/28/2012 | | 2012 | |
| Mattress Firm | | Painesville | | OH | | — |
| | 437 |
| | 1,318 |
| | — |
| | 1,755 |
| | (158 | ) | | 7/10/2014 | | 2014 | |
| Mattress Firm | | Johnstown | | PA | | — |
| | 389 |
| | 906 |
| | 745 |
| | 2,040 |
| | (115 | ) | | 7/31/2013 | | 1995 | |
| Mattress Firm | | Florence | | SC | | — |
| | 398 |
| | 929 |
| | (8 | ) | | 1,319 |
| | (210 | ) | | 12/7/2012 | | 2012 | |
| Mattress Firm | | Rock Hill | | SC | | — |
| | 385 |
| | 898 |
| | — |
| | 1,283 |
| | (170 | ) | | 8/21/2013 | | 2008 | |
| Mattress Firm | | Knoxville | | TN | | — |
| | 586 |
| | 1,088 |
| | — |
| | 1,674 |
| | (232 | ) | | 3/19/2013 | | 2012 | |
| Mattress Firm | | Nederland | | TX | | — |
| | 311 |
| | 1,245 |
| | — |
| | 1,556 |
| | (300 | ) | | 9/26/2012 | | 1997 | |
| Mattress Firm | | Bountiful | | UT | | — |
| | 736 |
| | 1,367 |
| | — |
| | 2,103 |
| | (310 | ) | | 12/31/2012 | | 2012 | |
| Mattress Firm | | Spokane | | WA | | — |
| | 409 |
| | 1,685 |
| | — |
| | 2,094 |
| | (357 | ) | | 4/4/2013 | | 2013 | |
| Mattress Firm | | Spokane | | WA | | — |
| | 511 |
| | 1,582 |
| | — |
| | 2,093 |
| | (343 | ) | | 3/28/2013 | | 2013 | |
| McAlisters | | Murfreesboro | | TN | | — |
| | 310 |
| | 720 |
| | — |
| | 1,030 |
| | (143 | ) | | 6/27/2013 | | 1995 | | Murfreesboro | | TN | | — |
| | 310 |
| | 720 |
| | — |
| | 1,030 |
| | (217 | ) | | 6/27/2013 | | 1995 |
| McAlisters | | Sherman | | TX | | — |
| | 563 |
| | 1,223 |
| | — |
| | 1,786 |
| | (184 | ) | | 5/16/2014 | | 2013 | | Sherman | | TX | | — |
| | 563 |
| | 1,223 |
| | — |
| | 1,786 |
| | (324 | ) | | 5/16/2014 | | 2013 |
| McAlisters | | Waco | | TX | | — |
| | 429 |
| | 791 |
| | — |
| | 1,220 |
| | (139 | ) | | 3/27/2014 | | 2000 | | Waco | | TX | | — |
| | 429 |
| | 791 |
| | — |
| | 1,220 |
| | (238 | ) | | 3/27/2014 | | 2000 |
| McDonald's | | Scotland Neck | | NC | | — |
| | 320 |
| | — |
| | — |
| | 320 |
| | — |
| | 6/27/2013 | | 2005 | | Scotland Neck | | NC | | — |
| | 320 |
| | — |
| | — |
| | 320 |
| | — |
| | 6/27/2013 | | 2005 |
| MDC Holdings Inc. | | | Denver | | CO | | — |
| | 12,648 |
| | 66,398 |
| | 397 |
| | 79,443 |
| | (17,105 | ) | | 11/5/2013 | | 2001 |
| MedAssets | | Plano | | TX | | — |
| | 10,432 |
| | 45,650 |
| | — |
| | 56,082 |
| | (5,839 | ) | | 2/7/2014 | | 2013 | | Plano | | TX | | — |
| | 10,432 |
| | 45,650 |
| | — |
| | 56,082 |
| | (9,902 | ) | | 2/7/2014 | | 2013 |
| The Medicines Co. | | | Parsippany | | NJ | | 27,700 |
| | 5,150 |
| | 50,051 |
| | 748 |
| | 55,949 |
| | (11,324 | ) | | 2/7/2014 | | 2009 |
| Melrose Park Center | | Melrose Park | | IL | | — |
| | 6,143 |
| | 10,515 |
| | 598 |
| | 17,256 |
| | (1,556 | ) | | 2/7/2014 | | 2006 | | Melrose Park | | IL | | — |
| | 6,143 |
| | 10,515 |
| | 597 |
| | 17,255 |
| | (2,664 | ) | | 2/7/2014 | | 2006 |
| Mercer Well Services | | Cleburne | | TX | | — |
| | 262 |
| | 369 |
| | — |
| | 631 |
| | (47 | ) | | 6/25/2014 | | 2008 | |
| Merrill Lynch | | Hopewell | | NJ | | 74,250 |
| | 17,619 |
| | 108,349 |
| | (12,142 | ) | | 113,826 |
| | (4,265 | ) | | 2/7/2014 | | 2001 | | Hopewell | | NJ | | 74,250 |
| | 17,619 |
| | 108,349 |
| | (12,141 | ) | | 113,827 |
| | (15,642 | ) | | 2/7/2014 | | 2001 |
| Metro PCS | | Richardson | | TX | | 7,813 |
| | 1,292 |
| | 19,606 |
| | 6 |
| | 20,904 |
| | (3,157 | ) | | 11/5/2013 | | 1986 | |
| Metro by T-Mobile | | | Richardson | | TX | | 7,489 |
| | 1,292 |
| | 19,606 |
| | 769 |
| | 21,667 |
| | (5,161 | ) | | 11/5/2013 | | 1986 |
| Mezcal Mexican Restaurant | | Grafton | | OH | | — |
| | 64 |
| | 191 |
| | — |
| | 255 |
| | (39 | ) | | 7/31/2013 | | 1990 | | Grafton | | OH | | — |
| | 64 |
| | 191 |
| | — |
| | 255 |
| | (60 | ) | | 7/31/2013 | | 1990 |
| Michael's | | Lafayette | | LA | | — |
| | 1,831 |
| | 3,631 |
| | — |
| | 5,462 |
| | (619 | ) | | 2/7/2014 | | 2011 | |
| Michaels | | | Lancaster | | CA | | — |
| | 7,744 |
| | 33,872 |
| | — |
| | 41,616 |
| | (1,113 | ) | | 11/20/2017 | | 1998 |
| Michaels | | | Lafayette | | LA | | — |
| | 1,831 |
| | 3,631 |
| | — |
| | 5,462 |
| | (1,049 | ) | | 2/7/2014 | | 2011 |
| Michaels | | | Phoenix | | AZ | | — |
| | 2,325 |
| | 5,948 |
| | — |
| | 8,273 |
| | (126 | ) | | 5/31/2018 | | 1997 |
| Michelin | | | Louisville | | KY | | — |
| | 1,120 |
| | 7,763 |
| | — |
| | 8,883 |
| | (2,403 | ) | | 11/5/2013 | | 2011 |
| Millenium Chem | | | Glen Burnie | | MD | | — |
| | 2,127 |
| | 23,198 |
| | (3,894 | ) | | 21,431 |
| | (2,794 | ) | | 2/21/2014 | | 1984 |
| Mills Fleet Farm | | | Cedar Falls | | IA | | — |
| | — |
| | 3,501 |
| | — |
| | 3,501 |
| | — |
| | 12/21/2018 | | N/A |
| Mister Car Wash | | | Florence | | AL | | — |
| | 198 |
| | 1,376 |
| | 3 |
| | 1,577 |
| | (49 | ) | | 10/17/2017 | | 2008 |
| Mister Car Wash | | | Florence | | AL | | — |
| | 404 |
| | 1,605 |
| | 3 |
| | 2,012 |
| | (70 | ) | | 10/17/2017 | | 2016 |
| Mister Car Wash | | | Muscle Shoals | | AL | | — |
| | 378 |
| | 1,445 |
| | 3 |
| | 1,826 |
| | (55 | ) | | 10/17/2017 | | 2008 |
| Mister Car Wash | | | Grand Rapids | | MI | | — |
| | 662 |
| | 777 |
| | — |
| | 1,439 |
| | (36 | ) | | 5/16/2017 | | 2002 |
| Mister Car Wash | | | Grand Rapids | | MI | | — |
| | 779 |
| | 1,600 |
| | — |
| | 2,379 |
| | (77 | ) | | 4/18/2017 | | 2001 |
| Mister Car Wash | | | Grand Rapids | | MI | | — |
| | 721 |
| | 996 |
| | — |
| | 1,717 |
| | (45 | ) | | 5/16/2017 | | 1984 |
| Mister Car Wash | | | Grand Rapids | | MI | | — |
| | 458 |
| | 938 |
| | — |
| | 1,396 |
| | (44 | ) | | 5/16/2017 | | 1961 |
| | | | | | Initial Costs (1) | | Costs Capitalized Subsequent to Acquisition (2) | | Gross Amount
Carried at
December 31, 2016
(3) (4) | | | | | | Initial Costs (1) | | Costs Capitalized Subsequent to Acquisition (2) | | Gross Amount
Carried at
December 31, 2018
(3) (4) | | | |
| Property | | City | | State | | Encumbrances at
December 31, 2016 | | Land | | Buildings, Fixtures and Improvements | | Accumulated Depreciation
(3) (5) | | Date Acquired | | Date of Construction | | City | | State | | Encumbrances at
December 31, 2018 | | Land | | Buildings, Fixtures and Improvements | | Accumulated Depreciation
(3) (5) | | Date Acquired | | Date of Construction |
| Michelin | | Louisville | | KY | | — |
| | 1,120 |
| | 7,763 |
| | — |
| | 8,883 |
| | (1,480 | ) | | 11/5/2013 | | 2011 | |
| Millenium Chem | | Glen Burnie | | MD | | — |
| | 2,127 |
| | 23,198 |
| | (3,895 | ) | | 21,430 |
| | (761 | ) | | 2/21/2014 | | 1984 | |
| Miraca Life Sciences | | Irving | | TX | | — |
| | 3,237 |
| | 37,297 |
| | 371 |
| | 40,905 |
| | (5,203 | ) | | 4/28/2014 | | 1997 | |
| Mister Car Wash | | | Grand Rapids | | MI | | — |
| | 554 |
| | 902 |
| | — |
| | 1,456 |
| | (11 | ) | | 8/15/2018 | | 1976 |
| Mister Car Wash | | | Jenison | | MI | | — |
| | 393 |
| | 915 |
| | — |
| | 1,308 |
| | (10 | ) | | 8/15/2018 | | 1977 |
| Mister Car Wash | | | Kentwood | | MI | | — |
| | 238 |
| | 877 |
| | — |
| | 1,115 |
| | (42 | ) | | 5/16/2017 | | 1979 |
| Monro Muffler | | Lewiston | | ME | | — |
| | 279 |
| | 1,115 |
| | — |
| | 1,394 |
| | (234 | ) | | 5/10/2013 | | 1976 | | Lewiston | | ME | | — |
| | 279 |
| | 1,115 |
| | — |
| | 1,394 |
| | (348 | ) | | 5/10/2013 | | 1976 |
| Monro Muffler | | Waukesha | | WI | | — |
| | 228 |
| | 684 |
| | — |
| | 912 |
| | (137 | ) | | 7/23/2013 | | 2002 | | Waukesha | | WI | | — |
| | 228 |
| | 684 |
| | — |
| | 912 |
| | (210 | ) | | 7/23/2013 | | 2002 |
| Monterey's Tex Mex | | Tulsa | | OK | | — |
| | 135 |
| | 406 |
| | (326 | ) | | 215 |
| | (6 | ) | | 7/31/2013 | | 2001 | | Tulsa | | OK | | — |
| | 135 |
| | 406 |
| | (326 | ) | | 215 |
| | (20 | ) | | 7/31/2013 | | 2001 |
| Moonshine | | | Austin | | TX | | — |
| | 837 |
| | 1,797 |
| | — |
| | 2,634 |
| | (546 | ) | | 6/27/2013 | | 1998 |
| MotoMart | | St. Charles | | MO | | — |
| | 1,085 |
| | 1,980 |
| | — |
| | 3,065 |
| | (351 | ) | | 2/7/2014 | | 2009 | | St. Charles | | MO | | — |
| | 1,085 |
| | 1,980 |
| | — |
| | 3,065 |
| | (595 | ) | | 2/7/2014 | | 2009 |
| Mrs. Baird's | | Dallas | | TX | | — |
| | 453 |
| | 4,077 |
| | — |
| | 4,530 |
| | (1,109 | ) | | 7/11/2012 | | 2002 | |
| MS Energy Service | | Midland | | TX | | — |
| | 1,165 |
| | 948 |
| | — |
| | 2,113 |
| | (120 | ) | | 6/12/2014 | | 2012 | | Midland | | TX | | — |
| | 1,165 |
| | 948 |
| | — |
| | 2,113 |
| | (214 | ) | | 6/12/2014 | | 2012 |
| My Dentist | | Chickasha | | OK | | — |
| | 100 |
| | 186 |
| | — |
| | 286 |
| | (38 | ) | | 6/27/2013 | | 1995 | |
| N/A - Billboard | | Memphis | | TN | | — |
| | 33 |
| | — |
| | — |
| | 33 |
| | — |
| | 7/31/2013 | | 1995 | | Memphis | | TN | | — |
| | 33 |
| | — |
| | — |
| | 33 |
| | — |
| | 7/31/2013 | | 1995 |
| N/A - Billboard | | Memphis | | TN | | — |
| | 63 |
| | — |
| | — |
| | 63 |
| | — |
| | 7/31/2013 | | 1995 | | Memphis | | TN | | — |
| | 63 |
| | — |
| | — |
| | 63 |
| | — |
| | 7/31/2013 | | 1995 |
| N/A - Billboard | | Memphis | | TN | | — |
| | 73 |
| | — |
| | — |
| | 73 |
| | — |
| | 7/31/2013 | | 1995 | | Memphis | | TN | | — |
| | 73 |
| | — |
| | — |
| | 73 |
| | — |
| | 7/31/2013 | | 1995 |
| N/A - Billboard | | Memphis | | TN | | — |
| | 90 |
| | — |
| | — |
| | 90 |
| | — |
| | 7/31/2013 | | 1995 | | Memphis | | TN | | — |
| | 90 |
| | — |
| | — |
| | 90 |
| | — |
| | 7/31/2013 | | 1995 |
| N/A - Parking Lot | | Kingston | | PA | | — |
| | 29 |
| | — |
| | — |
| | 29 |
| | — |
| | 6/27/2013 | | 1995 | | Kingston | | PA | | — |
| | 29 |
| | — |
| | — |
| | 29 |
| | — |
| | 6/27/2013 | | 1995 |
| National Tire & Battery | | St. Louis | | MO | | — |
| | 756 |
| | 924 |
| | — |
| | 1,680 |
| | (226 | ) | | 10/31/2012 | | 1998 | | Morrow | | GA | | — |
| | 397 |
| | 1,586 |
| | — |
| | 1,983 |
| | (548 | ) | | 6/5/2012 | | 1992 |
| National Tire & Battery | | Nashville | | TN | | 799 |
| | 603 |
| | 1,373 |
| | — |
| | 1,976 |
| | (199 | ) | | 2/7/2014 | | 1978 | | St. Louis | | MO | | — |
| | 756 |
| | 924 |
| | — |
| | 1,680 |
| | (308 | ) | | 10/31/2012 | | 1998 |
| National Tire & Battery | | | Nashville | | TN | | 799 |
| | 603 |
| | 1,373 |
| | — |
| | 1,976 |
| | (337 | ) | | 2/7/2014 | | 1978 |
| Natural Grocers | | | Gilbert | | AZ | | — |
| | 2,113 |
| | 3,211 |
| | — |
| | 5,324 |
| | (177 | ) | | 3/1/2017 | | 2016 |
| Natural Grocers | | | Gilbert | | AZ | | — |
| | 2,100 |
| | 3,231 |
| | — |
| | 5,331 |
| | (178 | ) | | 3/1/2017 | | 2016 |
| Natural Grocers | | | Tucson | | AZ | | — |
| | 1,571 |
| | 3,637 |
| | — |
| | 5,208 |
| | (228 | ) | | 3/1/2017 | | 2016 |
| Natural Grocers | | Salem | | OR | | — |
| | 1,339 |
| | 3,886 |
| | — |
| | 5,225 |
| | (600 | ) | | 2/7/2014 | | 2013 | | Salem | | OR | | — |
| | 1,339 |
| | 3,886 |
| | — |
| | 5,225 |
| | (1,017 | ) | | 2/7/2014 | | 2013 |
| Nestle Holdings | | Breinigsville | | PA | | — |
| | — |
| | 66,948 |
| | 11 |
| | 66,959 |
| | (12,762 | ) | | 11/5/2013 | | 1994 | | Breinigsville | | PA | | — |
| | 7,381 |
| | 66,948 |
| | — |
| | 74,329 |
| | (20,730 | ) | | 11/5/2013 | | 1994 |
| Nomac Drilling | | Houston | | TX | | — |
| | 369 |
| | 2,669 |
| | — |
| | 3,038 |
| | (315 | ) | | 6/12/2014 | | 2012 | |
| Northern Tool & Equipment | | Ocala | | FL | | 1,620 |
| | 1,693 |
| | 2,727 |
| | — |
| | 4,420 |
| | (421 | ) | | 2/7/2014 | | 2008 | | Ocala | | FL | | 1,574 |
| | 1,693 |
| | 2,727 |
| | — |
| | 4,420 |
| | (713 | ) | | 2/7/2014 | | 2008 |
| Northrop Grumman | | El Segundo | | CA | | — |
| | 15,935 |
| | 67,908 |
| | — |
| | 83,843 |
| | (8,353 | ) | | 6/27/2014 | | 1972 | | El Segundo | | CA | | — |
| | 15,935 |
| | 67,908 |
| | — |
| | 83,843 |
| | (14,927 | ) | | 6/27/2014 | | 1972 |
| NTW | | Morrow | | GA | | — |
| | 397 |
| | 1,586 |
| | — |
| | 1,983 |
| | (418 | ) | | 6/5/2012 | | 1992 | |
| NTT Data | | | Lincoln | | NE | | — |
| | 2,812 |
| | 25,566 |
| | — |
| | 28,378 |
| | (5,837 | ) | | 2/7/2014 | | 2009 |
| O'Charley's | | Dalton | | GA | | — |
| | 406 |
| | 1,817 |
| | — |
| | 2,223 |
| | (369 | ) | | 6/27/2013 | | 1993 | | Dalton | | GA | | — |
| | 406 |
| | 1,817 |
| | — |
| | 2,223 |
| | (552 | ) | | 6/27/2013 | | 1993 |
| O'Charley's | | Tucker | | GA | | — |
| | 1,037 |
| | 866 |
| | — |
| | 1,903 |
| | (176 | ) | | 6/27/2013 | | 1993 | | Tucker | | GA | | — |
| | 1,037 |
| | 866 |
| | — |
| | 1,903 |
| | (263 | ) | | 6/27/2013 | | 1993 |
| Old Country Buffet | | Burbank | | CA | | — |
| | 246 |
| | 1,309 |
| | (1,094 | ) | | 461 |
| | (30 | ) | | 1/8/2014 | | 2001 | |
| Old Country Buffet | | Fresno | | CA | | — |
| | 326 |
| | 1,306 |
| | (1,282 | ) | | 350 |
| | (25 | ) | | 1/8/2014 | | 2003 | | Burbank | | CA | | — |
| | 246 |
| | 1,309 |
| | (1,094 | ) | | 461 |
| | (112 | ) | | 1/8/2014 | | 2001 |
| Olive Garden | | Edmonton | | AB | | — |
| | 2,870 |
| | 452 |
| | — |
| | 3,322 |
| | (48 | ) | | 7/28/2014 | | 1990 | | Flagstaff | | AZ | | — |
| | 875 |
| | 455 |
| | — |
| | 1,330 |
| | (80 | ) | | 7/28/2014 | | 1996 |
| Olive Garden | | Edmonton | | AB | | — |
| | 2,946 |
| | 461 |
| | — |
| | 3,407 |
| | (49 | ) | | 7/28/2014 | | 1990 | | Altamonte Springs | | FL | | — |
| | 699 |
| | 4,023 |
| | — |
| | 4,722 |
| | (556 | ) | | 7/28/2014 | | 2006 |
| Olive Garden | | Flagstaff | | AZ | | — |
| | 875 |
| | 455 |
| | — |
| | 1,330 |
| | (44 | ) | | 7/28/2014 | | 1996 | | Leesburg | | FL | | — |
| | 692 |
| | 1,837 |
| | — |
| | 2,529 |
| | (238 | ) | | 7/28/2014 | | 1990 |
| Olive Garden | | Altamonte Springs | | FL | | — |
| | 699 |
| | 4,023 |
| | — |
| | 4,722 |
| | (307 | ) | | 7/28/2014 | | 2006 | | Port Charlotte | | FL | | — |
| | 1,454 |
| | 4,156 |
| | — |
| | 5,610 |
| | (496 | ) | | 7/28/2014 | | 1990 |
| Olive Garden | | Leesburg | | FL | | — |
| | 692 |
| | 1,837 |
| | — |
| | 2,529 |
| | (131 | ) | | 7/28/2014 | | 1990 | |
| | | | | | Initial Costs (1) | | Costs Capitalized Subsequent to Acquisition (2) | | Gross Amount
Carried at
December 31, 2016
(3) (4) | | | | | | Initial Costs (1) | | Costs Capitalized Subsequent to Acquisition (2) | | Gross Amount
Carried at
December 31, 2018
(3) (4) | | | |
| Property | | City | | State | | Encumbrances at
December 31, 2016 | | Land | | Buildings, Fixtures and Improvements | | Accumulated Depreciation
(3) (5) | | Date Acquired | | Date of Construction | | City | | State | | Encumbrances at
December 31, 2018 | | Land | | Buildings, Fixtures and Improvements | | Accumulated Depreciation
(3) (5) | | Date Acquired | | Date of Construction |
| Olive Garden | | Port Charlotte | | FL | | — |
| | 1,454 |
| | 4,156 |
| | — |
| | 5,610 |
| | (274 | ) | | 7/28/2014 | | 1990 | |
| Olive Garden | | Winnipeg | | MB | | — |
| | 1,640 |
| | 1,444 |
| | — |
| | 3,084 |
| | (107 | ) | | 7/28/2014 | | 1989 | |
| Olive Garden | | Salisbury | | MD | | — |
| | 1,171 |
| | 3,144 |
| | — |
| | 4,315 |
| | (214 | ) | | 7/28/2014 | | 1995 | | Salisbury | | MD | | — |
| | 1,171 |
| | 3,144 |
| | — |
| | 4,315 |
| | (388 | ) | | 7/28/2014 | | 1995 |
| Olive Garden | | Cary | | NC | | — |
| | 1,545 |
| | 6,603 |
| | — |
| | 8,148 |
| | (425 | ) | | 7/28/2014 | | 1992 | | Cary | | NC | | — |
| | 1,545 |
| | 6,603 |
| | — |
| | 8,148 |
| | (771 | ) | | 7/28/2014 | | 1992 |
| Olive Garden | | Oklahoma City | | OK | | — |
| | 819 |
| | 4,053 |
| | — |
| | 4,872 |
| | (269 | ) | | 7/28/2014 | | 1991 | | Oklahoma City | | OK | | — |
| | 819 |
| | 4,053 |
| | — |
| | 4,872 |
| | (487 | ) | | 7/28/2014 | | 1991 |
| Olive Garden | | Langhorne | | PA | | — |
| | 970 |
| | 3,717 |
| | — |
| | 4,687 |
| | (246 | ) | | 7/28/2014 | | 1996 | | Langhorne | | PA | | — |
| | 970 |
| | 3,717 |
| | — |
| | 4,687 |
| | (446 | ) | | 7/28/2014 | | 1996 |
| Olive Garden | | Pittsburgh | | PA | | — |
| | 1,560 |
| | 1,422 |
| | — |
| | 2,982 |
| | (129 | ) | | 7/28/2014 | | 2003 | | Pittsburgh | | PA | | — |
| | 1,560 |
| | 1,422 |
| | — |
| | 2,982 |
| | (233 | ) | | 7/28/2014 | | 2003 |
| Olive Garden | | Houston | | TX | | — |
| | 973 |
| | 2,902 |
| | — |
| | 3,875 |
| | (198 | ) | | 7/28/2014 | | 1994 | | Houston | | TX | | — |
| | 973 |
| | 2,902 |
| | — |
| | 3,875 |
| | (359 | ) | | 7/28/2014 | | 1994 |
| Olive Garden | | Chesapeake | | VA | | — |
| | 1,382 |
| | 2,252 |
| | — |
| | 3,634 |
| | (159 | ) | | 7/28/2014 | | 1991 | | Chesapeake | | VA | | — |
| | 1,382 |
| | 2,252 |
| | — |
| | 3,634 |
| | (289 | ) | | 7/28/2014 | | 1991 |
| Olive Garden | | Manassas | | VA | | — |
| | 1,965 |
| | 2,585 |
| | — |
| | 4,550 |
| | (179 | ) | | 7/28/2014 | | 1993 | | Manassas | | VA | | — |
| | 1,965 |
| | 2,585 |
| | — |
| | 4,550 |
| | (324 | ) | | 7/28/2014 | | 1993 |
| Olive Garden | | Silverdale | | WA | | — |
| | 1,752 |
| | 2,015 |
| | — |
| | 3,767 |
| | (145 | ) | | 7/28/2014 | | 1993 | | Silverdale | | WA | | — |
| | 1,752 |
| | 2,015 |
| | — |
| | 3,767 |
| | (263 | ) | | 7/28/2014 | | 1993 |
| Olive Garden | | Morgantown | | WV | | — |
| | 1,765 |
| | 2,199 |
| | — |
| | 3,964 |
| | (200 | ) | | 7/28/2014 | | 2006 | | Morgantown | | WV | | — |
| | 1,765 |
| | 2,199 |
| | — |
| | 3,964 |
| | (363 | ) | | 7/28/2014 | | 2006 |
| Omnipoint Communication | | Indianapolis | | IN | | 49,837 |
| | 5,770 |
| | 64,073 |
| | 679 |
| | 70,522 |
| | (11,441 | ) | | 5/9/2013 | | 2000 | | Indianapolis | | IN | | 49,838 |
| | 5,770 |
| | 64,073 |
| | 3,162 |
| | 73,005 |
| | (17,688 | ) | | 5/9/2013 | | 2000 |
| On the Border | | Rogers | | AR | | 950 |
| | 655 |
| | 1,500 |
| | — |
| | 2,155 |
| | (273 | ) | | 2/7/2014 | | 2002 | | Rogers | | AR | | 950 |
| | 655 |
| | 1,500 |
| | — |
| | 2,155 |
| | (463 | ) | | 2/7/2014 | | 2002 |
| On the Border | | Mesa | | AZ | | 1,804 |
| | 2,090 |
| | 1,534 |
| | — |
| | 3,624 |
| | (281 | ) | | 2/7/2014 | | 1998 | | Mesa | | AZ | | 1,804 |
| | 2,090 |
| | 1,534 |
| | — |
| | 3,624 |
| | (476 | ) | | 2/7/2014 | | 1998 |
| On the Border | | Peoria | | AZ | | 1,562 |
| | 2,129 |
| | 1,352 |
| | — |
| | 3,481 |
| | (226 | ) | | 2/7/2014 | | 1998 | | Peoria | | AZ | | 1,562 |
| | 2,129 |
| | 1,352 |
| | — |
| | 3,481 |
| | (383 | ) | | 2/7/2014 | | 1998 |
| On the Border | | Alpharetta | | GA | | — |
| | 1,771 |
| | 1,842 |
| | — |
| | 3,613 |
| | (334 | ) | | 2/7/2014 | | 1997 | | Alpharetta | | GA | | — |
| | 1,771 |
| | 1,842 |
| | — |
| | 3,613 |
| | (566 | ) | | 2/7/2014 | | 1997 |
| On the Border | | Buford | | GA | | — |
| | 1,786 |
| | 1,506 |
| | — |
| | 3,292 |
| | (277 | ) | | 2/7/2014 | | 2001 | | Buford | | GA | | — |
| | 1,786 |
| | 1,506 |
| | — |
| | 3,292 |
| | (470 | ) | | 2/7/2014 | | 2001 |
| On the Border | | Naperville | | IL | | — |
| | 2,549 |
| | 1,414 |
| | — |
| | 3,963 |
| | (303 | ) | | 2/7/2014 | | 1997 | | Naperville | | IL | | — |
| | 2,549 |
| | 1,414 |
| | — |
| | 3,963 |
| | (514 | ) | | 2/7/2014 | | 1997 |
| On the Border | | West Springfield | | MA | | 2,000 |
| | 413 |
| | 4,173 |
| | — |
| | 4,586 |
| | (718 | ) | | 2/7/2014 | | 1995 | | West Springfield | | MA | | 2,000 |
| | 413 |
| | 4,173 |
| | — |
| | 4,586 |
| | (1,217 | ) | | 2/7/2014 | | 1995 |
| On the Border | | Auburn Hills | | MI | | — |
| | 1,355 |
| | 2,745 |
| | — |
| | 4,100 |
| | (462 | ) | | 2/7/2014 | | 1999 | | Auburn Hills | | MI | | — |
| | 1,355 |
| | 2,745 |
| | — |
| | 4,100 |
| | (784 | ) | | 2/7/2014 | | 1999 |
| On the Border | | Novi | | MI | | — |
| | 444 |
| | 3,176 |
| | — |
| | 3,620 |
| | (520 | ) | | 2/7/2014 | | 1997 | | Novi | | MI | | — |
| | 444 |
| | 3,176 |
| | — |
| | 3,620 |
| | (881 | ) | | 2/7/2014 | | 1997 |
| On the Border | | Kansas City | | MO | | 1,454 |
| | 1,743 |
| | 1,039 |
| | — |
| | 2,782 |
| | (232 | ) | | 2/7/2014 | | 1997 | | Kansas City | | MO | | 1,454 |
| | 1,743 |
| | 1,039 |
| | — |
| | 2,782 |
| | (393 | ) | | 2/7/2014 | | 1997 |
| On the Border | | Lees Summit | | MO | | 1,200 |
| | 1,647 |
| | 1,008 |
| | — |
| | 2,655 |
| | (220 | ) | | 2/7/2014 | | 2002 | | Lees Summit | | MO | | 1,200 |
| | 1,647 |
| | 1,008 |
| | — |
| | 2,655 |
| | (373 | ) | | 2/7/2014 | | 2002 |
| On the Border | | Concord Mills | | NC | | — |
| | 1,903 |
| | 1,456 |
| | — |
| | 3,359 |
| | (295 | ) | | 2/7/2014 | | 2000 | | Concord Mills | | NC | | — |
| | 1,903 |
| | 1,456 |
| | — |
| | 3,359 |
| | (501 | ) | | 2/7/2014 | | 2000 |
| On the Border | | Mount Laurel | | NJ | | 713 |
| | 1,446 |
| | 1,938 |
| | — |
| | 3,384 |
| | (351 | ) | | 2/7/2014 | | 2004 | | Mount Laurel | | NJ | | 713 |
| | 1,446 |
| | 1,938 |
| | — |
| | 3,384 |
| | (596 | ) | | 2/7/2014 | | 2004 |
| On the Border | | W. Windsor | | NJ | | 2,432 |
| | 1,489 |
| | 1,703 |
| | — |
| | 3,192 |
| | (408 | ) | | 2/7/2014 | | 1998 | | W. Windsor | | NJ | | 2,433 |
| | 1,489 |
| | 1,703 |
| | — |
| | 3,192 |
| | (691 | ) | | 2/7/2014 | | 1998 |
| On the Border | | Columbus | | OH | | 1,925 |
| | 1,594 |
| | 1,558 |
| | — |
| | 3,152 |
| | (328 | ) | | 2/7/2014 | | 1997 | | Columbus | | OH | | 1,925 |
| | 1,594 |
| | 1,558 |
| | — |
| | 3,152 |
| | (556 | ) | | 2/7/2014 | | 1997 |
| On the Border | | Oklahoma City | | OK | | — |
| | 859 |
| | 2,310 |
| | — |
| | 3,169 |
| | (425 | ) | | 2/7/2014 | | 1996 | | Oklahoma City | | OK | | — |
| | 859 |
| | 2,310 |
| | — |
| | 3,169 |
| | (720 | ) | | 2/7/2014 | | 1996 |
| On the Border | | Tulsa | | OK | | — |
| | 740 |
| | 2,956 |
| | — |
| | 3,696 |
| | (530 | ) | | 2/7/2014 | | 1995 | | Tulsa | | OK | | — |
| | 740 |
| | 2,956 |
| | — |
| | 3,696 |
| | (899 | ) | | 2/7/2014 | | 1995 |
| On the Border | | Burleson | | TX | | — |
| | 891 |
| | 2,844 |
| | — |
| | 3,735 |
| | (504 | ) | | 2/7/2014 | | 2000 | | Burleson | | TX | | — |
| | 891 |
| | 2,844 |
| | — |
| | 3,735 |
| | (855 | ) | | 2/7/2014 | | 2000 |
| On the Border | | College Station | | TX | | — |
| | 2,218 |
| | 1,471 |
| | — |
| | 3,689 |
| | (265 | ) | | 2/7/2014 | | 1997 | | College Station | | TX | | — |
| | 2,218 |
| | 1,471 |
| | — |
| | 3,689 |
| | (450 | ) | | 2/7/2014 | | 1997 |
| On the Border | | | Denton | | TX | | — |
| | 1,419 |
| | 2,012 |
| | — |
| | 3,431 |
| | (616 | ) | | 2/7/2014 | | 2002 |
| On the Border | | | Desoto | | TX | | — |
| | 751 |
| | 3,207 |
| | — |
| | 3,958 |
| | (923 | ) | | 2/7/2014 | | 1998 |
| | | | | | Initial Costs (1) | | Costs Capitalized Subsequent to Acquisition (2) | | Gross Amount
Carried at
December 31, 2016
(3) (4) | | | | | | Initial Costs (1) | | Costs Capitalized Subsequent to Acquisition (2) | | Gross Amount
Carried at
December 31, 2018
(3) (4) | | | |
| Property | | City | | State | | Encumbrances at
December 31, 2016 | | Land | | Buildings, Fixtures and Improvements | | Accumulated Depreciation
(3) (5) | | Date Acquired | | Date of Construction | | City | | State | | Encumbrances at
December 31, 2018 | | Land | | Buildings, Fixtures and Improvements | | Accumulated Depreciation
(3) (5) | | Date Acquired | | Date of Construction |
| On the Border | | Denton | | TX | | — |
| | 1,419 |
| | 2,012 |
| | — |
| | 3,431 |
| | (363 | ) | | 2/7/2014 | | 2002 | |
| On the Border | | Desoto | | TX | | — |
| | 751 |
| | 3,207 |
| | — |
| | 3,958 |
| | (544 | ) | | 2/7/2014 | | 1998 | |
| On the Border | | Ft. Worth | | TX | | — |
| | 1,222 |
| | 2,991 |
| | — |
| | 4,213 |
| | (514 | ) | | 2/7/2014 | | 1999 | | Ft. Worth | | TX | | — |
| | 1,222 |
| | 2,991 |
| | — |
| | 4,213 |
| | (872 | ) | | 2/7/2014 | | 1999 |
| On the Border | | Garland | | TX | | — |
| | 1,065 |
| | 1,692 |
| | — |
| | 2,757 |
| | (299 | ) | | 2/7/2014 | | 2007 | | Garland | | TX | | — |
| | 1,065 |
| | 1,692 |
| | — |
| | 2,757 |
| | (507 | ) | | 2/7/2014 | | 2007 |
| On the Border | | Lubbock | | TX | | — |
| | 375 |
| | 3,679 |
| | — |
| | 4,054 |
| | (607 | ) | | 2/7/2014 | | 1994 | | Lubbock | | TX | | — |
| | 375 |
| | 3,679 |
| | — |
| | 4,054 |
| | (1,030 | ) | | 2/7/2014 | | 1994 |
| On the Border | | Rockwall | | TX | | — |
| | 693 |
| | 3,244 |
| | — |
| | 3,937 |
| | (520 | ) | | 2/7/2014 | | 1999 | | Rockwall | | TX | | — |
| | 693 |
| | 3,244 |
| | — |
| | 3,937 |
| | (881 | ) | | 2/7/2014 | | 1999 |
| On the Border | | Woodbridge | | VA | | — |
| | 1,799 |
| | 899 |
| | — |
| | 2,698 |
| | (327 | ) | | 2/7/2014 | | 1998 | | Woodbridge | | VA | | — |
| | 1,799 |
| | 899 |
| | — |
| | 2,698 |
| | (555 | ) | | 2/7/2014 | | 1998 |
| O'Reilly Auto Parts | | Oneonta | | AL | | — |
| | 81 |
| | 460 |
| | — |
| | 541 |
| | (113 | ) | | 8/2/2012 | | 2000 | | Oneonta | | AL | | — |
| | 81 |
| | 460 |
| | 52 |
| | 593 |
| | (148 | ) | | 8/2/2012 | | 2000 |
| O'Reilly Auto Parts | | Louisville | | KY | | — |
| | 573 |
| | 794 |
| | — |
| | 1,367 |
| | (124 | ) | | 2/7/2014 | | 2011 | | Louisville | | KY | | — |
| | 573 |
| | 794 |
| | — |
| | 1,367 |
| | (210 | ) | | 2/7/2014 | | 2011 |
| O'Reilly Auto Parts | | Breaux Bridge | | LA | | — |
| | 139 |
| | 738 |
| | — |
| | 877 |
| | (117 | ) | | 2/7/2014 | | 2009 | | Breaux Bridge | | LA | | — |
| | 139 |
| | 738 |
| | — |
| | 877 |
| | (198 | ) | | 2/7/2014 | | 2009 |
| O'Reilly Auto Parts | | Central | | LA | | — |
| | 104 |
| | 915 |
| | — |
| | 1,019 |
| | (139 | ) | | 2/7/2014 | | 2010 | | Central | | LA | | — |
| | 104 |
| | 915 |
| | — |
| | 1,019 |
| | (236 | ) | | 2/7/2014 | | 2010 |
| O'Reilly Auto Parts | | La Place | | LA | | — |
| | 342 |
| | 819 |
| | — |
| | 1,161 |
| | (128 | ) | | 2/7/2014 | | 2008 | | La Place | | LA | | — |
| | 342 |
| | 819 |
| | — |
| | 1,161 |
| | (218 | ) | | 2/7/2014 | | 2008 |
| O'Reilly Auto Parts | | New Roads | | LA | | — |
| | 175 |
| | 737 |
| | — |
| | 912 |
| | (117 | ) | | 2/7/2014 | | 2008 | | New Roads | | LA | | — |
| | 175 |
| | 737 |
| | — |
| | 912 |
| | (199 | ) | | 2/7/2014 | | 2008 |
| O'Reilly Auto Parts | | Ravenna | | OH | | — |
| | 144 |
| | 1,137 |
| | — |
| | 1,281 |
| | (170 | ) | | 2/7/2014 | | 2010 | | Ravenna | | OH | | — |
| | 144 |
| | 1,137 |
| | — |
| | 1,281 |
| | (289 | ) | | 2/7/2014 | | 2010 |
| O'Reilly Auto Parts | | Willard | | OH | | — |
| | 137 |
| | 877 |
| | — |
| | 1,014 |
| | (128 | ) | | 2/7/2014 | | 2011 | | Willard | | OH | | — |
| | 137 |
| | 877 |
| | — |
| | 1,014 |
| | (218 | ) | | 2/7/2014 | | 2011 |
| O'Reilly Auto Parts | | Highlands | | TX | | 485 |
| | 281 |
| | 813 |
| | — |
| | 1,094 |
| | (114 | ) | | 2/7/2014 | | 2010 | | Highlands | | TX | | 485 |
| | 281 |
| | 813 |
| | — |
| | 1,094 |
| | (193 | ) | | 2/7/2014 | | 2010 |
| O'Reilly Auto Parts | | Houston | | TX | | 560 |
| | 340 |
| | 895 |
| | — |
| | 1,235 |
| | (125 | ) | | 2/7/2014 | | 2010 | | Houston | | TX | | 560 |
| | 340 |
| | 895 |
| | — |
| | 1,235 |
| | (212 | ) | | 2/7/2014 | | 2010 |
| O'Reilly Auto Parts | | San Antonio | | TX | | 703 |
| | 439 |
| | 1,030 |
| | — |
| | 1,469 |
| | (149 | ) | | 2/7/2014 | | 2010 | | San Antonio | | TX | | 703 |
| | 439 |
| | 1,030 |
| | — |
| | 1,469 |
| | (252 | ) | | 2/7/2014 | | 2010 |
| O'Reilly Auto Parts | | Christiansburg | | VA | | 646 |
| | 562 |
| | 793 |
| | — |
| | 1,355 |
| | (115 | ) | | 2/7/2014 | | 2010 | | Christiansburg | | VA | | 646 |
| | 562 |
| | 793 |
| | — |
| | 1,355 |
| | (195 | ) | | 2/7/2014 | | 2010 |
| O'Reilly Auto Parts | | Laramie | | WY | | — |
| | 144 |
| | 1,297 |
| | — |
| | 1,441 |
| | (307 | ) | | 10/12/2012 | | 1999 | | Laramie | | WY | | — |
| | 144 |
| | 1,297 |
| | — |
| | 1,441 |
| | (409 | ) | | 10/12/2012 | | 1999 |
| Orora | | | Alhambra | | CA | | — |
| | 7,143 |
| | 8,730 |
| | — |
| | 15,873 |
| | (2,972 | ) | | 1/24/2013 | | 1966 |
| Outback Steakhouse | | Fort Smith | | AR | | — |
| | 841 |
| | 1,996 |
| | — |
| | 2,837 |
| | (365 | ) | | 2/7/2014 | | 1999 | | Fort Smith | | AR | | — |
| | 841 |
| | 1,996 |
| | — |
| | 2,837 |
| | (620 | ) | | 2/7/2014 | | 1999 |
| Outback Steakhouse | | Centennial | | CO | | — |
| | 1,378 |
| | 1,397 |
| | — |
| | 2,775 |
| | (261 | ) | | 2/7/2014 | | 1996 | | Centennial | | CO | | — |
| | 1,378 |
| | 1,397 |
| | — |
| | 2,775 |
| | (442 | ) | | 2/7/2014 | | 1996 |
| Outback Steakhouse | | Jacksonville | | FL | | — |
| | 770 |
| | 2,261 |
| | — |
| | 3,031 |
| | (369 | ) | | 2/7/2014 | | 2001 | | Jacksonville | | FL | | — |
| | 770 |
| | 2,261 |
| | — |
| | 3,031 |
| | (625 | ) | | 2/7/2014 | | 2001 |
| Outback Steakhouse | | Sebring | | FL | | — |
| | 981 |
| | 1,695 |
| | — |
| | 2,676 |
| | (312 | ) | | 2/7/2014 | | 2001 | | Sebring | | FL | | — |
| | 981 |
| | 1,695 |
| | — |
| | 2,676 |
| | (530 | ) | | 2/7/2014 | | 2001 |
| Outback Steakhouse | | Fort Wayne | | IN | | — |
| | 733 |
| | 984 |
| | — |
| | 1,717 |
| | (301 | ) | | 2/7/2014 | | 2000 | | Fort Wayne | | IN | | — |
| | 733 |
| | 984 |
| | — |
| | 1,717 |
| | (510 | ) | | 2/7/2014 | | 2000 |
| Outback Steakhouse | | Lexington | | KY | | — |
| | 1,077 |
| | 2,139 |
| | — |
| | 3,216 |
| | (379 | ) | | 2/7/2014 | | 2002 | | Lexington | | KY | | — |
| | 1,077 |
| | 2,139 |
| | — |
| | 3,216 |
| | (643 | ) | | 2/7/2014 | | 2002 |
| Outback Steakhouse | | Baton Rouge | | LA | | — |
| | 742 |
| | 1,272 |
| | — |
| | 2,014 |
| | (223 | ) | | 2/7/2014 | | 2001 | | Baton Rouge | | LA | | — |
| | 742 |
| | 1,272 |
| | — |
| | 2,014 |
| | (378 | ) | | 2/7/2014 | | 2001 |
| Outback Steakhouse | | Southgate | | MI | | — |
| | 787 |
| | 2,742 |
| | — |
| | 3,529 |
| | (460 | ) | | 2/7/2014 | | 1994 | | Southgate | | MI | | — |
| | 787 |
| | 2,742 |
| | — |
| | 3,529 |
| | (780 | ) | | 2/7/2014 | | 1994 |
| Outback Steakhouse | | Lees Summit | | MO | | — |
| | 901 |
| | 620 |
| | — |
| | 1,521 |
| | (125 | ) | | 2/7/2014 | | 1999 | | Lees Summit | | MO | | — |
| | 901 |
| | 620 |
| | — |
| | 1,521 |
| | (212 | ) | | 2/7/2014 | | 1999 |
| Outback Steakhouse | | Garner | | NC | | — |
| | 1,088 |
| | 1,817 |
| | — |
| | 2,905 |
| | (326 | ) | | 2/7/2014 | | 2004 | | Garner | | NC | | — |
| | 1,088 |
| | 1,817 |
| | — |
| | 2,905 |
| | (553 | ) | | 2/7/2014 | | 2004 |
| Outback Steakhouse | | Las Cruces | | NM | | — |
| | 536 |
| | 1,549 |
| | — |
| | 2,085 |
| | (265 | ) | | 2/7/2014 | | 2000 | | Las Cruces | | NM | | — |
| | 536 |
| | 1,549 |
| | — |
| | 2,085 |
| | (449 | ) | | 2/7/2014 | | 2000 |
| Outback Steakhouse | | Boardman Township | | OH | | — |
| | 575 |
| | 2,742 |
| | — |
| | 3,317 |
| | (470 | ) | | 2/7/2014 | | 1995 | | Boardman Township | | OH | | — |
| | 575 |
| | 2,742 |
| | — |
| | 3,317 |
| | (796 | ) | | 2/7/2014 | | 1995 |
| | | | | | Initial Costs (1) | | Costs Capitalized Subsequent to Acquisition (2) | | Gross Amount
Carried at
December 31, 2016
(3) (4) | | | | | | Initial Costs (1) | | Costs Capitalized Subsequent to Acquisition (2) | | Gross Amount
Carried at
December 31, 2018
(3) (4) | | | |
| Property | | City | | State | | Encumbrances at
December 31, 2016 | | Land | | Buildings, Fixtures and Improvements | | Accumulated Depreciation
(3) (5) | | Date Acquired | | Date of Construction | | City | | State | | Encumbrances at
December 31, 2018 | | Land | | Buildings, Fixtures and Improvements | | Accumulated Depreciation
(3) (5) | | Date Acquired | | Date of Construction |
| Outback Steakhouse | | Independence | | OH | | — |
| | 901 |
| | 2,268 |
| | — |
| | 3,169 |
| | (322 | ) | | 2/7/2014 | | 2006 | | Independence | | OH | | — |
| | 901 |
| | 2,268 |
| | — |
| | 3,169 |
| | (546 | ) | | 2/7/2014 | | 2006 |
| Outback Steakhouse | | Pittsburgh | | PA | | — |
| | 1,370 |
| | 932 |
| | — |
| | 2,302 |
| | (244 | ) | | 2/7/2014 | | 1995 | | Pittsburgh | | PA | | — |
| | 1,370 |
| | 932 |
| | (932 | ) | | 1,370 |
| | — |
| | 2/7/2014 | | 1995 |
| Outback Steakhouse | | Conroe | | TX | | — |
| | 959 |
| | 2,063 |
| | — |
| | 3,022 |
| | (326 | ) | | 2/7/2014 | | 2001 | | Conroe | | TX | | — |
| | 959 |
| | 2,063 |
| | — |
| | 3,022 |
| | (553 | ) | | 2/7/2014 | | 2001 |
| Outback Steakhouse | | Houston | | TX | | — |
| | 964 |
| | 2,321 |
| | — |
| | 3,285 |
| | (369 | ) | | 2/7/2014 | | 1998 | | Houston | | TX | | — |
| | 964 |
| | 2,321 |
| | — |
| | 3,285 |
| | (625 | ) | | 2/7/2014 | | 1998 |
| Outback Steakhouse | | Mcallen | | TX | | — |
| | 835 |
| | 443 |
| | — |
| | 1,278 |
| | (80 | ) | | 2/7/2014 | | 1999 | | Mcallen | | TX | | — |
| | 835 |
| | 443 |
| | — |
| | 1,278 |
| | (136 | ) | | 2/7/2014 | | 1999 |
| Outback Steakhouse | | Colonial Heights | | VA | | — |
| | 1,297 |
| | 746 |
| | — |
| | 2,043 |
| | (326 | ) | | 2/7/2014 | | 2000 | | Colonial Heights | | VA | | — |
| | 1,297 |
| | 746 |
| | — |
| | 2,043 |
| | (553 | ) | | 2/7/2014 | | 2000 |
| Outback Steakhouse | | Newport News | | VA | | — |
| | 600 |
| | 1,356 |
| | — |
| | 1,956 |
| | (395 | ) | | 2/7/2014 | | 1993 | | Newport News | | VA | | — |
| | 600 |
| | 1,356 |
| | — |
| | 1,956 |
| | (670 | ) | | 2/7/2014 | | 1993 |
| Outback Steakhouse | | Winchester | | VA | | — |
| | 704 |
| | 1,310 |
| | — |
| | 2,014 |
| | (419 | ) | | 2/7/2014 | | 2006 | | Winchester | | VA | | — |
| | 704 |
| | 1,310 |
| | — |
| | 2,014 |
| | (711 | ) | | 2/7/2014 | | 2006 |
| Owens & Minor | | Cleveland | | OH | | — |
| | 755 |
| | 6,077 |
| | (4 | ) | | 6,828 |
| | (692 | ) | | 9/30/2014 | | 2014 | | Cleveland | | OH | | — |
| | 755 |
| | 6,077 |
| | (4 | ) | | 6,828 |
| | (1,287 | ) | | 9/30/2014 | | 2014 |
| Owens Corning | | Newark | | OH | | — |
| | 725 |
| | 13,013 |
| | — |
| | 13,738 |
| | (1,701 | ) | | 2/7/2014 | | 2007 | | Newark | | OH | | — |
| | 725 |
| | 13,013 |
| | — |
| | 13,738 |
| | (2,884 | ) | | 2/7/2014 | | 2007 |
| Owens Corning | | Wichita Falls | | TX | | — |
| | 231 |
| | 847 |
| | — |
| | 1,078 |
| | (113 | ) | | 6/12/2014 | | 1972 | | Wichita Falls | | TX | | — |
| | 231 |
| | 847 |
| | — |
| | 1,078 |
| | (185 | ) | | 6/12/2014 | | 1972 |
| Pantry Gas & Convenience | | Montgomery | | AL | | — |
| | 526 |
| | 1,228 |
| | — |
| | 1,754 |
| | (279 | ) | | 12/31/2012 | | 1998 | | Montgomery | | AL | | — |
| | 526 |
| | 1,228 |
| | — |
| | 1,754 |
| | (381 | ) | | 12/31/2012 | | 1998 |
| Pantry Gas & Convenience | | Charlotte | | NC | | — |
| | 1,332 |
| | 1,332 |
| | — |
| | 2,664 |
| | (302 | ) | | 12/31/2012 | | 2004 | | Charlotte | | NC | | — |
| | 1,332 |
| | 1,332 |
| | — |
| | 2,664 |
| | (413 | ) | | 12/31/2012 | | 2004 |
| Pantry Gas & Convenience | | Charlotte | | NC | | — |
| | 1,667 |
| | 417 |
| | — |
| | 2,084 |
| | (95 | ) | | 12/31/2012 | | 1982 | | Charlotte | | NC | | — |
| | 1,667 |
| | 417 |
| | — |
| | 2,084 |
| | (129 | ) | | 12/31/2012 | | 1982 |
| Pantry Gas & Convenience | | Charlotte | | NC | | — |
| | 1,191 |
| | 1,787 |
| | — |
| | 2,978 |
| | (406 | ) | | 12/31/2012 | | 1987 | | Charlotte | | NC | | — |
| | 1,191 |
| | 1,787 |
| | — |
| | 2,978 |
| | (554 | ) | | 12/31/2012 | | 1987 |
| Pantry Gas & Convenience | | Charlotte | | NC | | — |
| | 1,070 |
| | 1,308 |
| | — |
| | 2,378 |
| | (297 | ) | | 12/31/2012 | | 1997 | | Charlotte | | NC | | — |
| | 1,070 |
| | 1,308 |
| | — |
| | 2,378 |
| | (406 | ) | | 12/31/2012 | | 1997 |
| Pantry Gas & Convenience | | Conover | | NC | | — |
| | 1,144 |
| | 936 |
| | — |
| | 2,080 |
| | (212 | ) | | 12/31/2012 | | 1998 | | Conover | | NC | | — |
| | 1,144 |
| | 936 |
| | — |
| | 2,080 |
| | (290 | ) | | 12/31/2012 | | 1998 |
| Pantry Gas & Convenience | | Cornelius | | NC | | — |
| | 1,847 |
| | 2,258 |
| | — |
| | 4,105 |
| | (512 | ) | | 12/31/2012 | | 1999 | | Cornelius | | NC | | — |
| | 1,847 |
| | 2,258 |
| | — |
| | 4,105 |
| | (700 | ) | | 12/31/2012 | | 1999 |
| Pantry Gas & Convenience | | Lincolnton | | NC | | — |
| | 1,766 |
| | 2,159 |
| | — |
| | 3,925 |
| | (490 | ) | | 12/31/2012 | | 2000 | | Lincolnton | | NC | | — |
| | 1,766 |
| | 2,159 |
| | — |
| | 3,925 |
| | (670 | ) | | 12/31/2012 | | 2000 |
| Pantry Gas & Convenience | | Matthews | | NC | | — |
| | 980 |
| | 1,819 |
| | — |
| | 2,799 |
| | (413 | ) | | 12/31/2012 | | 1987 | | Matthews | | NC | | — |
| | 980 |
| | 1,819 |
| | — |
| | 2,799 |
| | (564 | ) | | 12/31/2012 | | 1987 |
| Pantry Gas & Convenience | | Thomasville | | NC | | — |
| | 1,175 |
| | 1,436 |
| | — |
| | 2,611 |
| | (326 | ) | | 12/31/2012 | | 2000 | | Thomasville | | NC | | — |
| | 1,175 |
| | 1,436 |
| | — |
| | 2,611 |
| | (445 | ) | | 12/31/2012 | | 2000 |
| Pantry Gas & Convenience | | Fort Mill | | SC | | — |
| | 1,311 |
| | 1,967 |
| | — |
| | 3,278 |
| | (446 | ) | | 12/31/2012 | | 1988 | | Fort Mill | | SC | | — |
| | 1,311 |
| | 1,967 |
| | — |
| | 3,278 |
| | (610 | ) | | 12/31/2012 | | 1988 |
| Pearson Education | | Lawrence | | KS | | — |
| | 2,548 |
| | 18,057 |
| | (3,436 | ) | | 17,169 |
| | (520 | ) | | 11/5/2013 | | 1997 | | Lawrence | | KS | | — |
| | 2,548 |
| | 18,057 |
| | (3,435 | ) | | 17,170 |
| | (1,910 | ) | | 11/5/2013 | | 1997 |
| Penske | | Bedford | | OH | | — |
| | 183 |
| | — |
| | — |
| | 183 |
| | — |
| | 6/27/2013 | | 1995 | | Bedford | | OH | | — |
| | 183 |
| | — |
| | — |
| | 183 |
| | — |
| | 6/27/2013 | | 1995 |
| Peraton | | | Herndon | | VA | | — |
| | 1,384 |
| | 53,584 |
| | (17,140 | ) | | 37,828 |
| | (1,079 | ) | | 11/5/2013 | | 1999 |
| Petco | | Lake Charles | | LA | | 2,145 |
| | 690 |
| | 4,072 |
| | — |
| | 4,762 |
| | (568 | ) | | 2/7/2014 | | 2008 | | Lake Charles | | LA | | 2,145 |
| | 690 |
| | 4,072 |
| | 54 |
| | 4,816 |
| | (969 | ) | | 2/7/2014 | | 2008 |
| Petco | | Dardenne Prairie | | MO | | — |
| | 806 |
| | 3,024 |
| | — |
| | 3,830 |
| | (412 | ) | | 2/7/2014 | | 2009 | | Dardenne Prairie | | MO | | — |
| | 806 |
| | 3,024 |
| | — |
| | 3,830 |
| | (699 | ) | | 2/7/2014 | | 2009 |
| Petsmart | | Phoenix | | AZ | | 51,250 |
| | 7,308 |
| | 97,510 |
| | 36 |
| | 104,854 |
| | (11,572 | ) | | 2/7/2014 | | 1997 | |
| Petsmart | | Merced | | CA | | — |
| | 1,729 |
| | 4,194 |
| | — |
| | 5,923 |
| | (583 | ) | | 2/7/2014 | | 1993 | |
| Petsmart | | Redding | | CA | | — |
| | 1,312 |
| | 4,133 |
| | — |
| | 5,445 |
| | (627 | ) | | 2/7/2014 | | 1989 | |
| Petsmart | | Westlake Village | | CA | | — |
| | 3,406 |
| | 5,017 |
| | — |
| | 8,423 |
| | (671 | ) | | 2/7/2014 | | 1998 | |
| Petsmart | | Boca Raton | | FL | | — |
| | 3,514 |
| | 4,912 |
| | — |
| | 8,426 |
| | (707 | ) | | 2/7/2014 | | 2001 | |
| Petsmart | | Lake Mary | | FL | | — |
| | 2,430 |
| | 2,556 |
| | — |
| | 4,986 |
| | (373 | ) | | 2/7/2014 | | 1997 | |
| PetSmart | | | Phoenix | | AZ | | 51,250 |
| | 7,308 |
| | 97,510 |
| | 42 |
| | 104,860 |
| | (19,625 | ) | | 2/7/2014 | | 1997 |
| PetSmart | | | Merced | | CA | | — |
| | 1,729 |
| | 4,194 |
| | — |
| | 5,923 |
| | (987 | ) | | 2/7/2014 | | 1993 |
| PetSmart | | | Redding | | CA | | — |
| | 1,312 |
| | 4,133 |
| | 228 |
| | 5,673 |
| | (1,068 | ) | | 2/7/2014 | | 1989 |
| PetSmart | | | Westlake Village | | CA | | — |
| | 3,406 |
| | 5,017 |
| | — |
| | 8,423 |
| | (1,137 | ) | | 2/7/2014 | | 1998 |
| PetSmart | | | Boca Raton | | FL | | — |
| | 3,514 |
| | 4,912 |
| | — |
| | 8,426 |
| | (1,198 | ) | | 2/7/2014 | | 2001 |
| | | | | | Initial Costs (1) | | Costs Capitalized Subsequent to Acquisition (2) | | Gross Amount
Carried at
December 31, 2016
(3) (4) | | | | | | Initial Costs (1) | | Costs Capitalized Subsequent to Acquisition (2) | | Gross Amount
Carried at
December 31, 2018
(3) (4) | | | |
| Property | | City | | State | | Encumbrances at
December 31, 2016 | | Land | | Buildings, Fixtures and Improvements | | Accumulated Depreciation
(3) (5) | | Date Acquired | | Date of Construction | | City | | State | | Encumbrances at
December 31, 2018 | | Land | | Buildings, Fixtures and Improvements | | Accumulated Depreciation
(3) (5) | | Date Acquired | | Date of Construction |
| Petsmart | | Plantation | | FL | | — |
| | 965 |
| | 5,302 |
| | — |
| | 6,267 |
| | (726 | ) | | 2/7/2014 | | 2001 | |
| Petsmart | | Tallahassee | | FL | | — |
| | 1,468 |
| | 1,387 |
| | — |
| | 2,855 |
| | (209 | ) | | 2/7/2014 | | 1998 | |
| Petsmart | | Evanston | | IL | | — |
| | 1,120 |
| | 6,007 |
| | — |
| | 7,127 |
| | (801 | ) | | 2/7/2014 | | 2001 | |
| Petsmart | | Braintree | | MA | | — |
| | 2,805 |
| | 8,398 |
| | — |
| | 11,203 |
| | (1,091 | ) | | 2/7/2014 | | 1996 | |
| Petsmart | | Oxon Hill | | MD | | — |
| | 1,722 |
| | 4,389 |
| | — |
| | 6,111 |
| | (605 | ) | | 2/7/2014 | | 1998 | |
| Petsmart | | Flint | | MI | | — |
| | 606 |
| | 3,839 |
| | — |
| | 4,445 |
| | (527 | ) | | 2/7/2014 | | 1996 | |
| Petsmart | | Parma | | OH | | — |
| | 1,288 |
| | 3,527 |
| | — |
| | 4,815 |
| | (482 | ) | | 2/7/2014 | | 1996 | |
| Petsmart | | Dallas | | TX | | — |
| | 470 |
| | 6,089 |
| | — |
| | 6,559 |
| | (781 | ) | | 2/7/2014 | | 1998 | |
| Petsmart | | Southlake | | TX | | — |
| | 1,063 |
| | 7,093 |
| | — |
| | 8,156 |
| | (929 | ) | | 2/7/2014 | | 1998 | |
| PetSmart | | | Lake Mary | | FL | | — |
| | 2,430 |
| | 2,556 |
| | — |
| | 4,986 |
| | (632 | ) | | 2/7/2014 | | 1997 |
| PetSmart | | | Plantation | | FL | | — |
| | 965 |
| | 5,302 |
| | — |
| | 6,267 |
| | (1,232 | ) | | 2/7/2014 | | 2001 |
| PetSmart | | | Tallahassee | | FL | | — |
| | 1,468 |
| | 1,387 |
| | — |
| | 2,855 |
| | (355 | ) | | 2/7/2014 | | 1998 |
| PetSmart | | | Evanston | | IL | | — |
| | 1,120 |
| | 6,007 |
| | — |
| | 7,127 |
| | (1,359 | ) | | 2/7/2014 | | 2001 |
| PetSmart | | | Braintree | | MA | | — |
| | 2,805 |
| | 8,398 |
| | — |
| | 11,203 |
| | (1,850 | ) | | 2/7/2014 | | 1996 |
| PetSmart | | | Oxon Hill | | MD | | — |
| | 1,722 |
| | 4,389 |
| | — |
| | 6,111 |
| | (1,025 | ) | | 2/7/2014 | | 1998 |
| PetSmart | | | Flint | | MI | | — |
| | 606 |
| | 3,839 |
| | — |
| | 4,445 |
| | (893 | ) | | 2/7/2014 | | 1996 |
| PetSmart | | | Lee'S Summit | | MO | | — |
| | 781 |
| | 3,381 |
| | — |
| | 4,162 |
| | (95 | ) | | 1/5/2018 | | 2017 |
| PetSmart | | | Sedalia | | MO | | — |
| | 273 |
| | 3,645 |
| | — |
| | 3,918 |
| | (122 | ) | | 11/1/2017 | | 2017 |
| PetSmart | | | Parma | | OH | | — |
| | 1,288 |
| | 3,527 |
| | — |
| | 4,815 |
| | (817 | ) | | 2/7/2014 | | 1996 |
| PetSmart | | | Dallas | | TX | | — |
| | 470 |
| | 6,089 |
| | — |
| | 6,559 |
| | (1,325 | ) | | 2/7/2014 | | 1998 |
| PetSmart | | | Southlake | | TX | | — |
| | 1,063 |
| | 7,093 |
| | — |
| | 8,156 |
| | (1,576 | ) | | 2/7/2014 | | 1998 |
| PetSmart | | | Oak Creek | | WI | | — |
| | 906 |
| | 3,578 |
| | — |
| | 4,484 |
| | (160 | ) | | 8/25/2017 | | 2016 |
| Physicians Dialysis | | | Lawrenceville | | NJ | | — |
| | 633 |
| | 2,757 |
| | — |
| | 3,390 |
| | (588 | ) | | 2/7/2014 | | 2009 |
| Physicians Immediate Care | | Aurora | | IL | | — |
| | 1,043 |
| | 1,346 |
| | — |
| | 2,389 |
| | (222 | ) | | 2/7/2014 | | 2003 | | Aurora | | IL | | — |
| | 1,043 |
| | 1,346 |
| | — |
| | 2,389 |
| | (377 | ) | | 2/7/2014 | | 2003 |
| Physicians Immediate Care | | Glendale Heights | | IL | | — |
| | 487 |
| | 2,256 |
| | — |
| | 2,743 |
| | (352 | ) | | 2/7/2014 | | 1997 | | Glendale Heights | | IL | | — |
| | 487 |
| | 2,256 |
| | — |
| | 2,743 |
| | (597 | ) | | 2/7/2014 | | 1997 |
| Physicians Immediate Care | | New Lenox | | IL | | — |
| | 535 |
| | 1,884 |
| | — |
| | 2,419 |
| | (300 | ) | | 2/7/2014 | | 2011 | | New Lenox | | IL | | — |
| | 535 |
| | 1,884 |
| | — |
| | 2,419 |
| | (509 | ) | | 2/7/2014 | | 2011 |
| Physicians Immediate Care | | Plainfield | | IL | | — |
| | 590 |
| | 1,747 |
| | — |
| | 2,337 |
| | (276 | ) | | 2/7/2014 | | 2011 | | Plainfield | | IL | | — |
| | 590 |
| | 1,747 |
| | — |
| | 2,337 |
| | (468 | ) | | 2/7/2014 | | 2011 |
| Physicians Immediate Care | | Mishawaka | | IN | | — |
| | 252 |
| | 1,351 |
| | — |
| | 1,603 |
| | (233 | ) | | 2/7/2014 | | 2013 | | Mishawaka | | IN | | — |
| | 252 |
| | 1,351 |
| | — |
| | 1,603 |
| | (395 | ) | | 2/7/2014 | | 2013 |
| Pier 1 Imports | | Victoria | | TX | | — |
| | 457 |
| | 1,767 |
| | — |
| | 2,224 |
| | (278 | ) | | 2/7/2014 | | 2011 | | Victoria | | TX | | — |
| | 457 |
| | 1,767 |
| | — |
| | 2,224 |
| | (471 | ) | | 2/7/2014 | | 2011 |
| Pilot Flying J | | Carnesville | | GA | | — |
| | 1,867 |
| | 7,466 |
| | — |
| | 9,333 |
| | (2,134 | ) | | 1/31/2013 | | 2000 | |
| Pizza Hut/WingStreet | | Page | | AZ | | — |
| | 66 |
| | 263 |
| | — |
| | 329 |
| | (48 | ) | | 7/31/2013 | | 1977 | | Page | | AZ | | — |
| | 66 |
| | 263 |
| | — |
| | 329 |
| | (74 | ) | | 7/31/2013 | | 1977 |
| Pizza Hut/WingStreet | | Cooper City | | FL | | — |
| | 320 |
| | 466 |
| | — |
| | 786 |
| | (92 | ) | | 6/27/2013 | | 1995 | | Cooper City | | FL | | — |
| | 320 |
| | 466 |
| | — |
| | 786 |
| | (140 | ) | | 6/27/2013 | | 1995 |
| Pizza Hut/WingStreet | | Marathon | | FL | | — |
| | 530 |
| | 187 |
| | — |
| | 717 |
| | (37 | ) | | 6/27/2013 | | 1995 | | Marathon | | FL | | — |
| | 530 |
| | 187 |
| | — |
| | 717 |
| | (56 | ) | | 6/27/2013 | | 1995 |
| Pizza Hut/WingStreet | | Ashburn | | GA | | — |
| | 102 |
| | 233 |
| | (39 | ) | | 296 |
| | (18 | ) | | 6/27/2013 | | 1988 | | Eatonton | | GA | | — |
| | 353 |
| | 353 |
| | — |
| | 706 |
| | (99 | ) | | 7/31/2013 | | 1988 |
| Pizza Hut/WingStreet | | Eatonton | | GA | | — |
| | 353 |
| | 353 |
| | — |
| | 706 |
| | (64 | ) | | 7/31/2013 | | 1988 | | Greensboro | | GA | | — |
| | 569 |
| | 465 |
| | — |
| | 1,034 |
| | (131 | ) | | 7/31/2013 | | 1989 |
| Pizza Hut/WingStreet | | Greensboro | | GA | | — |
| | 569 |
| | 465 |
| | — |
| | 1,034 |
| | (85 | ) | | 7/31/2013 | | 1989 | | Jackson | | GA | | — |
| | 673 |
| | 735 |
| | — |
| | 1,408 |
| | (218 | ) | | 6/27/2013 | | 1987 |
| Pizza Hut/WingStreet | | Jackson | | GA | | — |
| | 673 |
| | 735 |
| | — |
| | 1,408 |
| | (144 | ) | | 6/27/2013 | | 1987 | | Louisville | | KY | | — |
| | 539 |
| | 499 |
| | — |
| | 1,038 |
| | (148 | ) | | 6/27/2013 | | 1975 |
| Pizza Hut/WingStreet | | Louisville | | KY | | — |
| | 539 |
| | 499 |
| | — |
| | 1,038 |
| | (98 | ) | | 6/27/2013 | | 1975 | | Salisbury | | MD | | — |
| | 245 |
| | 734 |
| | — |
| | 979 |
| | (206 | ) | | 7/31/2013 | | 1983 |
| Pizza Hut/WingStreet | | Lafayette | | LA | | — |
| | 68 |
| | 271 |
| | (146 | ) | | 193 |
| | (7 | ) | | 6/27/2013 | | 1990 | | Dearborn | | MI | | — |
| | 284 |
| | 528 |
| | — |
| | 812 |
| | (148 | ) | | 7/31/2013 | | 1977 |
| Pizza Hut/WingStreet | | Salisbury | | MD | | — |
| | 245 |
| | 734 |
| | — |
| | 979 |
| | (134 | ) | | 7/31/2013 | | 1983 | | Bozeman | | MT | | — |
| | 150 |
| | 343 |
| | — |
| | 493 |
| | (103 | ) | | 6/27/2013 | | 1995 |
| Pizza Hut/WingStreet | | Dearborn | | MI | | — |
| | 284 |
| | 528 |
| | — |
| | 812 |
| | (96 | ) | | 7/31/2013 | | 1977 | | Glasgow | | MT | | — |
| | 120 |
| | 217 |
| | — |
| | 337 |
| | (65 | ) | | 6/27/2013 | | 1995 |
| Pizza Hut/WingStreet | | Bozeman | | MT | | — |
| | 150 |
| | 343 |
| | — |
| | 493 |
| | (68 | ) | | 6/27/2013 | | 1995 | | Livingston | | MT | | — |
| | 130 |
| | 245 |
| | — |
| | 375 |
| | (74 | ) | | 6/27/2013 | | 1995 |
| Pizza Hut/WingStreet | | Glasgow | | MT | | — |
| | 120 |
| | 217 |
| | — |
| | 337 |
| | (43 | ) | | 6/27/2013 | | 1995 | |
| Pizza Hut/WingStreet | | Livingston | | MT | | — |
| | 130 |
| | 245 |
| | — |
| | 375 |
| | (49 | ) | | 6/27/2013 | | 1995 | |
| Pizza Hut/WingStreet | | East Syracuse | | NY | | — |
| | 137 |
| | 185 |
| | — |
| | 322 |
| | (36 | ) | | 6/27/2013 | | 1978 | |
| Pizza Hut/WingStreet | | Nedrow | | NY | | — |
| | 55 |
| | 80 |
| | — |
| | 135 |
| | (16 | ) | | 6/27/2013 | | 1979 | |
| | | | | | Initial Costs (1) | | Costs Capitalized Subsequent to Acquisition (2) | | Gross Amount
Carried at
December 31, 2016
(3) (4) | | | | | | Initial Costs (1) | | Costs Capitalized Subsequent to Acquisition (2) | | Gross Amount
Carried at
December 31, 2018
(3) (4) | | | |
| Property | | City | | State | | Encumbrances at
December 31, 2016 | | Land | | Buildings, Fixtures and Improvements | | Accumulated Depreciation
(3) (5) | | Date Acquired | | Date of Construction | | City | | State | | Encumbrances at
December 31, 2018 | | Land | | Buildings, Fixtures and Improvements | | Accumulated Depreciation
(3) (5) | | Date Acquired | | Date of Construction |
| Pizza Hut/WingStreet | | Bowling Green | | OH | | — |
| | 141 |
| | 262 |
| | — |
| | 403 |
| | (48 | ) | | 7/31/2013 | | 1979 | | East Syracuse | | NY | | — |
| | 137 |
| | 185 |
| | — |
| | 322 |
| | (55 | ) | | 6/27/2013 | | 1978 |
| Pizza Hut/WingStreet | | Cleveland | | OH | | — |
| | 87 |
| | 175 |
| | — |
| | 262 |
| | (34 | ) | | 6/27/2013 | | 1995 | | Bowling Green | | OH | | — |
| | 141 |
| | 262 |
| | — |
| | 403 |
| | (73 | ) | | 7/31/2013 | | 1979 |
| Pizza Hut/WingStreet | | Defiance | | OH | | — |
| | 114 |
| | 197 |
| | — |
| | 311 |
| | (39 | ) | | 6/27/2013 | | 1977 | | Defiance | | OH | | — |
| | 114 |
| | 197 |
| | — |
| | 311 |
| | (58 | ) | | 6/27/2013 | | 1977 |
| Pizza Hut/WingStreet | | Delaware | | OH | | — |
| | 270 |
| | 721 |
| | — |
| | 991 |
| | (141 | ) | | 6/27/2013 | | 1975 | | Delaware | | OH | | — |
| | 270 |
| | 721 |
| | — |
| | 991 |
| | (213 | ) | | 6/27/2013 | | 1975 |
| Pizza Hut/WingStreet | | Middleburg Hts | | OH | | — |
| | 128 |
| | 156 |
| | — |
| | 284 |
| | (29 | ) | | 7/31/2013 | | 1985 | | Middleburg Hts | | OH | | — |
| | 128 |
| | 156 |
| | — |
| | 284 |
| | (44 | ) | | 7/31/2013 | | 1985 |
| Pizza Hut/WingStreet | | North Olmsted | | OH | | — |
| | 122 |
| | 153 |
| | — |
| | 275 |
| | (30 | ) | | 6/27/2013 | | 1977 | | North Olmsted | | OH | | — |
| | 122 |
| | 153 |
| | — |
| | 275 |
| | (45 | ) | | 6/27/2013 | | 1977 |
| Pizza Hut/WingStreet | | Norwalk | | OH | | — |
| | 77 |
| | 115 |
| | — |
| | 192 |
| | (21 | ) | | 7/31/2013 | | 1977 | | Norwalk | | OH | | — |
| | 77 |
| | 115 |
| | — |
| | 192 |
| | (32 | ) | | 7/31/2013 | | 1977 |
| Pizza Hut/WingStreet | | Sandusky | | OH | | — |
| | 140 |
| | 171 |
| | — |
| | 311 |
| | (31 | ) | | 7/31/2013 | | 1982 | | Sandusky | | OH | | — |
| | 140 |
| | 171 |
| | — |
| | 311 |
| | (48 | ) | | 7/31/2013 | | 1982 |
| Pizza Hut/WingStreet | | Strongsville | | OH | | — |
| | 74 |
| | 108 |
| | — |
| | 182 |
| | (21 | ) | | 6/27/2013 | | 1977 | | Strongsville | | OH | | — |
| | 74 |
| | 108 |
| | — |
| | 182 |
| | (32 | ) | | 6/27/2013 | | 1977 |
| Pizza Hut/WingStreet | | Toledo | | OH | | — |
| | 58 |
| | 173 |
| | — |
| | 231 |
| | (34 | ) | | 6/27/2013 | | 1978 | | Toledo | | OH | | — |
| | 58 |
| | 173 |
| | — |
| | 231 |
| | (51 | ) | | 6/27/2013 | | 1978 |
| Pizza Hut/WingStreet | | Shamokin | | PA | | — |
| | 54 |
| | 217 |
| | — |
| | 271 |
| | (40 | ) | | 7/31/2013 | | 1995 | | Batesburg | | SC | | — |
| | 261 |
| | 484 |
| | — |
| | 745 |
| | (136 | ) | | 7/31/2013 | | 1987 |
| Pizza Hut/WingStreet | | Batesburg | | SC | | — |
| | 261 |
| | 484 |
| | — |
| | 745 |
| | (88 | ) | | 7/31/2013 | | 1987 | | Bishopville | | SC | | — |
| | 365 |
| | 365 |
| | — |
| | 730 |
| | (103 | ) | | 7/31/2013 | | 1987 |
| Pizza Hut/WingStreet | | Bishopville | | SC | | — |
| | 365 |
| | 365 |
| | — |
| | 730 |
| | (67 | ) | | 7/31/2013 | | 1987 | | Cheraw | | SC | | — |
| | 415 |
| | 507 |
| | — |
| | 922 |
| | (142 | ) | | 7/31/2013 | | 1984 |
| Pizza Hut/WingStreet | | Cheraw | | SC | | — |
| | 415 |
| | 507 |
| | — |
| | 922 |
| | (92 | ) | | 7/31/2013 | | 1984 | | Columbia | | SC | | — |
| | 881 |
| | 588 |
| | — |
| | 1,469 |
| | (165 | ) | | 7/31/2013 | | 1977 |
| Pizza Hut/WingStreet | | Columbia | | SC | | — |
| | 881 |
| | 588 |
| | — |
| | 1,469 |
| | (107 | ) | | 7/31/2013 | | 1977 | | Edgefield | | SC | | — |
| | 221 |
| | 410 |
| | — |
| | 631 |
| | (115 | ) | | 7/31/2013 | | 1986 |
| Pizza Hut/WingStreet | | Edgefield | | SC | | — |
| | 221 |
| | 410 |
| | — |
| | 631 |
| | (75 | ) | | 7/31/2013 | | 1986 | | Laurens | | SC | | — |
| | 454 |
| | 371 |
| | — |
| | 825 |
| | (104 | ) | | 7/31/2013 | | 1989 |
| Pizza Hut/WingStreet | | Laurens | | SC | | — |
| | 454 |
| | 371 |
| | — |
| | 825 |
| | (68 | ) | | 7/31/2013 | | 1989 | | Pageland | | SC | | — |
| | 344 |
| | 420 |
| | — |
| | 764 |
| | (118 | ) | | 7/31/2013 | | 1999 |
| Pizza Hut/WingStreet | | Pageland | | SC | | — |
| | 344 |
| | 420 |
| | — |
| | 764 |
| | (77 | ) | | 7/31/2013 | | 1999 | | Saluda | | SC | | — |
| | 346 |
| | 346 |
| | — |
| | 692 |
| | (97 | ) | | 7/31/2013 | | 1995 |
| Pizza Hut/WingStreet | | Saluda | | SC | | — |
| | 346 |
| | 346 |
| | — |
| | 692 |
| | (63 | ) | | 7/31/2013 | | 1995 | | Santee | | SC | | — |
| | 371 |
| | 248 |
| | — |
| | 619 |
| | (69 | ) | | 7/31/2013 | | 1972 |
| Pizza Hut/WingStreet | | Santee | | SC | | — |
| | 371 |
| | 248 |
| | — |
| | 619 |
| | (45 | ) | | 7/31/2013 | | 1972 | | St. George | | SC | | — |
| | 367 |
| | 245 |
| | — |
| | 612 |
| | (69 | ) | | 7/31/2013 | | 1980 |
| Pizza Hut/WingStreet | | St. George | | SC | | — |
| | 367 |
| | 245 |
| | — |
| | 612 |
| | (45 | ) | | 7/31/2013 | | 1980 | | West Columbia | | SC | | — |
| | 507 |
| | 415 |
| | — |
| | 922 |
| | (116 | ) | | 7/31/2013 | | 1980 |
| Pizza Hut/WingStreet | | West Columbia | | SC | | — |
| | 507 |
| | 415 |
| | — |
| | 922 |
| | (76 | ) | | 7/31/2013 | | 1980 | | Box Elder | | SD | | — |
| | 68 |
| | 217 |
| | — |
| | 285 |
| | (64 | ) | | 6/27/2013 | | 1985 |
| Pizza Hut/WingStreet | | Box Elder | | SD | | — |
| | 68 |
| | 217 |
| | — |
| | 285 |
| | (43 | ) | | 6/27/2013 | | 1985 | | Knoxville | | TN | | — |
| | 300 |
| | 546 |
| | — |
| | 846 |
| | (164 | ) | | 6/27/2013 | | 1995 |
| Pizza Hut/WingStreet | | Knoxville | | TN | | — |
| | 300 |
| | 546 |
| | — |
| | 846 |
| | (108 | ) | | 6/27/2013 | | 1995 | | Amarillo | | TX | | — |
| | 339 |
| | 1,016 |
| | — |
| | 1,355 |
| | (285 | ) | | 7/31/2013 | | 1976 |
| Pizza Hut/WingStreet | | Amarillo | | TX | | — |
| | 339 |
| | 1,016 |
| | — |
| | 1,355 |
| | (185 | ) | | 7/31/2013 | | 1976 | | Amarillo | | TX | | — |
| | 254 |
| | 1,015 |
| | — |
| | 1,269 |
| | (285 | ) | | 7/31/2013 | | 1980 |
| Pizza Hut/WingStreet | | Amarillo | | TX | | — |
| | 254 |
| | 1,015 |
| | — |
| | 1,269 |
| | (185 | ) | | 7/31/2013 | | 1980 | | Crystal City | | TX | | — |
| | 148 |
| | 453 |
| | — |
| | 601 |
| | (134 | ) | | 6/27/2013 | | 1981 |
| Pizza Hut/WingStreet | | Crystal City | | TX | | — |
| | 148 |
| | 453 |
| | — |
| | 601 |
| | (89 | ) | | 6/27/2013 | | 1981 | | Fort Stockton | | TX | | — |
| | 252 |
| | 1,007 |
| | — |
| | 1,259 |
| | (282 | ) | | 7/31/2013 | | 2008 |
| Pizza Hut/WingStreet | | Fort Stockton | | TX | | — |
| | 252 |
| | 1,007 |
| | — |
| | 1,259 |
| | (184 | ) | | 7/31/2013 | | 2008 | | Midland | | TX | | — |
| | 414 |
| | 506 |
| | — |
| | 920 |
| | (142 | ) | | 7/31/2013 | | 1975 |
| Pizza Hut/WingStreet | | Midland | | TX | | — |
| | 414 |
| | 506 |
| | — |
| | 920 |
| | (92 | ) | | 7/31/2013 | | 1975 | | Midland | | TX | | — |
| | 506 |
| | 619 |
| | — |
| | 1,125 |
| | (174 | ) | | 7/31/2013 | | 1978 |
| Pizza Hut/WingStreet | | Midland | | TX | | — |
| | 506 |
| | 619 |
| | — |
| | 1,125 |
| | (113 | ) | | 7/31/2013 | | 1978 | | Monahans | | TX | | — |
| | 361 |
| | 671 |
| | — |
| | 1,032 |
| | (188 | ) | | 7/31/2013 | | 1979 |
| Pizza Hut/WingStreet | | Monahans | | TX | | — |
| | 361 |
| | 671 |
| | — |
| | 1,032 |
| | (122 | ) | | 7/31/2013 | | 1979 | | Odessa | | TX | | — |
| | 456 |
| | 847 |
| | — |
| | 1,303 |
| | (238 | ) | | 7/31/2013 | | 1976 |
| Pizza Hut/WingStreet | | Odessa | | TX | | — |
| | 456 |
| | 847 |
| | — |
| | 1,303 |
| | (154 | ) | | 7/31/2013 | | 1976 | | Odessa | | TX | | — |
| | 588 |
| | 882 |
| | — |
| | 1,470 |
| | (247 | ) | | 7/31/2013 | | 1972 |
| | | | | | Initial Costs (1) | | Costs Capitalized Subsequent to Acquisition (2) | | Gross Amount
Carried at
December 31, 2016
(3) (4) | | | | | | Initial Costs (1) | | Costs Capitalized Subsequent to Acquisition (2) | | Gross Amount
Carried at
December 31, 2018
(3) (4) | | | |
| Property | | City | | State | | Encumbrances at
December 31, 2016 | | Land | | Buildings, Fixtures and Improvements | | Accumulated Depreciation
(3) (5) | | Date Acquired | | Date of Construction | | City | | State | | Encumbrances at
December 31, 2018 | | Land | | Buildings, Fixtures and Improvements | | Accumulated Depreciation
(3) (5) | | Date Acquired | | Date of Construction |
| Pizza Hut/WingStreet | | Odessa | | TX | | — |
| | 588 |
| | 882 |
| | — |
| | 1,470 |
| | (161 | ) | | 7/31/2013 | | 1972 | | Odessa | | TX | | — |
| | 572 |
| | 572 |
| | — |
| | 1,144 |
| | (161 | ) | | 7/31/2013 | | 1976 |
| Pizza Hut/WingStreet | | Odessa | | TX | | — |
| | 572 |
| | 572 |
| | — |
| | 1,144 |
| | (104 | ) | | 7/31/2013 | | 1976 | | Odessa | | TX | | — |
| | 627 |
| | 766 |
| | �� |
| | 1,393 |
| | (215 | ) | | 7/31/2013 | | 1979 |
| Pizza Hut/WingStreet | | Odessa | | TX | | — |
| | 627 |
| | 766 |
| | — |
| | 1,393 |
| | (140 | ) | | 7/31/2013 | | 1979 | | Odessa | | TX | | — |
| | 457 |
| | 685 |
| | — |
| | 1,142 |
| | (192 | ) | | 7/31/2013 | | 1976 |
| Pizza Hut/WingStreet | | Odessa | | TX | | — |
| | 457 |
| | 685 |
| | — |
| | 1,142 |
| | (125 | ) | | 7/31/2013 | | 1976 | | Pecos | | TX | | — |
| | 387 |
| | 719 |
| | — |
| | 1,106 |
| | (202 | ) | | 7/31/2013 | | 1974 |
| Pizza Hut/WingStreet | | Pecos | | TX | | — |
| | 387 |
| | 719 |
| | — |
| | 1,106 |
| | (131 | ) | | 7/31/2013 | | 1974 | | Stamford | | TX | | — |
| | 38 |
| | 115 |
| | — |
| | 153 |
| | (32 | ) | | 7/31/2013 | | 1995 |
| Pizza Hut/WingStreet | | San Angelo | | TX | | — |
| | 214 |
| | 641 |
| | (183 | ) | | 672 |
| | (18 | ) | | 7/31/2013 | | 1977 | | Cedar City | | UT | | — |
| | 52 |
| | 361 |
| | — |
| | 413 |
| | (107 | ) | | 6/27/2013 | | 1978 |
| Pizza Hut/WingStreet | | San Angelo | | TX | | — |
| | 268 |
| | 624 |
| | (266 | ) | | 626 |
| | (15 | ) | | 7/31/2013 | | 1980 | | Kanab | | UT | | — |
| | 52 |
| | 210 |
| | — |
| | 262 |
| | (59 | ) | | 7/31/2013 | | 1989 |
| Pizza Hut/WingStreet | | Stamford | | TX | | — |
| | 38 |
| | 115 |
| | — |
| | 153 |
| | (21 | ) | | 7/31/2013 | | 1995 | | Ashland | | VA | | — |
| | 589 |
| | 1,093 |
| | — |
| | 1,682 |
| | (307 | ) | | 7/31/2013 | | 1989 |
| Pizza Hut/WingStreet | | Cedar City | | UT | | — |
| | 52 |
| | 361 |
| | — |
| | 413 |
| | (71 | ) | | 6/27/2013 | | 1978 | | Bedford | | VA | | — |
| | 548 |
| | 670 |
| | — |
| | 1,218 |
| | (188 | ) | | 7/31/2013 | | 1977 |
| Pizza Hut/WingStreet | | Kanab | | UT | | — |
| | 52 |
| | 210 |
| | — |
| | 262 |
| | (38 | ) | | 7/31/2013 | | 1989 | | Chester | | VA | | — |
| | 473 |
| | 1,104 |
| | — |
| | 1,577 |
| | (310 | ) | | 7/31/2013 | | 1983 |
| Pizza Hut/WingStreet | | Ashland | | VA | | — |
| | 589 |
| | 1,093 |
| | — |
| | 1,682 |
| | (199 | ) | | 7/31/2013 | | 1989 | | Christiansburg | | VA | | — |
| | 494 |
| | 918 |
| | — |
| | 1,412 |
| | (258 | ) | | 7/31/2013 | | 1982 |
| Pizza Hut/WingStreet | | Bedford | | VA | | — |
| | 548 |
| | 670 |
| | — |
| | 1,218 |
| | (122 | ) | | 7/31/2013 | | 1977 | | Clifton Forge | | VA | | — |
| | 287 |
| | 861 |
| | — |
| | 1,148 |
| | (241 | ) | | 7/31/2013 | | 1978 |
| Pizza Hut/WingStreet | | Chester | | VA | | — |
| | 473 |
| | 1,104 |
| | — |
| | 1,577 |
| | (201 | ) | | 7/31/2013 | | 1983 | | Colonial Heights | | VA | | — |
| | 311 |
| | 311 |
| | — |
| | 622 |
| | (87 | ) | | 7/31/2013 | | 1991 |
| Pizza Hut/WingStreet | | Christiansburg | | VA | | — |
| | 494 |
| | 918 |
| | — |
| | 1,412 |
| | (167 | ) | | 7/31/2013 | | 1982 | | Hampton | | VA | | — |
| | 641 |
| | 345 |
| | — |
| | 986 |
| | (97 | ) | | 7/31/2013 | | 1977 |
| Pizza Hut/WingStreet | | Clifton Forge | | VA | | — |
| | 287 |
| | 861 |
| | — |
| | 1,148 |
| | (157 | ) | | 7/31/2013 | | 1978 | | Hopewell | | VA | | — |
| | 707 |
| | 864 |
| | — |
| | 1,571 |
| | (242 | ) | | 7/31/2013 | | 1985 |
| Pizza Hut/WingStreet | | Colonial Heights | | VA | | — |
| | 311 |
| | 311 |
| | — |
| | 622 |
| | (57 | ) | | 7/31/2013 | | 1991 | | Newport News | | VA | | — |
| | 394 |
| | 591 |
| | — |
| | 985 |
| | (166 | ) | | 7/31/2013 | | 1969 |
| Pizza Hut/WingStreet | | Hampton | | VA | | — |
| | 641 |
| | 345 |
| | — |
| | 986 |
| | (63 | ) | | 7/31/2013 | | 1977 | | Newport News | | VA | | — |
| | 394 |
| | 591 |
| | — |
| | 985 |
| | (166 | ) | | 7/31/2013 | | 1970 |
| Pizza Hut/WingStreet | | Hopewell | | VA | | — |
| | 707 |
| | 864 |
| | — |
| | 1,571 |
| | (158 | ) | | 7/31/2013 | | 1985 | | Petersburg | | VA | | — |
| | 378 |
| | 701 |
| | — |
| | 1,079 |
| | (197 | ) | | 7/31/2013 | | 1979 |
| Pizza Hut/WingStreet | | Newport News | | VA | | — |
| | 394 |
| | 591 |
| | — |
| | 985 |
| | (108 | ) | | 7/31/2013 | | 1969 | | Richmond | | VA | | — |
| | 666 |
| | 814 |
| | — |
| | 1,480 |
| | (228 | ) | | 7/31/2013 | | 1978 |
| Pizza Hut/WingStreet | | Newport News | | VA | | — |
| | 394 |
| | 591 |
| | — |
| | 985 |
| | (108 | ) | | 7/31/2013 | | 1970 | | Richmond | | VA | | — |
| | 311 |
| | 311 |
| | — |
| | 622 |
| | (87 | ) | | 7/31/2013 | | 1991 |
| Pizza Hut/WingStreet | | Petersburg | | VA | | — |
| | 378 |
| | 701 |
| | — |
| | 1,079 |
| | (128 | ) | | 7/31/2013 | | 1979 | | Abbotsford | | WI | | — |
| | 159 |
| | 195 |
| | — |
| | 354 |
| | (55 | ) | | 7/31/2013 | | 1980 |
| Pizza Hut/WingStreet | | Richmond | | VA | | — |
| | 666 |
| | 814 |
| | — |
| | 1,480 |
| | (149 | ) | | 7/31/2013 | | 1978 | | Antigo | | WI | | — |
| | 45 |
| | 252 |
| | 100 |
| | 397 |
| | (87 | ) | | 7/31/2013 | | 1997 |
| Pizza Hut/WingStreet | | Richmond | | VA | | — |
| | 311 |
| | 311 |
| | — |
| | 622 |
| | (57 | ) | | 7/31/2013 | | 1991 | | Clintonville | | WI | | — |
| | 208 |
| | 69 |
| | — |
| | 277 |
| | (19 | ) | | 7/31/2013 | | 1978 |
| Pizza Hut/WingStreet | | Abbotsford | | WI | | — |
| | 159 |
| | 195 |
| | — |
| | 354 |
| | (36 | ) | | 7/31/2013 | | 1980 | | Eagle River | | WI | | — |
| | 28 |
| | 159 |
| | — |
| | 187 |
| | (45 | ) | | 7/31/2013 | | 1991 |
| Pizza Hut/WingStreet | | Antigo | | WI | | — |
| | 45 |
| | 252 |
| | 100 |
| | 397 |
| | (52 | ) | | 7/31/2013 | | 1997 | | Hayward | | WI | | — |
| | 51 |
| | 205 |
| | — |
| | 256 |
| | (58 | ) | | 7/31/2013 | | 1993 |
| Pizza Hut/WingStreet | | Clintonville | | WI | | — |
| | 208 |
| | 69 |
| | — |
| | 277 |
| | (13 | ) | | 7/31/2013 | | 1978 | | Merrill | | WI | | — |
| | 83 |
| | 531 |
| | (100 | ) | | 514 |
| | (113 | ) | | 7/31/2013 | | 1980 |
| Pizza Hut/WingStreet | | Eagle River | | WI | | — |
| | 28 |
| | 159 |
| | — |
| | 187 |
| | (29 | ) | | 7/31/2013 | | 1991 | | Neilsville | | WI | | — |
| | 35 |
| | 106 |
| | — |
| | 141 |
| | (30 | ) | | 7/31/2013 | | 1995 |
| Pizza Hut/WingStreet | | Hayward | | WI | | — |
| | 51 |
| | 205 |
| | — |
| | 256 |
| | (37 | ) | | 7/31/2013 | | 1993 | | Plover | | WI | | — |
| | 85 |
| | 199 |
| | 100 |
| | 384 |
| | (72 | ) | | 7/31/2013 | | 1995 |
| Pizza Hut/WingStreet | | Merrill | | WI | | — |
| | 83 |
| | 531 |
| | (100 | ) | | 514 |
| | (70 | ) | | 7/31/2013 | | 1980 | | Stevens Point | | WI | | — |
| | 130 |
| | 390 |
| | 100 |
| | 620 |
| | (129 | ) | | 7/31/2013 | | 1995 |
| Pizza Hut/WingStreet | | Neillsville | | WI | | — |
| | 35 |
| | 106 |
| | — |
| | 141 |
| | (19 | ) | | 7/31/2013 | | 1995 | | Tomahawk | | WI | | — |
| | 35 |
| | 81 |
| | — |
| | 116 |
| | (23 | ) | | 7/31/2013 | | 1986 |
| Pizza Hut/WingStreet | | Plover | | WI | | — |
| | 85 |
| | 199 |
| | 100 |
| | 384 |
| | (41 | ) | | 7/31/2013 | | 1995 | | Waupaca | | WI | | — |
| | 61 |
| | 91 |
| | 35 |
| | 187 |
| | (37 | ) | | 7/31/2013 | | 1991 |
| Pizza Hut/WingStreet | | Schofield | | WI | | — |
| | 106 |
| | 196 |
| | — |
| | 302 |
| | (36 | ) | | 7/31/2013 | | 1987 | | Beckley | | WV | | — |
| | 160 |
| | 131 |
| | — |
| | 291 |
| | (37 | ) | | 7/31/2013 | | 1977 |
| | | | | | Initial Costs (1) | | Costs Capitalized Subsequent to Acquisition (2) | | Gross Amount
Carried at
December 31, 2016
(3) (4) | | | | | | Initial Costs (1) | | Costs Capitalized Subsequent to Acquisition (2) | | Gross Amount
Carried at
December 31, 2018
(3) (4) | | | |
| Property | | City | | State | | Encumbrances at
December 31, 2016 | | Land | | Buildings, Fixtures and Improvements | | Accumulated Depreciation
(3) (5) | | Date Acquired | | Date of Construction | | City | | State | | Encumbrances at
December 31, 2018 | | Land | | Buildings, Fixtures and Improvements | | Accumulated Depreciation
(3) (5) | | Date Acquired | | Date of Construction |
| Pizza Hut/WingStreet | | Stevens Point | | WI | | — |
| | 130 |
| | 390 |
| | 100 |
| | 620 |
| | (80 | ) | | 7/31/2013 | | 1995 | |
| Pizza Hut/WingStreet | | Tomahawk | | WI | | — |
| | 35 |
| | 81 |
| | — |
| | 116 |
| | (15 | ) | | 7/31/2013 | | 1986 | |
| Pizza Hut/WingStreet | | Waupaca | | WI | | — |
| | 61 |
| | 91 |
| | 35 |
| | 187 |
| | (20 | ) | | 7/31/2013 | | 1991 | |
| Pizza Hut/WingStreet | | Beckley | | WV | | — |
| | 160 |
| | 131 |
| | — |
| | 291 |
| | (24 | ) | | 7/31/2013 | | 1977 | |
| Pizza Hut/WingStreet | | Huntington | | WV | | — |
| | 190 |
| | 4 |
| | — |
| | 194 |
| | (1 | ) | | 7/31/2013 | | 1995 | | Huntington | | WV | | — |
| | 190 |
| | 4 |
| | — |
| | 194 |
| | (1 | ) | | 7/31/2013 | | 1995 |
| PLS Check Cashers | | Mesa | | AZ | | — |
| | 187 |
| | 759 |
| | — |
| | 946 |
| | (154 | ) | | 2/7/2014 | | 2006 | | Mesa | | AZ | | — |
| | 187 |
| | 759 |
| | — |
| | 946 |
| | (262 | ) | | 2/7/2014 | | 2006 |
| PLS Check Cashers | | Phoenix | | AZ | | — |
| | 288 |
| | 677 |
| | — |
| | 965 |
| | (130 | ) | | 2/7/2014 | | 2006 | | Phoenix | | AZ | | — |
| | 288 |
| | 677 |
| | — |
| | 965 |
| | (220 | ) | | 2/7/2014 | | 2006 |
| PLS Check Cashers | | Tucson | | AZ | | — |
| | 264 |
| | 800 |
| | — |
| | 1,064 |
| | (168 | ) | | 2/7/2014 | | 2005 | | Tucson | | AZ | | — |
| | 264 |
| | 800 |
| | — |
| | 1,064 |
| | (285 | ) | | 2/7/2014 | | 2005 |
| PLS Check Cashers | | Compton | | CA | | — |
| | 475 |
| | 107 |
| | — |
| | 582 |
| | (52 | ) | | 2/7/2014 | | 2005 | | Compton | | CA | | — |
| | 475 |
| | 107 |
| | — |
| | 582 |
| | (88 | ) | | 2/7/2014 | | 2005 |
| PLS Check Cashers | | Calumet Park | | IL | | — |
| | 306 |
| | 1,003 |
| | — |
| | 1,309 |
| | (200 | ) | | 2/7/2014 | | 2005 | | Calumet Park | | IL | | — |
| | 306 |
| | 1,003 |
| | — |
| | 1,309 |
| | (338 | ) | | 2/7/2014 | | 2005 |
| PLS Check Cashers | | Chicago | | IL | | — |
| | 451 |
| | 127 |
| | — |
| | 578 |
| | (63 | ) | | 2/7/2014 | | 2001 | | Chicago | | IL | | — |
| | 451 |
| | 127 |
| | — |
| | 578 |
| | (107 | ) | | 2/7/2014 | | 2001 |
| PLS Check Cashers | | Dallas | | TX | | — |
| | 197 |
| | 1,356 |
| | — |
| | 1,553 |
| | (216 | ) | | 2/7/2014 | | 1983 | | Dallas | | TX | | — |
| | 197 |
| | 1,356 |
| | — |
| | 1,553 |
| | (367 | ) | | 2/7/2014 | | 1983 |
| PLS Check Cashers | | Dallas | | TX | | — |
| | 169 |
| | 1,180 |
| | — |
| | 1,349 |
| | (190 | ) | | 2/7/2014 | | 2003 | | Dallas | | TX | | — |
| | 169 |
| | 1,180 |
| | — |
| | 1,349 |
| | (322 | ) | | 2/7/2014 | | 2003 |
| PLS Check Cashers | | Fort Worth | | TX | | — |
| | 187 |
| | 1,473 |
| | — |
| | 1,660 |
| | (227 | ) | | 2/7/2014 | | 2003 | | Fort Worth | | TX | | — |
| | 187 |
| | 1,473 |
| | — |
| | 1,660 |
| | (385 | ) | | 2/7/2014 | | 2003 |
| PLS Check Cashers | | Grand Prairie | | TX | | — |
| | 385 |
| | 1,056 |
| | — |
| | 1,441 |
| | (168 | ) | | 2/7/2014 | | 1971 | | Grand Prairie | | TX | | — |
| | 385 |
| | 1,056 |
| | — |
| | 1,441 |
| | (286 | ) | | 2/7/2014 | | 1971 |
| PLS Check Cashers | | Houston | | TX | | — |
| | 158 |
| | 1,293 |
| | — |
| | 1,451 |
| | (189 | ) | | 2/7/2014 | | 2005 | | Houston | | TX | | — |
| | 158 |
| | 1,293 |
| | — |
| | 1,451 |
| | (320 | ) | | 2/7/2014 | | 2005 |
| PLS Check Cashers | | Mesquite | | TX | | — |
| | 261 |
| | 1,388 |
| | — |
| | 1,649 |
| | (238 | ) | | 2/7/2014 | | 2006 | | Mesquite | | TX | | — |
| | 261 |
| | 1,388 |
| | — |
| | 1,649 |
| | (404 | ) | | 2/7/2014 | | 2006 |
| PLS Check Cashers | | Kenosha | | WI | | — |
| | 190 |
| | 693 |
| | — |
| | 883 |
| | (122 | ) | | 2/7/2014 | | 2005 | | Kenosha | | WI | | — |
| | 190 |
| | 693 |
| | — |
| | 883 |
| | (207 | ) | | 2/7/2014 | | 2005 |
| PNC Bank | | Woodbury | | NJ | | — |
| | 465 |
| | 2,633 |
| | — |
| | 3,098 |
| | (444 | ) | | 1/8/2014 | | 1971 | | Woodbury | | NJ | | — |
| | 465 |
| | 2,633 |
| | — |
| | 3,098 |
| | (744 | ) | | 1/8/2014 | | 1971 |
| PNC Bank | | Cincinnati | | OH | | — |
| | 195 |
| | 538 |
| | — |
| | 733 |
| | (92 | ) | | 1/8/2014 | | 1979 | | Cincinnati | | OH | | — |
| | 195 |
| | 538 |
| | (304 | ) | | 429 |
| | (5 | ) | | 1/8/2014 | | 1979 |
| Pollo Tropical | | Davie | | FL | | — |
| | 280 |
| | 1,490 |
| | — |
| | 1,770 |
| | (285 | ) | | 6/27/2013 | | 1995 | | Davie | | FL | | — |
| | 280 |
| | 1,490 |
| | — |
| | 1,770 |
| | (437 | ) | | 6/27/2013 | | 1995 |
| Pollo Tropical | | Fort Lauderdale | | FL | | — |
| | 190 |
| | 1,242 |
| | — |
| | 1,432 |
| | (238 | ) | | 6/27/2013 | | 1995 | | Fort Lauderdale | | FL | | — |
| | 190 |
| | 1,242 |
| | — |
| | 1,432 |
| | (364 | ) | | 6/27/2013 | | 1995 |
| Pollo Tropical | | Lake Worth | | FL | | — |
| | 280 |
| | 1,182 |
| | — |
| | 1,462 |
| | (227 | ) | | 6/27/2013 | | 1995 | | Lake Worth | | FL | | — |
| | 280 |
| | 1,182 |
| | — |
| | 1,462 |
| | (347 | ) | | 6/27/2013 | | 1995 |
| Ponderosa | | Scottsburg | | IN | | — |
| | 430 |
| | 141 |
| | — |
| | 571 |
| | (29 | ) | | 6/27/2013 | | 1985 | | Scottsburg | | IN | | — |
| | 430 |
| | 141 |
| | — |
| | 571 |
| | (43 | ) | | 6/27/2013 | | 1985 |
| Popeyes | | Brandon | | FL | | — |
| | 776 |
| | 961 |
| | — |
| | 1,737 |
| | (189 | ) | | 6/27/2013 | | 1978 | | Brandon | | FL | | — |
| | 776 |
| | 961 |
| | — |
| | 1,737 |
| | (285 | ) | | 6/27/2013 | | 1978 |
| Popeyes | | Carol City | | FL | | — |
| | 423 |
| | 1,090 |
| | — |
| | 1,513 |
| | (179 | ) | | 1/8/2014 | | 1979 | | Carol City | | FL | | — |
| | 423 |
| | 1,090 |
| | — |
| | 1,513 |
| | (301 | ) | | 1/8/2014 | | 1979 |
| Popeyes | | Jacksonville | | FL | | — |
| | 781 |
| | 955 |
| | — |
| | 1,736 |
| | (174 | ) | | 7/31/2013 | | 1955 | | Jacksonville | | FL | | — |
| | 781 |
| | 955 |
| | — |
| | 1,736 |
| | (268 | ) | | 7/31/2013 | | 1955 |
| Popeyes | | Lakeland | | FL | | — |
| | 830 |
| | 830 |
| | — |
| | 1,660 |
| | (151 | ) | | 7/31/2013 | | 1999 | | Lakeland | | FL | | — |
| | 830 |
| | 830 |
| | — |
| | 1,660 |
| | (233 | ) | | 7/31/2013 | | 1999 |
| Popeyes | | Miami | | FL | | — |
| | 220 |
| | 330 |
| | — |
| | 550 |
| | (60 | ) | | 7/31/2013 | | 1962 | | Miami | | FL | | — |
| | 220 |
| | 330 |
| | — |
| | 550 |
| | (93 | ) | | 7/31/2013 | | 1962 |
| Popeyes | | Orlando | | FL | | — |
| | 782 |
| | 955 |
| | — |
| | 1,737 |
| | (174 | ) | | 7/31/2013 | | 2004 | | Orlando | | FL | | — |
| | 782 |
| | 955 |
| | — |
| | 1,737 |
| | (268 | ) | | 7/31/2013 | | 2004 |
| Popeyes | | Pensacola | | FL | | — |
| | 301 |
| | 673 |
| | — |
| | 974 |
| | (111 | ) | | 1/8/2014 | | 2001 | | Pensacola | | FL | | — |
| | 301 |
| | 673 |
| | — |
| | 974 |
| | (186 | ) | | 1/8/2014 | | 2001 |
| Popeyes | | Starke | | FL | | — |
| | 380 |
| | — |
| | — |
| | 380 |
| | — |
| | 6/27/2013 | | 1995 | | Starke | | FL | | — |
| | 380 |
| | — |
| | 614 |
| | 994 |
| | (46 | ) | | 6/27/2013 | | 1995 |
| Popeyes | | | Tampa | | FL | | — |
| | 216 |
| | 508 |
| | — |
| | 724 |
| | (141 | ) | | 1/8/2014 | | 1981 |
| Popeyes | | | Tampa | | FL | | — |
| | 673 |
| | 1,065 |
| | — |
| | 1,738 |
| | (316 | ) | | 6/27/2013 | | 1976 |
| Popeyes | | | Winter Haven | | FL | | — |
| | 484 |
| | 1,001 |
| | — |
| | 1,485 |
| | (297 | ) | | 6/27/2013 | | 1976 |
| Popeyes | | | Thomasville | | GA | | — |
| | 110 |
| | 705 |
| | — |
| | 815 |
| | (207 | ) | | 6/27/2013 | | 1995 |
| | | | | | Initial Costs (1) | | Costs Capitalized Subsequent to Acquisition (2) | | Gross Amount
Carried at
December 31, 2016
(3) (4) | | | | | | Initial Costs (1) | | Costs Capitalized Subsequent to Acquisition (2) | | Gross Amount
Carried at
December 31, 2018
(3) (4) | | | |
| Property | | City | | State | | Encumbrances at
December 31, 2016 | | Land | | Buildings, Fixtures and Improvements | | Accumulated Depreciation
(3) (5) | | Date Acquired | | Date of Construction | | City | | State | | Encumbrances at
December 31, 2018 | | Land | | Buildings, Fixtures and Improvements | | Accumulated Depreciation
(3) (5) | | Date Acquired | | Date of Construction |
| Popeyes | | Tampa | | FL | | — |
| | 216 |
| | 508 |
| | — |
| | 724 |
| | (84 | ) | | 1/8/2014 | | 1981 | | Valdosta | | GA | | — |
| | 240 |
| | 599 |
| | — |
| | 839 |
| | (176 | ) | | 6/27/2013 | | 1995 |
| Popeyes | | Tampa | | FL | | — |
| | 673 |
| | 1,065 |
| | — |
| | 1,738 |
| | (209 | ) | | 6/27/2013 | | 1976 | | Baton Rouge | | LA | | — |
| | 323 |
| | 394 |
| | — |
| | 717 |
| | (111 | ) | �� | 7/31/2013 | | 1999 |
| Popeyes | | Winter Haven | | FL | | — |
| | 484 |
| | 1,001 |
| | — |
| | 1,485 |
| | (196 | ) | | 6/27/2013 | | 1976 | | Bayou Vista | | LA | | — |
| | 375 |
| | 709 |
| | — |
| | 1,084 |
| | (210 | ) | | 6/27/2013 | | 1985 |
| Popeyes | | Thomasville | | GA | | — |
| | 110 |
| | 705 |
| | — |
| | 815 |
| | (135 | ) | | 6/27/2013 | | 1995 | | Eunice | | LA | | — |
| | 382 |
| | 891 |
| | — |
| | 1,273 |
| | (250 | ) | | 7/31/2013 | | 1986 |
| Popeyes | | Valdosta | | GA | | — |
| | 240 |
| | 599 |
| | — |
| | 839 |
| | (115 | ) | | 6/27/2013 | | 1995 | | Franklin | | LA | | — |
| | 283 |
| | 538 |
| | — |
| | 821 |
| | (159 | ) | | 6/27/2013 | | 1985 |
| Popeyes | | Baton Rouge | | LA | | — |
| | 323 |
| | 394 |
| | — |
| | 717 |
| | (72 | ) | | 7/31/2013 | | 1999 | | Lafayette | | LA | | — |
| | 434 |
| | 899 |
| | — |
| | 1,333 |
| | (266 | ) | | 6/27/2013 | | 1993 |
| Popeyes | | Bayou Vista | | LA | | — |
| | 375 |
| | 709 |
| | — |
| | 1,084 |
| | (139 | ) | | 6/27/2013 | | 1985 | | Lafayette | | LA | | — |
| | 473 |
| | 901 |
| | — |
| | 1,374 |
| | (267 | ) | | 6/27/2013 | | 1996 |
| Popeyes | | Eunice | | LA | | — |
| | 382 |
| | 891 |
| | — |
| | 1,273 |
| | (163 | ) | | 7/31/2013 | | 1986 | | Marksville | | LA | | — |
| | 487 |
| | 1,129 |
| | — |
| | 1,616 |
| | (334 | ) | | 6/27/2013 | | 1987 |
| Popeyes | | Franklin | | LA | | — |
| | 283 |
| | 538 |
| | — |
| | 821 |
| | (106 | ) | | 6/27/2013 | | 1985 | | Ferguson | | MO | | — |
| | 128 |
| | 383 |
| | — |
| | 511 |
| | (108 | ) | | 7/31/2013 | | 1984 |
| Popeyes | | Lafayette | | LA | | — |
| | 434 |
| | 899 |
| | — |
| | 1,333 |
| | (176 | ) | | 6/27/2013 | | 1993 | | St. Louis | | MO | | — |
| | 248 |
| | 460 |
| | (579 | ) | | 129 |
| | — |
| | 6/27/2013 | | 1959 |
| Popeyes | | Lafayette | | LA | | — |
| | 473 |
| | 901 |
| | — |
| | 1,374 |
| | (177 | ) | | 6/27/2013 | | 1996 | | St. Louis | | MO | | — |
| | 288 |
| | 431 |
| | — |
| | 719 |
| | (121 | ) | | 7/31/2013 | | 1978 |
| Popeyes | | Marksville | | LA | | — |
| | 487 |
| | 1,129 |
| | — |
| | 1,616 |
| | (222 | ) | | 6/27/2013 | | 1987 | | Greenville | | MS | | — |
| | 513 |
| | 977 |
| | — |
| | 1,490 |
| | (289 | ) | | 6/27/2013 | | 1984 |
| Popeyes | | Ferguson | | MO | | — |
| | 128 |
| | 383 |
| | — |
| | 511 |
| | (70 | ) | | 7/31/2013 | | 1984 | | Grenada | | MS | | — |
| | 77 |
| | 458 |
| | — |
| | 535 |
| | (127 | ) | | 1/8/2014 | | 2007 |
| Popeyes | | St. Louis | | MO | | — |
| | 248 |
| | 460 |
| | — |
| | 708 |
| | (90 | ) | | 6/27/2013 | | 1959 | | Omaha | | NE | | — |
| | 343 |
| | 515 |
| | — |
| | 858 |
| | (144 | ) | | 7/31/2013 | | 1996 |
| Popeyes | | St. Louis | | MO | | — |
| | 288 |
| | 431 |
| | — |
| | 719 |
| | (79 | ) | | 7/31/2013 | | 1978 | | Omaha | | NE | | — |
| | 264 |
| | 615 |
| | — |
| | 879 |
| | (173 | ) | | 7/31/2013 | | 1985 |
| Popeyes | | Greenville | | MS | | — |
| | 513 |
| | 977 |
| | — |
| | 1,490 |
| | (192 | ) | | 6/27/2013 | | 1984 | | Eatontown | | NJ | | — |
| | 651 |
| | 796 |
| | — |
| | 1,447 |
| | (223 | ) | | 7/31/2013 | | 1987 |
| Popeyes | | Grenada | | MS | | — |
| | 77 |
| | 458 |
| | — |
| | 535 |
| | (76 | ) | | 1/8/2014 | | 2007 | | Austin | | TX | | — |
| | 1,216 |
| | 533 |
| | — |
| | 1,749 |
| | (158 | ) | | 6/27/2013 | | 1996 |
| Popeyes | | Omaha | | NE | | — |
| | 343 |
| | 515 |
| | — |
| | 858 |
| | (94 | ) | | 7/31/2013 | | 1996 | | Channelview | | TX | | — |
| | 220 |
| | 401 |
| | — |
| | 621 |
| | (118 | ) | | 6/27/2013 | | 1995 |
| Popeyes | | Omaha | | NE | | — |
| | 264 |
| | 615 |
| | — |
| | 879 |
| | (112 | ) | | 7/31/2013 | | 1985 | | Houston | | TX | | — |
| | 190 |
| | 452 |
| | — |
| | 642 |
| | (133 | ) | | 6/27/2013 | | 1995 |
| Popeyes | | Eatontown | | NJ | | — |
| | 651 |
| | 796 |
| | — |
| | 1,447 |
| | (145 | ) | | 7/31/2013 | | 1987 | | Houston | | TX | | — |
| | 295 |
| | 241 |
| | — |
| | 536 |
| | (68 | ) | | 7/31/2013 | | 1976 |
| Popeyes | | Austin | | TX | | — |
| | 1,216 |
| | 533 |
| | — |
| | 1,749 |
| | (105 | ) | | 6/27/2013 | | 1996 | | Houston | | TX | | — |
| | 111 |
| | 166 |
| | — |
| | 277 |
| | (47 | ) | | 7/31/2013 | | 1976 |
| Popeyes | | Channelview | | TX | | — |
| | 220 |
| | 401 |
| | — |
| | 621 |
| | (77 | ) | | 6/27/2013 | | 1995 | | Houston | | TX | | — |
| | 278 |
| | 227 |
| | — |
| | 505 |
| | (64 | ) | | 7/31/2013 | | 1978 |
| Popeyes | | Houston | | TX | | — |
| | 190 |
| | 452 |
| | — |
| | 642 |
| | (87 | ) | | 6/27/2013 | | 1995 | | Nederland | | TX | | — |
| | 445 |
| | 668 |
| | — |
| | 1,113 |
| | (187 | ) | | 7/31/2013 | | 1988 |
| Popeyes | | Houston | | TX | | — |
| | 295 |
| | 241 |
| | — |
| | 536 |
| | (44 | ) | | 7/31/2013 | | 1976 | | Orange | | TX | | — |
| | 456 |
| | 847 |
| | — |
| | 1,303 |
| | (238 | ) | | 7/31/2013 | | 1984 |
| Popeyes | | Houston | | TX | | — |
| | 111 |
| | 166 |
| | — |
| | 277 |
| | (30 | ) | | 7/31/2013 | | 1976 | | Port Arthur | | TX | | — |
| | 408 |
| | 589 |
| | — |
| | 997 |
| | (174 | ) | | 6/27/2013 | | 1984 |
| Popeyes | | Houston | | TX | | — |
| | 278 |
| | 227 |
| | — |
| | 505 |
| | (41 | ) | | 7/31/2013 | | 1978 | | Newport News | | VA | | — |
| | 381 |
| | 217 |
| | — |
| | 598 |
| | (64 | ) | | 6/27/2013 | | 2002 |
| Popeyes | | Nederland | | TX | | — |
| | 445 |
| | 668 |
| | — |
| | 1,113 |
| | (122 | ) | | 7/31/2013 | | 1988 | | Portsmouth | | VA | | — |
| | 369 |
| | 230 |
| | — |
| | 599 |
| | (68 | ) | | 6/27/2013 | | 2002 |
| Popeyes | | Orange | | TX | | — |
| | 456 |
| | 847 |
| | — |
| | 1,303 |
| | (155 | ) | | 7/31/2013 | | 1984 | |
| Popeyes | | Port Arthur | | TX | | — |
| | 408 |
| | 589 |
| | — |
| | 997 |
| | (116 | ) | | 6/27/2013 | | 1984 | |
| Popeyes | | Newport News | | VA | | — |
| | 381 |
| | 217 |
| | — |
| | 598 |
| | (43 | ) | | 6/27/2013 | | 2002 | |
| Popeyes | | Portsmouth | | VA | | — |
| | 369 |
| | 230 |
| | — |
| | 599 |
| | (45 | ) | | 6/27/2013 | | 2002 | |
| Price Rite | | Rochester | | NY | | 3,080 |
| | 569 |
| | 3,594 |
| | — |
| | 4,163 |
| | (997 | ) | | 9/27/2012 | | 1965 | | Rochester | | NY | | 3,080 |
| | 569 |
| | 3,594 |
| | — |
| | 4,163 |
| | (1,277 | ) | | 9/27/2012 | | 1965 |
| | | | | | Initial Costs (1) | | Costs Capitalized Subsequent to Acquisition (2) | | Gross Amount
Carried at
December 31, 2016
(3) (4) | | | | | | Initial Costs (1) | | Costs Capitalized Subsequent to Acquisition (2) | | Gross Amount
Carried at
December 31, 2018
(3) (4) | | | |
| Property | | City | | State | | Encumbrances at
December 31, 2016 | | Land | | Buildings, Fixtures and Improvements | | Accumulated Depreciation
(3) (5) | | Date Acquired | | Date of Construction | | City | | State | | Encumbrances at
December 31, 2018 | | Land | | Buildings, Fixtures and Improvements | | Accumulated Depreciation
(3) (5) | | Date Acquired | | Date of Construction |
| Publix | | Birmingham | | AL | | — |
| | 934 |
| | 6,377 |
| | 165 |
| | 7,476 |
| | (987 | ) | | 2/7/2014 | | 2004 | | Birmingham | | AL | | — |
| | 934 |
| | 6,377 |
| | 165 |
| | 7,476 |
| | (1,695 | ) | | 2/7/2014 | | 2004 |
| Pulte Mortgage | | Englewood | | CO | | — |
| | 2,563 |
| | 22,026 |
| | 1 |
| | 24,590 |
| | (3,460 | ) | | 11/5/2013 | | 2009 | | Englewood | | CO | | — |
| | 2,563 |
| | 22,026 |
| | — |
| | 24,589 |
| | (5,628 | ) | | 11/5/2013 | | 2009 |
| PWP Induestries, Inc. | | Kinston | | NC | | 8,930 |
| | 569 |
| | 8,307 |
| | — |
| | 8,876 |
| | (1,635 | ) | | 3/28/2014 | | 1995 | |
| Qdoba Mexican Grill | | Flint | | MI | | — |
| | 110 |
| | 990 |
| | — |
| | 1,100 |
| | (264 | ) | | 3/29/2013 | | 2006 | | Flint | | MI | | — |
| | 110 |
| | 990 |
| | — |
| | 1,100 |
| | (372 | ) | | 3/29/2013 | | 2006 |
| Qdoba Mexican Grill | | Grand Blanc | | MI | | — |
| | 165 |
| | 935 |
| | — |
| | 1,100 |
| | (250 | ) | | 3/29/2013 | | 2006 | | Grand Blanc | | MI | | — |
| | 165 |
| | 935 |
| | — |
| | 1,100 |
| | (352 | ) | | 3/29/2013 | | 2006 |
| Quincy's Family Steakhouse | | Monroe | | NC | | — |
| | 560 |
| | 458 |
| | (245 | ) | | 773 |
| | (33 | ) | | 7/31/2013 | | 1978 | | Monroe | | NC | | — |
| | 560 |
| | 458 |
| | (245 | ) | | 773 |
| | (72 | ) | | 7/31/2013 | | 1978 |
| RaceTrac | | Bessemer | | AL | | — |
| | 761 |
| | 2,624 |
| | — |
| | 3,385 |
| | (413 | ) | | 2/7/2014 | | 2003 | | Bessemer | | AL | | — |
| | 761 |
| | 2,624 |
| | — |
| | 3,385 |
| | (700 | ) | | 2/7/2014 | | 2003 |
| RaceTrac | | Mobile | | AL | | — |
| | 580 |
| | 1,317 |
| | — |
| | 1,897 |
| | (207 | ) | | 2/7/2014 | | 1998 | | Mobile | | AL | | — |
| | 580 |
| | 1,317 |
| | — |
| | 1,897 |
| | (350 | ) | | 2/7/2014 | | 1998 |
| RaceTrac | | Bellview | | FL | | — |
| | 684 |
| | 3,831 |
| | — |
| | 4,515 |
| | (626 | ) | | 2/7/2014 | | 2007 | | Bellview | | FL | | — |
| | 684 |
| | 3,831 |
| | — |
| | 4,515 |
| | (1,061 | ) | | 2/7/2014 | | 2007 |
| RaceTrac | | Jacksonville | | FL | | — |
| | 1,065 |
| | 2,863 |
| | — |
| | 3,928 |
| | (505 | ) | | 2/7/2014 | | 2011 | | Jacksonville | | FL | | — |
| | 1,065 |
| | 2,863 |
| | — |
| | 3,928 |
| | (856 | ) | | 2/7/2014 | | 2011 |
| RaceTrac | | Leesburg | | FL | | — |
| | 1,188 |
| | 2,711 |
| | — |
| | 3,899 |
| | (484 | ) | | 2/7/2014 | | 2007 | | Leesburg | | FL | | — |
| | 1,188 |
| | 2,711 |
| | — |
| | 3,899 |
| | (821 | ) | | 2/7/2014 | | 2007 |
| RaceTrac | | Atlanta | | GA | | — |
| | 1,025 |
| | 1,511 |
| | — |
| | 2,536 |
| | (252 | ) | | 2/7/2014 | | 2004 | | Atlanta | | GA | | — |
| | 1,025 |
| | 1,511 |
| | — |
| | 2,536 |
| | (427 | ) | | 2/7/2014 | | 2004 |
| RaceTrac | | Denton | | TX | | — |
| | 1,030 |
| | 2,645 |
| | — |
| | 3,675 |
| | (396 | ) | | 2/7/2014 | | 2003 | | Denton | | TX | | — |
| | 1,030 |
| | 2,645 |
| | — |
| | 3,675 |
| | (672 | ) | | 2/7/2014 | | 2003 |
| RaceTrac | | Houston | | TX | | — |
| | 1,209 |
| | 1,204 |
| | — |
| | 2,413 |
| | (185 | ) | | 2/7/2014 | | 1995 | | Houston | | TX | | — |
| | 1,209 |
| | 1,204 |
| | — |
| | 2,413 |
| | (314 | ) | | 2/7/2014 | | 1995 |
| RaceTrac | | Houston | | TX | | — |
| | 1,203 |
| | 1,509 |
| | — |
| | 2,712 |
| | (233 | ) | | 2/7/2014 | | 1997 | | Houston | | TX | | — |
| | 1,203 |
| | 1,509 |
| | — |
| | 2,712 |
| | (395 | ) | | 2/7/2014 | | 1997 |
| Rally's | | Indianapolis | | IN | | — |
| | 210 |
| | 1,514 |
| | — |
| | 1,724 |
| | (290 | ) | | 6/27/2013 | | 1995 | | Indianapolis | | IN | | — |
| | 210 |
| | 1,514 |
| | — |
| | 1,724 |
| | (444 | ) | | 6/27/2013 | | 1995 |
| Rally's | | Indianapolis | | IN | | — |
| | 1,168 |
| | — |
| | — |
| | 1,168 |
| | — |
| | 7/31/2013 | | 2005 | | Indianapolis | | IN | | — |
| | 1,168 |
| | — |
| | — |
| | 1,168 |
| | — |
| | 7/31/2013 | | 2005 |
| Rally's | | Indianapolis | | IN | | — |
| | 1,168 |
| | — |
| | — |
| | 1,168 |
| | — |
| | 7/31/2013 | | 2005 | | Indianapolis | | IN | | — |
| | 1,168 |
| | — |
| | — |
| | 1,168 |
| | — |
| | 7/31/2013 | | 2005 |
| Rally's | | Kokomo | | IN | | — |
| | 290 |
| | 548 |
| | — |
| | 838 |
| | (105 | ) | | 6/27/2013 | | 1995 | | Kokomo | | IN | | — |
| | 290 |
| | 548 |
| | — |
| | 838 |
| | (161 | ) | | 6/27/2013 | | 1995 |
| Rally's | | Muncie | | IN | | — |
| | 310 |
| | 1,196 |
| | — |
| | 1,506 |
| | (229 | ) | | 6/27/2013 | | 1995 | | Muncie | | IN | | — |
| | 310 |
| | 1,196 |
| | — |
| | 1,506 |
| | (351 | ) | | 6/27/2013 | | 1995 |
| Rally's | | Harvey | | LA | | — |
| | 420 |
| | 870 |
| | — |
| | 1,290 |
| | (167 | ) | | 6/27/2013 | | 1995 | | New Orleans | | LA | | — |
| | 450 |
| | 1,691 |
| | — |
| | 2,141 |
| | (496 | ) | | 6/27/2013 | | 1995 |
| Rally's | | New Orleans | | LA | | — |
| | 450 |
| | 1,691 |
| | — |
| | 2,141 |
| | (324 | ) | | 6/27/2013 | | 1995 | | New Orleans | | LA | | — |
| | 220 |
| | 1,018 |
| | — |
| | 1,238 |
| | (298 | ) | | 6/27/2013 | | 1995 |
| Rally's | | New Orleans | | LA | | — |
| | 220 |
| | 1,018 |
| | — |
| | 1,238 |
| | (195 | ) | | 6/27/2013 | | 1995 | | Hamtramck | | MI | | — |
| | 230 |
| | 1,020 |
| | — |
| | 1,250 |
| | (299 | ) | | 6/27/2013 | | 1995 |
| Rally's | | Hamtramck | | MI | | — |
| | 230 |
| | 1,020 |
| | — |
| | 1,250 |
| | (196 | ) | | 6/27/2013 | | 1995 | |
| Rancho Grande Grill | | Andalusia | | AL | | — |
| | 94 |
| | 251 |
| | — |
| | 345 |
| | (51 | ) | | 6/27/2013 | | 2004 | |
| RealTime Logic | | Colorado Springs | | CO | | — |
| | 1,100 |
| | 8,932 |
| | — |
| | 10,032 |
| | (3,145 | ) | | 5/9/2014 | | 2005 | |
| Reckitt Benckiser | | Chester | | NJ | | 5,500 |
| | 886 |
| | 7,972 |
| | — |
| | 8,858 |
| | (1,683 | ) | | 8/16/2012 | | 2006 | |
| Red Lobster | | Edmonton | | AB | | — |
| | 2,360 |
| | 555 |
| | — |
| | 2,915 |
| | (87 | ) | | 7/28/2014 | | 1990 | | Birmingham | | AL | | — |
| | — |
| | 741 |
| | — |
| | 741 |
| | (176 | ) | | 7/28/2014 | | 1972 |
| Red Lobster | | Edmonton | | AB | | — |
| | 2,585 |
| | 450 |
| | — |
| | 3,035 |
| | (85 | ) | | 7/28/2014 | | 1990 | | Dothan | | AL | | — |
| | 726 |
| | 1,244 |
| | — |
| | 1,970 |
| | (217 | ) | | 7/28/2014 | | 1979 |
| Red Lobster | | Birmingham | | AL | | — |
| | — |
| | 741 |
| | — |
| | 741 |
| | (97 | ) | | 7/28/2014 | | 1972 | | Huntsville | | AL | | — |
| | 1,098 |
| | 2,330 |
| | — |
| | 3,428 |
| | (322 | ) | | 7/28/2014 | | 1975 |
| Red Lobster | | Decatur | | AL | | — |
| | 1,100 |
| | 686 |
| | — |
| | 1,786 |
| | (105 | ) | | 7/28/2014 | | 1993 | | Montgomery | | AL | | — |
| | 1,034 |
| | 1,413 |
| | — |
| | 2,447 |
| | (241 | ) | | 7/28/2014 | | 1983 |
| Red Lobster | | Dothan | | AL | | — |
| | 726 |
| | 1,244 |
| | — |
| | 1,970 |
| | (120 | ) | | 7/28/2014 | | 1979 | | Vestavia Hills | | AL | | — |
| | 1,257 |
| | 1,417 |
| | — |
| | 2,674 |
| | (204 | ) | | 7/28/2014 | | 1972 |
| Red Lobster | | | Fort Smith | | AR | | — |
| | 1,643 |
| | 1,228 |
| | — |
| | 2,871 |
| | (227 | ) | | 7/28/2014 | | 1980 |
| Red Lobster | | | Hot Springs | | AR | | — |
| | 928 |
| | 1,593 |
| | — |
| | 2,521 |
| | (303 | ) | | 7/28/2014 | | 1994 |
| Red Lobster | | | North Little Rock | | AR | | — |
| | 999 |
| | 1,906 |
| | — |
| | 2,905 |
| | (295 | ) | | 7/28/2014 | | 1981 |
| Red Lobster | | | Pine Bluff | | AR | | — |
| | 226 |
| | 1,194 |
| | — |
| | 1,420 |
| | (254 | ) | | 7/28/2014 | | 1995 |
| Red Lobster | | | Chandler | | AZ | | — |
| | — |
| | 252 |
| | — |
| | 252 |
| | (165 | ) | | 7/28/2014 | | 2000 |
| Red Lobster | | | Flagstaff | | AZ | | — |
| | 891 |
| | 514 |
| | — |
| | 1,405 |
| | (182 | ) | | 7/28/2014 | | 1996 |
| | | | | | Initial Costs (1) | | Costs Capitalized Subsequent to Acquisition (2) | | Gross Amount
Carried at
December 31, 2016
(3) (4) | | | | | | Initial Costs (1) | | Costs Capitalized Subsequent to Acquisition (2) | | Gross Amount
Carried at
December 31, 2018
(3) (4) | | | |
| Property | | City | | State | | Encumbrances at
December 31, 2016 | | Land | | Buildings, Fixtures and Improvements | | Accumulated Depreciation
(3) (5) | | Date Acquired | | Date of Construction | | City | | State | | Encumbrances at
December 31, 2018 | | Land | | Buildings, Fixtures and Improvements | | Accumulated Depreciation
(3) (5) | | Date Acquired | | Date of Construction |
| Red Lobster | | Florence | | AL | | — |
| | 974 |
| | 908 |
| | — |
| | 1,882 |
| | (119 | ) | | 7/28/2014 | | 1990 | | Gilbert | | AZ | | — |
| | — |
| | 460 |
| | — |
| | 460 |
| | (212 | ) | | 7/28/2014 | | 2007 |
| Red Lobster | | Huntsville | | AL | | — |
| | 1,098 |
| | 2,330 |
| | — |
| | 3,428 |
| | (177 | ) | | 7/28/2014 | | 1975 | | Surprise | | AZ | | — |
| | — |
| | 565 |
| | — |
| | 565 |
| | (238 | ) | | 7/28/2014 | | 2003 |
| Red Lobster | | Montgomery | | AL | | — |
| | 1,034 |
| | 1,413 |
| | — |
| | 2,447 |
| | (133 | ) | | 7/28/2014 | | 1983 | | Tucson | | AZ | | — |
| | — |
| | 676 |
| | — |
| | 676 |
| | (238 | ) | | 7/28/2014 | | 2009 |
| Red Lobster | | Vestavia Hills | | AL | | — |
| | 1,257 |
| | 1,417 |
| | — |
| | 2,674 |
| | (112 | ) | | 7/28/2014 | | 1972 | | Bakersfield | | CA | | — |
| | — |
| | 731 |
| | — |
| | 731 |
| | (272 | ) | | 7/28/2014 | | 2003 |
| Red Lobster | | Fayetteville | | AR | | — |
| | 1,135 |
| | 1,248 |
| | — |
| | 2,383 |
| | (104 | ) | | 7/28/2014 | | 1984 | | Chula Vista | | CA | | — |
| | — |
| | 1,671 |
| | — |
| | 1,671 |
| | (361 | ) | | 7/28/2014 | | 1988 |
| Red Lobster | | Fort Smith | | AR | | — |
| | 1,643 |
| | 1,228 |
| | — |
| | 2,871 |
| | (125 | ) | | 7/28/2014 | | 1980 | | Fremont | | CA | | — |
| | 1,638 |
| | 564 |
| | — |
| | 2,202 |
| | (131 | ) | | 7/28/2014 | | 1984 |
| Red Lobster | | Hot Springs | | AR | | — |
| | 928 |
| | 1,593 |
| | — |
| | 2,521 |
| | (167 | ) | | 7/28/2014 | | 1994 | | Inglewood | | CA | | — |
| | — |
| | 2,211 |
| | — |
| | 2,211 |
| | (538 | ) | | 7/28/2014 | | 2007 |
| Red Lobster | | Little Rock | | AR | | — |
| | 1,942 |
| | 725 |
| | — |
| | 2,667 |
| | (84 | ) | | 7/28/2014 | | 1977 | | Oceanside | | CA | | — |
| | — |
| | 1,529 |
| | — |
| | 1,529 |
| | (345 | ) | | 7/28/2014 | | 2010 |
| Red Lobster | | North Little Rock | | AR | | — |
| | 999 |
| | 1,906 |
| | — |
| | 2,905 |
| | (163 | ) | | 7/28/2014 | | 1981 | | Palm Desert | | CA | | — |
| | 1,132 |
| | 1,321 |
| | — |
| | 2,453 |
| | (277 | ) | | 7/28/2014 | | 2012 |
| Red Lobster | | Pine Bluff | | AR | | — |
| | 226 |
| | 1,194 |
| | — |
| | 1,420 |
| | (140 | ) | | 7/28/2014 | | 1995 | | Riverside | | CA | | — |
| | 914 |
| | 2,459 |
| | — |
| | 3,373 |
| | (338 | ) | | 7/28/2014 | | 1988 |
| Red Lobster | | Rogers | | AR | | — |
| | 1,398 |
| | 2,069 |
| | — |
| | 3,467 |
| | (194 | ) | | 7/28/2014 | | 2008 | | San Bruno | | CA | | — |
| | — |
| | 1,611 |
| | — |
| | 1,611 |
| | (479 | ) | | 7/28/2014 | | 1992 |
| Red Lobster | | Chandler | | AZ | | — |
| | — |
| | 252 |
| | — |
| | 252 |
| | (91 | ) | | 7/28/2014 | | 2000 | | San Diego | | CA | | — |
| | — |
| | 1,113 |
| | — |
| | 1,113 |
| | (499 | ) | | 7/28/2014 | | 1988 |
| Red Lobster | | Flagstaff | | AZ | | — |
| | 891 |
| | 514 |
| | — |
| | 1,405 |
| | (100 | ) | | 7/28/2014 | | 1996 | | Valencia | | CA | | — |
| | — |
| | 841 |
| | — |
| | 841 |
| | (389 | ) | | 7/28/2014 | | 1988 |
| Red Lobster | | Gilbert | | AZ | | — |
| | — |
| | 460 |
| | — |
| | 460 |
| | (117 | ) | | 7/28/2014 | | 2007 | | Colorado Springs | | CO | | — |
| | — |
| | 1,512 |
| | — |
| | 1,512 |
| | (344 | ) | | 7/28/2014 | | 2004 |
| Red Lobster | | Phoenix | | AZ | | — |
| | 1,038 |
| | 350 |
| | — |
| | 1,388 |
| | (61 | ) | | 7/28/2014 | | 1982 | | Bridgeport | | CT | | — |
| | — |
| | 323 |
| | — |
| | 323 |
| | (172 | ) | | 7/28/2014 | | 1996 |
| Red Lobster | | Surprise | | AZ | | — |
| | — |
| | 565 |
| | — |
| | 565 |
| | (131 | ) | | 7/28/2014 | | 2003 | | Danbury | | CT | | — |
| | — |
| | 159 |
| | — |
| | 159 |
| | (123 | ) | | 7/28/2014 | | 1996 |
| Red Lobster | | Tucson | | AZ | | — |
| | — |
| | 676 |
| | — |
| | 676 |
| | (131 | ) | | 7/28/2014 | | 2009 | | Newark | | DE | | — |
| | — |
| | 1,515 |
| | — |
| | 1,515 |
| | (429 | ) | | 7/28/2014 | | 2006 |
| Red Lobster | | Bakersfield | | CA | | — |
| | — |
| | 731 |
| | — |
| | 731 |
| | (150 | ) | | 7/28/2014 | | 2003 | | Altamonte Springs | | FL | | — |
| | 1,212 |
| | 1,674 |
| | — |
| | 2,886 |
| | (273 | ) | | 7/28/2014 | | 1986 |
| Red Lobster | | Chico | | CA | | — |
| | 717 |
| | 1,146 |
| | — |
| | 1,863 |
| | (133 | ) | | 7/28/2014 | | 1994 | | Boynton Beach | | FL | | — |
| | — |
| | 1,631 |
| | — |
| | 1,631 |
| | (412 | ) | | 7/28/2014 | | 2008 |
| Red Lobster | | Chula Vista | | CA | | — |
| | — |
| | 1,671 |
| | — |
| | 1,671 |
| | (199 | ) | | 7/28/2014 | | 1988 | | Fort Pierce | | FL | | — |
| | 618 |
| | 1,491 |
| | — |
| | 2,109 |
| | (284 | ) | | 7/28/2014 | | 1995 |
| Red Lobster | | Fremont | | CA | | — |
| | 1,638 |
| | 564 |
| | — |
| | 2,202 |
| | (72 | ) | | 7/28/2014 | | 1984 | | Hollywood | | FL | | — |
| | — |
| | 2,282 |
| | — |
| | 2,282 |
| | (596 | ) | | 7/28/2014 | | 2003 |
| Red Lobster | | Inglewood | | CA | | — |
| | — |
| | 2,211 |
| | — |
| | 2,211 |
| | (297 | ) | | 7/28/2014 | | 2007 | | Kissimmee | | FL | | — |
| | — |
| | 1,364 |
| | — |
| | 1,364 |
| | (440 | ) | | 7/28/2014 | | 2002 |
| Red Lobster | | Oceanside | | CA | | — |
| | — |
| | 1,529 |
| | — |
| | 1,529 |
| | (190 | ) | | 7/28/2014 | | 2010 | | Leesburg | | FL | | — |
| | 721 |
| | 1,262 |
| | — |
| | 1,983 |
| | (245 | ) | | 7/28/2014 | | 1990 |
| Red Lobster | | Ontario | | CA | | — |
| | 1,304 |
| | 2,238 |
| | — |
| | 3,542 |
| | (190 | ) | | 7/28/2014 | | 2003 | | Miami | | FL | | — |
| | — |
| | 1,062 |
| | — |
| | 1,062 |
| | (400 | ) | | 7/28/2014 | | 2003 |
| Red Lobster | | Palm Desert | | CA | | — |
| | 1,132 |
| | 1,321 |
| | — |
| | 2,453 |
| | (153 | ) | | 7/28/2014 | | 2012 | | Orlando | | FL | | — |
| | — |
| | 1,188 |
| | — |
| | 1,188 |
| | (427 | ) | | 7/28/2014 | | 1989 |
| Red Lobster | | Riverside | | CA | | — |
| | 914 |
| | 2,459 |
| | — |
| | 3,373 |
| | (187 | ) | | 7/28/2014 | | 1988 | | Panama City | | FL | | — |
| | — |
| | 1,515 |
| | — |
| | 1,515 |
| | (382 | ) | | 7/28/2014 | | 1976 |
| Red Lobster | | San Bernardino | | CA | | — |
| | 838 |
| | 1,870 |
| | — |
| | 2,708 |
| | (169 | ) | | 7/28/2014 | | 1988 | | Pembroke Pines | | FL | | — |
| | 479 |
| | 3,126 |
| | — |
| | 3,605 |
| | (446 | ) | | 7/28/2014 | | 1987 |
| Red Lobster | | San Bruno | | CA | | — |
| | — |
| | 1,611 |
| | — |
| | 1,611 |
| | (264 | ) | | 7/28/2014 | | 1992 | | Plantation | | FL | | — |
| | 1,975 |
| | 1,733 |
| | — |
| | 3,708 |
| | (295 | ) | | 7/28/2014 | | 1989 |
| Red Lobster | | San Diego | | CA | | — |
| | — |
| | 1,113 |
| | — |
| | 1,113 |
| | (275 | ) | | 7/28/2014 | | 1988 | | Port Charlotte | | FL | | — |
| | 1,476 |
| | 1,516 |
| | — |
| | 2,992 |
| | (269 | ) | | 7/28/2014 | | 1990 |
| Red Lobster | | Torrance | | CA | | — |
| | 1,850 |
| | 1,579 |
| | — |
| | 3,429 |
| | (131 | ) | | 7/28/2014 | | 1988 | | Sebring | | FL | | — |
| | 1,003 |
| | 1,487 |
| | — |
| | 2,490 |
| | (254 | ) | | 7/28/2014 | | 1992 |
| Red Lobster | | Valencia | | CA | | — |
| | — |
| | 841 |
| | — |
| | 841 |
| | (215 | ) | | 7/28/2014 | | 1988 | | Winter Haven | | FL | | — |
| | 1,055 |
| | 2,217 |
| | — |
| | 3,272 |
| | (284 | ) | | 7/28/2014 | | 1972 |
| Red Lobster | | Colorado Springs | | CO | | — |
| | — |
| | 1,512 |
| | — |
| | 1,512 |
| | (190 | ) | | 7/28/2014 | | 2004 | | Athens | | GA | | — |
| | 669 |
| | 2,027 |
| | — |
| | 2,696 |
| | (266 | ) | | 7/28/2014 | | 1971 |
| Red Lobster | | | Austell | | GA | | — |
| | — |
| | 1,092 |
| | — |
| | 1,092 |
| | (301 | ) | | 7/28/2014 | | 2001 |
| | | | | | Initial Costs (1) | | Costs Capitalized Subsequent to Acquisition (2) | | Gross Amount
Carried at
December 31, 2016
(3) (4) | | | | | | Initial Costs (1) | | Costs Capitalized Subsequent to Acquisition (2) | | Gross Amount
Carried at
December 31, 2018
(3) (4) | | | |
| Property | | City | | State | | Encumbrances at
December 31, 2016 | | Land | | Buildings, Fixtures and Improvements | | Accumulated Depreciation
(3) (5) | | Date Acquired | | Date of Construction | | City | | State | | Encumbrances at
December 31, 2018 | | Land | | Buildings, Fixtures and Improvements | | Accumulated Depreciation
(3) (5) | | Date Acquired | | Date of Construction |
| Red Lobster | | Fort Collins | | CO | | — |
| | 828 |
| | 1,360 |
| | — |
| | 2,188 |
| | (132 | ) | | 7/28/2014 | | 1983 | | Buford | | GA | | — |
| | 1,315 |
| | 2,638 |
| | — |
| | 3,953 |
| | (408 | ) | | 7/28/2014 | | 2000 |
| Red Lobster | | Bridgeport | | CT | | — |
| | — |
| | 323 |
| | — |
| | 323 |
| | (95 | ) | | 7/28/2014 | | 1996 | | Cartersville | | GA | | — |
| | 594 |
| | 1,386 |
| | — |
| | 1,980 |
| | (257 | ) | | 7/28/2014 | | 1996 |
| Red Lobster | | Danbury | | CT | | — |
| | — |
| | 159 |
| | — |
| | 159 |
| | (68 | ) | | 7/28/2014 | | 1996 | | Columbus | | GA | | — |
| | 956 |
| | 1,957 |
| | — |
| | 2,913 |
| | (330 | ) | | 7/28/2014 | | 2005 |
| Red Lobster | | Newark | | DE | | — |
| | — |
| | 1,515 |
| | — |
| | 1,515 |
| | (237 | ) | | 7/28/2014 | | 2006 | | Dalton | | GA | | — |
| | 775 |
| | 2,045 |
| | — |
| | 2,820 |
| | (314 | ) | | 7/28/2014 | | 1995 |
| Red Lobster | | Talleyville | | DE | | — |
| | 1,201 |
| | 1,877 |
| | — |
| | 3,078 |
| | (171 | ) | | 7/28/2014 | | 1991 | | Decatur | | GA | | — |
| | 1,102 |
| | 1,873 |
| | — |
| | 2,975 |
| | (258 | ) | | 7/28/2014 | | 1973 |
| Red Lobster | | Altamonte Springs | | FL | | — |
| | 1,212 |
| | 1,674 |
| | — |
| | 2,886 |
| | (150 | ) | | 7/28/2014 | | 1986 | | Douglasville | | GA | | — |
| | 1,356 |
| | 1,161 |
| | — |
| | 2,517 |
| | (225 | ) | | 7/28/2014 | | 1991 |
| Red Lobster | | Boynton Beach | | FL | | — |
| | — |
| | 1,631 |
| | — |
| | 1,631 |
| | (227 | ) | | 7/28/2014 | | 2008 | | Jonesboro | | GA | | — |
| | 1,049 |
| | 1,678 |
| | — |
| | 2,727 |
| | (233 | ) | | 7/28/2014 | | 1972 |
| Red Lobster | | Fort Pierce | | FL | | — |
| | 618 |
| | 1,491 |
| | — |
| | 2,109 |
| | (156 | ) | | 7/28/2014 | | 1995 | | Kennesaw | | GA | | — |
| | 1,382 |
| | 1,802 |
| | — |
| | 3,184 |
| | (283 | ) | | 7/28/2014 | | 1987 |
| Red Lobster | | Hollywood | | FL | | — |
| | — |
| | 2,282 |
| | — |
| | 2,282 |
| | (329 | ) | | 7/28/2014 | | 2003 | | Rome | | GA | | — |
| | 961 |
| | 911 |
| | — |
| | 1,872 |
| | (174 | ) | | 7/28/2014 | | 1979 |
| Red Lobster | | Kissimmee | | FL | | — |
| | — |
| | 1,364 |
| | — |
| | 1,364 |
| | (243 | ) | | 7/28/2014 | | 2002 | | Roswell | | GA | | — |
| | 2,358 |
| | 354 |
| | — |
| | 2,712 |
| | (108 | ) | | 7/28/2014 | | 1981 |
| Red Lobster | | Leesburg | | FL | | — |
| | 721 |
| | 1,262 |
| | — |
| | 1,983 |
| | (135 | ) | | 7/28/2014 | | 1990 | | Savannah | | GA | | — |
| | 475 |
| | 2,236 |
| | — |
| | 2,711 |
| | (299 | ) | | 7/28/2014 | | 1971 |
| Red Lobster | | Miami | | FL | | — |
| | — |
| | 1,062 |
| | — |
| | 1,062 |
| | (220 | ) | | 7/28/2014 | | 2003 | | Tucker | | GA | | — |
| | — |
| | 1,718 |
| | — |
| | 1,718 |
| | (435 | ) | | 7/28/2014 | | 1973 |
| Red Lobster | | Orlando | | FL | | — |
| | — |
| | 1,188 |
| | — |
| | 1,188 |
| | (235 | ) | | 7/28/2014 | | 1989 | | Cedar Rapids | | IA | | — |
| | — |
| | 495 |
| | — |
| | 495 |
| | (245 | ) | | 7/28/2014 | | 1981 |
| Red Lobster | | Orlando | | FL | | — |
| | 1,728 |
| | 1,899 |
| | — |
| | 3,627 |
| | (143 | ) | | 7/28/2014 | | 1974 | | Davenport | | IA | | — |
| | 619 |
| | 2,896 |
| | — |
| | 3,515 |
| | (388 | ) | | 7/28/2014 | | 1975 |
| Red Lobster | | Panama City | | FL | | — |
| | — |
| | 1,515 |
| | — |
| | 1,515 |
| | (211 | ) | | 7/28/2014 | | 1976 | | Boise | | ID | | — |
| | — |
| | 714 |
| | — |
| | 714 |
| | (262 | ) | | 7/28/2014 | | 1988 |
| Red Lobster | | Pembroke Pines | | FL | | — |
| | 479 |
| | 3,126 |
| | — |
| | 3,605 |
| | (246 | ) | | 7/28/2014 | | 1987 | | Pocatello | | ID | | — |
| | — |
| | 773 |
| | — |
| | 773 |
| | (401 | ) | | 7/28/2014 | | 1994 |
| Red Lobster | | Plantation | | FL | | — |
| | 1,975 |
| | 1,733 |
| | — |
| | 3,708 |
| | (163 | ) | | 7/28/2014 | | 1989 | | Alton | | IL | | — |
| | 1,251 |
| | 1,854 |
| | — |
| | 3,105 |
| | (282 | ) | | 7/28/2014 | | 1983 |
| Red Lobster | | Port Charlotte | | FL | | — |
| | 1,476 |
| | 1,516 |
| | — |
| | 2,992 |
| | (148 | ) | | 7/28/2014 | | 1990 | | Aurora | | IL | | — |
| | 1,598 |
| | 782 |
| | — |
| | 2,380 |
| | (149 | ) | | 7/28/2014 | | 1979 |
| Red Lobster | | Sebring | | FL | | — |
| | 1,003 |
| | 1,487 |
| | — |
| | 2,490 |
| | (140 | ) | | 7/28/2014 | | 1992 | | Chicago | | IL | | — |
| | 1,064 |
| | 2,422 |
| | — |
| | 3,486 |
| | (335 | ) | | 7/28/2014 | | 1980 |
| Red Lobster | | Winter Haven | | FL | | — |
| | 1,055 |
| | 2,217 |
| | — |
| | 3,272 |
| | (156 | ) | | 7/28/2014 | | 1972 | | Danville | | IL | | — |
| | 253 |
| | 1,580 |
| | — |
| | 1,833 |
| | (294 | ) | | 7/28/2014 | | 1991 |
| Red Lobster | | Athens | | GA | | — |
| | 669 |
| | 2,027 |
| | — |
| | 2,696 |
| | (147 | ) | | 7/28/2014 | | 1971 | | Fairview Heights | | IL | | — |
| | — |
| | 1,806 |
| | — |
| | 1,806 |
| | (811 | ) | | 7/28/2014 | | 1972 |
| Red Lobster | | Augusta | | GA | | — |
| | 877 |
| | 1,301 |
| | — |
| | 2,178 |
| | (108 | ) | | 7/28/2014 | | 1971 | | Forsyth | | IL | | — |
| | — |
| | 1,083 |
| | — |
| | 1,083 |
| | (324 | ) | | 7/28/2014 | | 1975 |
| Red Lobster | | Austell | | GA | | — |
| | — |
| | 1,092 |
| | — |
| | 1,092 |
| | (166 | ) | | 7/28/2014 | | 2001 | | Gurnee | | IL | | — |
| | 1,735 |
| | 2,286 |
| | — |
| | 4,021 |
| | (319 | ) | | 7/28/2014 | | 1980 |
| Red Lobster | | Buford | | GA | | — |
| | 1,315 |
| | 2,638 |
| | — |
| | 3,953 |
| | (225 | ) | | 7/28/2014 | | 2000 | | Marion | | IL | | — |
| | 399 |
| | 2,399 |
| | — |
| | 2,798 |
| | (378 | ) | | 7/28/2014 | | 1992 |
| Red Lobster | | Canton | | GA | | — |
| | 596 |
| | 1,647 |
| | — |
| | 2,243 |
| | (164 | ) | | 7/30/2014 | | 2000 | | Matteson | | IL | | — |
| | 962 |
| | 2,212 |
| | — |
| | 3,174 |
| | (298 | ) | | 7/28/2014 | | 1976 |
| Red Lobster | | Cartersville | | GA | | — |
| | 594 |
| | 1,386 |
| | — |
| | 1,980 |
| | (142 | ) | | 7/28/2014 | | 1996 | | Norridge | | IL | | — |
| | — |
| | 929 |
| | — |
| | 929 |
| | (449 | ) | | 7/28/2014 | | 1979 |
| Red Lobster | | Columbus | | GA | | — |
| | 956 |
| | 1,957 |
| | — |
| | 2,913 |
| | (182 | ) | | 7/28/2014 | | 2005 | | Oak Lawn | | IL | | — |
| | 1,825 |
| | 2,316 |
| | — |
| | 4,141 |
| | (311 | ) | | 7/28/2014 | | 1975 |
| Red Lobster | | Conyers | | GA | | — |
| | 549 |
| | 3,144 |
| | — |
| | 3,693 |
| | (256 | ) | | 7/28/2014 | | 2000 | | Orland Park | | IL | | — |
| | 1,046 |
| | 2,489 |
| | — |
| | 3,535 |
| | (348 | ) | | 7/28/2014 | | 1980 |
| Red Lobster | | Dalton | | GA | | — |
| | 775 |
| | 2,045 |
| | — |
| | 2,820 |
| | (173 | ) | | 7/28/2014 | | 1995 | | Peru | | IL | | — |
| | 339 |
| | 1,169 |
| | — |
| | 1,508 |
| | (235 | ) | | 7/28/2014 | | 1995 |
| Red Lobster | | Decatur | | GA | | — |
| | 1,102 |
| | 1,873 |
| | — |
| | 2,975 |
| | (143 | ) | | 7/28/2014 | | 1973 | | Schaumburg | | IL | | — |
| | — |
| | 665 |
| | — |
| | 665 |
| | (226 | ) | | 7/28/2014 | | 1976 |
| Red Lobster | | Douglasville | | GA | | — |
| | 1,356 |
| | 1,161 |
| | — |
| | 2,517 |
| | (124 | ) | | 7/28/2014 | | 1991 | | Springfield | | IL | | — |
| | 1,205 |
| | 1,253 |
| | — |
| | 2,458 |
| | (218 | ) | | 7/28/2014 | | 1977 |
| Red Lobster | | Jonesboro | | GA | | — |
| | 1,049 |
| | 1,678 |
| | — |
| | 2,727 |
| | (128 | ) | | 7/28/2014 | | 1972 | | West Dundee | | IL | | — |
| | 197 |
| | 2,195 |
| | — |
| | 2,392 |
| | (313 | ) | | 7/28/2014 | | 1982 |
| Red Lobster | | | Anderson | | IN | | — |
| | 813 |
| | 1,272 |
| | — |
| | 2,085 |
| | (216 | ) | | 7/28/2014 | | 1982 |
| | | | | | Initial Costs (1) | | Costs Capitalized Subsequent to Acquisition (2) | | Gross Amount
Carried at
December 31, 2016
(3) (4) | | | | | | Initial Costs (1) | | Costs Capitalized Subsequent to Acquisition (2) | | Gross Amount
Carried at
December 31, 2018
(3) (4) | | | |
| Property | | City | | State | | Encumbrances at
December 31, 2016 | | Land | | Buildings, Fixtures and Improvements | | Accumulated Depreciation
(3) (5) | | Date Acquired | | Date of Construction | | City | | State | | Encumbrances at
December 31, 2018 | | Land | | Buildings, Fixtures and Improvements | | Accumulated Depreciation
(3) (5) | | Date Acquired | | Date of Construction |
| Red Lobster | | Kennesaw | | GA | | — |
| | 1,382 |
| | 1,802 |
| | — |
| | 3,184 |
| | (156 | ) | | 7/28/2014 | | 1987 | | Avon | | IN | | — |
| | — |
| | 864 |
| | — |
| | 864 |
| | (324 | ) | | 7/28/2014 | | 2001 |
| Red Lobster | | Newnan | | GA | | — |
| | 1,063 |
| | 1,547 |
| | — |
| | 2,610 |
| | (155 | ) | | 7/28/2014 | | 1999 | | Elkhart | | IN | | — |
| | 616 |
| | 1,657 |
| | — |
| | 2,273 |
| | (391 | ) | | 9/19/2014 | | 1993 |
| Red Lobster | | Perry | | GA | | — |
| | 351 |
| | 1,839 |
| | — |
| | 2,190 |
| | (174 | ) | | 7/28/2014 | | 1996 | | Evansville | | IN | | — |
| | 587 |
| | 3,357 |
| | — |
| | 3,944 |
| | (441 | ) | | 7/28/2014 | | 1972 |
| Red Lobster | | Rome | | GA | | — |
| | 961 |
| | 911 |
| | — |
| | 1,872 |
| | (96 | ) | | 7/28/2014 | | 1979 | | Kokomo | | IN | | — |
| | 394 |
| | 1,835 |
| | — |
| | 2,229 |
| | (274 | ) | | 7/28/2014 | | 1980 |
| Red Lobster | | Roswell | | GA | | — |
| | 2,358 |
| | 354 |
| | — |
| | 2,712 |
| | (60 | ) | | 7/28/2014 | | 1981 | | Mishawaka | | IN | | — |
| | 593 |
| | 2,205 |
| | — |
| | 2,798 |
| | (307 | ) | | 7/28/2014 | | 1974 |
| Red Lobster | | Savannah | | GA | | — |
| | 475 |
| | 2,236 |
| | — |
| | 2,711 |
| | (165 | ) | | 7/28/2014 | | 1971 | | Muncie | | IN | | — |
| | 627 |
| | 1,427 |
| | — |
| | 2,054 |
| | (189 | ) | | 7/28/2014 | | 1975 |
| Red Lobster | | Smyrna | | GA | | — |
| | 1,090 |
| | 1,677 |
| | — |
| | 2,767 |
| | (143 | ) | | 7/28/2014 | | 1983 | | Richmond | | IN | | — |
| | 371 |
| | 1,416 |
| | — |
| | 1,787 |
| | (273 | ) | | 7/28/2014 | | 1996 |
| Red Lobster | | Snellville | | GA | | — |
| | 887 |
| | 2,223 |
| | — |
| | 3,110 |
| | (189 | ) | | 7/28/2014 | | 1992 | | Terre Haute | | IN | | — |
| | 1,066 |
| | 2,640 |
| | — |
| | 3,706 |
| | (355 | ) | | 7/28/2014 | | 1972 |
| Red Lobster | | Tucker | | GA | | — |
| | — |
| | 1,718 |
| | — |
| | 1,718 |
| | (240 | ) | | 7/28/2014 | | 1973 | | Elizabethtown | | KY | | — |
| | 866 |
| | 401 |
| | — |
| | 1,267 |
| | (179 | ) | | 7/28/2014 | | 2003 |
| Red Lobster | | Ames | | IA | | — |
| | 789 |
| | 1,133 |
| | — |
| | 1,922 |
| | (134 | ) | | 7/28/2014 | | 1995 | | Lexington | | KY | | — |
| | — |
| | 1,094 |
| | — |
| | 1,094 |
| | (318 | ) | | 7/28/2014 | | 2011 |
| Red Lobster | | Cedar Rapids | | IA | | — |
| | — |
| | 495 |
| | — |
| | 495 |
| | (135 | ) | | 7/28/2014 | | 1981 | | Owensboro | | KY | | — |
| | 815 |
| | 1,485 |
| | — |
| | 2,300 |
| | (250 | ) | | 7/28/2014 | | 1982 |
| Red Lobster | | Davenport | | IA | | — |
| | 619 |
| | 2,896 |
| | — |
| | 3,515 |
| | (214 | ) | | 7/28/2014 | | 1975 | | St. Matthews | | KY | | — |
| | 1,640 |
| | 1,841 |
| | — |
| | 3,481 |
| | (258 | ) | | 7/28/2014 | | 1972 |
| Red Lobster | | West Des Moines | | IA | | — |
| | 1,033 |
| | 2,358 |
| | — |
| | 3,391 |
| | (181 | ) | | 7/28/2014 | | 1975 | | Baton Rouge | | LA | | — |
| | — |
| | 1,535 |
| | — |
| | 1,535 |
| | (390 | ) | | 7/28/2014 | | 2011 |
| Red Lobster | | Boise | | ID | | — |
| | — |
| | 714 |
| | — |
| | 714 |
| | (144 | ) | | 7/28/2014 | | 1988 | | Monroe | | LA | | — |
| | 455 |
| | 2,022 |
| | — |
| | 2,477 |
| | (327 | ) | | 7/28/2014 | | 1991 |
| Red Lobster | | Pocatello | | ID | | — |
| | — |
| | 773 |
| | — |
| | 773 |
| | (221 | ) | | 7/28/2014 | | 1994 | | Annapolis | | MD | | — |
| | — |
| | 644 |
| | — |
| | 644 |
| | (189 | ) | | 7/28/2014 | | 1985 |
| Red Lobster | | Alton | | IL | | — |
| | 1,251 |
| | 1,854 |
| | — |
| | 3,105 |
| | (155 | ) | | 7/28/2014 | | 1983 | | Frederick | | MD | | — |
| | — |
| | 319 |
| | — |
| | 319 |
| | (185 | ) | | 7/28/2014 | | 1997 |
| Red Lobster | | Aurora | | IL | | — |
| | 1,598 |
| | 782 |
| | — |
| | 2,380 |
| | (82 | ) | | 7/28/2014 | | 1979 | | Lanham | | MD | | — |
| | — |
| | 455 |
| | — |
| | 455 |
| | (200 | ) | | 7/28/2014 | | 1980 |
| Red Lobster | | Bloomingdale | | IL | | — |
| | 1,165 |
| | 1,309 |
| | — |
| | 2,474 |
| | (117 | ) | | 7/28/2014 | | 1981 | | Owings Mills | | MD | | — |
| | — |
| | 229 |
| | — |
| | 229 |
| | (128 | ) | | 7/28/2014 | | 1989 |
| Red Lobster | | Chicago | | IL | | — |
| | 1,064 |
| | 2,422 |
| | — |
| | 3,486 |
| | (185 | ) | | 7/28/2014 | | 1980 | | Salisbury | | MD | | — |
| | 1,070 |
| | 1,868 |
| | — |
| | 2,938 |
| | (321 | ) | | 7/28/2014 | | 1992 |
| Red Lobster | | Danville | | IL | | — |
| | 253 |
| | 1,580 |
| | — |
| | 1,833 |
| | (162 | ) | | 7/28/2014 | | 1991 | | Suitland | | MD | | — |
| | 1,090 |
| | 3,112 |
| | — |
| | 4,202 |
| | (399 | ) | | 7/28/2014 | | 1975 |
| Red Lobster | | Downers Grove | | IL | | — |
| | 1,694 |
| | 1,854 |
| | — |
| | 3,548 |
| | (167 | ) | | 7/30/2014 | | 1990 | | Battle Creek | | MI | | — |
| | 202 |
| | 1,827 |
| | — |
| | 2,029 |
| | (280 | ) | | 7/28/2014 | | 1979 |
| Red Lobster | | Fairview Heights | | IL | | — |
| | — |
| | 1,806 |
| | — |
| | 1,806 |
| | (447 | ) | | 7/28/2014 | | 1972 | | Dearborn Heights | | MI | | — |
| | 822 |
| | 2,156 |
| | — |
| | 2,978 |
| | (305 | ) | | 7/28/2014 | | 1975 |
| Red Lobster | | Forsyth | | IL | | — |
| | — |
| | 1,083 |
| | — |
| | 1,083 |
| | (179 | ) | | 7/28/2014 | | 1975 | | Flint | | MI | | — |
| | 505 |
| | 2,266 |
| | — |
| | 2,771 |
| | (325 | ) | | 7/28/2014 | | 1976 |
| Red Lobster | | Gurnee | | IL | | — |
| | 1,735 |
| | 2,286 |
| | — |
| | 4,021 |
| | (176 | ) | | 7/28/2014 | | 1980 | | Jackson | | MI | | — |
| | 235 |
| | 2,174 |
| | — |
| | 2,409 |
| | (310 | ) | | 7/28/2014 | | 1976 |
| Red Lobster | | Marion | | IL | | — |
| | 399 |
| | 2,399 |
| | — |
| | 2,798 |
| | (208 | ) | | 7/28/2014 | | 1992 | | Kentwood | | MI | | — |
| | 819 |
| | 1,606 |
| | — |
| | 2,425 |
| | (243 | ) | | 7/28/2014 | | 1975 |
| Red Lobster | | Matteson | | IL | | — |
| | 962 |
| | 2,212 |
| | — |
| | 3,174 |
| | (164 | ) | | 7/28/2014 | | 1976 | | Lansing | | MI | | — |
| | — |
| | 1,534 |
| | — |
| | 1,534 |
| | (390 | ) | | 7/28/2014 | | 1976 |
| Red Lobster | | Norridge | | IL | | — |
| | — |
| | 929 |
| | — |
| | 929 |
| | (248 | ) | | 7/28/2014 | | 1979 | | Livonia | | MI | | — |
| | 635 |
| | 1,824 |
| | — |
| | 2,459 |
| | (299 | ) | | 7/28/2014 | | 1987 |
| Red Lobster | | Oak Lawn | | IL | | — |
| | 1,825 |
| | 2,316 |
| | — |
| | 4,141 |
| | (171 | ) | | 7/28/2014 | | 1975 | | Mt. Pleasant | | MI | | — |
| | 508 |
| | 1,346 |
| | — |
| | 1,854 |
| | (261 | ) | | 7/28/2014 | | 1993 |
| Red Lobster | | Orland Park | | IL | | — |
| | 1,046 |
| | 2,489 |
| | — |
| | 3,535 |
| | (192 | ) | | 7/28/2014 | | 1980 | | Novi | | MI | | — |
| | 2,061 |
| | 1,847 |
| | — |
| | 3,908 |
| | (295 | ) | | 7/28/2014 | | 1983 |
| Red Lobster | | Peru | | IL | | — |
| | 339 |
| | 1,169 |
| | — |
| | 1,508 |
| | (130 | ) | | 7/28/2014 | | 1995 | | Portage | | MI | | — |
| | 396 |
| | 2,496 |
| | — |
| | 2,892 |
| | (341 | ) | | 7/28/2014 | | 1975 |
| Red Lobster | | Schaumburg | | IL | | — |
| | — |
| | 665 |
| | — |
| | 665 |
| | (125 | ) | | 7/28/2014 | | 1976 | | Saginaw | | MI | | — |
| | 335 |
| | 1,961 |
| | — |
| | 2,296 |
| | (287 | ) | | 7/28/2014 | | 1975 |
| Red Lobster | | Springfield | | IL | | — |
| | 1,205 |
| | 1,253 |
| | — |
| | 2,458 |
| | (120 | ) | | 7/28/2014 | | 1977 | | Southgate | | MI | | — |
| | 611 |
| | 2,531 |
| | — |
| | 3,142 |
| | (389 | ) | | 7/28/2014 | | 1990 |
| Red Lobster | | | Traverse City | | MI | | — |
| | 1,036 |
| | 1,121 |
| | — |
| | 2,157 |
| | (244 | ) | | 7/28/2014 | | 1996 |
|
| | | | | | | | | | | | | | | | | | | | | | | | | | |
| | | | | | | | Initial Costs (1) | | Costs Capitalized Subsequent to Acquisition (2) | | Gross Amount
Carried at
December 31, 2016
(3) (4) | | | | | | |
| Property | | City | | State | | Encumbrances at
December 31, 2016 | | Land | | Buildings, Fixtures and Improvements | | | Accumulated Depreciation
(3) (5) | | Date Acquired | | Date of Construction |
| Red Lobster | | West Dundee | | IL | | — |
| | 197 |
| | 2,195 |
| | — |
| | 2,392 |
| | (172 | ) | | 7/28/2014 | | 1982 |
| Red Lobster | | Anderson | | IN | | — |
| | 813 |
| | 1,272 |
| | — |
| | 2,085 |
| | (119 | ) | | 7/28/2014 | | 1982 |
| Red Lobster | | Avon | | IN | | — |
| | — |
| | 864 |
| | — |
| | 864 |
| | (179 | ) | | 7/28/2014 | | 2001 |
| Red Lobster | | Columbus | | IN | | — |
| | 615 |
| | 1,435 |
| | — |
| | 2,050 |
| | (143 | ) | | 7/28/2014 | | 1991 |
| Red Lobster | | Elkhart | | IN | | — |
| | 616 |
| | 1,657 |
| | — |
| | 2,273 |
| | (211 | ) | | 9/19/2014 | | 1993 |
| Red Lobster | | Evansville | | IN | | — |
| | 587 |
| | 3,357 |
| | — |
| | 3,944 |
| | (243 | ) | | 7/28/2014 | | 1972 |
| Red Lobster | | Fort Wayne | | IN | | — |
| | 567 |
| | 2,985 |
| | — |
| | 3,552 |
| | (217 | ) | | 7/28/2014 | | 1973 |
| Red Lobster | | Kokomo | | IN | | — |
| | 394 |
| | 1,835 |
| | — |
| | 2,229 |
| | (151 | ) | | 7/28/2014 | | 1980 |
| Red Lobster | | Merrillville | | IN | | — |
| | 568 |
| | 3,197 |
| | — |
| | 3,765 |
| | (230 | ) | | 7/28/2014 | | 1979 |
| Red Lobster | | Michigan City | | IN | | — |
| | 330 |
| | 2,233 |
| | — |
| | 2,563 |
| | (189 | ) | | 7/28/2014 | | 1992 |
| Red Lobster | | Mishawaka | | IN | | — |
| | 593 |
| | 2,205 |
| | — |
| | 2,798 |
| | (169 | ) | | 7/28/2014 | | 1974 |
| Red Lobster | | Muncie | | IN | | — |
| | 627 |
| | 1,427 |
| | — |
| | 2,054 |
| | (104 | ) | | 7/28/2014 | | 1975 |
| Red Lobster | | Richmond | | IN | | — |
| | 371 |
| | 1,416 |
| | — |
| | 1,787 |
| | (150 | ) | | 7/28/2014 | | 1996 |
| Red Lobster | | Terre Haute | | IN | | — |
| | 1,066 |
| | 2,640 |
| | — |
| | 3,706 |
| | (196 | ) | | 7/28/2014 | | 1972 |
| Red Lobster | | Topeka | | KS | | — |
| | 754 |
| | 2,211 |
| | — |
| | 2,965 |
| | (167 | ) | | 7/28/2014 | | 1972 |
| Red Lobster | | Elizabethtown | | KY | | — |
| | 866 |
| | 401 |
| | — |
| | 1,267 |
| | (98 | ) | | 7/28/2014 | | 2003 |
| Red Lobster | | Lexington | | KY | | — |
| | — |
| | 1,094 |
| | — |
| | 1,094 |
| | (175 | ) | | 7/28/2014 | | 2011 |
| Red Lobster | | Louisville | | KY | | — |
| | 893 |
| | 1,350 |
| | — |
| | 2,243 |
| | (140 | ) | | 7/28/2014 | | 1991 |
| Red Lobster | | Owensboro | | KY | | — |
| | 815 |
| | 1,485 |
| | — |
| | 2,300 |
| | (138 | ) | | 7/28/2014 | | 1982 |
| Red Lobster | | St. Matthews | | KY | | — |
| | 1,640 |
| | 1,841 |
| | — |
| | 3,481 |
| | (142 | ) | | 7/28/2014 | | 1972 |
| Red Lobster | | Baton Rouge | | LA | | — |
| | — |
| | 1,535 |
| | — |
| | 1,535 |
| | (215 | ) | | 7/28/2014 | | 2011 |
| Red Lobster | | Monroe | | LA | | — |
| | 455 |
| | 2,022 |
| | — |
| | 2,477 |
| | (180 | ) | | 7/28/2014 | | 1991 |
| Red Lobster | | Winnipeg | | MB | | — |
| | 1,664 |
| | 489 |
| | — |
| | 2,153 |
| | (89 | ) | | 7/28/2014 | | 1989 |
| Red Lobster | | Annapolis | | MD | | — |
| | — |
| | 644 |
| | — |
| | 644 |
| | (104 | ) | | 7/28/2014 | | 1985 |
| Red Lobster | | Frederick | | MD | | — |
| | — |
| | 319 |
| | — |
| | 319 |
| | (102 | ) | | 7/28/2014 | | 1997 |
| Red Lobster | | Hagerstown | | MD | | — |
| | 1,044 |
| | 1,755 |
| | — |
| | 2,799 |
| | (162 | ) | | 7/28/2014 | | 1992 |
| Red Lobster | | Lanham | | MD | | — |
| | — |
| | 455 |
| | — |
| | 455 |
| | (111 | ) | | 7/28/2014 | | 1980 |
| Red Lobster | | Owings Mills | | MD | | — |
| | — |
| | 229 |
| | — |
| | 229 |
| | (71 | ) | | 7/28/2014 | | 1989 |
| Red Lobster | | Salisbury | | MD | | — |
| | 1,070 |
| | 1,868 |
| | — |
| | 2,938 |
| | (177 | ) | | 7/28/2014 | | 1992 |
| Red Lobster | | Suitland | | MD | | — |
| | 1,090 |
| | 3,112 |
| | — |
| | 4,202 |
| | (220 | ) | | 7/28/2014 | | 1975 |
| Red Lobster | | Battle Creek | | MI | | — |
| | 202 |
| | 1,827 |
| | — |
| | 2,029 |
| | (154 | ) | | 7/28/2014 | | 1979 |
| Red Lobster | | Bay City | | MI | | — |
| | 168 |
| | 1,620 |
| | — |
| | 1,788 |
| | (162 | ) | | 7/28/2014 | | 1993 |
| | | | | | Initial Costs (1) | | Costs Capitalized Subsequent to Acquisition (2) | | Gross Amount
Carried at
December 31, 2016
(3) (4) | | | | | | Initial Costs (1) | | Costs Capitalized Subsequent to Acquisition (2) | | Gross Amount
Carried at
December 31, 2018
(3) (4) | | | |
| Property | | City | | State | | Encumbrances at
December 31, 2016 | | Land | | Buildings, Fixtures and Improvements | | Accumulated Depreciation
(3) (5) | | Date Acquired | | Date of Construction | | City | | State | | Encumbrances at
December 31, 2018 | | Land | | Buildings, Fixtures and Improvements | | Accumulated Depreciation
(3) (5) | | Date Acquired | | Date of Construction |
| Red Lobster | | Dearborn Heights | | MI | | — |
| | 822 |
| | 2,156 |
| | — |
| | 2,978 |
| | (168 | ) | | 7/28/2014 | | 1975 | | Warren | | MI | | — |
| | 349 |
| | 2,656 |
| | — |
| | 3,005 |
| | (360 | ) | | 7/28/2014 | | 1975 |
| Red Lobster | | Flint | | MI | | — |
| | 505 |
| | 2,266 |
| | — |
| | 2,771 |
| | (179 | ) | | 7/28/2014 | | 1976 | | Mankato | | MN | | — |
| | 867 |
| | 1,642 |
| | — |
| | 2,509 |
| | (298 | ) | | 7/28/2014 | | 1993 |
| Red Lobster | | Fort Gratiot | | MI | | — |
| | 250 |
| | 1,611 |
| | — |
| | 1,861 |
| | (174 | ) | | 7/28/2014 | | 2002 | | Rochester | | MN | | — |
| | — |
| | 1,674 |
| | — |
| | 1,674 |
| | (366 | ) | | 7/28/2014 | | 1987 |
| Red Lobster | | Grandville | | MI | | — |
| | 1,055 |
| | 1,479 |
| | — |
| | 2,534 |
| | (165 | ) | | 7/28/2014 | | 2001 | | Roseville | | MN | | — |
| | 1,291 |
| | 1,298 |
| | — |
| | 2,589 |
| | (185 | ) | | 7/28/2014 | | 1975 |
| Red Lobster | | Jackson | | MI | | — |
| | 235 |
| | 2,174 |
| | — |
| | 2,409 |
| | (171 | ) | | 7/28/2014 | | 1976 | | Branson | | MO | | — |
| | 1,496 |
| | 1,074 |
| | — |
| | 2,570 |
| | (168 | ) | | 7/30/2014 | | 2000 |
| Red Lobster | | Kentwood | | MI | | — |
| | 819 |
| | 1,606 |
| | — |
| | 2,425 |
| | (134 | ) | | 7/28/2014 | | 1975 | | Bridgeton | | MO | | — |
| | 1,128 |
| | 2,003 |
| | — |
| | 3,131 |
| | (287 | ) | | 7/28/2014 | | 1973 |
| Red Lobster | | Lansing | | MI | | — |
| | — |
| | 1,534 |
| | — |
| | 1,534 |
| | (215 | ) | | 7/28/2014 | | 1976 | | Chesterfield | | MO | | — |
| | — |
| | 1,762 |
| | — |
| | 1,762 |
| | (488 | ) | | 7/28/2014 | | 1973 |
| Red Lobster | | Livonia | | MI | | — |
| | 635 |
| | 1,824 |
| | — |
| | 2,459 |
| | (165 | ) | | 7/28/2014 | | 1987 | | Crestwood | | MO | | — |
| | 518 |
| | 1,466 |
| | — |
| | 1,984 |
| | (221 | ) | | 7/28/2014 | | 1975 |
| Red Lobster | | Mt. Pleasant | | MI | | — |
| | 508 |
| | 1,346 |
| | — |
| | 1,854 |
| | (144 | ) | | 7/28/2014 | | 1993 | | Jefferson City | | MO | | — |
| | 593 |
| | 1,092 |
| | — |
| | 1,685 |
| | (197 | ) | | 7/28/2014 | | 1995 |
| Red Lobster | | Muskegon | | MI | | — |
| | 386 |
| | 2,028 |
| | — |
| | 2,414 |
| | (170 | ) | | 7/28/2014 | | 1982 | | Springfield | | MO | | — |
| | — |
| | 1,510 |
| | — |
| | 1,510 |
| | (588 | ) | | 7/28/2014 | | 1972 |
| Red Lobster | | Novi | | MI | | — |
| | 2,061 |
| | 1,847 |
| | — |
| | 3,908 |
| | (163 | ) | | 7/28/2014 | | 1983 | | St. Joseph | | MO | | — |
| | 1,023 |
| | 1,002 |
| | — |
| | 2,025 |
| | (179 | ) | | 7/28/2014 | | 1979 |
| Red Lobster | | Portage | | MI | | — |
| | 396 |
| | 2,496 |
| | — |
| | 2,892 |
| | (188 | ) | | 7/28/2014 | | 1975 | |
| Red Lobster | | Saginaw | | MI | | — |
| | 335 |
| | 1,961 |
| | — |
| | 2,296 |
| | (158 | ) | | 7/28/2014 | | 1975 | |
| Red Lobster | | Southgate | | MI | | — |
| | 611 |
| | 2,531 |
| | — |
| | 3,142 |
| | (214 | ) | | 7/28/2014 | | 1990 | |
| Red Lobster | | Sterling Heights | | MI | | — |
| | 759 |
| | 3,215 |
| | — |
| | 3,974 |
| | (248 | ) | | 7/28/2014 | | 1985 | |
| Red Lobster | | Traverse City | | MI | | — |
| | 1,036 |
| | 1,121 |
| | — |
| | 2,157 |
| | (135 | ) | | 7/28/2014 | | 1996 | |
| Red Lobster | | Warren | | MI | | — |
| | 349 |
| | 2,656 |
| | — |
| | 3,005 |
| | (198 | ) | | 7/28/2014 | | 1975 | |
| Red Lobster | | Westland | | MI | | — |
| | 478 |
| | 2,551 |
| | — |
| | 3,029 |
| | (192 | ) | | 7/28/2014 | | 1975 | |
| Red Lobster | | Blaine | | MN | | — |
| | 1,325 |
| | 1,896 |
| | — |
| | 3,221 |
| | (152 | ) | | 7/28/2014 | | 1980 | |
| Red Lobster | | Burnsville | | MN | | — |
| | 1,222 |
| | 2,381 |
| | — |
| | 3,603 |
| | (174 | ) | | 7/30/2014 | | 1980 | |
| Red Lobster | | Mankato | | MN | | — |
| | 867 |
| | 1,642 |
| | — |
| | 2,509 |
| | (164 | ) | | 7/28/2014 | | 1993 | |
| Red Lobster | | Rochester | | MN | | — |
| | — |
| | 1,674 |
| | — |
| | 1,674 |
| | (202 | ) | | 7/28/2014 | | 1987 | |
| Red Lobster | | Roseville | | MN | | — |
| | 1,291 |
| | 1,298 |
| | — |
| | 2,589 |
| | (102 | ) | | 7/28/2014 | | 1975 | |
| Red Lobster | | St. Cloud | | MN | | — |
| | 760 |
| | 2,770 |
| | — |
| | 3,530 |
| | (214 | ) | | 7/28/2014 | | 1990 | |
| Red Lobster | | Branson | | MO | | — |
| | 1,496 |
| | 1,074 |
| | — |
| | 2,570 |
| | (93 | ) | | 7/30/2014 | | 2000 | |
| Red Lobster | | Bridgeton | | MO | | — |
| | 1,128 |
| | 2,003 |
| | — |
| | 3,131 |
| | (158 | ) | | 7/28/2014 | | 1973 | |
| Red Lobster | | Cape Girardeau | | MO | | — |
| | 1,412 |
| | 1,103 |
| | — |
| | 2,515 |
| | (132 | ) | | 7/28/2014 | | 1994 | |
| Red Lobster | | Chesterfield | | MO | | — |
| | — |
| | 1,762 |
| | — |
| | 1,762 |
| | (269 | ) | | 7/28/2014 | | 1973 | |
| Red Lobster | | Crestwood | | MO | | — |
| | 518 |
| | 1,466 |
| | — |
| | 1,984 |
| | (122 | ) | | 7/28/2014 | | 1975 | |
| Red Lobster | | Jefferson City | | MO | | — |
| | 593 |
| | 1,092 |
| | — |
| | 1,685 |
| | (109 | ) | | 7/28/2014 | | 1995 | |
| Red Lobster | | Springfield | | MO | | — |
| | — |
| | 1,510 |
| | — |
| | 1,510 |
| | (324 | ) | | 7/28/2014 | | 1972 | |
| Red Lobster | | St. Joseph | | MO | | — |
| | 1,023 |
| | 1,002 |
| | — |
| | 2,025 |
| | (99 | ) | | 7/28/2014 | | 1979 | |
| | | | | | Initial Costs (1) | | Costs Capitalized Subsequent to Acquisition (2) | | Gross Amount
Carried at
December 31, 2016
(3) (4) | | | | | | Initial Costs (1) | | Costs Capitalized Subsequent to Acquisition (2) | | Gross Amount
Carried at
December 31, 2018
(3) (4) | | | |
| Property | | City | | State | | Encumbrances at
December 31, 2016 | | Land | | Buildings, Fixtures and Improvements | | Accumulated Depreciation
(3) (5) | | Date Acquired | | Date of Construction | | City | | State | | Encumbrances at
December 31, 2018 | | Land | | Buildings, Fixtures and Improvements | | Accumulated Depreciation
(3) (5) | | Date Acquired | | Date of Construction |
| Red Lobster | | St. Peters | | MO | | — |
| | — |
| | 1,543 |
| | — |
| | 1,543 |
| | (338 | ) | | 7/28/2014 | | 1976 | | St. Peters | | MO | | — |
| | — |
| | 1,543 |
| | — |
| | 1,543 |
| | (614 | ) | | 7/28/2014 | | 1976 |
| Red Lobster | | St.Louis | | MO | | — |
| | 1,387 |
| | 2,662 |
| | — |
| | 4,049 |
| | (193 | ) | | 7/28/2014 | | 1972 | | St.Louis | | MO | | — |
| | 1,387 |
| | 2,662 |
| | — |
| | 4,049 |
| | (350 | ) | | 7/28/2014 | | 1972 |
| Red Lobster | | Jackson | | MS | | — |
| | 1,128 |
| | 2,851 |
| | — |
| | 3,979 |
| | (216 | ) | | 7/28/2014 | | 1977 | | Jackson | | MS | | — |
| | 1,128 |
| | 2,851 |
| | — |
| | 3,979 |
| | (392 | ) | | 7/28/2014 | | 1977 |
| Red Lobster | | Meridian | | MS | | — |
| | — |
| | 872 |
| | — |
| | 872 |
| | (147 | ) | | 7/28/2014 | | 1996 | | Meridian | | MS | | — |
| | — |
| | 872 |
| | — |
| | 872 |
| | (267 | ) | | 7/28/2014 | | 1996 |
| Red Lobster | | Southaven | | MS | | — |
| | 668 |
| | 2,640 |
| | — |
| | 3,308 |
| | (189 | ) | | 7/28/2014 | | 1972 | | Asheville | | NC | | — |
| | 544 |
| | 2,865 |
| | — |
| | 3,409 |
| | (390 | ) | | 7/28/2014 | | 1980 |
| Red Lobster | | Billings | | MT | | — |
| | 1,005 |
| | 2,436 |
| | — |
| | 3,441 |
| | (214 | ) | | 7/28/2014 | | 1993 | | Cary | | NC | | — |
| | 1,933 |
| | 1,118 |
| | — |
| | 3,051 |
| | (235 | ) | | 7/28/2014 | | 1992 |
| Red Lobster | | Asheville | | NC | | — |
| | 544 |
| | 2,865 |
| | — |
| | 3,409 |
| | (215 | ) | | 7/28/2014 | | 1980 | | Concord | | NC | | — |
| | — |
| | 1,506 |
| | — |
| | 1,506 |
| | (462 | ) | | 7/28/2014 | | 2002 |
| Red Lobster | | Burlington | | NC | | — |
| | 1,208 |
| | 403 |
| | — |
| | 1,611 |
| | (107 | ) | | 7/28/2014 | | 2011 | | Fayetteville | | NC | | — |
| | 675 |
| | 2,908 |
| | — |
| | 3,583 |
| | (356 | ) | | 7/28/2014 | | 1978 |
| Red Lobster | | Cary | | NC | | — |
| | 1,933 |
| | 1,118 |
| | — |
| | 3,051 |
| | (130 | ) | | 7/28/2014 | | 1992 | | Greensboro | | NC | | — |
| | 1,372 |
| | 1,785 |
| | — |
| | 3,157 |
| | (258 | ) | | 7/28/2014 | | 1972 |
| Red Lobster | | Concord | | NC | | — |
| | — |
| | 1,506 |
| | — |
| | 1,506 |
| | (255 | ) | | 7/28/2014 | | 2002 | | Raleigh | | NC | | — |
| | 946 |
| | 2,183 |
| | — |
| | 3,129 |
| | (288 | ) | | 7/28/2014 | | 1983 |
| Red Lobster | | Fayetteville | | NC | | — |
| | 675 |
| | 2,908 |
| | — |
| | 3,583 |
| | (196 | ) | | 7/28/2014 | | 1978 | | Bismarck | | ND | | — |
| | 831 |
| | 3,321 |
| | — |
| | 4,152 |
| | (437 | ) | | 7/28/2014 | | 1990 |
| Red Lobster | | Greensboro | | NC | | — |
| | 1,372 |
| | 1,785 |
| | — |
| | 3,157 |
| | (142 | ) | | 7/28/2014 | | 1972 | | Fargo | | ND | | — |
| | 888 |
| | 2,933 |
| | — |
| | 3,821 |
| | (403 | ) | | 7/28/2014 | | 1981 |
| Red Lobster | | Greenville | | NC | | — |
| | 1,139 |
| | 846 |
| | — |
| | 1,985 |
| | (115 | ) | | 7/28/2014 | | 1991 | | Kearney | | NE | | — |
| | 678 |
| | 1,109 |
| | — |
| | 1,787 |
| | (240 | ) | | 7/28/2014 | | 1996 |
| Red Lobster | | Hickory | | NC | | — |
| | 630 |
| | 1,660 |
| | — |
| | 2,290 |
| | (142 | ) | | 7/28/2014 | | 1989 | | Lincoln | | NE | | — |
| | — |
| | 254 |
| | — |
| | 254 |
| | (116 | ) | | 7/28/2014 | | 1977 |
| Red Lobster | | Matthews | | NC | | — |
| | 1,949 |
| | 495 |
| | — |
| | 2,444 |
| | (115 | ) | | 7/28/2014 | | 2012 | | Cherry Hill | | NJ | | — |
| | — |
| | 2,274 |
| | — |
| | 2,274 |
| | (670 | ) | | 7/28/2014 | | 1984 |
| Red Lobster | | Raleigh | | NC | | — |
| | 946 |
| | 2,183 |
| | — |
| | 3,129 |
| | (159 | ) | | 7/28/2014 | | 1983 | | Deptford | | NJ | | — |
| | — |
| | 1,608 |
| | — |
| | 1,608 |
| | (503 | ) | | 7/28/2014 | | 1991 |
| Red Lobster | | Bismarck | | ND | | — |
| | 831 |
| | 3,321 |
| | — |
| | 4,152 |
| | (241 | ) | | 7/28/2014 | | 1990 | | Vineland | | NJ | | — |
| | — |
| | 1,779 |
| | — |
| | 1,779 |
| | (411 | ) | | 7/28/2014 | | 1995 |
| Red Lobster | | Fargo | | ND | | — |
| | 888 |
| | 2,933 |
| | — |
| | 3,821 |
| | (222 | ) | | 7/28/2014 | | 1981 | | Clovis | | NM | | — |
| | — |
| | 318 |
| | — |
| | 318 |
| | (162 | ) | | 7/28/2014 | | 1995 |
| Red Lobster | | Grand Forks | | ND | | — |
| | 876 |
| | 1,694 |
| | — |
| | 2,570 |
| | (166 | ) | | 7/28/2014 | | 1992 | | Farmington | | NM | | — |
| | 855 |
| | 2,287 |
| | — |
| | 3,142 |
| | (363 | ) | | 7/28/2014 | | 1992 |
| Red Lobster | | Kearney | | NE | | — |
| | 678 |
| | 1,109 |
| | — |
| | 1,787 |
| | (132 | ) | | 7/28/2014 | | 1996 | | Amherst | | NY | | — |
| | 1,344 |
| | 1,271 |
| | — |
| | 2,615 |
| | (237 | ) | | 7/28/2014 | | 1980 |
| Red Lobster | | Lincoln | | NE | | — |
| | — |
| | 254 |
| | — |
| | 254 |
| | (64 | ) | | 7/28/2014 | | 1977 | | Brooklyn | | NY | | — |
| | — |
| | 5,897 |
| | — |
| | 5,897 |
| | (1,535 | ) | | 7/28/2014 | | 2003 |
| Red Lobster | | Cherry Hill | | NJ | | — |
| | — |
| | 2,274 |
| | — |
| | 2,274 |
| | (370 | ) | | 7/28/2014 | | 1984 | | Hicksville | | NY | | — |
| | — |
| | 870 |
| | — |
| | 870 |
| | (276 | ) | | 7/28/2014 | | 1982 |
| Red Lobster | | Delran | | NJ | | — |
| | 887 |
| | 1,671 |
| | — |
| | 2,558 |
| | (154 | ) | | 7/28/2014 | | 1988 | | Liverpool | | NY | | — |
| | 900 |
| | 2,088 |
| | — |
| | 2,988 |
| | (305 | ) | | 7/28/2014 | | 1975 |
| Red Lobster | | Deptford | | NJ | | — |
| | — |
| | 1,608 |
| | — |
| | 1,608 |
| | (277 | ) | | 7/28/2014 | | 1991 | | Rochester | | NY | | — |
| | 756 |
| | 2,122 |
| | — |
| | 2,878 |
| | (345 | ) | | 7/28/2014 | | 1985 |
| Red Lobster | | Vineland | | NJ | | — |
| | — |
| | 1,779 |
| | — |
| | 1,779 |
| | (227 | ) | | 7/28/2014 | | 1995 | | Ronkonkoma | | NY | | — |
| | — |
| | 1,109 |
| | — |
| | 1,109 |
| | (346 | ) | | 7/28/2014 | | 2005 |
| Red Lobster | | Clovis | | NM | | — |
| | — |
| | 318 |
| | — |
| | 318 |
| | (89 | ) | | 7/28/2014 | | 1995 | | Valley Stream | | NY | | — |
| | — |
| | 1,417 |
| | — |
| | 1,417 |
| | (457 | ) | | 7/28/2014 | | 1983 |
| Red Lobster | | Farmington | | NM | | — |
| | 855 |
| | 2,287 |
| | — |
| | 3,142 |
| | (200 | ) | | 7/28/2014 | | 1992 | | Vestal | | NY | | — |
| | 1,027 |
| | 2,255 |
| | — |
| | 3,282 |
| | (322 | ) | | 7/28/2014 | | 1976 |
| Red Lobster | | Roswell | | NM | | — |
| | 354 |
| | 1,248 |
| | — |
| | 1,602 |
| | (141 | ) | | 7/30/2014 | | 1994 | | Watertown | | NY | | — |
| | 807 |
| | 1,586 |
| | — |
| | 2,393 |
| | (297 | ) | | 7/28/2014 | | 1993 |
| Red Lobster | | Amherst | | NY | | — |
| | 1,344 |
| | 1,271 |
| | — |
| | 2,615 |
| | (131 | ) | | 7/28/2014 | | 1980 | | Yonkers | | NY | | — |
| | — |
| | 894 |
| | — |
| | 894 |
| | (288 | ) | | 7/28/2014 | | 2012 |
| Red Lobster | | Brooklyn | | NY | | — |
| | — |
| | 5,897 |
| | — |
| | 5,897 |
| | (846 | ) | | 7/28/2014 | | 2003 | | Akron | | OH | | — |
| | — |
| | 1,398 |
| | — |
| | 1,398 |
| | (418 | ) | | 7/28/2014 | | 1981 |
| Red Lobster | | Colonie | | NY | | — |
| | 1,014 |
| | 3,500 |
| | — |
| | 4,514 |
| | (256 | ) | | 7/28/2014 | | 1976 | | Beavercreek | | OH | | — |
| | 551 |
| | 2,334 |
| | — |
| | 2,885 |
| | (368 | ) | | 7/28/2014 | | 1994 |
| Red Lobster | | Henrietta | | NY | | — |
| | 956 |
| | 2,934 |
| | — |
| | 3,890 |
| | (224 | ) | | 7/28/2014 | | 1976 | | Canton | | OH | | — |
| | 398 |
| | 2,596 |
| | — |
| | 2,994 |
| | (337 | ) | | 7/28/2014 | | 1974 |
| | | | | | Initial Costs (1) | | Costs Capitalized Subsequent to Acquisition (2) | | Gross Amount
Carried at
December 31, 2016
(3) (4) | | | | | | Initial Costs (1) | | Costs Capitalized Subsequent to Acquisition (2) | | Gross Amount
Carried at
December 31, 2018
(3) (4) | | | |
| Property | | City | | State | | Encumbrances at
December 31, 2016 | | Land | | Buildings, Fixtures and Improvements | | Accumulated Depreciation
(3) (5) | | Date Acquired | | Date of Construction | | City | | State | | Encumbrances at
December 31, 2018 | | Land | | Buildings, Fixtures and Improvements | | Accumulated Depreciation
(3) (5) | | Date Acquired | | Date of Construction |
| Red Lobster | | Hicksville | | NY | | — |
| | — |
| | 870 |
| | — |
| | 870 |
| | (152 | ) | | 7/28/2014 | | 1982 | | Cincinnati | | OH | | — |
| | 1,484 |
| | 1,687 |
| | — |
| | 3,171 |
| | (232 | ) | | 7/28/2014 | | 1977 |
| Red Lobster | | Liverpool | | NY | | — |
| | 900 |
| | 2,088 |
| | — |
| | 2,988 |
| | (168 | ) | | 7/28/2014 | | 1975 | | Cincinnati | | OH | | — |
| | 365 |
| | 2,344 |
| | — |
| | 2,709 |
| | (313 | ) | | 7/28/2014 | | 1980 |
| Red Lobster | | Poughkeepsie | | NY | | — |
| | 1,987 |
| | 669 |
| | — |
| | 2,656 |
| | (79 | ) | | 7/28/2014 | | 1981 | | Columbus | | OH | | — |
| | — |
| | 1,100 |
| | — |
| | 1,100 |
| | (366 | ) | | 7/28/2014 | | 2002 |
| Red Lobster | | Rochester | | NY | | — |
| | 756 |
| | 2,122 |
| | — |
| | 2,878 |
| | (190 | ) | | 7/28/2014 | | 1985 | | Columbus | | OH | | — |
| | 787 |
| | 2,123 |
| | — |
| | 2,910 |
| | (286 | ) | | 7/28/2014 | | 1973 |
| Red Lobster | | Ronkonkoma | | NY | | — |
| | — |
| | 1,109 |
| | — |
| | 1,109 |
| | (191 | ) | | 7/28/2014 | | 2005 | | Cuyahoga Falls | | OH | | — |
| | 306 |
| | 2,511 |
| | — |
| | 2,817 |
| | (328 | ) | | 7/28/2014 | | 1974 |
| Red Lobster | | Valley Stream | | NY | | — |
| | — |
| | 1,417 |
| | — |
| | 1,417 |
| | (252 | ) | | 7/28/2014 | | 1983 | | Dublin | | OH | | — |
| | — |
| | 873 |
| | — |
| | 873 |
| | (255 | ) | | 7/28/2014 | | 1990 |
| Red Lobster | | Vestal | | NY | | — |
| | 1,027 |
| | 2,255 |
| | — |
| | 3,282 |
| | (178 | ) | | 7/28/2014 | | 1976 | | Lancaster | | OH | | — |
| | 737 |
| | 1,570 |
| | — |
| | 2,307 |
| | (263 | ) | | 7/28/2014 | | 1991 |
| Red Lobster | | Watertown | | NY | | — |
| | 807 |
| | 1,586 |
| | — |
| | 2,393 |
| | (164 | ) | | 7/28/2014 | | 1993 | | Lima | | OH | | — |
| | 843 |
| | 658 |
| | — |
| | 1,501 |
| | (181 | ) | | 7/28/2014 | | 1991 |
| Red Lobster | | Yonkers | | NY | | — |
| | — |
| | 894 |
| | — |
| | 894 |
| | (159 | ) | | 7/28/2014 | | 2012 | | Mansfield | | OH | | — |
| | 335 |
| | 1,697 |
| | — |
| | 2,032 |
| | (247 | ) | | 7/28/2014 | | 1977 |
| Red Lobster | | Akron | | OH | | — |
| | — |
| | 1,398 |
| | — |
| | 1,398 |
| | (231 | ) | | 7/28/2014 | | 1981 | | Mentor | | OH | | — |
| | 651 |
| | 2,129 |
| | — |
| | 2,780 |
| | (299 | ) | | 7/30/2014 | | 1977 |
| Red Lobster | | Beavercreek | | OH | | — |
| | 551 |
| | 2,334 |
| | — |
| | 2,885 |
| | (203 | ) | | 7/28/2014 | | 1994 | | Miamisburg | | OH | | — |
| | 612 |
| | 2,615 |
| | — |
| | 3,227 |
| | (323 | ) | | 7/28/2014 | | 1974 |
| Red Lobster | | Canton | | OH | | — |
| | 398 |
| | 2,596 |
| | — |
| | 2,994 |
| | (186 | ) | | 7/28/2014 | | 1974 | | New Philadelphia | | OH | | — |
| | 232 |
| | 1,349 |
| | — |
| | 1,581 |
| | (251 | ) | | 7/28/2014 | | 1991 |
| Red Lobster | | Cincinnati | | OH | | — |
| | 799 |
| | 1,915 |
| | — |
| | 2,714 |
| | (138 | ) | | 7/28/2014 | | 1974 | | Niles | | OH | | — |
| | — |
| | 1,799 |
| | — |
| | 1,799 |
| | (465 | ) | | 7/28/2014 | | 1982 |
| Red Lobster | | Cincinnati | | OH | | — |
| | 1,484 |
| | 1,687 |
| | — |
| | 3,171 |
| | (128 | ) | | 7/28/2014 | | 1977 | | North Olmsted | | OH | | — |
| | — |
| | 2,291 |
| | — |
| | 2,291 |
| | (519 | ) | | 7/28/2014 | | 1974 |
| Red Lobster | | Cincinnati | | OH | | — |
| | 365 |
| | 2,344 |
| | — |
| | 2,709 |
| | (173 | ) | | 7/28/2014 | | 1980 | | Parma | | OH | | — |
| | 466 |
| | 2,156 |
| | — |
| | 2,622 |
| | (293 | ) | | 7/28/2014 | | 1975 |
| Red Lobster | | Columbus | | OH | | — |
| | — |
| | 1,100 |
| | — |
| | 1,100 |
| | (202 | ) | | 7/28/2014 | | 2002 | | Sandusky | | OH | | — |
| | 1,290 |
| | 1,126 |
| | — |
| | 2,416 |
| | (210 | ) | | 7/30/2014 | | 1986 |
| Red Lobster | | Columbus | | OH | | — |
| | 787 |
| | 2,123 |
| | — |
| | 2,910 |
| | (158 | ) | | 7/28/2014 | | 1973 | | St. Clairsville | | OH | | — |
| | — |
| | 853 |
| | — |
| | 853 |
| | (386 | ) | | 7/28/2014 | | 1997 |
| Red Lobster | | Cuyahoga Falls | | OH | | — |
| | 306 |
| | 2,511 |
| | — |
| | 2,817 |
| | (181 | ) | | 7/28/2014 | | 1974 | | Wooster | | OH | | — |
| | 200 |
| | 1,205 |
| | — |
| | 1,405 |
| | (243 | ) | | 7/28/2014 | | 1995 |
| Red Lobster | | Dublin | | OH | | — |
| | — |
| | 873 |
| | — |
| | 873 |
| | (141 | ) | | 7/28/2014 | | 1990 | | Youngstown | | OH | | — |
| | 214 |
| | 2,477 |
| | — |
| | 2,691 |
| | (346 | ) | | 7/28/2014 | | 1982 |
| Red Lobster | | Lancaster | | OH | | — |
| | 737 |
| | 1,570 |
| | — |
| | 2,307 |
| | (145 | ) | | 7/28/2014 | | 1991 | | Muskogee | | OK | | — |
| | 399 |
| | 1,707 |
| | — |
| | 2,106 |
| | (301 | ) | | 7/28/2014 | | 1995 |
| Red Lobster | | Lima | | OH | | — |
| | 843 |
| | 658 |
| | — |
| | 1,501 |
| | (100 | ) | | 7/28/2014 | | 1991 | | Oklahoma City | | OK | | — |
| | 610 |
| | 2,681 |
| | — |
| | 3,291 |
| | (355 | ) | | 7/28/2014 | | 1980 |
| Red Lobster | | Mansfield | | OH | | — |
| | 335 |
| | 1,697 |
| | — |
| | 2,032 |
| | (136 | ) | | 7/28/2014 | | 1977 | | Oklahoma City | | OK | | — |
| | 800 |
| | 1,960 |
| | — |
| | 2,760 |
| | (303 | ) | | 7/28/2014 | | 1991 |
| Red Lobster | | Maumee | | OH | | — |
| | 505 |
| | 2,067 |
| | — |
| | 2,572 |
| | (167 | ) | | 7/28/2014 | | 1974 | | Shawnee | | OK | | — |
| | 437 |
| | 1,744 |
| | — |
| | 2,181 |
| | (281 | ) | | 7/28/2014 | | 1995 |
| Red Lobster | | Mentor | | OH | | — |
| | 651 |
| | 2,129 |
| | — |
| | 2,780 |
| | (165 | ) | | 7/30/2014 | | 1977 | | Bartonsville | | PA | | — |
| | — |
| | 2,389 |
| | — |
| | 2,389 |
| | (540 | ) | | 7/28/2014 | | 2010 |
| Red Lobster | | Miamisburg | | OH | | — |
| | 612 |
| | 2,615 |
| | — |
| | 3,227 |
| | (178 | ) | | 7/28/2014 | | 1974 | | Chambersburg | | PA | | — |
| | 694 |
| | 1,212 |
| | — |
| | 1,906 |
| | (246 | ) | | 7/28/2014 | | 1991 |
| Red Lobster | | New Philadelphia | | OH | | — |
| | 232 |
| | 1,349 |
| | — |
| | 1,581 |
| | (139 | ) | | 7/28/2014 | | 1991 | | Du Bois | | PA | | — |
| | 317 |
| | 981 |
| | — |
| | 1,298 |
| | (216 | ) | | 7/28/2014 | | 1995 |
| Red Lobster | | Niles | | OH | | — |
| | — |
| | 1,799 |
| | — |
| | 1,799 |
| | (257 | ) | | 7/28/2014 | | 1982 | | Greensburg | | PA | | — |
| | 748 |
| | 2,432 |
| | — |
| | 3,180 |
| | (342 | ) | | 7/28/2014 | | 1989 |
| Red Lobster | | North Olmsted | | OH | | — |
| | — |
| | 2,291 |
| | — |
| | 2,291 |
| | (286 | ) | | 7/28/2014 | | 1974 | | Hanover | | PA | | — |
| | 446 |
| | 1,870 |
| | — |
| | 2,316 |
| | (317 | ) | | 7/28/2014 | | 1995 |
| Red Lobster | | Parma | | OH | | — |
| | 466 |
| | 2,156 |
| | — |
| | 2,622 |
| | (162 | ) | | 7/28/2014 | | 1975 | | Lancaster | | PA | | — |
| | — |
| | 2,968 |
| | — |
| | 2,968 |
| | (580 | ) | | 7/28/2014 | | 1977 |
| Red Lobster | | Sandusky | | OH | | — |
| | 1,290 |
| | 1,126 |
| | — |
| | 2,416 |
| | (116 | ) | | 7/30/2014 | | 1986 | | Langhorne | | PA | | — |
| | 979 |
| | 2,735 |
| | — |
| | 3,714 |
| | (423 | ) | | 7/28/2014 | | 1996 |
| Red Lobster | | St. Clairsville | | OH | | — |
| | — |
| | 853 |
| | — |
| | 853 |
| | (213 | ) | | 7/28/2014 | | 1997 | | Mechanicsburg | | PA | | — |
| | 676 |
| | 2,656 |
| | — |
| | 3,332 |
| | (360 | ) | | 7/28/2014 | | 1976 |
| Red Lobster | | Toledo | | OH | | — |
| | 732 |
| | 2,112 |
| | — |
| | 2,844 |
| | (172 | ) | | 7/28/2014 | | 1974 | | Philadelphia | | PA | | — |
| | — |
| | 1,902 |
| | — |
| | 1,902 |
| | (388 | ) | | 7/28/2014 | | 1977 |
| | | | | | Initial Costs (1) | | Costs Capitalized Subsequent to Acquisition (2) | | Gross Amount
Carried at
December 31, 2016
(3) (4) | | | | | | Initial Costs (1) | | Costs Capitalized Subsequent to Acquisition (2) | | Gross Amount
Carried at
December 31, 2018
(3) (4) | | | |
| Property | | City | | State | | Encumbrances at
December 31, 2016 | | Land | | Buildings, Fixtures and Improvements | | Accumulated Depreciation
(3) (5) | | Date Acquired | | Date of Construction | | City | | State | | Encumbrances at
December 31, 2018 | | Land | | Buildings, Fixtures and Improvements | | Accumulated Depreciation
(3) (5) | | Date Acquired | | Date of Construction |
| Red Lobster | | Wooster | | OH | | — |
| | 200 |
| | 1,205 |
| | — |
| | 1,405 |
| | (134 | ) | | 7/28/2014 | | 1995 | | Pittsburgh | | PA | | — |
| | — |
| | 1,379 |
| | — |
| | 1,379 |
| | (423 | ) | | 7/28/2014 | | 1976 |
| Red Lobster | | Youngstown | | OH | | — |
| | 214 |
| | 2,477 |
| | — |
| | 2,691 |
| | (191 | ) | | 7/28/2014 | | 1982 | | Pittsburgh | | PA | | — |
| | 1,641 |
| | 1,096 |
| | — |
| | 2,737 |
| | (188 | ) | | 7/28/2014 | | 1987 |
| Red Lobster | | Muskogee | | OK | | — |
| | 399 |
| | 1,707 |
| | — |
| | 2,106 |
| | (166 | ) | | 7/28/2014 | | 1995 | | Pottstown | | PA | | — |
| | — |
| | 1,115 |
| | — |
| | 1,115 |
| | (540 | ) | | 7/28/2014 | | 1995 |
| Red Lobster | | Oklahoma City | | OK | | — |
| | 610 |
| | 2,681 |
| | — |
| | 3,291 |
| | (196 | ) | | 7/28/2014 | | 1980 | | Scranton | | PA | | — |
| | — |
| | 1,563 |
| | — |
| | 1,563 |
| | (522 | ) | | 7/28/2014 | | 2001 |
| Red Lobster | | Oklahoma City | | OK | | — |
| | 800 |
| | 1,960 |
| | — |
| | 2,760 |
| | (167 | ) | | 7/28/2014 | | 1991 | | Springfield | | PA | | — |
| | 1,571 |
| | 2,344 |
| | — |
| | 3,915 |
| | (364 | ) | | 7/28/2014 | | 1983 |
| Red Lobster | | Shawnee | | OK | | — |
| | 437 |
| | 1,744 |
| | — |
| | 2,181 |
| | (155 | ) | | 7/28/2014 | | 1995 | | State College | | PA | | — |
| | — |
| | 1,026 |
| | — |
| | 1,026 |
| | (438 | ) | | 7/28/2014 | | 1999 |
| Red Lobster | | Tulsa | | OK | | — |
| | 847 |
| | 2,084 |
| | — |
| | 2,931 |
| | (162 | ) | | 7/28/2014 | | 1976 | | Washington | | PA | | — |
| | — |
| | 694 |
| | — |
| | 694 |
| | (200 | ) | | 7/28/2014 | | 1976 |
| Red Lobster | | Barrie | | ON | | — |
| | 1,815 |
| | 317 |
| | — |
| | 2,132 |
| | (76 | ) | | 7/28/2014 | | 1986 | | Whitehall | | PA | | — |
| | — |
| | 2,155 |
| | — |
| | 2,155 |
| | (683 | ) | | 7/28/2014 | | 1977 |
| Red Lobster | | Brampton | | ON | | — |
| | 1,249 |
| | 1,396 |
| | — |
| | 2,645 |
| | (128 | ) | | 7/28/2014 | | 1986 | | Aiken | | SC | | — |
| | 780 |
| | 1,247 |
| | — |
| | 2,027 |
| | (236 | ) | | 7/28/2014 | | 1991 |
| Red Lobster | | Burlington | | ON | | — |
| | 1,884 |
| | 1,652 |
| | — |
| | 3,536 |
| | (143 | ) | | 7/28/2014 | | 1985 | | Columbia | | SC | | — |
| | — |
| | 918 |
| | — |
| | 918 |
| | (271 | ) | | 7/28/2014 | | 1980 |
| Red Lobster | | Kitchener | | ON | | — |
| | 1,397 |
| | 554 |
| | — |
| | 1,951 |
| | (90 | ) | | 7/28/2014 | | 1986 | | Florence | | SC | | — |
| | 779 |
| | 1,506 |
| | — |
| | 2,285 |
| | (269 | ) | | 7/28/2014 | | 1990 |
| Red Lobster | | London | | ON | | — |
| | 1,502 |
| | 649 |
| | — |
| | 2,151 |
| | (111 | ) | | 7/28/2014 | | 1986 | | Myrtle Beach | | SC | | — |
| | — |
| | 462 |
| | — |
| | 462 |
| | (221 | ) | | 7/28/2014 | | 2006 |
| Red Lobster | | Niagara Falls | | ON | | — |
| | 1,094 |
| | 1,402 |
| | — |
| | 2,496 |
| | (141 | ) | | 7/28/2014 | | 1986 | | Spartanburg | | SC | | — |
| | — |
| | 1,136 |
| | — |
| | 1,136 |
| | (265 | ) | | 7/28/2014 | | 1973 |
| Red Lobster | | Oshawa | | ON | | — |
| | 955 |
| | 775 |
| | — |
| | 1,730 |
| | (88 | ) | | 7/28/2014 | | 1986 | | Sumter | | SC | | — |
| | 988 |
| | 1,117 |
| | — |
| | 2,105 |
| | (241 | ) | | 7/28/2014 | | 1995 |
| Red Lobster | | Ottawa | | ON | | — |
| | 1,686 |
| | 938 |
| | — |
| | 2,624 |
| | (96 | ) | | 7/28/2014 | | 1986 | | Chattanooga | | TN | | — |
| | 1,548 |
| | 2,575 |
| | — |
| | 4,123 |
| | (318 | ) | | 7/28/2014 | | 1972 |
| Red Lobster | | Scarborough | | ON | | — |
| | 2,910 |
| | 1,260 |
| | — |
| | 4,170 |
| | (120 | ) | | 7/28/2014 | | 1985 | | Clarksville | | TN | | — |
| | 543 |
| | 2,223 |
| | — |
| | 2,766 |
| | (326 | ) | | 7/28/2014 | | 1990 |
| Red Lobster | | Sudbury | | ON | | — |
| | 1,149 |
| | 645 |
| | — |
| | 1,794 |
| | (103 | ) | | 7/28/2014 | | 1989 | | Jackson | | TN | | — |
| | 822 |
| | 1,427 |
| | — |
| | 2,249 |
| | (276 | ) | | 7/28/2014 | | 1995 |
| Red Lobster | | Windsor | | ON | | — |
| | 870 |
| | 648 |
| | — |
| | 1,518 |
| | (94 | ) | | 7/28/2014 | | 1983 | | Memphis | | TN | | — |
| | 1,602 |
| | 2,290 |
| | — |
| | 3,892 |
| | (306 | ) | | 7/28/2014 | | 1972 |
| Red Lobster | | Bartonsville | | PA | | — |
| | — |
| | 2,389 |
| | — |
| | 2,389 |
| | (298 | ) | | 7/28/2014 | | 2010 | | Sevierville | | TN | | — |
| | — |
| | 1,062 |
| | — |
| | 1,062 |
| | (371 | ) | | 7/28/2014 | | 2002 |
| Red Lobster | | Chambersburg | | PA | | — |
| | 694 |
| | 1,212 |
| | — |
| | 1,906 |
| | (136 | ) | | 7/28/2014 | | 1991 | | Abilene | | TX | | — |
| | 209 |
| | 1,976 |
| | — |
| | 2,185 |
| | (289 | ) | | 7/30/2014 | | 1980 |
| Red Lobster | | Du Bois | | PA | | — |
| | 317 |
| | 981 |
| | — |
| | 1,298 |
| | (119 | ) | | 7/28/2014 | | 1995 | | Amarillo | | TX | | — |
| | 590 |
| | 2,342 |
| | — |
| | 2,932 |
| | (319 | ) | | 7/28/2014 | | 1976 |
| Red Lobster | | Erie | | PA | | — |
| | 600 |
| | 1,800 |
| | — |
| | 2,400 |
| | (143 | ) | | 7/28/2014 | | 1987 | | Burleson | | TX | | — |
| | — |
| | 356 |
| | — |
| | 356 |
| | (190 | ) | | 7/28/2014 | | 2003 |
| Red Lobster | | Greensburg | | PA | | — |
| | 748 |
| | 2,432 |
| | — |
| | 3,180 |
| | (189 | ) | | 7/28/2014 | | 1989 | | College Station | | TX | | — |
| | — |
| | 643 |
| | — |
| | 643 |
| | (201 | ) | | 7/28/2014 | | 1983 |
| Red Lobster | | Hanover | | PA | | — |
| | 446 |
| | 1,870 |
| | — |
| | 2,316 |
| | (175 | ) | | 7/28/2014 | | 1995 | | Conroe | | TX | | — |
| | — |
| | 557 |
| | — |
| | 557 |
| | (228 | ) | | 7/28/2014 | | 2011 |
| Red Lobster | | Johnstown | | PA | | — |
| | 789 |
| | 1,799 |
| | — |
| | 2,588 |
| | (168 | ) | | 7/28/2014 | | 1993 | | Denton | | TX | | — |
| | 832 |
| | 2,044 |
| | — |
| | 2,876 |
| | (339 | ) | | 7/28/2014 | | 1991 |
| Red Lobster | | Lancaster | | PA | | — |
| | — |
| | 2,968 |
| | — |
| | 2,968 |
| | (320 | ) | | 7/28/2014 | | 1977 | | Duncanville | | TX | | — |
| | 361 |
| | 2,658 |
| | — |
| | 3,019 |
| | (351 | ) | | 7/28/2014 | | 1974 |
| Red Lobster | | Langhorne | | PA | | — |
| | 979 |
| | 2,735 |
| | — |
| | 3,714 |
| | (233 | ) | | 7/28/2014 | | 1996 | | El Paso | | TX | | — |
| | — |
| | 414 |
| | — |
| | 414 |
| | (208 | ) | | 7/28/2014 | | 1976 |
| Red Lobster | | Mechanicsburg | | PA | | — |
| | 676 |
| | 2,656 |
| | — |
| | 3,332 |
| | (199 | ) | | 7/28/2014 | | 1976 | | El Paso | | TX | | — |
| | — |
| | 883 |
| | — |
| | 883 |
| | (271 | ) | | 7/28/2014 | | 2008 |
| Red Lobster | | Philadelphia | | PA | | — |
| | — |
| | 1,902 |
| | — |
| | 1,902 |
| | (214 | ) | | 7/28/2014 | | 1977 | | Fort Worth | | TX | | — |
| | — |
| | 239 |
| | — |
| | 239 |
| | (120 | ) | | 7/28/2014 | | 1982 |
| Red Lobster | | Pittsburgh | | PA | | — |
| | — |
| | 1,379 |
| | — |
| | 1,379 |
| | (233 | ) | | 7/28/2014 | | 1976 | | Houston | | TX | | — |
| | — |
| | 399 |
| | — |
| | 399 |
| | (201 | ) | | 7/28/2014 | | 1974 |
| Red Lobster | | Pittsburgh | | PA | | — |
| | 1,352 |
| | 1,190 |
| | — |
| | 2,542 |
| | (100 | ) | | 7/28/2014 | | 1977 | | Houston | | TX | | — |
| | 960 |
| | 1,833 |
| | — |
| | 2,793 |
| | (269 | ) | | 7/28/2014 | | 1981 |
| Red Lobster | | Pittsburgh | | PA | | — |
| | 1,641 |
| | 1,096 |
| | — |
| | 2,737 |
| | (103 | ) | | 7/28/2014 | | 1987 | | Humble | | TX | | — |
| | — |
| | 1,087 |
| | — |
| | 1,087 |
| | (291 | ) | | 7/28/2014 | | 1980 |
| | | | | | Initial Costs (1) | | Costs Capitalized Subsequent to Acquisition (2) | | Gross Amount
Carried at
December 31, 2016
(3) (4) | | | | | | Initial Costs (1) | | Costs Capitalized Subsequent to Acquisition (2) | | Gross Amount
Carried at
December 31, 2018
(3) (4) | | | |
| Property | | City | | State | | Encumbrances at
December 31, 2016 | | Land | | Buildings, Fixtures and Improvements | | Accumulated Depreciation
(3) (5) | | Date Acquired | | Date of Construction | | City | | State | | Encumbrances at
December 31, 2018 | | Land | | Buildings, Fixtures and Improvements | | Accumulated Depreciation
(3) (5) | | Date Acquired | | Date of Construction |
| Red Lobster | | Pottstown | | PA | | — |
| | — |
| | 1,115 |
| | — |
| | 1,115 |
| | (298 | ) | | 7/28/2014 | | 1995 | | Killeen | | TX | | — |
| | 732 |
| | 1,935 |
| | — |
| | 2,667 |
| | (312 | ) | | 7/28/2014 | | 1991 |
| Red Lobster | | Scranton | | PA | | — |
| | — |
| | 1,563 |
| | — |
| | 1,563 |
| | (288 | ) | | 7/28/2014 | | 2001 | | Laredo | | TX | | — |
| | — |
| | 819 |
| | — |
| | 819 |
| | (302 | ) | | 7/28/2014 | | 2003 |
| Red Lobster | | Springfield | | PA | | — |
| | 1,571 |
| | 2,344 |
| | — |
| | 3,915 |
| | (201 | ) | | 7/28/2014 | | 1983 | | Lewisville | | TX | | — |
| | 1,087 |
| | 1,626 |
| | (106 | ) | | 2,607 |
| | (232 | ) | | 7/28/2014 | | 1973 |
| Red Lobster | | State College | | PA | | — |
| | — |
| | 1,026 |
| | — |
| | 1,026 |
| | (242 | ) | | 7/28/2014 | | 1999 | | Longview | | TX | | — |
| | 324 |
| | 2,625 |
| | — |
| | 2,949 |
| | (366 | ) | | 7/28/2014 | | 1981 |
| Red Lobster | | Washington | | PA | | — |
| | — |
| | 694 |
| | — |
| | 694 |
| | (110 | ) | | 7/28/2014 | | 1976 | | Mcallen | | TX | | — |
| | 1,175 |
| | 2,280 |
| | — |
| | 3,455 |
| | (332 | ) | | 7/28/2014 | | 1981 |
| Red Lobster | | Whitehall | | PA | | — |
| | — |
| | 2,155 |
| | — |
| | 2,155 |
| | (376 | ) | | 7/28/2014 | | 1977 | | Mcallen | | TX | | — |
| | 960 |
| | 1,647 |
| | — |
| | 2,607 |
| | (320 | ) | | 7/28/2014 | | 2010 |
| Red Lobster | | Aiken | | SC | | — |
| | 780 |
| | 1,247 |
| | — |
| | 2,027 |
| | (130 | ) | | 7/28/2014 | | 1991 | | San Antonio | | TX | | — |
| | — |
| | 963 |
| | — |
| | 963 |
| | (220 | ) | | 7/28/2014 | | 1974 |
| Red Lobster | | Columbia | | SC | | — |
| | — |
| | 918 |
| | — |
| | 918 |
| | (150 | ) | | 7/28/2014 | | 1980 | | Sugar Land | | TX | | — |
| | — |
| | 708 |
| | — |
| | 708 |
| | (203 | ) | | 7/28/2014 | | 1981 |
| Red Lobster | | Florence | | SC | | — |
| | 779 |
| | 1,506 |
| | — |
| | 2,285 |
| | (148 | ) | | 7/28/2014 | | 1990 | | Layton | | UT | | — |
| | 1,577 |
| | 1,333 |
| | — |
| | 2,910 |
| | (269 | ) | | 7/28/2014 | | 1993 |
| Red Lobster | | Myrtle Beach | | SC | | — |
| | — |
| | 462 |
| | — |
| | 462 |
| | (122 | ) | | 7/28/2014 | | 2006 | | Bristol | | VA | | — |
| | 816 |
| | 1,175 |
| | — |
| | 1,991 |
| | (231 | ) | | 7/28/2014 | | 2005 |
| Red Lobster | | Spartanburg | | SC | | — |
| | — |
| | 1,136 |
| | — |
| | 1,136 |
| | (146 | ) | | 7/28/2014 | | 1973 | | Charlottesville | | VA | | — |
| | — |
| | 1,021 |
| | — |
| | 1,021 |
| | (261 | ) | | 7/28/2014 | | 1986 |
| Red Lobster | | Sumter | | SC | | — |
| | 988 |
| | 1,117 |
| | — |
| | 2,105 |
| | (133 | ) | | 7/28/2014 | | 1995 | | Chesapeake | | VA | | — |
| | 1,262 |
| | 1,374 |
| | — |
| | 2,636 |
| | (227 | ) | | 7/28/2014 | | 1992 |
| Red Lobster | | Regina | | SK | | — |
| | 1,698 |
| | 548 |
| | — |
| | 2,246 |
| | (90 | ) | | 7/28/2014 | | 1989 | | Harrisonburg | | VA | | — |
| | 465 |
| | 1,369 |
| | — |
| | 1,834 |
| | (273 | ) | | 7/28/2014 | | 1993 |
| Red Lobster | | Saskatoon | | SK | | — |
| | 1,579 |
| | 1,359 |
| | — |
| | 2,938 |
| | (141 | ) | | 7/28/2014 | | 1990 | | Manassas | | VA | | — |
| | 1,800 |
| | 941 |
| | — |
| | 2,741 |
| | (200 | ) | | 7/28/2014 | | 1993 |
| Red Lobster | | Chattanooga | | TN | | — |
| | 1,548 |
| | 2,575 |
| | — |
| | 4,123 |
| | (175 | ) | | 7/28/2014 | | 1972 | | Midlothian | | VA | | — |
| | — |
| | 655 |
| | — |
| | 655 |
| | (272 | ) | | 7/28/2014 | | 2003 |
| Red Lobster | | Clarksville | | TN | | — |
| | 543 |
| | 2,223 |
| | — |
| | 2,766 |
| | (180 | ) | | 7/28/2014 | | 1990 | | Sterling | | VA | | — |
| | — |
| | 646 |
| | — |
| | 646 |
| | (265 | ) | | 7/28/2014 | | 2001 |
| Red Lobster | | Cookeville | | TN | | — |
| | 532 |
| | 1,205 |
| | — |
| | 1,737 |
| | (122 | ) | | 7/28/2014 | | 1995 | | Winchester | | VA | | — |
| | — |
| | 357 |
| | — |
| | 357 |
| | (187 | ) | | 7/28/2014 | | 2006 |
| Red Lobster | | Jackson | | TN | | — |
| | 822 |
| | 1,427 |
| | — |
| | 2,249 |
| | (152 | ) | | 7/28/2014 | | 1995 | | Olympia | | WA | | — |
| | — |
| | 596 |
| | — |
| | 596 |
| | (306 | ) | | 7/28/2014 | | 1995 |
| Red Lobster | | Memphis | | TN | | — |
| | 1,602 |
| | 2,290 |
| | — |
| | 3,892 |
| | (169 | ) | | 7/28/2014 | | 1972 | | Silverdale | | WA | | — |
| | 1,661 |
| | 501 |
| | — |
| | 2,162 |
| | (164 | ) | | 7/28/2014 | | 1993 |
| Red Lobster | | Mt. Juliet | | TN | | — |
| | 1,227 |
| | 773 |
| | — |
| | 2,000 |
| | (116 | ) | | 7/28/2014 | | 2009 | | Spokane | | WA | | — |
| | — |
| | 1,427 |
| | — |
| | 1,427 |
| | (372 | ) | | 7/28/2014 | | 2009 |
| Red Lobster | | Sevierville | | TN | | — |
| | — |
| | 1,062 |
| | — |
| | 1,062 |
| | (204 | ) | | 7/28/2014 | | 2002 | | Ashwaubenon | | WI | | — |
| | 1,270 |
| | 1,116 |
| | — |
| | 2,386 |
| | (195 | ) | | 7/28/2014 | | 1975 |
| Red Lobster | | Abilene | | TX | | — |
| | 209 |
| | 1,976 |
| | — |
| | 2,185 |
| | (159 | ) | | 7/30/2014 | | 1980 | | Mt. Pleasant | | WI | | — |
| | 856 |
| | 1,773 |
| | — |
| | 2,629 |
| | (348 | ) | | 7/28/2014 | | 2012 |
| Red Lobster | | Amarillo | | TX | | — |
| | 590 |
| | 2,342 |
| | — |
| | 2,932 |
| | (176 | ) | | 7/28/2014 | | 1976 | | Wauwatosa | | WI | | — |
| | 1,524 |
| | 997 |
| | — |
| | 2,521 |
| | (177 | ) | | 7/28/2014 | | 1975 |
| Red Lobster | | Brownsville | | TX | | — |
| | 427 |
| | 1,638 |
| | — |
| | 2,065 |
| | (155 | ) | | 7/28/2014 | | 1990 | | Charleston | | WV | | — |
| | — |
| | 1,100 |
| | — |
| | 1,100 |
| | (372 | ) | | 7/28/2014 | | 2003 |
| Red Lobster | | Burleson | | TX | | — |
| | — |
| | 356 |
| | — |
| | 356 |
| | (105 | ) | | 7/28/2014 | | 2003 | | Huntington | | WV | | — |
| | 344 |
| | 2,552 |
| | — |
| | 2,896 |
| | (383 | ) | | 7/28/2014 | | 1985 |
| Red Lobster | | College Station | | TX | | — |
| | — |
| | 643 |
| | — |
| | 643 |
| | (111 | ) | | 7/28/2014 | | 1983 | | Morgantown | | WV | | — |
| | 1,252 |
| | 1,477 |
| | — |
| | 2,729 |
| | (290 | ) | | 7/28/2014 | | 2009 |
| Red Lobster | | Conroe | | TX | | — |
| | — |
| | 557 |
| | — |
| | 557 |
| | (126 | ) | | 7/28/2014 | | 2011 | | Parkersburg | | WV | | — |
| | 654 |
| | 1,447 |
| | — |
| | 2,101 |
| | (285 | ) | | 7/28/2014 | | 1994 |
| Red Lobster | | Denton | | TX | | — |
| | 832 |
| | 2,044 |
| | — |
| | 2,876 |
| | (187 | ) | | 7/28/2014 | | 1991 | | Casper | | WY | | — |
| | 1,014 |
| | 1,337 |
| | — |
| | 2,351 |
| | (301 | ) | | 7/28/2014 | | 2011 |
| Red Lobster | | Duncanville | | TX | | — |
| | 361 |
| | 2,658 |
| | — |
| | 3,019 |
| | (193 | ) | | 7/28/2014 | | 1974 | | Cheyenne | | WY | | — |
| | 1,514 |
| | 640 |
| | — |
| | 2,154 |
| | (102 | ) | | 7/28/2014 | | 1992 |
| Red Lobster | | El Paso | | TX | | — |
| | — |
| | 414 |
| | — |
| | 414 |
| | (115 | ) | | 7/28/2014 | | 1976 | |
| Red Lobster | | El Paso | | TX | | — |
| | — |
| | 883 |
| | — |
| | 883 |
| | (149 | ) | | 7/28/2014 | | 2008 | |
| Red Lobster | | Fort Worth | | TX | | — |
| | — |
| | 239 |
| | — |
| | 239 |
| | (66 | ) | | 7/28/2014 | | 1982 | |
| Red Oak Village | | | San Marcos | | TX | | 12,480 |
| | 5,287 |
| | 20,357 |
| | 171 |
| | 25,815 |
| | (4,968 | ) | | 2/7/2014 | | 2006 |
| Reef Services, LLC | | | Gainesville | | TX | | — |
| | 86 |
| | 285 |
| | — |
| | 371 |
| | (59 | ) | | 6/25/2014 | | 2009 |
| Regal Cinemas | | | Christiansburg | | VA | | — |
| | 1,610 |
| | 9,897 |
| | — |
| | 11,507 |
| | (96 | ) | | 8/24/2018 | | 2007 |
|
| | | | | | | | | | | | | | | | | | | | | | | | | | |
| | | | | | | | Initial Costs (1) | | Costs Capitalized Subsequent to Acquisition (2) | | Gross Amount
Carried at
December 31, 2016
(3) (4) | | | | | | |
| Property | | City | | State | | Encumbrances at
December 31, 2016 | | Land | | Buildings, Fixtures and Improvements | | | Accumulated Depreciation
(3) (5) | | Date Acquired | | Date of Construction |
| Red Lobster | | Houston | | TX | | — |
| | — |
| | 399 |
| | — |
| | 399 |
| | (111 | ) | | 7/28/2014 | | 1974 |
| Red Lobster | | Houston | | TX | | — |
| | 960 |
| | 1,833 |
| | — |
| | 2,793 |
| | (149 | ) | | 7/28/2014 | | 1981 |
| Red Lobster | | Humble | | TX | | — |
| | — |
| | 1,087 |
| | — |
| | 1,087 |
| | (160 | ) | | 7/28/2014 | | 1980 |
| Red Lobster | | Killeen | | TX | | — |
| | 732 |
| | 1,935 |
| | — |
| | 2,667 |
| | (172 | ) | | 7/28/2014 | | 1991 |
| Red Lobster | | Laredo | | TX | | — |
| | — |
| | 819 |
| | — |
| | 819 |
| | (167 | ) | | 7/28/2014 | | 2003 |
| Red Lobster | | Lewisville | | TX | | — |
| | 1,087 |
| | 1,626 |
| | — |
| | 2,713 |
| | (128 | ) | | 7/28/2014 | | 1973 |
| Red Lobster | | Longview | | TX | | — |
| | 324 |
| | 2,625 |
| | — |
| | 2,949 |
| | (202 | ) | | 7/28/2014 | | 1981 |
| Red Lobster | | Lubbock | | TX | | — |
| | 1,103 |
| | 1,494 |
| | — |
| | 2,597 |
| | (127 | ) | | 7/28/2014 | | 1976 |
| Red Lobster | | Lufkin | | TX | | — |
| | 15 |
| | 1,732 |
| | — |
| | 1,747 |
| | (165 | ) | | 7/28/2014 | | 1996 |
| Red Lobster | | Mcallen | | TX | | — |
| | 1,175 |
| | 2,280 |
| | — |
| | 3,455 |
| | (183 | ) | | 7/28/2014 | | 1981 |
| Red Lobster | | Mcallen | | TX | | — |
| | 960 |
| | 1,647 |
| | — |
| | 2,607 |
| | (176 | ) | | 7/28/2014 | | 2010 |
| Red Lobster | | N. Richland Hills | | TX | | — |
| | 493 |
| | 2,889 |
| | — |
| | 3,382 |
| | (215 | ) | | 7/28/2014 | | 1978 |
| Red Lobster | | Pasadena | | TX | | — |
| | 675 |
| | 928 |
| | — |
| | 1,603 |
| | (88 | ) | | 7/28/2014 | | 1978 |
| Red Lobster | | San Antonio | | TX | | — |
| | — |
| | 963 |
| | — |
| | 963 |
| | (121 | ) | | 7/28/2014 | | 1974 |
| Red Lobster | | San Antonio | | TX | | — |
| | 474 |
| | 1,491 |
| | — |
| | 1,965 |
| | (137 | ) | | 7/28/2014 | | 1984 |
| Red Lobster | | Sherman | | TX | | — |
| | 675 |
| | 1,923 |
| | — |
| | 2,598 |
| | (180 | ) | | 7/28/2014 | | 1990 |
| Red Lobster | | Sugar Land | | TX | | — |
| | — |
| | 708 |
| | — |
| | 708 |
| | (112 | ) | | 7/28/2014 | | 1981 |
| Red Lobster | | Texarkana | | TX | | — |
| | 73 |
| | 2,148 |
| | — |
| | 2,221 |
| | (183 | ) | | 7/28/2014 | | 1986 |
| Red Lobster | | Tyler | | TX | | — |
| | 884 |
| | 1,755 |
| | — |
| | 2,639 |
| | (149 | ) | | 7/28/2014 | | 1982 |
| Red Lobster | | Victoria | | TX | | — |
| | 478 |
| | 1,905 |
| | — |
| | 2,383 |
| | (159 | ) | | 7/28/2014 | | 1984 |
| Red Lobster | | Layton | | UT | | — |
| | 1,577 |
| | 1,333 |
| | — |
| | 2,910 |
| | (148 | ) | | 7/28/2014 | | 1993 |
| Red Lobster | | Saint George | | UT | | — |
| | 797 |
| | 1,387 |
| | — |
| | 2,184 |
| | (149 | ) | | 7/28/2014 | | 1996 |
| Red Lobster | | Bristol | | VA | | — |
| | 816 |
| | 1,175 |
| | — |
| | 1,991 |
| | (128 | ) | | 7/28/2014 | | 2005 |
| Red Lobster | | Charlottesville | | VA | | — |
| | — |
| | 1,021 |
| | — |
| | 1,021 |
| | (144 | ) | | 7/28/2014 | | 1986 |
| Red Lobster | | Chesapeake | | VA | | — |
| | 1,262 |
| | 1,374 |
| | — |
| | 2,636 |
| | (125 | ) | | 7/28/2014 | | 1992 |
| Red Lobster | | Colonial Heights | | VA | | — |
| | 1,095 |
| | 1,409 |
| | — |
| | 2,504 |
| | (150 | ) | | 7/28/2014 | | 1993 |
| Red Lobster | | Fredericksburg | | VA | | — |
| | 1,088 |
| | 1,971 |
| | — |
| | 3,059 |
| | (176 | ) | | 7/28/2014 | | 1991 |
| Red Lobster | | Harrisonburg | | VA | | — |
| | 465 |
| | 1,369 |
| | — |
| | 1,834 |
| | (150 | ) | | 7/28/2014 | | 1993 |
| Red Lobster | | Manassas | | VA | | — |
| | 1,800 |
| | 941 |
| | — |
| | 2,741 |
| | (111 | ) | | 7/28/2014 | | 1993 |
| Red Lobster | | Midlothian | | VA | | — |
| | — |
| | 655 |
| | — |
| | 655 |
| | (150 | ) | | 7/28/2014 | | 2003 |
| Red Lobster | | Sterling | | VA | | — |
| | — |
| | 646 |
| | — |
| | 646 |
| | (146 | ) | | 7/28/2014 | | 2001 |
| Red Lobster | | Winchester | | VA | | — |
| | — |
| | 357 |
| | — |
| | 357 |
| | (103 | ) | | 7/28/2014 | | 2006 |
|
| | | | | | | | | | | | | | | | | | | | | | | | | | |
| | | | | | | | Initial Costs (1) | | Costs Capitalized Subsequent to Acquisition (2) | | Gross Amount
Carried at
December 31, 2016
(3) (4) | | | | | | |
| Property | | City | | State | | Encumbrances at
December 31, 2016 | | Land | | Buildings, Fixtures and Improvements | | | Accumulated Depreciation
(3) (5) | | Date Acquired | | Date of Construction |
| Red Lobster | | Woodbridge | | VA | | — |
| | 1,052 |
| | 2,096 |
| | — |
| | 3,148 |
| | (175 | ) | | 7/28/2014 | | 1989 |
| Red Lobster | | Olympia | | WA | | — |
| | — |
| | 596 |
| | — |
| | 596 |
| | (169 | ) | | 7/28/2014 | | 1995 |
| Red Lobster | | Silverdale | | WA | | — |
| | 1,661 |
| | 501 |
| | — |
| | 2,162 |
| | (90 | ) | | 7/28/2014 | | 1993 |
| Red Lobster | | Spokane | | WA | | — |
| | — |
| | 1,427 |
| | — |
| | 1,427 |
| | (205 | ) | | 7/28/2014 | | 2009 |
| Red Lobster | | Ashwaubenon | | WI | | — |
| | 1,270 |
| | 1,116 |
| | — |
| | 2,386 |
| | (107 | ) | | 7/28/2014 | | 1975 |
| Red Lobster | | Eau Claire | | WI | | — |
| | 527 |
| | 1,534 |
| | — |
| | 2,061 |
| | (146 | ) | | 7/28/2014 | | 1982 |
| Red Lobster | | Greenfield | | WI | | — |
| | 1,823 |
| | 1,673 |
| | — |
| | 3,496 |
| | (135 | ) | | 7/28/2014 | | 1975 |
| Red Lobster | | Mt. Pleasant | | WI | | — |
| | 856 |
| | 1,773 |
| | — |
| | 2,629 |
| | (192 | ) | | 7/28/2014 | | 2012 |
| Red Lobster | | Wauwatosa | | WI | | — |
| | 1,524 |
| | 997 |
| | — |
| | 2,521 |
| | (98 | ) | | 7/28/2014 | | 1975 |
| Red Lobster | | Charleston | | WV | | — |
| | — |
| | 1,100 |
| | — |
| | 1,100 |
| | (205 | ) | | 7/28/2014 | | 2003 |
| Red Lobster | | Huntington | | WV | | — |
| | 344 |
| | 2,552 |
| | — |
| | 2,896 |
| | (211 | ) | | 7/28/2014 | | 1985 |
| Red Lobster | | Morgantown | | WV | | — |
| | 1,252 |
| | 1,477 |
| | — |
| | 2,729 |
| | (160 | ) | | 7/28/2014 | | 2009 |
| Red Lobster | | Parkersburg | | WV | | — |
| | 654 |
| | 1,447 |
| | — |
| | 2,101 |
| | (157 | ) | | 7/28/2014 | | 1994 |
| Red Lobster | | Casper | | WY | | — |
| | 1,014 |
| | 1,337 |
| | — |
| | 2,351 |
| | (166 | ) | | 7/28/2014 | | 2011 |
| Red Lobster | | Cheyenne | | WY | | — |
| | 1,514 |
| | 640 |
| | — |
| | 2,154 |
| | (56 | ) | | 7/28/2014 | | 1992 |
| Red Oak Village | | San Marcos | | TX | | 12,480 |
| | 5,287 |
| | 20,357 |
| | 171 |
| | 25,815 |
| | (3,006 | ) | | 2/7/2014 | | 2006 |
| Reef Services, LLC | | Gainesville | | TX | | — |
| | 86 |
| | 285 |
| | — |
| | 371 |
| | (33 | ) | | 6/25/2014 | | 2009 |
| Rite Aid | | Talladega | | AL | | — |
| | 377 |
| | 1,311 |
| | — |
| | 1,688 |
| | (236 | ) | | 1/8/2014 | | 1997 |
| Rite Aid | | Bear | | DE | | — |
| | 851 |
| | 2,702 |
| | — |
| | 3,553 |
| | (494 | ) | | 1/8/2014 | | 1999 |
| Rite Aid | | Tucker | | GA | | — |
| | 793 |
| | 1,419 |
| | — |
| | 2,212 |
| | (255 | ) | | 1/8/2014 | | 1996 |
| Rite Aid | | Jeffersonville | | IN | | — |
| | 824 |
| | 2,472 |
| | — |
| | 3,296 |
| | (612 | ) | | 11/30/2012 | | 2008 |
| Rite Aid | | Lawrenceburg | | KY | | — |
| | 567 |
| | 2,267 |
| | — |
| | 2,834 |
| | (561 | ) | | 11/30/2012 | | 2008 |
| Rite Aid | | Lexington | | KY | | — |
| | — |
| | 1,943 |
| | — |
| | 1,943 |
| | (481 | ) | | 11/30/2012 | | 2007 |
| Rite Aid | | Paris | | KY | | — |
| | 743 |
| | 2,228 |
| | — |
| | 2,971 |
| | (552 | ) | | 11/30/2012 | | 2008 |
| Rite Aid | | Scottsville | | KY | | — |
| | 153 |
| | 2,904 |
| | — |
| | 3,057 |
| | (719 | ) | | 11/30/2012 | | 2007 |
| Rite Aid | | Stanford | | KY | | — |
| | 152 |
| | 2,886 |
| | — |
| | 3,038 |
| | (714 | ) | | 11/30/2012 | | 2009 |
| Rite Aid | | Adams | | MA | | — |
| | 300 |
| | 1,200 |
| | — |
| | 1,500 |
| | (249 | ) | | 7/30/2013 | | 1958 |
| Rite Aid | | Bangor | | ME | | — |
| | 724 |
| | 2,896 |
| | — |
| | 3,620 |
| | (464 | ) | | 5/19/2014 | | 1998 |
| Rite Aid | | Buxton | | ME | | — |
| | — |
| | — |
| | 2,131 |
| | 2,131 |
| | (270 | ) | | 5/19/2014 | | 1997 |
| Rite Aid | | Dover-Foxcroft | | ME | | — |
| | 256 |
| | 2,659 |
| | — |
| | 2,915 |
| | (488 | ) | | 1/8/2014 | | 1999 |
| Rite Aid | | Fort Fairfield | | ME | | — |
| | 117 |
| | 1,821 |
| | — |
| | 1,938 |
| | (336 | ) | | 1/8/2014 | | 1998 |
| Rite Aid | | Fort Kent | | ME | | — |
| | 387 |
| | 2,064 |
| | — |
| | 2,451 |
| | (371 | ) | | 1/8/2014 | | 1999 |
|
| | | | | | | | | | | | | | | | | | | | | | | | | | |
| | | | | | | | Initial Costs (1) | | Costs Capitalized Subsequent to Acquisition (2) | | Gross Amount
Carried at
December 31, 2018
(3) (4) | | | | | | |
| Property | | City | | State | | Encumbrances at
December 31, 2018 | | Land | | Buildings, Fixtures and Improvements | | | Accumulated Depreciation
(3) (5) | | Date Acquired | | Date of Construction |
| Ridley Pointe | | Smyrna | | TN | | — |
| | 2,009 |
| | 9,467 |
| | 109 |
| | 11,585 |
| | (381 | ) | | 8/25/2017 | | 2016 |
| Rite Aid | | Bear | | DE | | — |
| | 851 |
| | 2,702 |
| | — |
| | 3,553 |
| | (829 | ) | | 1/8/2014 | | 1999 |
| | | | | | Initial Costs (1) | | Costs Capitalized Subsequent to Acquisition (2) | | Gross Amount
Carried at
December 31, 2016
(3) (4) | | | | | | Initial Costs (1) | | Costs Capitalized Subsequent to Acquisition (2) | | Gross Amount
Carried at
December 31, 2018
(3) (4) | | | |
| Property | | City | | State | | Encumbrances at
December 31, 2016 | | Land | | Buildings, Fixtures and Improvements | | Accumulated Depreciation
(3) (5) | | Date Acquired | | Date of Construction | | City | | State | | Encumbrances at
December 31, 2018 | | Land | | Buildings, Fixtures and Improvements | | Accumulated Depreciation
(3) (5) | | Date Acquired | | Date of Construction |
| Rite Aid | | Van Buren | | ME | | — |
| | 115 |
| | 1,720 |
| | — |
| | 1,835 |
| | (318 | ) | | 1/8/2014 | | 1998 | | Bay City | | MI | | — |
| | 463 |
| | 1,629 |
| | 62 |
| | 2,154 |
| | (407 | ) | | 6/24/2014 | | 1996 |
| Rite Aid | | Bay City | | MI | | — |
| | 463 |
| | 1,629 |
| | — |
| | 2,092 |
| | (226 | ) | | 6/24/2014 | | 1996 | | Burton | | MI | | — |
| | 128 |
| | 2,541 |
| | (50 | ) | | 2,619 |
| | (791 | ) | | 7/26/2013 | | 1999 |
| Rite Aid | | Burton | | MI | | — |
| | 128 |
| | 2,541 |
| | (50 | ) | | 2,619 |
| | (523 | ) | | 7/26/2013 | | 1999 | | West Branch | | MI | | — |
| | 418 |
| | 1,280 |
| | 70 |
| | 1,768 |
| | (346 | ) | | 6/23/2014 | | 1996 |
| Rite Aid | | West Branch | | MI | | — |
| | 418 |
| | 1,280 |
| | 70 |
| | 1,768 |
| | (192 | ) | | 6/23/2014 | | 1996 | | Bristol | | NH | | — |
| | 395 |
| | 1,461 |
| | 52 |
| | 1,908 |
| | (452 | ) | | 1/8/2014 | | 1997 |
| Rite Aid | | Burlington | | NC | | — |
| | 973 |
| | 2,726 |
| | — |
| | 3,699 |
| | (500 | ) | | 1/8/2014 | | 2000 | | Winchester | | NH | | — |
| | 343 |
| | 1,868 |
| | — |
| | 2,211 |
| | (574 | ) | | 1/8/2014 | | 1998 |
| Rite Aid | | Wilson | | NC | | — |
| | 573 |
| | 1,337 |
| | — |
| | 1,910 |
| | (277 | ) | | 7/30/2013 | | 2002 | | Cheektowaga | | NY | | — |
| | 436 |
| | 3,466 |
| | — |
| | 3,902 |
| | (964 | ) | | 2/7/2014 | | 2000 |
| Rite Aid | | Bristol | | NH | | — |
| | 395 |
| | 1,461 |
| | 52 |
| | 1,908 |
| | (275 | ) | | 1/8/2014 | | 1997 | | Genoa | | OH | | — |
| | 405 |
| | 1,845 |
| | — |
| | 2,250 |
| | (554 | ) | | 1/8/2014 | | 1998 |
| Rite Aid | | Winchester | | NH | | — |
| | 343 |
| | 1,868 |
| | — |
| | 2,211 |
| | (344 | ) | | 1/8/2014 | | 1998 | | Lima | | OH | | — |
| | 576 |
| | 2,304 |
| | — |
| | 2,880 |
| | (769 | ) | | 11/13/2012 | | 2006 |
| Rite Aid | | Cheektowaga | | NY | | — |
| | 436 |
| | 3,466 |
| | — |
| | 3,902 |
| | (569 | ) | | 2/7/2014 | | 2000 | | Louisville | | OH | | — |
| | 576 |
| | 3,266 |
| | — |
| | 3,842 |
| | (1,098 | ) | | 10/31/2012 | | 2008 |
| Rite Aid | | Genoa | | OH | | — |
| | 405 |
| | 1,845 |
| | — |
| | 2,250 |
| | (331 | ) | | 1/8/2014 | | 1998 | | Marion | | OH | | — |
| | 508 |
| | 2,877 |
| | — |
| | 3,385 |
| | (960 | ) | | 11/13/2012 | | 2006 |
| Rite Aid | | Lima | | OH | | — |
| | 576 |
| | 2,304 |
| | — |
| | 2,880 |
| | (570 | ) | | 11/13/2012 | | 2006 | | St. Marys | | OH | | — |
| | 581 |
| | 2,322 |
| | — |
| | 2,903 |
| | (640 | ) | | 5/19/2014 | | 2005 |
| Rite Aid | | Louisville | | OH | | — |
| | 576 |
| | 3,266 |
| | — |
| | 3,842 |
| | (825 | ) | | 10/31/2012 | | 2008 | | Warren | | OH | | — |
| | 668 |
| | 2,670 |
| | 62 |
| | 3,400 |
| | (756 | ) | | 5/19/2014 | | 1999 |
| Rite Aid | | Marion | | OH | | — |
| | 508 |
| | 2,877 |
| | — |
| | 3,385 |
| | (712 | ) | | 11/13/2012 | | 2006 | | Wheelersburg | | OH | | — |
| | 361 |
| | 1,444 |
| | 65 |
| | 1,870 |
| | (419 | ) | | 5/19/2014 | | 1998 |
| Rite Aid | | St. Marys | | OH | | — |
| | 581 |
| | 2,322 |
| | — |
| | 2,903 |
| | (362 | ) | | 5/19/2014 | | 2005 | | Meadville | | PA | | — |
| | 193 |
| | 2,521 |
| | — |
| | 2,714 |
| | (754 | ) | | 1/8/2014 | | 1999 |
| Rite Aid | | Warren | | OH | | — |
| | 668 |
| | 2,670 |
| | — |
| | 3,338 |
| | (426 | ) | | 5/19/2014 | | 1999 | | Philadelphia | | PA | | — |
| | 633 |
| | 2,531 |
| | — |
| | 3,164 |
| | (724 | ) | | 5/19/2014 | | 1999 |
| Rite Aid | | Wheelersburg | | OH | | — |
| | 361 |
| | 1,444 |
| | 65 |
| | 1,870 |
| | (237 | ) | | 5/19/2014 | | 1998 | | Memphis | | TN | | — |
| | 266 |
| | 1,062 |
| | 54 |
| | 1,382 |
| | (313 | ) | | 5/19/2014 | | 2000 |
| Rite Aid | | Meadville | | PA | | — |
| | 193 |
| | 2,521 |
| | — |
| | 2,714 |
| | (450 | ) | | 1/8/2014 | | 1999 | | Hayes | | VA | | — |
| | 812 |
| | 3,247 |
| | — |
| | 4,059 |
| | (895 | ) | | 5/19/2014 | | 2005 |
| Rite Aid | | Philadelphia | | PA | | — |
| | 633 |
| | 2,531 |
| | — |
| | 3,164 |
| | (409 | ) | | 5/19/2014 | | 1999 | |
| Rite Aid | | Spartanburg | | SC | | — |
| | 894 |
| | 3,575 |
| | — |
| | 4,469 |
| | (557 | ) | | 5/19/2014 | | 2004 | |
| Rite Aid | | Travelers Rest | | SC | | — |
| | 882 |
| | 3,527 |
| | — |
| | 4,409 |
| | (549 | ) | | 5/19/2014 | | 2005 | |
| Rite Aid | | Memphis | | TN | | — |
| | 266 |
| | 1,062 |
| | 54 |
| | 1,382 |
| | (176 | ) | | 5/19/2014 | | 2000 | |
| Rite Aid | | Murfreesboro | | TN | | — |
| | 454 |
| | 1,817 |
| | — |
| | 2,271 |
| | (283 | ) | | 5/19/2014 | | 1999 | |
| Rite Aid | | Hayes | | VA | | — |
| | 812 |
| | 3,247 |
| | — |
| | 4,059 |
| | (506 | ) | | 5/19/2014 | | 2005 | |
| Rite Aid | | Huntington | | WV | | — |
| | 964 |
| | 2,250 |
| | — |
| | 3,214 |
| | (557 | ) | | 11/30/2012 | | 2008 | |
| Road Ranger | | Winnebago | | IL | | — |
| | 707 |
| | 3,202 |
| | — |
| | 3,909 |
| | (531 | ) | | 2/7/2014 | | 1998 | | Winnebago | | IL | | — |
| | 707 |
| | 3,202 |
| | — |
| | 3,909 |
| | (901 | ) | | 2/7/2014 | | 1998 |
| Rockwell Collins | | Sterling | | VA | | — |
| | 4,285 |
| | 29,802 |
| | — |
| | 34,087 |
| | (3,537 | ) | | 6/30/2014 | | 2011 | | Sterling | | VA | | — |
| | 4,285 |
| | 29,802 |
| | 6,304 |
| | 40,391 |
| | (6,382 | ) | | 6/30/2014 | | 2011 |
| Ross | | Highlands Ranch | | CO | | 3,475 |
| | 2,850 |
| | 4,795 |
| | — |
| | 7,645 |
| | (704 | ) | | 2/7/2014 | | 2007 | |
| Ross | | Austin | | TX | | — |
| | 658 |
| | 2,631 |
| | 700 |
| | 3,989 |
| | (520 | ) | | 5/19/2014 | | 2002 | | Austin | | TX | | — |
| | 658 |
| | 2,631 |
| | 700 |
| | 3,989 |
| | (920 | ) | | 5/19/2014 | | 2002 |
| Rubbermaid | | Winfield | | KS | | — |
| | 819 |
| | 15,555 |
| | — |
| | 16,374 |
| | (3,914 | ) | | 11/28/2012 | | 2012 | | Winfield | | KS | | — |
| | 819 |
| | 15,555 |
| | — |
| | 16,374 |
| | (5,392 | ) | | 11/28/2012 | | 2012 |
| Rubbermaid | | Winfield | | KS | | 12,725 |
| | 1,056 |
| | 20,060 |
| | — |
| | 21,116 |
| | (5,761 | ) | | 4/25/2012 | | 2008 | | Winfield | | KS | | — |
| | 1,056 |
| | 20,060 |
| | — |
| | 21,116 |
| | (7,386 | ) | | 4/25/2012 | | 2008 |
| Rubbermaid | | Bowling Green | | OH | | — |
| | 714 |
| | 13,564 |
| | — |
| | 14,278 |
| | (2,861 | ) | | 7/29/2013 | | 2013 | | Bowling Green | | OH | | — |
| | 714 |
| | 13,564 |
| | — |
| | 14,278 |
| | (4,367 | ) | | 7/29/2013 | | 2013 |
| Rubbermaid | | Brimfield | | OH | | — |
| | 1,552 |
| | 29,495 |
| | — |
| | 31,047 |
| | (7,122 | ) | | 1/31/2013 | | 2012 | | Brimfield | | OH | | — |
| | 1,552 |
| | 29,495 |
| | — |
| | 31,047 |
| | (10,043 | ) | | 1/31/2013 | | 2012 |
| Ruby Tuesday | | | Dillon | | CO | | — |
| | 400 |
| | 1,628 |
| | — |
| | 2,028 |
| | (490 | ) | | 6/27/2013 | | 1995 |
| Ruby Tuesday | | | Bartow | | FL | | — |
| | 270 |
| | 1,916 |
| | — |
| | 2,186 |
| | (577 | ) | | 6/27/2013 | | 1995 |
| Ruby Tuesday | | | Somerset | | KY | | — |
| | 480 |
| | 1,120 |
| | — |
| | 1,600 |
| | (337 | ) | | 6/27/2013 | | 1995 |
| Ryan's Buffet | | | Commerce | | GA | | — |
| | 962 |
| | 1,470 |
| | (647 | ) | | 1,785 |
| | (284 | ) | | 2/7/2014 | | 1996 |
| Ryan's Buffet | | | Rome | | GA | | — |
| | 831 |
| | 1,848 |
| | (919 | ) | | 1,760 |
| | (289 | ) | | 2/7/2014 | | 1983 |
| Ryan's Buffet | | | Asheville | | NC | | — |
| | 1,261 |
| | 2,204 |
| | (1,179 | ) | | 2,286 |
| | (362 | ) | | 2/7/2014 | | 1996 |
| Ryan's Buffet | | | Clarksburg | | WV | | — |
| | — |
| | 1,639 |
| | (1,305 | ) | | 334 |
| | (75 | ) | | 1/8/2014 | | 2001 |
| Salty's | | | Jasper | | AL | | — |
| | 140 |
| | 219 |
| | — |
| | 359 |
| | (66 | ) | | 6/27/2013 | | 1995 |
| | | | | | Initial Costs (1) | | Costs Capitalized Subsequent to Acquisition (2) | | Gross Amount
Carried at
December 31, 2016
(3) (4) | | | | | | Initial Costs (1) | | Costs Capitalized Subsequent to Acquisition (2) | | Gross Amount
Carried at
December 31, 2018
(3) (4) | | | |
| Property | | City | | State | | Encumbrances at
December 31, 2016 | | Land | | Buildings, Fixtures and Improvements | | Accumulated Depreciation
(3) (5) | | Date Acquired | | Date of Construction | | City | | State | | Encumbrances at
December 31, 2018 | | Land | | Buildings, Fixtures and Improvements | | Accumulated Depreciation
(3) (5) | | Date Acquired | | Date of Construction |
| Ruby Tuesday | | Dillon | | CO | | — |
| | 400 |
| | 1,628 |
| | — |
| | 2,028 |
| | (323 | ) | | 6/27/2013 | | 1995 | |
| Ruby Tuesday | | Bartow | | FL | | — |
| | 270 |
| | 1,916 |
| | — |
| | 2,186 |
| | (380 | ) | | 6/27/2013 | | 1995 | |
| Ruby Tuesday | | Orlando | | FL | | — |
| | 1,286 |
| | — |
| | (710 | ) | | 576 |
| | — |
| | 7/31/2013 | | 1998 | |
| Ruby Tuesday | | London | | KY | | — |
| | 370 |
| | 1,493 |
| | (263 | ) | | 1,600 |
| | (122 | ) | | 6/27/2013 | | 1995 | |
| Ruby Tuesday | | Somerset | | KY | | — |
| | 480 |
| | 1,120 |
| | — |
| | 1,600 |
| | (222 | ) | | 6/27/2013 | | 1995 | |
| Ryan's Buffet | | Commerce | | GA | | — |
| | 962 |
| | 1,470 |
| | (647 | ) | | 1,785 |
| | (122 | ) | | 2/7/2014 | | 1996 | |
| Ryan's Buffet | | Rome | | GA | | — |
| | 831 |
| | 1,848 |
| | (919 | ) | | 1,760 |
| | (124 | ) | | 2/7/2014 | | 1983 | |
| Ryan's Buffet | | Asheville | | NC | | — |
| | 1,261 |
| | 2,204 |
| | (1,179 | ) | | 2,286 |
| | (155 | ) | | 2/7/2014 | | 1996 | |
| Ryan's Buffet | | Clarksburg | | WV | | — |
| | — |
| | 1,639 |
| | (1,305 | ) | | 334 |
| | (21 | ) | | 1/8/2014 | | 2001 | |
| Sam's Club | | Hoover | | AL | | — |
| | 2,253 |
| | 9,606 |
| | — |
| | 11,859 |
| | (1,354 | ) | | 2/7/2014 | | 1989 | | Hoover | | AL | | — |
| | 2,253 |
| | 9,606 |
| | — |
| | 11,859 |
| | (2,296 | ) | | 2/7/2014 | | 1989 |
| Sam's Club | | Colorado Springs | | CO | | — |
| | 3,347 |
| | 12,652 |
| | — |
| | 15,999 |
| | (1,756 | ) | | 2/7/2014 | | 1998 | | Colorado Springs | | CO | | — |
| | 3,347 |
| | 12,652 |
| | — |
| | 15,999 |
| | (2,975 | ) | | 2/7/2014 | | 1998 |
| Sam's Club | | Douglasville | | GA | | — |
| | 1,701 |
| | 11,052 |
| | — |
| | 12,753 |
| | (1,429 | ) | | 2/7/2014 | | 1999 | | Douglasville | | GA | | — |
| | 1,701 |
| | 11,052 |
| | — |
| | 12,753 |
| | (2,423 | ) | | 2/7/2014 | | 1999 |
| Sam's Southern Eatery | | Kennesaw | | GA | | — |
| | 210 |
| | 46 |
| | — |
| | 256 |
| | (9 | ) | | 6/27/2013 | | 1995 | | Kennesaw | | GA | | — |
| | 210 |
| | 46 |
| | — |
| | 256 |
| | (14 | ) | | 6/27/2013 | | 1995 |
| Santa Rosa Commons | | Pace | | FL | | 13,000 |
| | 4,447 |
| | 21,884 |
| | — |
| | 26,331 |
| | (3,054 | ) | | 2/7/2014 | | 2008 | | Pace | | FL | | — |
| | 4,447 |
| | 21,884 |
| | 464 |
| | 26,795 |
| | (5,178 | ) | | 2/7/2014 | | 2008 |
| Savers | | | Austin | | TX | | — |
| | 740 |
| | 2,958 |
| | — |
| | 3,698 |
| | (755 | ) | | 5/19/2014 | | 2002 |
| Schlotzsky's | | Colorado Springs | | CO | | — |
| | 530 |
| | 530 |
| | — |
| | 1,060 |
| | (104 | ) | | 6/27/2013 | | 1997 | | Colorado Springs | | CO | | — |
| | 530 |
| | 530 |
| | — |
| | 1,060 |
| | (157 | ) | | 6/27/2013 | | 1997 |
| Schmitz & Schmitz | | Gainesville | | TX | | — |
| | 29 |
| | 1,950 |
| | — |
| | 1,979 |
| | (188 | ) | | 6/25/2014 | | 1930 | | Gainesville | | TX | | — |
| | 29 |
| | 1,950 |
| | — |
| | 1,979 |
| | (336 | ) | | 6/25/2014 | | 1930 |
| Schneider Electric | | | Foxboro | | MA | | — |
| | 11,784 |
| | — |
| | 27,888 |
| | 39,672 |
| | (4,882 | ) | | 6/27/2014 | | 1965 |
| Scotts Company | | Orrville | | OH | | — |
| | 278 |
| | 2,502 |
| | — |
| | 2,780 |
| | (655 | ) | | 9/28/2012 | | 1950 | | Orrville | | OH | | — |
| | 278 |
| | 2,502 |
| | — |
| | 2,780 |
| | (883 | ) | | 9/28/2012 | | 1950 |
| Scotts Company | | Orrville | | OH | | — |
| | 611 |
| | 1,134 |
| | — |
| | 1,745 |
| | (308 | ) | | 7/30/2012 | | 1950 | | Orrville | | OH | | — |
| | 611 |
| | 1,134 |
| | — |
| | 1,745 |
| | (407 | ) | | 7/30/2012 | | 1950 |
| Scotts Company | | Orrville | | OH | | — |
| | 609 |
| | 11,576 |
| | — |
| | 12,185 |
| | (3,148 | ) | | 7/30/2012 | | 2006 | | Orrville | | OH | | — |
| | 609 |
| | 11,576 |
| | — |
| | 12,185 |
| | (4,155 | ) | | 7/30/2012 | | 2006 |
| SCP Distributors | | North Little Rock | | AR | | — |
| | 258 |
| | 1,665 |
| | (9 | ) | | 1,914 |
| | (156 | ) | | 11/20/2014 | | 2006 | | North Little Rock | | AR | | — |
| | 258 |
| | 1,665 |
| | (9 | ) | | 1,914 |
| | (302 | ) | | 11/20/2014 | | 2006 |
| SCP Distributors | | Knoxville | | TN | | — |
| | 251 |
| | 900 |
| | — |
| | 1,151 |
| | (100 | ) | | 11/20/2014 | | 2012 | | Knoxville | | TN | | — |
| | 251 |
| | 900 |
| | 189 |
| | 1,340 |
| | (191 | ) | | 11/20/2014 | | 2012 |
| Sedwick Claims Management Serv | | Dublin | | OH | | — |
| | 945 |
| | 8,520 |
| | — |
| | 9,465 |
| | (1,041 | ) | | 6/26/2014 | | 1997 | |
| Sedgwick Claims Mgmt Services | | | Dublin | | OH | | — |
| | 945 |
| | 8,520 |
| | — |
| | 9,465 |
| | (1,861 | ) | | 6/26/2014 | | 1997 |
| Select Energy Services | | Damascus | | AR | | — |
| | 530 |
| | 800 |
| | — |
| | 1,330 |
| | (171 | ) | | 6/12/2014 | | 2009 | | Damascus | | AR | | — |
| | 530 |
| | 800 |
| | — |
| | 1,330 |
| | (306 | ) | | 6/12/2014 | | 2009 |
| Select Energy Services | | Frierson | | LA | | — |
| | 260 |
| | 4,954 |
| | — |
| | 5,214 |
| | (565 | ) | | 6/12/2014 | | 2010 | | Frierson | | LA | | — |
| | 260 |
| | 4,954 |
| | — |
| | 5,214 |
| | (1,009 | ) | | 6/12/2014 | | 2010 |
| Select Energy Services | | Alderson | | OK | | — |
| | 260 |
| | 1,150 |
| | — |
| | 1,410 |
| | (164 | ) | | 6/12/2014 | | 2008 | | Alderson | | OK | | — |
| | 260 |
| | 1,150 |
| | — |
| | 1,410 |
| | (294 | ) | | 6/12/2014 | | 2008 |
| Select Energy Services | | Big Wells | | TX | | — |
| | 353 |
| | 1,820 |
| | — |
| | 2,173 |
| | (209 | ) | | 6/12/2014 | | 2011 | | Big Wells | | TX | | — |
| | 353 |
| | 1,820 |
| | — |
| | 2,173 |
| | (374 | ) | | 6/12/2014 | | 2011 |
| Select Energy Services | | Chireno | | TX | | — |
| | 388 |
| | 5,470 |
| | — |
| | 5,858 |
| | (618 | ) | | 6/25/2014 | | 2011 | | Chireno | | TX | | — |
| | 388 |
| | 5,470 |
| | — |
| | 5,858 |
| | (1,104 | ) | | 6/25/2014 | | 2011 |
| Select Energy Services | | Cleburne | | TX | | — |
| | 154 |
| | 2,333 |
| | — |
| | 2,487 |
| | (269 | ) | | 6/25/2014 | | 2008 | | Cleburne | | TX | | — |
| | 154 |
| | 2,333 |
| | — |
| | 2,487 |
| | (480 | ) | | 6/25/2014 | | 2008 |
| Select Energy Services | | Dilley | | TX | | — |
| | 308 |
| | 1,416 |
| | — |
| | 1,724 |
| | (170 | ) | | 6/25/2014 | | 2012 | | Dilley | | TX | | — |
| | 308 |
| | 1,416 |
| | — |
| | 1,724 |
| | (304 | ) | | 6/25/2014 | | 2012 |
| Select Energy Services | | Odessa | | TX | | — |
| | 460 |
| | 1,998 |
| | — |
| | 2,458 |
| | (253 | ) | | 6/25/2014 | | 1982 | | Odessa | | TX | | — |
| | 460 |
| | 1,998 |
| | — |
| | 2,458 |
| | (452 | ) | | 6/25/2014 | | 1982 |
| Senor Panchos | | Orrville | | OH | | — |
| | 99 |
| | 176 |
| | — |
| | 275 |
| | (36 | ) | | 6/27/2013 | | 1990 | |
| Shale Tank Truck | | Cleburne | | TX | | — |
| | 476 |
| | 547 |
| | — |
| | 1,023 |
| | (69 | ) | | 6/25/2014 | | 2007 | | Cleburne | | TX | | — |
| | 476 |
| | 547 |
| | — |
| | 1,023 |
| | (122 | ) | | 6/25/2014 | | 2007 |
| Shale Tank Truck | | | Midland | | TX | | — |
| | 757 |
| | 939 |
| | — |
| | 1,696 |
| | (221 | ) | | 6/25/2014 | | 2012 |
| Sherwin-Williams | | | Angola | | IN | | — |
| | 249 |
| | 996 |
| | — |
| | 1,245 |
| | (257 | ) | | 5/19/2014 | | 2001 |
| Sherwin-Williams | | | Muskegon | | MI | | — |
| | 187 |
| | 1,524 |
| | — |
| | 1,711 |
| | (396 | ) | | 2/7/2014 | | 2008 |
| Sherwin-Williams | | | Ashtabula | | OH | | — |
| | 176 |
| | 704 |
| | — |
| | 880 |
| | (148 | ) | | 5/19/2014 | | 2003 |
| Sherwin-Williams | | | Boardman | | OH | | — |
| | 206 |
| | 825 |
| | — |
| | 1,031 |
| | (173 | ) | | 5/19/2014 | | 2003 |
| Shoney's | | | Gadsden | | AL | | — |
| | 220 |
| | 707 |
| | — |
| | 927 |
| | (213 | ) | | 6/27/2013 | | 1995 |
| Shoney's | | | Oxford | | AL | | — |
| | 670 |
| | 25 |
| | — |
| | 695 |
| | (8 | ) | | 6/27/2013 | | 1995 |
| Shoney's | | | Grayson | | KY | | — |
| | 420 |
| | 406 |
| | — |
| | 826 |
| | (122 | ) | | 6/27/2013 | | 1995 |
| | | | | | Initial Costs (1) | | Costs Capitalized Subsequent to Acquisition (2) | | Gross Amount
Carried at
December 31, 2016
(3) (4) | | | | | | Initial Costs (1) | | Costs Capitalized Subsequent to Acquisition (2) | | Gross Amount
Carried at
December 31, 2018
(3) (4) | | | |
| Property | | City | | State | | Encumbrances at
December 31, 2016 | | Land | | Buildings, Fixtures and Improvements | | Accumulated Depreciation
(3) (5) | | Date Acquired | | Date of Construction | | City | | State | | Encumbrances at
December 31, 2018 | | Land | | Buildings, Fixtures and Improvements | | Accumulated Depreciation
(3) (5) | | Date Acquired | | Date of Construction |
| Shale Tank Truck | | Midland | | TX | | — |
| | 757 |
| | 939 |
| | — |
| | 1,696 |
| | (124 | ) | | 6/25/2014 | | 2012 | |
| Sherwin-Williams | | Angola | | IN | | — |
| | 249 |
| | 996 |
| | — |
| | 1,245 |
| | (146 | ) | | 5/19/2014 | | 2001 | |
| Sherwin-Williams | | Muskegon | | MI | | — |
| | 187 |
| | 1,524 |
| | — |
| | 1,711 |
| | (234 | ) | | 2/7/2014 | | 2008 | |
| Sherwin-Williams | | Ashtabula | | OH | | — |
| | 176 |
| | 704 |
| | — |
| | 880 |
| | (83 | ) | | 5/19/2014 | | 2003 | |
| Sherwin-Williams | | Boardman | | OH | | — |
| | 206 |
| | 825 |
| | — |
| | 1,031 |
| | (98 | ) | | 5/19/2014 | | 2003 | |
| Shoney's | | Gadsden | | AL | | — |
| | 220 |
| | 707 |
| | — |
| | 927 |
| | (140 | ) | | 6/27/2013 | | 1995 | | Grenada | | MS | | — |
| | 270 |
| | 809 |
| | — |
| | 1,079 |
| | (227 | ) | | 7/31/2013 | | 1995 |
| Shoney's | | Oxford | | AL | | — |
| | 670 |
| | 25 |
| | — |
| | 695 |
| | (5 | ) | | 6/27/2013 | | 1995 | | Hattiesburg | | MS | | — |
| | 730 |
| | 618 |
| | — |
| | 1,348 |
| | (186 | ) | | 6/27/2013 | | 1995 |
| Shoney's | | Grayson | | KY | | — |
| | 420 |
| | 406 |
| | — |
| | 826 |
| | (81 | ) | | 6/27/2013 | | 1995 | | Jackson | | MS | | — |
| | 360 |
| | 572 |
| | — |
| | 932 |
| | (172 | ) | | 6/27/2013 | | 1995 |
| Shoney's | | Grenada | | MS | | — |
| | 270 |
| | 809 |
| | — |
| | 1,079 |
| | (148 | ) | | 7/31/2013 | | 1995 | | Summerville | | SC | | — |
| | 350 |
| | 800 |
| | — |
| | 1,150 |
| | (241 | ) | | 6/27/2013 | | 1995 |
| Shoney's | | Hattiesburg | | MS | | — |
| | 730 |
| | 618 |
| | — |
| | 1,348 |
| | (122 | ) | | 6/27/2013 | | 1995 | | Cookeville | | TN | | — |
| | 510 |
| | 760 |
| | — |
| | 1,270 |
| | (229 | ) | | 6/27/2013 | | 1995 |
| Shoney's | | Jackson | | MS | | — |
| | 360 |
| | 572 |
| | — |
| | 932 |
| | (113 | ) | | 6/27/2013 | | 1995 | | Lawrenceburg | | TN | | — |
| | 330 |
| | 873 |
| | — |
| | 1,203 |
| | (263 | ) | | 6/27/2013 | | 1995 |
| Shoney's | | Summerville | | SC | | — |
| | 350 |
| | 800 |
| | — |
| | 1,150 |
| | (159 | ) | | 6/27/2013 | | 1995 | | Charleston | | WV | | — |
| | 190 |
| | 543 |
| | — |
| | 733 |
| | (164 | ) | | 6/27/2013 | | 1995 |
| Shoney's | | Cookeville | | TN | | — |
| | 510 |
| | 760 |
| | — |
| | 1,270 |
| | (151 | ) | | 6/27/2013 | | 1995 | | Lewisburg | | WV | | — |
| | 110 |
| | 642 |
| | — |
| | 752 |
| | (193 | ) | | 6/27/2013 | | 1995 |
| Shoney's | | Lawrenceburg | | TN | | — |
| | 330 |
| | 873 |
| | — |
| | 1,203 |
| | (173 | ) | | 6/27/2013 | | 1995 | | Princeton | | WV | | — |
| | 90 |
| | 593 |
| | — |
| | 683 |
| | (179 | ) | | 6/27/2013 | | 1995 |
| Shoney's | | Charleston | | WV | | — |
| | 190 |
| | 543 |
| | — |
| | 733 |
| | (108 | ) | | 6/27/2013 | | 1995 | | Ripley | | WV | | — |
| | 200 |
| | 599 |
| | — |
| | 799 |
| | (180 | ) | | 6/27/2013 | | 1995 |
| Shoney's | | Lewisburg | | WV | | — |
| | 110 |
| | 642 |
| | — |
| | 752 |
| | (127 | ) | | 6/27/2013 | | 1995 | |
| Shoney's | | Princeton | | WV | | — |
| | 90 |
| | 593 |
| | — |
| | 683 |
| | (118 | ) | | 6/27/2013 | | 1995 | |
| Shoney's | | Ripley | | WV | | — |
| | 200 |
| | 599 |
| | — |
| | 799 |
| | (119 | ) | | 6/27/2013 | | 1995 | |
| Shopko | | L'Anse | | MI | | — |
| | 382 |
| | 1,736 |
| | — |
| | 2,118 |
| | (268 | ) | | 5/13/2014 | | 2009 | |
| Shopko Hometown | | | L'Anse | | MI | | — |
| | 382 |
| | 1,736 |
| | — |
| | 2,118 |
| | (473 | ) | | 5/13/2014 | | 2009 |
| Sierra Pines | | The Woodlands | | TX | | 11,297 |
| | 5,219 |
| | 19,196 |
| | 4,706 |
| | 29,121 |
| | (1,006 | ) | | 11/5/2013 | | 2014 | | The Woodlands | | TX | | 14,036 |
| | 5,219 |
| | 19,196 |
| | 7,233 |
| | 31,648 |
| | (3,095 | ) | | 11/5/2013 | | 2014 |
| SiteOne | | | Homer Glen | | IL | | — |
| | 929 |
| | 893 |
| | — |
| | 1,822 |
| | (32 | ) | | 5/29/2018 | | 1960 |
| SiteOne | | | Park City | | IL | | — |
| | 932 |
| | 744 |
| | — |
| | 1,676 |
| | (24 | ) | | 5/29/2018 | | 1988 |
| SiteOne | | | Pingree Grove | | IL | | — |
| | 1,281 |
| | 1,161 |
| | — |
| | 2,442 |
| | (35 | ) | | 5/29/2018 | | 2018 |
| Smokey Bones | | Morrow | | GA | | — |
| | 390 |
| | 2,184 |
| | — |
| | 2,574 |
| | (433 | ) | | 6/27/2013 | | 1995 | | Morrow | | GA | | — |
| | 390 |
| | 2,184 |
| | — |
| | 2,574 |
| | (658 | ) | | 6/27/2013 | | 1995 |
| Smokey Bones | | Pittsburgh | | PA | | — |
| | 1,490 |
| | 390 |
| | — |
| | 1,880 |
| | (80 | ) | | 7/28/2014 | | 2000 | | Pittsburgh | | PA | | — |
| | 1,490 |
| | 390 |
| | — |
| | 1,880 |
| | (146 | ) | | 7/28/2014 | | 2000 |
| Sonic Drive-In | | Wadesboro | | NC | | — |
| | 137 |
| | 266 |
| | — |
| | 403 |
| | (52 | ) | | 6/27/2013 | | 2007 | | Wadesboro | | NC | | — |
| | 137 |
| | 266 |
| | — |
| | 403 |
| | (79 | ) | | 6/27/2013 | | 2007 |
| Sonny's Real Pit BBQ | | Venice | | FL | | — |
| | 338 |
| | 507 |
| | — |
| | 845 |
| | (104 | ) | | 7/31/2013 | | 1978 | | Venice | | FL | | — |
| | 338 |
| | 507 |
| | — |
| | 845 |
| | (158 | ) | | 7/31/2013 | | 1978 |
| Sonny's Real Pit BBQ | | Athens | | GA | | — |
| | 460 |
| | 1,280 |
| | — |
| | 1,740 |
| | (254 | ) | | 6/27/2013 | | 1995 | | Athens | | GA | | — |
| | 460 |
| | 1,280 |
| | — |
| | 1,740 |
| | (385 | ) | | 6/27/2013 | | 1995 |
| Sonny's Real Pit BBQ | | Conyers | | GA | | — |
| | 450 |
| | 663 |
| | — |
| | 1,113 |
| | (131 | ) | | 6/27/2013 | | 1995 | | Conyers | | GA | | — |
| | 450 |
| | 663 |
| | — |
| | 1,113 |
| | (200 | ) | | 6/27/2013 | | 1995 |
| Sonny's Real Pit BBQ | | Marietta | | GA | | — |
| | 290 |
| | 1,772 |
| | — |
| | 2,062 |
| | (351 | ) | | 6/27/2013 | | 1995 | | Marietta | | GA | | — |
| | 290 |
| | 1,772 |
| | 400 |
| | 2,462 |
| | (546 | ) | | 6/27/2013 | | 1995 |
| Southern Kitchen | | | Prattville | | AL | | — |
| | 1,038 |
| | 1,802 |
| | (1,871 | ) | | 969 |
| | (125 | ) | | 2/7/2014 | | 1997 |
| Sovereign Bank | | Linden | | NJ | | — |
| | 601 |
| | 2,329 |
| | — |
| | 2,930 |
| | (386 | ) | | 1/8/2014 | | 1945 | | Linden | | NJ | | — |
| | 601 |
| | 2,329 |
| | — |
| | 2,930 |
| | (646 | ) | | 1/8/2014 | | 1945 |
| Sovereign Bank | | Kennett Square | | PA | | — |
| | 837 |
| | 2,412 |
| | — |
| | 3,249 |
| | (401 | ) | | 1/8/2014 | | 1963 | | Kennett Square | | PA | | — |
| | 837 |
| | 2,412 |
| | — |
| | 3,249 |
| | (672 | ) | | 1/8/2014 | | 1963 |
| Spaghetti Warehouse | | Marietta | | GA | | — |
| | 800 |
| | 276 |
| | — |
| | 1,076 |
| | (55 | ) | | 6/27/2013 | | 1995 | | Arlington | | TX | | — |
| | 630 |
| | 1,400 |
| | — |
| | 2,030 |
| | (421 | ) | | 6/27/2013 | | 1995 |
| Spaghetti Warehouse | | Aurora | | IL | | — |
| | 480 |
| | 805 |
| | — |
| | 1,285 |
| | (160 | ) | | 6/27/2013 | | 1995 | | Dallas | | TX | | — |
| | 810 |
| | 1,656 |
| | — |
| | 2,466 |
| | (499 | ) | | 6/27/2013 | | 1995 |
| Spaghetti Warehouse | | Elk Grove Village | | IL | | — |
| | 550 |
| | 299 |
| | — |
| | 849 |
| | (59 | ) | | 6/27/2013 | | 1995 | | San Antonio | | TX | | — |
| | 1,140 |
| | 1,434 |
| | (1,063 | ) | | 1,511 |
| | (96 | ) | | 6/27/2013 | | 1995 |
| Sprouts | | | Centennial | | CO | | — |
| | 1,581 |
| | 6,394 |
| | — |
| | 7,975 |
| | (1,771 | ) | | 2/7/2014 | | 2009 |
| St. Luke's Urgent Care | | | Creve Coeur | | MO | | — |
| | 1,644 |
| | 4,497 |
| | — |
| | 6,141 |
| | (1,286 | ) | | 2/7/2014 | | 2010 |
| Staples | | | Pensacola | | FL | | — |
| | 1,539 |
| | 3,354 |
| | — |
| | 4,893 |
| | (752 | ) | | 2/7/2014 | | 2010 |
| Staples | | | Helena | | MT | | — |
| | 1,159 |
| | 2,452 |
| | — |
| | 3,611 |
| | (585 | ) | | 2/7/2014 | | 2012 |
| | | | | | Initial Costs (1) | | Costs Capitalized Subsequent to Acquisition (2) | | Gross Amount
Carried at
December 31, 2016
(3) (4) | | | | | | Initial Costs (1) | | Costs Capitalized Subsequent to Acquisition (2) | | Gross Amount
Carried at
December 31, 2018
(3) (4) | | | |
| Property | | City | | State | | Encumbrances at
December 31, 2016 | | Land | | Buildings, Fixtures and Improvements | | Accumulated Depreciation
(3) (5) | | Date Acquired | | Date of Construction | | City | | State | | Encumbrances at
December 31, 2018 | | Land | | Buildings, Fixtures and Improvements | | Accumulated Depreciation
(3) (5) | | Date Acquired | | Date of Construction |
| Spaghetti Warehouse | | Oklahoma City | | OK | | — |
| | 570 |
| | 1,193 |
| | — |
| | 1,763 |
| | (237 | ) | | 6/27/2013 | | 1995 | |
| Spaghetti Warehouse | | Tulsa | | OK | | — |
| | 530 |
| | 1,174 |
| | — |
| | 1,704 |
| | (233 | ) | | 6/27/2013 | | 1995 | |
| Spaghetti Warehouse | | Memphis | | TN | | — |
| | 100 |
| | 283 |
| | (383 | ) | | — |
| | — |
| | 6/27/2013 | | 1995 | |
| Spaghetti Warehouse | | Arlington | | TX | | — |
| | 630 |
| | 1,400 |
| | — |
| | 2,030 |
| | (278 | ) | | 6/27/2013 | | 1995 | |
| Spaghetti Warehouse | | Dallas | | TX | | — |
| | 810 |
| | 1,656 |
| | — |
| | 2,466 |
| | (328 | ) | | 6/27/2013 | | 1995 | |
| Spaghetti Warehouse | | Houston | | TX | | — |
| | 980 |
| | 2,284 |
| | (1,575 | ) | | 1,689 |
| | — |
| | 6/27/2013 | | 1995 | |
| Spaghetti Warehouse | | Plano | | TX | | — |
| | 540 |
| | 1,060 |
| | — |
| | 1,600 |
| | (210 | ) | | 6/27/2013 | | 1995 | |
| Spaghetti Warehouse | | San Antonio | | TX | | — |
| | 1,140 |
| | 1,434 |
| | (1,063 | ) | | 1,511 |
| | — |
| | 6/27/2013 | | 1995 | |
| Sprouts | | Centennial | | CO | | — |
| | 1,581 |
| | 6,394 |
| | — |
| | 7,975 |
| | (1,044 | ) | | 2/7/2014 | | 2009 | |
| St. Luke's Urgent Care | | Creve Coeur | | MO | | — |
| | 1,644 |
| | 4,497 |
| | — |
| | 6,141 |
| | (758 | ) | | 2/7/2014 | | 2010 | |
| Staples | | Pensacola | | FL | | — |
| | 1,539 |
| | 3,354 |
| | — |
| | 4,893 |
| | (444 | ) | | 2/7/2014 | | 2010 | | Houston | | TX | | 1,815 |
| | 1,169 |
| | 3,192 |
| | — |
| | 4,361 |
| | (719 | ) | | 2/7/2014 | | 2008 |
| Staples | | Helena | | MT | | — |
| | 1,159 |
| | 2,452 |
| | — |
| | 3,611 |
| | (345 | ) | | 2/7/2014 | | 2012 | |
| Staples | | Houston | | TX | | 1,815 |
| | 1,169 |
| | 3,192 |
| | — |
| | 4,361 |
| | (425 | ) | | 2/7/2014 | | 2008 | |
| Starbucks | | | Las Vegas | | NV | | — |
| | 680 |
| | 1,533 |
| | 150 |
| | 2,363 |
| | (456 | ) | | 6/27/2013 | | 1995 |
| State of Colorado | | | Longmont | | CO | | — |
| | 1,150 |
| | 9,067 |
| | 4,341 |
| | 14,558 |
| | (3,594 | ) | | 1/8/2014 | | 1988 |
| Steak 'n Shake | | Tampa | | FL | | — |
| | 951 |
| | — |
| | 785 |
| | 1,736 |
| | (4 | ) | | 7/31/2013 | | 1999 | | Tampa | | FL | | — |
| | 951 |
| | — |
| | 785 |
| | 1,736 |
| | (73 | ) | | 7/31/2013 | | 1999 |
| Stearns Crossing | | Bartlett | | IL | | 7,060 |
| | 4,437 |
| | 5,970 |
| | 154 |
| | 10,561 |
| | (1,146 | ) | | 2/7/2014 | | 1999 | | Bartlett | | IL | | 7,060 |
| | 4,437 |
| | 5,970 |
| | 681 |
| | 11,088 |
| | (1,889 | ) | | 2/7/2014 | | 1999 |
| Stop & Shop | | Levittown | | PA | | — |
| | 4,716 |
| | 9,955 |
| | — |
| | 14,671 |
| | (1,553 | ) | | 11/5/2013 | | 1995 | |
| Stop & Shop | | Cranston | | RI | | — |
| | 4,309 |
| | — |
| | — |
| | 4,309 |
| | — |
| | 2/7/2014 | | 2011 | | Cranston | | RI | | — |
| | 4,309 |
| | — |
| | — |
| | 4,309 |
| | — |
| | 2/7/2014 | | 2011 |
| Stripes | | Portales | | NM | | — |
| | 306 |
| | 2,595 |
| | — |
| | 2,901 |
| | (452 | ) | | 2/7/2014 | | 2010 | | Portales | | NM | | — |
| | 306 |
| | 2,595 |
| | — |
| | 2,901 |
| | (767 | ) | | 2/7/2014 | | 2010 |
| Stripes | | Andrews | | TX | | — |
| | 406 |
| | 2,302 |
| | — |
| | 2,708 |
| | (501 | ) | | 2/15/2013 | | 2008 | | Andrews | | TX | | — |
| | 406 |
| | 2,302 |
| | — |
| | 2,708 |
| | (703 | ) | | 2/15/2013 | | 2008 |
| Stripes | | Brady | | TX | | — |
| | 203 |
| | 3,205 |
| | — |
| | 3,408 |
| | (513 | ) | | 2/7/2014 | | 2007 | | Brady | | TX | | — |
| | 203 |
| | 3,205 |
| | — |
| | 3,408 |
| | (870 | ) | | 2/7/2014 | | 2007 |
| Stripes | | Brownsville | | TX | | — |
| | 613 |
| | 3,195 |
| | — |
| | 3,808 |
| | (524 | ) | | 2/7/2014 | | 2007 | | Brownsville | | TX | | — |
| | 613 |
| | 3,195 |
| | — |
| | 3,808 |
| | (889 | ) | | 2/7/2014 | | 2007 |
| Stripes | | Carrizo Springs | | TX | | — |
| | 496 |
| | 2,526 |
| | — |
| | 3,022 |
| | (453 | ) | | 2/7/2014 | | 2010 | | Carrizo Springs | | TX | | — |
| | 496 |
| | 2,526 |
| | — |
| | 3,022 |
| | (767 | ) | | 2/7/2014 | | 2010 |
| Stripes | | Corpus Christi | | TX | | — |
| | 681 |
| | 2,047 |
| | — |
| | 2,728 |
| | (342 | ) | | 2/7/2014 | | 2007 | | Corpus Christi | | TX | | — |
| | 681 |
| | 2,047 |
| | — |
| | 2,728 |
| | (580 | ) | | 2/7/2014 | | 2007 |
| Stripes | | Corpus Christi | | TX | | — |
| | 1,011 |
| | 3,125 |
| | — |
| | 4,136 |
| | (516 | ) | | 2/7/2014 | | 2007 | | Corpus Christi | | TX | | — |
| | 1,011 |
| | 3,125 |
| | — |
| | 4,136 |
| | (875 | ) | | 2/7/2014 | | 2007 |
| Stripes | | Corpus Christi | | TX | | — |
| | 803 |
| | 3,109 |
| | — |
| | 3,912 |
| | (514 | ) | | 2/7/2014 | | 2007 | | Corpus Christi | | TX | | — |
| | 803 |
| | 3,109 |
| | — |
| | 3,912 |
| | (872 | ) | | 2/7/2014 | | 2007 |
| Stripes | | Eagle Pass | | TX | | — |
| | 762 |
| | 2,453 |
| | — |
| | 3,215 |
| | (412 | ) | | 2/7/2014 | | 2009 | | Eagle Pass | | TX | | — |
| | 762 |
| | 2,453 |
| | — |
| | 3,215 |
| | (698 | ) | | 2/7/2014 | | 2009 |
| Stripes | | Edinburg | | TX | | — |
| | 1,286 |
| | 1,546 |
| | — |
| | 2,832 |
| | (262 | ) | | 2/7/2014 | | 1999 | | Edinburg | | TX | | — |
| | 1,286 |
| | 1,546 |
| | — |
| | 2,832 |
| | (443 | ) | | 2/7/2014 | | 1999 |
| Stripes | | Edinburg | | TX | | — |
| | 488 |
| | 2,499 |
| | — |
| | 2,987 |
| | (444 | ) | | 2/7/2014 | | 2007 | | Edinburg | | TX | | — |
| | 488 |
| | 2,499 |
| | — |
| | 2,987 |
| | (752 | ) | | 2/7/2014 | | 2007 |
| Stripes | | Edinburg | | TX | | — |
| | 450 |
| | 2,818 |
| | — |
| | 3,268 |
| | (419 | ) | | 2/7/2014 | | 2007 | | Edinburg | | TX | | — |
| | 450 |
| | 2,818 |
| | — |
| | 3,268 |
| | (710 | ) | | 2/7/2014 | | 2007 |
| Stripes | | Fort Stockton | | TX | | — |
| | 1,237 |
| | 3,812 |
| | — |
| | 5,049 |
| | (736 | ) | | 2/7/2014 | | 2010 | | Fort Stockton | | TX | | — |
| | 1,237 |
| | 3,812 |
| | — |
| | 5,049 |
| | (1,248 | ) | | 2/7/2014 | | 2010 |
| Stripes | | Haskell | | TX | | — |
| | 143 |
| | 2,554 |
| | — |
| | 2,697 |
| | (442 | ) | | 2/7/2014 | | 2010 | | Haskell | | TX | | — |
| | 143 |
| | 2,554 |
| | — |
| | 2,697 |
| | (750 | ) | | 2/7/2014 | | 2010 |
| Stripes | | Houston | | TX | | — |
| | 1,204 |
| | 2,069 |
| | — |
| | 3,273 |
| | (334 | ) | | 2/7/2014 | | 2007 | | Houston | | TX | | — |
| | 1,204 |
| | 2,069 |
| | — |
| | 3,273 |
| | (566 | ) | | 2/7/2014 | | 2007 |
| Stripes | | | Laredo | | TX | | — |
| | 581 |
| | 2,367 |
| | — |
| | 2,948 |
| | (708 | ) | | 2/7/2014 | | 2010 |
| Stripes | | | Laredo | | TX | | — |
| | 626 |
| | 2,338 |
| | — |
| | 2,964 |
| | (713 | ) | | 2/7/2014 | | 2010 |
| Stripes | | | Midland | | TX | | — |
| | 1,098 |
| | 4,857 |
| | — |
| | 5,955 |
| | (1,346 | ) | | 2/7/2014 | | 2006 |
| Stripes | | | Mission | | TX | | — |
| | 742 |
| | 550 |
| | — |
| | 1,292 |
| | (147 | ) | | 2/7/2014 | | 1986 |
| Stripes | | | Mission | | TX | | — |
| | 1,007 |
| | 3,178 |
| | (33 | ) | | 4,152 |
| | (830 | ) | | 2/7/2014 | | 2003 |
| Stripes | | | Odessa | | TX | | — |
| | 301 |
| | 2,895 |
| | — |
| | 3,196 |
| | (814 | ) | | 2/7/2014 | | 2011 |
| Stripes | | | Odessa | | TX | | — |
| | 803 |
| | 3,596 |
| | — |
| | 4,399 |
| | (1,453 | ) | | 2/7/2014 | | 1998 |
| Stripes | | | Ranchito | | TX | | — |
| | 498 |
| | 2,671 |
| | — |
| | 3,169 |
| | (739 | ) | | 2/7/2014 | | 2010 |
| Stripes | | | San Angelo | | TX | | — |
| | 772 |
| | 4,025 |
| | — |
| | 4,797 |
| | (1,119 | ) | | 2/7/2014 | | 1997 |
| Stripes | | | San Angelo | | TX | | — |
| | 1,006 |
| | 3,277 |
| | — |
| | 4,283 |
| | (916 | ) | | 2/7/2014 | | 2007 |
| Subway | | | Knoxville | | TN | | — |
| | 160 |
| | 349 |
| | — |
| | 509 |
| | (102 | ) | | 6/27/2013 | | 1995 |
| | | | | | Initial Costs (1) | | Costs Capitalized Subsequent to Acquisition (2) | | Gross Amount
Carried at
December 31, 2016
(3) (4) | | | | | | Initial Costs (1) | | Costs Capitalized Subsequent to Acquisition (2) | | Gross Amount
Carried at
December 31, 2018
(3) (4) | | | |
| Property | | City | | State | | Encumbrances at
December 31, 2016 | | Land | | Buildings, Fixtures and Improvements | | Accumulated Depreciation
(3) (5) | | Date Acquired | | Date of Construction | | City | | State | | Encumbrances at
December 31, 2018 | | Land | | Buildings, Fixtures and Improvements | | Accumulated Depreciation
(3) (5) | | Date Acquired | | Date of Construction |
| Stripes | | La Feria | | TX | | — |
| | 219 |
| | 1,970 |
| | — |
| | 2,189 |
| | (429 | ) | | 2/15/2013 | | 2008 | |
| Stripes | | Laredo | | TX | | — |
| | 581 |
| | 2,367 |
| | — |
| | 2,948 |
| | (418 | ) | | 2/7/2014 | | 2010 | |
| Stripes | | Laredo | | TX | | — |
| | 626 |
| | 2,338 |
| | — |
| | 2,964 |
| | (420 | ) | | 2/7/2014 | | 2010 | |
| Stripes | | Midland | | TX | | — |
| | 1,098 |
| | 4,857 |
| | — |
| | 5,955 |
| | (794 | ) | | 2/7/2014 | | 2006 | |
| Stripes | | Mission | | TX | | — |
| | 742 |
| | 550 |
| | — |
| | 1,292 |
| | (87 | ) | | 2/7/2014 | | 1986 | |
| Stripes | | Mission | | TX | | — |
| | 1,007 |
| | 3,178 |
| | — |
| | 4,185 |
| | (490 | ) | | 2/7/2014 | | 2003 | |
| Stripes | | Odessa | | TX | | — |
| | 301 |
| | 2,895 |
| | — |
| | 3,196 |
| | (480 | ) | | 2/7/2014 | | 2011 | |
| Stripes | | Odessa | | TX | | — |
| | 803 |
| | 3,596 |
| | — |
| | 4,399 |
| | (857 | ) | | 2/7/2014 | | 1998 | |
| Stripes | | Pharr | | TX | | — |
| | 281 |
| | 2,531 |
| | — |
| | 2,812 |
| | (551 | ) | | 2/15/2013 | | 1995 | |
| Stripes | | Ranchito | | TX | | — |
| | 498 |
| | 2,671 |
| | — |
| | 3,169 |
| | (436 | ) | | 2/7/2014 | | 2010 | |
| Stripes | | Rio Hondo | | TX | | — |
| | 293 |
| | 2,640 |
| | — |
| | 2,933 |
| | (575 | ) | | 2/15/2013 | | 2008 | |
| Stripes | | San Angelo | | TX | | — |
| | 772 |
| | 4,025 |
| | — |
| | 4,797 |
| | (660 | ) | | 2/7/2014 | | 1997 | |
| Stripes | | San Angelo | | TX | | — |
| | 1,006 |
| | 3,277 |
| | — |
| | 4,283 |
| | (540 | ) | | 2/7/2014 | | 2007 | |
| Subway | | Knoxville | | TN | | — |
| | 160 |
| | 349 |
| | — |
| | 509 |
| | (67 | ) | | 6/27/2013 | | 1995 | |
| Sun Trust Bank | | Coral Springs | | FL | | — |
| | 654 |
| | 1,525 |
| | — |
| | 2,179 |
| | (303 | ) | | 4/12/2013 | | 1996 | | Coral Springs | | FL | | — |
| | 654 |
| | 1,525 |
| | — |
| | 2,179 |
| | (438 | ) | | 4/12/2013 | | 1996 |
| Sun Trust Bank | | Destin | | FL | | — |
| | 572 |
| | 1,717 |
| | — |
| | 2,289 |
| | (341 | ) | | 4/12/2013 | | 1998 | | Destin | | FL | | — |
| | 572 |
| | 1,717 |
| | — |
| | 2,289 |
| | (494 | ) | | 4/12/2013 | | 1998 |
| Sun Trust Bank | | Dunedin | | FL | | — |
| | 479 |
| | 1,917 |
| | — |
| | 2,396 |
| | (389 | ) | | 3/22/2013 | | 1995 | | Dunedin | | FL | | — |
| | 479 |
| | 1,917 |
| | — |
| | 2,396 |
| | (555 | ) | | 3/22/2013 | | 1995 |
| Sun Trust Bank | | Dunnellon | | FL | | — |
| | 82 |
| | 463 |
| | — |
| | 545 |
| | (94 | ) | | 3/22/2013 | | 1980 | | Dunnellon | | FL | | — |
| | 82 |
| | 463 |
| | — |
| | 545 |
| | (134 | ) | | 3/22/2013 | | 1980 |
| Sun Trust Bank | | Kissimmee | | FL | | — |
| | 1,167 |
| | 778 |
| | — |
| | 1,945 |
| | (155 | ) | | 4/12/2013 | | 1981 | | Lakeland | | FL | | — |
| | 598 |
| | 1,110 |
| | — |
| | 1,708 |
| | (319 | ) | | 4/12/2013 | | 1988 |
| Sun Trust Bank | | Lake Wales | | FL | | — |
| | 671 |
| | 671 |
| | — |
| | 1,342 |
| | (136 | ) | | 3/22/2013 | | 1988 | | North Port | | FL | | — |
| | 460 |
| | 1,381 |
| | — |
| | 1,841 |
| | (400 | ) | | 3/22/2013 | | 1982 |
| Sun Trust Bank | | Lakeland | | FL | | — |
| | 598 |
| | 1,110 |
| | — |
| | 1,708 |
| | (221 | ) | | 4/12/2013 | | 1988 | | Palm Harbor | | FL | | — |
| | 535 |
| | 1,249 |
| | — |
| | 1,784 |
| | (359 | ) | | 4/12/2013 | | 1994 |
| Sun Trust Bank | | Melbourne | | FL | | — |
| | 464 |
| | 1,392 |
| | — |
| | 1,856 |
| | (277 | ) | | 4/12/2013 | | 1987 | | Plant City | | FL | | — |
| | 751 |
| | 1,753 |
| | — |
| | 2,504 |
| | (508 | ) | | 3/22/2013 | | 2000 |
| Sun Trust Bank | | North Port | | FL | | — |
| | 460 |
| | 1,381 |
| | — |
| | 1,841 |
| | (281 | ) | | 3/22/2013 | | 1982 | | Port Orange | | FL | | — |
| | 590 |
| | 1,095 |
| | — |
| | 1,685 |
| | (317 | ) | | 3/22/2013 | | 1989 |
| Sun Trust Bank | | Palm Harbor | | FL | | — |
| | 535 |
| | 1,249 |
| | — |
| | 1,784 |
| | (248 | ) | | 4/12/2013 | | 1994 | | Port Orange | | FL | | — |
| | 563 |
| | 1,314 |
| | — |
| | 1,877 |
| | (381 | ) | | 3/22/2013 | | 1982 |
| Sun Trust Bank | | Plant City | | FL | | — |
| | 751 |
| | 1,753 |
| | — |
| | 2,504 |
| | (356 | ) | | 3/22/2013 | | 2000 | | S. Daytona Beach | | FL | | — |
| | 592 |
| | 1,099 |
| | — |
| | 1,691 |
| | (316 | ) | | 4/12/2013 | | 1985 |
| Sun Trust Bank | | Port Orange | | FL | | — |
| | 590 |
| | 1,095 |
| | — |
| | 1,685 |
| | (222 | ) | | 3/22/2013 | | 1989 | | West Palm Beach | | FL | | — |
| | 1,026 |
| | 1,026 |
| | — |
| | 2,052 |
| | (297 | ) | | 3/22/2013 | | 1981 |
| Sun Trust Bank | | Port Orange | | FL | | — |
| | 563 |
| | 1,314 |
| | — |
| | 1,877 |
| | (267 | ) | | 3/22/2013 | | 1982 | | Atlanta | | GA | | — |
| | 1,018 |
| | 1,527 |
| | — |
| | 2,545 |
| | (439 | ) | | 4/12/2013 | | 1965 |
| Sun Trust Bank | | S. Daytona Beach | | FL | | — |
| | 592 |
| | 1,099 |
| | — |
| | 1,691 |
| | (218 | ) | | 4/12/2013 | | 1985 | | Atlanta | | GA | | — |
| | 1,435 |
| | 478 |
| | — |
| | 1,913 |
| | (138 | ) | | 4/12/2013 | | 1970 |
| Sun Trust Bank | | Tallahassee | | FL | | — |
| | 828 |
| | 1,933 |
| | — |
| | 2,761 |
| | (384 | ) | | 4/12/2013 | | 1991 | | Dunwoody | | GA | | — |
| | 1,784 |
| | 1,460 |
| | — |
| | 3,244 |
| | (423 | ) | | 3/22/2013 | | 1972 |
| Sun Trust Bank | | West Palm Beach | | FL | | — |
| | 1,026 |
| | 1,026 |
| | — |
| | 2,052 |
| | (208 | ) | | 3/22/2013 | | 1981 | | Jesup | | GA | | — |
| | 184 |
| | 1,657 |
| | — |
| | 1,841 |
| | (480 | ) | | 3/22/2013 | | 1964 |
| Sun Trust Bank | | Atlanta | | GA | | — |
| | 1,018 |
| | 1,527 |
| | — |
| | 2,545 |
| | (303 | ) | | 4/12/2013 | | 1965 | | St. Simons Island | | GA | | — |
| | 1,363 |
| | 734 |
| | — |
| | 2,097 |
| | (213 | ) | | 3/22/2013 | | 1975 |
| Sun Trust Bank | | Atlanta | | GA | | — |
| | 1,435 |
| | 478 |
| | — |
| | 1,913 |
| | (95 | ) | | 4/12/2013 | | 1970 | | Annapolis | | MD | | — |
| | 2,653 |
| | 2,170 |
| | — |
| | 4,823 |
| | (609 | ) | | 7/23/2013 | | 1976 |
| Sun Trust Bank | | | Ellicott City | | MD | | — |
| | 1,728 |
| | 931 |
| | — |
| | 2,659 |
| | (270 | ) | | 3/22/2013 | | 1975 |
| Sun Trust Bank | | | Frederick | | MD | | — |
| | 991 |
| | 991 |
| | — |
| | 1,982 |
| | (285 | ) | | 4/26/2013 | | 1880 |
| Sun Trust Bank | | | Waldorf | | MD | | — |
| | 523 |
| | 2,962 |
| | — |
| | 3,485 |
| | (858 | ) | | 3/22/2013 | | 1964 |
| Sun Trust Bank | | | Belmont | | NC | | — |
| | 616 |
| | 924 |
| | — |
| | 1,540 |
| | (268 | ) | | 3/22/2013 | | 1970 |
| Sun Trust Bank | | | Carrboro | | NC | | — |
| | 512 |
| | 512 |
| | — |
| | 1,024 |
| | (147 | ) | | 4/12/2013 | | 1980 |
| Sun Trust Bank | | | Concord | | NC | | — |
| | 707 |
| | 707 |
| | — |
| | 1,414 |
| | (203 | ) | | 4/12/2013 | | 1988 |
| Sun Trust Bank | | | Durham | | NC | | — |
| | 747 |
| | 1,388 |
| | — |
| | 2,135 |
| | (399 | ) | | 4/12/2013 | | 1973 |
| Sun Trust Bank | | | Greensboro | | NC | | — |
| | 403 |
| | 748 |
| | — |
| | 1,151 |
| | (215 | ) | | 4/12/2013 | | 1962 |
| Sun Trust Bank | | | Lexington | | NC | | — |
| | 447 |
| | 831 |
| | — |
| | 1,278 |
| | (239 | ) | | 4/12/2013 | | 2001 |
| Sun Trust Bank | | | Matthews | | NC | | — |
| | 382 |
| | 382 |
| | — |
| | 764 |
| | (111 | ) | | 3/22/2013 | | 1971 |
| Sun Trust Bank | | | Mocksville | | NC | | — |
| | 978 |
| | 2,933 |
| | — |
| | 3,911 |
| | (850 | ) | | 3/22/2013 | | 2000 |
| Sun Trust Bank | | | Raleigh | | NC | | — |
| | 658 |
| | 658 |
| | — |
| | 1,316 |
| | (191 | ) | | 3/22/2013 | | 1977 |
| Sun Trust Bank | | | Chattanooga | | TN | | — |
| | 223 |
| | 1,263 |
| | — |
| | 1,486 |
| | (366 | ) | | 3/22/2013 | | 1953 |
| Sun Trust Bank | | | Madison | | TN | | — |
| | 286 |
| | 1,143 |
| | — |
| | 1,429 |
| | (331 | ) | | 3/22/2013 | | 1953 |
| | | | | | Initial Costs (1) | | Costs Capitalized Subsequent to Acquisition (2) | | Gross Amount
Carried at
December 31, 2016
(3) (4) | | | | | | Initial Costs (1) | | Costs Capitalized Subsequent to Acquisition (2) | | Gross Amount
Carried at
December 31, 2018
(3) (4) | | | |
| Property | | City | | State | | Encumbrances at
December 31, 2016 | | Land | | Buildings, Fixtures and Improvements | | Accumulated Depreciation
(3) (5) | | Date Acquired | | Date of Construction | | City | | State | | Encumbrances at
December 31, 2018 | | Land | | Buildings, Fixtures and Improvements | | Accumulated Depreciation
(3) (5) | | Date Acquired | | Date of Construction |
| Sun Trust Bank | | Bowdon | | GA | | — |
| | 416 |
| | 1,247 |
| | (1,395 | ) | | 268 |
| | — |
| | 3/22/2013 | | 1900 | | Nashville | | TN | | — |
| | 567 |
| | 305 |
| | — |
| | 872 |
| | (86 | ) | | 7/23/2013 | | 1954 |
| Sun Trust Bank | | Dunwoody | | GA | | — |
| | 1,784 |
| | 1,460 |
| | — |
| | 3,244 |
| | (297 | ) | | 3/22/2013 | | 1972 | | Nashville | | TN | | — |
| | 1,598 |
| | 1,308 |
| | — |
| | 2,906 |
| | (376 | ) | | 4/12/2013 | | 1992 |
| Sun Trust Bank | | Jesup | | GA | | — |
| | 184 |
| | 1,657 |
| | — |
| | 1,841 |
| | (337 | ) | | 3/22/2013 | | 1964 | | Nashville | | TN | | — |
| | 613 |
| | 613 |
| | — |
| | 1,226 |
| | (176 | ) | | 4/12/2013 | | 1970 |
| Sun Trust Bank | | St. Simons Island | | GA | | — |
| | 1,363 |
| | 734 |
| | — |
| | 2,097 |
| | (149 | ) | | 3/22/2013 | | 1975 | | Cheriton | | VA | | — |
| | 90 |
| | 510 |
| | — |
| | 600 |
| | (148 | ) | | 3/22/2013 | | 1975 |
| Sun Trust Bank | | Annapolis | | MD | | — |
| | 2,653 |
| | 2,170 |
| | — |
| | 4,823 |
| | (402 | ) | | 7/23/2013 | | 1976 | |
| Sun Trust Bank | | Ellicott City | | MD | | — |
| | 1,728 |
| | 931 |
| | — |
| | 2,659 |
| | (189 | ) | | 3/22/2013 | | 1975 | |
| Sun Trust Bank | | Frederick | | MD | | — |
| | 991 |
| | 991 |
| | — |
| | 1,982 |
| | (197 | ) | | 4/26/2013 | | 1880 | |
| Sun Trust Bank | | Waldorf | | MD | | — |
| | 523 |
| | 2,962 |
| | — |
| | 3,485 |
| | (602 | ) | | 3/22/2013 | | 1964 | |
| Sun Trust Bank | | Belmont | | NC | | — |
| | 616 |
| | 924 |
| | — |
| | 1,540 |
| | (188 | ) | | 3/22/2013 | | 1970 | |
| Sun Trust Bank | | Burlington | | NC | | — |
| | 446 |
| | 545 |
| | (403 | ) | | 588 |
| | — |
| | 4/12/2013 | | 1995 | |
| Sun Trust Bank | | Carrboro | | NC | | — |
| | 512 |
| | 512 |
| | — |
| | 1,024 |
| | (102 | ) | | 4/12/2013 | | 1980 | |
| Sun Trust Bank | | Concord | | NC | | — |
| | 707 |
| | 707 |
| | — |
| | 1,414 |
| | (141 | ) | | 4/12/2013 | | 1988 | |
| Sun Trust Bank | | Durham | | NC | | — |
| | 747 |
| | 1,388 |
| | — |
| | 2,135 |
| | (276 | ) | | 4/12/2013 | | 1973 | |
| Sun Trust Bank | | Greensboro | | NC | | — |
| | 403 |
| | 748 |
| | — |
| | 1,151 |
| | (149 | ) | | 4/12/2013 | | 1962 | |
| Sun Trust Bank | | Lexington | | NC | | — |
| | 447 |
| | 831 |
| | — |
| | 1,278 |
| | (165 | ) | | 4/12/2013 | | 2001 | |
| Sun Trust Bank | | Matthews | | NC | | — |
| | 382 |
| | 382 |
| | — |
| | 764 |
| | (78 | ) | | 3/22/2013 | | 1971 | |
| Sun Trust Bank | | Mocksville | | NC | | — |
| | 978 |
| | 2,933 |
| | — |
| | 3,911 |
| | (596 | ) | | 3/22/2013 | | 2000 | |
| Sun Trust Bank | | Monroe | | NC | | — |
| | 204 |
| | 1,837 |
| | (1,319 | ) | | 722 |
| | (19 | ) | | 4/12/2013 | | 1920 | |
| Sun Trust Bank | | Oakboro | | NC | | — |
| | 360 |
| | 540 |
| | (483 | ) | | 417 |
| | — |
| | 7/23/2013 | | 1970 | |
| Sun Trust Bank | | Raleigh | | NC | | — |
| | 658 |
| | 658 |
| | — |
| | 1,316 |
| | (134 | ) | | 3/22/2013 | | 1977 | |
| Sun Trust Bank | | Yadkinville | | NC | | — |
| | 200 |
| | 371 |
| | (368 | ) | | 203 |
| | (2 | ) | | 4/12/2013 | | 1975 | |
| Sun Trust Bank | | Zebulon | | NC | | — |
| | 515 |
| | 630 |
| | (546 | ) | | 599 |
| | — |
| | 3/22/2013 | | 1972 | |
| Sun Trust Bank | | Anderson | | SC | | — |
| | 574 |
| | 1,065 |
| | (1,018 | ) | | 621 |
| | (5 | ) | | 3/22/2013 | | 1998 | |
| Sun Trust Bank | | Belton | | SC | | — |
| | 473 |
| | 578 |
| | (943 | ) | | 108 |
| | — |
| | 4/12/2013 | | 1967 | |
| Sun Trust Bank | | Travelers Rest | | SC | | — |
| | 746 |
| | 746 |
| | (866 | ) | | 626 |
| | (4 | ) | | 4/12/2013 | | 1995 | |
| Sun Trust Bank | | Chattanooga | | TN | | — |
| | 223 |
| | 1,263 |
| | — |
| | 1,486 |
| | (257 | ) | | 3/22/2013 | | 1953 | |
| Sun Trust Bank | | La Vergne | | TN | | — |
| | 171 |
| | 209 |
| | — |
| | 380 |
| | (42 | ) | | 3/22/2013 | | 1985 | |
| Sun Trust Bank | | Madison | | TN | | — |
| | 286 |
| | 1,143 |
| | — |
| | 1,429 |
| | (232 | ) | | 3/22/2013 | | 1953 | |
| Sun Trust Bank | | Nashville | | TN | | — |
| | 567 |
| | 305 |
| | — |
| | 872 |
| | (57 | ) | | 7/23/2013 | | 1954 | |
| Sun Trust Bank | | Nashville | | TN | | — |
| | 1,598 |
| | 1,308 |
| | — |
| | 2,906 |
| | (260 | ) | | 4/12/2013 | | 1992 | |
| Sun Trust Bank | | Nashville | | TN | | — |
| | 613 |
| | 613 |
| | — |
| | 1,226 |
| | (122 | ) | | 4/12/2013 | | 1970 | |
| Sun Trust Bank | | Cheriton | | VA | | — |
| | 90 |
| | 510 |
| | — |
| | 600 |
| | (104 | ) | | 3/22/2013 | | 1975 | |
| | | | | | Initial Costs (1) | | Costs Capitalized Subsequent to Acquisition (2) | | Gross Amount
Carried at
December 31, 2016
(3) (4) | | | | | | Initial Costs (1) | | Costs Capitalized Subsequent to Acquisition (2) | | Gross Amount
Carried at
December 31, 2018
(3) (4) | | | |
| Property | | City | | State | | Encumbrances at
December 31, 2016 | | Land | | Buildings, Fixtures and Improvements | | Accumulated Depreciation
(3) (5) | | Date Acquired | | Date of Construction | | City | | State | | Encumbrances at
December 31, 2018 | | Land | | Buildings, Fixtures and Improvements | | Accumulated Depreciation
(3) (5) | | Date Acquired | | Date of Construction |
| Sun Trust Bank | | Lynchburg | | VA | | — |
| | 251 |
| | 466 |
| | — |
| | 717 |
| | (95 | ) | | 3/22/2013 | | 1973 | | Lynchburg | | VA | | — |
| | 251 |
| | 466 |
| | — |
| | 717 |
| | (135 | ) | | 3/22/2013 | | 1973 |
| Sun Trust Bank | | Norfolk | | VA | | — |
| | 656 |
| | 437 |
| | — |
| | 1,093 |
| | (87 | ) | | 4/12/2013 | | 1990 | | Petersburg | | VA | | — |
| | 102 |
| | 306 |
| | — |
| | 408 |
| | (88 | ) | | 4/12/2013 | | 1975 |
| Sun Trust Bank | | Petersburg | | VA | | — |
| | 102 |
| | 306 |
| | — |
| | 408 |
| | (61 | ) | | 4/12/2013 | | 1975 | | Richmond | | VA | | — |
| | 277 |
| | 416 |
| | — |
| | 693 |
| | (120 | ) | | 3/22/2013 | | 1959 |
| Sun Trust Bank | | Richmond | | VA | | — |
| | 277 |
| | 416 |
| | — |
| | 693 |
| | (84 | ) | | 3/22/2013 | | 1959 | | Richmond | | VA | | — |
| | 224 |
| | 2,012 |
| | — |
| | 2,236 |
| | (578 | ) | | 4/12/2013 | | 1909 |
| Sun Trust Bank | | Richmond | | VA | | — |
| | 224 |
| | 2,012 |
| | — |
| | 2,236 |
| | (400 | ) | | 4/12/2013 | | 1909 | | Rocky Mount | | VA | | — |
| | 265 |
| | 1,504 |
| | — |
| | 1,769 |
| | (429 | ) | | 5/22/2013 | | 1961 |
| Sun Trust Bank | | Rocky Mount | | VA | | — |
| | 265 |
| | 1,504 |
| | — |
| | 1,769 |
| | (292 | ) | | 5/22/2013 | | 1961 | |
| Sunbelt Rental | | Mabelvale | | AR | | — |
| | 240 |
| | 894 |
| | — |
| | 1,134 |
| | (115 | ) | | 6/4/2014 | | 2006 | |
| Sunbelt Rental | | Memphis | | TN | | — |
| | 365 |
| | 929 |
| | 128 |
| | 1,422 |
| | (120 | ) | | 9/26/2014 | | 1995 | |
| Sunbelt Rentals | | | Mabelvale | | AR | | — |
| | 240 |
| | 894 |
| | — |
| | 1,134 |
| | (205 | ) | | 6/4/2014 | | 2006 |
| Sunbelt Rentals | | | Memphis | | TN | | — |
| | 365 |
| | 929 |
| | 128 |
| | 1,422 |
| | (226 | ) | | 9/26/2014 | | 1995 |
| Sunoco | | Merritt Island | | FL | | — |
| | 540 |
| | 2,162 |
| | — |
| | 2,702 |
| | (256 | ) | | 5/19/2014 | | 2009 | | Merritt Island | | FL | | — |
| | 540 |
| | 2,162 |
| | — |
| | 2,702 |
| | (454 | ) | | 5/19/2014 | | 2009 |
| Sunset Valley Homestead | | Sunset Valley | | TX | | 17,124 |
| | 14,283 |
| | 28,351 |
| | 16 |
| | 42,650 |
| | (4,109 | ) | | 2/7/2014 | | 2007 | | Sunset Valley | | TX | | 16,650 |
| | 14,283 |
| | 28,351 |
| | 297 |
| | 42,931 |
| | (6,941 | ) | | 2/7/2014 | | 2007 |
| SuperAmerica | | | Foley | | MN | | — |
| | 72 |
| | 276 |
| | — |
| | 348 |
| | (18 | ) | | 3/27/2017 | | 1984 |
| SuperAmerica | | | Pequot Lakes | | MN | | — |
| | 158 |
| | 1,489 |
| | — |
| | 1,647 |
| | (96 | ) | | 3/27/2017 | | 1983 |
| SuperAmerica | | | Pierz | | MN | | — |
| | 67 |
| | 411 |
| | — |
| | 478 |
| | (25 | ) | | 3/27/2017 | | 1996 |
| SuperAmerica | | | Sartell | | MN | | — |
| | 718 |
| | 486 |
| | — |
| | 1,204 |
| | (28 | ) | | 3/27/2017 | | 2000 |
| SuperAmerica | | | Sauk Rapids | | MN | | — |
| | 419 |
| | 753 |
| | — |
| | 1,172 |
| | (46 | ) | | 3/27/2017 | | 1997 |
| SuperAmerica | | | St. Cloud | | MN | | — |
| | 582 |
| | 657 |
| | — |
| | 1,239 |
| | (42 | ) | | 3/27/2017 | | 1987 |
| SuperAmerica | | | St. Cloud | | MN | | — |
| | 104 |
| | 136 |
| | — |
| | 240 |
| | (8 | ) | | 3/27/2017 | | 1922 |
| SuperAmerica | | | St. Cloud | | MN | | — |
| | 126 |
| | 151 |
| | — |
| | 277 |
| | (10 | ) | | 3/27/2017 | | 1968 |
| SuperAmerica | | | St. Cloud | | MN | | — |
| | 330 |
| | 365 |
| | — |
| | 695 |
| | (23 | ) | | 3/27/2017 | | 1984 |
| SuperAmerica | | | St. Cloud | | MN | | — |
| | 361 |
| | 433 |
| | — |
| | 794 |
| | (28 | ) | | 3/27/2017 | | 1987 |
| SuperAmerica | | | Waite Park | | MN | | — |
| | 316 |
| | 333 |
| | — |
| | 649 |
| | (20 | ) | | 3/27/2017 | | 1999 |
| SuperAmerica | | | Waite Park | | MN | | — |
| | 770 |
| | 503 |
| | — |
| | 1,273 |
| | (31 | ) | | 3/27/2017 | | 1999 |
| Superior Energy Services | | Gainesville | | TX | | — |
| | 284 |
| | 10,475 |
| | (3 | ) | | 10,756 |
| | (3,826 | ) | | 7/24/2014 | | 1982 | | Gainesville | | TX | | — |
| | 284 |
| | 10,475 |
| | 3 |
| | 10,762 |
| | (6,935 | ) | | 7/24/2014 | | 1982 |
| Sweet Tomato | | Coral Springs | | FL | | — |
| | 790 |
| | 1,625 |
| | — |
| | 2,415 |
| | (322 | ) | | 6/27/2013 | | 1995 | | Coral Springs | | FL | | — |
| | 790 |
| | 1,625 |
| | — |
| | 2,415 |
| | (489 | ) | | 6/27/2013 | | 1995 |
| Synovus Bank | | Tampa | | FL | | — |
| | 985 |
| | 2,298 |
| | — |
| | 3,283 |
| | (498 | ) | | 12/31/2012 | | 1959 | | Tampa | | FL | | — |
| | 985 |
| | 2,298 |
| | — |
| | 3,283 |
| | (682 | ) | | 12/31/2012 | | 1959 |
| Sysmex | | Lincolnshire | | IL | | 22,500 |
| | 4,143 |
| | 36,987 |
| | — |
| | 41,130 |
| | (5,181 | ) | | 2/7/2014 | | 2010 | | Lincolnshire | | IL | | 22,500 |
| | 4,143 |
| | 36,987 |
| | 5 |
| | 41,135 |
| | (8,787 | ) | | 2/7/2014 | | 2010 |
| Taco Bell | | Albertville | | AL | | — |
| | 419 |
| | 778 |
| | — |
| | 1,197 |
| | (142 | ) | | 7/31/2013 | | 1995 | | Albertville | | AL | | — |
| | 419 |
| | 778 |
| | — |
| | 1,197 |
| | (218 | ) | | 7/31/2013 | | 1995 |
| Taco Bell | | Cullman | | AL | | — |
| | 375 |
| | 1,053 |
| | — |
| | 1,428 |
| | (207 | ) | | 6/27/2013 | | 1995 | | Cullman | | AL | | — |
| | 375 |
| | 1,053 |
| | — |
| | 1,428 |
| | (312 | ) | | 6/27/2013 | | 1995 |
| Taco Bell | | Daphne | | AL | | — |
| | 180 |
| | 1,278 |
| | — |
| | 1,458 |
| | (245 | ) | | 6/27/2013 | | 1995 | | Daphne | | AL | | — |
| | 180 |
| | 1,278 |
| | — |
| | 1,458 |
| | (375 | ) | | 6/27/2013 | | 1995 |
| Taco Bell | | Dora | | AL | | — |
| | 348 |
| | 813 |
| | — |
| | 1,161 |
| | (148 | ) | | 7/31/2013 | | 1995 | | Dora | | AL | | — |
| | 348 |
| | 813 |
| | — |
| | 1,161 |
| | (228 | ) | | 7/31/2013 | | 1995 |
| Taco Bell | | Foley | | AL | | — |
| | 360 |
| | 1,460 |
| | — |
| | 1,820 |
| | (280 | ) | | 6/27/2013 | | 1995 | | Foley | | AL | | — |
| | 360 |
| | 1,460 |
| | — |
| | 1,820 |
| | (428 | ) | | 6/27/2013 | | 1995 |
| Taco Bell | | Hartselle | | AL | | — |
| | 378 |
| | 781 |
| | — |
| | 1,159 |
| | (153 | ) | | 6/27/2013 | | 1995 | | Hartselle | | AL | | — |
| | 378 |
| | 781 |
| | — |
| | 1,159 |
| | (231 | ) | | 6/27/2013 | | 1995 |
| Taco Bell | | Jasper | | AL | | — |
| | 445 |
| | 814 |
| | — |
| | 1,259 |
| | (160 | ) | | 6/27/2013 | | 1995 | | Jasper | | AL | | — |
| | 445 |
| | 814 |
| | — |
| | 1,259 |
| | (241 | ) | | 6/27/2013 | | 1995 |
| Taco Bell | | Mobile | | AL | | — |
| | 160 |
| | 1,973 |
| | — |
| | 2,133 |
| | (378 | ) | | 6/27/2013 | | 1995 | |
| Taco Bell | | Saraland | | AL | | — |
| | 150 |
| | 1,063 |
| | — |
| | 1,213 |
| | (204 | ) | | 6/27/2013 | | 1995 | |
| Taco Bell | | Warrior | | AL | | — |
| | 364 |
| | 675 |
| | — |
| | 1,039 |
| | (123 | ) | | 7/31/2013 | | 1995 | |
| Taco Bell | | Winfield | | AL | | — |
| | 278 |
| | 834 |
| | — |
| | 1,112 |
| | (152 | ) | | 7/31/2013 | | 1995 | |
| Taco Bell | | Corona | | CA | | — |
| | 306 |
| | 1,138 |
| | — |
| | 1,444 |
| | (223 | ) | | 6/27/2013 | | 1990 | |
| Taco Bell | | Fairfield | | CA | | — |
| | 500 |
| | 1,327 |
| | — |
| | 1,827 |
| | (260 | ) | | 6/27/2013 | | 1985 | |
| Taco Bell | | Fontana | | CA | | — |
| | 524 |
| | 1,016 |
| | — |
| | 1,540 |
| | (199 | ) | | 6/27/2013 | | 1992 | |
| Taco Bell | | Montclair | | CA | | — |
| | 322 |
| | 900 |
| | — |
| | 1,222 |
| | (177 | ) | | 6/27/2013 | | 1996 | |
| Taco Bell | | Moreno Valley | | CA | | — |
| | 367 |
| | 998 |
| | — |
| | 1,365 |
| | (196 | ) | | 6/27/2013 | | 1992 | |
| Taco Bell | | Rancho Cucamonga | | CA | | — |
| | 415 |
| | 1,210 |
| | — |
| | 1,625 |
| | (238 | ) | | 6/27/2013 | | 1992 | |
| Taco Bell | | Rubidoux | | CA | | — |
| | 415 |
| | 1,223 |
| | — |
| | 1,638 |
| | (240 | ) | | 6/27/2013 | | 1992 | |
| | | | | | Initial Costs (1) | | Costs Capitalized Subsequent to Acquisition (2) | | Gross Amount
Carried at
December 31, 2016
(3) (4) | | | | | | Initial Costs (1) | | Costs Capitalized Subsequent to Acquisition (2) | | Gross Amount
Carried at
December 31, 2018
(3) (4) | | | |
| Property | | City | | State | | Encumbrances at
December 31, 2016 | | Land | | Buildings, Fixtures and Improvements | | Accumulated Depreciation
(3) (5) | | Date Acquired | | Date of Construction | | City | | State | | Encumbrances at
December 31, 2018 | | Land | | Buildings, Fixtures and Improvements | | Accumulated Depreciation
(3) (5) | | Date Acquired | | Date of Construction |
| Taco Bell | | Suisun City | | CA | | — |
| | 355 |
| | 1,419 |
| | — |
| | 1,774 |
| | (259 | ) | | 7/31/2013 | | 1986 | | Mobile | | AL | | — |
| | 160 |
| | 1,973 |
| | — |
| | 2,133 |
| | (579 | ) | | 6/27/2013 | | 1995 |
| Taco Bell | | Vacaville | | CA | | — |
| | 522 |
| | 1,513 |
| | — |
| | 2,035 |
| | (297 | ) | | 6/27/2013 | | 1985 | | Saraland | | AL | | — |
| | 150 |
| | 1,063 |
| | — |
| | 1,213 |
| | (312 | ) | | 6/27/2013 | | 1995 |
| Taco Bell | | Vacaville | | CA | | — |
| | 1,184 |
| | 1,375 |
| | — |
| | 2,559 |
| | (270 | ) | | 6/27/2013 | | 1994 | | Warrior | | AL | | — |
| | 364 |
| | 675 |
| | — |
| | 1,039 |
| | (189 | ) | | 7/31/2013 | | 1995 |
| Taco Bell | | Pensacola | | FL | | — |
| | 140 |
| | 1,897 |
| | — |
| | 2,037 |
| | (363 | ) | | 6/27/2013 | | 1995 | | Winfield | | AL | | — |
| | 278 |
| | 834 |
| | — |
| | 1,112 |
| | (234 | ) | | 7/31/2013 | | 1995 |
| Taco Bell | | Jacksonville | | FL | | — |
| | 440 |
| | 1,167 |
| | — |
| | 1,607 |
| | (224 | ) | | 6/27/2013 | | 1995 | | Corona | | CA | | — |
| | 306 |
| | 1,138 |
| | — |
| | 1,444 |
| | (337 | ) | | 6/27/2013 | | 1990 |
| Taco Bell | | Jacksonville | | FL | | — |
| | 340 |
| | 1,383 |
| | — |
| | 1,723 |
| | (265 | ) | | 6/27/2013 | | 1995 | | Fairfield | | CA | | — |
| | 500 |
| | 1,327 |
| | — |
| | 1,827 |
| | (393 | ) | | 6/27/2013 | | 1985 |
| Taco Bell | | Augusta | | GA | | — |
| | 220 |
| | 1,292 |
| | — |
| | 1,512 |
| | (248 | ) | | 6/27/2013 | | 1995 | | Fontana | | CA | | — |
| | 524 |
| | 1,016 |
| | — |
| | 1,540 |
| | (301 | ) | | 6/27/2013 | | 1992 |
| Taco Bell | | Hephzibah | | GA | | — |
| | 330 |
| | 930 |
| | — |
| | 1,260 |
| | (178 | ) | | 6/27/2013 | | 1995 | | Montclair | | CA | | — |
| | 322 |
| | 900 |
| | — |
| | 1,222 |
| | (267 | ) | | 6/27/2013 | | 1996 |
| Taco Bell | | Jesup | | GA | | — |
| | 230 |
| | 715 |
| | — |
| | 945 |
| | (137 | ) | | 6/27/2013 | | 1995 | | Moreno Valley | | CA | | — |
| | 367 |
| | 998 |
| | — |
| | 1,365 |
| | (296 | ) | | 6/27/2013 | | 1992 |
| Taco Bell | | Kennesaw | | GA | | — |
| | 162 |
| | 601 |
| | — |
| | 763 |
| | (118 | ) | | 6/27/2013 | | 1984 | | Rancho Cucamonga | | CA | | — |
| | 415 |
| | 1,210 |
| | — |
| | 1,625 |
| | (359 | ) | | 6/27/2013 | | 1992 |
| Taco Bell | | Waycross | | GA | | — |
| | 170 |
| | 1,115 |
| | — |
| | 1,285 |
| | (214 | ) | | 6/27/2013 | | 1995 | | Rubidoux | | CA | | — |
| | 415 |
| | 1,223 |
| | — |
| | 1,638 |
| | (362 | ) | | 6/27/2013 | | 1992 |
| Taco Bell | | Marion | | IN | | — |
| | 496 |
| | 921 |
| | — |
| | 1,417 |
| | (168 | ) | | 7/31/2013 | | 1994 | | Suisun City | | CA | | — |
| | 355 |
| | 1,419 |
| | — |
| | 1,774 |
| | (398 | ) | | 7/31/2013 | | 1986 |
| Taco Bell | | Crawfordsville | | IN | | — |
| | 234 |
| | 934 |
| | — |
| | 1,168 |
| | (170 | ) | | 7/31/2013 | | 1991 | | Vacaville | | CA | | — |
| | 522 |
| | 1,513 |
| | — |
| | 2,035 |
| | (448 | ) | | 6/27/2013 | | 1985 |
| Taco Bell | | Frankfort | | IN | | — |
| | 99 |
| | 893 |
| | — |
| | 992 |
| | (163 | ) | | 7/31/2013 | | 1985 | | Vacaville | | CA | | — |
| | 1,184 |
| | 1,375 |
| | — |
| | 2,559 |
| | (407 | ) | | 6/27/2013 | | 1994 |
| Taco Bell | | Hartford City | | IN | | — |
| | 99 |
| | 889 |
| | — |
| | 988 |
| | (162 | ) | | 7/31/2013 | | 1978 | | Jacksonville | | FL | | — |
| | 440 |
| | 1,167 |
| | — |
| | 1,607 |
| | (342 | ) | | 6/27/2013 | | 1995 |
| Taco Bell | | Kokomo | | IN | | — |
| | 199 |
| | 798 |
| | — |
| | 997 |
| | (146 | ) | | 7/31/2013 | | 1993 | | Jacksonville | | FL | | — |
| | 340 |
| | 1,383 |
| | — |
| | 1,723 |
| | (406 | ) | | 6/27/2013 | | 1995 |
| Taco Bell | | Lafayette | | IN | | — |
| | 304 |
| | 912 |
| | — |
| | 1,216 |
| | (166 | ) | | 7/31/2013 | | 1990 | | Pensacola | | FL | | — |
| | 140 |
| | 1,897 |
| | — |
| | 2,037 |
| | (556 | ) | | 6/27/2013 | | 1995 |
| Taco Bell | | Lebanon | | IN | | — |
| | 337 |
| | 1,348 |
| | — |
| | 1,685 |
| | (246 | ) | | 7/31/2013 | | 1983 | | Augusta | | GA | | — |
| | 220 |
| | 1,292 |
| | — |
| | 1,512 |
| | (379 | ) | | 6/27/2013 | | 1995 |
| Taco Bell | | Noblesville | | IN | | — |
| | 363 |
| | 545 |
| | — |
| | 908 |
| | (99 | ) | | 7/31/2013 | | 2005 | | Hephzibah | | GA | | — |
| | 330 |
| | 930 |
| | — |
| | 1,260 |
| | (273 | ) | | 6/27/2013 | | 1995 |
| Taco Bell | | Tipton | | IN | | — |
| | 104 |
| | 936 |
| | — |
| | 1,040 |
| | (171 | ) | | 7/31/2013 | | 1998 | | Jesup | | GA | | — |
| | 230 |
| | 715 |
| | — |
| | 945 |
| | (210 | ) | | 6/27/2013 | | 1995 |
| Taco Bell | | North Corbin | | KY | | — |
| | 139 |
| | 1,082 |
| | — |
| | 1,221 |
| | (212 | ) | | 6/27/2013 | | 1995 | | Kennesaw | | GA | | — |
| | 162 |
| | 601 |
| | — |
| | 763 |
| | (178 | ) | | 6/27/2013 | | 1984 |
| Taco Bell | | Detroit | | MI | | — |
| | 124 |
| | 704 |
| | — |
| | 828 |
| | (128 | ) | | 7/31/2013 | | 1989 | | Waycross | | GA | | — |
| | 170 |
| | 1,115 |
| | — |
| | 1,285 |
| | (327 | ) | | 6/27/2013 | | 1995 |
| Taco Bell | | St. Louis | | MO | | — |
| | 190 |
| | 1,951 |
| | — |
| | 2,141 |
| | (331 | ) | | 6/27/2013 | | 1995 | | Crawfordsville | | IN | | — |
| | 234 |
| | 934 |
| | — |
| | 1,168 |
| | (262 | ) | | 7/31/2013 | | 1991 |
| Taco Bell | | Wentzville | | MO | | — |
| | 410 |
| | 1,168 |
| | — |
| | 1,578 |
| | (224 | ) | | 6/27/2013 | | 1995 | | Hartford City | | IN | | — |
| | 99 |
| | 889 |
| | — |
| | 988 |
| | (249 | ) | | 7/31/2013 | | 1978 |
| Taco Bell | | Brunswick | | OH | | — |
| | 400 |
| | 1,267 |
| | — |
| | 1,667 |
| | (243 | ) | | 6/27/2013 | | 1995 | | Kokomo | | IN | | — |
| | 199 |
| | 798 |
| | — |
| | 997 |
| | (224 | ) | | 7/31/2013 | | 1993 |
| Taco Bell | | Dayton | | OH | | — |
| | 129 |
| | 732 |
| | — |
| | 861 |
| | (134 | ) | | 7/31/2013 | | 1995 | | Lafayette | | IN | | — |
| | 304 |
| | 912 |
| | — |
| | 1,216 |
| | (256 | ) | | 7/31/2013 | | 1990 |
| Taco Bell | | North Olmstead | | OH | | — |
| | 390 |
| | 904 |
| | — |
| | 1,294 |
| | (173 | ) | | 6/27/2013 | | 1995 | | Marion | | IN | | — |
| | 496 |
| | 921 |
| | — |
| | 1,417 |
| | (258 | ) | | 7/31/2013 | | 1994 |
| Taco Bell | | Kingston | | TN | | — |
| | 280 |
| | 714 |
| | — |
| | 994 |
| | (137 | ) | | 6/27/2013 | | 1995 | | Noblesville | | IN | | — |
| | 363 |
| | 545 |
| | — |
| | 908 |
| | (153 | ) | | 7/31/2013 | | 2005 |
| Taco Bell | | Dallas | | TX | | — |
| | 400 |
| | 1,225 |
| | — |
| | 1,625 |
| | (235 | ) | | 6/27/2013 | | 1995 | | Tipton | | IN | | — |
| | 104 |
| | 936 |
| | — |
| | 1,040 |
| | (263 | ) | | 7/31/2013 | | 1998 |
| Taco Bell / KFC | | Texarkana | | AR | | — |
| | 111 |
| | 630 |
| | — |
| | 741 |
| | (115 | ) | | 7/31/2013 | | 1980 | |
| Taco Bell / KFC | | Minden | | LA | | — |
| | 274 |
| | 639 |
| | — |
| | 913 |
| | (117 | ) | | 7/31/2013 | | 1995 | |
| Taco Bell / KFC | | Shreveport | | LA | | — |
| | 343 |
| | 514 |
| | — |
| | 857 |
| | (94 | ) | | 7/31/2013 | | 1995 | |
| Taco Bell | | | North Corbin | | KY | | — |
| | 139 |
| | 1,082 |
| | — |
| | 1,221 |
| | (320 | ) | | 6/27/2013 | | 1995 |
| Taco Bell | | | Detroit | | MI | | — |
| | 124 |
| | 704 |
| | — |
| | 828 |
| | (198 | ) | | 7/31/2013 | | 1989 |
| Taco Bell | | | St. Louis | | MO | | — |
| | 190 |
| | 1,951 |
| | — |
| | 2,141 |
| | (517 | ) | | 6/27/2013 | | 1995 |
| | | | | | Initial Costs (1) | | Costs Capitalized Subsequent to Acquisition (2) | | Gross Amount
Carried at
December 31, 2016
(3) (4) | | | | | | Initial Costs (1) | | Costs Capitalized Subsequent to Acquisition (2) | | Gross Amount
Carried at
December 31, 2018
(3) (4) | | | |
| Property | | City | | State | | Encumbrances at
December 31, 2016 | | Land | | Buildings, Fixtures and Improvements | | Accumulated Depreciation
(3) (5) | | Date Acquired | | Date of Construction | | City | | State | | Encumbrances at
December 31, 2018 | | Land | | Buildings, Fixtures and Improvements | | Accumulated Depreciation
(3) (5) | | Date Acquired | | Date of Construction |
| Taco Bell | | | Wentzville | | MO | | — |
| | 410 |
| | 1,168 |
| | — |
| | 1,578 |
| | (343 | ) | | 6/27/2013 | | 1995 |
| Taco Bell | | | Brunswick | | OH | | — |
| | 400 |
| | 1,267 |
| | — |
| | 1,667 |
| | (372 | ) | | 6/27/2013 | | 1995 |
| Taco Bell | | | North Olmstead | | OH | | — |
| | 390 |
| | 904 |
| | — |
| | 1,294 |
| | (265 | ) | | 6/27/2013 | | 1995 |
| Taco Bell | | | Kingston | | TN | | — |
| | 280 |
| | 714 |
| | 300 |
| | 1,294 |
| | (230 | ) | | 6/27/2013 | | 1995 |
| Taco Bell | | | Livingston | | TN | | — |
| | 300 |
| | 775 |
| | — |
| | 1,075 |
| | (13 | ) | | 6/27/2013 | | 1995 |
| Taco Bell | | | Dallas | | TX | | — |
| | 400 |
| | 1,225 |
| | — |
| | 1,625 |
| | (359 | ) | | 6/27/2013 | | 1995 |
| Taco Bell / KFC | | | Texarkana | | AR | | — |
| | 111 |
| | 630 |
| | — |
| | 741 |
| | (177 | ) | | 7/31/2013 | | 1980 |
| Taco Bell / KFC | | | Minden | | LA | | — |
| | 274 |
| | 639 |
| | — |
| | 913 |
| | (179 | ) | | 7/31/2013 | | 1995 |
| Taco Bell / KFC | | | Shreveport | | LA | | — |
| | 343 |
| | 514 |
| | — |
| | 857 |
| | (144 | ) | | 7/31/2013 | | 1995 |
| Taco Bell / KFC | | Shreveport | | LA | | — |
| | 616 |
| | 753 |
| | — |
| | 1,369 |
| | (137 | ) | | 7/31/2013 | | 1995 | | Shreveport | | LA | | — |
| | 616 |
| | 753 |
| | — |
| | 1,369 |
| | (211 | ) | | 7/31/2013 | | 1995 |
| Taco Bell / KFC | | Shreveport | | LA | | — |
| | 427 |
| | 522 |
| | — |
| | 949 |
| | (95 | ) | | 7/31/2013 | | 1997 | | Shreveport | | LA | | — |
| | 427 |
| | 522 |
| | — |
| | 949 |
| | (146 | ) | | 7/31/2013 | | 1997 |
| Taco Bell / KFC | | Shreveport | | LA | | — |
| | 352 |
| | 528 |
| | — |
| | 880 |
| | (96 | ) | | 7/31/2013 | | 1998 | | Shreveport | | LA | | — |
| | 352 |
| | 528 |
| | — |
| | 880 |
| | (148 | ) | | 7/31/2013 | | 1998 |
| Taco Bell / KFC | | Dunkirk | | NY | | — |
| | 800 |
| | 978 |
| | — |
| | 1,778 |
| | (178 | ) | | 7/31/2013 | | 2000 | | Dunkirk | | NY | | — |
| | 800 |
| | 978 |
| | — |
| | 1,778 |
| | (274 | ) | | 7/31/2013 | | 2000 |
| Taco Bell / KFC | | Geneva | | NY | | — |
| | 569 |
| | 695 |
| | — |
| | 1,264 |
| | (127 | ) | | 7/31/2013 | | 1999 | | Geneva | | NY | | — |
| | 569 |
| | 695 |
| | — |
| | 1,264 |
| | (195 | ) | | 7/31/2013 | | 1999 |
| Taco Bell / KFC | | Canonsburg | | PA | | — |
| | 176 |
| | 1,586 |
| | — |
| | 1,762 |
| | (289 | ) | | 7/31/2013 | | 1996 | | Canonsburg | | PA | | — |
| | 176 |
| | 1,586 |
| | — |
| | 1,762 |
| | (445 | ) | | 7/31/2013 | | 1996 |
| Taco Bell / KFC | | Pittsburgh | | PA | | — |
| | 180 |
| | 269 |
| | 3 |
| | 452 |
| | (46 | ) | | 10/1/2013 | | 1995 | | Pittsburgh | | PA | | — |
| | 180 |
| | 269 |
| | 3 |
| | 452 |
| | (74 | ) | | 10/1/2013 | | 1995 |
| Taco Bell / KFC | | Mount Pleasant | | TX | | — |
| | 106 |
| | 952 |
| | — |
| | 1,058 |
| | (174 | ) | | 7/31/2013 | | 1992 | | Mount Pleasant | | TX | | — |
| | 106 |
| | 952 |
| | — |
| | 1,058 |
| | (267 | ) | | 7/31/2013 | | 1992 |
| Taco Bell / KFC | | New Boston | | TX | | — |
| | 125 |
| | 1,127 |
| | — |
| | 1,252 |
| | (206 | ) | | 7/31/2013 | | 1995 | | New Boston | | TX | | — |
| | 125 |
| | 1,127 |
| | — |
| | 1,252 |
| | (316 | ) | | 7/31/2013 | | 1995 |
| Taco Bell / KFC | | Green Bay | | WI | | — |
| | 470 |
| | 574 |
| | — |
| | 1,044 |
| | (105 | ) | | 7/31/2013 | | 1986 | | Green Bay | | WI | | — |
| | 470 |
| | 574 |
| | — |
| | 1,044 |
| | (161 | ) | | 7/31/2013 | | 1986 |
| Taco Bell / KFC | | Milwaukee | | WI | | — |
| | 533 |
| | 1,055 |
| | — |
| | 1,588 |
| | (207 | ) | | 6/27/2013 | | 1978 | | Milwaukee | | WI | | — |
| | 533 |
| | 1,055 |
| | — |
| | 1,588 |
| | (313 | ) | | 6/27/2013 | | 1978 |
| Taco Bell / KFC | | Benwood | | WV | | — |
| | 123 |
| | 287 |
| | 4 |
| | 414 |
| | (49 | ) | | 10/1/2013 | | 1995 | | Benwood | | WV | | — |
| | 123 |
| | 287 |
| | 4 |
| | 414 |
| | (78 | ) | | 10/1/2013 | | 1995 |
| Taco Bell / Pizza Hut | | Dallas | | TX | | — |
| | 420 |
| | 1,582 |
| | — |
| | 2,002 |
| | (303 | ) | | 6/27/2013 | | 1995 | | Dallas | | TX | | — |
| | 420 |
| | 1,582 |
| | — |
| | 2,002 |
| | (464 | ) | | 6/27/2013 | | 1995 |
| Taco Bueno | | Hutchinson | | KS | | — |
| | 561 |
| | 841 |
| | — |
| | 1,402 |
| | (153 | ) | | 7/31/2013 | | 2000 | | Hutchinson | | KS | | — |
| | 561 |
| | 841 |
| | — |
| | 1,402 |
| | (236 | ) | | 7/31/2013 | | 2000 |
| Taco Bueno | | Belton | | MO | | — |
| | 476 |
| | 701 |
| | — |
| | 1,177 |
| | (138 | ) | | 6/27/2013 | | 2006 | | Springfield | | MO | | — |
| | 753 |
| | 753 |
| | (974 | ) | | 532 |
| | — |
| | 7/31/2013 | | 2006 |
| Taco Bueno | | Springfield | | MO | | — |
| | 753 |
| | 753 |
| | — |
| | 1,506 |
| | (137 | ) | | 7/31/2013 | | 2006 | | Arlington | | TX | | — |
| | 597 |
| | 895 |
| | — |
| | 1,492 |
| | (251 | ) | | 7/31/2013 | | 2000 |
| Taco Bueno | | Arlington | | TX | | — |
| | 597 |
| | 895 |
| | — |
| | 1,492 |
| | (163 | ) | | 7/31/2013 | | 2000 | | Frisco | | TX | | — |
| | 601 |
| | 577 |
| | — |
| | 1,178 |
| | (171 | ) | | 6/27/2013 | | 2000 |
| Taco Bueno | | Frisco | | TX | | — |
| | 601 |
| | 577 |
| | — |
| | 1,178 |
| | (113 | ) | | 6/27/2013 | | 2000 | | Lubbock | | TX | | — |
| | 228 |
| | 561 |
| | — |
| | 789 |
| | (166 | ) | | 6/27/2013 | | 2000 |
| Taco Bueno | | Lubbock | | TX | | — |
| | 228 |
| | 561 |
| | — |
| | 789 |
| | (110 | ) | | 6/27/2013 | | 2000 | | N. Richland Hills | | TX | | — |
| | 423 |
| | 567 |
| | — |
| | 990 |
| | (168 | ) | | 6/27/2013 | | 2000 |
| Taco Bueno | | N. Richland Hills | | TX | | — |
| | 423 |
| | 567 |
| | — |
| | 990 |
| | (111 | ) | | 6/27/2013 | | 2000 | | Waco | | TX | | — |
| | 595 |
| | 893 |
| | — |
| | 1,488 |
| | (250 | ) | | 7/31/2013 | | 2000 |
| Taco Bueno | | Waco | | TX | | — |
| | 595 |
| | 892 |
| | — |
| | 1,487 |
| | (163 | ) | | 7/31/2013 | | 1995 | |
| Taco Bueno | | Waco | | TX | | — |
| | 595 |
| | 893 |
| | — |
| | 1,488 |
| | (163 | ) | | 7/31/2013 | | 2000 | |
| Taco Cabana | | Austin | | TX | | — |
| | 700 |
| | 2,105 |
| | — |
| | 2,805 |
| | (403 | ) | | 6/27/2013 | | 1995 | | Austin | | TX | | — |
| | 700 |
| | 2,105 |
| | — |
| | 2,805 |
| | (617 | ) | | 6/27/2013 | | 1995 |
| Taco Cabana | | Pasadena | | TX | | — |
| | 420 |
| | 1,420 |
| | — |
| | 1,840 |
| | (272 | ) | | 6/27/2013 | | 1995 | | Pasadena | | TX | | — |
| | 420 |
| | 1,420 |
| | — |
| | 1,840 |
| | (416 | ) | | 6/27/2013 | | 1995 |
| Taco Cabana | | San Antonio | | TX | | — |
| | 600 |
| | 1,955 |
| | — |
| | 2,555 |
| | (375 | ) | | 6/27/2013 | | 1995 | | San Antonio | | TX | | — |
| | 600 |
| | 1,955 |
| | — |
| | 2,555 |
| | (574 | ) | | 6/27/2013 | | 1995 |
| Taco Cabana | | San Antonio | | TX | | — |
| | 500 |
| | 1,740 |
| | — |
| | 2,240 |
| | (334 | ) | | 6/27/2013 | | 1995 | |
| Taco Cabana | | San Antonio | | TX | | — |
| | 280 |
| | 1,695 |
| | — |
| | 1,975 |
| | (325 | ) | | 6/27/2013 | | 1995 | |
| Taco Cabana | | San Antonio | | TX | | — |
| | 500 |
| | 1,766 |
| | — |
| | 2,266 |
| | (338 | ) | | 6/27/2013 | | 1995 | |
| Taco Cabana | | Schertz | | TX | | — |
| | 520 |
| | 1,408 |
| | — |
| | 1,928 |
| | (270 | ) | | 6/27/2013 | | 1995 | |
| Talbots | | Hingham | | MA | | 23,363 |
| | 3,009 |
| | 27,080 |
| | — |
| | 30,089 |
| | (4,736 | ) | | 5/24/2013 | | 1980 | |
| Talbots | | Lakeville | | MA | | 22,508 |
| | 6,302 |
| | 25,209 |
| | — |
| | 31,511 |
| | (5,574 | ) | | 5/17/2013 | | 1987 | |
| TCF Bank | | Crystal | | MN | | — |
| | 640 |
| | 642 |
| | — |
| | 1,282 |
| | (119 | ) | | 6/27/2013 | | 1995 | |
|
| | | | | | | | | | | | | | | | | | | | | | | | | | |
| | | | | | | | Initial Costs (1) | | Costs Capitalized Subsequent to Acquisition (2) | | Gross Amount
Carried at
December 31, 2016
(3) (4) | | | | | | |
| Property | | City | | State | | Encumbrances at
December 31, 2016 | | Land | | Buildings, Fixtures and Improvements | | | Accumulated Depreciation
(3) (5) | | Date Acquired | | Date of Construction |
| TD Bank | | Falmouth | | ME | | 19,608 |
| | 4,057 |
| | 23,689 |
| | (500 | ) | | 27,246 |
| | (4,245 | ) | | 3/18/2013 | | 2002 |
| Teva Pharmaceuticals | | Malvern | | PA | | — |
| | 2,666 |
| | 40,981 |
| | (7,010 | ) | | 36,637 |
| | (1,048 | ) | | 11/5/2013 | | 1999 |
| Texas Roadhouse | | Cedar Rapids | | IA | | — |
| | 430 |
| | 2,194 |
| | — |
| | 2,624 |
| | (435 | ) | | 6/27/2013 | | 1995 |
| Texas Roadhouse | | Ammon | | ID | | — |
| | 490 |
| | 1,206 |
| | — |
| | 1,696 |
| | (239 | ) | | 6/27/2013 | | 1995 |
| Texas Roadhouse | | Shively | | KY | | — |
| | 540 |
| | 2,055 |
| | — |
| | 2,595 |
| | (407 | ) | | 6/27/2013 | | 1995 |
| Texas Roadhouse | | Concord | | NC | | — |
| | 650 |
| | 2,130 |
| | — |
| | 2,780 |
| | (422 | ) | | 6/27/2013 | | 1995 |
| Texas Roadhouse | | Gastonia | | NC | | — |
| | 570 |
| | 1,544 |
| | — |
| | 2,114 |
| | (306 | ) | | 6/27/2013 | | 1995 |
| Texas Roadhouse | | Hickory | | NC | | — |
| | 580 |
| | 1,831 |
| | — |
| | 2,411 |
| | (363 | ) | | 6/27/2013 | | 1995 |
| Texas Roadhouse | | College Station | | TX | | — |
| | 670 |
| | 2,299 |
| | — |
| | 2,969 |
| | (456 | ) | | 6/27/2013 | | 1995 |
| Texas Roadhouse | | Grand Prairie | | TX | | — |
| | 780 |
| | 1,867 |
| | — |
| | 2,647 |
| | (370 | ) | | 6/27/2013 | | 1995 |
| Texas Roadhouse | | Kenosha | | WI | | — |
| | 1,061 |
| | 1,835 |
| | (14 | ) | | 2,882 |
| | (373 | ) | | 6/27/2013 | | 2001 |
| TGI Fridays | | Royal Palm Beach | | FL | | — |
| | 1,530 |
| | 1,530 |
| | — |
| | 3,060 |
| | (315 | ) | | 7/31/2013 | | 2001 |
| TGI Fridays | | Ann Arbor | | MI | | — |
| | 547 |
| | 1,640 |
| | — |
| | 2,187 |
| | (337 | ) | | 7/31/2013 | | 1998 |
| TGI Fridays | | Kentwood | | MI | | — |
| | 281 |
| | 2,533 |
| | — |
| | 2,814 |
| | (521 | ) | | 7/31/2013 | | 1983 |
| TGI Fridays | | Novi | | MI | | — |
| | 1,042 |
| | 1,042 |
| | — |
| | 2,084 |
| | (215 | ) | | 7/31/2013 | | 1994 |
| TGI Fridays | | Blasdell | | NY | | — |
| | 1,215 |
| | 1,913 |
| | — |
| | 3,128 |
| | (389 | ) | | 6/27/2013 | | 2000 |
| TGI Fridays | | Warwick | | RI | | — |
| | 1,228 |
| | 2,775 |
| | (1,252 | ) | | 2,751 |
| | (177 | ) | | 6/27/2013 | | 1983 |
| The Fresh Market | | Winston-Salem | | NC | | — |
| | 196 |
| | 4,562 |
| | — |
| | 4,758 |
| | (626 | ) | | 2/7/2014 | | 2007 |
| The Medicines Co. | | Parsippany | | NJ | | 27,700 |
| | 5,150 |
| | 50,051 |
| | 329 |
| | 55,530 |
| | (6,666 | ) | | 2/7/2014 | | 2009 |
| The Shoppes at Port Arthur | | Port Arthur | | TX | | 8,077 |
| | 3,331 |
| | 14,992 |
| | — |
| | 18,323 |
| | (2,148 | ) | | 2/7/2014 | | 2008 |
| The UPS Store | | Elizabethtown | | KY | | — |
| | 1,460 |
| | 10,336 |
| | 778 |
| | 12,574 |
| | (2,051 | ) | | 9/24/2013 | | 2001 |
| The Vitamin Shoppe | | Evergreen Park | | IL | | — |
| | 476 |
| | 1,427 |
| | — |
| | 1,903 |
| | (297 | ) | | 4/19/2013 | | 2012 |
| The Vitamin Shoppe | | Ashland | | VA | | — |
| | 2,399 |
| | 19,663 |
| | — |
| | 22,062 |
| | (3,748 | ) | | 11/5/2013 | | 2013 |
| Thorntons Oil | | Bloomington | | IL | | — |
| | 1,184 |
| | 733 |
| | — |
| | 1,917 |
| | (142 | ) | | 2/7/2014 | | 1992 |
| Thorntons Oil | | Franklin Park | | IL | | — |
| | 1,403 |
| | 1,882 |
| | — |
| | 3,285 |
| | (323 | ) | | 2/7/2014 | | 1989 |
| Thorntons Oil | | Joliet | | IL | | — |
| | 953 |
| | 2,539 |
| | — |
| | 3,492 |
| | (433 | ) | | 2/7/2014 | | 2000 |
| Thorntons Oil | | Oaklawn | | IL | | — |
| | 1,203 |
| | 898 |
| | 278 |
| | 2,379 |
| | (167 | ) | | 2/7/2014 | | 1994 |
| Thorntons Oil | | Ottawa | | IL | | — |
| | 565 |
| | 2,003 |
| | — |
| | 2,568 |
| | (352 | ) | | 2/7/2014 | | 2006 |
| Thorntons Oil | | Plainfield | | IL | | — |
| | 862 |
| | 1,338 |
| | — |
| | 2,200 |
| | (242 | ) | | 2/7/2014 | | 1995 |
| Thorntons Oil | | Roselle | | IL | | — |
| | 661 |
| | 2,194 |
| | — |
| | 2,855 |
| | (362 | ) | | 2/7/2014 | | 1996 |
| Thorntons Oil | | South Elgin | | IL | | — |
| | 1,239 |
| | 1,688 |
| | — |
| | 2,927 |
| | (317 | ) | | 2/7/2014 | | 1995 |
| Thorntons Oil | | Springfield | | IL | | — |
| | 926 |
| | 2,514 |
| | — |
| | 3,440 |
| | (483 | ) | | 2/7/2014 | | 1994 |
|
| | | | | | | | | | | | | | | | | | | | | | | | | | |
| | | | | | | | Initial Costs (1) | | Costs Capitalized Subsequent to Acquisition (2) | | Gross Amount
Carried at
December 31, 2018
(3) (4) | | | | | | |
| Property | | City | | State | | Encumbrances at
December 31, 2018 | | Land | | Buildings, Fixtures and Improvements | | | Accumulated Depreciation
(3) (5) | | Date Acquired | | Date of Construction |
| Taco Cabana | | San Antonio | | TX | | — |
| | 500 |
| | 1,740 |
| | — |
| | 2,240 |
| | (511 | ) | | 6/27/2013 | | 1995 |
| Taco Cabana | | San Antonio | | TX | | — |
| | 280 |
| | 1,695 |
| | — |
| | 1,975 |
| | (497 | ) | | 6/27/2013 | | 1995 |
| Taco Cabana | | San Antonio | | TX | | — |
| | 500 |
| | 1,766 |
| | — |
| | 2,266 |
| | (518 | ) | | 6/27/2013 | | 1995 |
| Taco Cabana | | Schertz | | TX | | — |
| | 520 |
| | 1,408 |
| | — |
| | 1,928 |
| | (413 | ) | | 6/27/2013 | | 1995 |
| Take 5 Oil Change | | Lawrenceburg | | IN | | — |
| | 516 |
| | 721 |
| | — |
| | 1,237 |
| | (36 | ) | | 6/8/2017 | | 2017 |
| Take 5 Oil Change | | Alexandria | | KY | | — |
| | 294 |
| | 677 |
| | — |
| | 971 |
| | (30 | ) | | 6/8/2017 | | 1996 |
| Take 5 Oil Change | | Erlanger | | KY | | — |
| | 337 |
| | 1,072 |
| | — |
| | 1,409 |
| | (46 | ) | | 6/8/2017 | | 2003 |
| Take 5 Oil Change | | Florence | | KY | | — |
| | 279 |
| | 896 |
| | — |
| | 1,175 |
| | (40 | ) | | 6/8/2017 | | 1998 |
| Take 5 Oil Change | | Fort Wright | | KY | | — |
| | 179 |
| | 816 |
| | — |
| | 995 |
| | (38 | ) | | 6/8/2017 | | 1995 |
| Take 5 Oil Change | | Akron | | OH | | — |
| | 79 |
| | 287 |
| | — |
| | 366 |
| | (57 | ) | | 9/2/2014 | | 1988 |
| Take 5 Oil Change | | Akron | | OH | | — |
| | 135 |
| | 761 |
| | — |
| | 896 |
| | (156 | ) | | 9/2/2014 | | 1995 |
| Take 5 Oil Change | | Akron | | OH | | — |
| | 205 |
| | 1,043 |
| | — |
| | 1,248 |
| | (209 | ) | | 9/2/2014 | | 1992 |
| Take 5 Oil Change | | Bedford Heights | | OH | | — |
| | 156 |
| | 529 |
| | — |
| | 685 |
| | (115 | ) | | 9/2/2014 | | 1986 |
| Take 5 Oil Change | | Cleveland | | OH | | — |
| | 127 |
| | 559 |
| | — |
| | 686 |
| | (112 | ) | | 9/2/2014 | | 1988 |
| Take 5 Oil Change | | Fairview Park | | OH | | — |
| | 205 |
| | 179 |
| | — |
| | 384 |
| | (53 | ) | | 9/2/2014 | | 1988 |
| Take 5 Oil Change | | Lakewood | | OH | | — |
| | 205 |
| | 765 |
| | — |
| | 970 |
| | (157 | ) | | 9/2/2014 | | 1993 |
| Take 5 Oil Change | | Mayfield Heights | | OH | | — |
| | 201 |
| | 430 |
| | — |
| | 631 |
| | (93 | ) | | 9/2/2014 | | 1988 |
| Take 5 Oil Change | | Medina | | OH | | — |
| | 135 |
| | 414 |
| | (5 | ) | | 544 |
| | (91 | ) | | 9/2/2014 | | 1995 |
| Take 5 Oil Change | | Miamisburg | | OH | | — |
| | 246 |
| | 486 |
| | — |
| | 732 |
| | (23 | ) | | 6/8/2017 | | 1992 |
| Take 5 Oil Change | | Moraine | | OH | | — |
| | 415 |
| | 692 |
| | — |
| | 1,107 |
| | (31 | ) | | 6/8/2017 | | 1995 |
| Take 5 Oil Change | | N. Barberton | | OH | | — |
| | 140 |
| | 502 |
| | — |
| | 642 |
| | (99 | ) | | 9/2/2014 | | 1998 |
| Take 5 Oil Change | | Painesville | | OH | | — |
| | 276 |
| | 208 |
| | — |
| | 484 |
| | (55 | ) | | 9/2/2014 | | 1988 |
| Take 5 Oil Change | | Parma | | OH | | — |
| | 124 |
| | 390 |
| | — |
| | 514 |
| | (75 | ) | | 9/2/2014 | | 1986 |
| Take 5 Oil Change | | Parma | | OH | | — |
| | 306 |
| | 502 |
| | — |
| | 808 |
| | (111 | ) | | 9/2/2014 | | 1986 |
| Take 5 Oil Change | | Seven Hills | | OH | | — |
| | 182 |
| | 201 |
| | — |
| | 383 |
| | (50 | ) | | 9/2/2014 | | 1987 |
| Take 5 Oil Change | | Solon | | OH | | — |
| | 233 |
| | 487 |
| | — |
| | 720 |
| | (101 | ) | | 9/2/2014 | | 1992 |
| Take 5 Oil Change | | South Euclid | | OH | | — |
| | 109 |
| | 561 |
| | — |
| | 670 |
| | (104 | ) | | 9/2/2014 | | 1986 |
| Take 5 Oil Change | | Stow | | OH | | — |
| | 230 |
| | 132 |
| | — |
| | 362 |
| | (37 | ) | | 9/2/2014 | | 1988 |
| Take 5 Oil Change | | Westlake | | OH | | — |
| | 85 |
| | 525 |
| | — |
| | 610 |
| | (97 | ) | | 9/2/2014 | | 1999 |
| Take 5 Oil Change | | Willoughby | | OH | | — |
| | 168 |
| | 425 |
| | — |
| | 593 |
| | (86 | ) | | 9/2/2014 | | 1986 |
| Talbots | | Hingham | | MA | | 23,362 |
| | 3,009 |
| | 27,080 |
| | — |
| | 30,089 |
| | (7,045 | ) | | 5/24/2013 | | 1980 |
| Talbots | | Lakeville | | MA | | 22,509 |
| | 6,302 |
| | 25,209 |
| | — |
| | 31,511 |
| | (8,273 | ) | | 5/17/2013 | | 1987 |
|
| | | | | | | | | | | | | | | | | | | | | | | | | | |
| | | | | | | | Initial Costs (1) | | Costs Capitalized Subsequent to Acquisition (2) | | Gross Amount
Carried at
December 31, 2016
(3) (4) | | | | | | |
| Property | | City | | State | | Encumbrances at
December 31, 2016 | | Land | | Buildings, Fixtures and Improvements | | | Accumulated Depreciation
(3) (5) | | Date Acquired | | Date of Construction |
| Thorntons Oil | | Summit | | IL | | — |
| | 2,233 |
| | 109 |
| | — |
| | 2,342 |
| | (22 | ) | | 2/7/2014 | | 2000 |
| Thorntons Oil | | Waukegan | | IL | | — |
| | 875 |
| | 1,421 |
| | — |
| | 2,296 |
| | (245 | ) | | 2/7/2014 | | 1999 |
| Thorntons Oil | | Westmont | | IL | | — |
| | 760 |
| | 3,069 |
| | — |
| | 3,829 |
| | (503 | ) | | 2/7/2014 | | 1997 |
| Thorntons Oil | | Clarksville | | IN | | — |
| | 1,319 |
| | 687 |
| | — |
| | 2,006 |
| | (140 | ) | | 2/7/2014 | | 2005 |
| Thorntons Oil | | Edinburgh | | IN | | — |
| | 685 |
| | 1,505 |
| | — |
| | 2,190 |
| | (261 | ) | | 2/7/2014 | | 1996 |
| Thorntons Oil | | Evansville | | IN | | — |
| | 467 |
| | 1,479 |
| | — |
| | 1,946 |
| | (261 | ) | | 2/7/2014 | | 1987 |
| Thorntons Oil | | Evansville | | IN | | — |
| | 602 |
| | 1,398 |
| | — |
| | 2,000 |
| | (245 | ) | | 2/7/2014 | | 1990 |
| Thorntons Oil | | Jeffersonville | | IN | | — |
| | 1,233 |
| | 1,533 |
| | — |
| | 2,766 |
| | (287 | ) | | 2/7/2014 | | 1995 |
| Thorntons Oil | | Terre Haute | | IN | | — |
| | 732 |
| | 1,829 |
| | — |
| | 2,561 |
| | (327 | ) | | 2/7/2014 | | 1995 |
| Thorntons Oil | | Henderson | | KY | | — |
| | 659 |
| | 3,271 |
| | — |
| | 3,930 |
| | (560 | ) | | 2/7/2014 | | 1971 |
| Thorntons Oil | | Henderson | | KY | | — |
| | 483 |
| | 1,778 |
| | — |
| | 2,261 |
| | (278 | ) | | 2/7/2014 | | 2007 |
| Thorntons Oil | | Louisville | | KY | | — |
| | 637 |
| | 1,680 |
| | — |
| | 2,317 |
| | (260 | ) | | 2/7/2014 | | 1994 |
| Thorntons Oil | | Shelbyville | | KY | | — |
| | 299 |
| | 2,036 |
| | — |
| | 2,335 |
| | (336 | ) | | 2/7/2014 | | 1991 |
| Thorntons Oil | | Galloway | | OH | | — |
| | 547 |
| | 1,550 |
| | — |
| | 2,097 |
| | (259 | ) | | 2/7/2014 | | 1998 |
| Tiffany & Co. | | Parsippany | | NJ | | — |
| | 2,248 |
| | 81,081 |
| | — |
| | 83,329 |
| | (15,456 | ) | | 11/5/2013 | | 1997 |
| Tilted Kilt | | Hendersonville | | TN | | — |
| | 310 |
| | 763 |
| | — |
| | 1,073 |
| | (151 | ) | | 6/27/2013 | | 1995 |
| Time Warner Cable | | Milwaukee | | WI | | — |
| | 3,081 |
| | 22,512 |
| | 424 |
| | 26,017 |
| | (4,068 | ) | | 11/5/2013 | | 2001 |
| Tire Kingdom | | Auburndale | | FL | | 1,205 |
| | 609 |
| | 1,571 |
| | — |
| | 2,180 |
| | (248 | ) | | 2/7/2014 | | 2010 |
| Tire Kingdom | | Dublin | | OH | | 717 |
| | 373 |
| | 1,119 |
| | — |
| | 1,492 |
| | (306 | ) | | 4/30/2012 | | 2003 |
| Tire Kingdom | | Greenville | | SC | | — |
| | 499 |
| | 1,367 |
| | — |
| | 1,866 |
| | (221 | ) | | 3/28/2014 | | 1997 |
| Tire Warehouse | | Fitchburg | | MA | | — |
| | 203 |
| | 704 |
| | — |
| | 907 |
| | (140 | ) | | 6/27/2013 | | 1982 |
| Tire Warehouse | | Bangor | | ME | | — |
| | 289 |
| | 1,400 |
| | — |
| | 1,689 |
| | (278 | ) | | 6/27/2013 | | 1977 |
| Tires Plus | | Duluth | | GA | | — |
| | 777 |
| | 1,259 |
| | — |
| | 2,036 |
| | (213 | ) | | 2/21/2014 | | 2001 |
| TitleMax | | Gainesville | | GA | | — |
| | 221 |
| | 270 |
| | — |
| | 491 |
| | (55 | ) | | 7/31/2013 | | 2007 |
| TJ Maxx | | Philadelphia | | PA | | — |
| | 9,889 |
| | 84,953 |
| | — |
| | 94,842 |
| | (16,194 | ) | | 11/5/2013 | | 2001 |
| T-Mobile | | Nashville | | TN | | — |
| | 1,190 |
| | 15,847 |
| | — |
| | 17,037 |
| | (2,634 | ) | | 11/5/2013 | | 2002 |
| Tommy Addison's | | Edgewood | | FL | | — |
| | 366 |
| | 447 |
| | — |
| | 813 |
| | (92 | ) | | 7/31/2013 | | 2003 |
| Toys R Us | | Coral Springs | | FL | | — |
| | 4,264 |
| | 5,289 |
| | — |
| | 9,553 |
| | (765 | ) | | 2/7/2014 | | 2010 |
| Tractor Supply | | Oneonta | | AL | | — |
| | 359 |
| | 1,438 |
| | — |
| | 1,797 |
| | (254 | ) | | 4/18/2013 | | 1983 |
| Tractor Supply | | Summerdale | | AL | | 1,187 |
| | 276 |
| | 2,470 |
| | — |
| | 2,746 |
| | (317 | ) | | 2/7/2014 | | 2010 |
| Tractor Supply | | Tuscaloosa | | AL | | — |
| | 746 |
| | 1,979 |
| | — |
| | 2,725 |
| | (253 | ) | | 2/7/2014 | | 2012 |
| Tractor Supply | | Little Rock | | AR | | 1,500 |
| | 930 |
| | 2,035 |
| | — |
| | 2,965 |
| | (260 | ) | | 2/7/2014 | | 2009 |
|
| | | | | | | | | | | | | | | | | | | | | | | | | | |
| | | | | | | | Initial Costs (1) | | Costs Capitalized Subsequent to Acquisition (2) | | Gross Amount
Carried at
December 31, 2018
(3) (4) | | | | | | |
| Property | | City | | State | | Encumbrances at
December 31, 2018 | | Land | | Buildings, Fixtures and Improvements | | | Accumulated Depreciation
(3) (5) | | Date Acquired | | Date of Construction |
| Taqueria El Rodeo de Jalisco | | San Antonio | | TX | | — |
| | 168 |
| | 206 |
| | — |
| | 374 |
| | (58 | ) | | 7/31/2013 | | 1965 |
| TCF Bank | | Crystal | | MN | | — |
| | 640 |
| | 642 |
| | — |
| | 1,282 |
| | (180 | ) | | 6/27/2013 | | 1995 |
| TD Bank | | Falmouth | | ME | | 19,607 |
| | 4,057 |
| | 23,689 |
| | 307 |
| | 28,053 |
| | (6,236 | ) | | 3/18/2013 | | 2002 |
| Teva Pharmaceuticals | | Malvern | | PA | | — |
| | 2,666 |
| | 40,981 |
| | (6,111 | ) | | 37,536 |
| | (3,854 | ) | | 11/5/2013 | | 1999 |
| Texas Roadhouse | | Cedar Rapids | | IA | | — |
| | 430 |
| | 2,194 |
| | — |
| | 2,624 |
| | (661 | ) | | 6/27/2013 | | 1995 |
| Texas Roadhouse | | Ammon | | ID | | — |
| | 490 |
| | 1,206 |
| | — |
| | 1,696 |
| | (363 | ) | | 6/27/2013 | | 1995 |
| Texas Roadhouse | | Shively | | KY | | — |
| | 540 |
| | 2,055 |
| | — |
| | 2,595 |
| | (618 | ) | | 6/27/2013 | | 1995 |
| Texas Roadhouse | | Concord | | NC | | — |
| | 650 |
| | 2,130 |
| | — |
| | 2,780 |
| | (641 | ) | | 6/27/2013 | | 1995 |
| Texas Roadhouse | | Gastonia | | NC | | — |
| | 570 |
| | 1,544 |
| | — |
| | 2,114 |
| | (465 | ) | | 6/27/2013 | | 1995 |
| Texas Roadhouse | | Hickory | | NC | | — |
| | 580 |
| | 1,831 |
| | — |
| | 2,411 |
| | (551 | ) | | 6/27/2013 | | 1995 |
| Texas Roadhouse | | College Station | | TX | | — |
| | 670 |
| | 2,299 |
| | — |
| | 2,969 |
| | (692 | ) | | 6/27/2013 | | 1995 |
| Texas Roadhouse | | Grand Prairie | | TX | | — |
| | 780 |
| | 1,867 |
| | — |
| | 2,647 |
| | (562 | ) | | 6/27/2013 | | 1995 |
| Texas Roadhouse | | Kenosha | | WI | | — |
| | 1,061 |
| | 1,835 |
| | (14 | ) | | 2,882 |
| | (557 | ) | | 6/27/2013 | | 2001 |
| TGI Fridays | | Royal Palm Beach | | FL | | — |
| | 1,530 |
| | 1,530 |
| | — |
| | 3,060 |
| | (477 | ) | | 7/31/2013 | | 2001 |
| TGI Fridays | | Ann Arbor | | MI | | — |
| | 547 |
| | 1,640 |
| | — |
| | 2,187 |
| | (512 | ) | | 7/31/2013 | | 1998 |
| TGI Fridays | | Kentwood | | MI | | — |
| | 281 |
| | 2,533 |
| | — |
| | 2,814 |
| | (790 | ) | | 7/31/2013 | | 1983 |
| TGI Fridays | | Novi | | MI | | — |
| | 1,042 |
| | 1,042 |
| | — |
| | 2,084 |
| | (325 | ) | | 7/31/2013 | | 1994 |
| TGI Fridays | | Blasdell | | NY | | — |
| | 1,215 |
| | 1,913 |
| | — |
| | 3,128 |
| | (581 | ) | | 6/27/2013 | | 2000 |
| TGI Fridays | | Warwick | | RI | | — |
| | 1,228 |
| | 2,775 |
| | (1,252 | ) | | 2,751 |
| | (387 | ) | | 6/27/2013 | | 1983 |
| Thorntons Oil | | Bloomington | | IL | | — |
| | 1,184 |
| | 733 |
| | — |
| | 1,917 |
| | (240 | ) | | 2/7/2014 | | 1992 |
| Thorntons Oil | | Franklin Park | | IL | | — |
| | 1,403 |
| | 1,882 |
| | — |
| | 3,285 |
| | (548 | ) | | 2/7/2014 | | 1989 |
| Thorntons Oil | | Joliet | | IL | | — |
| | 953 |
| | 2,539 |
| | — |
| | 3,492 |
| | (734 | ) | | 2/7/2014 | | 2000 |
| Thorntons Oil | | Oaklawn | | IL | | — |
| | 1,203 |
| | 898 |
| | 278 |
| | 2,379 |
| | (283 | ) | | 2/7/2014 | | 1994 |
| Thorntons Oil | | Ottawa | | IL | | — |
| | 565 |
| | 2,003 |
| | — |
| | 2,568 |
| | (597 | ) | | 2/7/2014 | | 2006 |
| Thorntons Oil | | Plainfield | | IL | | — |
| | 862 |
| | 1,338 |
| | — |
| | 2,200 |
| | (410 | ) | | 2/7/2014 | | 1995 |
| Thorntons Oil | | Roselle | | IL | | — |
| | 661 |
| | 2,194 |
| | — |
| | 2,855 |
| | (614 | ) | | 2/7/2014 | | 1996 |
| Thorntons Oil | | South Elgin | | IL | | — |
| | 1,239 |
| | 1,688 |
| | — |
| | 2,927 |
| | (537 | ) | | 2/7/2014 | | 1995 |
| Thorntons Oil | | Springfield | | IL | | — |
| | 926 |
| | 2,514 |
| | — |
| | 3,440 |
| | (819 | ) | | 2/7/2014 | | 1994 |
| Thorntons Oil | | Summit | | IL | | — |
| | 2,233 |
| | 109 |
| | — |
| | 2,342 |
| | (38 | ) | | 2/7/2014 | | 2000 |
| Thorntons Oil | | Waukegan | | IL | | — |
| | 875 |
| | 1,421 |
| | — |
| | 2,296 |
| | (416 | ) | | 2/7/2014 | | 1999 |
| Thorntons Oil | | Westmont | | IL | | — |
| | 760 |
| | 3,069 |
| | — |
| | 3,829 |
| | (852 | ) | | 2/7/2014 | | 1997 |
| Thorntons Oil | | Clarksville | | IN | | — |
| | 1,319 |
| | 687 |
| | — |
| | 2,006 |
| | (238 | ) | | 2/7/2014 | | 2005 |
| | | | | | Initial Costs (1) | | Costs Capitalized Subsequent to Acquisition (2) | | Gross Amount
Carried at
December 31, 2016
(3) (4) | | | | | | Initial Costs (1) | | Costs Capitalized Subsequent to Acquisition (2) | | Gross Amount
Carried at
December 31, 2018
(3) (4) | | | |
| Property | | City | | State | | Encumbrances at
December 31, 2016 | | Land | | Buildings, Fixtures and Improvements | | Accumulated Depreciation
(3) (5) | | Date Acquired | | Date of Construction | | City | | State | | Encumbrances at
December 31, 2018 | | Land | | Buildings, Fixtures and Improvements | | Accumulated Depreciation
(3) (5) | | Date Acquired | | Date of Construction |
| Thorntons Oil | | | Edinburgh | | IN | | — |
| | 685 |
| | 1,505 |
| | — |
| | 2,190 |
| | (443 | ) | | 2/7/2014 | | 1996 |
| Thorntons Oil | | | Evansville | | IN | | — |
| | 467 |
| | 1,479 |
| | — |
| | 1,946 |
| | (443 | ) | | 2/7/2014 | | 1987 |
| Thorntons Oil | | | Evansville | | IN | | — |
| | 602 |
| | 1,398 |
| | — |
| | 2,000 |
| | (415 | ) | | 2/7/2014 | | 1990 |
| Thorntons Oil | | | Jeffersonville | | IN | | — |
| | 1,233 |
| | 1,533 |
| | — |
| | 2,766 |
| | (486 | ) | | 2/7/2014 | | 1995 |
| Thorntons Oil | | | Terre Haute | | IN | | — |
| | 732 |
| | 1,829 |
| | — |
| | 2,561 |
| | (555 | ) | | 2/7/2014 | | 1995 |
| Thorntons Oil | | | Henderson | | KY | | — |
| | 659 |
| | 3,271 |
| | — |
| | 3,930 |
| | (949 | ) | | 2/7/2014 | | 1971 |
| Thorntons Oil | | | Henderson | | KY | | — |
| | 483 |
| | 1,778 |
| | — |
| | 2,261 |
| | (472 | ) | | 2/7/2014 | | 2007 |
| Thorntons Oil | | | Louisville | | KY | | — |
| | 637 |
| | 1,680 |
| | — |
| | 2,317 |
| | (442 | ) | | 2/7/2014 | | 1994 |
| Thorntons Oil | | | Shelbyville | | KY | | — |
| | 299 |
| | 2,036 |
| | — |
| | 2,335 |
| | (569 | ) | | 2/7/2014 | | 1991 |
| Thorntons Oil | | | Galloway | | OH | | — |
| | 547 |
| | 1,550 |
| | — |
| | 2,097 |
| | (439 | ) | | 2/7/2014 | | 1998 |
| Tiffany & Co. | | | Parsippany | | NJ | | — |
| | 2,248 |
| | 81,081 |
| | — |
| | 83,329 |
| | (25,106 | ) | | 11/5/2013 | | 1997 |
| Tilted Kilt | | | Hendersonville | | TN | | — |
| | 310 |
| | 763 |
| | — |
| | 1,073 |
| | (230 | ) | | 6/27/2013 | | 1995 |
| Time Warner Cable | | | Milwaukee | | WI | | — |
| | 3,081 |
| | 22,512 |
| | 1,095 |
| | 26,688 |
| | (6,037 | ) | | 11/5/2013 | | 2001 |
| Tire Kingdom | | | Auburndale | | FL | | 1,204 |
| | 609 |
| | 1,571 |
| | — |
| | 2,180 |
| | (420 | ) | | 2/7/2014 | | 2010 |
| Tire Kingdom | | | Dublin | | OH | | — |
| | 373 |
| | 1,119 |
| | — |
| | 1,492 |
| | (393 | ) | | 4/30/2012 | | 2003 |
| Tire Kingdom | | | Greenville | | SC | | — |
| | 499 |
| | 1,367 |
| | — |
| | 1,866 |
| | (380 | ) | | 3/28/2014 | | 1997 |
| Tire Warehouse | | | Fitchburg | | MA | | — |
| | 203 |
| | 704 |
| | — |
| | 907 |
| | (209 | ) | | 6/27/2013 | | 1982 |
| Tire Warehouse | | | Bangor | | ME | | — |
| | 289 |
| | 1,400 |
| | — |
| | 1,689 |
| | (414 | ) | | 6/27/2013 | | 1977 |
| Tires Plus | | | Duluth | | GA | | — |
| | 777 |
| | 1,259 |
| | — |
| | 2,036 |
| | (361 | ) | | 2/21/2014 | | 2001 |
| TitleMax | | | Gainesville | | GA | | — |
| | 221 |
| | 270 |
| | — |
| | 491 |
| | (84 | ) | | 7/31/2013 | | 2007 |
| TJ Maxx | | | Philadelphia | | PA | | — |
| | 9,889 |
| | 84,953 |
| | — |
| | 94,842 |
| | (26,305 | ) | | 11/5/2013 | | 2001 |
| T-Mobile | | | Nashville | | TN | | — |
| | 1,190 |
| | 15,847 |
| | 691 |
| | 17,728 |
| | (4,031 | ) | | 11/5/2013 | | 2002 |
| Topgolf | | | Brooklyn Center | | MN | | — |
| | 8,173 |
| | 24,628 |
| | — |
| | 32,801 |
| | (129 | ) | | 11/2/2018 | | 2018 |
| Tractor Supply | | Auburn | | CA | | — |
| | 1,175 |
| | 2,901 |
| | — |
| | 4,076 |
| | (383 | ) | | 2/7/2014 | | 2012 | | Oneonta | | AL | | — |
| | 359 |
| | 1,438 |
| | — |
| | 1,797 |
| | (377 | ) | | 4/18/2013 | | 1983 |
| Tractor Supply | | Dixon | | CA | | 2,962 |
| | 1,619 |
| | 4,044 |
| | — |
| | 5,663 |
| | (538 | ) | | 2/7/2014 | | 2007 | | Summerdale | | AL | | 1,154 |
| | 276 |
| | 2,470 |
| | — |
| | 2,746 |
| | (538 | ) | | 2/7/2014 | | 2010 |
| Tractor Supply | | Jackson | | CA | | — |
| | 1,209 |
| | 3,640 |
| | — |
| | 4,849 |
| | (459 | ) | | 2/7/2014 | | 2012 | | Tuscaloosa | | AL | | — |
| | 746 |
| | 1,979 |
| | — |
| | 2,725 |
| | (429 | ) | | 2/7/2014 | | 2012 |
| Tractor Supply | | Los Banos | | CA | | 3,469 |
| | 1,213 |
| | 3,638 |
| | — |
| | 4,851 |
| | (672 | ) | | 2/28/2013 | | 2009 | | Little Rock | | AR | | 1,500 |
| | 930 |
| | 2,035 |
| | — |
| | 2,965 |
| | (441 | ) | | 2/7/2014 | | 2009 |
| Tractor Supply | | Middletown | | DE | | — |
| | 1,487 |
| | 3,293 |
| | — |
| | 4,780 |
| | (407 | ) | | 2/7/2014 | | 2007 | | Auburn | | CA | | — |
| | 1,175 |
| | 2,901 |
| | — |
| | 4,076 |
| | (649 | ) | | 2/7/2014 | | 2012 |
| Tractor Supply | | Mims | | FL | | — |
| | 310 |
| | 2,787 |
| | — |
| | 3,097 |
| | (426 | ) | | 10/10/2013 | | 2012 | | Dixon | | CA | | 2,962 |
| | 1,619 |
| | 4,044 |
| | — |
| | 5,663 |
| | (912 | ) | | 2/7/2014 | | 2007 |
| Tractor Supply | | Bainbridge | | GA | | — |
| | 687 |
| | 2,445 |
| | — |
| | 3,132 |
| | (300 | ) | | 2/7/2014 | | 2008 | | Jackson | | CA | | — |
| | 1,209 |
| | 3,640 |
| | — |
| | 4,849 |
| | (778 | ) | | 2/7/2014 | | 2012 |
| Tractor Supply | | Rincon | | GA | | — |
| | 978 |
| | 2,016 |
| | — |
| | 2,994 |
| | (249 | ) | | 2/7/2014 | | 2007 | | Los Banos | | CA | | 3,468 |
| | 1,213 |
| | 3,638 |
| | — |
| | 4,851 |
| | (974 | ) | | 2/28/2013 | | 2009 |
| Tractor Supply | | Alton | | IL | | 1,404 |
| | 565 |
| | 3,062 |
| | 59 |
| | 3,686 |
| | (384 | ) | | 2/7/2014 | | 2008 | | Buena Vista | | CO | | — |
| | 646 |
| | 2,974 |
| | — |
| | 3,620 |
| | (138 | ) | | 6/16/2017 | | 2014 |
| Tractor Supply | | Mishawaka | | IN | | — |
| | 620 |
| | 2,683 |
| | — |
| | 3,303 |
| | (339 | ) | | 2/7/2014 | | 2011 | |
| Tractor Supply | | Sellersburg | | IN | | 1,433 |
| | 762 |
| | 2,146 |
| | — |
| | 2,908 |
| | (280 | ) | | 2/7/2014 | | 2010 | |
| Tractor Supply | | St. John | | IN | | 2,247 |
| | 1,715 |
| | 3,397 |
| | — |
| | 5,112 |
| | (455 | ) | | 2/7/2014 | | 2007 | |
| Tractor Supply | | Lawrence | | KS | | 1,377 |
| | 361 |
| | 2,637 |
| | — |
| | 2,998 |
| | (340 | ) | | 2/7/2014 | | 2010 | |
| Tractor Supply | | Topeka | | KS | | 1,678 |
| | 446 |
| | 1,785 |
| | — |
| | 2,231 |
| | (280 | ) | | 5/19/2014 | | 2006 | |
| Tractor Supply | | Glasgow | | KY | | — |
| | 453 |
| | 1,812 |
| | — |
| | 2,265 |
| | (279 | ) | | 5/19/2014 | | 2005 | |
| Tractor Supply | | Grayson | | KY | | — |
| | 540 |
| | 2,709 |
| | — |
| | 3,249 |
| | (347 | ) | | 2/7/2014 | | 2011 | |
| Tractor Supply | | Paducah | | KY | | — |
| | 393 |
| | 1,574 |
| | — |
| | 1,967 |
| | (249 | ) | | 5/19/2014 | | 1995 | |
| Tractor Supply | | Gray | | LA | | 2,049 |
| | 550 |
| | 2,202 |
| | — |
| | 2,752 |
| | (459 | ) | | 8/7/2012 | | 2011 | |
| Tractor Supply | | Belchertown | | MA | | 1,823 |
| | 1,148 |
| | 3,179 |
| | — |
| | 4,327 |
| | (423 | ) | | 2/7/2014 | | 2009 | |
| Tractor Supply | | Millbury | | MA | | — |
| | 806 |
| | 3,094 |
| | — |
| | 3,900 |
| | (359 | ) | | 6/26/2014 | | 2013 | |
| Tractor Supply | | Southwick | | MA | | 2,428 |
| | 1,601 |
| | 3,583 |
| | — |
| | 5,184 |
| | (474 | ) | | 2/7/2014 | | 2008 | |
| Tractor Supply | | Augusta | | ME | | 1,423 |
| | 530 |
| | 2,756 |
| | — |
| | 3,286 |
| | (363 | ) | | 2/7/2014 | | 2009 | |
| Tractor Supply | | Jonesville | | MI | | — |
| | 267 |
| | 2,364 |
| | — |
| | 2,631 |
| | (329 | ) | | 3/28/2014 | | 2005 | |
| Tractor Supply | | Negaunee | | MI | | — |
| | 488 |
| | 1,953 |
| | — |
| | 2,441 |
| | (423 | ) | | 6/12/2012 | | 2010 | |
| Tractor Supply | | Jefferson City | | MO | | 1,125 |
| | 490 |
| | 1,877 |
| | — |
| | 2,367 |
| | (238 | ) | | 2/7/2014 | | 2009 | |
| Tractor Supply | | Nixa | | MO | | 1,346 |
| | 476 |
| | 2,040 |
| | — |
| | 2,516 |
| | (266 | ) | | 2/7/2014 | | 2009 | |
| Tractor Supply | | Sedalia | | MO | | 1,090 |
| | 480 |
| | 1,782 |
| | — |
| | 2,262 |
| | (238 | ) | | 2/7/2014 | | 2010 | |
| Tractor Supply | | Troy | | MO | | 1,286 |
| | 730 |
| | 2,587 |
| | — |
| | 3,317 |
| | (325 | ) | | 2/7/2014 | | 2009 | |
| Tractor Supply | | Union | | MO | | 1,404 |
| | 589 |
| | 3,012 |
| | 13 |
| | 3,614 |
| | (369 | ) | | 2/7/2014 | | 2008 | |
| Tractor Supply | | Franklin | | NC | | 1,480 |
| | 434 |
| | 2,629 |
| | — |
| | 3,063 |
| | (337 | ) | | 2/7/2014 | | 2009 | |
| Tractor Supply | | Murphy | | NC | | 1,402 |
| | 990 |
| | 2,090 |
| | — |
| | 3,080 |
| | (281 | ) | | 2/7/2014 | | 2010 | |
| Tractor Supply | | Plaistow | | NH | | — |
| | 638 |
| | 2,552 |
| | — |
| | 3,190 |
| | (390 | ) | | 10/10/2013 | | 2012 | |
|
| | | | | | | | | | | | | | | | | | | | | | | | | | |
| | | | | | | | Initial Costs (1) | | Costs Capitalized Subsequent to Acquisition (2) | | Gross Amount
Carried at
December 31, 2018
(3) (4) | | | | | | |
| Property | | City | | State | | Encumbrances at
December 31, 2018 | | Land | | Buildings, Fixtures and Improvements | | | Accumulated Depreciation
(3) (5) | | Date Acquired | | Date of Construction |
| Tractor Supply | | Middletown | | DE | | — |
| | 1,487 |
| | 3,293 |
| | — |
| | 4,780 |
| | (690 | ) | | 2/7/2014 | | 2007 |
| Tractor Supply | | Mims | | FL | | — |
| | 310 |
| | 2,787 |
| | — |
| | 3,097 |
| | (684 | ) | | 10/10/2013 | | 2012 |
| Tractor Supply | | Bainbridge | | GA | | — |
| | 687 |
| | 2,445 |
| | — |
| | 3,132 |
| | (508 | ) | | 2/7/2014 | | 2008 |
| Tractor Supply | | Rincon | | GA | | — |
| | 978 |
| | 2,016 |
| | — |
| | 2,994 |
| | (421 | ) | | 2/7/2014 | | 2007 |
| Tractor Supply | | Alton | | IL | | 1,404 |
| | 565 |
| | 3,062 |
| | 59 |
| | 3,686 |
| | (653 | ) | | 2/7/2014 | | 2008 |
| Tractor Supply | | Mishawaka | | IN | | — |
| | 620 |
| | 2,683 |
| | — |
| | 3,303 |
| | (575 | ) | | 2/7/2014 | | 2011 |
| Tractor Supply | | Sellersburg | | IN | | 1,433 |
| | 762 |
| | 2,146 |
| | — |
| | 2,908 |
| | (475 | ) | | 2/7/2014 | | 2010 |
| Tractor Supply | | St. John | | IN | | 2,247 |
| | 1,715 |
| | 3,397 |
| | — |
| | 5,112 |
| | (772 | ) | | 2/7/2014 | | 2007 |
| Tractor Supply | | Lawrence | | KS | | 1,377 |
| | 361 |
| | 2,637 |
| | — |
| | 2,998 |
| | (577 | ) | | 2/7/2014 | | 2010 |
| Tractor Supply | | Topeka | | KS | | — |
| | 446 |
| | 1,785 |
| | — |
| | 2,231 |
| | (495 | ) | | 5/19/2014 | | 2006 |
| Tractor Supply | | Glasgow | | KY | | — |
| | 453 |
| | 1,812 |
| | — |
| | 2,265 |
| | (494 | ) | | 5/19/2014 | | 2005 |
| Tractor Supply | | Grayson | | KY | | — |
| | 540 |
| | 2,709 |
| | — |
| | 3,249 |
| | (588 | ) | | 2/7/2014 | | 2011 |
| Tractor Supply | | Paducah | | KY | | — |
| | 393 |
| | 1,574 |
| | — |
| | 1,967 |
| | (441 | ) | | 5/19/2014 | | 1995 |
| Tractor Supply | | Gray | | LA | | 2,048 |
| | 550 |
| | 2,202 |
| | — |
| | 2,752 |
| | (627 | ) | | 8/7/2012 | | 2011 |
| Tractor Supply | | Belchertown | | MA | | 1,823 |
| | 1,148 |
| | 3,179 |
| | — |
| | 4,327 |
| | (717 | ) | | 2/7/2014 | | 2009 |
| Tractor Supply | | Millbury | | MA | | — |
| | 806 |
| | 3,094 |
| | — |
| | 3,900 |
| | (642 | ) | | 6/26/2014 | | 2013 |
| Tractor Supply | | Southwick | | MA | | 2,428 |
| | 1,601 |
| | 3,583 |
| | — |
| | 5,184 |
| | (804 | ) | | 2/7/2014 | | 2008 |
| Tractor Supply | | Augusta | | ME | | 1,423 |
| | 530 |
| | 2,756 |
| | — |
| | 3,286 |
| | (616 | ) | | 2/7/2014 | | 2009 |
| Tractor Supply | | Jonesville | | MI | | — |
| | 267 |
| | 2,364 |
| | — |
| | 2,631 |
| | (565 | ) | | 3/28/2014 | | 2005 |
| Tractor Supply | | Negaunee | | MI | | — |
| | 488 |
| | 1,953 |
| | — |
| | 2,441 |
| | (567 | ) | | 6/12/2012 | | 2010 |
| Tractor Supply | | Jefferson City | | MO | | 1,125 |
| | 490 |
| | 1,877 |
| | 73 |
| | 2,440 |
| | (404 | ) | | 2/7/2014 | | 2009 |
| Tractor Supply | | Nixa | | MO | | 1,346 |
| | 476 |
| | 2,040 |
| | — |
| | 2,516 |
| | (452 | ) | | 2/7/2014 | | 2009 |
| Tractor Supply | | Sedalia | | MO | | 1,090 |
| | 480 |
| | 1,782 |
| | — |
| | 2,262 |
| | (404 | ) | | 2/7/2014 | | 2010 |
| Tractor Supply | | Troy | | MO | | 1,286 |
| | 730 |
| | 2,587 |
| | — |
| | 3,317 |
| | (551 | ) | | 2/7/2014 | | 2009 |
| Tractor Supply | | Union | | MO | | 1,404 |
| | 589 |
| | 3,012 |
| | 13 |
| | 3,614 |
| | (628 | ) | | 2/7/2014 | | 2008 |
| Tractor Supply | | Franklin | | NC | | 1,479 |
| | 434 |
| | 2,629 |
| | — |
| | 3,063 |
| | (572 | ) | | 2/7/2014 | | 2009 |
| Tractor Supply | | Murphy | | NC | | 1,402 |
| | 990 |
| | 2,090 |
| | — |
| | 3,080 |
| | (476 | ) | | 2/7/2014 | | 2010 |
| Tractor Supply | | York | | NE | | — |
| | 326 |
| | 2,452 |
| | — |
| | 2,778 |
| | (88 | ) | | 11/3/2017 | | 2017 |
| Tractor Supply | | Plaistow | | NH | | — |
| | 638 |
| | 2,552 |
| | — |
| | 3,190 |
| | (626 | ) | | 10/10/2013 | | 2012 |
| | | | | | Initial Costs (1) | | Costs Capitalized Subsequent to Acquisition (2) | | Gross Amount
Carried at
December 31, 2016
(3) (4) | | | | | | Initial Costs (1) | | Costs Capitalized Subsequent to Acquisition (2) | | Gross Amount
Carried at
December 31, 2018
(3) (4) | | | |
| Property | | City | | State | | Encumbrances at
December 31, 2016 | | Land | | Buildings, Fixtures and Improvements | | Accumulated Depreciation
(3) (5) | | Date Acquired | | Date of Construction | | City | | State | | Encumbrances at
December 31, 2018 | | Land | | Buildings, Fixtures and Improvements | | Accumulated Depreciation
(3) (5) | | Date Acquired | | Date of Construction |
| Tractor Supply | | | Plymouth | | NH | | 2,074 |
| | 424 |
| | 2,430 |
| | 16 |
| | 2,870 |
| | (668 | ) | | 11/29/2012 | | 2011 |
| Tractor Supply | | Plymouth | | NH | | 2,074 |
| | 424 |
| | 2,430 |
| | 16 |
| | 2,870 |
| | (474 | ) | | 11/29/2012 | | 2011 | | Allentown | | NJ | | — |
| | 697 |
| | 3,949 |
| | — |
| | 4,646 |
| | (1,201 | ) | | 1/27/2012 | | 2008 |
| Tractor Supply | | Allentown | | NJ | | — |
| | 697 |
| | 3,949 |
| | — |
| | 4,646 |
| | (933 | ) | | 1/27/2012 | | 2008 | | Sicklerville | | NJ | | — |
| | 1,931 |
| | 4,302 |
| | — |
| | 6,233 |
| | (906 | ) | | 2/7/2014 | | 2009 |
| Tractor Supply | | Sicklerville | | NJ | | — |
| | 1,931 |
| | 4,302 |
| | — |
| | 6,233 |
| | (534 | ) | | 2/7/2014 | | 2009 | | Farmington | | NM | | — |
| | 1,091 |
| | 2,194 |
| | — |
| | 3,285 |
| | (525 | ) | | 3/28/2014 | | 2012 |
| Tractor Supply | | Farmington | | NM | | — |
| | 1,091 |
| | 2,194 |
| | — |
| | 3,285 |
| | (306 | ) | | 3/28/2014 | | 2012 | | Roswell | | NM | | — |
| | 947 |
| | 2,181 |
| | — |
| | 3,128 |
| | (480 | ) | | 2/7/2014 | | 2009 |
| Tractor Supply | | Roswell | | NM | | — |
| | 947 |
| | 2,181 |
| | — |
| | 3,128 |
| | (283 | ) | | 2/7/2014 | | 2009 | | Silver City | | NM | | — |
| | 716 |
| | 2,380 |
| | — |
| | 3,096 |
| | (569 | ) | | 3/28/2014 | | 2012 |
| Tractor Supply | | Silver City | | NM | | — |
| | 716 |
| | 2,380 |
| | — |
| | 3,096 |
| | (332 | ) | | 3/28/2014 | | 2012 | | Macedon | | NY | | — |
| | 168 |
| | 1,591 |
| | — |
| | 1,759 |
| | (374 | ) | | 4/29/2014 | | 1992 |
| Tractor Supply | | Macedon | | NY | | — |
| | 168 |
| | 1,591 |
| | — |
| | 1,759 |
| | (215 | ) | | 4/29/2014 | | 1992 | | Hamilton | | OH | | 932 |
| | 675 |
| | 1,472 |
| | — |
| | 2,147 |
| | (462 | ) | | 2/7/2014 | | 1975 |
| Tractor Supply | | Hamilton | | OH | | 932 |
| | 675 |
| | 1,472 |
| | — |
| | 2,147 |
| | (273 | ) | | 2/7/2014 | | 1975 | | Wauseon | | OH | | 1,374 |
| | 931 |
| | 2,128 |
| | — |
| | 3,059 |
| | (491 | ) | | 2/7/2014 | | 2007 |
| Tractor Supply | | Wauseon | | OH | | 1,374 |
| | 931 |
| | 2,128 |
| | — |
| | 3,059 |
| | (290 | ) | | 2/7/2014 | | 2007 | | Chickasha | | OK | | — |
| | 599 |
| | 2,056 |
| | 538 |
| | 3,193 |
| | (560 | ) | | 3/28/2014 | | 2014 |
| Tractor Supply | | Chickasha | | OK | | — |
| | 599 |
| | 2,056 |
| | 160 |
| | 2,815 |
| | (296 | ) | | 3/28/2014 | | 2014 | | Glenpool | | OK | | 1,180 |
| | 359 |
| | 2,447 |
| | — |
| | 2,806 |
| | (522 | ) | | 2/7/2014 | | 2009 |
| Tractor Supply | | Glenpool | | OK | | 1,180 |
| | 359 |
| | 2,447 |
| | — |
| | 2,806 |
| | (308 | ) | | 2/7/2014 | | 2009 | | Stillwater | | OK | | 1,205 |
| | 205 |
| | 2,715 |
| | — |
| | 2,920 |
| | (576 | ) | | 2/7/2014 | | 2009 |
| Tractor Supply | | Stillwater | | OK | | 1,205 |
| | 205 |
| | 2,715 |
| | — |
| | 2,920 |
| | (340 | ) | | 2/7/2014 | | 2009 | | Gibsonia | | PA | | 1,648 |
| | 1,044 |
| | 2,778 |
| | — |
| | 3,822 |
| | (613 | ) | | 2/7/2014 | | 2009 |
| Tractor Supply | | Gibsonia | | PA | | 1,648 |
| | 1,044 |
| | 2,778 |
| | — |
| | 3,822 |
| | (362 | ) | | 2/7/2014 | | 2009 | | Columbia | | SC | | — |
| | 952 |
| | 2,222 |
| | — |
| | 3,174 |
| | (465 | ) | | 2/7/2014 | | 2011 |
| Tractor Supply | | Columbia | | SC | | — |
| | 952 |
| | 2,222 |
| | — |
| | 3,174 |
| | (274 | ) | | 2/7/2014 | | 2011 | | Irmo | | SC | | — |
| | 725 |
| | 2,171 |
| | 62 |
| | 2,958 |
| | (483 | ) | | 2/7/2014 | | 2009 |
| Tractor Supply | | Irmo | | SC | | — |
| | 725 |
| | 2,171 |
| | 62 |
| | 2,958 |
| | (281 | ) | | 2/7/2014 | | 2009 | | Ballinger | | TX | | 1,248 |
| | 476 |
| | 2,477 |
| | — |
| | 2,953 |
| | (512 | ) | | 2/7/2014 | | 2010 |
| Tractor Supply | | Ballinger | | TX | | 1,248 |
| | 476 |
| | 2,477 |
| | — |
| | 2,953 |
| | (302 | ) | | 2/7/2014 | | 2010 | | Del Rio | | TX | | — |
| | 927 |
| | 2,044 |
| | — |
| | 2,971 |
| | (435 | ) | | 2/7/2014 | | 2009 |
| Tractor Supply | | Del Rio | | TX | | — |
| | 927 |
| | 2,044 |
| | — |
| | 2,971 |
| | (256 | ) | | 2/7/2014 | | 2009 | | Edinburg | | TX | | — |
| | 768 |
| | 3,163 |
| | — |
| | 3,931 |
| | (650 | ) | | 2/7/2014 | | 2009 |
| Tractor Supply | | Edinburg | | TX | | — |
| | 768 |
| | 3,163 |
| | — |
| | 3,931 |
| | (383 | ) | | 2/7/2014 | | 2009 | | Kenedy | | TX | | 1,163 |
| | 309 |
| | 2,372 |
| | — |
| | 2,681 |
| | (488 | ) | | 2/7/2014 | | 2010 |
| Tractor Supply | | Kenedy | | TX | | 1,197 |
| | 309 |
| | 2,372 |
| | — |
| | 2,681 |
| | (288 | ) | | 2/7/2014 | | 2010 | | Pearsall | | TX | | 1,144 |
| | 318 |
| | 2,551 |
| | — |
| | 2,869 |
| | (531 | ) | | 2/7/2014 | | 2009 |
| Tractor Supply | | Pearsall | | TX | | 1,177 |
| | 318 |
| | 2,551 |
| | — |
| | 2,869 |
| | (313 | ) | | 2/7/2014 | | 2009 | | Rio Grande | | TX | | — |
| | 469 |
| | 1,095 |
| | — |
| | 1,564 |
| | (318 | ) | | 6/19/2012 | | 1993 |
| Tractor Supply | | Rio Grande | | TX | | — |
| | 469 |
| | 1,095 |
| | — |
| | 1,564 |
| | (237 | ) | | 6/19/2012 | | 1993 | | Woodstock | | VA | | — |
| | 524 |
| | 2,098 |
| | — |
| | 2,622 |
| | (558 | ) | | 5/19/2014 | | 2004 |
| Tractor Supply | | Woodstock | | VA | | — |
| | 524 |
| | 2,098 |
| | — |
| | 2,622 |
| | (315 | ) | | 5/19/2014 | | 2004 | | Romney | | WV | | — |
| | 418 |
| | 3,097 |
| | — |
| | 3,515 |
| | (103 | ) | | 11/29/2017 | | 2017 |
| Trader Joe's | | Sarasota | | FL | | — |
| | 1,646 |
| | 5,416 |
| | — |
| | 7,062 |
| | (822 | ) | | 2/7/2014 | | 2012 | | Sarasota | | FL | | — |
| | 1,646 |
| | 5,416 |
| | — |
| | 7,062 |
| | (1,394 | ) | | 2/7/2014 | | 2012 |
| Trader Joe's | | Lexington | | KY | | — |
| | 2,287 |
| | 3,795 |
| | — |
| | 6,082 |
| | (601 | ) | | 2/7/2014 | | 2012 | | Lexington | | KY | | — |
| | 2,287 |
| | 3,795 |
| | — |
| | 6,082 |
| | (1,020 | ) | | 2/7/2014 | | 2012 |
| Tumbleweed | | Terre Haute | | IN | | — |
| | 434 |
| | 1,303 |
| | — |
| | 1,737 |
| | (268 | ) | | 7/31/2013 | | 1997 | | Terre Haute | | IN | | — |
| | 434 |
| | 1,303 |
| | — |
| | 1,737 |
| | (407 | ) | | 7/31/2013 | | 1997 |
| Tumbleweed | | Louisville | | KY | | — |
| | 468 |
| | 1,404 |
| | — |
| | 1,872 |
| | (289 | ) | | 7/31/2013 | | 2001 | | Louisville | | KY | | — |
| | 468 |
| | 1,404 |
| | — |
| | 1,872 |
| | (438 | ) | | 7/31/2013 | | 2001 |
| Tumbleweed | | Mayesville | | KY | | — |
| | 353 |
| | 823 |
| | — |
| | 1,176 |
| | (169 | ) | | 7/31/2013 | | 2000 | | Mayesville | | KY | | — |
| | 353 |
| | 823 |
| | — |
| | 1,176 |
| | (257 | ) | | 7/31/2013 | | 2000 |
| Tumbleweed | | Owensboro | | KY | | — |
| | 355 |
| | 1,420 |
| | — |
| | 1,775 |
| | (292 | ) | | 7/31/2013 | | 1997 | | Owensboro | | KY | | — |
| | 355 |
| | 1,420 |
| | — |
| | 1,775 |
| | (443 | ) | | 7/31/2013 | | 1997 |
| Tumbleweed | | Bellefontaine | | OH | | — |
| | 234 |
| | 938 |
| | — |
| | 1,172 |
| | (193 | ) | | 7/31/2013 | | 1999 | | Bellefontaine | | OH | | — |
| | 234 |
| | 938 |
| | — |
| | 1,172 |
| | (293 | ) | | 7/31/2013 | | 1999 |
| Tumbleweed | | Springfield | | OH | | — |
| | 549 |
| | 1,280 |
| | — |
| | 1,829 |
| | (263 | ) | | 7/31/2013 | | 1998 | | Springfield | | OH | | — |
| | 549 |
| | 1,280 |
| | — |
| | 1,829 |
| | (399 | ) | | 7/31/2013 | | 1998 |
| Tumbleweed | | Wooster | | OH | | — |
| | 342 |
| | 799 |
| | — |
| | 1,141 |
| | (164 | ) | | 7/31/2013 | | 1997 | | Wooster | | OH | | — |
| | 342 |
| | 799 |
| | — |
| | 1,141 |
| | (249 | ) | | 7/31/2013 | | 1997 |
| Tumbleweed | | Zanesville | | OH | | — |
| | 639 |
| | 1,491 |
| | — |
| | 2,130 |
| | (307 | ) | | 7/31/2013 | | 1998 | |
| | | | | | Initial Costs (1) | | Costs Capitalized Subsequent to Acquisition (2) | | Gross Amount
Carried at
December 31, 2016
(3) (4) | | | | | | Initial Costs (1) | | Costs Capitalized Subsequent to Acquisition (2) | | Gross Amount
Carried at
December 31, 2018
(3) (4) | | | |
| Property | | City | | State | | Encumbrances at
December 31, 2016 | | Land | | Buildings, Fixtures and Improvements | | Accumulated Depreciation
(3) (5) | | Date Acquired | | Date of Construction | | City | | State | | Encumbrances at
December 31, 2018 | | Land | | Buildings, Fixtures and Improvements | | Accumulated Depreciation
(3) (5) | | Date Acquired | | Date of Construction |
| Tumbleweed | | | Zanesville | | OH | | — |
| | 639 |
| | 1,491 |
| | — |
| | 2,130 |
| | (465 | ) | | 7/31/2013 | | 1998 |
| Tutor Time | | Downingtown | | PA | | — |
| | 205 |
| | 2,788 |
| | — |
| | 2,993 |
| | (417 | ) | | 2/7/2014 | | 1998 | | Downingtown | | PA | | — |
| | 205 |
| | 2,788 |
| | — |
| | 2,993 |
| | (707 | ) | | 2/7/2014 | | 1998 |
| Tutor Time | | Austin | | TX | | — |
| | 417 |
| | 1,861 |
| | — |
| | 2,278 |
| | (294 | ) | | 2/7/2014 | | 2000 | | Austin | | TX | | — |
| | 417 |
| | 1,861 |
| | — |
| | 2,278 |
| | (498 | ) | | 2/7/2014 | | 2000 |
| Ulta Salon | | Jonesboro | | AR | | — |
| | 742 |
| | 2,289 |
| | — |
| | 3,031 |
| | (313 | ) | | 2/7/2014 | | 2013 | |
| Ulta Salon | | Fort Gratiot | | MI | | — |
| | 164 |
| | 2,083 |
| | — |
| | 2,247 |
| | (294 | ) | | 2/7/2014 | | 2012 | |
| Ulta Salon | | Jackson | | TN | | 1,454 |
| | 547 |
| | 2,123 |
| | — |
| | 2,670 |
| | (297 | ) | | 2/7/2014 | | 2010 | |
| Ulta Beauty | | | Jonesboro | | AR | | — |
| | 742 |
| | 2,289 |
| | — |
| | 3,031 |
| | (531 | ) | | 2/7/2014 | | 2013 |
| Ulta Beauty | | | Fort Gratiot | | MI | | — |
| | 164 |
| | 2,083 |
| | — |
| | 2,247 |
| | (498 | ) | | 2/7/2014 | | 2012 |
| Ulta Beauty | | | Jackson | | TN | | 1,454 |
| | 547 |
| | 2,123 |
| | — |
| | 2,670 |
| | (503 | ) | | 2/7/2014 | | 2010 |
| United Buffet and Grille | | | Hagerstown | | MD | | — |
| | 244 |
| | 1,306 |
| | (1,505 | ) | | 45 |
| | (20 | ) | | 1/8/2014 | | 2001 |
| United Technologies | | Bradenton | | FL | | 10,050 |
| | 2,692 |
| | 17,973 |
| | — |
| | 20,665 |
| | (2,203 | ) | | 2/7/2014 | | 2004 | | Bradenton | | FL | | — |
| | 2,692 |
| | 17,973 |
| | — |
| | 20,665 |
| | (3,735 | ) | | 2/7/2014 | | 2004 |
| University Plaza | | Flagstaff | | AZ | | — |
| | 4,727 |
| | 18,087 |
| | 114 |
| | 22,928 |
| | (3,356 | ) | | 2/7/2014 | | 1982 | | Flagstaff | | AZ | | — |
| | 4,727 |
| | 18,087 |
| | 501 |
| | 23,315 |
| | (5,588 | ) | | 2/7/2014 | | 1982 |
| The UPS Store | | | Elizabethtown | | KY | | — |
| | 1,460 |
| | 10,336 |
| | 778 |
| | 12,574 |
| | (3,251 | ) | | 9/24/2013 | | 2001 |
| US Bank | | Alsip | | IL | | — |
| | 226 |
| | 1,280 |
| | — |
| | 1,506 |
| | (418 | ) | | 8/1/2010 | | 1981 | | Alsip | | IL | | — |
| | 226 |
| | 1,280 |
| | — |
| | 1,506 |
| | (472 | ) | | 8/1/2010 | | 1981 |
| US Bank | | Calumet City | | IL | | 334 |
| | 168 |
| | 393 |
| | — |
| | 561 |
| | (99 | ) | | 4/26/2012 | | 1975 | | Chicago | | IL | | — |
| | 267 |
| | 1,511 |
| | — |
| | 1,778 |
| | (558 | ) | | 8/1/2010 | | 1923 |
| US Bank | | Chicago | | IL | | 172 |
| | 189 |
| | 81 |
| | — |
| | 270 |
| | (20 | ) | | 4/26/2012 | | 1990 | | Chicago | | IL | | — |
| | 191 |
| | 1,082 |
| | — |
| | 1,273 |
| | (399 | ) | | 8/1/2010 | | 1979 |
| US Bank | | Chicago | | IL | | — |
| | 267 |
| | 1,511 |
| | — |
| | 1,778 |
| | (494 | ) | | 8/1/2010 | | 1923 | | Chicago Heights | | IL | | — |
| | 182 |
| | 1,637 |
| | — |
| | 1,819 |
| | (482 | ) | | 1/24/2013 | | 1996 |
| US Bank | | Chicago | | IL | | — |
| | 191 |
| | 1,082 |
| | — |
| | 1,273 |
| | (353 | ) | | 8/1/2010 | | 1979 | | Elmwood Park | | IL | | — |
| | 431 |
| | 2,441 |
| | — |
| | 2,872 |
| | (867 | ) | | 8/1/2010 | | 1984 |
| US Bank | | Chicago Heights | | IL | | — |
| | 182 |
| | 1,637 |
| | — |
| | 1,819 |
| | (347 | ) | | 1/24/2013 | | 1996 | | Evergreen Park | | IL | | — |
| | 167 |
| | 944 |
| | — |
| | 1,111 |
| | (349 | ) | | 8/1/2010 | | 1984 |
| US Bank | | Elmwood Park | | IL | | — |
| | 431 |
| | 2,441 |
| | — |
| | 2,872 |
| | (763 | ) | | 8/1/2010 | | 1984 | | Lyons | | IL | | — |
| | 214 |
| | 1,212 |
| | — |
| | 1,426 |
| | (447 | ) | | 8/1/2010 | | 1959 |
| US Bank | | Evergreen Park | | IL | | — |
| | 167 |
| | 944 |
| | — |
| | 1,111 |
| | (309 | ) | | 8/1/2010 | | 1984 | | Orland Hills | | IL | | 2,646 |
| | 1,253 |
| | 2,327 |
| | — |
| | 3,580 |
| | (690 | ) | | 12/14/2012 | | 1995 |
| US Bank | | Lyons | | IL | | — |
| | 214 |
| | 1,212 |
| | — |
| | 1,426 |
| | (396 | ) | | 8/1/2010 | | 1959 | | Westchester | | IL | | — |
| | 366 |
| | 853 |
| | — |
| | 1,219 |
| | (249 | ) | | 2/22/2013 | | 1986 |
| US Bank | | Olympia Fields | | IL | | 1,292 |
| | 426 |
| | 1,704 |
| | — |
| | 2,130 |
| | (430 | ) | | 4/26/2012 | | 1974 | | Wilmington | | IL | | — |
| | 330 |
| | 1,872 |
| | — |
| | 2,202 |
| | (654 | ) | | 8/1/2010 | | 1966 |
| US Bank | | Orland Hills | | IL | | 2,646 |
| | 1,253 |
| | 2,327 |
| | — |
| | 3,580 |
| | (504 | ) | | 12/14/2012 | | 1995 | | Fayetteville | | NC | | — |
| | 608 |
| | 1,741 |
| | — |
| | 2,349 |
| | (405 | ) | | 2/7/2014 | | 2012 |
| US Bank | | Westchester | | IL | | — |
| | 366 |
| | 853 |
| | — |
| | 1,219 |
| | (177 | ) | | 2/22/2013 | | 1986 | | Garfield Height | | OH | | — |
| | 165 |
| | 1,016 |
| | — |
| | 1,181 |
| | (304 | ) | | 1/8/2014 | | 1958 |
| US Bank | | Wilmington | | IL | | — |
| | 330 |
| | 1,872 |
| | — |
| | 2,202 |
| | (575 | ) | | 8/1/2010 | | 1966 | |
| US Bank | | Fayetteville | | NC | | — |
| | 608 |
| | 1,741 |
| | — |
| | 2,349 |
| | (239 | ) | | 2/7/2014 | | 2012 | |
| US Bank | | Garfield Height | | OH | | — |
| | 165 |
| | 1,016 |
| | — |
| | 1,181 |
| | (181 | ) | | 1/8/2014 | | 1958 | |
| USG Corporation | | Libertyville | | IL | | 14,807 |
| | 2,593 |
| | 10,283 |
| | — |
| | 12,876 |
| | (1,481 | ) | | 3/28/2014 | | 1965 | |
| VA Clinic | | Oceanside | | CA | | 27,750 |
| | 9,489 |
| | 33,812 |
| | 105 |
| | 43,406 |
| | (4,460 | ) | | 2/7/2014 | | 2010 | | Oceanside | | CA | | 27,749 |
| | 9,489 |
| | 33,812 |
| | 105 |
| | 43,406 |
| | (7,571 | ) | | 2/7/2014 | | 2010 |
| Vacant | | Cullman | | AL | | — |
| | 847 |
| | 2,390 |
| | (2,144 | ) | | 1,093 |
| | (40 | ) | | 2/7/2014 | | 1996 | | Hueytown | | AL | | — |
| | 60 |
| | 639 |
| | (312 | ) | | 387 |
| | (7 | ) | | 6/27/2013 | | 1995 |
| Vacant | | Jasper | | AL | | — |
| | 577 |
| | 2,545 |
| | (2,787 | ) | | 335 |
| | (14 | ) | | 2/7/2014 | | 2000 | | Jasper | | AL | | — |
| | 577 |
| | 2,545 |
| | (2,786 | ) | | 336 |
| | (54 | ) | | 2/7/2014 | | 2000 |
| Vacant | | Mobile | | AL | | — |
| | 127 |
| | 276 |
| | (162 | ) | | 241 |
| | (8 | ) | | 6/27/2013 | | 1974 | | Mobile | | AL | | — |
| | 127 |
| | 276 |
| | (254 | ) | | 149 |
| | (1 | ) | | 6/27/2013 | | 1974 |
| Vacant | | Prattville | | AL | | — |
| | 1,038 |
| | 1,802 |
| | (1,871 | ) | | 969 |
| | (34 | ) | | 2/7/2014 | | 1997 | | Arkadelphia | | AR | | — |
| | 225 |
| | 633 |
| | (720 | ) | | 138 |
| | (1 | ) | | 6/27/2013 | | 1990 |
| Vacant | | Tuscaloosa | | AL | | — |
| | 244 |
| | 1,306 |
| | (1,549 | ) | | 1 |
| | — |
| | 1/8/2014 | | 2001 | | Pine Bluff | | AR | | — |
| | 105 |
| | 433 |
| | (473 | ) | | 65 |
| | (1 | ) | | 6/27/2013 | | 1978 |
| Vacant | | Pine Bluff | | AR | | — |
| | 105 |
| | 433 |
| | (409 | ) | | 129 |
| | (9 | ) | | 6/27/2013 | | 1978 | | Fountain Hills | | AZ | | — |
| | 241 |
| | 597 |
| | (228 | ) | | 610 |
| | (37 | ) | | 6/27/2013 | | 1994 |
| Vacant | | Searcy | | AR | | — |
| | 231 |
| | 1,286 |
| | (1,318 | ) | | 199 |
| | (13 | ) | | 1/8/2014 | | 1998 | | Peoria | | AZ | | — |
| | 837 |
| | 1,953 |
| | (1,552 | ) | | 1,238 |
| | (67 | ) | | 2/27/2013 | | 1996 |
| Vacant | | Mesa | | AZ | | — |
| | 191 |
| | 1,007 |
| | (1,121 | ) | | 77 |
| | (6 | ) | | 1/8/2014 | | 1999 | | San Luis Obispo | | CA | | — |
| | 195 |
| | 1,013 |
| | (844 | ) | | 364 |
| | (96 | ) | | 1/8/2014 | | 2000 |
| Vacant | | | Santee | | CA | | — |
| | 265 |
| | 1,261 |
| | (1,390 | ) | | 136 |
| | (42 | ) | | 1/8/2014 | | 1995 |
| | | | | | Initial Costs (1) | | Costs Capitalized Subsequent to Acquisition (2) | | Gross Amount
Carried at
December 31, 2016
(3) (4) | | | | | | Initial Costs (1) | | Costs Capitalized Subsequent to Acquisition (2) | | Gross Amount
Carried at
December 31, 2018
(3) (4) | | | |
| Property | | City | | State | | Encumbrances at
December 31, 2016 | | Land | | Buildings, Fixtures and Improvements | | Accumulated Depreciation
(3) (5) | | Date Acquired | | Date of Construction | | City | | State | | Encumbrances at
December 31, 2018 | | Land | | Buildings, Fixtures and Improvements | | Accumulated Depreciation
(3) (5) | | Date Acquired | | Date of Construction |
| Vacant | | Fresno | | CA | | — |
| | 190 |
| | 1,810 |
| | — |
| | 2,000 |
| | (347 | ) | | 6/27/2013 | | 1995 | | Lone Tree | | CO | | — |
| | 196 |
| | 1,014 |
| | (1,070 | ) | | 140 |
| | (36 | ) | | 1/8/2014 | | 1995 |
| Vacant | | Gilroy | | CA | | — |
| | 249 |
| | 986 |
| | (1,235 | ) | | — |
| | — |
| | 1/8/2014 | | 2002 | | New London | | CT | | — |
| | 94 |
| | 534 |
| | (498 | ) | | 130 |
| | — |
| | 8/1/2010 | | 1995 |
| Vacant | | San Luis Obispo | | CA | | — |
| | 195 |
| | 1,013 |
| | (844 | ) | | 364 |
| | (26 | ) | | 1/8/2014 | | 2000 | | Brandon | | FL | | — |
| | 860 |
| | 3,071 |
| | (2,203 | ) | | 1,728 |
| | (180 | ) | | 6/27/2013 | | 2003 |
| Vacant | | Santee | | CA | | — |
| | 265 |
| | 1,261 |
| | (1,390 | ) | | 136 |
| | (12 | ) | | 1/8/2014 | | 1995 | | Cocoa | | FL | | — |
| | 249 |
| | 567 |
| | (242 | ) | | 574 |
| | (4 | ) | | 6/27/2013 | | 1979 |
| Vacant | | Vacaville | | CA | | — |
| | 195 |
| | 1,044 |
| | (1,238 | ) | | 1 |
| | — |
| | 1/8/2014 | | 2000 | | Coral Springs | | FL | | — |
| | 4,264 |
| | 5,289 |
| | — |
| | 9,553 |
| | (1,297 | ) | | 2/7/2014 | | 2010 |
| Vacant | | Denver | | CO | | — |
| | 12,648 |
| | 66,398 |
| | 388 |
| | 79,434 |
| | (11,313 | ) | | 11/5/2013 | | 2001 | | Kissimmee | | FL | | — |
| | 1,167 |
| | 778 |
| | (1,083 | ) | | 862 |
| | (2 | ) | | 4/12/2013 | | 1981 |
| Vacant | | Lone Tree | | CO | | — |
| | 196 |
| | 1,014 |
| | (1,070 | ) | | 140 |
| | (10 | ) | | 1/8/2014 | | 1995 | | Melbourne | | FL | | — |
| | 464 |
| | 1,392 |
| | — |
| | 1,856 |
| | (400 | ) | | 4/12/2013 | | 1987 |
| Vacant | | Davie | | FL | | — |
| | 193 |
| | 1,009 |
| | (1,201 | ) | | 1 |
| | — |
| | 1/8/2014 | | 1989 | | Melbourne | | FL | | — |
| | 405 |
| | 1,237 |
| | — |
| | 1,642 |
| | (326 | ) | | 2/7/2014 | | 2011 |
| Vacant | | Monticello | | FL | | — |
| | 115 |
| | 195 |
| | (134 | ) | | 176 |
| | (10 | ) | | 6/27/2013 | | 1987 | | Orlando | | FL | | — |
| | 1,286 |
| | — |
| | (297 | ) | | 989 |
| | (11 | ) | | 7/31/2013 | | 1998 |
| Vacant | | Columbus | | GA | | — |
| | 1,307 |
| | 2,529 |
| | (3,168 | ) | | 668 |
| | (23 | ) | | 2/7/2014 | | 2002 | | Tallahassee | | FL | | — |
| | 828 |
| | 1,933 |
| | (1,274 | ) | | 1,487 |
| | (16 | ) | | 4/12/2013 | | 1991 |
| Vacant | | Dawson | | GA | | — |
| | 131 |
| | 274 |
| | (182 | ) | | 223 |
| | (7 | ) | | 6/27/2013 | | 1987 | | Augusta | | GA | | — |
| | 178 |
| | 533 |
| | (591 | ) | | 120 |
| | (5 | ) | | 7/31/2013 | | 1981 |
| Vacant | | Stockbridge | | GA | | — |
| | 422 |
| | 2,391 |
| | (2,429 | ) | | 384 |
| | — |
| | 7/31/2013 | | 1987 | | Augusta | | GA | | — |
| | 178 |
| | 414 |
| | (525 | ) | | 67 |
| | (2 | ) | | 7/31/2013 | | 1978 |
| Vacant | | Bloomington | | IL | | — |
| | 270 |
| | 1,375 |
| | — |
| | 1,645 |
| | (273 | ) | | 6/27/2013 | | 1995 | | Bowdon | | GA | | — |
| | 416 |
| | 1,247 |
| | (1,563 | ) | | 100 |
| | — |
| | 3/22/2013 | | 1900 |
| Vacant | | Glenview | | IL | | 43,467 |
| | 14,014 |
| | 73,359 |
| | (47,361 | ) | | 40,012 |
| | (1,229 | ) | | 11/5/2013 | | 1975 | | Columbus | | GA | | — |
| | 1,307 |
| | 2,529 |
| | (2,876 | ) | | 960 |
| | (118 | ) | | 2/7/2014 | | 2002 |
| Vacant | | Lombard | | IL | | — |
| | 84 |
| | 100 |
| | — |
| | 184 |
| | (20 | ) | | 6/27/2013 | | 1973 | | Mason City | | IA | | — |
| | 290 |
| | 1,255 |
| | (737 | ) | | 808 |
| | (12 | ) | | 6/27/2013 | | 1995 |
| Vacant | | Peoria | | IL | | — |
| | 195 |
| | 1,013 |
| | (1,208 | ) | | — |
| | — |
| | 1/8/2014 | | 2000 | | Boise | | ID | | — |
| | 335 |
| | 1,339 |
| | — |
| | 1,674 |
| | (409 | ) | | 2/22/2013 | | 2013 |
| Vacant | | Nicholasville | | KY | | — |
| | 435 |
| | 2,040 |
| | (939 | ) | | 1,536 |
| | (73 | ) | | 6/11/2014 | | 2001 | | Garden City | | ID | | — |
| | 492 |
| | 1,305 |
| | — |
| | 1,797 |
| | (324 | ) | | 2/26/2014 | | 2003 |
| Vacant | | Owensboro | | KY | | — |
| | 1,244 |
| | 1,656 |
| | (1,941 | ) | | 959 |
| | (29 | ) | | 2/7/2014 | | 1997 | | Lombard | | IL | | — |
| | 84 |
| | 100 |
| | — |
| | 184 |
| | (30 | ) | | 6/27/2013 | | 1973 |
| Vacant | | Paducah | | KY | | — |
| | 1,121 |
| | 1,443 |
| | (1,630 | ) | | 934 |
| | (30 | ) | | 2/7/2014 | | 1995 | | Merrillville | | IN | | — |
| | 511 |
| | 4,768 |
| | — |
| | 5,279 |
| | (1,311 | ) | | 2/7/2014 | | 2011 |
| Vacant | | Alexandria | | LA | | — |
| | 82 |
| �� | 245 |
| | (93 | ) | | 234 |
| | (15 | ) | | 7/31/2013 | | 1985 | | Mishawaka | | IN | | — |
| | 375 |
| | 1,500 |
| | — |
| | 1,875 |
| | (441 | ) | | 7/30/2013 | | 2013 |
| Vacant | | Bossier City | | LA | | — |
| | 1,168 |
| | 2,594 |
| | (2,883 | ) | | 879 |
| | (31 | ) | | 2/7/2014 | | 2004 | | Bowling Green | | KY | | — |
| | 648 |
| | 973 |
| | — |
| | 1,621 |
| | (293 | ) | | 4/25/2013 | | 2012 |
| Vacant | | Hagerstown | | MD | | — |
| | 244 |
| | 1,306 |
| | (1,505 | ) | | 45 |
| | (5 | ) | | 1/8/2014 | | 2001 | | Nicholasville | | KY | | — |
| | 435 |
| | 2,040 |
| | (1,602 | ) | | 873 |
| | (21 | ) | | 6/11/2014 | | 2001 |
| Vacant | | Coloma | | MI | | 10,017 |
| | 1,929 |
| | 9,319 |
| | (5,783 | ) | | 5,465 |
| | (225 | ) | | 3/28/2014 | | 1965 | | Bossier City | | LA | | — |
| | 1,168 |
| | 2,594 |
| | (2,882 | ) | | 880 |
| | (117 | ) | | 2/7/2014 | | 2004 |
| Vacant | | Grossepointewoods | | MI | | — |
| | 140 |
| | 1,046 |
| | (785 | ) | | 401 |
| | (33 | ) | | 6/27/2013 | | 1995 | | Van Buren | | ME | | — |
| | 115 |
| | 1,720 |
| | (1,339 | ) | | 496 |
| | (27 | ) | | 1/8/2014 | | 1998 |
| Vacant | | Ypsilanti | | MI | | — |
| | 85 |
| | 483 |
| | (9 | ) | | 559 |
| | (136 | ) | | 11/23/2011 | | 2002 | | Detroit | | MI | | — |
| | 204 |
| | 1,159 |
| | (1,263 | ) | | 100 |
| | — |
| | 8/1/2010 | | 1956 |
| Vacant | | Coon Rapids | | MN | | — |
| | 1,611 |
| | 2,188 |
| | (2,894 | ) | | 905 |
| | (25 | ) | | 2/7/2014 | | 2003 | | Harper Woods | | MI | | — |
| | 207 |
| | 1,171 |
| | (1,137 | ) | | 241 |
| | — |
| | 8/1/2010 | | 1982 |
| Vacant | | Blue Springs | | MO | | — |
| | 810 |
| | 1,346 |
| | (1,515 | ) | | 641 |
| | (37 | ) | | 6/27/2013 | | 1995 | | Highland Park | | MI | | — |
| | 150 |
| | 848 |
| | (787 | ) | | 211 |
| | — |
| | 8/1/2010 | | 1967 |
| Vacant | | Horn Lake | | MS | | — |
| | 925 |
| | 2,463 |
| | (2,320 | ) | | 1,068 |
| | (39 | ) | | 2/7/2014 | | 1995 | | Southfield | | MI | | — |
| | 283 |
| | 1,605 |
| | (1,601 | ) | | 287 |
| | — |
| | 8/1/2010 | | 1975 |
| Vacant | | Natchez | | MS | | — |
| | 225 |
| | 674 |
| | (711 | ) | | 188 |
| | (6 | ) | | 7/31/2013 | | 1973 | | Spring Lake | | MI | | — |
| | 341 |
| | 512 |
| | (391 | ) | | 462 |
| | (6 | ) | | 7/31/2013 | | 1994 |
| Vacant | | Pearl | | MS | | — |
| | 1,058 |
| | 1,857 |
| | (1,893 | ) | | 1,022 |
| | (35 | ) | | 2/7/2014 | | 2000 | | Belton | | MO | | — |
| | 476 |
| | 701 |
| | — |
| | 1,177 |
| | (208 | ) | | 6/27/2013 | | 2006 |
| Vacant | | Albemarle | | NC | | — |
| | 483 |
| | 457 |
| | (493 | ) | | 447 |
| | (20 | ) | | 6/27/2013 | | 1995 | | Joplin | | MO | | — |
| | 314 |
| | 1,610 |
| | (1,231 | ) | | 693 |
| | (29 | ) | | 2/11/2014 | | 1984 |
| Vacant | | Greensboro | | NC | | — |
| | 1,020 |
| | — |
| | (178 | ) | | 842 |
| | — |
| | 2/21/2014 | | 1995 | | Joplin | | MO | | — |
| | 127 |
| | 300 |
| | — |
| | 427 |
| | (110 | ) | | 2/11/2014 | | 1973 |
| | | | | | Initial Costs (1) | | Costs Capitalized Subsequent to Acquisition (2) | | Gross Amount
Carried at
December 31, 2016
(3) (4) | | | | | | Initial Costs (1) | | Costs Capitalized Subsequent to Acquisition (2) | | Gross Amount
Carried at
December 31, 2018
(3) (4) | | | |
| Property | | City | | State | | Encumbrances at
December 31, 2016 | | Land | | Buildings, Fixtures and Improvements | | Accumulated Depreciation
(3) (5) | | Date Acquired | | Date of Construction | | City | | State | | Encumbrances at
December 31, 2018 | | Land | | Buildings, Fixtures and Improvements | | Accumulated Depreciation
(3) (5) | | Date Acquired | | Date of Construction |
| Vacant | | Deptford | | NJ | | — |
| | 195 |
| | 1,044 |
| | (1,239 | ) | | — |
| | — |
| | 1/8/2014 | | 2005 | | Albemarle | | NC | | — |
| | 483 |
| | 457 |
| | (493 | ) | | 447 |
| | (43 | ) | | 6/27/2013 | | 1995 |
| Vacant | | Hobbs | | NM | | — |
| | 815 |
| | — |
| | — |
| | 815 |
| | — |
| | 6/27/2013 | | 1995 | | Greenville | | NC | | — |
| | 1,085 |
| | 1,085 |
| | (1,323 | ) | | 847 |
| | — |
| | 12/12/2012 | | 2012 |
| Vacant | | Las Vegas | | NV | | — |
| | 680 |
| | 1,533 |
| | — |
| | 2,213 |
| | (294 | ) | | 6/27/2013 | | 1995 | | Raleigh | | NC | | — |
| | 1,091 |
| | 1,091 |
| | — |
| | 2,182 |
| | (346 | ) | | 9/28/2012 | | 1997 |
| Vacant | | Elmira | | NY | | — |
| | 199 |
| | 370 |
| | (441 | ) | | 128 |
| | — |
| | 7/31/2013 | | 1975 | | Warsaw | | NC | | — |
| | 75 |
| | 1,428 |
| | (880 | ) | | 623 |
| | (10 | ) | | 11/13/2012 | | 2003 |
| Vacant | | Wellsville | | NY | | — |
| | 123 |
| | 368 |
| | (217 | ) | | 274 |
| | — |
| | 7/31/2013 | | 1978 | | Wilmington | | NC | | — |
| | 412 |
| | 1,257 |
| | — |
| | 1,669 |
| | (384 | ) | | 3/29/2013 | | 2013 |
| Vacant | | Circleville | | OH | | — |
| | 140 |
| | 142 |
| | — |
| | 282 |
| | (15 | ) | | 6/27/2013 | | 1986 | | Wilson | | NC | | — |
| | 373 |
| | 692 |
| | — |
| | 1,065 |
| | (220 | ) | | 9/28/2012 | | 2012 |
| Vacant | | Moraine | | OH | | — |
| | 87 |
| | 148 |
| | — |
| | 235 |
| | (20 | ) | | 6/27/2013 | | 1995 | | Flanders | | NJ | | 915 |
| | 1,468 |
| | 883 |
| | (1,154 | ) | | 1,197 |
| �� | (18 | ) | | 2/7/2014 | | 2003 |
| Vacant | | Youngstown | | OH | | — |
| | 139 |
| | 232 |
| | (37 | ) | | 334 |
| | (19 | ) | | 6/27/2013 | | 1976 | | East Greenbush | | NY | | — |
| | 404 |
| | 269 |
| | (373 | ) | | 300 |
| | (1 | ) | | 6/27/2013 | | 1980 |
| Vacant | | The Dalles | | OR | | — |
| | 201 |
| | 802 |
| | (486 | ) | | 517 |
| | (103 | ) | | 7/31/2013 | | 1994 | | Greene | | NY | | — |
| | 216 |
| | 1,227 |
| | (1,193 | ) | | 250 |
| | — |
| | 8/1/2010 | | 1981 |
| Vacant | | Beaver Falls | | PA | | — |
| | 243 |
| | 1,304 |
| | (1,489 | ) | | 58 |
| | (4 | ) | | 1/8/2014 | | 2004 | | Nedrow | | NY | | — |
| | 55 |
| | 80 |
| | — |
| | 135 |
| | (24 | ) | | 6/27/2013 | | 1979 |
| Vacant | | Bristol | | PA | | — |
| | 114 |
| | 81 |
| | — |
| | 195 |
| | (18 | ) | | 1/8/2014 | | 1818 | | Rochester | | NY | | — |
| | 128 |
| | 384 |
| | (262 | ) | | 250 |
| | (10 | ) | | 7/31/2013 | | 1985 |
| Vacant | | Dickson City | | PA | | — |
| | 262 |
| | 1,257 |
| | (1,519 | ) | | — |
| | — |
| | 1/8/2014 | | 2004 | | Schenectady | | NY | | — |
| | 292 |
| | 1,655 |
| | (1,172 | ) | | 775 |
| | — |
| | 8/1/2010 | | 1974 |
| Vacant | | Indiana | | PA | | — |
| | 676 |
| | 1,255 |
| | (920 | ) | | 1,011 |
| | (63 | ) | | 7/31/2013 | | 2000 | | Cincinnati | | OH | | — |
| | 353 |
| | 824 |
| | (807 | ) | | 370 |
| | (2 | ) | | 7/31/2013 | | 1969 |
| Vacant | | Warwick | | RI | | — |
| | 1,570 |
| | 5,030 |
| | 7 |
| | 6,607 |
| | (799 | ) | | 9/24/2013 | | 1969 | | Dayton | | OH | | — |
| | 129 |
| | 732 |
| | (713 | ) | | 148 |
| | (5 | ) | | 7/31/2013 | | 1995 |
| Vacant | | Lexington | | SC | | — |
| | 244 |
| | 1,307 |
| | (1,356 | ) | | 195 |
| | (16 | ) | | 1/8/2014 | | 1998 | | Englewood | | OH | | — |
| | 547 |
| | — |
| | (422 | ) | | 125 |
| | — |
| | 6/27/2013 | | 1974 |
| Vacant | | Red Bank | | TN | | — |
| | 215 |
| | 323 |
| | (339 | ) | | 199 |
| | (10 | ) | | 7/31/2013 | | 1975 | | Massillon | | OH | | — |
| | 212 |
| | 1,202 |
| | (1,189 | ) | | 225 |
| | — |
| | 8/1/2010 | | 1958 |
| Vacant | | Sevierville | | TN | | — |
| | 1,443 |
| | 430 |
| | (751 | ) | | 1,122 |
| | (40 | ) | | 2/7/2014 | | 2003 | | Mentor | | OH | | — |
| | 178 |
| | 1,011 |
| | (599 | ) | | 590 |
| | (7 | ) | | 8/1/2010 | | 1976 |
| Vacant | | Abilene | | TX | | — |
| | 803 |
| | — |
| | — |
| | 803 |
| | — |
| | 6/27/2013 | | 1995 | | Moraine | | OH | | — |
| | 87 |
| | 148 |
| | (50 | ) | | 185 |
| | (1 | ) | | 6/27/2013 | | 1995 |
| Vacant | | El Paso | | TX | | — |
| | 246 |
| | 1,248 |
| | (1,490 | ) | | 4 |
| | — |
| | 1/8/2014 | | 1995 | | Youngstown | | OH | | — |
| | 139 |
| | 232 |
| | (123 | ) | | 248 |
| | (1 | ) | | 6/27/2013 | | 1976 |
| Vacant | | Houston | | TX | | 19,525 |
| | 2,356 |
| | 36,347 |
| | — |
| | 38,703 |
| | (5,535 | ) | | 11/5/2013 | | 2009 | | The Dalles | | OR | | — |
| | 201 |
| | 802 |
| | (486 | ) | | 517 |
| | (219 | ) | | 7/31/2013 | | 1994 |
| Vacant | | Irving | | TX | | — |
| | 522 |
| | 512 |
| | (235 | ) | | 799 |
| | (31 | ) | | 6/27/2013 | | 1995 | | Grants Pass | | OR | | — |
| | 393 |
| | 2,979 |
| | — |
| | 3,372 |
| | (845 | ) | | 1/8/2014 | | 1963 |
| Vacant | | Lubbock | | TX | | — |
| | 694 |
| | — |
| | (68 | ) | | 626 |
| | — |
| | 6/27/2013 | | 1979 | | Lake Oswego | | OR | | — |
| | 590 |
| | 1,693 |
| | — |
| | 2,283 |
| | (510 | ) | | 6/27/2013 | | 1995 |
| Vacant | | Pleasanton | | TX | | — |
| | 328 |
| | 4,804 |
| | (2,859 | ) | | 2,273 |
| | (46 | ) | | 9/25/2014 | | 2014 | | Beaver Falls | | PA | | — |
| | 243 |
| | 1,304 |
| | (1,489 | ) | | 58 |
| | (56 | ) | | 1/8/2014 | | 2004 |
| Vacant | | Texas City | | TX | | — |
| | 614 |
| | 3,351 |
| | (2,351 | ) | | 1,614 |
| | (64 | ) | | 2/7/2014 | | 2002 | | Drexel Hill | | PA | | — |
| | 266 |
| | 1,064 |
| | (901 | ) | | 429 |
| | — |
| | 12/14/2012 | | 1950 |
| Vacant | | Fredericksburg | | VA | | — |
| | 446 |
| | 2,071 |
| | (1,343 | ) | | 1,174 |
| | (91 | ) | | 4/23/2014 | | 1999 | | Ford City | | PA | | — |
| | 89 |
| | 802 |
| | (601 | ) | | 290 |
| | — |
| | 12/14/2012 | | 1975 |
| Vacant | | Brookfield | | WI | | — |
| | 50 |
| | 84 |
| | 45 |
| | 179 |
| | (27 | ) | | 2/21/2014 | | 1967 | | Highspire | | PA | | — |
| | 216 |
| | 649 |
| | (644 | ) | | 221 |
| | — |
| | 12/14/2012 | | 1974 |
| Vacant | | Beckley | | WV | | — |
| | 1,248 |
| | 2,258 |
| | (2,508 | ) | | 998 |
| | (35 | ) | | 2/7/2014 | | 1995 | | Indiana | | PA | | — |
| | 676 |
| | 1,255 |
| | (920 | ) | | 1,011 |
| | (139 | ) | | 7/31/2013 | | 2000 |
| Vanguard Car Rental | | College Park | | GA | | — |
| | 1,561 |
| | 6,244 |
| | — |
| | 7,805 |
| | (1,185 | ) | | 5/19/2014 | | 2002 | |
| Velox Insurance | | Woodstock | | GA | | — |
| | 155 |
| | 127 |
| | — |
| | 282 |
| | (26 | ) | | 7/31/2013 | | 1988 | |
| Verizon Wireless | | Statesville | | NC | | — |
| | 207 |
| | 459 |
| | 27 |
| | 693 |
| | (92 | ) | | 6/27/2013 | | 1993 | |
| Volusia Square | | Daytona Beach | | FL | | 16,556 |
| | 4,598 |
| | 28,511 |
| | 10 |
| | 33,119 |
| | (4,405 | ) | | 2/7/2014 | | 1986 | |
| Waffle House | | Cocoa | | FL | | — |
| | 150 |
| | 279 |
| | — |
| | 429 |
| | (51 | ) | | 7/31/2013 | | 1986 | |
| Vacant | | | Matamoras | | PA | | — |
| | 509 |
| | 946 |
| | (655 | ) | | 800 |
| | — |
| | 12/14/2012 | | 1920 |
| Vacant | | | Monesson | | PA | | — |
| | 198 |
| | 1,123 |
| | (1,222 | ) | | 99 |
| | (5 | ) | | 8/1/2010 | | 1930 |
| Vacant | | | North Fayette | | PA | | — |
| | 1,990 |
| | 2,700 |
| | 3 |
| | 4,693 |
| | (656 | ) | | 2/7/2014 | | 1999 |
| Vacant | | | Philadelphia | | PA | | — |
| | 127 |
| | 722 |
| | (650 | ) | | 199 |
| | — |
| | 12/14/2012 | | 1920 |
| Vacant | | | Pitcairn | | PA | | — |
| | 46 |
| | 867 |
| | (773 | ) | | 140 |
| | — |
| | 12/14/2012 | | 1985 |
| | | | | | Initial Costs (1) | | Costs Capitalized Subsequent to Acquisition (2) | | Gross Amount
Carried at
December 31, 2016
(3) (4) | | | | | | Initial Costs (1) | | Costs Capitalized Subsequent to Acquisition (2) | | Gross Amount
Carried at
December 31, 2018
(3) (4) | | | |
| Property | | City | | State | | Encumbrances at
December 31, 2016 | | Land | | Buildings, Fixtures and Improvements | | Accumulated Depreciation
(3) (5) | | Date Acquired | | Date of Construction | | City | | State | | Encumbrances at
December 31, 2018 | | Land | | Buildings, Fixtures and Improvements | | Accumulated Depreciation
(3) (5) | | Date Acquired | | Date of Construction |
| Vacant | | | Pittsburgh | | PA | | — |
| | 185 |
| | 1,051 |
| | — |
| | 1,236 |
| | (312 | ) | | 12/14/2012 | | 1960 |
| Vacant | | | Pittsburgh | | PA | | — |
| | 255 |
| | 1,019 |
| | — |
| | 1,274 |
| | (302 | ) | | 12/14/2012 | | 1970 |
| Vacant | | | Shamokin | | PA | | — |
| | 54 |
| | 217 |
| | (108 | ) | | 163 |
| | (3 | ) | | 7/31/2013 | | 1995 |
| Vacant | | | Greenville | | SC | | — |
| | 280 |
| | 342 |
| | (482 | ) | | 140 |
| | (4 | ) | | 7/31/2013 | | 1970 |
| Vacant | | | North Charleston | | SC | | — |
| | 2,193 |
| | 4,636 |
| | — |
| | 6,829 |
| | (1,290 | ) | | 2/7/2014 | | 2008 |
| Vacant | | | Memphis | | TN | | — |
| | 100 |
| | 283 |
| | 167 |
| | 550 |
| | — |
| | 6/27/2013 | | 1995 |
| Vacant | | | Sevierville | | TN | | — |
| | 1,443 |
| | 430 |
| | (751 | ) | | 1,122 |
| | (92 | ) | | 2/7/2014 | | 2003 |
| Vacant | | | Bay City | | TX | | — |
| | 229 |
| | 124 |
| | (220 | ) | | 133 |
| | (7 | ) | | 7/31/2013 | | 1985 |
| Vacant | | | Gun Barrel City | | TX | | — |
| | 300 |
| | 961 |
| | (866 | ) | | 395 |
| | (26 | ) | | 6/27/2013 | | 1995 |
| Vacant | | | Houston | | TX | | — |
| | 900 |
| | 1,749 |
| | — |
| | 2,649 |
| | (527 | ) | | 6/27/2013 | | 1995 |
| Vacant | | | Houston | | TX | | — |
| | 2,640 |
| | 10,559 |
| | — |
| | 13,199 |
| | (2,763 | ) | | 5/19/2014 | | 2004 |
| Vacant | | | Killeen | | TX | | — |
| | 534 |
| | 992 |
| | (803 | ) | | 723 |
| | (99 | ) | | 7/31/2013 | | 1993 |
| Vacant | | | Waco | | TX | | — |
| | 595 |
| | 892 |
| | (842 | ) | | 645 |
| | — |
| | 7/31/2013 | | 1995 |
| Vacant | | | Midlothian | | VA | | — |
| | 230 |
| | 1,300 |
| | (861 | ) | | 669 |
| | (60 | ) | | 6/27/2013 | | 1995 |
| Vacant | | | Norfolk | | VA | | — |
| | 656 |
| | 437 |
| | — |
| | 1,093 |
| | (126 | ) | | 4/12/2013 | | 1990 |
| Vacant | | | White River Junction | | VT | | — |
| | 183 |
| | 1,039 |
| | (836 | ) | | 386 |
| | (12 | ) | | 8/1/2010 | | 1975 |
| Vacant | | | Schofield | | WI | | — |
| | 106 |
| | 196 |
| | — |
| | 302 |
| | (55 | ) | | 7/31/2013 | | 1987 |
| Vanguard Car Rental | | | College Park | | GA | | — |
| | 1,561 |
| | 6,244 |
| | — |
| | 7,805 |
| | (2,114 | ) | | 5/19/2014 | | 2002 |
| Velox Insurance | | | Woodstock | | GA | | — |
| | 155 |
| | 127 |
| | 40 |
| | 322 |
| | (40 | ) | | 7/31/2013 | | 1988 |
| Verizon Wireless | | | Statesville | | NC | | — |
| | 207 |
| | 459 |
| | 27 |
| | 693 |
| | (138 | ) | | 6/27/2013 | | 1993 |
| The Vitamin Shoppe | | | Evergreen Park | | IL | | — |
| | 476 |
| | 1,427 |
| | — |
| | 1,903 |
| | (429 | ) | | 4/19/2013 | | 2012 |
| The Vitamin Shoppe | | | Ashland | | VA | | — |
| | 2,399 |
| | 19,663 |
| | — |
| | 22,062 |
| | (6,088 | ) | | 11/5/2013 | | 2013 |
| Volusia Square | | | Daytona Beach | | FL | | 16,557 |
| | 4,598 |
| | 28,511 |
| | (18,165 | ) | | 14,944 |
| | (202 | ) | | 2/7/2014 | | 1986 |
| Waffle House | | | Cocoa | | FL | | — |
| | 150 |
| | 279 |
| | — |
| | 429 |
| | (78 | ) | | 7/31/2013 | | 1986 |
| Walgreens | | Birmingham | | AL | | 1,530 |
| | 996 |
| | 3,005 |
| | — |
| | 4,001 |
| | (519 | ) | | 2/7/2014 | | 1999 | | Birmingham | | AL | | 1,487 |
| | 996 |
| | 3,005 |
| | — |
| | 4,001 |
| | (880 | ) | | 2/7/2014 | | 1999 |
| Walgreens | | Wetumpka | | AL | | — |
| | 547 |
| | 3,102 |
| | — |
| | 3,649 |
| | (907 | ) | | 2/22/2012 | | 2007 | | Talladega | | AL | | — |
| | 377 |
| | 1,311 |
| | — |
| | 1,688 |
| | (395 | ) | | 1/8/2014 | | 1997 |
| Walgreens | | Kingman | | AZ | | 2,942 |
| | 669 |
| | 5,726 |
| | — |
| | 6,395 |
| | (913 | ) | | 2/7/2014 | | 2009 | | Wetumpka | | AL | | — |
| | 547 |
| | 3,102 |
| | — |
| | 3,649 |
| | (1,105 | ) | | 2/22/2012 | | 2007 |
| Walgreens | | Peoria | | AZ | | — |
| | 837 |
| | 1,953 |
| | — |
| | 2,790 |
| | (454 | ) | | 2/27/2013 | | 1996 | | Kingman | | AZ | | 2,861 |
| | 669 |
| | 5,726 |
| | — |
| | 6,395 |
| | (1,547 | ) | | 2/7/2014 | | 2009 |
| Walgreens | | Phoenix | | AZ | | — |
| | 1,037 |
| | 1,927 |
| | — |
| | 2,964 |
| | (438 | ) | | 3/26/2013 | | 1999 | | Phoenix | | AZ | | — |
| | 1,037 |
| | 1,927 |
| | — |
| | 2,964 |
| | (624 | ) | | 3/26/2013 | | 1999 |
| Walgreens | | Tucson | | AZ | | — |
| | 1,234 |
| | 5,143 |
| | — |
| | 6,377 |
| | (818 | ) | | 2/7/2014 | | 2003 | | Tucson | | AZ | | — |
| | 1,234 |
| | 5,143 |
| | — |
| | 6,377 |
| | (1,386 | ) | | 2/7/2014 | | 2003 |
| Walgreens | | Tucson | | AZ | | 2,910 |
| | 1,406 |
| | 3,571 |
| | — |
| | 4,977 |
| | (580 | ) | | 2/7/2014 | | 2004 | | Tucson | | AZ | | 2,910 |
| | 1,406 |
| | 3,571 |
| | — |
| | 4,977 |
| | (984 | ) | | 2/7/2014 | | 2004 |
| Walgreens | | Coalinga | | CA | | 2,800 |
| | 396 |
| | 3,568 |
| | — |
| | 3,964 |
| | (1,093 | ) | | 10/11/2011 | | 2008 | | Coalinga | | CA | | 2,800 |
| | 396 |
| | 3,568 |
| | — |
| | 3,964 |
| | (1,307 | ) | | 10/11/2011 | | 2008 |
| Walgreens | | Lancaster | | CA | | 2,719 |
| | 859 |
| | 4,246 |
| | — |
| | 5,105 |
| | (739 | ) | | 2/7/2014 | | 2009 | |
| Walgreens | | Castle Rock | | CO | | 3,953 |
| | 1,581 |
| | 3,689 |
| | — |
| | 5,270 |
| | (766 | ) | | 7/11/2013 | | 2002 | |
| Walgreens | | Denver | | CO | | 3,350 |
| | — |
| | 4,050 |
| | — |
| | 4,050 |
| | (840 | ) | | 7/2/2013 | | 2008 | |
| Walgreens | | Pueblo | | CO | | — |
| | 519 |
| | 2,971 |
| | — |
| | 3,490 |
| | (479 | ) | | 2/7/2014 | | 2003 | |
| Walgreens | | Orlando | | FL | | — |
| | 1,007 |
| | 1,869 |
| | — |
| | 2,876 |
| | (369 | ) | | 9/30/2013 | | 1996 | |
| Walgreens | | Acworth | | GA | | — |
| | 1,583 |
| | 2,940 |
| | — |
| | 4,523 |
| | (698 | ) | | 1/25/2013 | | 2012 | |
| Walgreens | | Decatur | | GA | | — |
| | 1,746 |
| | 3,337 |
| | 1 |
| | 5,084 |
| | (537 | ) | | 2/7/2014 | | 2001 | |
| Walgreens | | Grayson | | GA | | 2,720 |
| | 947 |
| | 3,748 |
| | — |
| | 4,695 |
| | (594 | ) | | 2/7/2014 | | 2004 | |
| Walgreens | | Union City | | GA | | — |
| | 909 |
| | 3,841 |
| | — |
| | 4,750 |
| | (607 | ) | | 2/7/2014 | | 2005 | |
| Walgreens | | Dubuque | | IA | | — |
| | 638 |
| | 3,905 |
| | — |
| | 4,543 |
| | (616 | ) | | 2/7/2014 | | 2008 | |
| Walgreens | | Twin Falls | | ID | | 2,388 |
| | 1,156 |
| | 3,896 |
| | — |
| | 5,052 |
| | (646 | ) | | 2/7/2014 | | 2009 | |
| Walgreens | | Cahokia | | IL | | — |
| | 394 |
| | 1,577 |
| | 167 |
| | 2,138 |
| | (298 | ) | | 5/19/2014 | | 1994 | |
| Walgreens | | Chicago | | IL | | — |
| | 1,212 |
| | 2,829 |
| | — |
| | 4,041 |
| | (672 | ) | | 1/30/2013 | | 1999 | |
| Walgreens | | Chicago | | IL | | — |
| | 1,617 |
| | 3,003 |
| | — |
| | 4,620 |
| | (713 | ) | | 1/30/2013 | | 1995 | |
| Walgreens | | Chicago | | IL | | — |
| | 952 |
| | 3,235 |
| | — |
| | 4,187 |
| | (510 | ) | | 2/7/2014 | | 2003 | |
| Walgreens | | Chicago | | IL | | — |
| | 911 |
| | 4,830 |
| | — |
| | 5,741 |
| | (742 | ) | | 2/7/2014 | | 2000 | |
| Walgreens | | Machesney Park | | IL | | — |
| | 822 |
| | 3,727 |
| | — |
| | 4,549 |
| | (600 | ) | | 2/7/2014 | | 2008 | |
| Walgreens | | Matteson | | IL | | 2,450 |
| | 416 |
| | 4,070 |
| | — |
| | 4,486 |
| | (615 | ) | | 2/7/2014 | | 2008 | |
| Walgreens | | South Elgin | | IL | | 2,219 |
| | 1,710 |
| | 3,208 |
| | — |
| | 4,918 |
| | (526 | ) | | 2/7/2014 | | 2002 | |
| Walgreens | | St. Charles | | IL | | 1,991 |
| | 1,472 |
| | 3,262 |
| | — |
| | 4,734 |
| | (513 | ) | | 2/7/2014 | | 2002 | |
| Walgreens | | Anderson | | IN | | 2,717 |
| | 807 |
| | 3,227 |
| | — |
| | 4,034 |
| | (863 | ) | | 7/31/2012 | | 2001 | |
| Walgreens | | Lafayette | | IN | | 2,350 |
| | 626 |
| | 4,183 |
| | — |
| | 4,809 |
| | (595 | ) | | 2/7/2014 | | 2008 | |
| Walgreens | | South Bend | | IN | | 3,063 |
| | 1,240 |
| | 5,015 |
| | — |
| | 6,255 |
| | (825 | ) | | 2/7/2014 | | 2006 | |
| Walgreens | | Wichita | | KS | | — |
| | 385 |
| | 4,286 |
| | — |
| | 4,671 |
| | (679 | ) | | 2/7/2014 | | 2000 | |
| | | | | | Initial Costs (1) | | Costs Capitalized Subsequent to Acquisition (2) | | Gross Amount
Carried at
December 31, 2016
(3) (4) | | | | | | Initial Costs (1) | | Costs Capitalized Subsequent to Acquisition (2) | | Gross Amount
Carried at
December 31, 2018
(3) (4) | | | |
| Property | | City | | State | | Encumbrances at
December 31, 2016 | | Land | | Buildings, Fixtures and Improvements | | Accumulated Depreciation
(3) (5) | | Date Acquired | | Date of Construction | | City | | State | | Encumbrances at
December 31, 2018 | | Land | | Buildings, Fixtures and Improvements | | Accumulated Depreciation
(3) (5) | | Date Acquired | | Date of Construction |
| Walgreens | | Frankfort | | KY | | — |
| | 911 |
| | 3,643 |
| | — |
| | 4,554 |
| | (1,066 | ) | | 2/8/2012 | | 2006 | | Lancaster | | CA | | 2,719 |
| | 859 |
| | 4,246 |
| | — |
| | 5,105 |
| | (1,254 | ) | | 2/7/2014 | | 2009 |
| Walgreens | | Shereveport | | LA | | — |
| | 619 |
| | 3,509 |
| | — |
| | 4,128 |
| | (1,026 | ) | | 2/22/2012 | | 2003 | | Castle Rock | | CO | | 3,953 |
| | 1,581 |
| | 3,689 |
| | — |
| | 5,270 |
| | (1,157 | ) | | 7/11/2013 | | 2002 |
| Walgreens | | Framingham | | MA | | 2,991 |
| | 2,103 |
| | 4,770 |
| | — |
| | 6,873 |
| | (746 | ) | | 2/7/2014 | | 2007 | | Denver | | CO | | 3,350 |
| | — |
| | 4,050 |
| | — |
| | 4,050 |
| | (1,271 | ) | | 7/2/2013 | | 2008 |
| Walgreens | | Baltimore | | MD | | — |
| | 1,185 |
| | 2,764 |
| | — |
| | 3,949 |
| | (560 | ) | | 8/6/2013 | | 2000 | | Pueblo | | CO | | — |
| | 519 |
| | 2,971 |
| | — |
| | 3,490 |
| | (812 | ) | | 2/7/2014 | | 2003 |
| Walgreens | | Brooklyn Park | | MD | | — |
| | 1,416 |
| | 4,160 |
| | — |
| | 5,576 |
| | (648 | ) | | 2/7/2014 | | 2008 | | Orlando | | FL | | — |
| | 1,007 |
| | 1,869 |
| | — |
| | 2,876 |
| | (577 | ) | | 9/30/2013 | | 1996 |
| Walgreens | | Augusta | | ME | | 3,099 |
| | 1,648 |
| | 5,146 |
| | — |
| | 6,794 |
| | (859 | ) | | 2/7/2014 | | 2007 | | Acworth | | GA | | — |
| | 1,583 |
| | 2,940 |
| | — |
| | 4,523 |
| | (966 | ) | | 1/25/2013 | | 2012 |
| Walgreens | | Clarkston | | MI | | — |
| | 2,768 |
| | 3,197 |
| | — |
| | 5,965 |
| | (519 | ) | | 2/7/2014 | | 2000 | | Decatur | | GA | | — |
| | 1,746 |
| | 3,337 |
| | — |
| | 5,083 |
| | (911 | ) | | 2/7/2014 | | 2001 |
| Walgreens | | Clinton | | MI | | — |
| | 1,463 |
| | 3,413 |
| | — |
| | 4,876 |
| | (845 | ) | | 11/13/2012 | | 2002 | | Grayson | | GA | | 2,720 |
| | 947 |
| | 3,747 |
| | — |
| | 4,694 |
| | (1,007 | ) | | 2/7/2014 | | 2004 |
| Walgreens | | Dearborn Heights | | MI | | — |
| | 190 |
| | 3,605 |
| | — |
| | 3,795 |
| | (802 | ) | | 4/1/2013 | | 1998 | | Tucker | | GA | | — |
| | 793 |
| | 1,419 |
| | — |
| | 2,212 |
| | (427 | ) | | 1/8/2014 | | 1996 |
| Walgreens | | Eastpointe | | MI | | — |
| | 668 |
| | 2,672 |
| | — |
| | 3,340 |
| | (795 | ) | | 1/19/2012 | | 1998 | | Twin Falls | | ID | | 2,322 |
| | 1,156 |
| | 3,896 |
| | — |
| | 5,052 |
| | (1,096 | ) | | 2/7/2014 | | 2009 |
| Walgreens | | Lincoln Park | | MI | | 5,494 |
| | 1,041 |
| | 5,896 |
| | — |
| | 6,937 |
| | (1,577 | ) | | 7/31/2012 | | 2007 | | Cahokia | | IL | | — |
| | 394 |
| | 1,577 |
| | 167 |
| | 2,138 |
| | (537 | ) | | 5/19/2014 | | 1994 |
| Walgreens | | Livonia | | MI | | — |
| | 261 |
| | 2,350 |
| | — |
| | 2,611 |
| | (523 | ) | | 4/1/2013 | | 1998 | | Chicago | | IL | | — |
| | 1,212 |
| | 2,829 |
| | — |
| | 4,041 |
| | (930 | ) | | 1/30/2013 | | 1999 |
| Walgreens | | Stevensville | | MI | | 3,100 |
| | 855 |
| | 3,420 |
| | — |
| | 4,275 |
| | (1,039 | ) | | 11/28/2011 | | 2007 | | Chicago | | IL | | — |
| | 1,617 |
| | 3,003 |
| | — |
| | 4,620 |
| | (987 | ) | | 1/30/2013 | | 1995 |
| Walgreens | | Troy | | MI | | — |
| | — |
| | 1,896 |
| | — |
| | 1,896 |
| | (460 | ) | | 12/12/2012 | | 2000 | | Chicago | | IL | | — |
| | 952 |
| | 3,235 |
| | — |
| | 4,187 |
| | (864 | ) | | 2/7/2014 | | 2003 |
| Walgreens | | Warren | | MI | | — |
| | 748 |
| | 2,991 |
| | — |
| | 3,739 |
| | (740 | ) | | 11/21/2012 | | 1999 | | Chicago | | IL | | — |
| | 911 |
| | 4,830 |
| | — |
| | 5,741 |
| | (1,258 | ) | | 2/7/2014 | | 2000 |
| Walgreens | | North Mankato | | MN | | 2,484 |
| | 1,748 |
| | 3,604 |
| | — |
| | 5,352 |
| | (590 | ) | | 2/7/2014 | | 2008 | | Matteson | | IL | | 2,450 |
| | 416 |
| | 4,070 |
| | — |
| | 4,486 |
| | (1,043 | ) | | 2/7/2014 | | 2008 |
| Walgreens | | Country Club Hills | | MO | | — |
| | 997 |
| | 4,204 |
| | — |
| | 5,201 |
| | (624 | ) | | 2/7/2014 | | 2009 | | South Elgin | | IL | | 2,158 |
| | 1,710 |
| | 3,208 |
| | — |
| | 4,918 |
| | (892 | ) | | 2/7/2014 | | 2002 |
| Walgreens | | Independence | | MO | | — |
| | 1,122 |
| | 3,816 |
| | — |
| | 4,938 |
| | (619 | ) | | 2/7/2014 | | 2001 | | St. Charles | | IL | | 1,935 |
| | 1,472 |
| | 3,262 |
| | — |
| | 4,734 |
| | (869 | ) | | 2/7/2014 | | 2002 |
| Walgreens | | Columbia | | MS | | 3,091 |
| | 452 |
| | 4,072 |
| | — |
| | 4,524 |
| | (987 | ) | | 12/21/2012 | | 2011 | | Anderson | | IN | | — |
| | 807 |
| | 3,227 |
| | — |
| | 4,034 |
| | (1,109 | ) | | 7/31/2012 | | 2001 |
| Walgreens | | Greenwood | | MS | | — |
| | 561 |
| | 3,181 |
| | — |
| | 3,742 |
| | (930 | ) | | 2/22/2012 | | 2007 | | Jeffersonville | | IN | | — |
| | 824 |
| | 2,472 |
| | — |
| | 3,296 |
| | (825 | ) | | 11/30/2012 | | 2008 |
| Walgreens | | Jackson | | MS | | — |
| | 983 |
| | 2,996 |
| | — |
| | 3,979 |
| | (539 | ) | | 2/18/2014 | | 1998 | | Lafayette | | IN | | — |
| | 626 |
| | 4,183 |
| | — |
| | 4,809 |
| | (1,008 | ) | | 2/7/2014 | | 2008 |
| Walgreens | | Cape Carteret | | NC | | 2,400 |
| | 919 |
| | 3,087 |
| | — |
| | 4,006 |
| | (495 | ) | | 2/7/2014 | | 2008 | | South Bend | | IN | | 2,978 |
| | 1,240 |
| | 5,014 |
| | — |
| | 6,254 |
| | (1,399 | ) | | 2/7/2014 | | 2006 |
| Walgreens | | Durham | | NC | | 2,871 |
| | 1,441 |
| | 3,581 |
| | — |
| | 5,022 |
| | (640 | ) | | 2/7/2014 | | 2010 | | Lawrenceburg | | KY | | — |
| | 567 |
| | 2,267 |
| | — |
| | 2,834 |
| | (757 | ) | | 11/30/2012 | | 2008 |
| Walgreens | | Durham | | NC | | 2,798 |
| | 2,201 |
| | 2,923 |
| | — |
| | 5,124 |
| | (568 | ) | | 2/7/2014 | | 2008 | | Lexington | | KY | | — |
| | — |
| | 1,943 |
| | — |
| | 1,943 |
| | (648 | ) | | 11/30/2012 | | 2007 |
| Walgreens | | Laurinburg | | NC | | — |
| | 355 |
| | 3,577 |
| | — |
| | 3,932 |
| | (608 | ) | | 2/26/2014 | | 2013 | | Paris | | KY | | — |
| | 743 |
| | 2,228 |
| | — |
| | 2,971 |
| | (744 | ) | | 11/30/2012 | | 2008 |
| Walgreens | | Leland | | NC | | 2,472 |
| | 1,226 |
| | 3,681 |
| | — |
| | 4,907 |
| | (607 | ) | | 2/7/2014 | | 2008 | | Scottsville | | KY | | — |
| | 153 |
| | 2,904 |
| | — |
| | 3,057 |
| | (969 | ) | | 11/30/2012 | | 2007 |
| Walgreens | | Rocky Mount | | NC | | 2,941 |
| | 1,105 |
| | 4,046 |
| | — |
| | 5,151 |
| | (737 | ) | | 2/7/2014 | | 2009 | | Stanford | | KY | | — |
| | 152 |
| | 2,886 |
| | — |
| | 3,038 |
| | (963 | ) | | 11/30/2012 | | 2009 |
| Walgreens | | Winterville | | NC | | 2,972 |
| | 578 |
| | 5,322 |
| | — |
| | 5,900 |
| | (901 | ) | | 2/7/2014 | | 2009 | | Shereveport | | LA | | — |
| | 619 |
| | 3,509 |
| | — |
| | 4,128 |
| | (1,250 | ) | | 2/22/2012 | | 2003 |
| Walgreens | | North Platte | | NE | | — |
| | 935 |
| | 4,292 |
| | — |
| | 5,227 |
| | (711 | ) | | 2/7/2014 | | 2009 | | Adams | | MA | | — |
| | 300 |
| | 1,200 |
| | — |
| | 1,500 |
| | (376 | ) | | 7/30/2013 | | 1958 |
| Walgreens | | Omaha | | NE | | 2,530 |
| | 1,316 |
| | 4,122 |
| | — |
| | 5,438 |
| | (675 | ) | | 2/7/2014 | | 2009 | | Framingham | | MA | | 2,908 |
| | 2,103 |
| | 4,770 |
| | — |
| | 6,873 |
| | (1,265 | ) | | 2/7/2014 | | 2007 |
| Walgreens | | Papillion | | NE | | — |
| | 1,239 |
| | 3,212 |
| | — |
| | 4,451 |
| | (516 | ) | | 2/7/2014 | | 2009 | | Baltimore | | MD | | — |
| | 1,185 |
| | 2,764 |
| | — |
| | 3,949 |
| | (860 | ) | | 8/6/2013 | | 2000 |
| Walgreens | | Maplewood | | NJ | | 4,700 |
| | 1,071 |
| | 6,071 |
| | — |
| | 7,142 |
| | (1,844 | ) | | 11/18/2011 | | 2011 | | Brooklyn Park | | MD | | — |
| | 1,416 |
| | 4,160 |
| | — |
| | 5,576 |
| | (1,099 | ) | | 2/7/2014 | | 2008 |
|
| | | | | | | | | | | | | | | | | | | | | | | | | | |
| | | | | | | | Initial Costs (1) | | Costs Capitalized Subsequent to Acquisition (2) | | Gross Amount
Carried at
December 31, 2018
(3) (4) | | | | | | |
| Property | | City | | State | | Encumbrances at
December 31, 2018 | | Land | | Buildings, Fixtures and Improvements | | | Accumulated Depreciation
(3) (5) | | Date Acquired | | Date of Construction |
| Walgreens | | Augusta | | ME | | 3,013 |
| | 1,648 |
| | 5,146 |
| | — |
| | 6,794 |
| | (1,456 | ) | | 2/7/2014 | | 2007 |
| Walgreens | | Buxton | | ME | | — |
| | — |
| | — |
| | 2,131 |
| | 2,131 |
| | (477 | ) | | 5/19/2014 | | 1997 |
| Walgreens | | Dover-Foxcroft | | ME | | — |
| | 256 |
| | 2,659 |
| | 22 |
| | 2,937 |
| | (818 | ) | | 1/8/2014 | | 1999 |
| Walgreens | | Fort Fairfield | | ME | | — |
| | 117 |
| | 1,821 |
| | 76 |
| | 2,014 |
| | (562 | ) | | 1/8/2014 | | 1998 |
| Walgreens | | Fort Kent | | ME | | — |
| | 387 |
| | 2,064 |
| | 20 |
| | 2,471 |
| | (621 | ) | | 1/8/2014 | | 1999 |
| Walgreens | | Clarkston | | MI | | — |
| | 2,768 |
| | 3,197 |
| | — |
| | 5,965 |
| | (879 | ) | | 2/7/2014 | | 2000 |
| Walgreens | | Clinton | | MI | | — |
| | 1,463 |
| | 3,413 |
| | 50 |
| | 4,926 |
| | (1,140 | ) | | 11/13/2012 | | 2002 |
| Walgreens | | Dearborn Heights | | MI | | — |
| | 190 |
| | 3,605 |
| | 3 |
| | 3,798 |
| | (1,158 | ) | | 4/1/2013 | | 1998 |
| Walgreens | | Eastpointe | | MI | | — |
| | 668 |
| | 2,672 |
| | — |
| | 3,340 |
| | (959 | ) | | 1/19/2012 | | 1998 |
| Walgreens | | Lincoln Park | | MI | | 5,494 |
| | 1,041 |
| | 5,896 |
| | — |
| | 6,937 |
| | (2,027 | ) | | 7/31/2012 | | 2007 |
| Walgreens | | Livonia | | MI | | — |
| | 261 |
| | 2,350 |
| | 96 |
| | 2,707 |
| | (756 | ) | | 4/1/2013 | | 1998 |
| Walgreens | | Stevensville | | MI | | 3,099 |
| | 855 |
| | 3,420 |
| | — |
| | 4,275 |
| | (1,244 | ) | | 11/28/2011 | | 2007 |
| Walgreens | | Troy | | MI | | — |
| | — |
| | 1,896 |
| | 3 |
| | 1,899 |
| | (628 | ) | | 12/12/2012 | | 2000 |
| Walgreens | | Warren | | MI | | — |
| | 748 |
| | 2,990 |
| | 3 |
| | 3,741 |
| | (998 | ) | | 11/21/2012 | | 1999 |
| Walgreens | | North Mankato | | MN | | 2,415 |
| | 1,748 |
| | 3,604 |
| | — |
| | 5,352 |
| | (1,000 | ) | | 2/7/2014 | | 2008 |
| Walgreens | | Country Club Hills | | MO | | — |
| | 997 |
| | 4,204 |
| | — |
| | 5,201 |
| | (1,058 | ) | | 2/7/2014 | | 2009 |
| Walgreens | | Columbia | | MS | | — |
| | 452 |
| | 4,072 |
| | — |
| | 4,524 |
| | (1,349 | ) | | 12/21/2012 | | 2011 |
| Walgreens | | Greenwood | | MS | | — |
| | 561 |
| | 3,181 |
| | — |
| | 3,742 |
| | (1,133 | ) | | 2/22/2012 | | 2007 |
| Walgreens | | Burlington | | NC | | — |
| | 973 |
| | 2,726 |
| | — |
| | 3,699 |
| | (838 | ) | | 1/8/2014 | | 2000 |
| Walgreens | | Cape Carteret | | NC | | — |
| | 919 |
| | 3,087 |
| | — |
| | 4,006 |
| | (839 | ) | | 2/7/2014 | | 2008 |
| Walgreens | | Durham | | NC | | 2,871 |
| | 1,441 |
| | 3,581 |
| | — |
| | 5,022 |
| | (1,085 | ) | | 2/7/2014 | | 2010 |
| Walgreens | | Durham | | NC | | 2,720 |
| | 2,201 |
| | 2,923 |
| | — |
| | 5,124 |
| | (963 | ) | | 2/7/2014 | | 2008 |
| Walgreens | | Laurinburg | | NC | | — |
| | 355 |
| | 3,577 |
| | — |
| | 3,932 |
| | (1,031 | ) | | 2/26/2014 | | 2013 |
| Walgreens | | Leland | | NC | | 2,472 |
| | 1,226 |
| | 3,681 |
| | — |
| | 4,907 |
| | (1,029 | ) | | 2/7/2014 | | 2008 |
| Walgreens | | Rocky Mount | | NC | | 2,857 |
| | 1,105 |
| | 4,046 |
| | — |
| | 5,151 |
| | (1,250 | ) | | 2/7/2014 | | 2009 |
| Walgreens | | Wilson | | NC | | — |
| | 573 |
| | 1,337 |
| | — |
| | 1,910 |
| | (419 | ) | | 7/30/2013 | | 2002 |
| Walgreens | | Winterville | | NC | | 2,889 |
| | 578 |
| | 5,322 |
| | — |
| | 5,900 |
| | (1,528 | ) | | 2/7/2014 | | 2009 |
| Walgreens | | North Platte | | NE | | — |
| | 935 |
| | 4,291 |
| | — |
| | 5,226 |
| | (1,205 | ) | | 2/7/2014 | | 2009 |
| Walgreens | | Omaha | | NE | | 2,460 |
| | 1,316 |
| | 4,122 |
| | — |
| | 5,438 |
| | (1,145 | ) | | 2/7/2014 | | 2009 |
| Walgreens | | Papillion | | NE | | — |
| | 1,239 |
| | 3,212 |
| | — |
| | 4,451 |
| | (875 | ) | | 2/7/2014 | | 2009 |
| Walgreens | | Maplewood | | NJ | | 4,700 |
| | 1,071 |
| | 6,071 |
| | — |
| | 7,142 |
| | (2,208 | ) | | 11/18/2011 | | 2011 |
| | | | | | Initial Costs (1) | | Costs Capitalized Subsequent to Acquisition (2) | | Gross Amount
Carried at
December 31, 2016
(3) (4) | | | | | | Initial Costs (1) | | Costs Capitalized Subsequent to Acquisition (2) | | Gross Amount
Carried at
December 31, 2018
(3) (4) | | | |
| Property | | City | | State | | Encumbrances at
December 31, 2016 | | Land | | Buildings, Fixtures and Improvements | | Accumulated Depreciation
(3) (5) | | Date Acquired | | Date of Construction | | City | | State | | Encumbrances at
December 31, 2018 | | Land | | Buildings, Fixtures and Improvements | | Accumulated Depreciation
(3) (5) | | Date Acquired | | Date of Construction |
| Walgreens | | Albuquerque | | NM | | — |
| | 1,173 |
| | 2,287 |
| | — |
| | 3,460 |
| | (375 | ) | | 2/7/2014 | | 1996 | | Albuquerque | | NM | | — |
| | 1,173 |
| | 2,287 |
| | — |
| | 3,460 |
| | (636 | ) | | 2/7/2014 | | 1996 |
| Walgreens | | Las Vegas | | NV | | 6,566 |
| | 1,528 |
| | 6,114 |
| | — |
| | 7,642 |
| | (1,697 | ) | | 5/30/2012 | | 2009 | | Las Vegas | | NV | | 6,566 |
| | 1,528 |
| | 6,114 |
| | — |
| | 7,642 |
| | (2,132 | ) | | 5/30/2012 | | 2009 |
| Walgreens | | Las Vegas | | NV | | — |
| | 700 |
| | 2,801 |
| | — |
| | 3,501 |
| | (623 | ) | | 4/30/2013 | | 2001 | | Las Vegas | | NV | | — |
| | 700 |
| | 2,801 |
| | — |
| | 3,501 |
| | (900 | ) | | 4/30/2013 | | 2001 |
| Walgreens | | Lockport | | NY | | — |
| | 2,358 |
| | 2,301 |
| | — |
| | 4,659 |
| | (375 | ) | | 4/21/2014 | | 1998 | | Lockport | | NY | | — |
| | 2,358 |
| | 2,301 |
| | — |
| | 4,659 |
| | (652 | ) | | 4/21/2014 | | 1998 |
| Walgreens | | Staten Island | | NY | | 3,081 |
| | — |
| | 3,984 |
| | — |
| | 3,984 |
| | (1,220 | ) | | 10/5/2011 | | 2007 | | Staten Island | | NY | | 3,081 |
| | — |
| | 3,984 |
| | — |
| | 3,984 |
| | (1,459 | ) | | 10/5/2011 | | 2007 |
| Walgreens | | Watertown | | NY | | — |
| | 2,937 |
| | 2,664 |
| | — |
| | 5,601 |
| | (440 | ) | | 2/7/2014 | | 2006 | | Watertown | | NY | | — |
| | 2,937 |
| | 2,664 |
| | — |
| | 5,601 |
| | (747 | ) | | 2/7/2014 | | 2006 |
| Walgreens | | Akron | | OH | | 1,683 |
| | 664 |
| | 1,548 |
| | — |
| | 2,212 |
| | (337 | ) | | 5/31/2013 | | 1994 | | Akron | | OH | | 1,684 |
| | 664 |
| | 1,548 |
| | 71 |
| | 2,283 |
| | (496 | ) | | 5/31/2013 | | 1994 |
| Walgreens | | Bryan | | OH | | — |
| | 219 |
| | 4,154 |
| | — |
| | 4,373 |
| | (1,215 | ) | | 2/22/2012 | | 2007 | | Bryan | | OH | | — |
| | 219 |
| | 4,154 |
| | — |
| | 4,373 |
| | (1,480 | ) | | 2/22/2012 | | 2007 |
| Walgreens | | Cleveland | | OH | | — |
| | 472 |
| | 1,890 |
| | 68 |
| | 2,430 |
| | (300 | ) | | 5/19/2014 | | 1994 | | Cleveland | | OH | | — |
| | 472 |
| | 1,890 |
| | 68 |
| | 2,430 |
| | (534 | ) | | 5/19/2014 | | 1994 |
| Walgreens | | Cleveland | | OH | | 2,643 |
| | 743 |
| | 4,757 |
| | — |
| | 5,500 |
| | (784 | ) | | 2/7/2014 | | 2008 | | Cleveland | | OH | | 2,570 |
| | 743 |
| | 4,757 |
| | — |
| | 5,500 |
| | (1,330 | ) | | 2/7/2014 | | 2008 |
| Walgreens | | Eaton | | OH | | 3,068 |
| | 398 |
| | 3,586 |
| | — |
| | 3,984 |
| | (977 | ) | | 6/27/2012 | | 2008 | | Eaton | | OH | | 3,067 |
| | 398 |
| | 3,586 |
| | — |
| | 3,984 |
| | (1,242 | ) | | 6/27/2012 | | 2008 |
| Walgreens | | Medina | | OH | | — |
| | 820 |
| | 4,585 |
| | — |
| | 5,405 |
| | (713 | ) | | 2/7/2014 | | 2001 | | Medina | | OH | | — |
| | 820 |
| | 4,585 |
| | — |
| | 5,405 |
| | (1,209 | ) | | 2/7/2014 | | 2001 |
| Walgreens | | New Albany | | OH | | — |
| | 919 |
| | 3,424 |
| | — |
| | 4,343 |
| | (531 | ) | | 2/7/2014 | | 2006 | | New Albany | | OH | | — |
| | 919 |
| | 3,424 |
| | — |
| | 4,343 |
| | (900 | ) | | 2/7/2014 | | 2006 |
| Walgreens | | Edmond | | OK | | 2,240 |
| | 697 |
| | 4,288 |
| | — |
| | 4,985 |
| | (690 | ) | | 2/7/2014 | | 2000 | | Edmond | | OK | | 2,240 |
| | 697 |
| | 4,287 |
| | — |
| | 4,984 |
| | (1,169 | ) | | 2/7/2014 | | 2000 |
| Walgreens | | Stillwater | | OK | | — |
| | 368 |
| | 4,368 |
| | — |
| | 4,736 |
| | (698 | ) | | 2/7/2014 | | 2000 | | Stillwater | | OK | | — |
| | 368 |
| | 4,368 |
| | 87 |
| | 4,823 |
| | (1,189 | ) | | 2/7/2014 | | 2000 |
| Walgreens | | Tahlequah | | OK | | 2,940 |
| | 647 |
| | 3,664 |
| | — |
| | 4,311 |
| | (870 | ) | | 1/2/2013 | | 2008 | | Tahlequah | | OK | | — |
| | 647 |
| | 3,664 |
| | — |
| | 4,311 |
| | (1,205 | ) | | 1/2/2013 | | 2008 |
| Walgreens | | Tulsa | | OK | | — |
| | 1,147 |
| | 2,904 |
| | — |
| | 4,051 |
| | (467 | ) | | 2/7/2014 | | 2001 | | Tulsa | | OK | | — |
| | 1,147 |
| | 2,904 |
| | — |
| | 4,051 |
| | (791 | ) | | 2/7/2014 | | 2001 |
| Walgreens | | Aibonito Pueblo | | PR | | 5,695 |
| | 1,855 |
| | 5,566 |
| | — |
| | 7,421 |
| | (1,266 | ) | | 3/5/2013 | | 2012 | | Aibonito Pueblo | | PR | | 5,695 |
| | 1,855 |
| | 5,566 |
| | — |
| | 7,421 |
| | (1,802 | ) | | 3/5/2013 | | 2012 |
| Walgreens | | Las Piedras | | PR | | 5,292 |
| | 1,726 |
| | 5,179 |
| | — |
| | 6,905 |
| | (1,152 | ) | | 4/3/2013 | | 1995 | | Las Piedras | | PR | | 5,293 |
| | 1,726 |
| | 5,179 |
| | — |
| | 6,905 |
| | (1,664 | ) | | 4/3/2013 | | 1995 |
| Walgreens | | Anderson | | SC | | — |
| | 835 |
| | 3,342 |
| | — |
| | 4,177 |
| | (977 | ) | | 2/8/2012 | | 2006 | | Anderson | | SC | | — |
| | 835 |
| | 3,342 |
| | — |
| | 4,177 |
| | (1,190 | ) | | 2/8/2012 | | 2006 |
| Walgreens | | Easley | | SC | | 3,685 |
| | 1,206 |
| | 3,617 |
| | — |
| | 4,823 |
| | (986 | ) | | 6/27/2012 | | 2007 | | Easley | | SC | | 3,686 |
| | 1,206 |
| | 3,617 |
| | — |
| | 4,823 |
| | (1,253 | ) | | 6/27/2012 | | 2007 |
| Walgreens | | Fort Mill | | SC | | 2,272 |
| | 1,300 |
| | 2,760 |
| | — |
| | 4,060 |
| | (498 | ) | | 2/7/2014 | | 2010 | | Fort Mill | | SC | | 2,180 |
| | 1,300 |
| | 2,760 |
| | (232 | ) | | 3,828 |
| | (844 | ) | | 2/7/2014 | | 2010 |
| Walgreens | | Greenville | | SC | | 3,991 |
| | 1,313 |
| | 3,940 |
| | — |
| | 5,253 |
| | (1,074 | ) | | 6/27/2012 | | 2006 | | Greenville | | SC | | 3,991 |
| | 1,313 |
| | 3,940 |
| | — |
| | 5,253 |
| | (1,364 | ) | | 6/27/2012 | | 2006 |
| Walgreens | | Lancaster | | SC | | 2,923 |
| | 1,941 |
| | 3,526 |
| | — |
| | 5,467 |
| | (643 | ) | | 2/7/2014 | | 2009 | | Lancaster | | SC | | 2,841 |
| | 1,941 |
| | 3,526 |
| | — |
| | 5,467 |
| | (1,091 | ) | | 2/7/2014 | | 2009 |
| Walgreens | | Myrtle Beach | | SC | | — |
| | — |
| | 2,077 |
| | — |
| | 2,077 |
| | (626 | ) | | 12/29/2011 | | 2001 | | Myrtle Beach | | SC | | — |
| | — |
| | 2,077 |
| | — |
| | 2,077 |
| | (750 | ) | | 12/29/2011 | | 2001 |
| Walgreens | | N. Charleston | | SC | | 3,380 |
| | 1,320 |
| | 3,081 |
| | — |
| | 4,401 |
| | (840 | ) | | 6/27/2012 | | 2007 | | N. Charleston | | SC | | 3,379 |
| | 1,320 |
| | 3,081 |
| | — |
| | 4,401 |
| | (1,067 | ) | | 6/27/2012 | | 2007 |
| Walgreens | | Spearfish | | SD | | — |
| | 1,116 |
| | 4,158 |
| | — |
| | 5,274 |
| | (675 | ) | | 2/7/2014 | | 2008 | | Spartanburg | | SC | | — |
| | 894 |
| | 3,575 |
| | — |
| | 4,469 |
| | (986 | ) | | 5/19/2014 | | 2004 |
| Walgreens | | Bartlett | | TN | | — |
| | 2,358 |
| | 2,194 |
| | — |
| | 4,552 |
| | (350 | ) | | 2/7/2014 | | 2001 | | Travelers Rest | | SC | | — |
| | 882 |
| | 3,527 |
| | — |
| | 4,409 |
| | (972 | ) | | 5/19/2014 | | 2005 |
| Walgreens | | Cordova | | TN | | 2,254 |
| | 1,005 |
| | 2,345 |
| | — |
| | 3,350 |
| | (581 | ) | | 11/9/2012 | | 2002 | | Spearfish | | SD | | — |
| | 1,116 |
| | 4,158 |
| | — |
| | 5,274 |
| | (1,144 | ) | | 2/7/2014 | | 2008 |
| Walgreens | | Memphis | | TN | | 2,418 |
| | 896 |
| | 2,687 |
| | — |
| | 3,583 |
| | (678 | ) | | 10/2/2012 | | 2003 | | Bartlett | | TN | | — |
| | 2,358 |
| | 2,194 |
| | — |
| | 4,552 |
| | (593 | ) | | 2/7/2014 | | 2001 |
| Walgreens | | Anthony | | TX | | — |
| | 644 |
| | 4,369 |
| | — |
| | 5,013 |
| | (663 | ) | | 2/7/2014 | | 2008 | | Cordova | | TN | | — |
| | 1,005 |
| | 2,345 |
| | — |
| | 3,350 |
| | (783 | ) | | 11/9/2012 | | 2002 |
| Walgreens | | Baytown | | TX | | 2,432 |
| | 953 |
| | 4,299 |
| | — |
| | 5,252 |
| | (679 | ) | | 2/7/2014 | | 2009 | | Memphis | | TN | | — |
| | 896 |
| | 2,687 |
| | — |
| | 3,583 |
| | (903 | ) | | 10/2/2012 | | 2003 |
| | | | | | Initial Costs (1) | | Costs Capitalized Subsequent to Acquisition (2) | | Gross Amount
Carried at
December 31, 2016
(3) (4) | | | | | | Initial Costs (1) | | Costs Capitalized Subsequent to Acquisition (2) | | Gross Amount
Carried at
December 31, 2018
(3) (4) | | | |
| Property | | City | | State | | Encumbrances at
December 31, 2016 | | Land | | Buildings, Fixtures and Improvements | | Accumulated Depreciation
(3) (5) | | Date Acquired | | Date of Construction | | City | | State | | Encumbrances at
December 31, 2018 | | Land | | Buildings, Fixtures and Improvements | | Accumulated Depreciation
(3) (5) | | Date Acquired | | Date of Construction |
| Walgreens | | | Murfreesboro | | TN | | — |
| | 454 |
| | 1,817 |
| | — |
| | 2,271 |
| | (501 | ) | | 5/19/2014 | | 1999 |
| Walgreens | | Denton | | TX | | — |
| | 1,184 |
| | 3,726 |
| | — |
| | 4,910 |
| | (588 | ) | | 2/7/2014 | | 2009 | | Anthony | | TX | | — |
| | 644 |
| | 4,369 |
| | — |
| | 5,013 |
| | (1,124 | ) | | 2/7/2014 | | 2008 |
| Walgreens | | Houston | | TX | | — |
| | 491 |
| | 1,965 |
| | — |
| | 2,456 |
| | (357 | ) | | 5/19/2014 | | 1993 | | Baytown | | TX | | 2,364 |
| | 953 |
| | 4,298 |
| | — |
| | 5,251 |
| | (1,152 | ) | | 2/7/2014 | | 2009 |
| Walgreens | | Fredericksburg | | VA | | — |
| | 2,320 |
| | 3,789 |
| | — |
| | 6,109 |
| | (696 | ) | | 2/7/2014 | | 2008 | | Houston | | TX | | — |
| | 491 |
| | 1,965 |
| | — |
| | 2,456 |
| | (632 | ) | | 5/19/2014 | | 1993 |
| Walgreens | | Portsmouth | | VA | | 1,465 |
| | 730 |
| | 3,311 |
| | — |
| | 4,041 |
| | (621 | ) | | 11/5/2013 | | 1998 | | Portsmouth | | VA | | — |
| | 730 |
| | 3,311 |
| | — |
| | 4,041 |
| | (1,006 | ) | | 11/5/2013 | | 1998 |
| Walgreens | | Appleton | | WI | | 1,844 |
| | 975 |
| | 3,047 |
| | — |
| | 4,022 |
| | (494 | ) | | 2/7/2014 | | 2008 | | Appleton | | WI | | 1,792 |
| | 975 |
| | 3,047 |
| | — |
| | 4,022 |
| | (838 | ) | | 2/7/2014 | | 2008 |
| Walgreens | | Appleton | | WI | | 2,687 |
| | 1,198 |
| | 4,344 |
| | — |
| | 5,542 |
| | (709 | ) | | 2/7/2014 | | 2008 | | Appleton | | WI | | 2,612 |
| | 1,198 |
| | 4,344 |
| | — |
| | 5,542 |
| | (1,202 | ) | | 2/7/2014 | | 2008 |
| Walgreens | | Beloit | | WI | | 2,184 |
| | 721 |
| | 3,653 |
| | — |
| | 4,374 |
| | (600 | ) | | 2/7/2014 | | 2008 | | Beloit | | WI | | 2,184 |
| | 721 |
| | 3,653 |
| | — |
| | 4,374 |
| | (1,017 | ) | | 2/7/2014 | | 2008 |
| Walgreens | | Janesville | | WI | | — |
| | 1,039 |
| | 5,315 |
| | — |
| | 6,354 |
| | (857 | ) | | 2/7/2014 | | 2008 | | Janesville | | WI | | — |
| | 1,039 |
| | 5,315 |
| | — |
| | 6,354 |
| | (1,453 | ) | | 2/7/2014 | | 2008 |
| Walgreens | | Janesville | | WI | | 2,195 |
| | 593 |
| | 4,009 |
| | — |
| | 4,602 |
| | (643 | ) | | 2/7/2014 | | 2010 | | Janesville | | WI | | 2,134 |
| | 593 |
| | 4,009 |
| | — |
| | 4,602 |
| | (1,090 | ) | | 2/7/2014 | | 2010 |
| Walgreens | | Bridgeport | | WV | | — |
| | 1,315 |
| | 3,176 |
| | — |
| | 4,491 |
| | (543 | ) | | 2/18/2014 | | 2011 | | Huntington | | WV | | — |
| | 964 |
| | 2,250 |
| | — |
| | 3,214 |
| | (751 | ) | | 11/30/2012 | | 2008 |
| Wal-Mart | | Pueblo | | CO | | 8,250 |
| | 2,586 |
| | 12,512 |
| | — |
| | 15,098 |
| | (2,059 | ) | | 2/7/2014 | | 1998 | | Pueblo | | CO | | 8,249 |
| | 2,586 |
| | 12,512 |
| | — |
| | 15,098 |
| | (3,488 | ) | | 2/7/2014 | | 1998 |
| Wal-Mart | | Douglasville | | GA | | — |
| | 3,559 |
| | 17,588 |
| | — |
| | 21,147 |
| | (2,688 | ) | | 2/7/2014 | | 1999 | | Douglasville | | GA | | — |
| | 3,559 |
| | 17,588 |
| | — |
| | 21,147 |
| | (4,559 | ) | | 2/7/2014 | | 1999 |
| Wal-Mart | | Valdosta | | GA | | — |
| | 3,909 |
| | 9,447 |
| | — |
| | 13,356 |
| | (1,489 | ) | | 2/7/2014 | | 1998 | | Valdosta | | GA | | — |
| | 3,909 |
| | 9,447 |
| | — |
| | 13,356 |
| | (2,525 | ) | | 2/7/2014 | | 1998 |
| Wal-Mart | | Cary | | NC | | — |
| | 2,314 |
| | 5,550 |
| | — |
| | 7,864 |
| | (862 | ) | | 2/7/2014 | | 2005 | | Cary | | NC | | — |
| | 2,314 |
| | 5,549 |
| | — |
| | 7,863 |
| | (1,462 | ) | | 2/7/2014 | | 2005 |
| Wal-Mart | | Albuquerque | | NM | | — |
| | 10,991 |
| | — |
| | — |
| | 10,991 |
| | — |
| | 2/7/2014 | | 2008 | | Albuquerque | | NM | | — |
| | 10,991 |
| | — |
| | — |
| | 10,991 |
| | — |
| | 2/7/2014 | | 2008 |
| Wal-Mart | | Las Vegas | | NV | | — |
| | 17,038 |
| | — |
| | — |
| | 17,038 |
| | — |
| | 2/7/2014 | | 2001 | | Las Vegas | | NV | | — |
| | 17,038 |
| | — |
| | — |
| | 17,038 |
| | — |
| | 2/7/2014 | | 2001 |
| Wal-Mart | | Lancaster | | SC | | — |
| | 2,714 |
| | 11,677 |
| | — |
| | 14,391 |
| | (1,841 | ) | | 2/7/2014 | | 1999 | | Lancaster | | SC | | — |
| | 2,714 |
| | 11,677 |
| | — |
| | 14,391 |
| | (3,121 | ) | | 2/7/2014 | | 1999 |
| Wal-Mart | | Oneida | | TN | | — |
| | 1,803 |
| | 8,580 |
| | — |
| | 10,383 |
| | (1,319 | ) | | 2/7/2014 | | 1999 | |
| Waste Connections | | | Weatherford | | TX | | — |
| | 102 |
| | 3,386 |
| | (2,911 | ) | | 577 |
| | (175 | ) | | 6/12/2014 | | 2011 |
| WaWa | | Gap | | PA | | — |
| | 561 |
| | 5,054 |
| | — |
| | 5,615 |
| | (774 | ) | | 2/7/2014 | | 2004 | | Gap | | PA | | — |
| | 561 |
| | 5,054 |
| | — |
| | 5,615 |
| | (1,313 | ) | | 2/7/2014 | | 2004 |
| WaWa | | Portsmouth | | VA | | 1,241 |
| | 1,573 |
| | — |
| | — |
| | 1,573 |
| | — |
| | 2/7/2014 | | 2008 | | Portsmouth | | VA | | 1,241 |
| | 1,573 |
| | — |
| | — |
| | 1,573 |
| | — |
| | 2/7/2014 | | 2008 |
| Weir Oil and Gas | | Williston | | ND | | — |
| | 273 |
| | 6,232 |
| | — |
| | 6,505 |
| | (695 | ) | | 6/25/2014 | | 2012 | | Williston | | ND | | — |
| | 273 |
| | 6,232 |
| | — |
| | 6,505 |
| | (1,242 | ) | | 6/25/2014 | | 2012 |
| Wells Fargo | | Hillsboro | | OR | | — |
| | 10,480 |
| | 19,287 |
| | — |
| | 29,767 |
| | (2,436 | ) | | 2/7/2014 | | 1978 | | Bristol | | PA | | — |
| | 114 |
| | 81 |
| | 118 |
| | 313 |
| | (31 | ) | | 1/8/2014 | | 1818 |
| Wells Fargo | | Lebanon | | PA | | — |
| | 80 |
| | 435 |
| | — |
| | 515 |
| | (75 | ) | | 1/8/2014 | | 1995 | | Lebanon | | PA | | — |
| | 80 |
| | 435 |
| | 89 |
| | 604 |
| | (128 | ) | | 1/8/2014 | | 1995 |
| Welspun Global Trade | | | Houston | | TX | | 19,524 |
| | 2,356 |
| | 36,347 |
| | (19,687 | ) | | 19,016 |
| | — |
| | 11/5/2013 | | 2009 |
| Wendy's | | Anniston | | AL | | — |
| | 454 |
| | 591 |
| | — |
| | 1,045 |
| | (116 | ) | | 6/27/2013 | | 1976 | | Anniston | | AL | | — |
| | 454 |
| | 591 |
| | — |
| | 1,045 |
| | (175 | ) | | 6/27/2013 | | 1976 |
| Wendy's | | Auburn | | AL | | — |
| | 718 |
| | 1,334 |
| | — |
| | 2,052 |
| | (243 | ) | | 7/31/2013 | | 2000 | | Auburn | | AL | | — |
| | 718 |
| | 1,333 |
| | — |
| | 2,051 |
| | (374 | ) | | 7/31/2013 | | 2000 |
| Wendy's | | Birmingham | | AL | | — |
| | 562 |
| | 990 |
| | — |
| | 1,552 |
| | (194 | ) | | 6/27/2013 | | 2005 | | Birmingham | | AL | | — |
| | 562 |
| | 990 |
| | — |
| | 1,552 |
| | (293 | ) | | 6/27/2013 | | 2005 |
| Wendy's | | Homewood | | AL | | — |
| | 995 |
| | — |
| | — |
| | 995 |
| | — |
| | 6/27/2013 | | 1995 | | Homewood | | AL | | — |
| | 995 |
| | — |
| | — |
| | 995 |
| | — |
| | 6/27/2013 | | 1995 |
| Wendy's | | Phenix City | | AL | | — |
| | 529 |
| | 1,178 |
| | — |
| | 1,707 |
| | (231 | ) | | 6/27/2013 | | 1999 | | Phenix City | | AL | | — |
| | 529 |
| | 1,178 |
| | — |
| | 1,707 |
| | (349 | ) | | 6/27/2013 | | 1999 |
| Wendy's | | Arkadelphia | | AR | | — |
| | 225 |
| | 633 |
| | — |
| | 858 |
| | (124 | ) | | 6/27/2013 | | 1990 | | Batesville | | AR | | — |
| | 155 |
| | 878 |
| | — |
| | 1,033 |
| | (246 | ) | | 7/31/2013 | | 1995 |
| Wendy's | | Batesville | | AR | | — |
| | 155 |
| | 878 |
| | — |
| | 1,033 |
| | (160 | ) | | 7/31/2013 | | 1995 | | Benton | | AR | | — |
| | 478 |
| | 1,018 |
| | — |
| | 1,496 |
| | (302 | ) | | 6/27/2013 | | 1993 |
| Wendy's | | Benton | | AR | | — |
| | 478 |
| | 1,018 |
| | — |
| | 1,496 |
| | (200 | ) | | 6/27/2013 | | 1993 | |
| Wendy's | | Bentonville | | AR | | — |
| | 648 |
| | 708 |
| | — |
| | 1,356 |
| | (139 | ) | | 6/27/2013 | | 1993 | |
| | | | | | Initial Costs (1) | | Costs Capitalized Subsequent to Acquisition (2) | | Gross Amount
Carried at
December 31, 2016
(3) (4) | | | | | | Initial Costs (1) | | Costs Capitalized Subsequent to Acquisition (2) | | Gross Amount
Carried at
December 31, 2018
(3) (4) | | | |
| Property | | City | | State | | Encumbrances at
December 31, 2016 | | Land | | Buildings, Fixtures and Improvements | | Accumulated Depreciation
(3) (5) | | Date Acquired | | Date of Construction | | City | | State | | Encumbrances at
December 31, 2018 | | Land | | Buildings, Fixtures and Improvements | | Accumulated Depreciation
(3) (5) | | Date Acquired | | Date of Construction |
| Wendy's | | Bryant | | AR | | — |
| | 529 |
| | 575 |
| | — |
| | 1,104 |
| | (113 | ) | | 6/27/2013 | | 1995 | | Bentonville | | AR | | — |
| | 648 |
| | 708 |
| | — |
| | 1,356 |
| | (210 | ) | | 6/27/2013 | | 1993 |
| Wendy's | | Cabot | | AR | | — |
| | 524 |
| | 707 |
| | — |
| | 1,231 |
| | (139 | ) | | 6/27/2013 | | 1991 | | Bryant | | AR | | — |
| | 529 |
| | 575 |
| | — |
| | 1,104 |
| | (170 | ) | | 6/27/2013 | | 1995 |
| Wendy's | | Conway | | AR | | — |
| | 478 |
| | 594 |
| | — |
| | 1,072 |
| | (117 | ) | | 6/27/2013 | | 1985 | | Cabot | | AR | | — |
| | 524 |
| | 707 |
| | — |
| | 1,231 |
| | (209 | ) | | 6/27/2013 | | 1991 |
| Wendy's | | Conway | | AR | | — |
| | 482 |
| | 833 |
| | — |
| | 1,315 |
| | (163 | ) | | 6/27/2013 | | 1994 | | Conway | | AR | | — |
| | 478 |
| | 594 |
| | — |
| | 1,072 |
| | (176 | ) | | 6/27/2013 | | 1985 |
| Wendy's | | Fayetteville | | AR | | — |
| | 408 |
| | 830 |
| | — |
| | 1,238 |
| | (163 | ) | | 6/27/2013 | | 1994 | | Conway | | AR | | — |
| | 482 |
| | 833 |
| | — |
| | 1,315 |
| | (247 | ) | | 6/27/2013 | | 1994 |
| Wendy's | | Fayetteville | | AR | | — |
| | 463 |
| | 463 |
| | — |
| | 926 |
| | (84 | ) | | 7/31/2013 | | 1989 | | Fayetteville | | AR | | — |
| | 408 |
| | 830 |
| | — |
| | 1,238 |
| | (246 | ) | | 6/27/2013 | | 1994 |
| Wendy's | | Fort Smith | | AR | | — |
| | 195 |
| | 1,186 |
| | (11 | ) | | 1,370 |
| | (233 | ) | | 6/27/2013 | | 1995 | | Fayetteville | | AR | | — |
| | 463 |
| | 463 |
| | — |
| | 926 |
| | (130 | ) | | 7/31/2013 | | 1989 |
| Wendy's | | Fort Smith | | AR | | — |
| | 63 |
| | 1,016 |
| | — |
| | 1,079 |
| | (199 | ) | | 6/27/2013 | | 1995 | | Fort Smith | | AR | | — |
| | 195 |
| | 1,186 |
| | (11 | ) | | 1,370 |
| | (352 | ) | | 6/27/2013 | | 1995 |
| Wendy's | | Little Rock | | AR | | — |
| | 278 |
| | 878 |
| | — |
| | 1,156 |
| | (172 | ) | | 6/27/2013 | | 1976 | | Fort Smith | | AR | | — |
| | 63 |
| | 1,016 |
| | — |
| | 1,079 |
| | (301 | ) | | 6/27/2013 | | 1995 |
| Wendy's | | Little Rock | | AR | | — |
| | 990 |
| | 623 |
| | — |
| | 1,613 |
| | (301 | ) | | 6/27/2013 | | 1982 | | Little Rock | | AR | | — |
| | 278 |
| | 878 |
| | — |
| | 1,156 |
| | (260 | ) | | 6/27/2013 | | 1976 |
| Wendy's | | Little Rock | | AR | | — |
| | 605 |
| | 463 |
| | — |
| | 1,068 |
| | (91 | ) | | 6/27/2013 | | 1987 | | Little Rock | | AR | | — |
| | 990 |
| | 623 |
| | — |
| | 1,613 |
| | (464 | ) | | 6/27/2013 | | 1982 |
| Wendy's | | Little Rock | | AR | | — |
| | 501 |
| | 501 |
| | — |
| | 1,002 |
| | (91 | ) | | 7/31/2013 | | 1983 | | Little Rock | | AR | | — |
| | 605 |
| | 463 |
| | — |
| | 1,068 |
| | (137 | ) | | 6/27/2013 | | 1987 |
| Wendy's | | Little Rock | | AR | | — |
| | 773 |
| | 773 |
| | — |
| | 1,546 |
| | (141 | ) | | 7/31/2013 | | 1994 | | Little Rock | | AR | | — |
| | 501 |
| | 500 |
| | — |
| | 1,001 |
| | (141 | ) | | 7/31/2013 | | 1983 |
| Wendy's | | Little Rock | | AR | | — |
| | 532 |
| | 650 |
| | — |
| | 1,182 |
| | (119 | ) | | 7/31/2013 | | 1978 | | Little Rock | | AR | | — |
| | 773 |
| | 773 |
| | — |
| | 1,546 |
| | (217 | ) | | 7/31/2013 | | 1994 |
| Wendy's | | Pine Bluff | | AR | | — |
| | 221 |
| | 1,022 |
| | — |
| | 1,243 |
| | (201 | ) | | 6/27/2013 | | 1989 | | Little Rock | | AR | | — |
| | 532 |
| | 650 |
| | — |
| | 1,182 |
| | (182 | ) | | 7/31/2013 | | 1978 |
| Wendy's | | Rogers | | AR | | — |
| | 579 |
| | 912 |
| | — |
| | 1,491 |
| | (179 | ) | | 6/27/2013 | | 1995 | | Pine Bluff | | AR | | — |
| | 221 |
| | 1,022 |
| | — |
| | 1,243 |
| | (303 | ) | | 6/27/2013 | | 1989 |
| Wendy's | | Russellville | | AR | | — |
| | 356 |
| | 638 |
| | — |
| | 994 |
| | (125 | ) | | 6/27/2013 | | 1985 | | Rogers | | AR | | — |
| | 579 |
| | 912 |
| | — |
| | 1,491 |
| | (270 | ) | | 6/27/2013 | | 1995 |
| Wendy's | | Springdale | | AR | | — |
| | 323 |
| | 896 |
| | — |
| | 1,219 |
| | (176 | ) | | 6/27/2013 | | 1994 | | Russellville | | AR | | — |
| | 356 |
| | 638 |
| | — |
| | 994 |
| | (189 | ) | | 6/27/2013 | | 1985 |
| Wendy's | | Springdale | | AR | | — |
| | 410 |
| | 821 |
| | — |
| | 1,231 |
| | (161 | ) | | 6/27/2013 | | 1995 | | Springdale | | AR | | — |
| | 323 |
| | 896 |
| | — |
| | 1,219 |
| | (265 | ) | | 6/27/2013 | | 1994 |
| Wendy's | | Stuttgart | | AR | | — |
| | 67 |
| | 1,038 |
| | — |
| | 1,105 |
| | (204 | ) | | 6/27/2013 | | 2001 | | Springdale | | AR | | — |
| | 410 |
| | 821 |
| | — |
| | 1,231 |
| | (243 | ) | | 6/27/2013 | | 1995 |
| Wendy's | | Van Buren | | AR | | — |
| | 197 |
| | 748 |
| | — |
| | 945 |
| | (147 | ) | | 6/27/2013 | | 1994 | | Stuttgart | | AR | | — |
| | 67 |
| | 1,038 |
| | — |
| | 1,105 |
| | (308 | ) | | 6/27/2013 | | 2001 |
| Wendy's | | Payson | | AZ | | — |
| | 679 |
| | 829 |
| | — |
| | 1,508 |
| | (151 | ) | | 7/31/2013 | | 1986 | | Van Buren | | AR | | — |
| | 197 |
| | 748 |
| | — |
| | 945 |
| | (221 | ) | | 6/27/2013 | | 1994 |
| Wendy's | | Camarillo | | CA | | — |
| | 320 |
| | 2,253 |
| | — |
| | 2,573 |
| | (432 | ) | | 6/27/2013 | | 1995 | | Camarillo | | CA | | — |
| | 320 |
| | 2,253 |
| | — |
| | 2,573 |
| | (661 | ) | | 6/27/2013 | | 1995 |
| Wendy's | | Groton | | CT | | — |
| | 1,099 |
| | 900 |
| | — |
| | 1,999 |
| | (164 | ) | | 7/31/2013 | | 1978 | | Groton | | CT | | — |
| | 1,099 |
| | 900 |
| | — |
| | 1,999 |
| | (252 | ) | | 7/31/2013 | | 1978 |
| Wendy's | | Norwich | | CT | | — |
| | 703 |
| | 937 |
| | — |
| | 1,640 |
| | (184 | ) | | 6/27/2013 | | 1980 | | Norwich | | CT | | — |
| | 703 |
| | 937 |
| | — |
| | 1,640 |
| | (278 | ) | | 6/27/2013 | | 1980 |
| Wendy's | | Orange | | CT | | — |
| | 1,343 |
| | 1,641 |
| | — |
| | 2,984 |
| | (299 | ) | | 7/31/2013 | | 1995 | | Orange | | CT | | — |
| | 1,343 |
| | 1,641 |
| | — |
| | 2,984 |
| | (461 | ) | | 7/31/2013 | | 1995 |
| Wendy's | | Cocoa | | FL | | — |
| | 249 |
| | 567 |
| | — |
| | 816 |
| | (111 | ) | | 6/27/2013 | | 1979 | | Indialantic | | FL | | — |
| | 592 |
| | 614 |
| | — |
| | 1,206 |
| | (182 | ) | | 6/27/2013 | | 1985 |
| Wendy's | | Indialantic | | FL | | — |
| | 592 |
| | 614 |
| | — |
| | 1,206 |
| | (121 | ) | | 6/27/2013 | | 1985 | | Lake Wales | | FL | | — |
| | 975 |
| | 1,462 |
| | — |
| | 2,437 |
| | (410 | ) | | 7/31/2013 | | 1999 |
| Wendy's | | Lake Wales | | FL | | — |
| | 975 |
| | 1,462 |
| | — |
| | 2,437 |
| | (267 | ) | | 7/31/2013 | | 1999 | | Lynn Haven | | FL | | — |
| | 446 |
| | 852 |
| | — |
| | 1,298 |
| | (252 | ) | | 6/27/2013 | | 1995 |
| Wendy's | | Lynn Haven | | FL | | — |
| | 446 |
| | 852 |
| | — |
| | 1,298 |
| | (167 | ) | | 6/27/2013 | | 1995 | | Melbourne | | FL | | — |
| | 550 |
| | 680 |
| | — |
| | 1,230 |
| | (202 | ) | | 6/27/2013 | | 1993 |
| Wendy's | | Melbourne | | FL | | — |
| | 550 |
| | 681 |
| | — |
| | 1,231 |
| | (134 | ) | | 6/27/2013 | | 1993 | | Merritt Island | | FL | | — |
| | 720 |
| | 589 |
| | — |
| | 1,309 |
| | (165 | ) | | 7/31/2013 | | 1990 |
| Wendy's | | Merritt Island | | FL | | — |
| | 720 |
| | 589 |
| | — |
| | 1,309 |
| | (107 | ) | | 7/31/2013 | | 1990 | | New Smyrna Beach | | FL | | — |
| | 476 |
| | 394 |
| | — |
| | 870 |
| | (117 | ) | | 6/27/2013 | | 1982 |
| | | | | | Initial Costs (1) | | Costs Capitalized Subsequent to Acquisition (2) | | Gross Amount
Carried at
December 31, 2016
(3) (4) | | | | | | Initial Costs (1) | | Costs Capitalized Subsequent to Acquisition (2) | | Gross Amount
Carried at
December 31, 2018
(3) (4) | | | |
| Property | | City | | State | | Encumbrances at
December 31, 2016 | | Land | | Buildings, Fixtures and Improvements | | Accumulated Depreciation
(3) (5) | | Date Acquired | | Date of Construction | | City | | State | | Encumbrances at
December 31, 2018 | | Land | | Buildings, Fixtures and Improvements | | Accumulated Depreciation
(3) (5) | | Date Acquired | | Date of Construction |
| Wendy's | | New Smyrna Beach | | FL | | — |
| | 476 |
| | 394 |
| | — |
| | 870 |
| | (77 | ) | | 6/27/2013 | | 1982 | | Ormond Beach | | FL | | — |
| | 626 |
| | 561 |
| | — |
| | 1,187 |
| | (166 | ) | | 6/27/2013 | | 1994 |
| Wendy's | | Ormond Beach | | FL | | — |
| | 626 |
| | 561 |
| | — |
| | 1,187 |
| | (110 | ) | | 6/27/2013 | | 1994 | | Ormond Beach | | FL | | — |
| | 503 |
| | 503 |
| | — |
| | 1,006 |
| | (141 | ) | | 7/31/2013 | | 1984 |
| Wendy's | | Ormond Beach | | FL | | — |
| | 503 |
| | 503 |
| | — |
| | 1,006 |
| | (92 | ) | | 7/31/2013 | | 1984 | | Panama City | | FL | | — |
| | 461 |
| | 529 |
| | — |
| | 990 |
| | (157 | ) | | 6/27/2013 | | 1984 |
| Wendy's | | Panama City | | FL | | — |
| | 461 |
| | 529 |
| | — |
| | 990 |
| | (104 | ) | | 6/27/2013 | | 1984 | | Panama City | | FL | | — |
| | 445 |
| | 837 |
| | — |
| | 1,282 |
| | (248 | ) | | 6/27/2013 | | 1987 |
| Wendy's | | Panama City | | FL | | — |
| | 445 |
| | 837 |
| | — |
| | 1,282 |
| | (164 | ) | | 6/27/2013 | | 1987 | | Port Orange | | FL | | — |
| | 695 |
| | 569 |
| | — |
| | 1,264 |
| | (160 | ) | | 7/31/2013 | | 1996 |
| Wendy's | | Port Orange | | FL | | — |
| | 695 |
| | 569 |
| | — |
| | 1,264 |
| | (104 | ) | | 7/31/2013 | | 1996 | | South Daytona | | FL | | — |
| | 531 |
| | 432 |
| | — |
| | 963 |
| | (128 | ) | | 6/27/2013 | | 1980 |
| Wendy's | | South Daytona | | FL | | — |
| | 531 |
| | 432 |
| | — |
| | 963 |
| | (85 | ) | | 6/27/2013 | | 1980 | | Tallahassee | | FL | | — |
| | 952 |
| | 514 |
| | — |
| | 1,466 |
| | (152 | ) | | 6/27/2013 | | 1986 |
| Wendy's | | Tallahassee | | FL | | — |
| | 952 |
| | 514 |
| | — |
| | 1,466 |
| | (101 | ) | | 6/27/2013 | | 1986 | | Tallahassee | | FL | | — |
| | 855 |
| | 505 |
| | — |
| | 1,360 |
| | (149 | ) | | 6/27/2013 | | 1986 |
| Wendy's | | Tallahassee | | FL | | — |
| | 855 |
| | 505 |
| | — |
| | 1,360 |
| | (99 | ) | | 6/27/2013 | | 1986 | | Titusville | | FL | | — |
| | 415 |
| | 761 |
| | — |
| | 1,176 |
| | (225 | ) | | 6/27/2013 | | 1984 |
| Wendy's | | Titusville | | FL | | — |
| | 528 |
| | 239 |
| | — |
| | 767 |
| | (47 | ) | | 6/27/2013 | | 1978 | | Titusville | | FL | | — |
| | 414 |
| | 770 |
| | — |
| | 1,184 |
| | (216 | ) | | 7/31/2013 | | 1996 |
| Wendy's | | Titusville | | FL | | — |
| | 415 |
| | 761 |
| | — |
| | 1,176 |
| | (149 | ) | | 6/27/2013 | | 1984 | | Albany | | GA | | — |
| | 414 |
| | 1,656 |
| | — |
| | 2,070 |
| | (465 | ) | | 7/31/2013 | | 1995 |
| Wendy's | | Titusville | | FL | | — |
| | 414 |
| | 770 |
| | — |
| | 1,184 |
| | (140 | ) | | 7/31/2013 | | 1996 | | Albany | | GA | | — |
| | 383 |
| | 748 |
| | — |
| | 1,131 |
| | (199 | ) | | 3/26/2014 | | 1999 |
| Wendy's | | Albany | | GA | | — |
| | 414 |
| | 1,656 |
| | — |
| | 2,070 |
| | (302 | ) | | 7/31/2013 | | 1995 | | Marietta | | GA | | — |
| | 383 |
| | 506 |
| | — |
| | 889 |
| | (150 | ) | | 6/27/2013 | | 1994 |
| Wendy's | | Albany | | GA | | — |
| | 383 |
| | 748 |
| | — |
| | 1,131 |
| | (116 | ) | | 3/26/2014 | | 1999 | | Brunswick | | GA | | — |
| | 306 |
| | 435 |
| | — |
| | 741 |
| | (129 | ) | | 6/27/2013 | | 1985 |
| Wendy's | | Austell | | GA | | — |
| | 383 |
| | 506 |
| | — |
| | 889 |
| | (99 | ) | | 6/27/2013 | | 1994 | | Columbus | | GA | | — |
| | 701 |
| | 1,787 |
| | — |
| | 2,488 |
| | (530 | ) | | 6/27/2013 | | 1999 |
| Wendy's | | Brunswick | | GA | | — |
| | 306 |
| | 435 |
| | — |
| | 741 |
| | (85 | ) | | 6/27/2013 | | 1985 | | Columbus | | GA | | — |
| | 743 |
| | 1,184 |
| | — |
| | 1,927 |
| | (351 | ) | | 6/27/2013 | | 1988 |
| Wendy's | | Columbus | | GA | | — |
| | 701 |
| | 1,787 |
| | — |
| | 2,488 |
| | (351 | ) | | 6/27/2013 | | 1999 | | Columbus | | GA | | — |
| | 478 |
| | 2,209 |
| | — |
| | 2,687 |
| | (655 | ) | | 6/27/2013 | | 2003 |
| Wendy's | | Columbus | | GA | | — |
| | 743 |
| | 1,185 |
| | — |
| | 1,928 |
| | (233 | ) | | 6/27/2013 | | 1988 | | Columbus | | GA | | — |
| | 223 |
| | 1,380 |
| | — |
| | 1,603 |
| | (367 | ) | | 3/26/2014 | | 1982 |
| Wendy's | | Columbus | | GA | | — |
| | 478 |
| | 2,209 |
| | — |
| | 2,687 |
| | (434 | ) | | 6/27/2013 | | 2003 | | Douglasville | | GA | | — |
| | 605 |
| | 776 |
| | — |
| | 1,381 |
| | (230 | ) | | 6/27/2013 | | 1993 |
| Wendy's | | Columbus | | GA | | — |
| | 223 |
| | 1,380 |
| | — |
| | 1,603 |
| | (214 | ) | | 3/26/2014 | | 1982 | | Eastman | | GA | | — |
| | 258 |
| | 473 |
| | — |
| | 731 |
| | (140 | ) | | 6/27/2013 | | 1996 |
| Wendy's | | Douglasville | | GA | | — |
| | 605 |
| | 776 |
| | — |
| | 1,381 |
| | (152 | ) | | 6/27/2013 | | 1993 | | Fairburn | | GA | | — |
| | 1,076 |
| | 1,316 |
| | — |
| | 2,392 |
| | (369 | ) | | 7/31/2013 | | 2002 |
| Wendy's | | Eastman | | GA | | — |
| | 258 |
| | 473 |
| | — |
| | 731 |
| | (93 | ) | | 6/27/2013 | | 1996 | | Hogansville | | GA | | — |
| | 240 |
| | 1,359 |
| | (1,081 | ) | | 518 |
| | (4 | ) | | 7/31/2013 | | 1985 |
| Wendy's | | Fairburn | | GA | | — |
| | 1,076 |
| | 1,316 |
| | — |
| | 2,392 |
| | (240 | ) | | 7/31/2013 | | 2002 | | Lithia Springs | | GA | | — |
| | 668 |
| | 774 |
| | — |
| | 1,442 |
| | (229 | ) | | 6/27/2013 | | 1988 |
| Wendy's | | Hogansville | | GA | | — |
| | 240 |
| | 1,359 |
| | — |
| | 1,599 |
| | (248 | ) | | 7/31/2013 | | 1985 | | Morrow | | GA | | — |
| | 755 |
| | 922 |
| | — |
| | 1,677 |
| | (259 | ) | | 7/31/2013 | | 1990 |
| Wendy's | | Lithia Springs | | GA | | — |
| | 668 |
| | 774 |
| | — |
| | 1,442 |
| | (152 | ) | | 6/27/2013 | | 1988 | | Savannah | | GA | | — |
| | 720 |
| | 720 |
| | — |
| | 1,440 |
| | (202 | ) | | 7/31/2013 | | 2001 |
| Wendy's | | Morrow | | GA | | — |
| | 755 |
| | 922 |
| | — |
| | 1,677 |
| | (168 | ) | | 7/31/2013 | | 1990 | | Sharpsburg | | GA | | — |
| | 649 |
| | 1,299 |
| | — |
| | 1,948 |
| | (385 | ) | | 6/27/2013 | | 2002 |
| Wendy's | | Savannah | | GA | | — |
| | 720 |
| | 720 |
| | — |
| | 1,440 |
| | (131 | ) | | 7/31/2013 | | 2001 | | Bourbonnais | | IL | | — |
| | 346 |
| | 1,039 |
| | — |
| | 1,385 |
| | (292 | ) | | 7/31/2013 | | 1993 |
| Wendy's | | Sharpsburg | | GA | | — |
| | 649 |
| | 1,299 |
| | — |
| | 1,948 |
| | (255 | ) | | 6/27/2013 | | 2002 | | Joliet | | IL | | — |
| | 642 |
| | 963 |
| | — |
| | 1,605 |
| | (270 | ) | | 7/31/2013 | | 1977 |
| Wendy's | | Stockbridge | | GA | | — |
| | 480 |
| | 558 |
| | — |
| | 1,038 |
| | (110 | ) | | 6/27/2013 | | 1987 | | Kankakee | | IL | | — |
| | 250 |
| | 1,419 |
| | — |
| | 1,669 |
| | (398 | ) | | 7/31/2013 | | 2005 |
| Wendy's | | Bourbonnais | | IL | | — |
| | 346 |
| | 1,039 |
| | — |
| | 1,385 |
| | (190 | ) | | 7/31/2013 | | 1993 | | Mokena | | IL | | — |
| | 665 |
| | 997 |
| | — |
| | 1,662 |
| | (280 | ) | | 7/31/2013 | | 1992 |
| Wendy's | | Joliet | | IL | | — |
| | 642 |
| | 963 |
| | — |
| | 1,605 |
| | (176 | ) | | 7/31/2013 | | 1977 | | Normal | | IL | | — |
| | 443 |
| | 991 |
| | — |
| | 1,434 |
| | (263 | ) | | 3/26/2014 | | 1985 |
| Wendy's | | Kankakee | | IL | | — |
| | 250 |
| | 1,419 |
| | — |
| | 1,669 |
| | (259 | ) | | 7/31/2013 | | 2005 | | Anderson | | IN | | — |
| | 872 |
| | 736 |
| | — |
| | 1,608 |
| | (218 | ) | | 6/27/2013 | | 1978 |
| | | | | | Initial Costs (1) | | Costs Capitalized Subsequent to Acquisition (2) | | Gross Amount
Carried at
December 31, 2016
(3) (4) | | | | | | Initial Costs (1) | | Costs Capitalized Subsequent to Acquisition (2) | | Gross Amount
Carried at
December 31, 2018
(3) (4) | | | |
| Property | | City | | State | | Encumbrances at
December 31, 2016 | | Land | | Buildings, Fixtures and Improvements | | Accumulated Depreciation
(3) (5) | | Date Acquired | | Date of Construction | | City | | State | | Encumbrances at
December 31, 2018 | | Land | | Buildings, Fixtures and Improvements | | Accumulated Depreciation
(3) (5) | | Date Acquired | | Date of Construction |
| Wendy's | | Mokena | | IL | | — |
| | 665 |
| | 997 |
| | — |
| | 1,662 |
| | (182 | ) | | 7/31/2013 | | 1992 | | Anderson | | IN | | — |
| | 859 |
| | 707 |
| | — |
| | 1,566 |
| | (210 | ) | | 6/27/2013 | | 1978 |
| Wendy's | | Normal | | IL | | — |
| | 443 |
| | 991 |
| | — |
| | 1,434 |
| | (153 | ) | | 3/26/2014 | | 1985 | | Anderson | | IN | | — |
| | 505 |
| | 757 |
| | — |
| | 1,262 |
| | (212 | ) | | 7/31/2013 | | 1995 |
| Wendy's | | Anderson | | IN | | — |
| | 872 |
| | 736 |
| | — |
| | 1,608 |
| | (144 | ) | | 6/27/2013 | | 1978 | | Anderson | | IN | | — |
| | 584 |
| | 713 |
| | — |
| | 1,297 |
| | (200 | ) | | 7/31/2013 | | 1976 |
| Wendy's | | Anderson | | IN | | — |
| | 859 |
| | 708 |
| | — |
| | 1,567 |
| | (139 | ) | | 6/27/2013 | | 1978 | | Avon | | IN | | — |
| | 538 |
| | 407 |
| | — |
| | 945 |
| | (160 | ) | | 2/7/2014 | | 1990 |
| Wendy's | | Anderson | | IN | | — |
| | 505 |
| | 757 |
| | — |
| | 1,262 |
| | (138 | ) | | 7/31/2013 | | 1995 | | Avon | | IN | | — |
| | 638 |
| | 330 |
| | — |
| | 968 |
| | (175 | ) | | 2/7/2014 | | 1999 |
| Wendy's | | Anderson | | IN | | — |
| | 584 |
| | 713 |
| | — |
| | 1,297 |
| | (130 | ) | | 7/31/2013 | | 1976 | | Carmel | | IN | | — |
| | 736 |
| | 211 |
| | — |
| | 947 |
| | (90 | ) | | 2/7/2014 | | 1980 |
| Wendy's | | Avon | | IN | | — |
| | 538 |
| | 407 |
| | — |
| | 945 |
| | (94 | ) | | 2/7/2014 | | 1990 | | Carmel | | IN | | — |
| | 915 |
| | 178 |
| | — |
| | 1,093 |
| | (112 | ) | | 2/7/2014 | | 2001 |
| Wendy's | | Avon | | IN | | — |
| | 638 |
| | 330 |
| | — |
| | 968 |
| | (103 | ) | | 2/7/2014 | | 1999 | | Connersville | | IN | | — |
| | 324 |
| | 1,298 |
| | — |
| | 1,622 |
| | (364 | ) | | 7/31/2013 | | 1989 |
| Wendy's | | Carmel | | IN | | — |
| | 736 |
| | 211 |
| | — |
| | 947 |
| | (53 | ) | | 2/7/2014 | | 1980 | | Fishers | | IN | | — |
| | 855 |
| | 147 |
| | — |
| | 1,002 |
| | (94 | ) | | 2/7/2014 | | 1999 |
| Wendy's | | Carmel | | IN | | — |
| | 915 |
| | 178 |
| | — |
| | 1,093 |
| | (66 | ) | | 2/7/2014 | | 2001 | | Fishers | | IN | | — |
| | 761 |
| | 229 |
| | — |
| | 990 |
| | (119 | ) | | 2/7/2014 | | 2012 |
| Wendy's | | Connersville | | IN | | — |
| | 324 |
| | 1,298 |
| | — |
| | 1,622 |
| | (237 | ) | | 7/31/2013 | | 1989 | | Greenfield | | IN | | — |
| | 429 |
| | 214 |
| | — |
| | 643 |
| | (93 | ) | | 2/7/2014 | | 1980 |
| Wendy's | | Fishers | | IN | | — |
| | 855 |
| | 147 |
| | — |
| | 1,002 |
| | (55 | ) | | 2/7/2014 | | 1999 | | Indianapolis | | IN | | — |
| | 751 |
| | 212 |
| | — |
| | 963 |
| | (114 | ) | | 2/7/2014 | | 1993 |
| Wendy's | | Fishers | | IN | | — |
| | 761 |
| | 229 |
| | — |
| | 990 |
| | (70 | ) | | 2/7/2014 | | 2012 | | Lebanon | | IN | | — |
| | 1,265 |
| | 108 |
| | — |
| | 1,373 |
| | (84 | ) | | 2/7/2014 | | 1979 |
| Wendy's | | Greenfield | | IN | | — |
| | 429 |
| | 214 |
| | — |
| | 643 |
| | (55 | ) | | 2/7/2014 | | 1980 | | Noblesville | | IN | | — |
| | 590 |
| | 42 |
| | — |
| | 632 |
| | (24 | ) | | 2/7/2014 | | 1988 |
| Wendy's | | Indianapolis | | IN | | — |
| | 751 |
| | 212 |
| | — |
| | 963 |
| | (67 | ) | | 2/7/2014 | | 1993 | | Pendleton | | IN | | — |
| | 448 |
| | 894 |
| | — |
| | 1,342 |
| | (265 | ) | | 6/27/2013 | | 2005 |
| Wendy's | | Lebanon | | IN | | — |
| | 1,265 |
| | 108 |
| | — |
| | 1,373 |
| | (50 | ) | | 2/7/2014 | | 1979 | | Richmond | | IN | | — |
| | 735 |
| | 1,716 |
| | — |
| | 2,451 |
| | (481 | ) | | 7/31/2013 | | 1989 |
| Wendy's | | Noblesville | | IN | | — |
| | 590 |
| | 42 |
| | — |
| | 632 |
| | (14 | ) | | 2/7/2014 | | 1988 | | Richmond | | IN | | — |
| | 661 |
| | 992 |
| | — |
| | 1,653 |
| | (278 | ) | | 7/31/2013 | | 1989 |
| Wendy's | | Pendleton | | IN | | — |
| | 448 |
| | 895 |
| | — |
| | 1,343 |
| | (176 | ) | | 6/27/2013 | | 2005 | | Benton | | KY | | — |
| | 252 |
| | 926 |
| | — |
| | 1,178 |
| | (246 | ) | | 3/26/2014 | | 2001 |
| Wendy's | | Richmond | | IN | | — |
| | 735 |
| | 1,716 |
| | — |
| | 2,451 |
| | (313 | ) | | 7/31/2013 | | 1989 | | Louisville | | KY | | — |
| | 834 |
| | 1,379 |
| | — |
| | 2,213 |
| | (409 | ) | | 6/27/2013 | | 2001 |
| Wendy's | | Richmond | | IN | | — |
| | 661 |
| | 992 |
| | — |
| | 1,653 |
| | (181 | ) | | 7/31/2013 | | 1989 | | Louisville | | KY | | — |
| | 532 |
| | 1,221 |
| | — |
| | 1,753 |
| | (362 | ) | | 6/27/2013 | | 1998 |
| Wendy's | | Benton | | KY | | — |
| | 252 |
| | 926 |
| | — |
| | 1,178 |
| | (143 | ) | | 3/26/2014 | | 2001 | | Louisville | | KY | | — |
| | 857 |
| | 1,420 |
| | — |
| | 2,277 |
| | (421 | ) | | 6/27/2013 | | 2000 |
| Wendy's | | Louisville | | KY | | — |
| | 834 |
| | 1,379 |
| | — |
| | 2,213 |
| | (271 | ) | | 6/27/2013 | | 2001 | | Mayfield | | KY | | — |
| | 242 |
| | 779 |
| | — |
| | 1,021 |
| | (207 | ) | | 3/26/2014 | | 1986 |
| Wendy's | | Louisville | | KY | | — |
| | 532 |
| | 1,221 |
| | — |
| | 1,753 |
| | (240 | ) | | 6/27/2013 | | 1998 | | Minden | | LA | | — |
| | 182 |
| | 936 |
| | — |
| | 1,118 |
| | (277 | ) | | 6/27/2013 | | 2001 |
| Wendy's | | Louisville | | KY | | — |
| | 857 |
| | 1,421 |
| | — |
| | 2,278 |
| | (279 | ) | | 6/27/2013 | | 2000 | | Worcester | | MA | | — |
| | 370 |
| | 1,288 |
| | — |
| | 1,658 |
| | (378 | ) | | 6/27/2013 | | 1995 |
| Wendy's | | Mayfield | | KY | | — |
| | 242 |
| | 779 |
| | — |
| | 1,021 |
| | (120 | ) | | 3/26/2014 | | 1986 | | Baltimore | | MD | | — |
| | 760 |
| | 802 |
| | — |
| | 1,562 |
| | (238 | ) | | 6/27/2013 | | 1995 |
| Wendy's | | Baton Rouge | | LA | | — |
| | 316 |
| | 782 |
| | — |
| | 1,098 |
| | (153 | ) | | 6/27/2013 | | 1998 | | Baltimore | | MD | | — |
| | 904 |
| | 1,035 |
| | — |
| | 1,939 |
| | (307 | ) | | 6/27/2013 | | 2002 |
| Wendy's | | Minden | | LA | | — |
| | 182 |
| | 936 |
| | — |
| | 1,118 |
| | (184 | ) | | 6/27/2013 | | 2001 | | District Heights | | MD | | — |
| | 332 |
| | 275 |
| | — |
| | 607 |
| | (81 | ) | | 6/27/2013 | | 1979 |
| Wendy's | | Worcester | | MA | | — |
| | 370 |
| | 1,288 |
| | — |
| | 1,658 |
| | (247 | ) | | 6/27/2013 | | 1995 | | Landover | | MD | | — |
| | 340 |
| | 267 |
| | — |
| | 607 |
| | (79 | ) | | 6/27/2013 | | 1978 |
| Wendy's | | Baltimore | | MD | | — |
| | 760 |
| | 802 |
| | — |
| | 1,562 |
| | (157 | ) | | 6/27/2013 | | 1995 | | Pasadena | | MD | | — |
| | 1,049 |
| | 1,902 |
| | — |
| | 2,951 |
| | (564 | ) | | 6/27/2013 | | 1997 |
| Wendy's | | Baltimore | | MD | | — |
| | 904 |
| | 1,036 |
| | — |
| | 1,940 |
| | (203 | ) | | 6/27/2013 | | 2002 | | Salisbury | | MD | | — |
| | 370 |
| | 1,299 |
| | — |
| | 1,669 |
| | (381 | ) | | 6/27/2013 | | 1995 |
| Wendy's | | Landover | | MD | | — |
| | 340 |
| | 267 |
| | — |
| | 607 |
| | (52 | ) | | 6/27/2013 | | 1978 | | Madison Heights | | MI | | — |
| | 198 |
| | 725 |
| | (477 | ) | | 446 |
| | (35 | ) | | 6/27/2013 | | 1998 |
| Wendy's | | Pasadena | | MD | | — |
| | 1,049 |
| | 1,902 |
| | — |
| | 2,951 |
| | (373 | ) | | 6/27/2013 | | 1997 | | Picayune | | MS | | — |
| | 437 |
| | 1,032 |
| | — |
| | 1,469 |
| | (274 | ) | | 3/26/2014 | | 1983 |
| | | | | | Initial Costs (1) | | Costs Capitalized Subsequent to Acquisition (2) | | Gross Amount
Carried at
December 31, 2016
(3) (4) | | | | | | Initial Costs (1) | | Costs Capitalized Subsequent to Acquisition (2) | | Gross Amount
Carried at
December 31, 2018
(3) (4) | | | |
| Property | | City | | State | | Encumbrances at
December 31, 2016 | | Land | | Buildings, Fixtures and Improvements | | Accumulated Depreciation
(3) (5) | | Date Acquired | | Date of Construction | | City | | State | | Encumbrances at
December 31, 2018 | | Land | | Buildings, Fixtures and Improvements | | Accumulated Depreciation
(3) (5) | | Date Acquired | | Date of Construction |
| Wendy's | | Salisbury | | MD | | — |
| | 370 |
| | 1,299 |
| | — |
| | 1,669 |
| | (249 | ) | | 6/27/2013 | | 1995 | | Kinston | | NC | | — |
| | 491 |
| | 1,159 |
| | — |
| | 1,650 |
| | (302 | ) | | 5/1/2014 | | 2004 |
| Wendy's | | Suitland | | MD | | — |
| | 332 |
| | 275 |
| | — |
| | 607 |
| | (54 | ) | | 6/27/2013 | | 1979 | | Bellevue | | NE | | — |
| | 338 |
| | 484 |
| | — |
| | 822 |
| | (143 | ) | | 6/27/2013 | | 1981 |
| Wendy's | | Madison Heights | | MI | | — |
| | 198 |
| | 725 |
| | — |
| | 923 |
| | (142 | ) | | 6/27/2013 | | 1998 | | Millville | | NJ | | — |
| | 373 |
| | 1,169 |
| | — |
| | 1,542 |
| | (346 | ) | | 6/27/2013 | | 1994 |
| Wendy's | | Picayune | | MS | | — |
| | 437 |
| | 1,032 |
| | — |
| | 1,469 |
| | (160 | ) | | 3/26/2014 | | 1983 | | Henderson | | NV | | — |
| | 933 |
| | 842 |
| | — |
| | 1,775 |
| | (266 | ) | | 2/7/2014 | | 1997 |
| Wendy's | | Kinston | | NC | | — |
| | 491 |
| | 1,159 |
| | — |
| | 1,650 |
| | (171 | ) | | 5/1/2014 | | 2004 | | Henderson | | NV | | — |
| | 882 |
| | 457 |
| | — |
| | 1,339 |
| | (144 | ) | | 2/7/2014 | | 1999 |
| Wendy's | | Bellevue | | NE | | — |
| | 338 |
| | 484 |
| | — |
| | 822 |
| | (95 | ) | | 6/27/2013 | | 1981 | | Henderson | | NV | | — |
| | 785 |
| | 507 |
| | — |
| | 1,292 |
| | (173 | ) | | 2/7/2014 | | 2000 |
| Wendy's | | Millville | | NJ | | — |
| | 373 |
| | 1,169 |
| | — |
| | 1,542 |
| | (229 | ) | | 6/27/2013 | | 1994 | | Las Vegas | | NV | | — |
| | 398 |
| | 589 |
| | — |
| | 987 |
| | (162 | ) | | 2/7/2014 | | 1976 |
| Wendy's | | Henderson | | NV | | — |
| | 933 |
| | 842 |
| | — |
| | 1,775 |
| | (157 | ) | | 2/7/2014 | | 1997 | | Las Vegas | | NV | | — |
| | 919 |
| | 562 |
| | — |
| | 1,481 |
| | (185 | ) | | 2/7/2014 | | 1976 |
| Wendy's | | Henderson | | NV | | — |
| | 882 |
| | 457 |
| | — |
| | 1,339 |
| | (85 | ) | | 2/7/2014 | | 1999 | | Las Vegas | | NV | | — |
| | 789 |
| | 583 |
| | — |
| | 1,372 |
| | (164 | ) | | 2/7/2014 | | 1984 |
| Wendy's | | Henderson | | NV | | — |
| | 785 |
| | 508 |
| | — |
| | 1,293 |
| | (102 | ) | | 2/7/2014 | | 2000 | | Las Vegas | | NV | | — |
| | 725 |
| | 458 |
| | — |
| | 1,183 |
| | (149 | ) | | 2/7/2014 | | 1986 |
| Wendy's | | Las Vegas | | NV | | — |
| | 398 |
| | 589 |
| | — |
| | 987 |
| | (96 | ) | | 2/7/2014 | | 1976 | | Las Vegas | | NV | | — |
| | 915 |
| | 724 |
| | — |
| | 1,639 |
| | (222 | ) | | 2/7/2014 | | 1991 |
| Wendy's | | Las Vegas | | NV | | — |
| | 919 |
| | 562 |
| | — |
| | 1,481 |
| | (109 | ) | | 2/7/2014 | | 1976 | | Las Vegas | | NV | | — |
| | 633 |
| | 392 |
| | — |
| | 1,025 |
| | (113 | ) | | 2/7/2014 | | 1994 |
| Wendy's | | Las Vegas | | NV | | — |
| | 789 |
| | 583 |
| | — |
| | 1,372 |
| | (97 | ) | | 2/7/2014 | | 1984 | | Auburn | | NY | | — |
| | 465 |
| | 1,085 |
| | — |
| | 1,550 |
| | (304 | ) | | 7/31/2013 | | 1977 |
| Wendy's | | Las Vegas | | NV | | — |
| | 725 |
| | 458 |
| | — |
| | 1,183 |
| | (88 | ) | | 2/7/2014 | | 1986 | | Binghamton | | NY | | — |
| | 293 |
| | 879 |
| | — |
| | 1,172 |
| | (247 | ) | | 7/31/2013 | | 1978 |
| Wendy's | | Las Vegas | | NV | | — |
| | 915 |
| | 724 |
| | — |
| | 1,639 |
| | (131 | ) | | 2/7/2014 | | 1991 | | Corning | | NY | | — |
| | 191 |
| | 1,717 |
| | — |
| | 1,908 |
| | (482 | ) | | 7/31/2013 | | 1996 |
| Wendy's | | Las Vegas | | NV | | — |
| | 633 |
| | 392 |
| | — |
| | 1,025 |
| | (67 | ) | | 2/7/2014 | | 1994 | | Cortland | | NY | | — |
| | 635 |
| | 952 |
| | — |
| | 1,587 |
| | (267 | ) | | 7/31/2013 | | 1984 |
| Wendy's | | Auburn | | NY | | — |
| | 465 |
| | 1,085 |
| | — |
| | 1,550 |
| | (198 | ) | | 7/31/2013 | | 1977 | | Endicott | | NY | | — |
| | 313 |
| | 1,253 |
| | — |
| | 1,566 |
| | (352 | ) | | 7/31/2013 | | 1987 |
| Wendy's | | Binghamton | | NY | | — |
| | 293 |
| | 879 |
| | — |
| | 1,172 |
| | (160 | ) | | 7/31/2013 | | 1978 | | Fulton | | NY | | — |
| | 392 |
| | 1,181 |
| | — |
| | 1,573 |
| | (314 | ) | | 3/26/2014 | | 1980 |
| Wendy's | | Corning | | NY | | — |
| | 191 |
| | 1,717 |
| | — |
| | 1,908 |
| | (313 | ) | | 7/31/2013 | | 1996 | | Horseheads | | NY | | — |
| | 72 |
| | 1,369 |
| | — |
| | 1,441 |
| | (384 | ) | | 7/31/2013 | | 1982 |
| Wendy's | | Cortland | | NY | | — |
| | 635 |
| | 952 |
| | — |
| | 1,587 |
| | (174 | ) | | 7/31/2013 | | 1984 | | Liverpool | | NY | | — |
| | 530 |
| | 864 |
| | — |
| | 1,394 |
| | (104 | ) | | 3/26/2014 | | 1980 |
| Wendy's | | Endicott | | NY | | — |
| | 313 |
| | 1,253 |
| | — |
| | 1,566 |
| | (229 | ) | | 7/31/2013 | | 1987 | | Oswego | | NY | | — |
| | 190 |
| | 645 |
| | — |
| | 835 |
| | (171 | ) | | 3/26/2014 | | 1986 |
| Wendy's | | Fulton | | NY | | — |
| | 392 |
| | 1,181 |
| | — |
| | 1,573 |
| | (183 | ) | | 3/26/2014 | | 1980 | | Owego | | NY | | — |
| | 101 |
| | 1,915 |
| | — |
| | 2,016 |
| | (537 | ) | | 7/31/2013 | | 1989 |
| Wendy's | | Horseheads | | NY | | — |
| | 72 |
| | 1,369 |
| | — |
| | 1,441 |
| | (250 | ) | | 7/31/2013 | | 1982 | | Vestal | | NY | | — |
| | 488 |
| | 878 |
| | — |
| | 1,366 |
| | (105 | ) | | 3/26/2014 | | 1995 |
| Wendy's | | Liverpool | | NY | | — |
| | 530 |
| | 864 |
| | — |
| | 1,394 |
| | (60 | ) | | 3/26/2014 | | 1980 | | Belpre | | OH | | — |
| | 297 |
| | 1,194 |
| | — |
| | 1,491 |
| | (317 | ) | | 3/26/2014 | | 2000 |
| Wendy's | | Oswego | | NY | | — |
| | 190 |
| | 645 |
| | — |
| | 835 |
| | (100 | ) | | 3/26/2014 | | 1986 | | Bowling Green | | OH | | — |
| | 502 |
| | 932 |
| | (926 | ) | | 508 |
| | (54 | ) | | 7/31/2013 | | 1994 |
| Wendy's | | Owego | | NY | | — |
| | 101 |
| | 1,915 |
| | — |
| | 2,016 |
| | (349 | ) | | 7/31/2013 | | 1989 | | Brookville | | OH | | — |
| | 448 |
| | 1,072 |
| | — |
| | 1,520 |
| | (285 | ) | | 3/26/2014 | | 1984 |
| Wendy's | | Vestal | | NY | | — |
| | 488 |
| | 878 |
| | — |
| | 1,366 |
| | (61 | ) | | 3/26/2014 | | 1995 | | Buckeye Lake | | OH | | — |
| | 864 |
| | 877 |
| | — |
| | 1,741 |
| | (260 | ) | | 6/27/2013 | | 2000 |
| Wendy's | | Belpre | | OH | | — |
| | 297 |
| | 1,195 |
| | — |
| | 1,492 |
| | (185 | ) | | 3/26/2014 | | 2000 | | Centerville | | OH | | — |
| | 615 |
| | 1,434 |
| | — |
| | 2,049 |
| | (402 | ) | | 7/31/2013 | | 1997 |
| Wendy's | | Bowling Green | | OH | | — |
| | 502 |
| | 932 |
| | (926 | ) | | 508 |
| | (19 | ) | | 7/31/2013 | | 1994 | |
| Wendy's | | Brookville | | OH | | — |
| | 448 |
| | 1,072 |
| | — |
| | 1,520 |
| | (166 | ) | | 3/26/2014 | | 1984 | |
| Wendy's | | Buckeye Lake | | OH | | — |
| | 864 |
| | 877 |
| | — |
| | 1,741 |
| | (172 | ) | | 6/27/2013 | | 2000 | |
| Wendy's | | Centerville | | OH | | — |
| | 615 |
| | 1,434 |
| | — |
| | 2,049 |
| | (262 | ) | | 7/31/2013 | | 1997 | |
| | | | | | Initial Costs (1) | | Costs Capitalized Subsequent to Acquisition (2) | | Gross Amount
Carried at
December 31, 2016
(3) (4) | | | | | | Initial Costs (1) | | Costs Capitalized Subsequent to Acquisition (2) | | Gross Amount
Carried at
December 31, 2018
(3) (4) | | | |
| Property | | City | | State | | Encumbrances at
December 31, 2016 | | Land | | Buildings, Fixtures and Improvements | | Accumulated Depreciation
(3) (5) | | Date Acquired | | Date of Construction | | City | | State | | Encumbrances at
December 31, 2018 | | Land | | Buildings, Fixtures and Improvements | | Accumulated Depreciation
(3) (5) | | Date Acquired | | Date of Construction |
| Wendy's | | Cincinnati | | OH | | — |
| | 939 |
| | 1,408 |
| | — |
| | 2,347 |
| | (257 | ) | | 7/31/2013 | | 1980 | | Cincinnati | | OH | | — |
| | 939 |
| | 1,408 |
| | — |
| | 2,347 |
| | (395 | ) | | 7/31/2013 | | 1980 |
| Wendy's | | Dayton | | OH | | — |
| | 723 |
| | 1,343 |
| | — |
| | 2,066 |
| | (245 | ) | | 7/31/2013 | | 1977 | | Dayton | | OH | | — |
| | 723 |
| | 1,343 |
| | — |
| | 2,066 |
| | (377 | ) | | 7/31/2013 | | 1977 |
| Wendy's | | Dayton | | OH | | — |
| | 304 |
| | 1,264 |
| | — |
| | 1,568 |
| | (195 | ) | | 3/26/2014 | | 1974 | | Dayton | | OH | | — |
| | 304 |
| | 1,264 |
| | — |
| | 1,568 |
| | (335 | ) | | 3/26/2014 | | 1974 |
| Wendy's | | Dayton | | OH | | — |
| | 288 |
| | 813 |
| | — |
| | 1,101 |
| | (126 | ) | | 3/26/2014 | | 1985 | | Dayton | | OH | | — |
| | 288 |
| | 813 |
| | — |
| | 1,101 |
| | (216 | ) | | 3/26/2014 | | 1985 |
| Wendy's | | Dayton | | OH | | — |
| | 342 |
| | 848 |
| | — |
| | 1,190 |
| | (131 | ) | | 3/26/2014 | | 1973 | | Dayton | | OH | | — |
| | 342 |
| | 848 |
| | — |
| | 1,190 |
| | (225 | ) | | 3/26/2014 | | 1973 |
| Wendy's | | Dayton | | OH | | — |
| | 274 |
| | 1,029 |
| | — |
| | 1,303 |
| | (165 | ) | | 3/26/2014 | | 2004 | | Dayton | | OH | | — |
| | 274 |
| | 1,029 |
| | — |
| | 1,303 |
| | (283 | ) | | 3/26/2014 | | 2004 |
| Wendy's | | Dayton | | OH | | — |
| | 286 |
| | 869 |
| | — |
| | 1,155 |
| | (134 | ) | | 3/26/2014 | | 1977 | | Dayton | | OH | | — |
| | 286 |
| | 869 |
| | — |
| | 1,155 |
| | (231 | ) | | 3/26/2014 | | 1977 |
| Wendy's | | Dayton | | OH | | — |
| | 259 |
| | 838 |
| | — |
| | 1,097 |
| | (130 | ) | | 3/26/2014 | | 1985 | | Dayton | | OH | | — |
| | 259 |
| | 838 |
| | — |
| | 1,097 |
| | (223 | ) | | 3/26/2014 | | 1985 |
| Wendy's | | Eaton | | OH | | — |
| | 207 |
| | 1,084 |
| | — |
| | 1,291 |
| | (76 | ) | | 3/26/2014 | | 1993 | | Eaton | | OH | | — |
| | 207 |
| | 1,084 |
| | — |
| | 1,291 |
| | (130 | ) | | 3/26/2014 | | 1993 |
| Wendy's | | Englewood | | OH | | — |
| | 261 |
| | 924 |
| | — |
| | 1,185 |
| | (143 | ) | | 3/26/2014 | | 1976 | | Englewood | | OH | | — |
| | 261 |
| | 924 |
| | — |
| | 1,185 |
| | (245 | ) | | 3/26/2014 | | 1976 |
| Wendy's | | Fairborn | | OH | | — |
| | 629 |
| | 1,468 |
| | — |
| | 2,097 |
| | (268 | ) | | 7/31/2013 | | 1999 | | Fairborn | | OH | | — |
| | 629 |
| | 1,468 |
| | — |
| | 2,097 |
| | (412 | ) | | 7/31/2013 | | 1999 |
| Wendy's | | Fairborn | | OH | | — |
| | 604 |
| | 1,408 |
| | — |
| | 2,012 |
| | (257 | ) | | 7/31/2013 | | 1992 | | Fairborn | | OH | | — |
| | 604 |
| | 1,408 |
| | — |
| | 2,012 |
| | (395 | ) | | 7/31/2013 | | 1992 |
| Wendy's | | Fairborn | | OH | | — |
| | 271 |
| | 828 |
| | — |
| | 1,099 |
| | (128 | ) | | 3/26/2014 | | 1975 | | Fairborn | | OH | | — |
| | 271 |
| | 828 |
| | — |
| | 1,099 |
| | (220 | ) | | 3/26/2014 | | 1975 |
| Wendy's | | Fairfield | | OH | | — |
| | 794 |
| | 971 |
| | — |
| | 1,765 |
| | (177 | ) | | 7/31/2013 | | 1981 | | Fairfield | | OH | | — |
| | 794 |
| | 970 |
| | — |
| | 1,764 |
| | (272 | ) | | 7/31/2013 | | 1981 |
| Wendy's | | Hamilton | | OH | | — |
| | 655 |
| | 1,848 |
| | — |
| | 2,503 |
| | (363 | ) | | 6/27/2013 | | 2001 | | Hamilton | | OH | | — |
| | 655 |
| | 1,848 |
| | — |
| | 2,503 |
| | (547 | ) | | 6/27/2013 | | 2001 |
| Wendy's | | Hamilton | | OH | | — |
| | 697 |
| | 1,295 |
| | — |
| | 1,992 |
| | (236 | ) | | 7/31/2013 | | 1974 | | Hamilton | | OH | | — |
| | 697 |
| | 1,295 |
| | — |
| | 1,992 |
| | (363 | ) | | 7/31/2013 | | 1974 |
| Wendy's | | Hamilton | | OH | | — |
| | 908 |
| | 1,362 |
| | — |
| | 2,270 |
| | (248 | ) | | 7/31/2013 | | 2002 | | Hamilton | | OH | | — |
| | 908 |
| | 1,362 |
| | — |
| | 2,270 |
| | (382 | ) | | 7/31/2013 | | 2002 |
| Wendy's | | Hillsboro | | OH | | — |
| | 291 |
| | 1,408 |
| | — |
| | 1,699 |
| | (276 | ) | | 6/27/2013 | | 1985 | | Hillsboro | | OH | | — |
| | 291 |
| | 1,408 |
| | — |
| | 1,699 |
| | (417 | ) | | 6/27/2013 | | 1985 |
| Wendy's | | Lancaster | | OH | | — |
| | 552 |
| | 1,025 |
| | — |
| | 1,577 |
| | (187 | ) | | 7/31/2013 | | 1984 | | Lancaster | | OH | | — |
| | 552 |
| | 1,025 |
| | — |
| | 1,577 |
| | (288 | ) | | 7/31/2013 | | 1984 |
| Wendy's | | Miamisburg | | OH | | — |
| | 888 |
| | 1,086 |
| | — |
| | 1,974 |
| | (198 | ) | | 7/31/2013 | | 1995 | | Miamisburg | | OH | | — |
| | 888 |
| | 1,086 |
| | — |
| | 1,974 |
| | (305 | ) | | 7/31/2013 | | 1995 |
| Wendy's | | Middletown | | OH | | — |
| | 755 |
| | 1,133 |
| | — |
| | 1,888 |
| | (207 | ) | | 7/31/2013 | | 1995 | | Middletown | | OH | | — |
| | 755 |
| | 1,133 |
| | — |
| | 1,888 |
| | (318 | ) | | 7/31/2013 | | 1995 |
| Wendy's | | Middletown | | OH | | — |
| | 752 |
| | 920 |
| | — |
| | 1,672 |
| | (168 | ) | | 7/31/2013 | | 1995 | | Middletown | | OH | | — |
| | 752 |
| | 920 |
| | — |
| | 1,672 |
| | (258 | ) | | 7/31/2013 | | 1995 |
| Wendy's | | Middletown | | OH | | — |
| | 494 |
| | 1,481 |
| | — |
| | 1,975 |
| | (270 | ) | | 7/31/2013 | | 1977 | | Middletown | | OH | | — |
| | 494 |
| | 1,481 |
| | — |
| | 1,975 |
| | (416 | ) | | 7/31/2013 | | 1977 |
| Wendy's | | Saint Bernard | | OH | | — |
| | 432 |
| | 1,009 |
| | — |
| | 1,441 |
| | (184 | ) | | 7/31/2013 | | 1985 | | Saint Bernard | | OH | | — |
| | 432 |
| | 1,009 |
| | — |
| | 1,441 |
| | (283 | ) | | 7/31/2013 | | 1985 |
| Wendy's | | Springboro | | OH | | — |
| | 891 |
| | 1,336 |
| | — |
| | 2,227 |
| | (244 | ) | | 7/31/2013 | | 1982 | | Springboro | | OH | | — |
| | 891 |
| | 1,336 |
| | — |
| | 2,227 |
| | (375 | ) | | 7/31/2013 | | 1982 |
| Wendy's | | Swanton | | OH | | — |
| | 430 |
| | 1,233 |
| | — |
| | 1,663 |
| | (236 | ) | | 6/27/2013 | | 1995 | | Swanton | | OH | | — |
| | 430 |
| | 1,233 |
| | — |
| | 1,663 |
| | (362 | ) | | 6/27/2013 | | 1995 |
| Wendy's | | Sylvania | | OH | | — |
| | 300 |
| | 799 |
| | — |
| | 1,099 |
| | (153 | ) | | 6/27/2013 | | 1995 | | Sylvania | | OH | | — |
| | 300 |
| | 799 |
| | — |
| | 1,099 |
| | (234 | ) | | 6/27/2013 | | 1995 |
| Wendy's | | West Carrollton | | OH | | — |
| | 708 |
| | 865 |
| | — |
| | 1,573 |
| | (158 | ) | | 7/31/2013 | | 1979 | | West Carrollton | | OH | | — |
| | 708 |
| | 865 |
| | — |
| | 1,573 |
| | (243 | ) | | 7/31/2013 | | 1979 |
| Wendy's | | West Chester | | OH | | — |
| | 944 |
| | 772 |
| | — |
| | 1,716 |
| | (141 | ) | | 7/31/2013 | | 1982 | | West Chester | | OH | | — |
| | 944 |
| | 772 |
| | — |
| | 1,716 |
| | (217 | ) | | 7/31/2013 | | 1982 |
| Wendy's | | West Chester | | OH | | — |
| | 616 |
| | 924 |
| | — |
| | 1,540 |
| | (169 | ) | | 7/31/2013 | | 2005 | | West Chester | | OH | | — |
| | 616 |
| | 924 |
| | — |
| | 1,540 |
| | (259 | ) | | 7/31/2013 | | 2005 |
| Wendy's | | Whitehall | | OH | | — |
| | 716 |
| | 863 |
| | — |
| | 1,579 |
| | (169 | ) | | 6/27/2013 | | 1983 | | Whitehall | | OH | | — |
| | 716 |
| | 863 |
| | — |
| | 1,579 |
| | (256 | ) | | 6/27/2013 | | 1983 |
| Wendy's | | Wintersville | | OH | | — |
| | 621 |
| | 1,450 |
| | — |
| | 2,071 |
| | (264 | ) | | 7/31/2013 | | 1977 | | Wintersville | | OH | | — |
| | 621 |
| | 1,449 |
| | — |
| | 2,070 |
| | (407 | ) | | 7/31/2013 | | 1977 |
| | | | | | Initial Costs (1) | | Costs Capitalized Subsequent to Acquisition (2) | | Gross Amount
Carried at
December 31, 2016
(3) (4) | | | | | | Initial Costs (1) | | Costs Capitalized Subsequent to Acquisition (2) | | Gross Amount
Carried at
December 31, 2018
(3) (4) | | | |
| Property | | City | | State | | Encumbrances at
December 31, 2016 | | Land | | Buildings, Fixtures and Improvements | | Accumulated Depreciation
(3) (5) | | Date Acquired | | Date of Construction | | City | | State | | Encumbrances at
December 31, 2018 | | Land | | Buildings, Fixtures and Improvements | | Accumulated Depreciation
(3) (5) | | Date Acquired | | Date of Construction |
| Wendy's | | Edmond | | OK | | — |
| | 791 |
| | 697 |
| | — |
| | 1,488 |
| | (108 | ) | | 3/27/2014 | | 1979 | | Edmond | | OK | | — |
| | 791 |
| | 697 |
| | — |
| | 1,488 |
| | (185 | ) | | 3/27/2014 | | 1979 |
| Wendy's | | Enid | | OK | | — |
| | 158 |
| | 893 |
| | — |
| | 1,051 |
| | (163 | ) | | 7/31/2013 | | 2003 | | Enid | | OK | | — |
| | 158 |
| | 893 |
| | — |
| | 1,051 |
| | (251 | ) | | 7/31/2013 | | 2003 |
| Wendy's | | Ponca City | | OK | | — |
| | 529 |
| | 983 |
| | — |
| | 1,512 |
| | (179 | ) | | 7/31/2013 | | 1979 | | Ponca City | | OK | | — |
| | 529 |
| | 983 |
| | — |
| | 1,512 |
| | (276 | ) | | 7/31/2013 | | 1979 |
| Wendy's | | Sayre | | PA | | — |
| | 372 |
| | 1,115 |
| | — |
| | 1,487 |
| | (203 | ) | | 7/31/2013 | | 1994 | | Sayre | | PA | | — |
| | 372 |
| | 1,115 |
| | — |
| | 1,487 |
| | (313 | ) | | 7/31/2013 | | 1994 |
| Wendy's | | Anderson | | SC | | — |
| | 734 |
| | 897 |
| | — |
| | 1,631 |
| | (268 | ) | | 7/31/2013 | | 1995 | | Anderson | | SC | | — |
| | 734 |
| | 897 |
| | (1,168 | ) | | 463 |
| | (11 | ) | | 7/31/2013 | | 1995 |
| Wendy's | | Columbia | | SC | | — |
| | 1,368 |
| | — |
| | — |
| | 1,368 |
| | — |
| | 6/27/2013 | | 1995 | | Columbia | | SC | | — |
| | 1,368 |
| | — |
| | — |
| | 1,368 |
| | (37 | ) | | 6/27/2013 | | 1995 |
| Wendy's | | Greenville | | SC | | — |
| | 516 |
| | 631 |
| | — |
| | 1,147 |
| | (115 | ) | | 7/31/2013 | | 1975 | | Greenville | | SC | | — |
| | 516 |
| | 631 |
| | — |
| | 1,147 |
| | (177 | ) | | 7/31/2013 | | 1975 |
| Wendy's | | N. Myrtle Beach | | SC | | — |
| | 464 |
| | 861 |
| | — |
| | 1,325 |
| | (157 | ) | | 7/31/2013 | | 1983 | | N. Myrtle Beach | | SC | | — |
| | 464 |
| | 861 |
| | — |
| | 1,325 |
| | (242 | ) | | 7/31/2013 | | 1983 |
| Wendy's | | Spartanburg | | SC | | — |
| | 699 |
| | 572 |
| | — |
| | 1,271 |
| | (104 | ) | | 7/31/2013 | | 1977 | | Spartanburg | | SC | | — |
| | 699 |
| | 572 |
| | (818 | ) | | 453 |
| | (4 | ) | | 7/31/2013 | | 1977 |
| Wendy's | | Brentwood | | TN | | — |
| | 339 |
| | 1,356 |
| | — |
| | 1,695 |
| | (247 | ) | | 7/31/2013 | | 1982 | | Brentwood | | TN | | — |
| | 339 |
| | 1,356 |
| | — |
| | 1,695 |
| | (380 | ) | | 7/31/2013 | | 1982 |
| Wendy's | | Crossville | | TN | | — |
| | 190 |
| | 760 |
| | — |
| | 950 |
| | (139 | ) | | 7/31/2013 | | 1978 | | Crossville | | TN | | — |
| | 190 |
| | 760 |
| | — |
| | 950 |
| | (213 | ) | | 7/31/2013 | | 1978 |
| Wendy's | | Knoxville | | TN | | — |
| | 330 |
| | 1,161 |
| | — |
| | 1,491 |
| | (223 | ) | | 6/27/2013 | | 1995 | | Knoxville | | TN | | — |
| | 330 |
| | 1,161 |
| | — |
| | 1,491 |
| | (341 | ) | | 6/27/2013 | | 1995 |
| Wendy's | | Knoxville | | TN | | — |
| | 330 |
| | 1,132 |
| | — |
| | 1,462 |
| | (217 | ) | | 6/27/2013 | | 1995 | | Knoxville | | TN | | — |
| | 330 |
| | 1,132 |
| | — |
| | 1,462 |
| | (332 | ) | | 6/27/2013 | | 1995 |
| Wendy's | | Manchester | | TN | | — |
| | 245 |
| | 1,390 |
| | — |
| | 1,635 |
| | (254 | ) | | 7/31/2013 | | 1984 | | Manchester | | TN | | — |
| | 245 |
| | 1,390 |
| | — |
| | 1,635 |
| | (390 | ) | | 7/31/2013 | | 1984 |
| Wendy's | | Mcminnville | | TN | | — |
| | 255 |
| | 1,443 |
| | — |
| | 1,698 |
| | (263 | ) | | 7/31/2013 | | 2010 | | Mcminnville | | TN | | — |
| | 255 |
| | 1,443 |
| | — |
| | 1,698 |
| | (405 | ) | | 7/31/2013 | | 2010 |
| Wendy's | | Millington | | TN | | — |
| | 380 |
| | 1,208 |
| | — |
| | 1,588 |
| | (232 | ) | | 6/27/2013 | | 1995 | | Millington | | TN | | — |
| | 380 |
| | 1,208 |
| | — |
| | 1,588 |
| | (354 | ) | | 6/27/2013 | | 1995 |
| Wendy's | | Murfreesboro | | TN | | — |
| | 586 |
| | 1,088 |
| | — |
| | 1,674 |
| | (199 | ) | | 7/31/2013 | | 1983 | | Murfreesboro | | TN | | — |
| | 586 |
| | 1,088 |
| | — |
| | 1,674 |
| | (305 | ) | | 7/31/2013 | | 1983 |
| Wendy's | | Nashville | | TN | | — |
| | 592 |
| | 1,100 |
| | — |
| | 1,692 |
| | (201 | ) | | 7/31/2013 | | 1983 | | Nashville | | TN | | — |
| | 592 |
| | 1,100 |
| | — |
| | 1,692 |
| | (309 | ) | | 7/31/2013 | | 1983 |
| Wendy's | | Nashville | | TN | | — |
| | 328 |
| | 1,313 |
| | — |
| | 1,641 |
| | (239 | ) | | 7/31/2013 | | 1983 | | Nashville | | TN | | — |
| | 328 |
| | 1,313 |
| | — |
| | 1,641 |
| | (368 | ) | | 7/31/2013 | | 1983 |
| Wendy's | | Arlington | | TX | | — |
| | 1,322 |
| | 1,546 |
| | — |
| | 2,868 |
| | (303 | ) | | 6/27/2013 | | 1994 | | Arlington | | TX | | — |
| | 1,322 |
| | 1,546 |
| | — |
| | 2,868 |
| | (458 | ) | | 6/27/2013 | | 1994 |
| Wendy's | | Corpus Christi | | TX | | — |
| | 646 |
| | 1,199 |
| | — |
| | 1,845 |
| | (219 | ) | | 7/31/2013 | | 1987 | | Corpus Christi | | TX | | — |
| | 646 |
| | 1,198 |
| | — |
| | 1,844 |
| | (336 | ) | | 7/31/2013 | | 1987 |
| Wendy's | | El Paso | | TX | | — |
| | 630 |
| | 1,889 |
| | — |
| | 2,519 |
| | (345 | ) | | 7/31/2013 | | 1996 | | El Paso | | TX | | — |
| | 630 |
| | 1,889 |
| | — |
| | 2,519 |
| | (530 | ) | | 7/31/2013 | | 1996 |
| Wendy's | | Kingwood | | TX | | — |
| | 304 |
| | 1,724 |
| | (944 | ) | | 1,084 |
| | (33 | ) | | 7/31/2013 | | 2001 | | Kingwood | | TX | | — |
| | 304 |
| | 1,724 |
| | (944 | ) | | 1,084 |
| | (120 | ) | | 7/31/2013 | | 2001 |
| Wendy's | | San Antonio | | TX | | — |
| | 268 |
| | 630 |
| | — |
| | 898 |
| | (124 | ) | | 6/27/2013 | | 1985 | | San Antonio | | TX | | — |
| | 268 |
| | 630 |
| | — |
| | 898 |
| | (187 | ) | | 6/27/2013 | | 1985 |
| Wendy's | | San Antonio | | TX | | — |
| | 410 |
| | 451 |
| | — |
| | 861 |
| | (89 | ) | | 6/27/2013 | | 1987 | | San Antonio | | TX | | — |
| | 410 |
| | 451 |
| | — |
| | 861 |
| | (134 | ) | | 6/27/2013 | | 1987 |
| Wendy's | | San Antonio | | TX | | — |
| | 707 |
| | 603 |
| | — |
| | 1,310 |
| | (94 | ) | | 2/7/2014 | | 1990 | | San Antonio | | TX | | — |
| | 707 |
| | 603 |
| | — |
| | 1,310 |
| | (159 | ) | | 2/7/2014 | | 1990 |
| Wendy's | | San Antonio | | TX | | — |
| | 633 |
| | 1,388 |
| | — |
| | 2,021 |
| | (199 | ) | | 2/7/2014 | | 1992 | | San Antonio | | TX | | — |
| | 633 |
| | 1,388 |
| | — |
| | 2,021 |
| | (337 | ) | | 2/7/2014 | | 1992 |
| Wendy's | | San Antonio | | TX | | — |
| | 1,007 |
| | 546 |
| | — |
| | 1,553 |
| | (87 | ) | | 2/7/2014 | | 1995 | | San Antonio | | TX | | — |
| | 1,007 |
| | 546 |
| | — |
| | 1,553 |
| | (148 | ) | | 2/7/2014 | | 1995 |
| Wendy's | | San Antonio | | TX | | — |
| | 703 |
| | 45 |
| | — |
| | 748 |
| | (14 | ) | | 2/7/2014 | | 2000 | | San Antonio | | TX | | — |
| | 703 |
| | 45 |
| | — |
| | 748 |
| | (24 | ) | | 2/7/2014 | | 2000 |
| Wendy's | | San Antonio | | TX | | — |
| | 788 |
| | 45 |
| | — |
| | 833 |
| | (14 | ) | | 2/7/2014 | | 2003 | | San Antonio | | TX | | — |
| | 788 |
| | 45 |
| | — |
| | 833 |
| | (24 | ) | | 2/7/2014 | | 2003 |
| Wendy's | | San Marcos | | TX | | — |
| | 714 |
| | 1,024 |
| | — |
| | 1,738 |
| | (154 | ) | | 2/7/2014 | | 2002 | | San Marcos | | TX | | — |
| | 714 |
| | 1,024 |
| | — |
| | 1,738 |
| | (262 | ) | | 2/7/2014 | | 2002 |
| Wendy's | | Schertz | | TX | | — |
| | 793 |
| | 109 |
| | — |
| | 902 |
| | (20 | ) | | 2/7/2014 | | 1994 | | Schertz | | TX | | — |
| | 793 |
| | 109 |
| | — |
| | 902 |
| | (34 | ) | | 2/7/2014 | | 1994 |
| | | | | | Initial Costs (1) | | Costs Capitalized Subsequent to Acquisition (2) | | Gross Amount
Carried at
December 31, 2016
(3) (4) | | | | | | Initial Costs (1) | | Costs Capitalized Subsequent to Acquisition (2) | | Gross Amount
Carried at
December 31, 2018
(3) (4) | | | |
| Property | | City | | State | | Encumbrances at
December 31, 2016 | | Land | | Buildings, Fixtures and Improvements | | Accumulated Depreciation
(3) (5) | | Date Acquired | | Date of Construction | | City | | State | | Encumbrances at
December 31, 2018 | | Land | | Buildings, Fixtures and Improvements | | Accumulated Depreciation
(3) (5) | | Date Acquired | | Date of Construction |
| Wendy's | | Selma | | TX | | — |
| | 841 |
| | 117 |
| | — |
| | 958 |
| | (18 | ) | | 2/7/2014 | | 2003 | | Selma | | TX | | — |
| | 841 |
| | 117 |
| | — |
| | 958 |
| | (31 | ) | | 2/7/2014 | | 2003 |
| Wendy's | | Bluefield | | VA | | — |
| | 450 |
| | 1,927 |
| | — |
| | 2,377 |
| | (369 | ) | | 6/27/2013 | | 1995 | | Bluefield | | VA | | — |
| | 450 |
| | 1,927 |
| | — |
| | 2,377 |
| | (565 | ) | | 6/27/2013 | | 1995 |
| Wendy's | | Christiansburg | | VA | | — |
| | 416 |
| | 624 |
| | — |
| | 1,040 |
| | (114 | ) | | 7/31/2013 | | 1980 | | Christiansburg | | VA | | — |
| | 416 |
| | 624 |
| | — |
| | 1,040 |
| | (175 | ) | | 7/31/2013 | | 1980 |
| Wendy's | | Dublin | | VA | | — |
| | 384 |
| | 1,402 |
| | — |
| | 1,786 |
| | (275 | ) | | 6/27/2013 | | 1993 | | Dublin | | VA | | — |
| | 384 |
| | 1,401 |
| | — |
| | 1,785 |
| | (416 | ) | | 6/27/2013 | | 1993 |
| Wendy's | | Emporia | | VA | | — |
| | 631 |
| | 1,424 |
| | — |
| | 2,055 |
| | (280 | ) | | 6/27/2013 | | 1994 | | Emporia | | VA | | — |
| | 631 |
| | 1,424 |
| | — |
| | 2,055 |
| | (422 | ) | | 6/27/2013 | | 1994 |
| Wendy's | | Hayes | | VA | | — |
| | 304 |
| | 859 |
| | — |
| | 1,163 |
| | (169 | ) | | 6/27/2013 | | 1992 | | Hayes | | VA | | — |
| | 304 |
| | 859 |
| | — |
| | 1,163 |
| | (255 | ) | | 6/27/2013 | | 1992 |
| Wendy's | | Hillsville | | VA | | — |
| | 324 |
| | 973 |
| | — |
| | 1,297 |
| | (177 | ) | | 7/31/2013 | | 2001 | | Hillsville | | VA | | — |
| | 324 |
| | 973 |
| | — |
| | 1,297 |
| | (273 | ) | | 7/31/2013 | | 2001 |
| Wendy's | | Lebanon | | VA | | — |
| | 431 |
| | 1,006 |
| | — |
| | 1,437 |
| | (184 | ) | | 7/31/2013 | | 1983 | | Lebanon | | VA | | — |
| | 431 |
| | 1,006 |
| | — |
| | 1,437 |
| | (282 | ) | | 7/31/2013 | | 1983 |
| Wendy's | | Mechanicsville | | VA | | — |
| | 521 |
| | 704 |
| | — |
| | 1,225 |
| | (138 | ) | | 6/27/2013 | | 1989 | | Mechanicsville | | VA | | — |
| | 521 |
| | 704 |
| | — |
| | 1,225 |
| | (209 | ) | | 6/27/2013 | | 1989 |
| Wendy's | | Midlothian | | VA | | — |
| | 230 |
| | 1,300 |
| | — |
| | 1,530 |
| | (249 | ) | | 6/27/2013 | | 1995 | | Pounding Mill | | VA | | — |
| | 296 |
| | 1,404 |
| | — |
| | 1,700 |
| | (416 | ) | | 6/27/2013 | | 2004 |
| Wendy's | | North Tazewell | | VA | | — |
| | 124 |
| | 560 |
| | — |
| | 684 |
| | (110 | ) | | 6/27/2013 | | 1980 | | Woodbridge | | VA | | — |
| | 1,193 |
| | 1,598 |
| | — |
| | 2,791 |
| | (473 | ) | | 6/27/2013 | | 1996 |
| Wendy's | | Pounding Mill | | VA | | — |
| | 296 |
| | 1,404 |
| | — |
| | 1,700 |
| | (276 | ) | | 6/27/2013 | | 2004 | | Woodbridge | | VA | | — |
| | 521 |
| | 615 |
| | — |
| | 1,136 |
| | (182 | ) | | 6/27/2013 | | 1978 |
| Wendy's | | South Hill | | VA | | — |
| | 313 |
| | 976 |
| | (421 | ) | | 868 |
| | (59 | ) | | 6/27/2013 | | 1995 | | Wytheville | | VA | | — |
| | 598 |
| | 897 |
| | — |
| | 1,495 |
| | (252 | ) | | 7/31/2013 | | 2003 |
| Wendy's | | Woodbridge | | VA | | — |
| | 1,193 |
| | 1,598 |
| | — |
| | 2,791 |
| | (314 | ) | | 6/27/2013 | | 1996 | | Bellingham | | WA | | — |
| | 502 |
| | 477 |
| | — |
| | 979 |
| | (132 | ) | | 2/7/2014 | | 1994 |
| Wendy's | | Woodbridge | | VA | | — |
| | 521 |
| | 615 |
| | — |
| | 1,136 |
| | (121 | ) | | 6/27/2013 | | 1978 | | Bothell | | WA | | — |
| | 687 |
| | 292 |
| | — |
| | 979 |
| | (63 | ) | | 2/7/2014 | | 2004 |
| Wendy's | | Wytheville | | VA | | — |
| | 598 |
| | 897 |
| | — |
| | 1,495 |
| | (164 | ) | | 7/31/2013 | | 2003 | | Burlington | | WA | | — |
| | 425 |
| | 806 |
| | — |
| | 1,231 |
| | (239 | ) | | 6/27/2013 | | 1994 |
| Wendy's | | Bellingham | | WA | | — |
| | 502 |
| | 477 |
| | — |
| | 979 |
| | (78 | ) | | 2/7/2014 | | 1994 | | Port Angeles | | WA | | — |
| | 422 |
| | 502 |
| | — |
| | 924 |
| | (236 | ) | | 2/7/2014 | | 1980 |
| Wendy's | | Bothell | | WA | | — |
| | 687 |
| | 292 |
| | — |
| | 979 |
| | (37 | ) | | 2/7/2014 | | 2004 | | Redmond | | WA | | — |
| | 969 |
| | 123 |
| | — |
| | 1,092 |
| | (22 | ) | | 2/7/2014 | | 1977 |
| Wendy's | | Burlington | | WA | | — |
| | 425 |
| | 806 |
| | — |
| | 1,231 |
| | (158 | ) | | 6/27/2013 | | 1994 | | Silverdale | | WA | | — |
| | 808 |
| | 201 |
| | — |
| | 1,009 |
| | (154 | ) | | 2/7/2014 | | 1995 |
| Wendy's | | Port Angeles | | WA | | — |
| | 422 |
| | 503 |
| | — |
| | 925 |
| | (139 | ) | | 2/7/2014 | | 1980 | | Beloit | | WI | | — |
| | 1,138 |
| | 931 |
| | — |
| | 2,069 |
| | (261 | ) | | 7/31/2013 | | 2002 |
| Wendy's | | Redmond | | WA | | — |
| | 969 |
| | 123 |
| | — |
| | 1,092 |
| | (13 | ) | | 2/7/2014 | | 1977 | | Fitchburg | | WI | | — |
| | 662 |
| | 1,230 |
| | — |
| | 1,892 |
| | (345 | ) | | 7/31/2013 | | 2003 |
| Wendy's | | Silverdale | | WA | | — |
| | 808 |
| | 201 |
| | — |
| | 1,009 |
| | (91 | ) | | 2/7/2014 | | 1995 | | Germantown | | WI | | — |
| | 419 |
| | 1,257 |
| | — |
| | 1,676 |
| | (353 | ) | | 7/31/2013 | | 1989 |
| Wendy's | | Beloit | | WI | | — |
| | 1,138 |
| | 931 |
| | — |
| | 2,069 |
| | (170 | ) | | 7/31/2013 | | 2002 | | Greenfield | | WI | | — |
| | 487 |
| | 1,137 |
| | — |
| | 1,624 |
| | (319 | ) | | 7/31/2013 | | 2001 |
| Wendy's | | Fitchburg | | WI | | — |
| | 662 |
| | 1,230 |
| | — |
| | 1,892 |
| | (224 | ) | | 7/31/2013 | | 2003 | | Janesville | | WI | | — |
| | 647 |
| | 971 |
| | — |
| | 1,618 |
| | (272 | ) | | 7/31/2013 | | 1991 |
| Wendy's | | Germantown | | WI | | — |
| | 419 |
| | 1,257 |
| | — |
| | 1,676 |
| | (229 | ) | | 7/31/2013 | | 1989 | | Kenosha | | WI | | — |
| | 322 |
| | 1,290 |
| | — |
| | 1,612 |
| | (362 | ) | | 7/31/2013 | | 1984 |
| Wendy's | | Greenfield | | WI | | — |
| | 487 |
| | 1,137 |
| | — |
| | 1,624 |
| | (207 | ) | | 7/31/2013 | | 2001 | | Kenosha | | WI | | — |
| | 965 |
| | 1,447 |
| | — |
| | 2,412 |
| | (406 | ) | | 7/31/2013 | | 1986 |
| Wendy's | | Janesville | | WI | | — |
| | 647 |
| | 971 |
| | — |
| | 1,618 |
| | (177 | ) | | 7/31/2013 | | 1991 | | Madison | | WI | | — |
| | 454 |
| | 1,362 |
| | — |
| | 1,816 |
| | (382 | ) | | 7/31/2013 | | 1998 |
| Wendy's | | Kenosha | | WI | | — |
| | 322 |
| | 1,290 |
| | — |
| | 1,612 |
| | (235 | ) | | 7/31/2013 | | 1984 | | Milwaukee | | WI | | — |
| | 810 |
| | 810 |
| | — |
| | 1,620 |
| | (227 | ) | | 7/31/2013 | | 1979 |
| Wendy's | | Kenosha | | WI | | — |
| | 965 |
| | 1,447 |
| | — |
| | 2,412 |
| | (264 | ) | | 7/31/2013 | | 1986 | | Milwaukee | | WI | | — |
| | 338 |
| | 1,351 |
| | — |
| | 1,689 |
| | (379 | ) | | 7/31/2013 | | 1985 |
| Wendy's | | Madison | | WI | | — |
| | 454 |
| | 1,362 |
| | — |
| | 1,816 |
| | (248 | ) | | 7/31/2013 | | 1998 | | Milwaukee | | WI | | — |
| | 436 |
| | 1,015 |
| | — |
| | 1,451 |
| | (285 | ) | | 7/31/2013 | | 1983 |
| Wendy's | | Milwaukee | | WI | | — |
| | 810 |
| | 810 |
| | — |
| | 1,620 |
| | (148 | ) | | 7/31/2013 | | 1979 | | New Berlin | | WI | | — |
| | 903 |
| | 739 |
| | — |
| | 1,642 |
| | (207 | ) | | 7/31/2013 | | 1983 |
| Wendy's | | Milwaukee | | WI | | — |
| | 338 |
| | 1,351 |
| | — |
| | 1,689 |
| | (247 | ) | | 7/31/2013 | | 1985 | | Oak Creek | | WI | | — |
| | 577 |
| | 1,347 |
| | — |
| | 1,924 |
| | (378 | ) | | 7/31/2013 | | 1999 |
| | | | | | Initial Costs (1) | | Costs Capitalized Subsequent to Acquisition (2) | | Gross Amount
Carried at
December 31, 2016
(3) (4) | | | | | | Initial Costs (1) | | Costs Capitalized Subsequent to Acquisition (2) | | Gross Amount
Carried at
December 31, 2018
(3) (4) | | | |
| Property | | City | | State | | Encumbrances at
December 31, 2016 | | Land | | Buildings, Fixtures and Improvements | | Accumulated Depreciation
(3) (5) | | Date Acquired | | Date of Construction | | City | | State | | Encumbrances at
December 31, 2018 | | Land | | Buildings, Fixtures and Improvements | | Accumulated Depreciation
(3) (5) | | Date Acquired | | Date of Construction |
| Wendy's | | Milwaukee | | WI | | — |
| | 436 |
| | 1,016 |
| | — |
| | 1,452 |
| | (185 | ) | | 7/31/2013 | | 1983 | |
| Wendy's | | New Berlin | | WI | | — |
| | 903 |
| | 739 |
| | — |
| | 1,642 |
| | (135 | ) | | 7/31/2013 | | 1983 | |
| Wendy's | | Oak Creek | | WI | | — |
| | 577 |
| | 1,347 |
| | — |
| | 1,924 |
| | (246 | ) | | 7/31/2013 | | 1999 | |
| Wendy's | | Sheboygan | | WI | | — |
| | 676 |
| | 1,014 |
| | — |
| | 1,690 |
| | (185 | ) | | 7/31/2013 | | 1995 | | Sheboygan | | WI | | — |
| | 676 |
| | 1,014 |
| | — |
| | 1,690 |
| | (284 | ) | | 7/31/2013 | | 1995 |
| Wendy's | | West Allis | | WI | | — |
| | 583 |
| | 1,083 |
| | — |
| | 1,666 |
| | (197 | ) | | 7/31/2013 | | 1984 | | West Allis | | WI | | — |
| | 583 |
| | 1,083 |
| | — |
| | 1,666 |
| | (304 | ) | | 7/31/2013 | | 1984 |
| Wendy's | | Beaver | | WV | | — |
| | 290 |
| | 1,156 |
| | — |
| | 1,446 |
| | (222 | ) | | 6/27/2013 | | 1995 | | Beaver | | WV | | — |
| | 290 |
| | 1,156 |
| | — |
| | 1,446 |
| | (339 | ) | | 6/27/2013 | | 1995 |
| Wendy's | | Bridgeport | | WV | | — |
| | 273 |
| | 818 |
| | — |
| | 1,091 |
| | (149 | ) | | 7/31/2013 | | 1984 | | Bridgeport | | WV | | — |
| | 273 |
| | 818 |
| | — |
| | 1,091 |
| | (230 | ) | | 7/31/2013 | | 1984 |
| Wendy's | | Buckhannon | | WV | | — |
| | 157 |
| | 890 |
| | — |
| | 1,047 |
| | (162 | ) | | 7/31/2013 | | 1987 | | Buckhannon | | WV | | — |
| | 157 |
| | 890 |
| | — |
| | 1,047 |
| | (250 | ) | | 7/31/2013 | | 1987 |
| Wendy's | | Clarksburg | | WV | | — |
| | 277 |
| | 1,181 |
| | — |
| | 1,458 |
| | (183 | ) | | 3/26/2014 | | 1980 | | Clarksburg | | WV | | — |
| | 277 |
| | 1,181 |
| | — |
| | 1,458 |
| | (314 | ) | | 3/26/2014 | | 1980 |
| Wendy's | | Fairmont | | WV | | — |
| | 224 |
| | 1,119 |
| | — |
| | 1,343 |
| | (220 | ) | | 6/27/2013 | | 1983 | | Fairmont | | WV | | — |
| | 224 |
| | 1,119 |
| | — |
| | 1,343 |
| | (332 | ) | | 6/27/2013 | | 1983 |
| Wendy's | | Parkersburg | | WV | | — |
| | 295 |
| | 885 |
| | — |
| | 1,180 |
| | (161 | ) | | 7/31/2013 | | 1979 | | Parkersburg | | WV | | — |
| | 295 |
| | 885 |
| | — |
| | 1,180 |
| | (248 | ) | | 7/31/2013 | | 1979 |
| Wendy's | | Parkersburg | | WV | | — |
| | 311 |
| | 1,243 |
| | — |
| | 1,554 |
| | (227 | ) | | 7/31/2013 | | 1977 | | Parkersburg | | WV | | — |
| | 311 |
| | 1,243 |
| | — |
| | 1,554 |
| | (349 | ) | | 7/31/2013 | | 1977 |
| Wendy's | | Parkersburg | | WV | | — |
| | 241 |
| | 964 |
| | — |
| | 1,205 |
| | (176 | ) | | 7/31/2013 | | 1996 | | Parkersburg | | WV | | — |
| | 241 |
| | 964 |
| | — |
| | 1,205 |
| | (271 | ) | | 7/31/2013 | | 1996 |
| Wendy's | | Ripley | | WV | | — |
| | 273 |
| | 871 |
| | — |
| | 1,144 |
| | (171 | ) | | 6/27/2013 | | 1984 | | Ripley | | WV | | — |
| | 273 |
| | 871 |
| | — |
| | 1,144 |
| | (258 | ) | | 6/27/2013 | | 1984 |
| Wendy's | | Saint Marys | | WV | | — |
| | 70 |
| | 1,322 |
| | — |
| | 1,392 |
| | (241 | ) | | 7/31/2013 | | 2001 | | Saint Marys | | WV | | — |
| | 70 |
| | 1,322 |
| | — |
| | 1,392 |
| | (371 | ) | | 7/31/2013 | | 2001 |
| Wendy's | | Vienna | | WV | | — |
| | 301 |
| | 702 |
| | — |
| | 1,003 |
| | (128 | ) | | 7/31/2013 | | 1976 | | Vienna | | WV | | — |
| | 301 |
| | 702 |
| | — |
| | 1,003 |
| | (197 | ) | | 7/31/2013 | | 1976 |
| West Marine | | Anchorage | | AK | | — |
| | 1,220 |
| | 2,531 |
| | — |
| | 3,751 |
| | (375 | ) | | 3/31/2014 | | 1995 | | Anchorage | | AK | | — |
| | 1,220 |
| | 2,531 |
| | — |
| | 3,751 |
| | (644 | ) | | 3/31/2014 | | 1995 |
| West Marine | | Fort Lauderdale | | FL | | — |
| | 4,337 |
| | 9,052 |
| | — |
| | 13,389 |
| | (1,238 | ) | | 2/7/2014 | | 2011 | | Fort Lauderdale | | FL | | — |
| | 4,337 |
| | 9,052 |
| | — |
| | 13,389 |
| | (2,099 | ) | | 2/7/2014 | | 2011 |
| West Marine | | Harrison Township | | MI | | — |
| | 452 |
| | 2,092 |
| | — |
| | 2,544 |
| | (399 | ) | | 2/7/2014 | | 2009 | | Harrison Township | | MI | | — |
| | 452 |
| | 2,092 |
| | — |
| | 2,544 |
| | (676 | ) | | 2/7/2014 | | 2009 |
| West Marine | | Deltaville | | VA | | — |
| | 425 |
| | 2,409 |
| | — |
| | 2,834 |
| | (603 | ) | | 7/31/2012 | | 2012 | | Deltaville | | VA | | — |
| | 425 |
| | 2,409 |
| | — |
| | 2,834 |
| | (776 | ) | | 7/31/2012 | | 2012 |
| Whataburger | | Edna | | TX | | — |
| | 290 |
| | 869 |
| | — |
| | 1,159 |
| | (159 | ) | | 7/31/2013 | | 1986 | | Edna | | TX | | — |
| | 290 |
| | 869 |
| | — |
| | 1,159 |
| | (244 | ) | | 7/31/2013 | | 1986 |
| Whataburger | | El Campo | | TX | | — |
| | 693 |
| | 1,013 |
| | — |
| | 1,706 |
| | (199 | ) | | 6/27/2013 | | 1986 | | El Campo | | TX | | — |
| | 693 |
| | 1,013 |
| | — |
| | 1,706 |
| | (300 | ) | | 6/27/2013 | | 1986 |
| Whataburger | | Ingleside | | TX | | — |
| | 1,106 |
| | 474 |
| | — |
| | 1,580 |
| | (86 | ) | | 7/31/2013 | | 1986 | | Ingleside | | TX | | — |
| | 1,106 |
| | 474 |
| | — |
| | 1,580 |
| | (133 | ) | | 7/31/2013 | | 1986 |
| Whataburger | | Lubbock | | TX | | — |
| | 432 |
| | 647 |
| | — |
| | 1,079 |
| | (118 | ) | | 7/31/2013 | | 1992 | | Lubbock | | TX | | — |
| | 432 |
| | 647 |
| | — |
| | 1,079 |
| | (182 | ) | | 7/31/2013 | | 1992 |
| Whole Foods | | Hinsdale | | IL | | 5,709 |
| | 5,499 |
| | 7,389 |
| | — |
| | 12,888 |
| | (1,230 | ) | | 2/7/2014 | | 1999 | | Hinsdale | | IL | | 5,709 |
| | 5,499 |
| | 7,388 |
| | — |
| | 12,887 |
| | (2,086 | ) | | 2/7/2014 | | 1999 |
| Wild Bill's Sports Salon | | Rochester | | MN | | — |
| | 1,347 |
| | 1,102 |
| | — |
| | 2,449 |
| | (227 | ) | | 7/31/2013 | | 1993 | | Rochester | | MN | | — |
| | 1,347 |
| | 1,102 |
| | — |
| | 2,449 |
| | (344 | ) | | 7/31/2013 | | 1993 |
| Willbros Group, Inc. | | Tulsa | | OK | | — |
| | 2,239 |
| | 6,375 |
| | — |
| | 8,614 |
| | (671 | ) | | 6/25/2014 | | 1982 | | Tulsa | | OK | | — |
| | 2,239 |
| | 6,375 |
| | — |
| | 8,614 |
| | (1,200 | ) | | 6/25/2014 | | 1982 |
| Williams Sonoma | | Olive Branch | | MS | | 28,350 |
| | 2,330 |
| | 44,266 |
| | — |
| | 46,596 |
| | (11,813 | ) | | 8/10/2012 | | 2001 | | Olive Branch | | MS | | — |
| | 2,330 |
| | 44,266 |
| | — |
| | 46,596 |
| | (15,753 | ) | | 8/10/2012 | | 2001 |
| Winn-Dixie | | Jacksonville | | FL | | 63,240 |
| | 4,360 |
| | 82,835 |
| | — |
| | 87,195 |
| | (15,215 | ) | | 4/24/2013 | | 2000 | | Jacksonville | | FL | | 63,240 |
| | 4,360 |
| | 82,834 |
| | — |
| | 87,194 |
| | (21,852 | ) | | 4/24/2013 | | 2000 |
| Worrior Energy Services | | Midland | | TX | | — |
| | 508 |
| | 816 |
| | — |
| | 1,324 |
| | (105 | ) | | 6/25/2014 | | 2012 | | Midland | | TX | | — |
| | 508 |
| | 815 |
| | — |
| | 1,323 |
| | (187 | ) | | 6/25/2014 | | 2012 |
| Z'Tejas | | Austin | | TX | | — |
| | 837 |
| | 1,797 |
| | — |
| | 2,634 |
| | (365 | ) | | 6/27/2013 | | 1998 | |
| Other | | | N/A | | N/A | | — |
| | — |
| | 13,345 |
| | 25 |
| | 13,370 |
| | (3,642 | ) | | N/A | | N/A |
| | | $ | 2,629,949 |
| | $ | 2,942,810 |
| | $ | 10,738,812 |
| | $ | (141,701 | ) | | $ | 13,539,921 |
| | $ | (1,766,006 | ) | | | $ | 1,917,132 |
| | $ | 2,884,968 |
| | $ | 10,791,126 |
| | $ | (83,654 | ) | | $ | 13,592,440 |
| | $ | (2,622,879 | ) | |
___
| |
| (1) | Initial costs exclude subsequent impairment charges. |
| |
| (2) | Consists of capital expenditures and real estate development costs, net of condemnations, easements and impairment charges. |
| |
| (3) | Gross intangible lease assets of $2.04$2.01 billion and the associated accumulated amortization of $565.6$813.9 million are not reflected in the table above. |
| |
| (4) | The aggregate cost for Federal income tax purposes of land, buildings, fixtures and improvements as of December 31, 20162018 was $15.3$15.4 billion. |
| |
| (5) | Depreciation is computed using the straight-line method over the estimated useful lives of up to 40 years for buildings, five to 15 years for building fixtures and improvements. |
The following is a reconciliation of the gross real estate activity for the years ended December 31, 2016, 20152018, 2017 and 20142016 (amounts in thousands):
| | | | | Years Ended December 31, | | Years Ended December 31, |
| | | 2016 | | 2015 | | 2014 | | 2018 | | 2017 | | 2016 |
| Balance, beginning of year | | $ | 14,566,343 |
| | $ | 15,857,507 |
| | $ | 6,699,547 |
| | $ | 13,577,700 |
| | $ | 13,539,921 |
| | $ | 14,566,343 |
|
| Additions: | | | | | | | | | | | | |
| Acquisitions | | 91,052 |
| | 33,695 |
| | 11,095,559 |
| | 437,227 |
| | 634,080 |
| | 91,052 |
|
| Improvements | | 25,781 |
| | 60,321 |
| | 114,070 |
| | 31,898 |
| | 28,503 |
| | 25,781 |
|
| Deductions/Other: | | | | | | | | | | | | |
| Dispositions | | (878,552 | ) | | (1,261,724 | ) | | (1,945,186 | ) | | (368,808 | ) | | (505,403 | ) | | (878,552 | ) |
| Impairments | | (228,750 | ) | | (106,064 | ) | | (105,367 | ) | | (84,278 | ) | | (82,292 | ) | | (228,750 | ) |
| Reclassified to assets held for sale | | (36,722 | ) | | (16,761 | ) | | (1,116 | ) | | (2,997 | ) | | (52,376 | ) | | (36,722 | ) |
| Other | | 769 |
| | (631 | ) | | — |
| | 1,698 |
| | 15,267 |
| | 769 |
|
| Balance, end of year | | $ | 13,539,921 |
| | $ | 14,566,343 |
| | $ | 15,857,507 |
| | $ | 13,592,440 |
| | $ | 13,577,700 |
| | $ | 13,539,921 |
|
The following is a reconciliation of the accumulated depreciation for the years ended December 31, 2016, 20152018, 2017 and 20142016 (amounts in thousands):
| | | | | Years Ended December 31, | | Years Ended December 31, |
| | | 2016 | | 2015 | | 2014 | | 2018 | | 2017 | | 2016 |
| Balance, beginning of year | | $ | 1,331,751 |
| | $ | 775,050 |
| | $ | 205,712 |
| | $ | 2,217,108 |
| | $ | 1,766,006 |
| | $ | 1,331,751 |
|
| Additions: | | | | | | | | | | | | |
| Depreciation expense | | 586,321 |
| | 630,347 |
| | 628,340 |
| | 497,511 |
| | 548,901 |
| | 586,321 |
|
| Deductions: | | | | | | | |
| Deductions/Other: | | | | | | | |
| Dispositions | | (77,987 | ) | | (49,907 | ) | | (49,377 | ) | | (57,346 | ) | | (34,086 | ) | | (77,987 | ) |
| Impairments | | (69,040 | ) | | (23,196 | ) | | (9,625 | ) | | (32,147 | ) | | (50,828 | ) | | (69,040 | ) |
| Reclassified to assets held for sale | | (5,039 | ) | | (543 | ) | | — |
| | (400 | ) | | (12,885 | ) | | (5,039 | ) |
| Other | | | (1,847 | ) | | — |
| | — |
|
| Balance, end of year | | $ | 1,766,006 |
| | $ | 1,331,751 |
| | $ | 775,050 |
| | $ | 2,622,879 |
| | $ | 2,217,108 |
| | $ | 1,766,006 |
|
VEREIT, INC. AND VEREIT OPERATING PARTNERSHIP, L.P.
SCHEDULE IV – MORTGAGE LOANS HELD FOR INVESTMENTON REAL ESTATE
December 31, 2016 (in2018 (in thousands)
Schedule IV – Mortgage Loans Held For Investmenton Real Estate
| | | Description | | Location | | Interest Rate | | Final Maturity Date | | Periodic Payment Terms | | Prior Liens | | Face Amount of Mortgages | | Carrying Amount of Mortgages | | Principal Amount of Loans Subject to Delinquent Principal or Interest | | Location | | Interest Rate | | Final Maturity Date | | Periodic Payment Terms | | Prior Liens | | Face Amount of Mortgages | | Carrying Amount of Mortgages (1) | | Principal Amount of Loans Subject to Delinquent Principal or Interest |
Long-Term Mortgage Loans | | Bank Of America, N.A. | | Mt. Airy, MD | | 6.42% | | 12/15/2026 | | P&I | | N/A | | $ | 2,598 |
| | $ | 2,836 |
| | $ | — |
| |
| CVS Caremark Corporation | | Evansville, IN | | 6.22% | | 1/15/2033 | | P&I | | N/A | | 2,670 |
| | 2,934 |
| | — |
| | Evansville, IN | | 6.22% | | 1/15/2033 | | P&I | | N/A | | $ | 2,465 |
| | $ | 2,505 |
| | — |
|
| CVS Caremark Corporation | | Greensboro, GA | | 6.52% | | 1/15/2030 | | P&I | | N/A | | 1,002 |
| | 1,116 |
| | — |
| | Greensboro, GA | | 6.52% | | 1/15/2030 | | P&I | | N/A | | 899 |
| | 920 |
| | — |
|
| CVS Caremark Corporation | | Shelby Twp., MI | | 5.98% | | 1/15/2031 | | P&I | | N/A | | 2,022 |
| | 2,177 |
| | — |
| | Shelby Twp., MI | | 5.98% | | 1/15/2031 | | P&I | | N/A | | 1,828 |
| | 1,841 |
| | — |
|
| Koninklijke Ahold, N.V. | | Bensalem, PA | | 7.24% | | 5/15/2020 | | P&I | | N/A | | 1,489 |
| | 1,617 |
| | — |
| |
| Lowes Companies, Inc. | | Framingham, MA | | 5.87% | | 9/15/2031 | | (1) | | N/A | | 5,872 |
| | 1,944 |
| | — |
| |
| Walgreen Co. | | Dallas, TX | | 6.46% | | 12/15/2029 | | P&I | | N/A | | 2,517 |
| | 2,796 |
| | — |
| | Dallas, TX | | 6.46% | | 12/15/2029 | | P&I | | N/A | | 2,254 |
| | 2,297 |
| | — |
|
| Walgreen Co. | | Nacogdoches, TX | | 6.80% | | 9/15/2030 | | P&I | | N/A | | 2,758 |
| | 3,116 |
| | — |
| | Nacogdoches, TX | | 6.80% | | 9/15/2030 | | P&I | | N/A | | 2,501 |
| | 2,601 |
| | — |
|
| Walgreen Co. | | Rosemead, CA | | 6.26% | | 12/15/2029 | | P&I | | N/A | | 3,848 |
| | 4,228 |
| | — |
| |
| Total | | $ | 24,776 |
| | $ | 22,764 |
| | $ | — |
| |
| | | | $ | 9,947 |
| | $ | 10,164 |
| | $ | — |
|
| |
| (1) | During the year ended December 31, 2018, the Company decided to sell its mortgage notes receivable and classified them as held for sale. The valuation allowance related to the remaining five mortgage notes as of December 31, 2018 was $0.7 million. |
(1) Zero coupon rate with balloon payment due at maturity.
| | | | | Years Ended December 31, | | Years Ended December 31, |
| | | 2016 | | 2015 | | 2014 | | 2018 | | 2017 | | 2016 |
| Beginning Balance | | $ | 24,238 |
| | $ | 26,806 |
| | $ | 26,279 |
| | $ | 20,294 |
| | $ | 22,764 |
| | $ | 24,238 |
|
| Additions during the year: | | | | | | | |
| Acquired in Cole Merger | | — |
| | — |
| | 72,326 |
| |
| Investments in mortgage notes | | — |
| | — |
| | 2,952 |
| |
| Deductions during the year: | | | | | | | | | | | | |
| Early payoff of loan investment | | | — |
| | (1,502 | ) | | — |
|
| Sale of loan investments | | | (8,256 | ) | | — |
| | — |
|
| Principal payments received on loan investments | | (1,339 | ) | | (2,417 | ) | | (74,109 | ) | | (897 | ) | | (904 | ) | | (1,339 | ) |
| Amortization of unearned discounts and premiums | | (135 | ) | | (151 | ) | | (642 | ) | | 15 |
| | (64 | ) | | (135 | ) |
| Valuation allowance | | | (992 | ) | | — |
| | — |
|
| Ending Balance | | $ | 22,764 |
| | $ | 24,238 |
| | $ | 26,806 |
| | $ | 10,164 |
|
| $ | 20,294 |
|
| $ | 22,764 |
|