Contents
| Investment Team and Strategy | AUM as of December 31, 2017 | Composite Inception Date | Value-Added Since Inception Date (1) as of December 31, 2017 | Fund Rating(2) as of December 31, 2017 | |
| (in millions) | |||||
| Growth Team | |||||
| Global Opportunities | 15,469 | February 1, 2007 | 579 | ««««« | |
| Global Discovery | 16 | September 1, 2017 | (178) | Not yet rated | |
| U.S. Mid-Cap Growth | 12,798 | April 1, 1997 | 453 | ««« | |
| U.S. Small-Cap Growth | 2,345 | April 1, 1995 | 99 | ««« | |
Global Equity Team(3) | |||||
| Global Equity | 1,439 | April 1, 2010 | 406 | ««« | |
| Non-U.S. Growth | 27,101 | January 1, 1996 | 542 | «« | |
| Non-U.S. Small-Cap Growth | 695 | January 1, 2002 | 302 | «« | |
| U.S. Value Team | |||||
| Value Equity | 2,269 | July 1, 2005 | (5) | ««« | |
| U.S. Mid-Cap Value | 6,496 | April 1, 1999 | 388 | ««« | |
| Global Value Team | |||||
| Global Value | 19,930 | July 1, 2007 | 482 | «««« | |
| Non-U.S. Value | 21,757 | July 1, 2002 | 628 | ««««« | |
| Emerging Markets Team | |||||
| Emerging Markets | 282 | July 1, 2006 | 54 | ««« | |
| Credit Team | |||||
| High Income | 2,517 | April 1, 2014 | 296 | ««««« | |
| Privately offered strategy | 37 | July 1, 2017 | Not disclosed | Not applicable | |
| Developing World Team | |||||
| Developing World | 2,253 | July 1, 2015 | 353 | Not yet rated | |
| Thematic Team | |||||
| Thematic | 32 | May 1, 2017 | 1,612 | Not yet rated | |
| Privately offered strategy | 58 | November 1, 2017 | Not disclosed | Not applicable | |
| Total AUM as of December 31, 2017 | 115,494 | ||||
(1) Value-added since inception date is the amount in basis points by which the average annual gross composite return of each of our strategies has outperformed or underperformed the broad-based market index most commonly used by our clients to compare the performance of the relevant strategy since its inception date. Value-added for periods less than one year are not annualized. The broad-based market indices used to compute the value added since inception date for each of our strategies are as follows: Non-U.S. Growth Strategy / Non-U.S. Value Strategy-MSCI EAFE Index; Global Equity Strategy / Global Opportunities Strategy / Global Value Strategy / Global Discovery Strategy-MSCI ACWI Index; Non-U.S. Small-Cap Growth Strategy-MSCI EAFE Small Cap Index; U.S. Mid-Cap Growth Strategy / U.S. Mid-Cap Value Strategy-Russell Midcap® Index; U.S. Small-Cap Growth Strategy-Russell 2000® Index; Value Equity Strategy-Russell 1000® Index; Developing World Strategy / Emerging Markets Strategy-MSCI Emerging Markets Index; High Income Strategy-ICE BofAML US High Yield Master II Total Return Index; Thematic Strategy-S&P® 500 Index. Unlike the ICE BofAML US High Yield Master II Total Return Index, the Artisan High Income strategy may hold loans and other security types. At times, this causes material differences in relative performance. | |||||
(2) The Overall Morningstar RatingTM for a fund is derived from a weighted average of the performance figures associated with its three-year, five-year, and ten-year (if applicable) Morningstar Ratings metrics. The ratings which form the basis for the information reflected in this report, and the fund categories in which they are rated, relating to each Fund’s Investor Share Class are: Artisan Emerging Markets Fund—Diversified Emerging Markets; Artisan Global Equity Fund—World Stock; Artisan Global Opportunities Fund—World Stock; Artisan Global Value Fund—World Stock; Artisan High Income Fund—High Yield Bond; Artisan International Fund—Foreign Large Blend; Artisan International Small Cap Fund—Foreign Small/Mid Growth; Artisan International Value Fund—Foreign Large Blend; Artisan Mid Cap Fund—Mid-Cap Growth; Artisan Mid Cap Value Fund—Mid-Cap Value; Artisan Small Cap Fund—Small Growth; Artisan Value Fund—Large Value. Morningstar ratings are initially given on a fund’s three year track record and change monthly. | |||||
(3) On January 20, 2017, we ceased managing assets in the Global Small-Cap Growth Strategy. | |||||
Growth Team
Our Growth team, which was formed in 1997 and is based in Milwaukee, Wisconsin, manages four investment strategies: Global Opportunities, Global Discovery, U.S. Mid-Cap Growth and U.S. Small-Cap Growth. James D. Hamel, Matthew H. Kamm, Craigh A. Cepukenas, and Jason L. White and Jay C. Warner are the portfolio co-managersmanagers of all four strategies. Mr. Hamel is the lead portfolio manager of the Global Opportunities strategy; Mr. White is the lead portfolio manager of the Global Discovery strategy; Mr. Kamm is the lead portfolio manager of the U.S. Mid-Cap Growth strategy; and Mr. Cepukenas is the lead portfolio manager of the U.S. Small-Cap Growth strategy. The U.S. Mid-Cap Growth and U.S. Small-Cap Growth strategies are currently closed to most new investors and client relationships. The Global Opportunities strategy is open across pooled vehicles, but closed to most new separate account clients.
| As of December 31, 2021 | |||||||||||||||||||||||||||||
| Investment Strategy (Composite Inception Date) | 1 Year | 3 Years | 5 Years | 10 Years | Inception | ||||||||||||||||||||||||
| Global Opportunities (February 1, 2007) | |||||||||||||||||||||||||||||
| Average Annual Gross Returns | 15.17 | % | 30.66 | % | 22.22 | % | 18.32 | % | 13.27 | % | |||||||||||||||||||
MSCI ACWI® Index | 18.54 | % | 20.36 | % | 14.39 | % | 11.84 | % | 7.02 | % | |||||||||||||||||||
| Global Discovery (September 1, 2017) | |||||||||||||||||||||||||||||
| Average Annual Gross Returns | 14.01 | % | 34.48 | % | — | % | — | % | 23.86 | % | |||||||||||||||||||
MSCI ACWI® Index | 18.54 | % | 20.36 | % | — | % | — | % | 13.06 | % | |||||||||||||||||||
| U.S. Mid-Cap Growth (April 1, 1997) | |||||||||||||||||||||||||||||
| Average Annual Gross Returns | 11.68 | % | 35.59 | % | 24.22 | % | 18.62 | % | 16.58 | % | |||||||||||||||||||
Russell Midcap® Index | 22.58 | % | 23.26 | % | 15.09 | % | 14.89 | % | 11.13 | % | |||||||||||||||||||
Russell Midcap® Growth Index | 12.73 | % | 27.43 | % | 19.82 | % | 16.61 | % | 10.72 | % | |||||||||||||||||||
| U.S. Small-Cap Growth (April 1, 1995) | |||||||||||||||||||||||||||||
| Average Annual Gross Returns | (7.77) | % | 28.69 | % | 23.16 | % | 18.21 | % | 12.18 | % | |||||||||||||||||||
Russell 2000® Index | 14.82 | % | 20.00 | % | 12.01 | % | 13.22 | % | 9.83 | % | |||||||||||||||||||
Russell 2000® Growth Index | 2.83 | % | 21.14 | % | 14.52 | % | 14.12 | % | 8.67 | % | |||||||||||||||||||
| As of December 31, 2017 | ||||||||||||||
| Investment Strategy (Inception Date) | 1 Year | 3 Years | 5 Years | 10 Years | Inception | |||||||||
| Global Opportunities (February 1, 2007) | ||||||||||||||
| Average Annual Gross Returns | 32.73 | % | 15.18 | % | 14.87 | % | 10.46 | % | 11.00 | % | ||||
MSCI ACWI® Index | 23.97 | % | 9.29 | % | 10.79 | % | 4.65 | % | 5.21 | % | ||||
| Global Discovery (September 1, 2017) | ||||||||||||||
| Average Annual Gross Returns | — | — | — | — | 5.99 | % | ||||||||
MSCI ACWI® Index | — | — | — | — | 7.77 | % | ||||||||
| U.S. Mid-Cap Growth (April 1, 1997) | ||||||||||||||
| Average Annual Gross Returns | 21.96 | % | 8.14 | % | 13.46 | % | 9.95 | % | 15.06 | % | ||||
Russell Midcap® Index | 18.52 | % | 9.57 | % | 14.95 | % | 9.10 | % | 10.54 | % | ||||
Russell® Midcap Growth Index | 25.27 | % | 10.29 | % | 15.30 | % | 9.09 | % | 9.28 | % | ||||
| U.S. Small-Cap Growth (April 1, 1995) | ||||||||||||||
| Average Annual Gross Returns | 28.38 | % | 11.71 | % | 15.15 | % | 10.30 | % | 10.56 | % | ||||
Russell 2000® Index | 14.65 | % | 9.95 | % | 14.11 | % | 8.70 | % | 9.56 | % | ||||
Russell 2000® Growth Index | 22.17 | % | 10.27 | % | 15.20 | % | 9.18 | % | 7.98 | % | ||||
Global Equity Team
Our Global Equity team was formed in 1996 and is primarily based in San Francisco and New York. The Global Equity team currently manages threefour investment strategies: Global Equity, Non-U.S. Growth, Non-U.S. Small-Mid Growth and Non-U.S. Small-Cap Growth. China Post-Venture.
Mark L. Yockey is the founder of our Global Equity team and has beenserves as portfolio manager of each of the team’s strategies since their inception.Global Equity and Non-U.S. Growth strategies. Charles-Henri Hamker and Andrew J. Euretig are also portfolio managers of the Global Equity strategy and associate portfolio managers of the Non-U.S. Growth strategy andstrategy. Rezo Kanovich serves as the sole portfolio co-managers (with Mr. Yockey)manager of the Global EquityNon-U.S. Small-Mid Growth strategy. Mr. Hamker alsoTiffany Hsiao serves as portfolio co-managermanager and Yuanyuan Ji serves as associate portfolio manager of the Non-U.S. Small-Cap Growth strategy with Mr. Yockey. The Non-U.S. Growth and Non-U.S. Small-Cap Growth strategiesChina Post-Venture strategy.
3
| As of December 31, 2021 | |||||||||||||||||||||||||||||
| Investment Strategy (Composite Inception Date) | 1 Year | 3 Years | 5 Years | 10 Years | Inception | ||||||||||||||||||||||||
| Global Equity (April 1, 2010) | |||||||||||||||||||||||||||||
| Average Annual Gross Returns | 6.56 | % | 22.55 | % | 19.20 | % | 15.89 | % | 14.07 | % | |||||||||||||||||||
MSCI ACWI® Index | 18.54 | % | 20.36 | % | 14.39 | % | 11.84 | % | 10.10 | % | |||||||||||||||||||
| Non-U.S. Growth (January 1, 1996) | |||||||||||||||||||||||||||||
| Average Annual Gross Returns | 10.07 | % | 16.03 | % | 13.31 | % | 10.37 | % | 10.29 | % | |||||||||||||||||||
MSCI EAFE® Index | 11.26 | % | 13.53 | % | 9.54 | % | 8.02 | % | 5.25 | % | |||||||||||||||||||
| Non-U.S. Small-Mid Growth (January 1, 2019) | |||||||||||||||||||||||||||||
| Average Annual Gross Returns | 5.17 | % | 25.33 | % | — | % | — | % | 25.33 | % | |||||||||||||||||||
| MSCI All Country World Index Ex USA Small Mid Cap (Net) | 10.16 | % | 14.71 | % | — | % | — | % | 14.71 | % | |||||||||||||||||||
China Post-Venture (April 1, 2021) 1 | |||||||||||||||||||||||||||||
| Average Annual Gross Returns | — | % | — | % | — | % | — | % | (9.06) | % | |||||||||||||||||||
| MSCI China SMID Cap Index | — | % | — | % | — | % | — | % | (14.45) | % | |||||||||||||||||||
1 Periods less than one year are currently closed to most new investors and client relationships. On January 20, 2017, the Global Equity team ceased managing assets in a fourth strategy, the Artisan Global Small-Cap Growth strategy.not annualized.
| As of December 31, 2017 | ||||||||||||||
| Investment Strategy (Inception Date) | 1 Year | 3 Years | 5 Years | 10 Years | Inception | |||||||||
| Global Equity (April 1, 2010) | ||||||||||||||
| Average Annual Gross Returns | 33.31 | % | 10.66 | % | 13.20 | % | — | 13.14 | % | |||||
MSCI ACWI® Index | 23.97 | % | 9.29 | % | 10.79 | % | — | 9.08 | % | |||||
| Non-U.S. Growth (January 1, 1996) | ||||||||||||||
| Average Annual Gross Returns | 32.55 | % | 5.48 | % | 8.57 | % | 3.87 | % | 10.54 | % | ||||
MSCI EAFE® Index | 25.03 | % | 7.79 | % | 7.89 | % | 1.94 | % | 5.12 | % | ||||
| Non-U.S. Small-Cap Growth (January 1, 2002) | ||||||||||||||
| Average Annual Gross Returns | 35.54 | % | 10.39 | % | 9.67 | % | 5.51 | % | 13.87 | % | ||||
MSCI EAFE® Small Cap Index | 33.01 | % | 14.19 | % | 12.85 | % | 5.77 | % | 10.86 | % | ||||
U.S. Value Team
Our U.S. Value team, which was formed in 1997 and is based in Atlanta and Chicago, manages two investment strategies: Value Equity and U.S. Mid-Cap Value. James C. Kieffer, Thomas A. Reynolds, and Daniel L. Kane, and Craig Inman are the portfolio co-managersmanagers for both strategies. George O. Sertl, Jr., previously a portfolio co-managerDuring the first quarter of 2022, the team’s two strategies, stepped down from portfolio management in October 2017 and provided notice of his intent to retire. On May 23, 2016, the U.S. Value team ceasedwill begin managing assets in a third strategy, the Value Income strategy. James C. Kieffer, who relinquished portfolio management responsibilities of the Value Equity and U.S. Mid-Cap Value strategies effective February 1, 2021, remains a managing director of Artisan U.S. Small-Cap Value strategy.
| As of December 31, 2021 | |||||||||||||||||||||||||||||
| Investment Strategy (Composite Inception Date) | 1 Year | 3 Years | 5 Years | 10 Years | Inception | ||||||||||||||||||||||||
| Value Equity (July 1, 2005) | |||||||||||||||||||||||||||||
| Average Annual Gross Returns | 24.43 | % | 21.90 | % | 12.83 | % | 12.88 | % | 9.67 | % | |||||||||||||||||||
Russell 1000® Index | 26.45 | % | 26.18 | % | 18.41 | % | 16.53 | % | 11.07 | % | |||||||||||||||||||
Russell 1000® Value Index | 25.16 | % | 17.62 | % | 11.16 | % | 12.96 | % | 8.43 | % | |||||||||||||||||||
| U.S. Mid-Cap Value (April 1, 1999) | |||||||||||||||||||||||||||||
| Average Annual Gross Returns | 27.76 | % | 19.43 | % | 11.12 | % | 11.78 | % | 12.98 | % | |||||||||||||||||||
Russell Midcap® Index | 22.58 | % | 23.26 | % | 15.09 | % | 14.89 | % | 10.43 | % | |||||||||||||||||||
Russell Midcap® Value Index | 28.34 | % | 19.60 | % | 11.21 | % | 13.43 | % | 10.28 | % | |||||||||||||||||||
4
| As of December 31, 2017 | ||||||||||||||
| Investment Strategy (Inception Date) | 1 Year | 3 Years | 5 Years | 10 Years | Inception | |||||||||
| Value Equity (July 1, 2005) | ||||||||||||||
| Average Annual Gross Returns | 16.99 | % | 11.78 | % | 13.41 | % | 8.44 | % | 9.00 | % | ||||
Russell 1000® Index | 21.69 | % | 11.22 | % | 15.70 | % | 8.59 | % | 9.05 | % | ||||
Russell® 1000 Value Index | 13.66 | % | 8.64 | % | 14.03 | % | 7.10 | % | 7.77 | % | ||||
| U.S. Mid-Cap Value (April 1, 1999) | ||||||||||||||
| Average Annual Gross Returns | 13.69 | % | 8.70 | % | 12.64 | % | 10.17 | % | 13.51 | % | ||||
Russell Midcap® Index | 18.52 | % | 9.57 | % | 14.95 | % | 9.10 | % | 9.63 | % | ||||
Russell® Midcap Value Index | 13.34 | % | 8.99 | % | 14.67 | % | 9.09 | % | 10.20 | % | ||||
Our GlobalInternational Value team, was formed in 2002 andled by N. David Samra, is based in San Francisco and Chicago. The team manages two investment strategies: GlobalInternational Value and Non-U.S.International Small Cap Value. N. David Samra and Daniel J. O’Keefe are the portfolio co-managers of both strategies. Mr. Samra is theserves as lead portfolio manager of the Non-U.S.International Value strategy and managing director of the International Small Cap Value strategy. Ian P. McGonigle and Joseph Vari serve as co-portfolio managers of the International Value strategy. Beini Zhou and Anand Vasagiri serve as co-portfolio managers of the International Small Cap Value strategy.
| As of December 31, 2021 | |||||||||||||||||||||||||||||
| Investment Strategy (Composite Inception Date) | 1 Year | 3 Years | 5 Years | 10 Years | Inception | ||||||||||||||||||||||||
| International Value (July 1, 2002) | |||||||||||||||||||||||||||||
| Average Annual Gross Returns | 18.10 | % | 17.64 | % | 11.73 | % | 11.79 | % | 12.10 | % | |||||||||||||||||||
MSCI EAFE® Index | 11.26 | % | 13.53 | % | 9.54 | % | 8.02 | % | 6.59 | % | |||||||||||||||||||
| International Small Cap Value (October 1, 2020) | |||||||||||||||||||||||||||||
| Average Annual Gross Returns | 20.65 | % | — | % | — | % | — | % | 40.85 | % | |||||||||||||||||||
| MSCI All Country World Index Ex USA Small Cap (Net) | 12.93 | % | — | % | — | % | — | % | 31.41 | % | |||||||||||||||||||
Global Value Team
Our Global Value team, led by Daniel J. O’Keefe, is primarily based in Chicago. Mr. O’Keefe is theserves as lead portfolio manager and Michael J. McKinnon serves as portfolio manager of the team’s Global Value strategy. The Non-U.S. Value strategy is closed to most new investors and client relationships. The Global Value strategy is open to new relationships through pooled investment vehicles, but generally closed to most new separate account relationships.Select Equity strategies.
| As of December 31, 2021 | |||||||||||||||||||||||||||||
| Investment Strategy (Composite Inception Date) | 1 Year | 3 Years | 5 Years | 10 Years | Inception | ||||||||||||||||||||||||
| Global Value (July 1, 2007) | |||||||||||||||||||||||||||||
| Average Annual Gross Returns | 16.94 | % | 16.46 | % | 11.40 | % | 12.37 | % | 9.17 | % | |||||||||||||||||||
MSCI ACWI® Index | 18.54 | % | 20.36 | % | 14.39 | % | 11.84 | % | 6.60 | % | |||||||||||||||||||
| Select Equity (March 1, 2020) | |||||||||||||||||||||||||||||
| Average Annual Gross Returns | 16.87 | % | — | % | — | % | — | % | 21.61 | % | |||||||||||||||||||
| S&P 500 Index | 28.71 | % | — | % | — | % | — | % | 31.80 | % | |||||||||||||||||||
| As of December 31, 2017 | ||||||||||||||
| Investment Strategy (Inception Date) | 1 Year | 3 Years | 5 Years | 10 Years | Inception | |||||||||
| Global Value (July 1, 2007) | ||||||||||||||
| Average Annual Gross Returns | 23.47 | % | 10.49 | % | 13.88 | % | 10.45 | % | 9.40 | % | ||||
MSCI ACWI® Index | 23.97 | % | 9.29 | % | 10.79 | % | 4.65 | % | 4.58 | % | ||||
| Non-U.S. Value (July 1, 2002) | ||||||||||||||
| Average Annual Gross Returns | 25.34 | % | 9.84 | % | 12.14 | % | 9.04 | % | 13.03 | % | ||||
MSCI EAFE® Index | 25.03 | % | 7.79 | % | 7.89 | % | 1.94 | % | 6.74 | % | ||||
Sustainable Emerging Markets Team
Our Sustainable Emerging Markets team, which was formed in 2006 and is based in New York, manages a single investment strategy. Maria Negrete-Gruson is the portfolio manager for the Sustainable Emerging Markets strategy.
| As of December 31, 2021 | |||||||||||||||||||||||||||||
| Investment Strategy (Composite Inception Date) | 1 Year | 3 Years | 5 Years | 10 Years | Inception | ||||||||||||||||||||||||
| Sustainable Emerging Markets (July 1, 2006) | |||||||||||||||||||||||||||||
| Average Annual Gross Returns | (0.27) | % | 14.40 | % | 12.64 | % | 7.72 | % | 6.78 | % | |||||||||||||||||||
| MSCI Emerging Markets Index | (2.54) | % | 10.93 | % | 9.87 | % | 5.48 | % | 5.72 | % | |||||||||||||||||||
5
Table of company-specific and macroeconomic risks into its valuation analysis to develop a risk adjusted target price. The risk-rating assessment includes a review of country-appropriate macroeconomic risk factors to which a company is exposed. Finally, the team believes that investment opportunities develop when businesses with sustainable earnings are undervalued relative to peers and historical industry, country and regional valuations. The team values a business and develops a price target for a company based on its assessment of the business’s sustainable earnings and risk analysis.
| As of December 31, 2017 | ||||||||||||||
| Investment Strategy (Inception Date) | 1 Year | 3 Years | 5 Years | 10 Years | Inception | |||||||||
| Emerging Markets (July 1, 2006) | ||||||||||||||
| Average Annual Gross Returns | 41.19 | % | 13.72 | % | 6.83 | % | 2.28 | % | 6.89 | % | ||||
MSCI Emerging Markets IndexSM | 37.28 | % | 9.09 | % | 4.35 | % | 1.68 | % | 6.35 | % | ||||
Credit Team
Our Credit team, which was formed in 2014 and is currently based in Mission Woods, Kansas,Denver, manages twothree investment strategies: High Income, Credit Opportunities and a privately offered credit long-short strategy.Floating Rate. Bryan L. Krug is theserves as portfolio manager for both strategies. The following description applies toof the High Income strategy. Information for the privately offered strategy has been intentionally omitted.
| As of December 31, 2021 | |||||||||||||||||||||||||||||
| Investment Strategy (Composite Inception Date) | 1 Year | 3 Years | 5 Years | 10 Years | Inception | ||||||||||||||||||||||||
| High Income (April 1, 2014) | |||||||||||||||||||||||||||||
| Average Annual Gross Returns | 7.16 | % | 11.03 | % | 8.35 | % | — | % | 7.93 | % | |||||||||||||||||||
| ICE BofA U.S. High Yield Master II Total Return Index | 5.36 | % | 8.56 | % | 6.09 | % | — | % | 5.36 | % | |||||||||||||||||||
| Credit Opportunities (July 1, 2017) | |||||||||||||||||||||||||||||
| Average Annual Gross Returns | 18.44 | % | 18.84 | % | — | % | — | % | 14.44 | % | |||||||||||||||||||
| ICE BofA U.S. High Yield Master II Total Return Index | 0.17 | % | 1.28 | % | — | % | — | % | 1.45 | % | |||||||||||||||||||
Floating Rate (January 1, 2022) 1 | |||||||||||||||||||||||||||||
| Average Annual Gross Returns | — | % | — | % | — | % | — | % | — | % | |||||||||||||||||||
| Credit Suisse Leveraged Loan Total Return Index | — | % | — | % | — | % | — | % | — | % | |||||||||||||||||||
1 The Floating Rate strategy composite performance began on January 1, 2022. As a result, there is not a performance track record as of industry participants, and the decision-making history of the issuer’s management. The team believes that analyzing the history and trend of free cash flow generation is critical to understanding an issuer’s financial health. The team also considers an issuer’s capital structure, refinancing options, financial covenants, amortization schedules and overall financial transparency. The team seeks to manage the risk of loss on an investment with what it believes to be conservative financial projections that account for industry position, competitive dynamics and positioning within the capital structure. To determine the value of an investment opportunity the team uses multiple metrics. The team looks for credit improvement potential, relative value within an issuer’s capital structure, catalysts for business improvement and potential value stemming from market or industry dislocations.December 31, 2021.
| As of December 31, 2017 | ||||||||||||
| Investment Strategy (Inception Date) | 1 Year | 3 Years | 5 Years | 10 Years | Inception | |||||||
| High Income (April 1, 2014) | ||||||||||||
| Average Annual Gross Returns | 9.90 | % | 9.07 | % | — | — | 7.90 | % | ||||
| ICE BofA Merrill Lynch U.S. High Yield Master II Total Return Index (Net) | 7.48 | % | 6.38 | % | — | — | 4.94 | % | ||||
Developing World Team
Our Developing World team, which was formed in 2015 and is based in San Francisco, manages a singleone investment strategy. Lewis S. Kaufman is the portfolio manager for the Developing World strategy.
| As of December 31, 2021 | |||||||||||||||||||||||||||||
| Investment Strategy (Composite Inception Date) | 1 Year | 3 Years | 5 Years | 10 Years | Inception | ||||||||||||||||||||||||
| Developing World (July 1, 2015) | |||||||||||||||||||||||||||||
| Average Annual Gross Returns | (8.71) | % | 33.88 | % | 22.94 | % | — | % | 17.16 | % | |||||||||||||||||||
| MSCI Emerging Markets Index | (2.54) | % | 10.93 | % | 9.87 | % | — | % | 6.11 | % | |||||||||||||||||||
| As of December 31, 2017 | |||||||||||
| Investment Strategy (Inception Date) | 1 Year | 3 Years | 5 Years | 10 Years | Inception | ||||||
| Developing World (July 1, 2015) | |||||||||||
| Average Annual Gross Returns | 36.87 | % | — | — | — | 13.24 | % | ||||
| MSCI Emerging Markets Index | 37.28 | % | — | — | — | 9.71 | % | ||||
| As of December 31, 2021 | |||||||||||||||||||||||||||||
| Investment Strategy (Composite Inception Date) | 1 Year | 3 Years | 5 Years | 10 Years | Inception | ||||||||||||||||||||||||
| Antero Peak (May 1, 2017) | |||||||||||||||||||||||||||||
| Average Annual Gross Returns | 25.17 | % | 29.95 | % | — | % | — | % | 28.08 | % | |||||||||||||||||||
| S&P 500 Index | 28.71 | % | 26.04 | % | — | % | — | % | 18.12 | % | |||||||||||||||||||
| Antero Peak Hedge (November 1, 2017) | |||||||||||||||||||||||||||||
| Average Annual Gross Returns | 19.56 | % | 21.97 | % | — | % | — | % | 20.18 | % | |||||||||||||||||||
| S&P 500 Index | 28.71 | % | 26.04 | % | — | % | — | % | 18.04 | % | |||||||||||||||||||
Emerging Markets Debt Team
The following description appliesEmerging Markets Debt team was formed in 2021 and is based in Boston. We are working with the team to develop active, differentiated strategies with broad exposure to the Thematic strategy. Information foremerging markets debt asset class and expect the privately offered strategy has been intentionally omitted.team’s first strategies will launch during the first half of 2022.
6
Table of a top-down thematic framework and bottom-up analysis will position a portfolio to deliver attractive risk-adjusted returns over the long term.
Contents
Distribution, Investment Products and Client Relationships
The goal of our marketing, distribution and client service efforts is to establishgrow and maintain a client base that is diversified by investment strategy, investment vehicle (for example, across mutual funds and separate accounts),client type, distribution channel (for example, institutional, intermediary and retail) and geographic region. We focus our distribution and marketing efforts on sophisticated investors and asset allocators, including institutions and on intermediaries that operate with institutional-like, centralized decision-making processes and longer-term investment horizons. We have designed our distribution strategies and structured our distribution teams to use knowledgeable, seasoned marketing and client service professionals in a way intended to limit the time our investment professionals are required to spend inon marketing and client service activities. We believe that minimizing other demands allows our portfolio managers and other investment professionals to focus their energies and attention on the investment decision-making process, which we believe enhances the opportunity to achieve superior investment returns. Our distribution efforts are centrally managed by our Head of Global Distribution, who oversees and coordinates the efforts of our marketing and client service professionals.
Institutional Channel
Our institutional distribution channel includes institutional clients, such as U.S.-registered mutual funds, non-U.S. funds and collective investment trusts we sub-advise; state and local governments; employee benefit plans including Taft-Hartley plans; foundations; and endowments. Our institutional distribution channel also includes assets under management sourced from defined contribution/401(k)contribution plans. We offer our investment products to institutional clients directly and by marketing our services to the investment consultants and advisors that advise them. As of December 31, 2017,2021, approximately 45%36% of our assets under management were attributed to clients represented by investment consultants.
As of December 31, 2017, 66%2021, 64% of our assets under management were sourced through our institutional channel.
Intermediary Channel
We maintain relationships with a number of major brokerage firms and larger private banks and trust companies at which the process for identifying which funds to offer has been centralized to a relatively limited number of key decision-makers that exhibit institutionalinstitutional-like decision-making behavior. We also maintain relationships with a number of financial advisory firms and broker-dealer advisors that offer our investment products to their clients. These advisors range from relatively small firms to large organizations.
As of December 31, 2017,2021, approximately 30%32% of our assets under management were sourced through our intermediary channel.
Retail Channel
We primarily access retail investors indirectly through mutual fund supermarkets through which investors have the ability to purchase and redeem fund shares. InvestorsU.S. investors can also invest directly in the series of Artisan Funds. Our subsidiary, Artisan Partners Distributors LLC, a registered broker-dealer, distributes shares of Artisan Funds. Publicity and ratings and rankings from Morningstar, Lipper and others are important inessential to building the Artisan Partners brand, which is important infor attracting retail investors. As a result, we publicize the ratings and rankings received by the series of Artisan Funds and work to ensure that potential retail investors have appropriate information to evaluate a potential investment in Artisan Funds. We do not generally use direct marketing campaigns as we believe that their cost outweighs their potential benefits.
As of December 31, 2017,2021, approximately 4% of our assets under management were sourced from investors we categorize as retail investors.
Access Through a Range of Investment Vehicles
Our clients access our investment strategies through a range of investment vehicles, including separate accounts and mutual funds.pooled vehicles. As of December 31, 2017, approximately 50% of our assets under management were in separate accounts, and2021, Artisan Funds and Artisan Global Funds accounted for approximately 50%48% of our total assets under management.management, and approximately 52% of our assets under management were managed in separate accounts and other pooled vehicles.
Separate Accounts and Other
We manage traditional separate account assetsaccounts within most of our investment strategies. As of December 31, 2017,2021, we managed 215235 traditional separate accounts spanning 141138 client relationships and our largest separate account relationship represented approximately 9%8% of our assets under management. OurThese separate account clients include both institutional and intermediary channel relationships.relationships, such as pension and profit sharing plans, corporations, trusts, endowments, foundations, charitable organizations, high net worth individuals, governmental entities, insurance companies, commingled investment vehicles, investment advisers and other financial institutions, trustees of collective investment trusts and investment companies and similar pooled investment vehicles. We generally require a minimum relationship of $20 million to $100 million, depending on the strategy, to manage a separate account. We also offer access to a number of our strategies through Artisan-branded collective investment trusts and through funds (both public and private) that we sub-advise. The fees we charge ouron separate accounts vary by client, investment strategy and the size of the account. Fees are accrued monthly, but generally are paid quarterly in arrears.
7
A number of our investment strategies are accessible to certain types of employee benefit plans through Artisan-branded collective investment trusts, or CITs. We act as investment adviser to the CITs and earn a management fee for providing this service. As of December 31, 2021, Artisan-branded collective investment trusts represented approximately 5% of our own privatelyassets under management.
Certain of our investment strategies are primarily offered funds. through Artisan-sponsored unregistered pooled investment vehicles, referred to as Artisan Private Funds. For serving as investment adviser to Artisan Private Funds, we earn a management fee and, for certain funds, are entitled to receive either an allocation of profits or a performance-based fee. As of December 31, 2021, Artisan Private Funds comprised approximately 1% of our assets under management.
In our reporting materials, unless otherwise stated, our separate account“separate accounts and other” AUM includes assets we manage in traditional separate accounts, Artisan-branded collective investment trusts and Artisan Private Funds, as well as assets under advisement related to clients for whom we manage in Artisan-branded collectiveprovide investment trusts, in funds (both public and private) that we sub-advise, and in our own privately offered funds.models but do not have discretionary investment authority.
Artisan Funds and Artisan Global Funds
U.S. investors that do not meet our minimum account size for a separate account, or who otherwise prefer to invest through a mutual fund, can invest in our strategies through Artisan Funds. We serve as the investment adviser to each series of Artisan Funds, SEC-registered mutual funds that offer no-load, no 12b-1 share classes designed to meet the needs of a range of investors. Each series of Artisan Funds corresponds to an investment strategy we offer to clients. In contrast to some mutual funds, investors in Artisan Funds pay no 12b-1 fees, which are fees charged to investors in addition to management fees to pay for marketing, advertising and distribution services associated with the mutual funds. Rebates and expenses for marketing, advertising and distribution services related to Artisan Funds, including distribution payments to broker-dealers and other intermediaries with respect to the Investor and Advisor Shares, are paid out of the investment management fees we earn. The Institutional Shares do not include any payments to intermediaries. We earn investment management fees, which are based on the average daily net assets of each Artisan Fund and are paid monthly, for serving as investment adviser to these funds. As of December 31, 2021, Artisan Funds represented approximately 45% of our assets under management.
We also serve as investment manager of Artisan Global Funds, a family of Ireland-based UCITS funds. Artisan Global Funds which began operations in 2011, provides non-U.S. investors with access to a number of our investment strategies. Expenses for marketing, advertising and distribution services related to Artisan Global Funds, including payments to broker-dealers and other intermediaries, are paid out of thestrategies in a pooled vehicle structure. We earn investment management fees, we earn, which are based on the average daily net assets of each sub-fund and are generally paid monthly.monthly, for serving as investment adviser to these funds. As of December 31, 2021, Artisan Global Funds represented approximately 3% of our assets under management.
Regulatory Environment and Compliance
Our business is subject to extensive regulation in the United States at the federal level and, to a lesser extent, the state level, as well as by self-regulatory organizations and regulators located outside the United States. Under these laws and regulations, agencies that regulate investment advisers, investment funds and other related entities have broad administrative powers, including the power to limit, restrict or prohibit an investment adviserthe regulated entity from carrying on itsconducting business in the event that it fails to comply with such laws and regulations. PossibleBreaches of these laws and regulations could also result in regulatory enforcement, civil liability, criminal liability and/or the imposition of other sanctions, that may be imposed includeincluding monetary damages, fines, censures, the suspension of individual employees, limitations on engaging in certain lines of business for specified periods of time, and the revocation of investment adviser and other registrations, censures and fines. Aregistrations. In addition, a regulatory proceeding, regardless of whether it results in a sanction, can require substantial expenditures and can have an adverse effect on our reputation or business.
U.S. Regulation
As a publicly traded company, we are subject to U.S. federal securities laws, state securities and corporate laws, and the rules and regulations of U.S. regulatory and self-regulatory organizations. In particular, we are subject to the Securities Act of 1933, the Securities Exchange Act of 1934, the Dodd-Frank Wall Street Reform and Consumer Protection Act of 2010 (“Dodd-Frank”), the Sarbanes-Oxley Act of 2002 and, because we are listed on the New York Stock Exchange, the NYSE listed company rules.
Artisan Partners Limited Partnership and Artisan Partners UK LLP are registered with the SEC as investment advisers under the Investment Advisers Act of 1940, or Advisers Act, and Artisan Funds and several of the investment companies we sub-advise are registered under the Investment Company Act of 1940, or 1940 Act. The Advisers Act and the 1940 Act, together with other applicable securities laws and the SEC’s regulations and interpretations thereunder, impose substantive and material restrictions and requirements on the operations of investment advisers and mutual funds. The Securities Act and the Exchange Act, along with the regulations and interpretations thereunder, impose additional restrictions and requirements on mutual funds. The SEC is authorized to institute proceedings and impose sanctions for violations, of those Acts, ranging from fines and censures to, in the case of investment advisers, the termination of an adviser’s registration.
8
Table of investment opportunities among clients; use of soft dollars; execution of transactions; and recommendations to clients. We manage accounts for our clients on a discretionary basis, with authority to buy and sell securities for each portfolio, select broker-dealers to execute trades and negotiate brokerage commission rates. In connection with certain of these transactions, we receive soft dollar credits from broker-dealers that have the effect of reducing certain of our expenses.Contents
Artisan Partners Distributors LLC, our SEC-registered limited purpose broker-dealer subsidiary, is subject to the Securities Exchange Act of 1934, the SEC’s rules promulgated thereunder and the rules and regulations of the Financial Industry Regulatory Authority, which generally relate to sales practices, registration of personnel, compliance and supervision, and compensation and disclosure. FINRA has the authority to conduct periodic examinations of member broker-dealers, and may initiate administrative proceedings. Artisan Partners Distributors LLC is also subject to the SEC’s Uniform Net Capital Rule and the National Securities Clearing Corporation’s excess net capital requirement, which require that at least a minimum part of a registered broker-dealer’s assets be kept in relatively liquid form.
Artisan Partners Limited Partnership is a fiduciary under ERISAthe Employee Retirement Income Security Act of 1974, as amended, with respect to assets that we manage for benefit plan clients subject to ERISA. ERISA regulations promulgated thereunder and applicable provisions of the Internal Revenue Code impose certainimposes duties on persons who are ERISA fiduciaries, under ERISA, prohibitand prohibits certain transactions involvingbetween related parties to a retirement plan. The U.S. Department of Labor administers ERISA and regulates plan clientsfiduciaries, including investment advisers who service retirement plan clients.
Artisan Partners Limited Partnership is registered with the Commodity Futures Trading Commission (CFTC) as a commodity pool operator, and provide monetary penalties for violationsexpects to become a member of the National Futures Association (NFA), with respect to its management of the Artisan Emerging Markets Debt Opportunities Fund and Artisan Global Unconstrained Fund, each of which we expect to launch in the first half of 2022. The CFTC and NFA each administer a comparable regulatory system covering futures, swaps and other derivative instruments. As the commodity pool operator of these prohibitions.Funds, Artisan Partners expects to claim relief under the Commodity Exchange Act from certain reporting and recordkeeping requirements.
The legislative and regulatory environment in the U.S. is subject to continual change. Political and electoral changes and developments have in the past introduced, and may in the future introduce, additional uncertainty. New legal or regulatory requirements often add further complexity to our business and operations, and addressing such new requirements may require substantial expenditures of time and capital. Certain regulatory reforms in the U.S. that have, or may in the future, impact our business include the following items:
•The SEC has recently proposed and/or adopted several new rules impacting registered investment advisers (e.g. private fund advisor rules, cybersecurity risk management rules, beneficial ownership rules, T+1 settlement cycle, amendments to Form PF and amended advertising rule) and registered investment companies (e.g. new or amended rules on mutual fund use of derivatives, liquidity risk management, reporting modernization, valuation). In addition, the SEC’s current regulatory agenda indicates that the SEC will be proposing a number of rules impacting public companies (e.g. new disclosure requirements on topics such as climate change, human capital management, cybersecurity risk governance, and pay versus performance). These rules impact us and the mutual funds we manage to varying degrees.
•In recent years there has been an increased focus on the protection of customer privacy and data, and the need to secure sensitive information. We are subject to the California Consumer Privacy Act, which took effect in January 2020, and provides for enhanced consumer protections for California residents. Since then, several additional states have proposed and/or adopted data privacy laws with which we may be required to comply.
Non-U.S. Regulation
In addition to the extensive regulation we are subject to in the United States, onea number of our subsidiaries and certain of our non-U.S. operations are subject to regulation in non-U.S. jurisdictions. Some laws in non-U.S. jurisdictions are also extra-territorial and may apply to our business.
Artisan Partners UK LLP is authorized and regulated by the U.K. Financial Conduct Authority, which is responsible for the conduct of business and supervision of financial firms in the United Kingdom. The FCA imposes a comprehensive system of regulation that is primarily principles-based (compared to the primarily rules-based U.S. regulatory system).
Artisan Partners Europe is authorized and regulated by the Central Bank of Ireland, imposes requirements on UCITS fundswhich regulates our Irish business activities. Artisan Partners Europe has a branch office in Sweden, which is also regulated by the Central Bank of Ireland and is further subject to the regulation by it, including of the Swedish financial supervisory authority.
Artisan Global Funds, as doa family of Ireland-domiciled UCITS funds, are regulated by the regulators in certain other markets in which sharesCentral Bank of Ireland. Artisan Global Funds are offeredregistered for sale in many countries around the world, both in the EU and with which we are required to comply. Webeyond, and thus are also subject to regulation internationallythe laws of, and supervision by, the governmental authorities of those countries.
Artisan Partners Hong Kong Limited, our Hong Kong subsidiary, is licensed and regulated by the Hong Kong Securities and Futures Commission (the “SFC”). Artisan Partners Hong Kong Limited and its employees conducting regulated activities under the Securities and Futures Ordinance are subject to the rules, codes and guidelines issued by the SFC from time to time.
Artisan Partners Australia Pty Ltd has historically operated in Australia on the basis of a “sufficient equivalence relief” exemption from local licensing with the Australian Securities and Investments Commission, where we operate pursuantCommission. This relief is expiring for foreign financial service providers like us and, as a result, Artisan Partners Australia Pty Ltd or one of its affiliates may need to ordersapply for and obtain a securities license or a new exemption by April 1, 2023.
9
Certain Artisan Private Funds are regulated as mutual funds under the Mutual Funds Law (as amended) of the Cayman Islands, and by various Canadian regulatory authorities in the Canadian provinces where we operate pursuantCayman Islands Monetary Authority has supervisory and enforcement powers to exemptions from registration. ensure the funds’ compliance with the Mutual Funds Law.
Our business is also subject to the rules and regulations of the countries in which we marketconduct distribution or investment management activities. We have relationships with clients located outside of the United States, which relationships may be subject to laws and regulations of the jurisdictions in which the client is domiciled. In addition, 45% of our fundsassets under management were invested in securities denominated in currencies other than the U.S. dollar as of December 31, 2021. Our investments in these non-U.S. securities may subject us to certain laws and regulations of the jurisdictions in which the issuer resides or servicesis traded. We may also be subject to U.S. laws and conductregulations with respect to our distribution or investment management activities in non-U.S. markets, including the countriesin jurisdictions that may be considered higher risk.
Further expansion of our business into new international jurisdictions and regulatory reforms in jurisdictions in which we currently operate or invest, further complicate our compliance efforts. Addressing these legal and regulatory matters may require substantial time and expense. Certain non-U.S. regulatory reforms or guidance regarding such regulations that have, or may in the future, impact our business include the following items:
•In October 2020, the Central Bank of Ireland issued further guidance regarding the fund company management effectiveness framework (“CP86”). As a result of the guidance, fund management companies, including Artisan Global Funds, were required to assess their operational resources and governance arrangements and increase their level of resources to meet the new minimum requirements. During 2021, Artisan Global Funds retained a third-party management company to meet the requirements of CP86 in Ireland.
•The EU’s Markets in Financial Instruments Directive II regulates the use of soft dollars to pay for research and other soft dollar services. MiFID II’s soft dollar rules do not directly apply to our business because we currently conduct our investment strategies make investments. management activities in the United States. However, in response to MiFID II and the industry-wide changes prompted by it, we have experienced requests from clients to bear research expenses that are currently paid for using soft dollars. In response to such requests or as a result of changes in our operations, we may eventually bear a significant portion or all of the costs of research that are currently paid for using soft dollars, which would increase our operating expenses materially.
We may become subject to additional regulatory demands in the future to the extent we expand our business in existing and new jurisdictions. See “Risk Factors—Risks Related to our Industry—We are subject to extensive, regulation”complex and sometimes overlapping rules, regulations and legal interpretations.” and “Risk Factors—Risks Related to our Industry—The regulatory environment in which we operate is subject to continual change, and regulatory developments designed to increase oversight may adversely affect our business.”
Competition
The investment management industry is highly competitive. In order to be successful and grow our business, we must be able to compete effectively for assets under management. Historically, we have competedWe compete to attract assets to our managementclients and investors principally on the basis of:
•the performance of our investment strategies;strategies
•the continuity of our investment professionals;and distribution professionals
•the quality of the service we provide to our clients;clients
•the range of investment strategies and vehicles we offer
•our brand recognition and reputation within the institutional investing community.community
•the fees we charge for the investment management services we provide
Human Capital Resources
As of December 31, 2017,2021, we employed approximately 400 full-time and part-time employees. None498 associates. Approximately 30% of our employeesassociates work within our investment teams, 17% within our distribution teams and 53% within our business management and operations teams. Approximately 94% of our associates operate from our U.S. offices and 6% operate from our offices outside of the U.S. As of December 31, 2021, 40% of our U.S. associates were female and 20% of our U.S. associates self-identified as ethnically diverse.
10
We commit significant energy to the recruitment of our associates as they are critical to ensuring the long-term success of our firm. We strive to recruit and hire outstanding associates who thrive in broad roles and want the freedom to grow their talents and careers. We are also committed to seeking professionals from different backgrounds, experiences and locations to foster creative thinking and differentiated perspectives that remain a pillar of the firm’s culture. We have built relationships with a variety of recruitment partners and community organizations to broaden our candidate pools and increase our access to diverse talent.
We actively support associate development, both formally and informally, and encourage advancement from within the firm. Our tuition reimbursement program is subjectavailable to collective bargaining agreements.associates who are pursuing applicable undergraduate and graduate degrees or certifications or licenses relevant to the business. Our diversity and inclusion committee champions our diversity and inclusion initiatives by bringing together a group of individuals with broad representation across the firm, as well as diverse social, regional and cultural identities. We consideralso actively support a number of associate-led groups including the Pride Alliance, Multicultural Exchange, diffAbilities and the Women’s Networking Initiative. These groups create supportive and collaborative networks, encourage engagement and a sense of belonging, and enhance professional and personal growth. Our support of these and other associate-led programs are part of our relationshipongoing commitment to providing an environment that allows our talented associates to thrive.
We believe in order to attract and retain talent, it is critical that we continue to foster an engaging environment and provide attractive compensation and benefits programs. We regularly review compensation paid to associates to ensure it is competitive and fair for the role, experience, location and individual contribution. We provide equity or equity-linked incentives to all of our associates in order to align their economic interests with those of our employeesclients and stockholders. We encourage our associates to be goodsave for retirement. In the U.S., we match 100% of associate 401(k) contributions dollar for dollar (fully vested), up to the IRS limit. We also maintain competitive retirement programs or benefits for all non-U.S. associates. In addition, we offer a comprehensive benefits program that is available to all associates regardless of title, role, or responsibility.
Sustainability
Artisan Partners' purpose is to generate and have not experienced interruptionscompound wealth over the long-term for our clients. The wealth we generate improves retirement outcomes, pays for education, funds charitable purposes and in general improves people's lives. We are proud of operations dueour track record for the people we serve and are dedicated to labor disagreements.continuing to improve it.
To achieve our purpose, we must continue to thoughtfully grow our business over the long term while preserving a consistent environment in which our talented investment professionals and associates can thrive. Maintaining our talent-driven business model and investment-focused culture is critical to providing a stable environment for our associates, generating sustainable, long-term investment outcomes for clients, and creating long-term successful financial outcomes for shareholders.
To us, sustainability means the following:
•Long-term relationships with the right clients, on the right terms and with the right time horizons. We foster client relationships by prioritizing investment returns. Prioritizing clients’ investment returns may, at times, require us to limit client cash flows and overall assets managed in a strategy—a practice we refer to as capacity management.
•A deliberate process to bring on new investment talent, launch new strategies and build sustainable franchises. We are patient in developing our talent, teams and strategies. We are comfortable with evolving—and sometimes even disrupting—our firm to increase the probability of long-term successful investment outcomes through market cycles.
•Compelling work in a tailored environment, with long-term opportunities for associates across our firm. Our culture promotes associates’ success—ideally over their entire careers—with economic alignment in the form of variable compensation and long-duration incentive awards.
•Growing our business value while maintaining financial discipline and continuing to generate and distribute significant cash to our shareholders. By taking care of our people and fulfilling our fiduciary duty to our clients we create a waterfall effect that generates sustainable financial outcomes for our shareholders over the long term.
Our Structure and Reorganization
Holding Company Structure
We are a holding company and our assets principally consist of our ownership of partnership units of Artisan Partners Holdings, deferred tax assets and cash. As the sole general partner of Artisan Partners Holdings, we operate and control all of its business and affairs, subject to certain voting rights of its limited partners. We conduct all of our business activities through operating subsidiaries of Artisan Partners Holdings. Net profits and net losses are allocated based on the ownership of partnership units of Artisan Partners Holdings. As of December 31, 2017,2021, we owned approximately 67%84% of Artisan Partners Holdings, and the other 33%16% was owned by the limited partners of Artisan Partners Holdings.
11
IPO Reorganization
In March 2013, we completed our IPO. In connection with the IPO, we and Artisan Partners Holdings completed a series of reorganization transactions, which we refer to as the IPO Reorganization, in order to reorganize our capital structures in preparation for the IPO. The IPO Reorganization was designed to create a capital structure that preserves our ability to conduct our business through Artisan Partners Holdings, while permitting us to raise additional capital and provide access to liquidity through a public company. Multiple classes of securities at the public company level were necessary to achieve those objectives and maintain a corporate governance structure consistent with that of Artisan Partners Holdings prior to the IPO Reorganization. The IPO Reorganization included, among other changes, the following:
•Our appointment as the sole general partner of Artisan Partners Holdings.
•The modification of our capital structure into three classes of common stock and a series of convertible preferred stock. We issued shares of our Class B common stock and Class C common stock and convertible preferred stock to pre-IPO partners of Artisan Partners Holdings. Each share of Class B common stock corresponds to a Class B common unit of Artisan Partners Holdings. Each share of Class C common stock corresponds to either a Class A, Class D or Class E common unit of Artisan Partners Holdings. Subject to certain restrictions, each common unit of Artisan Partners Holdings (together with the corresponding share of Class B or Class C common stock) is exchangeable for a share of our Class A common stock.
•A corporation (“H&F Corp”) merged with and into Artisan Partners Asset Management, which we refer to in this document as the H&F Corp Merger. As consideration forIn connection with the merger, the shareholder of H&F Corp received shares of our convertible preferred stock contingent value rights, or CVRs, issued by Artisan Partners Asset Management and the right to receive an amount of cash. In November 2013, the CVRs issued by Artisan Partners Asset Management were terminated with no amounts paid or payable thereunder.certain other considerations. In June 2014, the shareholder of H&F Corp converted all of its then-remaining shares of convertible preferred stock into shares of Class A common stock and sold those shares. We no longer have any outstanding shares of convertible preferred stock, and Artisan Partners Holdings no longer has any outstanding preferred units.
•The voting and certain other rights of each class of limited partnership units of Artisan Partners Holdings were modified. In addition, Artisan Partners Holdings separately issued CVRs to the holders of the preferred units. In November 2013, the CVRs issued by Artisan Partners Holdings were terminated with no amounts paid or payable thereunder.
•We entered into two tax receivable agreements (“TRAs”), one with a private equity fund (the “Pre-H&F Corp Merger Shareholder”) and the other with each limited partner of Artisan Partners Holdings. Pursuant to the first TRA, APAM will paypays to the assignees of the Pre-H&F Corp Merger Shareholder a portion of certain tax benefits APAM realizes as a result of the H&F Corp Merger. Pursuant to the second TRA, APAM will paypays to current or former limited partners of Artisan Partners Holdings (or their assignees) a portion of certain tax benefits APAM realizes as a result of the purchase or exchange of their limited partnership units of Artisan Partners Holdings.
The diagram below depicts our organizational structure as of February 9, 2018:December 31, 2021:
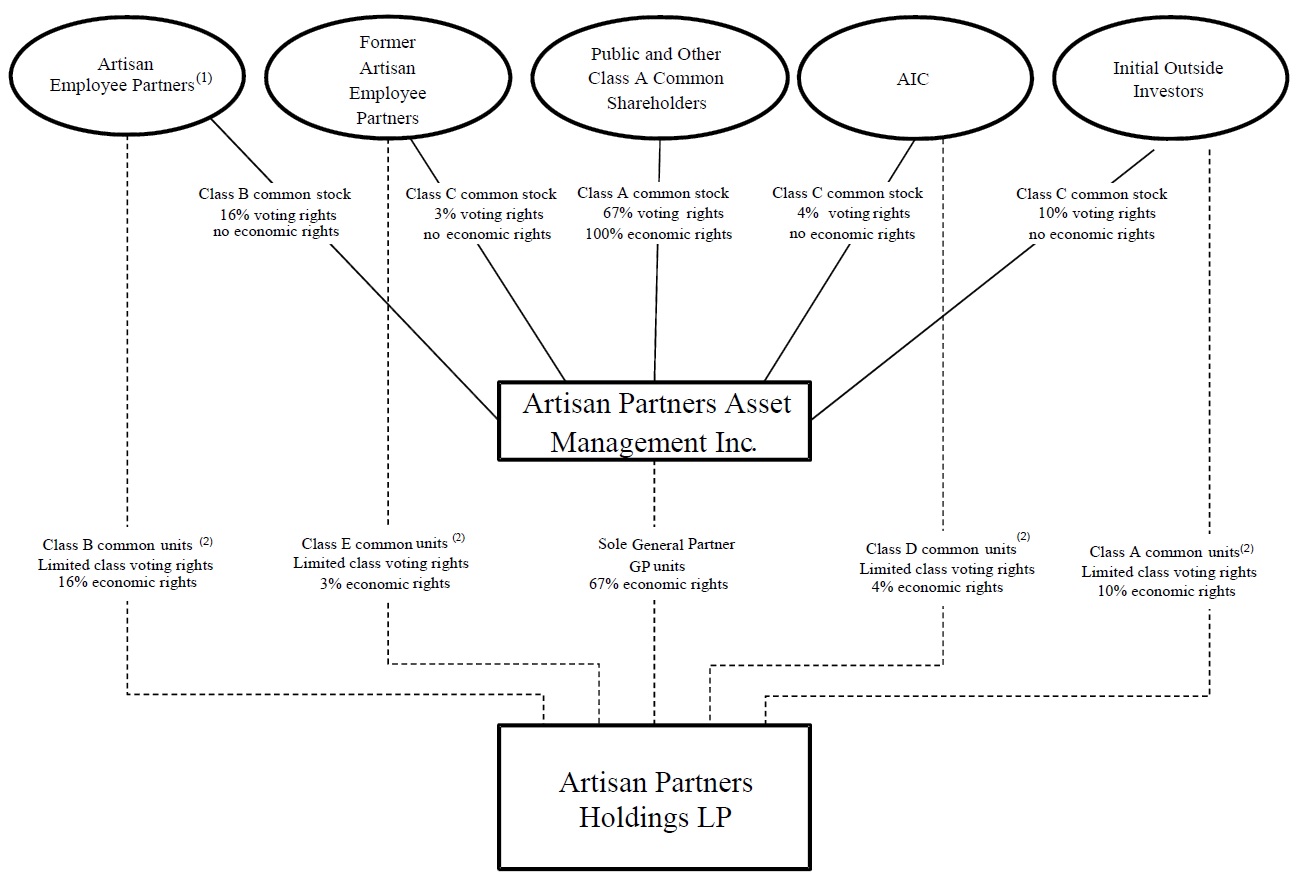
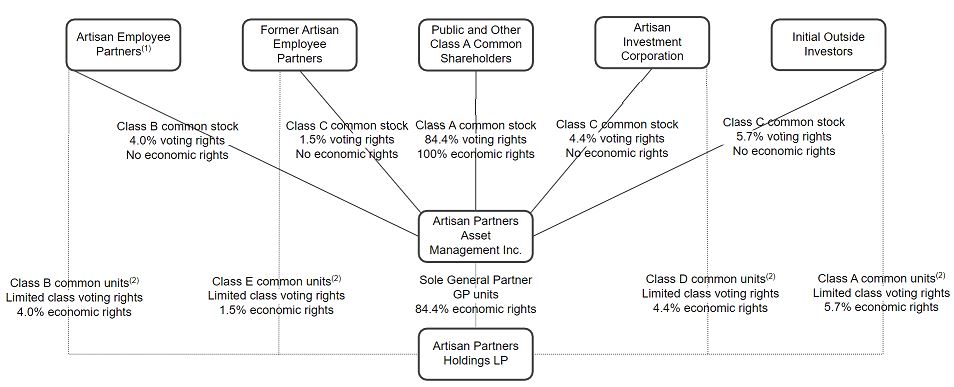
| (1) | Our employees to whom we have granted equity have entered into a stockholders agreement with respect to all shares of our common stock they have acquired from us and any shares they may acquire from us in the future, pursuant to which they granted an irrevocable voting proxy to a stockholders committee currently consisting of Eric R. Colson | ||||
| (2) | Each class of common units generally entitles its holders to the same economic and voting rights in Artisan Partners Holdings as each other class of common units, except that the Class E common units have no voting rights except as required by law. | ||||
12
Available Information
Our principal executive offices are located at 875 E. Wisconsin Avenue, Suite 800, Milwaukee, Wisconsin 53202. Our telephone number at this address is (414) 390-6100 and our website address is www.artisanpartners.com. We make available free of charge through our website all of the materials we file with or furnish withto the SEC as soon as reasonably practicable after we electronically file such material with, or furnish such materials withit to, the SEC. Information contained on our website is not part of, nor is it incorporated by reference into, this Form 10-K. The company was incorporated in Wisconsin on March 21, 2011 and converted to a Delaware corporation on October 29, 2012.
13
Table of the materials we file with the SEC at the SEC’s Public Reference Room at 100 F Street, NE, Washington, DC 20549. Information on the operation of the Public Reference Room may be obtained by calling the SEC at 1-800-SEC-0330. The SEC also maintains an Internet site that contains reports, proxies and information statements, and other information regarding issuers that file electronically with the SEC at www.sec.gov.Contents
Item 1A. Risk Factors
Risks Related to our Business
The loss of key investment professionals or senior members of our seniordistribution and management teamteams could have a material adverse effect on our business. In addition, a substantial portion of our total assets under management is in six of our strategies, several of which are closed to most new investors and client relationships.
The loss of any of these key professionals could limit our ability to successfully execute our business strategy and may prevent us from sustaining the historically strong investment performance we have achieved or adversely affect our ability to retain existing and attract new client assets and related revenues.
Any of our investment or managementkey professionals may resign at any time, join our competitors or form a competing company. Although many of our portfolio managers and each of our named executive officers are subject to post-employment non-compete obligations, these non-competition provisions may not be enforceable or may not be enforceable to their full extent. In addition, we may agree to waive non-competition provisions or other restrictive covenants applicable to former investment or managementkey professionals in light of the circumstances surrounding their relationship with us. We do not carry “key man” insurance that would provide us with proceeds in the event of the death or disability of any of the key members of our investment or management teams.
Changes to our management structure, corporate culture and corporate governance arrangements could also negatively impact our ability to retain key personnel.
Attracting, developing and retaining talented investment professionals is an essential component of our business strategy. To do so, it is critical that we continue to foster an environment and provide compensation that is attractive for our existing investment professionals and for prospective investment professionals. If we are unsuccessful in maintaining such an environment (for instance, because of changes in management structure, corporate culture, corporate governance arrangements, or applicable laws and regulations) or compensation levels or structures for any reason, our existing investment professionals may leave our firm or fail to produce their best work on a consistent, long-term basis and/or we may be unsuccessful in attracting talented new investment professionals, any of which could negatively impact the performance of our investment strategies, our financial results and our ability to grow.
Over our firm’s history we have sought to successfully design and implement compensation structures that align our investment professionals’ economic interests with those of our clients, investors partners, and shareholders.stockholders. We believe our historical structures have been important to our long-term growth and that objective, predictable, and transparent structures work best to incentivize investment professionals to perform over the long-term.
With respect to cash compensation,asset-based revenues, we use a single revenue share arrangement across all of our investment teams. Under the revenue share, each team shares a bonus pool consisting of 25% of the asset-based revenues earned by the strategies managed by the respective team. The revenue share directly links the majority of the investment teams’ cash compensation to long-term growth in revenues, which, over the long-term, we believe is primarily linked to investment performance. The asset-based revenue share is objective, predictable, transparent, and the same for all teams.
In addition, each team is generally entitled to a share of performance-based revenues earned by the strategies managed by the team. In the future, we expect that performance fees will represent a higher proportion of our total revenues, as some of our new products will use performance fees, while only a few of our separate accounts use performance fees today. We expect to design and implement new or modified compensation arrangements with respect to performance fee revenues. We do not expect that these new or modified compensation arrangements will have a significant impact on any of our existing arrangements, including the revenue share described above. However, the design and implementation of these new arrangements could cause instability within our existing investment teams and/or impact our ability to attract and retain new investment talent. These arrangements could also negatively impact the amount of profits that we recognize with respect to performance fee revenues, as compared to the asset-based revenues we earn today.
Over our firm’s history we have used a variety of equity incentives to align the long-term interests of our investment professionals and other senior personnel with the interests of our clients, investors, partners and shareholders. Untilstockholders. Prior to our IPO in 2013, firm equity awards were in the formconsisted of partnership profits interests, which entitled recipients to a percentage of future profits and future appreciation in the value of the firm.interests. Award recipients had the right to cash out their profits interests only after the end of their careers, and 50% of the awards were subject to forfeiture if the recipient left Artisan without proper notice or was terminated. Prior to the IPO Reorganization, the profits interests were converted into partnership units and, as part of the IPO Reorganization, the 50% forfeiture feature was eliminated and employee-partners were given the right to liquidate a portion of their partnership units during each year that they remained employed withby Artisan. At the time of
Since our IPO, the partnership units held by employee-partners represented 53% of the ownership interests inequity we’ve awarded to our firm. At the time of this report, the partnership units held by employee-partners represented approximately 16% of the ownership interests in our firm.
14
In 2014,2021 we made our first award of franchise capital awards to investment professionals. We designed franchise capital awards as we continuedan added feature to evolve our equity incentives, we introduced Career Shares, whichlong-term incentive award program to enhance the alignment between our investment professionals and clients, and to provide investment professionals with greater control over their long-term economic outcome. Franchise capital awards are restricted stockcash awards that in general, remainare subject to the same long-term vesting and forfeiture untilprovisions as the recipient’s qualifying retirement from Artisan. In general, since 2014, excluding sign-onrestricted share-based awards described above. Prior to vesting, though, the franchise capital awards will generally be invested in one or walk away awards, approximately 50%more of the awards we have made to our senior employees have been Career Shares, and the other 50% Standard Restricted Shares. Unlike our pre-IPO profits interests, the APAM restricted stock awards are “full value” awards (as opposed to “option-style” awards) and the Standard Restricted Shares provide recipients with liquidity prior to the end of their careers. The percentage ownership in our firm representedinvestment strategies managed by the newly granted restricted stock each year is less than the percentage ownership represented by the partnership units that employee-partners may exchange and sell each year. Therefore, the amount of our firm owned by employees, including our portfolio managers, is expected to continue to decline.award recipient’s investment team.
As we have since our founding, we continue to assess the effectiveness of our compensation arrangements and equity structures in aligning the long-term interests of our investment professionals with those of our clients, investors partners, and shareholdersstockholders and whether different, types of, or modified, awards or structures would enhance incentives for long-term growth and succession planning. The design and implementation of new or modified compensation arrangements and equity structures is complicated. We will only pursue changes that we believe will improve the alignment between our most important investment talent and our clients, investors, partners, and shareholders.
The performance of our investment strategies is critical in retaining existing client assets as well asand in attracting new client assets. If our investment strategies perform poorly for any reason, our earnings could decline because:
Our investment strategies can perform poorly for a number of reasons, including general market conditions; investor sentiment about market and economic conditions; investment styles and philosophies; investment decisions; the performance of the companies in which our investment strategies invest and the currencies in which those investmentinvestments are made; the liquidity of securities or instruments in which our investment strategies invest; and our inability to identify sufficient appropriate investment opportunities for existing and new client assets on a timely basis. In addition, while we seek to deliver long-term value to our clients, volatility may lead to under-performanceunder performance in the near term, which could adversely affect our results of operations.
In contrast, when our strategies experience strong results relative to the market, clients’ allocations to our strategies typically increase relative to their other investments and we sometimes experience withdrawals as our clients rebalance their investments to fit their asset allocation preferences despite our strong results.
While clients do not have legal recourse against us solely on the basis of poor investment results, if our investment strategies perform poorly, we are more likely to become subject to litigation brought by dissatisfied clients. In addition, to the extent clients are successful in claiming that their losses resulted from fraud, negligence, willful misconduct, breach of contract or other similar misconduct, these clients may have remedies against us, the mutual funds and other funds we advise and/or our investment professionals under various U.S. and non-U.S. laws.
Difficult market conditions can adversely affect our business in many ways, including by reducing the value of our assets under management and causing clients to withdraw funds, each of which could materially reduce our revenues and adversely affectimpact our financial condition.
Difficult market conditions may cause investors in the mutual funds we advise to redeem their investments in those funds which they can do at any time and without prior notice. Our separate accounts clients may also reduce the aggregate amount of assets under management with us with minimal or no notice for any reason, including due to declining financial market conditions. In addition, the prices of the securities held in the portfolios we manage may decline for any number of reasons beyond our control, including, among others, a declining market, general economic downturn, political uncertainty, natural disasters, acts of terrorism, or other unpredictable events such as a global pandemic.
In connection with the severe market dislocations of 2008 and 2009, for example, the value of our assets under management declined substantially due primarily to the sizable decline in stock prices worldwide. In the period from June 30, 2008 through March 31, 2009, our assets under management decreased by approximately 43%, primarily as a result of general market conditions. More recently, during the first quarter of 2020, AUM levels fell from $125.4 billion on February 19, 2020 to $95.2 billion on March 31, 2020, as a result of sharp global equity market declines related to the COVID-19 pandemic.
The fees we earn under our investment management agreements are typically based on the market value of our assets under management, and to a much lesser extent based directly on investment performance. Investors in the mutual funds we advise can redeem their investments in those funds at any time without prior notice and our clients may reduce the aggregate amount of assets under management with us with minimal or no notice for any reason, including financialIf difficult market conditions, and the absolute or relative investment performance we achieve for our clients. In addition, the prices of the securities held in the portfolios we manage may decline duehowever caused, lead to any number of factors beyond our control, including, among others, a declining market, general economic downturn, political uncertainty or acts of terrorism. In connection with the severe market dislocations of 2008 and 2009, for example, the value of our assets under management declined substantially due primarily to the sizeable decline in stock prices worldwide. In the period from June 30, 2008 through March 31, 2009, our assets under management decreased by approximately 43%, primarily as a result of general market conditions.
15
Table of December 31, 2007 to $115.5 billion as of December 31, 2017. The absolute measure of our assets under management represents a significant rate of growth that has been and may continue to be difficult to sustain. For instance, between June 30, 2014, and December 31, 2016, our assets under management declined from $112.0 billion to $96.8 billion. The continued long-term growth of our business will depend on, among other things, retaining key investment professionals, attracting and recruiting new investment professionals, maintaining existing investment strategies and selectively developing new, value-added investment strategies. Our business growth will also depend on our success in achieving superior investment performance from our investment strategies, as well as our ability to maintain and extend our distribution capabilities, to deal with changing market conditions, to maintain adequate financial and business controls and to comply with new legal and regulatory requirements arising in response to both the increased sophistication of the investment management industry and the significant market and economic events of the last decade. We may not be able to manage our growing business effectively or be able to sustain the level of long-term growth we have achieved historically.Contents
Our efforts to establish and develop new teams and strategies may face challenges or ultimately be unsuccessful, which would likely negativelycould impact our results of operations, and could negatively impact our reputation and culture.
We seek to addrecruit new investment teams that invest in a way that is consistent with our philosophy of offeringmanage high value-added investment strategies and would allow us to grow strategically. We also look to offerdevelop new, differentiated strategies managed by our existing teams. We expect the costs associated with establishing a new team and/or strategy to initially to exceed the revenues generated, which will likely negatively impact our results of operations. New strategies, whether managed by a new team or by an existing team may invest in instruments (such as certain types of derivatives)make investments or present operational, (including legal, and regulatory)regulatory, or distribution-related issues and risks with which we have little or no experience.not yet encountered. Our lack of experience could strain our resources and increase the likelihood of an error or failure. The establishment of new teams and/or strategies (in particular, alternative investment teams or strategies) may also cause us to depart from our traditional compensation and economic model, which could reduce our profitability and harm our firm’s culture.
We generally support the development of new strategies by making one or more seed investments using capital that would otherwise be available for our general corporate purposes. Making such seed investments exposes us to capital losses.
Failure to properly address conflicts of interest could harm our reputation or cause clients to withdraw funds, each of which could adversely affect our business and results of operations.
The SEC and other regulators have increased their scrutiny ofcontinued to focus on potential conflicts of interest and weour fiduciary duties as an adviser. We have implemented procedures and controls that we believe are reasonably designed to address these issues. However, appropriately dealing with conflicts of interest is complex and if we fail, or appear to fail, to deal appropriately with conflicts of interest, we could face reputational damage, litigation or regulatory proceedings or penalties, any of which may adversely affect our results of operations.
revenue and impact our financial condition.
Several of our investment strategies invest principally in the securities of non-U.S. companies, which involve foreign currency exchange, tax, political, social and economic uncertainties and risks.
As of December 31, 2017,2021, approximately 54%51% of our assets under management were invested in strategies that primarily invest in securities of non-U.S. companies. In addition, someSome of our other strategies also invest on a more limited basis in securities of non-U.S. companies. Approximately 47%45% of our assets under management were invested in securities denominated in currencies other than the U.S. dollar. Fluctuations in foreign currency exchange rates could negatively affect the returns of our clients who are invested in these strategies. In addition, an increase in the value of the U.S. dollar relative to non-U.S. currencies is likely to result in a decrease in the U.S. dollar value of our assets under management, which, in turn, would likely result in lower revenue and profits. See “Qualitative and Quantitative Disclosures Regarding Market Risk-Exchange Rate Risk” in Item 7A of this report for more information about exchange rate risk.
Investments in non-U.S. issuers may also be affected by tax positions taken in countries or regions in which we are invested as well as political, social and economic uncertainty. Declining tax revenues may cause governments to assert their ability to tax the local gains and/or income of foreign investors, (including our clients), which could adversely affect clients’ interests in investing outside their home markets. Many financial markets are not as developed, or as efficient, as the U.S. financial markets and, as a result, those markets may have limited liquidity and higher price volatility, and may lack established regulations.
Liquidity may also be adversely affected by political or economic events, government policies, and social or civil unrest within a particular country, and ourcountry. Our ability to dispose of an investment may also be adversely affected if we increase the size of our investmentsholdings in smaller non-U.S. issuers. Non-U.S. legal and regulatory environments, including financial accounting standards and practices, may also be different, and there may be less publicly available information about such companies. These risks could adversely affect the performance of our strategies that are invested in securities of non-U.S. issuers and may be particularly acute in the emerging or less developed markets in which we invest. In addition to our existing Sustainable Emerging Markets and Developing World strategies, a numberwe expect to launch three new emerging markets debt strategies in 2022. And several of our other investment strategies are permitted to invest, and do invest, in emerging or less developed markets.markets to a more limited extent.
16
We may not be able to maintain our current fee rates as a result of poor investment performance, competitive pressures, as a result of changes in our business mix or for other reasons, which could have a material adverse effect on our profit margins and results of operations.
We may not be able to maintain our current fee rates for any number of reasons, including as a result of poor investment performance, competitive pressures, changes in global markets and asset classes, or as a result of changes in our business mix. Although our investment management fees vary by client and investment strategy, we historically have been successful in maintaining an attractive overall rate of fee and profit margin due to the strength of our investment performance and our focus on high value-added investment strategies. In recent years, however, there has been a general trend toward lower fees in the investment management industry as a result of competition and regulatory and legal pressures. Some of our investment strategies that tend to invest in larger-capitalization companies and were designed to have larger capacity have lower fee schedules. In order to maintain our fee structure in a competitive environment, we must retain the ability to decline additional assets to manage from potential clients who demand lower fees even though our revenues may be adversely affected in the short term. In addition, we must be able to continue to provide clients with investment returns and service that our clients believe justify our fees.
The investment management agreements pursuant to which we advise mutual funds are terminable on short notice and, after an initial term, are subject to an annual process of review and renewal by the funds’ boards. As part of that annual review process, the fund board considers, among other things, the level of compensation that the fund has been paying us for our services. That process may result in the renegotiation of our fee structure or an increase in the cost of ourthe performance of our obligations. Any fee reductions on existing or future new business could have an adverse effect on our profit margins and results of operations.
We derive substantially all of our revenues from contracts and relationships that may be terminated upon short or no notice.
We derive substantially all of our revenues from investment advisory and sub-advisory agreements, all of which are terminable by clients upon short notice or no notice. Our investment management agreements with mutual funds, as required by law, are generally terminable by the funds’ boards or a vote of a majority of the funds’ outstanding voting securities on not more than 60 days’ written notice. After an initial term, each fund’s investment management agreement must be approved and renewed annually by that fund’s board, including by its independent members. In addition, all of our separate account clientsaccounts and some of the mutual funds that we sub-advise have the ability to re-allocate all or any portion of the assets that we manage away from us at any time with little or no notice. These investment management agreements and client relationships may be terminated or not renewed for any number of reasons. The decrease in revenues that could result from the termination of a material client relationship or groupthe re-allocation of client relationshipsassets away from us could have a material adverse effect on our business.
Investors in many of the pooled vehicles that we advise can redeem their investments in those funds at any time without prior notice or with fairly limited notice, which would reduce our assets under management and could adversely affect our earnings.
Investors in the mutual funds, UCITS funds, and some other pooled investment vehicles that we advise or sub-advise may redeem their investments in those funds at any time without prior notice and investorsnotice. Investors in certain other types of pooledpool vehicles we advise or sub-advise may typically redeem their investments onwith fairly limited or no prior notice, thereby reducing our assets under management.notice. These investors may redeem for any number of reasons, including general financial market conditions, the absolute or relative investment performance we have achieved, or their own financial condition and requirements. In a declining stock market, the pace of redemptions could accelerate. Poor investment performance relative to other funds tends to result in decreased purchasesThese redemptions would reduce our assets under management and increased redemptions of fund shares. For the year ended December 31, 2017, we generated approximately 80% of our revenues from advising mutual funds and other pooled vehicles (including Artisan Funds, Artisan Global Funds, and other entities for which we are adviser or sub-adviser), and the redemption of investments in those funds would adversely affect our revenues and could have a material adverse effect on our earnings.revenues.
We depend on third parties to market our investment strategies.
Our ability to attract additional assets to manage is highly dependent on our access to third-party intermediaries. We gain access to investors in Artisan Funds primarily through consultants, 401(k) platforms, mutual fund platforms, broker-dealers and financial advisors through which shares of the funds are sold. We have relationships with some third-party intermediaries through which we access clients in multiple distribution channels. Our two largest intermediary relationships across multiple distribution channels represented approximately 9% and 8%7% of our total assets under management as of December 31, 2017. 2021.
17
We compensate most of the intermediaries through which we gain access to investors in Artisan Funds by paying fees, most of which are a percentage of assets invested in Artisan Funds through that intermediary and with respect to which that intermediary provides shareholder and administrative services. The allocation of such fees between us and Artisan Funds is determined by the board of Artisan Funds,Funds’ board, based on information and a recommendation from us, with the goal of allocating to us, at a minimum, all costs attributable to marketing and distribution of shares of Artisan Funds.
In the future, our expenses in connection with those intermediary relationships could increase if the portion of those fees determined to be in connection with marketing and distribution, or otherwise allocated to us or payable by us, increased.
Industry pressure to increase transparency and reduce or eliminate inducements for distribution has impacted intermediaries’ business models and the manner in which they charge fees. If intermediaries continue to see reduced revenue from funds, we may see additional requests from intermediaries for alternative forms of compensation. To date, requests for such alternative forms of compensation have not had a material impact on us, but they could over time. Clients of these intermediaries may not continue to be accessible to us on terms we consider commercially reasonable, or at all. The absence of such access could have a material adverse effect on our results of operations.
We access institutional clients primarily through consultants. Ourconsultants upon whose referrals our institutional business is highly dependent upon referrals from consultants. Many of thesedependent. These consultants review and evaluate our products and our firm from time to time. As of December 31, 2017,2021, the investment consultant advising the largest portion of our assets under management represented approximately 9%5% of our total assets under management. Poor reviews or evaluations of eitherus or a particular strategy or us as an investment management firm may result in client withdrawals or may impair our ability to attract new assets through these intermediaries.consultants.
Our failure to comply with clients’ investment guidelines set by our clients, including the boards of funds, and limitations imposed by applicable law,legal limitations could result in damage awards against us and a loss of our assets under management, either of which could adversely affect our results of operations or financial condition.
When clients retain us to manage assets on their behalf, they generally specify certain guidelines regarding investment allocation and strategyguidelines that we are required to follow in managing their portfolios. The boardsIn addition, some of funds we manage generally establish similar guidelines regardingour clients are subject to laws that impose restrictions and limitations on the investment of assets in those funds. In general, over the long-term, we have experienced an increase in client-imposed guidelines. We are also required to investtheir assets. For example, U.S. mutual funds’fund assets that we manage must be invested in accordance with limitations under the 1940 Act and applicable provisions of the Internal Revenue Code of 1986, as amended, or the Internal Revenue Code. Other clients, such as plans subject to the Employee Retirement Income Security Act of 1974, as amended, or ERISA, or non-U.S. clients, require us to invest their assets in accordance with applicable law.amended. Our failure to comply with any of these guidelines and other limitations could result in losses to clients or fund investors in a fund which, depending on the circumstances, could result in our obligation to reimburse clients or fund investors for such losses. If we believed that the circumstances did not justify a reimbursement, or clients and investors believed the reimbursement we offered was insufficient, they could seek to recover damages from us or could withdraw assets from our management or terminate their investment management agreement with us. Any of these events could harm our reputation and adversely affect our business.
18
Operational risks may disrupt our business, result in losses, damage our reputation or limit our growth.
We are heavily dependent on the capacity and reliability of the communications and information and technology systems supporting our operations, whether developed, owned and operated by us or by third parties. We also rely on manual workflows and a variety of manual user controls. As our clients, physical locations and investment teams and strategies increase in number and grow in complexity, and as our employees become increasingly mobile, developing and maintaining the systems supporting our operations becomes increasingly challenging. Any changes, upgrades or expansions to our systems to support increased volumes or complexity of transactions or to otherwise support growth of the business may require significant expenditures and may increase the probability that we will experience operational errors. Operational risks such as trading or other operational errors or interruption or failure of our financial, accounting, trading, compliance and other data processing systems, whether caused by human error, fire, other natural disaster or pandemic, power or telecommunications failure, cyber-attack, ransomware or viruses, natural disaster, fire, act of terrorism or war, public health crisis or otherwise, could result in a disruption of our business, liability to clients, regulatory intervention or reputational damage, and thus materially adversely affect our business. Although we have back-up systems and a business continuity plan in place, these arrangements may not be adequate in the event of a significant interruption or failure of the systems or operations that are critical to our business. The potential for some types of operational risks, including for example, trading errors, may be increasedincrease in periods of increased volatility, which can magnify the cost of an error. Although we have not suffered material operational errors, including material trading errors, in the past, we may experience such errors in the future, the losses related to which we would absorb. Insurance and other safeguards might not be available or might only partially reimburse us for our losses.
We depend substantially on our Milwaukee, Wisconsin offices, where a majority of our employees, administration and technology resources are located, for the continued operation of our business. Any significant disruption to those offices could have a material adverse effect on us. We also dependrely on a number of key vendors for trading, middle- and back-office functions, various fund administration, accounting, custody and transfer agent roles and other operational needs. These key vendors may themselves rely on third party service providers to support their own operations. The failure of any key vendor, or of any service provider to a key vendor, to fulfill its obligations, for any reason, could cause operational issues that could lead to legal liability, regulatory issues, reputational harm and financial losses.
Any significant limitation, failure or security breach of the information security infrastructure, software applications, or other systems that are critical to our operations could disrupt our business, damage our reputation, and result in financial losses for us and/or our clients.
We are heavily reliant upon internal and third party technology systems, networks and networksapplications to view, process, transmit and store information, including sensitive client and proprietary information, and to conduct many of our business activities and transactions with our clients, vendors/service providers (collectively, “vendors”)vendors and other third parties. In addition, in recent years we have increased our use of and reliance on mobile and cloud technologies, including the complete migration of our information technology infrastructure to Amazon Web Service. Maintaining the integrity of these systems, networks and networkstechnologies is critical to the success of our business operations. We take measures to protect our proprietary information and our clients’ information pursuant to our internal policies and data protection regulations to which we’re subject. We rely on our (and our vendors’) information and cybersecurity infrastructure, policies, procedures and capabilities to protect thosethese systems, networks and applications and the data that reside on or are transmitted through them. We maintain a system of internal controls designed to provide reasonable assurance that fraudulent activity, including misappropriation of assets, fraudulent financial reporting, and unauthorized access to sensitive or confidential data is either prevented or detected in a timely manner.
Despite the measures we have taken and may in the future take to address and mitigate cybersecurity and other technology risks, we cannot guarantee that our systems, networks and networksapplications, and those of third parties on whom we rely, will not be subject to disruptions, system failures or outages, unauthorized access, ransomware, breaches or other interference. In particular, althoughFor example, in connection with the information released in December 2021 regarding the Log4j vulnerability, we take precautionspromptly assessed and updated our affected systems and contacted key vendors and service providers. We put in place additional protections to password protectward off threats related to the vulnerability and, encryptas of the date of this filing, are not aware of any significant impact to us. We remain, however, reliant upon the information provided to us by our mobile electronic devices, if such devices are stolen or misplaced,key vendors and service providers regarding any potential indirect impact by virtue of the services they may become vulnerable to hacking or other unauthorized use, creating a possibleprovide.
Cybersecurity and information security risk. Any such eventevents may result in operational disruptions as well as unauthorized access to or the disclosure, corruption or loss of our proprietary information or our clients’ or employees’ information, which in turn may result in legal claims, regulatory scrutiny and liability, reputational damage, the incurrence of costs to eliminate or mitigate further exposure, or the loss of clients or other damage to our business. In addition, the trend toward broad consumer and generalany required public notification of such incidents could exacerbate the harm to our business, financial condition or results of operations. Even if we successfully protect our technology infrastructure and the confidentiality of sensitive data, we may incur significant expensesexpense in connection with our responsesresponse to any such attacks and the adoption and maintenance of additional appropriate security measures. Although we maintain insurance to mitigate the expense associated with a potential incident, the damage or claims arising from an incident may not be covered or may exceed the amount of any insurance available. We cannot be certain that future advances in criminal capabilities, the discovery of new vulnerabilities attempts to exploit vulnerabilities in our or our vendors’ systems, data thefts, physical system or network break-ins or inappropriate access, or other developments will not compromise or breach the technology or other security measures protecting the networks, systems and systemsapplications we use.
19
Our newest investment strategies and strategies we may establish in the future present certain investment, operational, distribution and other risks that are different in kind and/or degree from those presented by our earlier investment strategies and we have less experiencedealing with those risks.
Our newest investment strategies have the ability to operate a fixed income strategy, including infrastructure and systems for trading and valuing fixed income securities and other credit instruments. Prior to the launch of the strategy, we had not operated a fixed income strategy. During 2017, we established our second fixed income strategy, a privately offered strategy. The fixed income strategies primarily invest in securities and instruments (such as high yield corporate bonds, secured and unsecured loans, revolving credit facilities and loan participations) and certain derivative securities (such as credit default swaps and futures) with which we previously had no or limited operational experience. The below-investment-grade instruments in which the strategies invest and the debtors to which the strategies are exposedmake investments that present different risks and/or degrees of risk (including liquidity and legal risks) than our other strategies, which invest primarily in publicly-tradedpublicly traded equity securities. In particular, the instruments in which theFor example, several of our newest strategies invest in securities that are not publicly traded. We may be less liquid than higher-rated bondsprohibited from selling these investments for a period of time and are not as liquid as most of the publicly-traded equitygenerally will be unable to sell these securities in which our other strategies primarily invest. This potential lack of liquidity may make itpublicly unless their sale is registered under applicable securities law or unless an exemption from such registration is available. Illiquid securities are more difficult for Artisan High Income Fund to accurately value these securities for purposesand dispose of determining the fund’s net asset value per sharewhen desired and, under certain circumstances, may make it more difficult for the fund to manage investors’ redemption requests. In order to identify, monitorOur newer strategies, and mitigate our exposure to these new or increased risks,strategies we have implemented or modified a number of policies, procedures and systems and hired new individuals with relevant experience. However, neither the measures we have taken, nor the Credit team’s investment decision-making and execution, can eliminate the risks associated with investingmay offer in the instruments described above. Any real or perceived problems with respect to our fixed income strategies (or any of our individual strategies) could negatively impact our reputation and business more generally.
Several of our newest investment strategies are primarily offered through private funds, which present operational, regulatory and distribution-related risks that are different than those associated with the mutual funds and traditional separate accounts through which we offer our earlier investment strategies. In the future, we expect to offer new investment strategies through closed-end funds with a commitment-based structure. Closed-end funds present different types of operational, regulatory and distribution-related risks with which we previously hadhave little to no or limited operational experience. These instruments and activities present different types and higher degreesThe complexity of investment risk than our other investment strategies. In addition, our lack of experience with these instruments and activitiesvehicles could strain our resources and increase the likelihood of an error.
real or perceived problems, which could damage our reputation or result in regulatory scrutiny or legal liability.
Offering private funds also poses risks associated with side by side management and the potential for real or perceived conflicts of interest, which, if not managed correctly, could cause reputational damage, litigationharm, regulatory scrutiny or regulatory proceedings or penalties. Welitigation. Although we have created or modified a number ofestablished policies and procedures brought in expertise from third party advisers, and implemented training programs in order to identify and mitigate exposure to these new risks. However,manage potential conflicts of interest, we are unable to completely eliminate the risks associated with offering private funds. Newthese risks.
Our newer investment strategies and investment vehicles, and those that we launchestablish in the future, will likely present newmay have more limited capacity than our earlier large capacity investment strategies. Despite the limited capacity, these newer strategies with broader degrees of freedom may require increased access to specialized technology, market data with advanced data analytic capabilities, and differentoperational resources, including bespoke operational solutions and third-party service providers. Requests for resources that are disproportionate to the size of the investment regulatory, operational, distributionteam may put pressure on our resource allocation model and cause friction and instability among the teams. Friction among investment teams may also occur if these newer strategies with broader degrees of freedom take action or make investments that ultimately impact the ability of our other risks than those presented byinvestment teams to invest in a manner consistent with their philosophy and process. Friction and distraction within our investment teams may cause our existing strategies. Any realinvestment professionals to leave our firm or perceived problems with futurefail to produce their best work on a consistent, long-term basis and/or we may be unsuccessful in attracting talented new investment professionals, any of which could negatively impact the performance of our investment strategies, or vehicles could cause a disproportionate negative impact on our businessfinancial results and reputation.our ability to grow.
Employee misconduct, or perceived misconduct, could expose us to significant legal liability and/or reputational harm.
We are vulnerable to reputational harm because we operate in an industry in which integrity and the confidence of our clients are of critical importance. Our employees, or third parties with whom we are affiliated, could engage in misconduct, (such as fraud or unauthorized trading), or perceived misconduct, that adversely affects our business. For example, if an employee were to engage in illegal or suspicious activities, we could be subject to regulatory sanctions and suffer serious harm to our reputation (as a consequence of the negative perception resulting from such activities), financial position, client relationships and ability to attract new clients. Our business often requires that we deal with confidential information. If our employees were to improperly use or disclose this information, even if inadvertently we could suffer serious harm to our reputation, financial position and current and future business relationships. It is not always possible to deter employee misconduct and the precautions we take to detectprevent and preventdetect this activity may not always be effective. Misconduct or perceived misconduct by our employees, or even unsubstantiated allegations of such conduct, could resultcause serious damage to our reputation, resulting in significant legal liability and/orthe loss of clients and an adverse effect on our reputationrevenues. Employee misconduct could also subject us to regulatory scrutiny and our business.legal liability.
If our techniques for managing risk are ineffective, we may be exposed to material unanticipated losses.
In order to manage the significant risks inherent in our business, we must maintain effective policies, procedures and systems that enable us to identify, monitor and mitigate our exposure to operational, legal and reputational risks. Our risk management methods may prove to be ineffective due to their design or implementation, or as a result of thea lack of adequate, accurate or timely information or otherwise. If our risk management efforts are ineffective, we could suffer losses that could have a material adverse effect on our operating results or financial condition or operating results.condition. Additionally, we could be subject to litigation, particularly from our clients or investors, and sanctions or fines from regulators.
20
Our indebtedness may expose us to material risks.
Our Series C, Series D and Series DE notes bear interest at a rate equal to 5.32%5.82%, 5.82%4.29%, and 4.29%4.53% per annum, respectively,respectively. On December 7, 2021, Artisan Partners Holdings entered into a Note Purchase Agreement to issue $90 million of Series F senior notes in a private placement transaction on August 16, 2022, subject to the satisfaction of certain customary closing conditions. All of the proceeds from the issuance of the Series F senior notes will be used to repay the Series C senior notes, which mature on August 16, 2022. The Series F senior notes will bear interest at a rate of 3.10% and will mature on August 16, 2032. The interest rate on each rateof the notes is subject to a 100 basis point increase in the event Artisan Partners Holdings receives a below-investment grade rating. Each series requires a balloon payment at maturity. Any substantial decrease in net operating cash flows or any substantial increase in expenses could make it difficult for us to meet our debt service requirements or force us to modify our operations. Our ability to repay the principal amount of our notes or any outstanding loans under our revolving credit agreement, to refinance our debt or to obtain additional financing through debt or the sale of additional equity securities will depend on our performance, as well as financial, business and other general economic factors affecting the credit and equity markets generally or our business in particular, many of which are beyond our control. Any such alternatives may not be available to us on satisfactory terms or at all.
Our note purchase agreements and revolving credit agreement contain, and our future indebtedness may contain, various covenants that may limit our business activities.
Our note purchase agreements and revolving credit agreement contain financial and operating covenants that limit our business activities, including restrictions on our ability to incur additional indebtedness and pay dividends to our stockholders. For example, the agreements include financial covenants requiring Artisan Partners Holdings not to exceed specified ratios of indebtedness to consolidated earnings before interest, taxes, depreciation and amortization (as defined in the agreements), or EBITDA, and interest expense to consolidated EBITDA. The agreements also restrict Artisan Partners Holdings from making distributions to its partners (including us), other than tax distributions or distributions to fund our ordinary expenses, if a default (as defined in the respective agreements) has occurred and is continuing or would result from such a distribution. In addition, if Artisan’sour average assets under management for a fiscal quarter isfalls below $45 billion, Holdings iswill generally be required to offer to pre-pay the unsecured notes. The failureFailure to comply with any of these restrictions could result in an event of default, giving our lenders the ability to accelerate repayment of our obligations. As of December 31, 2017,2021, we believe we are in compliance with all of the covenants and other requirements set forth in the agreements.
We provide a range of services to Artisan Funds, Artisan Global Funds, Artisan sponsored private fundsPrivate Funds and sub-advised funds which may expose us to liability.
We provide a broad range of administrative services to Artisan Funds, including providing personnel to Artisan Funds to serve as a directordirectors and as officers of Artisan Funds and to serve on the valuation and liquidity committee of Artisan Funds, the preparationFunds. We prepare or supervision ofsupervise the preparation of Artisan Funds’ regulatory filings maintenance of board calendars and preparation or supervision of the preparation of board meeting materials, management offinancial statements, and manage compliance and regulatory matters, provision ofmatters. We provide shareholder services, and communications, accounting services including the supervision of the activities of Artisan Funds’ accounting services provider in the calculation of the funds’ net asset values, supervision of the preparation of Artisan Funds’ financial statements and coordination of the audits of those financial statements, tax services including calculation of dividend and distribution amountsamounts. We also coordinate the audits of financial statements and supervision ofsupervise tax return preparation, and supervision of the work of Artisan Funds’ other service providers.preparation. Although less extensive than the range of services we provide to Artisan Funds, we also provide a range of similar services, in addition to investment management services to Artisan Global Funds and Artisan sponsored private funds, including personnel to serve as directors.
Private Funds. In addition, we from time to time we provide information to theother funds for which we act as sub-adviseradvise (or to a person oran entity providing administrative services to such a fund) which ismay be used by those funds in their efforts to comply with various regulatory requirements. If
The services we provide to Artisan Funds, Artisan Global Funds, Artisan Private Funds, and other funds we advise may expose us to liability. For example, if we make a mistake in the provision of thosesuch services, Artisan Funds, Artisan Global Funds, Artisan sponsored private funds, or the sub-adviseda fund could incur costs for which we might be liable. In addition, ifIf it were determined that Artisan Funds, Artisan Global Funds, Artisan sponsored private funds, or a sub-advised fund failed to comply with applicable regulatory requirements as a result of our action or our employees’ failure to act, by our employees, we could be responsible for losses suffered or penalties imposed. In addition, we could have penalties imposed on us, be required to pay fines or be subject to private litigation, any of which could decrease our future income or negatively affect our current business or our future growth prospects.
The expansion of our business inside and outside of the United States raises tax and regulatory risks, may adversely affect our profit margins and places additional demands on our resources and employees.
We have expanded and continue to expand our distribution efforts into non-U.S. markets, including the United Kingdom, other European countries, Canada, Australia and certain Asian countries, among others. We organized and serve as investment managermarkets. The number of Artisan Global Funds, a family of Ireland-based UCITS funds, that began operations during the first quarter of 2011. Our client relationships outside the United States haveU.S. has grown from 32 as of December 31, 2012 to 128226 as of December 31, 2017. Clients outside2021. Costs related to our distribution efforts in non-U.S. markets have often been more expensive than comparable costs in the United StatesU.S. Our non-U.S. clients may be adversely affected by political, socialaccustomed to certain practices that differ from and economic uncertainty in their respective home countries and regions, which could result in a decreasemay conflict with practices that are customary in the net client cash flows that come fromU.S. such clients. These clients also may be less accepting of the U.S. practice of paymentas, for certain research products and services through soft dollars or such practices may not be permissible in some jurisdictions. The Markets in Financial Instruments Directive II (“MiFID II”), effective on January 3, 2018, regulatesexample, the use of soft dollars to pay for research products and services. Such conflicting practices add complexity and risk to our non-U.S. client relationships.
21
While a majority of our operations take place in the U.S., we do maintain offices in a number of other soft dollar services. MiFID II’s soft dollar rulescountries including the U.K., Ireland, Singapore, Australia and Hong Kong. Operating our business in non-U.S. markets is generally more expensive than in the U.S. Among other expenses, the effective tax rates applicable to our income allocated to some non-U.S. markets may be higher than the effective rates applicable to our income allocated to the U.S. To the extent that our revenues do not directly applyincrease to the same degree our expenses increase in connection with our continuing expansion outside the U.S., our profitability could be adversely affected. Expanding our business becauseinto new markets may also place significant demands on our existing operational infrastructure and on our existing employees.
Regulators in non-U.S. jurisdictions in which we currently conductoperate could change their laws or regulations, or change the way they interpret existing laws and regulations, in a manner that might restrict or otherwise impede our investment management activitiesability to operate in their respective markets. Any such changes could increase the costs we incur in a specific jurisdiction without any corresponding increase in revenues and income from operating in the United States. However,jurisdiction. For example, in response to MiFID IIBrexit, we established an Irish subsidiary regulated by the Central Bank of Ireland to carry out distribution efforts in the EU. Brexit added complexity to our global operations, imposed additional risks and the industry-wide changes it may prompt orresulted in additional legal and compliance costs, without an increase in revenues to offset those costs. Despite those increased costs, we do not currently expect Brexit to have a change inmaterial impact on our operations, we may eventually bear a significant portion or all of the costs of research that are currently paid for using soft dollars, which would increase our operating expenses.business.
Our expansion outside of the United States has required and will continue to require us to incur a number of up-front expenses, including those associated with obtaining and maintaining regulatory approvals and office space, as well as additional ongoing expenses, including those associated with leases, the employment of additional support staff and regulatory compliance. Our U.S.-based employees routinely travel inside and outside the United StatesU.S. as a part of our investment research process, or to market our services and may spend extended periods of time in one or more non-U.S. jurisdictions.to supervise and manage our business. Their activities outsidein the United Statesjurisdictions they travel to on our behalf may raise both tax and regulatory issues. If and to the extent we are incorrect in our analysis of the applicability or impact of state or non-U.S. taxtaxes or regulatory requirements, we could incur costs, penalties or be the subject of an enforcement or other action. Operating our business
Changes in non-U.S. markets is generally more expensive than in the United States. Among other expenses, the effective tax rates applicablelaws or exposure to our income allocated to some non-U.S. markets, which we are likely to earn through an entity
From time to time, we are subject to a variety of reporting requirements underincome and non-income based tax audits in the Sarbanes-Oxley Act of 2002. Sarbanes-Oxley requires, among other things, thatjurisdictions in which we maintain effective internal control over financial reporting. In accordance with Section 404 of Sarbanes-Oxley, our management is required to conduct an annual assessment of the effectivenessoperate. The calculation of our internal control over financial reporting and include a report on these internal controlstax liabilities involves dealing with uncertainties in the annual reports we file with the SEC on Form 10-K. If we are not able to continue to comply with the requirementsapplication of Section 404complex tax rules and regulations in a capable manner,number of jurisdictions. From time to time, tax authorities have disagreed with certain positions we have taken which has resulted in additional taxes and, in certain cases interest payments. In the future, such instances may result in additional taxes, interest, fines and penalties becoming due. We evaluate whether to record tax liabilities for possible tax audit issues based on our estimate of whether, and the extent to which, additional income taxes will be subject to adverse regulatory consequencesdue. We adjust these liabilities in light of changing facts and there could be a negative reaction in the financial marketscircumstances as well as consult with our outside tax advisors. However, due to the complexity of some of these uncertainties, the ultimate resolution may result in a loss of investor confidence in us and the reliability ofpayment that is materially different from our financial statements. This could have a material adverse effect on us.estimates.
A change of control could result in termination of our investment advisory agreements with SEC-registered mutual funds and could trigger consent requirements in our other investment advisory agreements.
Under the U.S. Investment Company Act of 1940, as amended, or the 1940 Act, each of the investment advisory agreements between SEC-registered mutual funds and our subsidiary, Artisan Partners Limited Partnership, will terminate automatically in the event of its assignment, as defined in the 1940 Act.
assignment. Upon the occurrence of such an assignment, our subsidiary could continue to act as adviser to any such fund only if that fund’s board and shareholders approved a new investment advisory agreement, except in the case of certain of the funds that we sub-advise for which only board approval would be necessary. In addition, as required by the U.S. Investment Advisers Act of 1940, as amended, or the Advisers Act, each of the investment advisory agreements for the separate accounts we manage provides that it may not be assigned, as defined in the Advisers Act, without the consent of the client. An assignment occurs under the 1940 Act and the Advisers Act if, among other things, Artisan Partners Limited Partnership undergoes a change of control as recognized under the 1940 Act and the Advisers Act. If such an assignment were to occur, we cannot be certain that we willwould be able to obtain the necessary approvals from the boards and shareholders of the mutual funds we advise or the necessary consents from our separate account clients.
The continued COVID-19 outbreak and spread, and the reaction thereto, has negatively affected the global economy and has disrupted our normal business operations.
Since the first quarter of 2020, the COVID-19 pandemic, together with resulting voluntary and government-imposed actions, has disrupted the global economy and caused significant market fluctuations. Market fluctuations, for any reason, may cause clients to choose to redeem their investments in our strategies (upon short or no notice), as well as increase the likelihood and consequences of trading, valuation, or other operational errors.
The COVID-19 pandemic has also impacted the manner in which we operate as the majority of our associates now maintain a hybrid schedule. In addition, as of the date of this filing, the amount of business travel remains below pre-pandemic levels. We believe we continue to operate well under these changing circumstances. We are benefiting from the flexible and highly mobile operating environment we have built over 25 years. However, we do not know what, if any, longer-term impact the current operating environment will have on our business and results.
22
The COVID-19 pandemic may create risks to us in the future that cannot be foreseen and the adverse effects of such risks may be significant and long-term. As the COVID-19 pandemic continues to evolve, it is not possible to predict the full extent to which the pandemic will adversely impact our business, which will depend on numerous developing factors that remain uncertain and subject to change. The impacts and risks described herein relating to COVID-19 augment the discussion of overlapping risks in our other risk factors, which may be heightened by the COVID-19 pandemic.
Risks Related to our Industry
We are subject to extensive, regulation.complex and sometimes overlapping laws, rules and regulations.
The industry in which we operate is subject to extensive and frequently changing regulation. Political and electoral changes and developments have in the past introduced, and may in the future introduce, additional uncertainty. We are subject to extensive regulation in the United States, primarily at the federal level, including regulation by the SEC, under the 1940 Act and the Advisers Act, by the U.S. Department of Labor, under ERISA, and by the Financial Industry Regulatory Authority, Inc. The U.S. mutual funds we manage are registered with and regulated by the SEC as investment companies under the 1940 Act. We are also subject to regulation in the United Kingdom by the Financial Conduct Authority. The U.K. Financial Conduct Authority imposes a comprehensive system of regulation that is primarily principles-based (compared to the primarily rules-based U.S. regulatory system). The Advisers Act imposes numerous obligations on investment advisers including record keeping, advertising and operating requirements, disclosure obligations and prohibitions on fraudulent activities. The 1940 Act imposes similar obligations, as well as additional detailed operational requirements, on registered investment companies, which must be adhered to by their investment advisers. We have also expanded and continue to expand our distribution effort into non-U.S. markets, including the United Kingdom, other European countries, Canada, Australia and certain Asian countries, among others. The Central Bank of Ireland imposes requirements on UCITS funds subject to regulation by it, as do the regulators in certain other markets in which shares of Artisan Global Funds are offered for sale, and with which we are required to comply with respect to Artisan Global Funds. Certain Artisan sponsored private funds are regulated as mutual funds under the Mutual Funds Law (as amended) of the Cayman Islands, and the Cayman Islands Monetary Authority has supervisory and enforcement powers to ensure the funds’ compliance with the Mutual Funds Law. In the future, we may further expand our business outside of the United States in such a way or to such an extent that we may be required to register with additional foreign regulatory agencies or otherwise comply with additional non-U.S. laws and regulations that do not currently apply to us and with respect to which we do not have compliance experience. Our lack of experience in complying with any such non-U.S. laws and regulations may increase our risk of becoming party to litigation and subject to regulatory actions.
As a result of the extensive and complex regulatory environment in which we operate, we face risk of regulatory actions and litigation, which could consume substantial expenditures of time and capital. Our regulatory and compliance obligations impose significant operational and cost burdens on us and cover a broad range of topics including, investment advisory matters, securities and other financial instruments, financial reporting and other disclosure matters, accounting, tax, data protection, and privacy. As our business expands into new geographic regions and introduces new investment products with expanded degrees of freedom, the regulatory requirements to which we’re subject will increase in number. While we have focused significant attention and resources on the development and maintenance of compliance policies, procedures and practices, any inadvertent non-compliance with applicable laws, andrules or regulations, either in the foreign countries where we invest and/U.S. or where our clients or prospective clients resideabroad, could result in various legal proceedings, including civil litigation and regulatory investigations and enforcement actions that could result in fines, suspensions of personnelindividual employees, or other sanctions. See “Regulatory Environmentlimitations on particular business activities, any of which could have an adverse impact on our reputation and Compliance”.business.
The regulatory environment in which we operate is subject to continual change, and regulatory developments may adversely affect our business.
We operate in a legislative and regulatory environment that is subject to continual change, the nature of which we cannot predict. We may be adversely affected as a result of new or revised legislation or regulations imposed by the SEC, other U.S. or non-U.S. governmental regulatory authorities or self-regulatory organizations that supervise the financial markets. We also may be adversely affected by changes in the interpretation or enforcement of existing laws and rules by these governmental authorities and self-regulatory organizations, as well as by courts. It is impossible to determine the extent of the impact of any new U.S. or non-U.S. laws, regulations or initiatives that may be proposed, or whether any of thesuch proposals will become law. Compliance with any new laws or regulations, or changes in the interpretation or enforcement of existing laws or regulations, could be more difficult and expensive and affect the manner in which we conduct business.
The investment management industry is intensely competitive.
•Unlike some of our competitors, we do not currently engage in impact investing, offer passive investment strategies or “solutions” products like target-date funds.
•A number of our competitors have greater financial, technical, marketing and other resources, more comprehensive name recognition and more personnel than we do.
•Potential competitors have a relatively low cost of entering the investment management industry.
•Some investors may prefer to invest with an investment manager that is not publicly traded based on the perception that a publicly-traded asset manager may focus on the manager’s own growth to the detriment of investment performance for clients.performance.
•Other industry participants may seek to recruit our investment professionals.
•Many competitors charge lower fees for their investment management services than we do.
For example, the trend in favor of low-fee passive products such as index and certain exchange-traded funds will favorfavors those of our competitors who provide passive investment strategies. In recent years, across the investment management industry, passive products have experienced inflows and traditional actively managed products have experienced outflows, in each case, in the aggregate. That trend has presented, and likely will continue to present, a headwind to our business. Separately, intermediaries through which we distribute our mutual funds may also sell their own proprietary funds and investment products, which could limit the distribution of our investment strategies. If we are unable to compete effectively, our earnings would be reduced and our business could be materially adversely affected.
23
The investment management industry faces substantial litigation risks which could materially adversely affect our business, financial condition or results of operations or cause significant reputational harm to us.
We depend to a large extent on our network of relationships and on our reputation in order to attract and retain client assets. If a client is not satisfied with our services, its dissatisfaction may be more damaging to our business than client dissatisfaction would be to other types of businesses. We make investment decisions on behalf of our clients that could result in substantial losses to them. If our clients suffer significant losses, or are otherwise dissatisfied with our services, we could be subject to the risk of legal liabilitiesliability or actions alleging negligent misconduct,negligence, breach of fiduciary duty, breach of contract, unjust enrichment and/or fraud. These risks are often difficult to assess or quantify and their existence and magnitude often remain unknown for substantial periods of time, even after an action has been commenced.
We may incur significant legal expenses in defending against litigation whether or not we engaged in conduct as a result of which we might be subject to legal liability. Substantial legal liability or significant regulatory action against us could materially adversely affect our business, financial condition or results of operations or cause significant reputational harm to us.
Risks Related to Our Structure
Control by our stockholders committee of approximately 23%12% of the combined voting power of our capital stock and the rights of holders of limited partnership units of Artisan Partners Holdings may give rise to conflicts of interest.
The stockholders committee currently consists of Eric R. Colson (Chairman and Chief(Chief Executive Officer), Charles J. Daley, Jr. (Chief Financial Officer) and Gregory K. Ramirez (Executive Vice President). All shares subject to the stockholders agreement are voted in accordance with the majority decision of those three members. The stockholders committee’s control of approximately 23%12% of the combined voting power gives the committee considerablea meaningful influence in determining the outcome of any shareholderstockholder vote, including the election of directors and the approval of certain transactions.
In addition, because the majority of our pre-IPO owners (including certain members of our board of directors) hold all or a portion of their ownership interests in our business through Artisan Partners Holdings, rather than through Artisan Partners Asset Management, these pre-IPO owners may have conflicting interests with holders of our Class A common stock. For example, our pre-IPO owners may have different tax positions from us which could influence their decisions regarding whether and when we should dispose of assets, whether and when we should incur new or refinance existing indebtedness, especially in light of the existence of the tax receivable agreements, and whether and when Artisan Partners Asset Management should terminate the tax receivable agreements and accelerate its obligations thereunder. In addition, the structuring of future transactions may take into consideration these pre-IPO owners’ tax or other considerations even where no similar benefit would accrue to us.
Our ability to pay regular dividends to our stockholders is subject to the discretion of our board of directors and may be limited by our structure and applicable provisions of Delaware law.
We intend to pay dividends to holders of our Class A common stock as described in “Dividend Policy”. Our board of directors may, in its sole discretion, change the amount or frequency of dividends or discontinue the payment of dividends entirely. In addition, as a holding company, we are dependent upon the ability of our subsidiaries to generate earnings and cash flows and distribute them to us so that we may pay dividends to our stockholders. We expect to cause Artisan Partners Holdings, which is a Delaware limited partnership, to make distributions to its partners, including us, in an amount sufficient for us to pay dividends. However, its ability to make such distributions will be subject to its and its subsidiaries’ operating results, cash requirements and financial condition, the applicable provisions of Delaware law, that may limit the amount of funds available for distribution to its partners, its compliance with covenants and financial ratios related to existing or future indebtedness, including under our notes and our revolving credit agreement, its other agreements with third parties, as well as its obligation to make tax distributions under its partnership agreement (which distributions would reduce the cash available for distributions by Artisan Partners Holdings to us).
24
Our ability to pay taxes and expenses, including payments under the tax receivable agreements (“TRAs”), may be limited by our holding company structure.
As a holding company, our assets principally consist of our ownership of partnership units of Artisan Partners Holdings, deferred tax assets and cash and we have no independent means of generating revenue. Artisan Partners Holdings is a partnership for U.S. federal income tax purposes and, as such, is not subject to U.S. federal income tax. Instead, Artisan Partners Holdings’ taxable income is allocated to holders of its partnership units, including us. Accordingly, we incur income taxes on our proportionate share of Artisan Partners Holdings’ taxable income and also may incur expenses related to our operations. Under the terms of its amended and restated limited partnership agreement, Artisan Partners Holdings is obligated to make tax distributions to holders of its partnership units, including us. In addition to tax expenses, we are also required to make payments under the tax receivable agreements,TRAs, which will be significant, and we incur other expenses related to the tax receivable agreementsTRAs and our operations. We intend to fund the payment of amounts due under the TRAs out of the reduced tax payments that APAM realizes in respect of the tax attributes to which the TRAs relate. We also intend to cause Artisan Partners Holdings to make distributions in an amount sufficient to allow us to pay our taxes and pay any additional operating expenses. However, its ability to make such distributions will be subject to various limitations and restrictions as set forth in the preceding risk factor. If, as a consequence of these various limitations and restrictions, we do not have sufficient funds to pay tax or other liabilities or to fund our operations, we may have to borrow funds and thus our liquidity and financial condition could be materially adversely affected. To the extent that we are unable to make payments when due under the tax receivable agreementsTRAs for any reason, such payments will be deferred and will accrue interest at a rate equal to one-year LIBOR plus 300 basis points until paid. We expect to amend the TRA agreements to replace LIBOR with an alternative reference rate in advance of the anticipated discontinuation of the LIBOR benchmark.
We will be required to pay the tax receivable agreementTRA beneficiaries for certain tax benefits we claim, and we expect that the payments we will be required to make will be substantial.
We are party to two tax receivable agreements.TRAs. The first tax receivable agreementTRA generally provides for the payment by APAM to the assignees of the Pre-H&F Corp Merger Shareholder of 85% of the applicable cash savings, if any, of U.S. federal, state and local income taxes that APAM actually realizes (or is deemed to realize in certain circumstances) as a result of (i) the tax attributes of the preferred units APAM acquired in the merger of a wholly-owned subsidiary of the Pre-H&F Corp Merger Shareholder into APAM in March 2013 (ii) net operating losses available as a result of the merger, and (iii)(ii) tax benefits related to imputed interest.
The second tax receivable agreementTRA generally provides for the payment by APAM to current or former limited partners of Artisan Partners Holdings or their assignees of 85% of the applicable cash savings, if any, of U.S. federal, state and local income taxes that APAM actually realizes (or is deemed to realize in certain circumstances) as a result of (i) certain tax attributes of their partnership units sold to us or exchanged (for shares of Class A common stock, convertible preferred stock or other consideration) and that are created as a result of such sales or exchanges and payments under the TRAs and (ii) tax benefits related to imputed interest.
The payment obligation under the tax receivable agreementsTRAs is an obligation of APAM, not Artisan Partners Holdings, and we expect that the payments we will be required to make under the tax receivable agreementsTRAs will be substantial. Assuming no material changes in the relevant tax law and that APAM earns sufficient taxable income to realize all tax benefits that are subject to the tax receivable agreements,TRAs, we expect that the reduction in tax payments for us associated with (i) the merger described above; (ii) the purchase or exchange of partnership units from March 2013 through December 31, 2017;2021; and (iii) projected future purchases or exchanges of partnership units would aggregate to approximately $728$658 million over generally a minimum of 15 years, assuming the future purchases or exchanges described in clause (iii) occurred at a price of $39.50$47.64 per share of our Class A common stock, the closing price of our Class A common stock on December 29, 2017.31, 2021. Under such scenario we would be required to pay the other parties to the tax receivable agreementsTRAs 85% of such amount, or approximately $655$594 million, over generally a minimum of 15 years. The actual amounts may materially differ from these hypothetical amounts, as potential future reductions in tax payments for us and tax receivable agreementTRA payments by us will be calculated using the market value of our Class A common stock at the time of purchase or exchange and the prevailing tax rates applicable to us over the life of the tax receivable agreementsTRAs and will be dependent on us generating sufficient future taxable income to realize the benefit. As of December 31, 2017,2021, we recorded a $385.4$425.4 million liability, representing amounts payable under the tax receivable agreementsTRAs equal to 85% of the tax benefit we expected to realize from the H&F Corp merger described above, our purchase of partnership units from limited partners of Holdings and the exchange of partnership units from March 2013 through December 31, 2017,2021, assuming no material changes in the related tax law and that APAM earns sufficient taxable income to realize all tax benefits subject to the tax receivable agreements. TRAs.
The liability will increase upon future purchases or exchanges of limited partnership units with the increase representing amounts payable under the tax receivable agreementsTRAs equal to 85% of the estimated future tax benefits, if any, resulting from such purchases or exchanges. Payments under the tax receivable agreementsTRAs are not conditioned on the counterparties’ continued ownership of us.
The actual increase in tax basis, as well as the amount and timing of any payments under these agreements, will vary depending upon a number of factors, including the timing of sales or exchanges by the holders of limited partnership units, the price of the Class A common stock at the time of such sales or exchanges, whether such sales or exchanges are taxable, the amount and timing of the taxable income APAM generates in the future and the tax rate then applicable and the portion of APAM’s payments under the tax receivable agreementsTRAs constituting imputed interest or depreciable basis or amortizable basis. Payments under the tax receivable agreementsTRAs are expected to give rise to certain additional tax benefits attributable to either further increases in basis or in the form of deductions for imputed interest, depending on the tax receivable agreementTRA and the circumstances. Any such benefits are covered by the tax receivable agreementsTRAs and will increase the amounts due thereunder. In addition, the tax receivable agreementsTRAs provide for interest, at a rate equal to one-year LIBOR plus 100 basis points, accrued from the due date (without extensions) of the corresponding APAM tax return to the actual payment date, provided that the actual payment date is on or before the payment due date, as specified in the tax receivable agreements. TRAs.
25
In addition, to the extent that we are unable to make payments when due under the tax receivable agreementsTRAs for any reason, such payments will be deferred and will accrue interest at a rate equal to one-year LIBOR plus 300 basis points until paid.
Payments under the tax receivable agreementsTRAs will be based on the tax reporting positions that we determine. Although we are not aware of any issue that would cause the IRS or other taxing authority to challenge a tax basis increase or other tax attributes subject to the tax receivable agreements,TRAs, we will not be reimbursed for any payments previously made under the tax receivable agreementsTRAs if such basis increases or other benefits are subsequently disallowed (however, any such additional payments may be netted against future payments (if any) that are made under the tax receivable agreements)TRAs). As a result, in certain circumstances, payments could be made under the tax receivable agreementsTRAs in excess of the benefits that we actually realize in respect of the attributes to which the tax receivable agreementsTRAs relate.
In certain cases, payments under the tax receivable agreementsTRAs may be accelerated and/or significantly exceed the actual benefits we realize in respect of the tax attributes subject to the tax receivable agreements.TRAs.
The tax receivable agreementsTRAs provide that (i) upon certain mergers, asset sales, other forms of business combinations or other changes of control, (ii) in the event that we materially breach any of our material obligations under the agreements, whether as a result of failure to make any payment within six months of when due (provided we have sufficient funds to make such payment), failure to honor any other material obligation required thereunder or by operation of law as a result of the rejection of the agreements in a bankruptcy or otherwise, or (iii) if, at any time, we elect an early termination of the agreements, our (or our successor’s) obligations under the agreements (with respect to all units, whether or not units have been exchanged or acquired before or after such transaction) would be based on certain assumptions. In the case of a material breach or if we elect early termination, those assumptions include that we would have sufficient taxable income to fully utilize the deductions arising from the increased tax deductions and tax basis and other benefits related to entering into the tax receivable agreements.TRAs. In the case of a change of control, the assumptions include that in each taxable year ending on or after the closing date of the change of control, our taxable income (prior to the application of the tax deductions and tax basis and other benefits related to entering into the tax receivable agreements)TRAs) will equal the greater of (i) the actual taxable income (prior to the application of the tax deductions and tax basis and other benefits related to entering into the tax receivable agreements)TRAs) for the taxable year and (ii) the highest taxable income (calculated without taking into account extraordinary items of income or deduction and prior to the application of the tax deductions and tax basis and other benefits related to entering into the tax receivable agreements)TRAs) in any of the four fiscal quarters ended prior to the closing date of the change of control, annualized and increased by 10% for each taxable year beginning with the second taxable year following the closing date of the change of control. In the event we elect to terminate the agreements early or we materially breach a material obligation, our obligations under the agreements will accelerate. As a result, (i) we could be required to make payments under the tax receivable agreementsTRAs that are greater than or less than the specified percentage of the actual benefits we realize in respect of the tax attributes subject to the agreements and (ii) if we materially breach a material obligation under the agreements or if we elect to terminate the agreements early, we would be required to make an immediate payment equal to the present value of the anticipated future tax benefits, which payment may be made significantly in advance of the actual realization of such future benefits. In these situations, our obligations under the tax receivable agreementsTRAs could have a substantial negative impact on our liquidity and could have the effect of delaying, deferring or preventing certain mergers, asset sales, other forms of business combinations or other changes of control. There can be no assurance that we will be able to finance our obligations under the tax receivable agreements.TRAs. If we were to elect to terminate the tax receivable agreementsTRAs associated with (i) the merger described above; (ii) the purchase or exchange of partnership units from March 2013 through December 31, 2017;2021; and (iii) projected future purchases or exchanges of partnership units, as of December 31, 2017,2021, based on an assumed discount rate equal to one-year LIBOR plus 100 basis points and a price of $47.64 per share of our Class A common stock (the closing price of our Class A common stock on December 31, 2021), we estimate that we would be required to pay approximately $523$536 million in the aggregate under the tax receivable agreements.
TRAs.
If we were deemed an investment company under the 1940 Act as a result of our ownership of Artisan Partners Holdings, applicable restrictions could make it impractical for us to continue our business as contemplated and could have a material adverse effect on our business.
Under Sections 3(a)(1)(A) and (C) of the 1940 Act, a company generally will be deemed to be an “investment company” for purposes of the 1940 Act if (i) it is, or holds itself out as being, engaged primarily, or proposes to engage primarily, in the business of investing, reinvesting or trading in securities or (ii) it engages, or proposes to engage, in the business of investing, reinvesting, owning, holding or trading in securities and, absent an applicable exemption, it owns or proposes to acquire investment securities having a value exceeding 40% of the value of its total assets (exclusive of U.S. government securities and cash items) on an unconsolidated basis. We do not believe that we are an “investment company”, as such term is defined in either of those sections of the 1940 Act.
As theits sole general partner, of Artisan Partners Holdings, we control and operate Artisan Partners Holdings. On that basis, we believe that our interest in Artisan Partners Holdings is not an “investment security” as that term is used in the 1940 Act. However, if we were to cease participation in the management of Artisan Partners Holdings, our interest in Artisan Partners Holdings could be deemed an “investment security” for purposes of the 1940 Act..
We and Artisan Partners Holdings intend to continue to conduct our operations so that we will not be deemed an investment company. However, if we were to be deemed an investment company, restrictions imposed by the 1940 Act, including limitations on our capital structure and our ability to transact with affiliates, could make it impractical for us to continue our business as contemplated and could have a material adverse effect on our business.
26
Risks Related to Our Class A Common Stock
The market price of our Class A common stock may be highly volatile and could be subject to wide fluctuations. In addition, the trading volume of our Class A common stock may fluctuate and cause significant price variations to occur. If the market price of our Class A common stock declines significantly, investors may be unable to sell shares of Class A common stock at or above their purchase price, if at all. The market price of our Class A common stock may fluctuate or decline significantly in the future.
Future sales of our Class A common stock in the public market could lower our stock price, and any future grant or sale of equity or convertible securities may dilute existing stockholders’ ownership in us.
The market price of our Class A common stock could decline as a result of future sales of a large number of shares of our Class A common stock, or the perception that such sales could occur.
These sales, or the possibility that thesesuch sales may occur, also may make it more difficult for us to raise additional capital by selling equity securities in the future, at a time and price that we deem appropriate.
We are party to a resale and registration rights agreement pursuant to which the shares of our Class A common stock issued upon exchange of limited partnership units are eligible for resale. Such shares of Class A common stock may be transferred only in accordance with the terms and conditions of the resale and registration rights agreement. The commonagreement, which our Board may waive or modify at any time. Common units of Artisan Partners Holdings discussed below are exchangeable for shares of our Class A common stock on a one-for-one basis.
There is no limit on the number of shares of our Class A common stock that our Class A limited partners or AIC are permitted to sell. As of December 31, 2017,2021, our Class A limited partners owned approximately 7.74.5 million Class A common units and AIC owned approximately 3.5 million Class D common units.
We may also purchase limited partnerships units of Holdings at any time and may issue and sell additional shares of our Class A common stock to fund such purchases. We cannot predict the size of future issuances of our Class A common stock or the effect, if any, that such future issuances and sales of shares of our Class A common stock may have on the market price of our Class A common stock. Sales or distributions of substantial amounts of our Class A common stock (including shares issued in connection with an acquisition), or the perception that such sales could occur, may cause the market price of our Class A common stock to decline.
Provisions in our restated certificate of incorporationorganizational documents, equity award agreements and amended and restated bylaws and in the Delaware General Corporation Lawlaw could discourage a change of control that our stockholders may favor, which could negatively affect the market price of our Class A common stock.
Provisions in our restated certificate of incorporation, amended and restated bylaws and in the Delaware General Corporation Law, oras well as the DGCL,terms of our equity awards, may make it more difficult and expensive for a third party to acquire control of us even if a change of control would be beneficial to the interests of our stockholders. Those provisions include:
•The right of the variouscertain classes of our capital stock to vote, as separate classes, on certain amendments to our restated certificate of incorporation and certain fundamental transactions.
•The ability of our board of directors to determine to issue shares of preferred stock and to determine the price and other terms of those shares, which could be used to thwart a takeover attempt.stock.
•Advance notice procedures that stockholders must comply with in order to nominate candidates to our board of directors or to propose matters to be acted upon at a stockholders’ meeting, which may discourage or deter a potential acquiror from conducting a solicitationmeeting.
27
•A limitation that, generally, stockholder action may only be taken at an annual or special meeting or by unanimous written consent.
•A requirement that a special meeting of stockholders may be called only by our board of directors, the Chair of the board or our Chairman andthe Chief Executive Officer, which may delay the ability of our stockholders to force consideration of a proposal or to take action, including the removal of directors.Officer.
•The ability of our board of directors to adopt, amend and repeal our amended and restated bylaws by majority vote, while such action by stockholders would require a super majority vote,vote.
•Except with respect to awards held by our named executive officers which makes it more difficultare double trigger, single trigger vesting upon a change in control for stockholdersunvested employee equity awards, including unvested equity awards held by investment team members. Prior to February 2019, our awards generally included double trigger vesting upon a change certain provisions described above.in control.
The market price of our Class A common stock could be adversely affected to the extent that the provisions of our restated certificate of incorporation and amended and restated bylawsabove factors discourage or delay potential takeover attempts that our stockholders may favor.
Our restated certificate of incorporation designates the Court of Chancery of the State of Delaware as the sole and exclusivecontains a forum for certain types of actions and proceedings that may be initiated by our stockholders,selection clause, which could limit our stockholders’ ability to obtain a favorable judicial forum for disputes with us or our directors, officers, employees or agents.
Our restated certificate of incorporation provides that, unless we consent in writing to an alternative forum, the Court of Chancery of the State of Delaware will be the sole and exclusive forum for (i) any derivative action or proceeding brought oncertain types of actions and proceedings that may be initiated by our behalf, (ii) any action asserting a claim of breach of a fiduciary duty owed by any of our directors, officers, employees or agents to us or our stockholders, (iii) any action asserting a claim arising pursuant to any provision of the Delaware General Corporation Law, our restated certificate of incorporation or our amended and restated bylaws or (iv) any action asserting a claim that is governed by the internal affairs doctrine, in each case subject to the Court of Chancery having personal jurisdiction over the indispensable parties named as defendants therein and the claim not being one which is vested in the exclusive jurisdiction of a court or forum other than the Court of Chancery or for which the Court of Chancery does not have subject matter jurisdiction.stockholders. Any person purchasing or otherwise acquiring any interest in any shares of our capital stock shall be deemed to have notice of and to have consented to this provision of our restated certificate of incorporation. This choice of forum provision may limit our stockholders’ ability to bring a claim in a judicial forum that it finds favorable for disputes with us or our directors, officers, employees or agents, which may discourage such lawsuits against us and our directors, officers, employees and agents.such parties. Alternatively, if a court were to find this provision of our restated certificate of incorporationthe forum selection clause inapplicable to, or unenforceable in respect of, one or more of the specified types of actions or proceedings, we may incur additional costs associated with resolving such matters in other jurisdictions, which could adversely affect our business and financial condition.
Our indemnification obligations may pose substantial risks to our financial condition.
Pursuant to our restated certificate of incorporation, we will indemnify our directors and officers to the fullest extent permitted by Delaware law against all liability and expense incurred by them in their capacities as directors or officers of us. We alsous, and we are obligated to pay their expenses in connection with the defense of claims. Our bylaws provide for similar indemnification of, and advancement of expenses to, our directors, officers, employees and agents and members of our stockholders committee. We have also entered into indemnification agreements with each of our directors and executive officers and each member of our stockholders committee, pursuant to which we will indemnify them to the fullest extent permitted by Delaware law in connection with their service in such capacities. Artisan Partners Holdings will also indemnify and advance expenses to AIC as its(its former general partner, thepartner), former members of its pre-IPO Advisory Committee, theadvisory committee, members of our stockholders committee, our directors and officers, and its officers and employees against any liability and expenses incurred by them and arising as a result of the capacities in which they serve or served Artisan Partners Holdings.
We have obtained liability insurance insuring our directors, officers and members of our stockholders committee against liability for acts or omissions in their capacities as directors, officers or committee memberssuch, subject to certain exclusions. These indemnification obligations may pose substantial risks to our financial condition, asif we mayare not be able to maintain our insurance or, even if we are able to maintain our insurance, claims in excess of our insurance coverage could be material. In addition, these indemnification obligations and other provisions of our restated certificate of incorporation and the amended and restated partnership agreement of Artisan Partners Holdings, may have the effect of reducing the likelihood of derivative litigation against indemnified persons, and may discourage or deter stockholders or management from bringing a lawsuit against such persons, even though such an action, if successful, might otherwise have benefited us and our stockholders.
Our restated certificate of incorporation provides that certain of our investors do not have an obligation to offer us business opportunities.
Our restated certificate of incorporation provides that, to the fullest extent permitted by applicable law, certain of our investors and their respective affiliates (including affiliates who serve on our board of directors) have no obligation to offer us an opportunity to participate in the business opportunities presented to them, even if the opportunity is one that we might reasonably have pursued (and thereforepursued. Therefore, they may be free to compete with us in the same business or a similar business).business. Furthermore, we renounce and waive and agree not to assert any claim for breach of any fiduciary or other duty relating to any such opportunity against those investors and their affiliates by reason of any such activities unless, in the case of any person who is our director or officer, such opportunity is expressly offered to such director or officerperson in writing solely in his or her capacity as an officer or director of us. This may create actual and potential conflicts of interest between us and certain of our investors and their affiliates (including certain of our directors).
Item 1B. Unresolved Staff Comments
None
28
Item 2. Properties
We operatelease all of our business from officesoffice space, including our largest office in Milwaukee, Wisconsin; San Francisco, California; Atlanta, Georgia; New York, New York; Wilmington, Delaware; Mission Woods, Kansas; Chicago, Illinois; Sydney; London; Singapore and Toronto. MostWisconsin, where a majority of our business operations are based in Milwaukee. Our Chief Executive Officer and Chief Financial Officer, along with other employees are based in San Francisco.based. We lease office space in each location and believe our existing and contracted-for facilities are adequate to meet our requirements.
Item 3. Legal Proceedings
In the normal course of business, we may be subject to various legal and administrative proceedings. Currently, there are no legal or administrative proceedings that management believes may have a material adverse effect on our consolidated financial position, cash flows or results of operations.
Item 4. Mine Safety Disclosures
Not applicable
29
Information about our Executive Officers
Information regarding our executive officers is as follows:
Eric R. Colson, age 52, has been chief executive officer and a director of Artisan Partners Asset Management since March 2011. Mr. Colson also served as the president of Artisan Partners Asset Management from March 2011 to January 2021 and as chairman of the Company’s board of directors from August 2015 to August 2021. Mr. Colson has served as the chief executive officer of Artisan Partners since January 2010. Prior to January 2010, Mr. Colson served as chief operating officer of investment operations from March 2007 through January 2010. Mr. Colson has been a managing director of Artisan Partners since he joined the firm in January 2005.
Charles J. Daley, Jr., age 59, has been executive vice president, chief financial officer and treasurer of Artisan Partners Asset Management since March 2011. He has served as the chief financial officer of Artisan Partners since August 2010 and has been a managing director since July 2010 when he joined the firm.
Jason A. Gottlieb, age 52, has been president of Artisan Partners Asset Management since January 2021. From February 2017 to January 2021, he served as executive vice president of Artisan Partners Asset Management. Mr. Gottlieb joined Artisan Partners in October 2016 as a managing director and the chief operating officer of investments.
Sarah A. Johnson, age 50, has been executive vice president, chief legal officer and secretary of Artisan Partners Asset Management and general counsel of Artisan Partners since October 2013. From April 2013 to October 2013 she served as assistant secretary of Artisan Partners Asset Management. Ms. Johnson was named a managing director of Artisan Partners in March 2010.
Christopher J. Krein, age 50, has been executive vice president of Artisan Partners Asset Management and Artisan Partners' head of Global Distribution since January 2020. Prior to becoming head of Global Distribution, Mr. Krein was responsible for institutional marketing and client service for the Artisan Developing World team. Mr. Krein has been a managing director of Artisan Partners since he joined the firm in September 2015.
Eileen L. Kwei, age 43, has been executive vice president of Artisan Partners Asset Management and Artisan Partners’ chief administrative officer since January 2021. From February 2018 to January 2021, Ms. Kwei was responsible for institutional marketing and client service for the Artisan Credit team. Prior to February 2018, Ms. Kwei was a relationship manager for the Artisan Global Equity team. Ms. Kwei joined Artisan Partners in June 2013 and has been a managing director of Artisan Partners since 2018.
Gregory K. Ramirez, age 51, was appointed executive vice president of Artisan Partners Asset Management in February 2016. From October 2013 to February 2016, he served as senior vice president and from April 2013 to October 2013 as assistant treasurer. Mr. Ramirez is currently head of securities and trade operations and vehicle administration for Artisan Partners and serves as chair of the Artisan Risk and Integrity Committee. Mr. Ramirez was named a managing director of Artisan Partners in April 2003.
30
PART II
Item 5. Market for Registrant’s Common Equity, Related Stockholder Matters and Issuer Purchases of Equity Securities.
Shares of our Class A common stock have been listed and traded on the NYSE under the symbol “APAM” since March 7, 2013. The following table sets forth, for the periods indicated, the high and low intra-day sale prices in dollars on the NYSE forAs of February 18, 2022, there were approximately 126 stockholders of record of our Class A common stock, and the dividends per share25 stockholders of record of our Class AB common stock, we declared during the periods indicated.
| High | Low | Dividends Declared | ||||||||||
| For the quarter ended March 31, 2016 | $ | 35.54 | $ | 23.65 | $ | 1.00 | ||||||
| For the quarter ended June 30, 2016 | $ | 35.00 | $ | 26.14 | $ | 0.60 | ||||||
| For the quarter ended September 30, 2016 | $ | 29.45 | $ | 25.41 | $ | 0.60 | ||||||
| For the quarter ended December 31, 2016 | $ | 32.20 | $ | 24.48 | $ | 0.60 | ||||||
| For the quarter ended March 31, 2017 | $ | 30.85 | $ | 26.30 | $ | 0.96 | ||||||
| For the quarter ended June 30, 2017 | $ | 31.55 | $ | 26.70 | $ | 0.60 | ||||||
| For the quarter ended September 30, 2017 | $ | 33.85 | $ | 29.00 | $ | 0.60 | ||||||
| For the quarter ended December 31, 2017 | $ | 40.65 | $ | 32.45 | $ | 0.60 | ||||||
and 27 stockholders of record of our Class C common stock. These figures do not reflect beneficial ownership or shares held in nominee name, nor do they include holders of any restricted stock units or performance share units. There is no trading market for shares of our Class B common stock or Class C common stock.
Performance Graph
The following graph compares the year-end cumulative total stockholder return on our Class A common stock fromduring the date the shares began trading on the NYSE on March 7, 2013 tofive-year period ended December 31, 2017,2021, with the year-end cumulative total return of the S&P 500® and the Dow Jones U.S. Asset Managers Index. The graph assumes the investment of $100 in our common stock and in the market indices on March 7, 2013 and the reinvestment of all dividends.
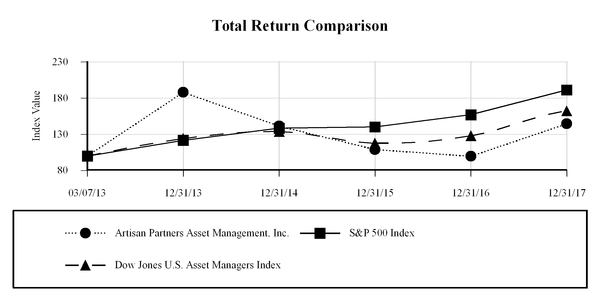
| 3/7/2013 | 12/31/2013 | 12/31/2014 | 12/31/2015 | 12/31/2016 | 12/31/2017 | |
| Artisan Partners Asset Management, Inc. | $100.00 | $188.06 | $141.46 | $108.85 | $99.63 | $144.54 |
| S&P 500 Index | $100.00 | $121.75 | $138.42 | $140.33 | $157.11 | $191.42 |
| Dow Jones U.S. Asset Managers Index | $100.00 | $124.20 | $133.86 | $117.85 | $127.98 | $162.43 |
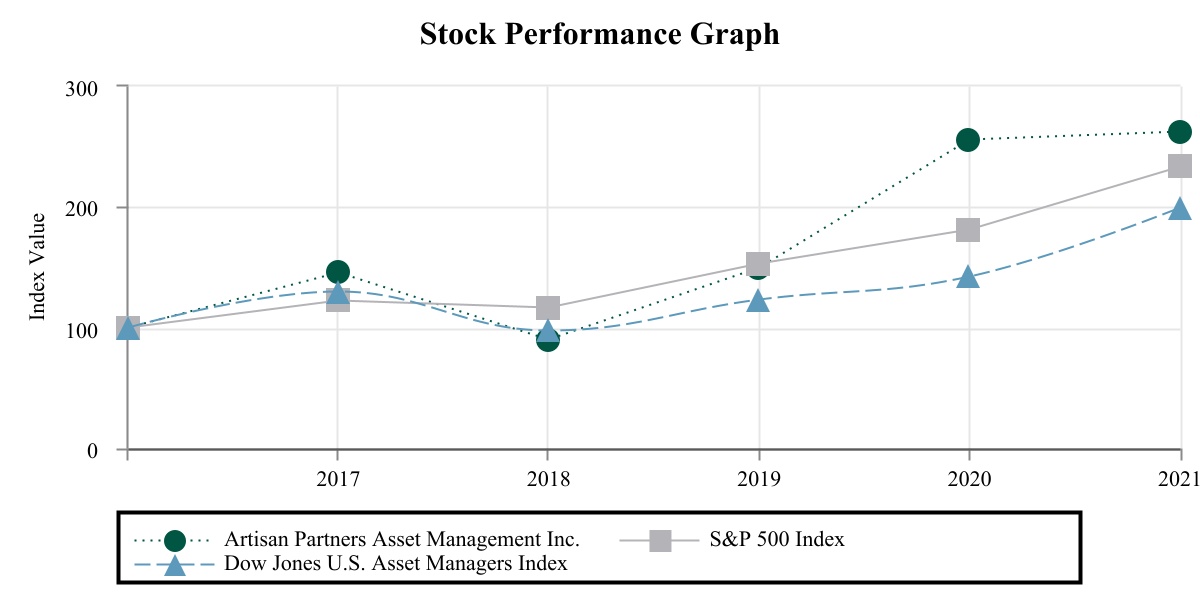
| For the Years Ended December 31, | |||||||||||||||||
| 2017 | 2018 | 2019 | 2020 | 2021 | |||||||||||||
| Artisan Partners Asset Management Inc. | $ | 145.07 | $ | 89.76 | $ | 149.48 | $ | 255.55 | $ | 262.45 | |||||||
| S&P 500 Index | $ | 121.83 | $ | 116.49 | $ | 153.17 | $ | 181.35 | $ | 233.41 | |||||||
| Dow Jones U.S. Asset Managers Index | $ | 129.66 | $ | 97.18 | $ | 123.15 | $ | 141.80 | $ | 199.40 | |||||||
The information containedabove table is provided pursuant to SEC regulations and the outcomes are impacted significantly by beginning- and end-point stock price, as well as the price at which dividends are reinvested. A stockholder who invested in APAM at its IPO on March 7, 2013, at the performance graph and table shall not be deemedIPO price of $30 per share would have experienced an 11% annual total return as of December 31, 2021 if all dividends were retained, compared to be “soliciting material” or “filed” or incorporated by reference in future filings with the SEC, except to the extent that the company specifically incorporates the information by reference into a document filed under the Securities Act or the Exchange Act.15% annual total return if all dividends were reinvested.
Dividend Policy
During the first quarter of 2018,2022, our board of directors declared a variable quarterly dividend of $0.60$1.03 per share with respect to the fourth quarter of Class A common stock2021 and a special annual dividend of $0.79$0.72 per share. The variable quarterly dividend of $1.03 per share represents approximately 80% of the cash generated in the fourth quarter of 2021. Subject to boardBoard approval each quarter, we currently expect to pay a quarterly dividend during 2018.of approximately 80% of the cash the Company generates each quarter. We expect quarterly cash generation to approximate adjusted net income plus long-term incentive compensation award expense, less cash reserved for future franchise capital awards (which we expect will approximate 4% of investment management revenues each quarter), with additional adjustments made for certain other sources and uses of cash, including capital expenditures. After the end of the year, our boardBoard will consider paying a special dividend that will take into consideration our annual adjusted earnings, business conditions andafter determining the amount of cash we want to retain at that time.needed for general corporate purposes and investments in growth and strategic initiatives. Although we expect to pay dividends according to our dividend policy, we may not pay dividends according to our policy or at all. We expect that management and our board will consider changes to our dividend policy, including consideration
31
We intend to fund dividends from our portion of distributions made by Artisan Partners Holdings from its available cash generated from operations. The holders of our Class B common stock and Class C common stock are not entitled to any cash dividends in their capacity as stockholders but, in their capacity as holders of limited partnership units of Artisan Partners Holdings, they generally participate on a pro rata basis in distributions by Artisan Partners Holdings.
The declaration and payment of all future dividends, if any, will be at the sole discretion of our board of directors. In determining the amount of any future dividends, our board of directors will take into account: (i) our financial results, (ii) our available cash, as well as anticipated cash requirements (including debt servicing)servicing, seed capital for new investment strategies and vehicles, and cash required to support growth and strategic initiatives), (iii) our capital requirements and the capital requirements of our subsidiaries (including Artisan Partners Holdings), (iv) contractual, legal, tax and regulatory restrictions on, and implications of, the payment of dividends by us to our stockholders or by our subsidiaries (including Artisan Partners Holdings) to us, including the obligation of Artisan Partners Holdings to make tax distributions to the holders of partnership units (including us), (v) general economic and business conditions and (vi) any other factors that our board of directors may deem relevant.
As a holding company, our assets principally consist of our ownership of partnership units of Artisan Partners Holdings, deferred tax assets and cash. Accordingly, we depend on distributions from Artisan Partners Holdings to fund any dividends we may pay. We intend to cause Artisan Partners Holdings to distribute cash to its partners, including us, in an amount sufficient to cover dividends, if any, declared by us. If we do cause Artisan Partners Holdings to make such distributions, holders of Artisan Partners Holdings limited partnership units will be entitled to receive equivalent distributions on a pro rata basis.
Our dividend policy has certain risks and limitations, particularly with respect to liquidity. Although we expect to pay dividends according to our dividend policy, we may not pay dividends according to our policy, or at all, if, among other things, Artisan Partners Holdings is unable to make distributions to us as a result of its operating results, cash requirements and financial condition, the applicable laws of the State of Delaware (which may limit the amount of funds available for distribution), its compliance with covenants and financial ratios related to indebtedness (including the notes and the revolving credit agreement) and its other agreements with third parties. Our note purchase and revolving credit agreements contain covenants limiting Artisan Partners Holdings’ ability to make distributions if a default has occurred and is continuing or would result from such a distribution. See “Management’s Discussion and Analysis of Financial Condition and Results of Operations—Liquidity and Capital Resources”.
Under the Delaware General Corporation Law, we may only pay dividends from legally available surplus or, if there is no such surplus, out of our net profits for the fiscal year in which the dividend is declared and/or the preceding fiscal year. Surplus is defined as the excess of the fair value of our total assets over the sum of the fair value of our total liabilities plus the par value of our outstanding capital stock. Capital stock is defined as the aggregate of the par value of all issued capital stock. To the extent we do not have sufficient cash to pay dividends, we may decide not to pay dividends.
| For the Years Ended December 31, | ||||||
| 2017 | 2016 | |||||
| (in millions) | ||||||
| For the quarter ended March 31 | $ | 38.2 | $ | 41.7 | ||
| For the quarter ended June 30 | $ | 100.1 | $ | 93.9 | ||
| For the quarter ended September 30 | $ | 77.2 | $ | 72.5 | ||
| For the quarter ending December 31 | $ | 97.4 | $ | 86.3 | ||
Unregistered Sales of Equity Securities
As described in Note 8, “Stockholders’ Equity”, to the Consolidated Financial Statements included in Item 8 of this report, upon termination of employment with Artisan, an employee-partner’s Class B common units are exchanged for Class E common units and the corresponding shares of Class B common stock are canceled. APAM issues the former employee-partner a number of shares of Class C common stock equal to the former employee-partner’s number of Class E common units. Class E common units are exchangeable for Class A common stock subject to the same restrictions and limitations on exchange applicable to the other common units of Holdings. There were no such issuances during the three months ended December 31, 2017.2021.
| As of December 31, 2017 | ||||||
Issued (or to be issued) upon settlement of restricted stock units(1) | Number of Securities remaining available for future issuance under equity compensation plans | Equity Type | ||||
| 2013 Omnibus Incentive Compensation Plan | 6,001,282 | 7,998,718 | Restricted Share Awards Restricted Stock Units | |||
| 2013 Non-Employee Director Plan | 120,942 | 879,058 | Restricted Stock Units | |||
(1) Excludes securities forfeited by grantees and available for future issuance. | ||||||
Item 6. Selected Financial Data
32
| For the Years Ended December 31, | |||||||||||||||||||
| 2017 | 2016 | 2015 | 2014 | 2013 | |||||||||||||||
| (in millions, except per-share data) | |||||||||||||||||||
| Statements of Operations Data: | |||||||||||||||||||
| Revenues | |||||||||||||||||||
| Management fees | |||||||||||||||||||
| Mutual funds | $ | 502.6 | $ | 470.6 | $ | 543.3 | $ | 575.4 | $ | 464.3 | |||||||||
| Separate accounts | 292.7 | 249.2 | 260.4 | 252.3 | 219.0 | ||||||||||||||
| Performance fees | 0.3 | 1.1 | 1.8 | 1.0 | 2.5 | ||||||||||||||
| Total revenues | $ | 795.6 | $ | 720.9 | $ | 805.5 | $ | 828.7 | $ | 685.8 | |||||||||
| Operating Expenses | |||||||||||||||||||
| Salaries, incentive compensation and benefits | 390.2 | 355.8 | 372.2 | 350.3 | 309.2 | ||||||||||||||
| Pre-offering related compensation-share-based awards | 12.7 | 28.1 | 42.1 | 64.7 | 404.2 | ||||||||||||||
| Pre-offering related compensation-other | — | — | — | — | 143.0 | ||||||||||||||
| Total compensation and benefits | 402.9 | 383.9 | 414.3 | 415.0 | 856.4 | ||||||||||||||
| Distribution, servicing and marketing | 29.6 | 32.5 | 43.6 | 49.1 | 38.4 | ||||||||||||||
| Occupancy | 14.5 | 13.1 | 12.5 | 11.3 | 10.5 | ||||||||||||||
| Communication and technology | 34.1 | 32.2 | 25.5 | 21.0 | 14.4 | ||||||||||||||
| General and administrative | 28.1 | 25.0 | 27.2 | 25.4 | 27.3 | ||||||||||||||
| Total operating expenses | 509.2 | 486.7 | 523.1 | 521.8 | 947.0 | ||||||||||||||
| Operating income (loss) | 286.4 | 234.2 | 282.4 | 306.9 | (261.2 | ) | |||||||||||||
| Non-operating income (loss) | |||||||||||||||||||
| Interest expense | (11.4 | ) | (11.7 | ) | (11.7 | ) | (11.6 | ) | (11.9 | ) | |||||||||
| Net gain on the valuation of contingent value rights | — | — | — | — | 49.6 | ||||||||||||||
| Net investment income (loss) and other | 1.1 | 1.3 | 0.4 | 0.4 | 5.1 | ||||||||||||||
| Net investment gain (loss) of consolidated investment products | 4.2 | — | — | — | — | ||||||||||||||
| Net gain (loss) on the tax receivable agreements | 290.9 | 0.7 | (12.2 | ) | (4.2 | ) | — | ||||||||||||
| Total non-operating income (loss) | 284.8 | (9.7 | ) | (23.5 | ) | (15.4 | ) | 42.8 | |||||||||||
| Income (loss) before income taxes | 571.2 | 224.5 | 258.9 | 291.5 | (218.4 | ) | |||||||||||||
| Provision for income taxes | 420.5 | 51.5 | 46.8 | 48.8 | 26.4 | ||||||||||||||
| Net income (loss) before noncontrolling interests | 150.7 | 173.0 | 212.1 | 242.7 | (244.8 | ) | |||||||||||||
| Less: Net income (loss) attributable to noncontrolling interests-Artisan Partners Holdings LP | 99.0 | 100.0 | 130.3 | 173.1 | (269.6 | ) | |||||||||||||
| Less: Net income attributable to noncontrolling interests - consolidated investment products | 2.1 | — | — | — | — | ||||||||||||||
| Net income attributable to Artisan Partners Asset Management Inc. | $ | 49.6 | $ | 73.0 | $ | 81.8 | $ | 69.6 | $ | 24.8 | |||||||||
| Earnings (loss) per basic and diluted common share | $ | 0.75 | $ | 1.57 | $ | 1.86 | $ | (0.37 | ) | $ | (2.04 | ) | |||||||
| Weighted average basic and diluted common shares outstanding | 44.6 | 38.1 | 35.4 | 27.5 | 13.8 | ||||||||||||||
| Dividends declared per Class A common share | $ | 2.76 | $ | 2.80 | $ | 3.35 | $ | 3.83 | $ | 0.86 | |||||||||
| As of December 31, | |||||||||||||||||||
| 2017 | 2016 | 2015 | 2014 | 2013 | |||||||||||||||
| Statement of Financial Condition Data: | (in millions) | ||||||||||||||||||
| Cash and cash equivalents | $ | 137.3 | $ | 156.8 | $ | 166.2 | $ | 182.3 | $ | 211.8 | |||||||||
| Total assets | 837.2 | 936.2 | 946.5 | 849.5 | 491.5 | ||||||||||||||
Borrowings(1) | 200.0 | 200.0 | 200.0 | 200.0 | 200.0 | ||||||||||||||
| Total liabilities | 666.5 | 818.5 | 829.9 | 742.0 | 409.6 | ||||||||||||||
| Redeemable noncontrolling interests | 62.6 | — | — | — | — | ||||||||||||||
| Total equity | $ | 108.1 | $ | 117.7 | $ | 116.6 | $ | 107.5 | $ | 81.9 | |||||||||
(1) In August 2012, we issued $200 million in unsecured notes and entered into a $100 million five-year revolving credit agreement. In August 2017, we issued $60 million in unsecured notes and used the proceeds to repay $60 million of the 2012 unsecured notes that matured in August 2017. On the same date, we amended and extended the $100 million revolving credit facility for an additional five-year period. See “Management’s Discussion and Analysis of Financial Condition and Results of Operations—Liquidity and Capital Resources”. | |||||||||||||||||||
| As of and for the Years Ended December 31, | |||||||||||||||||||
| 2017 | 2016 | 2015 | 2014 | 2013 | |||||||||||||||
| Selected Unaudited Operating Data: | (in millions) | ||||||||||||||||||
Assets under management(1) | $ | 115,494 | $ | 96,845 | $ | 99,848 | $ | 107,915 | $ | 105,477 | |||||||||
Net client cash flows(2) | (5,408 | ) | (4,824 | ) | (5,848 | ) | 788 | 7,178 | |||||||||||
Market appreciation (depreciation)(3) | $ | 24,057 | $ | 1,821 | $ | (2,219 | ) | $ | 1,650 | $ | 23,965 | ||||||||
(1) Reflects the dollar value of assets we managed for our clients in our investment strategies as of the last day of the period. | |||||||||||||||||||
(2) Reflects the dollar value of assets our clients placed with us for management, and withdrew from our management, during the period, excluding appreciation (depreciation) due to market performance and fluctuations in exchange rates. | |||||||||||||||||||
(3) Represents the appreciation (depreciation) of the value of our assets under management during the period due to market performance and fluctuations in exchange rates, as well as income, such as dividends, earned on assets under management. | |||||||||||||||||||
| For the Years Ended December 31, | |||||||||||||||||||
| 2017 | 2016 | 2015 | 2014 | 2013 | |||||||||||||||
| (dollars in millions) | |||||||||||||||||||
| Net income attributable to Artisan Partners Asset Management Inc. (GAAP) | $ | 49.6 | $ | 73.0 | $ | 81.8 | $ | 69.6 | $ | 24.8 | |||||||||
| Adjusted net income (Non-GAAP) | $ | 182.1 | $ | 158.7 | $ | 197.3 | $ | 228.9 | $ | 180.3 | |||||||||
| Operating income (loss) (GAAP) | $ | 286.4 | $ | 234.2 | $ | 282.4 | $ | 306.9 | $ | (261.2 | ) | ||||||||
| Adjusted operating income (Non-GAAP) | $ | 299.1 | $ | 262.3 | $ | 324.5 | $ | 371.7 | $ | 288.9 | |||||||||
| Operating margin (GAAP) | 36.0 | % | 32.5 | % | 35.1 | % | 37.0 | % | (38.1 | )% | |||||||||
| Adjusted operating margin (Non-GAAP) | 37.6 | % | 36.4 | % | 40.3 | % | 44.9 | % | 42.1 | % | |||||||||
Item 7. Management’s Discussion and Analysis of Financial Condition andResults of Operations
The following discussion and analysis of the results of operations and financial condition of the Company should be read in conjunction with the “Forward-Looking Statements” disclosure preceding Part I and the “Risk Factors” set forth in Item 1A of Part I of this Annual Report on Form 10‑K, each of which describe our risks, uncertainties and other important factors in more detail.
Overview and Recent Highlights
We are an investment management firm focused on providing high-value added, active investment strategies in growing asset classes to sophisticated clients globally.around the world. As of December 31, 2017,2021, our eightnine autonomous investment teams managed a total of 1721 investment strategies across multiple asset classes and investment styles. OverWe expect our firm’s history, we have createdtenth autonomous investment team to launch its first strategies during the first half of 2022.
We focus on attracting, retaining and developing talented investment professionals and creating an environment in which each investment team is provided ample resources and support, transparent and direct financial incentives, a high degree of investment autonomy, and a long-term time horizon. We create new investment strategies that canwhen we identify opportunities to add value for clients, oftentimes through the use of a broad array of securities, instruments, and techniques (which we call degrees of freedom) to differentiate returns and manage risk. During 2017, we launched the Thematic and Global Discovery strategies and two privately offered strategies managed by our Credit team and Thematic team, each of which provides our investment talent with significant degrees of freedom with which to add value and manage risk.
We focus our distribution efforts on sophisticated investors and asset allocators, including institutions and intermediaries that operate with institutional-like decision-making processes. We offer our investment strategies to clients and investors through multiple investment vehicles, including separate accounts and different types of pooled vehicles. As of December 31, 2017,2021, approximately 80% and 20%77% of our assets under management were managed for clients and investors domiciled in and outside of the U.S., respectively. Over the last five years we have grown and 23% of our assets under management fromwere managed for clients and investors domiciled outside of the U.S. from $7.9 billion as of December 31, 2012, to $22.7 billion as of December 31, 2017.
As a high-value added investment manager we expect that long-term investment performance will be the primary driver of our long-term business and financial results. If we maintain and evolve existing investment strategies and launch new investment strategies that meet the needs of and generate attractive outcomes for sophisticated asset allocators, we are confidentbelieve that we will continue to generate strong business and financial results.
Over shorter time periods, changes in our business and financial results are largely driven by market conditions and fluctuations in our assets under management that may not necessarily be the result of our long-term investment performance or the long-term demand for our strategies. For this reason, we expect that our business and financial results will be lumpy over time. During the year ended December 31, 2017, our assets under management increased to $115.5 billion, an increase of $18.6 billion, or 19.3%, compared to $96.8 billion at December 31, 2016, as a result of $24.1 billion in market appreciation, partially offset by $5.4 billion of net client cash outflows. Average assets under management for the year ended December 31, 2017 was $108.8 billion, an increase of 13.0% from the average of $96.3 billion for the year ended December 31, 2016.
We strive to maintain a financial model that is transparent and predictable. WeCurrently, we derive essentiallynearly all of our revenues from investment management fees, nearly allmost of which are based on a specified percentage of clients’ average assets under management. A majority of our expenses, including most of our compensation expense, vary directly with changes in our revenues.
We invest thoughtfully to support our investment teams and future growth, while also paying out to shareholdersstockholders and partners a majority of the cash that we generate from operations through dividends and distributions. RevenuesWe expect to continue to invest in the growth of the business, with a focus on adding new investment capabilities and more degrees of freedom in areas where both opportunity and client demand exist, and in which we can differentiate our active management and add value for clients.
Business highlights for 2021 included:
•Michael Cirami, Michael O'Brien and Sarah Orvin joined Artisan in September 2021 to build the firm's newest autonomous investment franchise. The new team will develop active, differentiated strategies with broad exposure to the emerging markets debt asset class. We expect to launch three emerging market debt strategies in 2022.
•On March 1, 2021, we launched the Artisan China Post-Venture Strategy, which is our first strategy with a dedicated private investing component.
•On December 1, 2021, we launched the Artisan Floating Rate strategy, managed by the Credit team.
Financial highlights for 2021 included:
•During the year ended December 31, 2021, our assets under management increased to $174.8 billion, an increase of $17.0 billion, or 11%, compared to $157.8 billion at December 31, 2020, as a result of $17.6 billion of market appreciation and $1.7 billion of net client cash inflows, partially offset by $2.3 billion of Artisan Funds’ distributions that were $796not reinvested by fund shareholders.
•Average assets under management for the year ended December 31, 2021 was $171.8 billion, an increase of 37.5% from the average of $124.9 billion for the year ended December 31, 2020.
•We earned $1.23 billion in revenue for the year ended December 31, 2021, a 36% increase from revenues of $900 million for the year ended December 31, 2017, a 10% increase from revenues of $721 million in the prior year.2020.
•Our GAAP operating margin was 36.0% for the year ended December 31, 2017,44.0% in 2021, compared to 32.5% for the year ended December 31, 2016.39.8% in 2020. Adjusted operating margin was 37.6% for the year ended December 31, 2017,44.1% in 2021, compared to 36.4% for the year ended December 31, 2016.39.8% in 2020.
•We declared and distributed dividends of $2.76$4.23 per share of Class A common stock during 2017,2021.
•We declared, effective February 1, 2022, a quarterly dividend of $1.03 per share of Class A common stock with respect to the December 2021 quarter and have declareda special annual dividend of $0.72 per share, for a total of $3.19$4.70 of dividends per share with respect to 2017.2021.
33
COVID-19 Pandemic
As noted in “Risk Factors—Risks Related to our Business”, the COVID-19 pandemic continues to impact the manner in which we operate, as the majority of our associates now maintain a hybrid schedule and, as of the date of this filing, the amount of business travel remains below pre-pandemic levels. We successfully completedbelieve we continue to operate well under these changing circumstances. We are benefiting from the flexible and highly mobile operating environment we have built over 25 years. However, we do not know what, if any, longer-term impact the current operating environment will have on our February 2017 follow-on offeringbusiness and results. Given the continued uncertainty surrounding the COVID-19 pandemic, it is difficult to predict whether further changes to associates' work arrangements will be needed and how long the reduced business travel will last. We expect most operating costs to return to pre-COVID-19 levels when associates return to the office and resume business travel.
The COVID-19 pandemic, together with resulting voluntary and government-imposed actions, has disrupted the global economy and caused significant market fluctuations. Ongoing global health concerns and uncertainty regarding the impact of COVID-19, could lead to further market volatility. Market fluctuations, for any reason, may cause clients to choose to redeem their investments from our investment strategies, which would ultimately impact our AUM, revenues and income.
As the COVID-19 pandemic continues to evolve, it is not possible to predict the full extent to which the pandemic may adversely impact our capital structure.
business, financial results and operations. These impacts, the onset of which may be delayed, will continue to depend on numerous developing factors that remain uncertain and subject to change.Organizational Structure
Organizational Structure
Our operations are conducted through Artisan Partners Holdings (“Holdings”) and its subsidiaries. On March 12, 2013, Artisan Partners Asset Management Inc. (“APAM”) and Artisan Partners Holdings LP completed a series of transactions (the “IPO Reorganization”) to reorganize their capital structures in connection with the initial public offering (“IPO”) of APAM’s Class A common stock. The IPO Reorganization and IPO were completed on March 12, 2013. The IPO Reorganization was designed to create a capital structure that preserves our ability to conduct our business through Holdings, while permitting us to raise additional capital and provide access to liquidity through a public company.
We operate our business in a single segment.
On February 28, 2017, APAM completed an offering of 5,626,517March 1, 2021, the Company sold 963,614 shares of Class A common stock in an underwritten offering and utilized all of the proceeds to purchase an aggregate of 5,626,517963,614 common units from certain limited partners of Holdings. In connection with the offering, APAM received 5,626,517963,614 GP units of Holdings.
During the year ended December 31, 2017,2021, certain limited partners of Holdings exchanged 1,472,1972,142,292 common units (along with a corresponding number of shares of Class B or Class C common stock of APAM)APAM, as applicable) for 1,472,1972,142,292 shares of Class A common stock. In connection with the exchanges, APAM received 1,472,1972,142,292 GP units of Holdings.
APAM’s equity ownership interest in Holdings increased from 57%80% at December 31, 20162020 to 67%84% at December 31, 2017,2021, as a result of these transactions and other equity transactions during the period.
34
| Deferred Tax Asset - Amortizable Basis | Amounts Payable Under Tax Receivable Agreements | ||||||
| (in millions) | |||||||
| December 31, 2016 | $ | 653.9 | $ | 586.2 | |||
| 2017 Follow-On Offering and Exchanges | 141.6 | 120.3 | |||||
| Amortization | (42.9 | ) | — | ||||
| Payments under TRA | — | (30.2 | ) | ||||
| Tax Reform - change in federal corporate tax rate | (341.7 | ) | (290.4 | ) | |||
| Change in estimate | (0.2 | ) | (0.5 | ) | |||
| December 31, 2017 | $ | 410.7 | $ | 385.4 | |||
Financial Overview
Economic Environment
Global equity and debt market conditions can materially affect our financial performance. During the year ended December 31, 2017, market appreciation increased our assets under management by 24.8%. The following table presents the total returns of relevant market indices:indices for the years ended December 31, 2021, 2020 and 2019:
| For the Years Ended December 31, | |||||||||||||||||
| 2021 | 2020 | 2019 | |||||||||||||||
| S&P 500 total returns | 28.7 | % | 18.4 | % | 31.5 | % | |||||||||||
| MSCI All Country World total returns | 18.5 | % | 16.3 | % | 26.6 | % | |||||||||||
| MSCI EAFE total returns | 11.3 | % | 7.8 | % | 22.0 | % | |||||||||||
| Russell Midcap® total returns | 22.6 | % | 17.1 | % | 30.5 | % | |||||||||||
| MSCI Emerging Markets Index | (2.5) | % | 18.3 | % | 18.4 | % | |||||||||||
| ICE BofA U.S. High Yield Master II Total Return Index | 5.4 | % | 6.2 | % | 14.4 | % | |||||||||||
| For the Years Ended December 31, | ||||||||
| 2017 | 2016 | 2015 | ||||||
| S&P 500 total returns | 21.8 | % | 12.0 | % | 1.4 | % | ||
| MSCI All Country World total returns | 24.0 | % | 7.9 | % | (2.4 | )% | ||
| MSCI EAFE total returns | 25.0 | % | 1.0 | % | (0.8 | )% | ||
Russell Midcap® total returns | 18.5 | % | 13.8 | % | (2.4 | )% | ||
| MSCI Emerging Markets Index | 37.3 | % | 11.2 | % | (14.9 | )% | ||
| ICE BofA Merrill Lynch U.S. High Yield Master II Total Return Index | 7.5 | % | 17.5 | % | (4.6 | )% | ||
Key Performance Indicators
When we review our business and financial performance we consider, among other things, the following:
| For the Years Ended December 31, | |||||||||||||||||
| 2021 | 2020 | 2019 | |||||||||||||||
| (unaudited; dollars in millions) | |||||||||||||||||
| Assets under management at period end | $ | 174,754 | $ | 157,776 | $ | 121,016 | |||||||||||
Average assets under management(1) | $ | 171,767 | $ | 124,901 | $ | 111,023 | |||||||||||
Net client cash flows(2) | $ | 1,678 | $ | 7,154 | $ | (2,658) | |||||||||||
| Total revenues | $ | 1,227 | $ | 900 | $ | 799 | |||||||||||
Weighted average fee(3) | 70.7 bps | 70.9 bps | 71.6 bps | ||||||||||||||
| Operating margin | 44.0 | % | 39.8 | % | 35.5 | % | |||||||||||
Adjusted operating margin (4) | 44.1 | % | 39.8 | % | 35.5 | % | |||||||||||
(1) We compute average assets under management by averaging day-end assets under management for the applicable period. | |||||||||||||||||
(2) Net client cash flows excludes Artisan Funds’ income and capital gain distributions that were not reinvested by fund shareholders. | |||||||||||||||||
(3) We compute our weighted average management fee by dividing annualized investment management fees (which excludes performance fees) by average assets under management for the applicable period. | |||||||||||||||||
(4) Adjusted measures are non-GAAP measures and are explained and reconciled to the comparable GAAP measures in “Supplemental Non-GAAP Financial Information” below. | |||||||||||||||||
| For the Years Ended December 31, | |||||||||||
| 2017 | 2016 | 2015 | |||||||||
| (dollars in millions) | |||||||||||
| Assets under management at period end | $ | 115,494 | $ | 96,845 | $ | 99,848 | |||||
Average assets under management(1) | $ | 108,754 | $ | 96,281 | $ | 106,484 | |||||
| Net client cash flows | $ | (5,408 | ) | $ | (4,824 | ) | $ | (5,848 | ) | ||
| Total revenues | $ | 796 | $ | 721 | $ | 806 | |||||
Weighted average fee(2) | 73.1 bps | 74.8 bps | 75.6 bps | ||||||||
| Operating Margin | 36.0 | % | 32.5 | % | 35.1 | % | |||||
Adjusted operating margin(3) | 37.6 | % | 36.4 | % | 40.3 | % | |||||
(1) We compute average assets under management by averaging day-end assets under management for the applicable period. | |||||||||||
(2) We compute our weighted average fee by dividing annualized investment management fees by average assets under management for the applicable period. | |||||||||||
(3) Adjusted measures are non-GAAP measures and are explained and reconciled to the comparable GAAP measures in “-Supplemental Non-GAAP Financial Information” below. | |||||||||||
Assets Under Management and Investment Performance
Changes to our operating results from one period to another are primarily caused by changes in the amount of our assets under management. Changes in the relative composition of our assets under management among our investment strategies and vehicles and the effective fee rates on our products also impact our operating results.
The amount and composition of our assets under management are, and will continue to be, influenced by a variety of factors including, among others:
•investment performance, including fluctuations in both the financial markets and foreign currency exchange rates and the quality of our investment decisions;
•flows of client assets into and out of our various strategies and investment vehicles;
•our decision to close strategies or limit the growth of assets in a strategy or a vehicle when we believe it is in the best interest of our clients; as well as our decision to re-open strategies, in part or entirely;
•our ability to attract and retain qualified investment, management, and marketing and client service professionals;
•industry trends towards products, strategies, vehicles or strategiesservices that we do not offer;
•competitive conditions in the investment management and broader financial services sectors; and
•investor sentiment and confidence.
35
The table below sets forth changes in our total assets under management:
| For the Years Ended December 31, | |||||||||||||||||
| 2021 | 2020 | 2019 | |||||||||||||||
| (unaudited; dollars in millions) | |||||||||||||||||
| Beginning assets under management | $ | 157,776 | $ | 121,016 | $ | 96,224 | |||||||||||
| Gross client cash inflows | 33,725 | 36,338 | 17,594 | ||||||||||||||
| Gross client cash outflows | (32,047) | (29,184) | (20,252) | ||||||||||||||
| Net client cash flows | 1,678 | 7,154 | (2,658) | ||||||||||||||
Artisan Funds’ distributions not reinvested(1) | (2,295) | (690) | (630) | ||||||||||||||
Investment returns and other(2) | 17,595 | 30,296 | 28,080 | ||||||||||||||
| Ending assets under management | $ | 174,754 | $ | 157,776 | $ | 121,016 | |||||||||||
| Average assets under management | $ | 171,767 | $ | 124,901 | $ | 111,023 | |||||||||||
(1) Artisan Funds’ distributions not reinvested represents the amount of income and capital gain distributions that were not reinvested in the Artisan Funds. | |||||||||||||||||
(2) Includes the impact of translating the value of assets under management denominated in non-USD currencies into U.S. dollars. The impact was immaterial for the periods presented. | |||||||||||||||||
| For the Years Ended December 31, | |||||||||||
| 2017 | 2016 | 2015 | |||||||||
| (in millions) | |||||||||||
| Beginning assets under management | $ | 96,845 | $ | 99,848 | $ | 107,915 | |||||
| Gross client cash inflows | 16,380 | 18,489 | 18,577 | ||||||||
| Gross client cash outflows | (21,788 | ) | (23,313 | ) | (24,425 | ) | |||||
| Net client cash flows | (5,408 | ) | (4,824 | ) | (5,848 | ) | |||||
Market appreciation (depreciation) (1) | 24,057 | 1,821 | (2,219 | ) | |||||||
| Ending assets under management | $ | 115,494 | $ | 96,845 | $ | 99,848 | |||||
| Average assets under management | $ | 108,754 | $ | 96,281 | $ | 106,484 | |||||
(1) Includes the impact of translating the value of assets under management denominated in non-USD currencies into US dollars. The impact was immaterial for the periods presented. | |||||||||||
Over the long-term, we expect to generate the majority of approximately $510 million, $294 million, and $616 million, respectively, from Artisan Funds annual income and capital gains distributions, net of reinvestments.
We monitor the availability of attractive investment opportunities relative to the amount of assets we manage in each of our investment strategies.strategies and the velocity at which the strategies are experiencing inflows. When appropriate, we will close a strategy to new investors or otherwise take action to slow or restrict its growth, even though our aggregate assets under management may be negatively impacted in the short term. We may also re-open a strategy, widely or selectively, to fill available capacity or manage the diversification of our client base in that strategy. We believe that management of our investment capacity protects our ability to manage assets successfully, which protects the interests of our clients and, in the long term, protects our ability to retain client assets and maintain our profit margins.
As of the date of this filing, our Non-U.S. Growth, Non-U.S. Small-Cap Growth, Non-U.S.the Artisan High Income Fund, Artisan International Value U.S. Mid-Cap GrowthFund and U.S. Small-Cap Growth strategiesArtisan International Small-Mid Fund are closed to most new investors and client relationships. Our Global Value and Global Opportunitiestheir respective strategies are open across pooled vehicles, but closedhave limited availability to most new separate account clients. We may selectively accept additional separate account clients in those strategies, butclient relationships. In addition, we are actively managing asset flows into those strategiesthe capacity of our U.S. Small-Cap Growth strategy with a bias towards assets from pooled vehicles.respect to new client relationships.
When we close or otherwise restrict the growth of a strategy, we typically continue to allow additional investments in the strategy by existing clients and certain related entities. We may also permit new investments by other eligible investors atin our discretion. As a result, during a given period we may have net client cash inflows in a closed strategy. However, when a strategy is closed or its growth is restricted we expect there to be periods of net client cash outflows.
The unaudited table belowon the following page sets forth the total assets under management for our investment teams and strategies as of December 31, 2017, the inception date for each investment composite, and the average annual total returns for each composite (gross of fees) and its respective broad-based benchmark (and style benchmark, if applicable) over a multi-horizon time period as of December 31, 2017.2021. Returns for periods less than one year are not annualized. Performance information for Artisan sponsored privately offered strategies has been intentionally omitted.
36
| Inception | Strategy AUM | Average Annual Total Returns (Gross) | Average Annual Value-Added(1) Since Inception (bps) | Composite Inception | Strategy AUM | Average Annual Total Returns (Gross) | Average Annual Value-Added(1) Since Inception (bps) | |||||||||||||||||||||||||||||||||||||||||
| Investment Team and Strategy | Date | (in $MM) | 1 YR | 3 YR | 5 YR | 10 YR | Inception | Investment Team and Strategy | Date | (in $MM) (2) | 1 YR | 3 YR | 5 YR | 10 YR | Inception | |||||||||||||||||||||||||||||||||
| Growth Team | Growth Team | |||||||||||||||||||||||||||||||||||||||||||||||
| Global Opportunities Strategy | 2/1/2007 | $ | 15,469 | 32.73% | 15.18% | 14.87% | 10.46% | 11.00% | 579 | Global Opportunities Strategy | 2/1/2007 | $ | 27,578 | 15.17% | 30.66% | 22.22% | 18.32% | 13.27% | 625 | |||||||||||||||||||||||||||||
| MSCI All Country World Index | 23.97% | 9.29% | 10.79% | 4.65% | 5.21% | MSCI All Country World Index | 18.54% | 20.36% | 14.39% | 11.84% | 7.02% | |||||||||||||||||||||||||||||||||||||
| Global Discovery | 9/1/2017 | 16 | N/A | 5.99% | (178) | |||||||||||||||||||||||||||||||||||||||||||
| Global Discovery Strategy | Global Discovery Strategy | 9/1/2017 | 2,371 | 14.01% | 34.48% | --- | 23.86% | 1,080 | ||||||||||||||||||||||||||||||||||||||||
| MSCI All Country World Index | N/A | N/A | 7.77% | MSCI All Country World Index | 18.54% | 20.36% | --- | 13.06% | ||||||||||||||||||||||||||||||||||||||||
| U.S. Mid-Cap Growth Strategy | 4/1/1997 | 12,798 | 21.96% | 8.14% | 13.46% | 9.95% | 15.06% | 453 | U.S. Mid-Cap Growth Strategy | 4/1/1997 | 16,919 | 11.68% | 35.59% | 24.22% | 18.62% | 16.58% | 586 | |||||||||||||||||||||||||||||||
Russell® Midcap Index | 18.52% | 9.57% | 14.95% | 9.10% | 10.54% | Russell® Midcap Index | 22.58% | 23.26% | 15.09% | 14.89% | 11.13% | |||||||||||||||||||||||||||||||||||||
Russell® Midcap Growth Index | 25.27% | 10.29% | 15.30% | 9.09% | 9.28% | Russell® Midcap Growth Index | 12.73% | 27.43% | 19.82% | 16.61% | 10.72% | |||||||||||||||||||||||||||||||||||||
| U.S. Small-Cap Growth Strategy | 4/1/1995 | 2,345 | 28.38% | 11.71% | 15.15% | 10.30% | 10.56% | 99 | U.S. Small-Cap Growth Strategy | 4/1/1995 | 5,566 | (7.77)% | 28.69% | 23.16% | 18.21% | 12.18% | 351 | |||||||||||||||||||||||||||||||
Russell® 2000 Index | 14.65% | 9.95% | 14.11% | 8.70% | 9.56% | Russell® 2000 Index | 14.82% | 20.00% | 12.01% | 13.22% | 9.83% | |||||||||||||||||||||||||||||||||||||
Russell® 2000 Growth Index | 22.17% | 10.27% | 15.20% | 9.18% | 7.98% | Russell® 2000 Growth Index | 2.83% | 21.14% | 14.52% | 14.12% | 8.67% | |||||||||||||||||||||||||||||||||||||
| Global Equity Team | Global Equity Team | |||||||||||||||||||||||||||||||||||||||||||||||
| Global Equity Strategy | 4/1/2010 | 1,439 | 33.31% | 10.66% | 13.20% | N/A | 13.14% | 406 | Global Equity Strategy | 4/1/2010 | 2,837 | 6.56% | 22.55% | 19.20% | 15.89% | 14.07% | 397 | |||||||||||||||||||||||||||||||
| MSCI All Country World Index | 23.97% | 9.29% | 10.79% | N/A | 9.08% | MSCI All Country World Index | 18.54% | 20.36% | 14.39% | 11.84% | 10.10% | |||||||||||||||||||||||||||||||||||||
| Non-U.S. Growth Strategy | 1/1/1996 | 27,101 | 32.55% | 5.48% | 8.57% | 3.87% | 10.54% | 542 | Non-U.S. Growth Strategy | 1/1/1996 | 20,507 | 10.07% | 16.03% | 13.31% | 10.37% | 10.29% | 504 | |||||||||||||||||||||||||||||||
| MSCI EAFE Index | 25.03% | 7.79% | 7.89% | 1.94% | 5.12% | MSCI EAFE Index | 11.26% | 13.53% | 9.54% | 8.02% | 5.25% | |||||||||||||||||||||||||||||||||||||
| Non-U.S. Small-Cap Growth Strategy | 1/1/2002 | 695 | 35.54% | 10.39% | 9.67% | 5.51% | 13.87% | 302 | ||||||||||||||||||||||||||||||||||||||||
| MSCI EAFE Small Cap Index | 33.01% | 14.19% | 12.85% | 5.77% | 10.86% | |||||||||||||||||||||||||||||||||||||||||||
| Non-U.S. Small-Mid Growth Strategy | Non-U.S. Small-Mid Growth Strategy | 1/1/2019 | 9,417 | 5.17% | 25.33 | --- | 25.33% | 1,062 | ||||||||||||||||||||||||||||||||||||||||
| MSCI ACWI ex US SMID Index | MSCI ACWI ex US SMID Index | 10.16% | 14.71 | --- | 14.71% | |||||||||||||||||||||||||||||||||||||||||||
| China Post-Venture Strategy | China Post-Venture Strategy | 4/1/2021 | 237 | --- | (9.06)% | 539 | ||||||||||||||||||||||||||||||||||||||||||
| MSCI China SMID Cap Index | MSCI China SMID Cap Index | --- | (14.45)% | |||||||||||||||||||||||||||||||||||||||||||||
| U.S. Value Team | U.S. Value Team | |||||||||||||||||||||||||||||||||||||||||||||||
| Value Equity Strategy | 7/1/2005 | 2,269 | 16.99% | 11.78% | 13.41% | 8.44% | 9.00% | (5) | Value Equity Strategy | 7/1/2005 | 4,054 | 24.43% | 21.90% | 12.83% | 12.88% | 9.67% | 124 | |||||||||||||||||||||||||||||||
| Russell® 1000 Index | 21.69% | 11.22% | 15.70% | 8.59% | 9.05% | Russell® 1000 Index | 26.45% | 26.18% | 18.41% | 16.53% | 11.07% | |||||||||||||||||||||||||||||||||||||
| Russell® 1000 Value Index | 13.66% | 8.64% | 14.03% | 7.10% | 7.77% | Russell® 1000 Value Index | 25.16% | 17.62% | 11.16% | 12.96% | 8.43% | |||||||||||||||||||||||||||||||||||||
| U.S. Mid-Cap Value Strategy | 4/1/1999 | 6,496 | 13.69% | 8.70% | 12.64% | 10.17% | 13.51% | 388 | U.S. Mid-Cap Value Strategy | 4/1/1999 | 3,999 | 27.76% | 19.43% | 11.12% | 11.78% | 12.98% | 270 | |||||||||||||||||||||||||||||||
| Russell® Midcap Index | 18.52% | 9.57% | 14.95% | 9.10% | 9.63% | Russell® Midcap Index | 22.58% | 23.26% | 15.09% | 14.89% | 10.43% | |||||||||||||||||||||||||||||||||||||
| Russell® Midcap Value Index | 13.34% | 8.99% | 14.67% | 9.09% | 10.20% | Russell® Midcap Value Index | 28.34% | 19.60% | 11.21% | 13.43% | 10.28% | |||||||||||||||||||||||||||||||||||||
| International Value Team | International Value Team | |||||||||||||||||||||||||||||||||||||||||||||||
| International Value Strategy | International Value Strategy | 7/1/2002 | 31,792 | 18.10% | 17.64% | 11.73% | 11.79% | 12.10% | 551 | |||||||||||||||||||||||||||||||||||||||
| MSCI EAFE Index | MSCI EAFE Index | 11.26% | 13.53% | 9.54% | 8.02% | 6.59% | ||||||||||||||||||||||||||||||||||||||||||
| International Small Cap Value Strategy | International Small Cap Value Strategy | 10/1/2020 | 24 | 20.65% | --- | 40.85% | 944 | |||||||||||||||||||||||||||||||||||||||||
| MSCI All Country World Index Ex USA Small Cap (Net) | MSCI All Country World Index Ex USA Small Cap (Net) | 12.93% | --- | 31.41% | ||||||||||||||||||||||||||||||||||||||||||||
| Global Value Team | Global Value Team | |||||||||||||||||||||||||||||||||||||||||||||||
| Global Value Strategy | 7/1/2007 | 19,930 | 23.47% | 10.49% | 13.88% | 10.45% | 9.40% | 482 | Global Value Strategy | 7/1/2007 | 26,324 | 16.94% | 16.46% | 11.40% | 12.37% | 9.17% | 257 | |||||||||||||||||||||||||||||||
| MSCI All Country World Index | 23.97% | 9.29% | 10.79% | 4.65% | 4.58% | MSCI All Country World Index | 18.54% | 20.36% | 14.39% | 11.84% | 6.60% | |||||||||||||||||||||||||||||||||||||
| Non-U.S. Value Strategy | 7/1/2002 | 21,757 | 25.34% | 9.84% | 12.14% | 9.04% | 13.03% | 628 | ||||||||||||||||||||||||||||||||||||||||
| MSCI EAFE Index | 25.03% | 7.79% | 7.89% | 1.94% | 6.74% | |||||||||||||||||||||||||||||||||||||||||||
| Emerging Markets Team | ||||||||||||||||||||||||||||||||||||||||||||||||
| Emerging Markets Strategy | 7/1/2006 | 282 | 41.19% | 13.72% | 6.83% | 2.28% | 6.89% | 54 | ||||||||||||||||||||||||||||||||||||||||
| Select Equity Strategy | Select Equity Strategy | 3/1/2020 | 420 | 16.87% | --- | 21.61% | (1,019) | |||||||||||||||||||||||||||||||||||||||||
| S&P 500 Market Index (Total Return) | S&P 500 Market Index (Total Return) | 28.71% | --- | 31.80% | ||||||||||||||||||||||||||||||||||||||||||||
| Sustainable Emerging Markets Team | Sustainable Emerging Markets Team | |||||||||||||||||||||||||||||||||||||||||||||||
| Sustainable Emerging Markets Strategy | Sustainable Emerging Markets Strategy | 7/1/2006 | 1,173 | (0.27)% | 14.40% | 12.64% | 7.72% | 6.78% | 106 | |||||||||||||||||||||||||||||||||||||||
| MSCI Emerging Markets Index | 37.28% | 9.09% | 4.35% | 1.68% | 6.35% | MSCI Emerging Markets Index | (2.54)% | 10.93% | 9.87% | 5.48% | 5.72% | |||||||||||||||||||||||||||||||||||||
| Credit Team | Credit Team | |||||||||||||||||||||||||||||||||||||||||||||||
High Income Strategy(2) | 4/1/2014 | 2,517 | 9.90% | 9.07% | N/A | 7.90% | 296 | |||||||||||||||||||||||||||||||||||||||||
| ICE BofAML US High Yield Master II Total Return Index | 7.48% | 6.38% | N/A | 4.94% | ||||||||||||||||||||||||||||||||||||||||||||
| High Income Strategy | High Income Strategy | 4/1/2014 | 8,018 | 7.16% | 11.03% | 8.35% | --- | 7.93% | 257 | |||||||||||||||||||||||||||||||||||||||
| ICE BofA U.S. High Yield Master II Total Return Index | ICE BofA U.S. High Yield Master II Total Return Index | 5.36% | 8.56% | 6.09% | --- | 5.36% | ||||||||||||||||||||||||||||||||||||||||||
| Credit Opportunities Strategy | Credit Opportunities Strategy | 7/1/2017 | 120 | 18.44% | 18.84% | --- | 14.44% | 1,299 | ||||||||||||||||||||||||||||||||||||||||
| ICE BofA U.S. Dollar LIBOR 3-month Constant Maturity Index | ICE BofA U.S. Dollar LIBOR 3-month Constant Maturity Index | 0.17% | 1.28% | --- | 1.45% | |||||||||||||||||||||||||||||||||||||||||||
Floating Rate Strategy (3) | Floating Rate Strategy (3) | 1/1/2022 | 19 | --- | — | |||||||||||||||||||||||||||||||||||||||||||
| Credit Suisse Leveraged Loan Total Return Index | Credit Suisse Leveraged Loan Total Return Index | --- | ||||||||||||||||||||||||||||||||||||||||||||||
| Developing World Team | Developing World Team | |||||||||||||||||||||||||||||||||||||||||||||||
| Developing World Strategy | 7/1/2015 | 2,253 | 36.87% | N/A | 13.24% | 353 | Developing World Strategy | 7/1/2015 | 8,102 | (8.71)% | 33.88% | 22.94% | --- | 17.16% | 1,105 | |||||||||||||||||||||||||||||||||
| MSCI Emerging Markets Index | 37.28% | N/A | 9.71% | MSCI Emerging Markets Index | (2.54)% | 10.93% | 9.87% | --- | 6.11% | |||||||||||||||||||||||||||||||||||||||
| Thematic Team | ||||||||||||||||||||||||||||||||||||||||||||||||
| Thematic Strategy | 5/1/2017 | 32 | N/A | N/A | 29.81% | 1,612 | ||||||||||||||||||||||||||||||||||||||||||
| S&P 500 Index | N/A | 13.7% | ||||||||||||||||||||||||||||||||||||||||||||||
Privately Offered Strategies(3) | 95 | |||||||||||||||||||||||||||||||||||||||||||||||
| Total Assets Under Management | $ | 115,494 | �� | |||||||||||||||||||||||||||||||||||||||||||||
(1) Value-added is the amount in basis points by which the average annual gross composite return of each of our strategies has outperformed the broad-based market index most commonly used by our clients to compare the performance of the relevant strategy. Value-added for periods less than one year is not annualized. | ||||||||||||||||||||||||||||||||||||||||||||||||
(2) The Artisan High Income strategy may hold loans and other security types, including securities with lower credit ratings, that may not be included in the ICE BofA Merrill Lynch High Yield Master II Index. At times, this causes material differences in relative performance. | ||||||||||||||||||||||||||||||||||||||||||||||||
(3) Total Assets Under Management includes $37 million and $58 million of assets managed in privately offered strategies managed by the Credit Team and the Thematic Team, respectively. Performance information for these strategies has been intentionally omitted. | ||||||||||||||||||||||||||||||||||||||||||||||||
37
| Antero Peak Group | |||||||||||||||||||||||||||||||||||
| Antero Peak Strategy | 5/1/2017 | 4,028 | 25.17% | 29.95% | --- | --- | 28.08% | 996 | |||||||||||||||||||||||||||
| S&P 500 Index | 28.71% | 26.04% | --- | --- | 18.12% | ||||||||||||||||||||||||||||||
| Antero Peak Hedge Strategy | 11/1/2017 | 1,249 | 19.56% | 21.97% | --- | --- | 20.18% | 214 | |||||||||||||||||||||||||||
| S&P 500 Index | 28.71% | 26.04% | --- | --- | 18.04% | ||||||||||||||||||||||||||||||
| Total Assets Under Management | $ | 174,754 | |||||||||||||||||||||||||||||||||
(1) Value-added is the amount, in basis points, by which the average annual gross composite return of each of our strategies has outperformed or underperformed its respective benchmark. See “Performance and Assets Under Management Information Used in this Report” for additional information regarding the benchmarks used. Value-added for periods less than one year is not annualized. The High Income strategy holds loans and other security types that are not included in its benchmark, which, at times, causes material differences in relative performance. The Credit Opportunities strategy is benchmark agnostic and has been compared to the 3-month LIBOR for reference purposes only. The Antero Peak and Antero Peak Hedge strategies' investments in initial public offerings (IPOs) made a material contribution to performance. IPO investments may contribute significantly to a small portfolio’s return, an effect that will generally decrease as assets grow. IPO investments may be unavailable in the future. | |||||||||||||||||||||||||||||||||||
(2) AUM for certain strategies include the following amounts for which Artisan Partners provides investment models to managed account sponsors (reported on a one-month lag): Artisan Sustainable Emerging Markets $98 million. | |||||||||||||||||||||||||||||||||||
(3) The Floating Rate strategy composite performance began on January 1, 2022. As a result, there is not a performance track record as of December 31, 2021. | |||||||||||||||||||||||||||||||||||
38
The tables below set forth changes in our assets under management by investment team:
| By Investment Team | ||||||||||||||||||||||||||||||||
| Year Ended | Growth | Global Equity | U.S. Value | International Value | Global Value | Sustainable Emerging Markets | Credit | Developing World | Antero Peak Group | Total | ||||||||||||||||||||||
| December 31, 2021 | (unaudited; in millions) | |||||||||||||||||||||||||||||||
| Beginning assets under management | $ | 52,685 | $ | 32,056 | $ | 7,149 | $ | 24,123 | $ | 22,417 | $ | 679 | $ | 6,338 | $ | 8,853 | $ | 3,476 | $ | 157,776 | ||||||||||||
| Gross client cash inflows | 7,418 | 4,384 | 407 | 8,121 | 4,723 | 499 | 3,158 | 3,499 | 1,516 | 33,725 | ||||||||||||||||||||||
| Gross client cash outflows | (12,528) | (5,313) | (1,189) | (4,057) | (3,809) | (54) | (1,582) | (3,035) | (480) | (32,047) | ||||||||||||||||||||||
| Net client cash flows | (5,110) | (929) | (782) | 4,064 | 914 | 445 | 1,576 | 464 | 1,036 | 1,678 | ||||||||||||||||||||||
Artisan Funds’ distributions not reinvested (1) | (302) | (545) | (47) | (701) | (46) | — | (217) | (286) | (151) | (2,295) | ||||||||||||||||||||||
Investment returns and other (2) | 5,161 | 2,416 | 1,733 | 4,330 | 3,459 | 49 | 460 | (929) | 916 | 17,595 | ||||||||||||||||||||||
| Ending assets under management | $ | 52,434 | $ | 32,998 | $ | 8,053 | $ | 31,816 | $ | 26,744 | $ | 1,173 | $ | 8,157 | $ | 8,102 | $ | 5,277 | $ | 174,754 | ||||||||||||
| Average assets under management | $ | 53,375 | $ | 33,679 | $ | 7,835 | $ | 28,998 | $ | 25,463 | $ | 924 | $ | 7,576 | $ | 9,541 | $ | 4,376 | $ | 171,767 | ||||||||||||
| December 31, 2020 | ||||||||||||||||||||||||||||||||
| Beginning assets under management | $ | 34,793 | $ | 27,860 | $ | 7,402 | $ | 22,000 | $ | 19,707 | $ | 234 | $ | 3,850 | $ | 3,374 | $ | 1,796 | $ | 121,016 | ||||||||||||
| Gross client cash inflows | 9,532 | 6,479 | 786 | 6,165 | 4,681 | 349 | 3,438 | 3,527 | 1,381 | 36,338 | ||||||||||||||||||||||
| Gross client cash outflows | (8,616) | (5,885) | (1,687) | (6,101) | (3,535) | (25) | (1,415) | (1,487) | (433) | (29,184) | ||||||||||||||||||||||
| Net client cash flows | 916 | 594 | (901) | 64 | 1,146 | 324 | 2,023 | 2,040 | 948 | 7,154 | ||||||||||||||||||||||
Artisan Funds’ distributions not reinvested (1) | (222) | (115) | (12) | (46) | — | — | (130) | (142) | (23) | (690) | ||||||||||||||||||||||
Investment returns and other (2) | 17,198 | 3,717 | 660 | 2,105 | 1,564 | 121 | 595 | 3,581 | 755 | 30,296 | ||||||||||||||||||||||
| Ending assets under management | $ | 52,685 | $ | 32,056 | $ | 7,149 | $ | 24,123 | $ | 22,417 | $ | 679 | $ | 6,338 | $ | 8,853 | $ | 3,476 | $ | 157,776 | ||||||||||||
| Average assets under management | $ | 40,806 | $ | 26,991 | $ | 6,266 | $ | 20,045 | $ | 17,780 | $ | 476 | $ | 4,493 | $ | 5,465 | $ | 2,579 | 124,901 | |||||||||||||
| December 31, 2019 | ||||||||||||||||||||||||||||||||
| Beginning assets under management | $ | 26,251 | $ | 22,967 | $ | 6,577 | $ | 17,681 | $ | 17,113 | $ | 179 | $ | 2,860 | $ | 1,993 | $ | 603 | $ | 96,224 | ||||||||||||
| Gross client cash inflows | 4,207 | 3,557 | 644 | 3,607 | 1,412 | 29 | 1,791 | 1,305 | 1,042 | 17,594 | ||||||||||||||||||||||
| Gross client cash outflows | (5,251) | (5,214) | (1,435) | (3,474) | (2,806) | (14) | (1,138) | (780) | (140) | (20,252) | ||||||||||||||||||||||
| Net client cash flows | (1,044) | (1,657) | (791) | 133 | (1,394) | 15 | 653 | 525 | 902 | (2,658) | ||||||||||||||||||||||
Artisan Funds’ distributions not reinvested (1) | (134) | (133) | (33) | (199) | (8) | — | (112) | — | (11) | (630) | ||||||||||||||||||||||
Investment returns and other (2) | 9,720 | 6,683 | 1,649 | 4,385 | 3,996 | 40 | 449 | 856 | 302 | 28,080 | ||||||||||||||||||||||
| Ending assets under management | $ | 34,793 | $ | 27,860 | $ | 7,402 | $ | 22,000 | $ | 19,707 | $ | 234 | $ | 3,850 | $ | 3,374 | $ | 1,796 | $ | 121,016 | ||||||||||||
| Average assets under management | $ | 31,861 | $ | 25,744 | $ | 7,113 | $ | 20,072 | $ | 18,559 | $ | 203 | $ | 3,586 | $ | 2,634 | $ | 1,251 | 111,023 | |||||||||||||
(1) Artisan Funds’ distributions not reinvested represents the amount of income and capital gain distributions that were not reinvested in the Artisan Funds. | ||||||||||||||||||||||||||||||||
(2) Includes the impact of translating the value of assets under management denominated in non-USD currencies into U.S. dollars. The impact was immaterial for the periods presented. | ||||||||||||||||||||||||||||||||
39
| By Investment Team | |||||||||||||||||||||||||||
| Year Ended | Growth | Global Equity | U.S. Value | Global Value | Emerging Markets | Credit | Developing World | Thematic | Total | ||||||||||||||||||
| December 31, 2017 | (in millions) | ||||||||||||||||||||||||||
| Beginning assets under management | $ | 25,714 | $ | 25,510 | $ | 8,588 | $ | 33,940 | $ | 228 | $ | 1,878 | $ | 987 | $ | — | $ | 96,845 | |||||||||
| Gross client cash inflows | 4,399 | 2,942 | 1,592 | 5,099 | 14 | 1,168 | 1,080 | 86 | 16,380 | ||||||||||||||||||
| Gross client cash outflows | (6,153 | ) | (6,818 | ) | (2,517 | ) | (5,321 | ) | (53 | ) | (672 | ) | (253 | ) | (1 | ) | (21,788 | ) | |||||||||
| Net client cash flows | (1,754 | ) | (3,876 | ) | (925 | ) | (222 | ) | (39 | ) | 496 | 827 | 85 | (5,408 | ) | ||||||||||||
| Market appreciation (depreciation) | 6,668 | 7,601 | 1,102 | 7,969 | 93 | 180 | 439 | 5 | 24,057 | ||||||||||||||||||
Net transfers(1) | — | — | — | — | — | — | — | — | — | ||||||||||||||||||
| Ending assets under management | $ | 30,628 | $ | 29,235 | $ | 8,765 | $ | 41,687 | $ | 282 | $ | 2,554 | $ | 2,253 | $ | 90 | $ | 115,494 | |||||||||
Average assets under management(2) | $ | 29,366 | $ | 28,060 | $ | 8,719 | $ | 38,383 | $ | 280 | $ | 2,294 | $ | 1,632 | $ | 28 | $ | 108,754 | |||||||||
| December 31, 2016 | |||||||||||||||||||||||||||
| Beginning assets under management | $ | 24,929 | $ | 32,434 | $ | 10,369 | $ | 30,182 | $ | 571 | $ | 989 | $ | 374 | $ | — | $ | 99,848 | |||||||||
| Gross client cash inflows | 5,803 | 3,897 | 1,650 | 5,383 | 10 | 1,094 | 652 | — | 18,489 | ||||||||||||||||||
| Gross client cash outflows | (5,353 | ) | (7,885 | ) | (5,264 | ) | (3,878 | ) | (401 | ) | (424 | ) | (108 | ) | — | (23,313 | ) | ||||||||||
| Net client cash flows | 450 | (3,988 | ) | (3,614 | ) | 1,505 | (391 | ) | 670 | 544 | — | (4,824 | ) | ||||||||||||||
| Market appreciation (depreciation) | 335 | (2,936 | ) | 1,833 | 2,253 | 48 | 219 | 69 | — | 1,821 | |||||||||||||||||
Net transfers(1) | — | — | — | — | — | — | — | — | — | ||||||||||||||||||
| Ending assets under management | $ | 25,714 | $ | 25,510 | $ | 8,588 | $ | 33,940 | $ | 228 | $ | 1,878 | $ | 987 | $ | — | 96,845 | ||||||||||
| Average assets under management | $ | 24,535 | $ | 29,216 | $ | 8,733 | $ | 31,282 | $ | 293 | $ | 1,527 | $ | 694 | $ | — | 96,281 | ||||||||||
| December 31, 2015 | |||||||||||||||||||||||||||
| Beginning assets under management | $ | 24,499 | $ | 31,452 | $ | 18,112 | $ | 32,481 | $ | 806 | $ | 565 | $ | — | $ | — | $ | 107,915 | |||||||||
| Gross client cash inflows | 4,809 | 7,697 | 2,117 | 2,760 | 42 | 764 | 388 | — | 18,577 | ||||||||||||||||||
| Gross client cash outflows | (5,294 | ) | (5,630 | ) | (8,574 | ) | (4,379 | ) | (205 | ) | (335 | ) | (8 | ) | — | (24,425 | ) | ||||||||||
| Net client cash flows | (485 | ) | 2,067 | (6,457 | ) | (1,619 | ) | (163 | ) | 429 | 380 | — | (5,848 | ) | |||||||||||||
| Market appreciation (depreciation) | 915 | (1,085 | ) | (1,286 | ) | (680 | ) | (72 | ) | (5 | ) | (6 | ) | — | (2,219 | ) | |||||||||||
Net transfers(1) | — | — | — | — | — | — | — | — | — | ||||||||||||||||||
| Ending assets under management | $ | 24,929 | $ | 32,434 | $ | 10,369 | $ | 30,182 | $ | 571 | $ | 989 | $ | 374 | $ | — | $ | 99,848 | |||||||||
Average assets under management(3) | $ | 25,204 | $ | 33,262 | $ | 14,511 | $ | 32,015 | $ | 641 | $ | 775 | $ | 153 | $ | — | 106,484 | ||||||||||
(1)Net transfers represent certain amounts that we have identified as having been transferred out of one investment strategy or investment vehicle into another strategy or vehicle. | |||||||||||||||||||||||||||
(2)For the Thematic team, average assets under management is for the period between April 24, 2017, when the Thematic strategy began investment operations, and December 31, 2017. | |||||||||||||||||||||||||||
(3)For the Developing World team, average assets under management is for the period between June 29, 2015, when the team’s investment strategy began operations, and December 31, 2015. | |||||||||||||||||||||||||||
The goal of our marketing, distribution and client services efforts is to establish and maintain a client base that is diversified by investment strategy, investment vehicleclient type and distribution channel. As distribution channels have evolved to have more institutional-like decision making processes and longer-term investment horizons, we have expanded our distribution efforts into those areas. The table below sets forth our assets under management by distribution channel:
| As of December 31, 2017 | As of December 31, 2016 | As of December 31, 2015 | ||||||||||||||||||
| $ in millions | % of total | $ in millions | % of total | $ in millions | % of total | |||||||||||||||
| Institutional | $ | 76,176 | 66.0 | % | $ | 64,113 | 66.2 | % | $ | 64,352 | 64.5 | % | ||||||||
| Intermediary | 34,172 | 29.6 | % | 27,925 | 28.8 | % | 30,161 | 30.2 | % | |||||||||||
| Retail | 5,146 | 4.4 | % | 4,807 | 5.0 | % | 5,335 | 5.3 | % | |||||||||||
Ending Assets Under Management(1) | $ | 115,494 | 100.0 | % | $ | 96,845 | 100.0 | % | $ | 99,848 | 100.0 | % | ||||||||
(1) The allocation of assets under management by distribution channel involves the use of estimates and the exercise of judgment. | ||||||||||||||||||||
| As of December 31, 2021 | As of December 31, 2020 | As of December 31, 2019 | |||||||||||||||||||||||||||||||||
| $ in millions | % of total | $ in millions | % of total | $ in millions | % of total | ||||||||||||||||||||||||||||||
| (unaudited) | (unaudited) | (unaudited) | |||||||||||||||||||||||||||||||||
| Institutional | $ | 111,705 | 63.9 | % | $ | 102,189 | 64.8 | % | $ | 80,274 | 66.3 | % | |||||||||||||||||||||||
| Intermediary | 55,198 | 31.6 | % | 48,657 | 30.8 | % | 35,574 | 29.4 | % | ||||||||||||||||||||||||||
| Retail | 7,851 | 4.5 | % | 6,930 | 4.4 | % | 5,168 | 4.3 | % | ||||||||||||||||||||||||||
Ending Assets Under Management(1) | $ | 174,754 | 100.0 | % | $ | 157,776 | 100.0 | % | $ | 121,016 | 100.0 | % | |||||||||||||||||||||||
(1) The allocation of assets under management by distribution channel involves the use of estimates and the exercise of judgment. | |||||||||||||||||||||||||||||||||||
Our institutional channel includes assets under management sourced from defined contribution plan clients, which makesmade up approximately 14%12% of our total assets under management as of December 31, 2017.2021.
40
The following tables set forth the changes in our assets under management for Artisan Funds, Artisan Global Funds and separate accounts:by vehicle type:
| Year Ended | Artisan Funds & Artisan Global Funds | Separate Accounts and Other(1) | Total | ||||||||||||||
| December 31, 2021 | (unaudited; in millions) | ||||||||||||||||
| Beginning assets under management | $ | 74,746 | $ | 83,030 | $ | 157,776 | |||||||||||
| Gross client cash inflows | 23,957 | 9,768 | 33,725 | ||||||||||||||
| Gross client cash outflows | (18,628) | (13,419) | (32,047) | ||||||||||||||
| Net client cash flows | 5,329 | (3,651) | 1,678 | ||||||||||||||
Artisan Funds’ distributions not reinvested(2) | (2,295) | — | (2,295) | ||||||||||||||
Investment returns and other(3) | 6,984 | 10,611 | 17,595 | ||||||||||||||
Net transfers(4) | (401) | 401 | — | ||||||||||||||
| Ending assets under management | $ | 84,363 | $ | 90,391 | $ | 174,754 | |||||||||||
| Average assets under management | $ | 83,533 | $ | 88,234 | $ | 171,767 | |||||||||||
| December 31, 2020 | |||||||||||||||||
| Beginning assets under management | $ | 57,288 | $ | 63,728 | $ | 121,016 | |||||||||||
| Gross client cash inflows | 22,510 | 13,828 | 36,338 | ||||||||||||||
| Gross client cash outflows | (18,110) | (11,074) | (29,184) | ||||||||||||||
| Net client cash flows | 4,400 | 2,754 | 7,154 | ||||||||||||||
Artisan Funds’ distributions not reinvested(2) | (690) | — | (690) | ||||||||||||||
Investment returns and other(3) | 14,259 | 16,037 | 30,296 | ||||||||||||||
Net transfers(4) | (511) | 511 | — | ||||||||||||||
| Ending assets under management | $ | 74,746 | $ | 83,030 | $ | 157,776 | |||||||||||
| Average assets under management | $ | 58,629 | $ | 66,272 | $ | 124,901 | |||||||||||
| December 31, 2019 | |||||||||||||||||
| Beginning assets under management | $ | 46,654 | $ | 49,570 | $ | 96,224 | |||||||||||
| Gross client cash inflows | 12,545 | 5,049 | 17,594 | ||||||||||||||
| Gross client cash outflows | (13,911) | (6,341) | (20,252) | ||||||||||||||
| Net client cash flows | (1,366) | (1,292) | (2,658) | ||||||||||||||
Artisan Funds’ distributions not reinvested(2) | (630) | — | (630) | ||||||||||||||
Investment returns and other(3) | 13,003 | 15,077 | 28,080 | ||||||||||||||
Net transfers(4) | (373) | 373 | — | ||||||||||||||
| Ending assets under management | $ | 57,288 | $ | 63,728 | $ | 121,016 | |||||||||||
| Average assets under management | $ | 52,974 | $ | 58,049 | 111,023 | ||||||||||||
(1) Separate accounts and other consists of AUM we manage in or through vehicles other than Artisan Funds or Artisan Global Funds. This AUM includes assets we manage in traditional separate accounts, as well as assets we manage in Artisan-branded collective investment trusts and in Artisan Private Funds. As of December 31, 2021, AUM for certain strategies include the following amounts for which Artisan Partners provides investment models to managed account sponsors (reported on a one-month lag): Artisan Sustainable Emerging Markets $98 million. | |||||||||||||||||
(2) Artisan Funds’ distributions not reinvested represents the amount of income and capital gain distributions that were not reinvested in the Artisan Funds. | |||||||||||||||||
(3) Includes the impact of translating the value of assets under management denominated in non-USD currencies into U.S. dollars. The impact was immaterial for the periods presented. | |||||||||||||||||
(4) Net transfers represent certain amounts that we have identified as having been transferred out of one investment strategy, investment vehicle or account and into another strategy, vehicle or account. | |||||||||||||||||
41
| Year Ended | Artisan Funds & Artisan Global Funds | Separate Accounts(2) | Total | ||||||||
| December 31, 2017 | (in millions) | ||||||||||
| Beginning assets under management | $ | 49,367 | $ | 47,478 | $ | 96,845 | |||||
| Gross client cash inflows | 12,448 | 3,932 | 16,380 | ||||||||
| Gross client cash outflows | (15,584 | ) | (6,204 | ) | (21,788 | ) | |||||
| Net client cash flows | (3,136 | ) | (2,272 | ) | (5,408 | ) | |||||
| Market appreciation (depreciation) | 11,674 | 12,383 | 24,057 | ||||||||
Net transfers(1) | (556 | ) | 556 | — | |||||||
| Ending assets under management | $ | 57,349 | $ | 58,145 | $ | 115,494 | |||||
| Average assets under management | $ | 54,552 | $ | 54,225 | $ | 108,754 | |||||
| December 31, 2016 | |||||||||||
| Beginning assets under management | $ | 53,526 | $ | 46,322 | $ | 99,848 | |||||
| Gross client cash inflows | 13,101 | 5,388 | 18,489 | ||||||||
| Gross client cash outflows | (17,715 | ) | (5,598 | ) | (23,313 | ) | |||||
| Net client cash flows | (4,614 | ) | (210 | ) | (4,824 | ) | |||||
| Market appreciation (depreciation) | 604 | 1,217 | 1,821 | ||||||||
Net transfers(1) | (149 | ) | 149 | — | |||||||
| Ending assets under management | $ | 49,367 | $ | 47,478 | $ | 96,845 | |||||
| Average assets under management | $ | 50,908 | $ | 45,373 | $ | 96,281 | |||||
| December 31, 2015 | |||||||||||
| Beginning assets under management | $ | 60,257 | $ | 47,658 | $ | 107,915 | |||||
| Gross client cash inflows | 13,942 | 4,635 | 18,577 | ||||||||
| Gross client cash outflows | (18,864 | ) | (5,561 | ) | (24,425 | ) | |||||
| Net client cash flows | (4,922 | ) | (926 | ) | (5,848 | ) | |||||
| Market appreciation (depreciation) | (1,494 | ) | (725 | ) | (2,219 | ) | |||||
Net transfers(1) | (315 | ) | 315 | — | |||||||
| Ending assets under management | $ | 53,526 | $ | 46,322 | $ | 99,848 | |||||
| Average assets under management | $ | 58,671 | $ | 47,813 | 106,484 | ||||||
(1)Net transfers represent certain amounts that we have identified as having been transferred out of one investment strategy, investment vehicle, or account and into another strategy, vehicle, or account. | |||||||||||
(2)Separate account AUM consists of the assets we manage in or through vehicles other than Artisan Funds or Artisan Global Funds. Separate account AUM includes assets we manage in traditional separate accounts, as well as assets we manage in Artisan-branded collective investment trusts, in funds (both public and private) that we sub-advise, and in our own privately offered funds. | |||||||||||
Artisan Funds and Artisan Global Funds
As of December 31, 2017,2021, Artisan Funds comprised $53.7$78.0 billion, or 47%45%, of our assets under management. For the year ended December 31, 2017,2021, fees from Artisan Funds represented $472.5$712.9 million, or 59%58%, of our revenues. Our contractual tiered fee rates for the series of Artisan Funds range from 0.625%0.60% to 1.25%1.05% of fund assets, depending on the investment strategy, the amount invested and other factors.
As of December 31, 2017,2021, Artisan Global Funds comprised $3.6$6.4 billion, or 3%, of our assets under management. In UCITS funds, it is permissible and in some circumstances customary for a portionFor the year ended December 31, 2021, fees from Artisan Global Funds represented $48.5 million, or 4%, of the management fee to be rebated to investors with accounts of a certain type or asset size to encourage investment at an early stage or for other reasons or for a portion of the management fee to be paid to intermediaries for distribution services. We have entered into such rebate and distribution arrangements, and will continue to do so, in circumstances we consider appropriate.our revenues. Our contractual fee rates for Artisan Global Funds range from 0.75% to 1.75%1.85% of assets under management. For the year ended December 31, 2017, fees from Artisan Global Funds represented $30.1 million, or 4%, of our revenues.
The weighted average management fee rate of fee paid by our Artisan Funds and Artisan Global Funds clients in the aggregate was 0.921%0.912%, 0.924%0.916%, and 0.926%0.915%, for the years ended December 31, 2017, 20162021, 2020 and 2015,2019, respectively.
Separate Accounts and Other
“Separate accounts comprised $58.1 billion, or 50%,and other”—which consists of our assets under management as of December 31, 2017. For the year ended December 31, 2017, fees from separate accounts represented $293.0 million, or 37%, of our revenues. Separate account assets under management consist of the assets we manage in or through vehicles other than Artisan Funds or Artisan Global Funds, including assets we manage in traditional separate accounts, Artisan-branded collective investment trusts and Artisan Private Funds, as well as assets under advisement related to clients for whom we manage in Artisan-branded collectiveprovide investment trusts, in funds (both publicmodels but do not have discretionary investment authority—comprised $90.4 billion, or 52%, of our assets under management as of December 31, 2021. For the year ended December 31, 2021, fees from separate accounts and private) that we sub-advise, and inother represented $465.8 million, or 38%, of our own privately offered funds.revenues.
For traditional separate account clients, we generally impose standard fee schedules that vary by investment strategy and, through the application of standard breakpoints, reflect the size of the account and client relationship, with tiered rates ofrelationship. The weighted average management fee currently ranging from 0.40% of assets under management to 1.05% of assets under management.rate paid by our traditional separate account clients was 0.484%, 0.498%, and 0.512% for the years ended December 31, 2021, 2020 and 2019, respectively. There are a number of exceptions to our standard fee schedules, including exceptions based on the nature of our relationship with the client and the value of the assets under our management in that relationship. In general, our effective rate of fee for a particular client relationship declines as the assets we manage for that client increase, which we believe is typical for the asset management industry.
A number of our investment strategies are accessible to certain types of employee benefit plans through Artisan-branded collective investment trusts. We act as investment adviser to the collective investment trusts and earn a management fee for providing this service. The weighted average management fee rate of fee paid by our separate accountArtisan-branded collective investment trust clients in the aggregate was 0.540%0.729%, 0.550%0.735%, and 0.547%0.739% for the years ended December 31, 2017, 20162021, 2020 and 2015,2019, respectively.
Artisan serves as the investment manager and acts as the general partner for certain Artisan Private Funds. Under the terms of these agreements, Artisan earns a management fee, and for certain funds is entitled to receive either an allocation of profits or a performance-based fee. The weighted average management fee rate paid by our Artisan Private Funds clients was 0.786%, 0.800%, and 0.706% for the years ended December 31, 2021, 2020 and 2019, respectively.
The weighted average management fee rate, which excludes performance fees, paid by our separate accounts and other clients in the aggregate was 0.513%, 0.526% and 0.534% for the years ended December 31, 2021, 2020 and 2019, respectively. Because, as is typical in the asset management industry, our rates of fee decline as the assets under our management in a relationship increase, and because of differences in our fees by investment strategy, a change in the composition of our assets under management, in particular a shift to strategies, clients or relationships with lower effective rates of fees, could have a material impact on our overall weighted average rate of fee. See “—Qualitative and Quantitative Disclosures Regarding Market Risk—Market Risk” for a sensitivity analysis that demonstrates the impact that certain changes in the composition of our assets under management could have on our revenues.
Investment Advisory Revenues
Essentially all of our revenues consist of investment management fees earned from managing clients’ assets. Our investment advisory fees, which are comprised of management fees and performance fees, fluctuate based on a number of factors, including the total value of our assets under management, the composition of assets under management among investment vehicles and our investment strategies, changes in the investment management fee rates on our products, the extent to which we enter into fee arrangements that differ from our standard fee schedules, which can be affected by custom and the competitive landscape in the relevant market, and, for the accounts on which we earn performance-basedperformance fees, the investment performance of those accounts relative to their designated benchmarks.accounts.
The different fee structures associated with Artisan Funds, Artisan Global Funds and separate accounts and other pooled vehicles, and the different fee schedules applicable to each of our investment strategies, make the composition of our assets under management an important determinant of the investment management fees we earn. Historically, we have received higher effective rates of investment management fees from Artisan Funds and Artisan Global Funds than from ourtraditional separate accounts, reflecting, among other things, the different and broader array of services we provide to Artisan Funds and Artisan Global Funds. Investment management fees for non-U.S. funds may also be higher because they include fees to offset higher distribution costs. Our investment management fees also differ by investment strategy, with higher-capacity strategies having lower standard fee schedulesrates than strategies with more limited capacity.
42
Certain separate account clients pay us fees according tobased on the performance of their accounts relative to certain agreed-upon benchmarks, which typically results in a lower base fee, but allows us to earn higher fees if the performance we achieve for that client is superior to the performance of an agreed-upon benchmark. We may also receive performance fees or incentive allocations from Artisan sponsored privately offered funds also pay performance-basedPrivate Funds. Approximately 3% of our $174.8 billion of assets under management as of December 31, 2021 have performance fee billing arrangements. Performance fees of $13.3 million, $14.7 million, and $4.6 million were recognized in the form of incentive allocations. years ended December 31, 2021, 2020 and 2019, respectively.
The following table sets forth revenues we earned by vehicle type for the years ended December 31, 2021, 2020 and 2019:
| For the Years Ended December 31, | |||||||||||||||||
| 2021 | 2020 | 2019 | |||||||||||||||
| Revenues | (in millions) | ||||||||||||||||
| Management fees | |||||||||||||||||
| Artisan Funds & Artisan Global Funds | $ | 761.4 | $ | 537.2 | $ | 484.9 | |||||||||||
| Separate accounts and other | 452.5 | 347.7 | 309.5 | ||||||||||||||
| Performance fees | 13.3 | 14.7 | 4.6 | ||||||||||||||
| Total revenues | $ | 1,227.2 | $ | 899.6 | $ | 799.0 | |||||||||||
| Average assets under management for period | $ | 171,767 | $ | 124,901 | $ | 111,023 | |||||||||||
Management fees, performance fees and performance-based feesincentive allocations earned from consolidated investment products are eliminated from revenue upon consolidation.
| For the Years Ended December 31, | |||||||||||
| 2017 | 2016 | 2015 | |||||||||
| (in millions) | |||||||||||
| Revenues | |||||||||||
| Management fees | |||||||||||
| Artisan Funds & Artisan Global Funds | $ | 502.6 | $ | 470.6 | $ | 543.3 | |||||
| Separate accounts | 292.7 | 249.2 | 260.4 | ||||||||
| Performance fees | 0.3 | 1.1 | 1.8 | ||||||||
| Total revenues | $ | 795.6 | $ | 720.9 | $ | 805.5 | |||||
| Average assets under management for period | $ | 108,754 | $ | 96,281 | $ | 106,484 | |||||
Operating Expenses
Our operating expenses consist primarily of compensation and benefits, distribution, servicing and marketing, occupancy, communication and technology, and general and administrative.
Our expenses may fluctuate due to a number of factors, including the following:
•variations in the level of total compensation expense due to, among other things, incentive compensation, equity awards, changes in our employee count (including the addition of new investment teams) and product mix and competitive factors; and
•expenses, such as distribution fees, rent, professional service fees, technology and data-related costs, incurred, as necessary, to operate and grow our business.
A significant portion of our operating expenses are variable and fluctuate in direct relation to our assets under management and revenues. Even if we experience declining revenues, we expect to continue to make the expenditures necessary for us to manage and grow our business. As a result, our profits may decline.
Compensation and Benefits
Compensation and benefits includes (i) salaries, incentive compensation and benefits costs and (ii) long term incentive compensation expense related to post-IPO equity and cash awards granted to employees and (iii) pre-offering related compensation, which consists of amortization expense on unvested Class B awards.employees.
Incentive compensation is one of the most significant parts of the total compensation of our senior employees. The aggregate amount of cash incentive compensation paid to members of our investment teams and senior members of our marketing and client service teams is based in large part on formulas that are tied directly to revenues. For each of our investment teams, incentive compensation generally represents 25% of the asset-based management fees and a share of performance-based fees generated by assets under management in the team’s strategy or strategies. Incentive compensation paid to other employees is discretionary and subjectively determined based on individual performance and our overall results during the applicable year.
Certain compensation and benefits expenses are seasonal,generally higher in the beginning of the year, such as employer funded retirement and health care contributions and payroll taxes. HistoricallyWe expect these costs have addedto add approximately $3$5 million to our costsexpenses in the first quarter of each calendar year.2022, compared to the fourth quarter of 2021. Given our priorities in 2022, we expect to increase headcount over the next year across investment, distribution & marketing, and back office. We expect the fixed component of our compensation and benefits expenses will increase by approximately $15 million related to increased headcount and overall rising wage costs.
43
We grant equity awards to our employees pursuant to the Artisan Partners Asset Management Inc. 2013 Omnibus Incentive Compensation Plan. The equity awards consist of standard restricted awards that generally vest on a pro rata basis over 5 years and career awards that vest when both of the following conditions are met (1) pro-rata annual time vesting over 5 years and (2) qualifying retirement (as defined in the award agreements).
The estimated grant date fair value for only thoseof equity awards that vest,is recognized as compensation expense on a straight-line basis over the requisite service period of the award. The initial requisite service period is generally three years for performance share units and five years for all other awards that have been granted to date. Compensation expense for performance share units is only recognized if it is probable that the performance conditions will be achieved. For all awards, if a service or performance condition is not achieved, the corresponding awards are forfeited and any previously recognized compensation expense is reversed. We grant long-term incentive cash awards, referred to as franchise capital awards, to certain investment team members in lieu of certain additional equity awards. The franchise capital awards are subject to the same long-term vesting and forfeiture provisions as the equity awards. Prior to vesting, franchise capital awards are generally allocated to one or more of Artisan’s investment strategies. The underlying investment holdings and franchise capital award liability are marked to market value each quarter. The change in value of the award liability is included in compensation expense. The change in value of the underlying investment holdings is included in non-operating income/(expense).
On January 25, 2022, the Company's board of directors approved thea grant of 1,268,500 restricted share-basedlong-term incentive awards with a grant date fair value of $86.8 million consisting of $38.2 million of equity awards and $48.6 million of franchise capital cash awards to certain of our employees during 2017 and 1,518,970 restricted share-based awards in February 2018.pursuant to the Company’s 2013 Omnibus Incentive Compensation Plan. The grants consisted of both standard restricted awards and career awards, as described above.
Since the IPO and including the February 2018 grant in the first quarter of 2022, our board of directors has approved the grant of 7,589,15711,348,630 restricted share-based awards. TheTotal unrecognized non-cash compensation expense for these awards asis $119.9 million. As of December 31, 2017 was $157the date of this filing, unvested equity awards are comprised of the following number of shares by vesting condition:
| Service Only | Service & Performance Conditions | Service & Market Conditions | Total | |||||||||||||||||||||||
| Standard Pro Rata Time Vesting | 2,138,947 | 58,581 | 58,581 | 2,256,109 | ||||||||||||||||||||||
| Qualified Retirement | 2,789,391 | 1,278,351 | 57,002 | 4,124,744 | ||||||||||||||||||||||
| Total Unvested | 4,928,338 | 1,336,932 | 115,583 | 6,380,853 | ||||||||||||||||||||||
Including the long-term incentive award approved in the first quarter of 2022, total unrecognized long-term incentive compensation expense is $199.5 million. We expect long-term incentive compensation expense to be approximately $14 million per quarter in 2022, excluding the impact of investment returns on the franchise capital awards’ underlying investments.
We expect to continue to make equity grantslong-term incentive awards each year, though the form and structure of equitythe awards may change as we seek to maximize alignment between our employees and our clients, investors partners, and shareholders.stockholders. The actual size of the expense over time will depend primarily on the number of awards granted and our stock price at the time theequity grants are made. The amount of equity grantedlong-term incentive awards will vary from year to year and will be influenced by our results and other factors. From time to time, we may also make individual equity grants to people we hire.
44
Table of our historical compensation and benefits expense related to Holdings’ Class B limited partnership interests. Prior to the IPO Reorganization, Class B limited partnership interests were granted to certain employees. The Class B limited partnership interests provided both an interest in future profits of Holdings as well as an interest in the overall value of Holdings. Class B limited partnership interests generally vested ratably over a five-year period from the date of grant. Holders of Class B limited partnership interests were entitled to fully participate in profits from and after the date of grant.Contents
Distribution, Servicing and Marketing
Distribution, servicing and marketing expenses primarily represent payments we make to broker-dealers, financial advisors, defined contribution plan providers, mutual fund supermarkets and other intermediaries for selling, servicing and administering accounts invested in shares of Artisan Funds. Artisan Funds authorizes intermediaries to accept purchase, exchange and redemption orders for shares of Artisan Funds on behalf of Artisan Funds. Many intermediaries charge a fee for those services. Artisan Funds pays a portion of suchsome of those fees, which areportion is intended to compensate the intermediary for its provision of services of the type that would be provided by Artisan Funds’ transfer agent or other service providers if the shares were registered directly on the books of Artisan Funds’ transfer agent. Like the investment management fees we earn as adviser to Artisan Funds, distribution, servicing and marketing fees typically vary with the value of the assets invested in shares of Artisan Funds. The allocation of such fees between us and Artisan Funds is determined by the board of Artisan Funds, based on information and a recommendation from us, with the goal of allocating to us, at a minimum, all costs attributable to the marketing and distribution of shares of Artisan Funds. A significant portion of Artisan Funds’ shares are held by investors through intermediaries to which we pay distribution, servicing and marketing expenses.
Total distribution, servicing and marketing fees will increase ifas we increase our assets under management sourced through intermediaries that charge these fees or similar fees. The amount we pay to intermediaries for distribution and administrative services varies by share class. IfAs assets transferhave transferred from the Investor share class to the Advisor or theand Institutional share classes, the amount we have paid for distribution, servicing and marketing has decreased. Consistent with the experience of feesother investment managers, as the foregoing expenses have decreased, we pay will decrease. In contrast to some mutual funds, investors in Artisan Funds pay no 12b-1 fees, which are fees charged to investors to payhave seen increased requests from intermediaries for marketing, advertising and distribution services.alternative forms of compensation. To date, such alternative forms of compensation have not been material, but they could be over time.
Occupancy
Occupancy expenses include operating leases for facilities, furniture and office equipment, miscellaneous facility related costs and depreciation expense associated with furniture purchases and leasehold improvements.
We expect three of our investment teams2022 occupancy expenses to relocate to new office space during 2018, which will increase occupancy expense by approximately $2$5 million per year. Additionally, we currently estimate that these relocations will result in approximately $4to $7 million of one-time expenses in 2018.compared to 2021.
Communication and technology
Communication and technology expenses include information and print subscriptions, telephone costs, information systems consulting fees, equipment and software maintenance expenses, operating leases for information technology equipment and depreciation and amortization expenses associated with computer hardware and software. Information and print subscriptions represent the costs we pay to obtain investment research and other data we need to operate our business, and suchbusiness. A portion of these expenses generally increase or decrease in relative proportion to the number of our employees and the overall size and scale of our business operations. We expect to continue our measured investments in technology to support our investment teams, distribution efforts, and scalable operations. We expect 2022 communication and technology expenses to increase by approximately $5 million to $7 million compared to 2021.
On behalf of our mutual fund and separate account clients, we make decisions to buy and sell securities for each portfolio, select broker-dealers to execute trades and negotiate brokerage commission rates. In connection with these transactions, we may receive research products and services from broker-dealers in exchange for the business we conduct with such firms. Some of those research products and services could be acquired for cash and our receipt of those products and services through the use of client commissions, or soft dollars, reduces cash expenses we would otherwise incur. Our operating expenses will increaseIn response to the extent thatMarkets in Financial Instruments Directive II and industry changes prompted by it, we decidehave experienced requests from clients to bear research expenses that are currently paid for using soft dollars. In response to such requests or as a result of changes in our operations, we may eventually bear a significant portion or all of the costs of research directly, rather than relying on the use of soft dollars. We believe that all research products and services we acquire throughare currently paid for using soft dollars, are within the safe harbor provided by Section 28(e) of the Exchange Act.
materially.
General and Administrative
General and administrative expenses include professional fees, travel and entertainment, certain state and local taxes, directors’ and officers’ liability insurance, director fees, and other miscellaneous expenses we incur in operating our business. Travel expenses decreased significantly in 2020 and remained lower than historical levels in 2021 due to the COVID-19 pandemic. We expect most operating costs, including travel expense, to return to or exceed pre-COVID-19 levels when employees return to the office and resume business travel.
Non-Operating Income (Loss)(Expense)
Interest Expense
Interest expense primarily relates to the interest we pay on our debt. In August 2012, we issued $200 million in fixed interest rate senior unsecured notes and entered into a $100 millionfive-year revolving credit agreement. The proceeds were used to repay the entire outstanding principal of an existing term loan. In August 2017, we issued $60 million of Series D notes and used the proceeds to repay the $60 million Series A senior notes that matured on August 16, 2017. We also amended and extended the $100 million revolving credit facility for an additional five-year period. The revolving credit facility has been undrawn since our March 2013 IPO. For a description of the terms of the notes and our revolving credit facility,debt, see “—Liquidity and Capital Resources”. Interest expense also includes interest on TRA payments, which is incurred between the due date (without extension) for our federal income tax return and the date on which we make TRA payments.
45
Net Investment Gain (Loss) of Consolidated Investment Products
Net investment gain (loss) of consolidated investment products represents the realized and unrealized investment gains (losses) related to investment products that are included in our consolidated financial statements because Artisan holds a controlling financial interest in the respective investment entities. Significant portions of net investment gain (loss) of consolidated investment products are offset by noncontrolling interests in our Consolidated Statements of Operations.
Net Investment Income and Other
Net investment income includes realized and other items included in total non-operating income (loss) relateunrealized investment gains (losses) related to nonconsolidated investment products, income earned on excess cash balances, and dividends earned on available-for-sale securities, and gains or losses we recognize upon the sale of available-for-salenonconsolidated equity securities.
Net Gain (Loss) on the Tax Receivable Agreements
Non-operating income (loss)(expense) also includes gains or losses related to the changes in our estimate of the payment obligation under the tax receivable agreements,TRAs, including the impact of Tax Reform.tax rate changes. The effect of changes in our estimate of amounts payable under the tax receivable agreements,TRAs, including the effect of changes in enacted tax rates and in applicable tax laws, is included in net income.
Net Income (Loss) Attributable to Noncontrolling Interests
Net Income (Loss) Attributable to Noncontrolling Interests-HoldingsInterests - Holdings
Net income (loss) attributable to noncontrolling interests-Holdingsinterests - Holdings represents the portion of earnings or loss attributable to the ownership interestinterests in Artisan Partners Holdings held by the limited partners of Artisan Partners Holdings.
Net Income (Loss) Attributable to Noncontrolling Interests - Consolidated Investment Products
Net income (loss) attributable to noncontrolling interests - consolidated investment products represents the portion of earnings or loss attributable to third-party investors’ ownership interestinterests in consolidated investment products.
Provision for Income Taxes
The provision for income taxes primarily represents APAM’s U.S. federal, state and local income taxes on its allocable portion of Holdings’ income, as well as foreign income taxes payable by Holdings’ subsidiaries. Our effective income tax rate is dependent on many factors, including a rate benefit attributable to the fact that a portion of Holdings’ taxable earnings are not subject to corporate level taxes. Thus, income before income taxes includes amounts that are attributable to noncontrolling interests and not taxable to APAM and its subsidiaries, which reduces the effective tax rate. ThisThe effective tax rate is also lower than the statutory rate due to dividends paid on unvested share-based awards. These favorable impact isimpacts are partially offset by the impact of certain permanent items, including pre-IPO share-basedcertain executive compensation expenses, that are not deductible for tax purposes. These factors are expected to continue to impact the effective tax rate for future years, although pre-IPO share based compensation awards became fully vested on July 1, 2017 and therefore the related impact to the effective tax rate will no longer exist after July 1, 2017.
46
Table of dividends on unvested share-based awards and vesting of restricted share-based awards; however, those items did not have a significant impact on our effective tax rate for the years ended December 31, 2017 and 2016.Contents
Results of Operations
Year Ended December 31, 2017,2021, Compared to Year Ended December 31, 2016
| For the Years Ended December 31, | Period-to-Period | |||||||||||||
| 2017 | 2016 | $ | % | |||||||||||
| Statements of operations data: | (in millions, except share and per-share data) | |||||||||||||
| Revenues | $ | 795.6 | $ | 720.9 | $ | 74.7 | 10 | % | ||||||
| Operating Expenses | ||||||||||||||
| Total compensation and benefits | 402.9 | 383.9 | 19.0 | 5 | % | |||||||||
| Other operating expenses | 106.3 | 102.8 | 3.5 | 3 | % | |||||||||
| Total operating expenses | 509.2 | 486.7 | 22.5 | 5 | % | |||||||||
| Total operating income | 286.4 | 234.2 | 52.2 | 22 | % | |||||||||
| Non-operating income (loss) | ||||||||||||||
| Interest expense | (11.4 | ) | (11.7 | ) | 0.3 | 3 | % | |||||||
| Other non-operating income (loss) | 296.2 | 2.0 | 294.2 | 14,710 | % | |||||||||
| Total non-operating income (loss) | 284.8 | (9.7 | ) | 294.5 | 3,036 | % | ||||||||
| Income before income taxes | 571.2 | 224.5 | 346.7 | 154 | % | |||||||||
| Provision for income taxes | 420.5 | 51.5 | 369.0 | 717 | % | |||||||||
| Net income before noncontrolling interests | 150.7 | 173.0 | (22.3 | ) | (13 | )% | ||||||||
| Less: Noncontrolling interests - Artisan Partners Holdings | 99.0 | 100.0 | (1.0 | ) | (1 | )% | ||||||||
| Less: Noncontrolling interests - consolidated investment products | 2.1 | — | 2.1 | 100 | % | |||||||||
| Net income attributable to Artisan Partners Asset Management Inc. | $ | 49.6 | $ | 73.0 | $ | (23.4 | ) | (32 | )% | |||||
| Per Share Data | ||||||||||||||
| Basic and diluted earnings per share | $ | 0.75 | $ | 1.57 | ||||||||||
| Basic and diluted weighted average number of common shares outstanding | 44,647,318 | 38,137,810 | ||||||||||||
| For the Years Ended December 31, | Period-to-Period | ||||||||||||||||||||||
| 2021 | 2020 | $ | % | ||||||||||||||||||||
| Statements of operations data: | (in millions, except share and per-share data) | ||||||||||||||||||||||
| Revenues | $ | 1,227.2 | $ | 899.6 | $ | 327.6 | 36 | % | |||||||||||||||
| Operating Expenses | |||||||||||||||||||||||
| Total compensation and benefits | 563.0 | 435.8 | 127.2 | 29 | % | ||||||||||||||||||
| Other operating expenses | 123.7 | 105.5 | 18.2 | 17 | % | ||||||||||||||||||
| Total operating expenses | 686.7 | 541.3 | 145.4 | 27 | % | ||||||||||||||||||
| Total operating income | 540.5 | 358.3 | 182.2 | 51 | % | ||||||||||||||||||
| Non-operating income (expense) | |||||||||||||||||||||||
| Interest expense | (10.8) | (10.8) | — | — | % | ||||||||||||||||||
| Other non-operating income | 21.9 | 21.8 | 0.1 | — | % | ||||||||||||||||||
| Total non-operating income (expense) | 11.1 | 11.0 | 0.1 | 1 | % | ||||||||||||||||||
| Income before income taxes | 551.6 | 369.3 | 182.3 | 49 | % | ||||||||||||||||||
| Provision for income taxes | 107.1 | 60.8 | 46.3 | 76 | % | ||||||||||||||||||
| Net income before noncontrolling interests | 444.5 | 308.5 | 136.0 | 44 | % | ||||||||||||||||||
| Less: Noncontrolling interests - Artisan Partners Holdings | 96.9 | 81.1 | 15.8 | 19 | % | ||||||||||||||||||
| Less: Noncontrolling interests - consolidated investment products | 11.1 | 14.8 | (3.7) | (25) | % | ||||||||||||||||||
| Net income attributable to Artisan Partners Asset Management Inc. | $ | 336.5 | $ | 212.6 | $ | 123.9 | 58 | % | |||||||||||||||
| Share Data | |||||||||||||||||||||||
| Basic earnings per share | $ | 5.10 | $ | 3.40 | |||||||||||||||||||
| Diluted earnings per share | $ | 5.09 | $ | 3.40 | |||||||||||||||||||
| Basic weighted average number of common shares outstanding | 59,866,790 | 55,633,529 | |||||||||||||||||||||
| Diluted weighted average number of common shares outstanding | 59,881,039 | 55,637,922 | |||||||||||||||||||||
Revenues
The increase in revenues of $74.7$327.6 million, or 10%36%, for the year ended December 31, 2017,2021, compared to the year ended December 31, 2016,2020, was driven primarily by a $12.5$46.9 billion, or 13%38%, increase in our average assets under management, partially offset by a decline$1.4 million decrease in the weighted average investment management fee.performance fee revenue. The weighted average investment management fee, of 73.1which excludes performance fees, was 70.7 basis points for the year ended December 31, 2017 decreased from 74.82021, compared to 70.9 basis points for the year ended December 31, 2016 primarily due to2020. The weighted average investment management fee remained relatively flat as a decrease in separate account fee rates resulting from tiered fee structures and client mix was mostly offset by the favorable rate impact of an increase in the proportion of our total assets managed inthrough Artisan Funds and Artisan Global Funds, which accrue management fees at a higher rate than separate accounts.
The following table sets forth the investment advisory fees and weighted average management fee and composition of revenue and assets under managementearned by investment vehicle:vehicle. The weighted average management fee for Artisan Funds and Artisan Global Funds reflects the additional services we provide to these pooled vehicles.
47
| Separate Accounts | Artisan Funds and Artisan Global Funds | Separate Accounts and Other (2) | Artisan Funds and Artisan Global Funds | |||||||||||||||||||||||||||||||||||
| For the Years Ended December 31, | 2017 | 2016 | 2017 | 2016 | For the Years Ended December 31, | 2021 | 2020 | 2021 | 2020 | |||||||||||||||||||||||||||||
| (dollars in millions) | (dollars in millions) | |||||||||||||||||||||||||||||||||||||
| Investment management fees | $ | 293.0 | $ | 250.3 | $ | 502.6 | $ | 470.6 | ||||||||||||||||||||||||||||||
| Weighted average fee | 54.0 basis points | 55.0 basis points | 92.1 basis points | 92.4 basis points | ||||||||||||||||||||||||||||||||||
| Investment advisory fees | Investment advisory fees | $ | 465.8 | $ | 362.4 | $ | 761.4 | $ | 537.2 | |||||||||||||||||||||||||||||
Weighted average management fee(1) | Weighted average management fee(1) | 51.3 bps | 52.6 bps | 91.2 bps | 91.6 bps | |||||||||||||||||||||||||||||||||
| Percentage of ending AUM | 50 | % | 49 | % | 50 | % | 51 | % | Percentage of ending AUM | 52 | % | 53 | % | 48 | % | 47 | % | |||||||||||||||||||||
(1) We compute our weighted average management fee by dividing annualized management fees (which excludes performance fees) by average assets under management for the applicable period. | (1) We compute our weighted average management fee by dividing annualized management fees (which excludes performance fees) by average assets under management for the applicable period. | |||||||||||||||||||||||||||||||||||||
(2) Separate accounts and other consists of assets we manage in or through vehicles other than Artisan Funds or Artisan Global Funds, including assets we manage in traditional separate accounts, Artisan-branded collective investment trusts and Artisan Private Funds, as well as assets under advisement related to clients for whom we provide investment models but do not have discretionary investment authority. | (2) Separate accounts and other consists of assets we manage in or through vehicles other than Artisan Funds or Artisan Global Funds, including assets we manage in traditional separate accounts, Artisan-branded collective investment trusts and Artisan Private Funds, as well as assets under advisement related to clients for whom we provide investment models but do not have discretionary investment authority. | |||||||||||||||||||||||||||||||||||||
Operating Expenses
The increase in total operating expenses of $22.5$145.4 million, or 5%27%, for the year ended December 31, 2017,2021, compared to the year ended December 31, 2016,2020, was primarily a result of higher incentive compensation and third-party distribution expense duerelated to increased revenues, additional post-IPO equity grants,increases in compensation and an increasebenefits as a result of increased headcount, higher long-term incentive compensation costs as a result of the grant in the numberJanuary 2021, and higher technology and professional fee expense as a result of employees, including costs incurred related to our eighth investment team founded in the fourth quarter of 2016. These increases were partially offset by decreases in third-party intermediary and pre-offering related equity compensation expenses.firm initiatives.
Compensation and Benefits
| For the Years Ended December 31, | Period-to-Period | |||||||||||||
| 2017 | 2016 | $ | % | |||||||||||
| (in millions) | ||||||||||||||
Salaries, incentive compensation and benefits (1) | $ | 341.1 | $ | 312.6 | $ | 28.5 | 9 | % | ||||||
| Restricted share-based award compensation expense | 49.1 | 43.2 | 5.9 | 14 | % | |||||||||
| Total salaries, incentive compensation and benefits | 390.2 | 355.8 | 34.4 | 10 | % | |||||||||
| Pre-offering related compensation - share-based awards | 12.7 | 28.1 | (15.4 | ) | (55 | )% | ||||||||
| Total compensation and benefits | $ | 402.9 | $ | 383.9 | $ | 19.0 | 5 | % | ||||||
(1) Excluding restricted share-based award compensation expense | ||||||||||||||
| For the Years Ended December 31, | Period-to-Period | ||||||||||||||||||||||
| 2021 | 2020 | $ | % | ||||||||||||||||||||
| (in millions) | |||||||||||||||||||||||
Salaries, incentive compensation and benefits (1) | $ | 516.9 | $ | 399.3 | $ | 117.6 | 29 | % | |||||||||||||||
| Long-term incentive compensation awards | 46.1 | 36.5 | 9.6 | 26 | % | ||||||||||||||||||
| Total compensation and benefits | $ | 563.0 | $ | 435.8 | $ | 127.2 | 29 | % | |||||||||||||||
(1) Excluding long-term incentive compensation awards | |||||||||||||||||||||||
The increase in salaries, incentive compensation and benefits was driven primarily by a $21.5$96.0 million increase in incentive compensation paid to our investment and marketing professionals as a result of the increase in revenue. The remaining increase is primarily due to costs associated withrevenue, and higher salary and benefits expenses on an increase in theincreased number of employees, including employees on our eighth investment team.employees.
Total salaries, incentive compensation and benefits was 49%46% and 48% of our revenues for the years ended December 31, 20172021 and 2016.2020, respectively.
Other operating expenses
Other operating expenses increased $3.5$18.2 million for the year ended December 31, 2017,2021, compared to the year ended December 31, 2016,2020, primarily due to a $3.1$7.4 million increase in general and administrative expenses, and a $1.9 millionthird-party distribution expense related to an increase in communicationAUM subject to those fees, and higher technology and professional fee expense as a result of increased information subscriptions and market data costs.firm initiatives.
48
Non-Operating Income (Loss)(Expense)
Non-operating income (expense) consisted of the following:
| For the Years Ended December 31, | Period-to-Period | ||||||||||||||||||||||
| 2021 | 2020 | $ | % | ||||||||||||||||||||
| (in millions) | |||||||||||||||||||||||
| Interest expense | $ | (10.8) | $ | (10.8) | $ | — | — | % | |||||||||||||||
| Net investment gain (loss) of consolidated investment products | 19.7 | 26.2 | (6.5) | (25) | % | ||||||||||||||||||
| Other investment gain (loss) | 1.8 | 0.3 | 1.5 | 500 | % | ||||||||||||||||||
| Net gain (loss) on the tax receivable agreements | 0.4 | (4.7) | 5.1 | (109) | % | ||||||||||||||||||
| Total non-operating income (expense) | $ | 11.1 | $ | 11.0 | $ | 0.1 | 1 | % | |||||||||||||||
Non-operating income (loss)(expense) for the year ended December 31, 20172021 includes $290.9a $0.4 million of incomegain relating to changesa change in the estimate of the payment obligation under the tax receivable agreements, including changes relating to Tax Reform, compared to $0.7a $4.7 million of incomeloss for the year ended December 31, 2016.2020. The effect of changes in that estimate after the date of an exchange or sale is included in net income.
Provision for Income Taxes
APAM’s effective income tax rate for the years ended December 31, 20172021 and 20162020 was 73.6%19.4% and 22.9%16.5%, respectively. The increase in effective tax rate increase was primarily due to Tax Reforman increase in APAM’s ownership in Holdings as the tax rate used to measure ourwell as a remeasurement of deferred tax assets decreasedin 2020, resulting from 37.0%an increase in estimated state income tax rates in 2020. An increase in Artisan's state deferred income tax rates results in an increase to 23.5%, which resulted in a reduction to our deferred tax assets of $352 million with a corresponding increasedecrease to the provision for income taxes for the year ended December 31, 2017. The increase in APAM’s equity ownership in Holdings also increasedtaxes.
Several factors contribute to the effective income tax rate. Forrate, including a rate benefit attributable to the year ended December 31, 2017,fact that approximately 38%19% and 24% of Holdings’ full year projected taxable earnings were not subject to corporate-level taxes compared to approximately 47% for the yearyears ended December 31, 2016.
2021 and 2020, respectively. Thus, income before income taxes includes amounts that are attributable to noncontrolling interests and not taxable to APAM and its subsidiaries, which reduces the effective tax rate. As APAM’s equity ownership in Holdings increases, the effective tax rate will likewise increase as more income will be subject to corporate-level taxes. The effective tax rate was favorably impacted in both periods due to tax deductible dividends paid on unvested restricted share-based awards and favorable tax deductions related to the vesting of restricted share-based awards.
Earnings Per Share
Weighted average basic and diluted shares of Class A common stock outstanding were higher for the year ended December 31, 2017,2021, compared to the year ended December 31, 2016,2020, as a result of stock offerings, unit exchanges, and equity award grants. See Note 12, “Earnings Per Share” in the Notes to the Consolidated Financial Statements in Item 8 of this report for further discussion of earnings per share.
Year Ended December 31, 20162020 Compared to the Year Ended December 31, 20152019
| For the Years Ended December 31, | For the Period-to-Period | ||||||||||||||||||||||
| 2020 | 2019 | $ | % | ||||||||||||||||||||
| Statements of operations data: | (in millions, except share and per-share data) | ||||||||||||||||||||||
| Revenues | $ | 899.6 | $ | 799.0 | $ | 100.6 | 13 | % | |||||||||||||||
| Operating Expenses | |||||||||||||||||||||||
| Total compensation and benefits | 435.8 | 400.5 | 35.3 | 9 | % | ||||||||||||||||||
| Other operating expenses | 105.5 | 115.0 | (9.5) | (8) | % | ||||||||||||||||||
| Total operating expenses | 541.3 | 515.5 | 25.8 | 5 | % | ||||||||||||||||||
| Total operating income | 358.3 | 283.5 | 74.8 | 26 | % | ||||||||||||||||||
| Non-operating income (expense) | |||||||||||||||||||||||
| Interest expense | (10.8) | (11.1) | 0.3 | 3 | % | ||||||||||||||||||
| Other non-operating income | 21.8 | (3.1) | 24.9 | 803 | % | ||||||||||||||||||
| Total non-operating income (expense) | 11.0 | (14.2) | 25.2 | 177 | % | ||||||||||||||||||
| Income before income taxes | 369.3 | 269.3 | 100.0 | 37 | % | ||||||||||||||||||
| Provision for income taxes | 60.8 | 27.8 | 33.0 | 119 | % | ||||||||||||||||||
| Net income before noncontrolling interests | 308.5 | 241.5 | 67.0 | 28 | % | ||||||||||||||||||
| Less: Noncontrolling interests - Artisan Partners Holdings | 81.1 | 80.1 | 1.0 | 1 | % | ||||||||||||||||||
| Less: Noncontrolling interests - consolidated investment products | 14.8 | 4.9 | 9.9 | 202 | % | ||||||||||||||||||
| Net income attributable to Artisan Partners Asset Management Inc. | $ | 212.6 | $ | 156.5 | $ | 56.1 | 36 | % | |||||||||||||||
| Share Data | |||||||||||||||||||||||
| Basic earnings per share | $ | 3.40 | $ | 2.65 | |||||||||||||||||||
| Diluted earnings per share | $ | 3.40 | $ | 2.65 | |||||||||||||||||||
| Basic weighted average number of common shares outstanding | 55,633,529 | 51,127,929 | |||||||||||||||||||||
| Diluted weighted average number of common shares outstanding | 55,637,922 | 51,127,929 | |||||||||||||||||||||
| For the Years Ended December 31, | For the Period-to-Period | |||||||||||||
| 2016 | 2015 | $ | % | |||||||||||
| Statements of operations data: | (in millions, except share and per-share data) | |||||||||||||
| Revenues | $ | 720.9 | $ | 805.5 | $ | (84.6 | ) | (11 | )% | |||||
| Operating Expenses | ||||||||||||||
| Total compensation and benefits | 383.9 | 414.3 | (30.4 | ) | (7 | )% | ||||||||
| Other operating expenses | 102.8 | 108.8 | (6.0 | ) | (6 | )% | ||||||||
| Total operating expenses | 486.7 | 523.1 | (36.4 | ) | (7 | )% | ||||||||
| Total operating income | 234.2 | 282.4 | (48.2 | ) | (17 | )% | ||||||||
| Non-operating income (loss) | ||||||||||||||
| Interest expense | (11.7 | ) | (11.7 | ) | — | — | % | |||||||
| Other non-operating income (loss) | 2.0 | (11.8 | ) | 13.8 | 117 | % | ||||||||
| Total non-operating income (loss) | (9.7 | ) | (23.5 | ) | 13.8 | 59 | % | |||||||
| Income before income taxes | 224.5 | 258.9 | (34.4 | ) | (13 | )% | ||||||||
| Provision for income taxes | 51.5 | 46.8 | 4.7 | 10 | % | |||||||||
| Net income before noncontrolling interests | 173.0 | 212.1 | (39.1 | ) | (18 | )% | ||||||||
| Less: Noncontrolling interests - Artisan Partners Holdings | 100.0 | 130.3 | (30.3 | ) | (23 | )% | ||||||||
| Net income attributable to Artisan Partners Asset Management Inc. | $ | 73.0 | $ | 81.8 | $ | (8.8 | ) | (11 | )% | |||||
| Per Share Data | ||||||||||||||
| Basic and diluted earnings per share | $ | 1.57 | $ | 1.86 | ||||||||||
| Basic and diluted weighted average number of common shares outstanding | 38,137,810 | 35,448,550 | ||||||||||||
50
Table of a shift in the mix of our assets under management between our investment strategies and vehicles, mainly an increase in the proportion of our total assets managed through separate accounts.Contents
| Separate Accounts | Artisan Funds and Artisan Global Funds | ||||||||||||||
| For the Years Ended December 31, | 2016 | 2015 | 2016 | 2015 | |||||||||||
| (dollars in millions) | |||||||||||||||
| Investment management fees | $ | 250.3 | $ | 262.2 | $ | 470.6 | $ | 543.3 | |||||||
| Weighted average fee | 55.0 basis points | 54.7 basis points | 92.4 basis points | 92.6 basis points | |||||||||||
| Percentage of ending AUM | 49 | % | 46 | % | 51 | % | 54 | % | |||||||
| For the Years Ended December 31, | Period-to-Period | |||||||||||||
| 2016 | 2015 | $ | % | |||||||||||
| (in millions) | ||||||||||||||
Salaries, incentive compensation and benefits (1) | $ | 312.6 | $ | 335.7 | $ | (23.1 | ) | (7 | )% | |||||
| Restricted share-based award compensation expense | 43.2 | 36.5 | 6.7 | 18 | % | |||||||||
| Total salaries, incentive compensation and benefits | 355.8 | 372.2 | (16.4 | ) | (4 | )% | ||||||||
| Pre-offering related compensation - share-based awards | 28.1 | 42.1 | (14.0 | ) | (33 | )% | ||||||||
| Total compensation and benefits | $ | 383.9 | $ | 414.3 | $ | (30.4 | ) | (7 | )% | |||||
(1) Excluding restricted share-based award compensation expense | ||||||||||||||
Supplemental Non-GAAP Financial Information
Our management uses non-GAAP measures (referred to as “adjusted” measures) of net income and operating income to evaluate the profitability and efficiency of the underlying operations of our business and as a factor when considering net income available for distributions and dividends. These adjusted measures remove the impact of (1) pre-offering related compensation, (2) net gain (loss) on the tax receivable agreements (if any), (2) compensation expense related to market valuation changes in compensation plans, (3) net investment gain (loss) of consolidated investment products, and (4) the adjustment toremeasurement of deferred taxes as a result of Tax Reform.taxes. These adjustments also remove the non-operational complexities of our structure by adding back non-controllingnoncontrolling interests and assuming all income of Artisan Partners Holdings is allocated to APAM. Management believes these non-GAAP measures provide more meaningful information to analyze our profitability and efficiency between periods and over time. We have included these non-GAAP measures to provide investors with the same financial metrics used by management to manage the company.Company.
Non-GAAP measures should be considered in addition to, and not as a substitute for, financial measures prepared in accordance with GAAP. Our non-GAAP measures may differ from similar measures used by other companies, even if similar terms are used to identify such measures. Our non-GAAP measures are as follows:
•Adjusted net income represents net income excluding the impact of (1) pre-offering related compensation, (2) net gain (loss) on the tax receivable agreements (if any), (2) compensation expense related to market valuation changes in compensation plans, (3) net investment gain (loss) of consolidated investment products, and (4) the adjustment toremeasurement of deferred taxes as a result of Tax Reform.taxes. Adjusted net income also reflects income taxes assuming the vesting of all unvested Class A share-based awards and as if all outstanding limited partnership units of Artisan Partners Holdings had been exchanged for Class A common stock of APAM on a one-for-one basis. Assuming full vesting and exchange, all income of Artisan Partners Holdings is treated as if it were allocated to APAM, and the adjusted provision for income taxes represents an estimate of income tax expense at an effective rate reflecting assumedAPAM's current federal, state, and local income taxes.statutory tax rates. The estimated adjusted effective tax rate was 37.0%24.7%, 24.7% and 24.1% for the periods presented. We estimate our adjusted effective tax rate will be 23.5% in 2018 as a result of Tax Reform.years ended December 31, 2021, 2020, and 2019, respectively.
•Adjusted net income per adjusted share is calculated by dividing adjusted net income by adjusted shares. The number of adjusted shares is derived by assuming the vesting of all unvested Class A share-based awards and the exchange of all outstanding limited partnership units of Artisan Partners Holdings for Class A common stock of APAM on a one-for-one basis.
•Adjusted operating income represents the operating income of the consolidated company excluding pre-offeringcompensation expense related compensation.to market valuation changes in compensation plans.
•Adjusted operating margin is calculated by dividing adjusted operating income by total revenues.
•Adjusted EBITDA represents adjusted net income before interest expense, income taxes, depreciation and amortization expense.
Net gain (loss) on the tax receivable agreements represents the income (expense) associated with the change in estimate of amounts payable under the tax receivable agreements entered into in connection with APAM’s initial public offering and related reorganization.
Compensation expense related to market valuation changes in compensation plans represents the expense (income) associated with the change in the long term incentive award liability resulting from investment returns of the underlying investment products. Because the compensation expense impact of the investment market exposure is economically hedged, management believes it is useful to reflect the expected net income offset in the calculation of adjusted operating income, adjusted net income, and adjusted EBITDA. The related investment gain (loss) on the underlying investments is included in the adjustment for net investment gain (loss) of investment products.
Net investment gain (loss) of consolidated investment products represents the investmentnon-operating income (loss)(expense) related to the Company’s investments, in both consolidated investment products that are included inand nonconsolidated investment products, including investments held to economically hedge compensation plans. Excluding these non-operating market gains or losses on investments provides greater transparency to evaluate the Company’s consolidated financial statements because Artisan holds a controlling financial interest in the respective investment entities. The investment income (loss), including the Company’s proportionate share, is removed from the adjusted measures to provide greater transparencyprofitability and efficiency of the underlying operations of the business.
51
Table of Tax Reform represents the non-cash increase in the provision for income taxes resulting from the change in federal corporate tax rates enacted during the December quarter of 2017. The tax rate used to measure deferred tax assets decreased from 37.0% to 23.5%, which resulted in a reduction to deferred tax assets of $352 million with a corresponding increase to the provision for income taxes. The reduction in certain deferred tax assets also resulted in a $290 million decrease in the amounts payable under the tax receivable agreements, which resulted in a corresponding increase to non-operating income.Contents
The following table sets forth, for the periods indicated, a reconciliation from GAAP financial measures to non-GAAP measures:
| For the Years Ended December 31, | |||||||||||||||||||||||||||||
| 2021 | 2020 | 2019 | |||||||||||||||||||||||||||
| (unaudited; in millions, except per share data) | |||||||||||||||||||||||||||||
| Reconciliation of non-GAAP financial measures: | |||||||||||||||||||||||||||||
| Net income attributable to Artisan Partners Asset Management Inc. (GAAP) | $ | 336.5 | $ | 212.6 | $ | 156.5 | |||||||||||||||||||||||
| Add back: Net income attributable to noncontrolling interests - Artisan Partners Holdings | 96.9 | 81.1 | 80.1 | ||||||||||||||||||||||||||
| Add back: Provision for income taxes | 107.1 | 60.8 | 27.8 | ||||||||||||||||||||||||||
| Add back: Compensation expense related to market valuation changes in compensation plans | 0.3 | — | — | ||||||||||||||||||||||||||
| Add back: Net (gain) loss on the tax receivable agreements | (0.4) | 4.7 | 19.6 | ||||||||||||||||||||||||||
| Add back: Net investment (gain) loss of investment products attributable to APAM | (9.3) | (10.3) | (9.9) | ||||||||||||||||||||||||||
| Less: Adjusted provision for income taxes | 131.2 | 86.2 | 66.1 | ||||||||||||||||||||||||||
| Adjusted net income (Non-GAAP) | $ | 399.9 | $ | 262.7 | $ | 208.0 | |||||||||||||||||||||||
| Average shares outstanding | |||||||||||||||||||||||||||||
| Class A common shares | 59.9 | 55.6 | 51.1 | ||||||||||||||||||||||||||
| Assumed vesting or exchange of: | |||||||||||||||||||||||||||||
| Unvested Class A restricted share-based awards | 5.4 | 5.4 | 5.1 | ||||||||||||||||||||||||||
| Artisan Partners Holdings units outstanding (noncontrolling interests) | 14.2 | 17.9 | 21.8 | ||||||||||||||||||||||||||
| Adjusted shares | 79.5 | 78.9 | 78.0 | ||||||||||||||||||||||||||
| Basic earnings per share (GAAP) | $ | 5.10 | $ | 3.40 | $ | 2.65 | |||||||||||||||||||||||
| Diluted earnings per share (GAAP) | $ | 5.09 | $ | 3.40 | $ | 2.65 | |||||||||||||||||||||||
| Adjusted net income per adjusted share (Non-GAAP) | $ | 5.03 | $ | 3.33 | $ | 2.67 | |||||||||||||||||||||||
| Operating income (GAAP) | $ | 540.5 | $ | 358.3 | $ | 283.5 | |||||||||||||||||||||||
| Add back: Compensation expense related to market valuation changes in compensation plans | 0.3 | — | — | ||||||||||||||||||||||||||
| Adjusted operating income (Non-GAAP) | $ | 540.8 | $ | 358.3 | $ | 283.5 | |||||||||||||||||||||||
| Operating margin (GAAP) | 44.0 | % | 39.8 | % | 35.5 | % | |||||||||||||||||||||||
| Adjusted operating margin (Non-GAAP) | 44.1 | % | 39.8 | % | 35.5 | % | |||||||||||||||||||||||
| Net income attributable to Artisan Partners Asset Management Inc. (GAAP) | $ | 336.5 | $ | 212.6 | $ | 156.5 | |||||||||||||||||||||||
| Add back: Net income attributable to noncontrolling interests - Artisan Partners Holdings | 96.9 | 81.1 | 80.1 | ||||||||||||||||||||||||||
| Add back: Net (gain) loss on the tax receivable agreements | (0.4) | 4.7 | 19.6 | ||||||||||||||||||||||||||
| Add back: Net investment (gain) loss of investment products attributable to APAM | (9.3) | (10.3) | (9.9) | ||||||||||||||||||||||||||
| Add back: Compensation expense related to market valuation changes in compensation plans | 0.3 | — | — | ||||||||||||||||||||||||||
| Add back: Interest expense | 10.8 | 10.8 | 11.1 | ||||||||||||||||||||||||||
| Add back: Provision for income taxes | 107.1 | 60.8 | 27.8 | ||||||||||||||||||||||||||
| Add back: Depreciation and amortization | 7.0 | 6.6 | 6.8 | ||||||||||||||||||||||||||
| Adjusted EBITDA (Non-GAAP) | $ | 548.9 | $ | 366.3 | $ | 292.0 | |||||||||||||||||||||||
52
| For the Years Ended December 31, | |||||||||||
| 2017 | 2016 | 2015 | |||||||||
| (in millions, except per share data) | |||||||||||
| Reconciliation of non-GAAP financial measures: | |||||||||||
| Net income attributable to Artisan Partners Asset Management Inc. (GAAP) | $ | 49.6 | $ | 73.0 | $ | 81.8 | |||||
| Add back: Net income attributable to noncontrolling interests - Artisan Partners Holdings | 99.0 | 100.0 | 130.3 | ||||||||
| Add back: Provision for income taxes | 420.5 | 51.5 | 46.8 | ||||||||
| Add back: Pre-offering related compensation - share-based awards | 12.7 | 28.1 | 42.1 | ||||||||
| Add back: Net (gain) loss on the tax receivable agreements | (290.9 | ) | (0.7 | ) | 12.2 | ||||||
| Add back: Net investment (gain) loss of consolidated investment products attributable to APAM | (1.9 | ) | — | — | |||||||
| Less: Adjusted provision for income taxes | 106.9 | 93.2 | 115.9 | ||||||||
| Adjusted net income (Non-GAAP) | $ | 182.1 | $ | 158.7 | $ | 197.3 | |||||
| Average shares outstanding | |||||||||||
| Class A common shares | 44.6 | 38.1 | 35.4 | ||||||||
| Assumed vesting or exchange of: | |||||||||||
| Unvested Class A restricted share-based awards | 4.2 | 3.6 | 3.1 | ||||||||
| Artisan Partners Holdings units outstanding (noncontrolling interest) | 26.8 | 32.8 | 35.0 | ||||||||
| Adjusted shares | 75.6 | 74.5 | 73.5 | ||||||||
| Basic and diluted earnings per share (GAAP) | $ | 0.75 | $ | 1.57 | $ | 1.86 | |||||
| Adjusted net income per adjusted share (Non-GAAP) | $ | 2.41 | $ | 2.13 | $ | 2.69 | |||||
| Operating income (GAAP) | $ | 286.4 | $ | 234.2 | $ | 282.4 | |||||
| Add back: Pre-offering related compensation - share-based awards | 12.7 | 28.1 | 42.1 | ||||||||
| Adjusted operating income (Non-GAAP) | $ | 299.1 | $ | 262.3 | $ | 324.5 | |||||
| Operating margin (GAAP) | 36.0 | % | 32.5 | % | 35.1 | % | |||||
| Adjusted operating margin (Non-GAAP) | 37.6 | % | 36.4 | % | 40.3 | % | |||||
| Net income attributable to Artisan Partners Asset Management Inc. (GAAP) | $ | 49.6 | $ | 73.0 | $ | 81.8 | |||||
| Add back: Net income attributable to noncontrolling interests - Artisan Partners Holdings | 99.0 | 100.0 | 130.3 | ||||||||
| Add back: Pre-offering related compensation - share-based awards | 12.7 | 28.1 | 42.1 | ||||||||
| Add back: Net (gain) loss on the tax receivable agreements | (290.9 | ) | (0.7 | ) | 12.2 | ||||||
| Add back: Net investment (gain) loss of consolidated investment products attributable to APAM | (1.9 | ) | — | — | |||||||
| Add back: Interest expense | 11.4 | 11.7 | 11.7 | ||||||||
| Add back: Provision for income taxes | 420.5 | 51.5 | 46.8 | ||||||||
| Add back: Depreciation and amortization | 5.3 | 5.2 | 4.5 | ||||||||
| Adjusted EBITDA (Non-GAAP) | $ | 305.7 | $ | 268.8 | $ | 329.4 | |||||
Liquidity and Capital Resources
Our working capital needs, including accrued incentive compensation payments, have been and are expected to be met primarily through cash generated by our operations. The assets and liabilities of consolidated investment products attributable to third-party investors do not impact our liquidity and capital resources. We have no right to the benefits from, nor do we bear the risks associated with, the assets and liabilities of consolidated investment products, beyond our direct equity investment and any investment managementadvisory fees and incentive allocations earned. Accordingly, assets and liabilities of consolidated investment products attributable to third-party investors are excluded from the amounts and discussions below. The following table shows our liquidity position as of December 31, 20172021 and December 31, 2016.
| December 31, 2017 | December 31, 2016 | ||||||
| (in millions) | |||||||
| Cash and cash equivalents | $ | 137.3 | $ | 156.8 | |||
| Accounts receivable | $ | 76.7 | $ | 59.7 | |||
Seed investments(1) | $ | 40.3 | $ | 6.3 | |||
| Undrawn commitment on revolving credit facility | $ | 100.0 | $ | 100.0 | |||
(1) Seed investments includes available-for-sale investments in unconsolidated sponsored investment entities, as well as Artisan’s direct equity investments in consolidated investment products. | |||||||
| December 31, 2021 | December 31, 2020 | ||||||||||
| (in millions) | |||||||||||
| Cash and cash equivalents | $ | 189.2 | $ | 155.0 | |||||||
| Accounts receivable | $ | 115.9 | $ | 99.9 | |||||||
Seed investments(1) | $ | 71.9 | $ | 62.6 | |||||||
| Undrawn commitment on revolving credit facility | $ | 100.0 | $ | 100.0 | |||||||
(1) Seed investments include Artisan's direct equity investments in consolidated and nonconsolidated Artisan-sponsored investment products. The balance excludes $37.9 million of investments made related to funded long-term incentive compensation plans. | |||||||||||
We manage our cash balances in order to fund our day-to-day operations. Accounts receivable primarily represent investment managementadvisory fees that have been earned, but not yet received from our clients. We perform a review of our receivables on a monthly basis to assess collectability. As of December 31, 2017,2021, none of our receivables were considered uncollectable. We also maintain a $100 million revolving credit facility, which was unused as of and for the year ended December 31, 2017.uncollectible.
We utilize capitalcash to make seed investments in Artisan-sponsored fundsinvestment products to support the development of new strategies.investment strategies and vehicles. As of December 31, 2017,2021, the balance of all seed investments, including investments in consolidated investment products, was $40.3$71.9 million. The seed investments are generally redeemable at our discretion.
During the year ended December 31, 2021, we also made investments of $35.0 million related to funded long-term incentive compensation plans. As of December 31, 2021, the value of investments held related to funded long-term incentive compensation plans was $37.9 million. In August 2012,the first quarter of 2022, we issuedintend to invest an additional $48.6 million in funded long-term incentive compensation plans related to the grant that was approved by our Board on January 25, 2022.
We expect our investment portfolio to continue to grow as we grant additional annual franchise capital awards and make seed investments in new investment strategies and vehicles.
We have $200 million in unsecured notes outstanding and entered into a $100 million five-year revolving credit facility.facility with a five-year term ending August 2022. The notes wereare comprised of three series, Series A,C, Series B,D, and Series C,E, each with a balloon payment at maturity.
The fixed interest rate on each series of unsecured notes is subject to a 100 basis point increase in the event Holdings receives a below-investment grade rating and any such increase will continue to apply until an investment grade rating is received. Holdings maintained an investment grade rating for the year ended December 31, 2017.2021.
These borrowings contain certain customary covenants including limitations on Artisan Partners Holdings’ ability to: (i) incur additional indebtedness or liens, (ii) engage in mergers or other fundamental changes, (iii) sell or otherwise dispose of assets including equity interests, and (iv) make dividend payments or other distributions to Artisan Partners Holdings’ partners (other than, among others, tax distributions paid to partners for the purpose of funding tax liabilities attributable to their interests) when a default occurred and is continuing or would result from such a distribution. In addition, in the event of a Change of Control (as defined in the Note Purchase Agreement) or if Artisan’s average assets under management for a fiscal quarter is below $45 billion, Holdings is generally required to offer to pre-pay the notes. Artisan Partners Limited Partnership, a wholly-owned subsidiary of Holdings, has guaranteed Holdings’ obligations under the terms of the Note Purchase Agreement.
In addition, covenants in the note purchase and revolving credit agreements require Artisan Partners Holdings to maintain the following financial ratios:
•leverage ratio (calculated as the ratio of consolidated total indebtedness on any date to consolidated EBITDA for the period of four consecutive fiscal quarters ended on or prior to such date) cannot exceed 3.00 to 1.00 (Artisan Partners Holdings’ leverage ratio for the year ended December 31, 20172021 was 0.60.3 to 1.00); and
53
•interest coverage ratio (calculated as the ratio of consolidated EBITDA for any period of four consecutive fiscal quarters to consolidated interest expense for such period) cannot be less than 4.00 to 1.00 for such period (Artisan Partners Holdings’ interest coverage ratio for the year ended December 31, 20172021 was 32.957.9 to 1.00).
Our failure to comply with any of the covenants or restrictions described above could result in an event of default under the agreements, giving our lenders the ability to accelerate repayment of our obligations. We were in compliance with all debt covenants as of December 31, 2017.
2021.
Distributions and Dividends
Artisan Partners Holdings’ distributions, including distributions to APAM, for the years ended December 31, 20172021 and 20162020 were as follows:
| For the Years Ended December 31, | |||||||||||
| 2021 | 2020 | ||||||||||
| (in millions) | |||||||||||
| Holdings Partnership Distributions to Limited Partners | $ | 93.2 | $ | 85.8 | |||||||
| Holdings Partnership Distributions to APAM | 400.2 | 270.0 | |||||||||
| Total Holdings Partnership Distributions | $ | 493.4 | $ | 355.8 | |||||||
| For the Years Ended December 31, | |||
| 2017 | 2016 | ||
| (in millions) | |||
| Holdings Partnership Distributions to Limited Partners | $115.8 | $133.9 | |
| Holdings Partnership Distributions to APAM | $197.1 | $160.5 | |
| Total Holdings Partnership Distributions | $312.9 | $294.4 | |
APAM declared and paid the following dividends per share during the years ended December 31, 20172021 and 2016:2020:
| For the Years Ended December 31, | ||||||||||||||||||||
| Type of Dividend | Class of Stock | 2021 | 2020 | |||||||||||||||||
| Quarterly | Common Class A | $ | 3.92 | $ | 2.79 | |||||||||||||||
| Special Annual | Common Class A | $ | 0.31 | $ | 0.60 | |||||||||||||||
| Type of Dividend | Class of Stock | For the Years Ended December 31, | ||||
| 2017 | 2016 | |||||
| Quarterly | Common Class A | $2.40 | $2.40 | |||
| Special Annual | Common Class A | $0.36 | $0.40 | |||
Subject to boardBoard approval each quarter, we currently expect to pay a quarterly dividend of $0.60 per shareapproximately 80% of Class A common stock.the cash the Company generates each quarter. We expect our quarterly cash generation to approximate adjusted net income plus long-term incentive compensation award expense, less cash reserved for future franchise capital awards (which we expect will approximate 4% of investment management revenues each quarter) with additional adjustments made for certain other sources and uses of cash, including capital expenditures. After the end of the year, our boardBoard will consider paying a special dividend that will take into consideration our annual adjusted earnings, business conditions andafter determining the amount of cash we want to retain at that time.needed for general corporate purposes and investments in growth and strategic initiatives. Although we expect to pay dividends according to our dividend policy, we may not pay dividends according to our policy or at all. We expect that our management and board will consider changes to our dividend policy during the course of 2018, including consideration of a variable quarterly dividend.
Tax Receivable Agreements (“TRAs”)
In addition to funding our normal operations, we will be required to fund amounts payable under the TRAs that we entered into in connection with the IPO, which resulted in the recognition of a $385.4$425.4 million liability as of December 31, 2017.2021. The liability generally represents 85% of the tax benefits APAM expects to realize as a result of the merger of an entity into APAM as part of the IPO Reorganization, our purchase of partnership units from limited partners of Holdings and the exchange of partnership units (for shares of Class A common stock or other consideration). The estimated liability assumes no material changes in the relevant tax law and that APAM earns sufficient taxable income to realize all tax benefits subject to the TRAs. As previously discussed, the TRA liability was reduced as a result of Tax Reform enactedAn increase or decrease in December 2017. Future increases or decreases infuture tax rates will increase or decrease, respectively, the expected tax benefits APAM would realize and the amounts payable under the TRAs. Changes in the estimate of expected tax benefits APAM would realize and the amounts payable under the TRAs as a result of change in tax rates have been and will be recorded in net income.
The liability will increase upon future purchases or exchanges of limited partnership units with the increase representing amounts payable under the TRAs equal to 85% of the estimated future tax benefits, if any, resulting from such purchases or exchanges.
54
We intend to fund the payment of amounts due under the TRAs out of the reduced tax payments that APAM realizes in respect of the tax attributes to which the TRAs relate.
The actual increase in tax basis, as well as the amount and timing of any payments under these agreements, will vary depending upon a number of factors, including the timing of sales or exchanges by the holders of limited partnership units, the price of the Class A common stock at the time of such sales or exchanges, whether such sales or exchanges are taxable, the amount and timing of the taxable income APAM generates in the future and the tax rate then applicable and the portion of APAM’s payments under the TRAs constituting imputed interest or depreciable basis or amortizable basis.
In certain cases, payments under the TRAs may be accelerated and/or significantly exceed the actual benefits we realize in respect of the tax attributes subject to the TRAs. In such cases, we intend to fund those payments with cash on hand, although we may have to borrow funds depending on the amount and timing of the payments. During the year ended December 31, 2017,2021, we made payments of $30.3$31.3 million, related to the TRAs, including interest, were made in accordance with the TRA agreements. Weinterest. In 2022, we expect to make payments of approximately $36$33 million in 2018 related to the TRAs.
Cash Flows
| For the Years Ended December 31, | |||||||||||||||||
| 2021 | 2020 | 2019 | |||||||||||||||
| (in millions) | |||||||||||||||||
| Cash, cash equivalents and restricted cash as of January 1, | $ | 199.5 | $ | 144.3 | $ | 175.5 | |||||||||||
| Net cash provided by operating activities | 398.5 | 318.7 | 292.9 | ||||||||||||||
| Net cash provided by (used in) investing activities | (27.0) | 18.7 | (17.5) | ||||||||||||||
| Net cash used in financing activities | (335.4) | (282.2) | (306.6) | ||||||||||||||
| Net impact of deconsolidation of consolidated investment products | (34.8) | — | — | ||||||||||||||
| Cash, cash equivalents and restricted cash as of December 31, | $ | 200.8 | $ | 199.5 | $ | 144.3 | |||||||||||
| For the Years Ended December 31, | |||||||||||
| 2017 | 2016 | 2015 | |||||||||
| (in millions) | |||||||||||
| Cash as of January 1 | $ | 156.8 | $ | 166.2 | $ | 182.3 | |||||
| Net cash provided by operating activities | 204.1 | 270.4 | 321.2 | ||||||||
| Net cash used in investing activities | (4.7 | ) | (2.1 | ) | (11.3 | ) | |||||
| Net cash used in financing activities | (218.9 | ) | (277.7 | ) | (326.0 | ) | |||||
| Cash as of December 31, | $ | 137.3 | $ | 156.8 | $ | 166.2 | |||||
Year Ended December 31, 20172021 Compared to Year Ended December 31, 20162020
Net cash provided by operating activities decreased $66.3increased $79.8 million duringfor the year ended December 31, 2017 primarily due to $92.5 million of net operating cash used by consolidated investment products, partially offset by increased revenues and operating income resulting from an increase in average assets under management. For the year ended December 31, 20172021, compared to the year ended December 31, 2016,2020, primarily due to an increase in operating income resulting from higher average AUM and revenues, partially offset by decreases in operating cash flows from consolidated investment products and an increase in income tax payments. For the year ended December 31, 2021 compared to the year ended December 31, 2020, our operating income, excluding noncash share-based and pre-offering related compensation expenses,expense, increased $42.8$184.9 million. Timing differences in working capital accounts reduced operatingOperating cash flows were negatively impacted by $14.5a $69.5 million reduction in 2017, compared to 2016.cash provided by consolidated investment products and a $34.9 million increase in cash paid for income taxes.
Investing activities consist primarily of acquiring and selling property and equipment, leasehold improvements and the purchase and sale of available-for-saleinvestment securities. Net cash used inby investing activities increased $2.6$45.7 million during the year ended December 31, 20172021, primarily due to a $3.8$42.8 million decreaseincrease in net proceeds from the salepurchases of investment securities, partially offset bywhich includes $34.1 million of investment securities related to funded long-term incentive compensation plans, and a $1.4$2.9 million decreaseincrease in acquisitionacquisitions of property and equipment and leasehold improvements.
Financing activities consist primarily of partnership distributions to non-controlling interests, dividend payments to holders of our Class A common stock, proceeds from the issuance of Class A common stock in follow-on offerings, payments to purchase Holdings partnership units, and payments of amounts owed under the tax receivable agreements. Net cash used byin financing activities decreased $58.8increased $53.2 million during the year ended December 31, 20172021, primarily due to $60.5a $71.7 million increase in dividends paid, a $7.4 million increase in distributions paid to limited partners, a $4.7 million increase in taxes paid related to employee net share settlement, and a $4.3 million increase in payments of net subscriptionsamounts owed under the TRAs. These higher cash uses were partially offset by a $35.0 million increase in contributions from noncontrolling interests in our consolidated investment products. Distributions to limited partners decreased $18.1 million and dividends paid increased $15.6 million due to the increase in APAM’s equity ownership interest in Holdings during
During the year ended December 31, 2017 compared to2021, the year ended December 31, 2016.
55
| Payments Due by Period | |||||||||||||||||||
| Total | Less than 1 year | 1-3 Years | 3-5 Years | More than 5 Years | |||||||||||||||
| (in millions) | |||||||||||||||||||
| Principal payments on borrowings | $ | 200.0 | $ | — | $ | 50.0 | $ | 90.0 | $ | 60.0 | |||||||||
TRAs (1) | 385.4 | — | — | — | — | ||||||||||||||
| Interest payable | 52.9 | 10.7 | 18.6 | 15.9 | 7.7 | ||||||||||||||
| Lease obligations | 77.0 | 11.4 | 20.3 | 18.6 | 26.7 | ||||||||||||||
| Total Contractual Obligations | $ | 715.3 | $ | 22.1 | $ | 88.9 | $ | 124.5 | $ | 94.4 | |||||||||
(1) The estimated payments under the TRAs as of December 31, 2017 are described above under “Liquidity and Capital Resources”. However, amounts payable under the TRAs will increase upon exchanges of Holdings units for our Class A common stock or sales of Holdings units to us, with the increase representing 85% of the estimated future tax benefits, if any, resulting from the exchanges or sales. The actual amount and timing of payments associated with our existing payable under our tax receivable agreements or future exchanges or sales, and associated tax benefits, will vary depending upon a number of factors as described under “-Liquidity and Capital Resources.” As a result, the timing of payments by period is currently unknown. We expect to pay approximately $36 million in 2018 related to the TRAs. | |||||||||||||||||||
Critical Accounting Policies and Estimates
The accompanying consolidated financial statements were prepared in accordance with GAAP, and related rules and regulations of the SEC. The preparation of financial statements in conformity with GAAP requires management to make estimates or assumptions that affect the reported amounts of assets and liabilities at the date of the financial statements and the reported amounts of revenues and expenses during the periods presented. Actual results could differ from these estimates or assumptions and may have a material effect on the consolidated financial statements.
Accounting policies are an integral part of our financial statements. A thorough understanding of these accounting policies is essential when reviewing our reported results of operations and our financial condition. Management believes that the critical accounting policies and estimates discussed below involve additional management judgment due to the sensitivity of the methods and assumptions used.
Consolidation
We consolidate all subsidiaries or other entities in which we have a controlling financial interest. We assess each legal entity in which we hold a variable interest on a quarterly basis to determine whether consolidation is appropriate. We determine whether we have a controlling financial interest in the entity by evaluating whether the entity is a voting interest entity (“VOE”) or a variable interest entity (“VIE”) under GAAP. Assessing whether an entity is a VIE or VOE and if it requires consolidation involves judgment and analysis. Factors considered in this assessment include the legal organization of the entity, our equity ownership and contractual involvement with the entity and any related party or de facto agent implications of our involvement with the entity.
Voting Interest Entities-A- A VOE is an entity in which (i) the total equity investment at risk is sufficient to enable the entity to finance its activities independently and (ii) the equity holders at risk have the obligation to absorb losses, the right to receive residual returns and the right to direct the activities of the entity that most significantly impact the entity’s economic performance, whereby the equity investment has all the characteristics of a controlling financial interest. As a result, voting rights are a key driver of determining which party, if any, should consolidate the entity. Under the VOE model, controlling financial interest is generally defined as a majority ownership of voting interests.
Variable Interest Entities-A- A VIE is an entity that lacks one or more of the characteristics of a VOE. In accordance with GAAP, an enterprise must consolidate all VIEs of which it is the primary beneficiary. We determine if a legal entity meets the definition of a VIE by considering whether the fund’s equity investment at risk is sufficient to finance its activities without additional subordinated financial support and whether the fund’s at-risk equity holders absorb any losses, have the right to receive residual returns and have the right to direct the activities of the entity most responsible for the entity’s economic performance.
Under the VIE model, controlling financial interest is defined as (i) the power to direct activities that most significantly impact the economic performance of the entity and (ii) the right to receive potentially significant benefits or the obligation to absorb potentially significant losses. We will generally consolidate VIEs in which we meet the power criteria and hold an equity ownership interest of greater than 10%.
We serve as the investment adviser for Artisan Funds, a family of mutual funds registered with the SEC under the Investment Company Act of 1940, and investment manager of Artisan Global Funds, a family of Ireland-based UCITS.UCITS funds. Artisan Funds and Artisan Global Funds are corporate entities the business and affairs of which are managed by their respective boards of directors. The shareholders of the funds retain voting rights, including the right to elect and reelect members of their respective boards of directors. Each series of Artisan Funds is a VOE and is separately evaluated for consolidation under the VOE model. The shareholders of Artisan Global Funds lack simple majority liquidation rights, and as a result, Artisan Global Funds is evaluated for consolidation under the VIE model. Artisan sponsored privately offered fundsPrivate Funds are also evaluated for consolidation under the VIE model because third-party equity holders of the funds lack the ability to remove Artisan as the general partner, or otherwise divest Artisan of its control of the funds.
Seed Investments - We generally make seed investments in sponsored investment portfolios at the portfolio’s formation. If the seed investment results in a controlling financial interest, we will consolidate the investment, and the underlying individual securities will be accounted for as trading securities.based on their classification at the underlying fund. If the seed investment results in significant influence, but not control, the investment will be accounted for as an equity method investment. Significant influence is generally considered to exist with equity ownership levels between 20% and 50%, although other factors are considered. Seed investments in which we do not have a controlling financial interest or significant influence are classifiedaccounted for as available-for-sale investments.investment securities. These investments are measured at fair value in the Consolidated StatementStatements of Financial Condition. Unrealized gainsRealized and losses for available-for-sale securities are excluded from earnings and reported in other comprehensive income until realized. Realized gains are recognized in non-operating income (loss). As of December 31, 2017, all of our unconsolidated seed investments were accounted for as available-for-sale securities. Effective January 1, 2018, unrealized gains (losses) on allinvestment securities are recorded in net investment income in the Consolidated Statements of our seedOperations. Dividend income from these investments will beis recognized throughwhen earned and is included in net income.investment income in the Consolidated Statements of Operations.
56
Revenue Recognition
Investment management fees are generally computed as a percentage of assets under management and are recognized as services are rendered.revenue at the end of each distinct service period. Fees for providing investment management services are computed and billed in accordance with the provisions of the applicableunderlying investment management agreements, which is generally on a monthly or quarterly basis. Investment management fees are presented net of cash rebates to certain Artisan Global Fund investors and fees waivedexpense reimbursements pursuant to contractual expense limitations of the funds or voluntary waivers.pooled investment vehicles.
Artisan accounts for asset management services as a single performance obligation that is satisfied over time, using a time-based measure of progress to recognize revenue. Customer consideration is variable due to the uncertainty of the value of assets under management during each distinct service period. At the end of each quarter, Artisan records revenue for the actual amount of investment management fees for that quarter because the uncertainty has been resolved.
Performance fees are subject to the uncertainty of market volatility, and as a result, the entire amount of the variable consideration related to performance fees is constrained until the end of each measurement period. At the end of the quarterly or annual measurement period, revenue is recorded for the actual amount of performance fees earned during that period because the uncertainty has been resolved.
The portfolios of Artisan Funds and Artisan Global Funds, as well as the portfolios we manage for our other clients, are invested principally in securities for which market values are readily available, with a portion of each portfolio held in cash or cash-like instruments. With the exception of the assets managed by our Credit team (which represented approximately 4.7% of our assets under management at December 31, 2021), the portfolios are invested principally in publicly-traded equity securities.
The investment management fees that we receive are calculated based on the values of the securities held in the accounts that we manage for our clients. For our U.S.-registered mutual fund clients and UCITS funds clients, including Artisan Funds and Artisan Global Funds, and for our own sponsored private funds,Artisan Private Funds, our fees are based on the values of the funds’ assets as determined for purposes of calculating their net asset values.
Securities held by U.S.-registered mutual funds, including Artisan Funds, Artisan Global Funds, and Artisan Private Funds are generally valued at closing market prices, or if closing market prices are not readily available or are not considered reliable, at a fair value determined under procedures established by the fund’s board (fair value pricing). A U.S.-registered mutual fund typically considers a closing market price not to be readily available, and therefore uses fair value pricing, if, among other things, the value of the security might have been materially affected by events occurring after the close of the market in which the security was principally traded but before the time for determination of the fund’s net asset value. A subsequent event might be a company-specific development, a development affecting an entire market or region, or a development that might be expected to have global implications. A significant change in securities prices in U.S. markets may be deemed to be such a subsequent event with respect to non-U.S. securities.
Values of securities determined using fair value pricing are likely to be different than they would be if only closing market prices were used. As a result, over short periods of time, the revenues we generate from U.S.-registered mutual funds, including Artisan Funds, may be different than they would be if only closing prices were used in valuing portfolio securities. Over longer time periods, the differences in our fees resulting from fair value pricing are not material.
For our separate account clients, other than U.S.-registered mutual funds, our fees may be based, at the client’s option, on the values of the securities in the portfolios we manage as determined by the client (or its custodian or other service provider) or by us in accordance with valuation procedures we have adopted. The valuation procedures we have adopted generally use closing market prices in the markets in which the securities trade, without adjustment for subsequent events except in unusual circumstances. We believe that our fees based on valuations determined under our procedures are not materially different from the fees we receive that are based on valuations determined by clients, their custodians or other service providers.
Income Taxes
We operate in numerous states and countries and must allocate our income, expenses, and earnings under the various laws and regulations of each of these taxing jurisdictions. Accordingly, our provision for income taxes represents our total estimate of the liability for income taxes that we have incurred in doing business each year in all of our locations. Annually, we file tax returns that represent our filing positions with each jurisdiction and settle our tax return liabilities. Each jurisdiction has the right to audit those tax returns and may take different positions with respect to income and expense allocations and taxable earnings determinations. Because the determination of our annual income tax provision is subject to judgments and estimates, actual results may vary from those recorded in our financial statements. We recognize additions to and reductions in income tax expense during a reporting period that pertains to prior period provisions as our estimated liabilities are revised and our actual tax returns and tax audits are completed.
Our management is required to exercise judgment in developing our provision for income taxes, including the determination of deferred tax assets and liabilities and any valuation allowance that might be required against deferred tax assets. As of December 31, 2017,2021, we have not recorded a valuation allowance on any deferred tax assets. In the event that sufficient taxable income of the same character does not result in future years, among other things, a valuation allowance for certain of our deferred tax assets may be required.
57
Payments pursuant to the Tax Receivable Agreements (“TRAs”)
We have recorded a liability of $385.4$425.4 million as of December 31, 2017,2021, representing 85% of the estimated future tax benefits subject to the TRAs. The actual amount and timing of any payments under these agreements will vary depending upon a number of factors, including the timing of sales or exchanges by the holders of limited partnership units, the price of the Class A common stock at the time of such sales or exchanges, whether such sales or exchanges are taxable, the amount and timing of the taxable income APAM generates in the future and the tax rate then applicable and the portion of APAM’s payments under the TRAs constituting imputed interest or depreciable basis or amortizable basis. The expected payment obligation assumes no additional uncertain tax positions that would impact the TRAs.
New or Revised Accounting Standards
See Note 2, “Summary of Significant Accounting Policies — Recent accounting pronouncements” to the Consolidated Financial Statements included in Item 8 of Part II of this Form 10-K.
Item 7A. Qualitative and Quantitative Disclosures Regarding Market Risk
Market Risk
Our exposure to market risk is directly related to the role of our operating company as an investment adviser for the pooled vehicles and separate accounts it manages. Essentially all of our revenues are derived from investment management agreements with these vehicles and accounts. Under these agreements, the investment managementadvisory fees we receive are generally based on the value of our assets under management, and our fee rates.rates and, for the accounts on which we earn performance based fees, the investment performance of those accounts. Accordingly, if our assets under management decline as a result of market depreciation, our revenues and net income will also decline. In addition, such a decline could cause our clients to withdraw their funds in favor of investments believed to offer higher returns or lower risk, which would cause our revenues to decline further.
The value of our assets under management was $115.5$174.8 billion as of December 31, 2017.2021. A 10% increase or decrease in the value of our assets under management, if proportionately distributed over all our investment strategies, products and client relationships, would cause an annualized increase or decrease in our revenues of approximately $84.4$123.6 million at our current weighted average fee rate of 7371 basis points. Because of our declining rates of fee for larger relationships and differences in our rates of fee across investment strategies, a change in the composition of our assets under management, in particular an increase in the proportion of our total assets under management attributable to strategies, clients or relationships with lower effective rates of fees, could have a material negative impact on our overall weighted average rate of fee. The same 10% increase or decrease in the value of our total assets under management, if attributed entirely to a proportionate increase or decrease in the assets of each of the Artisan Funds and Artisan Global Funds, to which we provide a range of services in addition to those provided to separate accounts and therefore charge a higher rate of fee, would cause an annualized increase or decrease in our revenues of approximately $106.4$159.4 million at the Artisan Funds and Artisan Global Funds aggregate weighted average fee of 9291 basis points. If the same 10% increase or decrease in the value of our total assets under management was attributable entirely to a proportionate increase or decrease in the assets of each separate account we manage, it would cause an annualized increase or decrease in our revenues of approximately $62.4$89.6 million at the current weighted average fee rate across all of our separate accounts of 5451 basis points.
As is customary in the asset management industry, clients invest in particular strategies to gain exposure to certain asset classes, which exposes their investment to the benefits and risks of those asset classes. Because we believe that our clients invest in each of our strategies in order to gain exposure to the portfolio securities of the respective strategies and may implement their own risk management program or procedures, we have not adopted a corporate-level risk management policy regarding client assets, nor have we attempted to hedge at the corporate level or within individual strategies the market risks that would affect the value of our overall assets under management and related revenues. Some of these risks (e.g., sector risks and currency risks) are inherent in certain strategies, and clients may invest in particular strategies to gain exposure to particular risks. While negative returns in our investment strategies and net client cash outflows do not directly reduce the assets on our balance sheet (because the assets we manage are owned by our clients, not us), any reduction in the value of our assets under management would result in a reduction in our revenues.
We also are subject to market risk from a decline in the prices of marketable securities that we own. The total value of marketable securities we owned, including our direct equity investments in consolidated investment products, was $40.3$109.8 million as of December 31, 2017.2021. We invested in certain of Artisan sponsored private funds,Private Funds, Artisan Funds and Artisan Global Funds in amounts sufficient to cover certain organizational expenses and to ensure that the funds had sufficient assets at the commencement of their operations to build a viable investment portfolio. Assuming a 10% increase or decrease in the values of our total marketable securities, the fair value would increase or decrease by $4.0$11.0 million at December 31, 2017.2021. Management regularly monitors the value of these investments; however, given their nature and relative size, we have not adopted a specific risk management policy to manage the associated market risk. Due to the nature
58
Exchange Rate Risk
A substantial portion of the accounts that we advise, or sub-advise, hold investments that are denominated in currencies other than the U.S. dollar. Movements in the rate of exchange between the U.S. dollar and the underlying foreign currency affect the values of assets held in accounts we manage, thereby affecting the amount of revenues we earn. The value of the assets we manage was $115.5$174.8 billion as of December 31, 2017. 2021. As of December 31, 2017,2021, approximately 54%51% of our assets under management across our investment strategies were invested in strategies that primarily invest in securities of non-U.S. companies and approximately 47%45% of our assets under management were invested in securities denominated in currencies other than the U.S. dollar. To the extent our assets under management are denominated in currencies other than the U.S. dollar, the value of those assets under management will decrease with an increase in the value of the U.S. dollar, or increase with a decrease in the value of the U.S. dollar. Each investment team monitors its own exposure to exchange rate risk and makes decisions on how to manage that risk in the portfolios managed by that team.
We have not adopted a corporate-level risk management policy to manage this exchange rate risk.risk in the assets we manage. Assuming that 47%45% of our assets under management is invested in securities denominated in currencies other than the U.S. dollar and excluding the impact of any hedging arrangements, a 10% increase or decrease in the value of the U.S. dollar would decrease or increase the fair value of our assets under management by $5.4$7.9 billion,, which would cause an annualized increase or decrease in revenues of approximately $39.5$55.6 million at our current weighted average fee rate of 7371 basis points.
We operate in several foreign countries of which the United Kingdom is the most prominent. We incur operating expenses and have foreign currency-denominated assets and liabilities associated with these operations, although our revenuesoperations. In addition, we have revenue arrangements that are predominately realizeddenominated in USD.non-U.S. currencies. We do not believe that foreign currency fluctuations materially affect our results of operations.
Interest Rate Risk
Interest rate changes may affect the amount of our interest payments in connection with our revolving credit agreement, and thereby affect future earnings and cash flows. As of December 31, 2017,2021, there were no borrowings outstanding under the revolving credit agreement.
The strategies managed by our Credit Team, which had $2.6$8.2 billion of assets under management as of December 31, 2017,2021, invest in fixed income securities. The values of debt instruments held by the strategy may fall in response to increases in interest rates, which would reduce our revenues. We have considered the potential impact of a 100 basis point movement in market interest rates on the portfolios of the strategies managed by our Credit Team. Based on our analysis, we do not expect that such a change would have a material impact on our revenues or results of operations in the next twelve months.
59
Item 8. Financial Information and Supplementary Data
| Index to Financial Statements: | Page | ||||
Report of Independent Registered Public Accounting Firm (PCAOB ID 238) | |||||
Consolidated Statements of Financial Condition as of December 31, | |||||
Consolidated Statements of Operations for the years ended December 31, | |||||
Consolidated Statements of Comprehensive Income for the years ended December 31, | |||||
Consolidated Statements of Changes in Stockholders’ Equity for the years ended December 31, | |||||
Consolidated Statements of Cash Flows for the years ended December 31, | |||||
Notes to Consolidated Financial Statements as of and for the years ended December 31, | |||||
60
Report of Independent Registered Public Accounting Firm
To the Board of Directors and
Stockholders of Artisan Partners Asset Management Inc.:
Opinions on the Financial Statements and Internal Control over Financial Reporting
We have audited the accompanying consolidated statements of financial condition of Artisan Partners Asset Management Inc.and its subsidiaries (the “Company”) as of December 31, 20172021 and 2016,2020, and the related consolidated statements of operations, of comprehensive income, of changes in stockholders’ equity and of cash flows for each of the three years in the period ended December 31, 2017,2021, including the related notes (collectively referred to as the “consolidated financial statements”).We also have audited the Company's internal control over financial reporting as of December 31, 2017,2021, based on criteria established in Internal Control - Integrated Framework(2013)issued by the Committee of Sponsoring Organizations of the Treadway Commission (COSO).
In our opinion, the consolidated financial statements referred to above present fairly, in all material respects, the financial position of the Company as of December 31, 20172021 and 2016,2020, and the results oftheir its operations andtheir its cash flows for each of the three years in the period ended December 31, 20172021 in conformity with accounting principles generally accepted in the United States of America. Also in our opinion, the Company maintained, in all material respects, effective internal control over financial reporting as of December 31, 2017,2021, based on criteria established in Internal Control - Integrated Framework(2013)issued by the COSO.
Basis for Opinions
The Company's management is responsible for these consolidated financial statements, for maintaining effective internal control over financial reporting, and for its assessment of the effectiveness of internal control over financial reporting, included in the Report of Management on Internal Control over Financial Reporting appearing under Item 9A “Controls and Procedures”. Our responsibility is to express opinions on the Company’s consolidatedfinancial statements and on the Company's internal control over financial reporting based on our audits. We are a public accounting firm registered with the Public Company Accounting Oversight Board (United States) ("PCAOB")(PCAOB) and are required to be independent with respect to the Company in accordance with the U.S. federal securities laws and the applicable rules and regulations of the Securities and Exchange Commission and the PCAOB.
We conducted our audits in accordance with the standards of the PCAOB. Those standards require that we plan and perform the audits to obtain reasonable assurance about whether the consolidatedfinancial statements are free of material misstatement, whether due to error or fraud, and whether effective internal control over financial reporting was maintained in all material respects.
Our audits of the consolidatedfinancial statements included performing procedures to assess the risks of material misstatement of the consolidatedfinancial statements, whether due to error or fraud, and performing procedures that respond to those risks. Such procedures included examining, on a test basis, evidence regarding the amounts and disclosures in the consolidatedfinancial statements. Our audits also included evaluating the accounting principles used and significant estimates made by management, as well as evaluating the overall presentation of the consolidatedfinancial statements. Our audit of internal control over financial reporting included obtaining an understanding of internal control over financial reporting, assessing the risk that a material weakness exists, and testing and evaluating the design and operating effectiveness of internal control based on the assessed risk. Our audits also included performing such other procedures as we considered necessary in the circumstances. We believe that our audits provide a reasonable basis for our opinions.
Definition and Limitations of Internal Control over Financial Reporting
A company’s internal control over financial reporting is a process designed to provide reasonable assurance regarding the reliability of financial reporting and the preparation of financial statements for external purposes in accordance with generally accepted accounting principles. A company’s internal control over financial reporting includes those policies and procedures that (i) pertain to the maintenance of records that, in reasonable detail, accurately and fairly reflect the transactions and dispositions of the assets of the company; (ii) provide reasonable assurance that transactions are recorded as necessary to permit preparation of financial statements in accordance with generally accepted accounting principles, and that receipts and expenditures of the company are being made only in accordance with authorizations of management and directors of the company; and (iii) provide reasonable assurance regarding prevention or timely detection of unauthorized acquisition, use, or disposition of the company’s assets that could have a material effect on the financial statements.
61
Because of its inherent limitations, internal control over financial reporting may not prevent or detect misstatements. Also, projections of any evaluation of effectiveness to future periods are subject to the risk that controls may become inadequate because of changes in conditions, or that the degree of compliance with the policies or procedures may deteriorate.
Critical Audit Matters
The critical audit matter communicated below is a matter arising from the current period audit of the consolidated financial statements that was communicated or required to be communicated to the audit committee and that (i) relates to accounts or disclosures that are material to the consolidated financial statements and (ii) involved our especially challenging, subjective, or complex judgments. The communication of critical audit matters does not alter in any way our opinion on the consolidated financial statements, taken as a whole, and we are not, by communicating the critical audit matter below, providing a separate opinion on the critical audit matter or on the accounts or disclosures to which it relates.
Income Taxes – Deferred Tax Assets and Amounts Payable Under Tax Receivable Agreements
As described in Notes 2 and 11 to the consolidated financial statements, the Company has recorded a deferred tax assets (“DTA”) balance of $497.9 million at December 31, 2021 while the amount payable under the tax receivable agreements (“TRA”) was $425.4 million. DTAs are determined by management based upon the future tax consequences attributable to temporary differences between the financial statement carrying amounts and tax bases of assets. The TRAs generally provide for payment of 85% of the applicable cash savings, if any, of U.S. federal, state and local income taxes that the Company actually realizes (or is deemed to realize in certain circumstances) as a result of certain tax attributes or benefits. The cash savings are calculated by comparing the Company’s actual income tax liability to the amount it would have been required to pay had it not been able to utilize any of the tax benefits subject to the TRAs. The increase in tax basis, which results in a DTA, as well as the amount and timing of any payments under these agreements, will vary depending on a number of factors, which include the timing of sales or exchanges by the holders of limited partnership units, the price of the Class A common stock at the time of such sales or exchanges, whether such sales or exchanges are taxable, the amount and timing of the taxable income the Company generates in the future and the tax rate then applicable, and the portion of the Company’s payments under the TRAs constituting imputed interest or depreciable basis or amortizable basis.
The principal considerations for our determination that performing procedures relating to deferred tax assets and amounts payable under tax receivable agreements is a critical audit matter are (1) the significant audit effort necessary in performing procedures related to the aforementioned factors utilized in the estimate and the assessment of the application of the tax laws, and (2) the use of professionals with specialized skill and knowledge to assist in evaluating the audit evidence obtained from these procedures.
Addressing the matter involved performing procedures and evaluating audit evidence in connection with forming our overall opinion on the consolidated financial statements. These procedures included testing the effectiveness of controls relating to income taxes, including controls over the deferred tax assets and tax receivable agreements. These procedures also included, among others, testing management’s process for estimating the deferred tax assets and amounts payable under tax receivable agreements, including (1) testing the factors to the Company’s estimates, related to the timing of sales or exchanges by the holders of limited partnership units and the price of the Class A common stock at the time of such sales or exchanges, (2) assessing the reasonableness of the factors used in the Company’s estimates, related to the likelihood of the Company having sufficient future taxable income to utilize the deferred tax asset as well as the portion of the Company’s payments under the TRA constituting depreciable basis or amortizable basis, and (3) testing the impact of sales or exchanges of limited partnership units on the deferred tax asset and amounts payable under tax receivable agreements. Professionals with specialized skill and knowledge were used to assist in testing the estimates and assessing the appropriateness of the application of the tax laws related to evaluating whether the sales or exchanges of partnership units are taxable.
/s/ PricewaterhouseCoopers LLP
February 21, 201822, 2022
We have served as the Company’s auditor since 1995.
62
ARTISAN PARTNERS ASSET MANAGEMENT INC. Consolidated Statements of Financial Condition (U.S. dollars in thousands, except per share amounts) | |||||||
| At December 31, | |||||||
| 2017 | 2016 | ||||||
| ASSETS | |||||||
| Cash and cash equivalents | $ | 137,286 | $ | 156,777 | |||
| Accounts receivable | 76,693 | 59,739 | |||||
| Investment securities | 4,978 | 6,297 | |||||
| Prepaid expenses | 8,969 | 8,654 | |||||
| Property and equipment, net | 21,025 | 20,018 | |||||
| Restricted cash | 629 | 629 | |||||
| Deferred tax assets | 429,212 | 678,518 | |||||
| Other | 4,395 | 5,534 | |||||
| Assets of consolidated investment products | |||||||
| Cash and cash equivalents | 21,881 | — | |||||
| Accounts receivable and other | 16,768 | — | |||||
| Investment assets, at fair value | 115,319 | — | |||||
| Total assets | $ | 837,155 | $ | 936,166 | |||
| LIABILITIES, REDEEMABLE NONCONTROLLING INTERESTS, AND STOCKHOLDERS’ EQUITY | |||||||
| Accounts payable, accrued expenses, and other | $ | 16,656 | $ | 15,609 | |||
| Accrued incentive compensation | 2,911 | 12,642 | |||||
| Deferred lease obligations | 6,363 | 3,972 | |||||
| Borrowings | 199,129 | 199,477 | |||||
| Class B redemptions payable | — | 506 | |||||
| Amounts payable under tax receivable agreements | 385,413 | 586,246 | |||||
| Liabilities of consolidated investment products | |||||||
| Accounts payable, accrued expenses, and other | 8,180 | — | |||||
| Investment liabilities, at fair value | 47,857 | — | |||||
| Total liabilities | $ | 666,509 | $ | 818,452 | |||
| Commitments and contingencies | |||||||
| Redeemable noncontrolling interests | 62,581 | — | |||||
| Common stock | |||||||
| Class A common stock ($0.01 par value per share, 500,000,000 shares authorized, 50,463,126 and 42,149,436 shares outstanding at December 31, 2017 and December 31, 2016, respectively) | 505 | 421 | |||||
| Class B common stock ($0.01 par value per share, 200,000,000 shares authorized, 11,922,192 and 15,142,049 shares outstanding at December 31, 2017 and December 31, 2016, respectively) | 119 | 151 | |||||
| Class C common stock ($0.01 par value per share, 400,000,000 shares authorized, 13,184,527 and 17,063,384 shares outstanding at December 31, 2017 and December 31, 2016, respectively) | 132 | 171 | |||||
| Additional paid-in capital | 147,910 | 119,221 | |||||
| Retained earnings (deficit) | (37,870 | ) | 13,395 | ||||
| Accumulated other comprehensive income (loss) | (873 | ) | (1,648 | ) | |||
| Total Artisan Partners Asset Management Inc. stockholders’ equity | 109,923 | 131,711 | |||||
| Noncontrolling interest - Artisan Partners Holdings | (1,858 | ) | (13,997 | ) | |||
| Total stockholders’ equity | $ | 108,065 | $ | 117,714 | |||
| Total liabilities, redeemable noncontrolling interests, and stockholders’ equity | $ | 837,155 | $ | 936,166 | |||
ARTISAN PARTNERS ASSET MANAGEMENT INC.
Consolidated Statements of Financial Condition
(U.S. dollars in thousands, except per share amounts)
| At December 31, | |||||||||||
| 2021 | 2020 | ||||||||||
| ASSETS | |||||||||||
| Cash and cash equivalents | $ | 189,226 | $ | 154,987 | |||||||
| Accounts receivable | 115,850 | 99,888 | |||||||||
| Investment securities | 47,878 | 3,656 | |||||||||
| Prepaid expenses | 12,543 | 10,820 | |||||||||
| Property and equipment, net | 35,313 | 35,874 | |||||||||
| Operating lease assets | 88,642 | 79,304 | |||||||||
| Restricted cash | 629 | 629 | |||||||||
| Deferred tax assets | 497,902 | 482,061 | |||||||||
| Other | 7,739 | 6,942 | |||||||||
| Assets of consolidated investment products | |||||||||||
| Cash and cash equivalents | 10,916 | 43,834 | |||||||||
| Accounts receivable and other | 6,408 | 3,587 | |||||||||
| Investment assets, at fair value | 195,001 | 230,380 | |||||||||
| Total assets | $ | 1,208,047 | $ | 1,151,962 | |||||||
| LIABILITIES, REDEEMABLE NONCONTROLLING INTERESTS, AND STOCKHOLDERS’ EQUITY | |||||||||||
| Accounts payable, accrued expenses, and other | $ | 28,992 | $ | 24,727 | |||||||
| Accrued incentive compensation | 7,521 | 12,924 | |||||||||
| Operating lease liabilities | 100,303 | 92,671 | |||||||||
| Borrowings | 199,444 | 199,284 | |||||||||
| Amounts payable under tax receivable agreements | 425,427 | 412,468 | |||||||||
| Liabilities of consolidated investment products | |||||||||||
| Accounts payable, accrued expenses, and other | 20,185 | 109,362 | |||||||||
| Investment liabilities, at fair value | 19,179 | 15,731 | |||||||||
| Total liabilities | $ | 801,051 | $ | 867,167 | |||||||
| Commitments and contingencies | 0 | 0 | |||||||||
| Redeemable noncontrolling interests | 111,035 | 93,753 | |||||||||
| Common stock | |||||||||||
| Class A common stock ($0.01 par value per share, 500,000,000 shares authorized, 66,699,872 and 63,131,007 shares outstanding at December 31, 2021 and December 31, 2020, respectively) | 667 | 631 | |||||||||
| Class B common stock ($0.01 par value per share, 200,000,000 shares authorized, 3,206,580 and 4,457,958 shares outstanding at December 31, 2021 and December 31, 2020, respectively) | 32 | 45 | |||||||||
| Class C common stock ($0.01 par value per share, 400,000,000 shares authorized, 9,128,617 and 10,983,145 shares outstanding at December 31, 2021 and December 31, 2020, respectively) | 91 | 110 | |||||||||
| Additional paid-in capital | 141,835 | 107,738 | |||||||||
| Retained earnings | 134,889 | 72,944 | |||||||||
| Accumulated other comprehensive income (loss) | (1,310) | (991) | |||||||||
| Total Artisan Partners Asset Management Inc. stockholders’ equity | 276,204 | 180,477 | |||||||||
| Noncontrolling interests - Artisan Partners Holdings | 19,757 | 10,565 | |||||||||
| Total stockholders’ equity | $ | 295,961 | $ | 191,042 | |||||||
| Total liabilities, redeemable noncontrolling interests, and stockholders’ equity | $ | 1,208,047 | $ | 1,151,962 | |||||||
The accompanying notes are an integral part of the consolidated financial statements.
63
ARTISAN PARTNERS ASSET MANAGEMENT INC.
Consolidated Statements of Operations
(U.S. dollars in thousands, except per share amounts)
| For the Years Ended December 31, | |||||||||||||||||
| Revenues | 2021 | 2020 | 2019 | ||||||||||||||
| Management fees | $ | 1,213,924 | $ | 884,902 | $ | 794,338 | |||||||||||
| Performance fees | 13,312 | 14,665 | 4,614 | ||||||||||||||
| Total revenues | $ | 1,227,236 | $ | 899,567 | $ | 798,952 | |||||||||||
| Operating Expenses | |||||||||||||||||
| Compensation and benefits | 563,054 | 435,818 | 400,456 | ||||||||||||||
| Distribution, servicing and marketing | 31,719 | 24,312 | 23,170 | ||||||||||||||
| Occupancy | 21,942 | 21,922 | 23,319 | ||||||||||||||
| Communication and technology | 42,861 | 38,138 | 39,499 | ||||||||||||||
| General and administrative | 27,169 | 21,053 | 29,053 | ||||||||||||||
| Total operating expenses | 686,745 | 541,243 | 515,497 | ||||||||||||||
| Total operating income | 540,491 | 358,324 | 283,455 | ||||||||||||||
| Non-operating income (expense) | |||||||||||||||||
| Interest expense | (10,803) | (10,804) | (11,054) | ||||||||||||||
| Net gain (loss) on the tax receivable agreements | 358 | (4,674) | (19,557) | ||||||||||||||
| Net investment gain (loss) of consolidated investment products | 19,748 | 26,147 | 10,084 | ||||||||||||||
| Other net investment gain (loss) | 1,756 | 305 | 6,338 | ||||||||||||||
| Total non-operating income (expense) | 11,059 | 10,974 | (14,189) | ||||||||||||||
| Income before income taxes | 551,550 | 369,298 | 269,266 | ||||||||||||||
| Provision for income taxes | 107,026 | 60,795 | 27,809 | ||||||||||||||
| Net income before noncontrolling interests | 444,524 | 308,503 | 241,457 | ||||||||||||||
| Less: Net income attributable to noncontrolling interests - Artisan Partners Holdings | 96,879 | 81,079 | 80,055 | ||||||||||||||
| Less: Net income (loss) attributable to noncontrolling interests - consolidated investment products | 11,129 | 14,807 | 4,866 | ||||||||||||||
| Net income attributable to Artisan Partners Asset Management Inc. | $ | 336,516 | $ | 212,617 | $ | 156,536 | |||||||||||
| Basic earnings per share | $ | 5.10 | $ | 3.40 | $ | 2.65 | |||||||||||
| Diluted earnings per share | $ | 5.09 | $ | 3.40 | $ | 2.65 | |||||||||||
| Basic weighted average number of common shares outstanding | 59,866,790 | 55,633,529 | 51,127,929 | ||||||||||||||
| Diluted weighted average number of common shares outstanding | 59,881,039 | 55,637,922 | 51,127,929 | ||||||||||||||
| Dividends declared per Class A common share | $ | 4.23 | $ | 3.39 | $ | 3.39 | |||||||||||
ARTISAN PARTNERS ASSET MANAGEMENT INC. Consolidated Statements of Operations (U.S. dollars in thousands, except per share amounts) | |||||||||||
| For the Years Ended December 31, | |||||||||||
| 2017 | 2016 | 2015 | |||||||||
| Revenues | |||||||||||
| Management fees | $ | 795,276 | $ | 719,778 | $ | 803,701 | |||||
| Performance fees | 348 | 1,081 | 1,768 | ||||||||
| Total revenues | $ | 795,624 | $ | 720,859 | $ | 805,469 | |||||
| Operating Expenses | |||||||||||
| Compensation and benefits | |||||||||||
| Salaries, incentive compensation and benefits | 390,202 | 355,835 | 372,167 | ||||||||
| Pre-offering related compensation - share-based awards | 12,678 | 28,080 | 42,071 | ||||||||
| Total compensation and benefits | 402,880 | 383,915 | 414,238 | ||||||||
| Distribution, servicing and marketing | 29,620 | 32,516 | 43,626 | ||||||||
| Occupancy | 14,490 | 13,076 | 12,504 | ||||||||
| Communication and technology | 34,073 | 32,125 | 25,487 | ||||||||
| General and administrative | 28,150 | 24,993 | 27,229 | ||||||||
| Total operating expenses | 509,213 | 486,625 | 523,084 | ||||||||
| Total operating income | 286,411 | 234,234 | 282,385 | ||||||||
| Non-operating income (loss) | |||||||||||
| Interest expense | (11,449 | ) | (11,653 | ) | (11,706 | ) | |||||
| Net investment gain (loss) of consolidated investment products | 4,241 | — | — | ||||||||
| Net investment income and other | 1,123 | 1,253 | 445 | ||||||||
| Net gain (loss) on the tax receivable agreements | 290,919 | 650 | (12,247 | ) | |||||||
| Total non-operating income (loss) | 284,834 | (9,750 | ) | (23,508 | ) | ||||||
| Income before income taxes | 571,245 | 224,484 | 258,877 | ||||||||
| Provision for income taxes | 420,508 | 51,483 | 46,771 | ||||||||
| Net income before noncontrolling interests | 150,737 | 173,001 | 212,106 | ||||||||
| Less: Net income attributable to noncontrolling interests - Artisan Partners Holdings | 99,038 | 99,971 | 130,305 | ||||||||
| Less: Net income attributable to noncontrolling interests - consolidated investment products | 2,100 | — | — | ||||||||
| Net income attributable to Artisan Partners Asset Management Inc. | $ | 49,599 | $ | 73,030 | $ | 81,801 | |||||
| Basic and diluted earnings per share | $ | 0.75 | $ | 1.57 | $ | 1.86 | |||||
| Basic and diluted weighted average number of common shares outstanding | 44,647,318 | 38,137,810 | 35,448,550 | ||||||||
| Dividends declared per Class A common share | $ | 2.76 | $ | 2.80 | $ | 3.35 | |||||
The accompanying notes are an integral part of the consolidated financial statements.
64
ARTISAN PARTNERS ASSET MANAGEMENT INC.
Consolidated Statements of Comprehensive Income
(U.S. dollars in thousands)
| For the Years Ended December 31, | |||||||||||||||||
| 2021 | 2020 | 2019 | |||||||||||||||
| Net income before noncontrolling interests | $ | 444,524 | $ | 308,503 | $ | 241,457 | |||||||||||
| Other comprehensive income (loss) | |||||||||||||||||
| Foreign currency translation gain (loss) | (319) | 732 | 732 | ||||||||||||||
| Total other comprehensive income (loss) | (319) | 732 | 732 | ||||||||||||||
| Comprehensive income | 444,205 | 309,235 | 242,189 | ||||||||||||||
| Comprehensive income attributable to noncontrolling interests - Artisan Partners Holdings | 96,879 | 81,376 | 80,317 | ||||||||||||||
| Comprehensive (loss) income attributable to noncontrolling interests - consolidated investment products | 11,129 | 14,807 | 4,866 | ||||||||||||||
| Comprehensive income attributable to Artisan Partners Asset Management Inc. | $ | 336,197 | $ | 213,052 | $ | 157,006 | |||||||||||
ARTISAN PARTNERS ASSET MANAGEMENT INC. Consolidated Statements of Comprehensive Income (U.S. dollars in thousands) | |||||||||||
| For the Years Ended December 31, | |||||||||||
| 2017 | 2016 | 2015 | |||||||||
| Net income before noncontrolling interests | $ | 150,737 | $ | 173,001 | $ | 212,106 | |||||
| Other comprehensive income (loss), net of tax | |||||||||||
| Unrealized gain (loss) on investment securities: | |||||||||||
| Unrealized gain (loss) on investment securities, net of tax of $131, ($20) and ($146), respectively | 542 | 974 | (301 | ) | |||||||
| Less: reclassification adjustment for net gains included in net income | 159 | 1,073 | 424 | ||||||||
| Net unrealized gain (loss) on investment securities | 383 | (99 | ) | (725 | ) | ||||||
| Foreign currency translation gain (loss) | 1,277 | (2,130 | ) | (586 | ) | ||||||
| Total other comprehensive income (loss) | 1,660 | (2,229 | ) | (1,311 | ) | ||||||
| Comprehensive income | 152,397 | 170,772 | 210,795 | ||||||||
| Comprehensive income attributable to noncontrolling interests - Artisan Partners Holdings | 99,922 | 99,015 | 129,574 | ||||||||
| Comprehensive income attributable to noncontrolling interests - consolidated investment products | 2,100 | — | — | ||||||||
| Comprehensive income attributable to Artisan Partners Asset Management Inc. | $ | 50,375 | $ | 71,757 | $ | 81,221 | |||||
The accompanying notes are an integral part of the consolidated financial statements.
65
ARTISAN PARTNERS ASSET MANAGEMENT INC.
Consolidated Statements of Changes in Stockholders’ Equity
(U.S. dollars in thousands)
| Class A Common Stock | Class B Common Stock | Class C Common Stock | Additional Paid-in Capital | Retained Earnings | Accumulated Other Comprehensive Income (Loss) | Noncontrolling interests - Artisan Partners Holdings | Total stockholders’ equity | Redeemable non-controlling interests | ||||||||||||||||||||||||
| Balance at January 1, 2019 | $ | 541 | $ | 86 | $ | 142 | $ | 97,553 | $ | 38,617 | $ | (1,895) | $ | 5,443 | $ | 140,487 | $ | 34,349 | ||||||||||||||
| Net income | — | — | — | — | 156,536 | — | 80,055 | 236,591 | 4,866 | |||||||||||||||||||||||
| Other comprehensive income - foreign currency translation | — | — | — | — | — | 521 | 211 | 732 | — | |||||||||||||||||||||||
| Cumulative impact of changes in ownership of Artisan Partners Holdings LP, net of tax | — | — | — | (3,533) | — | (51) | 3,584 | — | — | |||||||||||||||||||||||
| Amortization of equity-based compensation | — | — | — | 31,268 | — | — | 11,827 | 43,095 | — | |||||||||||||||||||||||
| Deferred tax assets, net of amounts payable under tax receivable agreements | — | — | — | 2,716 | — | — | — | 2,716 | — | |||||||||||||||||||||||
| Issuance of Class A common stock, net of issuance costs | — | — | — | (22) | — | — | — | (22) | — | |||||||||||||||||||||||
| Forfeitures and employee/partner terminations | — | — | — | — | — | — | — | — | — | |||||||||||||||||||||||
| Issuance of restricted stock awards | 10 | — | — | (10) | — | — | — | — | — | |||||||||||||||||||||||
| Employee net share settlement | (1) | — | — | (1,470) | — | — | (607) | (2,078) | — | |||||||||||||||||||||||
| Exchange of subsidiary equity | 14 | (8) | (6) | — | — | — | — | — | — | |||||||||||||||||||||||
| Capital contributions, net | — | — | — | — | — | — | — | — | 3,895 | |||||||||||||||||||||||
| Distributions | — | — | — | — | — | — | (94,842) | (94,842) | — | |||||||||||||||||||||||
| Dividends | — | — | — | (37,353) | (150,698) | — | (127) | (188,178) | — | |||||||||||||||||||||||
| Balance at December 31, 2019 | $ | 564 | $ | 78 | $ | 136 | $ | 89,149 | $ | 44,455 | $ | (1,425) | $ | 5,544 | $ | 138,501 | $ | 43,110 | ||||||||||||||
| Net income | — | — | — | — | 212,617 | — | 81,079 | 293,696 | 14,807 | |||||||||||||||||||||||
| Other comprehensive income - foreign currency translation | — | — | — | — | — | 623 | 109 | 732 | — | |||||||||||||||||||||||
| Cumulative impact of changes in ownership of Artisan Partners Holdings LP | — | — | — | (2,544) | — | (189) | 2,733 | — | — | |||||||||||||||||||||||
| Amortization of equity-based compensation | — | — | — | 28,801 | — | — | 8,226 | 37,027 | — | |||||||||||||||||||||||
| Deferred tax assets, net of amounts payable under tax receivable agreements | — | — | — | 14,740 | — | — | — | 14,740 | — | |||||||||||||||||||||||
| Issuance of Class A common stock, net of issuance costs | 18 | — | — | 62,696 | — | — | — | 62,714 | — | |||||||||||||||||||||||
| Forfeitures and employee/partner terminations | — | — | — | — | — | — | — | — | — | |||||||||||||||||||||||
| Issuance of restricted stock awards | 9 | — | — | (9) | — | — | — | — | — | |||||||||||||||||||||||
| Employee net share settlement | (1) | — | — | (3,314) | — | — | (1,215) | (4,530) | — | |||||||||||||||||||||||
| Exchange of subsidiary equity | 41 | (15) | (26) | — | — | — | — | — | — | |||||||||||||||||||||||
| Purchase of equity and subsidiary equity | — | (18) | — | (63,009) | — | — | — | (63,027) | — | |||||||||||||||||||||||
| Capital contributions, net | — | — | — | — | — | — | — | — | 38,277 | |||||||||||||||||||||||
| Impact of deconsolidation of consolidated investment products | — | — | — | — | — | — | — | — | (2,441) | |||||||||||||||||||||||
| Distributions | — | — | — | — | — | — | (85,805) | (85,805) | — | |||||||||||||||||||||||
| Dividends | — | — | — | (18,772) | (184,128) | — | (106) | (203,006) | — | |||||||||||||||||||||||
| Balance at December 31, 2020 | $ | 631 | $ | 45 | $ | 110 | $ | 107,738 | $ | 72,944 | $ | (991) | $ | 10,565 | $ | 191,042 | $ | 93,753 | ||||||||||||||
ARTISAN PARTNERS ASSET MANAGEMENT INC. Consolidated Statements of Changes in Stockholders’ Equity (U.S. dollars in thousands) | ||||||||||||||||||||||||
| Class A Common Stock | Class B Common Stock | Class C Common Stock | Additional Paid-in Capital | Retained Earnings | Accumulated Other Comprehensive Income (Loss) | Noncontrolling interest - Artisan Partners Holdings | Total stockholders’ equity | |||||||||||||||||
| Balance at January 1, 2015 | $ | 342 | $ | 215 | $ | 172 | $ | 93,524 | $ | 16,417 | $ | 206 | $ | (3,377 | ) | $ | 107,499 | |||||||
| Net income | — | — | — | — | 81,801 | — | 130,305 | 212,106 | ||||||||||||||||
| Other comprehensive income - foreign currency translation | — | — | — | — | — | (303 | ) | (283 | ) | (586 | ) | |||||||||||||
| Other comprehensive income - available for sale investments, net of tax | — | — | — | — | — | (307 | ) | (383 | ) | (690 | ) | |||||||||||||
| Cumulative impact of changes in ownership of Artisan Partners Holdings LP, net of tax | — | — | — | (5,463 | ) | — | 29 | 5,399 | (35 | ) | ||||||||||||||
| Amortization of equity-based compensation | — | — | — | 42,144 | — | — | 37,376 | 79,520 | ||||||||||||||||
| Deferred tax assets, net of amounts payable under tax receivable agreements | — | — | — | 26,075 | — | — | — | 26,075 | ||||||||||||||||
| Issuance of Class A common stock, net of issuance costs | 38 | — | — | 175,974 | — | — | — | 176,012 | ||||||||||||||||
| Forfeitures | — | (4 | ) | 3 | 1 | — | — | — | — | |||||||||||||||
| Issuance of restricted stock awards | 6 | — | — | (6 | ) | — | — | — | — | |||||||||||||||
| Employee net share settlement | — | — | — | (358 | ) | — | — | (311 | ) | (669 | ) | |||||||||||||
| Exchange of subsidiary equity | 8 | (4 | ) | (4 | ) | — | — | — | — | — | ||||||||||||||
| Purchase of equity and subsidiary equity | — | (24 | ) | (14 | ) | (176,520 | ) | — | — | — | (176,558 | ) | ||||||||||||
| Distributions | — | — | — | — | — | — | (182,175 | ) | (182,175 | ) | ||||||||||||||
| Dividends | — | — | — | (38,923 | ) | (84,980 | ) | — | (45 | ) | (123,948 | ) | ||||||||||||
| Balance at December 31, 2015 | $ | 394 | $ | 183 | $ | 157 | $ | 116,448 | $ | 13,238 | $ | (375 | ) | $ | (13,494 | ) | $ | 116,551 | ||||||
| Net income | — | — | — | — | 73,030 | — | 99,971 | 173,001 | ||||||||||||||||
| Other comprehensive income - foreign currency translation | — | — | — | — | — | (1,192 | ) | (938 | ) | (2,130 | ) | |||||||||||||
| Other comprehensive income - available for sale investments, net of tax | — | — | — | — | — | (30 | ) | (64 | ) | (94 | ) | |||||||||||||
| Cumulative impact of changes in ownership of Artisan Partners Holdings LP, net of tax | — | — | — | (3,332 | ) | — | (51 | ) | 3,378 | (5 | ) | |||||||||||||
| Amortization of equity-based compensation | — | — | — | 40,923 | (408 | ) | — | 31,481 | 71,996 | |||||||||||||||
| Deferred tax assets, net of amounts payable under tax receivable agreements | — | — | — | 8,439 | — | — | — | 8,439 | ||||||||||||||||
| Issuance of Class A common stock, net of issuance costs | — | — | — | (22 | ) | — | — | — | (22 | ) | ||||||||||||||
| Forfeitures | — | (17 | ) | 15 | 2 | — | — | — | — | |||||||||||||||
| Issuance of restricted stock awards | 11 | — | — | (11 | ) | — | — | — | — | |||||||||||||||
| Employee net share settlement | — | — | — | (422 | ) | — | — | (340 | ) | (762 | ) | |||||||||||||
| Exchange of subsidiary equity | 16 | (15 | ) | (1 | ) | — | — | — | — | — | ||||||||||||||
| Distributions | — | — | — | — | — | — | (133,876 | ) | (133,876 | ) | ||||||||||||||
| Dividends | — | — | — | (42,804 | ) | (72,465 | ) | — | (115 | ) | (115,384 | ) | ||||||||||||
| Balance at December 31, 2016 | $ | 421 | $ | 151 | $ | 171 | $ | 119,221 | $ | 13,395 | $ | (1,648 | ) | $ | (13,997 | ) | $ | 117,714 | ||||||
The accompanying notes are an integral part of the consolidated financial statements. | ||||||||||||||||||||||||
ARTISAN PARTNERS ASSET MANAGEMENT INC. Consolidated Statements of Changes in Stockholders’ Equity, continued (U.S. dollars in thousands) | |||||||||||||||||||||||||||
| Class A Common Stock | Class B Common Stock | Class C Common Stock | Additional Paid-in Capital | Retained Earnings (Deficit) | Accumulated Other Comprehensive Income (Loss) | Noncontrolling interest - Artisan Partners Holdings | Total stockholders’ equity | Redeemable non-controlling interest | |||||||||||||||||||
| Balance at January 1, 2017 | $ | 421 | $ | 151 | $ | 171 | $ | 119,221 | $ | 13,395 | $ | (1,648 | ) | $ | (13,997 | ) | $ | 117,714 | $ | — | |||||||
| Net income (loss) | — | — | — | — | 49,599 | — | 99,038 | 148,637 | 2,100 | ||||||||||||||||||
| Other comprehensive income - foreign currency translation | — | — | — | — | — | 830 | 447 | 1,277 | — | ||||||||||||||||||
| Other comprehensive income - available for sale investments, net of tax | — | — | — | — | — | 215 | 173 | 388 | — | ||||||||||||||||||
| Cumulative impact of changes in ownership of Artisan Partners Holdings LP, net of tax | — | — | — | (5,994 | ) | — | (270 | ) | 6,259 | (5 | ) | — | |||||||||||||||
| Amortization of equity-based compensation | — | — | — | 40,177 | — | — | 22,715 | 62,892 | — | ||||||||||||||||||
| Deferred tax assets, net of amounts payable under tax receivable agreements | — | — | — | 25,922 | — | — | — | 25,922 | — | ||||||||||||||||||
| Issuance of Class A common stock, net of issuance costs | 56 | — | — | 161,980 | — | — | — | 162,036 | — | ||||||||||||||||||
| Forfeitures | — | (1 | ) | 1 | — | — | — | — | — | — | |||||||||||||||||
| Issuance of restricted stock awards | 13 | — | — | (13 | ) | — | — | — | — | — | |||||||||||||||||
| Employee net share settlement | — | — | — | (891 | ) | — | — | (586 | ) | (1,477 | ) | — | |||||||||||||||
| Exchange of subsidiary equity | 15 | (10 | ) | (5 | ) | — | — | — | — | — | — | ||||||||||||||||
| Purchase of equity and subsidiary equity | — | (21 | ) | (35 | ) | (162,438 | ) | — | — | — | (162,494 | ) | — | ||||||||||||||
| Net contributions (redemptions) attributable to redeemable noncontrolling interest | — | — | — | — | — | — | — | — | 60,481 | ||||||||||||||||||
| Distributions | — | — | — | — | — | — | (115,804 | ) | (115,804 | ) | — | ||||||||||||||||
| Dividends | — | — | — | (30,054 | ) | (100,864 | ) | — | (103 | ) | (131,021 | ) | — | ||||||||||||||
| Balance at December 31, 2017 | $ | 505 | $ | 119 | $ | 132 | $ | 147,910 | $ | (37,870 | ) | $ | (873 | ) | $ | (1,858 | ) | $ | 108,065 | $ | 62,581 | ||||||
The accompanying notes are an integral part of the consolidated financial statements.
66
ARTISAN PARTNERS ASSET MANAGEMENT INC.
Consolidated Statements of Changes in Stockholders’ Equity, continued
(U.S. dollars in thousands)
| Class A Common Stock | Class B Common Stock | Class C Common Stock | Additional Paid-in Capital | Retained Earnings | Accumulated Other Comprehensive Income (Loss) | Noncontrolling interests - Artisan Partners Holdings | Total stockholders’ equity | Redeemable non-controlling interests | ||||||||||||||||||||||||
| Balance at January 1, 2021 | $ | 631 | $ | 45 | $ | 110 | $ | 107,738 | $ | 72,944 | $ | (991) | $ | 10,565 | $ | 191,042 | $ | 93,753 | ||||||||||||||
| Net income | — | — | — | — | 336,516 | — | 96,879 | 433,395 | 11,129 | |||||||||||||||||||||||
| Other comprehensive income - foreign currency translation | — | — | — | — | — | (271) | (48) | (319) | — | |||||||||||||||||||||||
| Cumulative impact of changes in ownership of Artisan Partners Holdings LP | — | — | — | (563) | — | (48) | 611 | — | — | |||||||||||||||||||||||
| Amortization of equity-based compensation | — | — | — | 32,750 | — | — | 6,899 | 39,649 | — | |||||||||||||||||||||||
| Deferred tax assets, net of amounts payable under tax receivable agreements | — | — | — | 9,656 | — | — | — | 9,656 | — | |||||||||||||||||||||||
| Issuance of Class A common stock, net of issuance costs | 10 | — | — | 46,630 | — | — | — | 46,640 | — | |||||||||||||||||||||||
| Forfeitures and employee/partner terminations | (1) | — | — | 1 | — | — | — | — | — | |||||||||||||||||||||||
| Issuance of restricted stock awards | 7 | — | — | (7) | — | — | — | — | — | |||||||||||||||||||||||
| Employee net share settlement | (2) | — | — | (7,452) | — | — | (1,791) | (9,245) | — | |||||||||||||||||||||||
| Exchange of subsidiary equity | 22 | (6) | (16) | — | — | — | — | — | — | |||||||||||||||||||||||
| Purchase of equity and subsidiary equity | — | (7) | (3) | (46,918) | — | — | — | (46,928) | — | |||||||||||||||||||||||
| Capital contributions, net | — | — | — | — | — | — | — | — | 73,236 | |||||||||||||||||||||||
| Impact of deconsolidation of consolidated investment products | — | — | — | — | — | — | — | — | (67,083) | |||||||||||||||||||||||
| Distributions | — | — | — | — | — | — | (93,189) | (93,189) | — | |||||||||||||||||||||||
| Dividends | — | — | — | — | (274,571) | — | (169) | (274,740) | — | |||||||||||||||||||||||
| Balance at December 31, 2021 | $ | 667 | $ | 32 | $ | 91 | $ | 141,835 | $ | 134,889 | $ | (1,310) | $ | 19,757 | $ | 295,961 | $ | 111,035 | ||||||||||||||
ARTISAN PARTNERS ASSET MANAGEMENT INC. Consolidated Statements of Cash Flows (U.S. dollars in thousands) | |||||||||||
| For the Years Ended December 31, | |||||||||||
| 2017 | 2016 | 2015 | |||||||||
| Cash flows from operating activities | |||||||||||
| Net income before noncontrolling interests | $ | 150,737 | $ | 173,001 | $ | 212,106 | |||||
| Adjustments to reconcile net income to net cash provided by operating activities: | |||||||||||
| Depreciation and amortization | 5,297 | 5,272 | 4,519 | ||||||||
| Deferred income taxes | 395,416 | 33,960 | 16,521 | ||||||||
| Net (gain) loss on investment securities | (519 | ) | (1,073 | ) | (424 | ) | |||||
| Net (gain) loss on the tax receivable agreements | (290,919 | ) | (650 | ) | 12,247 | ||||||
| Loss on disposal of property and equipment | 69 | 108 | 40 | ||||||||
| Amortization of debt issuance costs | 452 | 448 | 448 | ||||||||
| Share-based compensation | 62,892 | 71,996 | 79,520 | ||||||||
| Excess tax benefit on share-based awards | — | — | (1,300 | ) | |||||||
| Net investment (gain) loss of consolidated investment products | (4,241 | ) | — | — | |||||||
| Purchase of investments by consolidated investment products | (252,047 | ) | — | — | |||||||
| Proceeds from sale of investments by consolidated investment products | 190,353 | — | — | ||||||||
| Change in assets and liabilities resulting in an increase (decrease) in cash: | |||||||||||
| Accounts receivable | (16,955 | ) | 318 | 9,303 | |||||||
| Prepaid expenses and other assets | 1,629 | (4,898 | ) | (2,614 | ) | ||||||
| Accounts payable and accrued expenses | (9,202 | ) | (3,520 | ) | (316 | ) | |||||
| Class B liability awards | (506 | ) | (5,096 | ) | (8,682 | ) | |||||
| Deferred lease obligations | 2,391 | 494 | (129 | ) | |||||||
| Net change in operating assets and liabilities of consolidated investment products | (30,774 | ) | — | — | |||||||
| Net cash provided by operating activities | 204,073 | 270,360 | 321,239 | ||||||||
| Cash flows from investing activities | |||||||||||
| Acquisition of property and equipment | (1,578 | ) | (2,933 | ) | (3,794 | ) | |||||
| Leasehold improvements | (4,257 | ) | (4,343 | ) | (3,541 | ) | |||||
| Proceeds from sale of investment securities | 6,382 | 8,961 | 2,724 | ||||||||
| Purchase of investment securities | (5,250 | ) | (4,014 | ) | (6,750 | ) | |||||
| Change in restricted cash | — | 260 | 36 | ||||||||
| Net cash used in investing activities | (4,703 | ) | (2,069 | ) | (11,325 | ) | |||||
| The accompanying notes are an integral part of the consolidated financial statements. | |||||||||||
ARTISAN PARTNERS ASSET MANAGEMENT INC. Consolidated Statements of Cash Flows, continued (U.S. dollars in thousands) | |||||||||||
| For the Years Ended December 31, | |||||||||||
| 2017 | 2016 | 2015 | |||||||||
| Cash flows from financing activities | |||||||||||
| Partnership distributions | (115,804 | ) | (133,876 | ) | (182,175 | ) | |||||
| Dividends paid | (131,021 | ) | (115,384 | ) | (123,948 | ) | |||||
| Payment of debt issuance costs | (512 | ) | — | — | |||||||
| Proceeds from issuance of notes payable | 60,000 | — | — | ||||||||
| Principal payments on notes payable | (60,000 | ) | — | — | |||||||
| Change in other liabilities | — | — | (46 | ) | |||||||
| Payment under the tax receivable agreements | (30,234 | ) | (27,685 | ) | (20,040 | ) | |||||
| Net proceeds from issuance of common stock | 162,494 | — | 176,558 | ||||||||
| Payment of costs directly associated with the issuance of Class A common stock | (294 | ) | — | (427 | ) | ||||||
| Purchase of equity and subsidiary equity | (162,494 | ) | — | (176,558 | ) | ||||||
| Taxes paid related to employee net share settlement | (1,477 | ) | (762 | ) | (669 | ) | |||||
| Net contributions (redemptions) attributable to redeemable noncontrolling interest | 60,481 | — | — | ||||||||
| Excess tax benefit on share-based awards | — | — | 1,300 | ||||||||
| Net cash used in financing activities | (218,861 | ) | (277,707 | ) | (326,005 | ) | |||||
| Net increase (decrease) in cash and cash equivalents | (19,491 | ) | (9,416 | ) | (16,091 | ) | |||||
| Cash and cash equivalents | |||||||||||
| Beginning of period | 156,777 | 166,193 | 182,284 | ||||||||
| End of period | $ | 137,286 | $ | 156,777 | $ | 166,193 | |||||
| Supplementary information | |||||||||||
| Noncash activity: | |||||||||||
| Establishment of deferred tax assets | $ | 146,241 | $ | 33,941 | $ | 132,516 | |||||
| Establishment of amounts payable under tax receivable agreements | 120,320 | 25,480 | 107,740 | ||||||||
| Cash paid for: | |||||||||||
| Interest on borrowings | $ | 11,019 | $ | 11,108 | $ | 11,019 | |||||
| Income tax | 25,296 | 18,621 | 29,316 | ||||||||
The accompanying notes are an integral part of the consolidated financial statements.
67
ARTISAN PARTNERS ASSET MANAGEMENT INC.
Consolidated Statements of Cash Flows
(U.S. dollars in thousands)
| For the Years Ended December 31, | |||||||||||||||||
| Cash flows from operating activities | 2021 | 2020 | 2019 | ||||||||||||||
| Net income before noncontrolling interests | $ | 444,524 | $ | 308,503 | $ | 241,457 | |||||||||||
| Adjustments to reconcile net income to net cash provided by operating activities: | |||||||||||||||||
| Depreciation and amortization | 6,933 | 6,625 | 6,233 | ||||||||||||||
| Deferred income taxes | 38,382 | 27,990 | 7,356 | ||||||||||||||
| Asset impairment | — | 871 | 2,107 | ||||||||||||||
| Noncash lease expense | (1,931) | (1,499) | 1,533 | ||||||||||||||
| Net investment (gain) loss on nonconsolidated investment securities | (2,315) | (160) | (5,101) | ||||||||||||||
| Net (gain) loss on the tax receivable agreements | (358) | 4,674 | 19,557 | ||||||||||||||
| (Gain) loss on disposal of property and equipment | 4 | 5 | 275 | ||||||||||||||
| Amortization of debt issuance costs | 421 | 422 | 463 | ||||||||||||||
| Share-based compensation | 39,649 | 37,027 | 43,095 | ||||||||||||||
| Net investment (gain) loss of consolidated investment products | (19,748) | (26,147) | (10,084) | ||||||||||||||
| Purchase of investments by consolidated investment products | (252,399) | (191,274) | (123,366) | ||||||||||||||
| Proceeds from sale of investments by consolidated investment products | 196,620 | 137,561 | 75,468 | ||||||||||||||
| Change in assets and liabilities resulting in an increase (decrease) in cash: | |||||||||||||||||
| Accounts receivable | (15,962) | (18,020) | (14,178) | ||||||||||||||
| Prepaid expenses and other assets | (3,164) | (6,110) | 1,031 | ||||||||||||||
| Accounts payable and accrued expenses | (1,301) | 1,622 | 6,881 | ||||||||||||||
| Net change in operating assets and liabilities of consolidated investment products | (30,804) | 36,587 | 40,066 | ||||||||||||||
| Net cash provided by operating activities | 398,551 | 318,677 | 292,793 | ||||||||||||||
| Cash flows from investing activities | |||||||||||||||||
| Acquisition of property and equipment | (2,435) | (2,049) | (3,498) | ||||||||||||||
| Leasehold improvements | (3,532) | (1,050) | (14,286) | ||||||||||||||
| Proceeds from sale of investment securities | 12,813 | 24,001 | 288 | ||||||||||||||
| Purchase of investment securities | (33,820) | (2,150) | (10) | ||||||||||||||
| Net cash provided by (used in) investing activities | (26,974) | 18,752 | (17,506) | ||||||||||||||
The accompanying notes are an integral part of the consolidated financial statements.
68
ARTISAN PARTNERS ASSET MANAGEMENT INC.
Consolidated Statements of Cash Flows (continued)
(U.S. dollars in thousands)
| For the Years Ended December 31, | |||||||||||||||||
| Cash flows from financing activities | 2021 | 2020 | 2019 | ||||||||||||||
| Partnership distributions | (93,189) | (85,805) | (94,842) | ||||||||||||||
| Dividends paid | (274,740) | (203,006) | (188,178) | ||||||||||||||
| Payment of debt issuance costs | — | — | (366) | ||||||||||||||
| Proceeds from issuance of notes payable | — | — | 50,000 | ||||||||||||||
| Principal payments on notes payable | — | — | (50,000) | ||||||||||||||
| Payment under the tax receivable agreements | (31,250) | (26,943) | (24,998) | ||||||||||||||
| Net proceeds from issuance of common stock | 46,928 | 63,027 | — | ||||||||||||||
| Payment of costs directly associated with the issuance of Class A common stock | (244) | (227) | — | ||||||||||||||
| Purchase of equity and subsidiary equity | (46,928) | (63,027) | — | ||||||||||||||
| Taxes paid related to employee net share settlement | (9,246) | (4,530) | (2,078) | ||||||||||||||
| Capital contributions to consolidated investment products, net | 73,236 | 38,277 | 3,895 | ||||||||||||||
| Net cash used in financing activities | (335,433) | (282,234) | (306,567) | ||||||||||||||
| Net increase (decrease) in cash, cash equivalents and restricted cash | 36,144 | 55,195 | (31,280) | ||||||||||||||
| Net cash impact of deconsolidation of consolidated investment products | (34,823) | — | — | ||||||||||||||
| Cash, cash equivalents and restricted cash | |||||||||||||||||
| Beginning of period | 199,450 | 144,255 | 175,535 | ||||||||||||||
| End of period | $ | 200,771 | $ | 199,450 | $ | 144,255 | |||||||||||
| Cash, cash equivalents and restricted cash as of the end of the period | |||||||||||||||||
| Cash and cash equivalents | $ | 189,226 | $ | 154,987 | $ | 134,621 | |||||||||||
| Restricted cash | 629 | 629 | 629 | ||||||||||||||
| Cash and cash equivalents of consolidated investment products | 10,916 | 43,834 | 9,005 | ||||||||||||||
| Cash, cash equivalents and restricted cash | $ | 200,771 | $ | 199,450 | $ | 144,255 | |||||||||||
| Supplementary information | |||||||||||||||||
| Noncash activity: | |||||||||||||||||
| Establishment of deferred tax assets | $ | 54,214 | $ | 77,756 | $ | 35,999 | |||||||||||
| Establishment of amounts payable under tax receivable agreements | 44,209 | 64,087 | 30,967 | ||||||||||||||
| Increase in investment securities due to deconsolidation of consolidated investment products | 20,900 | 1,469 | 946 | ||||||||||||||
| Operating lease assets obtained in exchange for operating leases | 20,830 | 3,425 | 4,162 | ||||||||||||||
| Cash paid for: | |||||||||||||||||
| Interest on borrowings | $ | 10,210 | $ | 10,255 | $ | 10,649 | |||||||||||
| Income tax | 70,337 | 35,484 | 18,593 | ||||||||||||||
The accompanying notes are an integral part of the consolidated financial statements.
69
ARTISAN PARTNERS ASSET MANAGEMENT INC.
Notes to Consolidated Financial Statements
(U.S. currencies in thousands, except share and per share or per unit amounts and as otherwise indicated)
Note 1. Nature of Business and Organization
Nature of Business
Artisan Partners Asset Management Inc. (“APAM”), through its subsidiaries, is an investment management firm focused on providing high-value added, active investment strategies to sophisticated clients globally. APAM and its subsidiaries are hereafter referred to collectively as “Artisan” or the “Company”.
Artisan’s autonomous investment teams manage a broad range of U.S., non-U.S. and global investment strategies that are diversified by asset class, market cap and investment style. Strategies are offered through multiple investment vehicles to accommodate a broad range of client mandates. Artisan offers its investment management services primarily to institutions and through intermediaries that operate with institutional-like decision-making processes and have long-term investment horizons.
Organization
On March 12, 2013, APAM completed its initial public offering (the “IPO”). APAM was formed for the purpose of becoming the general partner of Artisan Partners Holdings LP (“Artisan Partners Holdings” or “Holdings”) in connection with the IPO. Holdings is a holding company for the investment management business conducted under the name “Artisan Partners”. The reorganization (“IPO Reorganization”) established the necessary corporate structure to complete the IPO while at the same time preserving the ability of the firm to conduct operations through Holdings and its subsidiaries.
As theits sole general partner, APAM controls the business and affairs of Holdings. As a result, APAM consolidates Holdings’ financial statements and records a noncontrolling interest for the equity interests in Holdings held by the limited partners of Holdings. At December 31, 2017,2021, APAM held approximately 67%84% of the equity ownership interest in Holdings.
Holdings, together with its wholly owned subsidiary, Artisan Investments GP LLC, (“AIGP”), controls a 100% interest in Artisan Partners Limited Partnership (“APLP”), a multi-product investment management firm that is the principal operating subsidiary of Artisan Partners Holdings. APLP is registered as an investment adviser with the U.S. Securities and Exchange Commission under the Investment Advisers Act of 1940. APLP provides investment advisory services to traditional separate accounts and pooled investment vehicles, including Artisan Partners Funds, Inc. (“Artisan Funds” or the “Funds”) and, Artisan Partners Global Funds plc (“Artisan Global Funds”), and Artisan sponsored private funds (“Artisan Private Funds”). Artisan Funds are a series of open-end, diversified mutual funds registered under the Investment Company Act of 1940, as amended. Artisan Global Funds is a family of Ireland-domiciled UCITS.
| Total Common Units Exchanged | Class A Common Units | Class B Common Units | Class E Common Units | |||||
| Common units exchanged on March 6, 2017 | 206,770 | — | 206,770 | — | ||||
| Common units exchanged on May 5, 2017 | 474,127 | 50,000 | 404,127 | 20,000 | ||||
| Common units exchanged on August 8, 2017 | 317,281 | 133,073 | 45,238 | 138,970 | ||||
| Common units exchanged on November 8, 2017 | 293,049 | — | 211,812 | 81,237 | ||||
| Common units exchanged on December 29, 2017 | 180,970 | — | 180,970 | — | ||||
| Total Units Exchanged | 1,472,197 | 183,073 | 1,048,917 | 240,207 | ||||
Note 2. Summary of Significant Accounting Policies
Basis of presentation
The accompanying consolidated financial statements were prepared in accordance with U.S. generally accepted accounting principles (“U.S. GAAP”) and related rules and regulations of the SEC. The preparation of financial statements in conformity with U.S. GAAP requires management to make estimates or assumptions that affect the reported amounts and disclosures in the financial statements. Actual results could differ from these estimates or assumptions.
Principles of consolidation
Artisan’s policy is to consolidate all subsidiaries or other entities in which it has a controlling financial interest. The consolidation guidance requires an analysis to determine if an entity should be evaluated for consolidation using the voting interest entity (“VOE”) model or the variable interest entity (“VIE”) model. Under the VOE model, controlling financial interest is generally defined as a majority ownership of voting interests. Under the VIE model, controlling financial interest is defined as (i) the power to direct activities that most significantly impact the economic performance of the entity and (ii) the right to receive potentially significant benefits or the obligation to absorb potentially significant losses. Artisan generally consolidates VIEs in which it meets the power criteria and holds an equity ownership interest of greater than 10%. The consolidated financial statements include the accounts of APAM and all subsidiaries or other entities in which APAM has a direct or indirect controlling financial interest. All material intercompany balances have been eliminated in consolidation.
Artisan serves as the investment adviser to Artisan Funds, Artisan Global Funds and other investment products, including Artisan sponsored private funds.Private Funds. Artisan Funds and Artisan Global Funds are corporate entities the business and affairs of which are managed by their respective boards of directors. The shareholders of the funds retain voting rights, including rights to elect and reelect members of their respective boards of directors. Each series of Artisan Funds is a VOE and is separately evaluated for consolidation under the VOE model. The shareholders of Artisan Global Funds lack simple majority liquidation rights, and as a result, each sub-fund of Artisan Global Funds is evaluated for consolidation under the VIE model. Artisan sponsored privately offered fundsPrivate Funds are also evaluated for consolidation under the VIE model because third-party equity holders of the funds generally lack the ability to remove Artisan as the general partner, or otherwise divest Artisan of its control of the funds.
70
From time to time, the Company makes investments in Artisan Funds, Artisan Global Funds and privately offered investment strategies, which are made on the same terms as are available to other investors.Artisan Private Funds. If the investment results in a controlling financial interest, APAM consolidates the fund, and the underlying individual securities are accounted for as trading securities. Investmentsactivity of the entire fund is included in which the Company does not have a controlling financial interest are classified as available-for-sale investments, as described below under “-Investment Securities”.Artisan’s Consolidated Financial Statements. As of December 31, 2017,2021, Artisan hashad a controlling financial interest in two1 series of Artisan Funds, 3 sub-funds of Artisan Global Funds and two privately offered investment funds2 Artisan Private Funds and, as a result, these funds are included in Artisan’s Consolidated Financial Statements. Because thethese consolidated investment products meet the definition of investment companies under U.S. GAAP, Artisan has retained the specialized industry accounting principles for investment companies in its Consolidated Financial Statements.the consolidated financial statements. See Note 6, “Variable Interest Entities and Consolidated Investment Products” for additional details.
Operating segments
Artisan operates in one segment, the investment management industry. Artisan provides investment management services to separate accounts mutual funds and other pooled investment vehicles. Management assesses the financial performance of these vehicles on a combined basis.
Cash and cash equivalents
Artisan defines cash and cash equivalents as money market funds and other highly liquid investments with original maturities of 90 days or less. Cash and cash equivalents are stated at cost, which approximates fair value due to the short-term nature and liquidity of these financial instruments. For disclosure purposes, cash equivalents are categorized as Level 1 in the fair value hierarchy. Cash and cash equivalents are subject to credit risk and were primarily maintained in demand deposit accounts with financial institutions or treasury money market funds. Interest and dividends related to cash and cash equivalents is recorded in other investment gain (loss) in the Consolidated Statements of Operations.
Foreign currency translation
Assets and liabilities of foreign operations whose functional currency is not the U.S. dollar are translated at prevailing year-end exchange rates. Revenue and expenses of such foreign operations are translated at average exchange rates during the year. The net effect of the translation adjustment for foreign operations is included in other comprehensive income (loss) in the Consolidated Statements of Comprehensive Income (Loss).Income. The cumulative effect of translation adjustments is included in accumulated other comprehensive income (loss) and noncontrolling interestinterests - Artisan Partners Holdings in the Consolidated Statements of Financial Condition, based on period-end ownership levels.
Accounts receivable
Accounts receivable are carried at invoiced amounts and consist primarily of investment managementadvisory fees that have been earned, but not yet received from clients. Due to the short-term nature of the receivables, the carrying values of these assets approximate fair value. The accounts receivable balance does not include any allowance for doubtful accounts as Artisan believes all accounts receivable balances are fully collectible. There has not been any bad debt expense recorded for the years ended December 31, 2017, 20162021, 2020 and 2015.2019.
Investment securities
Investment securities consist of nonconsolidated investments in unconsolidated sponsored investment entitiesshares of Artisan Funds, Artisan Global Funds, and are classified as available-for-sale.Artisan Private Funds. Investments provide exposure to various risks, including price risk (the risk of a potential future decline in value of the investment) and foreign currency risk. Investments in registered mutual funds are carried at fair value at their respectivebased on net asset values as of the valuation date.
Property and equipment
Property and equipment are carried at cost, less accumulated depreciation. Depreciation is generally recognized on a straight-line basis over the estimated useful lives of the respective assets which range from threeor the remaining lease term, whichever is shorter. The estimated useful lives of property and equipment as of December 31, 2021 are as follows:
| Property and Equipment Type | Useful Life | |||||||
| Computers and equipment | Three to Five years | |||||||
| Computer software | Three to Five years | |||||||
| Furniture and fixtures | Seven years | |||||||
| Leasehold improvements | Two to 14 years | |||||||
71
Implementation costs incurred to seven years. Depreciation for leasehold improvements is recognizeddevelop or obtain internal-use software, including hosting arrangements, are capitalized and expensed on a straight-line basis over either the applicable life of the asset class, typically the lesser of the economicestimated useful life of the improvementrespective software or the remaining term of the lease. hosting arrangement.
Property and equipment is tested for impairment when there is an indication that the carrying amount of an asset may not be recoverable. When an asset is determined to not be recoverable, the impairment loss is measured based on the excess, if any, of the carrying value of the asset over its fair value.
Leases
Artisan has lease commitments for office space, parking structures, and equipment, which are all accounted for as operating leases. Artisan records expense for operating leases on a straight-line basis over the lease term. Any lease incentives received by Artisan are also amortized on a straight-line basis over the lease term.
Artisan assesses its contractual arrangements for the existence of a lease at inception. Operating leases with an initial term greater than 12 months are recorded as operating lease assets and operating lease liabilities in the Consolidated Statements of Financial Condition. Lease components (e.g. fixed rental payments) and non-lease components (e.g. fixed common-area maintenance costs) are generally accounted for as a single component.
Operating lease liabilities are recognized at the lease commencement date based on the present value of lease payments over the lease term. Operating lease assets are recognized at the lease commencement date based on the present value of lease payments over the lease term, adjusted for prepaid rent and the remaining balance of lease incentives received. Artisan's lease agreements generally do not provide an implicit interest rate, and therefore the present value calculation uses Artisan's estimated incremental borrowing rate. A market-based approach is used to estimate the incremental borrowing rate for each individual lease using observable market interest rates and Artisan specific inputs. The lease terms include periods covered by options to extend or exclude periods covered by options to terminate the lease when it is reasonably certain that Artisan will exercise that option.
Restricted cash
Restricted cash represents cash that is restricted as collateral on a standby letter of credit related to a lease obligation.
Cash and cash equivalents of consolidated investment products
Cash and cash equivalents of consolidated investment products consist of highly liquid investments, including money market funds. See Note 6, “Variable Interest Entities and Consolidated Investment Products” for additional details.
Investment assets and liabilities of consolidated investment products
Investment assets and liabilities of consolidated investment products primarily consist of equity andsecurities, fixed income securities.securities and options. The carrying value of the investment assets and liabilities is also their fair value. Changes in the fair value of the investments are recognized as gains and losses in earnings. Equity securities are generally valued based upon closing market prices of the security on the principal exchange on which the security is traded. Fixed income securities include corporate bonds, convertible bonds and bank loans. Fixed income securities are generally valued based on the judgment of pricing vendors. Derivative assets and liabilities are generally comprised of put and call options on securities or indices. Put and call options are valued at the mid price (average of the bid price and ask price) as provided by the pricing vendor at the close of trading on the contract’s principal exchange. See Note 6, “Variable Interest Entities and Consolidated Investment Products” for additional details.
Redeemable noncontrolling interests
Redeemable noncontrolling interests represent third-party investors’ ownership interest in consolidated investment products. Third-party investors in consolidated investment products generally have the right to withdraw their capital, subject to certain conditions. Noncontrolling interests of consolidated investment products that are currently redeemable or convertible for cash or other assets at the option of the holder are classified as temporary equity.
Revenue recognition
Artisan’s investment advisory revenue is derived from contracts with customers in the form of investment management fees and performance fees.
Investment Management Fees
Investment management fees are generally computed as a percentage of assets under management and are recognized as services are rendered. Feesrevenue at the end of each distinct service period. Management fees for providing investment advisory services are computed and billed in accordance with the provisions of the applicableunderlying investment management agreements, which is generally on a monthly or quarterly basis. Investment management fees are presented net of cash rebates and fees waivedexpense reimbursements pursuant to contractual expense limitations of the funds or voluntary waivers.certain funds.
72
Performance Fees
A number of investment management agreements for a small number of accounts provide for performance-based fees or incentive allocations. Performance-basedallocations, collectively “performance fees”. Performance fees, and incentive allocations, if earned, are recognized upon completion of the contractually determined measurement period, which is generally quarterly or annually.
Performance fees are subject to the uncertainty of market volatility, and as a five-yearresult, the entire amount of the variable consideration related to performance fees is constrained until the end of each measurement period. At the end of the measurement period, from the date of grant. Holders of Class B limited partnership interests were entitled to fully participate in profits from and after the date of grant. During 2013, the Class B awards were modified, which eliminated the cash redemption feature and resulted in equity classification since such modification. Compensation expenserevenue is recorded for unvested Class B awards onthe actual amount of performance fees earned during that period because the uncertainty has been resolved. For performance fees with annual measurement periods, revenue recognized in the current period could relate to performance obligations that were partially satisfied in prior periods.
Customer Rebates and Expense Reimbursements
Artisan has contractually agreed to reimburse for expenses incurred to the extent necessary to limit annualized ordinary operating expenses incurred by certain funds to not more than a straight-line basis overfixed percentage of the remaining vesting period. Asfunds’ average daily net assets. Artisan may also contractually agree to pay fee rebates to certain investors in Artisan Global Funds. Artisan accounts for all reimbursements and rebates as a reduction of July 1, 2017, all Class B awards were fully vested.the transaction price (and, hence, of revenue) because the billing adjustments and payments represent consideration payable to customers and Artisan does not receive any distinct goods or services from the customers in exchange.
Share-based compensation
Share-based compensation expense is recognized based on grant-datethe estimated grant date fair value on a straight-line basis over the requisite service period of the award. The initial requisite service period is generally five years for restricted share-based awards. The Company’s accounting policy is to record the impact of forfeitures when they occur. The awards generally vest ratably over a five-year period from the date of grant. Certain awards vest upon the satisfaction of both (1) pro-rata annual time vesting over five years and (2) qualifying retirement (as defined in the award agreements).
Distribution, feesservicing and marketing
Artisan Funds has authorized certain financial services companies, broker-dealers, banks or other intermediaries, and in some cases other organizations designated by an authorized intermediary, to accept purchase, exchange, and redemption orders for shares of Artisan Funds on the funds’ behalf. Many intermediaries charge a fee for accounting and shareholder services provided to fund shareholders on the funds’ behalf. Those services typically include recordkeeping, transaction processing for shareholders’ accounts, and other services.
Artisan Global Funds also have distribution arrangements pursuant to which Artisan is required to pay a portion of its investment management fee for distribution, servicing and marketing of Artisan Global Funds shares.
Distribution, servicing and marketing fees paid by Artisan are presented as an operating expense asbecause Artisan is the principal in its role as the primary obligor related to distribution and marketingthese services. Distribution fees paid to intermediariesExpenses incurred were as follows:
| For the Years Ended December 31, | |||||||||||
| 2017 | 2016 | 2015 | |||||||||
| Total intermediary fees incurred related to Artisan Funds | $ | 78,398 | $ | 88,942 | $ | 120,402 | |||||
| Less: fees incurred by Artisan Funds | 52,701 | 59,654 | 80,390 | ||||||||
| Fees incurred by Artisan | 25,697 | 29,288 | 40,012 | ||||||||
| Global Funds distribution and other marketing expenses | 3,923 | 3,228 | 3,614 | ||||||||
| Total distribution, servicing and marketing | $ | 29,620 | $ | 32,516 | $ | 43,626 | |||||
| For the Years Ended December 31, | |||||||||||||||||
| 2021 | 2020 | 2019 | |||||||||||||||
| Expenses incurred with respect to Artisan Funds | $ | 28,640 | $ | 21,320 | $ | 20,096 | |||||||||||
| Expenses incurred with respect to Global Funds | 899 | 595 | 424 | ||||||||||||||
| Other marketing expenses | 2,180 | 2,397 | 2,650 | ||||||||||||||
| Total distribution, servicing and marketing | $ | 31,719 | $ | 24,312 | $ | 23,170 | |||||||||||
Accrued fees to intermediaries were $3.6$5.3 million and $4.2 million as of December 31, 20172021 and 2016,2020, respectively, and are included in accounts payable, accrued expenses and other liabilities in the Consolidated Statements of Financial Condition.
73
Loss contingencies
Artisan considers the assessment of loss contingencies as a significant accounting policy because of the significant uncertainty relating to the outcome of any potential legal actions and other claims and the difficulty of predicting the likelihood and range of the potential liability involved, coupled with the material impact on Artisan’s results of operations that could result from legal actions or other claims and assessments. Artisan recognizes estimated costs to defend as incurred. Potential loss contingencies are reviewed at least quarterly and are adjusted to reflect the impact and status of settlements, rulings, advice of counsel and other information pertinent to a particular matter. Significant differences could exist between the actual cost required to investigate, litigate and/or settle a claim or the ultimate outcome of a suit and management’s estimate. These differences could have a material impact on Artisan’s results of operations, financial position, or cash flows. Recoveries of losses are recognized in the Consolidated Statements of Operations when receipt is deemed probable. No loss contingencies were recorded at December 31, 2017, 2016,2021, 2020 and 2015.2019. Currently, there are no legal or administrative proceedings that management believes may have a material effect on Artisan’s consolidated financial position, cash flows or results of operations.
Income taxes
Artisan accounts for income taxes under the asset and liability method, which requires the recognition of deferred tax assets and liabilities for the future tax consequences attributable to temporary differences between the financial statement carrying amounts and tax bases of assets and liabilities. Deferred tax assets and liabilities are measured using enacted tax rates expected to apply to taxable income in the years in which those temporary differences are expected to be realized or settled. Artisan recognizes a valuation allowance if it is more likely than not that some portion or all of the deferred tax assets will not be realized.
Artisan accounts for uncertain income tax positions by recognizing the impact of a tax position in its consolidated financial statements when Artisan believes it is more likely than not that the tax position would not be sustained upon examination by the appropriate tax authorities based on the technical merits of the position.
Comprehensive income (loss)
Total comprehensive income (loss) includes net income and other comprehensive income. Other comprehensive income (loss) consists of the change in unrealized gains (losses) on available-for-sale investments and foreign currency translation, net of related tax effects. The tax effects of components of other comprehensive income (loss) is calculated on the portion of comprehensive income (loss) attributable to APAM.translation.
Partnership distributions
Artisan makes distributions to its partners for purposes of paying income taxes as required under the terms of Artisan Partners Holdings’ partnership agreement. Tax distributions are calculated utilizing the highest combined individual federal, state and local income tax rate among the various locations in which the partners, as a result of owning their interests in the partnership, are subject to tax, assuming maximum applicability of the phase-out of itemized deductions contained in the Internal Revenue Code.Code that apply to any specific tax year. Artisan also makes additional distributions under the terms of the partnership agreement. Distributions are recorded in the financial statements on the declaration date.
Earnings per Shareshare
Basic earnings per share is computed under the two-class method by dividing income available to Class A common stockholders by the weighted average number of Class A common shares outstanding during the period. Unvested restricted share-based awards are excluded from the number of Class A common shares outstanding for the basic earnings per share calculation because the shares have not yet been earned by employees. Income available to Class A common stockholders is computed by reducing net income attributable to APAM by earnings (both distributed and undistributed) allocated to participating securities, according to their respective rights to participate in those earnings. UnvestedExcept for certain performance share units, unvested share-based awards are participating securities because the awards include non-forfeitable dividend rights during the vesting period. Class B and Class C common shares do not share in profits of APAM and therefore are not reflected in the calculations.
Diluted earnings per share is computed by increasingunder the denominator bymore dilutive of the amounttreasury stock method or the two-class method. The weighted average number of additional Class A common shares that would have been outstanding if all potential Class A common shares had been issued. The numeratorduring the period is also increased forby the net income allocated to the potential Class A common shares. Potential dilutive Class A common shares consistassumed conversion of (1) the Class A common shares issuable upon exchange of Holdings limited partnership units for APAMnonparticipating unvested share-based awards into Class A common stock and (2) unvested restricted share-based awards.using the treasury stock method.
Recent accounting pronouncements
74
Note 3. Investment Securities
The disclosures below include details of Artisan’s investments, excluding money market funds and consolidated investment products. Investments held by consolidated investment products are described in Note 6, “Variable Interest Entities and Consolidated Investment Products”.
| Cost | Unrealized Gains | Unrealized Losses | Fair Value | ||||||||||||
| December 31, 2017 | |||||||||||||||
| Mutual funds | $ | 4,361 | $ | 617 | $ | — | $ | 4,978 | |||||||
| December 31, 2016 | |||||||||||||||
| Mutual funds | $ | 6,194 | $ | 103 | $ | — | $ | 6,297 | |||||||
| As of December 31, 2021 | As of December 31, 2020 | ||||||||||
| Investments in equity securities | $ | 37,179 | $ | 2,807 | |||||||
| Investments in equity securities accounted for under the equity method | 10,699 | 849 | |||||||||
| Total investment securities | $ | 47,878 | $ | 3,656 | |||||||
Artisan’s investments in mutual fundsequity securities consist of investments in shares of Artisan Funds, and Artisan Global Funds and are considered to be available-for-sale securities. As a result, unrealized gains (losses) are recorded to other comprehensive income (loss).
Private Funds. As of December 31, 2017 and 2016, none2021, $36.5 million of the Company’sArtisan’s investment securities were in an unrealized loss position. No impairment lossesrelated to funded long-term incentive compensation plans. Unrealized gains (losses) related to investment securities held at the end of the periods indicated below were recorded on these available-for-sale securities.as follows:
| As of December 31, 2021 | As of December 31, 2020 | As of December 31, 2019 | |||||||||||||||
| Unrealized gain (loss) on investment securities held at the end of the period | $ | 1,602 | $ | 716 | $ | 5,050 | |||||||||||
Other net investment gain (loss) is presented within the non-operating income (expense) section of the Consolidated Statements of Operations. The components of other net investment gain (loss) are as follows:
| For the Years Ended December 31, | |||||||||||||||||
| 2021 | 2020 | 2019 | |||||||||||||||
| Net investment gain (loss) on seed investments | $ | (401) | $ | 160 | $ | 5,087 | |||||||||||
| Net investment gain (loss) on franchise capital investments | $ | 2,716 | $ | — | $ | — | |||||||||||
| Other | $ | (559) | $ | 145 | $ | 1,251 | |||||||||||
| Other net investment gain (loss) | $ | 1,756 | $ | 305 | $ | 6,338 | |||||||||||
Note 4. Fair Value Measurements
The table below presents information about Artisan’s assets and liabilities that are measured at fair value and the valuation techniques Artisan utilized to determine such fair value. The financial instruments held by consolidated investment products are excluded from the table below and are presented in Note 6, “Variable Interest Entities and Consolidated Investment Products”.
In accordance with ASC 820, fair value is defined as the price that Artisan would receive upon selling an investment in an orderly transaction to an independent buyer in the principal or most advantageous market for the investment. The following three-tier fair value hierarchy prioritizes the inputs used in measuring fair value:
•Level 1 – Observable inputs such as quoted (unadjusted) market prices in active markets for identical securities.
•Level 2 – Other significant observable inputs (including but not limited to quoted prices for similar instruments, interest rates, prepayment speeds, credit risk, etc.).
•Level 3—3 – Significant unobservable inputs (including Artisan’s own assumptions in determining fair value).
75
The following provides the hierarchy of inputs used to derive fair value of Artisan’s assets and liabilities that are financial instruments as of December 31, 20172021 and 2016:
| Assets and Liabilities at Fair Value | |||||||||||||||
| Total | Level 1 | Level 2 | Level 3 | ||||||||||||
| December 31, 2017 | |||||||||||||||
| Assets | |||||||||||||||
| Cash equivalents | $ | 26,727 | $ | 26,727 | $ | — | $ | — | |||||||
| Mutual funds | 4,978 | 4,978 | — | — | |||||||||||
| December 31, 2016 | |||||||||||||||
| Assets | |||||||||||||||
| Cash equivalents | $ | 64,170 | $ | 64,170 | $ | — | $ | — | |||||||
| Mutual funds | 6,297 | 6,297 | — | — | |||||||||||
| Assets and Liabilities at Fair Value | |||||||||||||||||||||||||||||
| Total | NAV Practical Expedient (No Fair Value Level) | Level 1 | Level 2 | Level 3 | |||||||||||||||||||||||||
| December 31, 2021 | |||||||||||||||||||||||||||||
| Assets | |||||||||||||||||||||||||||||
| Money market funds | $ | 37,861 | $ | — | $ | 37,861 | $ | — | $ | — | |||||||||||||||||||
| Equity securities | 47,878 | 9,975 | 37,903 | — | — | ||||||||||||||||||||||||
| December 31, 2020 | |||||||||||||||||||||||||||||
| Assets | |||||||||||||||||||||||||||||
| Money market funds | $ | 25,855 | $ | — | $ | 25,855 | $ | — | $ | — | |||||||||||||||||||
| Equity securities | 3,656 | 57 | 3,599 | — | — | ||||||||||||||||||||||||
Fair values determined based on Level 1 inputs utilize quoted market prices for identical assets. Level 1 assets generally consist of money market funds, open-end mutual funds and UCITS funds. Equity securities without a fair value level consist of the Company’s investments in Artisan Private Funds, which are measured at the underlying fund’s net asset value (“NAV”), using the ASC 820 practical expedient. The NAV is provided by the fund and is derived from the fair values of the underlying investments as of the reporting date. Cash maintained in demand deposit accounts is excluded from the table above.
Note 5. Borrowings
Artisan’s borrowings consist of the following as of December 31, 20172021 and 2016:
| Maturity | Outstanding Balance as of 12/31/2017 | Outstanding Balance as of 12/31/2016 | Interest Rate Per Annum | |||||||||
| Revolving credit agreement | August 2022 | — | — | NA | ||||||||
| Senior notes | ||||||||||||
| Series A | August 2017 | — | 60,000 | 4.98 | % | |||||||
| Series B | August 2019 | 50,000 | 50,000 | 5.32 | % | |||||||
| Series C | August 2022 | 90,000 | 90,000 | 5.82 | % | |||||||
| Series D | August 2025 | 60,000 | — | 4.29 | % | |||||||
| Total borrowings | $ | 200,000 | $ | 200,000 | ||||||||
| Maturity | Outstanding Balance | Interest Rate Per Annum | |||||||||||||||||||||
| Revolving credit agreement | August 2022 | — | NA | ||||||||||||||||||||
| Senior notes | |||||||||||||||||||||||
| Series C | August 2022 | 90,000 | 5.82 | % | |||||||||||||||||||
| Series D | August 2025 | 60,000 | 4.29 | % | |||||||||||||||||||
| Series E | August 2027 | 50,000 | 4.53 | % | |||||||||||||||||||
| Total borrowings | $ | 200,000 | |||||||||||||||||||||
The fair value of borrowings was approximately $209.3$203.2 million as of December 31, 2017.2021. Fair value was determined based on future cash flows, discounted to present value using current market interest rates. The inputs are categorized as Level 2 in the fair value hierarchy, as defined in Note 4, “Fair Value Measurements”.
Senior notes - On August 16, 2012,December 7, 2021, Holdings issued $200 million in senior unsecured notes and entered into a $100Note Purchase Agreement to issue $90.0 millionfive-year revolving credit agreement. of Series F senior notes in a private placement transaction on August 16, 2022, subject to the satisfaction of certain customary closing conditions. The Company will use the proceeds were usedfrom the Series F senior notes to repay the entire outstanding principal of an existing term loan.
The fixed interest rate on each series of unsecured notes is subject to a one percentage point increase in the event Holdings receives a below-investment grade rating and any such increase will continue to apply until an investment grade rating is received.
Revolving credit agreement - Any loans outstanding under the revolving credit agreement bear interest at a rate per annum equal to, at the Company’s election, (i) LIBOR adjusted by a statutory reserve percentage plus an applicable margin ranging from 1.50% to 2.50%, depending on Holdings’ leverage ratio (as defined in the revolving credit agreement) or (ii) an alternate base rate equal to the highest of (a) Citibank, N.A.’s prime rate, (b) the federal funds effective rate plus 0.50%, and (c) the daily one-monthone-month LIBOR adjusted by a statutory reserve percentage plus 1.00%, plus, in each case, an applicable margin ranging from 0.50% to 1.50%, depending on Holdings’ leverage ratio. Unused commitments will bear interest at a rate that ranges from 0.175% to 0.500%, depending on Holdings’ leverage ratio.
As of and for the year-ended December 31, 2017,2021, there were no borrowings outstanding under the revolving credit agreement and the interest rate on the unused commitment was 0.175%.
76
The unsecured notes and the revolving credit agreement contain certain restrictive financial covenants including a limitation on the leverage ratio of Holdings and a minimum interest coverage ratio. The Company was in compliance with all debt covenants as of December 31, 2021.
Interest expense incurred on the unsecured notes and revolving credit agreement was $10.9$10.3 million, for the year ended December 31, 2017,$10.3 million, and $11.1$10.5 million for the years ended December 31, 20162021, 2020 and 2015.2019, respectively.
As of December 31, 2017,2021, the aggregate maturities of debt obligations, based on their contractual terms, are as follows:
| 2022 | $ | 90,000 | |||
| 2023 | — | ||||
| 2024 | — | ||||
| 2025 | 60,000 | ||||
| 2026 | — | ||||
| Thereafter | 50,000 | ||||
| Total | $ | 200,000 | |||
| 2018 | $ | — | |
| 2019 | 50,000 | ||
| 2020 | — | ||
| 2021 | — | ||
| 2022 | 90,000 | ||
| Thereafter | 60,000 | ||
| Total | $ | 200,000 | |
Note 6. Variable Interest Entities and Consolidated Investment Products
Artisan serves as the investment adviser for various types of investment products, consisting of both VIEs and VOEs. Artisan consolidates an investment product if it has a controlling financial interest in the entity. See Note 2, “Summary of Significant Accounting Policies”. Any such entities are collectively referred to herein as consolidated investment products or CIPs.
As of December 31, 2017,2021, Artisan is considered to be the primary beneficiaryhave a controlling financial interest in 1 series of two seriesArtisan Funds, 3 sub-funds of Artisan Global Funds and 2 Artisan Private Funds, with an aggregate direct equity investment in the funds related to two privately offeredconsolidated investment strategies for which it serves as investment manager. Artisan made aggregate seed investmentsproducts of $33.3 million in these CIPs during the year ended December 31, 2017.$61.9 million.
Artisan’s maximum exposure to loss in connection with the assets and liabilities of CIPs is limited to its direct equity investment, while the potential benefit is limited to the management fee and incentive allocationperformance fees received and the return on its equity investment. With the exception of Artisan’s direct equity investment, the assets of CIPs are not available to Artisan’s creditors, nor are they available to Artisan for general corporate purposes. In addition, third-party investors in the CIPs have no recourse to the general credit of the Company. As of December 31, 2017, Artisan’s aggregate direct equity investment in consolidated investment products was $35.4 million.
See Note 17, “Related Party Transactions” for additional information on management and performance fees earned from CIPs.
Third-party investors’ ownership interest in CIPs is presented as redeemable noncontrolling interestinterests in the Consolidated Statements of Financial Condition as third-party investors have the right to withdraw their capital, subject to certain conditions. Net income attributable to third-party investors is reported as net income attributable to noncontrolling interests - consolidated investment products in the Consolidated Statements of Operations.
77
During the year ended December 31, 2021, the Company determined that it no longer had a controlling financial interest in one Artisan Private Fund upon the redemption of the Company's seed investment. Upon loss of control, the VIE was deconsolidated and the following assets, liabilities, and equity of the fund were derecognized from the Company’s Consolidated Statements of Financial Condition:
| As of January 1, 2021 | ||||||||
| Assets of consolidated investment products | ||||||||
| Cash and cash equivalents | $ | 34,823 | ||||||
| Accounts receivable and other | 1,769 | |||||||
| Investment assets, at fair value | 72,868 | |||||||
| Less: Amounts reclassified to investment securities | (11,200) | |||||||
| Total assets | $ | 98,260 | ||||||
| Liabilities of consolidated investment products | ||||||||
| Accounts payable, accrued expenses and other | $ | 76,960 | ||||||
| Investment liabilities, at fair value | 566 | |||||||
| Total liabilities | 77,526 | |||||||
| Redeemable noncontrolling interests | 20,734 | |||||||
| Total liabilities and equity | $ | 98,260 | ||||||
There was no net impact to the Consolidated Statements of Operations for the year ended December 31, 2021. Artisan generally does not recognize a gain or loss upon deconsolidation of investment products because the assets and liabilities of CIPs are carried at fair value.
As of December 31, 2021, Artisan held direct equity investments of $10.7 million in VIEs for which the Company does not hold a controlling financial interest. These direct equity investments consisted of seed investments in sub-funds of Artisan Global Funds and Artisan Private Funds, both of which are accounted for under the equity method of accounting because Artisan has significant influence over the funds.
Fair Value Measurements - Consolidated Investment Products
78
The following tables present the fair value hierarchy levels of assets and liabilities held by CIPs measured at fair value as of December 31, 2017. There2021 and 2020:
| Assets and Liabilities at Fair Value | ||||||||||||||
| Total | Level 1 | Level 2 | Level 3 | |||||||||||
| December 31, 2021 | ||||||||||||||
| Assets | ||||||||||||||
| Money market funds | $ | 7,908 | $ | 7,908 | $ | — | $ | — | ||||||
| Equity securities - long position | 33,583 | 31,838 | 1,745 | — | ||||||||||
| Fixed income instruments - long position | 161,177 | — | 156,240 | 4,937 | ||||||||||
| Derivative assets | 241 | — | 241 | — | ||||||||||
| Liabilities | ||||||||||||||
| Equity securities - short position | $ | 3,427 | $ | 3,427 | $ | — | $ | — | ||||||
| Fixed income instruments - short position | 15,570 | — | 15,570 | — | ||||||||||
| Derivative liabilities | 182 | 4 | 178 | — | ||||||||||
| December 31, 2020 | ||||||||||||||
| Assets | ||||||||||||||
| Money market funds | $ | 7,822 | $ | 7,822 | $ | — | $ | — | ||||||
| Equity securities - long position | 83,960 | 83,027 | 933 | — | ||||||||||
| Fixed income instruments - long position | 133,518 | — | 133,518 | — | ||||||||||
| Derivative assets | 12,902 | 12,902 | — | — | ||||||||||
| Liabilities | ||||||||||||||
| Fixed income instruments - short position | $ | 14,978 | $ | — | $ | 14,978 | $ | — | ||||||
| Derivative liabilities | 753 | 566 | 187 | — | ||||||||||
CIP balances included in the Company's consolidated statements of financial condition were no CIP assets or liabilities as of December 31, 2016.follows:
| As of December 31, 2021 | As of December 31, 2020 | ||||||||||||||||
| Net CIP assets included in the table above | $ | 183,730 | $ | 222,471 | |||||||||||||
| Net CIP assets not included in the table above | (10,769) | (69,763) | |||||||||||||||
| Total Net CIP assets | 172,961 | 152,708 | |||||||||||||||
| Less: redeemable noncontrolling interests | 111,035 | 93,753 | |||||||||||||||
| Artisan’s direct equity investment in CIPs | $ | 61,926 | $ | 58,955 | |||||||||||||