UNITED STATES SECURITIES AND EXCHANGE COMMISSION
WASHINGTON, D.C. 20549
FORM 10-K
(Mark One)
| | | | | |
| ☑ | |
þ | ANNUAL REPORT PURSUANT TO SECTION 13 OR 15(d) OF THE SECURITIES EXCHANGE ACT OF 1934 |
| For the fiscal year ended December 31, 20172023 |
¨☐ | TRANSITION REPORT PURSUANT TO SECTION 13 OR 15(d) OF THE SECURITIES EXCHANGE ACT OF 1934 |
| For the transition period from to |
Commission file number 001-34095
FIRST BUSINESS FINANCIAL SERVICES, INC.
(Exact name of registrant as specified in its charter)
| | | | | | | | |
| Wisconsin | | 39-1576570 |
| | |
Wisconsin | | 39-1576570 |
| (State or other jurisdiction of incorporation or organization) | | (I.R.S. Employer Identification No.) |
| |
| 401 Charmany Drive, Madison, WI | | 53719 |
| (Address of principal executive offices) | | (Zip Code) |
Registrant’s telephone number, including area code: (608) 238-8008
Securities registered pursuant to Section 12(b) of the Act:
| | | | | | | | |
| | |
| Title of each class | Trading Symbol(s) | Name of each exchange on which registered |
| Common Stock, $0.01 par value | FBIZ | The Nasdaq Stock Market LLC |
Common Share Purchase Rights | | The Nasdaq Stock Market LLC |
Securities registered pursuant to Section 12(g) of the Act
None
Indicate by check mark if the registrant is a well-known seasoned issuer, as defined in Rule 405 of the Securities Act. Yes ¨ No þ
Indicate by check mark if the registrant is not required to file reports pursuant to Section 13 or 15(d) of the Act. Yes ¨ No þ
Indicate by check mark whether the registrant (1) has filed all reports required to be filed by Section 13 or 15(d) of the Securities Exchange Act of 1934 during the preceding 12 months (or for such shorter period that the registrant was required to file such reports), and (2) has been subject to such filing requirements for the past 90 days. Yes þ No ¨
Indicate by check mark whether the registrant has submitted electronically and posted on its corporate website, if any, every Interactive Data File required to be submitted and posted pursuant to Rule 405 of Regulation S-T during the preceding 12 months (or for such shorter period that the registrant was required to submit and post such files.) Yes þ No ¨
Indicate by check mark if the disclosure of delinquent filers pursuant to Item 405 of Regulation S-K is not contained herein, and will not be contained, to the best of registrant’s knowledge, in definitive proxy or information statements incorporated by reference in Part III of this Form 10-K or any amendment to this Form 10-K. ¨
Indicate by check mark whether the registrant is a large accelerated filer, an accelerated filer, a non-accelerated filer, or a smaller reporting company, or an emerging growth company. See the definitions of “large accelerated filer,” “accelerated filer”, “smaller reporting company” and “emerging growth company” in Rule 12b-2 of the Exchange Act. (Check one):
| | | | | | | | | | | | | | | | | | | | | | | | | | | | | |
| | | | |
Large accelerated filero | ☐ | Accelerated filerþ | ☑ | Non-accelerated filero | ☐ | Smaller reporting companyo | ☑ | Emerging growth companyo |
| | (Do not check if a smaller reporting company) | | ☐ |
If an emerging growth company, indicate by check mark if the registrant has elected not to use the extended transition period for complying with any new or revised financial accounting standards provided pursuant to Section 13(a) of the Exchange Act. ¨
Indicate by check mark whether the registrant has filed a report on and attestation to its management’s assessment of the effectiveness of its internal control over financial reporting under Section 404(b) of the Sarbanes-Oxley Act (15 U.S.C. 7262(b)) by the registered public accounting firm that prepared or issued its audit report. þ
If securities are registered pursuant to Section 12(b) of the Act, indicate by check mark whether the financial statements of the registrant included in the filing reflect the correction of an error to previously issued financial statements. ☐
Indicate by check mark whether any of those error corrections are restatements that required a recovery analysis of incentive-based compensation received by any of the registrant’s executive officers during the relevant recovery period pursuant to §240.10D-1(b). ☐
Indicate by check mark whether the registrant is a shell company (as defined in Rule 12b-2 of the Act). Yes ¨☐ No þ☑
The aggregate market value of the common equity held by non-affiliates computed by reference to the closing price of such common equity, as of the last business day of the registrant’s most recently completed second fiscal quarter, was approximately $201.2 million.$245.2 million.
As of March 1, 2018, 8,764,845February 26, 2024, 8,306,543 shares of common stock were outstanding.
DOCUMENTS INCORPORATED BY REFERENCE
Part III – Portions of the Proxy Statement for the Annual Meeting of Shareholders to be held on May 22, 2018April 26, 2024 are incorporated by reference into Part III hereof.
Table of Contents
PART I.
Item 1. Business
BUSINESS
General
First Business Financial Services, Inc. (together with all of its subsidiaries, collectively referred to as the “Corporation,” “FBFS,” “we,” “us,” or “our”) is a registered bank holding company originally incorporated in 1986 under the laws of the State of Wisconsin and is engaged in the commercial banking business through its wholly-owned bank subsidiary, First Business Bank (“FBB”,(collectively with its subsidiaries “FBB” or the “Bank”), headquartered in Madison, Wisconsin. All of our operations are conducted through the BankFBB and certain subsidiaries of FBB.its wholly-owned subsidiary First Business Specialty Finance, LLC (“FBSF”). The Bank operates as a business bank, delivering a full line of commercial banking products and services tailored to meet the specific needs of small and medium-sized businesses, business owners, executives, professionals, and high net worth individuals. Our products and services are focused on business banking, focus doesprivate wealth, and bank consulting. Within business banking, we offer commercial real estate lending, commercial and industrial lending, asset-based lending, accounts receivable financing, equipment financing, floorplan financing, vendor financing, Small Business Administration (“SBA”) lending and servicing, treasury management solutions, and company retirement services. Our private wealth management services include trust and estate administration, financial planning, investment management, and private banking. Our bank consulting experts provide investment portfolio administrative services, and asset liability management services. We do not rely on an extensiveutilize a branch network to attract retail clients; therefore,clients. Our operating model is predicated on deep client relationships, financial expertise, and an efficient, centralized administration function delivering best in class client satisfaction. Our focused model allows experienced staff to supplementprovide the business banking deposit base, the Bank utilizes a wholesale funding strategylevel of financial expertise needed to fund a portion of its assets.develop and maintain long-term relationships with our clients. We conduct our businesscommercial banking operations through one operating segment.
In early 2017, the Corporation owned three separate bank charters: Alterra Bank (“Alterra”), Leawood, Kansas, First Business Bank-Milwaukee (“FBB-Milwaukee”), Brookfield, Wisconsin and First Business Bank (“FBB”), Madison, Wisconsin. Effective June 1, 2017, Alterra and FBB-Milwaukee were merged with and into FBB. The Corporation’s existing management structure remains unchanged, with the current roles and decision making authority retained by local banking leaders, as well as the heads of our trust and investment management and specialty finance businesses.
As of December 31, 2017,2023, on a consolidated basis, we had total assets of $1.794$3.508 billion,, total gross loans and leases of $1.502$2.850 billion, total deposits of $1.394$2.797 billion, and total stockholders’ equity of $169.3 million.$289.6 million.
Business Lines
Commercial LendingBanking Products and Services
We strive to meet the specific commercial lending needs of small- to medium-sized companies in our targetprimary markets in Wisconsin, Kansas, and Missouri, primarilypredominantly through lines of credit and term loans to businesses with annual sales of up to $75.0$150 million. Through FBB, we service the Madison, Milwaukee andSouth Central Wisconsin, Southeast Wisconsin, Northeast Wisconsin, metropolitan areas and surrounding areas. In 2014 we acquired Aslin Group, Inc. and its bank subsidiary, Alterra, to add an established business-focused team serving similar sized businesses in the greater Kansas City metropolitan area. Alterra, now known as First Business Bank-Kansas City RegionMetro, and other borrowers through products with national channels.
Commercial Real Estate Lending We originate loans secured by commercial real estate, including owner-occupied, non owner-occupied facilities, primarily market-rent multifamily developments, 1-4 family residential developments, and construction loans for these types of buildings. As of December 31, 2023, our commercial real estate portfolio (“FBB-KC”CRE”), was subsequently rebranded as a full-service banking location represented approximately 60% of FBB during the charter consolidation referenced above.our total gross loans and leases receivable.
Commercial and Industrial Lending Our commercial loans are typically secured by various types of business assets, including inventory, receivables, and equipment. We also originate loans secured by commercial real estate, including owner-occupied commercial facilities, multi-family housing, office buildings, retail centers, and, to a lesser extent, commercial real estate construction loans. In very limited cases, we may originate loans on an unsecured basis. As of December 31, 2017,2023, our commercial real estate and commercial loans, excluding asset-based lending and equipment financing,industrial portfolio (“C&I”) represented approximately 86%39% of our total gross loans and leases receivable. The C&I portfolio includes conventional commercial and industrial loans as well as asset-based lending, accounts receivable financing, equipment financing, floorplan financing, and SBA lending. These C&I lending niches are described below.
C&I Lending - Asset-Based FinancingLending
First Business Capital Corp. (“FBCC”), a wholly-owned subsidiary of FBB, providesWe provide asset-based lending to small- to medium-sized companies. With its sales officesOur asset-based lending team serves clients on a nationwide basis through business development officers located in several states, FBCC serves clients nationwide.
FBCCstates. We primarily providesprovide revolving lines of credit and term loans for financial and strategic acquisitions, (e.g., leveraged or management buyouts), capital expenditures, working capital to support rapid growth, bank debt refinancing, debt restructuring, and corporate turnaround strategies and debtor-in-possession financing in the course of bankruptcy proceedings or the exit therefrom.strategies. As a bank-owned, asset-based lender with strong underwriting standards, FBCCour team is positioned to provide cost-effective financing solutions to companies whowhich do not have the established, stable cash flows necessary to qualify for traditional commercial lending products. These financingsborrowing relationships generally range between $1.0$2 million and $10.0$18 million with terms of 24 to 60 months. Asset-based lending typically generates higher yields than traditional commercial lending. This line of business complements our traditional commercial loan portfolio and provides us with more diverse income opportunities. As of December 31, 2017, our2023, asset-based lending business line represented 9%approximately 8% of our total gross loans and leases receivable.
C&I Lending - Accounts Receivable Financing
First Business Factors (“FBF”), a division of FBCC, provides funding toOur Accounts Receivable Financing team, with business development officers located in several states, serves clients nationwide by purchasing accounts receivable primarily on a full recourse basis. FBFThis offering provides competitive ratesworking capital to clients seekingsupport client growth and needingother client cash flow support, or who are experiencing financial issues. Factoringneeds. Accounts receivable financing typically generates higher yields than traditional commercial lending and complements our traditional commercial portfolio. FBF is headquartered in Chicago, Illinois and, with its sales offices located in several states, is able to serve clients nationwide. As of December 31, 2017, our factored2023, accounts receivable financing business line represented less than 1%approximately 3% of our total gross loans and leases receivable.
C&I Lending - Equipment Financing
First Business Equipment Finance, LLC (“FBEF”), a wholly-owned subsidiary of FBB, deliversThe Bank finances a broad range of equipment, finance products, includingthrough loans and leases, to address the financing needs of commercial clients in a variety of industries. FBEF’s focus includesOur Equipment Finance team, with business development officers located in several states, provides financing solutions for manufacturing equipment, industrial assets, construction and transportation equipment, agriculture equipment, medical equipment, and a wide variety of other commercial equipment. These financings generally range between $250,000$25,000 and $5.0$1 million with terms of 36 to 84 months.
Our Equipment Finance team seeks to position itself as the preferred point of sale financing choice utilized by equipment vendors and their purchasing customers. Our online application and proprietary credit scoring architecture enable us to provide small ticket vendor equipment financings through a nationwide distribution channel. These equipment vendors specialize primarily in healthcare, manufacturing, technology equipment, agriculture, construction, and specialty vehicles. Small ticket vendor equipment financing typically generates higher yields than traditional commercial lending. As of December 31, 2017, our2023, equipment financing business linerepresented approximately 10% of our total gross loans and leases receivable.
C&I Lending - Floorplan Financing
We offer floorplan financing for independent car dealerships nationwide. These floorplan programs generally range from $500,000 to $10 million for larger, well-established independent car dealers. Floorplan financing typically generates higher yields than traditional commercial lending. As of December 31, 2023, floorplan financing represented approximately 3% of our total gross loans and leases receivable.
Small Business Administration (“SBA”)C&I Lending - SBA Lending and Servicing
The SBA guarantees loans originated by lenders to small business borrowers who meet its program eligibility and underwriting guidelines. Specific program guidelines vary based on the SBA loan program; however, all loans must be underwritten, originated, monitored and serviced according to the SBA’s Standard Operating Procedures in order to maintain the guaranty under the SBA program. Generally, the SBA provides a guaranty to the lender ranging from 50% to 90% of principal and interest as an inducement to the lender to originate the loan.
The majority of our SBA loans are originated usingmade through programs designed by the 7(a) term loan program. This program typically provides a guaranty of 75% of principal and interest. Infederal government to assist the event of default on the loan, the bank may request that the SBA purchase the guaranteed portion of the loan for an amount equal to outstanding principal plus accrued interest permissible under SBA guidelines. In addition, the SBA will share on a pro-rata basissmall business community in the costs of collection, subject to SBA rules and limits, as well as the proceeds of liquidation.
obtaining financing. We are an activeapproved participant in the SBA’s Preferred Lender Program (“PLP”). The PLP is part of the SBA's effort to streamline the procedures necessary to provide financial assistance to the small business community. Under this program, the SBA delegates the final credit decision, and most servicing, and liquidation authority and responsibility to selected PLP lenders. We leverage this expertiseprogram authority and capacity to package, underwrite, process, service, and liquidate, if necessary, SBA loans throughoutnationwide.
Our SBA loans fall into three categories: loans originated under the Corporation’s locations.SBA’s 7(a) term loan program; loans originated under the SBA’s 504 program; and SBA Express loans and lines of credit. Specific program guidelines vary based on the SBA loan program; however, all loans must be underwritten, originated, monitored, and serviced according to the SBA’s Standard Operating Procedures in order to maintain the guaranty, if any, under the SBA program. Except for loans originated under the SBA’s 504 program, the SBA generally provides a guaranty to the lender ranging from 50% to 90% of loan the balance as an inducement to the lender to originate the loan.
The majority of our SBA loans are originated using the 7(a) term loan program. This program typically provides a guaranty of 75% of loan the balance. In the event of default on the loan, the lender may request that the SBA purchase the guaranteed portion of the loan for an amount equal to outstanding principal plus accrued interest permissible under SBA guidelines. In addition, the SBA will share on a pro-rata basis in certain costs of collection, subject to SBA rules and limits, as well as the proceeds of liquidation.
SBA lending is designed to generate new business opportunities for the Bank by meeting the needs of clients that cannot be met with conventional bank loans. We earn interest income from the loan,these loans, generally at variable rates higher than those of our traditional commercial loans. We have a variable rate, and by gathering deposits from and providing other services to these clients. In addition, our SBA strategy generates non-interesthistory of recognizing gains on the sale of the guaranteed portion of the loans. We also regularly earn treasury management fee income from two primary sources. First, we typically sell the guaranteed portions of the SBA loans to aggregators who securitize the assets for sale in the secondary marketborrower and receive a premium on each loan sold, resulting in the recognition of a gain in the period of sale. Second, we receive servicing income from the holderowner of the securitized asset oversold portion of these loans. As of December 31, 2023, the lifeon-balance sheet portion of the loan.SBA loans represented approximately 2% of our total gross loans and leases receivable.
Treasury Management Services
The BankFBB provides comprehensive treasury management services for commercial banking and specialized lending clients to manage their cash and liquidity, including lockbox,a variety of deposit accounts, accounts receivable collection services, electronic
payment solutions, cash vault services, fraud detection and protection, information reporting, reconciliation, and data integration solutions, and account balance optimization solutions. For our clients involved in international trade, the Bank offers international payment services, foreign exchange, and trade letters of credit. The Bank also offers a variety of deposit accounts and balance optimization solutions. As we strive to diversify our income and increase our non-interest income, we have focused on increasing sales of these services and have emphasized these offerings with new and existing business clients.
Trust and InvestmentCompany Retirement Plan Services
FBB through its First Business Trust & Investments (“FBTI”) division, acts as fiduciary and investment manager for individualcorporate clients, creating and corporateexecuting asset allocation strategies tailored to each corporation’s unique situation. FBB also acts as a discretionary trustee and investment fiduciary, sharing responsibility for monitoring assets to match the client’s specifications. Offering only non-proprietary funds removes conflict of interest while designing cost-effective company retirement plans which provide a competitive return. As of December 31, 2023, FBB had $395.9 million of company retirement plan assets under management and administration.
Private Wealth Management
FBB acts as fiduciary and investment manager for individual clients, creating and executing asset allocation strategies tailored to each client’s unique situation. FBTIFBB has full fiduciary powers and offers trust and estate administration, financial planning, and investment services,management, acting in a trustee or agent capacity as well as Employee Benefit/Retirement Plan services. FBTIcapacity. FBB also provides access to brokerage and custody-only services, for which it administers and safeguards assets, but does not provide investment advice. At assets. As of December 31, 2017, FBTI2023, FBB had $1.536$2.726 billion of private wealth assets under management and administration.
The Bank also offers private banking to its Private Wealth Management clients. As of December 31, 2023, private wealth loans represented approximately 2% of total gross loans and leases receivable.
Bank Consulting Services
FBB provides outsourced treasury services to assist banks and other financial institutions with balance sheet management. These services include investment portfolio management and administrative services, and asset liability management services.
Competition
The BankFBB encounters strong competition across all of our lines of business.commercial banking products and services. Such competition includes banks, savings institutions, mortgage banking companies, credit unions, finance companies, equipment finance companies, mutual funds, insurance companies, brokerage firms, investment banking firms, and FinTech companies. The Bank also competes with regional and national financial institutions, many of which have greater liquidity, higher lending limits, greater access to capital, more established market recognition, and more resources than the Bank. We believe the experience, expertise, and responsiveness of our banking professionals, andas well as our focus on fostering long-lasting relationships, sets us apart from our competitors.
WeHuman Capital Management
The Corporation believes achieving strong financial results begins with its employees. In 2023, the workforce grew to 349 employees. While the majority of employees are not dependent uponlocated in the primary banking markets, the Corporation has employees working onsite, hybrid, and remote in over 20 states.
This geographic expansion allows the Corporation to continue to diversify the workforce, compete in an increasingly challenging talent landscape, and add producers and specialists as business lines and needs grow.
The Corporation’s culture is critical to success and is rooted in a single orset of founding beliefs and guided by a few clients,core cultural competency framework. The clarity of the lossCorporation’s core values creates a special and committed team atmosphere, which increases productivity, reduces turnover, attracts motivated employees, and cultivates a culture of which wouldbelonging. The Corporation is in a people-differentiated business and attracting and retaining the best talent possible is critical to our success and financial performance. The strength of our culture and core values was demonstrated as follows throughout 2023:
a.The Corporation was named to the national list of Top Workplaces USA for the second year in a row and to the regional list of Wisconsin State Journal Top Workplaces for the South Central Wisconsin area and Milwaukee Journal Sentinel for the Milwaukee/Southeast Wisconsin area.
b.As part of the Top Workplaces Survey, the Corporation was also awarded the Top Workplaces Culture Excellence recognition across nine categories for a second year.
c.The Corporation achieved an Employee Engagement rating of 90% with an 88% participation rate – both well above the finance and insurance industry norm of 78% and 80%, respectively.
d.Employee Turnover was 9.33% – well below the employee turnover average of 17.7% in the banking industry, as reported in a survey conducted by Aon in 2023.
e.The Career Path Ratio for employees was 14%, above our 10% goal, indicating the prioritization of internal transfers and promotions throughout the organization to fill open positions, recognize strong employee performance and career progression.
f.Managerial Effectiveness, as measured in the engagement survey, was 86%, well above our goal of 80%. Managers and employees meet regularly to set and track progress on goals, have a material adverse effect1:1 conversations, complete check-ins focused on us.professional development, and track activity related to overall performance management.
g.A Culture Check-In was conducted with all employees to encourage open discussion and feedback between managers and employees. 100% of employees participated in the check-in.
Employeesh.A Rising Professionals Development Series was launched providing employee opportunities to grow, connect, and share ideas with peers and leadership within the organization.
i.A Leadership Challenge group was created comprised of emerging leaders and key employees from across the organization. The goal was to provide these emerging leaders with development opportunities and exposure to the strategic planning process to better prepare them to lead future planning cycles.
At December 31, 2017, we had 264 employees equatingj.The Corporation provided ongoing diversity, equity, and inclusion education opportunities to all employees. In addition, workplace culture interviews were held with approximately 251 full-time equivalent employees. None60% of our employees who identify as racially/ethnically diverse. The continued emphasis on an inclusive culture resulted in a Belonging rating of 90%, well above the 83% benchmark, in the 2023 employee engagement survey.
k.The Corporation is representedcommitted to paying an attractive, equitable, and competitive wage based on market rates for the employees' roles, experience, and performance. To ensure pay is competitive, the Corporation regularly benchmarks against other companies both within and outside the banking industry.
l.The Corporation is committed to supporting employees’ and their families’ well-being by offering a union or subjectcomprehensive total rewards package. The Corporation prioritizes supporting an employee’s physical, emotional, and financial wellness.
From the Corporation’s inception, the commitment to and investment in our employees and the communities we serve has been the foundation of the Corporation’s long-term success for the benefit of our shareholders. The Corporation’s commitment is best expressed in the words of our Belief Statement: At First Business Bank, we believe visionary, determined entrepreneurs and investors create a collective bargaining agreement.thriving economy and, in turn, social and economic advancement for their employees, investors, families, and communities. Built by driven entrepreneurs, First Business Bank has the experience to create both wealth, and a wealth of good in the world.
Subsidiaries
First Business Bank
FBB is a state bank chartered in 1909 in Wisconsin under the name Kingston State Bank. In 1990, FBB relocated its home office to Madison, Wisconsin, and began focusing on providing high-quality banking services to small- to medium-sized businesses located in Madison and the surrounding area. FBB’s business linescommercial banking products and services include commercial loans, commercial real estate loans, asset-based loans, accounts receivable financing, SBA lending and servicing, floorplan financing, equipment loans and leases, commercial deposit accounts, company retirement solutions, and treasury management services. FBB offers a variety of deposit accounts and personal loans to business owners, executives, professionals, and high net worth individuals. FBB also offers trustprivate wealth management services and investment services through FBTI, a division of FBB.bank consulting services. FBB has twofour full-service banking locations in Madison, Brookfield, and Appleton, Wisconsin, and Leawood, Kansas, as well as four loan production offices located in Appleton, Oshkosh, Manitowoc and Kenosha, Wisconsin.Kansas.
FBB has eight wholly-owned subsidiaries:
FBCC is an asset-based lending company specializing in providing lines of credit, factored receivable financing and term loans secured by accounts receivable, inventory, equipment and real estate assets, primarily to manufacturers and wholesale distribution companies located throughout the country, with a concentration in the Midwest. FBCC was established in 1995 and has sales offices in several states.
FBEF is a commercial equipment finance company offering a full array of finance and leasing options to commercial clients of which the largest percentage are currently located in Wisconsin. It offers new and replacement equipment loans and leases, debt restructuring, consolidation and sale-lease-back transactions through its primary banking locations in Wisconsin. FBEF was established in 1998.
Rimrock Road Investment Fund, LLC (“Rimrock”), established in 2009 and formerly known as FBB Real Estate, LLC, is a limited liability company originally established for the purpose of holding and liquidating real estate and other assets acquired by FBB through foreclosure or other legal proceedings. In 2014, Rimrock’s purpose was changed to reflect its qualified equity investment in a Madison, Wisconsin community development project, including the financing and ownership of a property that generates federal new market tax credits.
BOC Investment, LLC (“BOC”), is a limited liability company established for the purpose of capturing federal historic tax credits to reduce the cost of borrowing for a FBB client engaged in rehabilitating a historic building in Madison, Wisconsin. BOC was established in 2015.
Mitchell Street Apartments Investment, LLC (“Mitchell”), is a limited liability company established for the purpose of capturing federal and state historic tax credits to reduce the cost of borrowing for a FBB client engaged in rehabilitating a historic building in Milwaukee, Wisconsin. Mitchell was established in 2016.
ABKC Real Estate, LLC (“ABKCRE”), is a limited liability company established for the purpose of holding and liquidating real estate and other assets acquired by FBB through foreclosure or other legal proceedings. ABKCRE was established in 2017.
FBB Tax Credit Investment, LLC (“FBB Tax Credit”), established in 2012 and formerly known as FBB-Milwaukee Real Estate, LLC (“FBBMRE”), is a limited liability company originally established for the purpose of holding and liquidating real estate and other assets acquired by FBB through foreclosure or other legal proceedings. In 2017, FBB Tax Credit’s purpose was changed to facilitate investments in federal and state tax credits.
First Madison Investment Corp. (“FMIC”) is located in and formed under the laws of the State of Nevada, and was organized for the purpose of managing a portion of FBB’s investment portfolio. FMIC was established in 1993.
As of December 31, 2017,2023, FBB had six wholly-owned subsidiaries and total gross loans and leases receivable of $1.503$2.850 billion, total deposits of $1.396$2.799 billion, and total stockholders’ equity of $196.5$339.9 million.
FBFS Statutory Trust II
In September 2008, we formed FBFS Statutory Trust II (“Trust II”), a Delaware business trust wholly-owned by FBFS. In 2008, Trust II completed the sale of $10.0 million of 10.5% fixed rate trust preferred securities. Trust II also issued common securities in the amount of $315,000 to us. Trust II used the proceeds from the offering to purchase $10.3 million of 10.5% junior subordinated notes issued by us. FBFS has the right to redeem the junior subordinated notes at each interest payment date on or after September 26, 2013. The preferred securities are mandatorily redeemable upon the maturity of the junior subordinated notes on September 26, 2038. FBFS’s ownership interest in Trust II has not been consolidated into the financial statements.
Corporate Information
Our principal executive offices are located at 401 Charmany Drive, Madison, Wisconsin 53719 and our telephone number is (608) 238-8008. The contents of our website are not incorporated by reference into this Form 10-K. We maintain an Internet website at www.firstbusiness.com.www.firstbusiness.bank. This Form 10-K and all of our other filings under the Securities Exchange Act of 1934, as amended (the “Exchange Act”), are available free of charge through that website, free of charge, including copies of our proxy statement, annual reports on Form 10-K, quarterly reports on Form 10-Q, current reports on Form 8-K, and any amendments to those reports, on the date thatas soon as reasonably practicable after we electronically file those materials with, or furnish them to, the Securities and Exchange Commission (“SEC”). The contents
Markets
Although certain of our business linescommercial banking products and services are marketed throughout the Midwest and beyond, our primary markets lie in Wisconsin, Kansas, and Missouri. Specifically, our three target markets in Wisconsin consist of MadisonSouth Central Wisconsin, Southeast Wisconsin, and Milwaukee, and their surrounding communities, and NortheasternNortheast Wisconsin. We serve these markets primarily through our target marketsoffices in Madison, Brookfield, and Appleton, respectively. We serve the greater Kansas and MissouriCity Metro through our Leawood, Kansas office, which is located in the Kansas City metropolitan statistical area. Each of our primary markets provides a unique set of economic and demographic characteristics which provide us with a variety of strategic opportunities. A brief description of each of our primary markets is as follows:
MadisonSouth Central Wisconsin
As the capital of Wisconsin and home of the University of Wisconsin -Wisconsin-Madison, the greater Madison our Madison market,area, specifically Dane County and surrounding counties, offers an appealing economic environment populated by a highly educated workforce. While the economy of the Madison marketSouth Central Wisconsin is driven in large part by the government and education sectors, there is also a diverse array of industries outside of these segments, including significant concentration of insurance companies and agricultural-related industries. Madisonsegments. South Central Wisconsin is also home to a concentration oftechnology and research and development related companies, which benefit from the area’s strong governmental and academic ties, as well as several major health care systems/systems and hospitals, which provides healthcare services to South Central Wisconsin.
MilwaukeeSoutheast Wisconsin
OurThe Milwaukee market, the primary commercial and industrial hub for Southeastern Wisconsin, providesmetropolitan area has a diverse economic base with both a highly skilled labor force and significantstrong manufacturing base.sector. The most prominent economic sectors in the Milwaukee market include manufacturing, financial services, health care, diversified service companies, and education. MilwaukeeThe area is home to several major hospitals, providing health services to the greater SoutheasternSoutheast Wisconsin
market, several large academic institutions including the University of Wisconsin-Milwaukee and Marquette University, and a wide variety of small- to medium-sized firms with representatives in nearly every industrial classification.
NortheasternNortheast Wisconsin
The cities of Appleton, Green Bay, Oshkosh and Manitowoc,Oshkosh, Wisconsin serve as the primary population centers in our Northeast Wisconsin market and provide an attractive market to a variety of industries, including transportation, utilities, packaging, and diversified services, with the most significant economic drivers being the manufacturing, packaging, and paper goods industries.
Kansas City
Metro
Geographically located in the center of the U.S., the greater Kansas City areaMetro includes 1815 counties and more than 50 communities in Missouri and Kansas, including a central business district located in Kansas City, Missouri and communities on both sides of the state line. The area is known for the diversity of its economic base, with major employers in manufacturing and distribution, architecture and engineering, technology, telecommunications, financial services, and bioscience, as well as local government and higher education.federal government.
EXECUTIVE OFFICERS OF THE REGISTRANT
The following contains certain information about the executive officers of FBFS. There are no family relationships between any directors or executive officers of FBFS.
Corey A. Chambas, age 5561, has served as a director of FBFS since July 2002, as Chief Executive Officer since December 2006 and as President sincefrom February 2005.2005 until January 2023. He served as Chief Operating Officer of FBFS from February 2005 to September 2006 and as Executive Vice President from July 2002 to February 2005. He served as Chief Executive Officer of FBB from July 1999 to September 2006 and as President of FBB from July 1999 to February 2005. He also currently serves as a director of our subsidiary FMIC. Mr. Chambas has over 3035 years of commercial banking experience. Prior to joining FBFS in 1993, he was a Vice President of Commercial Lending with M&I Bank, now known as BMO Harris Bank, N.A. , in Madison, Wisconsin.
Edward G. Sloane, Jr.,Brian D. Spielmann, age 57, 41,has served as Chief Financial Officer of FBFS since January 2016.April 2023. Mr. SloaneSpielmann also serves as the Chief Financial Officer of the Bank. Mr. Sloane has over 30 years of financial services experience including mergers and acquisitions, strategic planning and financial reporting and analysis. Prior to joining FBFS, Mr. Sloane was Executive Vice President, Chief Financial Officer and Treasurer with Peoples Bancorp, Inc. in Marietta, Ohio from 2008 to 2015. He also served as Senior Vice President of Strategic Planning & Analysis for WesBanco, Inc. in Wheeling, West Virginia from 2006 to 2008, as Senior Vice President and Controller from 1998 to 2006 and in various other capacities from 1989 to 1998.
Michael J. Losenegger, age 60, has served as Chief Credit Officer of FBFS since May 2011. Mr. Losenegger also serves as the Chief Credit Officer of the Bank. He also currently serves as a director forof our subsidiaries FBCCFBSF subsidiary. Mr. Spielmann had been serving as the Corporation’s Deputy Chief Financial Officer and FBEF. Prior to being appointed Chief Credit Officer, Mr. Losenegger served as FBFS’s Chief OperatingAccounting Officer since September 2006.May 2022. Mr. Losenegger
Spielmann joined FBFS in 20032006 and has held various positions with FBB, including Chief ExecutiveAccounting Officer, Chief Operating OfficerDirector of Finance, Financial Reporting Manager, and Senior Vice President of Business Development. Mr. Losenegger has over 30 years of experience in commercial lending. Prior to joining FBFS, Mr. Losenegger was Senior Vice President of Lending at M&I Bank, now known as BMO Harris Bank, in Madison, Wisconsin.Financial Accountant.
Barbara M. Conley, David R. Seiler, age 6459, has served as FBFS’s General Counsel since June 2008. Ms. Conley also serves as General Counsel of the Bank. She has over 35 years of experience in commercial banking. Immediately prior to joining FBFS in 2007, Ms. Conley was a Senior Vice President in Corporate Banking with Associated Bank. She had been employed at Associated Bank since May 1976.
Jodi A. Chandler, age 53, has served as Chief Human ResourcesOperating Officer of FBFS since April 2016 and as President of FBFS since January 2010.2023. He also currently serves as a director for our subsidiary FBSF. Mr. Seiler has over 25 years of financial services experience including his previous position as Managing Director (formerly Senior Vice President/Manager) of the Correspondent Banking Division with BMO Bank, N.A. in Milwaukee, Wisconsin which he held from 2007 to 2016. Prior to that, shehe held the position of Senior Vice President-Human Resources for several years. She has been an employee of FBFS for over 25 years.President/Team Leader, Correspondent Real Estate Division from 2005 to 2007 and Vice President, Relationship Manager, Commercial Real Estate from 2002 to 2005.
Mark J. Meloy, age 56,62, has served as Chief Executive OfficerVice President of FBBFBFS since December 2007.January 2023. Mr. Meloy joined FBFS in 2000 and has held various positions including Chief Executive Officer of FBB, Executive Vice President of FBB, and President and Chief Executive Officer of
FBB-Milwaukee. He currently serves as CEO of FBEF. He also currently serves as a director of our subsidiaries FBB, FBCC and FBEF.FBSF subsidiary. Mr. Meloy has over 2535 years of commercial lending experience. Prior to joining FBFS, Mr. Meloy was a Vice President and Senior Relationship Manager with Firstar Bank, NA, in Cedar Rapids, Iowa and Milwaukee, Wisconsin, now known as U.S. Bank, working in their financial institutions group with mergers and acquisition financing.
JoanBradley A. Burke, Quade, age 66,58, has served as Chief Credit Officer of FBFS since April 2020. Mr. Quade had been serving as the Corporation’s Deputy Chief Credit Officer since October 2019. He also currently serves as a director for our subsidiary FBSF. Mr. Quade has over 35 years of experience in banking at publicly traded and privately-owned institutions and has led successful lending teams in commercial banking, investment real estate, equipment leasing, and treasury management. Prior to joining FBFS, Mr. Quade held the position of Senior Vice President with Johnson Bank in Milwaukee, Wisconsin.
Jodi A. Chandler, age 59, has served as Chief Human Resources Officer of FBTIFBFS since September 2001.January 2010. Prior to that, she held the position of Senior Vice President-Human Resources for several years. She has been an employee of FBFS for over 30 years.
Laura M. Garcia, age 51, has served as Chief Risk Officer for FBFS since March 2022. Prior to joining FBFS, she held the position of Head of North American Risk and Compliance, Managing Director for BMO Bank, N.A. in Chicago, Illinois, from 2018 to 2022. Ms. BurkeGarcia has over 30 years of experience in providing trustthe financial services investment management, mutual fund managementindustry, centered in commercial banking, credit, compliance, and brokerage services. Prior to joining FBFS, Ms. Burke was the President, Chief Executive Officer and Chairperson of the Board of Johnson Trust Company and certain of its affiliates.risk management.
Charles H. Batson, James E. Hartlieb, age 64,53, has served as the President of FBB since 2015 and as Chief Executive Officer of FBCCFBB and a director of FBB since January 2006.2023. Mr. Hartlieb joined FBB in 2009 as Senior Vice President of Greater Dane County. He also currently serves as a director for FBCC.of our FBSF subsidiary. Mr. BatsonHartlieb has over 3025 years of experience in asset-based lending.financial services experience. Prior to joining FBCC,FBB, Mr. Batson served as ViceHartlieb held the position of Regional President and Business Development Manager for Wells Fargo Business Credit, Inc. since 1990.with AMCORE Bank in Madison, Wisconsin, which he held from 1998 to 2009.
Daniel S. Ovokaitys, age 4450, has served as Chief Information Officer since June 2014. Prior to joining FBFS, Mr. Ovokaitys held the position of Head of Corporate IT (North/South America) for Merz Pharmaceuticals, located in Frankfurt, Germany, from 2010 to 2014. He also served as Director of IT for Aurora Health Care from 2006 to 2010 and Manager of IT for the American Transmission Company from 2000 to 2006.
David R. Seiler, age 53, has served as Chief Operating Officer of FBFS since April 2016. He also currently serves as a director for our subsidiary FBCC. Mr. Seiler has over 25 years of financial services experience including his previous position as Managing Director (formerly Senior Vice President/Manager) of the Correspondent Banking Division with BMO Harris Bank, N.A. in Milwaukee, Wisconsin which he held from 2007 to 2016. Prior to that, he held the position of Senior Vice President/Team Leader, Correspondent Real Estate Division from 2005 to 2007 and Vice President, Relationship Manager, Commercial Real Estate from 2002 to 2005.
SUPERVISION AND REGULATION
Below is a brief description of certain laws and regulations that relate to us and the Bank. This narrative does not purport to be complete and is qualified in its entirety by reference to applicable laws and regulations.
General
Institutions insured by the Federal Deposit Insurance Corporation (“FDIC”),-insured institutions, like the Bank, their holding companies, and their affiliates are extensively regulated under federal and state law. As a result, the Corporation’sour growth and earnings performance may be affected not only by management decisions and general economic conditions, but also by the requirements of federal and state statutes and by the regulations and policies of various bank regulatory agencies, including our primary regulators, the Board of Governors of the Federal Reserve System (“Federal Reserve”), the Bank’s state regulator, the Wisconsin Department of Financial Institutions (“WDFI”), and its primary federal regulator, the Federal Reserve, the FDIC and the Consumer Financial Protection Bureau (“CFPB”).FDIC. Furthermore, taxation laws administered by the Internal Revenue Service (“IRS”) and state taxing authorities, accounting rules developed by the Financial Accounting Standards Board (“FASB”), securities laws administered by the SEC and state securities authorities, and anti-money laundering
laws enforced by the U.S. Department of the Treasury (“Treasury”) have an impact the Corporation’son our business. The effect of these statutes, regulations, regulatory policies, and accounting rules are significant to the Corporation’sour operations and results.
Federal and state banking laws impose a comprehensive system of supervision, regulation, and enforcement on the operations of FDIC-insured institutions, their holding companies, and affiliates that is intended primarily for the protection of the FDIC-insured deposits and depositors of banks, rather than shareholders. These laws, and the regulations of the bank regulatory agencies issued under them, affect, among other things, the scope of the Corporation’sour business, the kinds and amounts of investments wethe Corporation and the Bank may make, limits on the Bank’s loans to any one borrower, reserve requirements, required capital levels relative to the Corporation’s assets, the nature and amount of collateral for loans, the establishment of branches, the ability to merge, consolidate and acquire, dealings with the Corporation’s and the Bank’s insiders and affiliates, and the Corporation’s payment of dividends. In reaction to the global financial crisis beginning in 2008 (the “global financial crisis”), and particularly following the passage of the Dodd-Frank Wall Street Reform and Consumer Protection Act of 2010 (the “Dodd-Frank(“Dodd-Frank Act”), we experienced heightened regulatory requirements and scrutiny. Although the reforms primarily targeted systemically important financial service providers, their influence filtered down in varying degrees to community banks over time and caused the Corporation’sour compliance and risk management processes, and the costs thereof, to increase. After the 2016 federal elections, momentum to decrease the regulatory burden on community banks gathered strength. AlthoughIn May 2018, the Economic Growth, Regulatory Relief and Consumer Protection Act (the “Regulatory Relief Act”) was enacted to modify or remove certain financial reform rules and regulations. While the Regulatory Relief Act maintains most of the regulatory structure established by the Dodd-Frank Act, it amends certain aspects of the regulatory framework for small depository institutions with assets of less than $10 billion, like us, and for large banks with assets of more than $50 billion that were considered systemically important under the Dodd-Frank Act solely because of size. Many of these deregulatory trends continuechanges were intended to receive muchresult in meaningful regulatory relief for community banks and their holding companies, including new rules that may make the capital requirements less complex. For a discussion amongof capital requirements, see The Role of Capital below. The Regulatory Relief Act also eliminated questions about the banking industry, lawmakersapplicability of certain Dodd-Frank Act reforms to community bank systems, including relieving the Bank of any requirement to engage in mandatory stress tests, name a risk committee, or comply with the Volcker Rule’s complicated prohibitions on proprietary trading and the bank regulatory agencies, little substantive progress has yet been made.ownership of private funds. The true impact of proposedCorporation believes these reforms remains difficultare generally favorable to predict with any certainty.
its operations.
The supervisory framework for U.S. banking organizations subjects banks and bank holding companies to regular examination by their respective regulatory agencies, which results in examination reports and ratings that are not publicly available and that can impact the conduct and growth of their business. These examinations consider not only compliance with applicable laws and regulations, but also capital levels, asset quality and risk, management ability and performance, earnings, liquidity, information technology, and various other factors. The regulatory agencies generally have broad discretion to impose restrictions and limitations on the operations of a regulated entity where the agencies determine, among other things, that such operations are unsafe or unsound, fail to comply with applicable law, or are otherwise inconsistent with laws and regulations or with the supervisory policies of these agencies.regulations.
The following is a summary of the material elements of the supervisory and regulatory framework applicable to us,the Corporation and the Bank, beginning with a discussion of the continuing regulatory emphasis on the Corporation’sour capital levels. It does not describe all of the statutes, regulations, and regulatory policies that apply, nor does it restate all of the requirements of those that are described. The descriptions are qualified in their entirety by reference to the particular statutory and regulatory provision.
Regulatory Emphasis onThe Role of Capital
Regulatory capital represents the net assets of a banking organization available to absorb losses. Because of the risks attendant to their business, FDIC-insured institutions are generally required to hold more capital than other businesses, which directly affects the Corporation’sour earnings capabilities. While capital has historically been one of the key measures of the financial health of both bank holding companies and banks, its role became fundamentally more important in the wake of the global financial crisis, as the banking regulators recognized that the amount and quality of capital held by banks prior to the crisis was insufficient to absorb losses during periods of severe stress. Certain provisions of the Dodd-Frank Act and Basel III, discussed below, establish strengthened capital standards for banks and bank holding companies require more capital to be held in the form of common stock and disallow certain funds from being included in capital determinations. These standards represent regulatory capital requirements that are meaningfully more stringent than those in place previously.
Minimum Required Capital Levels. Banks have been required to hold minimum levels of capital based on guidelines established by the bank regulatory agencies since 1983. The minimums have been expressed in terms of ratios of capital“capital” divided by total“total assets.” As discussed below, bank capital measures have become more sophisticated over the years and have focused more on the quality of capital and the risk of assets. Bank holding companies have historically had to comply with less stringent capital standards than their bank subsidiaries and have been able to raise capital with hybrid instruments such as trust preferred securities. The Dodd-Frank Act mandated the Federal Reserve to establish minimum capital levels for holding companies on a consolidated basis as stringent as those required for FDIC-insured institutions. A result of this change is that the proceeds of hybrid instruments, such as trust preferred securities, are beingwere excluded from capital over a phase-out period. However,
if such securities were issued prior to May 19, 2010 by bank holding companies with less than $15 billion of assets, they may be retained, subject to certain restrictions. Because we have assets of less than $15 billion, we are able to maintain the Corporation’s trust preferred proceeds as capital but we have to comply with new capital mandates in other respects and will not be able to raise capital in the future through the issuance of trust preferred securities.
The Basel III Rule. On September 12, 2010, the Group of Governors and Heads of Supervision, the oversight body of the Basel Committee on Banking Supervision, announced agreement on a strengthened set of capital requirements for banking organizations around the world, known as “Basel III”, to address deficiencies recognized in connection with the global financial crisis. In July 2013, the U.S. federal banking agencies approved the implementation of the Basel III regulatory capital reforms in pertinent part, and, at the same time, promulgated rules effecting certain changes required by the Dodd-Frank Act (the “Basel III Rule”). In contrast to capital requirements historically, which were in the form of guidelines, Basel III was released in the form of enforceable regulations by each of the regulatory agencies. The Basel III Rule is applicable to all banking organizations that are subject to minimum capital requirements, including federal and state banks and savings and loan associations, as well as to bank and savings and loan holding companies, other than “small bank holding companies” (generallywho are relieved from compliance with the Basel III Rule. Historically we have been disqualified from taking advantage of the relief since we have securities registered with the SEC. Moreover, our asset size now exceeds the small bank holding companies with consolidated assetscompany threshold. Banking organizations became subject to the Basel III Rule on January 1, 2015, and its requirements were fully phased-in as of less than $1 billion).January 1, 2019.
The Basel III Rule required higher capital levels, increased the required quantity and quality of capital and, required more detailed categories of risk weighting of riskier, more opaque assets. Forfor nearly every class of assets, the Basel III Ruleit requires a more complex, detailed and calibrated assessment of credit risk and calculation of risk weightings.risk-weight amounts.
Not only did the Basel III Rule increase most of the required minimum capital ratios in effect prior to January 1, 2015, but it introduced the concept of Common Equity Tier 1 Capital, which consists primarily of common stock, related surplus (net of Treasurytreasury stock), retained earnings, and Common Equity Tier 1 minority interests subject to certain regulatory adjustments. The Basel III Rule also changed the definition of capital by establishing more stringent criteria that instruments must meet to be considered Additional Tier 1 Capital (primarily non-cumulative perpetual preferred stock that meets certain requirements) and Tier 2 Capital (primarily other types of preferred stock and subordinated debt, subject to limitations). A number of instruments that historically qualified as Tier 1 Capital under Basel I do not qualify, or their qualifications will change.changed. For example, noncumulative perpetual preferred stock, which qualified as simple Tier 1 Capital, under Basel I, does not qualify as Common Equity Tier 1
Capital, but qualifies as Additional Tier 1 Capital. The Basel III Rule also constrained the inclusion of minority interests, mortgage-servicing assets, and deferred tax assets in capital and requires deductions from Common Equity Tier 1 Capital in the event that such assets exceed a certain percentage of a banking institution’s Common Equity Tier 1 Capital.
The Basel III Rule required minimum capital ratios beginning as of January 1, 2015, as follows:
•A ratio of minimum Common Equity Tier 1 Capital equal to 4.5% of risk-weighted assets;
•An increase in the minimum required amount of Tier 1 Capital from 4% to 6% of risk-weighted assets;
•A continuation of the minimum required amount of Total Capital (Tier 1 plus Tier 2) at 8% of risk-weighted assets; and
•A minimum leverage ratio of Tier 1 Capital to total quarterly average assets equal to 4% in all circumstances.
In addition, institutions that seek the freedom to make capital distributions (including for dividends and repurchases of stock) and pay discretionary bonuses to executive officers without restriction must also maintain 2.5% in Common Equity Tier 1 Capital attributable to a capital conservation buffer being phased in over three years beginning in 2016 (which, as of January 1, 2018, it had phased in to 1.875%).buffer. The purpose of the conservation buffer is to ensure that banking institutions maintain a buffer of capital that can be used to absorb losses during periods of financial and economic stress. Factoring in the fully phased-in conservation buffer increases the minimum ratios depicted above to 7% for Common Equity Tier 1 Capital, 8.5% for Tier 1 Capital and 10.5% for Total Capital.
BankingThrough subsequent rulemaking, the federal banking agencies provided certain forms of relief to banking organizations (except for large, internationally active banking organizations) becamethat are not subject to the new rules on January 1, 2015. However, therecapital regulation's advanced approaches, such as the Corporation. For instance, non-advanced approaches institutions are separate phase-in/phase-out periods for: (i)subject to simpler regulatory capital requirements for Mortgage Servicing Assets (“MSA”), certain Deferred Tax Assets (“DTA”) arising from temporary differences, investments in the capital conservation buffer; (ii)of unconsolidated financial institutions, and requirements for the amount of capital issued by a consolidated subsidiary of a banking organization and held by third parties (sometimes referred to as a minority interest) that is includable in regulatory capital. Specifically, such institutions may deduct from Common Equity Tier 1 Capital any amount of MSAs, temporary difference DTAs, and investments in the capital of unconsolidated financial institutions that individually exceeds 25 percent of Common Equity Tier 1 Capital.
On July 27, 2023, the federal banking agencies issued a proposed rule to implement the final components of the Basel III standards set by the Basel Committee on Banking Supervision in 2017. The proposed rule, which would not apply to the Corporation and the Bank as proposed, would substantially revise the existing regulatory capital adjustments and deductions; (iii) nonqualifying capital instruments; and (iv) changes to the prompt corrective action rules discussed below. The phase-in periods commenced on January 1, 2016 and extend until January 1, 2019.framework for institutions with $100 billion or more of assets.
Well-Capitalized Requirements. The ratios described above are minimum standards in order for banking organizations to be considered “adequately capitalized.” Bank regulatory agencies uniformly encourage banks to hold more capital and be “well-capitalized”
“well-capitalized” and, to that end, federal law and regulations provide various incentives for banking organizations to maintain regulatory capital at levels in excess of minimum regulatory requirements. For example, a banking organization that is well-capitalized may: (i) qualify for exemptions from prior notice or application requirements otherwise applicable to certain types of activities; (ii) qualify for expedited processing of other required notices or applications; and (iii) accept, roll-over, or renew brokered deposits. Higher capital levels could also be required if warranted by the particular circumstances or risk profiles of individual banking organizations. For example, the Federal Reserve’s capital guidelines contemplate that additional capital may be required to take adequate account of, among other things, interest rate risk, or the risks posed by concentrations of credit, nontraditional activities, or securities trading activities. Further, any banking organization experiencing or anticipating significant growth would be expected to maintain capital ratios, including tangible capital positions (i.e., Tier 1 Capital less all intangible assets), well above the minimum levels.
Under the capital regulations of the FDIC, and Federal Reserve, in order to be well-capitalized,well‑capitalized, a banking organization must maintain:
•A Common Equity Tier 1 Capital ratio to risk-weighted assets of 6.5% or more;
•A ratio of Tier 1 Capital to total risk-weighted assets of 8% or more (6% under Basel I);more;
•A ratio of Total Capital to total risk-weighted assets of 10% or more (the same as Basel I);more; and
•A leverage ratio of Tier 1 Capital to total adjusted average quarterly assets of 5% or greater.
It is possible under the Basel III Rule to be well-capitalized while remaining out of compliance with the capital conservation buffer discussed above.
As of December 31, 2017:2023: (i) the Bank wasis not subject to a directive from the WDFI or the FDIC to increase its capital; and (ii) the Bank was well-capitalized, as defined by FDIC regulations. As of December 31, 2017,Additionally, the Corporation had regulatory capital in excess of the Federal Reserve’s requirements and met the Basel III Rule requirements to be well-capitalized.as of December 31, 2023.
Prompt Corrective Action. An FDIC-insured institution’s capital playsThe concept of an important role in connection withinstitution being “well-capitalized” is part of a regulatory enforcement as well. Federal lawregime that provides the federal banking regulators with broad power to take prompt“prompt corrective actionaction” to resolve the problems of undercapitalized institutions. institutions based on the capital level of each particular institution.The extent of the regulators’ powers depends on whether the institution in question is “adequately capitalized,” “undercapitalized,” “significantly undercapitalized” or “critically undercapitalized,” in each case as defined by regulation. Depending upon the capital category to which an institution is assigned, the regulators’ corrective powers include: (i) requiring the institution to submit a capital restoration plan; (ii) limiting the institution’s asset growth and restricting its activities; (iii) requiring the institution to issue additional capital stock (including additional voting stock) or to sell itself; (iv) restricting transactions between the institution and its affiliates; (v) restricting the interest rate that the institution may pay on deposits; (vi) ordering a new election of directors of the institution; (vii) requiring that senior executive officers or directors be dismissed; (viii) prohibiting the institution from accepting deposits from correspondent banks;
(ix) requiring the institution to divest certain subsidiaries; (x) prohibiting the payment of principal or interest on subordinated debt; and (xi) ultimately, appointing a receiver for the institution.
RegulationsCommunity Bank Capital Simplification.Community banks have long raised concerns with bank regulators about the regulatory burden, complexity, and Supervisioncosts associated with certain provisions of the CorporationBasel III Rule. In response, Congress provided a potential Basel III “off-ramp” for certain institutions, like us, under Section 201 of the Regulatory Relief Act. Pursuant to authority granted thereunder, on September 17, 2019, the agencies adopted a final rule, effective on January 1, 2020, providing that banks and bank holding companies that have less than $10 billion in total consolidated assets and meet other qualifying criteria, including a “Community Bank Leverage Ratio” (“CBLR”) calculated by dividing Tier 1 capital by average total consolidated assets of greater than 9%, will be eligible to opt into the CBLR framework. By opting into the framework, qualifying banks and bank holding companies maintaining a CBLR greater than 9% will be considered to have satisfied the generally applicable risk-based and leverage capital requirements in the agencies’ capital rules and, if applicable, will be considered to have met the well-capitalized ratio requirements for purposes of section 38 of the Federal Deposit Insurance Act. In addition to the consolidated assets and CBLR requirements described above, a qualifying bank or bank holding company must also have (i) total off-balance sheet exposures (excluding derivatives other than sold credit derivatives and unconditionally cancellable commitments) of 25% or less of total consolidated assets, and (ii) the sum of total trading assets and trading liabilities of 5% or less of total consolidated assets.
General. The Corporation asand the Bank opted out of the CBLR framework for each reporting period in 2023 and has the option to opt into the framework for future reporting periods. The decision to opt into or out of the CBLR framework is monitored on an ongoing basis.
First Business Financial Services, Inc.
General. As the sole shareholder of the Bank, iswe are a bank holding company. As a bank holding company, we are registered with, and subject to regulation, supervision, and enforcement by, the Federal Reserve under the Bank Holding Company Act of 1956, as amended (“BHCA”). We are legally obligated to act as a source of financial and managerial strength to the Bank and to commit resources to support the Bank in circumstances where we might not otherwise do so. Under the BHCA, we are subject to periodic examination by the Federal Reserve andReserve. We are required to file with the Federal Reserve periodic reports of the Corporation’sour operations and such additional information regarding usthe Corporation and the Bankour subsidiaries as the Federal Reserve may require.
Acquisitions Activities and Change in ControlActivities. The primary purpose of a bank holding company is to control and manage banks. The BHCA generally requires the prior approval of the Federal Reserve for any merger involving a bank holding company or any acquisition by a bank holding company of another bank or bank holding company. Subject to certain conditions (including deposit concentration limits established by the BHCA,BHCA), the Federal Reserve may allow a bank holding company to acquire banks located in any state of the United States. In approving interstate acquisitions, the Federal Reserve is required to give effect to applicable state law limitations on the aggregate amount of deposits that may be held by the acquiring bank holding company and its FDIC-insured institution affiliates in the state in which the target bank is located (provided that those limits do not discriminate against out-of-state institutions or their holding companies) and state laws that require that the target bank havehas been in existence for a minimum period of time (not to exceed five years) before being acquired by an out-of-state bank holding company. Furthermore, in accordance with the Dodd-Frank Act, bank holding companies must be well-capitalized and well-managed in order to effect interstate mergers or acquisitions. For a discussion of the capital requirements, see “Regulatory Emphasis on Capital”The Role of Capital above.
The BHCA generally prohibits the Corporation from acquiring direct or indirect ownership or control of more than 5% of the voting shares of any company that is not a bank and from engaging in any business other than that of banking, managing and controlling banks or furnishing services to banks and their subsidiaries. This general prohibition is subject to a number of exceptions. The principal exception allows bank holding companies to engage in, and to own shares of companies engaged in, certain businesses found by the Federal Reserve prior to November 11, 1999 to be “so closely related to banking . . .... as to be a proper incident thereto.” This authority would permit uspermits the Corporation to engage in a variety of banking-related businesses, including the ownership and operation of a savings association, or any entity engaged in consumer finance, equipment leasing, the operation of a computer service bureau (including software development), and mortgage banking and brokerage services. The BHCA does not place territorial restrictions on the domestic activities of nonbanknon-bank subsidiaries of bank holding companies.
Additionally, bank holding companies that meet certain eligibility requirements prescribed by the BHCA and elect to operate as financial holding companies may engage in, or own shares in companies engaged in, a wider range of nonbankingnon-banking activities, including securities and insurance underwriting and sales, merchant banking, and any other activity that the Federal Reserve, in consultation with the Secretary of the Treasury, determines by regulation or order is financial in nature or incidental to any such financial activity or that the Federal Reserve determines by order to be complementary to any such financial activity and does not pose a substantial risk to the safety or soundness of FDIC-insured institutions or the financial system generally. In order to maintain status as a financial holding company, both the bank holding company and its subsidiary bank must be well-capitalized, well-managed, and have a least a satisfactory Community Reinvestment Act (“CRA”) rating. If the Federal Reserve determines that either the bank holding company or any of its subsidiary banks are not well-capitalized or well-managed, the Federal Reserve will provide a period of time in which to achieve compliance, but during the period of noncompliance, the Federal Reserve may place any additional limitations on it believes to be appropriate. Furthermore, if the Federal Reserve determines that the subsidiary bank has not received a satisfactory CRA rating, the holding company would not be able to commence any new financial activities or acquire a company that engages in such activities. The Corporation has not elected to becomeoperate as a financial holding company.
Change in Control.Federal law also prohibits any person or company from acquiring “control” of an FDIC-insured depository institution or its holding company without prior notice to the appropriate federal bank regulator. “Control” is conclusively presumed to exist upon the acquisition of 25% or more of the outstanding voting securities of a bank or bank holding company but may arise under certain circumstances between 10% and 24.99% ownership.
Capital Requirements. Bank holding companies are required to maintain capital in accordance with On January 30, 2020, the Federal Reserve capital adequacy requirements. Forissued a discussionfinal rule clarifying and expanding upon the Federal Reserve’s position on determinations of capital requirements, see “Regulatory Emphasis on Capital” above.whether a company has the ability to exercise a controlling influence over another company. In particular, the final rule is intended to provide a better understanding of the facts and circumstances that the Federal Reserve considers most relevant when assessing whether control exists.
Dividend Payments. The Corporation’sOur ability to pay dividends to the Corporation’sour shareholders may be affected by both general corporate law considerations and policies of the Federal Reserve applicable to bank holding companies. As a Wisconsin corporation, we are subject to the limitations of the Wisconsin Business Corporations Law,law, which allows us to pay dividends unless, after suchgiving effect to a dividend, any of the following would occur: (i) we would not be able to pay the Corporation’sour debts as they become due in the usual
course of business or (ii) the Corporation’s total assets would be less than the sum of the Corporation’sits total liabilities plus any amount that would be needed if we were to be dissolved at the time of the dividend payment, to satisfy the preferential rights upon dissolution of shareholders whose rights are superior to the rights of the shareholders receiving the distribution.
As a general matter, the Federal Reserve has indicated that the board of directors of a bank holding company should eliminate, defer, or significantly reduce dividends to shareholders if: (i) the company’s net income available to shareholders for the past four quarters, net of dividends previously paid during that period, is not sufficient to fully fund the dividends; (ii) the
prospective rate of earnings retention is inconsistent with the company’s capital needs and overall current and prospective financial condition; or (iii) the company will not meet, or is in danger of not meeting, its minimum regulatory capital adequacy ratios. Moreover, under the Dodd-Frank Act and the requirements of the Federal Reserve, the Corporation, as a bank holding company, is required to serve as a source of financial strength to the Bank and to commit resources to support the Bank. In addition, consistent with its “source of strength” policy, the Federal Reserve has stated that, as a matter of prudent banking, a bank holding company should not maintain a level of cash dividends to its shareholders that places undue pressure on the capital of its bank subsidiaries, or that can be funded only through additional borrowings or other arrangements that may undermine the bank holding company’s ability to serve as a source of strength. The appropriate federal regulatory authorities have indicated that paying dividends that deplete a bank’s capital base to an inadequate level would be an unsafe and unsound banking practice and that banking organizations should generally pay dividends only out of current operating earnings.
The Federal Reserve also possesses enforcement powers over bank holding companies and their non-bank subsidiaries to prevent or remedy actions that represent unsafe or unsound practices or violations of applicable statutes and regulations. Among these powers is the ability to proscribe the payment of dividends by banks and bank holding companies. In addition, under the Basel III Rule, institutions that seek the freedom to pay dividends will have to maintain 2.5% in Common Equity Tier 1 Capital attributable to the capital conservation buffer to be phased in over three years beginning in 2016.buffer. See “Regulatory Emphasis on Capital” above.The Role of Capital above for additional information.
Incentive Compensation. There have been a number of developments in recent years focused on incentive compensation plans sponsored by bank holding companies and banks, reflecting recognition by the bank regulatory agencies and Congress that flawed incentive compensation practices in the financial industry were one of many factors contributing to the global financial crisis. Layered on top of that are the abuses in the headlines dealing with product cross-selling incentive plans. The result is interagency guidance on sound incentive compensation practices and proposed rulemaking by the agencies required under Section 956 of the Dodd-Frank Act.
The interagency guidance recognized three core principles. Effective incentive plans should: (i) provide employees incentives that appropriately balance risk and reward; (ii) be compatible with effective controls and risk-management; and (iii) be supported by strong corporate governance, including active and effective oversight by the organization’s board of directors. Much of the guidance addresses large banking organizations and, because of the size and complexity of their operations, the regulators expect those organizations to maintain systematic and formalized policies, procedures and systems for ensuring that the incentive compensation arrangements for all executive and non-executive employees covered by this guidance are identified and reviewed, and appropriately balance risks and rewards. Smaller banking organizations like the Corporation that use incentive compensation arrangements are expected to be less extensive, formalized and detailed than those of the larger banks.
Section 956 of the Dodd-Frank Act required the banking agencies, the National Credit Union Administration, the SEC and the Federal Housing Finance Agency to jointly prescribe regulations that prohibit types of incentive-based compensation that encourages inappropriate risk taking and to disclose certain information regarding such plans. On June 10, 2016, the agencies released an updated proposed rule for comment. Section 956 will only apply to banking organizations with assets of greater than $1 billion. We have consolidated assets greater than $1 billion and less than $50 billion and we are considered a Level 3 banking organization under the proposed rules. The proposed rules contain mostly general principles and reporting requirements for Level 3 institutions so there are no specific prescriptions or limits, deferral requirements or claw-back mandates. Risk management and controls are required, as is board or committee level approval and oversight. Management expects to review its incentive plans in light of the proposed rulemaking and guidance and implement policies and procedures that mitigate unreasonable risk. As of December 31, 2017, these rules remain in proposed form.
Monetary Policy. The monetary policy of the Federal Reserve has a significant effect on the operating results of financial or bank holding companies and their subsidiaries. Among the tools available to the Federal Reserve to affect the money supply are open market transactions in U.S. government securities, changes in the discount rate on bank borrowings, and changes in reserve requirements against bank deposits. These means are used in varying combinations to influence overall growth and distribution of bank loans, investments and deposits, and their use may affect interest rates charged on loans or paid on deposits.
Federal Securities Regulation. The Corporation’s common stock is registered with the SEC under the Securities Act of 1933, as amended, and the Exchange Act. Consequently, we are subject to the information, proxy solicitation, insider trading, and other restrictions and requirements of the SEC under the Exchange Act.
Corporate Governance. The Dodd-Frank Act addressed many investor protection, corporate governance, and executive compensation matters that will affect most U.S. publicly traded companies. The Dodd-Frank Act increased shareholder influence over boards of directors by requiring companies to give shareholders a non-bindingnonbinding vote on executive compensation and so-called “golden parachute” payments, and by authorizing the SEC to promulgate rules that would allow shareholders to nominate and solicit voters for their own candidates using a company’s proxy materials. The legislation also directed the Federal Reserve to promulgate rules prohibiting excessive compensation paid to executives of bank holding companies, regardless of whether such companies are publicly traded.
Regulation and Supervision of theThe Bank
General. The Bank is a Wisconsin-charteredWisconsin state-chartered bank. The deposit accounts of the Bank are insured by the FDIC’s Deposit Insurance Fund (“DIF”) to the maximum extent provided under federal law and FDIC regulations, currently $250,000 per insured depositor category.regulations. As a Wisconsin-chartered FDIC-insured bank, the Bank is subject to the examination, supervision, reporting, and enforcement requirements of the WDFI, the chartering authority for Wisconsin banks, and the FDIC, designated by federal law as the primary federal regulator of insured state banks that, like the Bank, are not members of the Federal Reserve System (“nonmember banks”)(nonmember banks).
Deposit Insurance. Insurance. As an FDIC-insured institution, the Bank is required to pay deposit insurance premium assessments to the FDIC. Deposits are insured up to applicable limits by the FDIC and such insurance is backed by the full faith and credit of the United States Government. Under the Dodd-Frank Act, a permanent increase in deposit insurance was authorized to $250,000 per depositor, per insured depository institution for each account ownership category.
The FDIC has adopted a risk-based assessment system whereby FDIC-insured institutions pay insurance premiums at rates based on their risk classification. For institutions like the Bank that are not considered large and highly complex banking organizations, assessments are notnow based on examination ratingratings and financial ratios. The total base assessment rates currently range from 1.5 basis points to 30 basis points. At least semi-annually, the FDIC updates its loss and income projections for the DIF and, if needed, increases or decreases the assessment rates, following notice and comment on proposed rulemaking. The assessment base against which an FDIC-insured institution’s deposit insurance premiums paid to the DIF arehas been calculated since effectiveness of the Dodd-Frank Act is based on its average consolidated total assets less its average tangible equity. This method shiftsshifted the burden of deposit insurance premiums toward those large depository institutions that rely on funding sources other than U.S. deposits.
The reserve ratio is the FDIC insurance fund balance divided by estimated insured deposits. The Dodd-Frank Act alteredset the minimum DIF reserve ratio of the DIF, increasing the minimum from 1.15% toat 1.35% of the estimated amount of total insured deposits, and eliminating the requirement that the FDIC pay dividends to FDIC-insured institutions when the reserve ratio exceeds
certain thresholds. TheOn October 18, 2022, the FDIC adopted a final rule increasing the initial base deposit insurance rate schedules by 2 basis points, beginning with the first quarterly assessment period of 2023. Starting January 1, 2023, the total base assessment rates for small banks, such as the Bank, ranged from 2.5 basis points to 32 basis points. This new assessment rate schedule will remain in effect unless and until the reserve ratio reached 1.15% onmeets or exceeds 2.00%. Progressively lower assessment rate schedules will take effect when the reserve ratio reaches 2.00%, and again when it reaches 2.50%. The Bank’s assessment rate for deposit insurance was approximately 8 basis points for 2023.
The DIF reserve ratio was 1.10% as of June 30, 2016, when revised factors were put2023, which is less than the statutory minimum reserve ratio of 1.35%, which is required to be achieved by September 30, 2028. There was a sharp decline in placethe DIF in 2023 following the failures of Silicon Valley Bank, Signature Bank and First Republic Bank in the first half of 2023, coupled with strong insured deposit growth. On November 16, 2023, the FDIC issued a final rule to implement a special assessment to recover the loss DIF associated with protecting uninsured depositors following these bank failures. Under the final rule, the assessment base for calculatingan insured depository institution will be equal to the assessment. The reserve ratioinstitution’s estimated uninsured deposits as of December 31, 2017 was 1.30%. If2022, adjusted to exclude the reserve ratio does not reach 1.35% by December 31, 2018 (provided it is at least 1.15%),first $5 billion in estimated uninsured deposits. Under the final rule, the FDIC will impose a shortfallcollect the special assessment on Marchat an annual rate of 13.4 basis points beginning with the first quarterly assessment period of 2024 and will continue to collect special assessments for an anticipated total of eight quarterly assessment periods. At December 31, 2019 on insured depository institutions with total consolidated assets2023, our estimated level of $10 billion or more. uninsured deposits was below this threshold, and therefore, the Bank is not subject to this special assessment.
The FDIC will provide assessment creditsis authorized to insuredconduct examinations of and require reporting by FDIC-insured institutions. It is also authorized to terminate a depository institutions, likebank’s deposit insurance upon a finding by the FDIC that the bank’s financial condition is unsafe or unsound or that the institution has engaged in unsafe or unsound practices or has violated any applicable rule, regulation, order or condition enacted or imposed by the bank’s regulatory agency. The termination of deposit insurance for the Bank with total consolidated assets of less than $10 billion for the portion of their regular assessments that contribute to growth in the reserve ratio between 1.15%would have a material adverse effect on our earnings, operations and 1.35%. The FDIC will apply the credits each quarter that the reserve ratio is at least 1.38% to offset the regular deposit insurance assessments of institutions with credits.financial condition.
FICO Assessments. In addition to paying basic deposit insurance assessments, FDIC-insured institutions must pay Financing Corporation (“FICO”) assessments. FICO is a mixed-ownership governmental corporation chartered by the former Federal Home Loan Bank (“FHLB”) Board pursuant to the Competitive Equality Banking Act of 1987 to function as a financing vehicle for the recapitalization of the former Federal Savings and Loan Insurance Corporation. FICO issued 30-year noncallable bonds of approximately $8.1 billion that mature in 2017 through 2019. FICO’s authority to issue bonds ended on December 12, 1991. Since 1996, federal legislation has required that all FDIC-insured institutions pay assessments to cover interest payments on FICO’s outstanding obligations. The FICO assessment rate is adjusted quarterly and for the fourth quarter of 2017 was 54 cents per $100 dollars of assessable deposits.
Supervisory Assessments.All Wisconsin banks are required to pay supervisory assessments to the WDFI to fund the operations of that agency. The amount of the assessment is calculated on the basis of the Bank’s total assets. During the year ended December 31, 2017, the Bank paid supervisory assessments to the WDFI totaling approximately $60,000, which includes any separate assessment paid by FBB-Milwaukee. Also, Alterra, for the time in which it was held as a separate charter in 2017, paid supervisory assessments to the Office of State Bank Commissioner of Kansas totaling approximately $51,000.
Capital Requirements. Banks are generally required to maintain capital levels in excess of other businesses. For a discussion of capital requirements, see “Regulatory Emphasis on Capital” above.
Liquidity Requirements. Liquidity is a measure of the ability and ease with which bank assets may be converted to cash. Liquid assets are those that can be converted to cash quickly if needed to meet financial obligations. To remain viable, FDIC-insured institutions must have enough liquid assets to meet their near-term obligations, such as withdrawals by depositors. Because the global financial crisis was in part a liquidity crisis, Basel III also includes a liquidity framework that requires FDIC-insured institutions to measure their liquidity against specific liquidity tests. One test, referred to as the Liquidity Coverage Ratio, (“LCR”), is designed to ensure that the banking entity has an adequate stock of unencumbered high-quality liquid assets that can be converted easily and immediately in private markets into cash to meet liquidity needs for a 30-calendar day liquidity stress scenario. The other test, known as the Net Stable Funding Ratio, (“NSFR”), is designed to promote more medium- and long-term funding of the assets and activities of FDIC-insured institutions over a one-year horizon. These tests provide an incentive for banks and holding companies to increase their holdings in Treasury securities and other sovereign debt as a component of assets, increase the use of long-term debt as a funding source, and rely on stable funding like core deposits (in lieu of brokered deposits).
In addition to liquidity guidelines already in place, the federal bank regulatory agencies implemented the Basel III LCR in September 2014, which requires large financial firms to hold levels of liquid assets sufficient to protect against constraints on their funding during times of financial turmoil, and in 2016 proposed implementation of the NSFR. While these tests only apply to the largest banking organizations in the country, certain elements are expected to filter down to all FDIC-insured institutions. We are reviewing the Corporation’s liquidity risk management policies in light of the LCR and NSFR.
Stress Testing. A stress test is an analysis or simulation designed to determine the ability of a given FDIC-insured institution to deal with an economic crisis. In October 2012, U.S. bank regulators unveiled new rules mandated by the Dodd-Frank Act that require the largest U.S. banks to undergo stress tests twice per year, once internally and once conducted by the regulators. Stress tests are not required for banks with less than $10 billion in assets; however, the FDIC now recommends stress testing as means to identify and quantify loan portfolio risk and the Bank is conducting quarterly commercial real estate portfolio stress testing.
Dividend Payments.The primary source of funds for the Corporation is dividends from the Bank. Under Wisconsin banking law, Wisconsin-chartered banks generallythe board of directors of a bank may declare and pay a dividend from its undivided profits in an amount it considers expedient. The board of directors must provide for the payment of all expenses, losses, required reserves, taxes, and interest accrued or due from the bank before the declaration of dividends only out offrom undivided profits. If dividends declared and paid in either of the two immediately preceding years exceeded net income for either of those two years respectively, the bank may not declare or pay any dividend in the current year that exceeds year-to-date net income except with the written consent of the WDFI. The FDIC and the WDFI may restrictprohibit the declaration or payment of a dividend by a Wisconsin-chartered bank, such as the Bank. The payment of dividends by any FDIC-insured institution is affected by the requirement to maintain adequate capital pursuant to applicable capital adequacy guidelines and regulations, and a FDIC-insured institution generally is prohibited from paying any dividends if, following payment thereof, the institution would be undercapitalized. As described above, the Bank exceeded its capital requirements under applicable guidelines as of December 31, 2017.if either or both determine such payment would constitute an unsafe or unsound practice. In addition, under the Basel III Rule, institutions that seek the freedom to pay dividends will have to maintain 2.5% in Common Equity Tier 1 Capital attributable to the capital conservation buffer to be phased in over three years beginning in 2016.buffer. See “Regulatory Emphasis on Capital”The Role of Capital above.
State Bank Investments and Activities. The Bank is permitted to make investments and engage in activities directly or through subsidiaries as authorized by Wisconsin law. However, under federal law and FDIC regulations, FDIC-insured state banks are prohibited, subject to certain exceptions, from making or retaining equity investments of a type, or in an amount, thatwhich are not permissible for a national bank. Federal law and FDIC regulations also prohibit FDIC-insured state banks and their subsidiaries, subject to certain exceptions, from engaging as principal in any activity that is not permitted for a national bank unless the Bankbank meets, and continues to meet, its minimum regulatory capital requirements and the FDIC determines that the activity would not pose a significant risk to the DIF. These restrictions have not had, and are not currently expected to have, a material impact on the operations of the Bank.
Insider Transactions. The Bank is subject to certain restrictions imposed by federal law on “covered transactions” between the Bank and its “affiliates.” The Corporation isWe are an affiliate of the Bank for purposes of these restrictions, and covered transactions subject to the restrictions include extensions of credit to the Corporation, investments in the stock or other securities of the Corporation, and the acceptance of the stock or other securities of the Corporation as collateral for loans made by the Bank. The Dodd-Frank Act enhanced the requirements for certain transactions with affiliates, including an expansion of the definition of “covered transactions” and an increase in the amount of time for which collateral requirements regarding covered transactions must be maintained.
Certain limitations and reporting requirements are also placed on extensions of credit by the Bank to its directors and officers, to directors and officers of the Corporation and its subsidiaries, to principal shareholders of the Corporation, and to “related interests” of such directors, officers, and principal shareholders. In addition, federal law and regulations may affect the terms upon which any person who is a director or officer of the Corporation or the Bank, or a principal shareholder of the Corporation, may obtain credit from banks with which the Bank maintains a correspondent relationship.
Safety and Soundness Standards/Risk Management.The federal banking agencies have adopted guidelines that establish operational and managerial standards to promote the safety and soundness of FDIC-insured institutions. The guidelines set forth standards forapply to internal controls, information systems, internal audit systems, loan documentation,risk mitigation, bank operations, compliance, credit underwriting, interest rate exposure, asset growth, compensation, fees and benefits,fiduciary risk, asset quality, and earnings.
In general, the safety and soundness guidelinesstandards prescribe the goals to be achieved in each area, and each institution is responsible for establishing its own procedures to achieve those goals. IfWhile regulatory standards do not have the force of law, if an institution fails to comply with any of the standards set forthoperates in the guidelines,an unsafe and unsound manner, the FDIC-insured institution’s primary federal regulator may require the institution to submit a plan for achieving and maintaining compliance. If aan FDIC-insured institution fails to submit an acceptable compliance plan or fails in any material respect to implement a compliance plan that has been accepted by its primary federal regulator, the regulator is required to issue an order directing the institution to cure the deficiency. Until the deficiency cited in the regulator’s order is cured, the regulator may restrict the FDIC-insured institution’s rate of growth, require the FDIC-insured institution to increase its capital, restrict the rates the institution pays on deposits, or require the institution to take any action the regulator deems appropriate under the circumstances. Noncompliance with the standards established by the safety and soundness guidelines
may also constitute grounds for other enforcement action by the federal bank regulatory agencies, including cease and desist orders and civil money penalty assessments.
During the past decade,several years, the bank regulatory agencies have increasingly emphasized the importance of sound risk management processes and strong internal controls when evaluating the activities of the FDIC-insured institutions they supervise. Properly managing risks has been identified as critical to the conduct of safe and sound banking activities and has become even more important as new technologies, product innovation, and the size and speed of financial transactions have changed the nature of banking markets. The agencies have identified a spectrum of risks facing a banking institution including, but not limited to, credit, market, liquidity, operational, legalcompliance, and reputational risk. In particular, recent regulatory pronouncements have focused on operational risk, which arises from the potential that inadequate information systems, operational problems, breaches in internal controls, fraud, or unforeseen catastrophes will result in unexpected losses. New products and services, third-party risk, incentive compensation, and cybersecurity are critical sources of operational risk that FDIC-insured institutions mustare expected to address in the current environment. The Bank is expected to have active board and senior management oversight; adequate policies, procedures, and limits; adequate risk measurement, monitoring, and management information systems; and comprehensive internal controls.
Branching Authority. Authority. Wisconsin banks, such as the Bank, have the authority under Wisconsin law to establish branches anywhere in the State of Wisconsin, subject to receipt of all required regulatory approvals. The establishment of new interstate branches has historically been permitted only in those states the laws of which expressly authorize such expansion.The Dodd-Frank Act permits well-capitalized and well-managed banks to establish new interstate branches or acquire individual branches of a bank in another state (rather than the acquisition of an out-of-state bank in its entirety) without impediments. Federal law permits state and national banks to merge with banks in other states subject to: (i) regulatory approval; (ii) federal and state deposit concentration limits; and (iii) state law limitations requiring the merging bank to have been in existence for a minimum period of time (not to exceed five years) prior to the merger.
Brokered Deposits. On December 19, 2018, the FDIC adopted a final rule on the treatment of reciprocal deposits pursuant to the Regulatory Relief Act. The establishment of new interstate branches has historically been permitted only in those states the laws of which expressly authorize such expansion. The Dodd-Frank Act permitsfinal rule, effective March 6, 2019, exempts certain reciprocal deposits from being considered as brokered deposits for certain insured institutions. In particular, well-capitalized and well-managed bankswell-rated institutions are not required to establish new interstate branchestreat reciprocal deposits as brokered deposits up to the lesser of 20% of their total liabilities or $5 billion. Institutions that are not both well-capitalized and well-rated may also exclude reciprocal deposits from their brokered deposits under certain circumstances.
On December 15, 2020, the acquisition of individual branchesFDIC issued a final rule on brokered deposits. The rule aims to clarify and modernize the FDIC’s existing regulatory framework for brokered deposits. Among other things, the rule establishes bright-line standards for determining whether an entity meets the definition of a bank in another state (rather than“deposit broker,” and identifies a number of business relationships (or “designated exceptions”) that automatically meet the acquisition of an out-of-state bank in its entirety) without impediments.
Transaction Account Reserves. Federal Reserve regulations require FDIC-insured institutions to maintain reserves against their transaction accounts (primarily NOW and regular checking accounts). For 2018, the first $16 million of otherwise reservable balances are exempt from reserves and have“primary purpose” exception. The rule also establishes a zero percent reserve requirement;transparent application process for transaction accounts aggregating more than $16 million to $122.3 million, the reserve requirement is 3% of total transaction accounts; and for net transaction accounts in excess of $122.3 million, the reserve requirement is 3% up to $115.1 million plus 10%entities that seek a “primary purpose” exception but do not meet one of the aggregate amount“designated exceptions.”The new rule also reflects technological changes across the banking industry and removes regulatory disincentives that limit banks’ ability to serve their customers. Full compliance with the amended brokered deposits regulation was required by January 1, 2022.The FDIC staff continues to implement the final rule through the issuance of total transaction accounts in excess of $122.3 million. These reserve requirements are subject to annual adjustment by the Federal Reserve.interpretative guidance and other administrative actions.
Community Reinvestment Act (“CRA”) Requirements. The CRA requires the Bank to have a continuing and affirmative obligation in a safe and sound manner to help meet the credit needs of itsthe entire community, including low- and moderate-income (“LMI”) neighborhoods. Federal regulators regularly assess the Bank’s record of meeting the credit needs of its communities. ApplicationsAn institution’s CRA assessment may be used by its regulators in their evaluation of certain applications, including a merger, acquisition, or the establishment of a branch office. An unsatisfactory rating may be used as a basis for additional acquisitionsdenial of such an application.
On October 24, 2023, the federal banking agencies jointly issued a final rule to strengthen and modernize the existing CRA regulations. Under the final rule, the agencies will evaluate a bank’s CRA performance based upon the varied activities that it conducts and the communities in which it operates. CRA evaluations and data collection requirements will be tailored based on bank size and type. The Bank would be affectedconsidered a large bank with assets of greater than $2 billion under the final rule and therefore will be evaluated under new lending, retail services and products, community development financing, and community development services tests. The final rule includes CRA assessment areas associated with mobile and online banking, and new metrics and benchmarks to assess retail lending performance. In addition, the final rule emphasizes smaller loans and investments that can have a high impact and be more responsive to the needs of LMI communities. The final rule will take effect on April 1, 2024; however, compliance with the majority of the final rule's provisions will not be required until January 1, 2026, and the data reporting requirements of the final rule will not take effect until January 1, 2027.
Anti-Money Laundering. The Bank is subject to several federal laws that are designed to combat money laundering and terrorist financing, and to restrict transactions with persons, companies, or foreign governments sanctioned by United States authorities. This category of laws includes the Bank Secrecy Act (the “BSA”), the Money Laundering Control Act, the USA PATRIOT Act (collectively, “AML laws”) and implementing regulations as administered by the evaluationUnited States Treasury Department’s Office of Foreign Assets Control (“sanctions laws”).
As implemented by federal banking and securities regulators and the Department of the Bank’sTreasury, AML laws obligate depository institutions to verify their customers’ identity, conduct customer due diligence, report on suspicious activity, file reports of transactions in currency, and conduct enhanced due diligence on certain accounts. In addition, the Financial Crimes Enforcement Network (“FinCEN”) promulgated customer due diligence and customer identification rules that required banks to identify and verify the identity of beneficial owners of all legal entity customers (with certain exclusions) at the time a new account is opened (subject to certain exemptions). Sanctions laws prohibit persons of the United States from engaging in any transaction with a restricted person or restricted country. Depository institutions are required by their respective federal regulators to maintain policies and procedures in order to ensure compliance with the above obligations. Federal regulators regularly examine BSA/AML and sanctions compliance programs to ensure their adequacy and effectiveness, and the frequency and extent of such examinations and the remedial actions resulting therefrom have been increasing. Non–compliance with sanctions laws and/or AML laws or failure to maintain an adequate BSA/AML compliance program can lead to significant monetary penalties and reputational damage, and federal regulators evaluate the effectiveness of an applicant in meeting its CRA requirements.combating money laundering when determining whether to approve a proposed bank merger, acquisition, restructuring, or other expansionary activity.
Anti-Money Laundering. On January 1, 2021, the National Defense Authorization Act (“NDAA”) was enacted by Congress.The Unitingnew law establishes the most significant overhaul of BSA and Strengthening America by Providing Appropriate Tools Required to Intercept and Obstruct TerrorismAML since the USA PATRIOT Act of 2001, (the “USA PATRIOT Act”)including: (i) new beneficial ownership information and the establishment of a beneficial ownership registry, which requires corporate entities (generally any corporation, limited liability company or similar entity with 20 or fewer employees and annual gross income of $5 million or less) to report beneficial ownership information to FinCEN (which information will be maintained by FinCEN and made available upon request to financial institutions); (ii) whistleblower and penalty enhancements; (iii) improvements to existing information sharing provisions that permit financial institutions to share information relating to suspicious activity reports for purposes of combating illicit finance risks; and (iv) provisions emphasizing the importance of risk-based approaches to AML program requirements. Many of the changes to the BSA and AML require the Department of Treasury and FinCEN to
promulgate rules. On September 29, 2022, FinCEN issued a final regulation implementing the BSA amendments included in the NDAA with respect to beneficial ownership.
Privacy and Cybersecurity. The Bank is designedsubject to deny terroristsmany U.S. federal and criminalsstate laws and regulations governing requirements for maintaining policies and procedures to protect non-public personal information of their consumers. These laws require the Bank to periodically disclose their privacy policies and practices relating to sharing such information and permit consumers to opt out of their ability to obtain accessshare information with unaffiliated third parties under certain circumstances. They also impact the Bank’s ability to share certain information with affiliates and non-affiliates for marketing and/or non-marketing purposes, or to contact clients with marketing offers.
Moreover, given the increased focus on privacy and data security in the United States and internationally, laws and regulations related to the U.S. financial systemsame are evolving. Multiple states and has significant implications for FDIC-insured institutions, brokers, dealersCongress are considering additional laws or regulations that could create or alter individual privacy rights and other businesses involved in the transfer of money. The USA PATRIOT Act mandatesimpose additional obligations on banks and related financial services companies in possession of or with access to havepersonal data.
The Bank is required to implement a comprehensive information security program that includes administrative, technical, and physical safeguards to ensure the security and confidentiality of customer records and information. These security and privacy policies and procedures, with respectfor the protection of personal and confidential information, are in effect across the Bank and its subsidiaries. On November 18, 2021, the FDIC, the Federal Reserve System, and the OCC (collectively, the agencies) issued a joint final rule, to measures designedestablish computer-security incident notification requirements for banking organizations and their bank service providers.
Specifically, the rule requires banking organizations to addressnotify their primary federal regulator as soon as possible and no later than 36 hours after the discovery of a “computer-security incident” that rises to the level of a "notification incident," as those terms are defined under the final rule. Banks’ service providers are required under the rule to notify any affected bank to or allon behalf of which the service provider provides services "as soon as possible" after determining that it has experienced an incident that materially disrupts or degrades, or is reasonably likely to materially disrupt or degrade, covered services provided to such bank for as much as four hours.
The federal banking agencies have also adopted guidelines for establishing information security standards and cybersecurity programs for implementing safeguards under the supervision of the following matters: (i)board of directors. These guidelines, along with related regulatory materials, increasingly focus on risk management and processes related to information technology and the use of third parties in the provision of financial services. Moreover, recent cyberattacks against banks and other financial institutions that resulted in unauthorized access to confidential customer identification programs; (ii) money laundering; (iii) terrorist financing; (iv) identifyinginformation have prompted the federal banking regulators to issue more extensive guidance on cybersecurity risk management. Among other things, financial institutions are expected to design multiple layers of security controls to establish lines of defense and reporting suspicious activitiesensure that their risk management processes address the risks posed by compromised customer credentials, including security measures to authenticate customers accessing internet-based services. A financial institution also should have a robust business continuity program to recover from a cyberattack and currency transactions; (v) currency crimes; and (vi) cooperation between FDIC-insured institutions and law enforcement authorities.procedures for monitoring the security of third-party service providers that may have access to nonpublic data at the institution.
Concentrations in Commercial Real Estate. Estate. Concentration risk exists when FDIC-insured institutions deploy too many assets to any one industry or segment. A concentration in commercial real estate is one example of regulatory concern. The interagency Concentrations in Commercial Real Estate Lending, Sound Risk Management Practices guidance (“CRE Guidance”) provides supervisory criteria, including the following numerical indicators, to assist bank examiners in identifying banks with potentially significant commercial real estate loan concentrations that may warrant greater supervisory scrutiny: (i) commercial real estate loans exceeding 300% of capital and increasing 50% or more in the preceding three years; or (ii) construction and land development loans exceeding 100% of capital. The CRE Guidance does not limit banks’ levels of commercial real estate lending activities, but rather guides institutions in developing risk management practices and levels of capital that are commensurate with the level and nature of their commercial real estate concentrations. On December 18, 2015, the federal banking agencies issued a statement to reinforce prudent risk-management practices related to CRE lending, having observed substantial growth in many CRE asset and lending markets, increased competitive pressures, rising CRE concentrations in banks, and an easing of CRE underwriting standards. The federal bank agencies reminded FDIC-insured institutions to maintain underwriting discipline and exercise prudent risk-management practices to identify, measure, monitor,
and manage the risks arising from CRE lending. In addition, FDIC-insured institutions must maintain capital commensurate with the level and nature of their CRE concentration risk.
Consumer Financial Services. The historical structure of federal consumer protection regulation applicable to all providers of consumer financial products and services changed significantly on July 21, 2011, when the CFPB commenced operations to supervise and enforce consumer protection laws. The CFPB has broad rulemaking authority for a wide range of consumer protection laws that apply to all providers of consumer products and services, including the Bank, as well as the authority to prohibit “unfair,
“unfair, deceptive or abusive” acts and practices. The CFPB has examination and enforcement authority over providers with more than $10 billion in assets. FDIC-insured institutions with $10 billion or less in assets, like the Bank, continue to be examined by their applicable bank regulators. We do not currently expect
Because abuses in connection with residential mortgages were a significant factor contributing to the CFPB’sfinancial crisis, many new rules issued by the CFPB and required by the Dodd-Frank Act addressed mortgage and mortgage-related products, their underwriting, origination, servicing, and sales. The Dodd-Frank Act significantly expanded underwriting requirements applicable to loans secured by 1-4 family residential real property and augmented federal law combating predatory lending practices. In addition to numerous disclosure requirements, the Dodd‑Frank Act imposed new standards for mortgage loan originations on all lenders, including banks and savings associations, in an effort to strongly encourage lenders to verify a borrower’s ability to repay, while also establishing a presumption of compliance for certain “qualified mortgages.” The Regulatory Relief Act provided relief in connection with mortgages for banks with assets of less than $10 billion, and, as a result, mortgages the Bank makes are now considered to be qualified mortgages if they are held in portfolio for the life of the loan.
Current Expected Credit Loss (“CECL”) Treatment. In June 2016, the FASB issued an accounting standard update, “Financial Instruments-Credit Losses (Topic 326), Measurement of Credit Losses on Financial Instruments,” which replaces the current “incurred loss” model for recognizing credit losses with an “expected loss” model referred to as the CECL model. Under the CECL model, we are required to present certain financial assets carried at amortized cost, such as loans held for investment and held-to-maturity debt securities, at the net amount expected to be collected. The measurement of expected credit losses is based on information about past events, including historical experience, current conditions, and reasonable and supportable forecasts that affect the collectability of the reported amount.
On December 21, 2018, the federal banking agencies issued a joint final rule revising their regulatory capital rules to (i) address the impending implementation of the CECL accounting standard under GAAP; (ii) provide an optional three-year phase-in period for the day-one adverse regulatory capital effects that banking organizations were expected to experience upon enacting CECL; and (iii) require the use of CECL in stress tests beginning with the 2020 capital planning and stress testing cycle for certain banking organizations. The final rule took effect on April 1, 2019; however, on August 26, 2020, the federal bank regulatory agencies issued a final rule allowing institutions that adopted the CECL accounting standard in 2020 the option to mitigate the estimated capital effects of CECL for two years, followed by the three-year transition period already provided by the joint final rule. We elected to use the 2020 Capital Transition Relief as permitted under the applicable regulations. As a result, the three-year phase-out period described above commenced in 2023.
Digital Asset Regulation. The federal banking agencies have issued interpretive guidance and statements regarding the engagement by banking organizations in certain digital asset activities. On August 16, 2022, the Federal Reserve released supervisory guidance encouraging all banking organizations supervised by the agency to notify its lead supervisory point of contact at the Federal Reserve prior to engaging in any digital asset-related activity. Prior to engaging in any such activities, banking organizations are expected to ensure their proposed activities are legally permissible under relevant state and federal laws, and ensure they have implemented adequate systems, risk management, and internal controls to ensure that the activities are conducted in a significant impactsafe and sound manner consistent with applicable laws, including consumer protection laws. On April 7, 2022, the FDIC issued a financial institution letter also requiring its supervised institutions to provide notice and obtain supervisory feedback prior to engaging in any crypto-related activities.
On January 3, 2023, the federal banking agencies issued additional guidance in the form of a joint statement addressing digital asset-related risks to banking organizations. That statement noted the recent volatility and exposure of vulnerabilities in the digital asset sector and indicated that the agencies are continuing to assess whether or how the digital asset-related activities of banking organizations can be conducted in a safe and sound manner and in compliance with all applicable laws and regulations.The statement stressed that each agency has developed, and expects banking organizations to follow, supervisory processes for evaluating proposed and existing digital asset activities.
On February 23, 2023, the federal banking agencies issued a joint statement addressing liquidity risks to banking organizations resulting from crypto-asset market vulnerabilities. The joint statement noted that deposits placed by a crypto-asset-related entity and deposits that constitute stablecoin-related reserves may pose heightened liquidity risks to banking organizations due to the unpredictability of the scale and timing of deposit inflows and outflows. The statement stressed that banking organizations should establish and maintain effective risk management and controls commensurate with the level of liquidity risks from such funding sources. Further, on August 8, 2023, the Corporation’s operations, except for higher compliance costs.Federal Reserve announced the establishment of a Novel Activities Supervision Program, which is designed in part to enhance the Federal Reserve’s supervision processes in respect of banking organizations’ crypto-asset related activities and use of distributed ledger technologies and other novel technologies in the delivery of financial products and services.
Although the federal banking agencies have not developed formal regulations governing the digital asset activities of banking organizations, the supervisory framework summarized above dictates that, in order to effectively identify and manage digital asset-related risks and obtain supervisory non-objection to the proposed engagement in digital asset activities, banking organizations must implement appropriate risk management practices, including with respect to board and management oversight, policies and procedures, risk assessments, internal controls and monitoring.
Item 1A. Risk Factors
An investment in our common stock is subject to risks inherent to our business. Before making an investment decision, you should carefully read and consider the following risks and uncertainties. We may encounter risks in addition to those described below, including risks and uncertainties not currently known to us or those we currently deem to be immaterial. The risks described below, as well as such additional risks and uncertainties, may impair or materially and adversely affect our business, results of operations, and financial condition. The risks are organized in the following categories:
•Credit Risk
•Liquidity and Interest Rate Risk
•Operational Risk
•Strategic and External Risk
•Regulatory, Compliance, Legal, and Reputational Risk
•Risks Related to Investing in Our Common Stock
•General Risk Factors
Credit Risks
If we do not effectively manage our credit risk, we may experience increased levels of delinquencies, non-performing loans, and charge-offs, which would require increases in our provision for loan and leasecredit losses.
There are risks inherent in making any loan or lease, including risks inherent in dealing with individual borrowers, risks of nonpayment, risks resulting from uncertainties as to the future value of collateral and cash flows available to service debt, and risks resulting from changes in economic and market conditions. We cannot assure you that ourOur credit risk approval and monitoring procedures may not have identified or will identify all of these credit risks, and they cannot be expected to completely eliminate our credit risks. If the overall economic climate in the U.S., generally, or in our markets, specifically, deteriorates, or if the financial condition of our borrowers otherwise declines, then our borrowers may experience difficulties in repaying their loans and leases, and the level of non-performing loans and leases, charge-offs, and delinquencies could rise andrise. This would, in turn, require increases in the provision for loan and leasecredit losses, which may adversely affect our business, results of operations, and financial condition.
Our allowance for loan and leasecredit losses may not be adequate to cover actual losses.
We establish our allowance for loan and leasecredit losses (“ACL”) and maintain it at a level considered appropriate by management based on an analysis of our portfolio and market environment. The allowance for loan and lease lossesACL represents our estimate of probable losses inherent in the portfolio at each balance sheet date and is based upon relevant information available to us. The allowance contains provisions for probable losses that have been identified relating to specific relationships, as well as probable losses inherent in our loan and lease portfolio that are not specifically identified. Additions to the allowance for loan and lease losses,ACL, which are charged to earnings through the provision for loan and leasecredit losses, are determined based on a variety of factors, including an analysis of our loan and lease portfolio by segment, historical loss experience, subjective factors, and an evaluation of current economic conditions in our markets. The actual amount of loan and leasecredit losses is affected by changes in economic, operating, and other conditions within our markets, which may be beyond our control, and such losses may exceed current estimates.
At December 31, 2017,2023, our allowance for loan and lease lossesACL as a percentage of total loans and leases was 1.25%1.16% and as a percentage of total non-performing loans and leases was 71.10%160.21%. Although management believes the allowance for loan and lease lossesACL is appropriate, as of such date, we may be required to take additional provisions for losses in the future to further supplement the allowance, either due to management’s decision, based onassessment of credit conditions, or requirements by our banking regulators. In addition, bank regulatory agencies will periodically review our allowance for loan and lease lossesACL and the value attributed to non-performing loans and leases. Such regulatory agencies may require us to adjust our determination of the value for these items. Any significant increases to the allowance for loan and lease lossesACL may materially decrease our net income, which may adversely affect our business, results of operations, and financial condition.
A significant portion of our loan and lease portfolio is comprised of commercial real estate loans, which involve risks specific to real estate values and the real estate markets in general.
At December 31, 20172023 we had $1.0$1.700 billion of commercial real estate loans, which represented 67.7%59.6% of our total loan and lease portfolio. Because paymentsPayments on such loans are often dependent on the successful operation or development of the property or business involved,involved; therefore, repayment of such loans is often more sensitive than other types of loans to adverse conditions
in the real estate market or the general economy, which are outside the borrower’s control. In the event that the cash flow from the property is reduced, the borrower’s ability to repay the loan could be negatively impacted. The deterioration of one or a few of these loans could cause a material increase in our level of non-performing loans, which would result in a loss of revenue from these loans and could result in an increase in the provision for loan and leasecredit losses and an increase in charge-offs, all of which could have a material adverse impact on our net income. Additionally, manyMany of these loans have real estate as a primary or secondary component of collateral. The market value of real estate can fluctuate significantly in a short period of time as a result of economic conditions. Adverse developments affecting real estate values in one or more of our markets could impact the collateral coverage associated with the commercial real estate segment of our portfolio, possibly leading to increased specific reserves or charge-offs, which may adversely affect our business, results of operations, and financial condition.
Commercial real estate markets have been facing downward pressure since 2022 due in large part to increasing interest rates and declining property values. Accordingly, the federal banking agencies have expressed concerns about weaknesses in the current commercial real estate market and have applied increased regulatory scrutiny to institutions with commercial real estate loan portfolios that are fast growing or large relative to the institutions' total capital. To address supervisory expectations with respect to financial institutions’ handling of commercial real estate borrowers who are experiencing financial difficulty, in June of 2023, the federal banking agencies, including the FDIC, issued an interagency policy statement addressing prudent commercial real estate loan accommodations and workouts. Our failure to adequately implement enhanced risk management policies, procedures and controls could adversely affect our ability to increase this portfolio going forward and could result in an increased rate of delinquencies in, and increased losses from, this portfolio.
Because of the risks associated with commercial real estate loans, we closely monitor the concentration of such loans in our portfolio. If we or our regulators determine that this concentration is approaching or exceeds appropriate limits, we may need to reduce or cease the origination of additional commercial real estate loans, which could adversely affect our growth plans and profitability. In addition, weWe may be required to sell existing loans in our portfolio, but there can be no assurances that we would be able to do so at prices that are acceptable to us.
Real estate construction and land development loans are based upon estimates of costs and values associated with the completed project. These estimates may be inaccurate and we may be exposed to significant losses on loans for these projects.
Real estate construction and land development loans, a subset of commercial real estate loans, comprised approximately $165.3$193.1 million, or 11.0%6.8%, of our gross loan and lease portfolio, respectively, as of December 31, 2017.2023. Such lending involves additional risks as these loans are underwritten using the as-completed value of the project, which is uncertain prior to its completion, and costs may exceed realizable values in declining real estate markets. Because of the uncertainties inherent in estimating construction costs and the realizable market value of the completed project, it can be relatively difficult to evaluate accurately the total funds required to complete a project and the related loan-to-value ratio. As a result, construction loans often involve the disbursement of substantial funds with repayment dependent, in part, on the success of the ultimate project and the ability of the borrower to sell or lease the property, rather than the ability of the borrower or guarantor to repay principal and interest. If the appraisal of the completed project’s value proves to be overstated or market values decline, we may have inadequate security for the repayment of the loan upon completion of construction of the project. If we are forced to foreclose on a project prior to or at completion due to a default, we may not be able to recover all of the unpaid balance of, and accrued interest on, the loan and may incur related foreclosure and holding costs. In addition, we may be required to fund additional amounts to complete the project and may have to hold the property for an unspecified period of time while we attempt to dispose of it.
A large portion of our loan and lease portfolio is comprised of commercial loans secured by various business assets, the deterioration in value of which could increase our exposure to future probable losses.
At December 31, 2017,2023, approximately $429.0 million,$1.106 billion, or 28.5%38.8%, of our loan and lease portfolio was comprised of commercial loans to businesses collateralized by general business assets, including accounts receivable, inventory, and equipment. Our commercial loans are typically larger in amount than loans to individual consumers and therefore, have the potential for larger losses on an individual loan basis. Additionally, asset-based borrowerssome of our niche commercial lending clients are usually highly leveraged and/or have inconsistent historical earnings. Significant adverse changes in various industries could cause rapid declines in values and collectability associated with those business assets resulting in inadequate collateral coverage that may expose us to future losses. An increase in specific reserves and charge-offs may adversely affect our business, results of operations, and financial condition.
Non-performing assets take significant time to resolve, adversely affect our results of operations and financial condition and could result in further losses in the future.
At December 31, 2017, our non-performing loans and leases totaled $26.4 million, or 1.76% of our gross loan and lease portfolio and our non-performing assets (which include non-performing loans and foreclosed properties) totaled $27.5 million, or 1.53% of total assets. The aggregate amount of our non-performing loans and non-performing assets have increased from $25.2 million and $26.7 million, respectively, as of December 31, 2016. There can be no assurances that we will not experience further deterioration in our loan portfolio.
Our non-performing assets adversely affect our net income in various ways. We do not record interest income on non-accrual loans or foreclosed properties, thereby adversely affecting our net income and returns on assets and equity, increasing our loan administration costs and adversely affecting our efficiency ratio. When we take collateral in foreclosure and similar proceedings, we are required to mark the collateral to its then net realizable value, less estimated selling costs, which may result in a loss. These non-performing loans and foreclosed properties also increase our risk profile and the capital our regulators believe is appropriate in light of such risks. The resolution of non-performing assets requires significant time commitments from management and can be detrimental to the performance of their other responsibilities. If we experience increases in non-
performing loans and non-performing assets, our net interest income may be negatively impacted and our loan administration costs could increase, each of which may adversely affect our business, results of operations and financial condition.
The FASB issued an accounting standard that may require us to increase our allowance for loan losses and may have a material adverse effect on our financial condition and results of operations.
The FASB has issued a new accounting standard that will be effective for our first fiscal year after December 15, 2019. This standard, referred to as Current Expected Credit Loss (“CECL”), will require financial institutions to determine periodic estimates of lifetime expected credit losses on loans and leases and recognize the expected credit losses as allowances for loan and lease losses. This will change the current method of providing allowances for loan and lease losses that are probable, which may require us to increase our allowance for loan and lease losses, and to greatly increase the types of data we will need to collect and review to determine the appropriate level of the allowance for loan and lease losses. Any increase in our allowance for loan and lease losses or expenses incurred to determine the appropriate level of the allowance for loan and lease losses may have a material adverse effect on our financial condition and results of operations.
Liquidity and Interest Rate Risks
Liquidity risks could affect operations and jeopardize our business, financial condition and results of operations.
Our ability to implement our business strategy will depend on our liquidity and ability to obtain funding for loan originations, working capital and other general purposes. An inability to raise funds through deposits, borrowings, the sale of loans and other sources could have a substantial negative effect on our liquidity. Our preferred source of funds consists of client deposits, which we supplement with other sources, such as wholesale deposits made up of brokered deposits and deposits gathered through internet listing services. Such account and deposit balances can decrease when clients perceive alternative investments as providing a better risk/return profile. If clients move money out of bank deposits and into other investments, we may increase our utilization of wholesale deposits, FHLB advances and other wholesale funding sources necessary to fund desired growth levels. Because these funds generally are more sensitive to interest rate changes than our targeted in-market deposits, they are more likely to move to the highest rate available. In addition, the use of brokered deposits without regulatory approval is limited to banks that are “well capitalized” according to regulation. If the Bank is unable to maintain its capital levels at “well capitalized” minimums, we could lose a significant source of funding, which would force us to utilize different wholesale funding or potentially sell assets at a time when pricing may be unfavorable, increasing our funding costs and reducing our net interest income and net income.
Our access to funding sources in amounts adequate to finance or capitalize our activities or on terms that are acceptable to us could be impaired by factors that affect us directly or the financial services industry or economy in general, such as disruptions in the financial markets or negative views and expectations about the prospects for the financial services industry. Regional and community banks generally have less access to the capital markets than do national and super-regional banks because of their smaller size and limited analyst coverage. During periods of economic turmoil or decline, the financial services industry and the credit markets generally may be materially and adversely affected by declines in asset values and by diminished liquidity. Under such circumstances the liquidity issues are often particularly acute for regional and community banks, as larger financial institutions may curtail their lending to regional and community banks to reduce their exposure to the risks of other banks. Correspondent lenders may also reduce or even eliminate federal funds lines for their correspondent clients in difficult economic times.
As a result, we rely on our ability to generate deposits and effectively manage the repayment and maturity schedules of our loans and investment securities, to ensure that we have adequate liquidity to fund our operations. Any decline in available funding could adversely impact our ability to originate loans, invest in securities, meet our expenses, pay dividends to our shareholders or fulfill obligations such as repaying our borrowings or meeting deposit withdrawal demands, any of which could have a material adverse effect on our business, results of operations and financial condition.
The Corporation is a bank holding company and its sources of funds necessary to meet its obligations are limited.
The Corporation is a bank holding company and its operations are primarily conducted by the Bank, which is subject to significant federal and state regulation. Cash available to pay dividends to our shareholders, pay our obligations and meet our debt service requirements is derived primarily from our existing cash flow sources, our third party line of credit, dividends received from the Bank or a combination thereof. Future dividend payments by the Bank to us will require the generation of future earnings by the Bank and are subject to certain regulatory guidelines. If the Bank is unable to pay dividends to us, we may not have the resources or cash flow to pay or meet all of our obligations.
Interest rate shifts may reduce net interest income and otherwise negatively impact our financial condition and results of operations.
Shifts in short-term interest rates may reduce net interest income, which is the principal component of our earnings. Net interest income is the difference between the amounts received by us on our interest-earning assets and the interest paid by us on our interest-bearing liabilities. In certain scenarios, when interest rates rise, the rate of interest we pay on our liabilities may rise more quickly than the rate of interest that we receive on our interest-bearing assets, which could cause our profits to decrease. However, the structure of our balance sheet and resultant sensitivity to interest rates in various scenarios may change in the future.
Additionally, interest rate increases often result in larger payment requirements for our borrowers, which increases the potential for default. At the same time, the marketability of underlying collateral may be adversely affected by any reduced demand resulting from higher interest rates. In a declining interest rate environment, there may be an increase in prepayments on certain loans as borrowers refinance at lower rates.
Changes in interest rates also can affect the value of loans. An increase in interest rates that adversely affects the ability of borrowers to pay the principal or interest on loans may lead to an increase in nonperforming assets and a reduction of income recognized, which could have a material adverse effect on our results of operations and cash flows. Further, when we place a loan on non-accrual status, we reverse any accrued but unpaid interest receivable, which decreases interest income. Subsequently, we continue to have a cost to fund the loan, which is reflected as interest expense, without any interest income to offset the associated funding expense. Thus, an increase in the amount of non-performing assets would have an adverse impact on net interest income.
Rising interest rates may also result in a decline in value of our fixed-rate debt securities. The unrealized losses resulting from holding these securities would be recognized in other comprehensive income and reduce total stockholders’ equity. If debt securities in an unrealized loss position are sold, such losses become realized and will reduce our regulatory capital ratios.
Operational Risks
We rely on our management and the loss of one or more of those managers may harm our business.
Our success has been and will be greatly influenced by our continuing ability to retain the services of our existing senior management and, if we expand, to attract and retain additional qualified senior and middle management. The unexpected loss of key management personnel or the inability to recruit and retain qualified personnel in the future could have an adverse effect on our business and financial results. In addition, our failure to develop and/or maintain an effective succession plan will impede our ability to quickly and effectively react to unexpected loss of key management and in turn may have an adverse effect on our business, results of operations and financial condition.
We are subject to certain operational risks, including, but not limited to, client or employee fraud and data processing system failures and errors.
Employee errors and employee and client misconduct, including the improper disclosure or use of client information, could subject us to financial losses or regulatory sanctions and seriously harm our reputation. Misconduct by our employees could include hiding unauthorized activities from us, improper or unauthorized activities on behalf of our clients or improper use of confidential information. It is not always possible to prevent employee errors and misconduct, and the precautions we take to prevent and detect this activity may not be effective in all cases. Employee errors or misconduct could also subject us to financial claims for negligence.
We maintain a system of internal controls and insurance coverage to mitigate our operational risks, including data processing system failures and errors and client or employee fraud. If our internal controls fail to prevent or detect an occurrence, or if any resulting loss is not insured or exceeds applicable insurance limits, it could have a material adverse effect on our business, financial condition and results of operations.
Our information systems may experience an interruption or breach in security and cyber-attacks, all of which could have a material adverse effect on our business.
The Corporation relies heavily on internal and outsourced technologies, communications and information systems to conduct its business. Additionally, in the normal course of business, the Corporation collects, processes and retains sensitive and confidential information regarding our clients. As our reliance on technology has increased, so have the potential risks of a technology-related operation interruption (such as disruptions in our client relationship management, general ledger, deposit, loan or other systems) or the occurrence of a cyber-attack (such as unauthorized access to our systems). These risks have increased for all financial institutions as new technologies, the use of the Internet and telecommunications technologies (including mobile devices) to conduct financial and other business transactions have increased, and the sophistication and activities of organized crime, perpetrators of fraud, hackers, terrorists and others have increased. In addition to cyber-attacks or other security breaches involving the theft of sensitive and confidential information, hackers recently have engaged in attacks
against large financial institutions, particularly denial of service attacks, which are designed to disrupt key business services, such as customer-facing web sites. We may not be able to anticipate or implement effective preventive measures against all security breaches of these types, especially because the techniques used change frequently and because attacks can originate from a wide variety of sources. However, applying guidance from the Federal Financial Institutions Examination Council (“FFIEC”), the Corporation has analyzed and will continue to analyze security related to device specific considerations, user access topics, transaction-processing and network integrity.
We rely on our advisors, vendors and employees to comply with our policies and procedures to safeguard confidential data. The failure of these parties to comply with such policies and procedures could result in the loss or wrongful use of our clients’ confidential information or other sensitive information. In addition, even if we and our advisors, vendors and employees comply with our policies and procedures, persons who circumvent security measures could wrongfully use our confidential information or clients’ confidential information or cause interruptions or malfunctions in our operations.
The Corporation also faces risks related to cyber-attacks and other security breaches in connection with credit card and debit card transactions that typically involve the transmission of sensitive information regarding our customers through various third parties, including merchant acquiring banks, payment processors, payment card networks and its processors. Some of these parties have in the past been the target of security breaches and cyber-attacks, and because the transactions involve third parties and environments such as the point of sale that the Corporation does not control or secure, future security breaches or cyber-attacks affecting any of these third parties could impact us through no fault of its own, and in some cases it may have exposure and suffer losses for breaches or attacks relating to them. Further cyber-attacks or other breaches in the future, whether affecting us or others, could intensify consumer concern and regulatory focus and result in reduced use of payment cards and increased costs, all of which could have a material adverse effect on our business. To the extent we are involved in any future cyber-attacks or other breaches, our reputation could be affected, which could also have a material adverse effect on our business, financial condition or results of operations.
We are dependent upon third parties for certain information system, data management and processing services and to provide key components of our business infrastructure, which are subject to operational, security and other risks.
We outsource certain information system, data management and processing functions to third-party providers. These third-party service providers are sources of operational and informational security risk to us, including risks associated with operational errors, information system interruptions or breaches and unauthorized disclosures of sensitive or confidential client or customer information. If third-party service providers encounter any of these issues, or if we have difficulty exchanging information with them, we could be exposed to disruption of operations, loss of service or connectivity to customers, reputational damage and litigation risk that could have a material adverse effect on our business, results of operations and financial condition. We believe there may be an elevated risk of these issues occurring in connection with our recently completed core system conversion, which involved among other things, a change in certain of our third-party providers.
Third-party vendors provide key components of our business infrastructure such as internet connections, network access and core application processing. While we have selected these third-party vendors carefully, we do not control their actions. Any problems caused by these third parties, including as a result of their not providing us their services for any reason or their performing their services poorly, could adversely affect our ability to deliver products and services to our customers and otherwise to conduct our business.
Our business continuity plans could prove to be inadequate, resulting in a material interruption in or disruption to our business and a negative impact on our results of operations.
We rely heavily on communications and information systems to conduct our business and our operations are dependent on our ability to protect our systems against damage from fire, power loss or telecommunication failure. The computer systems and network infrastructure we use could be vulnerable to unforeseen problems. These problems may arise in both our internally developed systems and the systems of our third-party service providers. Any failure or interruption of these systems, whether due to severe weather, natural disasters, acts of war or terrorism, criminal activity or other factors, could result in failures or disruptions in general ledger, deposit, loan, client relationship management and other systems. While we have a business continuity plan and other policies and procedures designed to prevent or limit the effect of a failure, interruption or security breach of our information systems, there can be no assurance that any such failures or interruptions will not occur or, if they do occur, that they will be adequately addressed. The occurrence of any failures or interruptions of our information systems could damage our reputation, result in a loss of clients, subject us to additional regulatory scrutiny or expose us to civil litigation and possible financial liability, any of which could have a material adverse effect on our business, results of operations and financial condition.
Our framework for managing risks may not be effective in mitigating risk and loss to us.
Our risk management framework seeks to mitigate risk and loss to us. We have established processes and procedures intended to identify, measure, monitor, report and analyze the types of risk to which we are subject, including liquidity risk, credit risk, market risk, interest rate risk, operational risk, compensation risk, legal and compliance risk and reputational risk,
among others. However, as with any risk management framework, there are inherent limitations to our risk management strategies as there may exist, or develop in the future, risks that we have not appropriately anticipated or identified. Our ability to successfully identify and manage risks facing us is an important factor that can significantly impact our results. If our risk management framework proves ineffective, we could suffer unexpected losses which could adversely affect our business, results of operations and financial condition.
We are subject to changes in accounting principles, policies or guidelines.
Our financial performance is impacted by accounting principles, policies and guidelines. Some of these policies require the use of estimates and assumptions that may affect the value of our assets or liabilities and financial results. Some of our accounting policies are critical because they require management to make difficult, subjective and complex judgments about matters that are inherently uncertain and because it is likely that materially different amounts would be reported under different conditions or using different assumptions. If such estimates or assumptions underlying our financial statements are incorrect, we may experience material losses.
From time to time, the FASB and SEC change the financial accounting and reporting standards or the interpretation of those standards that govern the preparation of our financial statements. These changes are beyond our control, can be difficult to predict and could materially impact how we report our financial condition and results of operations. Changes in these standards are continuously occurring, and given recent economic conditions, more drastic changes may occur. The implementation of such changes could have a material adverse effect on our business, results of operations and financial condition.
Our internal controls may be ineffective.
Management regularly reviews and updates its internal controls, disclosure controls and procedures, and corporate governance policies and procedures. Any system of controls, however well designed and operated, is based in part on certain assumptions and can provide only reasonable, not absolute, assurances that the objectives of the controls are met. In addition, if we continue to grow the Corporation, our controls will also need to be updated to keep up with such growth. Any failure or circumvention of our controls and procedures or failure to comply with regulations related to controls and procedures could cause us to report a material weakness in internal control over financial reporting and conclude that our controls and procedures are not effective, which could have a material adverse effect on our business, results of operations and financial condition.
Strategic and External Risks
Our business may be adversely affected by conditions in the financial markets and economic conditions generally.
Our operations and profitability are impacted by general business and economic conditions in the U.S. and, to some extent, abroad. These conditions include short-term and long-term interest rates, inflation, money supply, political issues, legislative and regulatory changes, fluctuations in both debt and equity markets, broad trends in industry and finance, the strength of the U.S. economy and uncertainty in financial markets globally, all of which are beyond our control. A deterioration in economic conditions could result in an increase in loan delinquencies and non-performing assets, decreases in loan collateral values and a decrease in demand for our products and services, among other things, any of which could have a material adverse effect on our business, results of operations and financial condition.
Our business is concentrated in and largely dependent upon the continued growth and welfare of the general geographical markets in which we operate.
Our operations are heavily concentrated in the South Central region of Wisconsin and, to a lesser extent, the Southeastern and Northeastern regions of Wisconsin and the greater Kansas City area and, as a result, our financial condition, results of operations and cash flows are significantly impacted by changes in the economic conditions in those areas. Our success depends to a significant extent upon the business activity, population, income levels, deposits and real estate activity in these markets. Although our clients’ business and financial interests may extend well beyond these markets, adverse economic conditions that affect these markets could reduce our growth rate, affect the ability of our clients to repay their loans to us, affect the value of collateral underlying loans and generally affect our financial condition and results of operations. Because of our geographic concentration, we are less able than other regional or national financial institutions to diversify our credit risks across multiple markets.
Our financial condition and results of operations could be negatively affected if we fail to effectively execute our strategic plan or manage the growth called for in our strategic plan.
Our strategic plan currently calls for, among other things, regaining our strong asset quality while we continue to grow loans and generate in-market deposits to maintain our net interest margin and increasing fee income. Our ability to increase profitability in accordance with this plan will depend on a variety of factors, including the identification of desirable business opportunities, competitive responses from financial institutions in our markets and our ability to manage liquidity and funding sources. While we believe we have the management resources and internal systems in place to successfully execute our
strategic plan, we cannot guarantee that opportunities will be available and that the strategic plan will be successful or effectively executed.
Although we do not have any current definitive plans to do so, in implementing our strategic plan we may expand into additional communities or attempt to strengthen our position in our current markets through opportunistic acquisitions of similar or complementary financial services organizations. To the extent that we do so, we may experience higher operating expenses relative to operating income from the new operations or certain one-time expenses associated with the closure of offices, all of which may have an adverse effect on our business, results of operations and financial condition. Other effects of engaging in such strategies may include potential diversion of our management’s time and attention and general disruption to our business.
To the extent that we grow through new locations we cannot ensure that we will be able to adequately and profitably manage this growth. Acquiring other banks and businesses will involve similar risks to those commonly associated with branching, but may also involve additional risks, including potential exposure to unknown or contingent liabilities of banks and businesses we acquire and exposure to potential asset quality issues of the acquired bank or related business.
We could recognize impairment losses on securities held in our securities portfolio, goodwill or other long-lived assets.
As of December 31, 2017, the fair value of our securities portfolio was approximately $163.7 million. Factors beyond our control can significantly influence the fair value of securities in our portfolio and can cause potential adverse changes to the fair value of these securities. For example, fixed-rate securities acquired by us are generally subject to decreases in market value when interest rates rise. Additional factors include, but are not limited to, rating agency downgrades of the securities, defaults by the issuer or individual mortgagors with respect to the underlying securities and instability in the credit markets. Any of the foregoing factors could cause other-than-temporary impairment in future periods and result in realized losses. The process for determining whether impairment is other-than-temporary usually requires difficult, subjective judgments about the future financial performance of the issuer and any collateral underlying the security in order to assess the probability of receiving all contractual principal and interest payments on the security. Because of changing economic and market conditions affecting interest rates, the financial condition of issuers of the securities and the performance of the underlying collateral, we may recognize realized and/or unrealized losses in future periods, which could have an adverse effect on our business, results of operations and financial condition.
As of December 31, 2017, the Corporation had goodwill of $10.7 million recorded in connection with our acquisition of Alterra. Goodwill is not amortized but, instead, is subject to impairment tests on at least an annual basis, and more frequently if an event occurs or circumstances change that would more likely than not reduce the fair value of a reporting unit below its carrying amount. A decline in our stock price, decline in the performance of our acquired operations or the occurrence of another triggering event could, under certain circumstances, result in an impairment charge being recorded. Our most recent impairment test conducted as of November 30, 2017 indicated that the estimated fair value of the reporting unit exceeded the carrying value (including goodwill). Depending on market conditions, economic forecasts, results of operations, additional adverse circumstances specific to FBB-KC or other factors, the goodwill impairment analysis may require additional review of assumptions and outcomes prior to our next annual impairment testing date of July 1, 2018. In the event that we conclude that all or a portion of our goodwill may be impaired, a non-cash charge for the amount of such impairment would be recorded to earnings. Such a charge would have no impact on tangible capital or regulatory capital.
We could be required to establish a deferred tax asset valuation allowance and a corresponding charge against earnings if we experience a decrease in earnings.
Deferred tax assets are reported as assets on our balance sheet and represent the decrease in taxes expected to be paid in the future in connection with our allowance for loan and lease losses and other matters. If it becomes more likely than not that some portion or the entire deferred tax asset will not be realized, a valuation allowance must be recognized. Effective January 1, 2018, the enactment of the Tax Cuts and Jobs Act (the “Act”) reduced the federal corporate income tax rate to 21% from 35%. Despite this reduction to the federal corporate tax rate, the Corporation believes it will fully realize its deferred tax assets and therefore no valuation allowance was necessary as of December 31, 2017. This determination was based on the evaluation of several factors, including our recent earnings history, expected future earnings and appropriate tax planning strategies. A decrease in earnings could adversely impact our ability to fully utilize our deferred tax assets. If we determine that it is more likely than not that some portion or all of the deferred tax assets will not be realized, a valuation allowance will need to be recognized and this would result in a corresponding charge against our earnings.
Competition from other financial institutions could adversely affect our profitability.
We encounter heavy competition in attracting commercial loan, equipment finance and deposit clients as well as trust and investment clients. We believe the principal factors that are used to attract quality clients and distinguish one financial institution from another include value-added relationships, interest rates and rates of return, types of accounts, service fees, flexibility and quality of service.
Our competition includes banks, savings institutions, mortgage banking companies, credit unions, finance companies, equipment finance companies, mutual funds, insurance companies, brokerage firms, investment banking firms and FinTech companies. We also compete with regional and national financial institutions that have a substantial presence in our market areas, many of which have greater liquidity, higher lending limits, greater access to capital, more established market recognition and more resources and collective experience than we do. In addition, some larger financial institutions that have not historically competed with us directly have substantial excess liquidity and have sought, and may continue to seek, smaller lending relationships in our target markets. Furthermore, tax-exempt credit unions operate in most of our market areas and aggressively price their products and services to a large portion of the market. Finally, technology has also lowered the barriers to entry and made it possible for non-banks to offer products and services we have traditionally offered, such as automatic funds transfer and automatic payment systems. Our profitability depends, in part, upon our ability to successfully maintain and increase market share.
Consumers and businesses are increasingly using non-banks to complete their financial transactions, which could adversely affect our business and results of operations.
Technology and other changes are allowing consumers and businesses to complete financial transactions that historically have involved banks through alternative methods. For example, the wide acceptance of Internet-based commerce has resulted in a number of alternative payment processing systems and lending platforms in which banks play only minor roles. Clients can now maintain funds in prepaid debit cards or digital currencies, and pay bills and transfer funds directly without the direct assistance of banks. The diminishing role of banks as financial intermediaries has resulted and could continue to result in the loss of fee income, as well as the loss of customer deposits and the related income generated from those deposits. The loss of these revenue streams and the potential loss of lower cost deposits as a source of funds could have a material adverse effect on our business, financial condition and results of operations.
If we are unable to keep pace with technological advances in our industry, our ability to attract and retain clients could be adversely affected.
The banking industry is constantly subject to technological changes with frequent introductions of new technology-driven products and services. In addition to better serving clients, the effective use of technology increases our efficiency and enables us to reduce costs. Our future success will depend in part on our ability to address the needs of our clients by using technology to provide products and services that will satisfy client demands for convenience as well as create additional efficiencies in our operations. A number of our competitors have substantially greater resources to invest in technological improvements, as well as significant economies of scale. There can be no assurance that we will be able to implement and offer new technology-driven products and services to our clients. If we fail to do so, our ability to attract and retain clients may be adversely affected.
Our trust and investment services operations may be negatively impacted by changes in economic and market conditions.
Our trust and investment services operations may be negatively impacted by changes in general economic conditions and the conditions in the financial and securities markets, including the values of assets held under management. Our management contracts generally provide for fees payable for services based on the market value of assets under management. Because most of our contracts provide for a fee based on market values of securities, declines in securities prices will generally have an adverse effect on our results of operations from this business. Market declines and reductions in the value of our clients’ trust and investment services accounts could result in us losing trust and investment services clients, including those who are also banking clients.
Potential acquisitions may disrupt our business and dilute shareholder value.
While we remain committed to organic growth, we also may consider additional acquisition opportunities involving complementary financial service organizations if the right situation were to arise. Various risks commonly associated with acquisitions include, among other things:
Potential exposure to unknown or contingent liabilities of the target company.
Exposure to potential asset quality issues of the target company.
Potential disruption to our business.
Potential diversion of our management’s time and attention.
Possible loss of key employees and clients of the target company.
Difficulty in estimating the value of the target company.
Potential changes in banking or tax laws or regulations that may affect the target company.
Difficulty in integrating operations, personnel, technologies, services and products of acquired companies.
Acquisitions may involve the payment of a premium over book and market values, and, therefore, some dilution of our tangible book value and net income per common share may occur in connection with any future transaction. Furthermore,
failure to realize the expected revenue increases, cost savings, increases in geographic or product presence, and/or other projected benefits from an acquisition could have a material adverse effect on our business, financial condition and results of operations.
Regulatory, Compliance, Legal and Reputational Risks
We operate in a highly regulated industry and the laws and regulations that govern our operations, corporate governance, executive compensation and accounting principles, or changes in them, or our failure to comply with them, may adversely affect us.
We are subject to extensive regulation and supervision that govern almost all aspects of our operations. These laws and regulations, among other matters, prescribe minimum capital requirements, impose limitations on our business activities and compensation practices, limit the dividends or distributions that we can pay, restrict the ability of institutions to guarantee our debt and impose certain specific accounting requirements that may be more restrictive and may result in greater or earlier charges to earnings or reductions in our capital than generally accepted accounting principles. Compliance with laws and regulations can be difficult and costly and changes to laws and regulations often impose additional compliance costs. Further, our failure to comply with these laws and regulations, even if the failure was inadvertent or reflects a difference in interpretation, could subject us to restrictions on our business activities, fines and other penalties, any of which could adversely affect our business, results of operations and financial condition.
Monetary policies and regulations of the Federal Reserve could adversely affect our business, financial condition and results of operations.
In addition to being affected by general economic conditions, our earnings and growth are affected by the policies of the Federal Reserve. An important function of the Federal Reserve is to regulate the money supply and credit conditions. Among the instruments used by the Federal Reserve to implement these objectives are open market operations in U.S. government securities, adjustments to the discount rate and changes in reserve requirements against bank deposits. These instruments are used in varying combinations to influence overall economic growth and the distribution of credit, bank loans, investments and deposits. Their use also affects interest rates charged on loans or paid on deposits.
The monetary policies and regulations of the Federal Reserve have had a significant effect on the operating results of commercial banks in the past and are expected to continue to do so in the future. The effects of such policies upon our business, financial condition and results of operations cannot be predicted.
The financial services industry, as well as the broader economy, may be subject to new legislation, regulation and government policy.
From time to time, federal and state governments and bank regulatory agencies modify the laws and regulations that govern financial institutions and the financial system generally. Such laws and regulations can affect our operating environment in substantial and unpredictable ways. Among other effects, such laws and regulations can increase or decrease the cost of doing business, limit or expand the scope of permissible activities, or affect the competitive balance among banks and other financial institutions. In addition, any changes in monetary policy, fiscal policy, tax laws, including the Act, and other policies can affect the broader economic environment, interest rates and patterns of trade. Any of these changes could affect our company and the banking industry as a whole in ways that are difficult to predict, and could adversely impact our business, financial condition or results of operations.
We face a risk of noncompliance and enforcement action with the Bank Secrecy Act and other anti-money laundering statutes and regulations.
The Bank Secrecy Act, the USA PATRIOT Act and other laws and regulations require financial institutions, among other duties, to institute and maintain effective anti-money laundering programs and file suspicious activity and currency transaction reports as appropriate. The Financial Crimes Enforcement Network, established by Treasury to administer the Bank Secrecy Act, is authorized to impose significant civil money penalties for violations of those requirements and has recently engaged in coordinated enforcement efforts with the individual federal banking regulators, as well as the U.S. Department of Justice, Drug Enforcement Administration and IRS. There is also increased scrutiny of compliance with the rules enforced by the Financial Crimes Enforcement Network. Federal and state bank regulators also focus on compliance with Bank Secrecy Act and anti-money laundering regulations.
If our policies, procedures and systems are deemed deficient or the policies, procedures and systems of the financial institutions that we have already acquired or may acquire in the future are deficient, we would be subject to liability, including fines and regulatory actions, such as restrictions on our ability to pay dividends and the necessity to obtain regulatory approvals to proceed with certain aspects of our business plan which would adversely affect our business, results of operations and financial condition. Failure to maintain and implement adequate programs to combat money laundering and terrorist financing could also have serious reputational consequences for us.
SBA lending is a significant part of our strategic business plan. The success of our SBA lending program is dependent upon the continued availability of SBA loan programs, our status as a preferred lenderPreferred Lender under the SBA loan programs, our ability to effectively compete and originate new SBA loans, and our ability to comply with applicable SBA lending requirements.
SBA loans, excluding SBA loans made under the Paycheck Protection Program (“PPP Loans”), consisting of both commercial real estate and commercial loans, comprised approximately $53.4 million, or 1.9%, of our gross loan and lease portfolio as of December 31, 2023.
As an SBA Preferred Lender, we enable our clients to obtain SBA loans without being subject to the potentially lengthy SBA approval process necessary for lenders that are not SBA Preferred Lenders. The SBA periodically reviews the lending operations of participating lenders to assess, among other things, whether the lender exhibits prudent risk management. When weaknesses are identified, the SBA may request corrective actions or impose other restrictions, including revocation of the lender’s Preferred Lender status. If we lose our status as a Preferred Lender, we may lose our ability to compete effectively with other SBA Preferred Lenders, and as a result we could experience a material adverse effect to our financial results. Any changes to the SBA program, including changes to the level of guaranty provided by the federal government on SBA loans or changes to the level of funds appropriated by the federal government to the various SBA programs, may also have an adverse effect on our business, results of operations, and financial condition.
Historically we have sold We often choose to sell the guaranteed portions of our SBA 7(a) loans in the secondary market. These sales have resultedresult in our earning premium income and have createdcreate a stream of future servicing income. There can be no assurance that we will be able to continue originating these loans, that a secondary market will exist, or that we will continue to realize premiums upon the sale of the guaranteed portions of these loans. WhenWhether or not we sell the guaranteed portionsportion of ouran SBA 7(a) loans,loan, we retain credit risk on the non-guaranteed portionsportion of the loans.loan. We also have credit risk on the guaranteed portion if a determination is made by the SBA that there is a deficiency in the manner in which the loan was originated, funded, or serviced by the Bank. The total outstanding balance of sold SBA loans as of December 31, 2023 was $84.2 million.
In order for a borrower to be eligible to receive an SBA loan, the lenderit must establishbe established that the borrower would not be able to secure a bank loan without the credit enhancements provided by a guaranty under the SBA program. Accordingly, the SBA loans in our portfolio generally have weaker credit characteristics than the rest of our portfolio and may be at greater risk of default in the event of deterioration in economic conditions or the borrower’s financial condition.default. In the event of a loss resulting from default and a determination by the SBA that there is a deficiency in the manner in which the loan was originated, funded, or serviced by the Corporation,Bank, the SBA may require the CorporationBank to repurchase the previously sold portion of the loan, deny its liability under the guaranty, reduce the amount of the guaranty, or, if it has already paid under the guaranty, seek recovery of the principal loss related to the deficiency from the Corporation.Bank. Management has estimated losses inherent in the outstanding guaranteed portions of SBA loans and recorded an ACL and a SBA recourse reserve at a level determined to be appropriate. Significant increases to the ACL and the recourse reserve may materially decrease our net income, which may adversely affect our business, results of operations, and financial condition.
Non-performing assets take time to resolve, adversely affect our results of operations and financial condition, and could result in losses.
At December 31, 2023, our non-performing loans totaled $20.6 million, or 0.72% of our gross loan and lease portfolio, and our non-performing assets (which include non-performing loans and repossessed assets) totaled $20.8 million, or 0.59% of total assets. Our non-performing assets adversely affect our net income in various ways. We do not record interest income on non-accrual loans, thereby adversely affecting our net income and returns on assets and equity, increasing our loan administration costs, and adversely affecting our efficiency ratio. When we take collateral in repossession and similar proceedings, we are required to mark the collateral to its then net realizable value, less estimated selling costs, which may result in a loss. These non-performing loans and repossessed assets also increase our risk profile and the capital our regulators believe is appropriate in light of such risks. The resolution of non-performing assets requires significant time commitments from management and can be detrimental to the performance of their other responsibilities. If we experience increases in non-performing loans and non-performing assets, our net interest income may be negatively impacted and our loan administration costs could increase, each of which may adversely affect our business, results of operations, and financial condition.
Liquidity and Interest Rate Risks
Liquidity risks could affect operations and jeopardize our business, financial condition, and results of operations.
Our ability to implement our business strategy will depend on our liquidity and ability to obtain funding for loan originations, working capital, and other general purposes. An inability to raise funds through deposits, borrowings, the sale of loans, and other sources could have a substantial negative effect on our liquidity. Our preferred source of funding consists of client deposits, which we supplement with other sources, such as wholesale deposits made up of brokered deposits and deposits gathered through internet listing services. Such account and deposit balances can decrease when clients perceive alternative investments as providing a better risk/return profile. If clients move money out of bank deposits and into other investments, we may increase our utilization of wholesale deposits, FHLB advances, and other wholesale funding sources necessary to fund desired growth levels. In addition, the use of brokered deposits without regulatory approval is limited to banks that are “well capitalized” according to regulation. If the Bank is unable to maintain its capital levels at “well capitalized” minimums, we could lose a significant source of funding, which would force us to utilize different wholesale funding or potentially sell assets at a time when pricing may be unfavorable, increasing our funding costs and reducing our net interest income and net income.
Our access to funding sources could be impaired by factors that affect us directly or the financial services industry or economy in general, such as disruptions in the financial markets, credit quality, capital adequacy, or negative views and expectations about the prospects for the financial services industry. Regional and community banks generally have less access to the capital markets than do national and super-regional banks because of their smaller size and limited analyst coverage. During periods of economic turmoil or decline, the financial services industry and the credit markets generally may be materially and adversely affected by declines in asset values and by diminished liquidity. Under such circumstances, the liquidity issues are often particularly acute for regional and community banks, as larger financial institutions may curtail their lending to regional and community banks to reduce their exposure to the risks of other banks. Correspondent lenders may also reduce or even eliminate federal funds lines for their correspondent clients in difficult economic times.
As a result, we rely on our ability to generate deposits and effectively manage the repayment and maturity schedules of our loans and investment securities to ensure that we have adequate liquidity to fund our operations. Any decline in available funding could adversely impact our ability to originate loans, invest in securities, meet our expenses, pay dividends to our shareholders, or fulfill obligations such as repaying our borrowings or meeting deposit withdrawal demands, any of which could have a material adverse effect on our business, results of operations, and financial condition.
The Corporation is a bank holding company and its sources of funds necessary to meet its obligations are limited.
The Corporation is a bank holding company and its operations are primarily conducted by the Bank, which is subject to significant federal and state regulation. Cash available to pay dividends to our shareholders, pay our obligations, and meet our debt service requirements is derived primarily from our existing cash flow sources, our third party line of credit, dividends received from the Bank, or a combination thereof. Future dividend payments by the Bank will require the generation of future earnings by the Bank and are subject to certain regulatory guidelines. If the Bank is unable to pay dividends, we may not have the resources or cash flow to pay or meet all of our obligations.
Interest rate shifts may reduce net interest income and otherwise negatively impact our financial condition and results of operations.
Shifts in short-term interest rates may reduce net interest income, which is the principal component of our earnings. Net interest income is the difference between the amounts we receive on our interest-bearing assets and the amounts we pay on our interest-bearing liabilities. In certain scenarios, when interest rates rise, the rate of interest we pay on our liabilities may rise more quickly than the rate of interest that we receive on our interest-bearing assets, which could cause our profits to decrease. Similarly, when interest rates fall, the rate of interest we pay on our liabilities may not decrease as quickly as the rate of interest we receive on our interest-bearing assets, which could cause our profits to decrease. The structure of our balance sheet and resultant sensitivity to interest rates in various scenarios may change in the future.
Interest rate increases on variable rate loans often result in larger payment requirements for our borrowers, which increases the potential for default. At the same time, the marketability of underlying collateral may be adversely affected by any reduced demand resulting from higher interest rates. In a declining interest rate environment, there may be an increase in prepayments on certain loans as borrowers refinance at lower rates.
Changes in interest rates also can affect the value of loans. An increase in interest rates that adversely affects the ability of borrowers to pay the principal or interest on loans may lead to an increase in non-performing assets and a reduction of income recognized, which could have an adverse effect on our results of operations and cash flows. Further, when we place a loan on non-accrual status, we reverse any accrued but unpaid interest receivable, which decreases interest income. Subsequently, we continue to have a cost to fund the loan, which is reflected as interest expense, without any interest income to offset the associated funding expense. Thus, an increase in the amount of non-performing assets would have an adverse impact on net interest income.
Rising interest rates may also result in a decline in value of our fixed-rate debt securities. The unrealized losses resulting from holding these securities would be recognized in other comprehensive income and reduce total stockholders’ equity. If debt securities in an unrealized loss position are sold, such losses become realized and will reduce our regulatory capital ratios.
The proportion of the Corporation’s deposit account balances that exceed FDIC insurance limits may expose the Bank to enhanced liquidity risk.
There is growing consensus that the proportion of the deposits that exceeded FDIC insurance limits at Silicon Valley Bank, Signature Bank, and First Republic Bank was a significant factor in the failure of these institutions in the first half of 2023. In response, many large depositors across the industry withdrew deposits in excess of applicable deposit insurance limits and deposited these funds in other financial institutions and low-risk securities accounts in an effort to mitigate the risk of potential further bank failures. While the Bank has not experienced significant withdrawal activity in connection with the recent bank failures, if a significant portion of the Bank’s deposits were to be withdrawn within a short period of time in connection with a similar future crisis, additional sources of funding may be required to meet withdrawal demands. The Corporation may be unable to obtain sufficient funding on favorable terms, which may have an adverse effect on the Corporation’s net interest margin. In addition, funding deposit obligations may be more difficult in a high interest rate environment. Because the Corporation’s available-for-sale investment securities may lose value when interest rates rise, proceeds from the sale of such assets may be diminished during periods of elevated interest rates. Under such circumstances, the Corporation may be required to access funding from sources such as the Federal Reserve Discount Window or other alternative liquidity sources in order to manage our liquidity risk.
Uninsured deposits historically have been viewed by the regulators as less stable than insured deposits. According to statements made by the regulators, clients with larger uninsured deposit account balances often are small- and mid-sized businesses that rely upon deposit funds for payment of operational expenses and, as a result, are more likely to closely monitor the financial condition and performance of their depository institutions. As a result, in the event of financial distress, uninsured depositors historically have been more likely to withdraw their deposits. To that end, the federal banking agencies issued an interagency policy statement in July 2023 to underscore the importance of robust liquidity risk management and contingency funding planning. In the policy statement, the regulators noted that banks should maintain actionable contingency funding plans that take into account a range of possible stress scenarios, assess the stability of their funding and maintain a broad range of funding sources, ensure that collateral is available for borrowing, and review and revise contingency funding plans periodically and more frequently as market conditions and strategic initiatives change.
Operational Risks
Information security risks for financial institutions like us continue to increase in part because of new technologies, the increased use of the internet and telecommunications technologies (including mobile devices and cloud computing) to conduct financial and other business transactions, political activism, and the increased sophistication and activities of organized crime, terrorist, hackers, and perpetrators of fraud. A successful cyber-attack or other breach of our information systems could adversely affect the Corporation’s business, financial condition or results of operations and damage its reputation.
The methods of cyber-attacks change frequently or, in some cases, are not recognized until launch, we are not able to anticipate or implement effective preventive measures against all possible security breaches and the probability of a successful attack cannot be predicted. Although we employ detection and response mechanisms designed to detect and mitigate security incidents, early detection may be thwarted by persistent sophisticated attacks and malware designed to avoid detection. We train employees and our business and consumer clients on fraud risks and mitigation strategies. We face risks related to cyber-attacks and other security breaches that typically involve the transmission of sensitive information regarding our clients and monetary transactions through various third parties. Some of these parties have in the past been the target of security breaches and cyber-attacks. Because the transactions involve third parties and environments that we do not control or secure, future security breaches or cyber-attacks affecting any of these third parties could impact us through no fault of our own, and in some cases, we may suffer losses for breaches or attacks relating to them. We also rely on numerous other third-party service providers to conduct other aspects of our business operations and face similar risks relating to them. While we conduct security assessments on our high risk third party service providers, we cannot be sure that their information security protocols are sufficient to withstand a cyber-attack or other security breach.
The Corporation regularly evaluates its systems and controls and implements upgrades as necessary. The additional cost to the Corporation of our cyber security monitoring and protection systems and controls includes the cost of hardware and software, third party technology providers, consulting and forensic testing firms, and insurance premium costs, in addition to the incremental cost of our personnel who focus a substantial portion of their responsibilities on fraud and cyber security.
Any successful cyber-attack or other security breach involving the misappropriation, loss or other unauthorized disclosure of confidential client information or funds or that compromises our ability to function could erode confidence in the security of our systems, products and services, result in monetary losses, potentially subject us to regulatory investigation with fines and penalties, expose us to litigation and liability, disrupt our operations and have a material adverse effect on our business, financial condition or results of operations and damage our reputation.
We are dependent upon third parties for certain information systems, data management and processing services, and key components of our business infrastructure, which are subject to operational, security, and other risks.
As with many other companies, we outsource certain information systems, data management, and processing functions to third-party providers, including key components of our business infrastructure like internet and network access, and core application processing. While we have selected these third-party vendors carefully, we do not control their actions, nor is any vendor due diligence perfect. These third-party service providers are sources of operational and informational security risk to us, including risks associated with operational errors, information system interruptions or outages, unauthorized access or disclosure of sensitive or confidential information. If our third-party service providers encounter any of these issues, or if we have difficulty exchanging information with or receiving services from them, we could be exposed to disruption of operations, an inability to provide products and services to our clients, a loss of service or connectivity, reputational damage, and litigation risk that could have a material adverse effect on our business, results of operations, and financial condition.
Our business continuity plans could prove to be inadequate, resulting in a material interruption in or disruption to our business and a negative impact on our results of operations.
We rely heavily on communications and information systems to conduct our business and our operations are dependent on our ability to protect our systems against damage from fire, power loss, telecommunication failure, or other emergencies. The computer systems and network infrastructure we use could be vulnerable to unforeseen problems. These problems may arise in both our internally developed systems and the systems of our third-party service providers. Any failure or interruption of these systems could result in failures or disruptions in general ledger, core bank processing systems, client relationship management, and other systems. While we have a business continuity plan and other policies and procedures designed to prevent or limit the impact of a failure, interruption or security breach of our information systems, there can be no assurance that any of those events will not occur or, if they do occur, that they will be adequately remediated. The occurrence of any failure, interruption, or security breach of our information systems could damage our reputation, result in a loss of clients, subject us to additional regulatory scrutiny, or expose us to civil litigation and possible financial liability, any of which could have a material adverse effect on our business, results of operations, and financial condition.
New lines of business, products, and services are essential to our ability to compete but may subject us to additional risks.
Periodically, we implement new lines of business and/or offer new products and services within existing lines of business. There can be substantial risks and uncertainties associated with these efforts, particularly in instances where the markets for such services are still developing or due diligence is not fully vetted. In developing and marketing new lines of business and/or new products or services, we invest significant time and resources. Initial timetables for the introduction and development of new lines of business and/or new products or services may not be achieved, and price and profitability targets may not prove feasible. New technologies needed to support the new line of business or product may result in incremental operating costs and system defects. Compliance with regulations, competitive alternatives, and shifting market preferences, may also impact the successful implementation of a new line of business or a new product or service. In instances of new lines of businesses offering credit services, weaknesses relating to underwriting and operations may impact credit and capital. Delinquency may negatively affect non-performing assets and increase the provision for credit losses.
Any new line of business and/or new product or service could also have a significant impact on the effectiveness of our system of internal controls. Failure to successfully manage these risks in the development and implementation of new lines of business or new products or services could have a material adverse effect on our business, results of operations, and financial condition.
Our framework for managing risks may not be effective in mitigating risk and loss to us.
Our risk management framework seeks to mitigate risk and loss to us. We have established processes and procedures intended to identify, measure, monitor, control, and analyze the types of risk to which we are subject, including liquidity risk, credit risk, market risk, interest rate risk, operational risk, information and cyber security risk, compensation risk, legal and compliance risk, and reputational risk, among others. As with any risk management framework, there are inherent limitations to our risk management strategies as there may exist, or develop in the future, risks that we have not appropriately anticipated or identified. Our ability to successfully identify and manage risks facing us is an important factor that can significantly impact our results. If our risk management framework proves ineffective, we could suffer unexpected losses which could adversely affect our business, results of operations, and financial condition.
We are subject to changes in accounting principles, policies, or guidelines.
Our financial performance is impacted by accounting principles, policies, and guidelines. Some of these policies require the use of estimates and assumptions that may affect the value of our assets or liabilities and financial results. Some of our accounting policies are critical because they require management to make difficult, subjective, and complex judgments about matters that are inherently uncertain and because it is likely that materially different amounts would be reported under different conditions or using different assumptions. If such estimates or assumptions underlying our financial statements are incorrect, we may experience material losses.
From time to time, the FASB and SEC change the financial accounting and reporting standards or the interpretation of those standards that govern the preparation of our financial statements. These changes are beyond our control, can be difficult to predict, and could materially impact how we report our financial condition and results of operations. Changes in these standards are continuously occurring and more changes may occur in the future. The implementation of such changes could have a material adverse effect on our business, results of operations, and financial condition.
Our internal controls may be ineffective.
Management regularly reviews and updates its internal controls, disclosure controls and procedures, and corporate governance policies and procedures. Any system of controls, however well designed and operated, is based in part on certain assumptions and can provide only reasonable, not absolute, assurances that the objectives of the controls are met. In addition, as we continue to grow the Corporation, our controls need to be updated to keep up with such growth. Any failure or circumvention of our controls and procedures or failure to comply with regulations related to controls and procedures could cause us to report a material weakness in internal control over financial reporting and conclude that our controls and procedures are not effective, which could have a material adverse effect on our business, results of operations, and financial condition.
Strategic and External Risks
The Corporation’s business and financial results could be materially and adversely affected by widespread public health events.
The COVID-19 pandemic negatively impacted the global economy, disrupted global supply chains and equity markets and created significant volatility and disruption in financial and labor markets. In addition, the pandemic resulted in temporary closures of many businesses and the institution of social distancing and stay-at-home requirements in many states and communities, including Wisconsin, Kansas, and Missouri. The COVID-19 pandemic, including, in part, supply chain disruption and the effects of the extensive pandemic-related government stimulus, played a significant role in recent inflationary pressure in the U.S. economy.
Future widespread public health epidemics could result in the continued and increased recognition of credit losses in the Corporation’s loan portfolio and increases in the Corporation’s ACL, particularly to the extent that there is a significant negative impact on the global economy. Because of changing economic and market conditions affecting issuers, the Corporation may be required to recognize impairments on the securities it holds. Furthermore, the demand for the Corporation’s products and services may be impacted, which could materially adversely affect the Corporation’s revenue.
We cannot predict how further outbreaks, new variants, the efficacy of vaccines or future widespread public health epidemics, should they occur, might impact our financial condition and results of operation. The extent to which any future pandemic impacts the Corporation’s business, results of operations, and financial condition, as well as the Corporation’s regulatory capital, liquidity ratios, and stock price, will depend on future developments, which are highly uncertain and cannot be predicted, including the scope and duration of the pandemic and any responsive actions taken by governmental authorities and other third parties.
Our business may be adversely affected by conditions in the financial markets and economic conditions generally.
Our operations and profitability are impacted by general business and economic conditions in the U.S. and, to some extent, abroad. These conditions include short-term and long-term interest rates, inflation, money supply, political issues, legislative and regulatory changes, fluctuations in both debt and equity markets, broad trends in industry and finance, the strength of the U.S. economy and uncertainty in financial markets globally, all of which are beyond our control. A deterioration in economic conditions could result in an increase in loan delinquencies and non-performing assets, decreases in loan collateral values, and a decrease in demand for our products and services, among other things, any of which could have a material adverse effect on our business, results of operations, and financial condition.
Our business is concentrated in and largely dependent upon the continued growth and welfare of the general geographical markets in which we operate.
Our operations are heavily concentrated in southern Wisconsin and, to a lesser extent, the Northeast regions of Wisconsin and the greater Kansas City Metro and, as a result, our financial condition, results of operations, and cash flows are significantly impacted by changes in the economic conditions in those areas. Our success depends to a significant extent upon the business activity, population, income levels, deposits, and real estate activity in these markets. Although our clients’ business and financial interests may extend well beyond these markets, adverse economic conditions that affect these markets, including, without limitation, could reduce our growth rate, affect the ability of our clients to repay their loans to us, affect the value of collateral underlying loans, and generally affect our financial condition and results of operations. Because of our geographic concentration, we are less able than other regional or national financial institutions to diversify our credit risks across multiple markets.
Our financial condition and results of operations could be negatively affected if we fail to effectively execute our strategic plan or manage the growth called for in our strategic plan.
While we believe we have the management resources and internal systems in place to successfully execute our strategic plan, we cannot guarantee that opportunities will be available and that the strategic plan will be successful or effectively executed.
Although we do not have any current definitive plans to do so, we may expand into additional communities or attempt to strengthen our position in our current markets through opportunistic acquisitions of similar or complementary financial services organizations. To the extent that we do so, we may experience higher operating expenses relative to operating income from the new operations or certain one-time expenses associated with the closure of offices, all of which may have an adverse effect on our business, results of operations, and financial condition. Other effects of engaging in such strategies may include potential diversion of our management’s time and attention and general disruption to our business. To the extent that we grow through new locations, we cannot ensure that we will be able to adequately and profitably manage this growth. Acquiring other banks and businesses would involve similar risks to those commonly associated with branching, but may also involve additional risks, including potential exposure to unknown or contingent liabilities of banks and businesses we acquire and exposure to potential asset quality issues of the acquired bank or related business.
We could recognize impairment losses on securities held in our securities portfolio, goodwill, or other long-lived assets.
As of December 31, 2023, the fair value of our securities portfolio was approximately $305.3 million. Factors beyond our control can significantly influence the fair value of securities in our portfolio and can cause potential adverse changes to the fair value of these securities. For example, fixed-rate securities acquired by us are generally subject to decreases in market value when interest rates rise. Additional factors include, but are not limited to, rating agency downgrades of the securities, defaults by the issuer or individual mortgagors with respect to the underlying securities, and instability in the credit markets. Any of the foregoing factors could cause credit losses and result in a provision for credit losses. The process for determining whether impairment is other-than-temporary usually requires difficult, subjective judgments about the future financial performance of the issuer and any collateral underlying the security in order to assess the probability of receiving all contractual principal and interest payments on the security. Because of changing economic and market conditions affecting interest rates, the financial condition of issuers of the securities and the performance of the underlying collateral, we may recognize realized and/or unrealized losses in future periods, which could have an adverse effect on our business, results of operations, and financial condition.
As of December 31, 2023, the Corporation had goodwill of $10.7 million. Goodwill is not amortized but, instead, is subject to impairment tests on at least an annual basis, and more frequently if an event occurs or circumstances change that would more likely than not reduce the fair value of a reporting unit below its carrying amount. A decline in our stock price, decline in the performance of our acquired operations, or the occurrence of another triggering event could, under certain circumstances, result in an impairment charge being recorded. During 2023, our annual impairment test conducted July 1, 2023 indicated that the estimated fair value of the reporting unit exceeded the carrying value (including goodwill). Depending on market conditions, economic forecasts, results of operations, additional adverse circumstances or other factors, the goodwill
impairment analysis may require additional review of assumptions and outcomes prior to our next annual impairment testing date of July 1, 2024. In the event that we conclude that all or a portion of our goodwill may be impaired, a non-cash charge for the amount of such impairment would be recorded to earnings. Such a charge would have no impact on tangible capital or regulatory capital.
We could be required to establish a deferred tax asset valuation allowance and a corresponding charge against earnings if we experience a decrease in earnings.
Deferred tax assets are reported as assets on our balance sheet and represent the decrease in taxes expected to be paid in the future in connection with our ACL and other matters. If it becomes more likely than not that some portion or the entire deferred tax asset will not be realized, a valuation allowance must be recognized. As a result of a Wisconsin state tax law change in 2023, the Corporation has recorded a valuation allowance of $2.8 million against related state deferred tax assets. The Corporation believes it will fully realize its Federal and non-Wisconsin deferred tax assets. These determinations were based on the evaluation of several factors, including relevant tax law changes, our recent earnings history, expected future taxable earnings, and appropriate tax planning strategies. A decrease in taxable earnings could adversely impact our ability to fully utilize our remaining deferred tax assets. If we determine that it is more likely than not that some portion or all of the remaining deferred tax assets will not be realized, a valuation allowance will need to be recognized and this would result in a corresponding charge against our earnings.
Competition from other financial services providers could adversely affect our profitability.
We encounter heavy competition in attracting commercial loan, specialty finance, deposit, and private wealth management clients. We believe the principal factors that are used to attract quality clients and distinguish one financial institution from another include value-added relationships, interest rates and rates of return, types of accounts and product offerings, service fees, and quality of service.
Our competition includes banks, savings institutions, mortgage banking companies, credit unions, finance companies, equipment finance companies, mutual funds, insurance companies, brokerage firms, investment banking firms, and financial technology (“FinTech”) companies. We compete with regional and national financial institutions that have a substantial presence in our market areas, many of which have greater liquidity, higher lending limits, greater access to capital, more established market recognition, and more resources and collective experience than we do. Some larger financial institutions that have not historically competed with us directly have substantial excess liquidity and have sought, and may continue to seek, smaller lending relationships in our primary markets. Furthermore, tax-exempt credit unions operate in our market areas and aggressively price their products and services to a large portion of the market. Finally, technology has also lowered the barriers to entry and made it possible for non-bank financial service providers to offer products and services we have traditionally offered, such as automatic funds transfer and automatic payment systems. Our profitability depends, in part, upon our ability to successfully maintain and increase market share.
Consumers and businesses are increasingly using non-banks to complete their financial transactions, which could adversely affect our business and results of operations.
Technology and other changes are allowing consumers and businesses to complete financial transactions that historically have involved financial institutions through alternative methods. The wide acceptance of Internet-based and person-to-person commerce has resulted in a number of alternative payment processing systems and lending platforms in which banks play only minor roles. Businesses and consumers can now maintain funds in social payment applications, prepaid debit cards or digital currencies, and pay bills and transfer funds directly without the direct assistance of financial institutions. The diminishing role of financial institutions as financial intermediaries has resulted, and could continue to result, in the loss of fee income, as well as the loss of client deposits and the related income generated from those deposits. The loss of these revenue streams and the potential loss of lower cost deposits as a source of funds could have a material adverse effect on our business, financial condition, and results of operations.
If we are unable to keep pace with technological advances in our industry, our ability to attract and retain clients could be adversely affected.
The banking industry is constantly subject to technological changes with frequent introductions of new technology-driven products and services. In addition to better serving clients, the effective use of technology increases our efficiency and enables us to reduce costs. Our future success will depend in part on our ability to address the needs of our clients by using technology to provide products and services that will satisfy client demands for convenience as well as create additional efficiencies in our operations. A number of our competitors have substantially greater resources to invest in technological improvements, as well as significant economies of scale. There can be no assurance that we will be able to implement and offer new technology-driven products and services to our clients. If we fail to do so, our ability to attract and retain clients may be adversely affected.
Our private wealth management results of operations may be negatively impacted by changes in economic and market conditions.
Our private wealth management results of operations may be negatively impacted by changes in general economic conditions and the conditions in the financial and securities markets, including the values of assets held under management, which are beyond our control. Our management contracts generally provide for fees payable for services based on the market value of assets under management; therefore, declines in securities prices will generally have an adverse effect on our results of operations from this business. Market declines and reductions in the value of our clients’ private wealth management services accounts could result in us losing private wealth management services clients, including those who are also banking clients, and negatively affect our earnings.
Potential acquisitions may disrupt our business and dilute shareholder value.
While we remain committed to organic growth, we also may consider additional acquisition opportunities involving complementary financial service organizations if the right situation were to arise. Various risks commonly associated with acquisitions include, among other things:
•Potential exposure to unknown or contingent liabilities of the target company.
•Exposure to potential asset quality issues of the target company.
•Potential diversion of our management’s time and attention.
•Possible loss of key employees and clients of the target company.
•Difficulty in estimating the value of the target company.
•Potential changes in banking or tax laws or regulations that may affect the target company.
•Difficulty in integrating operations, personnel, technologies, services, and products of acquired companies.
Acquisitions may involve the payment of a premium over book and market values, and, therefore, some dilution of our tangible book value and net income per common share may occur in connection with any future transaction. Furthermore, failure to realize the expected revenue increases, cost savings, increases in geographic or product presence, and/or other projected benefits from an acquisition could have a material adverse effect on our business, financial condition, and results of operations.
The investments we make in certain tax-advantaged projects may not generate returns as anticipated and may have an adverse impact on the Corporation’s financial results.
We invest in certain tax-advantaged projects promoting community development. Investments in these projects are designed to generate a return primarily through the realization of federal and state income tax credits, and other tax benefits, over specified time periods. The Corporation is subject to the risk that previously recorded tax credits, which remain subject to recapture by taxing authorities based on compliance features required to be met at the project level, will fail to meet certain government compliance requirements and will not be able to be realized. The possible inability to realize these tax credit and other tax benefits could have a negative impact on the Corporation’s financial results. The risk of not being able to realize the tax credits and other tax benefits depends on many factors outside of the Corporation’s control, including changes in the applicable tax code and the ability of the projects to be completed.
A prolonged U.S. government shutdown or default by the U.S. on government obligations would harm our results of operations.
Our results of operations, including revenue, non-interest income, expenses and net interest income, would be adversely affected in the event of widespread financial and business disruption due to a default by the United States on U.S. government obligations or a prolonged failure to maintain significant U.S. government operations. Of particular impact to the Corporation are the operations regulated by the SBA. Any failure to maintain such U.S. government operations, and the after-effects of such shutdown, could impede our ability to originate SBA loans and sell such loans in the secondary market, and would materially adversely affect our business, results of operations, and financial condition.
In addition, many of our investment securities are issued by, and some of our loans are made to, the U.S. government and government agencies and sponsored entities. Uncertain domestic political conditions, including prior federal government shutdowns and potential future federal government shutdowns or other unresolved political issues, may pose credit default and liquidity risks with respect to investments in financial instruments issued or guaranteed by the federal government and loans to the federal government. Any further downgrade in the sovereign credit rating of the United States, as well as sovereign debt issues facing the governments of other countries, could have a material adverse impact on financial markets and economic conditions in the United States and worldwide. Any such adverse impact could have a material adverse effect on our liquidity, financial condition, and results of operations.
Regulatory, Compliance, Legal and Reputational Risks
We operate in multiple states and in a highly regulated industry and the federal and state laws and regulations that govern our operations, corporate governance, executive compensation, and accounting principles. Changes in them or our failure to comply with them, may adversely affect us.
We are subject to extensive regulation and supervision that govern almost all aspects of our operations. These laws and regulations, among other matters, prescribe minimum capital requirements, expose us to legal penalties, financial forfeiture and material loss if we fail to act in accordance with bank laws and regulations, impose limitations on our business activities and compensation practices, limit the dividends or distributions that we can pay, restrict the ability to guarantee our debt, and impose certain specific accounting requirements that may be more restrictive and may result in greater or earlier charges to earnings or reductions in our capital than generally accepted accounting principles. These regulations affect our lending practices, employment practices, compliance management system, operational controls, tax structure, and growth, among other things. Changes to federal and state laws, income and property tax regulations, or regulatory guidance, could affect us in substantial and unpredictable ways. Such changes could subject us to additional costs, tax filing requirements, employment practices, and limit the types of financial services and products we may offer, among other things. Compliance with laws and regulations can be difficult and costly, and changes to laws and regulations often impose additional costs. Further, our failure to comply with these laws and regulations, even if the failure was inadvertent or reflects a difference in interpretation, could subject us to restrictions on our business activities, fines, and other penalties, any of which could adversely affect our business, results of operations, and financial condition.
The financial services industry, as well as the broader economy, may be subject to new legislation, regulation, and government policy.
From time to time, federal and state governments and bank regulatory agencies modify the laws and regulations that govern financial institutions and the financial system generally. These modifications often, but not always, occur in response to crises or significant events, such as the several bank failures in early 2023, the COVID-19 pandemic, or political transitions. Such laws and regulations can affect our operating environment in substantial and unpredictable ways. Among other effects, such laws and regulations can increase or decrease the cost of doing business, limit or expand the scope of permissible activities, or affect the competitive balance among banks and other financial institutions. In addition, any changes in monetary policy, fiscal policy, tax laws, and other policies can affect the broader economic environment, interest rates, and patterns of trade. Any of these changes could affect our company and the banking industry as a whole in ways that are difficult to predict, and could adversely impact our business, financial condition, or results of operations.
We face a risk of noncompliance and enforcement action with the Bank Secrecy Act (“BSA”) and other anti-money laundering (“AML”) statutes and regulations.
AML laws and regulations require financial institutions, among other duties, to institute and maintain effective anti-money laundering programs and file suspicious activity and currency transaction reports as appropriate. The Financial Crimes Enforcement Network (“FinCEN”), established by Treasury to administer the BSA, is authorized to impose significant civil money penalties for violations of those requirements and has recently engaged in coordinated enforcement efforts with the individual federal banking regulators, as well as the U.S. Department of Justice, Drug Enforcement Administration and IRS. There is also increased scrutiny of compliance with the rules enforced by the FinCEN, Federal, and State regulators. Federal and state bank regulators also focus on compliance with AML laws.
If our policies, procedures, and systems are deemed deficient or the policies, procedures, and systems of the financial institutions that we may acquire in the future are deficient, we would be subject to liability, including fines and regulatory actions, such as restrictions on our ability to pay dividends and the necessity to obtain regulatory approvals to proceed with certain aspects of our business plan which would adversely affect our business, results of operations, and financial condition. Failure to maintain and implement adequate programs to combat money laundering and terrorist financing could also have serious reputational consequences for us.
We are periodically subject to examination and scrutiny by a number of banking agencies and, depending upon the findings and determinations of these agencies, we may be required to make adjustments to our business that could adversely affect us.
Federal and state banking agencies periodically conduct examinations of our business, including compliance with applicable laws and regulations. If, as a result of an examination, a federal banking agency was to determine that the financial condition, capital resources, asset quality, asset concentration, earnings prospects, management, liquidity, sensitivity to market risk, or other aspects of any of our operations has become unsatisfactory, or that we or our management is in violation of any law or regulation, it could take a number of different remedial actions as it deems appropriate. These actions include the power to enjoin “unsafe or unsound” practices, to require affirmative actions to correct any conditions resulting from any violation or practice, to issue an administrative order that can be judicially enforced, to direct an increase in our capital, to restrict our growth, to change the asset composition of our portfolio or balance sheet, to assess civil monetary penalties against our officers
or directors, to remove officers and directors and, if it is concluded that such conditions cannot be corrected or there is an imminent risk of loss to depositors, to terminate our deposit insurance. If we become subject to such regulatory actions, our business, results of operations, and financial condition may be adversely affected.
We are subject to claims and litigation pertaining to our fiduciary responsibilities.
Some of the services we provide, such as trust and investmentprivate wealth management services, require us to act as fiduciaries for our clients and others. From time to time, third parties could make claims and take legal action against us pertaining to the performance of our fiduciary responsibilities. If fiduciary investment decisions are not appropriately documented to justify action taken or trades are placed incorrectly, among other possible claims, and if these claims and legal actions are not resolved in a manner favorable to us, we may be exposed to significant financial liability and/or our reputation could be damaged. Either of theseThese results may adversely impact demand for our products and services or otherwise have an adverse effect on our business, results of operations, and financial condition.
Negative publicity could damage our reputation and adversely impact our business and financial results.
Reputation risk, or the risk to our earnings and capital due to negative publicity, is inherent in our business. Negative publicity can result from our actual or alleged conduct in a number of activities, including lending practices, information security, management actions, corporate governance and actions taken by government regulators and community organizations
in response to those activities. Negative publicity can adversely affect our ability to keep and attract clients, and can expose us to litigation and regulatory action, all of which could have a material adverse effect on our business, financial condition and results of operations.
Risks Related to Investing in Our Common Stock
Our stock is thinly traded and our stock price can fluctuate.
Although our common stock is listed for trading on the Nasdaq Global Select Market, low volume of trading activity and volatility in the price of our common stock may make it difficult for our shareholders to sell common stock when desired and at prices they find attractive. Our stock price can fluctuate significantly in response to a variety of factors including, among other things:
•actual or anticipated variations in our quarterly results of operations;
•recommendations by securities analysts;
•operating and stock price performance of other companies that investors deem comparable to us;
•news reports relating to trends, concerns, and other issues in the financial services industry;
•perceptions in the marketplace regarding us or our competitors and other financial services companies;
•new technology used, or services offered, by competitors; and
•changes in government regulations.
General market fluctuations, industry factors, and general economic and political conditions and events, such as economic slowdowns or recessions, interest rate changes, or credit loss trends, could also cause our stock price to decrease regardless of our operating results.
To maintain adequate capital levels, we may be required to raise additional capital in the future, but that capital may not be available when it is needed and/or could be dilutive to our existing shareholders.
We are required by regulatory authorities to maintain adequate levels of capital to support our operations. In order to ensure our ability to support the operations of the Bank, we may need to limit or terminate cash dividends that can be paid to our shareholders. In addition, we may need to raise capital in the future. Our ability to raise capital, if needed, will depend in part on our financial performance and conditions in the capital markets at that time, and accordingly, we cannot guarantee our ability to raise capital on terms acceptable to us. In addition, ifIf we decide to raise equity capital in the future, the interests of our shareholders could be diluted. Any issuance of common stock would dilute the ownership percentage of our current shareholders and any issuance of common stock at prices below tangible book value would dilute the tangible book value of each existing share of our common stock held by our current shareholders. The market price of our common stock could also decrease as a result of the sale of a large number of shares or similar securities, or the perception that such sales could occur. If we cannot raise capital when needed, our ability to serve as a source of strength to the Bank, pay dividends, maintain adequate capital levels and liquidity, or further expand our operations could be materially impaired.
If equity research analysts publish research or reports about our business with unfavorable commentary or downgrade our common stock, the price and trading volume of our common stock could decline.
The trading market for our common stock could be affected by whether equity research analysts publish research or reports about us and our business and what is included in such research or reports. If equity analysts publish research reports about us containing unfavorable commentary, downgrade our stock, or cease publishing reports about our business, the price of our stock could decline. If any analyst electing to cover us downgrades our stock, our stock price could decline rapidly. If any analyst electing to cover us ceases coverage of us, we could lose visibility in the market, which in turn could cause our common stock price or trading volume to decline and our common stock to be less liquid.
Volatility or events impacting a subset of the banking industry, such as larger banks or institutions that serve to specific markets, can impact the entire sector, including the Corporation, which could affect the confidence of our clients and investors and result in a material adverse effect on our performance and a decline in our stock price for reasons outside of our control.
The industry in which we compete is diverse, with participants ranging from community-based banks to global financial institutions with assets in the trillions of dollars. In addition, some financial institutions have exposure of an extremely broad range of risks, or outsized exposure to specific industries such as startup and early-stage, pharmaceutical, or oil & gas companies. When volatility, market events or similar issues affect a subset of financial institutions, or when there are news reports or high-profile incidents relating to trends, concerns, and other issues in the banking industry, the ramifications can affect the sector as a whole, regardless of the effect, or lack thereof, on any specific institution. For example, the recent failures of Silicon Valley Bank, Signature Bank and First Republic Bank, which were caused by specific risk management and industry issues, negatively impacted customer, investor and media perception of the entire sector, resulting in declines in depositor confidence and stock prices throughout the industry. Future events of this nature could result in a material adverse effect on our performance and a decline in our stock priced for reasons that would not otherwise affect the Bank or which are outside of our control.
General Risk Factors
Our ability to attract and retain talented employees is critical to our success.
Our success depends on our ability to continue to recruit and retain talented employees. Competition for such employees is intense, which has led to an increase in compensation throughout the labor market, and accordingly, an increase in payroll costs for employers. Prospective employees are also placing an emphasis on flexible, including remote, work arrangements and other considerations, and such arrangements can provide employees with more employment options and mobility, making them more difficult to retain. If we are unable to meet the expectations of employees and prospective employees, and thus, retain or attract employees, it could have a substantial adverse effect on our business.
We rely on our management and the loss of one or more of those managers may harm our business.
Our success has been and will be greatly influenced by our continuing ability to retain the services of our existing senior management and to attract and retain additional qualified senior and middle management. The unexpected loss of key management personnel or the inability to recruit and retain qualified personnel in the future could have an adverse effect on our business and financial results. In addition, our failure to develop and/or maintain an effective succession plan will impede our ability to quickly and effectively react to unexpected loss of key management, and in turn, may have an adverse effect on our business, results of operations, and financial condition.
Negative publicity could damage our reputation and adversely impact our business and financial results.
Reputation risk, or the risk to our earnings and capital due to negative publicity, is inherent in our business. Negative publicity can result from our actual or alleged conduct in a number of activities, including lending practices, fraud, information security, management actions, corporate governance, and actions taken by government regulators and community organizations in response to those activities. Negative publicity can adversely affect our ability to keep and attract clients, employees, and shareholders and can expose us to litigation and regulatory action, all of which could have a material adverse effect on our business, financial condition, and results of operations.
Item 1B. Unresolved Staff Comments
None.
Item 1C. Cybersecurity
Cybersecurity is an important component of our overall approach to Enterprise Risk Management (“ERM”). Our cybersecurity policies, standards, processes and practices are fully integrated in our ERM program which are based on recognized frameworks established by the National Institute of Standards and Technology, the International Organization for Standardization and other applicable industry standards. We seek to address cybersecurity risks through a comprehensive approach that is focused on preserving the confidentiality, security and availability of the information that we collect and store by identifying, preventing and mitigating cybersecurity threats and effectively responding to cybersecurity incidents when they occur.
Our cybersecurity program is focused on the following key areas:
Governance: The Board of Director’s (the “Board”) oversight of cybersecurity risk management is delegated to the Operational Risk Committee of the Board (the "ORC"), which regularly interacts with our ERM function, the Chief Information Officer ("CIO"), other members of management and relevant management committees. The ORC chair regularly reports material developments on cybersecurity to the Board.
Collaborative Approach: We have implemented a comprehensive approach to identifying, preventing and mitigating cybersecurity threats and incidents, while also implementing controls and procedures that provide for the prompt escalation of
certain cybersecurity incidents so that decisions regarding the public disclosure and reporting of such incidents can be made by management in a timely manner.
Technical Safeguards: We deploy technical safeguards that are designed to continuously protect our information systems from cybersecurity threats, including firewalls, intrusion prevention and detection systems, anti-malware functionality and access controls. These safeguards are evaluated and improved through vulnerability assessments, penetration testing, and cybersecurity threat intelligence.
Incident Response and Recovery Planning: We have established and maintain a comprehensive incident response and recovery plan that fully addresses our response to a potential cybersecurity incident, and such plans are tested and evaluated on a regular basis.
Third-Party Risk Management: We maintain a comprehensive, risk-based approach to identifying and monitoring cybersecurity risks presented by third parties, including vendors, service providers and other external users of our systems, as well as the systems of third parties that could adversely impact our business in the event of a cybersecurity incident affecting those third-party systems. Our third-party risk management program includes robust upfront and ongoing risk assessments for all critical and high-risk vendors.
Education and Awareness: We provide regular, mandatory training for personnel regarding cybersecurity threats as a means to equip our personnel with effective tools to address cybersecurity threats, and to communicate our evolving information security policies, standards, processes and practices. The Board receives periodic education and on a regular basis is informed about industry trends and how the Bank is responding to evolving threats.
We engage an independent third party to conduct periodic testing and assessment of our policies, standards, processes, controls and practices that are designed to address cybersecurity threats and incidents. These efforts include audits, assessments, vulnerability and penetration testing and other exercises focused on evaluating the effectiveness of our cybersecurity measures. We also engage independent third parties to complete periodic testing and assessments of our cybersecurity measures. The results of such assessments are reported to the ORC and the Board and we adjust our policies and practices as necessary based on the information provided by these assessments.
The Board and the ORC oversee our ERM process, including regular presentations and reports. The Board and the ORC also receive prompt and timely information regarding any cybersecurity incident that meets established reporting thresholds. The Board and the ORC coordinate the approach to cybersecurity management with the Chief Risk Officer and the Chief Information Officer, as well as our CFO and CEO.
Our Chief Risk and Chief Information Officers have 30 and 24 years of experience, respectively. Their background is summarized in Item 1, Executive Officers of the Registrant.
To date, we have not been materially affected by cybersecurity threats, including our business strategy, results of operations or financial condition. Please refer to Risk Factors in Item 1A for discussion of possible impacts from future cybersecurity events.
Item 2. Properties
The following table provides certain summary information with respect to the principal properties in which we conduct our operations, all of which were leased, as of December 31, 2017:
| | | | | | | | | | | | | | |
| Location | | Function | | Expiration
Date |
| | | | |
Location | | Function | | Expiration
Date
|
| 401 Charmany Drive, Madison, WI | | Full-service banking location of FBB and office of FBFS | | 2029 |
18500 W. Corporate Drive, Brookfield, WI | | Full-service banking location of FBB - MilwaukeeSouth Central Region and office of FBFS | | 20202028 |
11300 Tomahawk Creek Pkwy,17335 Golf Parkway, Brookfield, WI | | Full-service banking location of FBB - Southeast Region | | 2032 |
| 11141 Overbrook Road, Leawood, KS | | Full-service banking location of FBB - Kansas City Region | | 2033 |
| 3913 West Prospect Avenue, Appleton, WI | | 2023Full-service banking location of FBB - Northeast Region | | 2025 |
To facilitate additional business development opportunities, as of December 31, 2017, the Corporation had loan production offices in Oshkosh, Appleton, Manitowoc and Kenosha, Wisconsin.
For the purpose of generating business development opportunities in asset-based financing,our specialized lending and consulting businesses, as of December 31, 2017,2023, office space was also leased in several states nationwide under shorter-term lease agreements, which generally have terms of one year or less.
Item 3. Legal Proceedings
We believe that no litigation is threatened or pending in which we face potential loss or exposure which could materially affect our consolidated financial position, consolidated results of operations, or consolidated cash flows. Since our subsidiaries act as depositories of funds, lenders, and fiduciaries, they are occasionally named as defendants in lawsuits involving a variety of claims. This and other litigation is ordinary, routine litigation incidental to our business.
Item 4. Mine Safety Disclosures
Not applicable.
PART II.
Item 5. Market for Registrant’s Common Equity, Related StockholderShareholder Matters and Issuer Purchases of Equity Securities
Holders Price Range and Dividends Declared
The common stock of the Corporation is traded on the Nasdaq Global Select Market under the symbol “FBIZ.” As of March 1, 2018,February 15, 2024, there were 389361 registered shareholders of record of the Corporation’s common stock. Certain of the Corporation’s shares are held in “nominee” or “street” name and the number of beneficial owners of such shares as of March 1, 2018 was approximately 1,900.
The following table presents the range of high and low sale prices of our common stock for each quarter within the two most recent fiscal years, according to information provided by Nasdaq, and cash dividends declared in such quarters.
|
| | | | | | | | | | | | |
| | | High | | Low | | Dividend Declared |
| 2017 | | | | | | |
| 4th Quarter | | $ | 24.24 |
| | $ | 20.76 |
| | $ | 0.13 |
|
| 3rd Quarter | | 23.75 |
| | 20.57 |
| | 0.13 |
|
| 2nd Quarter | | 28.43 |
| | 22.49 |
| | 0.13 |
|
| 1st Quarter | | 26.47 |
| | 23.07 |
| | 0.13 |
|
| 2016 | | | | | | |
| 4th Quarter | | 24.14 |
| | 18.76 |
| | 0.12 |
|
| 3rd Quarter | | 24.74 |
| | 20.96 |
| | 0.12 |
|
| 2nd Quarter | | 25.94 |
| | 22.19 |
| | 0.12 |
|
| 1st Quarter | | 24.70 |
| | 20.06 |
| | 0.12 |
|
Dividend Policy
It has been our practice to pay a dividend to common shareholders. Dividends historically have been declared in the month following the end of each calendar quarter. However, the timing and amount of future dividends are at the discretion of the Board of Directors of the Corporation (the “Board”) and will depend upon the consolidated earnings, financial condition, liquidity, and capital requirements of the Corporation and the Bank, the amount of cash dividends paid to the Corporation by the Bank, applicable government regulations and policies, supervisory actions, and other factors considered relevant by the Board. Refer to Item 1 - Business - Supervision and Regulation - Regulation and Supervision of the Bank - Dividend Payments for additional discussion regarding the limitations on dividends and other capital contributions by the Bank to the Corporation. The Board anticipates it will continue to declare dividends as appropriate based on the above factors.
Stock Performance Graph
The chart shown below depicts total return to shareholders during the period beginning December 31, 20122018 and ending December 31, 2017. Total2023. The total return includes appreciation or depreciation in market value of the Corporation’s common stock as well as actual cash and stock dividends paid to common stockholders. Indices shown below, for comparison purposes only, are the Total Return Index for the Nasdaq Composite, which is a broad nationally recognized index of stock performance by publicly traded companies, and the SNL Bank Nasdaq, which is an index that contains securities of Nasdaq-listed companies classified according to the Industry Classification Benchmark as banks. The chart assumes that the value of the investment in FBIZ common stock and each of the three indices was $100 on December 31, 2012,2018 and that all dividends were reinvested in FBIZ common stock.
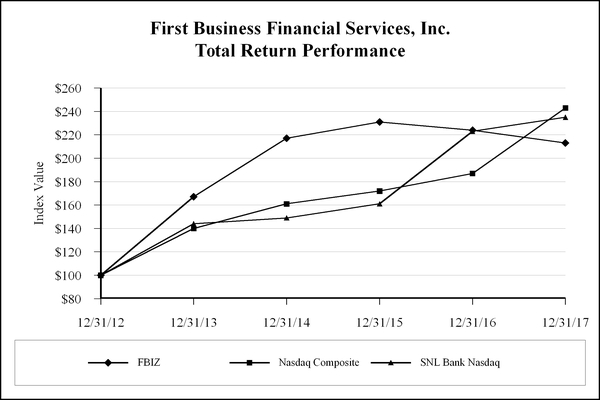

|
| | | | | | | | | | | | | | | | | | | | | | | |
| | As of December 31, |
| Index | 2012 | | 2013 | | 2014 | | 2015 | | 2016 | | 2017 |
| First Business Financial Services, Inc. | $ | 100.00 |
| | $ | 166.98 |
| | $ | 216.75 |
| | $ | 230.68 |
| | $ | 223.68 |
| | $ | 213.36 |
|
| Nasdaq Composite | 100.00 |
| | 140.12 |
| | 160.78 |
| | 171.97 |
| | 187.22 |
| | 242.71 |
|
| SNL Bank Nasdaq | 100.00 |
| | 143.73 |
| | 148.86 |
| | 160.70 |
| | 222.81 |
| | 234.58 |
|
| | | | | | | | | | | | | | | | | | | | | | | | | | | | | | | | | | | | | | |
| | As of December 31, |
| Index | | 2018 | | 2019 | | 2020 | | 2021 | | 2022 | | 2023 |
| First Business Financial Services, Inc. | | $ | 100.00 | | | $ | 138.56 | | | $ | 100.53 | | | $ | 163.69 | | | $ | 209.82 | | | $ | 236.96 | |
| NASDAQ Composite Index | | 100.00 | | 136.69 | | 198.10 | | 242.03 | | 163.28 | | 236.17 |
| KBW NASDAQ Bank Index | | 100.00 | | 136.13 | | 122.09 | | 168.88 | | 132.75 | | 131.57 |
Issuer Purchases of Securities
As previously announced, effective January 27, 2023, the Corporation’s Board of Directors authorized the repurchase by the Corporation of shares of its common stock with a maximum aggregate purchase price of $5.0 million, effective January 31, 2023 through January 31, 2024. As of December 31, 2023, the Corporation had repurchased a total of 65,112 shares for approximately $2.0 million at an average cost of $30.72 per share. At this time, the Corporation does not expect to adopt a new plan upon its expiration to replace the recently expired plan due to strong balance sheet growth.
Under the recently expired share repurchase program, the Corporation was authorized to repurchase shares from time to time in the open market or negotiated transactions at prevailing market rates, or by other means in accordance with federal securities laws.
The following table sets forth information about the Corporation's purchases of its common stock during the three months ended December 31, 2017.2023.
|
| | | | | | | | | | | | | | |
| Period | | Total Number of Shares Purchased(1) | | Average Price Paid Per Share | | Total Number of Shares Purchased as Part of Publicly Announced Plans or Programs | | Approximate Dollar Value of Shares that May Yet Be Purchased Under the Plans or Programs |
| October 1, 2017 - October 31, 2017 | | — |
| | $ | — |
| | — |
| | $ | — |
|
| November 1, 2017 - November 30, 2017 | | 1,024 |
| | 22.42 |
| | — |
| | — |
|
| December 1, 2017 - December 31, 2017 | | — |
| | — |
| | — |
| | — |
|
| Total | | 1,024 |
| | | | — |
| | |
| | | | | | | | | | | | | | | | | | | | | | | | | | |
| Period | | Total Number of Shares Purchased(1) | | Average Price Paid Per Share | | Total Number of Shares Purchased as Part of Publicly Announced Plans or Programs | | Total Number of Shares that May Yet Be Purchased Under the Plans or Programs |
| October 1, 2023 - October 31, 2023 | | — | | | $ | — | | | — | | | |
| November 1, 2023 - November 30, 2023 | | 458 | | | 34.30 | | | — | | | |
| December 1, 2023 - December 31, 2023 | | — | | | — | | | — | | | |
| Total | | 458 | | | | | — | | | 74,813 | |
| |
(1) | The shares in this column represent the shares that were surrendered to us to satisfy income tax withholding obligations in connection with the vesting of restricted shares. |
(1)During the fourth quarter of 2023, the Corporation repurchased an aggregate 458 shares of the Corporation’s common stock in open-market transactions, of which no shares were purchased pursuant to the repurchase program publicly announced on January 27, 2023, and of which 458 shares were surrendered to us to satisfy income tax withholding obligations in connection with the vesting of restricted awards. The Corporation did not repurchase any shares pursuant to the publicly announced program described above during the quarter.
Item 6. Selected Financial Data [Reserved]
Five Year Comparison of Selected Consolidated Financial Data
|
| | | | | | | | | | | | | | | | | | | | |
| | | As of and for the Year Ended December 31, |
| | | 2017 | | 2016 | | 2015 | | 2014 | | 2013 |
| | | (Dollars in Thousands, Except Share and Per Share Data) |
| INCOME STATEMENT: | | | | | | | | | | |
| Interest income | | $ | 75,811 |
| | $ | 78,117 |
| | $ | 72,471 |
| | $ | 57,701 |
| | $ | 53,810 |
|
| Interest expense | | 15,202 |
| | 14,789 |
| | 13,831 |
| | 11,571 |
| | 11,705 |
|
| Net interest income | | 60,609 |
| | 63,328 |
| | 58,640 |
| | 46,130 |
| | 42,105 |
|
| Provision for loan and lease losses | | 6,172 |
| | 7,818 |
| | 3,386 |
| | 1,236 |
| | (959 | ) |
| Non-interest income | | 16,665 |
| | 17,988 |
| | 17,011 |
| | 10,103 |
| | 8,442 |
|
| Non-interest expense | | 56,871 |
| | 56,433 |
| | 47,374 |
| | 33,775 |
| | 30,371 |
|
| Income tax expense | | 2,326 |
| | 2,156 |
| | 8,377 |
| | 7,083 |
| | 7,389 |
|
| Net income | | $ | 11,905 |
| | $ | 14,909 |
| | $ | 16,514 |
| | $ | 14,139 |
| | $ | 13,746 |
|
| Yield on earning assets | | 4.47 | % | | 4.50 | % | | 4.52 | % | | 4.45 | % | | 4.52 | % |
| Cost of funds | | 1.11 | % | | 1.06 | % | | 1.04 | % | | 1.07 | % | | 1.18 | % |
| Interest rate spread | | 3.36 | % | | 3.44 | % | | 3.48 | % | | 3.38 | % | | 3.34 | % |
| Net interest margin | | 3.58 | % | | 3.64 | % | | 3.66 | % | | 3.56 | % | | 3.54 | % |
| Return on average assets | | 0.67 | % | | 0.82 | % | | 0.97 | % | | 1.04 | % | | 1.10 | % |
| Return on average equity | | 7.16 | % | | 9.40 | % | | 11.36 | % | | 11.78 | % | | 13.12 | % |
| ENDING BALANCE SHEET: | | | | | | | | | | |
| Total assets | | $ | 1,794,066 |
| | $ | 1,780,699 |
| | $ | 1,782,081 |
| | $ | 1,628,505 |
| | $ | 1,268,267 |
|
| Securities | | 163,783 |
| | 184,505 |
| | 177,830 |
| | 186,261 |
| | 180,118 |
|
| Loans and leases, net of deferred loan fees | | 1,501,595 |
| | 1,450,675 |
| | 1,430,965 |
| | 1,266,438 |
| | 967,050 |
|
| In-market deposits | | 1,086,346 |
| | 1,122,174 |
| | 1,089,748 |
| | 1,010,928 |
| | 736,323 |
|
| Wholesale deposits | | 307,985 |
| | 416,681 |
| | 487,483 |
| | 427,340 |
| | 393,532 |
|
| FHLB advances and other borrowings | | 207,898 |
| | 59,676 |
| | 34,740 |
| | 33,451 |
| | 11,901 |
|
| Junior subordinated notes | | 10,019 |
| | 10,004 |
| | 9,990 |
| | 9,976 |
| | 9,962 |
|
| Stockholders’ equity | | 169,278 |
| | 161,650 |
| | 150,832 |
| | 137,748 |
| | 109,275 |
|
| FINANCIAL CONDITION ANALYSIS: | | | | | | | | | | |
| Allowance for loan and lease losses to gross loans and leases | | 1.25 | % | | 1.44 | % | | 1.14 | % | | 1.12 | % | | 1.42 | % |
| Allowance to non-accrual loans and leases | | 71.10 | % | | 83.00 | % | | 73.17 | % | | 146.33 | % | | 87.68 | % |
| Net charge-offs to average loans and leases | | 0.57 | % | | 0.22 | % | | 0.10 | % | | 0.08 | % | | 0.06 | % |
| Non-accrual loans to gross loans and leases | | 1.76 | % | | 1.74 | % | | 1.56 | % | | 0.76 | % | | 1.61 | % |
| Average equity to average assets | | 9.35 | % | | 8.75 | % | | 8.54 | % | | 8.80 | % | | 8.39 | % |
| STOCKHOLDERS’ DATA: | | | | | | | | | | |
Basic earnings per common share(1) | | $ | 1.36 |
| | $ | 1.71 |
| | $ | 1.90 |
| | $ | 1.76 |
| | $ | 1.75 |
|
Diluted earnings per common share(1) | | 1.36 |
| | 1.71 |
| | 1.90 |
| | 1.75 |
| | 1.74 |
|
| Book value per share at end of period | | 19.32 |
| | 18.55 |
| | 17.34 |
| | 15.88 |
| | 13.86 |
|
| Tangible book value per share at end of period | | 17.87 |
| | 17.08 |
| | 15.90 |
| | 14.51 |
| | 13.86 |
|
| Dividend declared per share | | 0.52 |
| | 0.48 |
| | 0.44 |
| | 0.42 |
| | 0.28 |
|
| Dividend payout ratio | | 38.12 | % | | 23.93 | % | | 23.93 | % | | 23.93 | % | | 16.05 | % |
| Shares outstanding | | 8,763,539 |
| | 8,715,856 |
| | 8,699,410 |
| | 8,671,854 |
| | 7,833,334 |
|
| |
(1) | Basic and diluted earnings per share reflect earnings per common share as calculated under the two-class method due to the existence of participating securities. All shares and per share amounts have been adjusted to reflect the 2-for-1 stock split in the form of a 100% stock dividend completed in August 2015. |
|
| |
Item 7. | Item 7. Management’s Discussion and Analysis of Financial Condition and Results of Operations |
Forward-Looking Statements
When used in this report the words or phrases “may,” “could,” “should,” “hope,” “might,” “believe,” “expect,” “plan,” “assume,” “intend,” “estimate,” “anticipate,” “project,” “likely,” or similar expressions are intended to identify “forward-looking statements.” Such statements are subject to risks and uncertainties, including among other things:
Competitive pressures among depository and other financial institutions nationally and in our markets.
•Adverse changes in the economy or business conditions, either nationally or in our markets.markets, including, without limitation, inflation, supply chain issues, economic downturn, labor shortages, wage pressures, and the adverse effects of public health events on the global, national, and local economy.
•Competitive pressures among depository and other financial institutions nationally and in our markets.
•Increases in defaults by borrowers and other delinquencies.
•Our ability to manage growth effectively, including the successful expansion of our client support, administrative infrastructure, and internal management systems.
•Fluctuations in interest rates and market prices.
The consequences of continued bank acquisitions and mergers in our markets, resulting in fewer but much larger and financially stronger competitors.
•Changes in legislative or regulatory requirements applicable to us and our subsidiaries.
•Changes in tax requirements, including tax rate changes, new tax laws, and revised tax law interpretations.
•Fraud, including client and system failure or breaches of our network security, including our internet banking activities.
•Failure to comply with the applicable SBA regulations in order to maintain the eligibility of the guaranteed portions of SBA loans.
These risks, together with the risks identified in Item 1A — Risk Factors, could cause actual results to differ materially from what we have anticipated or projected. These risk factors and uncertainties should be carefully considered by our shareholdersstockholders and potential investors. Investors should not place undue reliance on any such forward-looking statements, which speak only as of the date made.
Where any such forward-looking statement includes a statement of the assumptions or bases underlying such forward-looking statement, we caution that, while our management believes such assumptions or bases are reasonable and are made in good faith, assumed facts or bases can vary from actual results, and the differences between assumed facts or bases and actual results can be material, depending on the circumstances. Where, in any forward-looking statement, an expectation or belief is expressed as to future results, such expectation or belief is expressed in good faith and believed to have a reasonable basis, but there can be no assurance that the statement of expectation or belief will be achieved or accomplished.
We do not intend to, and specifically disclaim any obligation to, update any forward-looking statements.
The following discussion and analysis is intended as a review of significant events and factors affecting our financial condition and results of operations for the periods indicated. The discussion should be read in conjunction with the Consolidated Financial Statements and the Notes thereto and the Selected Consolidated Financial Data in this Form 10-K.thereto.
Overview
We are a registered bank holding company incorporated under the laws of the State of Wisconsin and are engaged in the commercial banking business through our wholly-owned banking subsidiary, FBB. All of our operations are conducted through the BankFBB and certain subsidiariesFirst Business Specialty Finance, LLC (“FBSF”), a wholly-owned subsidiary of FBB. We operateFBB operates as a business bank, focusing on delivering a full line of commercial banking products and services tailored to meet the specific needs of small and medium-sized businesses, business owners, executives, professionals, and high net worth individuals. Our products and services includeare focused on business banking, private wealth, and bank consulting. Within business banking, we offer commercial lending, SBAasset-based lending, accounts receivable financing, equipment financing, floorplan financing, vendor financing, Small Business Administration (“SBA”) lending and servicing, asset-based lending, equipment financing, factoring,treasury management solutions, and company retirement services. Our private wealth management services include trust and estate administration, financial planning, investment management, and private banking for executives and owners of our business banking clients and others. Our bank consulting experts provide investment portfolio administrative services, treasuryasset liability management services, and a broad range of deposit products.asset liability management process validation for other financial institutions. We do not utilize a branch network to attract retail clients. Our operating philosophymodel is predicated on deep client relationships, fostered by localfinancial expertise, combined with the efficiency ofand an efficient, centralized administrative functions such as information technology, loan and deposit operations, finance and accounting, credit administration compliance and human resources.function delivering best in class client satisfaction. Our focused model allows experienced staff to provide the level of financial expertise needed to develop and maintain long-term relationships with our clients.
Effective June 1, 2017,Long-Term Strategic Plan
In early 2019, management finalized the development of its five year strategic plan and began the implementation of strategies and initiatives that drive successful execution. Management’s objective over this five year period was to excel by building an expert team with diverse experiences who work together to impact client success more than any other financial partner. To meet this objective, we completed the consolidationidentified four key strategies which are linked to corporate financial goals, all business lines, and centralized administration functions to ensure communication and execution are consistent at all levels of the Corporation’s three bank charters intoCorporation.
These four strategies are described below:
•We will identify, attract, develop, and retain a single charter. In additiondiverse, high performing team to Federal Reserve supervisionpositively impact the overall performance and efficiency of the holding company, whichCorporation.
•We will remain unchanged, prior to consolidationincrease internal efficiencies, deliver a differentiated client experience, and drive client experience utilizing technology where possible.
•We will diversify and grow our deposit base.
•We will optimize our business lines for diversification and performance.
The table below shows the Corporation’s three chartered bank subsidiaries were supervised byperformance for the years ended December 31, 2023, 2022, and 2021 in comparison to the key performance indicators included in the Corporation’s 2019 strategic plan.
| | | | | | | | | | | | | | |
| As of December 31, | |
| Key Performance Indicators | 2021 | 2022 | 2023 | Strategic Plan |
| Return on average equity (“ROAE”) | 16.21% | 16.79% | 13.79% | 13.50% |
| Return on average assets (“ROAA”) | 1.37% | 1.46% | 1.13% | 1.15% |
| Top line revenue growth | 8.4% | 13.4% | 12.6% | ≥ 10% per year |
| In-market deposits to total bank funding | 82.9% | 76.1% | 76.0% | ≥ 75% |
Employee engagement (1) | 87% | 87% | 90% | ≥ 80% |
Client satisfaction (1) | 93% | 95% | 93% | ≥ 90% |
| | | | |
| (1) Anonymous surveys conducted annually | | | | |
Throughout 2023, the last year of the existing plan, management undertook an extensive process to reassess its key strategies and performance indicators to create a totalnew long-term strategic plan. The Corporation intends to disclose information about the key terms of four federal and state banking regulators. Thethe new strategic plan later in 2024 after it is finalized.
Financial Performance Summary
consolidated single charter is now supervised by the FDICResults as of and the WDFI. Beyond streamlining bank regulatory processes and relationships, the charter consolidation was designed to accelerate the Corporation’s ongoing efforts to improve overall operating efficiency. With one bank charter, we expect to eliminate administrative redundancies and increase our flexibility in managing capital, liquidity and funding.
In addition, having already integrated most of FBB-KC’s back office operations into FBFS, during the fourth quarter of 2017, the Corporation converted FBB-KC’s core bank system and centralized this service with FBB’s core bank system and its Wisconsin-based operations.
Operational Summary
Total assets at December 31, 2017 increased $13.4 million, or 0.8%, to $1.794 billion from $1.781 billion at December 31, 2016.
Net income for the year ended December 31, 2017 was $11.9 million compared2023 include:
•Net income available to $14.9 millioncommon shareholders for the year ended December 31, 2016.
Diluted earnings per common share were $1.36 for the year ended December 31, 2017,2023 was $36.2 million, decreasing 10.0% compared to $1.71 in the prior year.
Net interest margin was 3.58% for the year ended December 31, 2017, declining six basis points from 3.64% for the year ended December 31, 2016.
Top line revenue, which consists of net interest income and non-interest income, decreased 5.0% to $77.3 million for the year ended December 31, 2017, compared to $81.3 million for the same period in 2016.
Return on average assets and return on average equity for the year ended December 31, 2017 were 0.67% and 7.16% respectively, compared to 0.82% and 9.40%, respectively, for 2016.
Provision for loan and lease losses was $6.2$40.2 million for the year ended December 31, 2017,2022.
•Diluted earnings per common share were $4.33 for the year ended December 31, 2023, decreasing 8.8% compared to $7.8$4.75 in the prior year.
•Return on average assets (“ROAA”) for the year ended December 31, 2023 was 1.13%, compared to 1.46% for 2022.
•Return on average common equity (“ROACE”), which is defined as net income available to common shareholders divided by average equity reduced by average preferred stock, if any. ROACE was 13.79% for the year ended December 31, 2023, compared to 16.79% for the year ended December 31, 2022.
•Pre-tax, pre-provision (“PTPP”) adjusted earnings, which excludes certain one-time and discrete items, and PTPP ROAA were $56.2 million and 1.75%, respectively, for the year ended December 31, 2023, increasing $8.3 million, or 17.3%, and 1 bp, from year ended December 31, 2022.
•Fees in lieu of interest, defined as prepayment fees, asset-based loan fees, non-accrual interest, and loan fee amortization, totaled $3.2 million for the year ended December 31, 2016.
Loans and leases receivable at2023, decreasing 38.6% compared to $5.3 million for the year ended December 31, 2017 increased $50.9 million, or 3.5%, to $1.502 billion from $1.451 billion as of2022.
•Net interest margin was 3.78% for the year ended December 31, 2016.
Non-performing assets were $27.5 million and 1.53% of total assets as of2023, declining 4 bps from 3.82% for the year ended December 31, 2017,2022. Adjusted net interest margin, which excludes certain one-time and discrete items, was 3.63% for the year ended December 31, 2023 and December 31, 2022.
•Top line revenue, defined as net interest income plus non-interest income, grew 12.6% to $143.9 million for the year ended December 31, 2023, compared to $26.7$127.9 million and 1.50% of total assets as offor the year ended December 31, 2016.
2022.•Effective tax rate was 21.45% for the year ended December 31, 2023 compared to 21.79% for the year ended December 31, 2022.
•Provision for credit losses was $8.2 million for the year ended December 31, 2023, compared to a net provision benefit of $3.9 million for the year ended December 31, 2022. Net charge-offs as a percentage of average loans and leases increased to 0.57%were 0.05% for the year ended December 31, 2017,2023, compared to 0.22%net recoveries of 0.16% for the year ended December 31, 2016.
2022.Trust•Total assets at December 31, 2023 increased $531.2 million, or 17.8%, to $3.508 billion from $2.977 billion at December 31, 2022.
•Period-end gross loans and leases receivable at December 31, 2023 increased $407.2 million, or 16.7%, to $2.850 billion from $2.443 billion as of December 31, 2022. Average gross loans and leases of $2.648 billion increased $342.9 million, or 14.9% for the year ended December 31, 2023, compared to $2.305 billion for the same period in 2022.
•Non-performing assets increased to $20.8 million as of December 31, 2023, compared to $3.8 million as of December 31, 2022. Non-performing assets to total assets increased to 0.59% as of December 31, 2023, from 0.13% as of December 31, 2022.
•The allowance for credit losses as of December 31, 2023 increased $7.0 million, or 29.1%, to $31.3 million, compared to $24.2 million as of December 31, 2022. The allowance for credit losses was 1.16% of total loans as of December 31, 2023, compared to 0.99% as of December 31, 2022.
•Period-end in-market deposits at December 31, 2023 increased $373.1 million, or 19.0%, to $2.339 billion from $1.966 billion as of December 31, 2022. Average in-market deposits of $2.098 billion increased $169.3 million, or 8.8%, for the year ended December 31, 2023, compared to $1.929 billion for the same period in 2022.
•Private wealth and trust assets under management and administration increased by $332.0$461.5 million, or 27.6%17.3%, to $1.536$3.122 billion at December 31, 20172023, compared to $1.204$2.660 billion at December 31, 2016.
Trust and investment2022. Private wealth management service fee incomefees increased by $1.3 million,$544,000, or 24.5%5.00%, to $6.7 million for the year ended December 31, 20172023, compared to$5.4 million for the year ended December 31, 2016.
2022.Average in-market deposits of $1.097 billion, or 70.15% of total bank funding sources, for the year ended December 31, 2017, decreased2.4%, compared to $1.124 billion, or 69.98% of total bank funding sources, for the same period in 2016.
The detailed financial discussion that follows focuses on 20172023 results compared to 2016. Discussion of 2016 results compared2022. Information pertaining to 2015 is predominantly2022 in comparison to 2021 was included in the section captioned “2016 Compared to 2015.Corporation’s Annual Report on Form 10-K for the year ended December 31, 2022 on page 33 under Part II, Item 7, “Management’s Discussion and Analysis of Financial and Results of Operations,” which was filed with the SEC on February 22, 2023.
Results of Operations
Top Line Revenue
Top line revenue, is comprised of net interest income and non-interest income. This measurement is also commonly referred to as operating revenue. In 2017, top line revenue decreased 5.0%income, increased 12.6% for the year ended December 31, 2023 compared to the prior year ended December 31, 2022 primarily due to a reduction$14.2 million, or 14.4%, increase in gains from the sale of the guaranteed portions of SBAnet interest income and a $1.9 million, or 6.4%, increase in non-interest income. The increase in net interest income was driven by an increase in average loans and leases outstanding and related interest income, partially offset by net interest margin compression and a declinedecrease in recurring loan fees collected in lieu of interest. BasedThe increase in non-interest income was primarily due to a $1.8 million increase in other fee income, a $1.2 million increase in swap fee income, a $544,000 increase in trust fee income, and a $353,000 increase in loan fee income. These favorable variances were partially offset by a $733,000 decrease in bank owned life insurance income, a $718,000 decrease in service charge income on management’s second quarter 2016 decision to rebuild the SBA operationsdeposits, and production platforms,a $482,000 decrease in gains on the sale of SBA loans decreased $2.8 million to $1.6 million in 2017, compared to $4.4 million in 2016. Loan fees collected in lieu of interest decreased $2.4 million to $4.4 million in 2017, compared to $6.8 million in 2016.during the year ended December 31, 2023.
These 2017 revenue headwinds were partially offset by record trust and investment services fee income, an increase in loan swap fee income and successful efforts to manage in-market deposit rates and utilize an efficient mix of wholesale funding sources, despite a rising interest rate environment.
The components of top line revenue were as follows for 2017, 2016 and 2015:follows:
| | | | | For the Year Ended December 31, | | Change From Prior Year | | | For the Year Ended December 31, | | Change From Prior Year |
| | | 2017 | | 2016 | | 2015 | | $ Change 2017 | | % Change 2017 | | $ Change 2016 | | % Change 2016 | | | 2023 | | 2022 | | 2021 | | $ Change 2023 | | % Change 2023 | | $ Change 2022 | | % Change 2022 |
| | | (Dollars in Thousands) | | | (Dollars in Thousands) |
| Net interest income | | $ | 60,609 |
| | $ | 63,328 |
| | $ | 58,640 |
| | $ | (2,719 | ) | | (4.3 | )% | | $ | 4,688 |
| | 8.0 | % | Net interest income | | $ | 112,588 | | | $ | | $ | 98,422 | | | $ | | $ | 84,662 | | | $ | | $ | 14,166 | | | 14.4 | | 14.4 | % | | $ | 13,760 | | | 16.3 | | 16.3 | % |
| Non-interest income | | 16,665 |
| | 17,988 |
| | 17,011 |
| | (1,323 | ) | | (7.4 | ) | | 977 |
| | 5.7 |
| Non-interest income | | 31,308 | | | 29,428 | | 29,428 | | | 28,100 | | 28,100 | | | 1,880 | | 1,880 | | | 6.4 | | 6.4 | | | 1,328 | | 1,328 | | | 4.7 | | 4.7 | % |
| Top line revenue | | $ | 77,274 |
| | $ | 81,316 |
| | $ | 75,651 |
| | $ | (4,042 | ) | | (5.0 | ) | | $ | 5,665 |
| | 7.5 |
| Top line revenue | | $ | 143,896 | | | $ | | $ | 127,850 | | | $ | | $ | 112,762 | | | $ | | $ | 16,046 | | | 12.6 | | 12.6 | | | $ | | $ | 15,088 | | | 13.4 | | 13.4 | % |
Return on Average Assets and Return on Average Common Equity
Return on average assets (“ROAA”) ROAA was 0.67%1.13% for the year ended December 31, 20172023, compared to 0.82%1.46% for the year ended December 31, 2016. The decrease in ROAA can be attributed2022 principally due to a decrease$12.1 million increase in earnings as net income decreased 20.1% during the same time period. The reasonsprovision for the decrease in net income are consistent with top line revenue explanations discussed above. In addition, continued investments in technologycredit losses and an $8.6 million increase in collateral liquidation costs in 2017 reduced ROAA compared to 2016,operating expenses, partially offset by a $1.6$14.2 million reductionincrease in provision for loan and leases losses.net interest income. We consider ROAA is a critical metric used by us to measure the profitability of our organization and how efficiently our assets are deployed. ROAA also allows us to better benchmark our profitability to our peers without the need to consider different degrees of leverage which can ultimately influence return on equity measures.
Return on average equity (“ROAE”) ROACE for the year ended December 31, 20172023 was 7.16%13.79% compared to 9.40%16.79% for the year ended December 31, 2016.2022. The primary reasonsreason for the decreasechange in ROAE areROACE is consistent with the net income variance explanationschange in ROAA discussed above. We view ROAEROACE as an important measurement for monitoring profitability and continue to focus on improving our return to our shareholders by enhancing the overall profitability of our client relationships, controlling our expenses, and minimizing our costs of credit.
Efficiency Ratio and Pre-Tax, Pre-Provision Adjusted Earnings
Efficiency ratio measured 60.99% and 62.31% for the years ended December 31, 2023 and 2022, respectively. Efficiency ratio is a non-GAAP measure representing operating expense divided by operating revenue. Operating expense is defined as non-interest expense excluding the effects of the SBA recourse benefit or provision, impairment of tax credit investments, net gains or losses or gains on foreclosed properties,repossessed assets, amortization of other intangible assets, and other discrete items, if any, divided by operatingany. Operating revenue which is equal todefined as net interest income plus non-interest income less realized net gains or losses on securities, if any.any, and other discrete items.
The efficiency ratio deteriorated to 66.48%PTPP adjusted earnings for the year ended December 31, 2017,2023 was $56.2 million, compared to 61.12%$47.9 million for the year ended December 31, 2016. Despite this reported reduction in2022. PTPP adjusted earnings is a non-GAAP measure defined as operating efficiency, we believe we continue to progress towards enhancing our long-term efficiency ratio, building onrevenue less operating expense. In the strategic changes we havejudgment of the Corporation’s management, the adjustments made to datenon-interest expense and laying the foundation to generate sustainable and high-quality revenue growth. After significant investment in 2016 and 2017, we believe we now have a high-quality SBA infrastructure, with the people and processes in place to resume production in the quarters and years ahead as we continue to enhance our SBA sales presence. At the same time, we expect our recently completed charter consolidation and core system conversion to create capacity within our existing workforce to accommodate future growth in a highly efficient manner. Management will continue to take proactive measures to drive positive operating leverage with the objective of moving the efficiency ratio back toward our long-term operating goal of 58-62%.
We believe the efficiency ratio allowsnon-interest income allow investors and analysts to better assess the Corporation’s operating expenses in relation to its top linecore operating revenue by removing the volatility that is associated with certain non-recurringone-time items and other discrete items. The efficiency ratio alsoPTPP adjusted earnings allows management to benchmark performance of our model to our peers without the influence of the loan loss provision and tax considerations, which will ultimately influence other traditional financial measurements, including ROAAROA and ROAE. The information provided below reconciles the efficiency ratio to its most comparable GAAP measure.
Please refer to the Non-Interest Income andNon-Interest Expense section sections below for discussion on the primaryadditional drivers of the year-over-year change in the efficiency ratio.ratio and PTPP adjusted earnings.
| | | | | For the Year Ended December 31, | | Change From Prior Year |
| | | 2017 | | 2016 | | 2015 | | $ Change 2017 | | % Change 2017 | | $ Change 2016 | | % Change 2016 |
| | | (Dollars in Thousands) |
| | For the Year Ended December 31, | | | | For the Year Ended December 31, | | Change From Prior Year |
| | 2023 | | | | 2023 | | 2022 | | 2021 | | $ Change 2023 | | % Change 2023 | | $ Change 2022 | | % Change 2022 |
| | (Dollars in Thousands) | |
| Total non-interest expense | |
| Total non-interest expense | |
| Total non-interest expense | | $ | 56,871 |
| | $ | 56,433 |
| | $ | 47,374 |
| | $ | 438 |
| | 0.8 | % | | $ | 9,059 |
| | 19.1 | % | | $ | 88,575 | | | $ | | $ | 79,474 | | | $ | | $ | 71,535 | | | $ | | $ | 9,101 | | | 11.5 | | 11.5 | % | | $ | 7,939 | | | 11.1 | | 11.1 | % |
| Less: | | | | | | | | | | | | | | |
| Net (gain) loss on foreclosed properties | | (143 | ) | | 122 |
| | (171 | ) | | (265 | ) | | NM |
| | 293 |
| | NM |
|
| Net loss on repossessed assets | |
| Net loss on repossessed assets | |
| Net loss on repossessed assets | |
| Amortization of other intangible assets | | 54 |
| | 62 |
| | 71 |
| | (8 | ) | | (12.9 | ) | | (9 | ) | | (12.7 | )% | Amortization of other intangible assets | | — | | | — | | — | | | 25 | | 25 | | | — | | — | | | NM | | NM | | (25) | | | NM | | NM |
| SBA recourse provision | | 2,240 |
| | 2,068 |
| | — |
| | 172 |
| | NM |
| | 2,068 |
| | NM |
|
| SBA recourse expense (benefit) | |
| Contribution to First Business Charitable Foundation | | Contribution to First Business Charitable Foundation | | — | | | 809 | | | — | | | (809) | | | NM | | 809 | | | NM |
| Impairment of tax credit investments | | 2,784 |
| | 3,691 |
| | — |
| | (907 | ) | | NM |
| | 3,691 |
| | NM |
| Impairment of tax credit investments | | — | | | (351) | | (351) | | | — | | — | | | 351 | | 351 | | | NM | | NM | | (351) | | | NM | | NM |
| Deconversion fees | | 300 |
| | 794 |
| | — |
| | (494 | ) | | NM |
| | 794 |
| | NM |
|
| Total adjusted operating expense | | $ | 51,636 |
| | $ | 49,696 |
| | $ | 47,474 |
| | $ | 1,940 |
| | 3.9 |
| | $ | 2,222 |
| | 4.7 |
|
| | Total operating expense (a) | |
| Total operating expense (a) | |
| Total operating expense (a) | |
| Net interest income | | $ | 60,609 |
| | $ | 63,328 |
| | $ | 58,640 |
| | $ | (2,719 | ) | | (4.3 | ) | | $ | 4,688 |
| | 8.0 |
|
| Total non-interest income | | 16,665 |
| | 17,988 |
| | 17,011 |
| | (1,323 | ) | | (7.4 | ) | | 977 |
| | 5.7 |
|
| Less: | | | | | | | | | | | | | | |
| Net (loss) gain on sale of securities | | (403 | ) | | 10 |
| | — |
| | (413 | ) | | NM |
| | 10 |
| | NM |
|
| Total adjusted operating revenue | | $ | 77,677 |
| | $ | 81,306 |
| | $ | 75,651 |
| | $ | (3,629 | ) | | (4.5 | ) | | $ | 5,655 |
| | 7.5 |
|
| Bank-owned life insurance claim | |
| Bank-owned life insurance claim | |
| Bank-owned life insurance claim | | | — | | | 809 | | | — | | | (809) | | | NM | | 809 | | | NM |
| Net gain (loss) on sale of securities | | Net gain (loss) on sale of securities | | (45) | | | — | | | 29 | | | (45) | | | NM | | (29) | | | NM |
| Adjusted non-interest income | |
| Total operating revenue (b) | |
| Efficiency ratio | | 66.48 | % | | 61.12 | % | | 62.75 | % | |
| |
| | | |
|
| | Pre-tax, pre-provision adjusted earnings (b-a) | |
| | Pre-tax, pre-provision adjusted earnings (b-a) | |
| | Pre-tax, pre-provision adjusted earnings (b-a) | |
| Average total assets | |
| Pre-tax, pre-provision adjusted return on average assets | |
NM = Not meaningful
Net Interest Income
Net interest income levels depend on the amountsamount of and yieldsyield on interest-earning assets as compared to the amountsamount of and ratesrate paid on interest-bearing liabilities. Net interest income is sensitive to changes in market rates of interest and the asset/liability management processes to prepare for and respond to such changes.
The table below shows average balances, interest, average rates, net interest margin and the spread between combined average rates earned on our interest-earning assets and cost of interest-bearing liabilities for the periods indicated. The average balances are derived from average daily balances.
|
| | | | | | | | | | | | | | | | | | | | | | | | | | | | | | | | | |
| | | For the Year Ended December 31, |
| | | 2017 | | 2016 | | 2015 |
| | | Average Balance | | Interest | | Average Yield/ Rate | | Average Balance | | Interest | | Average Yield/ Rate | | Average Balance | | Interest | | Average Yield/ Rate |
| | | (Dollars in Thousands) |
| Interest-earning assets | | | | | | | | | | | | | | | | | | |
Commercial real estate and other mortgage loans(1) | | $ | 961,572 |
| | $ | 43,452 |
| | 4.52 | % | | $ | 938,524 |
| | $ | 43,927 |
| | 4.68 | % | | $ | 848,213 |
| | $ | 40,006 |
| | 4.72 | % |
Commercial and industrial loans(1) | | 447,937 |
| | 26,165 |
| | 5.84 | % | | 465,736 |
| | 28,143 |
| | 6.04 | % | | 445,659 |
| | 26,668 |
| | 5.98 | % |
Direct financing leases(1) | | 28,988 |
| | 1,231 |
| | 4.25 | % | | 30,379 |
| | 1,364 |
| | 4.49 | % | | 30,228 |
| | 1,394 |
| | 4.61 | % |
Consumer and other loans(1) | | 27,612 |
| | 1,112 |
| | 4.03 | % | | 25,615 |
| | 1,193 |
| | 4.66 | % | | 23,996 |
| | 1,067 |
| | 4.45 | % |
Total loans and leases receivable(1) | | 1,466,109 |
| | 71,960 |
| | 4.91 | % | | 1,460,254 |
| | 74,627 |
| | 5.11 | % | | 1,348,096 |
| | 69,135 |
| | 5.13 | % |
Mortgage-related securities(2) | | 138,528 |
| | 2,466 |
| | 1.78 | % | | 147,433 |
| | 2,328 |
| | 1.58 | % | | 153,182 |
| | 2,490 |
| | 1.63 | % |
Other investment securities(3) | | 37,085 |
| | 682 |
| | 1.84 | % | | 32,995 |
| | 517 |
| | 1.57 | % | | 29,686 |
| | 472 |
| | 1.59 | % |
| FHLB and FRB stock | | 4,231 |
| | 103 |
| | 2.43 | % | | 2,537 |
| | 79 |
| | 3.11 | % | | 2,886 |
| | 81 |
| | 2.82 | % |
| Short-term investments | | 49,113 |
| | 600 |
| | 1.22 | % | | 94,548 |
| | 566 |
| | 0.60 | % | | 69,264 |
| | 293 |
| | 0.42 | % |
| Total interest-earning assets | | 1,695,066 |
| | 75,811 |
| | 4.47 | % | | 1,737,767 |
| | 78,117 |
| | 4.50 | % | | 1,603,114 |
| | 72,471 |
| | 4.52 | % |
| Non-interest-earning assets | | 84,829 |
| | | | | | 73,905 |
| | | | | | 97,932 |
| | | | |
| Total assets | | $ | 1,779,895 |
| | | | | | $ | 1,811,672 |
| | | | | | $ | 1,701,046 |
| | | | |
| Interest-bearing liabilities | | | | | | | | | | | | | | | | | | |
| Transaction accounts | | $ | 226,540 |
| | 1,335 |
| | 0.59 | % | | $ | 169,571 |
| | 456 |
| | 0.27 | % | | $ | 125,558 |
| | 297 |
| | 0.24 | % |
| Money market | | 583,241 |
| | 2,746 |
| | 0.47 | % | | 642,784 |
| | 3,112 |
| | 0.48 | % | | 602,842 |
| | 3,331 |
| | 0.55 | % |
| Certificates of deposit | | 56,667 |
| | 569 |
| | 1.00 | % | | 65,608 |
| | 592 |
| | 0.90 | % | | 106,177 |
| | 825 |
| | 0.78 | % |
| Wholesale deposits | | 361,712 |
| | 6,155 |
| | 1.70 | % | | 467,826 |
| | 7,556 |
| | 1.62 | % | | 450,460 |
| | 6,424 |
| | 1.43 | % |
| Total interest-bearing deposits | | 1,228,160 |
| | 10,805 |
| | 0.88 | % | | 1,345,789 |
| | 11,716 |
| | 0.87 | % | | 1,285,037 |
| | 10,877 |
| | 0.85 | % |
| FHLB advances | | 105,276 |
| | 1,472 |
| | 1.40 | % | | 14,485 |
| | 140 |
| | 0.97 | % | | 14,779 |
| | 110 |
| | 0.75 | % |
| Other borrowings | | 24,796 |
| | 1,813 |
| | 7.31 | % | | 26,463 |
| | 1,818 |
| | 6.87 | % | | 24,944 |
| | 1,732 |
| | 6.94 | % |
| Junior subordinated notes | | 10,011 |
| | 1,112 |
| | 11.11 | % | | 9,997 |
| | 1,115 |
| | 11.15 | % | | 9,982 |
| | 1,112 |
| | 11.14 | % |
| Total interest-bearing liabilities | | 1,368,243 |
| | 15,202 |
| | 1.11 | % | | 1,396,734 |
| | 14,789 |
| | 1.06 | % | | 1,334,742 |
| | 13,831 |
| | 1.04 | % |
| Non-interest-bearing demand deposit accounts | | 230,907 |
| | | | | | 246,182 |
| | | | | | 211,945 |
| | | | |
| Other non-interest-bearing liabilities | | 14,375 |
| | | | | | 10,210 |
| | | | | | 9,049 |
| | | | |
| Total liabilities | | 1,613,525 |
| | | | | | 1,653,126 |
| | | | | | 1,555,736 |
| | | | |
| Stockholders’ equity | | 166,370 |
| | | | | | 158,546 |
| | | | | | 145,310 |
| | | | |
| Total liabilities and stockholders’ equity | | $ | 1,779,895 |
| | | | | | $ | 1,811,672 |
| | | | | | $ | 1,701,046 |
| | | | |
| Net interest income | | | | $ | 60,609 |
| | | | | | $ | 63,328 |
| | | | | | $ | 58,640 |
| | |
| Net interest spread | | | | | | 3.36 | % | | | | | | 3.44 | % | | | | | | 3.48 | % |
| Net interest-earning assets | | $ | 326,823 |
| | | | | | $ | 341,033 |
| | | | | | $ | 268,372 |
| | | | |
| Net interest margin | | | | | | 3.58 | % | | | | | | 3.64 | % | | | | | | 3.66 | % |
| Average interest-earning assets to average interest-bearing liabilities | | 123.89 | % | | | | | | 124.42 | % | | | | | | 120.11 | % | | | | |
| Return on average assets | | 0.67 | % | | | | | | 0.82 | % | | | | | | 0.97 | % | | | | |
| Return on average equity | | 7.16 | % | | | | | | 9.40 | % | | | | | | 11.36 | % | | | | |
| Average equity to average assets | | 9.35 | % | | | | | | 8.75 | % | | | | | | 8.54 | % | | | | |
| Non-interest expense to average assets | | 3.20 | % | | | | | | 3.11 | % | | | | | | 2.78 | % | | | | |
| |
(1) | The average balances of loans and leases include non-performing loans and leases and loans held for sale. Interest income related to non-performing loans and leases is recognized when collected. Interest income includes net loan fees collected in lieu of interest. |
| |
(2) | Includes amortized cost basis of assets available-for-sale and held-to-maturity. |
| |
(3) | Yields on tax-exempt municipal obligations are not presented on a tax-equivalent basis in this table. |
| | | | | | | | | | | | | | | | | | | | | | | | | | | | | | | | | | | | | | | | | | | | | | | | | | | | | | | | |
| | | For the Year Ended December 31, |
| | | 2023 | | 2022 | | 2021 |
| | | Average
Balance | | Interest | | Average
Yield/
Rate | | Average
Balance | | Interest | | Average
Yield/
Rate | | Average
Balance | | Interest | | Average
Yield/
Rate |
| | | (Dollars in Thousands) |
| Interest-earning assets | | | | | | | | | | | | | | | | | | |
Commercial real estate and other mortgage loans(1) | | $ | 1,586,967 | | | $ | 98,370 | | | 6.20 | % | | $ | 1,484,239 | | | $ | 66,917 | | | 4.51 | % | | $ | 1,387,434 | | | $ | 51,930 | | | 3.74 | % |
Commercial and industrial loans(1) | | 1,013,866 | | | 81,963 | | | 8.08 | % | | 771,056 | | | 46,575 | | | 6.04 | % | | 747,514 | | | 38,342 | | | 5.13 | % |
Consumer and other loans(1) | | 47,018 | | | 2,316 | | | 4.93 | % | | 49,695 | | | 1,876 | | | 3.78 | % | | 44,206 | | | 1,572 | | | 3.56 | % |
Total loans and leases receivable(1) | | 2,647,851 | | | 182,649 | | | 6.90 | % | | 2,304,990 | | | 115,368 | | | 5.01 | % | | 2,179,154 | | | 91,844 | | | 4.21 | % |
Mortgage-related securities(2) | | 200,383 | | | 6,433 | | | 3.21 | % | | 173,495 | | | 3,486 | | | 2.01 | % | | 159,242 | | | 2,633 | | | 1.65 | % |
Other investment securities(3) | | 62,921 | | | 1,770 | | | 2.81 | % | | 51,700 | | | 986 | | | 1.91 | % | | 44,739 | | | 777 | | | 1.74 | % |
| FHLB stock | | 15,162 | | | 1,231 | | | 8.12 | % | | 16,462 | | | 989 | | | 6.01 | % | | 13,066 | | | 651 | | | 4.98 | % |
| Short-term investments | | 54,311 | | | 2,845 | | | 5.24 | % | | 30,845 | | | 542 | | | 1.76 | % | | 64,308 | | | 90 | | | 0.14 | % |
| Total interest-earning assets | | 2,980,628 | | | 194,928 | | | 6.54 | % | | 2,577,492 | | | 121,371 | | | 4.71 | % | | 2,460,509 | | | 95,995 | | | 3.90 | % |
| Non-interest-earning assets | | 231,521 | | | | | | | 175,424 | | | | | | | 144,499 | | | | | |
| Total assets | | $ | 3,212,149 | | | | | | | $ | 2,752,916 | | | | | | | $ | 2,605,008 | | | | | |
| Interest-bearing liabilities | | | | | | | | | | | | | | | | | | |
| Transaction accounts | | $ | 689,500 | | | 23,727 | | | 3.44 | % | | $ | 503,668 | | | 3,963 | | | 0.79 | % | | $ | 506,693 | | | 988 | | | 0.19 | % |
| Money market accounts | | 681,336 | | | 22,129 | | | 3.25 | % | | 761,469 | | | 6,241 | | | 0.82 | % | | 693,608 | | | 1,183 | | | 0.17 | % |
| Certificates of deposit | | 273,387 | | | 11,209 | | | 4.10 | % | | 97,448 | | | 1,358 | | | 1.39 | % | | 47,020 | | | 396 | | | 0.84 | % |
| Wholesale deposits | | 346,285 | | | 14,353 | | | 4.14 | % | | 48,825 | | | 1,616 | | | 3.31 | % | | 119,831 | | | 986 | | | 0.82 | % |
| Total interest-bearing deposits | | 1,990,508 | | | 71,418 | | | 3.59 | % | | 1,411,410 | | | 13,178 | | | 0.93 | % | | 1,367,152 | | | 3,553 | | | 0.26 | % |
| FHLB advances | | 351,990 | | | 8,881 | | | 2.52 | % | | 414,191 | | | 7,024 | | | 1.70 | % | | 376,781 | | | 4,908 | | | 1.30 | % |
| Other borrowings | | 38,891 | | | 2,041 | | | 5.25 | % | | 43,818 | | | 2,243 | | | 5.12 | % | | 31,935 | | | 1,759 | | | 5.51 | % |
Junior subordinated notes (4) | | — | | | — | | | — | % | | 2,429 | | | 504 | | | 20.75 | % | | 10,068 | | | 1,113 | | | 11.05 | % |
| Total interest-bearing liabilities | | 2,381,389 | | | 82,340 | | | 3.46 | % | | 1,871,848 | | | 22,949 | | | 1.23 | % | | 1,785,936 | | | 11,333 | | | 0.63 | % |
| Non-interest-bearing demand deposit accounts | | 453,930 | | | | | | | 566,230 | | | | | | | 536,981 | | | | | |
| Other non-interest-bearing liabilities | | 102,668 | | | | | | | 65,611 | | | | | | | 61,580 | | | | | |
| Total liabilities | | 2,937,987 | | | | | | | 2,503,689 | | | | | | | 2,384,497 | | | | | |
| Stockholders’ equity | | 274,162 | | | | | | | 249,227 | | | | | | | 220,511 | | | | | |
| Total liabilities and stockholders’ equity | | $ | 3,212,149 | | | | | | | $ | 2,752,916 | | | | | | | $ | 2,605,008 | | | | | |
| Net interest income | | | | $ | 112,588 | | | | | | | $ | 98,422 | | | | | | | $ | 84,662 | | | |
| Net interest spread | | | | | | 3.08 | % | | | | | | 3.48 | % | | | | | | 3.27 | % |
| Net interest-earning assets | | $ | 599,239 | | | | | | | $ | 705,644 | | | | | | | $ | 674,573 | | | | | |
| Net interest margin | | | | | | 3.78 | % | | | | | | 3.82 | % | | | | | | 3.44 | % |
| Average interest-earning assets to average interest-bearing liabilities | | 125.16 | % | | | | | | 137.70 | % | | | | | | 137.77 | % | | | | |
| Return on average assets | | 1.13 | % | | | | | | 1.46 | % | | | | | | 1.37 | % | | | | |
| Return on average equity | | 13.79 | % | | | | | | 16.79 | % | | | | | | 16.21 | % | | | | |
| Average equity to average assets | | 8.54 | % | | | | | | 9.05 | % | | | | | | 8.46 | % | | | | |
| Non-interest expense to average assets | | 2.76 | % | | | | | | 2.89 | % | | | | | | 2.75 | % | | | | |
| | | | | | | | | | | | | | | | | | |
(1)The average balances of loans and leases include non-accrual loans and leases and loans held for sale. Interest income related to non-accrual loans and leases is recognized when collected. Interest income includes net loan fees in lieu of interest.
(2)Includes amortized cost basis of assets available-for-sale and held-to-maturity.
(3)Yields on tax-exempt municipal securities are not presented on a tax-equivalent basis in this table.
(4)Weighted average rate of junior subordinated notes and debentures reflects the accelerated amortization of subordinated debt issuance costs as a result of the early redemption of the junior subordinated notes during the first quarter of 2022.
The following table provides information with respect to: (1) the change in net interest income attributable to changes in rate (changes in rate multiplied by prior volume); and (2) the change in net interest income attributable to changes in volume (changes in volume multiplied by prior rate) for the year ended December 31, 20172023 compared to the year ended December 31, 2016 and for the year ended December 31, 2016 compared to the year ended December 31, 2015.2022. The change in net interest income attributable to changes in rate and volume (changes in rate multiplied by changes in volume) has been allocated to the rate and volume changes in proportion to the relationship of the absolute dollar amounts of the change in each.
Rate/Volume Analysis
| | | | | | | | | | | | | | | | | | | | | | | | | | | | | | | | | | | | | | |
| | | Increase (Decrease) for the Year Ended December 31, |
| | | 2023 Compared to 2022 | | 2022 Compared to 2021 |
| | | Rate | | Volume | | Net | | Rate | | Volume | | Net |
| | | (In Thousands) |
| Interest-earning assets | | | | | | | | | | | | |
Commercial real estate and other mortgage loans(1) | | $ | 26,551 | | | $ | 4,902 | | | $ | 31,453 | | | $ | 11,176 | | | $ | 3,811 | | | $ | 14,987 | |
Commercial and industrial loans(1) | | 18,329 | | | 17,059 | | | 35,388 | | | 6,993 | | | 1,240 | | | 8,233 | |
Consumer and other loans(1) | | 546 | | | (106) | | | 440 | | | 101 | | | 203 | | | 304 | |
Total loans and leases receivable(1) | | 45,426 | | | 21,855 | | | 67,281 | | | 18,270 | | | 5,254 | | | 23,524 | |
Mortgage-related securities(2) | | 2,341 | | | 606 | | | 2,947 | | | 602 | | | 251 | | | 853 | |
| Other investment securities | | 538 | | | 246 | | | 784 | | | 81 | | | 128 | | | 209 | |
| FHLB Stock | | 325 | | | (83) | | | 242 | | | 149 | | | 189 | | | 338 | |
| Short-term investments | | 1,664 | | | 639 | | | 2,303 | | | 522 | | | (70) | | | 452 | |
| Total net change in income on interest-earning assets | | 50,294 | | | 23,263 | | | 73,557 | | | 19,625 | | | 5,752 | | | 25,376 | |
| Interest-bearing liabilities | | | | | | | | | | | | |
| Transaction accounts | | 17,816 | | | 1,948 | | | 19,764 | | | 2,981 | | | (6) | | | 2,975 | |
| Money market | | 16,612 | | | (724) | | | 15,888 | | | 4,931 | | | 127 | | | 5,058 | |
| Certificates of deposit | | 5,105 | | | 4,746 | | | 9,851 | | | 364 | | | 598 | | | 962 | |
| Wholesale deposits | | 507 | | | 12,230 | | | 12,737 | | | 1,503 | | | (873) | | | 630 | |
| Total deposits | | 40,040 | | | 18,200 | | | 58,240 | | | 9,779 | | | (154) | | | 9,625 | |
| FHLB advances | | 3,033 | | | (1,176) | | | 1,857 | | | 1,593 | | | 523 | | | 2,116 | |
| Other borrowings | | 56 | | | (258) | | | (202) | | | (131) | | | 615 | | | 484 | |
| Junior subordinated notes | | — | | | (504) | | | (504) | | | 579 | | | (1,188) | | | (609) | |
| Total net change in expense on interest-bearing liabilities | | 43,129 | | | 16,262 | | | 59,391 | | | 11,820 | | | (204) | | | 11,616 | |
| Net change in net interest income | | $ | 7,165 | | | $ | 7,001 | | | $ | 14,166 | | | $ | 7,805 | | | $ | 5,956 | | | $ | 13,760 | |
(1)The average balances of loans and leases include non-accrual loans and leases and loans held for sale. Interest income related to non-accrual loans and leases is recognized when collected. Interest income includes net loan fees collected in lieu of interest.
(2)Includes amortized cost basis of assets available-for-sale and held-to-maturity.
The change in yield of the respective interest-earning asset or the rate paid on interest-bearing liability compared to the change in short-term market rates is commonly referred to as a beta. The table below displays the beta calculations for loans and leases, total interest earning assets, in-market deposits, interest-bearing deposits and total interest-bearing liabilities for the year ended December 31, 2023 and 2022. Additionally, adjusted total loans and leases and total interest-earning assets excludes the volatile impact of fees in lieu of interest.
|
| | | | | | | | | | | | | | | | | | | | | | | | |
| | | Increase (Decrease) for the Year Ended December 31, |
| | | 2017 Compared to 2016 | | 2016 Compared to 2015 |
| | | Rate | | Volume | | Net | | Rate | | Volume | | Net |
| | | (In Thousands) |
| Interest-earning assets | | | | | | | | | | | | |
Commercial real estate and other mortgage loans(1) | | $ | (1,538 | ) | | $ | 1,063 |
| | $ | (475 | ) | | $ | (308 | ) | | $ | 4,228 |
| | $ | 3,920 |
|
Commercial and industrial loans(1) | | (922 | ) | | (1,056 | ) | | (1,978 | ) | | 264 |
| | 1,211 |
| | 1,475 |
|
Direct financing leases(1) | | (72 | ) | | (61 | ) | | (133 | ) | | (36 | ) | | 7 |
| | (29 | ) |
Consumer and other loans(1) | | (169 | ) | | 88 |
| | (81 | ) | | 52 |
| | 74 |
| | 126 |
|
Total loans and leases receivable(1) | | (2,701 | ) | | 34 |
| | (2,667 | ) | | (28 | ) |
| 5,520 |
|
| 5,492 |
|
Mortgage-related securities(2) | | 284 |
| | (146 | ) | | 138 |
| | (70 | ) | | (91 | ) | | (161 | ) |
| Other investment securities | | 96 |
| | 69 |
| | 165 |
| | (8 | ) | | 52 |
| | 44 |
|
| FHLB and FRB Stock | | (20 | ) | | 44 |
| | 24 |
| | 8 |
| | (11 | ) | | (3 | ) |
| Short-term investments | | 395 |
| | (361 | ) | | 34 |
| | 145 |
| | 129 |
| | 274 |
|
| Total net change in income on interest-earning assets | | (1,946 | ) | | (360 | ) | | (2,306 | ) | | 47 |
|
| 5,599 |
|
| 5,646 |
|
| Interest-bearing liabilities | | | | | | | | | | | | |
| Transaction accounts | | 686 |
| | 193 |
| | 879 |
| | 44 |
| | 114 |
| | 158 |
|
| Money market | | (84 | ) | | (282 | ) | | (366 | ) | | (430 | ) | | 212 |
| | (218 | ) |
| Certificates of deposit | | 63 |
| | (86 | ) | | (23 | ) | | 117 |
| | (351 | ) | | (234 | ) |
| Wholesale deposits | | 387 |
| | (1,788 | ) | | (1,401 | ) | | 878 |
| | 255 |
| | 1,133 |
|
| Total deposits | | 1,052 |
| | (1,963 | ) | | (911 | ) | | 609 |
|
| 230 |
|
| 839 |
|
| FHLB advances | | 89 |
| | 1,243 |
| | 1,332 |
| | 32 |
| | (2 | ) | | 30 |
|
| Other borrowings | | 113 |
| | (118 | ) | | (5 | ) | | (19 | ) | | 105 |
| | 86 |
|
| Junior subordinated notes | | (5 | ) | | 2 |
| | (3 | ) | | 1 |
| | 2 |
| | 3 |
|
| Total net change in expense on interest-bearing liabilities | | 1,249 |
| | (836 | ) | | 413 |
| | 624 |
|
| 334 |
|
| 958 |
|
| Net change in net interest income | | $ | (3,195 | ) | | $ | 476 |
| | $ | (2,719 | ) | | $ | (577 | ) |
| $ | 5,265 |
|
| $ | 4,688 |
|
| |
(1) | The average balances of loans and leases include non-performing loans and leases and loans held for sale. Interest income related to non-performing loans and leases is recognized when collected. Interest income includes net loan fees collected in lieu of interest. |
| |
(2) | Includes amortized cost basis of assets available-for-sale and held-to-maturity. |
| | | | | | | | | | | | | | | | | | | | | | | | | | | | | |
| For the Year Ended December 31, | | | | |
| 2023 | | 2022 | | 2021 | | 2023 Compared to 2022 | | 2022 Compared to 2021 |
| Average Yield/Rate (3) | | Increase (Decrease) |
Total loans and leases receivable (a) | 6.90 | % | | 5.01 | % | | 4.21 | % | | 1.89 | % | | 0.80 | % |
Total interest-earning assets(b) | 6.54 | % | | 4.71 | % | | 3.90 | % | | 1.83 | % | | 0.81 | % |
Adjusted total loans and leases receivable (1)(c) | 6.78 | % | | 4.78 | % | | 3.91 | % | | 2.00 | % | | 0.87 | % |
Adjusted total interest-earning assets (1)(d) | 6.43 | % | | 4.50 | % | | 3.61 | % | | 1.93 | % | | 0.89 | % |
Total in-market deposits(e) | 2.72 | % | | 0.60 | % | | 0.14 | % | | 2.12 | % | | 0.46 | % |
Total bank funding(f) | 2.87 | % | | 0.84 | % | | 0.37 | % | | 2.03 | % | | 0.47 | % |
Net interest margin(g) | 3.78 | % | | 3.82 | % | | 3.44 | % | | (0.04) | % | | 0.38 | % |
Adjusted net interest margin(h) | 3.63 | % | | 3.63 | % | | 3.21 | % | | — | % | | 0.42 | % |
| | | | | | | | | |
Effective fed funds rate (2)(i) | 5.02 | % | | 1.69 | % | | 0.08 | % | | 3.33 | % | | 1.61 | % |
| | | | | | | | | |
| Beta Calculations: | | | | | | | | | |
Total loans and leases receivable(a)/(i) | | | | | | | 56.76 | % | | 49.69 | % |
Total interest-earning assets(b)/(i) | | | | | | | 54.98 | % | | 50.31 | % |
Adjusted total loans and leases receivable (1)(c)/(i) | | | | | | | 60.06 | % | | 54.04 | % |
Adjusted total interest-earning assets (1)(d)/(i) | | | | | | | 57.87 | % | | 55.28 | % |
Total in-market deposits(e)/(i) | | | | | | | 63.66 | % | | 28.57 | % |
Total bank funding(f)/(i) | | | | | | | 60.96 | % | | 29.19 | % |
Net interest margin(g)/(i) | | | | | | | (1.20) | % | | 23.60 | % |
Adjusted net interest margin(h)/(i) | | | | | | | — | % | | 26.09 | % |
(1)Excluding average net PPP loans, PPP loan interest income, and fees in lieu of interest.
(2)Board of Governors of the Federal Reserve System (US), Effective Federal Funds Rates [DFF]. retrieved from FRED, Federal Reserve Bank of St. Louis.
(3)Represents annualized yields/rates.
Net interest income decreasedincreased by $2.7$14.2 million, or 4.3%14.4%, for the year ended December 31, 20172023, compared to the year ended December 31, 2022. The increase was principally due to an increase in average loans and leases outstanding, partially offset by net interest margin compression and a decrease in fees in lieu of interest. Average gross loans and leases of $2.648 billion increased by $342.9 million, or 14.9% for the year ended December 31, 2023, compared to $2.305 billion for the same period in 2016. The decrease in net interest income was primarily attributable to a $2.4 million decrease in recurring loan2022. Loan fees collected in lieu of interest combined with a shift indecreased 38.6% to $3.2 million, compared to $5.3 million during the mixsame period of loan originations toward lower-yielding conventional commercial loans. This decrease in interest income was partially muted by successful efforts to manage in-market deposit rates and reinvestment of certain investment security cash flows amid a rising interest rate environment.comparison.
The yield on average earning assets for the year ended December 31, 20172023 was 4.47%6.54%, an increase of 183 basis points compared to 4.50%4.71% for the year ended December 31, 2016. The decrease in the yield on average earning assets2022. This increase was principally due to a decreasethe rising interest rates on variable-rate loans and investment in recurring loan fees collected in lieu of interest.securities at higher interest rates. Excluding the impact of recurring loan fees in lieu of interest in both 20172023 and 2016,2022, the yield on average earning assets for the year ended December 31, 20172023 was 4.21%6.43%, an increase of 193 basis points compared to 4.10%4.50% for the year ended December 31, 2016. This increase in yield is principally due to a reduction in lower yielding short-term investments, as average cash held at the Federal Reserve decreased $46.3 million, combined with an increase in investment security yields and the increase in rates on certain variable-rate loans following the Federal Open Market Committee’s (“FOMC”) increases in the targeted federal funds rate since December 2016.2022.
The yield on average loans and leases receivable for the year ended December 31, 2017 was 4.91% compared to 5.11% for the year ended December 31, 2016. The decrease in yield was principally due to a decrease in recurring loan fees collected in lieu of interest. Excluding the impact of loan fees in lieu of interest in both 2017 and 2016, the yield on average loans and leases receivable for the year ended December 31, 2017 was 4.61% compared to 4.64% for the year ended December 31, 2016.
While the yield on average variable rate loans and leases receivable benefited from the FOMC’s decision to raise the federal funds target rate 75 basis points in 2017, a significant portion of our loan and lease portfolio is comprised of fixed rate loans with terms generally from three to five years. As these loans reach their maturity they are renewed at current market rates and subject to competitive pricing pressures. As a result, the average yield on the loan and lease portfolio for the full year 2017, excluding purchase accounting adjustments and elevated recurring loan fees, continued to decline in comparison to full year 2016 results. We believe our ability to improve the average yield of the loan and lease portfolio may partially be dependent on the steepness of the yield curve, as well as our ability to successfully limit the price sensitivity of our existing and prospective client base by continuing to focus on adding value and fostering relationships.
The average rate paid on interest-bearing liabilities was 1.11%3.46% for the year ended December 31, 2017,2023, an increase of five223 basis points from 1.06%1.23% for the year ended December 31, 2016. We were successful in limiting the increase in2022. The average rate paid during 2017, despite a rising rate environment,increased as the weighted average rate paid on interest-bearing liabilities continued to benefit from a relatively stable level of low cost in-market interest-bearing deposits. In addition, the increase in the average rate paid was tempered due to a favorable change in ourCorporation increased deposit rates and secured wholesale funding, mix as maturing fixed ratewhich consists of wholesale deposits were replaced with more efficient and cost effective fixed rate FHLB advances. Consistent with our longstanding funding strategy to use the most efficient and cost effective source of wholesale funds, management will continue to replace maturing wholesale deposits with fixed rate FHLB advances, at various maturity terms commensurate with the Bank’s funding needs. Average FHLB advanceselevated fixed rates.
Net interest margin decreased four basis points to 3.78% for the year ended December 31, 2017 increased $90.8 million2023, compared to $105.3 million at an average rate paid of 1.40%. As of December 31, 2017, the weighted average original maturity of our FHLB term advances was 3.7 years.
Despite an uncertain rate environment, management expects to effectively manage the Corporation’s liability structure in both term and rate to deliver a stable net interest margin within our target range. Further, we expect to attract new in-market deposit relationships in our Wisconsin and Kansas-based markets which we believe will contribute to our ability to maintain an appropriate cost of funds. Average in-market deposits - comprised of all transaction accounts, money market accounts and non-wholesale deposits - decreased 2.4% to $1.097 billion3.82% for the year ended December 31, 2017 from $1.124 billion2022. Adjusted net interest margin measured 3.63% for the yearyears ended December 31, 2016.2023 and December 31, 2022. Adjusted net interest margin is a non-GAAP measure representing net interest income excluding the fees in lieu of interest and other recurring, but volatile, components of net interest margin divided by average interest-earning assets less other recurring, but volatile, components of average interest-earning assets.
Management believes its success in growing in-market deposits, disciplined loan pricing, and increased production in existing higher-yielding commercial lending products will allow the Corporation to achieve a net interest margin that supports our long-term profitability goals. The collection of loan fees in lieu of interest is an expected source of volatility to quarterly net
interest income and net interest margin. Net interest margin may also experience volatility due to events such as the collection of interest on loans previously in non-accrual status or the accumulation of significant short-term deposit inflows.
Provision for Loan and LeaseCredit Losses
We determinedetermined our provision for loan and leasecredit losses pursuant to our allowance for loan and leasecredit loss methodology, which is based on the magnitude of current and historical net charge-offs recordedthroughout the established look-back period, the evaluation of several qualitative factors for each portfolio category, and the amount of specific reserves established for impairednon-performing loans that present collateral shortfall positions. Refer to Allowance for Loan and LeaseCredit Lossesin the Critical Accounting Policy section, for further information regarding our refined allowance for loan and leasecredit loss methodology.
We recorded a
The following table shows the components of the provision for loan and lease lossescredit losses.
| | | | | | | | | | | | | | | | | | | | |
| | For the Year Ended December 31, |
| (Dollars in thousands) | | 2023 | | 2022 | | 2021 |
| Change in general reserve due to subjective factor changes | | $ | 33 | | | $ | (384) | | | $ | (426) | |
| Change in general reserve due to quantitative factor changes | | (1,453) | | | (2,012) | | | (4,456) | |
| Charge-offs | | 1,781 | | | 979 | | | 3,508 | |
| Recoveries | | (548) | | | (4,741) | | | (5,126) | |
| Change in specific reserves on individually evaluated loans, net | | 4,330 | | | 146 | | | (2,175) | |
| Change due to loan growth, net | | 3,652 | | | 2,144 | | | 2,872 | |
| Change in unfunded credit commitment reserve | | 387 | | | — | | | — | |
Total provision for credit losses (a) | | $ | 8,182 | | | $ | (3,868) | | | $ | (5,803) | |
(a) - Management adopted ASC 326 on January 1, 2023. Prior periods are presented under the incurred loss model.
The Corporation recognized $8.2 million of $6.2 millionprovision expense for the year ended December 31, 2017 as2023, compared to $7.8a $3.9 million provision benefit for the year ended December 31, 2016. Provision2022. The provision expense for the year ended December 31, 20172023 was primarily reflected $5.0due to a $4.3 million of estimated losses relatedincrease in the specific reserves on individually evaluated loans and a $3.7 million increase in the general reserve due to the previously disclosed $6.7 million Wisconsin-based commercial and industrial impaired loan. Management continues to pursue all potential repayment sources related to this credit. The provision for the year ended December 31, 2017 also reflected $5.0 million in charge-offs related to the Corporation’s remaining energy sector exposure, of which $2.3 million was specifically reserved for as of December 31, 2016.loan growth. These 2017 increases were partially offset by the reversal of a $1.8$1.5 million specific reserve based on the full repayment of a previously disclosed impaired construction loan originated in our Kansas City market. Provision for the year ended December 31, 2016 primarily reflected $8.2 million in specific reserves and net charge-offs related to five discrete Kansas City-based loan relationships.
The addition of specific reserves on impaired loans represents new specific reserves established when collateral shortfalls are present, while conversely the release of specific reserves represents the reduction of previously established reserves that are no longer required. Changes in the allowance for loan and lease lossesgeneral reserve from quantitative factors, mainly due to subjective factor changes reflect management’s evaluation of the level of riskan improving economic forecast. Specific reserves were higher on loans in Equipment Finance and, to a lesser extent SBA, within the portfolio based upon several factors for each portfolio segment. Charge-offs in excess of previously established specific reserves require an additional provision for loanCommercial and lease losses to maintain the allowance for loan and lease losses at a level deemed appropriate by management. This amount is net of the release of any specific reserve that may have already been provided. ChangeIndustrial portfolio. Equipment Finance had higher defaults from borrowers in the inherent risktransportation and logistics industry which management believes is consistent with the cyclical nature of this industry. Given current economic conditions, the portfolio is primarily influenced by the overall growthCorporation expects continued stress within this group of borrowers in gross loans and leases and an analysis of loans previously charged off, as well as, movement of existing loans and leases in and out of an impaired loan classification where a specific evaluation of a particular credit may be required rather2024.
than the application of a general reserve loss rate. Refer to Asset Quality, below, for further information regarding the overall credit quality of our loan and lease portfolio.
Non-Interest Income
Non-interest income consisting primarily of fees earned for trust and investment services, service charges on deposits, loan fees and gains on sale of SBA loans, decreasedincreased by $1.3$1.9 million, or 7.4%6.4%, to $16.7$31.3 million for the year ended December 31, 2017,2023, from $18.0$29.4 million for the year ended December 31, 2016.2022. Management continues to focus on revenue growth from multiple non-interest income sources in order to maintain a diversified revenue stream through greater contributioncontributions from fee-based revenues. Total non-interest income accounted for 21.6%21.8% of our total revenues in 20172023 compared to 22.1%23.0% in 2016.
2022. The decreaseincrease in total non-interest income for the year ended December 31, 20172023 primarily reflected lower gains from SBA and residential mortgage loans sales stemming from the Corporation’s decision to rebuild its SBA platform and to exit all secondary market residential mortgage loan origination activity. The decrease was partially offset by record trust and investment services fee income, an increase in other non-interest income, led by mezzanine fund investment income, commercial loan swap fee income, and an increase in bank-ownedhigher private wealth management services income. These increases were partially offset by a decrease bank owned life insurance (“BOLI”) fee income driven by a $9.8 million purchaseand lower service charge income.
The components of non-interest income were as follows forfollows:
| | | | | | | | | | | | | | | | | | | | | | | | | | | | | | | | | | | | | | | | | |
| For the Year Ended December 31, | | Change From Prior Year |
| 2023 | | 2022 | | 2021 | | $ Change 2023 | | % Change 2023 | | $ Change 2022 | | % Change 2022 |
| (Dollars in Thousands) |
| Private wealth management services fee income | $ | 11,425 | | | $ | 10,881 | | | $ | 10,784 | | | $ | 544 | | | 5.0 | % | | $ | 97 | | | 0.9 | |
| Gain on sale of SBA loans | 2,055 | | | 2,537 | | | 4,044 | | | (482) | | | (19.0) | | | (1,507) | | | (37.3) | |
| Service charges on deposits | 3,131 | | | 3,849 | | | 3,837 | | | (718) | | | (18.7) | | | 12 | | | 0.3 | |
| Loan fees | 3,363 | | | 3,010 | | | 2,506 | | | 353 | | | 11.7 | | | 504 | | | 20.1 | |
| Bank-owned life insurance income | 1,494 | | | 2,227 | | | 1,413 | | | (733) | | | (32.9) | | | 814 | | | 57.6 | |
| Net (loss) gain on sale of securities | (45) | | | — | | | 29 | | | (45) | | | NM | | (29) | | | (100.0) | |
| Swap fees | 2,964 | | | 1,793 | | | 1,368 | | | 1,171 | | | 65.3 | | | 425 | | | 31.1 | |
| Other non-interest income | 6,921 | | | 5,131 | | | 4,119 | | | 1,790 | | | 34.9 | | | 1,012 | | | 24.6 | |
| Total non-interest income | $ | 31,308 | | | $ | 29,428 | | | $ | 28,100 | | | $ | 1,880 | | | 6.4 | | | $ | 1,328 | | | 4.7 | |
Fee income ratio(1) | 21.8 | % | | 23.0 | % | | 24.9 | % | | | | | | | | |
(1)Fee income ratio is fee income, per the years ended December 31, 2017, 2016 and 2015:above table, divided by top line revenue (defined as net interest income plus non-interest income).
|
| | | | | | | | | | | | | | | | | | | | | | | | | | |
| | For the Year Ended December 31, | | Change From Prior Year |
| | 2017 | | 2016 | | 2015 | | $ Change 2017 | | % Change 2017 | | $ Change 2016 | | % Change 2016 |
| | (In Thousands) |
| Trust and investment service fees | $ | 6,670 |
| | $ | 5,356 |
| | $ | 4,954 |
| | $ | 1,314 |
| | 24.5 | % | | $ | 402 |
| | 8.1 | % |
| Gain on sale of SBA loans | 1,591 |
| | 4,400 |
| | 3,999 |
| | (2,809 | ) | | (63.8 | ) | | 401 |
| | 10.0 | % |
| Gain on sale of residential mortgage loans | 26 |
| | 590 |
| | 729 |
| | (564 | ) | | (95.6 | ) | | (139 | ) | | (19.1 | )% |
| Service charges on deposits | 3,013 |
| | 2,990 |
| | 2,812 |
| | 23 |
| | 0.8 |
| | 178 |
| | 6.3 |
|
| Loan fees | 1,988 |
| | 2,430 |
| | 2,187 |
| | (442 | ) | | (18.2 | ) | | 243 |
| | 11.1 |
|
| Increase in cash surrender value of bank-owned life insurance | 1,250 |
| | 974 |
| | 960 |
| | 276 |
| | 28.3 |
| | 14 |
| | 1.5 |
|
| Net (loss) gain on sale of securities | (403 | ) | | 10 |
| | — |
| | (413 | ) | | NM |
| — |
| 10 |
| | NM |
|
| Swap fees | 909 |
| | 76 |
| | 7 |
| | 833 |
| | NM |
| — |
| 69 |
| | NM |
|
| Other non-interest income | 1,621 |
| | 1,162 |
| | 1,363 |
| | 459 |
| | 39.5 |
| | (201 | ) | | (14.7 | ) |
| Total non-interest income | $ | 16,665 |
| | $ | 17,988 |
| | $ | 17,011 |
| | $ | (1,323 | ) | | (7.4 | ) | | $ | 977 |
| | 5.7 |
|
Fee income ratio(1) | 21.6 | % | | 22.1 | % | | 22.5 | % | | | | | | | | |
| |
(1) | Fee income ratio is fee income, per the above table, divided by top line revenue (defined as net interest income plus non-interest income). |
Trust and investment Private wealth management services fee income increased by $1.3 million,$544,000, or 24.5%5.0%, to $6.7a record $11.4 million for the year ended December 31, 20172023 compared to $5.4the previous record of $10.9 million for the year ended December 31, 2016. Trust and investment2022. Private wealth management services fee income is primarily driven by the amount of trust assets under management and administration, as well as the mix of business at different fee structures, and can be positively or negatively influenced by the timing and magnitude of volatility within the capitalequity and fixed income markets. This increase was driven by an increase in average assets under management and administration, which is attributable to market appreciation, new client relationships, and new money from existing client relationships. At December 31, 2017,2023, our trust assets under management and administration were $1.350$3.122 billion, or 38.2%17.3% more than the trust assets under management of $977.0 million at December 31, 2016, while our assets under administration decreased approximately 18.0%, to $186.4 million at December 31, 2017 from $227.4 million at December 31, 2016. The decrease in assets under administration reflected the transfer of client assets from assets under administration to assets under management. The retirement plan services industry is undergoing a migration from advised services to fiduciary services. Consequently, during the first quarter of 2017, one large and several smaller retirement plans changed their service model, which resulted in assets moving to full fiduciary status. We anticipate there will be similar migration of additional assets because of this trend in the future. We expect to continue to increase our revenue from assets under management and administration but market volatility may also affect the actual change in revenue.
Gain on sale of SBA loans for the year ended$2.660 billion at December 31, 2017 totaled $1.62022.
Other non-interest income increased by $1.8 million a decrease of $2.8 million, or 63.8%, from the same period in 2016 resulting from management’s decision during the second quarter of 2016 to temporarily slow SBA production while making investments to enhance the infrastructure, processes, capacity and scalability of the SBA platform. With the infrastructure and processes in place, management is now committed to increasing SBA production at a moderate pace by continuing to expand our business development team.
Loan fees decreased by $442,000, or 18.2%, to $2.0$6.9 million for the year ended December 31, 2017 from $2.42023, compared to $5.1 million for the year ended December 31, 2016.2022. The decrease in loan feesincrease was primarily attributabledue to a decreasestrong returns from the Corporation’s investments in fees associated with SBA production, specifically SBAmezzanine funds.
Commercial loan packaginginterest rate swap fee income as well as a decrease asset-based lending audit fee income.
Net loss on sale of securities totaled $403,000was $3.0 million for the year ended December 31, 2017,2023, compared to net gain on sale of securities of $10,000$1.8 million for the year ended December 31, 2016. This was principally due to the strategic decision to harvest securities losses ahead of the 2018 reduction in corporate tax rates. We reinvested the cash into securities within the portfolio’s existing risk profile while adding approximately 130 basis points in yield.
Swap fees increased by $833,000 to $909,000 for the year ended December 31, 2017 from $76,000 for the year ended December 31, 2016.2022. We originate commercial real estate loans in which we offer clients a floating rate and an interest rate swap. The client’s swap andis then offset the client’s swap with a counter-party dealer. The execution of these transactions generates swap fee income. We believe dueThe aggregate amortizing notional value of interest rate swaps with various borrowers was $939.2 million as of December 31, 2023, compared to the market’s general assumption$744.2 million as of a risingDecember 31, 2022. Interest rate swaps can be an attractive product for our commercial borrowers, although associated fee income can be variable from period to period based on client demand and the interest rate environment throughout 2018, we could see additional demand for these types of interest rate swap opportunities.in any given quarter.
Other non-interest incomeLoan fees increased by $459,000$353,000, or 11.7%, to $1.6$3.4 million for the year ended December 31, 2017,2023, compared to $1.2$3.0 million for the year ended December 31, 2016.same period in 2022. The increase was primarily due to historically reflecting our quarterly allocation of net income/loss from equity investments in two mezzanine funds in other non-interest expense. Due to the underlying funds being in an earnings position for a sustained period of time, we recognized our share of earnings in other non-interest income for the year ended December 31, 2017.
Non-Interest Expense
Non-interest expense increaseddriven by $438,000, or 0.8%, to $56.9 million for the year ended December 31, 2017 from $56.4 million for the comparable period of 2016. The increase in non-interest expense was primarily due to an increase in other non-interest expense, collateral liquidation costsequipment finance and computer software expense. The increase was partially offset by a decrease in impairment of tax credit investments, data processing expense and marketing expense.floorplan finance lending activity generating additional service fee income.
The components of non-interest expense were as follows for the years ended December 31, 2017, 2016 and 2015:
|
| | | | | | | | | | | | | | | | | | | | | | | | | |
| | For the Year Ended December 31, | | Change From Prior Year |
| | 2017 | | 2016 | | 2015 | | $ Change 2017 | | % Change 2017 | | $ Change 2016 | | % Change 2016 |
| | (Dollars in Thousands) |
| Compensation | $ | 31,663 |
| | $ | 31,545 |
| | $ | 28,543 |
| | $ | 118 |
| | 0.4 | % | | $ | 3,002 |
| | 10.5 | % |
| Occupancy | 2,088 |
| | 2,019 |
| | 1,973 |
| | 69 |
| | 3.4 |
| | 46 |
| | 2.3 |
|
| Professional fees | 4,063 |
| | 4,031 |
| | 4,893 |
| | 32 |
| | 0.8 |
| | (862 | ) | | (17.6 | ) |
| Data processing | 2,701 |
| | 3,298 |
| | 2,378 |
| | (597 | ) | | (18.1 | ) | | 920 |
| | 38.7 |
|
| Marketing | 2,109 |
| | 2,338 |
| | 2,585 |
| | (229 | ) | | (9.8 | ) | | (247 | ) | | (9.6 | ) |
| Equipment | 1,211 |
| | 1,189 |
| | 1,230 |
| | 22 |
| | 1.9 |
| | (41 | ) | | (3.3 | ) |
| Computer software | 2,723 |
| | 2,160 |
| | 1,649 |
| | 563 |
| | 26.1 |
| | 511 |
| | 31.0 |
|
| FDIC insurance | 1,388 |
| | 1,472 |
| | 920 |
| | (84 | ) | | (5.7 | ) | | 552 |
| | 60.0 |
|
| Collateral liquidation costs | 829 |
| | 262 |
| | 472 |
| | 567 |
| | 216.4 |
| | (210 | ) | | (44.5 | ) |
| Net (gain) loss on foreclosed properties | (143 | ) | | 122 |
| | (171 | ) | | (265 | ) | | (217.2 | ) | | 293 |
| | (171.3 | ) |
| Impairment on tax credit investments | 2,784 |
| | 3,691 |
| | — |
| | (907 | ) | | (24.6 | ) | | 3,691 |
| | NM |
|
| SBA recourse provision | 2,240 |
| | 2,068 |
| | — |
| | 172 |
| | 8.3 |
| | 2,068 |
| | NM |
|
| Other non-interest expense | 3,215 |
| | 2,238 |
| | 2,902 |
| | 977 |
| | 43.7 |
| | (664 | ) | | (22.9 | ) |
| Total non-interest expense | $ | 56,871 |
| | $ | 56,433 |
| | $ | 47,374 |
| | $ | 438 |
| | 0.8 |
| | $ | 9,059 |
| | 19.1 |
|
| Compensation expense to total non-interest expense | 55.7 | % | | 55.9 | % | | 60.3 | % | | | |
|
| | | |
|
|
| Full-time equivalent employees | 251 |
| | 257 |
| | 242 |
| |
|
| |
|
| |
|
| |
|
|
Compensation expense increased by $118,000, or 0.4%, to $31.7 million for the year ended December 31, 2017 from $31.5 million for the year ended December 31, 2016. The increase reflects annual merit increases and growth in employee benefit costs. Full time equivalent employees as of December 31, 2017 were 251, down 2.3% from 257 at December 31, 2016.
The modest decrease in FTE does not accurately depict our commitment to opportunistic growth but is merely a reflection of timing as it relates to filling open positions. Consistent with our historical approach to talent acquisition, we expect to continue investing in talent to support our strategic growth efforts, both in the form of additional business development and operational staff.
Data processing expenseBank-owned life insurance income decreased by $597,000,$733,000, or 18.1%32.9%, to $2.7 million for the year ended December 31, 2017 from $3.3 million for the year ended December 31, 2016. The decrease is primarily due to a reduction in non-recurring expense related to our recent core banking system conversion. During the fourth quarter of 2017 we recognized $199,000 in final deconversion costs related to FBB-KC’s core banking system, compared to $794,000 in one-time fees recognized in the fourth quarter of 2016 to terminate its core banking system vendor agreement. These one-time fees are expected to be more than offset by savings recognized over the life of the renegotiated contract extended through the year 2022.
Marketing expense decreased by $229,000, or 9.8%, to $2.1 million for the year ended December 31, 2017 from $2.3 million for the year ended December 31, 2016. The decrease is primarily due to a reduction of certain advertising initiatives as management continues to align expense growth with revenue production.
Computer software expense increased by $563,000, or 26.1%, to $2.7 million for the year ended December 31, 2017 from $2.2 million for the year ended December 31, 2016. The increase was principally due to investments in technology platforms, continuing our strategic focus on scaling the Corporation to efficiently execute our growth strategy.
FDIC insurance expense decreased by $84,000, or 5.7%, to $1.4 million for the year ended December 31, 2017 from $1.5 million for the year ended December 31, 2016. Consistent with our funding philosophy to match-fund long-term fixed rate loans with the most cost effective source of wholesale funds, in 2017 we began replacing maturing brokered certificates of deposit with the more cost effective FHLB advances in order to lower our FDIC assessment rate. While we expect to continue this strategy in 2018, we do not expect brokered certificates of deposit as a percentage of total assets to go below 10%.
Collateral liquidation costs for the year ended December 31, 2017 were $829,000 compared to $262,000 for the same period in 2016. The increase primarily reflected our workout process related to two non-performing loans.
Net loss on foreclosed properties decreased $265,000 to a net gain of $143,000 for the year ended December 31, 2017, compared to a net loss of $122,000 for the year ended December 31, 2016. The decrease reflects a $547,000 gain on the sale of the Overland Park full-service banking location in 2017, partially offset by a reduction in the fair value of the remaining foreclosed property.
Impairment on tax credit investments decreased $907,000, or 24.6%, to $2.8 million for the year ended December 31, 2017, compared to $3.7 million for the year ended December 31, 2016. The decrease reflects $2.3 million of impairment associated with the recognition of a $3.0 million federal historic tax credit in 2017, compared to $3.2 million of impairment associated with a $3.6 million credit in 2016.
SBA recourse provision for the year ended December 31, 2017 was $2.2 million compared to $2.1 million for the same period in 2016. The increase reflected refinements to the recourse reserve estimate due to the migration of certain credits with potential guaranty eligibility issues during the year. Management has extensively overhauled the previously acquired SBA lending platform and implemented best practices in the critical areas of credit, operations and compliance. These essential functions are overseen by a team of experienced SBA professionals, including a Director of SBA Credit, a Senior Director of SBA Operations and an SBA Compliance Manager, who all joined the team within the past 15 months. With these major pieces of the rebuild in place in 2017, we are now actively adding more producers in order to achieve the appropriate mix of producers and internal support staff to drive an optimal level of efficiency in our SBA business model.
Despite these enhancements to the SBA platform, changes to SBA recourse provision may be a source of non-interest expense volatility in future quarters; however, we believe the frequency and volatility in SBA recourse provision should diminish over time as we continue to originate new SBA loans with our rebuilt platform, the existing portfolio amortizes down and ongoing remediation efforts mitigate possible losses. The total recourse reserve balance was $2.8 million, or 2.8% of total sold SBA loans outstanding at December 31, 2017.
Other non-interest expense increased by $977,000, or 43.7%, to $3.2 million for the year ended December 31, 2017 from $2.2 million for the year ended December 31, 2016. The increase was primarily due to historically reflecting our quarterly allocation of net income/loss from equity investments in two mezzanine funds in other non-interest expense. Due to the underlying funds being in an earnings position for a sustained period of time, we recognized our share of earnings in other non-interest income for the year ended December 31, 2017.
Income Taxes
Income tax expense was $2.3 million for the year ended December 31, 2017,2023, compared to $2.2 million for the year ended December 31, 2016. Effective January 1, 2018,2022. The decrease was due to the Act reducedrecognition of a $809,000 insurance claim in the corporate federal income taxyear ended December 31, 2022.
Service charges on deposits for the year ended December 31, 2023 totaled $3.1 million, a decrease of $718,000, or 18.7%, from the same period in 2022. The decrease was due to higher earnings credit rates commensurate with the higher interest rate environment partially offset by an increase in additional product sales to 21%new and existing clients.
Gain on sale of SBA loans for the year ended December 31, 2023 totaled $2.1 million, a decrease of $482,000, or 19.0%, from 35%the same period in 2022. The decrease is mainly due to a reduction in total loans sold resulting from lighter production in the first half of 2023.
Non-Interest Expense
Non-interest expense increased by $9.1 million, or 11.5%, to $88.6 million for the year ended December 31, 2023 from $79.5 million for the year ended December 31, 2022. Operating expense, which requiredexcludes certain one-time and discrete items as defined in the Efficiency Ratio table above, increased $8.6 million, or 10.9%, to $87.8 million for the year ended December 31, 2023 compared to $79.2 million for the year ended December 31, 2022. The increase in operating expense was due to an increase in all expense categories, led by compensation, FDIC insurance, and other non-interest expense.
The components of non-interest expense were as follows:
| | | | | | | | | | | | | | | | | | | | | | | | | | | | | | | | | | | | | | | | | |
| For the Year Ended December 31, | | Change From Prior Year |
| 2023 | | 2022 | | 2021 | | $ Change 2023 | | % Change 2023 | | $ Change 2022 | | % Change 2022 |
| (Dollars in Thousands) |
| Compensation | $ | 61,059 | | | $ | 57,742 | | | $ | 51,710 | | | $ | 3,317 | | | 5.7 | % | | $ | 6,032 | | | 11.7 | |
| Occupancy | 2,381 | | | 2,358 | | | 2,180 | | | 23 | | | 1.0 | | | 178 | | | 8.2 | |
| Professional fees | 5,325 | | | 4,881 | | | 3,736 | | | 444 | | | 9.1 | | | 1,145 | | | 30.6 | |
| Data processing | 3,826 | | | 3,197 | | | 3,087 | | | 629 | | | 19.7 | | | 110 | | | 3.6 | |
| Marketing | 2,889 | | | 2,354 | | | 2,022 | | | 535 | | | 22.7 | | | 332 | | | 16.4 | |
| Equipment | 1,340 | | | 1,091 | | | 990 | | | 249 | | | 22.8 | | | 101 | | | 10.2 | |
| Computer software | 4,985 | | | 4,416 | | | 4,260 | | | 569 | | | 12.9 | | | 156 | | | 3.7 | |
| FDIC insurance | 2,238 | | | 1,042 | | | 1,143 | | | 1,196 | | | 114.8 | | | (101) | | | (8.8) | |
| | | | | | | | | | | | | |
| | | | | | | | | | | | | |
| | | | | | | | | | | | | |
| | | | | | | | | | | | | |
| | | | | | | | | | | | | |
| Other non-interest expense | 4,532 | | | 2,393 | | | 2,407 | | | 2,139 | | | 89.4 | | | (14) | | | (0.6) | |
| Total non-interest expense | $ | 88,575 | | | $ | 79,474 | | | $ | 71,535 | | | $ | 9,101 | | | 11.5 | | | $ | 7,939 | | | 11.1 | |
Total operating expense(1) | $ | 87,788 | | | $ | 79,155 | | | $ | 71,571 | | | $ | 8,633 | | | 10.9 | | | $ | 7,584 | | | 10.6 | |
| Full-time equivalent employees | 343 | | | 337 | | | 304 | | | 6 | | | 1.8 | | | 33 | | | 10.9 | |
NM = Not meaningful
(1)Total operating expense represents total non-interest expense, adjusted to exclude the impact of discrete items as previously defined in the non-GAAP efficiency ratio calculation above.
Compensation expense increased by $3.3 million, or 5.7%, to $61.1 million for the year ended December 31, 2023 from $57.7 million for the year ended December 31, 2022 principally due to an increase in average FTEs, annual merit increases, growth in employee benefit costs, and increase in incentive compensation. The increase reflects a $2.5 million, or 7.1%, increase in employee salaries and a $908,000, or 25.6% increase in incentive compensation due to exceptional loan and deposit growth. These increases were partially offset by a $1.5 million, or 22.6% decrease in estimated annual cash bonuses compared to a record year for 2022. The Bank’s compensation philosophy is to provide base salaries competitive with the market. Given the competitive job market and the critical importance to the Corporation to revalue its deferred taxes as of retaining employees, annual base salaries were increased an additional $1.5 million, or approximately 4.1%, in the aggregate for 2024. Average FTEs were 343 for the year ended December 31, 2017.2023, increased by 18, or 5.5%, from 325 for the year ended December 31, 2022.
Other non-interest expense increased $2.1 million, or 89.4%, for the year ended December 31, 2023 compared to the year ended December 31, 2022. The revaluation resultedincrease was primarily due to a $985,000 increase in liquidation expense related to an additionalAsset-Based Lending client, a $963,000 increase in SBA recourse provision, a $232,000 increase in expense from swap credit valuation changes, increase in travel expense, and an increase in loan related expenses. These increases were partially offset by a decrease in charitable donations due to a non-recurring contribution to First Business Charitable foundation totaling $809,000 in the prior year.
FDIC Insurance increased $1.2 million, or 114.8%, for the year ended December 31, 2023 compared to the year ended December 31, 2022. The increase was primarily due to an increase in the assessment rate and the Corporation’s assessable base.
Data processing fees increased $629,000, or 19.7%, for the year ended December 31, 2023 compared to the year ended December 31, 2022. The increase was primarily due to an increase in core processing costs commensurate with loan and deposit account growth, as well as various project implementations.
Computer software expense increased by $569,000, or 12.9%, for the year ended December 31, 2023 compared to the year ended December 31, 2022. The increase was primarily due to continued investment in technology to support the Corporation’s growth.
Marketing expense increased by $535,000, or 22.7%, for the year ended December 31, 2023 compared to the year ended December 31, 2022. The increase was primarily due to an increase in business development efforts and advertising projects commensurate with our expanding sales force.
Professional fees increased $444,000, or 9.1%, for the year ended December 31, 2023 compared to the year ended December 31, 2022. The increase was primarily due to an increase in recruiting expense and a general increase in other professional consulting services for various projects.
Income Taxes
Income tax expense was $10.1 million for the year ended December 31, 2023, compared to $11.4 million for the year ended December 31, 2022. The income tax expense during the fourth quarter of 2017. The Corporation also recognizedincluded a federal historic$1.2 million and $635,000 net benefit from tax credit investments in both 20172023 and 2016, which reduced income tax expense by $3.0 million and $3.6 million,2022, respectively. The effective tax rate for the year ended December 31, 20172023 was 16.3%21.5% compared to 12.6%21.8% for the year ended December 31, 2016.2022. Management completed its analysis of the Wisconsin State Budget 2023, which included language that provides an exemption for state tax on certain loan income for loans to Wisconsin small businesses. Management estimates this law will eliminate the Bank’s Wisconsin state income tax in 2023 and the foreseeable future. This conclusion results in a 2023 state income tax benefit of $2.8 million offset by a one-time $2.8 million charge to state income tax expense to recognize a valuation allowance on deferred state income taxes. Based on expected earnings, reduction in state tax, and future tax credit investments, the Corporation expects to report an effective tax rate between 18% and 19% for 2024.
FINANCIAL CONDITION
General
AtTotal assets increased by $531.2 million, or 17.8%, to $3.508 billion as of December 31, 2017 total assets were $1.7942023 compared to $2.977 billion, representing an increase of $13.4 million, or 0.8%, from $1.781 billion at December 31, 2016.2022. The increase in total assets was primarily driven by an increase in loans and leases which was partially offsetreceivable, cash and cash equivalents, securities, and other assets. Total liabilities increased by a decrease in our investment security portfolio and by a decrease in cash held at the Federal Reserve Bank (“FRB”)$502.3 million, or 18.5%, to $3.218 billion as the excess liquidity was deployedof December 31, 2023 compared to fund loan and lease growth.
Short-term investments
Short-term investments decreased by $27.4 million to $35.5 million$2.716 billion at December 31, 20172022. The increase in total liabilities was principally due to an increase in deposits.
Cash and cash equivalents
Cash and cash equivalents include short-term investments and cash and due from $62.9banks.Short-term investments increased by $30.3 million to $107.2 million at December 31, 2016.2023 from $76.9 million at December 31, 2022. Both short-term investments and cash and due from banks increased during 2023. Short-term investments primarily consist of interest-bearing deposits held at the FRB, which decreased by $23.2 million to $17.7 million at December 31, 2017.Federal Reserve Bank (“FRB”). We value the safety and soundness provided by the FRB, and therefore, we incorporate short-term investments in our on-balance-sheeton-balance sheet liquidity program. Although the majorityAs of short-term investments consist ofDecember 31, 2023 and 2022, interest-bearing deposits withheld at the FRB we also make investments in commercial paper. We approach decisions to purchase commercial paper with similar rigorwere $76.5 million and underwriting standards applied to our loan and lease portfolio. The original maturities of the commercial paper are typically 60 days or less and provide an attractive yield in comparison to other short-term alternatives. These investments also assist us in maintaining a shorter duration of our overall investment portfolio which we believe is necessary to take advantage of a rising rate environment.$47.0 million, respectively. In general, the level of our cash and short-term investments iswill be influenced by the timing of deposit gathering, scheduled maturities of wholesale deposits, and FHLB advances, funding of loan and lease growth when opportunities are presented, and the level of our securities portfolio. Please refer to the section entitled Liquidity and Capital Resources for further discussion.
Securities
Total securities, including available-for-sale and held-to-maturity, decreasedincreased by $20.7$80.9 million to $163.8$305.5 million at December 31, 20172023 from $184.5$224.7 million at December 31, 2016.2022. As of December 31, 2017,2023 and 2022, our total securities portfolio had a weighted average estimated remaining maturity of approximately 3.5 years.5.6 years and 6.3 years, respectively. The investment portfolio primarily consists of collateralized mortgage obligations and agency obligationsmortgage-backed securities and is used to provide a source of liquidity, including the ability to pledge securities for possible future cash advances, while contributing to the earnings potential of the Bank. The overall duration of the securities portfolio is established and maintained to further mitigate interest rate risk present within our balance sheet as identified through asset/liability simulations. We purchase investment securities intended to protect net interest margin while maintaining an acceptable risk profile. In addition, we will purchase investmentsinvestment securities to utilize our cash position effectively within appropriate policy guidelines and estimates of future cash demands. While collateralized mortgage obligationsmortgage-backed securities present prepayment risk and extension risk, we believe the overall credit risk associated with these investments is minimal, as the majorityall of the obligationssecurities we hold are guaranteed by the United States Treasury, the Federal National Mortgage Association (“FNMA”), the Federal Home Loan Mortgage Corporation (“FHLMC”), or the Government National Mortgage Association (“GNMA”), a U.S. government agency. The estimated repayment streams associated with this portfolio also allow
us to better match short-term liabilities. The Bank’s investment policies allow for various types of investments, including tax-exempt municipal securities. The ability to invest in tax-exempt municipal securities provides for further opportunity to improve our overall yield on the securities portfolio. We evaluate the credit risk of the municipal obligationssecurities prior to purchase and generally limit exposure to general obligation issuances from municipalities, primarily in Wisconsin.
As we evaluate the level of on-balance-sheet liquidity, we continue to purchase U.S. government agency obligations, primarily those obligations issued by Federal Home Loan Mortgage Corporation (“FHLMC”) and Federal National Mortgage Association (“FNMA”). We have structured these purchases to have final maturities within two to four years from the issue date. Some of the securities contain either quarterly or one-time call features. The maturity structure of our securities portfolio allows us to effectively manage the cash flows of these securities along with the collateralized mortgage obligations to be able to meet loan demand in the near future without the need to immediately borrow funds from various funding sources and proactively adjust the portfolio should interest rates rise materially within the next two to four years. Our management deems these securities to be creditworthy and believes they exhibit appropriate market yields for the risks assumed. We expect to continue to purchase these types of approved securities with appropriate maturity terms when they are available in the market.
The majority of the securities we hold have active trading markets; therefore, we have not experienced difficulties in pricing our securities. We use a third-party pricing service as our primary source of market prices for the securities portfolio. On a quarterly basis, we validate the reasonableness of prices received from this source through independent verification of the portfolio, data integrity validation through comparison of current price to prior period prices, and an expectation-based analysis of movement in prices based upon the changes in the related yield curves and other market factors. On a periodic basis, we review the third-party pricing vendor’s methodology for pricing relevant securities and the results of its internal control assessments. Our securities portfolio is sensitive to fluctuations in the interest rate environment and has limited sensitivity to credit risk due to the nature of the issuers and guarantors of the securities as previously discussed. If interest rates decline and the credit quality of the securities remains constant or improves, the fair value of our debt securities portfolio would likely improve, thereby increasing total comprehensive income. If interest rates increase and the credit quality of the securities remains constant or deteriorates, the fair value of our debt securities portfolio would likely decline and therefore decrease total comprehensive income. The magnitude of the fair value change will be based upon the duration of the portfolio. A securities portfolio with a longer average duration will exhibit greater market price volatility movements than a securities portfolio with a shorter average duration in a changing rate environment. During the year ended December 31, 2017,2023, we recognized unrealized holding lossesgains of $1.2$5.6 million before income taxes through other comprehensive income. These lossesgains were the result of thean increase in interest rates. No securities within our portfolio were deemed to be other-than-temporarily impairedrequire an allowance for credit losses as of December 31, 2017.2023. We sold approximately $5.1 million of securities during the year ended December 31, 2023 to proactively manage our securities portfolio and meet our long-term investment objectives. As of December 31, 20172023 no securities were classified as trading securities.
At December 31, 2017, $2.82023, $45.4 million of our mortgage-related securities were pledged to secure our various obligations, including interest rate swap contracts.contracts and municipal deposits.
The tabletables below setsset forth information regarding the amortized cost and fair values of our securities atsecurities.
| | | | | | | | | | | | | | | | | | | | | | | | | | | | | | |
| | | As of December 31, |
| | | 2023 | | 2022 | | |
| | | Amortized Cost | | Fair Value | | Amortized Cost | | Fair Value | | | | |
| | | (In Thousands) |
| Available-for-sale: | | | | | | | | | | | | |
| U.S. Treasuries | | $ | 14,158 | | | $ | 13,776 | | | $ | 4,977 | | | $ | 4,445 | | | | | |
| U.S. government agency securities - government-sponsored enterprises | | 27,986 | | | 27,566 | | | 13,666 | | | 13,205 | | | | | |
| Municipal securities | | 40,407 | | | 35,881 | | | 45,088 | | | 39,311 | | | | | |
| Residential mortgage-backed securities - government issued | | 69,441 | | | 68,056 | | | 21,790 | | | 19,431 | | | | | |
| Residential mortgage-backed securities - government-sponsored enterprises | | 131,321 | | | 120,833 | | | 119,265 | | | 106,323 | | | | | |
| Commercial mortgage-backed securities - government issued | | 2,995 | | | 2,525 | | | 3,450 | | | 2,932 | | | | | |
| Commercial mortgage-backed securities - government-sponsored enterprises | | 32,774 | | | 28,369 | | | 31,515 | | | 26,377 | | | | | |
| | | | | | | | | | | | |
| | $ | 319,082 | | | $ | 297,006 | | | $ | 239,751 | | | $ | 212,024 | | | | | |
| | | | | | | | | | | | | | | | | | | | | | | | | | | | | | |
| | | As of December 31, |
| | | 2023 | | 2022 | | |
| | | Amortized Cost | | Fair Value | | Amortized Cost | | Fair Value | | | | |
| | | (In Thousands) |
| Held-to-maturity: | | | | | | | | | | | | |
| Municipal securities | | $ | 4,210 | | | $ | 4,173 | | | $ | 7,467 | | | $ | 7,404 | | | | | |
| Residential mortgage-backed securities - government issued | | 1,211 | | | 1,135 | | | 1,625 | | | 1,518 | | | | | |
| Residential mortgage-backed securities - government-sponsored issued | | 1,078 | | | 1,025 | | | 1,537 | | | 1,444 | | | | | |
| Commercial mortgage-backed securities - government-sponsored enterprises | | 2,004 | | | 1,922 | | | 2,006 | | | 1,904 | | | | | |
| | $ | 8,503 | | | $ | 8,255 | | | $ | 12,635 | | | $ | 12,270 | | | | | |
U.S. Treasuries represent treasury bonds issued by the dates indicated.
|
| | | | | | | | | | | | | | | | | | | | | | | | |
| | | As of December 31, |
| | | 2017 | | 2016 | | 2015 |
| | | Amortized Cost | | Fair Value | | Amortized Cost | | Fair Value | | Amortized Cost | | Fair Value |
| | | (In Thousands) |
| Available-for-sale: | | | | | | | | | | | | |
| U.S. government agency obligations - government-sponsored enterprises | | $ | 999 |
| | $ | 1,000 |
| | $ | 6,298 |
| | $ | 6,295 |
| | $ | 8,047 |
| | $ | 8,017 |
|
| Municipal obligations | | 9,494 |
| | 9,414 |
| | 8,246 |
| | 8,156 |
| | 4,278 |
| | 4,283 |
|
| Asset-backed securities | | — |
| | — |
| | 1,116 |
| | 1,081 |
| | 1,327 |
| | 1,269 |
|
| Collateralized mortgage obligations - government issued | | 22,313 |
| | 22,249 |
| | 30,936 |
| | 31,213 |
| | 43,845 |
| | 44,543 |
|
| Collateralized mortgage obligations - government-sponsored enterprises | | 91,480 |
| | 90,305 |
| | 99,865 |
| | 99,148 |
| | 82,707 |
| | 82,436 |
|
| Other securities | | 3,040 |
| | 3,037 |
| | — |
| | — |
| | — |
| | — |
|
| | | $ | 127,326 |
| | $ | 126,005 |
| | $ | 146,461 |
| | $ | 145,893 |
| | $ | 140,204 |
| | $ | 140,548 |
|
|
| | | | | | | | | | | | | | | | | | | | | | | | |
| | | As of December 31, |
| | | 2017 | | 2016 | | 2015 |
| | | Amortized Cost | | Fair Value | | Amortized Cost | | Fair Value | | Amortized Cost | | Fair Value |
| | | (In Thousands) |
| Held-to-maturity: | | | | | | | | | | | | |
| U.S. government agency obligations - government-sponsored enterprises | | $ | 1,499 |
| | $ | 1,490 |
| | $ | 1,497 |
| | $ | 1,494 |
| | $ | 1,495 |
| | $ | 1,485 |
|
| Municipal obligations | | 21,680 |
| | 21,822 |
| | 21,173 |
| | 21,157 |
| | 16,038 |
| | 16,365 |
|
| Collateralized mortgage obligations - government issued | | 9,072 |
| | 8,943 |
| | 9,148 |
| | 9,127 |
| | 11,718 |
| | 11,709 |
|
| Collateralized mortgage obligations - government-sponsored enterprises | | 5,527 |
| | 5,441 |
| | 6,794 |
| | 6,742 |
| | 8,031 |
| | 7,999 |
|
| | | $ | 37,778 |
| | $ | 37,696 |
| | $ | 38,612 |
| | $ | 38,520 |
| | $ | 37,282 |
| | $ | 37,558 |
|
United States Treasury. U.S. government agency obligationssecurities - government-sponsored enterprises represent securities issued by FNMA and the FHLMC and FNMA.SBA. Municipal obligationssecurities include securities issued by various municipalities located primarily within the State of Wisconsin and are primarily general obligation bonds that are tax-exempt in nature. Asset-backedResidential and commercial mortgage-backed securities represent securities issued by the Student Loan Marketing Association (“SLMA”) which are 97% guaranteed by the U.S. government. Collateralized mortgage obligations - government issued represent securities guaranteed by GNMA. Collateralized mortgage obligationsResidential and commercial mortgage-backed securities - government-sponsored enterprises include securities guaranteed by FHLMC, FNMA, and the FNMA.FHLB. Other securities represent certificates of deposit of insured banks and savings institutions with an original maturity greater than three months. As of December 31, 2017,2023, no issuer's securities exceeded 10% of our total stockholders' equity.
The following table sets forth the contractual maturity and weighted average yield characteristics of the fair value of our available-for-sale securities and the amortized cost of our held-to-maturity securities at December 31, 2017,2023, classified by remaining contractual maturity. Actual maturities may differ from contractual maturities because issuers have the right to call or prepay obligationssecurities without call or prepayment penalties. Yields on tax-exempt obligationssecurities have not been computed on a tax equivalent basis.
|
| | | | | | | | | | | | | | | | | | | | | | | | | | | | | | | | |
| | | Less than One Year | | One to Five Years | | Five to Ten Years | | Over Ten Years | | |
| | | Fair Value | | Weighted
Average
Yield | | Fair Value | | Weighted
Average
Yield | | Fair Value | | Weighted
Average
Yield | | Fair Value | | Weighted
Average
Yield | | Total |
| | | (Dollars in Thousands) |
| Available-for-sale: | | | | | | | | | | | | | | | | | | |
| U.S. government agency obligations - government-sponsored enterprises | | $ | — |
| | — | % | | $ | 1,000 |
| | 2.04 | % | | $ | — |
| | — | % | | $ | — |
| | — | % | | $ | 1,000 |
|
| Municipal obligations | | 4,468 |
| | 1.04 |
| | 3,105 |
| | 1.23 |
| | 1,348 |
| | 1.60 |
| | 493 |
| | 2.20 |
| | 9,414 |
|
| Collateralized mortgage obligations - government issued | | — |
| | — |
| | — |
| | — |
| | 6,954 |
| | 2.97 |
| | 15,295 |
| | 2.46 |
| | 22,249 |
|
| Collateralized mortgage obligations - government-sponsored enterprises | | 22 |
| | 2.45 |
| | 6,864 |
| | 2.08 |
| | 27,340 |
| | 1.94 |
| | 56,079 |
| | 2.27 |
| | 90,305 |
|
| Other securities | | 590 |
| | 1.20 |
| | 2,447 |
| | 2.27 |
| | — |
| | — |
| | — |
| | — |
| | 3,037 |
|
| | | $ | 5,080 |
| | | | $ | 13,416 |
| | | | $ | 35,642 |
| | | | $ | 71,867 |
| | | | $ | 126,005 |
|
| | | | | | | | | | | | | | | | | | | | | | | | | | | | | | | | | | | | | | | | | | | | | | | | | | | | | | | | |
| | Less than One Year | | One to Five Years | | Five to Ten Years | | Over Ten Years | | |
| | Fair Value | | Weighted
Average
Yield | | Fair Value | | Weighted
Average
Yield | | Fair Value | | Weighted
Average
Yield | | Fair Value | | Weighted
Average
Yield | | Total |
| | | (Dollars in Thousands) |
| Available-for-sale: | | | | | | | | | | | | | | | | | | |
| U.S. treasuries | | $ | 9,182 | | | 5.19 | % | | $ | 4,594 | | | 1.00 | % | | $ | — | | | — | % | | $ | — | | | — | % | | $ | 13,776 | |
| U.S. government agency securities - government-sponsored enterprises | | 13,387 | | | 4.12 | | | 6,060 | | | 2.76 | | | 1,345 | | | 6.19 | | | 6,774 | | | 6.04 | | | 27,566 | |
| Municipal securities | | — | | | — | | | 6,992 | | | 1.42 | | | 10,570 | | | 1.86 | | | 18,319 | | | 2.05 | | | 35,881 | |
| | | | | | | | | | | | | | | | | | |
| | 22,569 | | | | | 17,646 | | | | | 11,915 | | | | | 25,093 | | | | | 77,223 | |
| Residential mortgage-backed securities | | | | | | | | | | | | | | | | | | 188,889 | |
| Commercial mortgage-backed securities | | | | | | | | | | | | | | | | | | 30,894 | |
| | $ | 22,569 | | | | | $ | 17,646 | | | | | $ | 11,915 | | | | | $ | 25,093 | | | | | $ | 297,006 | |
| | | | | | | | | | | | | | | | | | | | | | | | | | | | | | | | | | | | | | | | | | | | | | | | | | | | | | | | |
| | Less than One Year | | One to Five Years | | Five to Ten Years | | Over Ten Years | | |
| | Amortized Cost | | Weighted
Average
Yield | | Amortized Cost | | Weighted
Average
Yield | | Amortized Cost | | Weighted
Average
Yield | | Amortized Cost | | Weighted
Average
Yield | | Total |
| | | (Dollars in Thousands) |
| Held-to-maturity: | | | | | | | | | | | | | | | | | | |
| Municipal securities | | $ | 1,060 | | | 2.40 | % | | $ | 3,150 | | | 2.76 | % | | $ | — | | | — | % | | $ | — | | | — | % | | $ | 4,210 | |
| | 1,060 | | | | | 3,150 | | | | | — | | | | | — | | | | | 4,210 | |
| Residential mortgage-backed securities | | | | | | | | | | | | | | | | | | 2,289 | |
| Commercial mortgage-backed securities | | | | | | | | | | | | | | | | | | 2,004 | |
| | $ | 1,060 | | | | | $ | 3,150 | | | | | $ | — | | | | | $ | — | | | | | $ | 8,503 | |
|
| | | | | | | | | | | | | | | | | | | | | | | | | | | | | | | | |
| | | Less than One Year | | One to Five Years | | Five to Ten Years | | Over Ten Years | | |
| | | Amortized Cost | | Weighted
Average
Yield | | Amortized Cost | | Weighted
Average
Yield | | Amortized Cost | | Weighted
Average
Yield | | Amortized Cost | | Weighted
Average
Yield | | Total |
| | | (Dollars in Thousands) |
| Held-to-maturity: | | | | | | | | | | | | | | | | | | |
| U.S. government agency obligations - government-sponsored enterprises | | $ | 1,499 |
| | 1.07 | % | | $ | — |
| | — | % | | $ | — |
| | — | % | | $ | — |
| | — | % | | $ | 1,499 |
|
| Municipal obligations | | — |
| | — |
| | 10,673 |
| | 2.00 |
| | 10,058 |
| | 2.20 |
| | 949 |
| | 2.69 |
| | 21,680 |
|
| Collateralized mortgage obligations - government issued | | — |
| | — |
| | — |
| | — |
| | 4,014 |
| | 1.80 |
| | 5,058 |
| | 2.12 |
| | 9,072 |
|
| Collateralized mortgage obligations - government-sponsored enterprises | | — |
| | — |
| | — |
| | — |
| | 1,641 |
| | 1.47 |
| | 3,886 |
| | 1.72 |
| | 5,527 |
|
| | | $ | 1,499 |
| | | | $ | 10,673 |
| | | | $ | 15,713 |
| | | | $ | 9,893 |
| | | | $ | 37,778 |
|
Derivative Activities
The Bank’s investmentBoard-approved Bank policies allow the Bank to participate in hedging strategies or to use financial futures, options, forward commitments, or interest rate swaps with prior approval from the Board.swaps. The Bank utilizes, from time to time, derivative instruments in the course of theirits asset/liability management. As of December 31, 2017 and 2016,The Corporation’s derivative financial instruments, under which the Bank did not hold any derivative instruments that were designated asCorporation is required to either receive cash from or pay cash to counterparties depending on changes in interest rates applied to notional amounts, are carried at fair value hedges. The derivative portfolio includes interest rate swaps offered directly to qualified commercial borrowers, which allowon the Bank to provide a fixed rate alternative to their clients while mitigating interest rate risk by keeping a variable rate loan in their portfolios. The Bank economically hedges client derivative transactions by entering into equal and offsetting interest rate swap contracts executed with dealer counterparties. The economic hedge with the dealer counterparties allows the Bank to primarily offset the fixed rate interest rate risk. Derivative transactions executed through this program are not designated as accounting hedge relationships and are marked to market through earnings each period.consolidated balance sheets.
As of December 31, 2017,2023, the aggregate amortizing notional value of interest rate swaps with various commercial borrowers was approximately $53.4 million.$939.2 million, compared to $744.2 million as of December 31, 2022. We receive fixed rates and pay floating rates based upon LIBORdesignated benchmark interest rates on the swaps with commercial borrowers. These swaps mature between September 2018May 2024 and May 2034.July 2040. Commercial borrower swaps are
completed independently with each borrower and are not subject to master netting arrangements. AllAs of theseDecember 31, 2023, the commercial borrower swaps were reported on the Consolidated Balance SheetsSheet as a derivative liability and asset of $942,000, included in accrued interest receivable$51.1 million and other assets$7.9 million, respectively, compared to a derivative liability and asset of $61.4 million and $1.0 million, respectively, as of December 31, 2017.2022. On the offsetting swap contracts with dealer counterparties, we pay fixed rates and receive floating rates based upon LIBOR.designated benchmark interest rates. These interest rate swaps also have maturity dates between September 2018May 2024 and May 2034.July 2040. Dealer counterparty swaps are subject to master netting agreements among the contracts within theour Bank and arewere reported as a derivative liability of $942,000. The value of these swaps was included in accrued interest payable and other liabilities on the Consolidated Balance SheetsSheet as a net derivative asset of $43.2 million as of December 31, 2017.2023, compared to a net derivative asset of $60.4 million as of December 31, 2022. The gross amount of dealer counterparty swaps as of December 31, 2023, without regard to the enforceable master netting agreement, was a gross derivative asset and liability of $51.1 million and $7.9 million, respectively, compared to a gross derivative asset and liability of $61.4 million and $1.0 million, respectively, as of December 31, 2022.
During the fourth quarter of 2017, theThe Corporation also enteredenters into an interest rate swapswaps to manage interest rate risk and reduce the cost of match-funding certain long-term fixed rate loans. ThisThese derivative contract involvescontracts involve the receipt of floating rate interest from a counterparty in exchange for the Corporation making fixed-rate payments over the life of the agreement, without the exchange of the underlying notional value. This instrument isThe instruments are designated as a cash flow hedgehedges as the receipt of floating rate interest from the counterparty is used to manage interest rate risk associated with forecasted issuances of short-term FHLB advances. The change in the fair value of thisthese hedging instrumentinstruments is recorded in accumulated other comprehensive income and is subsequently reclassified into earnings in the period that the hedged transaction affectstransactions affect earnings.
As of December 31, 2017,2023, the aggregate notional value of theinterest rate swaps designated as cash flow hedge, which matures inhedges was $402.7 million. These interest rate swaps mature between December 2027, was approximately $22.0 million.2023 and March 2034. A pre-tax unrealized loss of $122,000$3.5 million was recognized in accumulated other comprehensive income for the year ended December 31, 2017 with2023, while a corresponding amount reportedpre-tax unrealized gain of $8.5 million and $3.6 million were recognized in accruedother comprehensive income for the years ended December 31, 2022 and 2021, respectively, and there were no ineffective portion of these hedges.
The Corporation also enters into interest payablerate swaps to mitigate market value volatility on certain long-term fixed-rate securities. The objective of the hedge is to protect the Corporation against changes in fair value due to changes in benchmark interest rates. The instruments are designated as fair value hedges as the changes in the fair value of the interest rate swap are expected to offset changes in the fair value of the hedged item attributable to changes in the SOFR swap rate, the designated benchmark interest rate. These derivative contracts involve the receipt of floating rate interest from a counterparty in exchange for the Corporation making fixed-rate payments over the life of the agreement, without the exchange of the underlying notional value. The change in the fair value of these hedging instruments is recorded in accumulated other comprehensive income and is subsequently reclassified into earnings in the period that the hedged transactions affect earnings. As of December 31, 2023, the aggregate notional value of interest rate swaps designated as fair value hedges was $12.5 million. These interest rate swaps mature between February 2031 and October 2034. A pre-tax unrealized gain of $22,000 and $602,000 was recognized in other liabilities oncomprehensive income for the year ended December 31, 2023 and 2022, respectively, and there was no ineffective portion of these hedges. No pre-tax unrealized gain or loss was recognized in other comprehensive income for the year ended December 31, 2021.
For further information and discussion of our derivatives, see Note 17 — Derivative Financial Instruments of the Consolidated Balance Sheets.Financial Statements.
Loans and Leases Receivable
Loans and leases receivable, net of allowance for loan and leasecredit losses, increased by $53.1$400.2 million, or 3.7%16.5%, to $1.483$2.819 billion at December 31, 20172023 from $1.430$2.419 billion at December 31, 2016.2022.
While we continue There continues to havebe a concentration in commercial real estate (“CRE”)CRE loans the overall mixwhich represented 59.6% and 63.1% of our portfolio remained fairly consistent in 2017 when compared to 2016. Approximately 67.7%total loans, as of our loan and lease portfolio was concentrated in CRE loans at December 31, 2017, primarily in our owner-occupied2023 and non-owner-occupied classes, compared to 65.2% at December 31, 2016. Our CRE portfolio increased by $72.0 million, or 7.6%, to $1.018 billion at December 31, 2017 from $945.9 million at December 31, 2016.2022, respectively. As of December 31, 2017,2023, approximately 19.7%15.1% of the CRE loans
were owner-occupied CRE.CRE, compared to 17.4% as of December 31, 2022. We consider owner-occupied CRE more characteristic of the Corporation’s commercial and industrial (“C&I”)&I portfolio as, in general, the client’s primary source of repayment is the cash flow from the operating entity occupying the commercial real estate property.
Our C&I portfolio decreased $21.3increased $252.5 million, or 4.7%29.6%, to $429.0$1.106 billion at December 31, 2023 from $853.3 million at December 31, 2017 from $450.3 million at December 31, 2016 reflecting specialty finance prepayments2022. The Corporation experienced significant C&I loan growth in 2023, due to growth across products and continued competitive pressure amid soft overall commercial loan demand. The countercyclical nature ofgeographies. Management believes the asset-based lending business may result in increased payoffs and fees collected in lieu of interest in periods of economic stability, with increased loan fundings and interest income during weaker economic markets. Consequently, a slight decline was notedinvestment in the Corporation’s C&I component of our portfolio mix as approximately 28.5% of our loanproduct lines has positioned the Corporation for strong and lease portfolio was comprised of C&I loans at December 31, 2017, compared to 31.0% at December 31, 2016. sustainable growth in 2024 and beyond.
We continue to emphasize actively pursuingpursue C&I loans across the Corporation as this segment of our loan and lease portfolio provides an attractive yield commensurate with an appropriate level of credit risk and creates opportunities for in-market deposit, treasury management, and trust and investmentprivate wealth management relationships which generate additional fee revenue.
While we continue to experience significant competition as banks operating in our primary geographic area attempt to deploy excess liquidity, we remain committed to our underwriting standards and will not deviate from those standards for the sole purpose Underwriting of growing our loan and lease portfolio. We continue to expect our new loan and lease activity to adequately replace amortization and to continue to grow at a modest pace in future years.
Credit underwritingcredit is primarily through approval from a serial sign-off or committee process and is a key component of our operating philosophy. Business development officers have relatively lowno individual lending authority limits, and thus, a significant portion of our new credit extensions require approval from a loan approval committee regardless of the type of loan or lease, amount of the credit or the related complexities of each proposal. In addition, we make every reasonable effort to ensure that there is appropriate collateral or a government guarantee at the time of origination to protect our interest in the related loan or lease. To monitor the ongoing credit quality of our loans and leases, each credit is evaluated for proper risk rating using a nine grade risk rating system at the time of origination, subsequent renewal, evaluation of updated financial information from our borrowers, or as other circumstances dictate.
While we continue to experience significant competition from banks operating in our primary geographic areas, we remain committed to our underwriting standards and will not deviate from those standards for the sole purpose of growing our loan and lease portfolio. We continue to expect our new loan and lease activity to be adequate to replace normal amortization, allowing us to continue growing in future years.
The following table presents information concerning the composition of the Bank’s consolidated loans and leases receivable at the dates indicated.receivable.
| | | | | | | | | | | | | | | | | | | | | | | | | | | | | | | | | | | | | | |
| | As of December 31, |
| | 2023 | | 2022 | | | | | | |
| | Amount Outstanding | | % of Total Loans and Leases | | Amount Outstanding | | % of Total Loans and Leases | | | | | | | | | | | | |
| | (Dollars in Thousands) |
| Commercial real estate: | | | | | | | | | | | | | | | | | | | | |
| Commercial real estate — owner occupied | | $ | 256,479 | | | 9.0 | % | | $ | 268,354 | | | 11.0 | % | | | | | | | | | | | | |
| Commercial real estate — non-owner occupied | | 773,494 | | | 27.1 | | | 687,091 | | | 28.1 | | | | | | | | | | | | | |
| Construction | | 193,080 | | | 6.8 | | | 218,751 | | | 9.0 | | | | | | | | | | | | | |
| Multi-family | | 450,529 | | | 15.8 | | | 350,026 | | | 14.3 | | | | | | | | | | | | | |
| 1-4 family | | 26,289 | | | 0.9 | | | 17,728 | | | 0.7 | | | | | | | | | | | | | |
| Total commercial real estate | | 1,699,871 | | | 59.6 | | | 1,541,950 | | | 63.1 | | | | | | | | | | | | | |
| Commercial and industrial | | 1,105,835 | | | 38.8 | | | 853,327 | | | 34.9 | | | | | | | | | | | | | |
| Consumer and other | | 44,312 | | | 1.6 | | | 47,938 | | | 2.0 | | | | | | | | | | | | | |
| Total gross loans and leases receivable | | 2,850,018 | | | 100.0 | % | | 2,443,215 | | | 100.0 | % | | | | | | | | | | | | |
| Less: | | | | | | | | | | | | | | | | | | | | |
| Allowance for credit losses | | 31,275 | | | | | 24,230 | | | | | | | | | | | | | | | |
| Deferred loan fees and costs, net | | (243) | | | | | 149 | | | | | | | | | | | | | | | |
| Loans and leases receivable, net | | $ | 2,818,986 | | | | | $ | 2,418,836 | | | | | | | | | | | | | | | |
Below is a view of selected loan portfolios disaggregated by North American Industry Classification (“NAICs”) code as of December 31, 2023: | | | | | | | | | | | | | | | | | | | | |
| Real Estate | Wholesale and Manufacturing | Retail and Hospitality | Transportation and Warehousing | Other | Total |
| Commercial real estate — owner occupied | 4% | 27% | 18% | 17% | 34% | 100% |
| Commercial real estate — non-owner occupied | 75% (1) | 1% | 10% | 2% | 12% | 100% |
| Commercial and industrial | 4% | 26% | 21% | 12% | 37% | 100% |
(1) Includes approximately $252.9 million of office real estate, or 10% of gross loans.
See Asset Quality for further discussion of industry-specific risks.
|
| | | | | | | | | | | | | | | | | | | | | | | | | | | | | | | | | | | |
| | | As of December 31, |
| | | 2017 | | 2016 | | 2015 | | 2014 | | 2013 |
| | | Amount Outstanding | | % of Total Loans and Leases | | Amount Outstanding | | % of Total Loans and Leases | | Amount Outstanding | | % of Total Loans and Leases | | Amount Outstanding | | % of Total Loans and Leases | | Amount Outstanding | | % of Total Loans and Leases |
| | | (Dollars in Thousands) |
| Commercial real estate: | | | | | | | | | | | | | | | | | | | | |
| Commercial real estate — owner occupied | | $ | 200,387 |
| | 13.3 | % | | $ | 176,459 |
| | 12.2 | % | | $ | 176,322 |
| | 12.3 | % | | $ | 163,884 |
| | 12.8 | % | | $ | 141,164 |
| | 14.4 | % |
| Commercial real estate — non-owner occupied | | 470,236 |
| | 31.3 |
| | 473,158 |
| | 32.6 |
| | 436,901 |
| | 30.5 |
| | 417,962 |
| | 32.6 |
| | 341,695 |
| | 34.8 |
|
| Land development | | 40,154 |
| | 2.7 |
| | 56,638 |
| | 3.9 |
| | 59,779 |
| | 4.2 |
| | 56,836 |
| | 4.4 |
| | 40,946 |
| | 4.2 |
|
| Construction | | 125,157 |
| | 8.3 |
| | 101,206 |
| | 7.0 |
| | 100,625 |
| | 7.0 |
| | 64,324 |
| | 5.0 |
| | 27,762 |
| | 2.8 |
|
| Multi-family | | 136,978 |
| | 9.1 |
| | 92,762 |
| | 6.4 |
| | 80,254 |
| | 5.6 |
| | 72,578 |
| | 5.7 |
| | 62,758 |
| | 6.4 |
|
| 1-4 family | | 44,976 |
| | 3.0 |
| | 45,651 |
| | 3.1 |
| | 50,304 |
| | 3.5 |
| | 36,182 |
| | 2.8 |
| | 30,786 |
| | 3.1 |
|
| Total commercial real estate | | 1,017,888 |
| | 67.7 |
| | 945,874 |
| | 65.2 |
| | 904,185 |
| | 63.1 |
| | 811,766 |
| | 63.3 |
| | 645,111 |
| | 65.7 |
|
| Commercial and industrial | | 429,002 |
| | 28.5 |
| | 450,298 |
| | 31.0 |
| | 472,193 |
| | 33.0 |
| | 416,654 |
| | 32.5 |
| | 293,552 |
| | 29.9 |
|
| Direct financing leases, net | | 30,787 |
| | 2.1 |
| | 30,951 |
| | 2.1 |
| | 31,093 |
| | 2.2 |
| | 34,165 |
| | 2.7 |
| | 26,065 |
| | 2.7 |
|
| Consumer and other: | | | | | | | | | | | | | | | | | | | | |
| Home equity and second mortgage | | 7,262 |
| | 0.5 |
| | 8,412 |
| | 0.6 |
| | 8,237 |
| | 0.6 |
| | 7,866 |
| | 0.6 |
| | 5,272 |
| | 0.5 |
|
| Other | | 18,099 |
| | 1.2 |
| | 16,329 |
| | 1.1 |
| | 16,319 |
| | 1.1 |
| | 11,341 |
| | 0.9 |
| | 11,972 |
| | 1.2 |
|
| Total consumer and other | | 25,361 |
| | 1.7 |
| | 24,741 |
| | 1.7 |
| | 24,556 |
| | 1.7 |
| | 19,207 |
| | 1.5 |
| | 17,244 |
| | 1.8 |
|
| Total gross loans and leases receivable | | 1,503,038 |
| | 100.0 | % | | 1,451,864 |
| | 100.0 | % | | 1,432,027 |
| | 100.0 | % | | 1,281,792 |
| | 100.0 | % | | 981,972 |
| | 100.0 | % |
| Less: | | | | | | | | | | | | | | | | | | | | |
| Allowance for loan and lease losses | | 18,763 |
| | | | 20,912 |
| | | | 16,316 |
| | | | 14,329 |
| | | | 13,901 |
| | |
| Deferred loan fees | | 1,443 |
| | | | 1,189 |
| | | | 1,062 |
| | | | 1,025 |
| | | | 1,021 |
| | |
| Loans and leases receivable, net | | $ | 1,482,832 |
| | | | $ | 1,429,763 |
| | | | $ | 1,414,649 |
| | | | $ | 1,266,438 |
| | | | $ | 967,050 |
| | |
The following table shows the scheduled contractual maturities of the Bank’s consolidated gross loans and leases receivable, as well as the dollar amount of such loans and leases which are scheduled to mature after one year whichand have fixed or adjustable interest rates, as of December 31, 2017.2023.
| | | | | | | | | | | | | | | | | | | | | | | | | | | | | | | | | | | | | | |
| | Amounts Due | | Interest Terms On Amounts Due after One Year |
| | | In One Year
or Less | | After One
Year through
Five Years | | After Five
Years | | Total | | Fixed Rate | | Variable
Rate |
| | | (In Thousands) |
| Commercial real estate: | | | | | | | | | | | | |
| Owner-occupied | | $ | 20,274 | | | $ | 137,966 | | | $ | 98,239 | | | $ | 256,479 | | | $ | 191,383 | | | $ | 44,822 | |
| Non-owner occupied | | 96,300 | | | 364,249 | | | 312,945 | | | 773,494 | | | 325,712 | | | 351,483 | |
| Construction | | 48,652 | | | 77,203 | | | 67,225 | | | 193,080 | | | 22,604 | | | 121,825 | |
| Multi-family | | 25,669 | | | 162,554 | | | 262,306 | | | 450,529 | | | 102,604 | | | 322,256 | |
| 1-4 family | | 1,140 | | | 11,514 | | | 13,635 | | | 26,289 | | | 18,708 | | | 6,440 | |
| Commercial and industrial | | 306,864 | | | 665,954 | | | 133,017 | | | 1,105,835 | | | 241,606 | | | 557,364 | |
| Consumer and other | | 9,992 | | | 33,886 | | | 434 | | | 44,312 | | | 28,452 | | | 5,868 | |
| | $ | 508,891 | | | $ | 1,453,326 | | | $ | 887,801 | | | $ | 2,850,018 | | | $ | 931,069 | | | $ | 1,410,058 | |
|
| | | | | | | | | | | | | | | | | | | | | | | | |
| | | Amounts Due | | Interest Terms On Amounts Due after One Year |
| | | In One Year or Less | | After One Year through Five Years | | After Five Years | | Total | | Fixed Rate | | Variable Rate |
| | | (In Thousands) |
| Commercial real estate: | | | | | | | | | | | | |
| Owner-occupied | | $ | 27,389 |
| | $ | 116,367 |
| | $ | 56,631 |
| | $ | 200,387 |
| | $ | 115,067 |
| | $ | 57,931 |
|
| Non-owner occupied | | 80,544 |
| | 252,436 |
| | 137,256 |
| | 470,236 |
| | 294,060 |
| | 95,631 |
|
| Land development | | 29,102 |
| | 11,052 |
| | — |
| | 40,154 |
| | 8,695 |
| | 2,357 |
|
| Construction | | 26,731 |
| | 46,108 |
| | 52,318 |
| | 125,157 |
| | 47,022 |
| | 51,404 |
|
| Multi-family | | 10,846 |
| | 74,979 |
| | 51,153 |
| | 136,978 |
| | 90,743 |
| | 35,389 |
|
| 1-4 family | | 10,228 |
| | 27,690 |
| | 7,058 |
| | 44,976 |
| | 32,755 |
| | 1,993 |
|
| Commercial and industrial | | 176,221 |
| | 204,346 |
| | 48,435 |
| | 429,002 |
| | 93,860 |
| | 158,921 |
|
| Direct financing leases | | 29 |
| | 20,717 |
| | 10,041 |
| | 30,787 |
| | 30,759 |
| | — |
|
| Consumer and other | | 5,503 |
| | 18,333 |
| | 1,525 |
| | 25,361 |
| | 16,082 |
| | 3,776 |
|
| | | $ | 366,593 |
| | $ | 772,028 |
| | $ | 364,417 |
| | $ | 1,503,038 |
| | $ | 729,043 |
| | $ | 407,402 |
|
Commercial Real Estate. The Bank originates owner-occupied and non-owner-occupied commercial real estate loans which have fixed or adjustable rates and generally terms of upthree to five10 years and amortizations of up to 2530 years on existing commercial real estate and new construction.estate. The Bank also originates loans to construct commercial properties and complete land development projects. The Bank’s construction loans generally have terms of six to 24 months with fixed or adjustable interest rates and fees that are due at the time of origination. Loan proceeds are disbursed in increments as construction progresses and as project inspections warrant.
Commercial real estate lending typically involves larger loan principal amounts than residential mortgage loans or consumer loans and, therefore, have the potential for larger losses on a per loan basis. The repayment of thesecommercial real estate loans generally is dependent on sufficient income from the occupants of properties securing the loans to cover operating expenses and debt service. Payments on commercial real estate loans are often dependent on external market conditions impacting the successful operation or development of the property or business involved. Therefore, repayment of such loans is often more sensitive than other types of loans to adverse conditions in the real estate market or the general economy, which are outside the borrower’s control. In the event that the cash flow from the property is reduced, the borrower’s ability to repay the loan could be negatively impacted. The deterioration of one or a few of these loans could cause a material increase in our level of nonperforming loans, which would result in a loss of revenue from these loans and could result in an increase in the provision for loan and leasecredit losses and an increase in charge-offs, all of which could have a material adverse impact on our net income. Additionally, many of these loans have real estate as a primary or secondary component of collateral. The market value of real estate can fluctuate significantly in a short period of time as a result of economic conditions. Adverse developments affecting real estate values in one or more of our markets could impact collateral coverage associated with the commercial real estate segment of our portfolio, possibly leading to increased specific reserves or charge-offs, which would adversely affect profitability. Of the $1.018 billion of commercial real estate loans outstanding as of December 31, 2017, $31.6 million were originated by our asset-based lending subsidiary.
Commercial and Industrial. The Bank’s commercial and industrial loan portfolio is comprised of loans for a variety of purposes which principally are secured by inventory, accounts receivable, equipment, machinery, and other corporate assets and are advanced within limits prescribed by our loan policy. The majority of such loans are secured and typically backed by personal guarantees of the owners of the borrowing business. Of the $429.0 million$1.106 billion of commercial and industrialC&I loans outstanding as of December 31, 2017, $109.32023, $464.3 million were conventional C&I loans and $728.0 million were originated by ourthe FBSF subsidiary. FBSF products consists of equipment financing, asset-based lending, subsidiary, $6.2 million were originated by our factored receivable business line and $9.5 million were originated by our equipment finance and leasing subsidiary. The asset-based loans, including accounts receivable purchased on a full recourse basis, are typically secured by the borrower’s accounts receivablefinancing, and inventory. These loans generally have higher interest rates and non-origination fees collected in lieu of interest and the collateral supporting the credit is closely monitored. The equipment finance loans may provide 100%floorplan financing.
Our commercial loans are typically larger in amount than loans to individual consumers and, therefore, have the potential for larger losses on a per loan basis. Additionally, asset-based borrowers are usually highly leveraged and/or have inconsistent historical earnings. Significant adverse changes in various industries could cause rapid declines in values and collectability associated with those business assets resulting in inadequate collateral coverage that may expose us to future losses. An increase in specific reserves and charge-offs may have a material adverse impact on our results of operations.
Small Business Administration. As an SBA Preferred Lender, the Bank originates loans partially guaranteed by the SBA to small businesses under the 7(a) Loan Program. Historically we have sold the guaranteed portions of our SBA 7(a) loans in the secondary market and retained the non-guaranteed portions. As of December 31, 2017, the Corporation’s ownership of SBA loans that were included in the commercial and industrial loan portfolio was $36.8 million, while the amount included in the commercial real estate loan portfolio was $15.5 million.
Direct Financing Leases. Direct financing leases initiated through FBEF are originated with a fixed rate and typically a term of seven years or less. It is customary in the leasing industry to provide 100% financing; however, FBEF will, from time-to-time, require a down payment or lease deposit to provide a credit enhancement. As of December 31, 2017, the Bank had $30.8 million in net direct financing receivables outstanding.
FBEF leases machinery and equipment to clients under leases which qualify as direct financing leases for financial reporting and as operating leases for income tax purposes. Under the direct financing method of accounting, the minimum lease payments to be received under the lease contract, together with the estimated unguaranteed residual value (approximating 3% to 20% of the cost of the related equipment), are recorded as lease receivables when the lease is signed and the lease property is delivered to the client. The excess of the minimum lease payments and residual values over the cost of the equipment is recorded as unearned lease income. Unearned lease income is recognized over the term of the lease on a basis which results in a level rate of return on the unrecovered lease investment. Lease payments are recorded when due under the lease contract. Residual value is the estimated fair market value of the equipment on lease at lease termination. In estimating the equipment’s
fair value, FBEF relies on historical experience by equipment type and manufacturer, published sources of used equipment pricing, internal evaluations and, when available, valuations by independent appraisers, adjusted for known trends.
Our commercial leases are typically larger in amount than leases to individual consumers and, therefore, have the potential for larger losses on an individual lease basis. Significant adverse changes in various industries could cause rapid declines in values of leased equipment resulting in inadequate collateral coverage that may expose us to future losses. An increase in specific reserves and charge-offs may have a material adverse impact on our results of operations.
Consumer and Other. The Bank originates a small amount of consumer loans consisting of home equity, first and second mortgage, credit cardmortgages, and other personal loans for professional and executive clients of the Bank.
Asset Quality
Non-performing loans and leases increased $1.2$16.9 million, or 4.7%462.9%, to $26.4$20.6 million at December 31, 20172023 compared to $25.2$3.7 million at December 31, 2016.
2022. Our total impairednon-performing assets consisted of the following as of the dates indicated.following:
| | | | | | | | | | | | | | | | | | | | |
| | | As of December 31, |
| | | 2023 | | 2022 | | | | | | |
| | | (Dollars in Thousands) |
| Non-performing loans and leases | | | | | | | | | | |
| Commercial real estate: | | | | | | | | | | |
| Commercial real estate – owner occupied | | $ | — | | | $ | — | | | | | | | |
| Commercial real estate – non-owner occupied | | — | | | — | | | | | | | |
| Construction | | — | | | — | | | | | | | |
| Multi-family | | — | | | — | | | | | | | |
| 1-4 family | | 22 | | | 30 | | | | | | | |
| Total non-performing commercial real estate | | 22 | | | 30 | | | | | | | |
| Commercial and industrial | | 20,575 | | | 3,629 | | | | | | | |
| Consumer and other | | — | | | — | | | | | | | |
| Total non-accrual loans and leases | | 20,597 | | | 3,659 | | | | | | | |
| Repossessed assets, net | | 247 | | | 95 | | | | | | | |
| Total non-performing assets | | $ | 20,844 | | | $ | 3,754 | | | | | | | |
| | | | | | | | | | |
| | | | | | | | | | |
| | | | | | | | | | |
| Total non-performing loans and leases to gross loans and leases | | 0.72 | % | | 0.15 | % | | | | | | |
| Total non-performing assets to gross loans and leases plus repossessed assets, net | | 0.73 | % | | 0.15 | % | | | | | | |
| Total non-performing assets to total assets | | 0.59 | % | | 0.13 | % | | | | | | |
| Allowance for credit losses to gross loans and leases | | 1.16 | % | | 0.99 | % | | | | | | |
| Allowance for credit losses to non-performing loans and leases | | 160.21 | % | | 662.20 | % | | | | | | |
|
| | | | | | | | | | | | | | | | | | | | |
| | | As of December 31, |
| | | 2017 | | 2016 | | 2015 | | 2014 | | 2013 |
| | | (Dollars in Thousands) |
| Non-accrual loans and leases | | | | | | | | | | |
| Commercial real estate: | | | | | | | | | | |
| Commercial real estate – owner occupied | | $ | 7,021 |
| | $ | 2,223 |
| | $ | 2,907 |
| | $ | 500 |
| | $ | 339 |
|
| Commercial real estate – non-owner occupied | | 34 |
| | 1,609 |
| | 1,678 |
| | 286 |
| | 283 |
|
| Land development | | 2,626 |
| | 3,440 |
| | 4,393 |
| | 4,932 |
| | 5,422 |
|
| Construction | | 2,872 |
| | 2,918 |
| | 397 |
| | — |
| | — |
|
| Multi-family | | — |
| | — |
| | 2 |
| | 17 |
| | 31 |
|
| 1-4 family | | 1,161 |
| | 1,937 |
| | 2,550 |
| | 690 |
| | 521 |
|
| Total non-accrual commercial real estate | | 13,714 |
| | 12,127 |
| | 11,927 |
| | 6,425 |
| | 6,596 |
|
| Commercial and industrial | | 12,321 |
| | 12,463 |
| | 9,136 |
| | 2,318 |
| | 8,011 |
|
| Direct financing leases, net | | — |
| | — |
| | 38 |
| | — |
| | — |
|
| Consumer and other: | | | | | | | | | | |
| Home equity and second mortgage | | — |
| | — |
| | 542 |
| | 329 |
| | 453 |
|
| Other | | 354 |
| | 604 |
| | 655 |
| | 720 |
| | 795 |
|
| Total non-accrual consumer and other loans | | 354 |
| | 604 |
| | 1,197 |
| | 1,049 |
| | 1,248 |
|
| Total non-accrual loans and leases | | 26,389 |
| | 25,194 |
| | 22,298 |
| | 9,792 |
| | 15,855 |
|
| Foreclosed properties, net | | 1,069 |
| | 1,472 |
| | 1,677 |
| | 1,693 |
| | 333 |
|
| Total non-performing assets | | 27,458 |
| | 26,666 |
| | 23,975 |
| | 11,485 |
| | 16,188 |
|
| Performing troubled debt restructurings | | 332 |
| | 717 |
| | 1,735 |
| | 2,003 |
| | 371 |
|
| Total impaired assets | | $ | 27,790 |
| | $ | 27,383 |
| | $ | 25,710 |
| | $ | 13,488 |
| | $ | 16,559 |
|
| Total non-accrual loans and leases to gross loans and leases | | 1.76 | % | | 1.74 | % | | 1.56 | % | | 1.61 | % | | 1.55 | % |
| Total non-performing assets to gross loans and leases plus foreclosed properties, net | | 1.83 | % | | 1.83 | % | | 1.67 | % | | 1.65 | % | | 1.72 | % |
| Total non-performing assets to total assets | | 1.53 | % | | 1.50 | % | | 1.35 | % | | 1.28 | % | | 1.28 | % |
| Allowance for loan and lease losses to gross loans and leases | | 1.25 | % | | 1.44 | % | | 1.14 | % | | 1.42 | % | | 1.69 | % |
| Allowance for loan and lease losses to non-accrual loans and leases | | 71.10 | % | | 83.00 | % | | 73.17 | % | | 87.68 | % | | 109.05 | % |
As of December 31, 2017 and 2016, $8.8 million and $12.8 million of the non-accrual loans were considered troubled debt restructurings, respectively. As noted in the table above, non-performing assets consisted of non-accrualnon-performing loans and leases and foreclosed propertiesrepossessed assets totaling $27.5$20.8 million, or 1.53%0.59% of total assets, as of December 31, 2017,2023, an increase in non-performing assets of 3.0%,$17.1 million, or $792,000,455.2%, from December 31, 2016. Impaired2022. As of December 31, 2023 and 2022, our allowance for credit losses to total non-performing loans and leases as of December 31, 2017was 160.21% and 2016 also included $332,000 and $717,000, respectively, of loans that are performing troubled debt restructurings, which are considered impaired662.20%, respectively. The increase in non-performing assets was primarily due to one fully-collateralized, $8.8 million ABL loan which defaulted in the concessionsecond quarter 2023. Excluding the ABL loan, non-performing assets totaled $12.0 million, or 0.34% of total assets. The liquidation process has transitioned into Chapter 7 bankruptcy, likely delaying final resolution until the second half of 2024. The Corporation’s ABL loans are rigorously underwritten and fully collateralized, historically resulting in terms, but are meetingno losses in the restructured payment termsevent of a default. Another driver in non-performing assets, is an increase in defaults in Equipment Finance driven by transportation and therefore are not on non-accrual status.logistics borrowers, which management believes is consistent with the cyclical nature of this industry.
We use a wide variety of available metrics to assess the overall asset quality of the portfolio and no one metric is used independently to make a final conclusion as to the asset quality of the portfolio. Non-performing assets as a percentage of total assets increased slightly to 1.53%0.59% at December 31, 20172023 from 1.50%0.13% at December 31, 2016.
2022. As of December 31, 2017, the payment performance2023, 99.20% of ourloans were current compared to 99.8% as of December 31, 2022. The decrease in current status is primarily driven by higher past-due Equipment Finance borrowers.
We reviewed loans and leases did not pointwith exposure to anycertain industries:
•Transportation and Logistics, Equipment Finance - 2% of total loans - Management considered the following: 7% of Equipment Finance Transportation loans are rated Category IV and defaults from these borrowers are driving an increase in charge-offs and new areasreserves. Based on our reserve methodology for individually and collectively evaluated loans, we believe our reserves related to this industry to be appropriate
•Transportation and Logistics, other than Equipment Finance - 4% of concern, as approximately 98.7%total loans - Management considered the following: Less than 1% of the Transportation loans outside of Equipment Finance are rated Category IV. Collateral on these loans includes commercial real estate, business assets, and equipment. Based on these and other borrower-specific considerations, no additional reserve requirements were identified.
•Office, Commercial Real Estate - 10% of total portfolio wasloans - Management considered the following: office exposure is concentrated in the Wisconsin markets where local market vacancy rates are below national rates, a current payment status. majority of the loan maturity dates are beyond 2031 with the borrower paying a fixed rate, either directly or through an interest rate swap, and there are no non-performing loans in the portfolio. Based on these and other borrower-specific considerations, no additional reserve requirements were identified.
•Multifamily, Commercial Real Estate - 16% of total loans - Management considered the following: multifamily exposure is concentrated in the Wisconsin markets where local market vacancy rates are below national rates, a majority of the loan maturity dates are beyond 2029 with the borrower paying a fixed rate, either directly or through an interest rate swap, and there are no non-performing loans in the portfolio. Based on these and other borrower-specific considerations, no additional reserve requirements were identified.
We also monitor our asset quality through our established categories as defined in Note 4 – Loans, Leases Receivable, and Allowance for Credit Losses of ourthe Consolidated Financial Statements. As we continue to actively monitor the credit quality of our loan and lease portfolios, we may identify additional loans and leases for which the borrowers or lessees are having difficulties making the required principal and interest payments based upon factors including, but not limited to, the inability to sell the underlying collateral, inadequate cash flow from the operations of the underlying businesses, liquidation events, or bankruptcy filings. We are proactively working with our impairednon-performing loan borrowers to find meaningful solutions to difficult situations that are in the best interests of the Bank.
Additional information about non-performing loans is as follows:
| | | | | | | | | | | | | | | | | | | | |
| | | As of December 31, |
| | | 2023 | | 2022 | | | | | | |
| | | (In Thousands) |
| Individually evaluated loans and leases with no specific reserves required | | $ | 9,691 | | | $ | 1,067 | | | | | | | |
| Individually evaluated loans and leases with specific reserves required | | 10,906 | | | 2,592 | | | | | | | |
| Total individually evaluated loans and leases | | 20,597 | | | 3,659 | | | | | | | |
| Less: Specific reserve (included in allowance for credit losses) | | 5,990 | | | 1,650 | | | | | | | |
| Net non-performing loans and leases | | $ | 14,607 | | | $ | 2,009 | | | | | | | |
| Average non-performing loans and leases | | $ | 10,450 | | | $ | 4,899 | | | | | | | |
| | | | | | | | | | |
| | | For the years ended December 31, |
| | | 2023 | | 2022 | | | | | | |
| | | (In Thousands) |
| Foregone interest income attributable to non-performing loans and leases | | $ | 1,431 | | | $ | 400 | | | | | | | |
| Less: Interest income recognized on non-performing loans and leases | | 266 | | | 1,436 | | | | | | | |
| Net foregone interest income on non-performing loans and leases | | $ | 1,165 | | | $ | (1,036) | | | | | | | |
Loans and leases with no specific reserves represent non-performing loans where the collateral, less cost to sell, equals or exceeds the net realizable value of the loan. As part of the underwriting process, as well as our ongoing monitoring efforts, we evaluate sufficiency of collateral to protect our interest in the related loan or lease. As a result of this practice, a significant portion of our outstanding balance of non-performing loans or leases may not require additional specific reserves or require only a minimal amount of required specific reserve. Management is proactive in recording charge-offs to bring loans to their net realizable value in situations where it is determined with certainty that we will not recover the entire amount of our principal. This practice may lead to a lower allowance for credit loss to non-performing loans and leases ratio as compared to our peers or industry expectations.
In 2017,2023, as well as in all previous reporting periods, there were no loans over 90 days past due and still accruing interest. Loans and leases greater than 90 days past due are considered impairednon-performing and are placed on non-accrual status. Cash received while a loan or a lease is on non-accrual status is generally applied solely against the outstanding principal. If collectability of the contractual principal and interest is not in doubt, payments received may be applied to both interest due on a cash basis and principal.
Additional information about impaired loans as
Allowance for the years indicated was as follows:Credit Losses
|
| | | | | | | | | | | | | | | | | | | | |
| | | As of December 31, |
| | | 2017 | | 2016 | | 2015 | | 2014 | | 2013 |
| | | (In Thousands) |
| Impaired loans and leases with no impairment reserves | | $ | 16,975 |
| | $ | 11,345 |
| | $ | 15,175 |
| | $ | 11,270 |
| | $ | 8,200 |
|
| Impaired loans and leases with impairment reserves required | | 9,746 |
| | 14,566 |
| | 8,858 |
| | 525 |
| | 8,026 |
|
| Total impaired loans and leases | | 26,721 |
| | 25,911 |
| | 24,033 |
| | 11,795 |
| | 16,226 |
|
| Less: Impairment reserve (included in allowance for loan and lease losses) | | 4,491 |
| | 5,599 |
| | 1,113 |
| | 290 |
| | 402 |
|
| Net impaired loans and leases | | $ | 22,230 |
| | $ | 20,312 |
| | $ | 22,920 |
| | $ | 11,505 |
| | $ | 15,824 |
|
| Average impaired loans and leases | | $ | 33,164 |
| | $ | 22,986 |
| | $ | 11,443 |
| | $ | 14,474 |
| | $ | 12,084 |
|
| | | | | | | | | | | |
| | | For the years ended December 31, |
| | | 2017 | | 2016 | | 2015 | | 2014 | | 2013 |
| | | (In Thousands) |
| Interest income attributable to impaired loans and leases | | $ | 2,695 |
| | $ | 1,617 |
| | $ | 750 |
| | $ | 870 |
| | $ | 887 |
|
| Less: Interest income recognized on impaired loans and leases | | 454 |
| | 614 |
| | 87 |
| | 740 |
| | 221 |
|
| Net foregone interest income on impaired loans and leases | | $ | 2,241 |
| | $ | 1,003 |
| | $ | 663 |
| | $ | 130 |
| | $ | 666 |
|
Loans with no specific reserves required represent impaired loans where the collateral, based upon current information, is deemed to be sufficient or that have been partially charged-off to reflect our net realizable value of the loan. When analyzing the adequacy of collateral, we obtain external appraisals as appropriate. Our policy regarding commercial real estate appraisals requires the utilization of appraisers from our approved list, the performance of independent reviews to monitor the quality of such appraisals and receipt of new appraisals for impaired loans at least annually, or more frequently as circumstances warrant. We make adjustments to the appraisals for appropriate selling costs. In addition, the ordering of appraisals and review of the appraisals are performed by individuals who are independent of the business development process. Based on the specific evaluation of the collateral of each impaired loan, we believe the reserve for impaired loans was appropriate at December 31, 2017. However, we cannot provide assurance that the facts and circumstances surrounding each individual impaired loan will not change and that the specific reserve or current carrying value will not be different in the future, which may require additional charge-offs or specific reserves to be recorded. Smaller balance loans (individually less than $50,000) are collectively evaluated for impairment as allowed under applicable accounting standards.
Foreclosed properties are recorded at the lower of cost or net realizable value. If, at the time of foreclosure, the fair value less cost to sell is lower than the carrying value of the loan, the difference, if any, is charged to theThe allowance for loan and leasecredit losses prior(“ACL”) increased $7.0 million, or 29.1%, to the transfer to foreclosed property. The fair value is based on an appraisal, discounted cash flow analysis (the majority of which is based on current occupancy and lease rates) or a verifiable offer to purchase. After foreclosure, valuation allowances or future write-downs to net realizable value are charged directly to non-interest expense. Foreclosed properties were $1.1$31.3 million as of December 31, 2017, compared to $1.52023 from $24.2 million as of December 31, 2016. We recorded
impairment losses of approximately $403,000, $7,000 and $36,000 for the years ended December 31, 2017, 2016 and 2015, respectively. Net gain on sales of existing foreclosed property inventory was $547,000 for the year ended December 31, 2017, which reflected the sale of the Corporation’s previously disclosed Overland Park full-service banking location during the fourth quarter of 2017. Net losses on sales were $115,000 for the year ended December 31, 2016 compared to net gains of $207,000 for the year ended December 31, 2015. We continue to evaluate possible exit strategies on our impaired loans when foreclosure action may be probable and our level of foreclosed assets may increase in the future. Loans are transferred to foreclosed properties when we claim ownership rights to the properties.
2022. A summary of
foreclosed propertiesthe activity
in the ACL, inclusive of reserves for
unfunded credit commitments, follows: | | | | | | | | | | | | | | | | | | | | |
| | | Year Ended December 31, |
| | | 2023 | | 2022 | | | | | | |
| | | (Dollars in Thousands) |
| Allowance at beginning of period | | $ | 24,230 | | | $ | 24,336 | | | | | | | |
| Impact of adoption of ASC 326 | | 1,818 | | | — | | | | | | | |
| Charge-offs: | | | | | | | | | | |
| Commercial real estate | | | | | | | | | | |
| Commercial real estate — owner occupied | | — | | | — | | | | | | | |
| Commercial real estate — non-owner occupied | | — | | | — | | | | | | | |
| Construction | | — | | | — | | | | | | | |
| Multi-family | | — | | | — | | | | | | | |
| 1-4 family | | — | | | — | | | | | | | |
| Commercial and industrial | | (1,781) | | | (909) | | | | | | | |
| Consumer and other | | — | | | (70) | | | | | | | |
| Total charge-offs | | (1,781) | | | (979) | | | | | | | |
| Recoveries: | | | | | | | | | | |
| Commercial real estate | | | | | | | | | | |
| Commercial real estate — owner occupied | | 8 | | | 4,260 | | | | | | | |
| Commercial real estate — non-owner occupied | | 1 | | | 2 | | | | | | | |
| Construction | | — | | | — | | | | | | | |
| Multi-family | | — | | | — | | | | | | | |
| 1-4 family | | 40 | | | — | | | | | | | |
| Commercial and industrial | | 479 | | | 437 | | | | | | | |
| Consumer and other | | 20 | | | 42 | | | | | | | |
| Total recoveries | | 548 | | | 4,741 | | | | | | | |
| Net charge-offs | | (1,233) | | | 3,762 | | | | | | | |
| Provision for credit losses | | 8,182 | | | (3,868) | | | | | | | |
| Allowance at end of period | | $ | 32,997 | | | $ | 24,230 | | | | | | | |
| Net charge-offs as a percent of average gross loans and leases | | 0.05 | % | | (0.16) | % | | | | | | |
During the years ended December 31, 2017, 2016first quarter of 2023, the Corporation adopted ASU 2016-13, including the CECL methodology for estimating the ACL. This standard was adopted using a modified retrospective approach on January 1, 2023, resulting in a $484,000 increase to the ACL and 2015 is as follows:
|
| | | | | | | | | | | | |
| | | For the Year Ended December 31, |
| | | 2017 | | 2016 | | 2015 |
| | | (In Thousands) |
| Balance at the beginning of the period | | $ | 1,472 |
| | $ | 1,677 |
| | $ | 1,693 |
|
| Transfer of loans to foreclosed properties, at lower of cost or fair value | | 1,112 |
| | — |
| | 341 |
|
| Impairment adjustments | | (403 | ) | | (7 | ) | | (36 | ) |
| Net book value of properties sold | | (1,112 | ) | | (198 | ) | | (321 | ) |
| Balance at the end of the period | | $ | 1,069 |
| | $ | 1,472 |
| | $ | 1,677 |
|
Allowance for Loan and Lease Losses
The allowance for loan and lease lossesa $1.3 million increase to the unfunded credit commitments reserve. In addition to the adoption of ASU 2016-13, the increase in ACL as a percentagepercent of gross loans and leases was 1.25% as of December 31, 2017principally due to increase in specific reserves and 1.44% as of December 31, 2016. Non-accrual loanschanges to quantitative and leases as a percentage of gross loans and leases increased slightly to 1.76% at December 31, 2017 compared to 1.74% at December 31, 2016. qualitative model factors.
During the year ended December 31, 2017, we2023, the Corporation recorded net charge-offs on impairednon-performing loans and leases of approximately $8.3$1.2 million, which included $8.8$1.8 million of charge-offs and $519,000$548,000 of recoveries. During the year ended December 31, 2016,2022, we recorded net charge-offsrecoveries on impairednon-performing loans and leases of approximately $3.2$3.8 million, which included $3.6 million$979,000 of charge-offs and $372,000$4.7 million of recoveries.
As ofThe Corporation recognized $8.2 million provision expense for the year ended December 31, 2017 and 2016, our allowance2023, compared to $3.9 million provision benefit for loan and lease losses to total non-accrual loans and leasesthe year ended December 31, 2022. The provision expense for the year ended December 31, 2023 was 71.10% and 83.00%, respectively. This ratio decreased primarily due to the collateral positions related to additional non-accrual loans and leases outstanding during 2017. Despite a $1.3$4.3 million increase in non-accrualthe specific reserves on individually evaluated loans and leases,a $3.7 million increase in the general reserve due to loan growth. These increases were partially offset by a $1.5 million reduction in the general reserve from improving historical loss rates.
The increase in ACL was primarily driven by loan growth and net increase in specific reserves related to non-accrualon loans in Equipment Finance and leases decreased $1.1 million. Impaired loansSBA within the Commercial and leases exhibit weaknesses that inhibit repaymentIndustrial portfolio. Equipment Finance had higher defaults from borrowers in compliancethe
transportation and logistics industry which management believes is consistent with the original terms of the note or lease. However, the measurement of impairment on loans and leases may not always result in a specific reserve included in the allowance for loan and lease losses. As part of the underwriting process, as well as our ongoing monitoring efforts, we try to ensure that we have appropriate collateral to protect our interest in the related loan or lease. As a resultcyclical nature of this practice, a significant portion of our outstanding balance of non-performing loans or leases either does not require additional specific reserves or requires only a minimal amount of required specific reserve, as we believe the loans and leases are adequately collateralized as of the measurement period. In addition, management is proactive in recording charge-offs to bring loans to their net realizable value in situations where it is determined with certainty that we will not recover the entire amount of our principal. This practice may lead to a lower allowance for loan and lease loss to non-accrual loans and leases ratio as compared to our peers or industry expectations. As asset quality strengthens, our allowance for loan and lease losses is measured more through general characteristics, including historical loss experience, of our portfolio rather than through specific identification and we would therefore expect this ratio to rise. Conversely, if we identify further impaired loans, this ratio could fall if the impaired loans are adequately collateralized and therefore require no specific or general reserve.industry. Given our business practices and evaluation of our existing loan and lease portfolio, we believe this coverage ratio is appropriate for the probable losses inherent in our loan and lease portfolio as of December 31, 2017.
To determine the level and composition of the allowance for loan and lease losses, we break out the portfolio by segments with similar risk characteristics. First, we evaluate loans and leases for potential impairment classification. We analyze each loan and lease identified as impaired on an individual basis to determine a specific reserve based upon the estimated value of the underlying collateral for collateral-dependent loans, or alternatively, the present value of expected cash flows. For each segment of loans and leases that has not been individually evaluated, management segregates the Bank’s loss factors into a quantitative general reserve component based on historical loss rates throughout the defined look back period. The quantitative general reserve component also considers an estimate of the historical loss emergence period, which is the period of time between the event that triggers the loss to the charge-off of that loss. The methodology also focuses on evaluation of several qualitative factors for each portfolio category, including but not limited to: management’s ongoing review and grading of the loan and lease portfolios, consideration of delinquency experience, changes in the size of the loan and lease
portfolios, existingcurrent economic conditions, levelthe Corporation expects continued stress within this group of loans and leases subject to more frequent review by management, changesborrowers in underlying collateral, concentrations of loans to specific industries and other qualitative factors that could affect credit losses.2024.
When it is determined that we will not receive our entire contractual principal or the loss is confirmed, we record a charge against the allowance for loan and lease loss reserve to bring the loan or lease to its net realizable value. Many of the impaired loans as of December 31, 2017 are collateral dependent. It is typically part of our process to obtain appraisals on impaired loans and leases that are primarily secured by real estate or equipment at least annually, or more frequently as circumstances warrant. As we have completed new appraisals and/or market evaluations, we have found that in general real estate values have been stable or improved; however, in specific situations current fair values collateralizing certain impaired loans were inadequate to support the entire amount of the outstanding debt. Foreclosure actions may have been initiated on certain of these commercial real estate and other mortgage loans.
As a result of our review process, we have concluded that an appropriate allowanceACL for loan and lease losses for the existing loan and lease portfolio was $18.8is $33.0 million, or 1.25%1.16% of gross loans and leases, at December 31, 2017. Taking into consideration net charge-offs of $8.3 million, the required provision for loan and lease losses was $6.2 million for the year ended December 31, 2017.2023. However, given ongoing complexities with current workout situations and the uncertainty surrounding future economic conditions, further charge-offs, and increased provisions for loan and leasecredit losses may be recorded if additional facts and circumstances lead us to a different conclusion. In addition, various federal and state regulatory agencies review the allowance for loan and lease losses. These agencies could require certain loan and lease balances to be classified differently or charged off when their credit evaluations differ from those of management, based on their judgments about information available to them at the time of their examination.
A summary of the activity in the allowance for loan and lease losses follows:
|
| | | | | | | | | | | | | | | | | | | | |
| | | Year Ended December 31, |
| | | 2017 | | 2016 | | 2015 | | 2014 | | 2013 |
| | | (Dollars in Thousands) |
| Allowance at beginning of period | | $ | 20,912 |
| | $ | 16,316 |
| | $ | 14,329 |
| | $ | 13,901 |
| | $ | 15,400 |
|
| Charge-offs: | | | | | | | | | | |
| Commercial real estate | | | | | | | | | | |
| Commercial real estate — owner occupied | | (9 | ) | | (41 | ) | | — |
| | — |
| | — |
|
| Commercial real estate — non-owner occupied | | (80 | ) | | — |
| | (653 | ) | | (631 | ) | | (792 | ) |
| Construction and land development | | — |
| | (948 | ) | | — |
| | — |
| | (71 | ) |
| Multi-family | | — |
| | — |
| | — |
| | — |
| | — |
|
| 1-4 family | | (38 | ) | | (205 | ) | | (120 | ) | | — |
| | (33 | ) |
| Commercial and industrial | | (8,621 | ) | | (2,273 | ) | | (701 | ) | | (600 | ) | | (14 | ) |
| Direct financing leases | | — |
| | — |
| | — |
| | — |
| | — |
|
| Consumer and other | | | | | | | | | | |
| Home equity and second mortgage | | — |
| | (114 | ) | | (32 | ) | | — |
| | — |
|
| Other | | (92 | ) | | (13 | ) | | (7 | ) | | (2 | ) | | (4 | ) |
| Total charge-offs | | (8,840 | ) | | (3,594 | ) | | (1,513 | ) | | (1,233 | ) | | (914 | ) |
| Recoveries: | | | | | | | | | | |
| Commercial real estate | | | | | | | | | | |
| Commercial real estate — owner occupied | | 42 |
| | — |
| | 2 |
| | 8 |
| | 1 |
|
| Commercial real estate — non-owner occupied | | 2 |
| | 74 |
| | — |
| | 5 |
| | 61 |
|
| Construction and land development | | 102 |
| | 129 |
| | 70 |
| | — |
| | 281 |
|
| Multi-family | | — |
| | — |
| | — |
| | 14 |
| | — |
|
| 1-4 family | | 7 |
| | 71 |
| | 32 |
| | 17 |
| | 10 |
|
| Commercial and industrial | | 323 |
| | 91 |
| | 5 |
| | 369 |
| | 11 |
|
| Direct financing leases | | — |
| | — |
| | — |
| | — |
|
| 5 |
|
| Consumer and other | | | | | | | | | | |
| Home equity and second mortgage | | 3 |
| | 4 |
| | 4 |
| | 12 |
| | 5 |
|
| Other | | 40 |
| | 3 |
| | 1 |
| | — |
| | — |
|
| Total recoveries | | 519 |
| | 372 |
| | 114 |
| | 425 |
| | 374 |
|
| Net charge-offs | | (8,321 | ) | | (3,222 | ) | | (1,399 | ) | | (808 | ) | | (540 | ) |
| Provision for loan and lease losses | | 6,172 |
| | 7,818 |
| | 3,386 |
| | 1,236 |
| | (959 | ) |
| Allowance at end of period | | $ | 18,763 |
| | $ | 20,912 |
| | $ | 16,316 |
| | $ | 14,329 |
| | $ | 13,901 |
|
| Net charge-offs as a percent of average gross loans and leases | | 0.57 | % | | 0.22 | % | | 0.10 | % | | 0.08 | % | | 0.06 | % |
We review our methodology and periodically adjust allocation percentages of the allowance by segment, as reflected in the following table. Within the specific categories, certain loans or leases have been identified for specific reserve allocations as well as the whole category of that loan type or lease being reviewed for a general reserve based on the foregoing analysis of trends and overall balance growth within that category.
The table below shows our allocation of the allowance for loan and lease losses by loan portfolio segments at the dates indicated.segments.The allocation of the allowance by segment is management’s best estimate of the inherent risk in the respective loan segments.portfolio as described in Allowance for Credit Losses in the Critical Accounting Policies and Estimatessection. Despite the specific allocation noted in the table below, the entire allowance is available to cover any loss.
| | | | | | | | | | | | | | | | | | | | | | | | | | | | | | | | | | | | | | |
| | | As of December 31, |
| | | 2023 | | 2022 | | | | | | |
| | Balance | | (a) | | Balance | | (a) | | | | | | | | | | | | |
| | | (Dollars in Thousands) |
| Loan and lease portfolios: | | | | | | | | | | | | | | | | | | | | |
| Commercial real estate | | $ | 12,170 | | | 0.72 | % | | $ | 12,560 | | | 0.81 | % | | | | | | | | | | | | |
| Commercial and industrial | | 18,710 | | | 1.69 | | | 11,128 | | | 1.30 | | | | | | | | | | | | | |
| Consumer and other | | 395 | | | 0.89 | | | 542 | | | 1.13 | | | | | | | | | | | | | |
| Total allowance for loan losses | | $ | 31,275 | | | 1.10 | % | | $ | 24,230 | | | 0.99 | % | | | | | | | | | | | | |
Reserve for unfunded credit commitments (b) | | $ | 1,722 | | | | | $ | — | | | | | | | | | | | | | | | |
| Total allowance for credit losses | | $ | 32,997 | | | 1.16 | % | | $ | 24,230 | | | 0.99 | % | | | | | | | | | | | | |
|
| | | | | | | | | | | | | | | | | | | | | | | | | | | | | | | | | | | |
| | | As of December 31, |
| | | 2017 | | 2016 | | 2015 | | 2014 | | 2013 |
| | | Balance | | (a) | | Balance | | (a) | | Balance | | (a) | | Balance | | (a) | | Balance | | (a) |
| | | (Dollars in Thousands) |
| Loan and lease segments: | | | | | | | | | | | | | | | | | | | | |
| Commercial real estate | | $ | 10,131 |
| | 1.00 | % | | $ | 12,384 |
| | 1.31 | % | | $ | 11,220 |
| | 1.24 | % | | $ | 8,619 |
| | 1.06 | % | | $ | 9,055 |
| | 1.40 | % |
| Commercial and industrial | | 8,225 |
| | 1.79 | % | | 7,970 |
| | 1.66 | % | | 4,387 |
| | 0.87 | % | | 5,492 |
| | 1.22 | % | | 4,573 |
| | 1.43 | % |
| Consumer and other | | 407 |
| | 1.60 | % | | 558 |
| | 2.26 | % | | 709 |
| | 2.89 | % | | 218 |
| | 1.14 | % | | 273 |
| | 1.58 | % |
| Total allowance for loan and lease losses | | $ | 18,763 |
| | 1.25 | % | | $ | 20,912 |
| | 1.44 | % | | $ | 16,316 |
| | 1.14 | % | | $ | 14,329 |
| | 1.12 | % | | $ | 13,901 |
| | 1.42 | % |
| |
(a) | Allowance for loan losses category as a percentage of total loans by category. |
(b)Not required prior to adoption of ASC 326 on January 1, 2023
The allowancechange in ACL as a percentage of gross loans and leases for loan and lease losses allocated to the commercial real estate portfolio decreased in 2017 primarilyportfolios was due to the reversal of a $1.8 millionadditional specific reserve based on the full repayment of the aforementioned Kansas City-based construction loan. This segment also benefited from a net recovery position during 2017, which reduced the historical loss rates applied to the quantitative general reserve. The allowance for loan and lease losses allocated to the commercialreserves in Commercial and industrial portfolio increasedand change in both 2017 and 2016. These increases were primarily due to elevated specific reserves, as well as 2017 and 2016 net charge-offsquantitative factors in all portfolios in the adoption of $8.3 million and $2.2 million, respectively, which increased the historical loss rates applied to the quantitative general reserve.
ASC 326. Although we believe the allowance for loan and lease lossesACL was appropriate based on the current level of loan and lease delinquencies, non-accrual loans and leases, trends in charge-offs, economic conditions, and other factors as of December 31, 2017,2023, there can be no assurance that future adjustments to the allowance will not be necessary.
Deposits
As of December 31, 2017,2023, deposits decreasedincreased by $144.5$628.6 million to $1.394$2.797 billion from $1.539$2.168 billion at December 31, 2016.2022. The decreaseincrease in deposits was primarily due to increases in wholesale deposits and transaction accounts of $255.5 million and $227.0 million, respectively. The large increase in wholesale deposits is primarily driven by a decrease inshift from FHLB advances to wholesale deposits to manage interest rate risk and liquidity by utilizing the levelmost efficient and cost-effective source of wholesale deposits, specifically brokeredfunds to match-fund our fixed-rate loan portfolio. In addition, certificates of deposit and money market accounts increased by $133.4 million and $12.7 million, respectively. Both transaction and money market accounts increased due to the successful execution of client deposits gathered through internet deposit listing services, which declined by $108.7 million to $308.0 million at December 31, 2017 from $416.7 million at December 31, 2016. Consistent with our funding philosophy to match-fund long-term fixed rate loans with the most cost effective source of wholesale funds,initiatives and change in 2017 we began replacing maturing brokeredclient preferences. Additionally, certificate of deposit with the more cost effective FHLB advancesaccounts saw an increase primarily due to a change in order to lower our FDIC assessment rate. While we expect to continue this strategy in 2018, we do not expect brokered certificatesclient interest rate expectations.
The following table presents the composition of the Bank’s consolidated deposits at the dates indicated.deposits.
| | | | | | | | | | | | | | | | | | | | | | | | | | | | | | | | | | | | | | |
| | As of December 31, |
| | 2023 | | 2022 | | | | | | |
| | Balance | | % of Total Deposits | | Balance | | % of Total Deposits | | | | | | | | | | | | |
| | (Dollars in Thousands) |
| Non-interest-bearing transaction accounts | | $ | 445,376 | | | 15.9 | % | | $ | 537,107 | | | 24.8 | % | | | | | | | | | | | | |
| Interest-bearing transaction accounts | | 895,319 | | | 32.0 | | | 576,601 | | | 26.6 | | | | | | | | | | | | | |
| Money market accounts | | 711,245 | | | 25.4 | | | 698,505 | | | 32.2 | | | | | | | | | | | | | |
| Certificates of deposit | | 287,131 | | | 10.3 | | | 153,757 | | | 7.1 | | | | | | | | | | | | | |
| Wholesale deposits | | 457,708 | | | 16.4 | | | 202,236 | | | 9.3 | | | | | | | | | | | | | |
| Total deposits | | $ | 2,796,779 | | | 100.0 | % | | $ | 2,168,206 | | | 100.0 | % | | | | | | | | | | | | |
| | | | | | | | | | | | | | | | | | | | |
| Uninsured deposits | | 994,687 | | | | | 967,465 | | | | | | | | | | | | | | | |
| Less: uninsured deposits collateralized by pledged assets | | 17,051 | | | | | 14,326 | | | | | | | | | | | | | | | |
| Total uninsured, net of collateralized deposits | | $ | 977,636 | | | 35.0 | % | | $ | 953,139 | | | 44.0 | % | | | | | | | | | | | | |
|
| | | | | | | | | | | | | | | | | | | | | | | | | | | | | | | | | | | |
| | | As of December 31, |
| | | 2017 | | 2016 | | 2015 | | 2014 | | 2013 |
| | | Balance | | % of Total Deposits | | Balance | | % of Total Deposits | | Balance | | % of Total Deposits | | Balance | | % of Total Deposits | | Balance | | % of Total Deposits |
| | | (Dollars in Thousands) |
| Non-interest-bearing transaction accounts | | $ | 277,445 |
| | 19.9 | % | | $ | 252,638 |
| | 16.4 | % | | $ | 231,199 |
| | 14.7 | % | | $ | 204,328 |
| | 14.2 | % | | $ | 151,275 |
| | 13.4 | % |
| Interest-bearing transaction accounts | | 217,625 |
| | 15.6 |
| | 183,992 |
| | 12.0 |
| | 165,921 |
| | 10.5 |
| | 104,199 |
| | 7.2 |
| | 77,004 |
| | 6.8 |
|
| Money market accounts | | 515,077 |
| | 36.9 |
| | 627,090 |
| | 40.8 |
| | 612,642 |
| | 38.8 |
| | 575,766 |
| | 40.0 |
| | 456,065 |
| | 40.4 |
|
| Certificates of deposit | | 76,199 |
| | 5.5 |
| | 58,454 |
| | 3.8 |
| | 79,986 |
| | 5.1 |
| | 126,635 |
| | 8.8 |
| | 51,979 |
| | 4.6 |
|
| Wholesale deposits | | 307,985 |
| | 22.1 |
| | 416,681 |
| | 27.1 |
| | 487,483 |
| | 30.9 |
| | 427,340 |
| | 29.8 |
| | 393,532 |
| | 34.8 |
|
| Total deposits | | 1,394,331 |
| | 100.0 | % | | 1,538,855 |
| | 100.0 | % | | 1,577,231 |
| | 100.0 | % | | 1,438,268 |
| | 100.0 | % | | 1,129,855 |
| | 100.0 | % |
Deposit Period-end deposit balances associated with in-market relationships will fluctuate based upon maturity of time deposits, client demands for the use of their cash, and our ability to service and maintain existing and new client relationships. Deposits continue to be the primary source of the Bank’s funding for lending and other investment activities. A variety of accounts are designed to attract both short- and long-term deposits. These accounts include non-interest-bearing transaction accounts,
interest-bearing transaction accounts, money market accounts, and time deposits.certificates of deposit. Deposit terms offered by the Bank vary according to the minimum balance required, the time period the funds must remain on deposit, the rates and products offered by competitors, and the interest rates charged on other sources of funds, among other factors. Our Bank’s in-market deposits are obtained primarily from the South Central, Northeast and Southeast regions of Wisconsin and the greater Kansas City Metro.
Our strategic efforts continue to be focused on adding in-market relationships. We measure the success of in-market deposit gathering efforts based on the number and average balances of our deposit accounts as compared torather than ending balances due to the volatility of some of our larger relationships. Our Bank’s in-market deposits are obtained primarily from the South Central, Northeastern and Southeastern regions of Wisconsin and the greater Kansas City area. Average in-market deposits for the year ended December 31, 20172023 were approximately $1.097$2.098 billion, or 70.15%75.0% of total bank funding. Total bank funding is defined as total deposits plus FHLB advances. This compares to average in-market deposits of $1.124$1.929 billion, or 69.98%80.6% of total bank funding, for 2016.2022. Refer to Note 89 - Deposits in ourthe Consolidated Financial Statements for additional information regarding our deposit composition.
The following table sets forth the amount and maturities of the Bank’s certificates of deposit and term wholesale deposits at December 31, 2017.2023.
| | | | | | | | | | | | | | | | | | | | | | | | | | | | | | | | |
| Interest Rate | | Three Months and Less | | Over Three Months Through Six Months | | Over Six Months Through Twelve Months | | Over Twelve Months | | Total |
| | (In Thousands) |
| 0.00% to 0.99% | | $ | 712 | | | $ | — | | | $ | 233 | | | $ | 408 | | | $ | 1,353 | |
| 1.00% to 1.99% | | — | | | 176 | | | 2,084 | | | — | | | 2,260 | |
| 2.00% to 2.99% | | 2,332 | | | — | | | 5,195 | | | 2,552 | | | 10,079 | |
| 3.00% to 3.99% | | 10,185 | | | 2,507 | | | 484 | | | 39,103 | | | 52,279 | |
| 4.00% to 4.99% | | 110,400 | | | 17,120 | | | 13,181 | | | 116,131 | | | 256,832 | |
| 5.00% and greater | | 317,805 | | | 21,005 | | | 33,226 | | | — | | | 372,036 | |
| | $ | 441,434 | | | $ | 40,808 | | | $ | 54,403 | | | $ | 158,194 | | | $ | 694,839 | |
|
| | | | | | | | | | | | | | | | | | | | |
| Interest Rate | | Three Months and Less | | Over Three Months Through Six Months | | Over Six Months Through Twelve Months | | Over Twelve Months | | Total |
| | | (In Thousands) |
| 0.00% to 0.99% | | $ | 5,948 |
| | $ | 8,682 |
| | $ | 10,532 |
| | $ | 1,530 |
| | $ | 26,692 |
|
| 1.00% to 1.99% | | 21,777 |
| | 48,092 |
| | 76,941 |
| | 152,494 |
| | 299,304 |
|
| 2.00% to 2.99% | | — |
| | — |
| | — |
| | 58,188 |
| | 58,188 |
|
| | | $ | 27,725 |
| | $ | 56,774 |
| | $ | 87,473 |
| | $ | 212,212 |
| | $ | 384,184 |
|
At December 31, 2017,2023, time deposits included $13.4$120.2 million of certificates of deposit and wholesale deposits in denominations greater than or equal to $250,000. Of these certificates, $1.0$87.7 million are scheduled to mature in three months or less, $4.9$5.5 million in greater than three through six months, $1.8$24.5 million in greater than six through twelve months and $5.7$2.5 million in greater than twelve months.
Of the total time deposits outstanding as of December 31, 2017, $172.02023, $536.6 million are scheduled to mature in 2018, $74.82024, $19.1 million in 2019, $86.12025, $50.4 million in 2020, $21.52026, $73.8 million in 2021, $4.82027, and $12.8 million in 2022 and $25.0 million thereafter.2028. As of December 31, 2017,2023, we have $49.0 million ofno wholesale certificates of deposit which the Bank has the right to call prior to the scheduled maturity. These certificates have original maturities ranging from 3-18 years with options to call after the first six to twelve months of issuing the certificates with monthly, quarterly or semi-annually call options thereafter.
Borrowings
We had total borrowings of $217.9$330.9 million as of December 31, 2017, an increase2023, a decrease of $148.2$125.9 million, or 212.7%27.6%, from $69.7$456.8 million at December 31, 2016.2022. The primary reason for the increaseBank utilized more wholesale deposits in borrowings was due to the increase inlieu of FHLB advances consistent with our funding philosophy to match-fund long-term fixedmanage interest rate loans withrisk and liquidity by utilizing the most efficient and cost effective source of wholesale funds.
Consistent with our funding philosophy to use the most efficient and cost effectivecost-effective source of wholesale funds we expect the balanceto match-fund our fixed-rate loan portfolio. Total wholesale funding as a percentage of FHLB advances to increase in future periods as we continue to reduce our brokered certificate of deposit portfolio to help reduce the recent increase in our FDIC insurance assessment rate resulting from the FDIC’s revised methodology made effective July 1, 2016. Our operating range of wholesale funds to total bank funding is 30%-40%. Wholesale funds include brokered certificateswas 25.2% as of deposit, deposits gathered from internet listing services and FHLB advances.December 31, 2023 compared to 25.1% as of December 31, 2022. Total bank funding is defined as total deposits plus FHLB advances. At
As of December 31, 2017,2023, the ratioCorporation had $20,000 of other borrowings, which consisted of sold tax credit investments accounted for as secured borrowings because they did not qualify for true sale accounting. As of December 31, 2022, the Corporation had other borrowings of $6.1 million which consisted of sold loans accounted for as secured borrowings because they did not qualify for true sale accounting.
Consistent with our funding philosophy to manage interest rate risk, we will use the most efficient and cost effective source of wholesale fundsfunds. We utilize FHLB advances to total bankthe extent we maintain an adequate level of excess borrowing capacity for liquidity and contingency funding was 31.2%.purposes and pricing remains favorable in comparison to the wholesale deposit alternative. We will use FHLB advances and/or brokered certificates of deposit in specific maturity periods needed, typically three to five years, to match-fund fixed rate loans and effectively mitigate the interest rate risk measured through our asset/liability management process and to support asset growth initiatives while taking into consideration our operating goals and desired level of usage of wholesale funds. Please refer to the section titled Liquidity and Capital Resources, below, for further information regarding our use and monitoring of wholesale funds.
The following table sets forth the outstanding balances, weighted average balances, and weighted average interest rates for our borrowings (short-term and long-term) as indicated.
| | | | | | | | | | | | | | | | | | | | | | | | | | | | | | | | | | | | | | | | | | | | |
| | | December 31, 2023 | | December 31, 2022 | | |
| | Balance | | Weighted
Average
Balance | | Weighted
Average
Rate | | Balance | | Weighted
Average
Balance | | Weighted
Average
Rate | | | | | | |
| | | (Dollars in Thousands) |
| Federal funds purchased | | $ | — | | | $ | 3 | | | 5.37 | % | | $ | — | | | $ | 14 | | | 7.42 | % | | | | | | |
| FHLB advances | | 281,500 | | | 351,990 | | | 2.52 | | | 416,380 | | | 414,191 | | | 1.70 | | | | | | | |
| Line of credit | | — | | | 38 | | | 7.26 | | | — | | | 85 | | | 2.78 | | | | | | | |
| Other borrowings | | 20 | | | 600 | | | 8.33 | | | 6,088 | | | 8,624 | | | 5.23 | | | | | | | |
| Subordinated notes payable | | 49,396 | | | 38,250 | | | 5.16 | | | 34,340 | | | 35,095 | | | 5.06 | | | | | | | |
Junior subordinated notes(1) | | — | | | — | | | — | | | — | | | 2,429 | | | 20.75 | | | | | | | |
| | | $ | 330,916 | | | $ | 390,881 | | | 2.79 | | | $ | 456,808 | | | $ | 460,438 | | | 2.12 | | | | | | | |
|
| | | | | | | | | | | | | | | | | | | | | | | | | | | | | | | | | |
| | | December 31, 2017 | | December 31, 2016 | | December 31, 2015 |
| | | Balance | | Weighted
Average
Balance | | Weighted
Average
Rate | | Balance | | Weighted
Average
Balance | | Weighted
Average
Rate | | Balance | | Weighted
Average
Balance | | Weighted
Average
Rate |
| | | (Dollars in Thousands) |
| Federal funds purchased | | $ | — |
| | $ | 66 |
| | 1.22 | % | | $ | — |
| | $ | 178 |
| | 0.92 | % | | $ | — |
| | $ | 237 |
| | 0.86 | % |
| FHLB advances | | 183,500 |
| | 105,276 |
| | 1.40 |
| | 33,578 |
| | 14,485 |
| | 0.97 |
| | 8,198 |
| | 14,779 |
| | 0.75 |
|
| Line of credit | | 10 |
| | 328 |
| | 3.64 |
| | 1,010 |
| | 2,079 |
| | 3.26 |
| | 1,592 |
| | 678 |
| | 9.66 |
|
Other borrowings(1) | | 675 |
| | 1,241 |
| | 14.50 |
| | 2,590 |
| | 1,739 |
| | 7.64 |
| | 2,510 |
| | 1,619 |
| | 3.18 |
|
| Subordinated notes payable | | 23,713 |
| | 23,161 |
| | 6.93 |
| | 22,498 |
| | 22,467 |
| | 7.13 |
| | 22,440 |
| | 22,410 |
| | 7.14 |
|
| Junior subordinated notes | | 10,019 |
| | 10,011 |
| | 11.11 |
| | 10,004 |
| | 9,997 |
| | 11.07 |
| | 9,990 |
| | 9,982 |
| | 11.14 |
|
| | | $ | 217,917 |
| | $ | 140,083 |
| | 3.14 |
| | $ | 69,680 |
| | $ | 50,945 |
| | 6.03 |
| | $ | 44,730 |
| | $ | 49,705 |
| | 5.94 |
|
| Short-term borrowings | | $ | 37,010 |
| | | | | | $ | 20,588 |
| | | | | | $ | 7,010 |
| | | | |
| Long-term borrowings | | 180,907 |
| | | | | | 49,092 |
| | | | | | 37,720 |
| | | | |
| | | $ | 217,917 |
| | | | | | $ | 69,680 |
| | | | | | $ | 44,730 |
| | | | |
| |
(1) | Weighted average rate of other borrowings reflects the cost of prepaying(1) Weighted average rate of junior subordinated notes reflects the accelerated amortization of subordinated debt issuance costs as a secured borrowing during the second quarter of 2017. |
The following table sets forth maximum amounts outstanding at each month-end for specific types of short-term borrowings for the periods indicated. The maximum month-end balance has been the result of using advances with originalthe early redemption of the junior subordinated notes during the first quarter of 2022.
A summary of annual maturities of upborrowings at December 31, 2023 is as follows:
| | | | | | | | |
| (In Thousands) | | |
| Maturities during the year ended December 31, | | |
| 2024 | | $ | 120,520 | |
| 2025 | | 48,000 | |
| 2026 | | 65,000 | |
| 2027 | | 28,000 | |
| 2028 | | — | |
| Thereafter | | 69,396 | |
| | $ | 330,916 | |
TheCorporationissuednewsubordinateddebenturesasofSeptember29,2023.Theaggregateprincipalamountofthenewlyissuedsubordinateddebentureswas$15.0millionwhichqualifiedasTier2capital.Thesubordinateddebenturesbearafixedinterestrateof8.0%withamaturitydateofSeptember29,2033.TheCorporationmay,atitsoption,redeemthedebentures,inwholeorpart,atanytimeafterthefifthanniversaryofissuance.
Refer to 30 days to accommodate the orderly issuance of permanent wholesale funds, eitherNote 10 – FHLB Advances, Other Borrowings and Subordinated Notes and Debentures in the formConsolidated Financial Statements for additional information on the terms of brokered certificates of deposit or FHLB advances.Corporation’s current debt instruments.
|
| | | | | | | | | | | | |
| | | Year Ended December 31, |
| | | 2017 | | 2016 | | 2015 |
| | | (In Thousands) |
| Maximum month-end balance: | | | | | | |
| FHLB advances | | $ | 49,000 |
| | $ | 45,500 |
| | $ | 29,000 |
|
Stockholders’ Equity
As of December 31, 2017,2023, stockholders’ equity was $169.3$289.6 million, or 9.4%8.26% of total assets, compared to stockholders’ equity of $161.7$260.6 million, or 9.1%8.76% of total assets, as of December 31, 2016.2022. Stockholders’ equity increased by $7.6$28.9 million during the year ended December 31, 20172023 attributable to net income of $11.9$37.0 million for the year ended December 31, 2017,2023, partially offset by preferred and common stock dividend declarations of $4.5$875,000 and $7.6 million, respectively, and stock repurchases of $2.0 million of the $5.0 million authorized under the repurchase program discussed below.
On March 4, 2022, the Corporation issued 12,500 shares, or $12.5 million in aggregate liquidation preference, of 7.0% Fixed-to-Floating Rate Non-Cumulative Perpetual Preferred Stock, Series A, par value $0.01 per share, with a liquidation preference of $1,000 per share (the “Series A Preferred Stock”) in a private placement to institutional investors. The net proceeds received from the issuance of the Series A Preferred Stock were $12.0 million.
Non-bank Consolidated Subsidiaries
First Madison Investment Corp. FMIC is7.0% per annum, payable quarterly, in arrears, on March 15, June 15, September 15 and December 15 of each year up to, but excluding, March 15, 2027. For each dividend period from and including March 15, 2027, dividends will be paid at a wholly-owned operating subsidiaryfloating rate of FBB incorporated in the StateThree-Month Term SOFR plus a spread of Nevada in 1993. FMIC was organized for the purpose of managing a portion of FBB’s investment portfolio. FMIC invests in marketable securities. As an operating subsidiary, FMIC’s results of operations are consolidated with FBB’s for financial and regulatory purposes. FBB’s investment in FMIC was $154.3 million at December 31, 2017, gross loans outstanding were $29.9 million and net income for539 basis points per annum. During the year ended December 31, 2017 was $1.8 million. This compares2023, the Corporation paid $875,000 in preferred cash dividends. The Series A Preferred Stock is perpetual and has no stated maturity. The Corporation may redeem the Series A Preferred Stock at its option at a redemption price equal to $1,000 per share, plus any declared and unpaid dividends (without regard to any undeclared dividends), subject to regulatory approval, on or after March 15, 2027 or within 90 days following a regulatory capital treatment event, in accordance with the terms of the Series A Preferred Stock.
On January 27, 2023, the Board of Directors of the Corporation approved a share repurchase program. The program authorized the repurchase by the Corporation of up to $5 million of its total outstanding shares of common stock over a period of approximately twelve months, ending January 31, 2024. As of December 31, 2023, the Corporation had repurchased a total investment of $153.0 million, no gross loans and net income of $1.665,112 shares for approximately $2.0 million at and foran average cost of $30.72 per share. At this time, the year ended December 31, 2016.Corporation does not expect to adopt a new plan to replace the recently expired plan due to strong balance sheet growth.
First Business Capital Corp. FBCC is a wholly-owned subsidiary Under the recently expired share repurchase program, authorized the repurchase of FBB formed in 1995 and headquartered in Madison, Wisconsin. FBCC is an asset-based financing company establishedshares from time to meet the financing needs of companies that are generally unable to obtain traditional commercial lending products. FBCC underwrites its loans with additional emphasis placed on collateral coverage as the companies it finances are growing rapidly, highly leveraged or undergoing a turn-around period. Through its FBF division, FBCC purchases accounts receivable on a full recourse basis as one additional alternative to meet the financing needs of its client base. FBB’s investment in FBCC at December 31, 2017 was $38.7 million, gross loans outstanding were $147.1 million and net income for the year ended December 31, 2017 was $3.1 million. This compares to a total investment of $35.5 million, gross loans of $151.7 million and net income of $4.6 million at and for the year ended December 31, 2016.
First Business Equipment Finance, LLC. FBEF, headquartered in Madison, Wisconsin, was formed in 1998 for the purpose of originating leases and extending credittime in the formopen market or negotiated transactions at prevailing market rates, or by other means in accordance with federal securities laws.
Rimrock Road Investment Fund, LLC. Rimrock, formerly known as FBB Real Estate, LLC, is a wholly-owned subsidiary of FBB and was originally formed in 2009 for the purpose of holding and liquidating real estate and other assets acquired through foreclosure or other legal proceedings. In 2014, Rimrock’s purpose was changed to reflect its qualified equity investment in a Madison, Wisconsin community development project, including the financing and ownership of a property that generates federal new market tax credits. FBB’s total investment in Rimrock at December 31, 2017 was $2.8 million and Rimrock had net income of $15,000 for the year ended December 31, 2017. This compares to a total investment of $2.8 million and net income of $1,000 at and for the year ended December 31, 2016.
BOC Investment, LLC. BOC is a wholly-owned subsidiary of FBB and was formed in 2015 for the purpose of holding its equity investment in a Madison, Wisconsin historic development project. The investment provided federal historic tax credits upon the completion of the restoration project. FBB’s total investment in BOC at December 31, 2017 was $4.0 million and BOC had net income of $131,000 for the year ended December 31, 2017. This compares to a total investment of $3.9 million and a net income of $422,000 at and for the year ended December 31, 2016.
Mitchell Street Apartments Investment, LLC. Mitchell is a wholly-owned subsidiary of FBB and was formed in 2016 for the purpose of holding its equity investment in a Milwaukee, Wisconsin historic development project. The investment provided federal and state historic tax credits upon the completion of the restoration project. FBB’s total investment in Mitchell at December 31, 2017 was $1.4 million and Mitchell had $803,000 net income for the year ended December 31, 2017. This compares to a total investment of $563,000 and a no net income at and for the year ended December 31, 2016.
ABKC Real Estate, LLC. ABKCRE is a wholly-owned subsidiary of FBB and was formed for the purpose of holding and liquidating real estate and other assets acquired by FBB through foreclosure or other legal proceedings. ABKCRE was established in 2017. FBB’s total investment in ABKCRE at December 31, 2017 was $1.2 million and a net loss of $238,000 for the year ended December 31, 2017.
FBB Tax Credit Investment, LLC. FBB Tax Credit, formerly known as FBB-Milwaukee Real Estate, LLC, is a wholly-owned subsidiary of FBB and was originally formed in 2012 for the purpose of holding and liquidating real estate and other assets acquired by FBB through foreclosure or other legal proceedings. In 2017, FBB Tax Credit’s purpose was changed to facilitate investments in federal and state tax credits.
LIQUIDITY AND CAPITAL RESOURCES
We expect The Corporation expects to meet ourits liquidity needs through existing cash on hand, established cash flow sources, ourits third party senior line of credit, and dividends received from the Bank. While the Bank is subject to certain generally applicable regulatory limitations regarding theirits ability to pay dividends to the Corporation, we do not believe that the Corporation will be adversely affected by these dividend limitations. The Corporation’s principal liquidity requirements at December 31, 20172023 were the interest payments due on subordinated notes and junior subordinated notes.cash dividends payable to both common and preferred stockholders. During 20172023 and 2016,2022, FBB declared and paid dividends totaling $13.5$12.1 million and $7.0$2.0 million, respectively. The capital ratios of the Corporation and its subsidiariesBank met all applicable regulatory capital adequacy requirements in effect on December 31, 2017,2023, and continue to meet the heightened requirements imposed by Basel III, including the capital conservation buffer that went into effect January 1, 2016.buffer. The Corporation’s and the Bank’s respective Boards of DirectorsBoard and management teams adhere to the appropriate regulatory guidelines on decisions which affect their capital positions, including but not limited to, decisions relating to the payment of dividends and increasing indebtedness.
The Bank maintains liquidity by obtaining funds from several sources. The Bank’s primary source of funds are principal and interest payments on loans receivable and mortgage-related securities, deposits, and other borrowings, such as federal funds and FHLB advances. The scheduled payments of loans and mortgage-related securities are generally a predictable source of funds. Deposit flows and loan prepayments, however, are greatly influenced by general interest rates, economic conditions, and competition.
We view on-balance-sheetreadily accessible liquidity as a critical element to maintaining adequate liquidity to meet our cash and collateral obligations. We define our on-balance-sheetreadily accessible liquidity as the total of our short-term investments, our unencumbered securities available-for-sale, and our unencumbered pledged loans. As of December 31, 20172023 and 2016,2022, our immediate on-balance-sheetreadily accessible liquidity was $401.1$734.4 million and $543.1$449.6 million, respectively. At December 31, 20172023 and 2016,2022, the Bank has $17.7had $106.8 million and $40.9$76.5 million on deposit with the FRB recorded in short-term investments, respectively. Any excess funds not used for loan funding or satisfying other cash obligations were maintained as part of our on-balance-sheetreadily accessible liquidity in our interest-bearing accounts with the FRB, as we value the safety and soundness provided by the FRB. We plan to utilize excess liquidity to fund loan and lease portfolio growth, pay down maturing debt, pay down FHLB advances, allow run off of maturing wholesale certificates of deposit or to invest in securities to maintain adequate liquidity at an improved margin. The decline in on-balance-sheet liquidity is primarily attributable to the decrease in cash held on deposit with the FRB and the increased use of FHLB advances.
We had $491.5$739.2 million of outstanding wholesale funds at December 31, 2017,2023, compared to $450.3$618.6 million of wholesale funds as of December 31, 2016,2022, which represented 31.2%24.0% and 28.6%23.9%, respectively, of ending balanceperiod end total bank funding. Wholesale funds include FHLB advances, brokered certificates of deposit, and deposits gathered from internet listing services. Total bank funding is defined as total deposits plus FHLB advances. We are committed to raising in-market deposits while maintaining our overall target mix ofutilizing wholesale funds to match-fund our loan portfolio and in-market deposits.mitigate interest rate risk. Wholesale funds continue to be an efficient and cost effective source of funding for the Bank and allows it to gather funds across a larger geographic base at price levels and maturities that are more attractive than local time deposits when required to raise a similar level of in-market deposits within a short time period. Access to such deposits and borrowings allows us the flexibility to refrain from pursuing single serviceless desirable deposit relationships in markets that have experienced unfavorable pricing levels.relationships. In addition, the administrative costs associated with wholesale funds are considerably lower than those that would be incurred to administer a similar level of local deposits with a similar maturity structure. During the time frames necessary to accumulate wholesale funds in an orderly manner, we will use short-term FHLB advances to meet our temporary funding needs. The short-term FHLB advances will typically have terms of one week to one month to cover the overall expected funding demands.
Period-end in-market deposits increased $373.1 million, or 19.0%, to $2.339 billion at December 31, 2023 from $1.966 billion at December 31, 2022 as in-market deposit balances increased due to successful business development efforts, partially offset by deposit movement from money market accounts to, alternative investment options, and clients funding their normal course of business. Our in-market relationships remain stable;continue to grow; however, deposit balances associated with those relationships will fluctuate. We expect to establish new client relationships and continue marketing efforts aimed at increasing the balances in existing clients’ deposit accounts. Nonetheless, we will continue to use wholesale funds in specific maturity periods, typically three to five years, needed to effectively mitigate the interest rate risk measured through our asset/liability management process or in shorter time periods if in-market deposit balances decline. In order to provide for ongoing liquidity and funding, substantially all of our wholesale funds are certificates of deposit which do not allow for withdrawal at the option of the depositor before the stated maturity (with the exception of deposits accumulated through the internet listing service which have the same early withdrawal privileges and fees as do our other in-market deposits) and FHLB advances with contractual maturity terms and no call provisions. The Bank limits the percentage of wholesale funds to total bank funds in accordance with liquidity policies approved by its Board of Directors. The Corporation’s overall operating range of wholesale funds to total bank funds is 30%-40%.Board. The Bank was in compliance with its policy limits as of December 31, 2017.2023.
The Bank was able to access the wholesale funding market as needed at rates and terms comparable to market standards during the year ended December 31, 2017.2023. In the event that there is a disruption in the availability of wholesale funds at maturity, the Bank has managed the maturity structure, in compliance with our approved liquidity policy, so at least one year of maturities could be funded through on-balance-sheetreadily available liquidity. These potential funding sources include deposits maintained at
the FRB or Federal Reserve Discount Window utilizing currently unencumbered securities and acceptable loans as collateral. As of December 31, 2017,2023, the available liquidity was in excess of the stated policy minimum. We believe the Bank will also have access to the unused federal funds lines, cash flows from borrower repayments, and cash flows from security maturities. The Bank also has the ability to raise local market deposits by offering attractive rates to generate the level required to fulfill its liquidity needs.
The Corporation maintains a shelf registration with the Securities and Exchange Commission that would allow the Corporation to offer and sell, from time to time and in one or more offerings, up to $75.0 million in aggregate initial offering price of common and preferred stock, debt securities, warrants, subscription rights, units, or depository shares, or any combination thereof.
The Bank is required by federal regulation to maintain sufficient liquidity to ensure safe and sound operations. We believe that the Bank has sufficient liquidity to match the balance of net withdrawable deposits and short-term borrowings in light of present economic conditions and deposit flows.
During the year ended December 31, 2017,2023, operating activities resulted in a net cash inflow of $22.4 million. Operating cash flows included$52.3 million driven by net income of $11.9 million and a provision for loan and leases losses of $6.2$37.0 million. Net cash used in investing activities for the year ended December 31, 20172023 was $46.4$506.8 million which consisted of $408.6 million in cash outflows to fund net loan growth and reinvestment of$75.7 million in net cash flows within purchases of additional securities, partially offset by cash inflows from maturities, redemptions and paydowns ofoutflows to purchase available-for-sale and held-to-maturity securities. Net cash used inprovided by financing activities for the year ended December 31, 20172023 was $1.0$491.4 million. Financing cash flows included a $628.6 million net increase in deposits and a $134.9 million net increase in FHLB advances, partially offset by cash dividends paid of $7.6 million, and share repurchases of $3.0 million, respectively.
Refer to Note 1012 - Stockholders’ Equity and Regulatory Capital for a summary ofadditional information regarding the Corporation’s and the Bank’s capital ratios and the ratios required by their federal regulators at December 31, 20172023 and 2016.2022.
OFF-BALANCE-SHEET ARRANGEMENTS
Commitments
As of December 31, 2017, the Bank had outstanding commitments to originate $498.0 million of loans and commitments to extend funds to or on behalf of clients pursuant to standby letters of credit of $13.8 million. As of December 31, 2017, the Bank had $283.9 million of commitments to extend funds which extend beyond one year. We do not expect any losses as a result of these funding commitments. We have evaluated outstanding commitments associated with loans that were identified as impaired loans and concluded that there are no additional losses required to be recorded with these unfunded commitments as of December 31, 2017. We believe that additional commitments will not be granted or additional collateral will be provided to support any additional funds advanced. The Bank also utilizes interest rate swaps for the purposes of interest rate risk management, as described further in Note 17 – Derivative Financial Instruments to the Consolidated Financial Statements.
Additionally the Corporation has remaining commitments of $960,000 to Aldine Capital Fund, LP (“Aldine”) and $1.5 million to Aldine Capital Fund II, LP (“Aldine II”), which are private equity mezzanine funding limited partnerships in which we have invested. Aldine began its operations in October 2006 and Aldine II began its operations in March 2013.
We believe adequate capital and liquidity are available from various sources to fund projected commitments.
Contractual Obligations
The following table summarizes our contractual cash obligations at December 31, 2017:
|
| | | | | | | | | | | | | | | | | | | | |
| | | Payments Due by Period |
| | | Less than 1 Year | | 1-3 Years | | 4-5 Years | | More than 5 Years | | Total |
| | | (In Thousands) |
| Operating lease obligations | | $ | 1,648 |
| | $ | 3,121 |
| | $ | 2,807 |
| | $ | 4,820 |
| | $ | 12,396 |
|
| Time deposits | | 171,972 |
| | 160,930 |
| | 26,295 |
| | 24,987 |
| | 384,184 |
|
| Line of credit | | 10 |
| | — |
| | — |
| | — |
| | 10 |
|
| Subordinated notes payable | | — |
| | — |
| | — |
| | 23,713 |
| | 23,713 |
|
| Junior subordinated notes | | — |
| | — |
| | — |
| | 10,019 |
| | 10,019 |
|
| FHLB advances | | 37,000 |
| | 121,000 |
| | 12,000 |
| | 13,500 |
| | 183,500 |
|
| Other borrowings | | — |
| | — |
| | — |
| | 675 |
| | 675 |
|
| Total contractual obligations | | $ | 210,630 |
| | $ | 285,051 |
| | $ | 41,102 |
| | $ | 77,714 |
| | $ | 614,497 |
|
SBA Recourse
In the ordinary course of business, the Corporation sells the guaranteed portions of SBA loans to third parties. In the event of a loss resulting from default and a determination by the SBA that there is a deficiency in the manner in which the loan was originated, funded or serviced by the Corporation, the SBA may require the Corporation to repurchase the loan, deny its liability under the guaranty, reduce the amount of the guaranty, or, if it has already paid under the guaranty, seek recovery of the principal loss related to the deficiency from the Corporation. The Corporation must comply with applicable SBA regulations in order to maintain the guaranty.
Management has assessed the estimated losses inherent in the outstanding guaranteed portions of SBA loans sold in accordance with ASC 450, Contingencies, and determined a recourse reserve based on the probability of future losses for these loans to be $2.8 million at December 31, 2017. The recourse reserve is reported in accrued interest payable and other liabilities on the Consolidated Balance Sheets. See Note 18– Commitments and Contingencies for additional information on the SBA recourse reserve.
2016 COMPARED TO 2015
Top Line Revenue
In 2016, top line revenue increased by approximately 7.5% from the prior year primarily due to an 8.3% increase in average loans and leases and elevated recurring loan fees collected in lieu of interest. Recurring loan fees collected in lieu of interest totaled $5.1 million in 2016, compared to $3.3 million in 2015. The increase in fees collected in lieu of interest can primarily be attributed to above average prepayment activity in our asset-based lending line of business.
Return on Average Assets and Return on Average Equity
ROAA was 0.82% for the year ended December 31, 2016 compared to 0.97% for the year ended December 31, 2015. The decrease in ROAA can be attributed principally to a decrease in earnings as net income decreased 9.7% during the same time period. The decrease in net income was primarily due to both the deterioration in credit quality and related increase in the provision for loan and leases losses, and our decision to temporarily slow SBA production while making investments in the SBA platform. This decrease was partially offset by the aforementioned elevated loan fees collected in lieu of interest. ROAA is a critical metric used by us to measure the profitability of our organization and how efficiently our assets are deployed. ROAA also allows us to better benchmark our profitability to our peers without the need to consider different degrees of leverage which can ultimately influence return on equity measures.
ROAE for the year ended December 31, 2016 was 9.40% compared to 11.36% for the year ended December 31, 2015. The primary reasons for the decrease in ROAE are consistent with the net income variance explanations discussed above. We view ROAE as an important measurement for monitoring profitability and continue to focus on improving our return to our shareholders by enhancing the overall profitability of our client relationships, controlling our expenses and minimizing our costs of credit.
Efficiency Ratio
The efficiency ratio improved to 61.12% for the year ended December 31, 2016, compared to 62.75% for the year ended December 31, 2015, and deteriorated moderately from the 60.06% for the year ended December 31, 2014. We took significant steps in 2016 toward enhancing the Corporation’s long-term efficiency ratio. While loan fees are a regular part of our business model, unusually elevated loan fees and other non-recurring items meaningfully improved our efficiency ratio during 2016. A normalized level of fees and expenses would have resulted in an efficiency ratio in the mid-60% range.
Please refer to the Non-Interest Expense section below for discussion on the primary drivers of the year-over-year change in the efficiency ratio.
Net Interest Income
Net interest income increased by $4.7 million, or 8.0%, for the year ended December 31, 2016 compared to the same period in 2015. The increase in net interest income was primarily attributable to an increase in total loans and leases receivable combined with a $1.8 million increase in recurring loan fees collected in lieu of interest. These items more than offset continued competitive pricing pressure on loans and leases, a decrease in the net accretion of purchase accounting adjustments and an increase in the rate paid on wholesale funds resulting from a steeper yield curve.
The yield on average earning assets for the year ended December 31, 2016 was 4.50% compared to 4.52% for the year ended December 31, 2015. The decrease in the yield on average earning assets was principally due to a decrease in net accretion of purchase accounting adjustments, offset by above average recurring loan fees collected in lieu of interest. Excluding the impact of purchase accounting accretion in both 2015 and 2016 and the $1.8 million increase in loan fees in 2016, the yield on average earning assets for the year ended December 31, 2016 was 4.16% compared to 4.20% for the year ended December 31, 2015. Similarly, excluding net accretion in both 2015 and 2016 and the year over year increase in loan fees, the yield on the loan and lease portfolio declined five basis points to 4.95% for the year ended December 31, 2016 from 5.00% for the year ended December 31, 2015.
A significant portion of our loan and lease portfolio is comprised of fixed rate loans with terms generally from three to five years. As these loans reach their maturity they are renewed at current market rates and subject to competitive pricing pressures. As a result, the overall yield on the loan and lease portfolio, excluding purchase accounting adjustments and elevated recurring loan fees, continued to decline in 2016.
The overall weighted average rate paid on interest-bearing liabilities was 1.06% for the year ended December 31, 2016, an increase of two basis points from 1.04% for the year ended December 31, 2015. The moderate increase in the overall rate paid on interest-bearing liabilities was primarily caused by an increase in rate paid on our wholesale deposits and in-market certificates of deposit, partially offset by a reduction in the average rate paid on our money market accounts. Our continued success of attracting in-market non-interest bearing and interest-bearing demand deposits through new business relationships and increased client deposit balances mitigated the overall increase in our cost of funds driven by a steeper yield curve. The weighted average remaining maturity of our wholesale deposit portfolio remains consistent when compared to the same period in 2015, however, market rates increased moderately throughout 2016 as a result of the Federal Reserve raising rates in both December 2015 and December 2016.
Average in-market deposits - comprised of all transaction accounts, money market accounts and non-wholesale deposits - increased 7.4% to $1.124 billion for the year ended December 31, 2016 from $1.047 billion for the year ended December 31, 2015.
Provision for Loan and Lease Losses
We recorded a provision for loan and lease losses in the amount of $7.8 million for the year ended December 31, 2016 as compared to $3.4 million for the year ended December 31, 2015. Provision for the year ended December 31, 2016 primarily reflected $8.2 million in specific reserves and net charge-offs related to five discrete Kansas City market loan relationships. This increase in provision for loan and leases losses was tempered by improvements in underlying credit metrics in the remaining loan and lease portfolio, as asset quality in our Wisconsin markets remained strong.
Non-Interest Income
Non-interest income, consisting primarily of fees earned for trust and investment services, gains on sale of SBA loans, service charges on deposits and loan fee income, increased by $1.0 million, or 5.7%, to $18.0 million for the year ended December 31, 2016, from $17.0 million for the year ended December 31, 2015. Total non-interest income accounted for 22.1% of our total revenues in 2016 compared to 22.5% in 2015.
Trust and investment services fee income increased by $402,000, or 8.1%, to $5.4 million for the year ended December 31, 2016 compared to $5.0 million for the year ended December 31, 2015. Trust and investment services fee income is primarily driven by the amount of assets under management and administration as well as the mix of business at
different fee structures and can be positively or negatively influenced by the timing and magnitude of volatility within the capital markets. At December 31, 2016, our trust assets under management were $977.0 million, or 19.5% more than the trust assets under management of $817.9 million at December 31, 2015, while our assets under administration increased approximately 11.9%, to $227.4 million at December 31, 2016 from $203.2 million at December 31, 2015.
Gain on sale of SBA loans for the year ended December 31, 2016 totaled $4.4 million, an increase of $401,000, or 10.0%, from the same period in 2015, primarily attributable to greater than expected production in the first and second quarters of 2016.
Service charges on deposits increased by $178,000, or 6.3%, to $3.0 million for the year ended December 31, 2016, compared to $2.8 million for the year ended December 31, 2015. The increase in service charges on deposits is primarily due to our success of attracting in-market fee generating non-interest bearing and interest-bearing demand deposits through new business relationships and increased client deposit balances.
Loan fees increased by approximately $243,000, or 11.1%, to $2.4 million for the year ended December 31, 2016 from $2.2 million for the year ended December 31, 2015. The increase in loan fees is primarily attributable to an increase in fees commensurate with SBA production, specifically the fee income generated from servicing and packaging SBA loans. This increase was partially offset by a decrease in fees earned for issuing letters of credit on behalf of our clients.
Other non-interest income decreased by $122,000 to $1.2 million for the year ended December 31, 2016, compared to $1.4 million for the year ended December 31, 2015. The decrease in other non-interest income was primarily due to a decrease in the gains recognized on the termination of leased assets. This decrease was partially offset by income recognized from our investment in various Community Development Entities.
Non-Interest Expense
Non-interest expense increased by $9.1 million, or 19.1%, to $56.4 million for the year ended December 31, 2016 from $47.4 million for the comparable period of 2015. The increase in non-interest expense was primarily due to an increase in compensation expense, impairment of tax credit investments (which resulted from the recognition of $4.2 million of tax credit benefits) and establishment of a SBA recourse reserve. The increase was partially offset by a decrease in professional fees, marketing costs and collateral liquidation costs.
Compensation expense increased by $3.0 million, or 10.5%, to $31.5 million for the year ended December 31, 2016 from $28.5 million for the year ended December 31, 2015. The increase reflects growth in compensation costs related to our strategic investment in new employees to meet our existing and future growth objectives, annual merit increases and employee benefit costs. Full time equivalent employees as of December 31, 2016 were 257, up 6.2% from 242 at December 31, 2015.
Professional fees expense decreased by $862,000, or 17.6%, to $4.0 million for the year ended December 31, 2016 from $4.9 million for the year ended December 31, 2015. The decrease was consistent with management’s expectations as technology platforms introduced in 2015 were largely put in place in 2016. Management will evaluate additional technology platforms and expand the capabilities of existing platforms going forward as we continue to strategically focus on scaling the Corporation to efficiently execute our growth strategy. For the year ended December 31, 2016, professional fees and fees paid to outside service providers specifically related to information technology (“IT”) projects decreased $508,000 and $439,000, respectively. In addition, fees paid for audit assurance and tax compliance decreased by $126,000. These decreases in professional fees were partially offset by a $391,000 increase in consulting services related to SBA strategic planning and loan review, and website development.
Data processing expense increased by $920,000, or 38.7%, to $3.3 million for the year ended December 31, 2016 from $2.4 million for the year ended December 31, 2015. The increase is principally due to a one-time fee of $794,000 to terminate FBB-KC’s existing core banking system vendor agreement.
Marketing expense decreased by $247,000, or 9.6%, to $2.3 million for the year ended December 31, 2016 from $2.6 million for the year ended December 31, 2015. The favorable variance is primarily due to a purposeful reduction of certain advertising initiatives as management continues to align expense growth with revenue production.
FDIC insurance expense increased by $552,000, or 60.0%, to $1.5 million for the year ended December 31, 2016 from $920,000 for the year ended December 31, 2015. The increase in FDIC insurance expense is commensurate with the pricing changes made effective by the FDIC on July 1, 2016 (which negatively impacts FDIC-insured institutions with brokered deposits greater than 10% of total assets) and reflective of the Corporation’s growth in criticized and risk-weighted assets.
During 2016, in accordance with the applicable accounting guidance, the Corporation recognized $3.3 million in nonrecurring expense due to impairment of a historic tax credit investment, which corresponded with the recognition of $3.8 million in tax credits, providing a net benefit to after-tax earnings of $450,000 for the year ended December 31, 2016. In addition, 2016 expenses included the recognition of $2.1 million in SBA recourse provision for estimated losses in the outstanding guaranteed portions of SBA loans sold. As a result of negative trends in credit quality, the Corporation performed a proactive and rigorous eligibility review of its SBA loan guarantees during 2016. No SBA recourse provision was recognized for the same period in 2015.
Income Taxes
Income tax expense was $2.2 million for the year ended December 31, 2016, compared to $8.4 million for the year ended December 31, 2015 primarily due to the aforementioned recognition of a historic tax credit, as well as lower pre-tax income. The effective tax rate for the year ended December 31, 2016 was 12.6% compared to 33.7% for the year ended December 31, 2015. The Corporation’s effective tax rate may fluctuate as it is impacted by the level and timing of the Corporation’s utilization of tax credits, level of pre-tax income and the extent of tax-exempt investments and loans.
CRITICAL ACCOUNTING POLICIES AND ESTIMATES
The preparation of financial statements in conformity with GAAP requires management to make estimates and assumptions that affect the reported amounts of assets and liabilities and disclosure of contingent assets and liabilities at the date of the financial statements and the reported amounts of revenues and expenses during the reporting period. By their nature, changes in these assumptions and estimates could significantly affect the Corporation’s financial position or results of operations. Actual results could differ from those estimates. Discussed below are certain policies that are critical to the Corporation. We view critical accounting policies to be those which are highly dependent on subjective or complex judgments, estimates and assumptions, and where changes in those estimates and assumptions could have a significant impact on the financial statements.
Allowance for LoanCredit Losses. Management believes the determination of the ACL involves a high degree of judgment and Lease Losses.complexity than its other significant accounting policies. The allowanceACL is calculated with the objective of maintaining a reserve level believed by management to be sufficient to absorb estimated credit losses over the life of an asset or an off-balance sheet credit exposure. Management’s determination of the adequacy of the ACL is based on periodic evaluations of past events, including historical credit loss experience on financial assets with similar risk characteristics, current conditions, and reasonable and supportable forecasts that affect the collectability of the remaining cash flows over the contractual term of the financial assets. However, this evaluation has subjective components requiring material estimates, including expected default probabilities, the expected loss given default, the amounts and timing of expected future cash flows, and estimated losses based on historical loss experience and forecasted economic conditions. All of these factors may be susceptible to significant change. To the extent that actual results differ from management estimates, additional provisions for loan and leasecredit losses may be required that would adversely impact earnings in future periods. The ACL represents our recognition of the risks of extending credit and our evaluation of the quality of the loan and lease portfolio and as such, requires the use of judgment as well as other systematic objective and quantitative methods which may include additional assumptions and estimates. The risks of extending credit and the accuracy of our evaluation
One of the quality ofmost significant judgments impacting the loanACL estimate is the economic forecast for United States national unemployment and lease portfolio are neither static nor mutually exclusive andUnited States national GDP. Changes in the economic forecast could result in a material impact on our Consolidated Financial Statements. We may over-estimatesignificantly affect the quality of the loan and lease portfolio, resulting in a lower allowance for loan and lease losses than necessary, overstating net income and equity. Conversely, we may under-estimate the quality of the loan and lease portfolio, resulting in a higher
allowance for loan and lease losses than necessary, understating net income and equity. The allowance for loan and lease losses is a valuation allowance for probableestimated credit losses increased bywhich could potentially lead to materially different allowance levels from one reporting period to the provision for loan and lease losses and decreased by charge-offs, netnext.
Loans that no longer conform to the risk characteristics of recoveries. We estimate the allowance reserve balance required and the related provision for loan and lease losses based on monthly evaluations of the loan and lease portfolio, with particular attention paid to loans and leases that have been specifically identified as needing additional management analysis because of the potential for further problems. During these evaluations, consideration is also given to such factors as the level and composition of impaired and otherany pool are evaluated individually. This includes all non-performing loans and leases, historical loss experience, resultsmay also include other loans that management identifies as non-conforming. Reserves on individually-evaluated loans are estimated based on one or a combination of examinations by regulatory agencies, independent loan and lease reviews, our estimateestimates of the fair value of the underlying collateral taking into consideration various valuation techniquesless cost to sell, seniority of the Bank’s claim, and qualitative adjustments to inputs to those estimatesborrower repayment forecasts. For loans and leases less than $1,000,000 in the Equipment Finance pool, the recovery value is based on historical experience rather than specific asset appraisals.
Management also evaluates debt securities for credit losses when a default or decline in fair value the strength and availability of guarantees, concentration of credits and other factors. Allocations of the allowance may be made for specific loans or leases, but the entire allowance is available for any loan or lease that, in our judgment, should be charged off. Loan and lease losses are charged against the allowance when we believe that the uncollectability of a loan or lease balance is confirmed. identified.
See Note 1 – Nature of Operations and Summary of Significant Accounting Policies, Note 3 Securities, and Note 4 – Loans, Leases Receivable, and Allowance for Credit Losses in the Consolidated Financial Statements for further discussion of the allowance for loan and lease losses.ACL.
We also continue to exercise our legal rights and remedies as appropriate in the collection and disposal of non-performing assets, and adhere to rigorous underwriting standards in our origination process in order to achieve strong asset quality. Although we believe that the allowance for loan and lease lossesACL was appropriate as of December 31, 20172023 based upon the evaluation of loan and lease delinquencies, non-performing assets, charge-off trends, economic conditions, and other factors, there can be no assurance that future adjustments to the allowance will not be necessary. If the quality of loans or leases deteriorates, then the allowance for loan and lease losses would generally be expected to increase relative to total loans and leases. If loan or lease quality improves, then the allowance would generally be expected to decrease relative to total loans and leases.
Goodwill Impairment Assessment. Goodwill is not amortized but, instead, is subject to impairment tests on at least an annual basis, and more frequently if an event occurs or circumstances change that would more likely than not reduce the fair value of a reporting unit below its carrying amount, including goodwill. The Corporation conducted its annual impairment test onas of July 1, 2017,2023, utilizing a qualitative assessment, and concluded that it iswas more likely than not that FBB-KC’sthe estimated fair value of the reporting unit exceeded its carrying value. Due to management’s decision to temporarily slow SBA production while investments to enhance the platform were made and the slower than expected ramp up of production during the fourth quarter, management elected to again assess goodwill on November 30, 2017 by comparing the fair value, of FBB-KC to its carrying value. Based on this assessment, management concluded that there wasresulting in no evidence of goodwill impairment. There were no events since the November 2017 impairment test that have changed the Corporation's impairment assessment conclusion. Although no goodwill impairment was noted, there can be no assurances that future goodwill impairment will not occur. See Note 1 – Nature of Operations and Summary of Significant Accounting Policiesfor the Corporation's accounting policy on goodwill and see Note 67 – Goodwill and Other Intangible Assets in the Consolidated Financial Statements for a detailed discussion of the factors considered by management in the assessment.
Income Taxes. The Corporation and its wholly owned subsidiaries file a consolidated federal income tax return and a combined Wisconsin state tax return and a Kansas state tax return. Deferred income taxes are recognized for the future tax consequences attributable to differences between the financial statement carrying amounts of existing assets and liabilities and their respective tax bases. The determination of current and deferred income taxes is based on complex analysis of many factors, including the interpretation of federal and state income tax laws, the difference between the tax and financial reporting basis of assets and liabilities (temporary differences), estimates of amounts currently due or owed, such as the timing of reversals of temporary differences, and current accounting standards. We apply a more likely than not approach to each of our tax positions when determining the amount of tax benefit to record in our Consolidated Financial Statements. Deferred tax assets and liabilities are measured using enacted tax rates expected to apply to taxable income in the years in which those temporary differences are expected to be recovered or settled. The effect of a change in tax rates on deferred taxes is recognized in income in the period that includes the enactment date. Effective January 1, 2018, the enactment of the Act reduced the corporate federal income tax rate to 21% from 35%, which required the Corporation to revalue its deferred taxes as of December 31, 2017. The revaluation resulted in an additional $629,000 income tax expense during the fourth quarter of 2017.
We have made our best estimate of valuation allowances utilizing available evidence and evaluation of sources of taxable income including tax planning strategies and expected reversals of timing differences to determine if valuation allowances were needed for deferred tax assets. Realization of deferred tax assets over time is dependent on our ability to generate sufficient taxable earnings in future periods and a valuation allowance may be necessary if management determines that it is more likely than not that the deferred asset will not be utilized. These estimates and assumptions are subject to change. Changes in these estimates and assumptions could adversely affect future consolidated results of operations. The Corporation believes the tax assets and liabilities are properly recorded in the Consolidated Financial Statements. See also Note 16 – Income Taxes in the Consolidated Financial Statements.
The Corporation also invests in certain development entities that generate federal and state historic and low income housing tax credits. The tax benefits associated with these investments are accounted for either under the flow-through method, equity method, or proportional amortization method and are recognized when the respective project is placed in service or over the investment term.
The federal and state taxing authorities who make assessments based on their determination of tax laws may periodically review our interpretation of federal and state income tax laws. Tax liabilities could differ significantly from the estimates and interpretations used in determining the current and deferred income tax liabilities based on the completion of examinations by taxing authorities.
SBA Recourse Reserve. The SBA recourse reserve represents management’s estimate of losses associated with the guaranteed portions of sold SBA loans. In the event of a loss resulting from default and a determination by the SBA that there is a deficiency in the manner in which the loan was originated, funded or serviced by the Corporation, the SBA may require the Corporation to repurchase the loan, deny its liability under the guaranty, reduce the amount of the guaranty, or, if it has already paid under the guaranty, seek recovery of the principal loss related to the deficiency from the Corporation. The Corporation must comply with applicable SBA regulations in order to maintain the guaranty. We estimate the SBA recourse reserve balance and the related SBA recourse provision by individually analyzing the eligibility of the guaranty for impaired loans that present a collateral shortfall, as well as by evaluating several factors to estimate probable losses within the remaining performing portion of the sold portfolio.
Although we believe that the SBA recourse reserve was appropriate as of December 31, 2017, future adjustments may be necessary based on changes to impaired loans, the fair value estimate of the underlying collateral and the Corporation’s ability to originate, fund or service sold SBA loans in accordance with SBA regulations. In addition, the SBA’s ultimate conclusion on the eligibility of a guaranty may be inconsistent with management’s best estimate. See Note 1 - Nature of Operations and Summary of Significant Accounting Policies in the Consolidated Financial Statements for further discussion of the SBA recourse reserve.
|
| |
Item 7A. | Item 7A. Quantitative and Qualitative Disclosures about Market Risk |
Our primary market risk is interest rate risk, which arises from exposure of our financial position to changes in interest rates. It is our strategy to reduce the impact of interest rate risk on net interest margin by maintaining a favorable matchmatch-funded position between the maturities and repricing dates of interest-earning assets and interest-bearing liabilities. This strategy is monitored by the Bank’s Asset/Liability Management Committee, in accordance with policies approved by the Bank’s Board. The committee meets regularly to review the sensitivity of the Bank’s assets and liabilities to changes in interest rates, liquidity needs and sources, and pricing and funding strategies.
The primary technique we use two techniques to measure interest rate risk. The firstrisk is simulation of earnings. In this measurement technique the balance sheet is modeled as an ongoing entity whereby future growth, pricing, and funding assumptions are implemented. These assumptions are modeled under different rate scenarios that include a parallel, instantaneoussimultaneous, instant and sustained change in interest rates. Key assumptions include:
The following table illustrates the behaviorpotential impact of interest rates and pricing spreads;
the changes in product balances; and
the behavior of loan and deposit clients in different rate environments.
This analysis incorporates several assumptions, the most material of which relate to the re-pricing characteristics and balance fluctuations of deposits with indeterminate or non-contractual maturities.
The sensitivity analysis included below is measured as a percentage change inmarket rates on our net interest income for the next 12 months due to instantaneous movements in benchmark interest rates from a baseline scenario. Estimated changes set forth below are dependent upon material assumptions such as those previously discussed. The reduction in expected benefit from instantaneous rate changes is principally due to the assumption that the Bank’s deposit price sensitivity will be greater in 2018 than it was in 2017.twelve months. |
| | | | | | |
| | | Impact on Net Interest Income as of December 31, |
| Instantaneous Rate Change in Basis Points | | 2017 | | 2016 |
| Down 50 | | (0.16 | )% | | 0.01 | % |
| No Change | | — | % | | — | % |
| Up 100 | | 1.38 | % | | 5.34 | % |
| Up 200 | | 3.01 | % | | 10.95 | % |
The earnings simulation analysis does not incorporate any management actions that may be used to mitigate negative consequences of actual interest rate movement. For that reason and others, they do not reflect the likely actual results but serve as conservative estimates of interest rate risk. This simulation analysis is not comparable to actual results disclosed elsewhere or directly predictive of future values of other measures provided.
The second measurement technique used is static gap analysis. Gap analysis involves measurement of the difference in asset and liability repricing on a cumulative basis within a specified time frame. In general, a positive gap indicates that more interest-earning assets than interest-bearing liabilities reprice/mature in a time frame and a negative gap indicates the opposite. As shown in the cumulative gap position in the table presented below, at December 31, 2017, our interest-bearing liabilities have the general characteristics that will allow them to reprice faster than interest-earning assets over the next 12 months while our interest-earning assets will reprice faster than interest-bearing-liabilities thereafter. In addition to the gap position, other determinants of net interest income are the shape of the yield curve, general rate levels and the corresponding effect of contractual interest rate floors, reinvestment spreads, balance sheet growth and mix, and interest rate spreads. Our success in attracting in-market deposits adds to the interest rate liability sensitivity of the organization. | | | | | | | | | | | | | | |
| | Impact on Net Interest Income as of December 31, |
| Instantaneous Rate Change in Basis Points | | 2023 | | 2022 |
| Down 300 | | (0.20) | % | | (9.90) | % |
| Down 200 | | 1.54 | | | (0.88) | |
| Down 100 | | 1.92 | | | 0.79 | |
| No Change | | — | | | — | |
| Up 100 | | 2.11 | | | 2.26 | |
| Up 200 | | 2.24 | | | 4.48 | |
| Up 300 | | 2.36 | | | 6.65 | |
We manage the structure of interest-earning assets and interest-bearing liabilities by adjusting their mix, yield, maturity and/or repricing characteristics based on market conditions. WholesaleFHLB advances and, to a lesser extent, wholesale certificates of deposit and FHLB advances are a significant source of our funding and wefunds. We use a variety of maturities to augment our management of interest rate exposure. In addition,Currently, we do not employ any derivatives to assist in managing our interest rate risk exposure; however, management has the authorization, as permitted within applicable approved policies, and ability to utilize various derivativesuch instruments should they be appropriate to manage interest rate exposure. We maintained our historically neutral balance sheet throughout 2023 and believe we ended the year appropriately positioned.
The following table illustrates our static gap position at December 31, 2017.
|
| | | | | | | | | | | | | | | | | | | | |
| | | Estimated Maturity or Repricing at December 31, 2017 |
| | | Within 3 Months | | 3-12 Months | | 1-5 Years | | After 5 Years | | Total |
| | | (Dollars in Thousands) |
| Assets: | | | | | | | | | | |
| Short-term investments | | $ | 35,481 |
| | $ | — |
| | $ | — |
| | $ | — |
| | $ | 35,481 |
|
| Investment securities | | 6,544 |
| | 26,503 |
| | 93,744 |
| | 37,872 |
| | 164,663 |
|
| Commercial loans | | 218,017 |
| | 28,088 |
| | 75,968 |
| | 6,283 |
| | 328,356 |
|
| Real estate loans | | 333,742 |
| | 86,250 |
| | 385,445 |
| | 177,524 |
| | 982,961 |
|
| Asset-based loans | | 145,388 |
| | — |
| | — |
| | — |
| | 145,388 |
|
| Lease receivables | | 878 |
| | 5,297 |
| | 13,824 |
| | 2,234 |
| | 22,233 |
|
| Consumer loans | | 2,008 |
| | 337 |
| | 499 |
| | — |
| | 2,844 |
|
Total earning assets(1) | | $ | 742,058 |
| | $ | 146,475 |
| | $ | 569,480 |
| | $ | 223,913 |
| | $ | 1,681,926 |
|
| Liabilities: | | | | | | | | | | |
| Interest-bearing transaction | | $ | 217,625 |
| | $ | — |
| | $ | — |
| | $ | — |
| | $ | 217,625 |
|
| Money market accounts | | 515,078 |
| | — |
| | — |
| | — |
| | 515,078 |
|
| Time deposits under $250,000 | | 14,854 |
| | 149,610 |
| | 182,068 |
| | 24,988 |
| | 371,520 |
|
| Time deposits $250,000 and over | | 998 |
| | 6,509 |
| | 5,157 |
| | — |
| | 12,664 |
|
| FHLB advances | | 5,000 |
| | 10,000 |
| | 133,000 |
| | 35,500 |
| | 183,500 |
|
| Short-term borrowings | | 10 |
| | — |
| | — |
| | — |
| | 10 |
|
Long-term debt(2) | | — |
| | — |
| | 15,675 |
| | 19,405 |
| | 35,080 |
|
| Total interest-bearing liabilities | | $ | 753,565 |
| | $ | 166,119 |
| | $ | 335,900 |
| | $ | 79,893 |
| | $ | 1,335,477 |
|
| Interest rate gap | | $ | (11,507 | ) | | $ | (19,644 | ) | | $ | 233,580 |
| | $ | 144,020 |
| | $ | 346,449 |
|
| Cumulative interest rate gap | | $ | (11,507 | ) | | $ | (31,151 | ) | | $ | 202,429 |
| | $ | 346,449 |
| | |
| Cumulative interest rate gap to total earning assets | | (0.68 | )% | | (1.85 | )% | | 12.04 | % | | 20.60 | % | | |
| |
(1) | Excludes non-interest sensitive balances and balances with indeterminate maturities. |
| |
(2) | Excludes debt issuance costs. |
The following table illustrates our static gap position at December 31, 2016.
|
| | | | | | | | | | | | | | | | | | | | |
| | | Estimated Maturity or Repricing at December 31, 2016 |
| | | Within 3 Months | | 3-12 Months | | 1-5 Years | | After 5 Years | | Total |
| | | (Dollars in Thousands) |
| Assets: | | | | | | | | | | |
| Short-term investments | | $ | 61,941 |
| | $ | — |
| | $ | 980 |
| | $ | — |
| | $ | 62,921 |
|
| Investment securities | | 8,395 |
| | 16,536 |
| | 143,267 |
| | 16,148 |
| | 184,346 |
|
| Commercial loans | | 211,799 |
| | 28,226 |
| | 83,867 |
| | 10,296 |
| | 334,188 |
|
| Real estate loans | | 343,584 |
| | 92,890 |
| | 365,379 |
| | 120,853 |
| | 922,706 |
|
| Asset-based loans | | 151,872 |
| | — |
| | — |
| | — |
| | 151,872 |
|
| Lease receivables | | 829 |
| | 3,864 |
| | 13,907 |
| | 1,216 |
| | 19,816 |
|
| Consumer loans | | 1,217 |
| | 337 |
| | 655 |
| | — |
| | 2,209 |
|
Total earning assets(1) | | $ | 779,637 |
| | $ | 141,853 |
| | $ | 608,055 |
| | $ | 148,513 |
| | $ | 1,678,058 |
|
| Liabilities: | | | | | | | | | | |
| Interest-bearing transaction | | $ | 183,992 |
| | $ | — |
| | $ | — |
| | $ | — |
| | $ | 183,992 |
|
| Money market accounts | | 627,090 |
| | — |
| | — |
| | — |
| | 627,090 |
|
| Time deposits under $250,000 | | 23,611 |
| | 116,461 |
| | 295,313 |
| | 31,647 |
| | 467,032 |
|
| Time deposits $250,000 and over | | 2,516 |
| | 2,554 |
| | 3,033 |
| | — |
| | 8,103 |
|
| FHLB advances | | 78 |
| | 19,500 |
| | 14,000 |
| | — |
| | 33,578 |
|
| Short-term borrowings | | 1,010 |
| | — |
| | — |
| | — |
| | 1,010 |
|
Long-term debt(2) | | 9,841 |
| | — |
| | 15,675 |
| | 10,315 |
| | 35,831 |
|
| Total interest-bearing liabilities | | $ | 848,138 |
| | $ | 138,515 |
| | $ | 328,021 |
| | $ | 41,962 |
| | $ | 1,356,636 |
|
| Interest rate gap | | $ | (68,501 | ) | | $ | 3,338 |
| | $ | 280,034 |
| | $ | 106,551 |
| | $ | 321,422 |
|
| Cumulative interest rate gap | | $ | (68,501 | ) | | $ | (65,163 | ) | | $ | 214,871 |
| | $ | 321,422 |
| | |
| Cumulative interest rate gap to total earning assets | | (4.08 | )% | | (3.88 | )% | | 12.80 | % | | 19.15 | % | | |
| |
(1) | Excludes non-interest sensitive balances and balances with indeterminate maturities. |
| |
(2) | Excludes debt issuance costs. |
|
| |
Item 8. | Item 8. Financial Statements and Supplementary Data |
INDEX TO CONSOLIDATED FINANCIAL STATEMENTS OF FIRST BUSINESS FINANCIAL SERVICES
| | | | | | | | |
| | |
| | |
| Consolidated Financial Statements | | Page No. |
| | |
| | |
| | |
| | |
| | |
| | |
| | |
| | |
| | |
| | |
| | |
| | |
| | |
| | |
First Business Financial Services, Inc.
Consolidated Balance Sheets
| | | | | December 31,
2017 | | December 31,
2016 |
| | December 31,
2023 | | | | December 31,
2023 | | December 31,
2022 |
| | (In Thousands, Except Share Data) | | (In Thousands, Except Share Data) |
| Assets | | | | | Assets | | |
| Cash and due from banks | | $ | 17,059 |
| | $ | 14,596 |
|
| Short-term investments | | 35,480 |
| | 62,921 |
|
| Cash and cash equivalents | | 52,539 |
| | 77,517 |
|
| Securities available-for-sale, at fair value | | 126,005 |
| | 145,893 |
|
| Securities held-to-maturity, at amortized cost | | 37,778 |
| | 38,612 |
|
| Loans held for sale | | 2,194 |
| | 1,111 |
|
| Loans and leases receivable, net of allowance for loan and lease losses of $18,763 and $20,912, respectively | | 1,482,832 |
| | 1,429,763 |
|
| Loans and leases receivable, net of allowance for credit losses of $31,275 and $24,230, respectively | |
| Premises and equipment, net | | 3,156 |
| | 3,772 |
|
| Foreclosed properties | | 1,069 |
| | 1,472 |
|
| Repossessed assets | |
| Right-of-use assets, net | |
| Bank-owned life insurance | | 40,323 |
| | 39,048 |
|
| Federal Home Loan Bank and Federal Reserve Bank stock, at cost | | 5,670 |
| | 2,131 |
|
| Federal Home Loan Bank stock, at cost | |
| Goodwill and other intangible assets | | 12,652 |
| | 12,773 |
|
| Derivatives | |
| Accrued interest receivable and other assets | | 29,848 |
| | 28,607 |
|
| Total assets | | $ | 1,794,066 |
| | $ | 1,780,699 |
|
| Liabilities and Stockholders’ Equity | | | | | Liabilities and Stockholders’ Equity | | |
| Deposits | | $ | 1,394,331 |
| | $ | 1,538,855 |
|
| Federal Home Loan Bank advances and other borrowings | | 207,898 |
| | 59,676 |
|
| Junior subordinated notes | | 10,019 |
| | 10,004 |
|
| Lease liabilities | |
| Derivatives | |
| Accrued interest payable and other liabilities | | 12,540 |
| | 10,514 |
|
| Total liabilities | | 1,624,788 |
| | 1,619,049 |
|
| Stockholders’ equity: | | | | | Stockholders’ equity: | | |
| Preferred stock, $0.01 par value, 2,500,000 shares authorized, none issued or outstanding | | — |
| | — |
|
| Common stock, $0.01 par value, 25,000,000 shares authorized, 9,021,985 and 8,959,239 shares issued, 8,763,539 and 8,715,856 shares outstanding at December 31, 2017 and 2016, respectively | | 90 |
| | 90 |
|
| Preferred stock, $0.01 par value, 2,500,000 shares authorized, 12,500 shares of 7% non-cumulative perpetual preferred stock, Series A, outstanding at December 31, 2023 and 2022, respectively | |
| Common stock, $0.01 par value, 25,000,000 shares authorized, 9,418,463 and 9,371,078 shares issued, 8,314,778 and 8,362,085 shares outstanding at December 31, 2023 and 2022, respectively | |
| Additional paid-in capital | | 78,620 |
| | 77,542 |
|
| Retained earnings | | 98,906 |
| | 91,317 |
|
| Accumulated other comprehensive loss | | (1,238 | ) | | (522 | ) |
| Treasury stock, 258,446 and 243,383 shares at December 31, 2017 and 2016, respectively, at cost | | (7,100 | ) | | (6,777 | ) |
| Treasury stock, 1,103,685 and 1,008,993 shares at December 31, 2023 and 2022, respectively, at cost | |
| Total stockholders’ equity | | 169,278 |
| | 161,650 |
|
| Total liabilities and stockholders’ equity | | $ | 1,794,066 |
| | $ | 1,780,699 |
|
See accompanying Notes to Consolidated Financial Statements.
First Business Financial Services, Inc.
Consolidated Statements of Income
| | | | | For the Year Ended December 31, |
| | For the Year Ended December 31, | | | | For the Year Ended December 31, |
| | | 2017 | | 2016 | | 2015 | | | 2023 | | 2022 | | 2021 |
| | | (In Thousands, Except Share Data) | | | (In Thousands, Except Share Data) |
| Interest income | | | | | | |
| Loans and leases | |
| Loans and leases | |
| Loans and leases | | $ | 71,960 |
| | $ | 74,627 |
| | $ | 69,135 |
|
| Securities | | 3,148 |
| | 2,845 |
| | 2,962 |
|
| Short-term investments | | 703 |
| | 645 |
| | 374 |
|
| Total interest income | | 75,811 |
| | 78,117 |
| | 72,471 |
|
| Interest expense | | | | | | |
| Deposits | | 10,805 |
| | 11,716 |
| | 10,877 |
|
| Deposits | |
| Deposits | |
| Federal Home Loan Bank advances and other borrowings | | 3,285 |
| | 1,958 |
| | 1,842 |
|
| Junior subordinated notes | | 1,112 |
| | 1,115 |
| | 1,112 |
|
| Total interest expense | | 15,202 |
| | 14,789 |
| | 13,831 |
|
| Net interest income | | 60,609 |
| | 63,328 |
| | 58,640 |
|
| Provision for loan and lease losses | | 6,172 |
| | 7,818 |
| | 3,386 |
|
| Net interest income after provision for loan and lease losses | | 54,437 |
| | 55,510 |
| | 55,254 |
|
| Provision for credit losses | |
| Net interest income after provision for credit losses | |
| Non-interest income | | | | | | |
| Trust and investment service fees | | 6,670 |
| | 5,356 |
| | 4,954 |
|
| Private wealth management service fees | |
| Private wealth management service fees | |
| Private wealth management service fees | |
| Gain on sale of Small Business Administration loans | | 1,591 |
| | 4,400 |
| | 3,999 |
|
| Gain on sale of residential mortgage loans | | 26 |
| | 590 |
| | 729 |
|
| | Service charges on deposits | |
| Service charges on deposits | |
| Service charges on deposits | | 3,013 |
| | 2,990 |
| | 2,812 |
|
| Loan fees | | 1,988 |
| | 2,430 |
| | 2,187 |
|
| Increase in cash surrender value of bank-owned life insurance | | 1,250 |
| | 974 |
| | 960 |
|
| Bank-owned life insurance income | |
| Net (loss) gain on sale of securities | | (403 | ) | | 10 |
| | — |
|
| Swap fees | | 909 |
| | 76 |
| | 7 |
|
| Other non-interest income | | 1,621 |
| | 1,162 |
| | 1,363 |
|
| Total non-interest income | | 16,665 |
| | 17,988 |
| | 17,011 |
|
| Non-interest expense | | | | | | |
| Compensation | |
| Compensation | |
| Compensation | | 31,663 |
| | 31,545 |
| | 28,543 |
|
| Occupancy | | 2,088 |
| | 2,019 |
| | 1,973 |
|
| Professional fees | | 4,063 |
| | 4,031 |
| | 4,893 |
|
| Data processing | | 2,701 |
| | 3,298 |
| | 2,378 |
|
| Marketing | | 2,109 |
| | 2,338 |
| | 2,585 |
|
| Equipment | | 1,211 |
| | 1,189 |
| | 1,230 |
|
| Computer software | | 2,723 |
| | 2,160 |
| | 1,649 |
|
| FDIC insurance | | 1,388 |
| | 1,472 |
| | 920 |
|
| Collateral liquidation costs | | 829 |
| | 262 |
| | 472 |
|
| Net (gain) loss on foreclosed properties | | (143 | ) | | 122 |
| | (171 | ) |
| Impairment of tax credit investments | | 2,784 |
| | 3,691 |
| | — |
|
| SBA recourse provision | | 2,240 |
| | 2,068 |
| | — |
|
| Other non-interest expense | | 3,215 |
| | 2,238 |
| | 2,902 |
|
| Total non-interest expense | | 56,871 |
|
| 56,433 |
|
| 47,374 |
|
| Income before income tax expense | | 14,231 |
| | 17,065 |
| | 24,891 |
|
| Income tax expense | | 2,326 |
| | 2,156 |
| | 8,377 |
|
| Net income | | $ | 11,905 |
| | $ | 14,909 |
| | $ | 16,514 |
|
| Preferred stock dividend | |
| Income available to common shareholders | |
| Earnings per common share: | | | | | | |
| Basic | |
| Basic | |
| Basic | | $ | 1.36 |
| | $ | 1.71 |
| | $ | 1.90 |
|
| Diluted | | 1.36 |
| | 1.71 |
| | 1.90 |
|
| Dividends declared per share | | 0.52 |
| | 0.48 |
| | 0.44 |
|
See accompanying Notes to Consolidated Financial Statements.
First Business Financial Services, Inc.
Consolidated Statements of Comprehensive Income
| | | For the Year Ended December 31, | | | | For the Year Ended December 31, |
| | 2023 | | | | 2023 | | 2022 | | 2021 |
| | (In Thousands) | | | | (In Thousands) |
| Net income | |
| Other comprehensive income (loss) | |
| Securities available-for-sale: | |
| Securities available-for-sale: | |
| Securities available-for-sale: | |
| Unrealized securities gains (losses) arising during the period | |
| Unrealized securities gains (losses) arising during the period | |
| Unrealized securities gains (losses) arising during the period | |
| Reclassification adjustment for net losses (gains) realized in net income | |
| Securities held-to-maturity: | |
| | Amortization of net unrealized losses transferred from available-for-sale | |
| | | For the Year Ended December 31, |
| Amortization of net unrealized losses transferred from available-for-sale | |
| | | 2017 | | 2016 | | 2015 |
| | | (In Thousands) |
| Net income | | $ | 11,905 |
| | $ | 14,909 |
| | $ | 16,514 |
|
| Other comprehensive loss, before tax | | | | | | |
| Securities available-for-sale: | | | | | | |
| Unrealized securities losses arising during the period | | (1,156 | ) | | (902 | ) | | (719 | ) |
| Reclassification adjustment for net loss (gain) realized in net income | | 403 |
| | (10 | ) | | — |
|
| Securities held-to-maturity: | | | | | | |
| Amortization of net unrealized losses transferred from available-for-sale | | 102 |
| | 159 |
| | 233 |
|
| Interest rate swaps: | | | | | | |
| Unrealized losses on interest rate swaps arising during the period | | (122 | ) | | — |
| | — |
|
| Income tax benefit | | 279 |
| | 311 |
| | 188 |
|
| Total other comprehensive loss | | (494 | ) | | (442 | ) | | (298 | ) |
| Unrealized (losses) gains on interest rate swaps arising during the period | |
| Unrealized (losses) gains on interest rate swaps arising during the period | |
| Unrealized (losses) gains on interest rate swaps arising during the period | |
| Income tax (expense) benefit | |
| Total other comprehensive income (loss) | |
| Comprehensive income | | $ | 11,411 |
| | $ | 14,467 |
| | $ | 16,216 |
|
See accompanying Notes to Consolidated Financial Statements.
First Business Financial Services, Inc.
Consolidated Statements of Changes in Stockholders’ Equity
| | | | | | | | | | | | | | | | | | | | | | | | | | | | | | | | | | | | | | | | | | | | | | | | | | |
| | Common Shares Outstanding | | Preferred Stock | | Common
Stock | | Additional
Paid-in
Capital | | Retained
Earnings | | Accumulated
Other
Comprehensive
Loss | | Treasury
Stock | | Total |
| | | (In Thousands, Except Share Data) |
| Balance at January 1, 2021 | | 8,566,960 | | | $ | — | | | $ | 92 | | | $ | 83,125 | | | $ | 140,431 | | | $ | (933) | | | $ | (16,553) | | | $ | 206,162 | |
| Net income | | — | | | — | | | — | | | — | | | 35,755 | | | — | | | — | | | 35,755 | |
| Other comprehensive loss | | — | | | — | | | — | | | — | | | — | | | (524) | | | — | | | (524) | |
| | | | | | | | | | | | | | | | |
| | | | | | | | | | | | | | | | |
| | | | | | | | | | | | | | | | |
| | | | | | | | | | | | | | | | |
| Share-based compensation - restricted shares and employee stock purchase plan | | 85,370 | | | — | | | 1 | | | 2,512 | | | — | | | — | | | — | | | 2,513 | |
| Issuance of common stock under the employee stock purchase plan | | 6,531 | | | — | | | — | | | 160 | | | — | | | — | | | — | | | 160 | |
| | | | | | | | | | | | | | | | |
| | | | | | | | | | | | | | | | |
| Cash dividends ($0.72 per share) | | — | | | — | | | — | | | — | | | (6,166) | | | — | | | — | | | (6,166) | |
| Treasury stock purchased | | (201,297) | | | — | | | — | | | — | | | — | | | — | | | (5,478) | | | (5,478) | |
| Balance at December 31, 2021 | | 8,457,564 | | | — | | | 93 | | | 85,797 | | | 170,020 | | | (1,457) | | | (22,031) | | | 232,422 | |
| Net income | | — | | | — | | | — | | | — | | | 40,858 | | | — | | | — | | | 40,858 | |
| Other comprehensive loss | | — | | | — | | | — | | | — | | | — | | | (13,853) | | | — | | | (13,853) | |
| Issuance of preferred stock, net of issuance costs | | — | | | 11,992 | | | — | | | — | | | — | | | — | | | — | | | 11,992 | |
| | | | | | | | | | | | | | | | |
| | | | | | | | | | | | | | | | |
| | | | | | | | | | | | | | | | |
| Share-based compensation - restricted shares and employee stock purchase plan | | 75,564 | | | — | | | 1 | | | 2,583 | | | — | | | — | | | — | | | 2,584 | |
| Issuance of common stock under the employee stock purchase plan | | 4,535 | | | — | | | — | | | 134 | | | — | | | — | | | — | | | 134 | |
| Treasury stock re-issued | | — | | | — | | | — | | | (1,002) | | | — | | | — | | | 1,002 | | | — | |
| Preferred stock dividends | | — | | | — | | | — | | | — | | | (683) | | | — | | | — | | | (683) | |
| Cash dividends ($0.79 per share) | | — | | | — | | | — | | | — | | | (6,688) | | | — | | | — | | | (6,688) | |
| Treasury stock purchased | | (175,578) | | | — | | | — | | | — | | | — | | | — | | | (6,126) | | | (6,126) | |
| Balance at December 31, 2022 | | 8,362,085 | | | 11,992 | | | 94 | | | 87,512 | | | 203,507 | | | (15,310) | | | (27,155) | | | 260,640 | |
| Cumulative change in accounting principle | | — | | | — | | | — | | | — | | | (1,353) | | | — | | | — | | | (1,353) | |
| Balance at January 1, 2023 | | 8,362,085 | | | 11,992 | | | 94 | | | 87,512 | | | 202,154 | | | (15,310) | | | (27,155) | | | 259,287 | |
| Net income | | — | | | — | | | — | | | — | | | 37,027 | | | — | | | — | | | 37,027 | |
| Other comprehensive income | | — | | | — | | | — | | | — | | | — | | | 1,593 | | | — | | | 1,593 | |
| | | | | | | | | | | | | | | | |
| | | | | | | | | | | | | | | | |
| | | | | | | | | | | | | | | | |
| | | | | | | | | | | | | | | | |
| Share-based compensation - restricted shares and employee stock purchase plan | | 43,057 | | | — | | | 1 | | | 2,976 | | | — | | | — | | | — | | | 2,977 | |
| Issuance of common stock under the employee stock purchase plan | | 4,328 | | | — | | | — | | | 128 | | | — | | | — | | | — | | | 128 | |
| | | | | | | | | | | | | | | | |
| Preferred stock dividends | | — | | | — | | | — | | | — | | | (875) | | | — | | | — | | | (875) | |
| Cash dividends ($0.91 per share) | | — | | | — | | | — | | | — | | | (7,578) | | | — | | | — | | | (7,578) | |
| Treasury stock purchased | | (94,692) | | | — | | | — | | | | | — | | | — | | | (2,971) | | | (2,971) | |
| Balance at December 31, 2023 | | 8,314,778 | | | $ | 11,992 | | | $ | 95 | | | $ | 90,616 | | | $ | 230,728 | | | $ | (13,717) | | | $ | (30,126) | | | $ | 289,588 | |
|
| | | | | | | | | | | | | | | | | | | | | | | | | | | |
| | | Common Shares Outstanding | | Common Stock | | Additional Paid-in Capital | | Retained Earnings | | Accumulated Other Comprehensive Income (Loss) | | Treasury Stock | | Total |
| | | (In Thousands, Except Share Data) |
| Balance at December 31, 2014 | | 8,671,854 |
| | $ | 45 |
| | $ | 74,963 |
| | $ | 67,886 |
| | $ | 218 |
| | $ | (5,364 | ) | | $ | 137,748 |
|
| Net income | | — |
| | — |
| | — |
| | 16,514 |
| | — |
| | — |
| | 16,514 |
|
| Other comprehensive income | | — |
| | — |
| | — |
| | — |
| | (298 | ) | | — |
| | (298 | ) |
| Common stock dividends | | — |
| | 44 |
| | (44 | ) | | — |
| | — |
| | — |
| | — |
|
| Exercise of stock options | | 24,000 |
| | — |
| | 300 |
| | — |
| | — |
| | — |
| | 300 |
|
| Share-based compensation - restricted shares | | 45,347 |
| | — |
| | 1,063 |
| | — |
| | — |
| | — |
| | 1,063 |
|
| Share-based compensation - tax benefits | | — |
| | — |
| | 267 |
| | — |
| | — |
| | — |
| | 267 |
|
| Cash dividends ($0.44 per share) | | — |
| | — |
| | — |
| | (3,816 | ) | | — |
| | — |
| | (3,816 | ) |
| Treasury stock purchased | | (41,791 | ) | | — |
| | — |
| | — |
| | — |
| | (946 | ) | | (946 | ) |
| Balance at December 31, 2015 | | 8,699,410 |
| | 89 |
| | 76,549 |
| | 80,584 |
| | (80 | ) | | (6,310 | ) | | 150,832 |
|
| Net income | | — |
| | — |
| | — |
| | 14,909 |
| | — |
| | — |
| | 14,909 |
|
| Other comprehensive loss | | — |
| | — |
| | — |
| | — |
| | (442 | ) | | — |
| | (442 | ) |
| Share-based compensation - restricted shares | | 36,864 |
| | 1 |
| | 993 |
| | — |
| | — |
| | — |
| | 994 |
|
| Cash dividends ($0.48 per share) | | — |
| | — |
| | — |
| | (4,176 | ) | | — |
| | — |
| | (4,176 | ) |
| Treasury stock purchased | | (20,418 | ) | | — |
| | — |
| | — |
| | — |
| | (467 | ) | | (467 | ) |
| Balance at December 31, 2016 | | 8,715,856 |
| | 90 |
| | 77,542 |
| | 91,317 |
| | (522 | ) | | (6,777 | ) | | 161,650 |
|
| Net income | | — |
| | — |
| | — |
| | 11,905 |
| | — |
| | — |
| | 11,905 |
|
| Other comprehensive loss | | — |
| | — |
| | — |
| | — |
| | (494 | ) | | — |
| | (494 | ) |
| Share-based compensation - restricted shares | | 62,746 |
| | — |
| | 1,078 |
| | — |
| | — |
| | — |
| | 1,078 |
|
| Cash dividends ($0.52 per share) | | — |
| | — |
| | — |
| | (4,538 | ) | | — |
| | — |
| | (4,538 | ) |
| Treasury stock purchased | | (15,063 | ) | | — |
| | — |
| | — |
| | — |
| | (323 | ) | | (323 | ) |
| Deferred tax revaluation adjustment | | — |
| | — |
| | — |
| | 222 |
| | (222 | ) | | — |
| | — |
|
| Balance at December 31, 2017 | | 8,763,539 |
| | $ | 90 |
|
| $ | 78,620 |
|
| $ | 98,906 |
|
| $ | (1,238 | ) |
| $ | (7,100 | ) |
| $ | 169,278 |
|
See accompanying Notes to Consolidated Financial Statements.
First Business Financial Services, Inc. First Business Financial Services, Inc. Consolidated Statements of Cash Flows |
| | | | | | | | | | | | |
| | | For the Year Ended December 31, |
| | | 2017 | | 2016 | | 2015 |
| | | (In Thousands) |
| Operating activities | | | | | | |
| Net income | | $ | 11,905 |
| | $ | 14,909 |
| | $ | 16,514 |
|
| Adjustments to reconcile net income to net cash provided by operating activities: | | | | | | |
| Deferred income taxes, net | | 1,747 |
| | (1,108 | ) | | 1,158 |
|
| Impairment of tax credit investments | | 2,784 |
| | 3,691 |
| | — |
|
| Provision for loan and lease losses | | 6,172 |
| | 7,818 |
| | 3,386 |
|
| Depreciation, amortization and accretion, net | | 1,562 |
| | 1,515 |
| | (90 | ) |
| Share-based compensation | | 1,078 |
| | 994 |
| | 1,063 |
|
| Net loss (gain) on sale of available-for-sale securities | | 403 |
| | (10 | ) | | — |
|
| Gain on sale of historic development entity state tax credit | | (210 | ) | | — |
| | — |
|
| Increase in value of bank-owned life insurance policies | | (1,250 | ) | | (974 | ) | | (960 | ) |
| Origination of loans for sale | | (69,966 | ) | | (71,965 | ) | | (70,254 | ) |
| Sale of loans originated for sale | | 70,500 |
| | 78,546 |
| | 77,333 |
|
| Gain on sale of loans originated for sale | | (1,617 | ) | | (4,990 | ) | | (4,728 | ) |
| Net (gain) loss on foreclosed properties, including impairment valuation | | (143 | ) | | 122 |
| | (171 | ) |
| Excess tax benefit from share-based compensation | | (66 | ) | | (142 | ) | | — |
|
| Returns on investments in limited partnerships | | 459 |
| | 250 |
| | — |
|
| Net increase in accrued interest receivable and other assets | | (2,857 | ) | | (3,861 | ) | | (1,033 | ) |
| Net increase in accrued interest payable and other liabilities | | 1,907 |
| | 1,367 |
| | 1,002 |
|
| Net cash provided by operating activities | | 22,408 |
| | 26,162 |
| | 23,220 |
|
| Investing activities | | | | | | |
| Proceeds from maturities, redemptions and paydowns of available-for-sale securities | | 38,241 |
| | 43,745 |
| | 42,899 |
|
| Proceeds from maturities, redemptions and paydowns of held-to-maturity securities | | 3,808 |
| | 3,882 |
| | 4,349 |
|
| Proceeds from sale of available-for-sale securities | | 40,144 |
| | 5,227 |
| | — |
|
| Purchases of available-for-sale securities | | (60,399 | ) | | (56,356 | ) | | (40,721 | ) |
| Purchases of held-to-maturity securities | | (3,016 | ) | | (5,191 | ) | | — |
|
| Proceeds from sale of foreclosed properties | | 1,659 |
| | 83 |
| | 528 |
|
| Net increase in loans and leases | | (59,033 | ) | | (22,385 | ) | | (155,204 | ) |
| Investments in limited partnerships | | (500 | ) | | (750 | ) | | — |
|
| Returns of investments in limited partnerships | | 97 |
| | 541 |
| | 459 |
|
| Investment in historic development entities | | (5,312 | ) | | (3,456 | ) | | (578 | ) |
| Proceeds from sale of historic development entity state tax credit | | 2,764 |
| | — |
| | — |
|
| Investment in Federal Home Loan Bank and Federal Reserve Bank Stock | | (16,275 | ) | | (1,308 | ) | | (1,352 | ) |
| Proceeds from the sale of Federal Home Loan Bank Stock | | 12,736 |
| | 2,020 |
| | 849 |
|
| Purchases of leasehold improvements and equipment, net | | (1,242 | ) | | (584 | ) | | (789 | ) |
| Purchases of bank owned life insurance policies | | — |
| | (9,750 | ) | | — |
|
| Premium payment on bank owned life insurance policies | | (25 | ) | | (26 | ) | | (25 | ) |
| Net cash used in investing activities | | (46,353 | ) | | (44,308 | ) | | (149,585 | ) |
| Financing activities | | | | | | |
| Net (decrease) increase in deposits | | (144,486 | ) | | (38,256 | ) | | 139,469 |
|
| Repayment of Federal Home Loan Bank advances | | (656,916 | ) | | (4,500 | ) | | (1,000 | ) |
| Proceeds from Federal Home Loan Bank advances | | 806,916 |
| | 30,000 |
| | — |
|
| Net (decrease) increase in short-term borrowed funds | | (1,000 | ) | | (1,500 | ) | | 1,500 |
|
| Net (decrease) increase in long-term borrowed funds | | (1,901 | ) | | 998 |
| | 918 |
|
| Proceeds from issuance of subordinated notes payable | | 9,090 |
| | — |
| | — |
|
| Repayment of subordinated notes payable | | (7,875 | ) | | — |
| | — |
|
| Excess tax benefit from share-based compensation | | — |
| | — |
| | 267 |
|
| Cash dividends paid | | (4,538 | ) | | (4,176 | ) | | (3,816 | ) |
| | | | | | | | | | | | | | | | | | | | |
| | For the Year Ended December 31, |
| | | 2023 | | 2022 | | 2021 |
| | | (In Thousands) |
| Operating activities | | | | | | |
| Net income | | $ | 37,027 | | | $ | 40,858 | | | $ | 35,755 | |
| Adjustments to reconcile net income to net cash provided by operating activities: | | | | | | |
| Deferred income taxes, net | | 2,120 | | | (775) | | | 1,223 | |
| Tax credit investments recovery | | — | | | (351) | | | — | |
| Provision for credit losses | | 8,182 | | | (3,868) | | | (5,803) | |
| | | | | | |
| Depreciation, amortization and accretion, net | | 3,636 | | | 4,066 | | | 3,554 | |
| Share-based compensation | | 2,977 | | | 2,584 | | | 2,513 | |
| Net loss on disposal of fixed assets | | 73 | | | — | | | 78 | |
| | | | | | |
| Amortization of tax credit investments | | 4,053 | | | 1,035 | | | — | |
| | | | | | |
| Bank-owned life insurance policy income | | (1,494) | | | (2,227) | | | (1,413) | |
| Origination of loans for sale | | (149,669) | | | (124,915) | | | (99,266) | |
| Sale of loans originated for sale | | 149,767 | | | 128,391 | | | 108,435 | |
| Gain on sale of loans originated for sale | | (2,055) | | | (2,537) | | | (4,044) | |
| Net loss (gain) on repossessed assets | | 13 | | | (429) | | | 15 | |
| Return on investment in limited partnerships | | 4,922 | | | 721 | | | 371 | |
| Excess tax benefit from share-based compensation | | 194 | | | 264 | | | 48 | |
| Net payments on operating lease liabilities | | (1,425) | | | (1,470) | | | (1,431) | |
| Net increase in accrued interest receivable and other assets | | (21,497) | | | (7,728) | | | (6,774) | |
| Net increase in accrued interest payable and other liabilities | | 15,468 | | | 5,026 | | | 2,731 | |
| Net cash provided by operating activities | | 52,292 | | | 38,645 | | | 35,992 | |
| Investing activities | | | | | | |
| Proceeds from maturities, redemptions and paydowns of available-for-sale securities | | 22,114 | | | 40,835 | | | 51,166 | |
| Proceeds from maturities, redemptions and paydowns of held-to-maturity securities | | 4,115 | | | 7,080 | | | 6,586 | |
| Proceeds from sale of available-for-sale securities | | 5,085 | | | — | | | 14,955 | |
| Purchases of available-for-sale securities | | (106,967) | | | (75,740) | | | (93,019) | |
| | | | | | |
| Proceeds from sale of repossessed assets | | 25 | | | 71 | | | — | |
| | | | | | |
| Net increase in loans and leases | | (408,618) | | | (199,467) | | | (86,660) | |
| Investments in limited partnerships | | (1,413) | | | (1,508) | | | (1,059) | |
| Returns of investments in limited partnerships | | 7 | | | 17 | | | 32 | |
| | | | | | |
| Investment in tax credit investments | | (24,160) | | | (11,454) | | | (2,964) | |
| Distribution from tax credit investments | | 101 | | | 474 | | | 57 | |
| | | | | | |
| Investment in Federal Home Loan Bank and Federal Reserve Bank Stock | | (32,069) | | | (45,660) | | | (7,439) | |
| Proceeds from the sale of Federal Home Loan Bank Stock | | 37,839 | | | 41,184 | | | 7,680 | |
| Purchases of leasehold improvements and equipment, net | | (2,884) | | | (3,223) | | | (391) | |
| Proceeds from sale of leasehold improvements and equipment, net | | — | | | — | | | 44 | |
| | | | | | |
| Premium payment on bank owned life insurance policies | | (24) | | | (50) | | | — | |
| | | | | | |
| Proceeds from bank owned life insurance claim | | — | | | 1,859 | | | — | |
| Proceeds from redemption of Trust II stock | | — | | | 315 | | | — | |
| Net cash used in investing activities | | (506,849) | | | (245,267) | | | (111,012) | |
| Financing activities | | | | | | |
| Net increase in deposits | | 628,573 | | | 210,283 | | | 102,407 | |
| Repayment of Federal Home Loan Bank advances | | (1,698,730) | | | (2,374,849) | | | (814,000) | |
| Proceeds from Federal Home Loan Bank advances | | 1,563,851 | | | 2,422,429 | | | 788,300 | |
| | | | | | |
| Proceeds from issuance of subordinated notes payable | | 15,000 | | | 20,000 | | | — | |
| Repayment of subordinated notes payable | | — | | | (9,090) | | | — | |
| Repayment of junior subordinated debt | | — | | | (10,076) | | | — | |
| | | | | | |
| | | | | | |
| Net (decrease) increase in long-term borrowed funds | | (6,013) | | | (5,132) | | | 9,998 | |
| | | | | | |
| | | | | | |
| Cash dividends paid | | (7,578) | | | (6,688) | | | (6,166) | |
| | | | | | | | | | | | | | | | | | | | |
| | For the Year Ended December 31, |
| | | 2023 | | 2022 | | 2021 |
| | | (In Thousands) |
| Preferred stock dividends paid | | (875) | | | (683) | | | — | |
| Proceeds from issuance of common stock under ESPP | | 128 | | | 134 | | | 160 | |
| Proceeds from issuance of preferred stock | | — | | | 11,992 | | | — | |
| | | | | | |
| Purchase of treasury stock | | (2,971) | | | (6,126) | | | (5,478) | |
| Net cash provided by financing activities | | 491,385 | | | 252,194 | | | 75,221 | |
| Net increase in cash and cash equivalents | | 36,828 | | | 45,572 | | | 201 | |
| Cash and cash equivalents at the beginning of the period | | 102,682 | | | 57,110 | | | 56,909 | |
| Cash and cash equivalents at the end of the period | | $ | 139,510 | | | $ | 102,682 | | | $ | 57,110 | |
| Supplementary cash flow information | | | | | | |
| Cash paid during the period for: | | | | | | |
| Interest paid on deposits and borrowings | | $ | 75,533 | | | $ | 20,110 | | | $ | 13,206 | |
| Net income taxes paid | | 7,456 | | | 8,038 | | | 14,519 | |
| Non-cash investing and financing activities: | | | | | | |
| | | | | | |
| | | | | | |
| Transfer of loans to repossessed assets | | 190 | | | 50 | | | 146 | |
| | | | | | |
| | | | | | |
| | | | | | |
| | | | | | |
| | | | | | |
| Lease liability in exchange for right-of-use-asset | | — | | | 6,265 | | | 316 | |
First Business Financial Services, Inc. Consolidated Statements of Cash Flows |
| | | | | | | | | | | | |
| | | For the Year Ended December 31, |
| | | 2017 | | 2016 | | 2015 |
| | | (In Thousands) |
| Exercise of stock options | | — |
| | — |
| | 300 |
|
| Purchase of treasury stock | | (323 | ) | | (467 | ) | | (946 | ) |
| Net cash (used in) provided by financing activities | | (1,033 | ) | | (17,901 | ) | | 136,692 |
|
| Net (decrease) increase in cash and cash equivalents | | (24,978 | ) | | (36,047 | ) | | 10,327 |
|
| Cash and cash equivalents at the beginning of the period | | 77,517 |
| | 113,564 |
| | 103,237 |
|
| Cash and cash equivalents at the end of the period | | $ | 52,539 |
| | $ | 77,517 |
| | $ | 113,564 |
|
| Supplementary cash flow information | | | | | | |
| Cash paid during the period for: | | | | | | |
| Interest paid on deposits and borrowings | | $ | 14,872 |
| | $ | 14,790 |
| | $ | 13,639 |
|
| Income taxes paid | | 2,160 |
| | 5,554 |
| | 5,668 |
|
| Non-cash investing and financing activities: | | | | | | |
| Transfer of loans from held-to-maturity to held-for-sale | | 12,896 |
| | 11,504 |
| | 4,336 |
|
Transfer from premises and equipment to foreclosed properties
| | 1,113 |
| | — |
| | — |
|
First Business Financial Services, Inc.
NOTES TO CONSOLIDATED FINANCIAL STATEMENTS
Note 1 – Nature of Operations and Summary of Significant Accounting Policies
Nature of Operations. The accounting and reporting practices of First Business Financial Services, Inc. (the(“FBFS” or the “Corporation”), through our wholly-owned subsidiary, First Business Bank (“FBB”, or the “Bank”), hashave been prepared in accordance with U.S. generally accepted accounting principles (“GAAP”). FBB operates as a commercial banking institution primarily in the Wisconsin and the greater Kansas City markets. FBB also offers trust and investment services through First Business Trust & Investments (“FBTI”), a division of FBB.metropolitan area. The Bank provides a full range of financial services to businesses, business owners, executives, professionals, and high net worth individuals. FBB also offers bank consulting services to community financial institutions. The Bank is subject to competition from other financial institutions and service providers, and is also subject to state and federal regulations. As of December 31, 2023, FBB hashad the following wholly-owned subsidiaries: First Business Capital Corp.Specialty Finance, LLC (“FBCC”FBSF”), First Madison Investment Corp. (“FMIC”), First Business Equipment Finance, LLC (“FBEF”), ABKC Real Estate, LLC (“ABKC”), Rimrock Road Investment Fund,FBB Real Estate 2, LLC (“Rimrock Road”), BOC Investment, LLC (“BOC”FBB RE 2”), Mitchell Street Apartments Investment, LLC (“Mitchell Street”), and FBB Tax Credit Investment LLC (“FBB Tax Credit”). FMIC is located in and was formed under the laws of the state of Nevada.
Basis of Financial Statement Presentation. The Consolidated Financial Statements include the accounts of the Corporation and its wholly-owned subsidiaries. All significant intercompany balances and transactions have been eliminated in consolidation. In accordance with the provisions
Use of Accounting Standards Codification (“ASC”) Topic 810, the Corporation’s ownership interest in FBFS Statutory Trust II (“Trust II”) has not been consolidated into the financial statements.
Estimates. Management of the Corporation is required to make estimates and assumptions thatwhich affect the reported amounts of assets and liabilities and disclosure of contingent assets and liabilities at the date of the financial statements as well as reported amounts of revenues and expenses during the reporting period. Actual results could differ significantly from those estimates. Material estimates that could significantly change in the near-term include the value of securities and interest rate swaps, level of the allowance for loan and leasecredit losses, lease residuals, property under operating leases, goodwill, level of the Small Business Administration (“SBA”) recourse reserve and income taxes. Certain amounts in prior periods may have been reclassified to conform to the current presentation.
Subsequent Events. Subsequent events have been evaluated through the date of the issuance of the Consolidated Financial Statements. No significant subsequent events have occurred through this date requiring adjustment to the financial statements or disclosures.
Cash and Cash Equivalents. The Corporation considers federal funds sold, interest-bearing deposits, and short-term investments that have original maturities of three months or less to be cash equivalents.
Securities. The Corporation classifies its investment and mortgage-related securities as available-for-sale, held-to-maturity, and trading. Debt securities that the Corporation has the positive intent and ability to hold to maturity are classified as held-to-maturity and are stated at amortized cost. Debt and equity securities bought expressly for the purpose of selling in the near term are classified as trading securities and are measured at fair value with unrealized gains and losses reported in earnings. Debt and equity securities not classified as held-to-maturity or as trading are classified as available-for-sale. Available-for-sale securities are measured at fair value with unrealized gains and losses reported as a separate component of stockholders’ equity, net of tax. Realized gains and losses and declines in value deemed to be other than temporary, are included in the consolidated statementsConsolidated Statements of incomeIncome as a component of non-interest income. Credit losses for securities are recorded as an allowance for credit losses through the provision for credit losses. The cost of securities sold is based on the specific identification method. The Corporation did not hold any trading securities at December 31, 20172023 or 2016.2022.
Discounts and premiums on securities are accreted and amortized into interest income using the effective yield method over the estimated life (based on maturity date, call date, or weighted average lifelife) of the securities.related security.
Declines in the fair value of investment securities (with certain exceptionsAllowance for Credit Loss (“ACL”) - Available For Sale (“AFS”) Debt Securities. For AFS debt securities noted below) that are deemed to be other-than-temporary are charged to earnings as a realizedin an unrealized loss and a new cost basis for the securities is established. In evaluating other-than-temporary impairment, management considers the length of time and extent to which the fair value has been less than cost, the financial condition and near-term prospects of the issuer and the intent and ability ofposition, the Corporation to retain its investment in the issuer for a period of time sufficient to allow for any anticipated recovery in fair value in the near term. Declines in the fair value of debt securities below amortized cost are deemed to be other-than-temporary in circumstances where: (1) the Corporation has the intent to sell a security; (2)first assesses whether it is more likely than not that the Corporation will be required to sell the security before recovery of its amortized cost basis; or (3) the Corporation does not expect to recover the entire amortized cost basis of the security. If the Corporation intends to sell, a security or if it is more likely than not that the Corporation will be required to sell the security before recovery, an other-than-temporary impairment write-down is recognized in earnings equal to the difference between the security’s amortized cost basis and its fair value. If the Corporation does not intend to sell the security or it is not more likely than not that it will be required to sell, the security before recovery of its amortized cost basis. If either of the other-
than-temporary impairment write-down is separated into an amount representingthe security by a rating agency, and adverse conditions specifically related to the security, among other factors. If this assessment indicates that a credit loss whichexists, the present value of cash flows expected to be collected from the security are compared to the amortized cost basis of the security. If the present value of cash flows expected to be collected is recognized in earnings,less than the amortized cost basis, a credit loss exists and an allowance for credit losses is recorded for the credit loss, limited by the amount related to all other factors, whichthat the fair value is less than the amortized cost basis. Any decline in fair value that has not been recorded through an allowance for credit losses is recognized in other comprehensive income.income, net of applicable taxes.
Changes in the ACL are recorded as a provision for (or recovery of) credit loss expense. Losses are charged against allowance when management believes that uncollectibility of an AFS debt security is confirmed or when either of the criteria regarding intent or requirement to sell is met.
Accrued interest receivable on AFS debt securities totaled $1.3 million at December 31, 2023 and is excluded from the estimate of credit losses.
ACL - Held To Maturity (“HTM”) Debt Securities. Management measures expected credit losses on HTM debt securities on a collective basis by major security type. Accrued interest receivable on HTM debt securities totaled $38,000 at December 31, 2023 and is excluded from the estimate of credit losses. The HTM securities portfolio includes residential mortgage backed securities (“MBS”) commercial MBS, and municipal securities. All residential and commercial MBS are U.S. government issued or U.S. government sponsored and substantially all municipal bonds are rated A or above.
Loans Held for Sale. Residential real estate loans and the The guaranteed portions of SBA loans which are originated and intended for sale in the secondary market are classified as held for sale. These loans are carried at the lower of cost or fair value in the aggregate. Unrealized losses on such loans are recognized through a valuation allowance by a charge to other non-interest income. Gains and losses on the sale of loans are also included in other non-interest income. As assets specifically originated for sale, the origination of, disposition of, and gain/loss on these loans are classified as operating activities in the statementConsolidated Statement of cash flows.Cash Flows. Fees received from the borrower and direct costs to originate the loans are deferred and recognized as part of the gain or loss on sale. There was $2.2were $4.6 million and $1.1$2.6 million in loans held for sale outstanding at December 31, 20172023 and 2016,2022, respectively.
Loans and Leases. Loans and leases which management has the intent and ability to hold for the foreseeable future or until maturity are reported at their outstanding principal balance with adjustments for partial charge-offs, the allowance for loan and leasecredit losses, deferred fees or costs on originated loans and leases, and unamortized premiums or discounts on any purchased loans.
A loan or a lease is accounted for as a troubled debt restructuring ifOccasionally, the Corporation for economicmodifies loans or legal reasons relatedleases to the borrower’sborrowers in financial condition, grants a concession to the borrower that it would not otherwise consider. A troubled debt restructuring may involve the receipt of assets from the debtor in partialdistress by providing principal forgiveness, term extension, an other-than-significant payment delay or full satisfaction of the loan or lease or a modification of terms, such as a reduction of the stated interest rate or facereduction. When principal forgiveness is provided, the amount of forgiveness is charged-off against the loan or lease, a reduction of accrued interest, an extension of the maturity date at a stated interest rate lower than the current market rateallowance for a new loan or lease with similar risk or some combination of these concessions. Restructured loans can involve loans remaining on non-accrual, moving to non-accrual or continuing on accrual status, depending on individual facts and circumstances. Non-accrual restructured loans are included and treated with all other non-accrual loans. In addition, all accruing restructured loans are reported as troubled debt restructurings which are considered and accounted for as impaired loans. Generally, restructured loans remain on non-accrual until the borrower has attained a sustained period of repayment performance under the modified loan terms (generally a minimum of six months). However, performance prior to the restructuring, or significant events that coincide with the restructuring, are considered in assessing whether the borrower can meet the new terms and whether the loan should be returned to or maintained on accrual status. If the borrower’s ability to meet the revised payment schedule is not reasonably assured, the loan remains on non-accrual.credit loss.
Interest on non-impairednon-performing loans and leases is accrued and credited to income on a daily basis based on the unpaid principal balance and is calculated using the effective interest method. Per policy, a loan or a lease is considered impairednon-performing and placed on non-accrual status when it becomes 90 days past due or it is doubtful that contractual principal and interest will be collected in accordance with the terms of the contract. A loan or lease is determined to be past due if the borrower fails to meet a contractual payment and will continue to be considered past due until all contractual payments are received. When a loan or leaseleases is placed on non-accrual, the interest accrual is discontinued and previously accrued but uncollected interest is deducted from interest income. If collectability of the contractual principal and interest is in doubt, payments received are first applied to reduce the loan principal. If collectability of the contractual payments is not in doubt, payments may be applied to interest for interest amounts due on a cash basis. As soon as it is determined with certainty that the principal of an impaireda non-performing loan or lease is uncollectable,uncollectible, either through collections from the borrower or disposition of the underlying collateral, the portion of the carrying balance that exceeds the estimated measurement value of the loan or lease is charged off. Loans or leases are returned to accrual status when they are brought current in terms of both principal and accrued interest due, have performed in accordance with contractual terms for a reasonable period of time, and when the ultimate collectability of total contractual principal and interest is no longer doubtful.
Transfers of assets, including but not limited to the guaranteed portions of SBA loans and participation interests in other, non-SBA originated loans, that upon completion of the transfer satisfy the conditions to be reported as a sale, including legal isolation, are derecognized from the Consolidated Financial Statements. Transfers of assets that upon completion of the transfer do not meet the conditions of a sale are recorded on a gross basis with a secured borrowing identified to reflect the amount of the transferred interest.
Loan and lease origination fees as well as certain direct origination costs are deferred and amortized as an adjustment to loan yields over the stated term of the loan or lease.loan. Loans or leases that result from a refinance or restructuring, other than a troubled debt restructuring,modified loans or leases to borrowers in financial distress, where terms are at least as favorable to the Corporation as the terms for comparable loans to other borrowers with similar collection risks and result in an essentially new loan, or lease, are accounted for as a new loan or lease.loan. Any unamortized net fees, costs, or penalties are recognized when the new loan or lease is originated. Unamortized net loan or lease fees or costs for loans and leases that result from a refinance or restructure with only minor modifications to the original loan or lease contract are carried forward as a part of the net investment in the new loanloan. For modified loans or lease. For troubled debt
restructurings,leases to borrowers in financial distress, all fees received in connection with a modification of terms are applied as a reduction of the loan or lease and any related costs, including direct loan origination costs, are charged to expense as incurred.
ACL - Loans. The ACL is a valuation account that is deducted from the loans' amortized cost basis to present the net amounts expected to be collected on the loans. Loans are charged off against the allowance when management believes that the uncollectibility of a loan balance is confirmed. Expected recoveries do not exceed the aggregate of amounts previously charged-off and expected to be charged-off.
Management estimates the allowance balance using relevant available information, from internal and external sources, relating to past events, current conditions, and reasonable and supportable forecasts. Historical credit loss experience provides the basis for the estimation of expected credit losses. Adjustments to historical loss information are made for differences in current loan-specific risk characteristics such as differences in underwriting standards, portfolio mix, delinquency level, or term as well as changes in external conditions, such as changes in unemployment rates, property values, or other relevant factors.
Accrued interest receivable on loans totaled $11.1 million at December 31, 2023 and is excluded from the estimate of credit losses.
ACL - Loans - Collectively Evaluated. The ACL is measured on a collective pool basis when similar risk characteristics exist. The Corporation purchased an individual loanhas identified the following portfolio segments:
Commercial Real Estate: Commercial real estate portfolio segments utilize substantially similar processes and controls. Due to the collateral types, availability of data, and results of the Loss Driver Analysis (“LDA”), management utilizes a unique forecast model for each portfolio segment along with a separate analysis of subjective factors.
•Construction - Loans secured by real estate used to finance land development or construction.
•1-4 Family - Loans secured by 1-4 family residential property
•Multi-family - Loans secured by multi-family residential property
•Owner Occupied - Loans secured by nonfarm, nonresidential owner-occupied property
•Non-owner Occupied - Loans secured by other nonfarm, nonresidential property
Commercial and Industrial Lending: Commercial and industrial lending is a portfolio segment where management uses a common forecast due to common risk management, similarity in 2013collateral types, availability of data, and a groupresults of the LDA. Management has distinct processes, controls, and procedures which enable more precise development of subjective factors at the pool level.
•Commercial - Loans to small- to medium-sized companies in our primary markets in Wisconsin, Kansas, and Missouri, predominantly through lines of credit and term loans to businesses with annual sales of up to $150 million.
•Asset Based Lending - Products include revolving lines of credit and term loans for strategic acquisitions, capital expenditures, working capital, bank debt refinancing, debt restructuring, and corporate turnaround strategies.
•Floorplan - Floor plan financing for independent auto dealerships nationwide.
•SBA - Loans originated in connectionaccordance with the Alterra acquisition which have shown evidenceguidelines of credit deterioration since origination. These purchasedthe Small Business Administration (“SBA”). As the Corporation prefers to sell the guaranteed portion, the on-balance sheet loans are recorded at fair value, such that there is no carryoverprimarily unguaranteed.
•Equipment finance - Loans and leases secured by a broad range of equipment to commercial clients in a variety of industries.
Consumer and other: Consumer loans consisted of marketable security loans and other personal loans for executives and high net-worth individuals. The Corporation uses a unique forecast model and subjective factors for this portfolio segment due to the client type and data availability.
Measures of the seller’s allowance for loan losses. Such purchased loansACL are accounted for individually. At acquisition,as follows:
| | | | | | | | | | | | | | | | | | | | |
| Portfolio Segment | | Pool | | Measurement Method | | Loss Driver |
| Commercial real estate | | | | | | |
| Owner occupied | | | | Discounted Cash Flow | | National unemployment, National GDP |
| Non-owner occupied | | | | Discounted Cash Flow | | National unemployment, National GDP |
| Construction | | | | Discounted Cash Flow | | National unemployment, National GDP |
| Multi-family | | | | Discounted Cash Flow | | National unemployment, National GDP |
| 1-4 Family | | | | Discounted Cash Flow | | National unemployment, National GDP |
| Commercial and industrial | | | | | | |
| | Commercial | | Discounted Cash Flow | | National unemployment, National GDP |
| | ABL | | Discounted Cash Flow | | National unemployment, National GDP |
| | Floorplan | | Discounted Cash Flow | | National unemployment, National GDP |
| | SBA | | Weighted Average Remaining Maturity | | N/A |
| | Equipment Finance | | Discounted Cash Flow | | National unemployment, National GDP |
| Consumer and other | | | | Discounted Cash Flow | | National unemployment, National GDP |
The Corporation utilized a discounted cash flow (DCF) or Weighted Average Remaining Maturity (WARM) method to estimate the Corporation estimates the amount and timingquantitative portion of expected cash flows for each purchased loan and the expected cash flows in excess of fair value are recorded as interest income over the remaining life of the loan (accretable yield). The excess of the loan’s contractual principal and interest over expected cash flows at acquisition is not recorded (nonaccretable difference).
Over the life of the loan, expected cash flows continue to be estimated. If the present value of expected cash flows is less than the carrying amount, losses are recognized by an increase in the allowance for loan losses. Ifcredit losses for loans evaluated on a collective pooled basis. For each segment, a LDA was performed in order to identify loss drivers and create a regression model for use in forecasting cash flows. For all DCF-based pools, the present valueLDA analyses utilized the Corporation’s and peer data from the Federal Financial Institutions Examination Council's (“FFIEC”) Call Report filings.
In creating the DCF model, the Corporation has established a one-year reasonable and supportable forecast period with a one-year straight line reversion to the long-term historical average. Due to the infrequency of expected cash flows is greater thanlosses, the carrying amount, it is recognized as partCorporation elected to use peer data for a more statistically sound calculation.
Key inputs into the DCF model include loan-level detail, including the amortized cost basis of future interest income.
Allowance for Loanindividual loans, payment structure, loss history, and Lease Losses.forecasted loss drivers. The allowance for loan and lease losses is maintained atCorporation utilizes a level that management deems appropriatethird party to absorb probable and estimable losses inherentprovide economic forecasts under various scenarios, which are assessed quarterly considering the scenarios in the loan and lease portfolios. The methodology applied for determining inherent losses stems from current risk characteristicscontext of the loancurrent economic environment and lease portfolio, an assessmentpresumed risk of individual impaired loans and leases, actual loss experience and adverse situations that may affectloss.
Expected credit losses are estimated over the borrower’s ability to repay. The methodology also focuses on evaluation of several factors for each portfolio category, including but not limited to: management’s ongoing review and gradingcontractual term of the loanloans, adjusted for prepayments when appropriate. The contractual term excludes extensions, renewals, and lease portfolios, consideration of delinquency experience, changesmodifications unless the extension or renewal options are included in the sizeoriginal or modified contract at the reporting date and are not unconditionally cancellable by the Corporation.
Additional key assumptions in the DCF model include the probability of default (“PD”), loss given default (“LGD”), and prepayment/curtailment rates. The Corporation utilizes the model-driven PD and a LGD derived using a method referred to as Frye Jacobs. The Frye Jacobs method is a mathematical formula that traces the relationship between LGD and PD over time and projects the LGD based on the level of PD forecasted. In all cases, the Frye Jacobs method is utilized to calculate LGDs during the forecast period, reversion period and long-term historical average. Prepayment and curtailment rates were calculated through third party studies of the loan and lease portfolios, existing economic conditions, level of loans and leases subject to more frequent review by management, changes in underlying collateral, concentrations of loans to specific industries and other qualitative and quantitative factors that could affect credit losses. Impaired and other loans and leases have risk characteristics that are unique to an individual borrower andCorporation’s own data.
When the loss must be estimated on an individual basis. Loans and leases that are not individually reviewed and measured for impairment are aggregated and historical loss statistics are primarilyDCF method is used to determine the allowance for credit losses, management adjusts the effective interest rate used to discount expected cash flows to incorporate expected prepayments.
For the WARM-based SBA pool, Corporation-specific data was used to develop the model assumptions. The Corporation developed a reasonable and supportable estimate for the remaining maturity and estimated loss through analysis of historical data. The remaining maturity calculation excludes loans originated under the Paycheck Protection Program as such loans are inconsistent with the current portfolio composition. The quarterly loss rate data includes 2017 to current as the SBA lending policies and procedures were realigned in 2016 following the acquisition of Alterra Bank. Only the unguaranteed portion of the SBA loans are assessed via WARM. The risk of loss.a failed guarantee claim is captured under ASC 450 contingency accounting.
Qualitative factors for DCF and WARM methodologies include the following:
•The measurementCorporation’s lending policies and procedures, including changes in lending strategies, underwriting standards and practices for collections, write-offs, and recoveries;
•Actual and expected changes in international, national, regional, and local economic and business conditions and developments in which the Corporation operates that affect the collectability of financial assets;
•The experience, ability, and depth of the estimateCorporation’s lending, investment, collection, and other relevant management and staff;
•The volume of loss is reliant upon historical experience, information aboutpast due financial assets, the abilityvolume of non-performing assets, and the volume and severity of adversely classified or graded assets;
•The existence and effect of industry concentrations of credit;
•The nature and volume of the individual debtor to pay and the appraisal of loan collateral in light of current economic conditions. An estimate of loss is an approximation of what portion of all amounts receivable, according to the contractual terms of that receivable, is deemed uncollectible. Determinationportfolio segment or class;
•The quality of the allowance is inherently subjective because it requires estimationCorporation’s credit review function and;
•The effect of amountsother external factors such as the regulatory, legal and timing of expected future cash flows on impaired loans and leases, estimation of losses on types of loans and leases based on historical losses and consideration of current economic trends, both local and national. Based on management’s periodic review using all previously mentioned pertinent factors, a provision for loan and lease losses is charged to expense when it is determined an increase in the allowance for loan and lease losses is appropriate. A negative provision for loan and lease losses may be recognized if management determines a reduction in the level of allowance for loan and lease losses is appropriate. Loan and lease losses are charged against the allowance and recoveries are credited to the allowance.
The allowance for loan and lease losses contains specific allowances established for expected losses on impaired loans and leases. Impaired loans and leases are defined as loans and leases for which, based on current informationtechnological environments, competition, and events it is probablesuch as natural disasters or pandemics
ACL - Loans - Individually Evaluated. Loans that the Corporation will be unable to collect scheduled principal and interest payments according to the contractual terms of the loan or lease agreement. Loans and leases subject to impairment are defined as non-accrual and restructured loans and leases.
Impaired loans and leasesdo not share risk characteristics are evaluated on an individual basis and are excluded from the collective evaluation. The Corporation has determined that all loans which have been placed on non-performing status and other performing loans that have been identified due to determinenon-conforming characteristics will be individually evaluated. Individual analysis will evaluate the amount ofrequired specific reserve or charge-off required, if any. Smaller balance (individually less than $50,000)for loans and leasesin scope. Specific reserves on non-performing loans are collectively evaluated for impairment as allowed under applicable accounting standards.
The measurement value of impaired loans and leases is determinedtypically based on the present valuemanagement’s best estimate of expected future cash flows discounted at the loan’s effective interest rate (the contractual interest rate adjusted for any net deferred loan fees or costs, premium or discount existing at the origination or acquisition of the loan), the market price of the loan or lease or the fair value of collateral securing these loans, adjusted for selling costs as appropriate.
ACL - Off-Balance Sheet Credit Exposures. The Corporation estimates expected credit losses over the underlying collateral less costscontractual period in which the Corporation is exposed to sell, ifcredit risk via a contractual obligation to extend credit, unless that obligation is unconditionally cancellable by the loan or leaseCorporation. The allowance for credit losses on off-balance sheet credit exposure is collateral dependent. A loan or lease is collateral dependent if repayment isadjusted as a provision for credit loss expense. The estimate includes consideration of the likelihood that funding will occur and an estimate of expected credit losses on commitments expected to be provided principally by the underlying collateral. A loan’s effective interest rate may changefunded over the lifeits estimated life. Funding rates are based on a historical analysis of the loan based on subsequent changes in rates or indices or may be fixed at the rate in effect at the date the loan wasCorporation’s portfolio, while estimates of credit losses are determined to be impaired.
Subsequent to the initial impairment, any significant change in the amount or timing of an impaired loan or lease’s future cash flows will result in a reassessment of the valuation allowance to determine if an adjustment is necessary. Measurements based on observable market price or fair value of the collateral may change over time and require a reassessment of the allowance if there is a significant change in either measurement base. Any increase in the present value of expected future cash flows attributable to the passage of time is recorded as interest income accrued on the net carrying amount of the loan or lease at the
effective interest rate used to discount the impaired loan or lease’s estimated future cash flows. Any change in present value attributable to changes in the amount or timing of expected future cash flows is recorded as loan loss expense inusing the same manner in which impairment was initially recognized orloss rates as a reduction of loan loss expense that otherwise would be reported. Where the level of loan or lease impairment is measured using observable market price or fair value of collateral, any decrease in the observable market price of an impaired loan or lease or fair value of the collateral of an impaired collateral-dependent loan or lease is recorded as loan loss expense in the same manner in which impairment was initially recognized. Any increase in the observable market value of the impaired loan or lease or fair value of the collateral of an impaired collateral-dependent loan or lease is recorded as a reduction in the amount of loan loss expense that otherwise would be reported.funded loans.
Net Investment in Direct Financing Leases. The net investment in direct financing lease agreements represents total undiscounted payments plus estimated unguaranteed residual value (approximating 3% to 20% of the cost of the related equipment) and is recorded as lease receivables when the lease is signed and the leased property is delivered to the client. The excess of the minimum lease payments and residual values over the cost of the equipment is recorded as unearned lease income. Unearned lease income is recognized over the term of the lease on a basis which results in an approximate level rate of return on the unrecovered lease investment. Lease payments are recorded when due under the lease contract. Residual values are established at lease inception equal to the estimated value to be received from the equipment following termination of the initial lease and such estimated value considers all relevant information and circumstances regarding the equipment. In estimating the equipment’s fair value at lease termination, the Corporation relies on internally or externally prepared appraisals, published sources of used equipment prices and historical experience adjusted for known current industry and economic trends. The Corporation’s estimates are periodically reviewed to ensure reasonableness; however, the amounts the Corporation will ultimately realize could differ from the estimated amounts. When there are other than temporary declines in the Corporation’s carrying amount of the unguaranteed residual value, the carrying value is reduced and charged to non-interest expense.
Operating Leases. Machinery and equipment are leased to clients under operating leases and are recorded at cost. Equipment under such leases is depreciated over the estimated useful life or term of the lease, if shorter. The impairment loss, if any, would be charged to expense in the period it becomes evident. Rental income is recorded on the straight-line accrual basis as other non-interest income.
Premises and Equipment, net. The cost of buildings and capitalized leasehold improvements is amortized on the straight-line method over the lesser of the term of the respective lease or estimated economic life. Equipment is stated at cost less accumulated depreciation and amortization which is calculated by the straight-line method over the estimated useful lives of three3 to ten10 years. Maintenance and repair costs are charged to expense as incurred. Improvements which extend the useful life are capitalized and depreciated over the remaining useful life of the assets.
Foreclosed Properties.Repossessed Assets. Property acquired by repossession, foreclosure, or by deed in lieu of foreclosure is carriedrecorded at the lower of the recorded investment in the loan at the time of acquisition or the fair value of the underlying property, less costs to sell. This fair value becomes the new cost basis for the repossessed asset. Any write-down in the carrying value of a loan or lease at the time of acquisition is charged to the allowance for loan and leasecredit losses. Any subsequent write-downs to reflect current fair value, as well as gains and losses on disposition and revenues are recorded in non-interest expense. CostsAny required or prudent costs incurred relating to the development and improvement of the property are capitalized while holding period costs are charged to other non-interest expense.
Leases. At contract inception, the Corporation determines whether the arrangement is or contains a lease and determines the lease classification. The lease term is determined based on the non-cancellable term of the lease adjusted to the extent optional renewal terms and termination rights are reasonably certain. Lease expense is recognized evenly over the lease term. Variable lease payments are recognized as period costs. The present value of remaining lease payments is recognized as a liability on the balance sheet with a corresponding right-of-use asset adjusted for prepaid or accrued lease payments. The Corporation uses the Federal Home Loan Bank fixed advance rate as of the lease inception date that most closely resembles the remaining term of the lease as the incremental borrowing rate, unless the interest rate implicit in the lease contract is readily determinable. The Corporation has elected to exclude short-term leases as well as all non-lease items, such as common area maintenance, from being included in the lease liability on the Consolidated Balance Sheets.
Bank-Owned Life Insurance. Bank-owned life insurance (“BOLI”) is reported at the amount that would be realized if the life insurance policies were surrendered on the balance sheet date. BOLI policies owned by the Bank are purchased with the objective to fund certain future employee benefit costs with the death benefit proceeds. The cash surrender value of such policies is recorded in bank-owned life insurance on the Consolidated Balance Sheets and changes in the value are recorded in non-interest income. The total death benefit of all BOLI policies was $97.7$133.7 million and $97.3$133.8 million as of December 31, 20172023 and 2016,2022, respectively. There are no restrictions on the use of BOLI proceeds nor are there any contractual restrictions on the ability to surrender the policy. As of each of December 31, 20172023 and 2016,2022, there were no borrowings against the cash surrender value of the BOLI policies.
Federal Home Loan Bank and Federal Reserve Bank Stock. The Bank is required to maintain Federal Home Loan Bank (“FHLB”) stock as members of the FHLB, and in amounts as required by these institutions. Alterra, previously as a state chartered member of the Federal Reserve Bank of Kansas City, was required to own shares of Federal Reserve Bank (“FRB”) stock. TheseFHLB. This equity securities aresecurity is “restricted” in that theyit can only be sold back to the respective institutionsFHLB or another member institution at par. Therefore, they areit is less liquid than other marketable equity securities and theirthe fair value is equal to cost. At December 31, 2017 and 2016, the Bank had FHLB stock of $1.1 million and $1.8 million, respectively. Alterra had FRB stock of $1.1 million at December 31, 2016. The Corporation periodically evaluates its holding in FHLB and FRB stock for impairment. Should the stock be impaired, it would be written down to its estimated fair value. There were no impairments recorded on FHLB and FRB stock during the yearyears ended December 31, 20172023 or 2016.2022.
Goodwill and Other Intangible Assets. Goodwill and other intangible assets consist primarily of goodwill core deposit intangibles and loan servicing rights. Core deposit intangibles have estimated finite lives and are amortized on an accelerated basis to expense over a period of seven years. Loan servicing rights, when purchased,originated, are initially recorded at fair value and subsequently amortized in proportion to and over the period of estimated net servicing income. The Corporation reviews other intangible assets for impairment at least annually, or whenever events or changes in circumstances indicate that the carrying amount of an asset may not be recoverable, in which case an impairment charge would be recorded.
Goodwill is not amortized but is subject to impairment tests on at least an annual basis, and more frequently if an event occurs or circumstances change that would more likely than not reduce the fair value of the reporting unit below its carrying amount (including goodwill). An initial qualitative evaluation is made to assess the likelihood of impairment and determine whether further quantitative testing to calculate the fair value is necessary. When the qualitative evaluation indicates that impairment is more likely than not, quantitative testing is required whereby the fair value of each reporting unit is calculated and compared to the recorded book value, “step one.”value. If the calculated fair value of the reporting unit exceeds its carrying value, goodwill is not considered impaired and “step two” is not considered necessary.impaired. If the carrying value of a reporting unit exceeds its calculated fair value, an impairment charge is recognized in earnings in an amount equal to the impairment test continues (“step two”) by comparingdifference.
Other Investments. The Corporation owns certain equity investments in other corporate organizations which are not consolidated because the carryingCorporation does not own more than a 50% interest or exercise control over the organization. Investments in corporations representing at least a 20% interest are generally accounted for using the equity method and investments in corporations representing less than 20% interest are generally accounted for at cost. Investments in limited partnerships representing from at least a 3% up to a 50% interest in the entity are generally accounted for using the equity method and investments in limited partnerships representing less than 3% are generally accounted for at cost. All of these investments are periodically evaluated for impairment. Should an investment be impaired, it would be written down to its estimated fair value. The equity investments are reported in other assets and the income and expense from such investments, if any, is reported in non-interest income and non-interest expense.
Derivative Instruments. The Corporation uses derivative instruments to protect against the risk of adverse price or interest rate movements on the value of the reporting unit’s goodwillcertain assets, liabilities, future cash flows, and economic hedges for written client derivative contracts. Derivative instruments represent contracts between parties that usually require little or no initial net investment and result in one party delivering cash to the impliedother party based on a notional amount and an underlying variable, as specified in the contract, and may be subject to master netting agreements.
Market risk is the risk of loss arising from an adverse change in interest rates, exchange rates, or equity prices. The Corporation’s primary market risk is interest rate risk. Instruments designed to manage interest rate risk include interest rate swaps, interest rate options, and interest rate caps and floors with indices that relate to the pricing of specific assets and liabilities. The nature and volume of the derivative instruments used to manage interest rate risk depend on the level and type of assets and liabilities on the balance sheet and the risk management strategies for the current and anticipated rate environments. Counterparty risk with respect to derivative instruments occurs when a counterparty to a derivative contract with an unrealized gain fails to perform according to the terms of the agreement. Counterparty risk is managed by limiting the counterparties to highly rated dealers, requiring collateral postings when values are in deficit positions, applying uniform credit standards to all activities with credit risk, and monitoring the size and the maturity structure of the derivative portfolio.
All derivative instruments are to be carried at fair value on the Consolidated Balance Sheets. The accounting for the gain or loss due to changes in the fair value of goodwill.a derivative instrument depends on whether the derivative instrument qualifies as a hedge. If the derivative instrument does not qualify as a hedge, the gains or losses are reported in earnings when they occur. However, if the derivative instrument qualifies as a hedge, the accounting varies based on the type of risk being hedged. The impliedCorporation utilizes interest rate swaps offered directly to qualified commercial borrowers, which do not qualify for hedge accounting, and therefore, all changes in fair value is computed by adjusting all assets and liabilitiesgains and losses on these instruments are reported in earnings as they occur. The effects of netting arrangements are disclosed within the Notes of the reporting unitConsolidated Financial Statements. The Corporation offers interest rate swap products directly to currentqualified commercial borrowers. The Corporation economically hedges client derivative transactions by entering into offsetting interest rate swap contracts executed with a third party. Derivative transactions executed as part of this program are not considered hedging instruments and are marked-to-market through earnings each period. The derivative contracts have mirror-image terms, which results in the positions’ changes in fair value withoffsetting through earnings each period. The credit risk and risk of non-performance embedded in the offset adjustment to goodwill. The adjusted goodwill balancefair value calculations is different between the implieddealer
counterparties and the commercial borrowers which may result in a difference in the changes in the fair value of the goodwill. An impairment charge is recognized ifmirror-image swaps. The Corporation incorporates credit valuation adjustments to appropriately reflect both its own non-performance risk and the carryingcounterparty’s risk in the fair value of goodwill exceedsmeasurements. When evaluating the implied fair value of goodwill. See Note 6its derivative contracts for additional information on goodwillthe effects of non-performance and credit risk, the Corporation considers the impact of netting and any applicable credit enhancements such as collateral postings, thresholds and guarantees.
The Corporation also enters into interest rate swaps to manage interest rate risk and reduce the cost of match-funding certain long-term fixed rate loans. These derivative contracts are designated as a cash flow hedge as the receipt of floating interest from the counterparty is used to manage interest rate risk associated with forecasted issuances of short-term FHLB advances. The change in fair value of the hedging instrument is recorded in accumulated other intangible assets.comprehensive income.
SBA Recourse Reserve. The Corporation establishes SBA recourse reserves on the guaranteed portions of sold SBA loans when it is probable that the guarantee may be ineligible.loans. The recourse reserve is reported in accrued interest payable and other liabilities on the Consolidated Balance Sheets and consists of two components: (1) specific reservesSheets. A reserve is established for individually evaluated impaired loans that present a collateral shortfall whereand it is probable that the guaranty associated with the sold portion of the SBA loan is determined to most likely be ineligible; and (2) general reserves for estimated probable losses on the remaining sold portfolio. The general reserve methodology is based on the evaluation of several factors, including but not limited to: credit quality trends within the SBA portfolio, changes in underlying collateral and the Corporation’s ability to originate, fund or service sold SBA loans in accordance with SBA regulations.ineligible.
In the ordinary course of business, the Corporation sells the guaranteed portions of SBA loans to third parties. The Corporation has a continuing involvement in each of the transferred lending arrangements by way of relationship management, servicing the loans, as well as being subject to normal and customary requirements of the SBA loan program; however, there are no further obligations to the third-party participant required of the Corporation, other than standard representations and warranties related to sold amounts. In the event of a loss resulting from default and a determination by the SBA that there is a deficiency in the manner in which the loan was originated, funded, or serviced by the Corporation, the SBA may require the Corporation to repurchase the loan, deny its liability under the guaranty, reduce the amount of the guaranty, or, if it has already paid under the guaranty, seek recovery of the principal loss related to the deficiency from the Corporation. The Corporation must comply with applicable SBA regulations in order to maintain the guaranty. In addition, the Corporation retains the option to repurchase the sold guaranteed portion of an SBA loan if the loan defaults. See Note 18 for additional information on the SBA recourse reserve.
Other Investments. The Corporation owns certain equity investments in other corporate organizations which are not consolidated because the Corporation does not own more than a 50% interest or exercise control over the organization. Investments in corporations representing at least a 20% interest are generally accounted for using the equity method and investments in corporations representing less than 20% interest are generally accounted for at cost. Investments in limited partnerships representing from at least a 3% up to a 50% interest in the entity are generally accounted for using the equity method and investments in limited partnerships representing less than 3% are generally accounted for at cost. All of these investments are periodically evaluated for impairment. Should an investment be impaired, it would be written down to its estimated fair value. The equity investments are reported in other assets and the income and expense from such investments, if any, is reported in non-interest income and non-interest expense.
Derivative Instruments. The Corporation uses derivative instruments to protect against the risk of adverse price or interest rate movements on the value of certain assets, liabilities, future cash flows and economic hedges for written client derivative contracts. Derivative instruments represent contracts between parties that usually require little or no initial net investment and result in one party delivering cash to the other party based on a notional amount and an underlying variable, as specified in the contract, and may be subject to master netting agreements.
Market risk is the risk of loss arising from an adverse change in interest rates, exchange rates or equity prices. The Corporation’s primary market risk is interest rate risk. Instruments designed to manage interest rate risk include interest rate swaps, interest rate options and interest rate caps and floors with indices that relate to the pricing of specific assets and liabilities. The nature and volume of the derivative instruments used to manage interest rate risk depend on the level and type of
assets and liabilities on the balance sheet and the risk management strategies for the current and anticipated rate environments. Counterparty risk with respect to derivative instruments occurs when a counterparty to a derivative contract with an unrealized gain fails to perform according to the terms of the agreement. Counterparty risk is managed by limiting the counterparties to highly rated dealers, requiring collateral postings when values are in deficit positions, applying uniform credit standards to all activities with credit risk and monitoring the size and the maturity structure of the derivative portfolio.
All derivative instruments are to be carried at fair value on the Consolidated Balance Sheets. The accounting for the gain or loss due to changes in the fair value of a derivative instrument depends on whether the derivative instrument qualifies as a hedge. If the derivative instrument does not qualify as a hedge, the gains or losses are reported in earnings when they occur. However, if the derivative instrument qualifies as a hedge, the accounting varies based on the type of risk being hedged. In 2017 and 2016, the Corporation utilized interest rate swaps offered directly to qualified commercial borrowers, which did not qualify for hedge accounting, and therefore, all changes in fair value and gains and losses on these instruments were reported in earnings as they occurred. The effects of netting arrangements are disclosed within the Notes of the Consolidated Financial Statements.
During the fourth quarter of 2017, the Corporation also entered into an interest rate swap to manage interest rate risk and reduce the cost of match-funding certain long-term fixed rate loans. This derivative contract was designated as a cash flow hedge as the receipt of floating interest from the counterparty is used to manage interest rate risk associated with forecasted issuances of short-term FHLB advances. The change in fair value of the hedging instrument was recorded in accumulated other comprehensive income.
Income Taxes. Deferred income tax assets and liabilities are computed for temporary differences in timing between the financial statement and tax basis of assets and liabilities that result in taxable or deductible amounts in the future based on enacted tax law and rates applicable to periods in which the differences are expected to affect taxable income. The effect of a change in tax rates on deferred taxes is recognized in income in the period that includes the enactment date. The ultimate realization of deferred tax assets is dependent upon the generation of future taxable income during the periods in which those temporary differences become deductible. Management considers the scheduled reversals of deferred tax liabilities, appropriate tax planning strategies, and projections for future taxable income over the period which the deferred tax assets are deductible. When necessary, valuation allowances are established to reduce deferred tax assets to the realizable amount. Management believes it is more likely than not thatIn July 2023, the Corporation will realizestate of Wisconsin incorporated a Commercial loan interest exemption (2023 Wis. Act. 19 - Section 71.26(1)(i)) into its tax law. The exemption applies to the benefitsincome of these deductible differences, neta financial institution including interest, fees ,and penalties, derived from a commercial loan of $5 million or less provided to borrowers residing or located in the state and used primarily for a business or agricultural purposes. The addition of the existingnew state commercial income exclusion is expected to result in a taxable loss at the state level considering pre-tax book income and expected permanent adjustments to state income. This state taxable loss is expected to produce state net operating losses that will not be realizable in the future barring any further state tax law change, or a change in the Corporation’s mix of products. The Corporation also does not expect its deferred tax liabilities to be a substantial source of taxable income at the state level. The Corporation does not currently have a tax planning technique in process to generate Wisconsin taxable income to overcome the losses. Therefore, management recorded a valuation allowances.allowance against the Corporation’s Wisconsin deferred tax assets as of December 31, 2023.
Income tax expense or benefit represents the tax payable or tax refundable for a period, adjusted by the applicable change in deferred tax assets and liabilities for that period. The Corporation also invests in certain development entities that generate federal and state historic tax credits. The tax benefits associated with these investments are accounted for under the flow-through method and are recognized when the respective project is placed in service. The Corporation and its subsidiaries file a consolidated federal income tax return and separate state income tax returns. Tax sharing agreements allocate taxes to each legal entity for the settlement of intercompany taxes. The Corporation applies a more likely than not standard to each of its tax positions when determining the amount of tax expense or benefit to record in its financial statements. Unrecognized tax benefits are recorded in other liabilities. The Corporation recognizes accrued interest relating to unrecognized tax benefits in income tax expense and penalties in other non-interest expense.
Other Comprehensive Income or Loss. Comprehensive income or loss, shown as a separate financial statement, includes net income or loss, changes in unrealized holding gains and losses on available-for-sale securities, changes in deferred gains and losses on investment securities transferred from available-for-sale to held-to-maturity, if any, changes in unrealized gains and losses associated with cash flow hedging instruments, if any, and the amortization of deferred gains and losses associated with terminated cash flow hedges, if any. For the year ended December 31, 2017,2023, $45,000 of realized securities losses were
recognized and reclassified out of accumulated other comprehensive income. Realized securities gains of $10,000 were reclassified out of accumulated other comprehensive income forloss. For the year ended December 31, 2016.2022, no realized securities gains or losses were recognized.
Earnings Per Common Share. Earnings per common share (“EPS”) is computed using the two-class method. Basic EPS is computed by dividing net income allocated to common shares by the weighted average number of common shares outstanding for the period, excluding any participating securities. Participating securities include unvested restricted shares. Unvested restricted shares are considered participating securities because holders of these securities receive non-forfeitable dividends at the same rate as the holders of the Corporation’s common stock. Diluted EPS is computed by dividing net income allocated to common shares adjusted for reallocation of undistributed earnings of unvested restricted shares by the weighted average number of common shares determined for the basic EPS plus the dilutive effect of common stock equivalents using the treasury stock method based on the average market price for the period.
Segments and Related Information. The Corporation is required to report each operating segment based on materiality thresholds of ten percent or more of certain amounts, such as revenue. Additionally, the Corporation is required to report separate operating segments until the revenue attributable to such segments is at least 75 percent of total consolidated revenue.
The Corporation provides a broad range of financial services to individuals and companies in the Midwest.companies. These services include demand, time, and savings products, the sale of certain non-deposit financial products, and commercial and retail lending, leasing and trustprivate wealth management services. While the Corporation’s chief decision-maker monitors the revenue streams of the various products, services, and locations, operations are managed and financial performance is evaluated on a corporate-wide basis. The Corporation’s business units have similar basic characteristics in the nature of the products, production processes and type or class of client for products or services; therefore, these business units are considered one operating segment.
Share-Based Compensation. As noted below within The Corporation may grant restricted stock awards, restricted stock units, and other stock based awards to plan participants, subject to forfeiture upon the “Recent Accounting Pronouncements” section,occurrence of certain events until the dates specified in the participant’s award agreement. The Corporation early adopted ASU No. 2016-09accounts for forfeitures as they occur. While restricted stock is subject to forfeiture, restricted stock award participants may exercise full voting rights and will receive all dividends and other distributions paid with respect to the restricted shares. Dividend equivalent units with respect to restricted stock grants made after January 2023 will be deferred and paid at the time of vesting. Restricted stock units do not have voting rights and are provided dividend equivalents. The restricted stock granted under the 2019 Equity Incentive Plan (the “Plan”) is typically subject to a three or four year vesting period. Compensation expense for restricted stock is recognized over the requisite service period of three or four years for the entire award on October 1, 2016 with an effective date of January 1, 2016.a straight-line basis. Upon vesting of restricted share awards subject to ASU No. 2016-09,stock, the benefit of tax deductions in excess of recognized compensation expense is reflected as an income tax benefit in the Consolidated Statements of Income. Excess tax benefits are included in other operating activities and taxes paid related to net share settlement of equity awards in financing activities within the Consolidated Statements of Cash Flows.
The Corporation elected to account for forfeitures as they occur. Whileissues a combination of performance-based restricted stock is subject to forfeiture,units and restricted stock participants may exercise full voting rightsawards to plan participants. Vesting of the performance-based restricted stock units will be measured on Total Shareholder Return (“TSR”) and Return on Average Equity (“ROAE”) prior to 2023 or Return on Average Common Equity (“ROACE”) for issuances after 2022, and will receive all dividends and other distributions paid with respect tocliff-vest after a three-year measurement period based on the restricted shares. Restricted stock units do not have voting rights and are provided dividend equivalents. The restricted stock granted under the Plan is typically subjectCorporation’s performance relative to a vesting period.custom peer group. At the end of the performance period, the number of actual shares to be awarded varies between 0% and 200% of target amounts. Compensation expense is recognized for performance-based restricted stock units over the requisite service and performance period of generally fourthree years for the entire expected award on a straight-line basis. See Note 12The compensation expense for additional information on share-based compensation.
Recent Accounting Pronouncements.
In May 2014, the FASB issued ASU No. 2014-09, “Revenue from Contracts with Customers (Topic 606),” with an original effective dateawards expected to vest for annual reporting periods beginning after December 15, 2016. The ASU is a converged standard between the FASB and the IASB that provides a single comprehensive revenue recognition model for all contracts with customers across transactions and industries. The primary objectivepercentage of the ASU is revenue recognition that represents the transfer of promised goods or services to customers in an amount that reflects the consideration to which the entity expects to be entitled in exchange for those goods or services. In August 2015, the FASB issued ASU No. 2015-14, which defers the effective date of ASU 2014-09 to annual and interim reporting periods in fiscal years beginning after December 15, 2017. Earlier application is permitted only as of annual and interim reporting periods in fiscal years beginning after December 15, 2016. In March 2016, the FASB issued ASU No. 2016-08, “Revenue from Contracts with Customers (Topic 606): Principal versus Agent Considerations (Reporting Revenue Gross versus Net.” The ASU intends to improve the operability and understandability of the implementation guidance of ASU 2014-09 on principal versus agent considerations. In April, May and December 2016, the FASB also issued ASU No. 2016-10, No. 2016-12 and No. 2016-20, respectively, related to Topic 606. The amendments do not change the core principals of the previously issued guidance, but instead further clarify and provide implementation guidance for certain aspects of the original ASU. The Corporation intends to adopt the accounting standards during the first quarter of 2018, as required. The Corporation conducted its assessment of the primary contractsperformance-based restricted stock units subject to the guidance, including trustmetric will be adjusted if there is a change in the expectation of metric. The compensation expense for the awards expected to vest for the percentage of performance-based restricted stock units subject to the TSR metric are never adjusted, and asset management fees, brokerage commissions and deposit service charges. are amortized utilizing the accounting fair value provided using a Monte Carlo pricing model.
The Corporation has concluded that the adoptionoffers an Employee Stock Purchase Plan (“ESPP”) to all qualifying employees. The plan qualifies as an ESPP under section 423 of the accounting standard will not haveInternal Revenue Code of 1986. Under the ESPP, eligible employees may enroll in a material impactthree month offer period that begins January, April, July, and October of each year. Employees may purchase a limited number of shares of the Corporation’s common stock at 90% of the fair market value on the Corporation’s existing revenue recognition practices or on its results of operations, financial position and liquidity.
In February 2016, the FASB issued ASU No. 2016-02, “Leases (Topic 842).” The ASU intends to increase transparency and comparability among organizations by recognizing lease assets and lease liabilities and disclosing key information about leasing arrangements. The ASU will require lessees to recognize the following for all leases (with the exception of short-term leases) at the commencement date: (1) a lease liability, which is a lessees’ obligation to make lease payments arising from a lease, measured on a discounted basis; and (2) a right-of-use asset, which is an asset that represents the lessee’s right to use, or control the use of, a specified asset for the lease term. Under the new guidance, lessor accounting is largely unchanged. Certain targeted improvements were made to align, where necessary, lessor accounting with the lessee accounting model and Topic 606, Revenue from Contracts with Customers. The new lease guidance simplifies the accounting for sale and leaseback transactions primarily because lessees must recognize lease assets and lease liabilities. Lessees (for capital and operating leases) and lessors (for sales-type, direct financing, and operating leases) must apply a modified retrospective transition approach for leases existing at, or entered into after, the beginninglast day of the earliest comparative period presented in the financial statements.offering period. The modified retrospective approach would not require any transition accountingESPP is treated as a compensatory plan for leases that expired before the earliest comparative period presented. The ASU is effective for public companies for fiscal years beginning after December 15, 2018, including interim periods within those fiscal years, with early adoption permitted. The Corporation intends to adopt the accounting standard during the first quarterpurposes of 2019, as required, and is currently evaluating the impact on its results of operations, financial position and liquidity.share-based compensation expense.
Recent Accounting Pronouncements. In June 2016, the FASB issued ASU No. 2016-13, “Financial Instruments- Credit Losses (Topic 326).,” which is often referred to as CECL. The ASU replaces the incurred loss impairment methodology for recognizing credit losses with a methodology that reflects all expected credit losses. The ASU also requires consideration of a broader range of information to inform credit loss estimates, including such factors as
past events, current conditions, and reasonable and supportable forecasts that affect the collectability of the reported amount. The amendments affect loans, debt securities, trade receivables, net investments in leases, off-balance-sheet credit exposures, and any other financial asset not excluded from the scope that have the contractual right to receive cash. Entities will apply the amendments in the ASU through a cumulative-effect adjustment to retained earnings as of the beginning of the first reporting period in which the guidance is effective. In November 2019, the FASB issued ASU No. 2019-10, “Financial Instruments—Credit Losses (Topic 326), Derivatives and Hedging (Topic 815), and Leases (Topic 842).” The ASU delays the effective date for the credit losses standard from January 1, 2020 to January 1, 2023 for certain entities, including certain Securities and Exchange Commission filers, public business entities, and private companies. As a smaller reporting company, the Corporation elected to defer
adoption. The Corporation has established a cross-functional committee and has implemented a third-party software solution to assist with the adoption of the standard. During the fourth quarter of 2022 and first quarter of 2023, management had the model validated by a third party, performed a full parallel run, and finalized the methodology, processes and internal controls. Management’s model utilizes national GDP and unemployment as inputs to the reasonable and supportable forecast. On January 1,2023, the Corporation adopted ASC 326 using the modified retrospective method for all financial assets measuring at amortized cost and off-balance sheet credit exposures. Results for reporting periods beginning after January 1, 2023 are presented under ASC 326 while prior period amounts continue to be reported in accordance with previously applicable U.S. GAAP. The Corporation recorded a net decrease to retained earnings of $1.4 million as of January 1, 2023 for the cumulative effect of adopting ASC 326. The transition adjustment to allowance for credit losses (“ACL”) includes $1.3 million related to off-balance sheet credit exposures and $484,000 related to loans.
In March 2020, the FASB issued ASU No. 2020-04 “Reference Rate Reform (Topic 848): Facilitation of the Effects of Reference Rate Reform on Financial Reporting.” These amendments provide temporary, optional guidance to ease the potential burden in accounting for reference rate reform. The ASU provides optional expedients and exceptions for applying generally accepted accounting principles to contract modifications and hedging relationships, subject to meeting certain criteria, that reference LIBOR or another reference rate expected to be discontinued. It is effectiveintended to help stakeholders during the global market-wide reference rate transition period. In January 2021, the FASB issued ASU 2021-01 which clarifies that certain optional expedients and exceptions in Topic 848 for contract modifications and hedge accounting apply to derivatives that are affected by the discounting transition. The Corporation adopted this standard in the fourth quarter 2022. The Corporation utilized available optional expedients to simplify accounting analyses for contract modifications and allow hedging relationships to continue without de-designation where there are qualifying changes in the critical terms. The adoption of this standard did not have a material effect on the Corporation’s operating results or financial condition.
In March 2022, the FASB issued ASU No. 2022-02 "Financial Instruments-Credit Losses (Topic 326): Troubled Debt Restructurings and Vintage Disclosures." The amendments in this update eliminate the accounting guidance for TDRs by creditors in Subtopic 310-40, Receivables-Troubled Debt Restructurings by Creditors, while enhancing disclosure requirements for certain loan refinancings and restructurings by creditors when a borrower is experiencing financial difficulty. Specifically, rather than applying the recognition and measurement guidance for TDRs, an entity must apply the loan refinancing and restructuring guidance in paragraphs 310-20-35-9 through 35-11 to determine whether a modification results in a new loan or a continuation of an existing loan. Additionally, for public companiesbusiness entities, the amendments in this update require that an entity disclose current-period gross write-offs by year of origination for financing receivables and net investments in leases within the scope of Subtopic 326-20, Financial Instruments-Credit Losses-Measured at Amortized Cost in the vintage disclosures required by paragraph 326-20-50-6. The Corporation adopted this standard in the first quarter 2023. The adoption did not have a material impact on the consolidated financial statements.
In March 2023, the FASB issued ASU No. 2023-02 “Investments-Equity Method and Joint Ventures (Topic 323): Accounting for Investments in Tax Credit Structures Using the Proportional Amortization Method (a consensus of the Emerging Issues Task Force).” The amendments in this Update permit reporting entities to elect to account for their tax equity investments, regardless of the program from which the income tax credits are received, using the proportional amortization method if certain conditions are met. A reporting entity may make an accounting policy election to apply the proportional amortization method on a tax-credit-program-by-tax-credit-program basis rather than electing to apply the proportional amortization method at the reporting entity level or to individual investments. This update is effective for fiscal years beginning after December 15, 2019, including interim periods within those fiscal years. Early adoption is permitted as of the fiscal years beginning after December 15, 2018. The Corporation intends to adopt the accounting standard during the first quarter of 2020, as required, and is2023. We are currently evaluatingassessing the impact on its results of operations, financial position and liquidity. A cross-functional team has been established to assess and implement the standard.
In May 2017,December 2023, the FASB issued ASU No. 2017-09, “Compensation- Stock Compensation2023-09, “Income Taxes (Topic 718).740): Improvements to Income Tax Disclosures.” The ASU provides clarity about whichThis update enhances the transparency and decision usefulness of income tax disclosures by providing better information regarding exposure to potential changes to the terms or conditions of a share-based payment award require an entity to apply modification accounting. The ASUin jurisdictional tax legislation and related forecasting and cash flow opportunities. This update is effective for all entities for fiscal years beginning after December 15, 2017, including interim periods within those fiscal years. Early adoption is permitted. The Corporation is in the process of evaluating2024. We are currently assessing the impact of this standard but does not expect this standard to have a material impact on its results of operations, financial position and liquidity.the standard.
In August 2017,October 2023, the FASB issued ASU No. 2017-12, “Derivatives2023-06, “Disclosure Improvements: Codification Amendments in Response to the SEC’s Disclosure Update and Hedging (Topic 815).Simplification Initiative.” The ASU intendsThis update is intended to better align an entity’s risk management activitiesimprove the relevance and usefulness of financial reportinginformation for hedging relationships through changes to bothinvestors and other users by incorporating certain SEC disclosure requirements into the designation and measurement guidance for qualifying hedging relationships and the presentation of hedge results. It also expands and refines hedge accounting for both nonfinancial and financial risk components and aligns the recognition and presentation of the effects of the hedging instrument and the hedged item. The ASUFASB Accounting Standards Codification. This update is effective for public companies forfiscal years, and interim periods within those fiscal years, beginning after December 15, 2018, including2023. We are currently assessing the impact of the standard.
In November 2023 the FASB issued ASU No. 2023-07, “Segment Reporting (Topic 820): Improvements to Reportable Segment Disclosures.” This update is intended to improve reportable segment disclosure requirements, primarily through enhanced disclosures about significant segment expenses. This update is effective for fiscal years, and interim periods within those fiscal years. Early adoption is permitted. The Corporation adoptedyears, beginning after December 15, 2024. We are currently assessing the standardimpact of the standard.
Reclassifications. Certain amounts in the fourth quarter of 2017 with no2022 consolidated financial statements have been reclassified to conform to the 2023 presentation. These reclassifications were not material and did not impact on its results of operations, financial position and liquidity.previously reported net income or comprehensive income.
Note 2 – Cash and Cash Equivalents
Cash and due from banks was approximately $17.1$32.3 million and $14.6$25.8 million at December 31, 20172023 and 2016,2022, respectively. Required reserves inAs of March 26, 2020, the form of either vault cash or deposits held at theFederal Reserve Bank (“FRB”) reduced reserve requirement ratios to zero percent for all depository institutions. FRB balances were $16.8$106.8 million and $6.4$76.5 million at December 31, 20172023 and 2016, respectively. FRB balances were $17.7 million and $40.9 million at December 31, 2017 and 2016,2022, respectively, and are included in short-term investments on the Consolidated Balance Sheets. Short-term investments, considered cash equivalents, were $35.5$107.2 million and $62.9$76.9 million at December 31, 20172023 and 2016,2022, respectively.
Note 3 – Securities
The amortized cost and fair value of securities available-for-sale and the corresponding amounts of gross unrealized gains and losses recognized in accumulated other comprehensive income were as follows: |
| | | | | | | | | | | | | | | | |
| | | As of December 31, 2017 |
| | | Amortized Cost | | Gross Unrealized Gains | | Gross Unrealized Losses | | Fair Value |
| | | (In Thousands) |
| Available-for-sale: | | | | | | | | |
| U.S. government agency obligations - government-sponsored enterprises | | $ | 999 |
| | $ | 1 |
| | $ | — |
| | $ | 1,000 |
|
| Municipal obligations | | 9,494 |
| | 2 |
| | (82 | ) | | 9,414 |
|
| Collateralized mortgage obligations - government issued | | 22,313 |
| | 149 |
| | (213 | ) | | 22,249 |
|
| Collateralized mortgage obligations - government-sponsored enterprises | | 91,480 |
| | 24 |
| | (1,199 | ) | | 90,305 |
|
| Other securities | | 3,040 |
| | 3 |
| | (6 | ) | | 3,037 |
|
| | | $ | 127,326 |
| | $ | 179 |
| | $ | (1,500 | ) | | $ | 126,005 |
|
| | | | | | | | | | | | | | | | | | | | | | | | | | |
| | | As of December 31, 2023 |
| | Amortized Cost | | Gross
Unrealized
Gains | | Gross
Unrealized
Losses | | Fair Value |
| | | (In Thousands) |
| Available-for-sale: | | | | | | | | |
| U.S. treasuries | | $ | 14,158 | | | $ | 7 | | | $ | (389) | | | $ | 13,776 | |
| U.S. government agency securities - government-sponsored enterprises | | 27,986 | | | 35 | | | (455) | | | 27,566 | |
| Municipal securities | | 40,407 | | | — | | | (4,526) | | | 35,881 | |
| | | | | | | | |
| Residential mortgage-backed securities - government issued | | 69,441 | | | 1,000 | | | (2,385) | | | 68,056 | |
| Residential mortgage-backed securities - government-sponsored enterprises | | 131,321 | | | 281 | | | (10,769) | | | 120,833 | |
| Commercial mortgage-backed securities - government issued | | 2,995 | | | — | | | (470) | | | 2,525 | |
| Commercial mortgage-backed securities - government-sponsored enterprises | | 32,774 | | | 65 | | | (4,470) | | | 28,369 | |
| | | | | | | | |
| | | $ | 319,082 | | | $ | 1,388 | | | $ | (23,464) | | | $ | 297,006 | |
| | | | | | | | | | | | | | | | | | | | | | | | | | |
| | | As of December 31, 2022 |
| | Amortized Cost | | Gross
Unrealized
Gains | | Gross
Unrealized
Losses | | Fair Value |
| | | (In Thousands) |
| Available-for-sale: | | | | | | | | |
| U.S. treasuries | | $ | 4,977 | | | $ | — | | | $ | (532) | | | $ | 4,445 | |
| U.S. government agency securities - government-sponsored enterprises | | 13,666 | | | 70 | | | (531) | | | 13,205 | |
| Municipal securities | | 45,088 | | | 90 | | | (5,867) | | | 39,311 | |
| | | | | | | | |
| Residential mortgage-backed securities - government issued | | 21,790 | | | — | | | (2,359) | | | 19,431 | |
| Residential mortgage-backed securities - government-sponsored enterprises | | 119,265 | | | — | | | (12,942) | | | 106,323 | |
| Commercial mortgage-backed securities - government issued | | 3,450 | | | — | | | (518) | | | 2,932 | |
| Commercial mortgage-backed securities - government-sponsored enterprises | | 31,515 | | | — | | | (5,138) | | | 26,377 | |
| | | | | | | | |
| | | $ | 239,751 | | | $ | 160 | | | $ | (27,887) | | | $ | 212,024 | |
|
| | | | | | | | | | | | | | | | |
| | | As of December 31, 2016 |
| | | Amortized Cost | | Gross Unrealized Gains | | Gross Unrealized Losses | | Fair Value |
| | | (In Thousands) |
| Available-for-sale: | | | | | | | | |
| U.S. government agency obligations - government-sponsored enterprises | | $ | 6,298 |
| | $ | 7 |
| | $ | (10 | ) | | $ | 6,295 |
|
| Municipal obligations | | 8,246 |
| | 2 |
| | (92 | ) | | 8,156 |
|
| Asset-backed securities | | 1,116 |
| | — |
| | (35 | ) | | 1,081 |
|
| Collateralized mortgage obligations - government issued | | 30,936 |
| | 423 |
| | (146 | ) | | 31,213 |
|
| Collateralized mortgage obligations - government-sponsored enterprises | | 99,865 |
| | 252 |
| | (969 | ) | | 99,148 |
|
| | | $ | 146,461 |
| | $ | 684 |
| | $ | (1,252 | ) | | $ | 145,893 |
|
The amortized cost and fair value of securities held-to-maturity and the corresponding amounts of gross unrealizedunrecognized gains and losses were as follows:
| | | | | | | | | | | | | | | | | | | | | | | | | | |
| | | As of December 31, 2023 |
| | Amortized Cost | | Gross
Unrecognized
Gains | | Gross
Unrecognized
Losses | | Fair Value |
| | | (In Thousands) |
| Held-to-maturity: | | | | | | | | |
| | | | | | | | |
| Municipal securities | | $ | 4,210 | | | $ | 4 | | | $ | (41) | | | $ | 4,173 | |
| | | | | | | | |
| Residential mortgage-backed securities - government issued | | 1,211 | | | — | | | (76) | | | 1,135 | |
| Residential mortgage-backed securities - government-sponsored enterprises | | 1,078 | | | — | | | (53) | | | 1,025 | |
| Commercial mortgage-backed securities - government-sponsored enterprises | | 2,004 | | | — | | | (82) | | | 1,922 | |
| | | $ | 8,503 | | | $ | 4 | | | $ | (252) | | | $ | 8,255 | |
|
| | | | | | | | | | | | | | | | |
| | | As of December 31, 2017 |
| | | Amortized Cost | | Gross Unrealized Gains | | Gross Unrealized Losses | | Fair Value |
| | | (In Thousands) |
| Held-to-maturity: | | | | | | | | |
| U.S. government agency obligations - government-sponsored enterprises | | $ | 1,499 |
| | $ | — |
| | $ | (9 | ) | | $ | 1,490 |
|
| Municipal obligations | | 21,680 |
| | 176 |
| | (34 | ) | | 21,822 |
|
| Collateralized mortgage obligations - government issued | | 9,072 |
| | 1 |
| | (130 | ) | | 8,943 |
|
| Collateralized mortgage obligations - government-sponsored enterprises | | 5,527 |
| | — |
| | (86 | ) | | 5,441 |
|
| | | $ | 37,778 |
| | $ | 177 |
| | $ | (259 | ) | | $ | 37,696 |
|
| | | | | | | | | | | | | | | | | | | | | | | | | | |
| | | As of December 31, 2022 |
| | Amortized Cost | | Gross
Unrecognized
Gains | | Gross
Unrecognized
Losses | | Fair Value |
| | | (In Thousands) |
| Held-to-maturity: | | | | | | | | |
| | | | | | | | |
| Municipal securities | | $ | 7,467 | | | $ | 7 | | | $ | (70) | | | $ | 7,404 | |
| | | | | | | | |
| Residential mortgage-backed securities - government issued | | 1,625 | | | — | | | (107) | | | 1,518 | |
| Residential mortgage-backed securities - government-sponsored enterprises | | 1,537 | | | — | | | (93) | | | 1,444 | |
| Commercial mortgage-backed securities - government-sponsored enterprises | | 2,006 | | | — | | | (102) | | | 1,904 | |
| | | $ | 12,635 | | | $ | 7 | | | $ | (372) | | | $ | 12,270 | |
|
| | | | | | | | | | | | | | | | |
| | | As of December 31, 2016 |
| | | Amortized Cost | | Gross Unrealized Gains | | Gross Unrealized Losses | | Fair Value |
| | | (In Thousands) |
| Held-to-maturity: | | | | | | | | |
| U.S. government agency obligations - government-sponsored enterprises | | $ | 1,497 |
| | $ | 2 |
| | $ | (5 | ) | | $ | 1,494 |
|
| Municipal obligations | | 21,173 |
| | 62 |
| | (78 | ) | | 21,157 |
|
| Collateralized mortgage obligations - government issued | | 9,148 |
| | 17 |
| | (38 | ) | | 9,127 |
|
| Collateralized mortgage obligations - government-sponsored enterprises | | 6,794 |
| | 6 |
| | (58 | ) | | 6,742 |
|
| | | $ | 38,612 |
| | $ | 87 |
| | $ | (179 | ) | | $ | 38,520 |
|
U.S. Treasuries contain treasury bonds issued by the United States Treasury. U.S. government agency obligationssecurities - government-sponsored enterprises represent securities issued by the Federal Home Loan Bank (“FHLB”), the Federal Home Loan Mortgage Corporation (“FHLMC”) and Federal National Mortgage Association (“FNMA”). and the SBA. Municipal obligationssecurities include securities issued by various municipalities located primarily within the State of Wisconsin and are primarily general obligation bonds that are tax-exempt in nature. Asset-backedResidential and commercial mortgage-backed securities represent securities issued by the Student Loan Marketing Association (“SLMA”) which are 97% guaranteed by the U.S. government. Collateralized mortgage obligations - government issued represent securities guaranteed by the Government National Mortgage Association. Collateralized mortgage obligationsResidential and commercial mortgage-backed securities - government-sponsored enterprises include securities guaranteed by the
FHLMC Federal Home Loan Mortgage Corporation, FNMA, and the FNMA. OtherFHLB. There were 16 and seven sales of available-for-sale securities represent certificatesthat occurred during the years ended December 31, 2023 and 2021, respectively. There were no sales of deposit of insured banks and savings institutions with an original maturity greater than three months.available-for-sale securities that occurred during the year ended December 31, 2022.
Total proceeds and gross realized gains and losses from sales of securities available-for-sale were as follows:
| | | | | | | | | | | | | | | | | | | | |
| | | For the Year Ended December 31, |
| | | 2023 | | 2022 | | 2021 |
| | | (In Thousands) |
| Gross gains | | $ | 68 | | | $ | — | | | $ | 92 | |
| Gross losses | | (113) | | | — | | | (63) | |
| Net (losses) gains on sale of available-for-sale securities | | $ | (45) | | | $ | — | | | $ | 29 | |
| Proceeds from sale of available-for-sale securities | | $ | 5,085 | | | $ | — | | | $ | 14,955 | |
|
| | | | | | | | | | | | |
| | | For the Year Ended December 31, |
| | | 2017 | | 2016 | | 2015 |
| | | (In Thousands) |
| Gross gains | | $ | 92 |
| | $ | 10 |
| | $ | — |
|
| Gross losses | | (495 | ) | | — |
| | — |
|
| Net (losses) gains on sale of available-for-sale securities | | $ | (403 | ) | | $ | 10 |
| | $ | — |
|
| Proceeds from sale of available-for-sale securities | | $ | 40,144 |
| | $ | 5,227 |
| | $ | — |
|
At December 31, 20172023 and 2016,2022, securities with a fair value of $2.8$45.4 million and $22.4$35.9 million,, respectively, were pledged to secure various obligations, including interest rate swap contracts outstanding FHLB advances and additional FHLB availability.municipal deposits.
The amortized cost and fair value of securities by contractual maturity at December 31, 20172023 are shown below. Actual maturities may differ from contractual maturities because issuers have the right to call or prepay certain obligations with or without call or prepayment penalties.
| | | | | | | | | | | | | | | | | | | | | | | | | | |
| | Available-for-Sale | | Held-to-Maturity |
| | Amortized Cost | | Fair Value | | Amortized Cost | | Fair Value |
| | | (In Thousands) |
| Due in one year or less | | $ | 22,576 | | | $ | 22,569 | | | $ | 1,060 | | | $ | 1,057 | |
| Due in one year through five years | | 18,970 | | | 17,646 | | | 3,150 | | | 3,116 | |
| Due in five through ten years | | 12,653 | | | 11,915 | | | — | | | — | |
| Due in over ten years | | 28,352 | | | 25,093 | | | — | | | — | |
| | | 82,551 | | | 77,223 | | | 4,210 | | | 4,173 | |
| Residential mortgage-backed securities | | 200,762 | | | 188,889 | | | 2,289 | | | 2,160 | |
| Commercial mortgage-backed securities | | 35,769 | | | 30,894 | | | 2,004 | | | 1,922 | |
| | $ | 319,082 | | | $ | 297,006 | | | $ | 8,503 | | | $ | 8,255 | |
|
| | | | | | | | | | | | | | | | |
| | | Available-for-Sale | | Held-to-Maturity |
| | | Amortized Cost | | Fair Value | | Amortized Cost | | Fair Value |
| | | (In Thousands) |
| Due in one year or less | | $ | 5,090 |
| | $ | 5,080 |
| | $ | 1,499 |
| | $ | 1,490 |
|
| Due in one year through five years | | 13,506 |
| | 13,416 |
| | 10,673 |
| | 10,704 |
|
| Due in five through ten years | | 35,941 |
| | 35,642 |
| | 15,713 |
| | 15,734 |
|
| Due in over ten years | | 72,789 |
| | 71,867 |
| | 9,893 |
| | 9,768 |
|
| | | $ | 127,326 |
| | $ | 126,005 |
| | $ | 37,778 |
| | $ | 37,696 |
|
The tables below show the Corporation’s gross unrealized losses and fair value of available-for-sale investments, aggregated by investment category and length of time that individual investments were in a continuous loss position at December 31, 20172023 and 2016. At December 31, 2017, the Corporation held 141 available-for-sale securities that were in an unrealized loss position. Such securities have not experienced credit rating downgrades; however, they have primarily declined in value due to the current interest rate environment. At December 31, 2017, the Corporation held 50 available-for-sale securities that had been in a continuous unrealized loss position for twelve months or greater.2022.
The Corporation also has not specifically identified available-for-sale securities in a loss position that it intends to sell in the near term and does not believe that it will be required to sell any such securities. The Corporation reviews its securities on a quarterly basis to monitor its exposure to other-than-temporary impairment.assess declines in fair value for credit losses. Consideration is given to such factors as the lengthcredit rating of time and extentthe borrower, market conditions such as current interest rates, any adverse conditions specific to which the security has been in an unrealized loss position, changes in security ratings and an evaluation of the present value of expected future cash flows, if necessary. Baseddelinquency status on the Corporation’s evaluation, it is expected that the Corporation will recover the entire amortized cost basis of each security. Accordingly, no other-than-temporary impairment was recorded in the Consolidated Statements of Income forcontractual payments. For the years ended December 31, 20172023 and 2016.2022, management concluded that in all instances securities with fair value less than carrying value was due to market and other factors; thus no credit loss provision was required.
A summary of unrealized loss information for securities available-for-sale, categorized by security type and length of time for which the security has been in a continuous unrealized loss position, follows:
| | | | | | | | | | | | | | | | | | | | | | | | | | | | | | | | | | | | | | |
| | | December 31, 2023 |
| | | Less than 12 Months | | 12 Months or Longer | | Total |
| | Fair Value | | Unrealized
Losses | | Fair Value | | Unrealized
Losses | | Fair Value | | Unrealized
Losses |
| | | (In Thousands) |
| Available-for-sale: | | | | | | | | | | | | |
| U.S. treasuries | | $ | — | | | $ | — | | | $ | 4,595 | | | $ | 389 | | | $ | 4,595 | | | $ | 389 | |
| U.S. government agency securities - government-sponsored enterprises | | 13,370 | | | 30 | | | 3,076 | | | 425 | | | 16,446 | | | 455 | |
| Municipal securities | | — | | | — | | | 35,881 | | | 4,526 | | | 35,881 | | | 4,526 | |
| | | | | | | | | | | | |
| Residential mortgage-backed securities - government issued | | 13,178 | | | 160 | | | 13,819 | | | 2,225 | | | 26,997 | | | 2,385 | |
| Residential mortgage-backed securities - government-sponsored enterprises | | 19,925 | | | 285 | | | 78,086 | | | 10,484 | | | 98,011 | | | 10,769 | |
| Commercial mortgage-backed securities - government issued | | — | | | — | | | 2,525 | | | 470 | | | 2,525 | | | 470 | |
| Commercial mortgage-backed securities - government-sponsored enterprises | | 893 | | | 20 | | | 26,465 | | | 4,450 | | | 27,358 | | | 4,470 | |
| | | | | | | | | | | | |
| | | $ | 47,366 | | | $ | 495 | | | $ | 164,447 | | | $ | 22,969 | | | $ | 211,813 | | | $ | 23,464 | |
|
| | | | | | | | | | | | | | | | | | | | | | | | |
| | | December 31, 2017 |
| | | Less than 12 Months | | 12 Months or Longer | | Total |
| | | Fair Value | | Unrealized
Losses | | Fair Value | | Unrealized
Losses | | Fair Value | | Unrealized
Losses |
| | | (In Thousands) |
| Available-for-sale: | | | | | | | | | | | | |
| Municipal obligations | | $ | 6,132 |
| | $ | 43 |
| | $ | 2,755 |
| | $ | 39 |
| | $ | 8,887 |
| | $ | 82 |
|
| Collateralized mortgage obligations - government issued | | 7,104 |
| | 40 |
| | 6,715 |
| | 173 |
| | 13,819 |
| | 213 |
|
| Collateralized mortgage obligations - government-sponsored enterprises | | 59,256 |
| | 476 |
| | 28,004 |
| | 723 |
| | 87,260 |
| | 1,199 |
|
| Other securities | | 1,954 |
| | 6 |
| | — |
| | — |
| | 1,954 |
| | 6 |
|
| | | $ | 74,446 |
| | $ | 565 |
| | $ | 37,474 |
| | $ | 935 |
| | $ | 111,920 |
| | $ | 1,500 |
|
| | | | | | | | | | | | | | | | | | | | | | | | | | | | | | | | | | | | | | |
| | | December 31, 2022 |
| | | Less than 12 Months | | 12 Months or Longer | | Total |
| | Fair Value | | Unrealized
Losses | | Fair Value | | Unrealized
Losses | | Fair Value | | Unrealized
Losses |
| | | (In Thousands) |
| Available-for-sale: | | | | | | | | | | | | |
| U.S. treasuries | | $ | — | | | $ | — | | | $ | 4,446 | | | $ | 532 | | | $ | 4,446 | | | $ | 532 | |
| U.S. government agency obligations - government-sponsored enterprises | | — | | | — | | | 2,969 | | | 531 | | | 2,969 | | | 531 | |
| Municipal securities | | 26,759 | | | 3,132 | | | 10,133 | | | 2,735 | | | 36,892 | | | 5,867 | |
| | | | | | | | | | | | |
| Residential mortgage-backed securities - government issued | | 9,624 | | | 436 | | | 9,807 | | | 1,923 | | | 19,431 | | | 2,359 | |
| Residential mortgage-backed securities - government-sponsored enterprises | | 71,474 | | | 6,433 | | | 34,849 | | | 6,509 | | | 106,323 | | | 12,942 | |
| Commercial mortgage-backed securities - government issued | | 1,236 | | | 112 | | | 1,696 | | | 406 | | | 2,932 | | | 518 | |
| Commercial mortgage-backed securities - government-sponsored enterprises | | 7,758 | | | 984 | | | 18,619 | | | 4,154 | | | 26,377 | | | 5,138 | |
| | | | | | | | | | | | |
| | | $ | 116,851 | | | $ | 11,097 | | | $ | 82,519 | | | $ | 16,790 | | | $ | 199,370 | | | $ | 27,887 | |
|
| | | | | | | | | | | | | | | | | | | | | | | | |
| | | December 31, 2016 |
| | | Less than 12 Months | | 12 Months or Longer | | Total |
| | | Fair Value | | Unrealized
Losses | | Fair Value | | Unrealized
Losses | | Fair Value | | Unrealized
Losses |
| | | (In Thousands) |
| Available-for-sale: | | | | | | | | | | | | |
| U.S. government agency obligations - government-sponsored enterprises | | $ | 1,991 |
| | $ | 10 |
| | $ | — |
| | $ | — |
| | $ | 1,991 |
| | $ | 10 |
|
| Municipal obligations | | 7,207 |
| | 89 |
| | 406 |
| | 3 |
| | 7,613 |
| | 92 |
|
| Asset-backed securities | | — |
| | — |
| | 1,081 |
| | 35 |
| | 1,081 |
| | 35 |
|
| Collateralized mortgage obligations - government issued | | 10,552 |
| | 130 |
| | 493 |
| | 16 |
| | 11,045 |
| | 146 |
|
| Collateralized mortgage obligations - government-sponsored enterprises | | 54,843 |
| | 931 |
| | 1,819 |
| | 38 |
| | 56,662 |
| | 969 |
|
| | | $ | 74,593 |
| | $ | 1,160 |
| | $ | 3,799 |
| | $ | 92 |
| | $ | 78,392 |
| | $ | 1,252 |
|
The tables below show the Corporation’s gross unrealized losses and fair value of held-to-maturity investments, aggregated by investment category and length of time that individual investments were in a continuous loss position at December 31, 20172023 and 2016.2022. At December 31, 2017,2023, the Corporation held 3629 held-to-maturity securities that were in an unrealized loss position. Such securitiesposition, 24 of which have not experienced credit rating downgrades; however, they have primarily declined in value due to the current interest rate environment. There were 16 held-to-maturity securities that had been in a continuous loss position for twelve months or greater asgreater. Management assesses held-to-maturity securities for credit losses on a quarterly basis. The assessment includes review of December 31, 2017. It is expected that the Corporation will recover the entire amortized cost basiscredit ratings, identification of each held-to-maturity security based upon andelinquency and evaluation of aforementionedmarket factors. Based on this analysis, management concludes the decline in fair value is due to market factors, specifically changes in interest rates. Accordingly, no other-than-temporary impairmentcredit loss provision was recorded in the Consolidated Statements of Income for the years ended December 31, 20172023, 2022, and 2016.
2021.
A summary of unrealizedunrecognized loss information for securities held-to-maturity, categorized by security type and length of time for which the security has been in a continuous unrealized loss position, follows:
|
| | | | | | | | | | | | | | | | | | | | | | | | |
| | | December 31, 2017 |
| | | Less than 12 Months | | 12 Months or Longer | | Total |
| | | Fair Value | | Unrealized
Losses | | Fair Value | | Unrealized
Losses | | Fair Value | | Unrealized
Losses |
| | | (In Thousands) |
| Held-to-maturity: | | | | | | | | | | | | |
| U.S. government agency obligations - government-sponsored enterprises | | $ | — |
| | $ | — |
| | $ | 1,499 |
| | $ | 9 |
| | $ | 1,499 |
| | $ | 9 |
|
| Municipal obligations | | 3,723 |
| | 27 |
| | 259 |
| | 7 |
| | 3,982 |
| | 34 |
|
| Collateralized mortgage obligations - government issued | | 3,868 |
| | 51 |
| | 4,677 |
| | 79 |
| | 8,545 |
| | 130 |
|
| Collateralized mortgage obligations - government-sponsored enterprises | | — |
| | — |
| | 5,527 |
| | 86 |
| | 5,527 |
| | 86 |
|
| | | $ | 7,591 |
| | $ | 78 |
| | $ | 11,962 |
| | $ | 181 |
| | $ | 19,553 |
| | $ | 259 |
|
| | | | | | | | | | | | | | | | | | | | | | | | | | | | | | | | | | | | | | |
| | | December 31, 2023 |
| | | Less than 12 Months | | 12 Months or Longer | | Total |
| | Fair Value | | Unrealized
Losses | | Fair Value | | Unrealized
Losses | | Fair Value | | Unrealized
Losses |
| | | (In Thousands) |
| Held-to-maturity: | | | | | | | | | | | | |
| | | | | | | | | | | | |
| Municipal securities | | $ | 1,424 | | | $ | 4 | | | $ | 2,234 | | | $ | 37 | | | $ | 3,658 | | | $ | 41 | |
| | | | | | | | | | | | |
| Residential mortgage-backed securities - government issued | | — | | | — | | | 1,135 | | | 76 | | | 1,135 | | | 76 | |
| Residential mortgage-backed securities - government-sponsored enterprises | | — | | | — | | | 1,025 | | | 53 | | | 1,025 | | | 53 | |
| Commercial mortgage backed securities - government-sponsored enterprises | | — | | | — | | | 1,922 | | | 82 | | | 1,922 | | | 82 | |
| | | $ | 1,424 | | | $ | 4 | | | $ | 6,316 | | | $ | 248 | | | $ | 7,740 | | | $ | 252 | |
|
| | | | | | | | | | | | | | | | | | | | | | | | |
| | | December 31, 2016 |
| | | Less than 12 Months | | 12 Months or Longer | | Total |
| | | Fair Value | | Unrealized
Losses | | Fair Value | | Unrealized
Losses | | Fair Value | | Unrealized
Losses |
| | | (In Thousands) |
| Held-to-maturity: | | | | | | | | | | | | |
| U.S. government agency obligations - government-sponsored enterprises | | $ | 1,000 |
| | $ | 5 |
| | $ | — |
| | $ | — |
| | $ | 1,000 |
| | $ | 5 |
|
| Municipal obligations | | 9,472 |
| | 78 |
| | — |
| | — |
| | 9,472 |
| | 78 |
|
| Collateralized mortgage obligations - government issued | | 6,980 |
| | 38 |
| | — |
| | — |
| | 6,980 |
| | 38 |
|
| Collateralized mortgage obligations - government-sponsored enterprises | | 4,682 |
| | 58 |
| | — |
| | — |
| | 4,682 |
| | 58 |
|
| | | $ | 22,134 |
| | $ | 179 |
| | $ | — |
| | $ | — |
| | $ | 22,134 |
| | $ | 179 |
|
| | | | | | | | | | | | | | | | | | | | | | | | | | | | | | | | | | | | | | |
| | | December 31, 2022 |
| | | Less than 12 Months | | 12 Months or Longer | | Total |
| | Fair Value | | Unrealized
Losses | | Fair Value | | Unrealized
Losses | | Fair Value | | Unrealized
Losses |
| | | (In Thousands) |
| Held-to-maturity: | | | | | | | | | | | | |
| | | | | | | | | | | | |
| Municipal securities | | $ | 6,035 | | | $ | 52 | | | $ | 267 | | | $ | 18 | | | $ | 6,302 | | | $ | 70 | |
| | | | | | | | | | | | |
| Residential mortgage-backed securities - government issued | | 1,518 | | | 107 | | | — | | | — | | | 1,518 | | | 107 | |
| Residential mortgage-backed securities - government-sponsored enterprises | | 1,444 | | | 93 | | | — | | | — | | | 1,444 | | | 93 | |
| Commercial mortgage-backed securities - government-sponsored enterprises | | 1,904 | | | 102 | | | — | | | — | | | 1,904 | | | 102 | |
| | | $ | 10,901 | | | $ | 354 | | | $ | 267 | | | $ | 18 | | | $ | 11,168 | | | $ | 372 | |
On January 1, 2023, the Corporation adopted ASU 2016-13, which replaced the legacy GAAP other-than-temporary impairment (“OTTI”) model with a credit loss model. ASU 2016-13 requires an allowance on lifetime expected credit losses on held to maturity debt securities. As of January 1, 2023 and December 31, 2023, the Corporation estimated the expected credit losses to be immaterial based on the composition of the securities portfolio.
Note 4 – Loan and Lease Receivables, Impaired Loans, and Leases Receivable, and Allowance for Loan and LeaseCredit Losses
Loan and lease receivablesleases receivable consist of the following:
|
| | | | | | | | |
| | | December 31,
2017 | | December 31,
2016 |
| | | (In Thousands) |
| Commercial real estate: | | | | |
| Commercial real estate — owner occupied | | $ | 200,387 |
| | $ | 176,459 |
|
| Commercial real estate — non-owner occupied | | 470,236 |
| | 473,158 |
|
| Land development | | 40,154 |
| | 56,638 |
|
| Construction | | 125,157 |
| | 101,206 |
|
| Multi-family | | 136,978 |
| | 92,762 |
|
| 1-4 family | | 44,976 |
| | 45,651 |
|
| Total commercial real estate | | 1,017,888 |
| | 945,874 |
|
| Commercial and industrial | | 429,002 |
| | 450,298 |
|
| Direct financing leases, net | | 30,787 |
| | 30,951 |
|
| Consumer and other: | | | | |
| Home equity and second mortgages | | 7,262 |
| | 8,412 |
|
| Other | | 18,099 |
| | 16,329 |
|
| Total consumer and other | | 25,361 |
| | 24,741 |
|
| Total gross loans and leases receivable | | 1,503,038 |
| | 1,451,864 |
|
| Less: | | | | |
| Allowance for loan and lease losses | | 18,763 |
| | 20,912 |
|
| Deferred loan fees | | 1,443 |
| | 1,189 |
|
| Loans and leases receivable, net | | $ | 1,482,832 |
| | $ | 1,429,763 |
|
As of December 31, 2017 and 2016, the total amount of the Corporation’s ownership of SBA loans on the Consolidated Balance Sheets comprised of the following:
|
| | | | | | | | |
| | | December 31,
2017 | | December 31,
2016 |
| | | (In Thousands) |
| Retained, unguaranteed portions of sold SBA loans | | $ | 30,071 |
| | $ | 30,418 |
|
Other SBA loans(1) | | 22,254 |
| | 30,617 |
|
| Total SBA loans | | $ | 52,325 |
| | $ | 61,035 |
|
| |
(1) | Primarily consisted of SBA Express loans and impaired SBA loans that were repurchased from the secondary market, all of which were not saleable as of December 31, 2017 and December 31, 2016, respectively. |
As of December 31, 2017 and 2016, $11.1 million and $5.5 million of SBA loans were considered impaired, respectively. | | | | | | | | | | | | | | |
| | December 31,
2023 | | December 31,
2022 |
| | | (In Thousands) |
| Commercial real estate: | | | | |
| Commercial real estate — owner occupied | | $ | 256,479 | | | $ | 268,354 | |
| Commercial real estate — non-owner occupied | | 773,494 | | | 687,091 | |
| Construction | | 193,080 | | | 218,751 | |
| Multi-family | | 450,529 | | | 350,026 | |
| 1-4 family | | 26,289 | | | 17,728 | |
| Total commercial real estate | | 1,699,871 | | | 1,541,950 | |
| Commercial and industrial | | 1,105,835 | | | 853,327 | |
| Consumer and other | | 44,312 | | | 47,938 | |
| Total gross loans and leases receivable | | 2,850,018 | | | 2,443,215 | |
| Less: | | | | |
| Allowance for loan losses | | 31,275 | | | 24,230 | |
| Deferred loan fees and costs, net | | (243) | | | 149 | |
| Loans and leases receivable, net | | $ | 2,818,986 | | | $ | 2,418,836 | |
Loans transferred to third parties consist of the guaranteed portions of SBA loans which the Corporation sold in the secondary market and participation interests in other, non-SBA originated loans and residential real estate loans. The total principal amount of the guaranteed portions of SBA loans sold during the year ended December 31, 20172023 and 20162022 was $16.5$23.6 million and $41.2$29.9 million, respectively. Each of the transfers of these financial assets met the qualifications for sale accounting, and therefore, all of the loans transferred during the year ended December 31, 20172023 and 20162022 have been derecognized in the Consolidated Financial Statements. The guaranteed portions of SBA loans were transferred at their fair value and the related gain was recognized upon the transfer as non-interest income in the Consolidated Financial Statements. The total outstanding balance of sold SBA loans at December 31, 20172023 and 20162022 was $100.3$84.2 million and $105.1$88.5 million, respectively.
The total principal amount of transferred participation interests in other, non-SBA originated commercial loans during the year ended December 31, 20172023 and 20162022 was $63.6$120.0 million and $17.6$96.0 million, respectively, all of which were treated as sales and
derecognized under the applicable accounting guidance at the time of transfer. No gain or loss was recognized on participation interests in other, non-SBA originated loans as they were transferred at or near the date of loan origination and the payments received for servicing the portion of the loans participated represents adequate compensation. The total outstanding balance of these transferred loans at December 31, 20172023 and 20162022 was $106.4$279.5 million and $102.7$222.9 million, respectively. As of December 31, 20172023 and 2016,2022, the total amount of the Corporation’s partial ownership of these transferred loans on the Consolidated Balance Sheets was $181.7$367.4 million and $106.1$339.0 million, respectively. No loans in this participation portfolio were considered impaired asAs of December 31, 20172023 and 2016.2022, the non-SBA originated participation portfolio contained no non-performing loans. The Corporation does not share in the participant’s portion of any potential charge-offs. The total amount of loan participationsThere were no loans purchased on the Consolidated Balance Sheets as of December 31, 20172023 and 2016 was $650,000 and $1.2 million, respectively.2022.
The Corporation also previously sold residential real estatefollowing table presents loans servicing released, in the secondary market. The total principal amount of residential real estate loansand loan participations sold during the year ended December 31, 2017 and 2016 was $1.6 million and $26.3 million, respectively. Each of the transfers of these financial assets met the qualifications for sale accounting, and therefore all of the loans transferred have been derecognized in the Consolidated Financial Statements. The loans were transferred at their fair value and the related gain was recognized as non-interest income upon the transfer in the Consolidated Financial Statements.by portfolio segment:
| | | | | | | | | | | | | | | | | | | | | | | | | | | | | | | | | | | | | | | | | | | | | | | | | | |
| December 31, 2023 | | Owner Occupied | | Non-Owner Occupied | | Construction | | Multi-Family | | 1-4 Family | | Commercial and Industrial | | Consumer and Other | | Total |
| | (In Thousands) |
| Sales | | $ | 17,390 | | | $ | — | | | $ | 75,532 | | | $ | 11,382 | | | $ | — | | | $ | 39,290 | | | $ | — | | | $ | 143,594 | |
| | | | | | | | | | | | | | | | | | | | | | | | | | | | | | | | | | | | | | | | | | | | | | | | | | |
| December 31, 2022 | | Owner Occupied | | Non-Owner Occupied | | Construction | | Multi-Family | | 1-4 Family | | Commercial and Industrial | | Consumer and Other | | Total |
| | (In Thousands) |
| Sales | | $ | — | | | $ | 5,000 | | | $ | 58,586 | | | $ | 3,184 | | | $ | — | | | $ | 59,085 | | | $ | — | | | $ | 125,855 | |
Certain of the Corporation’s executive officers, directors, and their related interests are loan clients of the Bank. As of December 31, 2017 and 2016, loans aggregating approximately $10.5 million and $6.3 million, respectively, were outstanding to such parties. New loans granted to such parties during the years ended December 31, 2017 and 2016 were approximately $8.3 million and $673,000 and repayments on such loans were approximately $4.1 million and $1.3 million, respectively. These loans were madeto related parties are summarized below:
| | | | | | | | | | | | | | |
| | December 31, 2023 | | December 31, 2022 |
| | (In Thousands) |
| Balance at beginning of year | | $ | 224 | | | $ | 1,288 | |
| New loans | | 349 | | | 656 | |
| Repayments | | (310) | | | (1,560) | |
| Change due to status of executive officers and directors | | — | | | (160) | |
| Balance at end of year | | $ | 263 | | | $ | 224 | |
The Corporation’s net investment in direct financing leases consists of the ordinary coursefollowing:
| | | | | | | | | | | | | | |
| | | December 31,
2023 | | December 31,
2022 |
| | | (In Thousands) |
| Minimum lease payments receivable | | $ | 9,660 | | | $ | 10,673 | |
| Estimated unguaranteed residual values in leased property | | 1,468 | | | 2,776 | |
| Unearned lease and residual income | | (1,362) | | | (1,300) | |
| Investment in commercial direct financing leases | | $ | 9,766 | | | $ | 12,149 | |
The Corporation leases equipment under direct financing leases expiring in future years. Some of businessthese leases provide for additional rents and on substantiallygenerally allow the same terms as those prevailinglessees to purchase the equipment for fair value at the time for comparable loans not relatedend of the lease term.
Future aggregate maturities of minimum lease payments to the lender. None of these loans were considered impairedbe received are as of December 31, 2017 or 2016.follows:
| | | | | | | | |
| (In Thousands) | | |
| Maturities during year ended December 31, | | |
| 2024 | | $ | 3,268 | |
| 2025 | | 2,425 | |
| 2026 | | 1,788 | |
| 2027 | | 1,301 | |
| 2028 | | 626 | |
| Thereafter | | 252 | |
| | $ | 9,660 | |
The following tables illustrate ending balances of the Corporation’s loan and lease portfolio, including impairednon-performing loans by class of receivable, and considering certain credit quality indicators as of December 31, 2017 and 2016:indicators:
| | | | | | | | | | | | | | | | | | | | | | | | | | | | | | | | | | | | | | | | | | | | | | | | | | |
| December 31, 2023 | | Term Loans Amortized Cost Basis by Origination Year | | | | |
| (In Thousands) | | 2023 | | 2022 | | 2021 | | 2020 | | 2019 | | Prior | | Revolving Loans Amortized Cost Basis | | Total |
| Commercial real estate — owner occupied | | | | | | | | | | | | |
| Category | | | | | | | | | | | | | | | | |
| I | | $ | 31,637 | | | $ | 43,156 | | | $ | 38,803 | | | $ | 44,704 | | | $ | 22,078 | | | $ | 72,774 | | | $ | 451 | | | $ | 253,603 | |
| II | | — | | | — | | | — | | | 260 | | | — | | | — | | | — | | | 260 | |
| III | | — | | | — | | | — | | | — | | | — | | | 2,616 | | | — | | | 2,616 | |
| IV | | — | | | — | | | — | | | — | | | — | | | — | | | — | | | — | |
| Total | | $ | 31,637 | | | $ | 43,156 | | | $ | 38,803 | | | $ | 44,964 | | | $ | 22,078 | | | $ | 75,390 | | | $ | 451 | | | $ | 256,479 | |
| | | | | | | | | | | | | | | | |
| Commercial real estate — non-owner occupied | | | | | | | | | | | | |
| Category | | | | | | | | | | | | | | | | |
| I | | $ | 71,857 | | | $ | 76,689 | | | $ | 72,660 | | | $ | 78,212 | | | $ | 66,262 | | | $ | 314,970 | | | $ | 32,478 | | | $ | 713,128 | |
| II | | — | | | — | | | 2,302 | | | 2,252 | | | 19,838 | | | 16,274 | | | — | | | 40,666 | |
| III | | — | | | — | | | — | | | — | | | — | | | 19,700 | | | — | | | 19,700 | |
| IV | | — | | | — | | | — | | | — | | | — | | | — | | | — | | | — | |
| Total | | $ | 71,857 | | | $ | 76,689 | | | $ | 74,962 | | | $ | 80,464 | | | $ | 86,100 | | | $ | 350,944 | | | $ | 32,478 | | | $ | 773,494 | |
| | | | | | | | | | | | | | | | |
| Construction | | | | | | | | | | | | | | | | |
| Category | | | | | | | | | | | | | | | | |
| I | | $ | 63,660 | | | $ | 83,161 | | | $ | 8,542 | | | $ | 744 | | | $ | 433 | | | $ | 6,528 | | | $ | 15,011 | | | $ | 178,079 | |
| II | | — | | | — | | | 9,289 | | | 5,712 | | | — | | | — | | | — | | | 15,001 | |
| III | | — | | | — | | | — | | | — | | | — | | | — | | | — | | | — | |
| IV | | — | | | — | | | — | | | — | | | — | | | — | | | — | | | — | |
| Total | | $ | 63,660 | | | $ | 83,161 | | | $ | 17,831 | | | $ | 6,456 | | | $ | 433 | | | $ | 6,528 | | | $ | 15,011 | | | $ | 193,080 | |
| | | | | | | | | | | | | | | | |
|
| | | | | | | | | | | | | | | | | | | | |
| | | December 31, 2017 |
| | | Category | | |
| | | I | | II | | III | | IV | | Total |
| | | (Dollars in Thousands) |
| Commercial real estate: | | | | | | | | | | |
| Commercial real estate — owner occupied | | $ | 166,018 |
| | $ | 18,442 |
| | $ | 8,850 |
| | $ | 7,077 |
| | $ | 200,387 |
|
| Commercial real estate — non-owner occupied | | 441,246 |
| | 27,854 |
| | 1,102 |
| | 34 |
| | 470,236 |
|
| Land development | | 36,470 |
| | 1,057 |
| | — |
| | 2,627 |
| | 40,154 |
|
| Construction | | 121,528 |
| | 757 |
| | — |
| | 2,872 |
| | 125,157 |
|
| Multi-family | | 136,978 |
| | — |
| | — |
| | — |
| | 136,978 |
|
| 1-4 family | | 34,598 |
| | 7,735 |
| | 1,220 |
| | 1,423 |
| | 44,976 |
|
| Total commercial real estate | | 936,838 |
| | 55,845 |
| | 11,172 |
| | 14,033 |
| | 1,017,888 |
|
| Commercial and industrial | | 341,875 |
| | 25,344 |
| | 49,453 |
| | 12,330 |
| | 429,002 |
|
| Direct financing leases, net | | 28,866 |
| | 342 |
| | 1,579 |
| | — |
| | 30,787 |
|
| Consumer and other: | | | | | | | | | | |
| Home equity and second mortgages | | 7,250 |
| | 8 |
| | — |
| | 4 |
| | 7,262 |
|
| Other | | 17,745 |
| | — |
| | — |
| | 354 |
| | 18,099 |
|
| Total consumer and other | | 24,995 |
| | 8 |
| | — |
| | 358 |
| | 25,361 |
|
| Total gross loans and leases receivable | | $ | 1,332,574 |
| | $ | 81,539 |
| | $ | 62,204 |
| | $ | 26,721 |
| | $ | 1,503,038 |
|
| Category as a % of total portfolio | | 88.66 | % | | 5.42 | % | | 4.14 | % | | 1.78 | % | | 100.00 | % |
| | | | | | | | | | | | | | | | | | | | | | | | | | | | | | | | | | | | | | | | | | | | | | | | | | |
| December 31, 2023 | | Term Loans Amortized Cost Basis by Origination Year | | | | |
| (In Thousands) | | 2023 | | 2022 | | 2021 | | 2020 | | 2019 | | Prior | | Revolving Loans Amortized Cost Basis | | Total |
| Multi-family | | | | | | | | | | | | | | | | |
| Category | | | | | | | | | | | | | | | | |
| I | | $ | 84,932 | | | $ | 41,068 | | | $ | 70,054 | | | $ | 113,294 | | | $ | 22,925 | | | $ | 115,243 | | | $ | 3,013 | | | $ | 450,529 | |
| II | | — | | | — | | | — | | | — | | | — | | | — | | | — | | | — | |
| III | | — | | | — | | | — | | | — | | | — | | | — | | | — | | | — | |
| IV | | — | | | — | | | — | | | — | | | — | | | — | | | — | | | — | |
| Total | | $ | 84,932 | | | $ | 41,068 | | | $ | 70,054 | | | $ | 113,294 | | | $ | 22,925 | | | $ | 115,243 | | | $ | 3,013 | | | $ | 450,529 | |
| | | | | | | | | | | | | | | | |
| 1-4 family | | | | | | | | | | | | | | | | |
| Category | | | | | | | | | | | | | | | | |
| I | | $ | 4,242 | | | $ | 7,684 | | | $ | 2,672 | | | $ | 2,359 | | | $ | 443 | | | $ | 2,805 | | | $ | 6,062 | | | $ | 26,267 | |
| II | | — | | | — | | | — | | | — | | | — | | | — | | | — | | | — | |
| III | | — | | | — | | | — | | | — | | | — | | | — | | | — | | | — | |
| IV | | — | | | — | | | — | | | — | | | — | | | 22 | | | — | | | 22 | |
| Total | | $ | 4,242 | | | $ | 7,684 | | | $ | 2,672 | | | $ | 2,359 | | | $ | 443 | | | $ | 2,827 | | | $ | 6,062 | | | $ | 26,289 | |
| | | | | | | | | | | | | | | | |
| Commercial and industrial | | | | | | | | | | | | | | |
| Category | | | | | | | | | | | | | | | | |
| I | | $ | 302,612 | | | $ | 144,167 | | | $ | 85,504 | | | $ | 38,164 | | | $ | 20,151 | | | $ | 26,490 | | | $ | 415,301 | | | $ | 1,032,389 | |
| II | | 1,496 | | | 5,280 | | | 785 | | | 353 | | | 94 | | | 219 | | | 5,706 | | | 13,933 | |
| III | | 1,093 | | | 7,168 | | | 1,882 | | | 5,919 | | | 3,861 | | | 3,957 | | | 15,058 | | | 38,938 | |
| IV | | 1,482 | | | 6,519 | | | 1,319 | | | 321 | | | 133 | | | 1,644 | | | 9,157 | | | 20,575 | |
| Total | | $ | 306,683 | | | $ | 163,134 | | | $ | 89,490 | | | $ | 44,757 | | | $ | 24,239 | | | $ | 32,310 | | | $ | 445,222 | | | $ | 1,105,835 | |
| | | | | | | | | | | | | | | | |
| Consumer and other | | | | | | | | | | | | | | | | |
| Category | | | | | | | | | | | | | | | | |
| I | | $ | 5,920 | | | $ | 8,786 | | | $ | 3,167 | | | $ | 12,193 | | | $ | 2,049 | | | $ | 3,485 | | | $ | 8,712 | | | $ | 44,312 | |
| II | | — | | | — | | | — | | | — | | | — | | | — | | | — | | | — | |
| III | | — | | | — | | | — | | | — | | | — | | | — | | | — | | | — | |
| IV | | — | | | — | | | — | | | — | | | — | | | — | | | — | | | — | |
| Total | | $ | 5,920 | | | $ | 8,786 | | | $ | 3,167 | | | $ | 12,193 | | | $ | 2,049 | | | $ | 3,485 | | | $ | 8,712 | | | $ | 44,312 | |
| | | | | | | | | | | | | | | | |
| Total Loans | | | | | | | | | | | | | | | | |
| Category | | | | | | | | | | | | | | | | |
| I | | $ | 564,860 | | | $ | 404,711 | | | $ | 281,402 | | | $ | 289,670 | | | $ | 134,341 | | | $ | 542,295 | | | $ | 481,028 | | | $ | 2,698,307 | |
| II | | 1,496 | | | 5,280 | | | 12,376 | | | 8,577 | | | 19,932 | | | 16,493 | | | 5,706 | | | 69,860 | |
| III | | 1,093 | | | 7,168 | | | 1,882 | | | 5,919 | | | 3,861 | | | 26,273 | | | 15,058 | | | 61,254 | |
| IV | | 1,482 | | | 6,519 | | | 1,319 | | | 321 | | | 133 | | | 1,666 | | | 9,157 | | | $ | 20,597 | |
| Total | | $ | 568,931 | | | $ | 423,678 | | | $ | 296,979 | | | $ | 304,487 | | | $ | 158,267 | | | $ | 586,727 | | | $ | 510,949 | | | $ | 2,850,018 | |
|
| | | | | | | | | | | | | | | | | | | | |
| | | December 31, 2016 |
| | | Category | | |
| | | I | | II | | III | | IV | | Total |
| | | (Dollars in Thousands) |
| Commercial real estate: | | | | | | | | | | |
| Commercial real estate — owner occupied | | $ | 142,704 |
| | $ | 20,294 |
| | $ | 11,174 |
| | $ | 2,287 |
| | $ | 176,459 |
|
| Commercial real estate — non-owner occupied | | 447,895 |
| | 20,933 |
| | 2,721 |
| | 1,609 |
| | 473,158 |
|
| Land development | | 52,082 |
| | 823 |
| | 293 |
| | 3,440 |
| | 56,638 |
|
| Construction | | 93,510 |
| | 3,154 |
| | 1,624 |
| | 2,918 |
| | 101,206 |
|
| Multi-family | | 87,418 |
| | 1,937 |
| | 3,407 |
| | — |
| | 92,762 |
|
| 1-4 family | | 38,504 |
| | 3,144 |
| | 1,431 |
| | 2,572 |
| | 45,651 |
|
| Total commercial real estate | | 862,113 |
| | 50,285 |
| | 20,650 |
| | 12,826 |
| | 945,874 |
|
| Commercial and industrial | | 348,201 |
| | 42,949 |
| | 46,675 |
| | 12,473 |
| | 450,298 |
|
| Direct financing leases, net | | 29,351 |
| | 1,600 |
| | — |
| | — |
| | 30,951 |
|
| Consumer and other: | | | | | | | | | | |
| Home equity and second mortgages | | 8,271 |
| | 121 |
| | 12 |
| | 8 |
| | 8,412 |
|
| Other | | 15,714 |
| | — |
| | 11 |
| | 604 |
| | 16,329 |
|
| Total consumer and other | | 23,985 |
| | 121 |
| | 23 |
| | 612 |
| | 24,741 |
|
| Total gross loans and leases receivable | | $ | 1,263,650 |
| | $ | 94,955 |
| | $ | 67,348 |
| | $ | 25,911 |
| | $ | 1,451,864 |
|
| Category as a % of total portfolio | | 87.04 | % | | 6.54 | % | | 4.64 | % | | 1.78 | % | | 100.00 | % |
| | | | | | | | | | | | | | | | | | | | | | | | | | | | | | | | | | | | | | | | | | | | | | | | | | |
| December 31, 2022 | | Term Loans Amortized Cost Basis by Origination Year | | | | |
| (In Thousands) | | 2022 | | 2021 | | 2020 | | 2019 | | 2018 | | Prior | | Revolving Loans Amortized Cost Basis | | Total |
| Commercial real estate — owner occupied | | | | | | | | | | | | |
| Category | | | | | | | | | | | | | | | | |
| I | | $ | 50,705 | | | $ | 34,896 | | | $ | 55,096 | | | $ | 25,583 | | | $ | 15,583 | | | $ | 72,091 | | | $ | 2,287 | | | $ | 256,241 | |
| II | | — | | | 560 | | | 300 | | | — | | | 399 | | | 1,344 | | | — | | | 2,603 | |
| III | | — | | | 494 | | | 5,489 | | | 299 | | | 417 | | | 2,811 | | | — | | | 9,510 | |
| IV | | — | | | — | | | — | | | — | | | — | | | — | | | — | | | — | |
| Total | | $ | 50,705 | | | $ | 35,950 | | | $ | 60,885 | | | $ | 25,882 | | | $ | 16,399 | | | $ | 76,246 | | | $ | 2,287 | | | $ | 268,354 | |
| | | | | | | | | | | | | | | | |
| Commercial real estate — non-owner occupied | | | | | | | | | | | | |
| Category | | | | | | | | | | | | | | | | |
| I | | $ | 88,752 | | | $ | 74,615 | | | $ | 60,216 | | | $ | 64,847 | | | $ | 84,053 | | | $ | 232,405 | | | $ | 25,508 | | | $ | 630,396 | |
| II | | — | | | — | | | — | | | 15,099 | | | 11,390 | | | 7,534 | | | — | | | 34,023 | |
| III | | — | | | — | | | 3,891 | | | — | | | — | | | 18,566 | | | 215 | | | 22,672 | |
| IV | | — | | | — | | | — | | | — | | | — | | | — | | | — | | | — | |
| Total | | $ | 88,752 | | | $ | 74,615 | | | $ | 64,107 | | | $ | 79,946 | | | $ | 95,443 | | | $ | 258,505 | | | $ | 25,723 | | | $ | 687,091 | |
| | | | | | | | | | | | | | | | |
| Construction | | | | | | | | | | | | | | | | |
| Category | | | | | | | | | | | | | | | | |
| I | | $ | 39,942 | | | $ | 70,257 | | | $ | 39,048 | | | $ | 457 | | | $ | 8,052 | | | $ | 22,603 | | | $ | 27,601 | | | $ | 207,960 | |
| II | | — | | | — | | | — | | | — | | | — | | | — | | | — | | | — | |
| III | | — | | | — | | | — | | | 10,791 | | | — | | | — | | | — | | | 10,791 | |
| IV | | — | | | — | | | — | | | — | | | — | | | — | | | — | | | — | |
| Total | | $ | 39,942 | | | $ | 70,257 | | | $ | 39,048 | | | $ | 11,248 | | | $ | 8,052 | | | $ | 22,603 | | | $ | 27,601 | | | $ | 218,751 | |
| | | | | | | | | | | | | | | | |
| Multi-family | | | | | | | | | | | | | | | | |
| Category | | | | | | | | | | | | | | | | |
| I | | $ | 21,698 | | | $ | 46,894 | | | $ | 121,199 | | | $ | 23,293 | | | $ | 32,611 | | | $ | 93,723 | | | $ | 2,612 | | | $ | 342,030 | |
| II | | — | | | — | | | — | | | — | | | — | | | 7,996 | | | — | | | 7,996 | |
| III | | — | | | — | | | — | | | — | | | — | | | — | | | — | | | — | |
| IV | | — | | | — | | | — | | | — | | | — | | | — | | | — | | | — | |
| Total | | $ | 21,698 | | | $ | 46,894 | | | $ | 121,199 | | | $ | 23,293 | | | $ | 32,611 | | | $ | 101,719 | | | $ | 2,612 | | | $ | 350,026 | |
| | | | | | | | | | | | | | | | |
| 1-4 family | | | | | | | | | | | | | | | | |
| Category | | | | | | | | | | | | | | | | |
| I | | $ | 7,659 | | | $ | 3,087 | | | $ | 2,525 | | | $ | 632 | | | $ | 98 | | | $ | 2,250 | | | $ | 1,447 | | | $ | 17,698 | |
| II | | — | | | — | | | — | | | — | | | — | | | — | | | — | | | — | |
| III | | — | | | — | | | — | | | — | | | — | | | — | | | — | | | — | |
| IV | | — | | | — | | | — | | | — | | | — | | | 30 | | | — | | | 30 | |
| Total | | $ | 7,659 | | | $ | 3,087 | | | $ | 2,525 | | | $ | 632 | | | $ | 98 | | | $ | 2,280 | | | $ | 1,447 | | | $ | 17,728 | |
| | | | | | | | | | | | | | | | |
Credit underwriting primarily through a committee process is a key component
| | | | | | | | | | | | | | | | | | | | | | | | | | | | | | | | | | | | | | | | | | | | | | | | | | |
| December 31, 2022 | | Term Loans Amortized Cost Basis by Origination Year | | | | |
| (In Thousands) | | 2022 | | 2021 | | 2020 | | 2019 | | 2018 | | Prior | | Revolving Loans Amortized Cost Basis | | Total |
| Commercial and industrial | | | | | | | | | | | | | | |
| Category | | | | | | | | | | | | | | | | |
| I | | $ | 199,293 | | | $ | 109,901 | | | $ | 56,590 | | | $ | 30,000 | | | $ | 13,838 | | | $ | 19,367 | | | $ | 364,817 | | | $ | 793,806 | |
| II | | 5,499 | | | 801 | | | 3,021 | | | 1,108 | | | 92 | | | 239 | | | 9,846 | | | 20,606 | |
| III | | 1,809 | | | 5,607 | | | 6,691 | | | 6,699 | | | 133 | | | 5,451 | | | 8,896 | | | 35,286 | |
| IV | | 601 | | | 1,015 | | | 589 | | | 446 | | | 102 | | | 876 | | | — | | | 3,629 | |
| Total | | $ | 207,202 | | | $ | 117,324 | | | $ | 66,891 | | | $ | 38,253 | | | $ | 14,165 | | | $ | 25,933 | | | $ | 383,559 | | | $ | 853,327 | |
| | | | | | | | | | | | | | | | |
| Consumer and other | | | | | | | | | | | | | | | | |
| Category | | | | | | | | | | | | | | | | |
| I | | $ | 11,086 | | | $ | 3,556 | | | $ | 13,870 | | | $ | 2,433 | | | $ | 2,600 | | | $ | 4,193 | | | $ | 10,200 | | | $ | 47,938 | |
| II | | — | | | — | | | — | | | — | | | — | | | — | | | — | | | — | |
| III | | — | | | — | | | — | | | — | | | — | | | — | | | — | | | — | |
| IV | | — | | | — | | | — | | | — | | | — | | | — | | | — | | | — | |
| Total | | $ | 11,086 | | | $ | 3,556 | | | $ | 13,870 | | | $ | 2,433 | | | $ | 2,600 | | | $ | 4,193 | | | $ | 10,200 | | | $ | 47,938 | |
| | | | | | | | | | | | | | | | |
| Total Loans | | | | | | | | | | | | | | | | |
| Category | | | | | | | | | | | | | | | | |
| I | | $ | 419,135 | | | $ | 343,206 | | | $ | 348,544 | | | $ | 147,245 | | | $ | 156,835 | | | $ | 446,632 | | | $ | 434,472 | | | $ | 2,296,069 | |
| II | | 5,499 | | | 1,361 | | | 3,321 | | | 16,207 | | | 11,881 | | | 17,113 | | | 9,846 | | | 65,228 | |
| III | | 1,809 | | | 6,101 | | | 16,071 | | | 17,789 | | | 550 | | | 26,828 | | | 9,111 | | | 78,259 | |
| IV | | 601 | | | 1,015 | | | 589 | | | 446 | | | 102 | | | 906 | | | — | | | 3,659 | |
| Total | | $ | 427,044 | | | $ | 351,683 | | | $ | 368,525 | | | $ | 181,687 | | | $ | 169,368 | | | $ | 491,479 | | | $ | 453,429 | | | $ | 2,443,215 | |
Each credit is evaluated for proper risk rating upon origination, at the time of each subsequent renewal, upon receipt and evaluation of updated financial information from the Corporation’s borrowers or as other circumstances dictate. The Corporation primarily uses a nine grade risk rating system to monitor the ongoing credit quality of its loans and leases. The risk rating grades follow a consistent definition and are then applied to specific loan types based on the nature of the loan. Each risk rating is subjective and, depending on the size and nature of the credit, subject to various levels of review and concurrence on the stated risk rating. In addition to its nine grade risk rating system, the Corporation groups loans into four loan and related risk categories which determine the level and nature of review by management.
Category I — Loans and leases in this category are performing in accordance with the terms of the contract and generally exhibit no immediate concerns regarding the security and viability of the underlying collateral, financial stability of the borrower, integrity or strength of the borrowers’ management team or the industry in which the borrower operates. The Corporation monitors Category I loans and leases through payment performance, continued maintenance of its personal relationships with such borrowers and continued review of such borrowers’ compliance with the terms of their respective agreements.
Category II — Loans and leases in this category are beginning to show signs of deterioration in one or more of the Corporation’s core underwriting criteria such as financial stability, management strength, industry trends or collateral values. Management will place credits in this category to allow for proactive monitoring and resolution with the borrower to possibly mitigate the area of concern and prevent further deterioration or risk of loss to the Corporation. Category II loans are considered performing but are monitored frequently by the assigned business development officer and by subcommittees of the Bank’s Loan Committee.asset quality review committees.
Category III — Loans and leases in this category are identified by management as warranting special attention. However, the balance in this category is not intended to represent the amount of adversely classified assets held by the Bank. Category III
loans and leases generally exhibit undesirable characteristics, such as evidence of adverse financial trends and conditions, managerial problems, deteriorating economic conditions within the related industry or evidence of adverse public filings and may exhibit collateral shortfall positions. Management continues to believe that it will collect all contractual principal and interest in accordance with the original terms of the contracts relating to the loans and leases in this category, and therefore
Category III loans are considered performing with no specific reserves established for this category. Category III loans are monitored by management and subcommittees of the Bank’s Loan Committeeasset quality review committees on a monthly basis and the Bank’s Boards of Directors at each of their regularly scheduled meetings.basis.
Category IV — Loans and leases in this category are considered to be impaired. Impaired loans and leases have been placed on non-accrual as managementnon-performing loans. Management has determined that it is unlikely that the Bank will receive the contractual principal and interest in accordance with the original terms of the agreement. ImpairedNon-performing loans are individually evaluated to assess the need for the establishment of specific reserves or charge-offs. When analyzing the adequacy of collateral, the Corporation obtains external appraisals at least annually for impaired loans and leases.annually. External appraisals are obtained from the Corporation’s approved appraiser listing and are independently reviewed to monitor the quality of such appraisals. To the extent a collateral shortfall position is present, a specific reserve or charge-off will be recorded to reflect the magnitude of the impairment.recorded. Loans and leases in this category are monitored by management and subcommittees of the Bank’s Loan Committeeasset quality review committees on a monthly basis and the Bank’s Boards of Directors at each of their regularly scheduled meetings.basis.
Utilizing regulatory classification terminology, the Corporation identified $32.7 million and $34.3 million of loans and leases as Substandard as of December 31, 2017 and 2016, respectively. The Corporation identified $4.7 million of loans and leases as Doubtful as of December 31, 2017. No loans and leases were considered Doubtful as of December 31, 2016. Additionally, no loans were considered Special Mention or Loss as of either December 31, 2017 or 2016. The population of Substandard loans is a subset of Category III and Category IV loans.
The delinquency aging of the loan and lease portfolio by class of receivable as of December 31, 2017 and 2016 was as follows: | | | December 31, 2023 | | | | December 31, 2023 |
| | 30-59
Days Past Due | | | | 30-59
Days Past Due | | 60-89
Days Past Due | | Greater
Than 90
Days Past Due | | Total Past Due | | Current | | Total Loans and Leases |
| | | | | | | | | | | | | | | | (Dollars in Thousands) |
| | | December 31, 2017 |
| | | 30-59
Days Past Due | | 60-89
Days Past Due | | Greater
Than 90
Days Past Due | | Total Past Due | | Current | | Total Loans and Leases |
| | | (Dollars in Thousands) |
| Accruing loans and leases | | | | | | | | | | | | |
| Performing loans and leases | | Performing loans and leases | | |
| Commercial real estate: | | | | | | | | | | | | | Commercial real estate: | | |
| Owner occupied | | $ | — |
| | $ | — |
| | $ | — |
| | $ | — |
| | $ | 193,366 |
| | $ | 193,366 |
|
| Non-owner occupied | | — |
| | — |
| | — |
| | — |
| | 470,202 |
| | 470,202 |
|
| Land development | | — |
| | — |
| | — |
| | — |
| | 37,528 |
| | 37,528 |
|
| Construction | | — |
| | 196 |
| | — |
| | 196 |
| | 122,089 |
| | 122,285 |
|
| Multi-family | | — |
| | — |
| | — |
| | — |
| | 136,978 |
| | 136,978 |
|
| 1-4 family | | 496 |
| | — |
| | — |
| | 496 |
| | 43,319 |
| | 43,815 |
|
| Commercial and industrial | | 1,169 |
| | 197 |
| | — |
| | 1,366 |
| | 415,315 |
| | 416,681 |
|
| Direct financing leases, net | | — |
| | — |
| | — |
| | — |
| | 30,787 |
| | 30,787 |
|
| Consumer and other: | | | | | | | |
| | | |
|
| Home equity and second mortgages | | 106 |
| | — |
| | — |
| | 106 |
| | 7,156 |
| | 7,262 |
|
| Other | | — |
| | — |
| | — |
| | — |
| | 17,745 |
| | 17,745 |
|
| Consumer and other | |
| Total | | 1,771 |
| | 393 |
| | — |
| | 2,164 |
| | 1,474,485 |
| | 1,476,649 |
|
| Non-accruing loans and leases | | | | | | | | | | | | |
| Non-performing loans and leases | | Non-performing loans and leases | | |
| Commercial real estate: | | | | | | | | | | | | | Commercial real estate: | | |
| Owner occupied | | 405 |
| | — |
| | 4,836 |
| | 5,241 |
| | 1,780 |
| | 7,021 |
|
| Non-owner occupied | | — |
| | — |
| | — |
| | — |
| | 34 |
| | 34 |
|
| Land development | | — |
| | — |
| | — |
| | — |
| | 2,626 |
| | 2,626 |
|
| Construction | | — |
| | — |
| | 2,872 |
| | 2,872 |
| | — |
| | 2,872 |
|
| Multi-family | | — |
| | — |
| | — |
| | — |
| | — |
| | — |
|
| 1-4 family | | — |
| | — |
| | 948 |
| | 948 |
| | 213 |
| | 1,161 |
|
| Commercial and industrial | | 782 |
| | — |
| | 7,349 |
| | 8,131 |
| | 4,190 |
| | 12,321 |
|
| Direct financing leases, net | | — |
| | — |
| | — |
| | — |
| | — |
| | — |
|
| Consumer and other: | | | | | | | |
| | | |
|
| Home equity and second mortgages | | — |
| | — |
| | — |
| | — |
| | — |
| | — |
|
| Other | | — |
| | — |
| | 345 |
| | 345 |
| | 9 |
| | 354 |
|
| Consumer and other | |
| Total | | 1,187 |
| | — |
| | 16,350 |
| | 17,537 |
| | 8,852 |
| | 26,389 |
|
| Total loans and leases | | | | | | | | | | | | | Total loans and leases | | |
| Commercial real estate: | | | | | | | | | | | | | Commercial real estate: | | |
| Owner occupied | | 405 |
| | — |
| | 4,836 |
| | 5,241 |
| | 195,146 |
| | 200,387 |
|
| Non-owner occupied | | — |
| | — |
| | — |
| | — |
| | 470,236 |
| | 470,236 |
|
| Land development | | — |
| | — |
| | — |
| | — |
| | 40,154 |
| | 40,154 |
|
| Construction | | — |
| | 196 |
| | 2,872 |
| | 3,068 |
| | 122,089 |
| | 125,157 |
|
| Multi-family | | — |
| | — |
| | — |
| | — |
| | 136,978 |
| | 136,978 |
|
| 1-4 family | | 496 |
| | — |
| | 948 |
| | 1,444 |
| | 43,532 |
| | 44,976 |
|
| Commercial and industrial | | 1,951 |
| | 197 |
| | 7,349 |
| | 9,497 |
| | 419,505 |
| | 429,002 |
|
| Direct financing leases, net | | — |
| | — |
| | — |
| | — |
| | 30,787 |
| | 30,787 |
|
| Consumer and other: | | | | | | | |
| |
| |
|
| Home equity and second mortgages | | 106 |
| | — |
| | — |
| | 106 |
| | 7,156 |
| | 7,262 |
|
| Other | | — |
| | — |
| | 345 |
| | 345 |
| | 17,754 |
| | 18,099 |
|
| Consumer and other | |
| Total | | $ | 2,958 |
| | $ | 393 |
| | $ | 16,350 |
| | $ | 19,701 |
| | $ | 1,483,337 |
| | $ | 1,503,038 |
|
| Percent of portfolio | | 0.20 | % | | 0.03 | % | | 1.09 | % | | 1.32 | % | | 98.68 | % | | 100.00 | % | Percent of portfolio | | 0.12 | % | | 0.04 | % | | 0.64 | % | | 0.80 | % | | 99.20 | % | | 100.00 | % |
| | | | | | | | | | | | | | | | | | | | | | | | | | | | | | | | | | | | | | |
| | December 31, 2022 |
| | 30-59
Days Past Due | | 60-89
Days Past Due | | Greater
Than 90
Days Past Due | | Total Past Due | | Current | | Total Loans and Leases |
| | | (Dollars in Thousands) |
| Performing loans and leases | | | | | | | | | | | | |
| Commercial real estate: | | | | | | | | | | | | |
| Owner occupied | | $ | — | | | $ | — | | | $ | — | | | $ | — | | | $ | 268,354 | | | $ | 268,354 | |
| Non-owner occupied | | 215 | | | — | | | — | | | 215 | | | 686,876 | | | 687,091 | |
| Construction | | — | | | — | | | — | | | — | | | 218,751 | | | 218,751 | |
| Multi-family | | — | | | — | | | — | | | — | | | 350,026 | | | 350,026 | |
| 1-4 family | | — | | | — | | | — | | | — | | | 17,698 | | | 17,698 | |
| Commercial and industrial | | 1,437 | | | 403 | | | — | | | 1,840 | | | 847,858 | | | 849,698 | |
| Consumer and other | | — | | | — | | | — | | | — | | | 47,938 | | | 47,938 | |
| Total | | 1,652 | | | 403 | | | — | | | 2,055 | | | 2,437,501 | | | 2,439,556 | |
| Non-performing loans and leases | | | | | | | | | | | | |
| Commercial real estate: | | | | | | | | | | | | |
| Owner occupied | | — | | | — | | | — | | | — | | | — | | | — | |
| Non-owner occupied | | — | | | — | | | — | | | — | | | — | | | — | |
| Construction | | — | | | — | | | — | | | — | | | — | | | — | |
| Multi-family | | — | | | — | | | — | | | — | | | — | | | — | |
| 1-4 family | | — | | | — | | | — | | | — | | | 30 | | | 30 | |
| Commercial and industrial | | 439 | | | 126 | | | 2,464 | | | 3,029 | | | 600 | | | 3,629 | |
| Consumer and other | | — | | | — | | | — | | | — | | | — | | | — | |
| Total | | 439 | | | 126 | | | 2,464 | | | 3,029 | | | 630 | | | 3,659 | |
| Total loans and leases | | | | | | | | | | | | |
| Commercial real estate: | | | | | | | | | | | | |
| Owner occupied | | — | | | — | | | — | | | — | | | 268,354 | | | 268,354 | |
| Non-owner occupied | | 215 | | | — | | | — | | | 215 | | | 686,876 | | | 687,091 | |
| Construction | | — | | | — | | | — | | | — | | | 218,751 | | | 218,751 | |
| Multi-family | | — | | | — | | | — | | | — | | | 350,026 | | | 350,026 | |
| 1-4 family | | — | | | — | | | — | | | — | | | 17,728 | | | 17,728 | |
| Commercial and industrial | | 1,876 | | | 529 | | | 2,464 | | | 4,869 | | | 848,458 | | | 853,327 | |
| Consumer and other | | — | | | — | | | — | | | — | | | 47,938 | | | 47,938 | |
| Total | | $ | 2,091 | | | $ | 529 | | | $ | 2,464 | | | $ | 5,084 | | | $ | 2,438,131 | | | $ | 2,443,215 | |
| Percent of portfolio | | 0.09 | % | | 0.02 | % | | 0.10 | % | | 0.21 | % | | 99.79 | % | | 100.00 | % |
|
| | | | | | | | | | | | | | | | | | | | | | | | |
| | | December 31, 2016 |
| | | 30-59
Days Past Due | | 60-89
Days Past Due | | Greater
Than 90
Days Past Due | | Total Past Due | | Current | | Total Loans and Leases |
| | | (Dollars in Thousands) |
| Accruing loans and leases | | | | | | | | | | | | |
| Commercial real estate: | | | | | | | | | | | | |
| Owner occupied | | $ | — |
| | $ | — |
| | $ | — |
| | $ | — |
| | $ | 174,236 |
| | $ | 174,236 |
|
| Non-owner occupied | | — |
| | — |
| | — |
| | — |
| | 471,549 |
| | 471,549 |
|
| Land development | | — |
| | — |
| | — |
| | — |
| | 53,198 |
| | 53,198 |
|
| Construction | | — |
| | — |
| | — |
| | — |
| | 98,288 |
| | 98,288 |
|
| Multi-family | | — |
| | — |
| | — |
| | — |
| | 92,762 |
| | 92,762 |
|
| 1-4 family | | 75 |
| | — |
| | — |
| | 75 |
| | 43,639 |
| | 43,714 |
|
| Commercial and industrial | | 55 |
| | 468 |
| | — |
| | 523 |
| | 437,312 |
| | 437,835 |
|
| Direct financing leases, net | | — |
| | — |
| | — |
| | — |
| | 30,951 |
| | 30,951 |
|
| Consumer and other: | | | | | | | | | | | | |
| Home equity and second mortgages | | — |
| | — |
| | — |
| | — |
| | 8,412 |
| | 8,412 |
|
| Other | | — |
| | — |
| | — |
| | — |
| | 15,725 |
| | 15,725 |
|
| Total | | 130 |
| | 468 |
| | — |
| | 598 |
| | 1,426,072 |
| | 1,426,670 |
|
| Non-accruing loans and leases | | | | | | | | | | | | |
| Commercial real estate: | | | | | | | | | | | | |
| Owner occupied | | — |
| | — |
| | 1,183 |
| | 1,183 |
| | 1,040 |
| | 2,223 |
|
| Non-owner occupied | | — |
| | — |
| | — |
| | — |
| | 1,609 |
| | 1,609 |
|
| Land development | | — |
| | — |
| | — |
| | — |
| | 3,440 |
| | 3,440 |
|
| Construction | | 2,482 |
| | — |
| | 436 |
| | 2,918 |
| | — |
| | 2,918 |
|
| Multi-family | | — |
| | — |
| | — |
| | — |
| | — |
| | — |
|
| 1-4 family | | — |
| | — |
| | 1,240 |
| | 1,240 |
| | 697 |
| | 1,937 |
|
| Commercial and industrial | | 3,345 |
| | 168 |
| | 6,740 |
| | 10,253 |
| | 2,210 |
| | 12,463 |
|
| Direct financing leases, net | | — |
| | — |
| | — |
| | — |
| | — |
| | — |
|
| Consumer and other: | | | | | | | | | | | | |
| Home equity and second mortgages | | — |
| | — |
| | — |
| | — |
| | — |
| | — |
|
| Other | | 186 |
| | — |
| | 378 |
| | 564 |
| | 40 |
| | 604 |
|
| Total | | 6,013 |
| | 168 |
| | 9,977 |
| | 16,158 |
| | 9,036 |
| | 25,194 |
|
| Total loans and leases | | | | | | | | | | | | |
| Commercial real estate: | | | | | | | | | | | | |
| Owner occupied | | — |
| | — |
| | 1,183 |
| | 1,183 |
| | 175,276 |
| | 176,459 |
|
| Non-owner occupied | | — |
| | — |
| | — |
| | — |
| | 473,158 |
| | 473,158 |
|
| Land development | | — |
| | — |
| | — |
| | — |
| | 56,638 |
| | 56,638 |
|
| Construction | | 2,482 |
| | — |
| | 436 |
| | 2,918 |
| | 98,288 |
| | 101,206 |
|
| Multi-family | | — |
| | — |
| | — |
| | — |
| | 92,762 |
| | 92,762 |
|
| 1-4 family | | 75 |
| | — |
| | 1,240 |
| | 1,315 |
| | 44,336 |
| | 45,651 |
|
| Commercial and industrial | | 3,400 |
| | 636 |
| | 6,740 |
| | 10,776 |
| | 439,522 |
| | 450,298 |
|
| Direct financing leases, net | | — |
| | — |
| | — |
| | — |
| | 30,951 |
| | 30,951 |
|
| Consumer and other: | | | | | | | | | | | | |
| Home equity and second mortgages | | — |
| | — |
| | — |
| | — |
| | 8,412 |
| | 8,412 |
|
| Other | | 186 |
| | — |
| | 378 |
| | 564 |
| | 15,765 |
| | 16,329 |
|
| Total | | $ | 6,143 |
| | $ | 636 |
| | $ | 9,977 |
| | $ | 16,756 |
| | $ | 1,435,108 |
| | $ | 1,451,864 |
|
| Percent of portfolio | | 0.42 | % | | 0.04 | % | | 0.69 | % | | 1.15 | % | | 98.85 | % | | 100.00 | % |
The Corporation’s total impairednon-performing assets consisted of the following at December 31, 2017 and 2016, respectively.following:
| | | | | | | | | | | | | | |
| | December 31,
2023 | | December 31,
2022 |
| | | (In Thousands) |
| Non-performing loans and leases | | | | |
| Commercial real estate: | | | | |
| Commercial real estate — owner occupied | | $ | — | | | $ | — | |
| Commercial real estate — non-owner occupied | | — | | | — | |
| Construction | | — | | | — | |
| Multi-family | | — | | | — | |
| 1-4 family | | 22 | | | 30 | |
| Total non-performing commercial real estate | | 22 | | | 30 | |
| Commercial and industrial | | 20,575 | | | 3,629 | |
| Consumer and other | | — | | | — | |
| Total non-performing loans and leases | | 20,597 | | | 3,659 | |
| Repossessed assets, net | | 247 | | | 95 | |
| Total non-performing assets | | $ | 20,844 | | | $ | 3,754 | |
|
| | | | | | | | |
| | | December 31,
2017 | | December 31,
2016 |
| | | (In Thousands) |
| Non-accrual loans and leases | | | | |
| Commercial real estate: | | | | |
| Commercial real estate — owner occupied | | $ | 7,021 |
| | $ | 2,223 |
|
| Commercial real estate — non-owner occupied | | 34 |
| | 1,609 |
|
| Land development | | 2,626 |
| | 3,440 |
|
| Construction | | 2,872 |
| | 2,918 |
|
| Multi-family | | — |
| | — |
|
| 1-4 family | | 1,161 |
| | 1,937 |
|
| Total non-accrual commercial real estate | | 13,714 |
| | 12,127 |
|
| Commercial and industrial | | 12,321 |
| | 12,463 |
|
| Direct financing leases, net | | — |
| | — |
|
| Consumer and other: | | | | |
| Home equity and second mortgages | | — |
| | — |
|
| Other | | 354 |
| | 604 |
|
| Total non-accrual consumer and other loans | | 354 |
| | 604 |
|
| Total non-accrual loans and leases | | 26,389 |
| | 25,194 |
|
| Foreclosed properties, net | | 1,069 |
| | 1,472 |
|
| Total non-performing assets | | 27,458 |
| | 26,666 |
|
| Performing troubled debt restructurings | | 332 |
| | 717 |
|
| Total impaired assets | | $ | 27,790 |
| | $ | 27,383 |
|
| | | | | | | | | | | | | | |
| | December 31,
2023 | | December 31,
2022 |
| Total non-performing loans and leases to gross loans and leases | | 0.72 | % | | 0.15 | % |
| Total non-performing assets to total gross loans and leases plus repossessed assets, net | | 0.73 | | | 0.15 | |
| Total non-performing assets to total assets | | 0.59 | | | 0.13 | |
| Allowance for credit losses to gross loans and leases | | 1.16 | | | 0.99 | |
| Allowance for credit losses to non-performing loans and leases | | 160.21 | | | 662.20 | |
|
| | | | | | |
| | | December 31,
2017 | | December 31,
2016 |
| Total non-accrual loans and leases to gross loans and leases | | 1.76 | % | | 1.74 | % |
| Total non-performing assets to total gross loans and leases plus foreclosed properties, net | | 1.83 |
| | 1.83 |
|
| Total non-performing assets to total assets | | 1.53 |
| | 1.50 |
|
| Allowance for loan and lease losses to gross loans and leases | | 1.25 |
| | 1.44 |
|
| Allowance for loan and lease losses to non-accrual loans and leases | | 71.10 |
| | 83.00 |
|
As of December 31, 2017 and 2016, $8.8Non-performing loans, which are collateral dependent, are primarily secured by inventory $8.9 million, equipment $3.7 million, and $12.8 million ofaccounts receivable and other assets $1.7 million. Occasionally, the non-accrualCorporation modifies loans and leases were considered troubled debt restructurings, respectively.to borrowers in financial distress. There were no unfunded commitments associated with troubled debt restructuredthree commercial and industrial loans and leases asfor a total of December 31, 2017.
The following table provides the number of loans$882,000 modified in a troubled debt restructuring and the pre- and post-modification recorded investment by class of receivable as of December 31, 2017 and 2016:
|
| | | | | | | | | | | | | | | | | | | | |
| | | As of December 31, 2017 | | As of December 31, 2016 |
| | | Number of Loans | | Pre-Modification Recorded Investment | | Post-Modification Recorded Investment | | Number of Loans | | Pre-Modification Recorded Investment | | Post-Modification Recorded Investment |
| | | (Dollars in Thousands) |
| Commercial real estate: | | | | | | | | | | | | |
| Commercial real estate — owner occupied | | 3 | | $ | 1,065 |
| | $ | 880 |
| | 3 | | $ | 1,065 |
| | $ | 930 |
|
| Commercial real estate — non-owner occupied | | 1 | | 158 |
| | 34 |
| | 1 | | 158 |
| | 39 |
|
| Land development | | 1 | | 5,745 |
| | 2,626 |
| | 1 | | 5,745 |
| | 3,440 |
|
| Construction | | — | | — |
| | — |
| | 2 | | 331 |
| | 314 |
|
| Multi-family | | — | | — |
| | — |
| | — | | — |
| | — |
|
| 1-4 family | | 8 | | 627 |
| | 307 |
| | 11 | | 1,391 |
| | 1,393 |
|
| Commercial and industrial | | 10 | | 8,759 |
| | 4,951 |
| | 10 | | 8,094 |
| | 7,058 |
|
| Consumer and other: | | | | | | | | | | | | |
| Home equity and second mortgage | | 2 | | 37 |
| | 4 |
| | 1 | | 37 |
| | 8 |
|
| Other | | 2 | | 2,094 |
| | 345 |
| | 1 | | 2,076 |
| | 378 |
|
| Total | | 27 | | $ | 18,485 |
| | $ | 9,147 |
| | 30 | | $ | 18,897 |
| | $ | 13,560 |
|
All loans and leases modified as a troubled debt restructuring are measured for impairment. The nature and extent of the impairment of restructured loans, including those which have experienced a default, is considered in the determination of an appropriate level of the allowance for loan and lease losses.
As of December 31, 2017 and 2016, the Corporation’s troubled debt restructurings grouped by type of concession were as follows:
|
| | | | | | | | | | | | | | |
| | | As of December 31, 2017 | | As of December 31, 2016 |
| | | Number of Loans | | Recorded Investment | | Number of Loans | | Recorded Investment |
| | | (Dollars in Thousands) |
| Commercial real estate: | | | | | | | | |
| Extension of term | | — |
| | $ | — |
| | 1 |
| | $ | 8 |
|
| Interest rate concession | | 12 |
| | 3,793 |
| | 1 |
| | 52 |
|
| Combination of extension of term and interest rate concession | | 1 |
| | 54 |
| | 16 |
| | 6,056 |
|
| Commercial and industrial: | | | | | | | | |
| Combination of extension of term and interest rate concession | | 10 |
| | 4,951 |
| | 10 |
| | 7,058 |
|
| Consumer and other: | | | | | | | | |
| Extension of term | | 1 |
| | 328 |
| | 1 |
| | 378 |
|
| Combination of extension of term and interest rate concession | | 3 |
| | 21 |
| | 1 |
| | 8 |
|
| Total | | 27 |
| | $ | 9,147 |
| | 30 |
| | $ | 13,560 |
|
Duringduring the year ended December 31, 2017, four commercial and industrial2023. The modifications consisted of payment deferrals. These loans are included in total non-performing loans and one consumer loan totaling $4.4 millionare currently between zero and $17,000, respectively,209 days past due as of December 31, 2023. No loans were modified to a troubled debt restructuring. Duringduring the year ended December 31, 2016, three2022. There was one commercial and industrial loans and one commercial real estate loan totaling $675,000 and $441,000, respectively, were modified to a troubled debt restructuring.
There were no loans and leases$382,000 that was modified in a troubled debt restructuring during the previous 12 months and which subsequently defaulted during the year ended December 31, 2017.2023. There were no loans to borrowers experiencing financial distress that were modified during the previous 12 months and which subsequently defaulted during the year ended December 31, 2022. There were no unfunded commitments associated with loans modified for borrowers experiencing financial distress as of December 31, 2023.
The following represents additional information regarding the Corporation’s
impairednon-accrual loans and leases,
including performing troubled debt restructurings, by
class:portfolio segment: | | | As of and for the Year Ended December 31, 2023 | | | | As of and for the Year Ended December 31, 2023 |
| | Amortized Cost(1) | | | | Amortized Cost(1) | | Unpaid
Principal
Balance | | Individual
Reserve | | Average Recorded Investment(2) | | Foregone
Interest
Income | | Interest
Income
Recognized | | Net Foregone
Interest
Income |
| | | | | | | | | | | | | | | | | | (In Thousands) |
| | | As of and for the Year Ended December 31, 2017 |
| | | Recorded Investment | | Unpaid Principal Balance | | Impairment Reserve | | Average Recorded Investment(1) | | Foregone Interest Income | | Interest Income Recognized | | Net Foregone Interest Income |
| | | (In Thousands) |
| With no impairment reserve recorded: | | | | | | | | | | | | | | |
| With no individual reserve recorded: | | With no individual reserve recorded: | | |
| Commercial real estate: | | | | | | | | | | | | | | | Commercial real estate: | | |
| Owner occupied | | $ | 7,077 |
| | $ | 7,077 |
| | $ | — |
| | $ | 5,549 |
| | $ | 613 |
| | $ | — |
| | $ | 613 |
|
| Non-owner occupied | | 34 |
| | 75 |
| | — |
| | 1,830 |
| | 97 |
| | 226 |
| | (129 | ) |
| Land development | | 2,627 |
| | 5,297 |
| | — |
| | 3,092 |
| | 84 |
| | — |
| | 84 |
|
| Construction | | — |
| | — |
| | — |
| | 2,000 |
| | 134 |
| | 214 |
| | (80 | ) |
| Multi-family | | — |
| | — |
| | — |
| | 1 |
| | — |
| | — |
| | — |
|
| 1-4 family | | 1,423 |
| | 1,706 |
| | — |
| | 2,146 |
| | 53 |
| | 7 |
| | 46 |
|
| Commercial and industrial | | 5,465 |
| | 6,502 |
| | — |
| | 3,634 |
| | 858 |
| | 7 |
| | 851 |
|
| Direct financing leases, net | | — |
| | — |
| | — |
| | — |
| | — |
| | — |
| | — |
|
| Consumer and other: | | | | | | | | | | | | | | |
| Home equity and second mortgages | | 4 |
| | 3 |
| | — |
| | 7 |
| | — |
| | — |
| | — |
|
| Other | | 345 |
| | 1,011 |
| | — |
| | 365 |
| | 59 |
| | — |
| | 59 |
|
| Consumer and other | |
| Total | | 16,975 |
| | 21,671 |
| | — |
| | 18,624 |
| | 1,898 |
| | 454 |
| | 1,444 |
|
| With impairment reserve recorded: | | | | | | | | | | | | | | |
| With individual reserve recorded: | | With individual reserve recorded: | | |
| Commercial real estate: | | | | | | | | | | | | | | | Commercial real estate: | | |
| Owner occupied | | — |
| | — |
| | — |
| | — |
| | — |
| | — |
| | — |
|
| Non-owner occupied | | — |
| | — |
| | — |
| | — |
| | — |
| | — |
| | — |
|
| Land development | | — |
| | — |
| | — |
| | — |
| | — |
| | — |
| | — |
|
| Construction | | 2,872 |
| | 2,872 |
| | 415 |
| | 2,252 |
| | 158 |
| | — |
| | 158 |
|
| Multi-family | | — |
| | — |
| | — |
| | — |
| | — |
| | — |
| | — |
|
| 1-4 family | | — |
| | — |
| | — |
| | — |
| | — |
| | — |
| | — |
|
| Commercial and industrial | | 6,865 |
| | 8,813 |
| | 4,067 |
| | 12,288 |
| | 639 |
| | — |
| | 639 |
|
| Direct financing leases, net | | — |
| | — |
| | — |
| | — |
| | — |
| | — |
| | — |
|
| Consumer and other: | | | | | | | | | | | | | | |
| Home equity and second mortgages | | — |
| | — |
| | — |
| | — |
| | — |
| | — |
| | — |
|
| Other | | 9 |
| | 9 |
| | 9 |
| | — |
| | — |
| | — |
| | — |
|
| Consumer and other | |
| Total | | 9,746 |
| | 11,694 |
| | 4,491 |
| | 14,540 |
| | 797 |
| | — |
| | 797 |
|
| Total: | | | | | | | | | | | | | | | Total: | | |
| Commercial real estate: | | | | | | | | | | | | | | | Commercial real estate: | | |
| Owner occupied | | 7,077 |
| | 7,077 |
| | — |
| | 5,549 |
| | 613 |
| | — |
| | 613 |
|
| Non-owner occupied | | 34 |
| | 75 |
| | — |
| | 1,830 |
| | 97 |
| | 226 |
| | (129 | ) |
| Land development | | 2,627 |
| | 5,297 |
| | — |
| | 3,092 |
| | 84 |
| | — |
| | 84 |
|
| Construction | | 2,872 |
| | 2,872 |
| | 415 |
| | 4,252 |
| | 292 |
| | 214 |
| | 78 |
|
| Multi-family | | — |
| | — |
| | — |
| | 1 |
| | — |
| | — |
| | — |
|
| 1-4 family | | 1,423 |
| | 1,706 |
| | — |
| | 2,146 |
| | 53 |
| | 7 |
| | 46 |
|
| Commercial and industrial | | 12,330 |
| | 15,315 |
| | 4,067 |
| | 15,922 |
| | 1,497 |
| | 7 |
| | 1,490 |
|
| Direct financing leases, net | | — |
| | — |
| | — |
| | — |
| | — |
| | — |
| | — |
|
| Consumer and other: | | | | | | | | | | | | | | |
| Home equity and second mortgages | | 4 |
| | 3 |
| | — |
| | 7 |
| | — |
| | — |
| | — |
|
| Other | | 354 |
| | 1,020 |
| | 9 |
| | 365 |
| | 59 |
| | — |
| | 59 |
|
| Consumer and other | |
| Grand total | | $ | 26,721 |
| | $ | 33,365 |
| | $ | 4,491 |
| | $ | 33,164 |
| | $ | 2,695 |
| | $ | 454 |
| | $ | 2,241 |
|
| |
(1) | Average recorded investment is calculated primarily using daily average balances. |
(1)The amortized cost represents the unpaid principal balance net of any partial charge-offs.
(2)Average recorded investment is calculated primarily using daily average balances.
| | | | | | | | | | | | | | | | | | | | | | | | | | | | | | | | | | | | | | | | | | | | |
| | As of and for the Year Ended December 31, 2022 |
| | Recorded Investment(1) | | Unpaid
Principal
Balance | | Individual
Reserve | | Average Recorded Investment(2) | | Foregone
Interest
Income | | Interest
Income
Recognized | | Net Foregone
Interest
Income |
| | | (In Thousands) |
| With no individual reserve recorded: | | | | | | | | | | | | | | |
| Commercial real estate: | | | | | | | | | | | | | | |
| Owner occupied | | $ | — | | | $ | — | | | $ | — | | | $ | 180 | | | $ | 14 | | | $ | 759 | | | $ | (745) | |
| Non-owner occupied | | — | | | — | | | — | | | — | | | — | | | 1 | | | (1) | |
| Construction | | — | | | — | | | — | | | — | | | — | | | 47 | | | (47) | |
| Multi-family | | — | | | — | | | — | | | — | | | — | | | — | | | — | |
| 1-4 family | | 30 | | | 35 | | | — | | | 112 | | | 8 | | | 41 | | | (33) | |
| Commercial and industrial | | 1,037 | | | 1,037 | | | — | | | 3,153 | | | 277 | | | 587 | | | (310) | |
| Consumer and other | | — | | | — | | | — | | | — | | | — | | | — | | | — | |
| Total | | 1,067 | | | 1,072 | | | — | | | 3,445 | | | 299 | | | 1,435 | | | (1,136) | |
| With individual reserve recorded: | | | | | | | | | | | | | | |
| Commercial real estate: | | | | | | | | | | | | | | |
| Owner occupied | | — | | | — | | | — | | | — | | | — | | | — | | | — | |
| Non-owner occupied | | — | | | — | | | — | | | — | | | — | | | — | | | — | |
| Construction | | — | | | — | | | — | | | — | | | — | | | — | | | — | |
| Multi-family | | — | | | — | | | — | | | — | | | — | | | — | | | — | |
| 1-4 family | | — | | | — | | | — | | | — | | | — | | | — | | | — | |
| Commercial and industrial | | 2,592 | | | 2,612 | | | 1,650 | | | 1,454 | | | 101 | | | 1 | | | 100 | |
| Consumer and other | | — | | | — | | | — | | | — | | | — | | | — | | | — | |
| Total | | 2,592 | | | 2,612 | | | 1,650 | | | 1,454 | | | 101 | | | 1 | | | 100 | |
| Total: | | | | | | | | | | | | | | |
| Commercial real estate: | | | | | | | | | | | | | | |
| Owner occupied | | — | | | — | | | — | | | 180 | | | 14 | | | 759 | | | (745) | |
| Non-owner occupied | | — | | | — | | | — | | | — | | | — | | | 1 | | | (1) | |
| Construction | | — | | | — | | | — | | | — | | | — | | | 47 | | | (47) | |
| Multi-family | | — | | | — | | | — | | | — | | | — | | | — | | | — | |
| 1-4 family | | 30 | | | 35 | | | — | | | 112 | | | 8 | | | 41 | | | (33) | |
| Commercial and industrial | | 3,629 | | | 3,649 | | | 1,650 | | | 4,607 | | | 378 | | | 588 | | | (210) | |
| Consumer and other | | — | | | — | | | — | | | — | | | — | | | — | | | — | |
| Grand total | | $ | 3,659 | | | $ | 3,684 | | | $ | 1,650 | | | $ | 4,899 | | | $ | 400 | | | $ | 1,436 | | | $ | (1,036) | |
(1)The recorded investment represents the unpaid principal balance net of any partial charge-offs.
(2)Average recorded investment is calculated primarily using daily average balances.
|
| | | | | | | | | | | | | | | | | | | | | | | | | | | | | | | | |
| | | As of and for the Year Ended December 31, 2016 |
| | | Recorded Investment | | Unpaid Principal Balance | | Impairment Reserve | | Average Recorded Investment(1) | | Foregone Interest Income | | Interest Income Recognized | | Net Foregone Interest Income |
| | | (In Thousands) |
| With no impairment reserve recorded: | | | | | | | | | | | | | | |
| Commercial real estate: | | | | | | | | | | | | | | |
| Owner occupied | | $ | 1,788 |
| | $ | 1,788 |
| | $ | — |
| | $ | 3,577 |
| | $ | 328 |
| | $ | 118 |
| | $ | 210 |
|
| Non-owner occupied | | 1,609 |
| | 1,647 |
| | — |
| | 1,318 |
| | 91 |
| | 79 |
| | 12 |
|
| Land development | | 3,440 |
| | 6,111 |
| | — |
| | 3,898 |
| | 107 |
| | — |
| | 107 |
|
| Construction | | 436 |
| | 438 |
| — |
| — |
| — |
| 291 |
| — |
| 20 |
| — |
| — |
| | 20 |
|
| Multi-family | | — |
| | — |
| | — |
| | — |
| | 1 |
| | 134 |
| | (133 | ) |
| 1-4 family | | 2,379 |
| | 2,379 |
| | — |
| | 2,755 |
| | 125 |
| | 94 |
| | 31 |
|
| Commercial and industrial | | 1,307 |
| | 1,307 |
| | — |
| | 709 |
| | 79 |
| | 62 |
| | 17 |
|
| Direct financing leases, net | | — |
| | — |
| | — |
| | 6 |
| | — |
| | — |
| | — |
|
| Consumer and other: | | | | | | | | | | | | | | |
| Home equity and second mortgages | | 8 |
| | 8 |
| | — |
| | 307 |
| | 16 |
| | 127 |
| | (111 | ) |
| Other | | 378 |
| | 1,044 |
| | — |
| | 510 |
| | 71 |
| | — |
| | 71 |
|
| Total | | 11,345 |
| | 14,722 |
| | — |
| | 13,371 |
| | 838 |
| | 614 |
| | 224 |
|
| With impairment reserve recorded: | | | | | | | | | | | | | | |
| Commercial real estate: | | | | | | | | | | | | | | |
| Owner occupied | | 499 |
| | 499 |
| | 70 |
| | 111 |
| | 28 |
| | — |
| | 28 |
|
| Non-owner occupied | | — |
| | — |
| | — |
| | — |
| | — |
| | — |
| | — |
|
| Land development | | — |
| | — |
| — |
| — |
| — |
| — |
| — |
| — |
| — |
| — |
| | — |
|
| Construction | | 2,482 |
| | 2,482 |
| — |
| 1,790 |
| — |
| 834 |
| — |
| 45 |
| — |
| — |
| | 45 |
|
| Multi-family | | — |
| | — |
| | — |
| | — |
| | — |
| | — |
| | — |
|
| 1-4 family | | 193 |
| | 199 |
| | 39 |
| | 203 |
| | 5 |
| | — |
| | 5 |
|
| Commercial and industrial | | 11,166 |
| | 11,166 |
| | 3,700 |
| | 8,448 |
| | 701 |
| | — |
| | 701 |
|
| Direct financing leases, net | | — |
| | — |
| | — |
| | — |
| | — |
| | — |
| | — |
|
| Consumer and other: | | | | | | | | | | | | | | |
| Home equity and second mortgages | | — |
| | — |
| | — |
| | — |
| | — |
| | — |
| | — |
|
| Other | | 226 |
| | 226 |
| | — |
| | 19 |
| | — |
| | — |
| | — |
|
| Total | | 14,566 |
| | 14,572 |
| | 5,599 |
| | 9,615 |
| | 779 |
| | — |
| | 779 |
|
| Total: | | | | | | | | | | | | | | |
| Commercial real estate: | | | | | | | | | | | | | | |
| Owner occupied | | 2,287 |
| | 2,287 |
| | 70 |
| | 3,688 |
| | 356 |
| | 118 |
| | 238 |
|
| Non-owner occupied | | 1,609 |
| | 1,647 |
| | — |
| | 1,318 |
| | 91 |
| | 79 |
| | 12 |
|
| Land development | | 3,440 |
| | 6,111 |
| | — |
| | 3,898 |
| | 107 |
| | — |
| | 107 |
|
| Construction | | 2,918 |
| | 2,920 |
| | 1,790 |
| | 1,125 |
| | 65 |
| | — |
| | 65 |
|
| Multi-family | | — |
| | — |
| | — |
| | — |
| | 1 |
| | 134 |
| | (133 | ) |
| 1-4 family | | 2,572 |
| | 2,578 |
| | 39 |
| | 2,958 |
| | 130 |
| | 94 |
| | 36 |
|
| Commercial and industrial | | 12,473 |
| | 12,473 |
| | 3,700 |
| | 9,157 |
| | 780 |
| | 62 |
| | 718 |
|
| Direct financing leases, net | | — |
| | — |
| | — |
| | 6 |
| | — |
| | — |
| | — |
|
| Consumer and other: | | | | | | | | | | | | | | |
| Home equity and second mortgages | | 8 |
| | 8 |
| | — |
| | 307 |
| | 16 |
| | 127 |
| | (111 | ) |
| Other | | 604 |
| | 1,270 |
| | — |
| | 529 |
| | 71 |
| | — |
| | 71 |
|
| Grand total | | $ | 25,911 |
| | $ | 29,294 |
| | $ | 5,599 |
| | $ | 22,986 |
| | $ | 1,617 |
| | $ | 614 |
| | $ | 1,003 |
|
| |
(1) | Average recorded investment is calculated primarily using daily average balances. |
| | | | | | | | | | | | | | | | | | | | | | | | | | | | | | | | | | | | | | | | | | | | |
| | As of and for the Year Ended December 31, 2021 |
| | Recorded Investment(1) | | Unpaid
Principal
Balance | | Individual
Reserve | | Average Recorded Investment(2) | | Foregone
Interest
Income | | Interest
Income
Recognized | | Net Foregone
Interest
Income |
| | | (In Thousands) |
| With no individual reserve recorded: | | | | | | | | | | | | | | |
| Commercial real estate: | | | | | | | | | | | | | | |
| Owner occupied | | $ | 348 | | | $ | 386 | | | $ | — | | | $ | 2,217 | | | $ | 145 | | | $ | 218 | | | $ | (73) | |
| Non-owner occupied | | — | | | — | | | — | | | 2,281 | | | 233 | | | 16 | | | 217 | |
| Construction | | — | | | — | | | — | | | 7 | | | — | | | — | | | — | |
| Multi-family | | — | | | — | | | — | | | — | | | — | | | — | | | — | |
| 1-4 family | | 339 | | | 344 | | | — | | | 285 | | | 60 | | | 24 | | | 36 | |
| Commercial and industrial | | 3,732 | | | 3,834 | | | — | | | 7,916 | | | 523 | | | 179 | | | 344 | |
| Consumer and other | | — | | | — | | | — | | | 48 | | | 30 | | | 9 | | | 21 | |
| Total | | 4,419 | | | 4,564 | | | — | | | 12,754 | | | 991 | | | 446 | | | 545 | |
| With individual reserve recorded: | | | | | | | | | | | | | | |
| Commercial real estate: | | | | | | | | | | | | | | |
| Owner occupied | | — | | | — | | | — | | | — | | | — | | | — | | | — | |
| Non-owner occupied | | — | | | — | | | — | | | — | | | — | | | — | | | — | |
| Construction | | — | | | — | | | — | | | — | | | — | | | — | | | — | |
| Multi-family | | — | | | — | | | — | | | — | | | — | | | — | | | — | |
| 1-4 family | | — | | | — | | | — | | | — | | | — | | | — | | | — | |
| Commercial and industrial | | 2,156 | | | 2,156 | | | 1,505 | | | 1,506 | | | 113 | | | 8 | | | 105 | |
| Consumer and other | | — | | | — | | | — | | | — | | | — | | | — | | | — | |
| Total | | 2,156 | | | 2,156 | | | 1,505 | | | 1,506 | | | 113 | | | 8 | | | 105 | |
| Total: | | | | | | | | | | | | | | |
| Commercial real estate: | | | | | | | | | | | | | | |
| Owner occupied | | 348 | | | 386 | | | — | | | 2,217 | | | 145 | | | 218 | | | (73) | |
| Non-owner occupied | | — | | | — | | | — | | | 2,281 | | | 233 | | | 16 | | | 217 | |
| Construction | | — | | | — | | | — | | | 7 | | | — | | | — | | | — | |
| Multi-family | | — | | | — | | | — | | | — | | | — | | | — | | | — | |
| 1-4 family | | 339 | | | 344 | | | — | | | 285 | | | 60 | | | 24 | | | 36 | |
| Commercial and industrial | | 5,888 | | | 5,990 | | | 1,505 | | | 9,422 | | | 636 | | | 187 | | | 449 | |
| Consumer and other | | — | | | — | | | — | | | 48 | | | 30 | | | 9 | | | 21 | |
| Grand total | | $ | 6,575 | | | $ | 6,720 | | | $ | 1,505 | | | $ | 14,260 | | | $ | 1,104 | | | $ | 454 | | | $ | 650 | |
(1)The recorded investment represents the unpaid principal balance net of any partial charge-offs. |
| | | | | | | | | | | | | | | | | | | | | | | | | | | | |
| | | As of and for the Year Ended December 31, 2015 |
| | | Recorded Investment | | Unpaid Principal Balance | | Impairment Reserve | | Average Recorded Investment(1) | | Foregone Interest Income | | Interest Income Recognized | | Net Foregone Interest Income |
| | | (In Thousands) |
| With no impairment reserve recorded: | | | | | | | | | | | | | | |
| Commercial real estate: | | | | | | | | | | | | | | |
| Owner occupied | | $ | 2,164 |
| �� | $ | 2,164 |
| | $ | — |
| | $ | 712 |
| | $ | 53 |
| | $ | 12 |
| | $ | 41 |
|
| Non-owner occupied | | 2,314 |
| | 2,355 |
| | — |
| | 962 |
| | 25 |
| | — |
| | 25 |
|
| Land development | | 4,413 |
| | 7,083 |
| | — |
| | 4,333 |
| | 133 |
| | — |
| | 133 |
|
| Construction | | 120 |
| | 120 |
| | — |
| | 474 |
| | — |
| | — |
| | — |
|
| Multi-family | | 2 |
| | 369 |
| | — |
| | 10 |
| | 27 |
| | — |
| | 27 |
|
| 1-4 family | | 2,423 |
| | 2,486 |
| | — |
| | 1,604 |
| | 82 |
| | 4 |
| | 78 |
|
| Commercial and industrial | | 2,546 |
| | 2,590 |
| | — |
| | 544 |
| | 172 |
| | 6 |
| | 166 |
|
| Direct financing leases, net | | 38 |
| | 38 |
| | — |
| | 4 |
| | — |
| | — |
| | — |
|
| Consumer and other: | | | | | | | | | | | | | | |
| Home equity and second mortgages | | 500 |
| | 500 |
| | — |
| | 390 |
| | 23 |
| | 63 |
| | (40 | ) |
| Other | | 655 |
| | 1,321 |
| | — |
| | 688 |
| | 82 |
| | — |
| | 82 |
|
| Total | | 15,175 |
| | 19,026 |
| | — |
| | 9,721 |
| | 597 |
| | 85 |
| | 512 |
|
| With impairment reserve recorded: | | | | | | | | | | | | | | |
| Commercial real estate: | | | | | | | | | | | | | | |
| Owner occupied | | 814 |
| | 814 |
| | 20 |
| | 215 |
| | 7 |
| | 2 |
| | 5 |
|
| Non-owner occupied | | — |
| | — |
| | — |
| | — |
| | — |
| | — |
| | — |
|
| Land development | | — |
| | — |
| | — |
| | — |
| | — |
| | — |
| | — |
|
| Construction | | 397 |
| | 397 |
| | 48 |
| | 34 |
| | — |
| | — |
| | — |
|
| Multi-family | | — |
| | — |
| | — |
| | — |
| | — |
| | — |
| | — |
|
| 1-4 family | | 945 |
| | 950 |
| | 173 |
| | 605 |
| | 34 |
| | — |
| | 34 |
|
| Commercial and industrial | | 6,603 |
| | 6,603 |
| | 847 |
| | 810 |
| | 102 |
| | — |
| | 102 |
|
| Direct financing leases, net | | — |
| | — |
| | — |
| | — |
| | — |
| | — |
| | — |
|
| Consumer and other: | | | | | | | | | | | | | | |
| Home equity and second mortgages | | 99 |
| | 99 |
| | 25 |
| | 58 |
| | 10 |
| | — |
| | 10 |
|
| Other | | — |
| | — |
| | — |
| | — |
| | — |
| | — |
| | — |
|
| Total | | 8,858 |
| | 8,863 |
| | 1,113 |
| | 1,722 |
| | 153 |
| | 2 |
| | 151 |
|
| Total: | | | | | | | | | | | | | | |
| Commercial real estate: | | | | | | | | | | | | | | |
| Owner occupied | | 2,978 |
| | 2,978 |
| | 20 |
| | 927 |
| | 60 |
| | 14 |
| | 46 |
|
| Non-owner occupied | | 2,314 |
| | 2,355 |
| | — |
| | 962 |
| | 25 |
| | — |
| | 25 |
|
| Land development | | 4,413 |
| | 7,083 |
| | — |
| | 4,333 |
| | 133 |
| | — |
| | 133 |
|
| Construction | | 517 |
| | 517 |
| | 48 |
| | 508 |
| | — |
| | — |
| | — |
|
| Multi-family | | 2 |
| | 369 |
| | — |
| | 10 |
| | 27 |
| | — |
| | 27 |
|
| 1-4 family | | 3,368 |
| | 3,436 |
| | 173 |
| | 2,209 |
| | 116 |
| | 4 |
| | 112 |
|
| Commercial and industrial | | 9,149 |
| | 9,193 |
| | 847 |
| | 1,354 |
| | 274 |
| | 6 |
| | 268 |
|
| Direct financing leases, net | | 38 |
| | 38 |
| | — |
| | 4 |
| | — |
| | — |
| | — |
|
| Consumer and other: | | | | | | | | | | | | | | |
| Home equity and second mortgages | | 599 |
| | 599 |
| | 25 |
| | 448 |
| | 33 |
| | 63 |
| | (30 | ) |
| Other | | 655 |
| | 1,321 |
| | — |
| | 688 |
| | 82 |
| | — |
| | 82 |
|
| Grand total | | $ | 24,033 |
| | $ | 27,889 |
| | $ | 1,113 |
| | $ | 11,443 |
| | $ | 750 |
| | $ | 87 |
| | $ | 663 |
|
| |
(1) | Average recorded investment is calculated primarily using daily average balances. |
The difference between the recorded investment of loans and leases and the unpaid principal balance of $6.6 million, $3.4 million$15,000 and $3.9 million$26,000 as of December 31, 2017, 20162023 and 2015,2022, respectively, represents partial charge-offs of loans and leases resulting from losses due to the appraised value of the collateral securing the loans and leases being below the carrying values of the loans and leases. Impaired loans and leases also included $332,000, $717,000 and $1.7 million of loans as of December 31, 2017, 2016 and 2015, respectively, that were performing troubled debt restructurings, and although not on non-
accrual, were reported as impaired due to the concession in terms. When a loan is placed on non-accrual, interest accrual is discontinued and previously accrued but uncollected interest is deducted from interest income. Cash payments collected on non-accrual loans are first applied to such loan’s principal. Foregone interest represents the interest that was contractually due on the loan but not received or recorded. No principal has been forgiven on modified loans during the years ended December 31, 2023 and 2022. To the extent the amount of principal on a non-accrual loan is fully collected and additional cash is received, the Corporation will recognize interest income.
To determine the level and compositionAllowance for Credit Losses
The ACL is an estimate of the allowance for loan and leaseexpected credit losses the Corporation categorizes the portfolio into segmentson financial assets measured at amortized cost, which is measured using relevant information about past events, including historical credit loss experience on financial assets with similar risk characteristics. First,characteristics, current conditions, and reasonable and supportable forecasts that affect the collectability of the remaining cash flows over the contractual term of the financial assets.
During the first quarter of 2023, the Corporation evaluates loansadopted ASU 2016-13, including the CECL methodology for estimating the ACL. This standard was adopted using a modified retrospective approach on January 1, 2023, resulting in a $484,000 increase to the ACL and leases for potential impairment classification. The Corporation analyzes each loana $1.3 million increase to the unfunded credit commitments reserve. A cumulative effect adjustment resulting in
an $1.4 million decrease to retained earnings and lease determineda $465,000 increase to be impaired on an individual basis to determine a specific reserve based upon the estimated valuedeferred tax assets was also recorded as of the underlying collateraladoption of ASU 2016-13.
Quantitative Considerations
The ACL is primarily calculated utilizing a discounted cash flow (“DCF”) model. Key inputs and assumptions used in this model are discussed below:
•Forecast model - For each portfolio segment, a loss driver analysis (“LDA”) was performed in order to identify appropriate loss drivers and create a regression model for collateral-dependent loans, or alternatively, the present value of expecteduse in forecasting cash flows. The LDA analysis utilized peer FFIEC Call Report data for all pools. The Corporation applies historical trends from established risk factorsplans to each categoryupdate the LDA annually.
•Probability of loans and leasesdefault – PD is the probability that an asset will be in default within a given time frame. The Corporation has not been individually evaluated fordefined default as when a charge-off has occurred, a loan goes to non-accrual status, or a loan is greater than 90 days past due. The forecast model is utilized to estimate PDs.
•Loss given default – LGD is the purpose of establishing the general portionpercentage of the allowance.asset not expected to be collected due to default. The LGD is derived from using a method referred to as Frye Jacobs which uses industry data.
•Prepayments and curtailments – Prepayments and curtailments are calculated based on the Corporation’s own data. This analysis is updated annually.
•Forecast and reversion – the Corporation has established a one-year reasonable and supportable forecast period with a one-year straight line reversion to the long-term historical average.
•Economic forecast – the Corporation utilizes a third party to provide economic forecasts under various scenarios, which are assessed against economic indicators and management’s observations in the market. As of December 31, 2023, the Corporation selected a forecast which forecasts unemployment between 3.89% and 4.04% and GDP growth change between 1.29% and 2.32% over the next four quarters. Following the forecast period, the model reverts to long-term averages over four quarters. Management believes that the resulting quantitative reserve appropriately balances economic indicators with identified risks.
Qualitative Considerations
In addition to the quantitative model, management considers the need for qualitative adjustment for risks not considered in the DCF. Factors that are considered by management in determining loan collectability and the appropriate level of the ACL are listed below:
•The Corporation’s lending policies and procedures, including changes in lending strategies, underwriting standards and practices for collections, write-offs, and recoveries;
•Actual and expected changes in international, national, regional, and local economic and business conditions and developments in which the Corporation operates that affect the collectability of financial assets;
•The experience, ability, and depth of the Corporation’s lending, investment, collection, and other relevant management and staff;
•The volume of past due financial assets, the volume of non-performing assets, and the volume and severity of adversely classified or graded assets;
•The existence and effect of industry concentrations of credit;
•The nature and volume of the portfolio segment or class;
•The quality of the Corporation’s credit review function;
•The effect of other external factors such as the regulatory, legal and technological environments, competition, and events such as natural disasters or pandemics.
ACL Activity
A summary of the activity in the allowance for loan and leasecredit losses by portfolio segment is as follows:
| | | | | | | | | | | | | As of and for the Year Ended December 31, 2023 |
| | | As of and for the Year Ended December 31, 2017 |
| | | Commercial Real Estate | | Commercial and Industrial | | Consumer and Other | | Total |
| | Owner Occupied | | | | Owner Occupied | | Non-Owner Occupied | | Construction | | Multi-Family | | 1-4 Family | | Commercial
and
Industrial | | Consumer
and Other | | Total |
| | | (Dollars in Thousands) | | | (In Thousands) |
| Beginning balance | | $ | 12,384 |
| | $ | 7,970 |
| | $ | 558 |
| | $ | 20,912 |
|
| Impact of adopting ASC 326 | |
| Charge-offs | | (127 | ) | | (8,621 | ) | | (92 | ) | | (8,840 | ) |
| Recoveries | | 153 |
| | 323 |
| | 43 |
| | 519 |
|
| Net recoveries (charge-offs) | | 26 |
| | (8,298 | ) | | (49 | ) | | (8,321 | ) |
| Provision for credit losses | | (2,279 | ) | | 8,553 |
| | (102 | ) | | 6,172 |
|
| Ending balance | | $ | 10,131 |
| | $ | 8,225 |
| | $ | 407 |
| | $ | 18,763 |
|
| Components: | |
| Allowance for loan losses | |
| Allowance for loan losses | |
| Allowance for loan losses | |
| Allowance for unfunded credit commitments | |
| Total ACL | |
| | | | | | | | | | | | | As of and for the Year Ended December 31, 2022 |
| | | As of and for the Year Ended December 31, 2016 |
| | | Commercial Real Estate | | Commercial and Industrial | | Consumer and Other | | Total |
| | Commercial
Real Estate | | | | Commercial
Real Estate | | Commercial
and
Industrial | | Consumer
and Other | | Total |
| | | (Dollars in Thousands) | | | (In Thousands) |
| Beginning balance | | $ | 11,220 |
| | $ | 4,387 |
| | $ | 709 |
| | $ | 16,316 |
|
| Charge-offs | | (1,194 | ) | | (2,273 | ) | | (127 | ) | | (3,594 | ) |
| Recoveries | | 274 |
| | 91 |
| | 7 |
| | 372 |
|
| Net charge-offs | | (920 | ) | | (2,182 | ) | | (120 | ) | | (3,222 | ) |
| Net recoveries (charge-offs) | |
| Provision for credit losses | | 2,084 |
| | 5,765 |
| | (31 | ) | | 7,818 |
|
| | Ending balance | | $ | 12,384 |
| | $ | 7,970 |
| | $ | 558 |
| | $ | 20,912 |
|
| Ending balance | |
| Ending balance | |
| | | | | | | | | | | | | | | | | | | | | | | | | | |
| | | As of and for the Year Ended December 31, 2021 |
| | Commercial
Real Estate | | Commercial
and
Industrial | | Consumer
and Other | | Total |
| | | (In Thousands) |
| Beginning balance | | $ | 17,157 | | | $ | 10,593 | | | $ | 771 | | | $ | 28,521 | |
| Charge-offs | | (256) | | | (3,227) | | | (25) | | | (3,508) | |
| Recoveries | | 3,935 | | | 1,168 | | | 23 | | | 5,126 | |
| Net recoveries (charge-offs) | | 3,679 | | | (2,059) | | | (2) | | | 1,618 | |
| Provision for credit losses | | (5,726) | | | (121) | | | 44 | | | (5,803) | |
| | | | | | | | |
| Ending balance | | $ | 15,110 | | | $ | 8,413 | | | $ | 813 | | | $ | 24,336 | |
|
| | | | | | | | | | | | | | | | |
| | | As of and for the Year Ended December 31, 2015 |
| | | Commercial Real Estate | | Commercial and Industrial | | Consumer and Other | | Total |
| | | (Dollars in Thousands) |
| Beginning balance | | $ | 8,619 |
| | $ | 5,492 |
| | $ | 218 |
| | $ | 14,329 |
|
| Charge-offs | | (793 | ) | | (711 | ) | | (9 | ) | | (1,513 | ) |
| Recoveries | | 104 |
| | 6 |
| | 4 |
| | 114 |
|
| Net charge-offs | | (689 | ) | | (705 | ) | | (5 | ) | | (1,399 | ) |
| Provision for credit losses | | 3,290 |
| | (400 | ) | | 496 |
| | 3,386 |
|
| Ending balance | | $ | 11,220 |
| | $ | 4,387 |
| | $ | 709 |
| | $ | 16,316 |
|
The following tables provide information regarding the allowance for loan and leasecredit losses and balances by type of allowance methodology.methodology:
| | | | | | | | | | | | | | | | | | | | | | | | | | | | | | | | | | | | | | | | | | | | | | | | | | |
| | | December 31, 2023 |
| | Owner Occupied | | Non-Owner Occupied | | Construction | | Multi-Family | | 1-4 Family | | Commercial
and
Industrial | | Consumer
and Other | | Total |
| | | (In Thousands) |
| Allowance for credit losses: | | | | | | | | | | | | | | | | |
| Collectively evaluated for credit losses | | $ | 1,525 | | | $ | 5,596 | | | $ | 1,244 | | | $ | 3,562 | | | $ | 221 | | | $ | 12,743 | | | $ | 395 | | | $ | 25,286 | |
| Individually evaluated for credit loss | | — | | | — | | | — | | | — | | | 22 | | | 5,967 | | | — | | | 5,989 | |
| Total | | $ | 1,525 | | | $ | 5,596 | | | $ | 1,244 | | | $ | 3,562 | | | $ | 243 | | | $ | 18,710 | | | $ | 395 | | | $ | 31,275 | |
| Loans and lease receivables: | | | | | | | | | | | | | | | | |
| Collectively evaluated for credit losses | | $ | 256,479 | | | $ | 773,494 | | | $ | 193,080 | | | $ | 450,529 | | | $ | 26,267 | | | $ | 1,085,260 | | | $ | 44,312 | | | $ | 2,829,421 | |
| Individually evaluated for credit loss | | — | | | — | | | — | | | — | | | 22 | | | 20,575 | | | — | | | 20,597 | |
| Total | | $ | 256,479 | | | $ | 773,494 | | | $ | 193,080 | | | $ | 450,529 | | | $ | 26,289 | | | $ | 1,105,835 | | | $ | 44,312 | | | $ | 2,850,018 | |
| | | | | | | | | | | | | | | | | | | | | | | | | | |
| | | December 31, 2022 |
| | Commercial
Real Estate | | Commercial
and
Industrial | | Consumer
and Other | | Total |
| | | (In Thousands) |
| Allowance for credit losses: | | | | | | | | |
| Collectively evaluated for credit losses | | $ | 12,560 | | | $ | 9,478 | | | $ | 542 | | | $ | 22,580 | |
| Individually evaluated for credit loss | | — | | | 1,650 | | | — | | | 1,650 | |
| | | | | | | | |
| Total | | $ | 12,560 | | | $ | 11,128 | | | $ | 542 | | | $ | 24,230 | |
| Loans and lease receivables: | | | | | | | | |
| Collectively evaluated for credit losses | | $ | 1,541,920 | | | $ | 849,542 | | | $ | 47,938 | | | $ | 2,439,400 | |
| Individually evaluated for credit loss | | 30 | | | 3,785 | | | — | | | 3,815 | |
| | | | | | | | |
| Total | | $ | 1,541,950 | | | $ | 853,327 | | | $ | 47,938 | | | $ | 2,443,215 | |
|
| | | | | | | | | | | | | | | | |
| | | As of December 31, 2017 |
| | | Commercial Real Estate | | Commercial and Industrial | | Consumer and Other | | Total |
| | | (Dollars in Thousands) |
| Allowance for loan and lease losses: | | | | | | | | |
| Collectively evaluated for impairment | | $ | 9,716 |
| | $ | 4,158 |
| | $ | 398 |
| | $ | 14,272 |
|
| Individually evaluated for impairment | | 415 |
| | 4,067 |
| | 9 |
| | 4,491 |
|
| Loans acquired with deteriorated credit quality | | — |
| | — |
| | — |
| | — |
|
| Total | | $ | 10,131 |
| | $ | 8,225 |
| | $ | 407 |
| | $ | 18,763 |
|
| Loans and lease receivables: | | | | | | | | |
| Collectively evaluated for impairment | | $ | 1,003,855 |
| | $ | 447,459 |
| | $ | 25,003 |
| | 1,476,317 |
|
| Individually evaluated for impairment | | 13,506 |
| | 12,324 |
| | 358 |
| | 26,188 |
|
| Loans acquired with deteriorated credit quality | | 527 |
| | 6 |
| | — |
| | 533 |
|
| Total | | $ | 1,017,888 |
| | $ | 459,789 |
| | $ | 25,361 |
| | $ | 1,503,038 |
|
|
| | | | | | | | | | | | | | | | |
| | | As of December 31, 2016 |
| | | Commercial Real Estate | | Commercial and Industrial | | Consumer and Other | | Total |
| | | (Dollars in Thousands) |
| Allowance for loan and lease losses: | | | | | | | | |
| Collectively evaluated for impairment | | $ | 10,485 |
| | $ | 4,270 |
| | $ | 558 |
| | $ | 15,313 |
|
| Individually evaluated for impairment | | 1,899 |
| | 3,700 |
| | — |
| | 5,599 |
|
| Loans acquired with deteriorated credit quality | | — |
| | — |
| | — |
| | — |
|
| Total | | $ | 12,384 |
| | $ | 7,970 |
| | $ | 558 |
| | $ | 20,912 |
|
| Loans and lease receivables: | | | | | | | | |
| Collectively evaluated for impairment | | $ | 933,048 |
| | $ | 468,776 |
| | $ | 24,129 |
| | $ | 1,425,953 |
|
| Individually evaluated for impairment | | 11,222 |
| | 12,452 |
| | 612 |
| | 24,286 |
|
| Loans acquired with deteriorated credit quality | | 1,604 |
| | 21 |
| | — |
| | 1,625 |
|
| Total | | $ | 945,874 |
| | $ | 481,249 |
| | $ | 24,741 |
| | $ | 1,451,864 |
|
The Corporation’s net investment in direct financing leases consists of the following:
|
| | | | | | | | |
| | | As of December 31, |
| | | 2017 | | 2016 |
| | | (In Thousands) |
| Minimum lease payments receivable | | $ | 24,898 |
| | $ | 26,096 |
|
| Estimated unguaranteed residual values in leased property | | 8,312 |
| | 7,625 |
|
| Initial direct costs | | 76 |
| | 106 |
|
| Unearned lease and residual income | | (2,499 | ) | | (2,876 | ) |
| Investment in commercial direct financing leases | | $ | 30,787 |
| | $ | 30,951 |
|
There were no impairments of residual value of leased property during the years ended December 31, 2017, 2016 and 2015.
The Corporation leases equipment under direct financing leases expiring in future years. Some of these leases provide for additional rents based on use in excess of a stipulated minimum number of hours and generally allow the lessees to purchase the equipment for fair value at the end of the lease term.
Future aggregate maturities of minimum lease payments to be received are as follows:
|
| | | | |
| (In Thousands) | | |
| Maturities during year ended December 31, | | |
| 2018 | | $ | 8,866 |
|
| 2019 | | 6,635 |
|
| 2020 | | 4,632 |
|
| 2021 | | 2,301 |
|
| 2022 | | 1,393 |
|
| Thereafter | | 1,071 |
|
| | | $ | 24,898 |
|
Note 5 – Premises and Equipment
A summary of premises and equipment at December 31, 2017 and 2016 iswas as follows:
| | | | | | | | | | | | | | |
| | | As of December 31, |
| | | 2023 | | 2022 |
| | | (In Thousands) |
| | | | |
| Leasehold improvements | | $ | 5,557 | | | $ | 4,525 | |
| Furniture and equipment | | 9,361 | | | 8,250 | |
| Total premises and equipment | | 14,918 | | | 12,775 | |
| Less: accumulated depreciation | | (8,728) | | | (8,435) | |
| Total premises and equipment, net | | $ | 6,190 | | | $ | 4,340 | |
|
| | | | | | | | |
| | | As of December 31, |
| | | 2017 | | 2016 |
| | | (In Thousands) |
| Land | | $ | — |
| | $ | 650 |
|
| Building and leasehold improvements | | 2,550 |
| | 3,019 |
|
| Furniture and equipment | | 6,442 |
| | 5,366 |
|
| | | 8,992 |
| | 9,035 |
|
| Less: accumulated depreciation | | (5,836 | ) | | (5,263 | ) |
| Total premises and equipment, net | | $ | 3,156 |
| | $ | 3,772 |
|
Depreciation expense was $744,000, $767,000$961,000, $578,000, and $746,000$585,000 for the years ended December 31, 2017, 20162023, 2022, and 2015,2021, respectively. During 2023, the Corporation relocated its Kansas City metropolitan office. This resulted in additional leasehold improvements and equipment of $1.3 million and $606,000, respectively.
Note 6 – Leases
The Corporation leases various office spaces and specialized lending production offices under non-cancellable operating leases which expire on various dates through 2033. The Corporation also leases office equipment. The Corporation recognizes a right-of-use asset and an operating lease liability for all leases, with the exception of short-term leases. Right-of-use assets represent the right to use an underlying asset for the lease term and lease liabilities are recognized at the lease commencement date based on the estimated present value of lease payments over the lease term. Lease expense for operating leases and short-term leases is recognized on a straight-line basis over the lease term.
In June 2023, the Corporation relocated its Kansas City metropolitan area office. This resulted in a $2.6 million right-of-use asset and $3.7 million lease liability, which was recorded in October 2022. The Corporation received a $1.1 million tenant improvement allowance related to this lease, which was recognized as a lease incentive and deducted from the right-of-use asset.
The components of total lease expense were as follows:
| | | | | | | | | | | | | | | | | | | | |
| | For the Year Ended December 31, |
| | 2023 | | 2022 | | 2021 |
| | (In Thousands) |
| Operating lease cost | | $ | 1,411 | | | $ | 1,544 | | | $ | 1,513 | |
| Short-term lease cost | | 200 | | | 148 | | | 158 | |
| Variable lease cost | | 576 | | | 604 | | | 492 | |
| Less: sublease income | | (75) | | | (179) | | | (170) | |
| Total lease cost, net | | $ | 2,112 | | | $ | 2,117 | | | $ | 1,993 | |
Quantitative information regarding the Corporation’s operating leases was as follows:
| | | | | | | | | | | | | | | | | | | | |
| | December 31, 2023 | | December 31, 2022 | | December 31, 2021 |
| Weighted-average remaining lease term (in years) | | 7.70 | | 8.06 | | 5.05 |
| Weighted-average discount rate | | 3.61 | % | | 3.40 | % | | 2.51 | % |
The following maturity analysis shows the undiscounted cash flows due on the Corporation’s operating lease liabilities:
| | | | | |
| (In Thousands) | |
| 2024 | $ | 1,514 | |
| 2025 | 1,408 | |
| 2026 | 1,400 | |
| 2027 | 1,427 | |
| 2028 | 1,113 | |
| Thereafter | 3,600 | |
| Total undiscounted cash flows | 10,462 | |
| Discount on cash flows | (1,508) | |
| Total lease liability | $ | 8,954 | |
Note 67 – Goodwill and Other Intangible Assets
Goodwill
Goodwill is not amortized, but is subject to impairment tests on an annual basis and more frequently if an event occurs or circumstances change that would more likely than not reduce the fair value of a reporting unit below its carrying amount (including
(including goodwill). At December 31, 20172023 and 2016,2022, the Corporation had goodwill of $10.7 million, which was related to the acquisition of Alterra Bank in 2014.
The Corporation conducted its annual impairment test on July 1, 2017,2023, utilizing a qualitative assessment, and concluded that it was more likely than not that FBB-KC’sthe estimated fair value exceeded its carrying value. Due to management’s decision to temporarily slow SBA production while investments to enhance the platform were made and the slower than expected ramp up of production during the fourth quarter, management elected to again assess goodwill on November 30, 2017 by comparing the fair value of FBB-KC to its carrying value. The fair value of the reporting unit was determined based on a weighted average of the income and market approaches. The income approach establishes fairexceeded its carrying value, based on estimated future cash flows of the reporting unit, discounted by an estimated weighted-average cost of capital developed using the capital asset pricing model, which reflects the overall level of inherent risk of the reporting unit. The income approach uses our projections of financial performance for a four-year period and includes assumptions about future revenue growth rates, operating margins and terminal values. The market approach establishes fair value by applying cash flow multiples to the respective reporting unit’s operating performance. The multiples are derived from other publicly traded companies that are similar but not identical from an operational and economic standpoint.
Based on this assessment, there wasresulting in no evidence of goodwill impairment as of November 30, 2017. Management also assessed external and internal qualitative factors through December 31, 2017 and determined no changes to factors occurred that would negatively impact the goodwill test. impairment.
Other Intangible Assets
The Corporation has intangible assets that are amortized consisting of loan servicing rights and core deposit intangibles.rights.
Loan servicing rights are recognized upon sale of the guaranteed portions of SBA loans with servicing rights retained. When SBA loans are sold, servicing rights are initially recorded at fair value with the income statement effect recorded in gains on sales of loans. Loan servicing assets are subsequently measured using the amortization method, which requires servicing rights to be amortized into interest income in proportion to, and over the period of, the estimated future net servicing income of the underlying loans. For the years ended December 31, 2017, 20162023, 2022, and 2015,2021, loan servicing asset amortization totaled $388,000, $639,000$500,000, $634,000, and $197,000,$412,000, respectively.
The estimated fair value of the Corporation’s loan servicing asset was $1.8$1.4 million and $1.9$1.5 million as of December 31, 20172023 and 2016,2022, respectively. The Corporation periodically reviews this portfolio for impairment and engages a third-party valuation firm to assess the fair value of the overall servicing rights portfolio.
The core deposit intangible has a finite life and is amortized by the straight-line method over a period of seven years. The net book value of the core deposit intangible was $147,000 and $202,000 as of December 31, 2017 and 2016, respectively. For During the years ended December 31, 2017, 20162023 and 2015, amortization totaled $55,000, $62,0002022, the Corporation recognized $73,000 and $71,000, respectively$1,000 of impairment expense, respectively. During the year ended December 31, 2021, the Corporation recognized an impairment recovery of $63,000.
Note 78 – Other Assets
The Corporation is a limited partner in several limited partnership investments. The Corporation is not the general partner, does not have controlling ownership, and is not the primary beneficiary in any of these limited partnerships and thus, the limited partnerships have not been consolidated. These investments are accounted for using the equity and proportional amortization method of accounting and are evaluated for impairment at the end of each reporting period.
Historic Rehabilitation Tax Credits
In 2015, theThe Corporation investedinvests in a development entityentities through BOC, aMitchell Street and FBB Tax Credit, wholly-owned subsidiarysubsidiaries of FBB, to acquire, rehabilitate and operate a historic building in Madison, Wisconsin.buildings. At December 31, 20172023 and 2016,2022, the net carrying value of the investmentinvestments was $174,000. $2.4 million and $2.2 million, respectively. During 2023, the Corporation invested $285,000 in these partnerships. During 2022 and 2021, the Corporation had no activity related to these investments.
Low-Income Housing Tax Credits
The Corporation contributed an additional $2.8 million to the projectinvests in 2016. During 2016, the Corporation recognized $3.8 million in historic tax credits related to this investment and $3.3 million in impairment to the underlying investment.
In 2016, the Corporation also invested in a development entity through Mitchell Street, a wholly-owned subsidiary of FBB, to rehabilitate a historic building in Milwaukee, Wisconsin. At December 31, 2017 and 2016, the net carrying value of the investment was $570,000 and $563,000, respectively. The Corporation contributed an additional $4.9 million to the project in 2017. During 2017, the Corporation recognized $3.0 million in federal historic tax credits related to this investment and $2.3 million in impairment to the underlying investment. The Corporation also sold the state historic tax credits associated with the investment to a third parted for a pre-tax gain of $210,000.
In 2017, the Corporation also invested in a development entityentities through FBB Tax Credit, a wholly-owned subsidiary of FBB, to rehabilitate a historic building in Kenosha, Wisconsin.develop buildings that offer low-income housing. These investments are accounted for using the proportional amortization method of accounting. At December 31, 2017,2023 and 2022, the net carrying value of the investment was $417,000. The aggregate capital contributionsinvestments were $33.3 million and $13.5 million, respectively. During 2023, 2022, and 2021, the Corporation invested $24.0 million, $11.5 million, and $3.0 million in these partnerships, respectively. During 2023 and 2022, the Corporation recognized $5.3 million and $1.4 million in tax benefit, respectively, and $4.1 million and $1.0 million in amortization, respectively, related to these partnerships. Amortization is included in income tax expense in the project will depend uponaccompanying Consolidated Statements of Income. During 2021, the final amount of the certified project costs, but are expectedCorporation did not recognize any tax benefit or amortization related to approximate $2.1 million. The credits will be taken when the project is placed in service and are subject to a five-year recapture period.these partnerships.
New Market Tax CreditsOther Investments
The Corporation investedCorporation’s equity investment in a community development entity (“CDE”) through Rimrock Road, a wholly-owned subsidiarymezzanine funds, consisting of FBB, to developAldine Capital Fund II, LP, Aldine Capital Fund III, LP, and operate a real estate project located in a low-income community. At December 31, 2017 and 2016, Rimrock Road had one CDE investment with a net carrying value of $6.6Aldine Capital Fund IV, LP, totaled $13.5 million and $7.1 million respectively. The investment provides federal new market tax credits over the seven year compliance period through 2020. The remaining federal new market tax credit to be utilized over a maximum of seven years was $1.4$12.8 million as of December 31, 2017. The Corporation’s use of the federal new market tax credit during the year ended December 31, 20172023 and 2016 was $450,000 and $375,000,2022, respectively.
Other Investments
The Corporation has an equity investment in Aldine Capital Fund, LP, a mezzanine fund, of $904,000 and $883,000 recorded as As of December 31, 2017 and 2016, respectively. The Corporation’s equity investment in Aldine Capital Fund II, LP, also a mezzanine fund, totaled $3.42023, the Corporation has $5.3 million and $3.1remaining of the original $15.0 million as of December 31, 2017 and 2016, respectively.commitment to these partnerships. The Corporation’s share of these partnerships’ income included in other non-interest income in the Consolidated Statements of Income for the years ended December 31, 20172023, 2022, and 20162021 was $354,000$4.8 million, $3.0 million, and $790,000,$2.5 million, respectively. The Corporation’s share of these partnerships’ losses included in other non-interest expense in the Consolidated Statements of Income for the years ended December 31, 2023, 2022 and 2021 was $101,000, $0, and $24,000, respectively.
The Corporation is the sole owner of $315,000 of common securities issued by Trust II. The purpose of Trust II was to complete the sale of $10.0 million of 10.50% fixed rate preferred securities. Trust II, a wholly owned subsidiary of the Corporation, is not consolidated into the financial statements of the Corporation. TheCorporation’s equity investment in Trust II of $315,000Dane Workforce Housing Fund LLC, a Wisconsin limited liability company focused on community development by providing affordable workforce housing units in Dane County, Wisconsin, totaled $916,000 and $653,000 as of December 31, 20172023 and 2016 is2022, respectively. The Corporation had a $63,000 commitment remaining of the original $1.0 million as of December 31, 2023. The Corporation’s share of the investment fund’s income included in accrued interest receivableother non-interest income in the Consolidated Statements of Income for the years ended December 31, 2023, 2022, and 2021 was $13,000, $8,000, and $2,000, respectively. The Corporation’s share of this partnerships’ losses included in other assets.non-interest expense in the Consolidated Statements of Income for the year ended December 31, 2021 was $19,000. There were no losses related to this investment during the years ended December 31, 2023 and 2022.
The Corporation’s equity investment in BankTech Ventures, LP, a venture capital fund, focused on the community banking industry through strategic investments in growth-stage startups that directly support community banking needs, totaled $569,000 and $154,000 as of December 31, 2023 and 2022, respectively. The Corporation had a $530,000 commitment remaining of the original $1.0 million as of December 31, 2023. The Corporation’s share of the investment fund’s income included in other non-interest income in the Consolidated Statements of Income for the year ended December 31, 2023 was $211,000. There was no income related to this investment during the years ended December 31, 2022 and 2021. The Corporation’s share of this partnerships’ losses included in other non-interest expense in the Consolidated Statements of Income for the years ended December 31, 2023 and 2022 was $2,000 and $21,000, respectively. There were no losses related to this investment during the year ended December 31, 2021.
A summary of accrued interest receivable and other assets as of December 31, 2017 and 2016 was as follows:
| | | | | | | | | | | | | | |
| | | December 31, 2023 | | December 31, 2022 |
| | | (In Thousands) |
| Accrued interest receivable | | $ | 13,275 | | | $ | 9,403 | |
| Net deferred tax asset | | 9,508 | | | 11,711 | |
| Investment in historic development entities | | 2,393 | | | 2,176 | |
| Investment in low-income housing development entity | | 33,303 | | | 13,514 | |
| | | | |
| Investment in limited partnerships | | 15,027 | | | 13,599 | |
| Prepaid expenses | | 4,269 | | | 3,821 | |
| Other assets | | 13,283 | | | 8,883 | |
| Total accrued interest receivable and other assets | | $ | 91,058 | | | $ | 63,107 | |
|
| | | | | | | | |
| | | December 31, 2017 | | December 31, 2016 |
| | | (In Thousands) |
| Accrued interest receivable | | $ | 5,019 |
| | $ | 4,677 |
|
| Net deferred tax asset | | 2,584 |
| | 4,052 |
|
| Investment in historic development entities | | 1,161 |
| | 737 |
|
| Investment in a CDE | | 6,591 |
| | 7,106 |
|
| Investment in limited partnerships | | 4,261 |
| | 3,963 |
|
| Investment in Trust II | | 315 |
| | 315 |
|
| Fair value of interest rate swaps | | 942 |
| | 352 |
|
| Prepaid expenses | | 3,091 |
| | 3,074 |
|
| Other assets | | 5,884 |
| | 4,331 |
|
| Total accrued interest receivable and other assets | | $ | 29,848 |
| | $ | 28,607 |
|
Note 89 – Deposits
The composition of deposits at December 31, 2017 and 2016 is as follows:shown below.
|
| | | | | | | | | | | | | | | | | | | | | | |
| | | December 31, 2017 | | December 31, 2016 |
| | | Balance | | Average Balance | | Average Rate | | Balance | | Average Balance | | Average Rate |
| | | (Dollars in Thousands) |
| Non-interest-bearing transaction accounts | | $ | 277,445 |
| | $ | 230,907 |
| | — | % | | $ | 252,638 |
| | $ | 246,182 |
| | — | % |
| Interest-bearing transaction accounts | | 217,625 |
| | 226,540 |
| | 0.59 |
| | 183,992 |
| | 169,571 |
| | 0.27 |
|
| Money market accounts | | 515,077 |
| | 583,241 |
| | 0.47 |
| | 627,090 |
| | 642,784 |
| | 0.48 |
|
| Certificates of deposit | | 76,199 |
| | 56,667 |
| | 1.00 |
| | 58,454 |
| | 65,608 |
| | 0.90 |
|
| Wholesale deposits | | 307,985 |
| | 361,712 |
| | 1.70 |
| | 416,681 |
| | 467,826 |
| | 1.62 |
|
| Total deposits | | $ | 1,394,331 |
| | $ | 1,459,067 |
| | 0.74 |
| | $ | 1,538,855 |
| | $ | 1,591,971 |
| | 0.74 |
|
| | | | | | | | | | | | | | | | | | | | | | | | | | | | | | | | | | | | | | |
| | | December 31, 2023 | | December 31, 2022 |
| | Balance | | Average Balance | | Average Rate | | Balance | | Average Balance | | Average Rate |
| | | (Dollars in Thousands) |
| Non-interest-bearing transaction accounts | | $ | 445,376 | | | $ | 453,930 | | | — | % | | $ | 537,107 | | | $ | 566,230 | | | — | % |
| Interest-bearing transaction accounts | | 895,319 | | | 689,500 | | | 3.44 | | | 576,601 | | | 503,668 | | | 0.79 | |
| Money market accounts | | 711,245 | | | 681,336 | | | 3.25 | | | 698,505 | | | 761,469 | | | 0.82 | |
| Certificates of deposit | | 287,131 | | | 273,387 | | | 4.10 | | | 153,757 | | | 97,448 | | | 1.39 | |
| Wholesale deposits | | 457,708 | | | 346,285 | | | 4.14 | | | 202,236 | | | 48,825 | | | 3.31 | |
| Total deposits | | $ | 2,796,779 | | | $ | 2,444,438 | | | 2.92 | | | $ | 2,168,206 | | | $ | 1,977,640 | | | 0.67 | |
A summary of annual maturities of in-market and wholesale certificates of deposit outstanding and wholesale deposits at December 31, 20172023 is as follows:
| | | | | | | | |
| (In Thousands) | | |
| Maturities during the year ended December 31, | | |
| 2024 | | $ | 536,645 | |
| 2025 | | 19,081 | |
| 2026 | | 50,416 | |
| 2027 | | 73,804 | |
| 2028 | | 12,821 | |
| Thereafter | | 2,072 | |
| | $ | 694,839 | |
|
| | | | |
| (In Thousands) | | |
| Maturities during the year ended December 31, | | |
| 2018 | | $ | 171,972 |
|
| 2019 | | 74,808 |
|
| 2020 | | 86,122 |
|
| 2021 | | 21,482 |
|
| 2022 | | 4,813 |
|
| Thereafter | | 24,987 |
|
| | | $ | 384,184 |
|
Deposits include approximately $13.4 million and $8.9 million of certificatesCertificates of deposit and wholesale deposits which are denominated in amounts ofgreater than $250,000 or morewere $120.2 million and $81.6 million at December 31, 20172023 and 2016,2022, respectively.
Note 910 – FHLB Advances, Other Borrowings and Junior Subordinated Notes and Debentures
The composition of borrowed funds is shown below.
| | | | | | | | | | | | | | | | | | | | | | | | | | | | | | | | | | | | | | |
| | | December 31, 2023 | | December 31, 2022 |
| | Balance | | Weighted
Average
Balance | | Weighted
Average
Rate | | Balance | | Weighted
Average
Balance | | Weighted
Average
Rate |
| | | (Dollars in Thousands) |
| Federal funds purchased | | $ | — | | | $ | 3 | | | 5.37 | % | | $ | — | | | $ | 14 | | | 7.42 | % |
| | | | | | | | | | | | |
| FHLB advances | | 281,500 | | | 351,990 | | | 2.52 | | | 416,380 | | | 414,191 | | | 1.70 | |
| Line of credit | | — | | | 38 | | | 7.26 | | | — | | | 85 | | | 2.78 | |
| Other borrowings | | 20 | | | 600 | | | 8.33 | | | 6,088 | | | 8,624 | | | 5.23 | |
| | | | | | | | | | | | |
| Subordinated notes and debentures | | 49,396 | | | 38,250 | | | 5.16 | | | 34,340 | | | 35,095 | | | 5.06 | |
Junior subordinated notes(1) | | — | | | — | | | — | | | — | | | 2,429 | | | 20.75 | |
| | | $ | 330,916 | | | $ | 390,881 | | | 2.79 | | | $ | 456,808 | | | $ | 460,438 | | | 2.12 | |
(1) Weighted average rate of junior subordinated notes and debentures reflects the accelerated amortization of subordinated debt issuance costs as a result of the early redemption of the junior subordinated notes during the first quarter of 2022.
A summary of annual maturities of borrowings at December 31, 2017 and 20162023 is as follows:
| | | | | | | | |
| (In Thousands) | | |
| Maturities during the year ended December 31, | | |
| 2024 | | $ | 120,520 | |
| 2025 | | 48,000 | |
| 2026 | | 65,000 | |
| 2027 | | 28,000 | |
| 2028 | | — | |
| Thereafter | | 69,396 | |
| | $ | 330,916 | |
|
| | | | | | | | | | | | | | | | | | | | | | |
| | | December 31, 2017 | | December 31, 2016 |
| | | Balance | | Weighted Average Balance | | Weighted Average Rate | | Balance | | Weighted Average Balance | | Weighted Average Rate |
| | | (Dollars in Thousands) |
| Federal funds purchased | | $ | — |
| | $ | 66 |
| | 1.22 | % | | $ | — |
| | $ | 178 |
| | 0.92 | % |
| FHLB advances | | 183,500 |
| | 105,276 |
| | 1.40 |
| | 33,578 |
| | 14,485 |
| | 0.97 |
|
| Line of credit | | 10 |
| | 328 |
| | 3.64 |
| | 1,010 |
| | 2,079 |
| | 3.26 |
|
Other borrowings(1) | | 675 |
| | 1,241 |
| | 14.50 |
| | 2,590 |
| | 1,739 |
| | 7.64 |
|
| Subordinated notes payable | | 23,713 |
| | 23,161 |
| | 6.93 |
| | 22,498 |
| | 22,467 |
| | 7.13 |
|
| Junior subordinated notes | | 10,019 |
| | 10,011 |
| | 11.11 |
| | 10,004 |
| | 9,997 |
| | 11.07 |
|
| | | $ | 217,917 |
| | $ | 140,083 |
| | 3.14 |
| | $ | 69,680 |
| | $ | 50,945 |
| | 6.03 |
|
| Short-term borrowings | | $ | 37,010 |
| | | | | | $ | 20,588 |
| | | | |
| Long-term borrowings | | 180,907 |
| | | | | | 49,092 |
| | | | |
| | | $ | 217,917 |
| | | | | | $ | 69,680 |
| | | | |
| |
(1) | Weighted average rate of other borrowings reflects the cost of prepaying a secured borrowing during the second quarter of 2017. |
The Corporation has a $388.2$649.0 million FHLB line of credit available for advances and open line borrowings which is collateralized by mortgage-related securities, unencumbered first mortgage loans and secured small business loans as noted below. At December 31, 2017, $204.72023, $367.5 million of this line remained unused. There were no advances outstanding on the Corporation’s open line at December 31, 2017 and 2016. There were $183.5$281.5 million of term FHLB advances outstanding at December 31, 20172023 with stated fixed interest rates ranging from 1.20%0.50% to 2.42%5.58% compared to $33.6$416.4 million of term FHLB advances outstanding at December 31, 20162022 with stated fixed interest raterates ranging from 0.83%0.31% to 4.43%4.69%. The term FHLB advances outstanding at December 31, 20172023 are due at various dates through August 2024.May 2030.
The Corporation is required to maintain as collateral mortgage-related securities, and unencumbered first mortgage loans and secured small business loans in its portfolio aggregating at least the amount of outstanding advances from the FHLB. Loans totaling approximately $388.2 million$1.172 billion and $326.4 million$1.059 billion were pledged as collateral at December 31, 20172023 and 2016,2022, respectively. Collateralized mortgage obligations totaling approximately $20.7 million were pledged as collateral for FHLB advances at December 31, 2016.
The Corporation has a senior line of credit with a third-party financial institution of $10.5 million. As of December 31, 2017,2023, the line of credit carried an interest rate of LIBORSOFR + 2.75% with an interest rate floor of 3.125%2.36% that matured on February 19, 20182024 and had certain performance debt covenants of which the Corporation was in compliance. The Corporation pays a commitment fee on this senior line of credit. For the years ended December 31, 20172023, 2022, and 20162021 the Corporation incurred
$13,000 $13,000 additional interest expense due to this fee. There was no outstanding balance on the line of credit as of December 31, 2023. On February 19, 2018,20, 2024, the credit line was renewed for one additional year with pricing terms of LIBOR1-month term SOFR + 2.75% with an interest rate floor of 3.125%2.36% and a maturity date of February 20, 2019. As of December 31, 2017, the outstanding balance on the line of credit was $10,000.19, 2025.
The Corporation hasissued new subordinated notes payable. At December 31, 2017, thedebentures as of September 29, 2023. The aggregate principal amount of the newly issued subordinated notes payable outstandingdebentures was $23.7$15.0 million, which qualified foras Tier 2 capital. At December 31, 2017, $15.0 million boreThe subordinated debentures bear a fixed interest rate of 6.50%8.0% with a maturity date of September 21, 2024 and $9.1 million bore a fixed interest rate of 6.00% with a maturity date of April 15, 2027. There are no debt covenants on the subordinated notes payable.29, 2033. The Corporation may, at its option, redeem the notes,debentures, in whole or part, at any time after the fifth anniversary of issuance. As of December 31, 2017, $377,0002023, $573,000 of debt issuance costs remain in the subordinated notesnote and debenture payable balance.balance, of which $48,000 was related to the recently issued subordinated debentures.
In September 2008, Trust II completed the sale of $10.0 million of 10.50% fixed rate trust preferred securities (“Preferred Securities”). Trust II also issued common securities of $315,000. Trust II used the proceeds from the offering to purchase $10.3 million of 10.50% junior subordinated notes (“Notes”) of the Corporation. The Preferred Securities are mandatorily redeemable upon the maturity of the Notes on September 26, 2038. The Preferred Securities qualify under the risk-based capital guidelines as Tier 1 capital for regulatory purposes. Per the provisions of the Dodd-Frank Act, bank holding companies with total assets of less than $15 billion are not required to phase out trust preferred securities as an element of Tier 1 capital as other, larger institutions must. The Corporation used the proceeds from the sale of the Notes for general corporate purposes including providing additional capital to its subsidiaries. As of December 31, 2017, $296,0002023, the Corporation had other borrowings of debt issuance costs remain reflected in junior subordinated notes on$20,000, which consisted of sold tax credit investments accounted for as secured borrowings because they did not qualify for true sale accounting. As of December 31, 2022, the Consolidated Balance Sheets.
Corporation had other borrowings of $6.1 million, which consisted of sold loans accounted for as secured borrowings because they did not qualify for true sale accounting. The Corporation has entered into derivative contracts hedging a portion of the rightborrowings included in the 2024 maturities above. As of December 31, 2023, the notional amount of derivatives designated as cash flow hedges totaled $96.4 million with a weighted average remaining maturity of 2.5 years and a weighted average rate of 1.78%.
Note 11 – Preferred Stock
On March 4, 2022, the Corporation issued 12,500 shares, or $12.5 million in aggregate liquidation preference, of 7.0% Fixed-to-Floating Rate Non-Cumulative Perpetual Preferred Stock, Series A, par value $0.01 per share, with a liquidation preference of $1,000 per share (the “Series A Preferred Stock”) in a private placement to institutional investors. The net proceeds received from the issuance of the Series A Preferred Stock were $12.0 million.
The Corporation expects to pay dividends on the Series A Preferred Stock when and if declared by the Board, at a fixed rate of 7.0% per annum, payable quarterly, in arrears, on March 15, June 15, September 15 and December 15 of each year up to, but excluding, March 15, 2027. For each dividend period from and including March 15, 2027, dividends will be paid at a floating rate of Three-Month Term SOFR plus a spread of 539 basis points per annum. During the years ended December 31, 2023 and 2022, the Board of Directors declared aggregate preferred stock dividends of $875,000 and $683,000, respectively. The Series A Preferred Stock is perpetual and has no stated maturity. The Corporation may redeem the NotesSeries A Preferred Stock at each interest payment dateits option at a redemption price equal to $1,000 per share, plus any declared and unpaid dividends (without regard to any undeclared dividends), subject to regulatory approval, on or after September 26, 2013. The Corporation also has the right to redeem the Notes, in whole but not in part, after the occurrence of certain special events. Special events are limited to: (1)March 15, 2027 or within 90 days following a change inregulatory capital treatment resultingevent, in accordance with the inabilityterms of the Corporation to include the Notes in Tier 1 capital, (2) a change in laws or regulations that could require Trust II to register as an investment company under the Investment Company Act of 1940, as amended; and (3) a change in laws or regulations that would require Trust II to pay income tax with respect to interest received on the Notes or, prohibit the Corporation from deducting the interest payable by the Corporation on the Notes or result in greater than a de minimis amount of taxes for Trust II.Series A Preferred Stock.
Note 1012 – Regulatory Capital
The Corporation and the Bank are subject to various regulatory capital requirements administered by Federal and the State of Wisconsin banking agencies. Failure to meet minimum capital requirements can result in certain mandatory, and possibly additional discretionary actions on the part of regulators, that if undertaken, could have a direct material effect on the Bank’s assets, liabilities, and certain off-balance-sheetoff-balance sheet items as calculated under regulatory practices. The Corporation’s and the Bank’s capital amounts and classifications are also subject to qualitative judgments by the regulators about components, risk weightings, and other factors. The Corporation regularly reviews and updates, when appropriate, its Capital and Liquidity Action Plan,Plans, which is designed to help ensure appropriate capital adequacy, to plan for future capital needs, and to ensure that the Corporation serves as a source of financial strength to the Bank. The Corporation’s and the Bank’s Boards of DirectorsBoard and management teams adhere to the appropriate regulatory guidelines on decisions which affect their respective capital positions, including but not limited to, decisions relating to the payment of dividends and increasing indebtedness.
As a bank holding company, the Corporation’s ability to pay dividends is affected by the policies and enforcement powers of the Board of Governors of the Federal Reserve system (the “Federal Reserve”). Federal Reserve guidance urges financial institutions to strongly consider eliminating, deferring, or significantly reducing dividends if: (i) net income available to common shareholders for the past four quarters, net of dividends previously paid during that period, is not sufficient to fully fund the dividend; (ii) the prospective rate of earnings retention is not consistent with the bank holding company’s capital needs and overall current and prospective financial condition; or (iii) the bank holding company will not meet, or is in danger of not meeting, its minimum regulatory capital ratios. Management intends, when appropriate under regulatory guidelines, to consult with the Federal Reserve BankFRB of Chicago and provide it with information on the Corporation’s then-current and prospective earnings and capital position in advance of declaring any cash dividends. As a Wisconsin corporation, the Corporation is subject to the limitations of the Wisconsin Business Corporation Law, which prohibit the Corporation from paying dividends if such payment would: (i) render the Corporation unable to pay its debts as they become due in the usual course of business, or (ii) result in the Corporation’s assets being less than the sum of its total liabilities plus the amount needed to satisfy the preferential rights upon dissolution of any stockholdersshareholders with preferential rights superior to those stockholdersshareholders receiving the dividend.
The Bank is also subject to certain legal, regulatory, and other restrictions on their ability to pay dividends to the Corporation. As a bank holding company, the payment of dividends by the Bank to the Corporation is one of the sources of funds the Corporation could use to pay dividends, if any, in the future and to make other payments. Future dividend decisions by the
Bank and the Corporation will continue to be subject to compliance with various legal, regulatory, and other restrictions as defined from time to time.
QualitativeQuantitative measures established by regulation to ensure capital adequacy require the Corporation and the Bank to maintain minimum amounts and ratios of Total Common Equity Tier 1 and Tier 1 capital to risk-weighted assets and of Tier 1 capital to
adjusted total assets. These risk-based capital requirements presently address credit risk related to both recorded and off-balance-sheetoff-balance sheet commitments and obligations.
In July 2013, the FRB and the FDIC approved the final rules implementing the Basel Committee on Banking Supervision’s capital guidelines for U.S. banks. These rules are applicable to all financial institutions that are subject to minimum capital requirements, including federal and state banks and savings and loan associations, as well as bank and savings and loan holding companies other than “small bank holding companies” (generally non-publicly traded bank holding companies with consolidated assets of less than $1 billion). Under the final rules, minimum requirements increased for both the quantity and quality of capital held by the Corporation. The rules include a new Common Equity Tier 1 capital to risk-weighted assets minimum ratio of 4.5%, raise the minimum ratio of Tier 1 capital to risk-weighted assets from 4.0% to 6.0%, require a minimum ratio of Total Capital to risk-weighted assets of 8.0%, and require a minimum Tier 1 leverage ratio of 4.0%. The rules also permit banking organizations with less than $15 billion in assets to retain, through a one-time election, the past treatment for accumulated other comprehensive income, which did not affect regulatory capital. The Corporation elected to retain this treatment, which reduces the volatility of regulatory capital ratios. A new capitalThe Corporation also must comply with the 2.5% conservation buffer, comprisedwhich the Corporation met as of Common Equity Tier 1 capital, was also established above the regulatory minimum capital requirements. This capital conservation buffer will be phased in beginning January 1, 2016 at 0.625% of risk-weighted assets and will increase each subsequent year by an additional 0.625% until reaching its final level of 2.5% on January 1, 2019.December 31, 2023.
As of December 31, 2017, both2023, the Corporation’s capital levels exceeded the regulatory minimums and the Bank’s capital levels remained characterized as well capitalized under the new rules.regulatory framework. The following table summarizestables summarize both the Corporation’s and the Bank’s capital ratios and the ratios required by their federal regulators at December 31, 2017:regulators:
| | | | | | | | | | | | | | | | | | | | | | | | | | | | | | | | | | | | | | | | | | | | | | | | | | |
| | As of December 31, 2023 |
| | | Actual(1) | | Minimum Required for Capital Adequacy Purposes | | For Capital Adequacy Purposes Plus Capital Conservation Buffer | | Minimum Required to Be Well Capitalized Under Prompt Corrective Action
Requirements |
| | | Amount | | Ratio | | Amount | | Ratio | | Amount | | Ratio | | Amount | | Ratio |
| | | (Dollars in Thousands) |
Total capital
(to risk-weighted assets) | | | | | | | | | | | | | | | | |
| Consolidated | | $ | 375,440 | | | 11.19 | % | | $ | 268,500 | | | 8.00 | % | | $ | 352,406 | | | 10.50 | % | | N/A | | N/A |
| First Business Bank | | 376,310 | | | 11.21 | | | 268,595 | | | 8.00 | | | 352,531 | | | 10.50 | | | $ | 335,744 | | | 10.00 | % |
Tier 1 capital
(to risk-weighted assets) | | | | | | | | | | | | | | | | |
| Consolidated | | $ | 293,338 | | | 8.74 | % | | $ | 201,375 | | | 6.00 | % | | $ | 285,281 | | | 8.50 | % | | N/A | | N/A |
| First Business Bank | | 343,604 | | | 10.23 | | | 201,446 | | | 6.00 | | | 285,382 | | | 8.50 | | | $ | 268,595 | | | 8.00 | % |
Common equity tier 1 capital
(to risk-weighted assets) | | | | | | | | | | | | | | | | |
| Consolidated | | $ | 281,346 | | | 8.38 | % | | $ | 151,031 | | | 4.50 | % | | $ | 234,937 | | | 7.00 | % | | N/A | | N/A |
| First Business Bank | | 343,604 | | | 10.23 | | | 151,085 | | | 4.50 | | | 235,021 | | | 7.00 | | | $ | 218,233 | | | 6.50 | % |
Tier 1 leverage capital
(to adjusted assets) | | | | | | | | | | | | | | | | |
| Consolidated | | $ | 293,338 | | | 8.43 | % | | $ | 139,145 | | | 4.00 | % | | $ | 139,145 | | | 4.00 | % | | N/A | | N/A |
| First Business Bank | | 343,604 | | | 9.87 | | | 139,262 | | | 4.00 | | | 139,262 | | | 4.00 | | | $ | 174,077 | | | 5.00 | % |
(1) 2023 capital amounts include $1.0 million of additional stockholders’ equity as elected by the Corporation and permitted by federal banking regulatory agencies. Risk-weighted assets were also adjusted accordingly.
|
| | | | | | | | | | | | | | | | | | | | | | | | | | | | |
| | | Actual | | Minimum Required for Capital Adequacy Purposes | | For Capital Adequacy Purposes Plus Capital Conservation Buffer | | Minimum Required to Be Well Capitalized Under Prompt Corrective Action Requirements |
| | | Amount | | Ratio | | Amount | | Ratio | | Amount | | Ratio | | Amount | | Ratio |
| | | (Dollars in Thousands) |
| As of December 31, 2017 | | | | | | | | | | | | | | | | |
Total capital (to risk-weighted assets) | | | | | | | | | | | | | | | | |
| Consolidated | | $ | 214,501 |
| | 11.98 | % | | $ | 143,219 |
| | 8.00 | % | | $ | 165,597 |
| | 9.250 | % | | N/A |
| | N/A |
|
| First Business Bank | | 207,986 |
| | 11.66 |
| | 142,736 |
| | 8.00 |
| | 165,038 |
| | 9.250 |
| | $ | 178,420 |
| | 10.00 | % |
Tier 1 capital (to risk-weighted assets) | | | | | | | | | | | | | | | | |
| Consolidated | | $ | 169,176 |
| | 9.45 |
| | $ | 107,414 |
| | 6.00 |
| | $ | 129,792 |
| | 7.250 | % | | N/A |
| | N/A |
|
| First Business Bank | | 186,374 |
| | 10.45 |
| | 107,052 |
| | 6.00 |
| | 129,354 |
| | 7.250 |
| | $ | 142,736 |
| | 8.00 |
|
Common equity tier 1 capital (to risk-weighted assets) | | | | | | | | | | | | | | | | |
| Consolidated | | $ | 159,157 |
| | 8.89 |
| | $ | 80,561 |
| | 4.50 |
| | $ | 102,939 |
| | 5.750 | % | | N/A |
| | N/A |
|
| First Business Bank | | 186,374 |
| | 10.45 |
| | 80,289 |
| | 4.50 |
| | 102,591 |
| | 5.750 |
| | $ | 115,973 |
| | 6.50 |
|
Tier 1 leverage capital (to adjusted assets) | | | | | | | | | | | | | | | | |
| Consolidated | | $ | 169,176 |
| | 9.54 |
| | $ | 70,920 |
| | 4.00 |
| | $ | 70,920 |
| | 4.00 | % | | N/A |
| | N/A |
|
| First Business Bank | | 186,374 |
| | 10.56 |
| | 70,617 |
| | 4.00 |
| | 70,617 |
| | 4.00 |
| | $ | 88,272 |
| | 5.00 |
|
The following table summarizes both the Corporation’s and the Corporation’s legacy bank charters’ ratios and the ratios required by their federal regulators at December 31, 2016:
| | | As of December 31, 2022 | | | | As of December 31, 2022 |
| | | | Actual | | Minimum Required for Capital Adequacy Purposes | | For Capital Adequacy Purposes Plus Capital Conservation Buffer | | Minimum Required to Be Well Capitalized Under Prompt Corrective Action
Requirements |
| | | | | | | | | | | | | | | | | | | | Amount | | Ratio | | Amount | | Ratio | | Amount | | Ratio | | Amount | | Ratio |
| | | Actual | | Minimum Required for Capital Adequacy Purposes | | For Capital Adequacy Purposes Plus Capital Conservation Buffer | | Minimum Required to Be Well Capitalized Under Prompt Corrective Action Requirements | | | (Dollars in Thousands) |
| | | Amount | | Ratio | | Amount | | Ratio | | Amount | | Ratio | | Amount | | Ratio |
| | | (Dollars in Thousands) |
| As of December 31, 2016 | | | | | | | | | | | | | | | | |
Total capital (to risk-weighted assets) | | | | | | | | | | | | | | | | |
| Consolidated | | $ | 204,117 |
| | 11.74 | % | | $ | 139,101 |
| | 8.00 | % | | $ | 149,968 |
| | 8.625 | % | | N/A |
| | N/A |
|
| Consolidated | |
| Consolidated | | | $ | 323,893 | | | 11.26 | % | | $ | 230,180 | | | 8.00 | % | | $ | 302,111 | | | 10.50 | % | | N/A |
| First Business Bank | | 147,811 |
| | 11.55 |
| | 102,362 |
| | 8.00 |
| | 110,360 |
| | 8.625 |
| | $ | 127,953 |
| | 10.00 | % | First Business Bank | | 323,021 | | | 11.22 | | 11.22 | | | 230,367 | | 230,367 | | | 8.00 | | 8.00 | | | 302,357 | | 302,357 | | | 10.50 | | 10.50 | | | $ | | $ | 287,959 | | | 10.00 | | 10.00 | % |
| First Business Bank – Milwaukee | | 24,347 |
| | 11.02 |
| | 17,680 |
| | 8.00 |
| | 19,062 |
| | 8.625 |
| | 22,101 |
| | 10.00 |
|
| Alterra Bank | | 31,699 |
| | 13.27 |
| | 19,106 |
| | 8.00 |
| | 20,599 |
| | 8.625 |
| | 23,882 |
| | 10.00 |
|
Tier 1 capital (to risk-weighted assets) | | | | | | | | | | | | | | | | |
| Consolidated | | $ | 160,964 |
| | 9.26 | % | | $ | 104,326 |
| | 6.00 | % | | $ | 115,193 |
| | 6.625 | % | | N/A |
| | N/A |
|
| Consolidated | |
| Consolidated | | | $ | 264,843 | | | 9.20 | % | | $ | 172,635 | | | 6.00 | % | | $ | 244,566 | | | 8.50 | % | | N/A |
| First Business Bank | | 134,208 |
| | 10.49 |
| | 76,772 |
| | 6.00 |
| | 84,769 |
| | 6.625 |
| | $ | 102,362 |
| | 8.00 | % | First Business Bank | | 298,312 | | | 10.36 | | 10.36 | | | 172,775 | | 172,775 | | | 6.00 | | 6.00 | | | 244,765 | | 244,765 | | | 8.50 | | 8.50 | | | $ | | $ | 230,367 | | | 8.00 | | 8.00 | % |
| First Business Bank – Milwaukee | | 22,323 |
| | 10.10 |
| | 13,260 |
| | 6.00 |
| | 14,642 |
| | 6.625 |
| | 17,680 |
| | 8.00 |
|
| Alterra Bank | | 28,685 |
| | 12.01 |
| | 14,329 |
| | 6.00 |
| | 15,822 |
| | 6.625 |
| | 19,106 |
| | 8.00 |
|
Common equity tier 1 capital (to risk-weighted assets)
| | | | | | | | | | | | | | | | |
| Consolidated | | $ | 150,960 |
| | 8.68 | % | | $ | 78,244 |
| | 4.50 | % | | $ | 89,111 |
| | 5.125 | % | | N/A |
| | N/A |
|
| Consolidated | |
| Consolidated | | | $ | 252,851 | | | 8.79 | % | | $ | 129,476 | | | 4.50 | % | | $ | 201,407 | | | 7.00 | % | | N/A |
| First Business Bank | | 134,208 |
| | 10.49 |
| | 57,579 |
| | 4.50 |
| | 65,576 |
| | 5.125 |
| | $ | 83,170 |
| | 6.50 | % | First Business Bank | | 298,312 | | | 10.36 | | 10.36 | | | 129,581 | | 129,581 | | | 4.50 | | 4.50 | | | 201,571 | | 201,571 | | | 7.00 | | 7.00 | | | $ | | $ | 187,173 | | | 6.50 | | 6.50 | % |
| First Business Bank – Milwaukee | | 22,323 |
| | 10.10 |
| | 9,945 |
| | 4.50 |
| | 11,327 |
| | 5.125 |
| | 14,365 |
| | 6.50 |
|
| Alterra Bank | | 28,685 |
| | 12.01 |
| | 10,747 |
| | 4.50 |
| | 12,240 |
| | 5.125 |
| | 15,524 |
| | 6.50 |
|
Tier 1 leverage capital (to adjusted assets) | | | | | | | | | | | | | | | | |
| Consolidated | | $ | 160,964 |
| | 9.07 | % | | $ | 70,985 |
| | 4.00 | % | | $ | 70,985 |
| | 4.00 | % | | N/A |
| | N/A |
|
| Consolidated | |
| Consolidated | | | $ | 264,843 | | | 9.17 | % | | $ | 115,464 | | | 4.00 | % | | $ | 115,464 | | | 4.00 | % | | N/A |
| First Business Bank | | 134,208 |
| | 10.40 |
| | 51,600 |
| | 4.00 |
| | 51,600 |
| | 4.00 |
| | $ | 64,500 |
| | 5.00 | % | First Business Bank | | 298,312 | | | 10.34 | | 10.34 | | | 115,402 | | 115,402 | | | 4.00 | | 4.00 | | | 115,402 | | 115,402 | | | 4.00 | | 4.00 | | | $ | | $ | 144,252 | | | 5.00 | | 5.00 | % |
| First Business Bank – Milwaukee | | 22,323 |
| | 9.15 |
| | 9,758 |
| | 4.00 |
| | 9,758 |
| | 4.00 |
| | 12,198 |
| | 5.00 |
|
| Alterra Bank | | 28,685 |
| | 10.58 |
| | 10,842 |
| | 4.00 |
| | 10,842 |
| | 4.00 |
| | 13,552 |
| | 5.00 |
|
The following table reconciles stockholders’ equity to federal regulatory capital at December 31, 20172023 and 2016,2022, respectively:
| | | | | | | | | | | | | | |
| | | As of December 31, |
| | | 2023 | | 2022 |
| | | (In Thousands) |
| Stockholders’ equity of the Corporation | | $ | 289,588 | | | $ | 260,640 | |
| Net unrealized and accumulated losses on specific items | | 13,717 | | | 15,310 | |
| Disallowed servicing assets | | (614) | | | (706) | |
| Disallowed goodwill and other intangibles | | (10,368) | | | (10,401) | |
| ASC 326 Phase-in | | 1,015 | | | — | |
| Tier 1 capital | | 293,338 | | | 264,843 | |
| Allowable general valuation allowances and subordinated debt | | 82,102 | | | 59,050 | |
| Total capital | | $ | 375,440 | | | $ | 323,893 | |
|
| | | | | | | | |
| | | As of December 31, |
| | | 2017 | | 2016 |
| | | (In Thousands) |
| Stockholders’ equity of the Corporation | | $ | 169,278 |
| | $ | 161,650 |
|
| Net unrealized and accumulated losses on specific items | | 1,238 |
| | 522 |
|
| Disallowed servicing assets | | (848 | ) | | (652 | ) |
| Disallowed goodwill and other intangibles | | (10,511 | ) | | (10,560 | ) |
| Junior subordinated notes | | 10,019 |
| | 10,004 |
|
| Tier 1 capital | | 169,176 |
| | 160,964 |
|
| Allowable general valuation allowances and subordinated debt | | 45,325 |
| | 43,153 |
|
| Total capital | | $ | 214,501 |
| | $ | 204,117 |
|
Note 1113 – Earnings per Common Share
Earnings per common share are computed using the two-class method. Basic earnings per common share are computed by dividing net income allocated to common shares by the weighted average number of shares outstanding during the applicable period, excluding outstanding participating securities. Participating securities include unvested restricted shares. Unvested restricted shares are considered participating securities because holders of these securities receive non-forfeitable dividends, or dividend equivalents, at the same rate as holders of the Corporation’s common stock. Diluted earnings per share are computed by dividing net income allocated to common shares adjusted for reallocation of undistributed earnings of unvested restricted shares by the weighted average number of shares determined for the basic earnings per common share computation plus the dilutive effect of common stock equivalents using the treasury stock method.
| | | For the Year Ended December 31, | | | | For the Year Ended December 31, |
| | | | | 2023 | | 2022 | | 2021 |
| (Dollars in Thousands, Except Share Data) | | | (Dollars in Thousands, Except Share Data) |
| Basic earnings per common share | |
| Net income | |
| Net income | |
| Net income | |
| Less: preferred stock dividends | |
| Less: earnings allocated to participating securities | |
| Basic earnings allocated to common shareholders | |
| | Weighted-average common shares outstanding, excluding participating securities | |
| Weighted-average common shares outstanding, excluding participating securities | |
| Weighted-average common shares outstanding, excluding participating securities | |
| | Basic earnings per common share | |
| Basic earnings per common share | |
| Basic earnings per common share | |
| | Diluted earnings per common share | |
| Diluted earnings per common share | |
| Diluted earnings per common share | | | |
| Earnings allocated to common shareholders, diluted | |
| | | | | For the Year Ended December 31, |
| | | 2017 | | 2016 | | 2015 |
| | (Dollars in Thousands, Except Share Data) |
| Basic earnings per common share | | | | | | |
| Net income | | $ | 11,905 |
| | $ | 14,909 |
| | $ | 16,514 |
|
| Less: earnings allocated to participating securities | | 162 |
| | 219 |
| | 273 |
|
| Basic earnings allocated to common shareholders | | $ | 11,743 |
| | $ | 14,690 |
| | $ | 16,241 |
|
| Weighted-average common shares outstanding, excluding participating securities | | 8,612,770 |
| | 8,573,722 |
| | 8,549,176 |
|
| Basic earnings per common share | | $ | 1.36 |
| | $ | 1.71 |
| | $ | 1.90 |
|
| Weighted-average diluted common shares outstanding, excluding participating securities | |
| | Weighted-average diluted common shares outstanding, excluding participating securities | |
| | Weighted-average diluted common shares outstanding, excluding participating securities | |
| | | | | | | |
| Diluted earnings per common share | | | | | | |
| Earnings allocated to common shareholders, diluted | | $ | 11,743 |
| | $ | 14,690 |
| | $ | 16,241 |
|
| Weighted-average common shares outstanding, excluding participating securities | | 8,612,770 |
| | 8,573,722 |
| | 8,549,176 |
|
| Dilutive effect of share-based awards | | — |
| | — |
| | 1,146 |
|
| Weighted-average diluted common shares outstanding, excluding participating securities | | 8,612,770 |
| | 8,573,722 |
| | 8,550,322 |
|
| Diluted earnings per common share | | $ | 1.36 |
| | $ | 1.71 |
| | $ | 1.90 |
|
| Diluted earnings per common share | |
Note 1214 – Share-Based Compensation
The Corporation initially adopted the 20122019 Equity Incentive Plan (the “Plan”) during the quarter ended June 30, 2012.2019. The Plan is administered by the Compensation Committee of the Board of Directors (the “Board”) of the Corporation and provides for the grant of equity ownership opportunities through incentive stock options and nonqualified stock options, restricted stock, restricted stock units, dividend equivalent units, and any other type of award permitted by the Plan. As of December 31, 2017, 211,8352023, 328,332 shares were available for future grants under the Plan.Plan, as amended. Shares covered by awards that expire, terminate, or lapse will again be available for the grant of awards under the Plan. The Corporation may issue new shares and shares from its treasury stock for shares delivered under the Plan.
Restricted Stock
Under the Plan, the Corporation may grant restricted stock awards (“RSA”), restricted stock units (“RSU”), and other stock-based awards to plan participants, subject to forfeiture upon the occurrence of certain events until the dates specified in the participant’s award agreement. While restricted stock is subject to forfeiture, restricted stockRSA participants may exercise full voting rights and will receive all dividends and other distributions paid with respect to the restricted shares. Restricted stock unitsRSUs do not have voting rights andrights. RSUs granted prior to 2023 are provided dividend equivalents.equivalents concurrent with dividends paid to shareholders while RSUs granted in 2023 and after will accrue dividend equivalents payable upon vesting. The restricted stock granted under the Plan is typically subject to a vesting period. Compensation expense for restricted stock is recognized over the requisite service period of generally three or four years for the entire award on a straight-line basis. Upon vesting of restricted stock, the benefit of tax deductions in excess of recognized compensation expense is reflected as an income tax benefit in the Consolidated Statements of Income.
The Corporation may also issue performance-based restricted stock units (“PRSU”). Vesting of the PRSU will be measured on the relative Total Shareholder Return (“TSR”) and relative Return on Average Equity (“ROAE”) for issuances prior to 2023 or Return on Average Common Equity (“ROACE”) for issuances after 2022, and will cliff-vest after a three-year measurement period based on the Corporation’s TSR performance and ROAE or ROACE performance compared to a broad peer group of over 100 banks. At the end of the performance period, the number of actual shares to be awarded varies between 0% and 200% of target amounts. The restricted stock awards and units issued to executive officers will vest ratably over a three-year period. Compensation expense is recognized for PRSU over the requisite service and performance period of generally three years for the entire expected award on a straight-line basis. The compensation expense for the awards expected to vest for the percentage of performance-based restricted stock units subject to the ROAE or ROACE metric will be adjusted if there is a change in the expectation of ROAE or ROACE. The compensation expense for the awards expected to vest for the percentage of PRSU subject to the TSR metric are never adjusted and are amortized utilizing the accounting fair value provided using a Monte Carlo pricing model.
Restricted stock activity for the year ended December 31, 2017, 20162023, 2022, and 20152021 was as follows:
| | | | | | | | | | | | | | | | | | | | | | | | | | | | | | | | | | | | | | | | | | | | | | | | | | |
| | RSA | | Weighted Average Grant Price | | PRSU | | Weighted Average Grant Price | | RSU | | Weighted Average Grant Price | | Total | | Weighted Average Grant Price |
| Nonvested balance as of January 1, 2021 | | 143,246 | | | $ | 23.04 | | | 39,570 | | | $ | 28.85 | | | 4,988 | | | $ | 24.08 | | | 187,804 | | | $ | 24.29 | |
Granted (1) | | 67,515 | | | 22.39 | | | 23,550 | | | 27.12 | | | 2,065 | | | 21.68 | | | 93,130 | | | 23.57 | |
| Vested | | (61,384) | | | 22.26 | | | — | | | — | | | (2,001) | | | 22.91 | | | (63,385) | | | 22.28 | |
| Forfeited | | (7,760) | | | 23.24 | | | — | | | — | | | — | | | — | | | (7,760) | | | 23.24 | |
| Nonvested balance as of December 31, 2021 | | 141,617 | | | 23.06 | | | 63,120 | | | 28.20 | | | 5,052 | | | 23.56 | | | 209,789 | | | 24.62 | |
Granted (1) | | 62,560 | | | 34.04 | | | 37,335 | | | 24.71 | | | 3,115 | | | 27.95 | | | 103,010 | | | 30.47 | |
| Vested | | (62,353) | | | 23.21 | | | (43,020) | | | 18.91 | | | (2,062) | | | 23.20 | | | (107,435) | | | 21.49 | |
| Forfeited | | (8,507) | | | 26.15 | | | — | | | — | | | — | | | — | | | (8,507) | | | 26.15 | |
| Nonvested balance as of December 31, 2022 | | 133,317 | | | 27.95 | | | 57,435 | | | 32.89 | | | 6,105 | | | 25.92 | | | 196,857 | | | 29.32 | |
Granted (1) | | — | | | — | | | 34,840 | | | 35.79 | | | 54,955 | | | 34.43 | | | 89,795 | | | 34.96 | |
| Vested | | (56,931) | | | 27.03 | | | (36,120) | | | 31.31 | | | (3,253) | | | 26.06 | | | (96,304) | | | 28.60 | |
| Forfeited | | (4,435) | | | 30.20 | | | — | | | — | | | (820) | | | 36.42 | | | (5,255) | | | 31.17 | |
| Nonvested balance as of December 31, 2023 | | 71,951 | | | $ | 28.53 | | | 56,155 | | | $ | 35.70 | | | 56,987 | | | $ | 33.97 | | | 185,093 | | | $ | 32.38 | |
| Unrecognized compensation cost (in thousands) | | $ | 1,229 | | | | | $ | 879 | | | | | $ | 1,393 | | | | | $ | 3,501 | | | |
| Weighted average remaining recognition period (in years) | | 1.80 | | | | 1.64 | | | | 2.79 | | | | 2.15 | | |
|
| | | | | | | | | | | | | | | | | | | | | |
| | | For the Year Ended December 31, |
| | | 2017 | | 2016 | | 2015 |
| | | Number of Restricted Shares | | Weighted Average Grant-Date Fair Value | | Number of Restricted Shares | | Weighted Average Grant-Date Fair Value | | Number of Restricted Shares | | Weighted Average Grant-Date Fair Value |
| Nonvested balance at beginning of year | | 116,245 |
| | $ | 21.13 |
| | 135,471 |
| | $ | 20.13 |
| | 154,998 |
| | $ | 16.97 |
|
| Granted | | 71,130 |
| | 21.67 |
| | 60,415 |
| | 22.74 |
| | 53,790 |
| | 22.52 |
|
| Vested | | (48,550 | ) | | 21.51 |
| | (56,090 | ) | | 18.71 |
| | (64,874 | ) | | 15.23 |
|
| Forfeited | | (8,384 | ) | | 21.65 |
| | (23,551 | ) | | 20.90 |
| | (8,443 | ) | | 15.03 |
|
| Nonvested balance as of end of year | | 130,441 |
| | 21.43 |
| | 116,245 |
| | 21.13 |
| | 135,471 |
| | 20.13 |
|
As(1)The number of December 31, 2017,restricted shares/units shown includes the Corporation had $2.5 millionshares that would be granted if the target level of deferred unvested compensation expense, whichperformance is achieved related to the Corporation expects to recognize over a weighted-average periodPRSU. The number of approximately 2.9 years.
Forshares actually issued may vary. During the yearsyear ended December 31, 2017, 20162023, an additional 18,060 were issued related to actual performance results of previously granted awards.
Employee Stock Purchase Plan
The Corporation is authorized to issue up to 250,000 shares of common stock under the ESPP. The plan qualifies as an employee stock purchase plan under section 423 of the Internal Revenue Code of 1986. Under the ESPP, eligible employees may enroll in a three month offer period that begins January, April, July, and 2015,October of each year. Employees may elect to purchase a limited number of shares of the Corporation's common stock at 90% of the fair market value on the last day of the offering period. The ESPP is treated as a compensatory item for purposes of share-based compensation expense.
During the year ended December 31, 2023, the Corporation issued 4,328 shares of common stock under the ESPP. At December 31, 2023, 230,638 shares remained available for issuance under the ESPP.
Share-based compensation expense related to restricted stock and ESPP included in the Consolidated Statements of Income was as follows:
| | | | | | | | | | | | | | | | | | | | |
| | For the Year Ended December 31, |
| | 2023 | | 2022 | | 2021 |
| | (In Thousands) |
| Share-based compensation expense | | $ | 2,977 | | | $ | 2,584 | | | $ | 2,513 | |
|
| | | | | | | | | | | | |
| | | For the Year Ended December 31, |
| | | 2017 | | 2016 | | 2015 |
| | | (In Thousands) |
| Share-based compensation expense | | $ | 1,078 |
| | $ | 994 |
| | $ | 1,063 |
|
Note 1315 – Employee Benefit Plans
The Corporation maintains a contributory 401(k) defined contribution plan covering substantially all employees. The Corporation matches 100% of amounts contributed by each participating employee, up to 3.0%3% of the employee’s compensation. The Corporation may also make discretionary profit sharing contributions up to an additional 6.0%6% of salary. Contributions are expensed in the period incurred and recorded in compensation expense in the Consolidated Statements of Income. The Corporation made a matching contribution of 3.0%3% to all eligible employees which totaled $626,000, $621,000$1.2 million, $1.1 million, and $573,000$987,000 for the years ended December 31, 2017, 20162023, 2022, and 2015,2021, respectively. Discretionary profit sharing contributions for substantially all employees of 1.0%5.9%, or $183,000, 1.2%$2.1 million, 5.2%, or $207,000,$1.6 million, and 3.3%4.7%, or $549,000,$1.3 million, were made in 2017, 20162023, 2022, and 2015,2021, respectively.
As of December 31, 2017, 20162023, 2022, and 2015,2021, the Corporation had a deferred compensation plan under which it provided contributions to supplement the retirement income of one executive. Under the terms of the plan, benefits to be received are generally payable within six months of the date of the termination of employment with the Corporation. The expense associated with the deferred compensation plan for the years ended December 31, 2017, 20162023, 2022, and 20152021 was $132,000, $124,000$493,000, $382,000, and $116,000,$237,000, respectively. The present value of future paymentsdeferred compensation liability under the remaining plan of $1.1$2.8 million and $987,000$2.3 million at December 31, 20172023 and 2016,2022, respectively, is included in accrued interest payable and other liabilities on the Consolidated Balance Sheets.
The Corporation owned life insurance policies on the life of the executive covered by the deferred compensation plan, which had cash surrender values and death benefits of approximately $2.4$3.1 million and $5.9$6.2 million, respectively, at December 31, 20172023 and cash surrender values and death benefits of approximately $2.3$2.9 million and $5.9$6.1 million, respectively, at December 31, 2016.2022. The remaining balance of the cash surrender value of bank-owned life insurance of $37.9$52.4 million and $36.7$51.0 million as of December 31, 20172023 and 2016,2022, respectively, is related to policies on a number of then-qualified individuals affiliated with the Bank.
Note 14 – Leases
The Corporation leases various office spaces, loan production offices and specialty financing production offices under noncancelable operating leases which expire on various dates through 2029. The Corporation’s total rent expense was $1.9 million, $1.8 million and $1.7 million for the years ended December 31, 2017, 2016 and 2015, respectively. Rent expense is recognized on a straight-line basis. The Corporation also leases other office equipment. Rental expense for these operating leases was $129,000, $136,000 and $109,000 for the years ended December 31, 2017, 2016 and 2015, respectively.
Future minimum lease payments for noncancelable operating leases for each of the five succeeding years and thereafter are as follows:
|
| | | |
| (In Thousands) | |
| 2018 | $ | 1,648 |
|
| 2019 | 1,565 |
|
| 2020 | 1,556 |
|
| 2021 | 1,397 |
|
| 2022 | 1,410 |
|
| Thereafter | 4,820 |
|
| | $ | 12,396 |
|
Note 15 - Other Non-Interest Expense
A summary of other non-interest expenses for the years ended December 31, 2017, 2016 and 2015 is as follows:
|
| | | | | | | | | | | | |
| | | Year Ended December 31, |
| | | 2017 | | 2016 | | 2015 |
| | | (In Thousands) |
| General and administrative expenses | | $ | 1,905 |
| | $ | 1,545 |
| | $ | 1,759 |
|
| Travel and other employee expenses | | 1,298 |
| | 1,354 |
| | 1,277 |
|
Partnership income (1) | | — |
| | (790 | ) | | (481 | ) |
| Other expenses | | 12 |
| | 129 |
| | 347 |
|
| Total other non-interest expense | | $ | 3,215 |
| | $ | 2,238 |
| | $ | 2,902 |
|
| |
(1) | Partnership income was recorded in other non-interest income for the year ended December 31, 2017. |
Note 16 – Income Taxes
Income tax expense for the years ended December 31, 2017, 2016 and 2015 consists of the following:
| | | | | Year Ended December 31, | | | For the Year Ended December 31, |
| | | 2017 | | 2016 | | 2015 | | | 2023 | | 2022 | | 2021 |
| | | (In Thousands) | | | (In Thousands) |
| Current: | | | | | | |
| Federal | | $ | 131 |
| | $ | 2,839 |
| | $ | 5,881 |
|
| Federal | |
| Federal | |
| State | | 448 |
| | 425 |
| | 1,338 |
|
| Current tax expense | | 579 |
| | 3,264 |
| | 7,219 |
|
| Deferred: | | | | | | |
| Federal | | 1,657 |
| | (1,000 | ) | | 1,036 |
|
| Federal | |
| Federal | |
| State | | 90 |
| | (108 | ) | | 122 |
|
| Deferred tax expense (benefit) | | 1,747 |
| | (1,108 | ) | | 1,158 |
|
| Total income tax expense | | $ | 2,326 |
| | $ | 2,156 |
| | $ | 8,377 |
|
Deferred income tax assets and liabilities reflect the net tax effects of temporary differences between the carrying amounts of assets and liabilities for financial reporting purposes and their tax basis. Deferred tax assets and liabilities are measured using enacted tax rates to apply to taxable income in the period in which the temporary differences are expected to be recovered or settled. Effective January 1, 2018, the enactment of the Tax Cuts and Jobs Act (the “Act”) reduced the corporate federal income tax rate to 21% from 35%, which required the Corporation to revalue its deferred taxes as of December 31, 2017. The revaluation resulted in a $629,000 reduction to the Corporation’s net deferred tax assets with a corresponding increase to income tax expense. Net deferred tax assets are included in accrued interest receivable and other assets in the Consolidated Balance Sheets.
On December 22, 2017, the SEC issued Staff Accounting Bulletin 118 (SAB 118), which provides guidance on accounting for the Act’s impact. SAB 118 provides a measurement period, which in no case should extend beyond one year from the Act’s enactment, during which a company acting in good faith may complete the accounting for the impacts
The significant components of the Corporation’s deferred tax assets and liabilities were as follows:
| | | | | December 31, 2017 | | December 31, 2016 | | | December 31, 2023 | | December 31, 2022 |
| | | (In Thousands) | | | (In Thousands) |
| Deferred tax assets: | | | | |
| Allowance for loan and lease losses | | $ | 4,795 |
| | $ | 8,177 |
|
| SBA recourse reserve | | 729 |
| | 720 |
|
| Excess book basis over tax basis for net assets acquired | | 96 |
| | 336 |
|
| Allowance for credit losses | |
| Allowance for credit losses | |
| Allowance for credit losses | |
| | Deferred compensation | |
| Deferred compensation | |
| Deferred compensation | | 482 |
| | 951 |
|
| State net operating loss carryforwards | | 615 |
| | 548 |
|
| Write-down of repossessed assets | |
| | Non-accrual loan interest | |
| Non-accrual loan interest | |
| Non-accrual loan interest | | 942 |
| | 815 |
|
| Capital loss carryforwards | | 21 |
| | 32 |
|
| Unrealized losses on securities | | 423 |
| | 349 |
|
| Share-based compensation | |
| Other | | 354 |
| | 394 |
|
| Total deferred tax assets before valuation allowance | | 8,457 |
| | 12,322 |
|
| Valuation allowance | | — |
| | — |
|
| Total deferred tax assets | | 8,457 |
| | 12,322 |
|
| Deferred tax liabilities: | | | | |
| Leasing and fixed asset activities | | 5,338 |
| | 7,389 |
|
| Leasing and fixed asset activities | |
| Leasing and fixed asset activities | |
| Loan servicing asset | | 471 |
| | 780 |
|
| | Other | |
| Other | |
| Other | | 64 |
| | 101 |
|
| Total deferred tax liabilities | | 5,873 |
| | 8,270 |
|
| Net deferred tax asset | | $ | 2,584 |
| | $ | 4,052 |
|
The tax effects of unrealized gains and losses on securities are components of other comprehensive income. A reconciliation of the change in net deferred tax assets to deferred tax expense as of December 31, 2017, 2016 and 2015 wasis as follows:
| | | | | December 31, 2017 | | December 31, 2016 | | December 31, 2015 | | | December 31, 2023 | | December 31, 2022 | | December 31, 2021 |
| | | (In Thousands) |
| Change in net deferred tax assets | | $ | (1,468 | ) | | $ | 1,419 |
| | $ | (970 | ) |
| Change in net deferred tax assets | |
| Change in net deferred tax assets | |
| Deferred taxes allocated to other comprehensive income | | (279 | ) | | (311 | ) | | (188 | ) |
| Deferred income tax (expense) benefit | | $ | (1,747 | ) | | $ | 1,108 |
| | $ | (1,158 | ) |
| Cumulative change in accounting principle | |
| Deferred income tax benefit (expense) | |
Realization of the deferred tax asset over time is dependent upon the Corporation generating sufficient taxable earnings in future periods. In making the determination that the realization of the deferred tax was more likely than not, the Corporation considered several factors including its recent earnings history, its expected earnings in the future, appropriate tax planning strategies, and expiration dates associated with operating loss carry forwards.carryforwards.
On July 5, 2023, the Wisconsin legislature enacted 2023 Wisconsin Act 19 (the “Act”). The Act contains a provision that provides financial institutions with a state tax-exemption for interest, fees, and penalties earned on qualifying loans. For the exemption to apply, the loan must be $5 million or less, for primarily a business or agricultural purpose, and made to borrowers residing or located in Wisconsin. The exemption first applies to taxable years beginning after December 31, 2022 and applies to loans on the books as of January 1, 2023 and to new loans made after that meet the qualifications. The Corporation currently projects that its Wisconsin state taxable income will be significantly reduced and/or eliminated in the future as a result of this provision. The Corporation reversed $2.8 million in income tax expense which had been recorded during 2023 and recognized a date of enactment valuation allowance for Wisconsin deferred tax assets of $2.8 million, resulting in a one-time $2.8 million increase in tax expense.
Deferred tax assets are deferred tax consequences attributable to deductible temporary differences and carryforwards. After the deferred tax asset has been measured using the applicable enacted tax rate and provisions of the enacted tax law, it is then necessary to assess the need for a valuation allowance. A valuation allowance is needed when, based on the weight of the
available evidence, it is more likely than not that some portion of the deferred asset will not be realized. The realization of deferred tax assets is dependent on the existence of taxable income of the appropriate character (e.g., ordinary or capital) within the carry-back and carry-forward periods available under tax law, which would consider future reversals of existing taxable temporary differences and available tax planning strategies. As of December 31, 2023, the state deferred tax valuation allowance was $3.3 million, reducing our Wisconsin deferred tax assets to $0. The Corporation had state net operating loss carryforwards of approximately $9.9$16.4 million and $10.7$6.3 million at December 31, 20172023 and 2016,2022, respectively, which can be usedit does not expect to offset due to having no expected future state taxable income. The Corporation believes it will be able to fully utilizeutilized its established deferred tax assets and Wisconsin state net operating losses under this law and therefore no valuation allowance has been established as of December 31, 2017.2022.
The provision for income taxes differs from that computed at the federal statutory corporate tax rate as follows:
| | | | | Year Ended December 31, | | | Year Ended December 31, |
| | | 2017 | | 2016 | | 2015 | | | 2023 | | 2022 | | 2021 |
| | | (Dollars in Thousands) | | | (Dollars in Thousands) |
| Income before income tax expense | | $ | 14,231 |
| | $ | 17,065 |
| | $ | 24,891 |
|
| Tax expense at statutory federal rate of 35.00%, 35.00% and 34.42% applied to income before income tax expense, respectively | | $ | 4,981 |
| | $ | 5,973 |
| | $ | 8,568 |
|
| Tax expense at statutory federal rate of 21% applied to income before income tax expense | |
| State income tax, net of federal effect | | 511 |
| | 206 |
| | 968 |
|
| Tax-exempt security and loan income, net of TEFRA adjustments | | (1,045 | ) | | (1,114 | ) | | (879 | ) |
| | Change in valuation allowance | |
| Change in valuation allowance | |
| Change in valuation allowance | |
| Bank-owned life insurance | | (438 | ) | | (341 | ) | | (330 | ) |
| | Tax credits, net | | (2,390 | ) | | (2,696 | ) | | (246 | ) |
| Deferred tax revaluation adjustment | | 629 |
| | — |
| | — |
|
| | Tax credits, net | |
| | Tax credits, net | |
| | Share-based compensation | |
| Share-based compensation | |
| Share-based compensation | |
| Section 162(m) limitation | |
| Other | | 78 |
| | 128 |
| | 296 |
|
| Total income tax expense | | $ | 2,326 |
| | $ | 2,156 |
| | $ | 8,377 |
|
| Effective tax rate | | 16.34 | % | | 12.63 | % | | 33.65 | % | Effective tax rate | | 21.45 | % | | 21.79 | % | | 23.97 | % |
There were no uncertain tax positions outstanding as of December 31, 20172023 and 2016.2022. As of December 31, 2017,2023, tax years remaining open for the State of Wisconsin tax were 20132019 through 2016.2022. Federal tax years that remained open were 20142020 through 2016.2022. As of December 31, 2017,2023, there were also no unrecognized tax benefits that are expected to significantly increase or decrease within the next twelve months.
Note 17 – Derivative Financial Instruments
The Corporation offers interest rate swap products directly to qualified commercial borrowers. The Corporation economically hedges client derivative transactions by entering into offsetting interest rate swap contracts executed with a third party. Derivative transactions executed as part of this program are not designated as accounting hedge relationshipsconsidered hedging instruments and are marked-to-market through earnings each period. The derivative contracts have mirror-image terms, which results in the positions’ changes in fair value primarily offsetting through earnings each period. The credit risk and risk of non-performance embedded in the fair value calculations is different between the dealer counterparties and the commercial borrowers which may result in a difference in the changes in the fair value of the mirror-image swaps. The Corporation incorporates credit valuation adjustments to appropriately reflect both its own non-performance risk and the counterparty’s risk in the fair value measurements. When evaluating the fair value of its derivative contracts for the effects of non-performance and credit risk, the Corporation considered the impact of netting and any applicable credit enhancements such as collateral postings, thresholds and guarantees.
At As of December 31, 2017,2023 and 2022 the aggregate amortizing notional value of interest rate swaps with various commercial borrowerscredit valuation allowance was $53.4 million. $117,000 and $38,000, respectively.
The Corporation receives fixed rates and pays floating rates based upon LIBORdesignated benchmark interest rates used on the swaps with commercial borrowers. These interest rate swaps mature between September 2018 and May 2034. Commercial borrower swaps are completed independently with each borrower and are not subject to master netting arrangements. These commercial borrower swaps were reported on the Consolidated Balance Sheets as a derivative asset of $942,000, included in accrued interest receivable and other assets as of December 31, 2017. In the event of default on a commercial borrower interest rate swap by the counterparty, a right of offset exists to allow for the commercial borrower to set off amounts due against the related commercial loan. As of December 31, 2017, no interest rate swaps were in default and therefore all values for the commercial borrower swaps are recorded on a gross basis on the Consolidated Balance Sheets.
At December 31, 2017, the aggregate amortizing notional value of interest rate swaps with dealer counterparties was also $53.4 million. The Corporation pays fixed rates and receives floating rates based upon LIBORdesignated benchmark interest rates used on the swaps with dealer counterparties. These interest rate swaps mature in September 2018 through May 2034. Dealer counterparty swaps wereare subject to master netting agreements among the contracts within our Bank and are reported on the Consolidated Balance Sheets as a net derivative liability of $942,000, included in accrued interest payable and other liabilities as of December 31, 2017.Sheet. The gross amount of dealer counterparty swaps, without regard to the enforceable master netting agreement, was $942,000 as noa gross derivative asset of $51.1 million and gross derivative liability of $7.9 million. No right of offset existed with the dealer counterparty swaps as of December 31, 2017.
The table below provides information about the balance sheet location and fair value of the Corporation’s derivative instruments to qualified commercial borrowers as of December 31, 2017 and 2016.
2023.
|
| | | | | | | | | | | | |
| | | Interest Rate Swap Contracts |
| | | Asset Derivatives | | Liability Derivatives |
| | | Balance Sheet Location | | Fair Value | | Balance Sheet Location | | Fair Value |
| | | (In Thousands) |
| Derivatives not designated as hedging instruments | | | | | | | | |
| December 31, 2017 | | Accrued interest receivable and other assets | | $ | 942 |
| | Accrued interest payable and other liabilities | | $ | 942 |
|
| December 31, 2016 | | Accrued interest receivable and other assets | | $ | 352 |
| | Accrued interest payable and other liabilities | | $ | 352 |
|
These derivative instruments held by the Corporation for the year ended December 31, 2017 were not considered hedging instruments. All changes in the fair value of these instruments are recorded in other non-interest income. Given the mirror-image terms of the outstanding derivative portfolio, the change in fair value for the years ended December 31, 2017, 20162023, 2022, and 20152021 had an insignificant impact toon the Consolidated Statements of Income.
During the fourth quarter of 2017, theThe Corporation also enteredenters into an interest rate swapswaps to manage interest rate risk and reduce the cost of match-funding certain long-term fixed rate loans. ThisThese derivative contract involvescontracts involve the receipt of floating rate interest from a counterparty in exchange for the Corporation making fixed-rate payments over the life of the agreement, without the exchange of the underlying notional value. This instrument isThe instruments are designated as a cash flow hedgehedges as the receipt of floating rate interest from the counterparty is used to manage interest rate risk associated with forecasted issuances ofrelated to cash outflows attributable to future wholesale deposit or short-term FHLB advances.advance borrowings. The change in the fair value of thisthese hedging instrumentinstruments is recorded in accumulated other comprehensive income and is subsequently reclassified into earnings in the period that the hedged transaction affectstransactions affect earnings.
As of December 31, 2017, the Corporation had one outstanding interest rate swap designated as a cash flow hedge with an aggregate notional value of $22.0 million. This interest rate swap matures in December 2027. A pre-tax unrealized loss of $122,000$3.5 million was recognized in accumulated other comprehensive income for the year ended December 31, 20172023, while a pre-tax unrealized gain of $8.5 million and $3.6 million was recognized in other comprehensive income for the years ended December 31, 2022 and 2021, respectively, and there waswere no ineffective portionportions of this hedge. Nothese hedges.
The Corporation also enters into interest rate swaps to mitigate market value volatility on certain long-term fixed securities. The objective of the hedge is to protect the Corporation against changes in fair value due to changes in benchmark interest rates. The instruments are designated as cash flowfair value hedges as the changes in the fair value of the interest rate swap are expected to offset changes in the fair value of the hedged item attributable to changes in the SOFR swap rate, the designated benchmark interest rate. These derivative contracts involve the receipt of floating rate interest from a counterparty in exchange for the Corporation making fixed-rate payments over the life of the agreement, without the exchange of the underlying notional value. The change in the fair value of these hedging instruments is recorded in accumulated other comprehensive income and is subsequently reclassified into earnings in the period that the hedged transactions affect earnings. Pre-tax unrealized gains of $22,000 and $602,000 were outstanding during 2016.recognized in other comprehensive income for the years ended December 31, 2023 and 2022, and there were no ineffective portions of these hedges. No pre-tax unrealized gain or loss was recognized in other comprehensive income for the year ended December 31, 2021.
| | | | | | | | | | | | | | | | | | | | | | | | | | |
| | As of December 31, 2023 |
| | Number of Instruments | | Notional Amount | | Weighted Average Maturity (In Years) | | Fair Value |
| | (Dollars in Thousands) |
| Included in Derivative assets | | | | | | | | |
| Derivatives not designated as hedging instruments | | | | | | | | |
| Interest rate swap agreements on loans with commercial loan clients | | 25 | | | $ | 249,454 | | | 6.33 | | $ | 7,904 | |
| Interest rate swap agreements on loans with third-party counter parties | | 106 | | | 939,156 | | | 6.06 | | 43,234 | |
| Derivatives designated as hedging instruments | | | | | | | | |
| Interest rate swap related to AFS securities | | 11 | | | $ | 12,500 | | | 8.28 | | $ | 624 | |
| Interest rate swap related to wholesale funding | | 9 | | | 96,400 | | | 2.47 | | 3,835 | |
| Included in Derivative liabilities | | | | | | | | |
| Derivatives not designated as hedging instruments | | | | | | | | |
| Interest rate swap agreements on loans with commercial loan clients | | 81 | | | $ | 689,702 | | | 5.96 | | $ | 51,138 | |
| | | | | | | | |
| Derivatives designated as hedging instruments | | | | | | | | |
| | | | | | | | |
| Interest rate swap related to wholesale funding | | 29 | | | $ | 306,255 | | | 3.89 | | $ | 811 | |
| | | | | | | | | | | | | | | | | | | | | | | | | | |
| | As of December 31, 2022 |
| | Number of Instruments | | Notional Amount | | Weighted Average Maturity (In Years) | | Fair Value |
| | (Dollars in Thousands) |
| Included in Derivative assets | | | | | | | | |
| Derivatives not designated as hedging instruments | | | | | | | | |
| Interest rate swap agreements on loans with commercial loan clients | | 2 | | | $ | 65,352 | | | 4.83 | | $ | 1,010 | |
| Interest rate swap agreements on loans with third-party counter parties | | 84 | | | 744,233 | | | 7.37 | | 60,409 | |
| Derivatives designated as hedging instruments | | | | | | | | |
| Interest rate swap related to AFS securities | | 11 | | | $ | 12,500 | | | 9.28 | | $ | 602 | |
| Interest rate swap related to wholesale funding | | 11 | | | 116,400 | | | 2.88 | | 6,560 | |
| Included in Derivative liabilities | | | | | | | | |
| Derivatives not designated as hedging instruments | | | | | | | | |
| Interest rate swap agreements on loans with commercial loan clients | | 82 | | | $ | 678,881 | | | 7.61 | | $ | 61,419 | |
| | | | | | | | |
| | | | | | | | |
| | | | | | | | |
| | | | | | | | |
Note 18 – Commitments and Contingencies
The Bank is party to financial instruments with off-balance-sheetoff-balance sheet risk in the normal course of business to meet the financing needs of clients. These financial instruments include commitments to extend credit and standby letters of credit and involve, to varying degrees, elements of credit and interest rate risk in excess of the amounts recognized in the Consolidated Financial Statements. The contract amounts reflect the extent of involvement the Bank has in these particular classes of financial instruments.
In the event of non-performance, the Bank’s exposure to credit loss for commitments to extend credit and standby letters of credit is represented by the contractual amount of these instruments. The Bank uses the same credit policies in making commitments and conditional obligations as they do for instruments reflected in the Consolidated Financial Statements. An accrual for credit losses on financial instruments with off-balance-sheetoff-balance sheet risk would be recorded separate from any valuation account related to any such recognized financial instrument. As of December 31, 20172023 and 2016,2022, there were no accrued credit losses for financial instruments with off-balance-sheetoff-balance sheet risk.
Financial instruments whose contract amounts represent potential credit risk at December 31, 2017 and 2016, respectively, arewere as follows:
| | | | | | | | | | | | | | |
| | | At December 31, |
| | | 2023 | | 2022 |
| | | (In Thousands) |
| Commitments to extend credit, primarily commercial loans | | $ | 1,198,031 | | | $ | 913,042 | |
| Standby letters of credit | | 17,938 | | | 15,013 | |
|
| | | | | | | | |
| | | At December 31, |
| | | 2017 | | 2016 |
| | | (In Thousands) |
| Commitments to extend credit, primarily commercial loans | | $ | 497,993 |
| | $ | 539,146 |
|
| Standby letters of credit | | 13,845 |
| | 11,771 |
|
Commitments to extend credit are agreements to lend to a client as long as there is no violation of any condition in the contract. Commitments generally have fixed expiration dates or other termination clauses and may have a fixed interest rate or a rate
which varies with the prime rate or other market indices and may require payment of a fee. Since some commitments expire without being drawn upon, the total commitment amounts do not necessarily represent future cash requirements of the Bank. The Bank evaluates the creditworthiness of each client on a case-by-case basis and generally extends credit only on a secured basis. Collateral obtained varies but consists primarily of commercial real estate, accounts receivable, inventory, equipment, and securities. There is generally no market for commercial loan commitments, the fair value of which would approximate the present value of any fees expected to be received as a result of the commitment. These are not considered to be material to the financial statements.
Standby letters of credit are conditional commitments issued by the Bank to guarantee the performance of a client to a third party. Generally, standby letters of credit expire within one year and are collateralized by accounts receivable, equipment,
inventory, and commercial properties. The credit risk involved in issuing letters of credit is essentially the same as that involved in extending loan facilities to clients. The fair value of standby letters of credit is recorded as a liability when the standby letter of credit is issued. The fair value has been estimated to approximate the fees received by the Bank for issuance. The fees are recorded into income and the fair value of the guarantee is decreased ratably over the term of the standby letter of credit.
In the ordinary course of business, theThe Corporation sells the guaranteed portions of SBA 7(a) and 504 loans, as well as participation interests in other, non-SBA originated, loans to third parties. The Corporation has a continuing involvement in each of the transferred lending arrangements by way of relationship management and servicing the loans, as well as being subject to normal and customary requirements of the SBA loan program and standard representations and warranties related to sold amounts. In the event of a loss resulting from default and a determination by the SBA that there is a deficiency in the manner in which the loan was originated, funded, or serviced by the Corporation, the SBA may require the Corporation to repurchase the loan, deny its liability under the guaranty, reduce the amount of the guaranty, or, if it has already paid under the guaranty, seek recovery of the principal loss related to the deficiency from the Corporation. The Corporation must comply with applicable SBA regulations in order to maintain the guaranty. In addition, the Corporation retains the option to repurchase the sold guaranteed portion of an SBA loan if the loan defaults.
Management has assessed estimated losses inherent in the outstanding guaranteed portions of SBA loans sold in accordance with ASC 450, Contingencies, and determined a recourse reserve based on the probability of future losses for these loans to be $2.8 million$955,000 and $1.8 million$441,000 at December 31, 20172023 and 2016,2022, respectively, which is reported in accrued interest payable and other liabilities on the Consolidated Balance Sheets. During the years ended December 31, 2017 and 2016, a $2.2 million and $2.1 million recourse reserve provision was recorded, respectively.
The summary of the activity in the SBA recourse reserve for the year ended December 31, 2017 and 2016 is as follows:
| | | | | | | | | | | | | | |
| | As of and For the Year Ended December 31, |
| | | 2023 | | 2022 |
| | | (In Thousands) |
| Balance at the beginning of the period | | $ | 441 | | | $ | 635 | |
| SBA recourse provision (benefit) | | 775 | | | (188) | |
| Charge-offs, net | | (261) | | | (6) | |
| Balance at the end of the period | | $ | 955 | | | $ | 441 | |
|
| | | | | | | | |
| | | At December 31, |
| | | 2017 | | 2016 |
| | | (In Thousands) |
| Balance at the beginning of the period | | $ | 1,750 |
| | $ | — |
|
| SBA recourse provision | | 2,240 |
| | 2,068 |
|
| Charge-offs, net | | (1,141 | ) | | (318 | ) |
| Balance at the end of the period | | $ | 2,849 |
| | $ | 1,750 |
|
In the normal course of business, various legal proceedings involving the Corporation are pending. Management, based upon advice from legal counsel, does not anticipate any significant losses as a result of these actions. Management believes that any liability arising from any such proceedings currently existing or threatened will not have a material adverse effect on the Corporation’s financial position, results of operations, and cash flows.
Note 19 – Fair Value Disclosures
The Corporation determines the fair values of its financial instruments based on the fair value hierarchy established in ASC Topic 820, which requires an entity to maximize the use of observable inputs and minimize the use of unobservable inputs when measuring fair value. Fair value is defined as the price that would be received in an orderly transaction that is not a forced liquidation or distressed sale at the measurement date and is based on exit prices. Fair value includes assumptions about risk, such as nonperformance risk in liability fair values, and is a market-based measurement, not an entity-specific measurement. The standard describes three levels of inputs that may be used to measure fair value.
Level 1 — Level 1 inputs are unadjusted quoted prices in active markets for identical assets or liabilities that the Corporation has the ability to access at the measurement date.
Level 2 — Level 2 inputs are inputs, other than quoted prices included with Level 1, that are observable for the asset or liability either directly or indirectly, such as quoted prices for similar assets or liabilities; quoted prices in markets that are not active; or other inputs that are observable or can be corroborated by observable market data for substantially the full term of the assets or liabilities.
Level 3 — Level 3 inputs are supported by little or no market activity and are significant to the fair value of the assets or liabilities.
In instances where the determination of the fair value measurement is based on inputs from different levels of the fair value hierarchy, the level in the fair value hierarchy within which the entire fair value measurement falls is based on the lowest level input that is significant to the fair value measurement in its entirety. The Corporation’s assessment of the significance of a particular input to the fair value measurement in its entirety requires judgment and considers factors specific to the asset or liability.
Assets and liabilities measured at fair value on a recurring basis, segregated by fair value hierarchy level, are summarized below:
| | | | | December 31, 2017 |
| | | Fair Value Measurements Using | | |
| | | Level 1 | | Level 2 | | Level 3 | | Total |
| | December 31, 2023 | | | | December 31, 2023 |
| | Fair Value Measurements Using | | | | Fair Value Measurements Using | | |
| | Level 1 | | | | Level 1 | | Level 2 | | Level 3 | | Total |
| | | (In Thousands) | | | (In Thousands) |
| Assets: | | | | | | | | |
| Securities available-for-sale: | | | | | | | | |
| U.S. government agency obligations - government-sponsored enterprises | | $ | — |
| | $ | 1,000 |
| | $ | — |
| | $ | 1,000 |
|
| Municipal obligations | | — |
| | 9,414 |
| | — |
| | 9,414 |
|
| Collateralized mortgage obligations - government issued | | — |
| | 22,249 |
| | — |
| | 22,249 |
|
| Collateralized mortgage obligations - government-sponsored enterprises | | — |
| | 90,305 |
| | — |
| | 90,305 |
|
| Other securities | | — |
| | 3,037 |
| | — |
| | 3,037 |
|
| Securities available-for-sale: | |
| Securities available-for-sale: | |
| U.S. treasuries | |
| U.S. treasuries | |
| U.S. treasuries | |
| U.S. government agency securities - government-sponsored enterprises | |
| Municipal securities | |
| Residential mortgage-backed securities - government issued | |
| Residential mortgage-backed securities - government-sponsored enterprises | |
| Commercial mortgage-backed securities - government issued | |
| Commercial mortgage-backed securities - government-sponsored enterprises | |
| | Interest rate swaps | |
| Interest rate swaps | |
| Interest rate swaps | | — |
| | 942 |
| | — |
| | 942 |
|
| Liabilities: | | | | | | | |
|
| Interest rate swaps | | — |
| | 1,064 |
| | — |
| | 1,064 |
|
| Interest rate swaps | |
| Interest rate swaps | |
| | | December 31, 2022 | | | | December 31, 2022 |
| | | | | | | | | | | | Fair Value Measurements Using | | |
| | | December 31, 2016 |
| | | Fair Value Measurements Using | | |
| | | Level 1 | | Level 2 | | Level 3 | | Total |
| | Level 1 | | | | Level 1 | | Level 2 | | Level 3 | | Total |
| | | (In Thousands) | | | (In Thousands) |
| Assets: | | | | | | | | |
| Securities available-for-sale: | | | | | | | | |
| U.S. government agency obligations - government-sponsored enterprises | | $ | — |
| | $ | 6,295 |
| | $ | — |
| | $ | 6,295 |
|
| Municipal obligations | | — |
| | 8,156 |
| | — |
| | 8,156 |
|
| Asset backed securities | | — |
| | 1,081 |
| | — |
| | 1,081 |
|
| Collateralized mortgage obligations - government issued | | — |
| | 31,213 |
| | — |
| | 31,213 |
|
| Collateralized mortgage obligations - government-sponsored enterprises | | — |
| | 99,148 |
| | — |
| | 99,148 |
|
| Securities available-for-sale: | |
| Securities available-for-sale: | |
| U.S. treasuries | |
| U.S. treasuries | |
| U.S. treasuries | |
| U.S. government agency securities - government-sponsored enterprises | |
| Municipal securities | |
| Residential mortgage-backed securities - government issued | |
| Residential mortgage-backed securities - government-sponsored enterprises | |
| Commercial mortgage-backed securities - government issued | |
| Commercial mortgage-backed securities - government-sponsored enterprises | |
| | Interest rate swaps | |
| Interest rate swaps | |
| Interest rate swaps | | — |
| | 352 |
| | — |
| | 352 |
|
| Liabilities: | | | | | | | | | Liabilities: | | |
| Interest rate swaps | | — |
| | 352 |
| | — |
| | 352 |
|
For assets and liabilities measured at fair value on a recurring basis, there were no transfers between the levels during the year ended December 31, 20172023 or 20162022 related to the above measurements.
Assets and liabilities measured at fair value on a non-recurring basis, segregated by fair value hierarchy, are summarized below:
| | | | | | | | | | | | | | | | | | | | | | | | | | |
| | | December 31, 2023 |
| | | Fair Value Measurements Using | | |
| | | Level 1 | | Level 2 | | Level 3 | | Total |
| | | (In Thousands) |
| Collateral-dependent loans | | $ | — | | | $ | — | | | $ | 4,917 | | | $ | 4,917 | |
| Repossessed assets | | — | | | — | | | 247 | | | 247 | |
| Loan servicing rights | | — | | | — | | | 1,356 | | | 1,356 | |
| | | | | December 31, 2022 |
| | | | December 31, 2017 |
| | | Fair Value Measurements Using | | |
| | | Level 1 | | Level 2 | | Level 3 | | Total | | Level 1 | | Level 2 | | Level 3 | | Total |
| | | (In Thousands) | | | (In Thousands) |
| Impaired loans | | $ | — |
| | $ | 10,063 |
| | $ | 5,084 |
| | $ | 15,147 |
|
| Foreclosed properties | | — |
| | 1,069 |
| | — |
| | 1,069 |
|
| Repossessed assets | |
| Loan servicing rights | |
|
| | | | | | | | | | | | | | | | |
| | | December 31, 2016 |
| | | Fair Value Measurements Using | | |
| | | Level 1 | | Level 2 | | Level 3 | | Total |
| | | (In Thousands) |
| Impaired loans | | $ | — |
| | $ | 12,268 |
| | $ | 1,097 |
| | $ | 13,365 |
|
| Foreclosed properties | | — |
| | 1,472 |
| | — |
| | 1,472 |
|
ImpairedCollateral-dependent loans were written down to the fair value of their underlying collateral less costs to sell of $15.1$4.9 million and $13.4$1.0 million at December 31, 20172023 and 2016,2022, respectively, through the establishment of specific reserves or by recording charge-offs when the carrying value exceeded the fair value of the underlying collateral of impaired loans. Valuation techniques consistent with the market approach, income approach, or cost approach were used to measure fair value and primarilyvalue. These techniques included observable inputs for the individual impaired loans being evaluated such as current appraisals, recent sales of similar assets, or other observable market data, and are reflected within Level 2 of the hierarchy. In cases where an input is unobservable specificallyinputs, typically when discounts are applied to appraisal values to adjust such values to current market conditions or to reflect net realizable value, the impaired loan balance is reflected within Level 3 of the hierarchy.values. The quantification of unobservable inputs for Level 3 impaired loan values range from 15%10% - 21%100% as of the measurement date of December 31, 2017.2023. The weighted average of those unobservable inputs was 18%57%. The majority of the impaired loans in the Level 3 category are considered collateral dependent loans or are supported by aan SBA guaranty.
Foreclosed properties,Repossessed assets, upon initial recognition, are remeasured and reported at fair value through a charge-off to the allowance for loan and leasecredit losses, if deemed necessary, based upon the fair value of the foreclosed property.repossessed asset. The fair value of a foreclosed property,repossessed asset, upon initial recognition, is estimated using a market approach or Level 2 inputs based on observable market data, typicallysuch as a current appraisal, recent sale price of similar assets, or Level 3 inputs based upon assumptions specific to the individual property or equipment. Level 3 inputs typically include unobservable inputsequipment, such as management applied discounts used to further reduce values to a net realizable value and may be used in situations when observable inputs become stale. Foreclosed property fair value inputs may transition to Level 1
Loan servicing rights represent the asset retained upon receipt of an accepted offer for the sale of the related foreclosed property.guaranteed portion of certain SBA loans. When SBA loans are sold, servicing rights are initially recorded at fair value with the income statement effect recorded in gains on sales of loans. The servicing rights are subsequently measured using the amortization method, which requires amortization into interest income in proportion to, and over the period of, the estimated future net servicing income of the underlying loans.
The Corporation periodically reviews this portfolio for impairment and engages a third-party valuation firm to assess the fair value of the overall servicing rights portfolio. Loan servicing rights do not trade in an active, open market with readily observable prices. While sales of loan servicing rights do occur, the precise terms and conditions typically are not readily available to allow for a “quoted price for similar assets” comparison. Accordingly, the Corporation utilizes an independent valuation from a third party which uses a discounted cash flow model to estimate the fair value of its loan servicing rights. The valuation model incorporates prepayment assumptions to project loan servicing rights cash flows based on the current interest rate scenario, which is then discounted to estimate an expected fair value of the loan servicing rights. The valuation model considers portfolio characteristics of the underlying serviced portion of the SBA loans and uses the following significant unobservable inputs: (1) constant prepayment rate (“CPR”) assumptions based on the SBA sold pools historical CPR as quoted in Bloomberg and (2) a discount rate. Due to the nature of the valuation inputs, loan servicing rights are classified in Level 3 of the fair value hierarchy.
Fair Value of Financial Instruments
The Corporation is required to disclose estimated fair values for its financial instruments. Fair value estimates, methods and assumptions, consistent with exit price concepts for fair value measurements, are set forth below:
| | | | | | | | | | | | | | | | | | | | | | | | | | | | | | | | |
| | December 31, 2023 |
| | Carrying
Amount | | Fair Value |
| | | | Total | | Level 1 | | Level 2 | | Level 3 |
| | | (In Thousands) |
| Financial assets: | | | | | | | | | | |
| Cash and cash equivalents | | $ | 139,510 | | | $ | 139,510 | | | $ | 139,510 | | | $ | — | | | $ | — | |
| Securities available-for-sale | | 297,006 | | | 297,006 | | | — | | | 297,006 | | | — | |
| Securities held-to-maturity | | 8,503 | | | 8,255 | | | — | | | 8,255 | | | — | |
| Loans held for sale | | 4,589 | | | 4,956 | | | — | | | 4,956 | | | — | |
| Loans and lease receivables, net | | 2,818,986 | | | 2,789,731 | | | — | | | — | | | 2,789,731 | |
| | | | | | | | | | |
| Federal Home Loan Bank stock | | 12,042 | | | N/A | | N/A | | N/A | | N/A |
| Accrued interest receivable | | 13,275 | | | 13,275 | | | 13,275 | | | — | | | — | |
| Interest rate swaps | | 55,597 | | | 55,597 | | | — | | | 55,597 | | | — | |
| Financial liabilities: | | | | | | | | | | |
| Deposits | | 2,796,779 | | | 2,795,463 | | | 2,101,939 | | | 693,524 | | | — | |
| Federal Home Loan Bank advances and other borrowings | | 330,916 | | | 320,287 | | | — | | | 320,287 | | | — | |
| | | | | | | | | | |
| Accrued interest payable | | 10,860 | | | 10,860 | | | 10,860 | | | — | | | — | |
| Interest rate swaps | | 51,949 | | | 51,949 | | | — | | | 51,949 | | | — | |
| Off-balance sheet items: | | | | | | | | | | |
| Standby letters of credit | | 190 | | | 190 | | | — | | | — | | | 190 | |
| | | | | | | | | | |
|
| | | | | | | | | | | | | | | | | | | | |
| | | December 31, 2017 |
| | | Carrying
Amount | | Fair Value |
| | | | | Total | | Level 1 | | Level 2 | | Level 3 |
| | | (In Thousands) |
| Financial assets: | | | | | | | | | | |
| Cash and cash equivalents | | $ | 52,539 |
| | $ | 52,539 |
| | $ | 35,114 |
| | $ | 17,425 |
| | $ | — |
|
| Securities available-for-sale | | 126,005 |
| | 126,005 |
| | — |
| | 126,005 |
| | — |
|
| Securities held-to-maturity | | 37,778 |
| | 37,696 |
| | — |
| | 37,696 |
| | — |
|
| Loans held for sale | | 2,194 |
| | 2,413 |
| | — |
| | 2,413 |
| | — |
|
| Loans and lease receivables, net | | 1,482,832 |
| | 1,482,664 |
| | — |
| | 10,063 |
| | 1,472,601 |
|
| Bank-owned life insurance | | 40,323 |
| | 40,323 |
| | 40,323 |
| | — |
| | — |
|
| Federal Home Loan Bank and Federal Reserve Bank stock | | 5,670 |
| | 5,670 |
| | — |
| | — |
| | 5,670 |
|
| Accrued interest receivable | | 5,019 |
| | 5,019 |
| | 5,019 |
| | — |
| | — |
|
| Interest rate swaps | | 942 |
| | 942 |
| | — |
| | 942 |
| | — |
|
| Financial liabilities: | | | | | | | | | | |
| Deposits | | 1,394,331 |
| | 1,391,801 |
| | 1,010,147 |
| | 381,654 |
| | — |
|
| Federal Home Loan Bank advances and other borrowings | | 207,898 |
| | 191,441 |
| | — |
| | 191,441 |
| | — |
|
| Junior subordinated notes | | 10,019 |
| | 8,836 |
| | — |
| | — |
| | 8,836 |
|
| Accrued interest payable | | 2,095 |
| | 2,095 |
| | 2,095 |
| | — |
| | — |
|
| Interest rate swaps | | 1,064 |
| | 1,064 |
| | — |
| | 1,064 |
| | — |
|
| Off-balance-sheet items: | | | | | | | | | | |
| Standby letters of credit | | 75 |
| | 75 |
| | — |
| | — |
| | 75 |
|
N/A = The fair value is not applicable due to restrictions placed on transferability
| | | | | | | | | | | | | | | | | | | | | | | | | | | | | | | | |
| | | December 31, 2022 |
| | Carrying
Amount | | Fair Value |
| | | | Total | | Level 1 | | Level 2 | | Level 3 |
| | | (In Thousands) |
| Financial assets: | | | | | | | | | | |
| Cash and cash equivalents | | $ | 102,682 | | | $ | 102,682 | | | $ | 102,682 | | | $ | — | | | $ | — | |
| Securities available-for-sale | | 212,024 | | | 212,024 | | | — | | | 212,024 | | | — | |
| Securities held-to-maturity | | 12,635 | | | 12,270 | | | — | | | 12,270 | | | — | |
| Loans held for sale | | 2,632 | | | 2,829 | | | — | | | 2,829 | | | — | |
| Loans and lease receivables, net | | 2,418,836 | | | 2,394,702 | | | — | | | — | | | 2,394,702 | |
| | | | | | | | | | |
| Federal Home Loan Bank stock | | 17,812 | | | N/A | | N/A | | N/A | | N/A |
| Accrued interest receivable | | 9,403 | | | 9,403 | | | 9,403 | | | — | | | — | |
| Interest rate swaps | | 68,581 | | | 68,543 | | | — | | | 68,543 | | | — | |
| Financial liabilities: | | | | | | | | | | |
| Deposits | | 2,168,206 | | | 2,167,444 | | | 1,827,215 | | | 340,229 | | | — | |
| Federal Home Loan Bank advances and other borrowings | | 456,808 | | | 440,242 | | | — | | | 440,242 | | | — | |
| | | | | | | | | | |
| Accrued interest payable | | 4,053 | | | 4,053 | | | 4,053 | | | — | | | — | |
| Interest rate swaps | | 61,419 | | | 61,419 | | | — | | | 61,419 | | | — | |
| Off-balance sheet items: | | | | | | | | | | |
| Standby letters of credit | | 184 | | | 184 | | | — | | | — | | | 184 | |
| | | | | | | | | | |
|
| | | | | | | | | | | | | | | | | | | | |
| | | December 31, 2016 |
| | | Carrying
Amount | | Fair Value |
| | | | | Total | | Level 1 | | Level 2 | | Level 3 |
| | | (In Thousands) |
| Financial assets: | | | | | | | | | | |
| Cash and cash equivalents | | $ | 77,517 |
| | $ | 77,517 |
| | $ | 55,622 |
| | $ | 21,895 |
| | $ | — |
|
| Securities available-for-sale | | 145,893 |
| | 145,893 |
| | — |
| | 145,893 |
| | — |
|
| Securities held-to-maturity | | 38,612 |
| | 38,520 |
| | — |
| | 38,520 |
| | — |
|
| Loans held for sale | | 1,111 |
| | 1,222 |
| | — |
| | 1,222 |
| | — |
|
| Loans and lease receivables, net | | 1,429,763 |
| | 1,447,044 |
| | — |
| | 12,268 |
| | 1,434,776 |
|
| Bank-owned life insurance | | 39,048 |
| | 39,048 |
| | — |
| | 39,048 |
| | — |
|
| Federal Home Loan Bank and Federal Reserve Bank stock | | 2,131 |
| | 2,131 |
| | — |
| | 2,131 |
| | — |
|
| Accrued interest receivable | | 4,677 |
| | 4,677 |
| | 4,677 |
| | — |
| | — |
|
| Interest rate swaps | | 352 |
| | 352 |
| | — |
| | 352 |
| | — |
|
| Financial liabilities: | | | | | | | | | | |
| Deposits | | 1,538,855 |
| | 1,539,413 |
| | 1,063,720 |
| | $ | 475,693 |
| | — |
|
| Federal Home Loan Bank advances and other borrowings | | 59,676 |
| | 60,893 |
| | — |
| | 60,893 |
| | — |
|
| Junior subordinated notes | | 10,004 |
| | 9,072 |
| | — |
| | — |
| | 9,072 |
|
| Accrued interest payable | | 1,765 |
| | 1,765 |
| | 1,765 |
| | — |
| | — |
|
| Interest rate swaps | | 352 |
| | 352 |
| | — |
| | 352 |
| | — |
|
| Off-balance-sheet items: | | | | | | | | | | |
| Standby letters of credit | | 58 |
| | 58 |
| | — |
| | — |
| | 58 |
|
Disclosure of fair value information about financial instruments, for which it is practicable to estimate that value, is required whether or not recognized in the Consolidated Balance Sheets. In cases where quoted market prices are not available, fair values are based on estimates using present value or other valuation techniques. Those techniques are significantly affected by the assumptions used, including the discount rate and estimates of future cash flows. In that regard, the derived fair value estimates cannot be substantiated by comparison to independent markets and, in many cases, could not be realized in immediate settlement of the instruments. Certain financial instruments and all non-financial instruments are excluded from the disclosure requirements. Accordingly, the aggregate fair value amounts presented do not necessarily represent the underlying value of the Corporation.
Cash and Cash Equivalents: The carrying amount reported for cash and due from banks and interest bearing deposits held by the Corporation approximates fair value because of its immediate availability and because it does not present unanticipated credit concerns. As of December 31, 2017 and 2016, the Corporation held $17.4 million and $20.3 million, respectively, of commercial paper. The fair value of commercial paper is classified as a Level 2 input due to the lack of available independent pricing sources.
Securities: The fair value measurements of investment securities are determined by a third-party pricing service which considers observable data that may include dealer quotes, market spreads, cash flows, the U.S. Treasury yield curve, trade execution data, market consensus prepayment speeds, credit information and the securities’ terms and conditions, among other things. The fair value measurements are subject to independent verification by another pricing source on a quarterly basis to review for reasonableness. Any significant differences in pricing are reviewed with appropriate members of management who have the relevant technical expertise to assess the results. The Corporation has determined that these valuations are classified in Level 2 of the fair value hierarchy. When the independent pricing service does not provide a fair value measurement for a particular security, the Corporation will estimate the fair value based on specific information about each security. Fair values derived in this manner are classified in Level 3 of the fair value hierarchy.
Loans Held for Sale: Loans held for sale, which consist of the guaranteed portions of SBA 7(a) loans, are carried at the lower of cost or estimated fair value. The estimated fair value is based on what secondary markets are currently offering for portfolios with similar characteristics.
Loans and Lease Receivables, net: The fair value estimation process for the loan portfolio uses an exit price concept and reflects discounts that the Corporation believes are consistent with liquidity discounts in the market place. Fair values are estimated for portfolios of loans with similar financial characteristics. The fair value of performing and nonperforming loans is calculated by discounting scheduled and expected cash flows through the estimated maturity using estimated market rates that reflect the credit and interest rate risk inherent in the portfolio of loans and then applying a discount factor based upon the embedded credit risk of the loan and the fair value of collateral securing nonperforming loans when the loan is collateral dependent. The estimate of maturity is based on the Bank’s historical experience with repayments for each loan classification, modified, as required, by an estimate of the effect of current economic and lending conditions. Significant unobservable inputs include, but are not limited to, discounts (investor yield premiums) applied to fair value calculations to further determine the exit price value of a portfolio of loans.
Federal Home Loan Bank and Federal Reserve Bank Stock: The carrying amount of FHLB and FRB stock equals its fair value because the shares may be redeemed by the FHLB and the FRB at their carrying amount of $100 per share.
Bank-Owned Life Insurance: The carrying amount of the cash surrender value of life insurance approximates its fair value as the carrying value represents the current settlement amount.
Accrued Interest Receivable and Accrued Interest Payable: The carrying amounts reported for accrued interest receivable and accrued interest payable approximate fair value because of their immediate availability and because they do not present unanticipated credit concerns.
Deposits: The fair value of deposits with no stated maturity, such as demand deposits and money market accounts, is equal to the amount payable on demand. The fair value of time deposits is based on the discounted value of contractual cash flows. The discount rate is estimated using the rates currently offered for deposits of similar remaining maturities. The fair value estimates do not include the intangible value that results from the funding provided by deposit liabilities compared to borrowing funds in the market.
Borrowed Funds: Market rates currently available to the Corporation and Bank for debt with similar terms and remaining maturities are used to estimate fair value of existing debt.
Interest Rate Swaps: The carrying amount and fair value of existing derivative financial instruments are based upon independent valuation models, which use widely accepted valuation techniques, including discounted cash flow analysis on the expected cash flows of each derivative contract. This analysis reflects the contractual terms of the derivatives, including the period to maturity, and uses observable market-based inputs, including interest rate curves and implied volatilities. The Corporation incorporates credit valuation adjustments to appropriately reflect both its own nonperformance risk and the respective counterparty’s nonperformance risk in the fair value measurements. In adjusting the fair value of its derivative contracts for the effect of nonperformance risk, the Corporation considers the impact of netting and any applicable credit enhancements, such as collateral postings, thresholds, mutual puts and guarantees.
Financial Instruments with Off-Balance-Sheet Risks: The fair value
Limitations: Fair value estimates are made at a discrete point in time, based on relevant market information and information about the financial instrument. These estimates do not reflect any premium or discount that could result from offering for sale at one time the Corporation’s entire holding of a particular financial instrument. Because no market exists for a significant portion of the Corporation’s financial instruments, fair value estimates are based on judgments regarding future expected loss experience, current economic conditions, risk characteristics of various financial instruments and other factors. These estimates are subjective in nature and involve uncertainties and matters of significant judgment and, therefore, cannot be determined with precision. Changes in assumptions could significantly affect the estimates.
Fair value estimates are based on existing balance sheet financial instruments without attempting to estimate the value of anticipated future business and the value of assets and liabilities that are not considered financial instruments. In addition, the tax ramifications related to the realization of the unrealized gains and losses can have a significant effect on fair value estimates and are not considered in the estimates.
Note 20 – Condensed Parent Only Financial Information
The following represents the condensed financial information of FBFSthe Corporation only:
Condensed Balance Sheets
| | | | | | | | | | | | | | |
| | | December 31,
2023 | | December 31,
2022 |
| | | (In Thousands) |
| Assets | | | | |
| Cash and cash equivalents | | $ | 2,027 | | | $ | 3,129 | |
| Investments in subsidiaries, at equity | | 339,854 | | | 294,109 | |
| Premises and equipment, net | | 51 | | | 66 | |
| | | | |
| Other assets | | 697 | | | 1,239 | |
| Total assets | | $ | 342,629 | | | $ | 298,543 | |
| Liabilities and Stockholders’ Equity | | | | |
| Junior subordinated notes and other borrowings | | $ | 49,396 | | | $ | 34,341 | |
| | | | |
| Accrued interest payable and other liabilities | | 3,645 | | | 3,562 | |
| Total liabilities | | 53,041 | | | 37,903 | |
| Stockholders’ equity | | 289,588 | | | 260,640 | |
| Total liabilities and stockholders’ equity | | $ | 342,629 | | | $ | 298,543 | |
|
| | | | | | | | |
| | | As of December 31, |
| | | 2017 | | 2016 |
| | | (In Thousands) |
| Assets | | | | |
| Cash and due from banks | | $ | 1,472 |
| | $ | 127 |
|
| Investments in subsidiaries, at equity | | 196,810 |
| | 196,221 |
|
| Leasehold improvements and equipment, net | | 2,067 |
| | 1,605 |
|
| Other assets | | 5,993 |
| | 4,738 |
|
| Total assets | | $ | 206,342 |
| | $ | 202,691 |
|
| Liabilities and Stockholders’ Equity | | | | |
| Borrowed funds | | $ | 33,742 |
| | $ | 33,512 |
|
| Other liabilities | | 3,322 |
| | 7,529 |
|
| Total liabilities | | 37,064 |
| | 41,041 |
|
| Stockholders’ equity | | 169,278 |
| | 161,650 |
|
| Total liabilities and stockholders’ equity | | $ | 206,342 |
| | $ | 202,691 |
|
Condensed Statements of Income
| | | | | | | | | | | | | | | | | | | | |
| | | For the Year Ended December 31, |
| | | 2023 | | 2022 | | 2021 |
| | | (In Thousands) |
| Net interest expense | | $ | 1,989 | | | $ | 2,295 | | | $ | 2,539 | |
| Non-interest income | | | | | | |
| Consulting and rental income from consolidated subsidiaries | | 5,644 | | | 5,794 | | | 2,417 | |
| Other non-interest income | | 43 | | | 69 | | | 34 | |
| Total non-interest income | | 5,687 | | | 5,863 | | | 2,451 | |
| Non-interest expense | | 8,234 | | | 7,633 | | | 5,747 | |
| Loss before income tax benefit and equity in undistributed net income of consolidated subsidiaries | | 4,536 | | | 4,065 | | | 5,835 | |
| Income tax benefit | | 337 | | | 1,387 | | | 1,483 | |
| Loss before equity in undistributed net income of consolidated subsidiaries | | 4,199 | | | 2,678 | | | 4,352 | |
| Equity in undistributed net income of consolidated subsidiaries | | 41,226 | | | 43,536 | | | 40,107 | |
| Net income | | $ | 37,027 | | | $ | 40,858 | | | $ | 35,755 | |
|
| | | | | | | | | | | | |
| | | For the Year Ended December 31, |
| | | 2017 | | 2016 | | 2015 |
| | | (In Thousands) |
| Net interest expense | | $ | 2,744 |
| | $ | 2,799 |
| | $ | 2,777 |
|
| Non-interest income | | | | | | |
| Consulting and rental income from consolidated subsidiaries | | 19,139 |
| | 16,036 |
| | 13,398 |
|
| Other | | 34 |
| | 33 |
| | 35 |
|
| Total non-interest income | | 19,173 |
| | 16,069 |
| | 13,433 |
|
| Non-interest expense | | 21,575 |
| | 19,250 |
| | 16,854 |
|
| Loss before income tax benefit and equity in undistributed net income of consolidated subsidiaries | | 5,146 |
| | 5,980 |
| | 6,198 |
|
| Income tax benefit | | 1,965 |
| | 2,170 |
| | 2,527 |
|
| Loss before equity in undistributed net income of consolidated subsidiaries | | 3,181 |
| | 3,810 |
| | 3,671 |
|
| Equity in undistributed net income of consolidated subsidiaries | | 15,086 |
| | 18,719 |
| | 20,185 |
|
| Net income | | $ | 11,905 |
| | $ | 14,909 |
| | $ | 16,514 |
|
Condensed Statements of Cash Flows
| | | | | | | | | | | | | | | | | | | | |
| | | For the Year Ended December 31, |
| | | 2023 | | 2022 | | 2021 |
| | | (In Thousands) |
| Operating activities | | | | | | |
| Net income | | $ | 37,027 | | | $ | 40,858 | | | $ | 35,755 | |
| Adjustments to reconcile net income to net cash used in operating activities: | | | | | | |
| Equity in undistributed earnings of consolidated subsidiaries | | (41,226) | | | (43,536) | | | (40,107) | |
| Share-based compensation | | 2,977 | | | 2,584 | | | 2,513 | |
| Excess tax benefit from share-based compensation | | (91) | | | (91) | | | (27) | |
| | | | | | |
| Net (decrease) increase in other liabilities | | (1,854) | | | 2,592 | | | (2,090) | |
| Other, net | | 1,207 | | | (538) | | | 3,413 | |
| Net cash (used in) provided by operating activities | | (1,960) | | | 1,869 | | | (543) | |
| Investing activities | | | | | | |
| Dividends received from subsidiaries | | 12,100 | | | 2,008 | | | 8,534 | |
| Proceeds from redemption of Trust II stock | | — | | | 315 | | | — | |
| Capital contributions to subsidiaries | | (15,000) | | | — | | | — | |
| Net cash (used in) provided by investing activities | | (2,900) | | | 2,323 | | | 8,534 | |
| Financing activities | | | | | | |
| Net increase (decreases) in long-term borrowed funds | | 54 | | | (357) | | | 55 | |
| Proceeds from issuance of subordinated notes payable | | 15,000 | | | 20,000 | | | — | |
| Repayment of subordinated notes payable | | — | | | (9,090) | | | — | |
| Repayment of junior subordinated debentures | | — | | | (10,076) | | | — | |
| Proceeds from issuance of preferred stock | | — | | | 11,992 | | | — | |
| | | | | | |
| | | | | | |
| Proceeds from purchased funds and other short-term debt | | — | | | (500) | | | 500 | |
| Purchase of treasury stock | | (2,971) | | | (6,126) | | | (5,477) | |
| | | | | | |
| Preferred stock dividends paid | | (875) | | | (683) | | | — | |
| Cash dividends paid | | (7,578) | | | (6,688) | | | (6,166) | |
| Net proceeds from purchases of ESPP shares | | 128 | | | 134 | | | 160 | |
| Net cash provided by (used in) financing activities | | 3,758 | | | (1,394) | | | (10,928) | |
| Net (decrease) increase in cash and due from banks | | (1,102) | | | 2,798 | | | (2,937) | |
| Cash and cash equivalents at the beginning of the period | | 3,129 | | | 331 | | | 3,268 | |
| Cash and cash equivalents at the end of the period | | $ | 2,027 | | | $ | 3,129 | | | $ | 331 | |
|
| | | | | | | | | | | | |
| | | For the Year Ended December 31, |
| | | 2017 | | 2016 | | 2015 |
| | | (In Thousands) |
| Operating activities | | | | | | |
| Net income | | $ | 11,905 |
| | $ | 14,909 |
| | $ | 16,514 |
|
| Adjustments to reconcile net income to net cash used in operating activities: | | | | | | |
| Equity in undistributed earnings of consolidated subsidiaries | | (15,086 | ) | | (18,719 | ) | | (20,185 | ) |
| Share-based compensation | | 1,078 |
| | 994 |
| | 448 |
|
| Excess tax benefit from share-based compensation | | (37 | ) | | (83 | ) | | — |
|
| Net (decrease) increase in other liabilities | | (4,170 | ) | | 1,198 |
| | 2,390 |
|
| Other, net | | (2,233 | ) | | (3,162 | ) | | (481 | ) |
| Net cash used in operating activities | | (8,543 | ) | | (4,863 | ) | | (1,314 | ) |
| Investing activities | | | | | | |
| Dividends received from subsidiaries | | 14,534 |
| | 13,534 |
| | 7,034 |
|
| Capital contributions to subsidiaries | | — |
| | (3,500 | ) | | (3,000 | ) |
| Net cash provided by investing activities | | 14,534 |
| | 10,034 |
| | 4,034 |
|
| Financing activities | | | | | | |
| Net (decrease) increase in short-term borrowed funds | | (1,000 | ) | | (1,500 | ) | | 1,500 |
|
| Proceeds from issuance of subordinated notes payable | | 9,090 |
| | — |
| | — |
|
| Repayment of subordinated notes payable | | (7,875 | ) | | — |
| | — |
|
| Proceeds from exercise of stock options | | — |
| | — |
| | 300 |
|
| Purchase of treasury stock | | (323 | ) | | (467 | ) | | (946 | ) |
| Excess tax benefit from share-based compensation | | — |
| | — |
| | 162 |
|
| Cash dividends paid | | (4,538 | ) | | (4,176 | ) | | (3,816 | ) |
| Net cash used in financing activities | | (4,646 | ) | | (6,143 | ) | | (2,800 | ) |
| Increase (decrease) in cash and cash equivalents | | 1,345 |
| | (972 | ) | | (80 | ) |
| Cash and due from banks at the beginning of the period | | 127 |
| | 1,099 |
| | 1,179 |
|
| Cash and due from banks at the end of the period | | $ | 1,472 |
| | $ | 127 |
| | $ | 1,099 |
|
Note 21 – Condensed Quarterly Earnings (unaudited)
| | | | | | | | | | | | | | | | | | | | | | | | | | | | | | | | | | | | | | | | | | | | | | | |
| | 2023 | | 2022 |
| | Fourth
Quarter | | Third
Quarter | | Second
Quarter | | First
Quarter | | Fourth
Quarter | | Third
Quarter | | Second
Quarter | | First
Quarter |
| | (Dollars in Thousands, Except Per Share Data) |
| Interest income | $ | 54,762 | | | $ | 50,941 | | | $ | 47,161 | | | $ | 42,064 | | | $ | 38,319 | | | $ | 31,786 | | | $ | 27,031 | | | $ | 24,235 | |
| Interest expense | 25,222 | | | 22,345 | | | 19,414 | | | 15,359 | | | 10,867 | | | 5,902 | | | 3,371 | | | 2,809 | |
| Net interest income | 29,540 | | | 28,596 | | | 27,747 | | | 26,705 | | | 27,452 | | | 25,884 | | | 23,660 | | | 21,426 | |
| Provision for credit losses | 2,573 | | | 1,817 | | | 2,231 | | | 1,561 | | | 702 | | | 12 | | | (3,727) | | | (855) | |
| Non-interest income | 7,094 | | | 8,430 | | | 7,374 | | | 8,410 | | | 6,973 | | | 8,197 | | | 6,872 | | | 7,386 | |
| Non-interest expense | 21,588 | | | 23,189 | | | 22,031 | | | 21,767 | | | 21,167 | | | 20,028 | | | 19,456 | | | 18,823 | |
| Income before income tax expense | 12,473 | | | 12,020 | | | 10,859 | | | 11,787 | | | 12,556 | | | 14,041 | | | 14,803 | | | 10,844 | |
| Income tax expense | 2,703 | | | 2,079 | | | 2,522 | | | 2,808 | | | 2,400 | | | 3,215 | | | 3,599 | | | 2,172 | |
| Net income | 9,770 | | | 9,941 | | | 8,337 | | | 8,979 | | | 10,156 | | | 10,826 | | | 11,204 | | | 8,672 | |
| Preferred stock dividend | 219 | | | 218 | | | 219 | | | 219 | | | 219 | | | 219 | | | 245 | | | — | |
| Income available to common shareholders | $ | 9,551 | | | $ | 9,723 | | | $ | 8,118 | | | $ | 8,760 | | | $ | 9,937 | | | $ | 10,607 | | | $ | 10,959 | | | $ | 8,672 | |
| Per common share: | | | | | | | | | | | | | | | |
| Basic earnings | $ | 1.15 | | | $ | 1.17 | | | $ | 0.98 | | | $ | 1.05 | | | $ | 1.18 | | | $ | 1.25 | | | $ | 1.29 | | | $ | 1.02 | |
| Diluted earnings | 1.15 | | | 1.17 | | | 0.98 | | | 1.05 | | | 1.18 | | | 1.25 | | | 1.29 | | | 1.02 | |
| Dividends declared | 0.2275 | | | 0.2275 | | | 0.2275 | | | 0.2275 | | | 0.1975 | | | 0.1975 | | | 0.1975 | | | 0.1975 | |
|
| | | | | | | | | | | | | | | | | | | | | | | | | | | | | | | |
| | 2017 | | 2016 |
| | Fourth
Quarter | | Third Quarter | | Second Quarter | | First Quarter | | Fourth Quarter | | Third Quarter | | Second Quarter | | First Quarter |
| | (Dollars in Thousands, Except Per Share Data) |
| Interest income | $ | 19,504 |
| | $ | 18,634 |
| | $ | 19,225 |
| | $ | 18,447 |
| | $ | 20,321 |
| | $ | 18,898 |
| | $ | 19,555 |
| | $ | 19,343 |
|
| Interest expense | 4,146 |
| | 3,751 |
| | 3,746 |
| | 3,559 |
| | 3,568 |
| | 3,603 |
| | 3,814 |
| | 3,804 |
|
| Net interest income | 15,358 |
|
| 14,883 |
|
| 15,479 |
| | 14,888 |
|
| 16,753 |
| | 15,295 |
| | 15,741 |
| | 15,539 |
|
| Provision for loan and lease losses | 473 |
| | 1,471 |
| | 3,656 |
| | 572 |
| | 994 |
| | 3,537 |
| | 2,762 |
| | 525 |
|
| Non-interest income | 3,525 |
| | 4,339 |
| | 4,738 |
| | 4,063 |
| | 3,931 |
| | 3,640 |
| | 5,823 |
| | 4,594 |
|
| Non-interest expense | 14,859 |
| | 14,231 |
| | 14,221 |
| | 13,560 |
| | 14,523 |
| | 15,753 |
| | 13,458 |
| | 12,699 |
|
| Income (loss) before income tax expense | 3,551 |
|
| 3,520 |
|
| 2,340 |
| | 4,819 |
|
| 5,167 |
| | (355 | ) | | 5,344 |
| | 6,909 |
|
Income tax (benefit) expense(1) | (486 | ) | | 936 |
| | 454 |
| | 1,422 |
| | 1,199 |
| | (3,020 | ) | | 1,621 |
| | 2,356 |
|
Net income(1) | $ | 4,037 |
|
| $ | 2,584 |
|
| $ | 1,886 |
| | $ | 3,397 |
|
| $ | 3,968 |
| | $ | 2,665 |
| | $ | 3,723 |
| | $ | 4,553 |
|
| Per common share: | | | | | | | | | | | | | | | |
Basic earnings(1) | $ | 0.46 |
| | $ | 0.30 |
| | $ | 0.22 |
| | $ | 0.39 |
| | $ | 0.46 |
| | $ | 0.31 |
| | $ | 0.43 |
| | $ | 0.52 |
|
Diluted earnings(1) | 0.46 |
| | 0.30 |
| | 0.22 |
| | 0.39 |
| | 0.46 |
| | 0.31 |
| | 0.43 |
| | 0.52 |
|
| Dividends declared | 0.13 |
| | 0.13 |
| | 0.13 |
| | 0.13 |
| | 0.12 |
| | 0.12 |
| | 0.12 |
| | 0.12 |
|
| |
(1) | Results for the third quarter, second quarter and first quarter 2016 have been adjusted to reflect early adoption of ASU 2016-09, “Compensation - Stock Compensation (Topic 718): Improvements to Employee Share-Based Payment Accounting.” |
REPORT OF INDEPENDENT REGISTERED PUBLIC ACCOUNTING FIRM
Report of Independent Registered Public Accounting Firm
To
Shareholders and the Stockholders and Board of Directors
First Business Financial Services, Inc.:
Madison, Wisconsin
Opinion
Opinions on the ConsolidatedFinancial Statements and Internal Control over Financial Reporting
We have audited the accompanying consolidated balance sheets of First Business Financial Services, Inc. and subsidiaries (the Company)"Corporation") as of December 31, 20172023 and 2016,2022, the related consolidated statements of income, comprehensive income, changes in stockholders’ equity, and cash flows for each of the years in the three‑yearthree-year period ended December 31, 2017,2023, and the related notes (collectively referred to as the consolidated"financial statements"). We also have audited the Corporation’s internal control over financial statements)reporting as of December 31, 2023, based on criteria established in Internal Control – Integrated Framework: (2013) issued by the Committee of Sponsoring Organizations of the Treadway Commission (COSO).
In our opinion, the consolidated financial statements referred to above present fairly, in all material respects, the financial position of the CompanyCorporation as of December 31, 20172023 and 2016,2022, and the results of its operations and its cash flows for each of the years in the three‑yearthree-year period ended December 31, 2017,2023 in conformity with U.S.accounting principles generally accepted accounting principles.
We also have audited, in accordance with the standardsUnited States of America. Also in our opinion, the Public Company Accounting Oversight Board (United States) (PCAOB), the Company’sCorporation maintained, in all material respects, effective internal control over financial reporting as of December 31, 2017,2023, based on criteria established in Internal Control -– Integrated FrameworkFramework: (2013) issued by COSO.
Change in Accounting Principle
As discussed in Note 1 to the Committeeconsolidated financial statements, the Corporation has changed its method of Sponsoring Organizationsaccounting for credit losses effective January 1, 2023 due to the adoption of Financial Accounting Standards Board (“FASB”) Accounting Standards Codification No. 326, Financial Instruments – Credit Losses (“ASC 326”). The Corporation adopted the Treadway Commission,new credit loss standard using the modified retrospective method such that prior period amounts are not adjusted and our report dated March 9, 2018 expressedan unqualified opinion on the effectiveness of the Company’scontinue to be reported in accordance with previously applicable generally accepted accounting principles.
Basis for Opinions
The Corporation’s management is responsible for these financial statements, for maintaining effective internal control over financial reporting.
Basisreporting, and for Opinion
These consolidated financial statements are the responsibilityits assessment of the Company’s management.effectiveness of internal control over financial reporting, included in the accompanying Management’s Annual Report on Internal Control over Financial Reporting. Our responsibility is to express an opinion on these consolidatedthe Corporation’s financial statements and an opinion on the Corporation’s internal control over financial reporting based on our audits. We are a public accounting firm registered with the PCAOBPublic Company Accounting Oversight Board (United States) ("PCAOB") and are required to be independent with respect to the CompanyCorporation in accordance with the U.S. federal securities laws and the applicable rules and regulations of the Securities and Exchange Commission and the PCAOB.
We conducted our audits in accordance with the standards of the PCAOB. Those standards require that we plan and perform the auditaudits to obtain reasonable assurance about whether the consolidated financial statements are free of material misstatement, whether due to error or fraud. fraud, and whether effective internal control over financial reporting was maintained in all material respects.
Our audits of the financial statements included performing procedures to assess the risks of material misstatement of the consolidated financial statements, whether due to error or fraud, and performing procedures that respond to those risks. Such procedures included examining, on a test basis, evidence regarding the amounts and disclosures in the consolidated financial statements. Our audits also included evaluating the accounting principles used and significant estimates made by management, as well as evaluating the overall presentation of the consolidated financial statements. Our audit of internal control over financial reporting included obtaining an understanding of internal control over financial reporting, assessing the risk that a material weakness exists, and testing and evaluating the design and operating effectiveness of internal control based on the assessed risk. Our audits also included performing such other procedures as we considered necessary in the circumstances. We believe that our audits provide a reasonable basis for our opinion.opinions.
Definition and Limitations of Internal Control Over Financial Reporting
A company’s internal control over financial reporting is a process designed to provide reasonable assurance regarding the reliability of financial reporting and the preparation of financial statements for external purposes in accordance with generally accepted accounting principles. A company’s internal control over financial reporting includes those policies and procedures that (1) pertain to the maintenance of records that, in reasonable detail, accurately and fairly reflect the transactions and dispositions of the assets of the company; (2) provide reasonable assurance that transactions are recorded as necessary to permit preparation of financial statements in accordance with generally accepted accounting principles, and that receipts and expenditures of the company are being made only in accordance with authorizations of management and directors of the company; and (3) provide reasonable assurance regarding prevention or timely detection of unauthorized acquisition, use, or disposition of the company’s assets that could have a material effect on the financial statements.
Because of its inherent limitations, internal control over financial reporting may not prevent or detect misstatements. Also, projections of any evaluation of effectiveness to future periods are subject to the risk that controls may become inadequate because of changes in conditions, or that the degree of compliance with the policies or procedures may deteriorate.
Critical Audit Matter
The critical audit matter communicated below is a matter arising from the current period audit of the financial statements that was communicated or required to be communicated to the audit committee and that: (1) relates to accounts or disclosures that are material to the financial statements and (2) involved our especially challenging, subjective, or complex judgments. The communication of the critical audit matter does not alter in any way our opinion on the financial statements, taken as a whole, and we are not, by communicating the critical audit matter below, providing a separate opinion on the critical audit matter or on the accounts or disclosures to which it relates.
Allowance and Provision for Credit Losses – Qualitative Factors
The Corporation adopted ASC 326 (“CECL”) as of January 1, 2023 as described in Note 1 of the consolidated financial statements using the modified retrospective method. ASC 326 requires the Corporation’s loan portfolio, measured at amortized cost, to be presented at the net amount expected to be collected. The estimates of expected credit losses on loans are based on relevant information about past events, current conditions, and reasonable and supportable forecasts regarding the collectability of the remaining cash flows over the contractual term of the loans. The Corporation utilized a discounted cash flow model to estimate the quantitative component of the allowance for credit losses for loans using key inputs and assumptions such as probability of default, loss given default, prepayment and curtailment rates, and forecast model. The quantitative model was adjusted with qualitative factors, including but not limited to: management’s ongoing review and grading of the loan and lease portfolios, consideration of delinquency experience, changes in the size of the loan and lease portfolios, existing economic conditions, level of loans and leases subject to more frequent review by management, changes in underlying collateral, concentrations of loans to specific industries, and other qualitative factors that could affect credit losses. The determination of qualitative factors involves significant management judgment and the use of subjective assumptions.
We identified auditing the qualitative factors as a critical audit matter because of the high degree of auditor judgment and auditor effort required to evaluate management's judgments in their determination of the qualitative factors.
The primary procedures we performed to address this critical audit matter included:
Testing the effectiveness of controls over the evaluation of the qualitative factors, including controls addressing:
a.The reliability and relevance of data used as the basis for the adjustments relating to qualitative factors;
b.The reasonableness of management’s judgments and assumptions related to the assessed level of risk and the ending allocation of the qualitative factors;
c.The mathematical accuracy of the dollar amount applied to the qualitative factors;
Substantively testing management’s process, including evaluating their judgments and assumptions, for developing the qualitative factors, which included:
a.Evaluation of the reliability and relevance of data used as a basis for the adjustments relating to qualitative factors;
b.Evaluation of the reasonableness of management’s judgments and assumptions related to the assessed level of risk for the qualitative factors and the resulting allocation;
c.Evaluation of the mathematical accuracy of the adjustment factors for the qualitative component and the dollar amount of the reserve derived from the qualitative factor assessment;
d.Tracing the allowance allocation from the qualitative factor analysis to the overall allowance calculation.
/s/ KPMGCrowe LLP
We have served as the Company’sCorporation's auditor since 1999.2017, which is the year the engagement was signed for the audit of the 2018 financial statements.
Chicago,
Oak Brook, Illinois
March 9, 2018February 28, 2024
Item 9. Changes in and Disagreements with Accountants on Accounting and Financial Disclosure
None.
Item 9A. Controls and Procedures
Disclosure Controls and Procedures
The Corporation’s management, with the participation of the Corporation’s Chief Executive Officer and Chief Financial Officer, has evaluated the Corporation’s disclosure controls and procedures (as defined in Rules 13a-15(e) and 15d-15(e) under the Securities Exchange Act of 1934, as amended). Based upon that evaluation, the Corporation’s Chief Executive Officer and Chief Financial Officer have concluded that the Corporation’s disclosure controls and procedures were effective as of December 31, 2017.2023.
Changes in Internal Control over Financial Reporting
There was no change in the Corporation’s internal control over financial reporting (as such term is defined in Rules 13a-15(f) and 15d-15(f) under the Securities and Exchange Act of 1934, as amended) that occurred during the quarter ended December 31, 20172023 that has materially affected, or is reasonably likely to materially affect, the Corporation’s internal control over financial reporting.
Management’s Annual Report on Internal Control over Financial Reporting
The Corporation’s management is responsible for establishing and maintaining adequate internal control over financial reporting, as such term is defined in Rules 13a-15(f) and 15d-15(f) under the Securities Exchange Act of 1934, as amended. The Corporation’s internal control over financial reporting is a process designed to provide reasonable assurance regarding the reliability of financial reporting and the preparation of the Corporation’s financial statements for external purposes in accordance with generally accepted accounting principles.
Management, under the supervision of the Chief Executive Officer and the Chief Financial Officer, assessed the effectiveness of the Corporation’s internal control over financial reporting based on criteria for effective internal control over financial reporting established in Internal Control – Integrated Framework (2013), issued by the Committee of Sponsoring Organization of the Treadway Commission (COSO). Based on this assessment, management has determined that the Corporation’s internal control over financial reporting was effective as of December 31, 2017.2023.
KPMG Crowe LLP, the independent registered public accounting firm that audited the Consolidated Financial Statements of the Corporation included in this Annual Report on Form 10-K, has issued an attestation report on the effectiveness of the Corporation’s internal control over financial reporting as of December 31, 2017.2023. The report, which expresses an unqualified opinion on the effectiveness of the Corporation’s internal control over financial reporting as of December 31, 2017,2023, is included under the heading “Report of Independent Registered Public Accounting Firm.”
Report of Independent Registered Public Accounting Firm
To the Stockholders and Board of Directors
First Business Financial Services, Inc.:
Opinion on Internal Control Over Financial Reporting
We have audited First Business Financial Services, Inc. and subsidiaries’ (the Company) internal control over financial reporting as of December 31, 2017, based on criteria established in Internal Control - Integrated Framework (2013) issued by the Committee of Sponsoring Organizations of the Treadway Commission. In our opinion, the Company maintained, in all material respects, effective internal control over financial reporting as of December 31, 2017, based on criteria established in Internal Control - Integrated Framework (2013) issued by the Committee of Sponsoring Organizations of the Treadway Commission.
We also have audited, in accordance with the standards of the Public Company Accounting Oversight Board (United States) (PCAOB), the consolidated balance sheets of the Company as of December 31, 2017 and 2016, the related consolidated statements of income, comprehensive income, changes in stockholders’ equity, and cash flows for each of the years in the three-year period ended December 31, 2017, and the related notes (collectively, the consolidated financial statements), and our report dated March 9, 2018 expressed an unqualified opinion on those consolidated financial statements.
Basis for Opinion
The Company’s management is responsible for maintaining effective internal control over financial reporting and for its assessment of the effectiveness of internal control over financial reporting, included in the accompanying Management’s Annual Report on Internal Control over Financial Reporting. Our responsibility is to express an opinion on the Company’s internal control over financial reporting based on our audit. We are a public accounting firm registered with the PCAOB and are required to be independent with respect to the Company in accordance with the U.S. federal securities laws and the applicable rules and regulations of the Securities and Exchange Commission and the PCAOB.
We conducted our audit in accordance with the standards of the PCAOB. Those standards require that we plan and perform the audit to obtain reasonable assurance about whether effective internal control over financial reporting was maintained in all material respects. Our audit of internal control over financial reporting included obtaining an understanding of internal control over financial reporting, assessing the risk that a material weakness exists, and testing and evaluating the design and operating effectiveness of internal control based on the assessed risk. Our audit also included performing such other procedures as we considered necessary in the circumstances. We believe that our audit provides a reasonable basis for our opinion.
Definition and Limitations of Internal Control Over Financial Reporting
A company’s internal control over financial reporting is a process designed to provide reasonable assurance regarding the reliability of financial reporting and the preparation of financial statements for external purposes in accordance with generally accepted accounting principles. A company’s internal control over financial reporting includes those policies and procedures that (1) pertain to the maintenance of records that, in reasonable detail, accurately and fairly reflect the transactions and dispositions of the assets of the company; (2) provide reasonable assurance that transactions are recorded as necessary to permit preparation of financial statements in accordance with generally accepted accounting principles, and that receipts and expenditures of the company are being made only in accordance with authorizations of management and directors of the company; and (3) provide reasonable assurance regarding prevention or timely detection of unauthorized acquisition, use, or disposition of the company’s assets that could have a material effect on the financial statements.
Because of its inherent limitations, internal control over financial reporting may not prevent or detect misstatements. Also, projections of any evaluation of effectiveness to future periods are subject to the risk that controls may become inadequate because of changes in conditions, or that the degree of compliance with the policies or procedures may deteriorate.
/s/ KPMG LLP
Chicago, Illinois
March 9, 2018
Item 9B. Other Information
(a) None.
(b) During the three months ended December 31, 2023, no director or "officer" of the Corporation adopted or terminated a "Rule 10b5-1 Trading Arrangement" or "non-Rule 10b5-1 trading arrangement," as each term is defined in Item 408(a) of Regulation S-K. Item 9C. Disclosure Regarding Foreign Jurisdictions that Prevent Inspections
Not applicable.
PART III.
Item 10. Directors, Executive Officers and Corporate Governance
| |
(a) | Directors of the Registrant. The information included in the definitive Proxy Statement for the Annual Meeting of the Shareholders to be held on May 22, 2018 under the captions “Item 1 - Election of Directors,” “Corporate Governance Principles and Practices” and “Section 16(a) Beneficial Ownership Reporting Compliance” is incorporated herein by reference.
|
| |
(b) | Executive Officers of the Registrant. The information presented in Item 1 of this document is incorporated herein by reference.
|
| |
(c) | Code of Ethics. The Corporation has adopted a code of ethics applicable to all employees, including the principal executive officer, principal financial officer and principal accounting officer of the Corporation. The FBFS Code of Ethics is posted on the Corporation’s website at www.firstbusiness.com. The Corporation intends to satisfy the disclosure requirements under Item 5.05(c) of Form 8-K regarding any amendment to or waiver of the code with respect to its Chief Executive Officer and Chief Financial Officer, principal accounting officer, and persons performing similar functions, by posting such information to the Corporation’s website.
|
(a)Directors of the Registrant. The information included in the definitive Proxy Statement for the Annual Meeting of the Shareholders to be held on April 26, 2024 under the caption “Item 1 - Election of Directors” is incorporated herein by reference.
(b)Executive Officers of the Registrant. The information presented in Item 1 of this document is incorporated herein by reference.
(c)Code of Ethics. The Corporation has adopted a code of ethics applicable to all employees, including the principal executive officer, principal financial officer and principal accounting officer of the Corporation. The FBFS Code of Business Conduct and Ethics is posted on the Corporation’s website at ir.firstbusiness.bank/govdocs. The Corporation intends to satisfy the disclosure requirements under Item 5.05(c) of Form 8-K regarding any amendment to or waiver of the code with respect to its Chief Executive Officer, Chief Financial Officer, principal accounting officer, and persons performing similar functions, by posting such information to the Corporation’s website.
(d)Audit Committee. The information included in the definitive Proxy Statement for the Annual Meeting of the Shareholders to be held on April 26, 2024 under the caption “Item 1 - Election of Directors” is incorporated herein by reference.
(e)Delinquent Section 16(a) Reports. The information included in the definitive Proxy Statement for the Annual Meeting of the Shareholders to be held on April 26, 2024 under the caption “Delinquent Section 16(a) Reports” is incorporated herein by reference.
Item 11. Executive Compensation
Information with respect to compensation for our directors and officers included in the definitive Proxy Statement for the Annual Meeting of the Shareholders to be held on May 22, 2018April 26, 2024 under the captions “Executive Compensation”, “Director Compensation,” “Summary Compensation Table,“Compensation Committee Report,” “Long Term Incentive Plans,” “Outstanding Equity Awards at December 31, 2017,” “Disclosure Regarding Termination and Change in Control Provisions”“Compensation Committee Interlocks and “Director Compensation”Insider Participation” is incorporated herein by reference.
Item 12. Security Ownership of Certain Beneficial Owners and Management and Related StockholderShareholder Matters
Information with respect to security ownership of certain beneficial owners and management included in the definitive Proxy Statement for the Annual Meeting of the Shareholders to be held on May 22, 2018April 26, 2024 under the caption “Principal Shareholders” is incorporated herein by reference.
Equity Compensation Plan Information
The following table summarizes certainprovides information with respect to compensation plans under which equity securities of the Corporation are authorized for issuance as of December 31, 2017.
2023 regarding shares outstanding and available for issuance under our existing compensation plans.
|
| | | | | | | | | | |
Plan category | | Number of securities to
be issued upon exercise
of outstanding options,
warrants and rights
| | Weighted-average
exercise price of
outstanding options,
warrants and rights
| | Number of securities
remaining available for
future issuance under
equity compensation
plans (excluding
securities reflected in
column (a))
|
| | (a) | | (b) | | (c) |
Equity compensation plans approved by security holders | | — |
| | $ | — |
| | 211,835 |
|
Equity compensation plans not approved by security holders | | — |
| | — |
| | — |
|
| | | | | | | | | | | | | | | | | | | | | | | | | | |
| Plan Category | | (a) Number of securities to be issued upon exercise of outstanding options, warrants and rights(1) | | (b) Weighted-average exercise price of outstanding options, warrants and rights(2) | | (c) Weighted-average contractual term outstanding options, warrants and rights (years) | | (d) Number of securities remaining available for future issuance under equity compensation plans (excluding securities reflected in column (a))(3) |
| Equity compensation plans approved by shareholders | | 152,517 | | | 35.05 | | | 2.94 | | | 558,970 | |
| Equity compensation plans not approved by shareholders | | — | | | — | | | — | | | — | |
(1) Includes the following type of awards: options - 0 shares; RSUs - 56,987 shares; PRSUs prior to 2023 assuming maximum performance - 78,750; PRSUs in 2023 assuming target performance - 16,780 shares. All shares subject to RSUs issued under the 2019 Equity Incentive Plan.
(2) The weighted average exercise price does not take into account awards of RSUs or PRSUs which do not have an exercise price. (3) Includes the number of shares remaining available for future issuance under the following plans: Employee Stock Purchase Plan - 230,638 shares: and Equity Incentive Plan - 328,332 shares (assuming maximum performance is achieved under PRSU awards).
Item 13. Certain Relationships and Related Transactions, and Director Independence
Information with respect to certain relationships and related transactions included in the definitive Proxy Statement for the Annual Meeting of the Shareholders to be held on May 22, 2018April 26, 2024 under the captions “Related Party Transactions” and “Corporate Governance Principles and Practices”“Item 1 - Election of Directors” is incorporated herein by reference.
Item 14. Principal Accountant Fees and Services
Information with respect to principal accounting fees and services included in the definitive Proxy Statement for the Annual Meeting of the Shareholders to be held on May 22, 2018April 26, 2024 under the caption “Miscellaneous” is incorporated herein by reference.
PART IV.
Item 15. Exhibits and Financial Statement Schedules
The Consolidated Financial Statements listed on the Index included under “Item“Item 8. Financial Statements and Supplementary Data”Data” are filed as a part of this Form 10-K. All financial statement schedules have been included in the Consolidated Financial Statements or are either not applicable or not significant.
Exhibit Index
| | | | | |
| Exhibit No. | Exhibit Name |
| |
| |
Exhibit No. | Exhibit Name |
| |
| 3.1 | |
| |
| 3.2 | |
| |
| 3.3 | |
| |
| Pursuant to Item 601(b)(4)(iii) of Regulation S-K, the Registrant agrees to furnish to the Securities and Exchange Commission, upon request, any instrument defining the rights of holders of long-term debt not being registered that is not filed as an exhibit to this Annual Report on Form 10-K. No such instrument authorizes securities in excess of 10% of the total assets of the Registrant. |
| |
| 4.1 | |
| |
4.2 | |
| |
| 4.2 | |
| |
10.1* | |
| |
10.2* | |
| |
10.3*
| |
| |
10.410.3*
| |
| |
10.510.4*
| |
| |
10.610.5*
| |
| |
10.710.6*
| |
| |
10.7* | |
| |
10.8* | |
| |
10.9* | |
| |
10.10* | |
| |
| | | | | |
10.11* | |
| |
10.12* | |
| |
10.13* | |
| |
| 10.14* | |
| |
| 10.15* | |
| |
| 10.16* | |
| |
| 10.17* | |
| |
| 10.18 | |
| |
| 10.19 | |
| |
| 21 | |
|
| |
| |
| 23 | |
| |
| 31.1 | |
| |
| 31.2 | |
| |
| 32 | |
| |
| 97 | |
| |
| 101 | The following financial information from First Business Financial Services, Inc.’s Annual Report on Form 10-K for the year ended December 31, 2017,2023, formatted in XBRL (eXtensible Business Reporting Language): (i) Consolidated Balance Sheets as of December 31, 20172023 and December 31, 2016,2022, (ii) Consolidated Statements of Income for the years ended December 31, 2017, 20162023, 2022, and 2015,2021, (iii) Consolidated Statements of Comprehensive Income for the years ended December 31, 2017, 20162023, 2022, and 2015,2021, (iv) Consolidated Statements of Changes in Stockholders’ Equity for the years ended December 31, 2017, 20162023, 2022, and 2015,2021, (v) Consolidated Statements of Cash Flows for the years ended December 31, 2017, 20162023, 2022, and 2015,2021, and (vi) the Notes to Consolidated Financial Statements |
| 104 | Cover page interactive data file (formatted as inline XBRL and contained in Exhibit 101) |
| |
| * | Management contract or compensatory plan. |
Item 16. Form 10-K Summary
None.
Signatures
Pursuant to the requirements of Section 13 or 15(d) of the Securities Exchange Act of 1934, the registrant has duly caused this report to be signed on its behalf by the undersigned, thereunto duly authorized.
| | | | | | | | | | | |
| | | |
| | | FIRST BUSINESS FINANCIAL SERVICES, INC. |
| | | |
March 9, 2018February 28, 2024 | | | /s/ Corey A. Chambas |
| | | Corey A. Chambas |
| | | Chief Executive Officer |
Pursuant to the requirements of the Securities Exchange Act of 1934, this report has been signed below by the following persons on behalf of the registrant and in the capacities and on the dates indicated.
| | | | | | | | | | | | | | |
| Signature | | Title | | Date |
| | | | |
Signature | | Title | | Date |
| | | | |
| /s/ Corey A. Chambas | | Chief Executive Officer and Director | | March 9, 2018February 28, 2024 |
| Corey A. Chambas | | (principal executive officer) | | |
| | | | |
/s/ Edward G. Sloane, Jr.Brian D. Spielmann | | Chief Financial Officer | | March 9, 2018February 28, 2024 |
Edward G. Sloane, Jr.Brian D. Spielmann | | (principal financial officer) | | |
| | | | |
/s/ Michael J. MurphyKevin D. Crampton | | Chief Accounting Officer | | March 9, 2018February 28, 2024 |
Michael J. MurphyKevin D. Crampton | | (principal accounting officer) | | |
| | | | |
/s/ Jerome J. SmithGerald L. Kilcoyne | | ChairmanChair of the Board of Directors | | March 9, 2018February 28, 2024 |
Jerome J. SmithGerald L. Kilcoyne | | | | |
| | | | |
| /s/ Laurie S. Benson | | Director | | February 28, 2024 |
| Laurie S. Benson | | | | |
| | | | |
| /s/ Mark D. Bugher | | Director | | Director | March 9, 2018February 28, 2024 |
| Mark D. Bugher | | | | |
| | | | |
| /s/ Carla C. Chavarria | | Director | | February 28, 2024 |
| Carla C. Chavarria | | | | |
| /s/ Jan A. Eddy | | Director | | March 9, 2018
Jan A. Eddy | | | | |
| | | | |
| /s/ John J. Harris | | Director | | Director | March 9, 2018February 28, 2024 |
| John J. Harris | | | | |
| | | | |
| /s/ Ralph R. Kauten | | Director | | February 28, 2024 |
| Ralph R. Kauten | | | | |
| | | | |
| /s/ W. Kent Lorenz | | Director | | February 28, 2024 |
| W. Kent Lorenz | | | | |
| | | | |
/s/ Gerald L. KilcoyneDaniel P. Olszewski | | Director | | Director | March 9, 2018February 28, 2024 |
Gerald L. KilcoyneDaniel P. Olszewski | | | | |
| | | | |
/s/ John M. Silseth | | Director | | March 9, 2018 |
John M. Silseth | | | | |
| | | | |
/s/ Carla C. Sanders | | Director | | March 9, 2018 |
Carla C. Sanders | | | | |
| | | | |
| /s/ Carol P. Sanders | | Director | | Director | March 9, 2018February 28, 2024 |
| Carol P. Sanders | | | | |
| | | | |
/s/ Dean W. Voeks | | Director | | March 9, 2018 |
Dean W. Voeks | | | | |