PART I
The following discussion should be read in conjunction with the consolidated financial statements, including the notes, included elsewhere in this Annual Report on Form 10-K (this "Report"). Except as otherwise indicated or unless the context otherwise requires, “Xylem,” “we,” “us,” “our” and “the Company” refer to Xylem Inc. and its subsidiaries. References in the consolidated financial statements to "ITT" or the "former parent" refer to ITT Corporation (now ITT LLC) and its consolidated subsidiaries (other than Xylem Inc.) as of the applicable periods.
Forward-Looking Statements
This Report contains information that may constitute “forward-looking statements" within the meaning of Section 27A of the Private Securities Litigation Act of 1995. Forward-looking statements by their nature address matters that are, to different degrees, uncertain.1933, as amended, and Section 21E of the Securities Exchange Act of 1934, as amended. Generally, the words “anticipate,” “estimate,” “expect,” “project,” “intend,” “plan,” "contemplate," "predict," “forecast,” “likely,” “believe,” “target,” “will,” “could,” “would,” “should”“should,” "potential," "may" and similar expressions or their negative, may, but are not necessary to, identify forward-looking statements. However, the absence of these words or similar expressions does not mean that a statement is not forward-looking. TheseBy their nature, forward-looking statements address uncertain matters and include any statements thatthat: are not historical, in nature, including anysuch as statements about the capitalization of the Company, the Company’s restructuring and realignmentour strategy, financial plans, future strategic plans and other statements that describe the Company’s business strategy, outlook, objectives, plans, intentions or goals. All statements thatgoals (including those related to our social, environmental and other sustainability goals); or address operatingpossible or future results of operations or financial performance, events or developments that we expect or anticipate will occur in the future - including statements relating to orders, revenues, operating margins and earnings per share growth, andgrowth.
Although we believe that the expectations reflected in any of our forward-looking statements expressing general views about future operatingare reasonable, actual results - arecould differ materially from those projected or assumed in any of our forward-looking statements. Forward-lookingOur future financial condition and results of operations, as well as any forward-looking statements, involve knownare subject to change and unknownto inherent risks and uncertainties, many of which are beyond our control. Additionally, many of these risks and other importantuncertainties are, and may continue to be, amplified by impacts from changes in international conditions, including as a result of the war between Russia and Ukraine, coronavirus (“COVID-19”) pandemic and macroeconomic conditions, including inflation. Important factors that could cause our actual results, performance and achievements, or industry results to differ materially from those expressedestimates or projections contained in or implied by our forward-looking statements include, among others, the following: the impact of overall industry and general economic conditions, including industrial, governmental, and public and private sector spending, inflation, interest rates and related monetary policy by governments in or reasonably inferred from, such forward-looking statements.
3
consummate the transaction; risks that the proposed transaction disrupts the current plans or operations of Xylem or Evoqua; the ability of Xylem and Evoqua to retain and hire key personnel; competitive responses to the proposed transaction; unexpected costs, charges or expenses resulting from the transaction; potential adverse reactions or changes to relationships with customers, suppliers, distributors and other business partners resulting from the announcement or completion of the transaction; the combined company’s ability to achieve the synergies expected from the transaction, as well as delays, challenges and expenses associated with integrating the combined company’s existing businesses.
Forward-looking and other statements in this Form 10-K regarding our environmental and other sustainability plans and goals are not an indication that these statements are necessarily material to investors or are required to be disclosed in our filings with the SEC. In addition, historical, current, and forward-looking social, environmental and sustainability-related statements may be based on standards for measuring progress that are still developing, internal controls and processes that continue to evolve, and assumptions that are subject to change in the future. All forward-looking statements made herein are based on information currently available to the Companyus as of the date of this Report. The Company undertakesWe undertake no obligation to publicly update or revise any forward-looking statements, whether as a result of new information, future events or otherwise, except as required by law.
4
ITEM 1. BUSINESS
Business Overview
Xylem with 2019 revenues of $5.2 billion and approximately 16,300 employees, is a leading global water technology company.company with 2022 revenues of $5.5 billion and approximately 17,800 employees worldwide. We design, manufacture and service highly engineered products and solutions ranging across a wide variety of critical applications, primarily in the water sector, but also in electric and gas.energy. Our broad portfolio of products, services and solutions addresses customer needs of scarcity, resilience, and affordability across the water cycle, from the delivery, measurement and use of drinking water, to the collection, testing, analysis and treatment of wastewater, to the return of water to the environment.
We have differentiated market positions in core application areas including transport, treatment, test,dewatering, analytic instrumentation and measurement, smart metering, infrastructure assessment services, digital software solutions condition assessmentfor utilities, and leak detection,applied water systems for commercial and residential building services and industrial processing.processes. Setting us apart is a unique set of global assets that include:
•A substantial global installed base across the water cycle that provides for steady recurring and replacement revenue
•A strong history of bringing innovative products, solutions, and business models to customers
•A strong financial position and cash generation profile that enables us to fund strategic organic and inorganic growth initiatives, and consistently return capital to shareholders
Our Industry
Our vision is to create a world in which water issues are no longer a constraint to health, prosperity and sustainable development.
Our planet faces serious water challenges. Less than 1% of the total water available on earth is fresh water, and these supplies are under threat due tothreatened by factors such as the draining of aquifers, increased pollution and the effects of climate change. Demand for fresh water is rising rapidly due to population growth, industrial expansion, and increased agricultural development, with consumption estimated to double every 20 years. By 2025, more than 30% of the world’s population is expected to live in areas without adequate water supply. Even in developed countries with sufficient clean water supply, existing water supply infrastructure is aging and often inefficient. In the United States,U.S., deteriorating pipe systems, theft or inaccurate meters result in approximately one out of every six gallons of treated water being lost prior to reaching the end customer. This problem of "non-revenue" water is a major financial challenge of many utilities globally, especially in developing markets where non-revenue water can represent 10% to 60% or more of net water produced. These and other challenges create opportunities for growth in the global water industry. We estimate the total addressable market size of the global water industry, excluding operational expenditures related to labor, energy, and chemicals, to be approximately $560$700 billion.
Global water needs cannot be met without streamlining the water industry’s cost structure with technologies that fundamentally change the provision and management of water. We compete in areas that are pivotal to improving water affordability"water affordability" and resilience"resilience", while reducing the impact of water scarcity. Water affordability"water scarcity". "Water affordability" refers to the more efficient delivery, use and treatment of clean water and wastewater. Resilience"Resilience" refers to the management of water-related risks, including climate change mitigation, and the resilience of water infrastructure. Water scarcity"Water scarcity" refers to the management of limited supplies of water due to climate change, overpopulation and pollution. Our customers often face all three of these challenges, ranging from inefficient and aging water distribution networks and energy-intensive or unreliable water and wastewater management systems (which require(requiring improvements in “water affordability”)water affordability); droughts and pollution which limit the amount of water readily available (causing "water scarcity”)water scarcity); or exposure to natural disasters such as floods or droughts (which require(requiring improvements in “resilience”)resilience). Additionally, we also provide solutions to enhance communications and efficiency, improve safety and conserve resources to customers in the water electric, gas, and lightingenergy sectors. Delivering value in these areas creates significant opportunity for the Company. We estimate our total served market size to be approximately $61 billion.
5
The Global Water Industry Value Chain
The water industry value chain includes Equipment, Technology and Services companies, like Xylem, whichthat address the unique challenges and demands of a diverse customer base. This customer base includes water and wastewater utilities that supply, treat and monitor clean water or transport, treat and analyze wastewater or storm water through an infrastructure network, and engineering, procurement and construction or (EPC)("EPC") firms and third party contractors, whichthat work with utilities to design and build water and wastewater infrastructure networks, as depicted below. Utilities and other customers require products, solutions, services, technology and application expertise from their Equipment, Technology and Services providers to address trends such as rising pollution, stricter regulations, increasing operational costs and the increased outsourcing of process knowledge. In addition to utilities, Equipment, Technology and Service companies also provide distinct technologies and application expertise to a wide array of entities, including farms, mines, power plants, industrial facilities (such as food and beverage and pharmaceutical manufacturers) and residential and commercial customers seeking to address similar trends.
Water Industry Supply Chain

Business Strategy
Our overarching strategy is to enhance shareholder valuehelp customers solve the world's greatest water challenges with innovative products, services and solutions to deliver sustainable economic, social and environmental benefits. The following strategic pillars guide where and how we focus our efforts and resources to implement this strategy:
•Drive Customer Success. We seek to partner with customers to meet their stakeholders’ needs through our broad portfolio of products, services and solutions. We are focused on several key areas, beginning with making it easier for customers to do business with Xylem and access the full range of our capabilities. As part of this, we are implementing a digital platform to discover, select, get price quotes, and purchase our offerings. Second, we seek to lead the way as digital technologies transform our sector by further integrating our digital solution portfolio and broadening our solution sales, digital literacy and marketing capabilities company-wide. Third, we seek to help customers get the most out of their systems by providing distinctiveworld-class services that enable increased uptime, efficiency and resilience. We partner with them by providing powerful, integrated lifecycle services and solutions.
6
•Grow in the Emerging Markets. We continue to invest in localizing our capabilities in the emerging markets. We will continue building innovation, product management and engineering teams in these regions, expanding our market coverage in key growth markets such as China, India, Eastern Europe, Latin America and Africa. We seek to address the base of the pyramid population by providing water and sanitation needs with new solutions and business models.
•Strengthen Innovation and Technology. We seek to create new customer offerings that help them solve water challenges more powerfully than ever before, while also providing our company with rapid growth opportunities. We are focused on building and enabling infrastructure for digital growth by making our customers' most important water scarcity, affordabilityhardware, networks and software applications interoperable and creating a common software experience. This will further strengthen our core product offerings, and deliver strategic, sustainable innovations that help us tap into new markets through advanced technology and new business models.
•Build a Culture of Continuous Improvement. We seek to continue embedding a continuous improvement mindset throughout the Company, and will continue to improve our efficiency, simplify our business and manage costs to support continued growth. We are committed to eliminating business complexity by streamlining internal bureaucracy and expanding standard business platforms and processes to help people do their jobs. This will result in freeing up time to ensure that we focus on work that creates customer value. Other focus areas include removing unnecessary costs from our end-to-end value chain to free up resources for growth; and building resilience challenges, enabling usand sustainability into our supply chain to grow revenue, organicallyprotect our ability to serve customers.
•Cultivate Leadership and throughTalent Development. We continue to foster an empowering, mission-driven, diverse, equitable and inclusive culture. We will continue to build leadership succession depth and breadth in keeping with our commitment to developing the next generation of leaders. We will also align our incentives, including share-based and performance-based compensation, and organizational structure to our strategy, favoring approaches to drive 'one company' skills, mindset and behaviors, and stakeholder value creation.
Our strategic acquisitions, as we streamline our cost structure. Key elementsplan firmly embeds sustainability at the heart of our competitive advantage and unique business model, and aligns each of our five core strategic pillars to the overarching goal of integrating sustainability into everything we do.
While our strategy will evolve in response to the changing world, our four values are summarized below:
the enduring principles that go to the heart of who we are and guide how we conduct ourselves each day: Respect, Responsibility, Integrity and Creativity.
7 |
Business Segments, Distribution and Competitive Landscape
We have three reportable business segments that are aligned around the critical market applications they provide: Water Infrastructure, Applied Water, and Measurement & Control Solutions. See Note 22,21, “Segment and Geographic Data,” in our consolidated financial statements for financial information about segments and geographic areas.
The table and descriptions below provide an overview of our business segments.segments:
| Market Applications | 2022 Revenue (in millions) | % Revenue | Major Products | Primary Brands | |||||||||||||||||||||||||||||||||||||||||
Market Applications | 2019 Revenue (in millions) | % Revenue | Major Products | Primary Brands | |||||||||||||||||||||||||||||||||||||||||
Water Infrastructure | Transport | $ | 1,780 | 82 | % | • Water and wastewater pumps • Filtration, disinfection and biological treatment equipment • Mobile dewatering equipment | • Flygt • Godwin • Leopold • Sanitaire • Wedeco | Water Infrastructure | Transport | $ | 1,943 | 82 | % | • Water and wastewater pumps • Filtration, disinfection and biological treatment equipment • Mobile dewatering equipment and rental services | • Flygt • Godwin • Leopold • Sanitaire • Wedeco • Xylem Vue | ||||||||||||||||||||||||||||||
| Treatment | 397 | 18 | % | Treatment | 421 | 18 | % | ||||||||||||||||||||||||||||||||||||||
| $ | 2,364 | 100 | % | ||||||||||||||||||||||||||||||||||||||||||
| $ | 2,177 | 100 | % | ||||||||||||||||||||||||||||||||||||||||||
Applied Water | Building Services | $ | 848 | 55 | % | • Pumps • Valves • Heat exchangers • Controls • Dispensing equipment systems | • A-C Fire Pump • Bell & Gossett • Flojet • Goulds Water Technology • Jabsco • Lowara • Standard Xchange | Applied Water | Commercial Building Services | $ | 659 | 37 | % | • Pumps • Valves • Heat exchangers • Controls • Dispensing equipment systems | • A-C Fire Pump • Bell & Gossett • Flojet • Goulds Water Technology • Jabsco • Lowara • Standard Xchange • Xylem Vue | ||||||||||||||||||||||||||||||
| Industrial Water | 693 | 45 | % | Residential Building Services | 306 | 17 | % | ||||||||||||||||||||||||||||||||||||||
| $ | 1,541 | 100 | % | ||||||||||||||||||||||||||||||||||||||||||
| Applied Water | Applied Water | Industrial Water | 802 | 46 | % | ||||||||||||||||||||||||||||||||||||||||
| $ | 1,767 | 100 | % | • Pumps • Valves • Heat exchangers • Controls • Dispensing equipment systems | |||||||||||||||||||||||||||||||||||||||||
• Pumps • Valves • Heat exchangers • Controls • Dispensing equipment systems | • A-C Fire Pump • Bell & Gossett • Flojet • Goulds Water Technology • Jabsco • Lowara • Standard Xchange • Xylem Vue | ||||||||||||||||||||||||||||||||||||||||||||
• A-C Fire Pump • Bell & Gossett • Flojet • Goulds Water Technology • Jabsco • Lowara • Standard Xchange | |||||||||||||||||||||||||||||||||||||||||||||
| Measurement & Control Solutions | Water | $ | 768 | 50 | % | Measurement & Control Solutions | Water | $ | 1,126 | 81 | % | ||||||||||||||||||||||||||||||||||
| Energy | 337 | 22 | % | Energy | 265 | 19 | % | • Smart meters • Networked communication devices • Data analytics • Test equipment • Controls • Sensor devices • Software & managed services • Critical infrastructure services | |||||||||||||||||||||||||||||||||||||
| Test | 327 | 21 | % | $ | 1,391 | 100 | % | ||||||||||||||||||||||||||||||||||||||
| Measurement & Control Solutions | • Pure Technologies • Sensus • Smith Blair • WTW • YSI • Xylem Vue | ||||||||||||||||||||||||||||||||||||||||||||
| Software as a Service/Other | 99 | 7 | % | • Smart meters • Networked communication devices • Data analytics • Test equipment • Controls • Sensor devices • Software & managed services • Critical infrastructure services | |||||||||||||||||||||||||||||||||||||||||
| $ | 1,531 | 100 | % | • EmNet • Pure • Sensus • Smith Blair • Visenti • WTW • YSI | |||||||||||||||||||||||||||||||||||||||||
Water Infrastructure
Our Water Infrastructure segment primarily supports the process that collects water from a source, treats it and distributes it to users, and then treats and returns the wastewater responsibly to the environment through two closely linked applications: Transport and Treatment. The Transport application also includes sales and rental of
specialty dewatering pumps and related equipment and services, which provide the safe removal or draining of groundwater and surface water from construction sites or other industrial sites and bypass pumping for the repair of aging utility infrastructure, as well as emergency water transport and removal during severe weather events.
The customer base consists of two primary end markets: utility and industrial. The utility market includes public, private and public-private entities that support water, wastewater and storm water networks. The industrial market includes customers whothat require similar water and wastewater infrastructure networksapplications to support various industrial operations.
8
Water Infrastructure sells primarily through direct channels with remaining sales through indirect channels and service capabilities. Both utility and industrial facility customers increasingly require our teams’ global but locally proficient expertise to use our equipment in their specific applications. Several trends are increasing demand for this application expertise: (i) the increase in both the type and amount of contaminants found in the water supply, (ii) increasing environmental regulations, (iii) the need to increase system efficiencies and resilience to optimize energy and other operational costs, (iv) the retirement of an aging water industry workforce that has not been systematically renewed at utilities and other end-user customers, and (v) the build-out of water infrastructure in the emerging markets. We estimate our served market size in this sector to be approximately $18 billion.
Given the highly fragmented nature of the water industry, the Water Infrastructure segment competes with a large number of businesses.businesses and no one business competes across all the markets Water Infrastructure serves. We differentiate ourselves in the market by focusing on product and service performance, quality and reliability, innovation, speed to market with new or disruptive technologies and business models, application expertise, brand reputation, energy efficiency, product security, product life-cycle cost, timeliness of delivery, proximity of service centers, effectiveness of our distribution channels, price and price.customers' experience in doing business with us. Increasingly digital solutions and analytics are important competitive differentiators. We are actively expanding our capabilities in these areas and integrating them together with our legacy technologies and service offerings as well as capabilities from other Xylem business units to present ever more compelling solutions to our customers. In the sale or rental of products and provision of services, we benefit from our large installed base, which requires maintenance, repair and replacement parts due to the critical application and nature of the products and the conditions under which they operate. Timeliness of delivery, quality and the proximity of service centers are important customer considerations when selecting a provider for after-market products and services as well as equipment rentals. In geographic regions where we are locally positioned to provide a quick response, customers have historically relied on us, rather than our competitors, for after-market products relating to our highly engineered and customized solutions. Our key competitors in the Water Infrastructure segment include KSB Inc., Sulzer Ltd., Evoqua Water Technologies,Grundfos, United Rentals, Trojan (Danaher Corporation) and Grundfos, among others.Evoqua.
Applied Water
Applied Water encompasses the uses of water in two primarily applications: Building Services and Industrial Water. These applicationsto serve a diverse set of customers in the commercial, residential and industrial end markets including: residential, commercial and industrial.markets. Residential consumers represent the end users in the residential market, while owners and managers of properties such as apartment buildings, retail stores, institutional buildings, restaurants, schools,schools/universities, hospitals and hotels are examples of end users in the commercial market. The industrial market includes OEMs,original equipment manufacturers ("OEMs"), exploration and production firms, and developers and managers of industrial facilities, such as electrical power generators, chemical manufacturers, machine shops, clothing manufacturers, marine, food and beverage companies and car washes.
In the Applied Water segment, end markets vary widely and, as a result, specialized distribution partners are often preferred. As such, the Applied Water segment provides the majority of its sales through strong indirect channels with the remaining sales going through our global direct sales channels. We have long-standing relationships with many of the leading independent distributors in the markets we serve and we provide incentives to distributors, such as specialized loyalty and training programs.
Competition in the Applied Water segment focuses on brand equity,reputation, application expertise, product delivery, performance and energy efficiency, quality and reliability, and price. We compete by offering a wide variety of innovative and high-quality products, coupled with world-class application expertise. We believe our distribution through well-established channels and our reputation for quality significantly enhance our market position. Our ability to deliver innovative product offerings has enabled us to compete effectively, to cultivate and maintain customer relationships and to serve and expand into many niche and new markets. Our key competitors in the Applied Water segment include Grundfos, Wilo SE, Pentair plc and Franklin Electric Co., Inc.
9
Measurement & Control Solutions
Measurement & Control Solutions develops advanced technology solutions that enable intelligent use and conservation of critical water and energy resources. The segment delivers communications, smart metering, measurement and control technologiescapabilities and critical infrastructure technologies that allow customers to more effectively use their distribution networks for the delivery, monitoring and control of critical resources such as water, electricity and natural gas. We also provide analytical instrumentation used to measure and analyze water quality, flow and level in clean water, wastewater, surfaceoutdoor water and coastal environments. Additionally, we offer software and services including cloud-based analytics, remote monitoring and data management, leak detection, condition assessment, asset management and pressure monitoring solutions. We also offer smart lighting solutions that improve efficiency and public safety efforts across communities.
At the heart of our leading technologies isare automation, data management and decision support. Communications networks enable customers to automate and optimize meter reading, bill customers, monitor flow rates and detect and enable rapid response to changing and unsafe conditions. In short, they provide insight into operations and enable our customers to manage the entire scope of their operations remotely through their networks. At the center of our offering is the FlexNet communication network, which provides a common communications platform and infrastructure for essential metering services. This two-way communication technology remotely connects a wide variety of smart points in a given network with protocols, frequently on Federal Communications Commission ("FCC") licensed spectrum in the United States, thatU.S., to enable reliable, resilient and secure transmissions. These technologies allow our customers to remotely and continuously monitor their water gas or electricand energy distribution infrastructure, prioritize and manage maintenance, and use data to optimize allmany aspects of their networks. Our Advanced Infrastructure Analyticsdigital software solutions complement these offerings with intelligent solutionsapplications that help utility decision-makers manage and maintain their networks more effectively in real time.
The majority of our sales in the United States isU.S. are conducted through strong, long-standing relationships with leading distributors and dedicated channel partners for the water gas and electricenergy markets. Internationally, direct sales are often made in markets without established distribution channels; however, some distribution channels are used in more developed markets. A more direct sales approach, with key account management, is employed for large utilities and government programs.
Our Sensus-branded meters are well positioned in the smart metering sector, the fastest growing sector of the global meter industry. We set ourselves apart in the industry by focusing on our communication network, innovation, new product development and service offerings that deliver tangible savings from efficiency of operating costs in meter reading and billing as well as reduction of non-revenue water through improved meter accuracy, reduced theft and identification of leaks. Our YSI and WTW-branded instruments have a strong position in the analytical instrumentation market and provide critical readings of various water quality, level and flow parameters for customers. We provide a differentiated offering in the reliability and accuracy of our products often in rugged, remote, and hazardous locations. Our Pure Technologies’Technologies equipment and services are also well positioned in the leak detection sector, which is attracting considerable attention as aging infrastructure and increased regulatory scrutiny exert pressure on operating budgets. Our key competitors in the Measurement & Control Solutions segment include Itron, Badger Meter, Landis+Gyr, Neptune (Roper), Elster (Honeywell),Kamstrup, Echologics (Mueller Water Products), Hach (Danaher Corporation) and Teledyne.
Geographic Profile
The table below illustrates the annual revenue and percentage of revenue by geographic area for each of the three years ended December 31.
| Revenue | |||||||||||||||||||||||||||||||||||
| (in millions) | 2022 | 2021 | 2020 | ||||||||||||||||||||||||||||||||
| $ Amount | % of Total | $ Amount | % of Total | $ Amount | % of Total | ||||||||||||||||||||||||||||||
| United States | $ | 2,573 | 47 | % | $ | 2,280 | 44 | % | $ | 2,297 | 47 | % | |||||||||||||||||||||||
| Western Europe | 1,411 | 26 | % | 1,414 | 27 | % | 1,259 | 26 | % | ||||||||||||||||||||||||||
Emerging Markets (a) | 1,074 | 19 | % | 1,066 | 21 | % | 919 | 19 | % | ||||||||||||||||||||||||||
| Other | 464 | 8 | % | 435 | 8 | % | 401 | 8 | % | ||||||||||||||||||||||||||
| Total | $ | 5,522 | $ | 5,195 | $ | 4,876 | |||||||||||||||||||||||||||||
10
| Revenue | ||||||||||||||||||||
| (in millions) | 2019 | 2018 | 2017 | |||||||||||||||||
| $ Amount | % of Total | $ Amount | % of Total | $ Amount | % of Total | |||||||||||||||
| United States | $ | 2,554 | 49 | % | $ | 2,424 | 47 | % | $ | 2,161 | 46 | % | ||||||||
| Europe | 1,380 | 26 | % | 1,449 | 28 | % | 1,335 | 28 | % | |||||||||||
| Asia Pacific | 659 | 13 | % | 660 | 13 | % | 611 | 13 | % | |||||||||||
| Other | 656 | 12 | % | 674 | 12 | % | 600 | 13 | % | |||||||||||
| Total | $ | 5,249 | $ | 5,207 | $ | 4,707 | ||||||||||||||
"Other")
Supply and Seasonality
We have a global manufacturing and assembly footprint, with production facilities in Europe, North America, Latin America, Asia and the Middle East. Our inventory management and distribution practices seek to minimize inventory holding periods by striving to take delivery of the inventory and manufacturing as close as possible to the sale or distribution of products to our customers. All of our businesses require various parts and raw materials, the availability and prices of which may fluctuate. Parts and raw materials commonly used in our products include motors, fabricated parts, castings, magnets, bearings, seals, batteries, PCBsprinted circuit boards ("PCBs") and electronic components, including semiconductors, as well as commodities, including steel, brass, nickel, copper, aluminum and plastics. While we may recover some cost increases through operational improvements, we are still exposed to some pricing risk, including increased pricing risk due to duty and tariff assessments by the United StatesU.S. or other governments on foreign imports. We attempt to control costs through fixed-priced contracts with suppliers and various other programs, such as our global procurement initiative.
Our business relies on third-party suppliers, contract manufacturing and commodity markets to secure raw materials, parts and components used in our products. We typically acquire materials and components through a combination of blanket and scheduled purchase orders to support our materials requirements. For many of our products we have existing alternate sources of supply, or such sources may be readily available.
We may experiencehave experienced price volatility or supply constraints forwhen materials that arehave not been available from multiple sources. From time to time, we acquire certain inventory in anticipation of supply constraints or enter into longer-term pricing commitments with suppliers to improve the priority, price and availability of supply. There have been no raw material shortages in the past several years that have had a significant adverse impact on our business as a whole.
Our business segments experience a modest level of seasonality in their operations. This seasonality is dependent on factors such as customers' capital spending, as well as the effects of climate change and weather conditions, including heavy flooding, prolonged droughts and fluctuations in temperatures or weather patterns, all of which can positively or negatively impact portions of our business.
Customers
Our business is not dependent on any single customer or a few customers, the loss of which would have a material adverse effect on our Company. No individual customer accounted for more than 10% of our consolidated revenues in 2019, 20182022, 2021 or 2017.2020.
Backlog
Backlog includes orders on hand as well as contractual customer agreements at the end of the period. Delivery schedules vary from customer to customer based on their requirements. Annual or multi-year contracts are subject to rescheduling and cancellation by customers due to the long-term nature of the contracts. As such, beginning total backlog, plus orders, minus revenues, will not equal ending total backlog due to contract adjustments, foreign currency fluctuations, and other factors. Typically, large projects require longer lead production cycles and deployment schedules, and delays can occur from time to time. Total backlog was $1,801$3,605 million at December 31, 20192022 and $1,689$3,240 million at December 31, 2018.2021. We anticipate that approximately 60%55% of the backlog at December 31, 20192022 will be recognized as revenue during 2020.2023.
Research and Development
Research and development (“R&D”) is a key foundation of our growth strategy and we focus on the design and development of products and application know-how that anticipateaddress anticipated customer needs and emerging trends. Our engineers are involved in new product development as well as improvement of existing products to increase customer value. Our businesses invest substantial resources into R&D. We anticipate we will continue to develop and invest in our R&D capabilities to promote a steady flow of innovative, high-quality and reliable products and integrated solutions to further strengthen our position in the markets we serve. In addition to investments made in software development, which were capitalized, we incurred $191$206 million, $189$204 million, and $181$187 million as a result of R&D investment spending in 2019, 20182022, 2021 and 2017,2020, respectively.
We have R&D and product development capabilities around the world. R&D activities are initially conducted in our technology centers, located in conjunction with some of our major manufacturing facilities to ensureenable an efficient and robust development process. We have several global technical centers and local development teams around the world where we are supporting global needs and accelerating the customization of our products and solutions to address local needs. In some cases, our R&D activities are conducted at our piloting and testing facilities and at strategic customer sites. These piloting and testing facilities enable us to serve our strategic markets globally. As
part of expanding our bandwidth and to increase our access to technology, we have built innovation eco-system
11
partnerships with academic institutions as well as other technology firms, start-up accelerators and venture capital organizations.
Capitalized Software
We capitalizeoffer software developed for saleas a product or service directly to external customers, which is included within "Other intangible assets, net" on our Consolidated Balance Sheets. As of December 31, 20192022 and 20182021 we had net capitalized software for saleused in sales and services to external customers of $165$213 million and $128$211 million, respectively.
Intellectual Property
We generally seek patent protection for those inventions and improvements that we believe will improve our competitive position. We believe that our patentsposition and applications are important for maintaining the competitive differentiation of our products and improving our return on R&D investments.not suitable to be kept as a trade secret. While we own, control or license a significant number of patents, trade secrets, proprietary information, trademarks, trade names, copyrights and other intellectual property rights which, in the aggregate, are of material importance to our business, management believes that our business, as a whole, as well as each of our core business segments, is not materially dependent on any one intellectual property right or related group of such rights.
Patents, patent applications and license agreements expire or terminate over time by operation of law, in accordance with their terms or otherwise. As the portfolio of our patents, patent applications and license agreements has evolved over time, we do not expect the expiration of any specific patent to have a material adverse effect on our financial position or results of operations.
Governmental Regulations
Environmental Matters and RegulationRegulations
Our global operations are subject to various laws and regulations governing the environment and climate change, such as those promulgated by the United StatesU.S. Environmental Protection Agency and similar state and foreign environmental agencies, including the discharge of pollutants and the management and disposal of hazardous substances. While environmental and climate change laws and regulations are subject to change, such changes can be difficult to predict reliably and the timing of potential changes is uncertain. Management does not believe, based on current circumstances, that compliance costs pursuant to such regulations will have a material adverse effect on our financial position or results of operations. However, the effect of future legislative or regulatory changes could be material to our financial condition or results of operations.
We continue to be dedicated to environmental and sustainability programs to minimize the use of natural resources, and reduce the utilization and generation of hazardous materials from our processes and to remediate identified environmental concerns. As to the latter, weWe are currently engaged in site investigations and remediation activities to address environmental cleanup from past operations at a number of current and former manufacturing facilities. We do not anticipate these liabilities will have a material adverse effect on our consolidated financial position or results of operations. At December 31, 2019,2022, we had estimated and accrued $3$4 million related to environmental matters.
Other Regulations
As a company with global operations, we are subject to complex U.S. federal, state and local and foreign laws and regulations in the countries where we conduct business, including with respect to trade, such as tariffs, imports and exports; anti-bribery and corruption; antitrust and competition; data security and privacy, such as the EU General Data Protection Regulation (“GDPR”) and the China Personal Information Protection Law ('PIPL"); use of regulated radio spectrum, including that of the U.S. FCC; lobbying activity; health and safety; and the environment, among other matters. We have policies and procedures in place to promote compliance with these laws and regulations. Additional information about the impact of government regulations on Xylem’s business is included in Item 1A. “Risk Factors” under the headings Risks Related to Our Business and Operations, Risks Related to Financial and Tax, and Risks Related to Legal and Regulatory.
12
Sustainability
At Xylem, sustainability is at the center of who we are and what we do. As a leading global water technology company, we address onesome of the world’s most urgent sustainability challenges - responsible stewardship of our shared water resources.resources and resiliency of communities to climate change. Technology is playing an increasingly important role in helping the world solve water issues. We have a long history of innovation and we are focusing on the powerful capabilities of smart technology, integrated management and data analytics.
We believe our financial performance and commitment to sustainability go hand in hand. Xylem approaches business sustainability as a way to generate economic value while also creating value for society, thus meeting the needs of both. Accordingly, in 2019, we evolved our approach to leverage sustainability in our decision-making toward long-term value creation for our shareholders, customers, employees and communities in which we operate and we announced an ambitious new slate of 2025 sustainabilitySustainability goals. These newThe progress towards these goals can be found in our 20182021 Sustainability Report, which is published usingaligned to the Global Reporting Initiative (GRI) framework.and the Sustainability Accounting Standards Board frameworks.
In setting our 2025 Sustainability goals, we also aligned them with the United Nations Sustainable Development Goals (UNSDGs)("UNSDGs"), not only to substantiate our contribution to achieving global objectives, but also to be transparent in our communication to stakeholders by providing details on our responsibility to build a sustainable future. While Xylem embraces all 17 of the UNSDGs, we have a special focus on SDG6: Clean Water and Sanitation.
Additionally, in 2021, Xylem announced our commitment to reach Net Zero greenhouse gas ("GHG") emissions before 2050 across our value chain, further aligning our long-term commitment to sustainability with sector-wide moves towards reduced carbon footprint. In 2022, we submitted our 2030 GHG reduction targets to the Science Based Target Initiative for validation. As of year end, these are currently under review.
In 2022, we announced investments in CNote’s Impact Cash™ platform, a mechanism through which we invest and deposit cash at scale in community finance institutions that strengthen and transform underserved communities. In 2021, in partnership with Goldman Sachs, we continued our work towards further integrating our business and finance strategies with sustainability by creating a cash account tied to performance of select 2025 Sustainability goals. In 2020, Xylem completed a $1 billion Green Bond offering in senior unsecured notes, consisting of $500 million of 1.950% senior notes due in January 2028 and $500 million of 2.250% senior notes due in January 2031. The proceeds of this offering were allocated to green projects that help improve water accessibility, water affordability, and water systems resilience. This follows our 2019 execution of a five-year revolving credit facility (the “2019 Credit Facility”) with Citibank, N.A., as Administrative Agent, and a syndicate of lenders. The 2019 Credit Facility includes a pricing grid that determines the applicable margin based on Xylem's credit rating, with a further adjustment depending on Xylem's annual Sustainalytics Environmental, Social and Governance (“ESG”) score, an important barometer of Xylem’s continued commitment to sustainability. Additionally, during the first quarter of 2021, we issued a special grant of less than 0.1 million ESG performance share units.
Human Capital
Our colleagues around the globe are united in a shared purpose – to solve water – and, as such, are key to the Company’s success and execution of our strategy. We continue to foster an empowering, mission-driven, people-centered, diverse, equitable and inclusive culture. We believe that our overall success and long-term growth depend, in part, on our continued ability to attract and retain diverse and highly skilled colleagues, including senior leaders and colleagues with skills in our strategic competencies, such as engineering, innovation, digital technologies, sales excellence, sustainability and product and project management, as well as production and technical services talent. The market for production, technical services, leadership and highly-skilled talent is increasingly competitive, but we believe our culture is a differentiator and therefore important to our ability to attract and retain employees.
As of December 31, 2019,2022, Xylem hademployed approximately 16,30017,800 employees worldwide. We have approximately 5,600 employees in the United States,U.S., 7,100 in Western Europe, and 4,300 in the Emerging Markets, with the remaining 800 in other geographies in which we operate. Approximately 37% of whom approximately 17%our colleagues are represented by labor unions.unions, including 16% of our U.S. colleagues. In certain foreign countries, our employeescolleagues are represented by work councils. We believe that our facilities are in favorable labor markets with ready access to adequate numbers of workers and believe our relations with our employees are good.good, including with our employees that are represented by labor unions or works councils.
13
We conduct regular employee engagement surveys to understand our employees’ perspectives, identify areas for additional focus and establish action plans. These surveys cover a range of topics, including employee engagement, company culture, customer focus, organizational effectiveness, employee well-being, safety, diversity, equity and inclusion, pay for performance and career development opportunities. Our approach currently includes a periodic comprehensive global survey, shorter pulse surveys and listening sessions. 86% of our employees globally participated in our 2021 comprehensive engagement survey, and our engagement index showed increases from the 2019 survey.
Our Vision and Values
Our vision and values provide the foundation for how we want to grow as a company as well as the inspiration for how we want to behave as industry leaders and ethical corporate citizens. Our vision is to create a world in which water issues are no longer a constraint to health, prosperity, and sustainable development. We devote our technology, time and talent to advance the smarter use of water and our colleagues are guided by our core values:
•Respect for each other, for diversity of people and opinions, for the environment;
•Responsibility for our words and actions, for customer satisfaction, for giving back to our communities;
•Integrity for acting ethically, for doing what we say we’ll do, for having the courage to communicate with candor; and
•Creativity for thinking beyond boundaries, for anticipating tomorrow’s challenges, for unlocking growth potential.
Diversity, Equity and Inclusion
We are committed to a workplace that creates a sense of belonging for everyone: where all our colleagues feel involved, respected, valued, heard, connected and able to bring their authentic selves to work. At Xylem, we recognize the power of diversity, equity and inclusion to drive innovation, make us more competitive, positively impact employee and customer satisfaction and the Company’s performance, better serve the communities in which we operate, create value for our shareholders and other stakeholders and advance social equity.
Our commitment to building a global, diverse, equitable and inclusive culture starts with our Board of Directors and senior leadership team members, who represent a broad spectrum of backgrounds and perspectives. We believe that the diversity of our Board of Directors and senior leadership enhances our ability to evolve and execute our business strategy and to attract and retain diverse and highly-qualified talent, and also fuels our commitment to foster a culture of inclusion and provide our colleagues with equitable access to opportunities. As of December 31, 2022 globally, 26% of our colleagues identify as female; in the U.S., 28% of our colleagues identify as U.S. minorities.
Diversity and inclusion metrics are included in our regular business reviews to provide transparency and drive accountability by highlighting progress on goals and outlining steps to achieve them. In addition, we publicly disclose various workforce metrics regarding gender, age and racial and ethnic diversity, including our U.S. EEO-1 report. One of our strategies for becoming a more diverse organization—and incorporating broader experiences, skill sets, and perspectives into our work—is expanding sourcing channels for diverse talent through external diversity partnerships and affiliations.
We offer Employee Network Groups, which are voluntary, employee-led groups formed by people with a common affinity, such as gender, race, sexual orientation and gender identity, military status or other attributes. Each Employee Network Group is sponsored and supported by one or more senior leaders and all groups are open to all employees regardless of any diversity attributes with which they may identify. Collectively, approximately 3,900 colleagues participate as members of our network groups.
Health and Safety
Protecting the safety, health and well-being of our colleagues is one of our highest priorities. We have a strong Environmental, Health and Safety program that focuses on governance, risk reduction, training and education, and leadership accountability to provide our colleagues with safe and healthy workplaces.
In our 2021 employee engagement survey, we sought specific feedback from our colleagues on their efforts to manage stress and disconnect from work and, based on the survey responses, we have augmented our holistic well-being strategies, including providing mental health awareness training to our people leaders, which more than 500 people managers have participated in, and expanding our Employee Assistance Program support across the globe.
14
In response to the ongoing crisis in Ukraine, we continue to provide financial and logistical support to our colleagues and partners in Ukraine, including travel assistance and temporary accommodations near our facilities in Poland.
Compensation and Benefits
Xylem takes a total rewards approach that integrates programs for compensation, benefits, recognition and work-life balance and we strive to provide our colleagues with competitive compensation and benefits. In 2022, for our U.S. colleagues, we enhanced our paid parental leave and short-term disability coverage, provided for flexible time off, and expanded our health and welfare benefits, including with respect to reproductive care. While individual program components may differ by country, role or level, our culture and commitment to results and equity remain constant. We are currently conducting a pay equity assessment based on gender and U.S. minority classifications and will use the results of this assessment to continue to support our commitment to equitable pay by role.
We seek to align our human capital and sustainability strategies to support our mission-driven culture and further our shared value approach, which is designed to generate increased economic and social value for our investors and other stakeholders. Accordingly, in 2021, the Company expanded its sustainability-linked compensation for all of our senior leaders, as well as a broader group of executives, with a special, one-time grant of performance share units with goals that are based on 5 of our strategically transformative 2025 Sustainability goals. We continue to expand our long-term incentive program to reach deeper in the organization to recognize key talent and top performers and attract and retain digital technology talent.
We have heard from many of our office-based colleagues that they greatly value the increased flexibility and autonomy that come with remote working. We believe that an appropriately tailored approach that balances in the office, fully remote and hybrid arrangements increases our ability to retain and attract the best, most diverse talent, while reducing our carbon footprint associated with unnecessary commuting and business travel. We are continuing to explore ways to help our colleagues thrive in a variety of work settings and have formalized guidelines that support remote and hybrid work. To better support our colleagues in a more flexible workplace, we also provide high-touch global onboarding and leverage collaboration technologies.
Career Development
We are committed to enhancing colleagues’ capabilities needed for the Company to win in the marketplace. We also are focused on internal talent mobility across functions, geographies and businesses. Through our continuous improvement program, we nurture and grow a continuous improvement mindset throughout all areas of the Company.
We have a broad range of talent development programs and experiences to facilitate the continued professional growth and leadership development of our colleagues and to support our succession plans. These programs span across all levels, businesses and functions, including entry-level talent recruitment programs, development programs for emerging leaders, people leader training and executive leadership development. We also provide on-demand/self-paced learning through our learning management systems.
We prioritize employee engagement through regular, year-round discussions focused on employee performance feedback and development, opportunities to work on special projects, and volunteer activities involving Watermark, our corporate social responsibility program, as well as Xylem Ignite, our youth engagement program. Our Employee Network Groups foster inclusion and support the development of our colleagues by offering formal and informal leadership opportunities and creating visibility for colleagues.
Labor Relations
Xylem recognizes the work of labor organizations, work councils and trade unions to better the lives of working people. Accordingly, Xylem respects the legal rights of its employees to join or to refrain from joining such organizations. An employee’s decision to join or not join a labor organization will in no way result in any discrimination against that employee. Xylem informs managers at all levels of the importance of respecting the rights of colleagues to organize or be represented. We work to establish favorable employment conditions that promote positive relationships between our colleagues and their managers, facilitate communications among our colleagues and support their development.
15
Available Information
We are required to file annual, quarterly and current reports, proxy statements and other information with the SEC. Our annual reports on Form 10-K, quarterly reports on Form 10-Q, current reports on Form 8-K, proxy statements and amendments to those reports are available free of charge on our website www.xylem.com as soon as reasonably practicable after such reports are electronically filed with or furnished to the SEC. The information on our website is not, and shall not be deemed to be, a part hereof or incorporated into this or any of our other filings with the SEC.
In addition, the public may read or copy any materials filed with the SEC, free of charge, at www.sec.gov.
16
ITEM 1A. RISK FACTORS
In evaluating our business and investment in our securities, investors should carefully consider the following discussion of significantmaterial factors events, and uncertainties that make an investment in our securities risky should be carefully considered,events, along with all of the other information in this Report and in our other filings with the SEC. The events and consequences discussed in these risk factorsbelow could, in circumstances that we may not be able to accurately predict, recognize or control, have a material adverse effect on our business, financial condition, cash flow,flows, results of operations and/or market price of our common stock.
These risk factors do not identify all of the risks we face. WeOur business is also subject to general risks that affect many other companies. In addition, we operate in a continually changing business, economic and geopolitical environment and as a result, new risk factors, or changes to our risk profile, may emerge from time to time. We could also be affected by factors, events, or uncertainties that areRisks not presentlycurrently known to us, or that we currently do not consider to present significant risks. In addition, thebelieve are immaterial, may impact our business, operations, financial condition or share price. The global economic and geopolitical climate, amplifiesincluding as a result of the war between Russia and Ukraine, the coronavirus ("COVID-19") pandemic, and macroeconomic conditions, amplify many of these risks.the risks below. Risks in this section are grouped in the following categories: (1) Risks Related to Geopolitical, Macroeconomic and Industry Factors; (2) Risks Related to Our Business and Operations; (3) Risks Related to Financial and Tax; (4) Risks Related to Legal and Regulatory; and (5) Risks Related to the Proposed Acquisition of Evoqua. Many risks affect more than one category, and as a result the risks are not in order of significance or probability of occurrence.
Risks Related to Geopolitical, Macroeconomic and Industry Factors
Industry and economic conditions may adversely affect our markets and our customers’ operating conditions, which can in turn affect our business, results of operations and financial condition.
With sales in approximately 150 countries, we compete across a wide range of geographic and end-markets. Material economic and industry factors impacting our businesses include: (i) the overall strength of, and our customers’ confidence in, local and global macroeconomic conditions; (ii) inflation, (iii) overall strength of industrial, governmental, public and private sector spending; (iv) overall strength of the industrial, residential and commercial real estate markets; (v) federal, state, local and municipal governmental fiscal, trade and procurement laws, regulations and policies, including with respect to domestic content; (vi) the availability of commercial financing for our customers and end-users; and (vii) the degree of funding for our public sector customers, including with respect to water infrastructure investments. Macroeconomic impacts and dynamics, including as a result of the COVID-19 pandemic, with respect to supply chain shortages, logistics challenges, tight labor markets and inflation, have had, and continue to have, a material adverse effect on our business and results of operations. Future slowdowns, economic recession, or other prolonged downturns in the global economy or our markets could have material adverse effects on our business, financial condition, cash flows, results of operations and stock price.
We are exposed to geopolitical, regulatory, economic, foreign exchange and other risks associated with our global sales, supply chain and operations.
In 2022, 47% of our total revenue was from sales to U.S. customers and 53% was from sales to customers outside the U.S. We expect our sales from international operations and export sales to continue to be a significant portion of our revenue. Many of our manufacturing operations, employees, suppliers and distribution channels are located outside of the U.S. Our operations, supply chain and sales both within the U.S. and internationally are subject, in varying degrees, to risks and uncertainties inherent in doing business globally, including:
•economic nationalism, populism, protectionism, anti-global sentiment and changes in trade protection measures, including embargoes, tariffs and other trade barriers, import and export regulations, licensing requirements, and new and existing domestic content requirements for projects receiving governmental funding;
•instability of and impacts from the evolving global geopolitical environment, including with respect to the relationships among the U.S., European Union, China, Taiwan, or other foreign countries, and the international community at large;
•threat, outbreak, uncertainty or escalation of terrorism, political instability, insurrection, war or other armed conflict, including between Russia and Ukraine;
•threat or outbreak of epidemics, global health crises or pandemics, such as COVID-19, and related uncertainties;
17
•changes in tax laws and potential negative consequences from the interpretation, application and enforcement by governmental tax authorities of tax laws and policies, and changes in other laws and regulations or how such provisions are interpreted or administered;
•disruptions in our global supply chain, operations or those of third parties upon which we rely, including due to labor or supply shortages, freight and logistics challenges;
•actual or threatened war or armed conflict, labor actions, or civil, political or other disturbances;
•unfavorable circumstances arising from host country laws or regulations, including those related to infrastructure and data transmission, security and privacy;
•theft, compromise or misappropriation of our technology, intellectual property or data;
•shocks to the global financial system, including due to the outbreak or threat of war, armed conflict, other geopolitical conflicts, terrorism or global health crises, the effects of climate change, or other idiosyncratic events;
•foreign currency exchange rate fluctuations, restrictions on repatriation of earnings or payment of distributions, dividends, loans or advances to us by foreign subsidiaries;
•global or regional safety and security considerations; and
•increased costs and risks in developing, staffing and simultaneously managing our many global operations as a result of distance, remote work arrangements, language and cultural differences.
In the year ended December 31, 2022, 19% of our total revenues were generated in emerging markets and we have placed a particular emphasis in our strategy on increasing our growth and presence in emerging markets, including China, India, and key markets in Africa. Beyond the general risks that we face outside the U.S., our operations in emerging markets are subject to additional risks and uncertainties, including: (i) governments may impose or increase withholding or other taxes on remittances and other payments to us; (ii) governments may seek to nationalize our assets; (iii) governments may impose or increase investment barriers or other restrictions affecting our business; (iv) difficulty in enforcing commercial agreements; (v) challenges collecting receivables, or protecting our intellectual property and other assets; (vi) pressure on the pricing of our products and services; (vii) higher business conduct risks; and (viii) challenges in our ability to attract and retain qualified talent and labor. We cannot predict the impact that such factors might have on our business, financial condition, cash flows, results of operations and stock price.
We have significant sales, operations and direct or indirect suppliers located in China, which have been in the past, or could in the future be, adversely affected by China’s evolving laws, regulations and policies, including with respect to its evolving COVID Policy, import and export tariffs and restrictions, and information security and privacy. Our business and operating results could also be adversely impacted by changes in the political and geopolitical environment involving China, including U.S.-China or China-Taiwan relations. For example, the U.S.’ imposition of tariffs on goods imported from China or deemed to be of Chinese origin, as well as the potential for new tariffs, other governmental actions, trade embargoes or sanctions by the U.S., or countermeasures imposed by China in response, has in the past and could in the future have an adverse direct or indirect impact our global supply chain, manufacturing costs, and sales and operations in China.Furthermore, geopolitical changes in China-Taiwan relations could disrupt the operations of several companies in Taiwan that are critical to our complex, global supply chain, including with respect to the supply of semiconductors (“chips”) and other electronic components. Such changes could likely have significant negative effects on the global semiconductor industry and could adversely affect our ability to manufacture our digitally-enabled products, such as pumps, controllers and smart meters.
In the year ended December 31, 2022, 47% of our revenues was from sales to U.S. customers, which included sales of products sold into federally funded projects. We expect our U.S. sales in 2023 and beyond to be similar. However, we may not be able to successfully compete for federally funded projects as some of our products may not comply with the domestic content requirements of the U.S. Buy America mandate under the Infrastructure Investment and Jobs Act (“IIJA”), as well as other federally funded projects. We continue to evaluate the risks associated with the Buy America mandate, as well as related mitigation options around sourcing and manufacturing, but there is no guarantee that we will be able to meet applicable domestic content requirements across all our product lines. While governmental exemptions and waivers may in the future be issued that negate the application of the Buy America mandate to some or all of our potential sales into IIJA and other federally funded projects, it is uncertain whether and to what extent such exemptions or waivers may be issued. An inability to meet applicable domestic content requirements for U.S. federally funded projects could have a material adverse impact on our business, financial condition or results of operations.
18
We are unable to predict the extent to which the ongoing global COVID-19 pandemic, or other outbreaks, epidemics, pandemics, or public health crises may adversely impact our business, results of operations and financial condition.
Our global operations expose us to risks associated with public health crises, including epidemics and pandemics. Outbreaks of epidemics, pandemics, or public health crises could adversely affect, among other things, demand for our products and services; our operations and sales; our supply chain; our research and development capabilities, engineering, design, and manufacturing processes; and other important business activities. Such outbreaks could result in the restriction or suspension of travel, prohibitions of non-essential activities, and limit in-person activities within our Company and with customers and could also present operational challenges, such as disruptions in our manufacturing and supply chain and logistics, all of which can adversely affect our ability to fulfill orders, provide services, respond to customer requests and maintain our business operations. We are unable to predict the full extent of the impact of the outbreak of epidemics, pandemics, or public health crises on our operations, customers and suppliers.
Since early 2020, the COVID-19 pandemic and its variants have resulted in, and may continue to result in, a slowdown of global economic activity, travel restrictions, prohibitions of non-essential activities in some cases, disruption and shutdown of businesses, including that of our customers and suppliers. Our operations have been affected by a range of external factors related to the COVID-19 pandemic that are not within our control, including the various governmental restrictions on employees, customers, partners and suppliers, such as China’s COVID Policy, designed to limit the spread of COVID-19. The pandemic and broader global market supply and demand dynamics have impacted, and continue to impact our supply chain with unpredictable disruptions due to material and component shortages, including with respect to key electronic components such as chips, capacity constraints, delays in shipment of materials necessary to the manufacture of our products, freight and logistics challenges, tight labor markets and inflation. While component supply shortages are showing signs of recovery, they may nevertheless persist, adversely disrupting our business. The ultimate extent of the impacts of the COVID-19 pandemic, including as a result of possible subsequent outbreaks of new variants and measures taken in response thereto remains highly uncertain and cannot currently be predicted and we may not be successful at mitigating such impacts.
The COVID-19 pandemic caused significant volatility and uncertainty in the global financial and capital markets. A further disruption of these markets, or resulting economic downturn from the COVID-19 pandemic or outbreak of other global health crises, may impact our ability to incur debt or access capital, or increase our cost of capital. There are no assurances that the credit markets or the capital markets will be available to us in the future or that the lenders participating in our credit facilities will be able to provide financing in accordance with their contractual obligations. Additionally, concerns over the economic impacts of COVID-19 have caused, and may continue to cause, volatility in our stock price. A sustained economic downturn could impact our liquidity position, including our ability to continue to pay dividends, or could impact our asset values resulting in the carrying value of our goodwill or other intangible assets exceeding their fair value, which may require us to recognize an impairment to those assets.
Inflation, tariffs, customs duties and other increases in manufacturing and operating costs have, and could continue to, adversely affect our cash flows and results of operations.
Our operating costs are subject to fluctuations, particularly due to changes in prices for commodities, parts, raw materials, energy and related utilities, freight and logistics, and cost of labor, which have been and may continue to be driven by a variety of factors, including inflation, tight labor markets, prevailing price levels, exchange rates, changes in trade agreements and trade protection measures including tariffs, and other economic factors. Throughout 2022 our operating costs have been adversely impacted by price inflation, including with respect to the cost of certain raw materials, electronic components, commodities, freight and logistics, and we expect this to continue for the foreseeable future. In addition, we have significant manufacturing operations in Europe, which could be adversely impacted by increased costs for energy as a result of the Russia-Ukraine conflict and governments' efforts to decrease dependence on Russia energy supplies. The U.S. has enacted various trade actions, including imposing tariffs on certain goods we import from China and other countries, which has resulted in retaliatory tariffs by China and other countries. Additional tariffs imposed by the U.S., or further retaliatory trade measures taken by China or other countries, could increase the cost of our products that we may not be able to offset through price increases or productivity. Further, in a declining price environment, our operating margins may contract because we account for inventory using the first-in, first-out method. Actions we take to mitigate volatility in manufacturing and operating costs may not be successful and, as a result, our business, financial condition, cash flows and results of operations could be materially and adversely affected.
19
Risks Related to Our Business and Operations
Failure to compete successfully in our markets, including our ability to develop and commercialize innovative and disruptive technologies, could adversely affect our business.
We offer our technologies, products and services in highly competitive markets. We believe the principal points of competition in our markets are product and service performance, quality and reliability, innovation, speed to market with new or disruptive technologies and business models, application expertise, brand reputation, energy efficiency, product security, product life cycle cost, timeliness of delivery, proximity of our service centers to customers, effectiveness of our distribution channels, price and customers’ experience in conductingdoing business with us. Maintaining and improving our competitive position will require successful management of these factors in a business environment with increasingly rapid rates of change and disruption, including our continued investment in talent, manufacturing, technologydisruption.
Our competitive position and innovation, research and development, engineering, sales and marketing, customer service and support, and our distribution networks. Our future growth rate dependsdepend upon a number of factors, including our ability to:to successfully: (i) innovate, develop and maintain competitive and secure products and services, as well as business models and customer experience, to address emerging regulations and trends and customermeet customers’ needs in our target markets,(including those related to social, environmental and sustainability matters), (ii) defend our market share against an ever-expanding number of competitors, many of which are new and non-traditional competitors from outside our industry, such as majorlarge technology firms, or those out of emerging markets, (iii) enhance our product and service offerings by adding innovative features, increased efficiency or disruptive technologies that differentiate them from those of our competitors and prevent commoditization, (iv) develop, manufacture and bring compelling, secure and efficient new products and services to market quickly and cost-effectively, (v) continue to cultivate, develop and (v)maintain our distribution network of channel partners, (vi) attract, develop and retain individuals with the requisite innovation, digital and technical expertise and understanding of customers’ needs to develop and commercialize new technologies, and introduce new products and services.services, (vii) continue to leverage and expand our external ecosystem of innovation partners from universities, venture capital, the start-up of community and other technology firms, (viii) continue to invest in our manufacturing, research and development, engineering, sales and marketing, digitization of customer service and support tools, and distribution networks, (ix) win large contracts, and (i) compete for business subject to applicable governmental procurement laws, regulations and policies, including new and existing domestic content requirements in the U.S. and globally, as they may evolve over time.
We may not be successful in maintaining our competitive position. Our competitorsposition, which could adversely affect our business, financial condition, cash flows or third parties from outside our industry may develop disruptive technologies, products and services more quickly than us or that are superior to ours, may develop new or more efficient or effective methods or business models to provide technologies, products and services, or may adapt more quickly than we do to new trends, disruptive technologies or evolving customer requirements.results of operations. The failure of our technologies, products or services to maintain and gain market acceptance due to more attractive offerings, as well asfailure of our products to comply with new governmental regulations or policies, or customers’ slower-than-expected adoption of and investment in our new and innovative technologies could significantly reduce our revenues or market share and adversely affect our competitive standing and prospects.position. Pricing pressures also could cause us to adjust the prices of certain products to stay competitive, or we may not be able to continue to win large contracts, which could adversely affect our market share and financial performance. Failurecompetitive position.
20
Cybersecurity incidents or other disruptions to continue competing successfully or to win large contractsour information technology infrastructure, communications networks and operations could adversely affect our business, financial condition, cash flow or results of operations.
Our business operations, including manufacturing, rely on information technology, operational technology, and communications networks, some of which are operated by third parties, including increasingly, cloud-based service providers, to process, transmit and store our electronic information, including sensitive data such as confidential business information and personal data relating to employees, customers or other business partners. We have, or operate through,As a concentrationresult of operationsthe evolution of new ways of working, a significant portion of our workforce has transitioned to remote working and are therefore reliant on certain sites, such as productionour information technology infrastructure and shared service centers.communication networks and access to reliable and safe communication networks in their communities in order to be able to perform their jobs. We also rely on third parties’ information technology systems to run manufacturing processes, to store or manage data, or to manage or support a variety of critical business processes and activities.activities, including with regard to remote work. Regardless of protection measures, essentially all systems are susceptible to damage, disruption or shut-down due to cybersecurity attacks, including ransomware, denial-of-service, computer viruses and security breaches, as well as human error or malfeasance,breaches; equipment or system failure, including due to maintenance, obsolescence or age,age; and other events or circumstances, such as human error or malfeasance, vandalism, natural disasters,disaster, fire, power, communication or communication outages,other utility outage, shutdown telecommunication or utility failure and other events. In
In addition, we have in the past offered and continue to offer certain services and products, including pumps, controllers and meters, used by third parties for operational purposes or to collect data, whichthat are digitally-enabled or that connect to and are part of the “Internet of Things” (IoT)., and are used by our customers and other third parties for operational purposes or to collect data. Cybersecurity attacks may target hardware, software and information installed, stored or transmitted by our products after they have been purchased and incorporated into third-parties’customers and other third parties’ products, facilities or infrastructure.infrastructure, including critical infrastructure applications. While we attempt to provide security measures to safeguard our products and services from cyber threats, the potential for an attack remains. In addition, our customers may continue to use digitally-enabled products that were designed, manufactured and sold by us at a time when current security features were not available. A successful attack may result in the misappropriation, destruction, unauthorized access to or disclosure of customers or other third parties' confidential information, damage or disruption to customer or shut-down of third parties’ operations, potentially with personal health and safety risks, recall of our products or increased costs for security and remediation, as well as possible damage to our brand reputation.
Like many multinational corporations,companies, we, and some third parties upon which we rely, have experienced cybersecurity attacks on information technology networks and systems, products and services in the past and may experience them in the future, likely with more frequency and involving a broader range of devices and modes of attack. To date, none have resulted in any material adverse impact to our business, operations, products, services or customers. We have adopted measures designed to mitigate potential risks associated with cybersecurity threats, breaches or other disruptions or damage to our information technology networks and systems, products and services but the unpredictability of the timing, nature and scope of such disruptions and threats could impact our business, operations, products and services. Disruption to any of the information technology and communications networks on which we rely, or an attack on our products and services, could interfere with our operations, disrupt our supply chain and service to our customers, interrupt production and shipments, result in theft or compromise of our and our customers’ intellectual property and trade secrets, damage employee, customer and business partner relationships, negatively impact our reputation, result in legal claims and proceedings or regulatory enforcement actions, and increase our costs for security and remediation, any of which could have a material adverse effect on our competitive position, results of operations, cash flows or financial condition.
Although we continue to assess these risks, implement controlsmeasures to mitigate these risks and perform business continuity and disaster recovery planning, we cannot be sure that cybersecurity attacks or other interruptions with material adverse effects will not occur.occur, or that our business continuity and disaster recovery efforts will be effective and adequate.
Lack of or delay in availability of products, parts, raw materials and energy from our supply chain or the inability of suppliers to meet delivery and other requirements, could adversely affect our business.
Our resultsbusiness relies on a large and complex network of operationssuppliers (and their suppliers), including contract manufacturing, commodity markets and freight and logistics providers, to secure and ship finished goods and raw materials, parts, electronic components and other components that are used in our products. We expect that our reliance on, and the complexity of, the supply chain will continue to increase. Parts and raw materials commonly used in our products include electronic components, including semiconductors, motors, fabricated parts, castings, magnets, bearings, seals, batteries, and PCBs, as well as commodities, including steel, brass, nickel, copper,
21
aluminum and plastics. We are exposed to the availability of these parts, components, materials and finished goods, which throughout 2022 have been and may in the future be subject to delay, curtailment or change due to, among other things, macroeconomic factors including supply and demand dynamics, labor shortages, changes in the strategy or production planning of suppliers including decisions to exit production of key components upon which we rely, interruptions in suppliers' production, labor disputes, the impaired financial condition of a particular supplier, suppliers’ capacity allocations to other purchasers, changes in trade agreements and trade protection measures including tariffs, exchange rates and prevailing price levels, ability to meet regulatory requirements, weather emergencies and associated effects of climate change, the ongoing effects of the COVID-19 pandemic, or other public health crises, or threatened or actual terrorism, armed conflict, or war, including the ongoing conflict between Russia and Ukraine. In addition, any threatened or actual escalation of the Russia-Ukraine conflict, including impacts such as disruption or increased cost of energy supply in Europe, could delay or interrupt our supplies from suppliers of energy intensive materials, such as steel, glass and plastics, among others. We have also experienced, and continue to experience, increased freight and logistics costs, delivery delays related to port congestion and other logistics-related challenges. Although we have insurance, we cannot be certain that this insurance coverage will continue to be available to us at a reasonable cost or will be adequate to cover any or all aspects of supply chain disruptions.
Some of our key components are available only from a sole or single source supplier or a limited group of suppliers and so we are subject to supply and pricing risk. In addition, if a sole or single source supplier were to cease or interrupt production or otherwise fail to supply a key component to us, it could adversely affect our product sales and operating results.
In addition, as a result of the ongoing COVID-19 pandemic and broader global economic, geopoliticalmarket supply and financial market conditions.
demand dynamics, we have experienced and may continue to experience shortages, capacity constraints and delays with respect to the supply of components, including electronic components (in particular, chips), and other parts and raw materials. We compete aroundhave and continue to take measures, including with respect to buffer stock, the world in various geographicuse of alternative suppliers and product markets. In 2019, 49%, 24%re-design of certain products, to mitigate the impacts of the ongoing supply chain, freight and 20%logistics issues. However, if these shortages and disruptions continue, if additional disruptions occur (including related to the aforementioned risk of our total revenue was from customers locateddisruption in the United States, western Europeglobal semiconductor industry due to China-Taiwan geopolitical issues), or if our efforts to mitigate these shortages and emerging markets, respectively. We expect revenue from these marketsdisruptions are insufficient or unsuccessful, we may be unable to, be significant for the foreseeable future. Important factors impactingor delayed in our businesses include the overall strength of these economies andability to execute on our customers’ confidence in both local and global macro-economic conditions; instability and uncertainties from the global geopolitical environment; industrial and private sector spending, federal, state, local and municipal governmental fiscal and trade policies; the strength of the residential and commercial real estate markets; interest rates; availability of commercial financing forbacklog, fill new customer orders or timely deliver products to our customers and end-users; the availability of funding for our public sector customers; and unemployment rates. A slowdown or prolonged downturn in the global economy or our markets has in the past, andtherefore could have in the future a material adverse effect on our business, financial condition cash flow andor results of operations.
A material disruption to any of our facilities or operations, or that of third parties upon which we rely, may adversely affect our business.business and financial performance.
Our facilities and operations rely on a complex and highly reactive global supply chain, consistingincluding suppliers (and their suppliers), some of suppliers,which are a single-or sole-source, distributors, contract manufacturers, utilities providers, and freight and logistics providers. In addition, our business relieswe rely on certain third parties to supply critical business processes and activities, including in the areas of Finance, Human Resources, Procurement, Travel and Information Technology. If ourOur facilities orand operations and those of certain third parties uponon which we rely, have experienced, and may in our supply chain and critical business operations were to be disruptedthe future experience, disruptions or delays as a result of an actual or threatened event or circumstance, including due to a significant equipment, technological or system failure, natural disaster, weather event, effects of climate change, power, energy curtailment or outage, water or communications outage, fire, explosion, critical supply chain failure, terrorism, cybersecurity attack, political disruption, the effects of COVID-19, outbreak of pandemics,an epidemic, pandemic or other public health crisis, insurrection, armed conflict or war, labor dispute, work stoppage or slowdown, technology failure, adverse weather conditionsfinancial viability or other reason,reason. In addition, our facilities or that of third parties upon which we rely operate in certain circumstances with equipment that may be unique and difficult to replace or involve long lead times for replacement. A significant disruption to any of our facilities or operations, or that of third parties upon which we rely, could cause material adverse impacts to our financial performance, operations and business, could be adversely affected. Interruptions could causeincluding an inability to meet customer demand or contractual commitments, increase ourincreased costs, reduce ourand reduced sales, and could impact our business processes and activities, including our ability to timely report financial results. We also have or operate through a concentration of operations on certain sites, such as production and shared services centers, where business interruptions could cause material damage and costs. Any interruption in capability may be lengthy and have lasting effects, require a significant amount of management and other employees' time and focus, and require us to make substantial expenditures to remedymitigate the situation, which could negatively affect our operations, business processes and activities, profitability, financial condition and financial condition.reputation. Any recovery under our insurance policies may not offset the lost sales, or increased costs, that may be experienced during a disruption of operations or any resultant longer-termlonger term loss of suppliers, sales or customers that we may experience as a result of a disruption. Although we continue to assess these risks, implement mitigation plans and perform business continuity and disaster recovery planning, we cannot be sure that interruptions with material adverse effects on our operational and financial performance will not occur.
22
Failure to retain our existing senior management, engineering, technology, sales, services and other key talents or the inability to attract new qualified and diverse talent could negatively impact our business.
Our success has depended, and will continue to depend on our ability to attract and retain highly qualified and diverse employees in senior management positions, and in strategic or core competencies, including engineering, innovation, digital technologies, commercial excellence, service, and project management, as well as general production-related talent. The market for highly-skilled talent, leaders and labor in our industry remains highly competitive. As a result, our success in attracting and retaining employees,particularly in the areas of services, digital technologies, innovation and data science, has depended, and will continue to depend on our ability to offer attractive career growth opportunities, work arrangements, compensation, and benefits, and also policies and ways of working that support employee wellbeing. In addition, continuing to evolve our culture, which includes advancing diversity, equity and inclusion, is critical to attracting and retaining talent needed to execute our strategy, while also driving innovation, remaining competitive and creating long-term value. We also need to continue to develop qualified talent to support business growth and robust succession plans, both of which are critical to our long-term success. A failure to attract or retain highly engaged and skilled talent and labor could adversely affect our ability to meet and exceed the needs of our customers, operate and grow our business and execute our strategy.
Defects, unanticipated use or inadequate disclosures with respect to our products could adversely affect our business, reputation and financial condition cash flow and results of operations.
We may not achieve some or all of the expected benefits of our restructuring and realignment plans andor our restructuring and realignment may adversely affect our business.
In 2022 and recent prior fiscal years, we have initiated restructuring and realignment plans in an effort to optimize our cost structure, and improve our operational efficiency and effectiveness. In 2017,effectiveness, strengthen our competitive positioning and better serve our customers. Additionally, in 2020, in response to the business and economic conditions resulting from the COVID-19 pandemic, we undertook steps to advanceinitiated additional restructuring and realignment activity. We are also engaged in a multi-year effort to transform many of our support functions and related technologies, including Finance, Human Resources and Procurement. Challenges with the enabling technologies and delays in implementing planned restructuring and realignment activities have resulted in delayed the realization of some of the expected operational and financial benefits from such actions. As such, weWe may not be able to obtain all of the cost savings and benefits that were initially anticipated in connection with our restructuring and realignment plans. Additionally, as a result of these plans, we may experience a loss of continuity loss ofor, accumulated knowledge or inefficiencyinefficiencies during transitional periods and ongoing operations. Realignment and restructuring require a significant amount of management and other employees' time and focus, which may divert attention from operating and growing our business.
The successful implementation and execution of our restructuring and realignment actions are critical to achieving our expected cost savings, as well as effectively competing in the marketplace and positioning us for future growth. Factors that may impede a successful implementation and execution include the retention of key employees, the impact of
regulatory matters including tax, matters involving certain third-party service providers selected to assist us, including staffing, technology, and thecompliance of service providers’ complianceproviders with the Company'sour internal controls over financial reporting, and adverse economic market conditions. If our restructuring and realignment actions are not executed successfully, it could have a material adverse effectimpacts on the effectiveness of our internal controls over financial reporting, as well as our competitive position, business, financial condition, cash flowflows and results of operations.
23
To execute our growth strategy, we plan to continue to pursue the acquisition of other companies, assets, technologies, product lines and customer channels that either complement or expand our existing business.business or improve our competitive position. We may not be able to identify suitable candidates, negotiate appropriate acquisitioncomplete acquisitions with favorable terms or timing, or at all, or obtain financing that may be needed to consummate acquisitions, complete proposed acquisitions,acquisitions. In addition, our results of operations may be adversely impacted by: (i) the failure to successfully integrate acquired businesses into our existing operations, technology and financial and other systems, (ii) the failure of acquired businesses to meet or expand into new markets. In addition,exceed expected returns, which in the past has led to, and in the future may lead to, accounting impairments, (iii) the discovery of unanticipated liabilities, labor relations difficulties, cybersecurity concerns, control or compliance issues, or other issues for which we cannot make assurances that any acquisition will perform as planned, be accretive to earnings,lack contractual protections, insurance or prove to be beneficial to our operations or cash flow.indemnities.
Acquisitions involve a number of risks and present financial, managerial and operational challenges, including: diversion of managementmanagement’s attention from existing businesses and operations; integration of technology, operations personnel, and financial and other systems; potentially insufficient cybersecurity controls; insufficient internal controls over financial or compliance activities or financial reporting; the failure to realize expected synergies; the assumption of liabilities normally assumed with an acquisition as well as the possibility that we become exposed to substantial undisclosed liabilities or new material risks associated with the acquired businesses; and the loss of key employees of the acquired businesses. Failure to successfully execute our growth strategy via acquisitions and successfully integrate these acquisitions could adversely affect our competitive position, business, financial condition or results of operations.
A significant portion of our products and offerings in our Measurement & Control Solutions segment are affected by the availability, regulation of and interference with radio spectrum that we use.
A significant portion of the offerings in our Measurement & Control Solutions segment use radio spectrum, which is subject to government regulation. To the extent we introduce new products designed for use in the U.S. or another country, such products may require significant modification or redesign in order to meet frequency requirements and other regulatory specifications. Limitations on frequency availability or the cost of making necessary modifications may preclude us from selling our products in certain countries. The regulations that govern our use of radio spectrum may change, which may require us to modify our products or seek new partnerships, either directly or due to interference caused by new consumer products allowed under the regulations. In addition, we may not be able to secure suitable partners for co-development of products.The inability to modify our products to meet such requirements, the possible delays in completing or the cost of such modifications could have a material adverse effect on our business, financial condition, and results of operations.
In the U.S., our products are primarily designed to use FCC-licensed spectrum in the 900MHz range. If the FCC does not renew our existing spectrum licenses, or materially changes regulations affecting the use of these licenses, our business, financial condition, and results of operations could be adversely affected. In addition, there may be insufficient available frequencies in some markets to sustain or develop our planned operations at a commercially feasible price or at all.
Outside the U.S., certain of our products require the use of radio frequency and are subject to regulations. In some jurisdictions, radio station licenses may be granted for a fixed term and must be periodically renewed. Our advanced and smart metering systems offerings transmit to (and receive information from, if applicable) handheld, mobile, or fixed network reading devices in licensed bands made available to us through strategic partnerships and are reliant to some extent on the licensed spectrum continuing to be available through our partners or our customers. We may be unable to find partners or customers that have access to sufficient frequencies in some markets to sustain or develop our planned operations, or to find partners or customers that have access to sufficient frequencies in the relevant markets at a commercially feasible price or at all.
Weather conditions, including the effects of climate change and associated efforts by governmental or regulatory authorities to mitigate such effects, may cause volatility in our served markets, and may affect our businesses, operations and financial results.
Globally, the frequency and severity of weather events due to the effects of climate change is increasing. The unpredictable nature of weather events and related conditions, including heavy flooding, water stress due to prolonged droughts, and fluctuations in temperatures or weather patterns, including as a result of climate change, can positively or negatively impact portions of our business. For example, heavy flooding and rain events attributable to the effects of global climate change may increase customer demand for some of our solutions that help manage water and stormwater overflows or remove and transfer excess or unwanted water. Prolonged drought conditions may increase demand for our pumping technology used in agriculture and turf irrigation applications. Demand for water reuse applications, including those provided by our treatment business, may also increase as communities look to address water scarcity challenges due to the effects of climate change. In addition, fluctuations in temperatures result in varying levels of demand for our products used in residential and commercial hydronic applications, where homes and buildings use circulating water to heat and cool living spaces. Significant fluctuations in these weather conditions and climate changes can therefore result in volatility in our financial results.
24
Severe weather events and other effects of climate change have also caused, and may in the future cause, disruptions to our facilities and operations, as well as those of our customers and suppliers. In 2021, a physical risk analysis using the Task Force on Climate Related Financial Disclosures (“TCFD”) framework indicated that certain of our facilities are at a moderate risk for exposure to water stress, coldwave and wildfire impacts due to the effects of climate change. While we continue to assess these risks, implement mitigation plans and perform business continuity and disaster recovery planning, we cannot be sure that disruptions with material adverse effects will not occur.
Governments may implement emissions trading schemes, carbon taxes, fuel taxes and other policies to reduce the impacts of climate change that could impact our business and financial results. The timing, scope and effect of governments’ implementation of carbon pricing and taxes are uncertain, but could significantly increase our expenses in the future and therefore have material adverse impacts on our business, financial condition, cash flows, results of operations and market price of our common stock.
Our commitments, goals, targets, objectives and initiatives related to sustainability, and our public statements and disclosures regarding them, expose us to numerous risks.
We have developed, and will continue to establish, goals, targets, and other objectives related to sustainability matters, including our sustainability goals and commitments to Science-Based Targets aligned to limiting global temperature increase to 1.5°C above pre-industrial level, in line with the Paris Agreement, by 2030 and net zero greenhouse gas (GHG) emissions (Scope 1, 2 and 3) before 2050. Achieving these goals and commitments will require evolving our business, making capital investments and developing technologies that might not currently exist. We might incur additional expense or be required to recognize impairment charges in connection with our efforts. These commitments, goals, targets and other objectives reflect our current plans and there is no guarantee that they will be achieved. Our efforts to research, establish, accomplish, and accurately report on these commitments, goals, targets and objectives expose us to operational, reputational, financial, legal, and other risks. Our ability to achieve any stated commitment, goal, target, or objective is subject to factors and conditions, many of which are outside of our control, including the pace of changes in technology, the availability of requisite financing, and the availability of suppliers that can meet our sustainability and other standards.
Our business may face increased scrutiny from the investment community, regulators, media and other stakeholders related to our sustainability activities, including our commitments, goals, targets and objectives, and our methodologies and timelines for pursuing them. We are subject to increasing regulatory requirements around sustainability-related disclosures, including significant anticipated rulemaking by the SEC, which may continue to evolve. Complying with regulators’ disclosure requirements may impose substantial additional costs and require additional resources, including with respect to third-party attestation, to enable the capture, analysis and audit of appropriate data. Any actual or alleged failure to comply with regulatory requirements could result in fines, penalties and civil liabilities, and damage to our reputation. Furthermore, if our sustainability reporting and practices do not meet investor, regulator or other stakeholders’ expectations, standards and requirements, our reputation, ability to attract or retain employees, and attractiveness as an investment, business partner or acquiror could be negatively impacted. Similarly, our failure or perceived failure to pursue or fulfill our sustainability commitments, goals, targets, and objectives, to comply with ethical, environmental, or other standards, regulations, or expectations, or to comply with reporting requirements and standards with respect to these matters, within the timelines we announce, or at all, could have operational, reputational, financial and legal impacts.
Risks Related to Financial and Tax
Our business is subject to foreign currency exchange rates fluctuations.
Sales outside of the U.S. for the year ended December 31, 2022 accounted for approximately 53% of our net sales. We also have significant operations in various locations outside of the U.S. Our principal currency exposures for which we enter into cash flow hedges relate to the Euro, Swedish Krona, British Pound, Canadian Dollar, Australian Dollar, and Polish Zloty. Changes in the value of currencies of the countries in which we do business relative to the value of the U.S. Dollar or Euro could affect our ability to sell products competitively and control our cost structure, which has had and may continue to have a material adverse effect on our business, financial condition, cash flows and results of operations. Additionally, we are subject to foreign exchange translation risk due to changes in the value of foreign currencies in relation to our reporting currency, the U.S. Dollar. The translation risk is primarily concentrated in the exchange rate between the U.S. Dollar and the Euro, Chinese Yuan, British Pound, Canadian Dollar, Australian Dollar, Swedish Krona and Indian Rupee. As the U.S. Dollar fluctuates against other currencies in which we transact business, revenue and income may be impacted. Strengthening of the U.S. Dollar relative to the Euro and the currencies of the other countries in which we do business, has materially and adversely affected, and could in the future materially and adversely affect, our sales growth and profitability in future periods. Refer to
25
Item 7A. "Quantitative and Qualitative Disclosures about Market Risk" for additional information on foreign exchange risk.
Our financial results can be difficult to predict.
Our business is impacted by a substantial amount of short cycle and book-and-bill business, which we have limited insight into, particularly for the business that we transact through our significant distribution network. Our businesses, including that of our Measurement & Control Solutions segment, are also impacted by our long-cycle business, including large projects, which could be unexpectedly cancelled, or whose timing can change based upon customer requirements due to a number of factors affecting the project that are beyond our knowledge or control, such as funding, readiness of the project and regulatory approvals. We rely on a complex global supply chain, which has been subject to dynamic conditions, volatility, unexpected changes and disruptions due to international conditions, including as a result of the war between Russia and Ukraine, the COVID-19 pandemic and macroeconomic conditions, including high inflation. These supply chain challenges have affected, and may continue to affect, our cost structure, production and ability to timely fill customer orders. We cannot predict when, or if, these conditions will ease or subside in the future. Accordingly, our financial results for any given period have been and will continue to be difficult to predict.
We may incur additional impairment charges for our goodwill and other indefinite-lived intangible assets which would negatively impact our operating results.
We have a significant amount of goodwill and purchased intangible assets on our balance sheet as a result of acquisitions. As of December 31, 2022, the net carrying value of our goodwill and other indefinite-lived intangible assets totaled approximately $3 billion. In accordance with generally accepted accounting principles, we evaluate these assets for impairment at least annually, or more frequently if changes in events or circumstances indicate it is more likely than not that a potential impairment could exist. Significant negative industry or economic trends, disruptions to our business or our customers’ business, inability to effectively integrate or scale acquired businesses, increases in cost of capital, unexpected significant changes or planned changes in use of the assets, failure of the FCC to renew radio spectrum licenses, and divestitures and market capitalization declines may cause impairment of our goodwill and other indefinite-lived intangible assets. For example, in 2020 we recorded goodwill impairment charges $58 million within our Measurement & Control Solutions segment primarily related to the performance of the business of the Pure Technologies Ltd. acquisition ("Pure") (as detailed in Note 11, “Goodwill and Other Intangible Assets”). We did not record goodwill impairment charges within our Measurement & Control Solutions segment in 2021 or 2022. Material impairment charges have in the past and could in the future adversely affect our results of operations and financial condition.
Changes in our effective tax rates and tax expenses may adversely affect our financial results.
We sell our products in approximately 150 countries and 53% of our revenue was generated outside the U.S. for the year ended December 31, 2022. Given the global nature of our business, a number of factors may increase our effective tax rates and tax expense, including:
•the geographic mix of jurisdictions in which profits are earned and taxed;
•the statutory tax rates and tax laws in jurisdictions in which we conduct business;
•the resolution of tax issues arising from tax examinations by various tax authorities; and
•the valuation of our deferred tax assets and liabilities.
Additionally, tax laws, regulations, and administrative practices in various jurisdictions may be subject to significant change, with or without notice, due to economic, political, and other conditions, and significant judgment is required in evaluating and estimating our provision and accruals for these taxes. The recent agreement by countries in the Organization for Economic Cooperation and Development to implement additional legislative changes increases the uncertainty of future income tax positions, and such changes may result in additional tax expense and effective tax rate volatility.
Our businesses are regularly examined by various tax authorities throughout the world and the resolutions of these examinations do not typically have a significant impact on our effective tax rates and tax expenses, but they could. For example, following an examination regarding aspects of the reorganization of our European business that occurred in 2013, the Swedish tax authority issued a tax assessment to Xylem’s Swedish subsidiary in 2019, which we are appealing as further described in Note 6, “Income Taxes.” This examination as well as other examinations can result in increased tax assessments, and settlement or litigation about the assessments and final resolution could be unfavorable to Xylem. We regularly assess the likelihood of favorable or unfavorable outcomes resulting from these examinations to determine the adequacy of our provision for income taxes, including unrecognized tax benefits; however, developments in an audit or litigation could materially and adversely affect us. Although we
26
believe our tax estimates and accruals are reasonable, there can be no assurance that any final determination will not be materially different than the treatment reflected in its historical income tax provisions, accruals and unrecognized tax benefits, which could materially and adversely affect our business, operating results, cash flows and financial condition.
Our pension and other defined benefit plans are subject to financial market risks that could adversely impact our earnings, financial condition and cash flows in future periods.
Certain current and retired employees are covered by pension and other defined benefit plans (collectively, “post-retirement benefit plans”). We make contributions to fund our post-retirement benefit plans when we consider it necessary or advantageous to do so. Significant changes in market interest rates, decreases in fair value of or investment losses on plan assets, changes in discount rates, or changes in minimum funding requirements established by governments, taxing authorities or other agreements, could increase our funding obligations and adversely impact our earnings, financial condition and cash flows in future periods. In addition, the cost of our post-retirement benefit plans is incurred over long periods of time and involves factors that can be volatile and unpredictable, including rates of return on plan assets, discount rates used to calculate liabilities and expenses, change in laws and regulatory actions, and changes in actuarial experience and assumptions, which could adversely impact our earnings, results of operations, financial condition and cash flows.
Our debt obligations may adversely affect our business and our ability to meet our obligations and pay dividends.
As of December 31, 2022, our total outstanding indebtedness was $1,880 million as described under “Liquidity and Capital Resources" and we may incur additional debt in the future. Our current or future indebtedness could have adverse consequences to us and our investors, including:
•increasing our vulnerability to general adverse economic and industry conditions;
•limiting our ability to obtain additional financing or borrow additional funds;
•reducing or eliminating our ability to pay future dividends or repurchase our common stock;
•limiting our flexibility in planning for, or reacting to, changes in our business and industry;
•requiring a substantial portion of our cash flows from operations to make principal and interest payments;
•reducing the cash flows available to fund working capital, capital expenditures, acquisitions or other investments to grow our business;
•increasing the amount of interest expense that we must pay if future borrowings are at variable interest rates, which, as interest rates increase, would result in higher interest expense; and
•increasing the risk of a future credit rating downgrade, which could increase future debt costs and limit the availability of debt financing.
In addition, there can be no assurance that future borrowings or equity financing will be available to us on favorable terms or at all for the payment or refinancing of our indebtedness. The terms of any future debt indentures, including those related to green financing, may also impose additional and more stringent restrictions on our operations than we currently have.
Our ability to make scheduled principal payments of, to pay interest on, or to refinance our indebtedness and to satisfy our other debt obligations will depend on our future cash flows from operations, which may not be sufficient or may be affected by factors beyond our control. If we are unable to service our indebtedness, our business, financial condition, results of operations and share price could be materially adversely affected.
Risks Related to Legal and Regulatory
Failure to comply with laws, regulations and policies, including but not limited to the U.S. Foreign Corrupt Practices Act, other applicable anti-corruption legislationlaws, trade regulations, and data privacy and security laws, could result in fines, criminal penalties and anhave a material adverse effectimpact on our business, results of operations, financial condition and reputation.
Given our global operations, we are subject to regulation under a wide variety of U.S. federal and state and non-U.S. laws, regulations and policies, including laws and regulations related to anti-corruption, trade regulations, including export and import compliance, anti-trust and money laundering. Our policies mandate compliance with these laws and regulations. The U.S. Foreign Corrupt Practices Act (the "FCPA"), the U.K. Bribery Act of 2010 and similar anti-briberyanti-corruption laws in other jurisdictions generally prohibit companies and their intermediaries from making improper payments to
27
government officials or other persons for the purpose of obtaining or retaining business. Our policies mandate compliance with these anti-bribery laws. We operate in many parts of the world that are recognized as having governmental and commercial corruption and in certain circumstances, strict compliance with anti-briberyanti-corruption laws may conflict with local business customs and practices. We cannot assure youguarantee that our internal controlcontrols, policies and procedures will always prevent and protect us from improper conduct of our employees or business partners. In the event that we believe or have reason to believe that our employees or business partners have or may have violated applicable laws, regulations or policies, including anti-corruption laws, we are required to investigate the relevant facts and circumstances, which can be expensive and require significant time and attention from senior management. Any such violation could result in substantial fines, sanctions, civil and/or criminal penalties, termination of relationships with business partners and curtailment of operations in certain jurisdictions, and as a result might materially and adversely affect our business, results of operations or financial condition. In addition, actual or alleged violations could damage our reputation and ability to do business.
Additionally, to conduct our operations, we regularly move data across borders, and consequently we are subject to a variety of continuously evolving and developing laws and regulations in the United States, such asregarding data privacy, data protection and data security, including the California Consumer Protection Act, the EU's GDPR and abroad regarding privacy, data protection and data security.PIPL. The scope of the laws that may be applicable to us is evolving, often uncertain and may be conflicting, particularly with respect to foreign laws. For example, the European Union’s General Data Protection Regulation (“GDPR”)GDPR greatly increases the jurisdictional reach of European UnionEU law and adds a broad array of requirements for handling personal data, including the enforcement of data subject rights, enhanced security requirements, obligations to guarantee EU data subject rights are not compromised in countries outside the EU, and public disclosure of significant data breaches. Other countries, such as China with its PIPL, have enacted or are enacting data localization and security laws that require data to stay within their borders. All of these evolving legal and operational requirements impose significant costs of compliance that are likely to increase over time. AnyIn addition, any such violation could result in substantial fines, sanctions and/or civil penalties, damage to our reputation and might materially and adversely affect our business, results of operations or financial condition.
We face risks related to legal and regulatory proceedings.
We are subject to various laws, ordinances, regulations and other requirements of government authorities in the U.S. and foreign countries, and in the United States, any violation of which could potentially create substantial liability for us and damage our reputation. Changes in laws, ordinances, regulations or other government policies, the nature, timing, and effect of which are uncertain, may significantly increase our expenses and liabilities.
From time to time, we are involved in legal and regulatory proceedings that are incidental to the operation of our businesses (or the business operations of previously owned entities). These proceedings may seek remedies relating to environmental matters, tax, intellectual property, acquisitions or divestitures, product liability, andproperty damage, personal injury, claims, privacy, employment, labor and pension matters,pensions, government contract issues and commercial or contractual disputes. Our continuingcontinued transition to connected orand digital technologies and solutions has increased our exposure to intellectual property litigation and we expect that this risk will continue to increase as we execute on our innovation and technology priorities.
It is not possible to predict with certainty the outcome of claims, investigations, regulatory proceedings and lawsuits, and we could in the future incur judgments, fines or penalties or enter into settlements and claims that could have an adverse effect on our reputation, as well as an adverse effect on our business, results of operations and financial condition in any particular period.condition. Additionally, we may be required to change or cease operations at one or more
facilities if a regulatory agency determines that we have failed to comply with laws, regulations or orders applicable to our business.
The global and diverse nature of our operations, coupled with the increase in regulation and enforcement in many regions of the globe, means that legal and compliance risks will continue to exist and additional legal and regulatory proceedings and other contingencies, the outcome of which cannot be predicted with certainty, will arise from time to time. In addition, subsequent developments in legal and regulatory proceedings may affect our assessments and estimates of loss contingencies recorded as a reserve and require us to make payments in excess of our reserves, which could have an adverse effect on our results of operations and financial condition.
28
Infringement or cause volatility in, our financial results.
We own numerous patents, trademarks, copyrights, trade secrets and other intellectual property and licenses to intellectual property owned by others, which in the aggregatethat are important to our business. Our intellectual property rights may provide us with competitive advantage because they may help us differentiate our technologies, products and services, including our growing portfolio of data analytics and digitally-enabled offerings. TheHowever, our current or future intellectual property rights that we have or obtain, however, may not provide us with a significant competitive advantage because they may not be sufficiently broad or may be challenged, invalidated, circumvented, misappropriated, independently developed, or designed-around, particularly given our international operations in countries where laws governing intellectual property rights are not highly developed, protected or enforced. Our failure to obtain or maintain intellectual property rights that convey competitive advantage, adequately protect our intellectual property, or detect or prevent circumvention, misappropriation or unauthorized use of such property, andas well as the cost of enforcing our intellectual property rights, could adversely impact our business, financial condition and results of operations.
From time to time, we receive notices from third parties alleging intellectual property infringement or misappropriation. Any dispute or litigation regarding intellectual property could be costly and time-consuming to defend due to the complexity and the uncertainty of intellectual property litigation. Our intellectual property portfolioWe may not be usefulsuccessful in asserting a counterclaim, or negotiating a license, in response to a claim of infringement or misappropriation. In addition, as a result of such claims of infringement or misappropriation, we could lose our rights to use critical technology, be unable to license critical technology or sell critical products and services, be required to pay substantial damages or license fees with respect to the infringeduse of third-party intellectual property rights, or be required to redesign our products at substantial cost, any of which could adversely impact our competitive position, financial condition and results of operations. Even if we successfully defend against claims of infringement or misappropriation, we may incur significant costs and diversion of management attention and resources, which could adversely affect our business, financial condition and results of operations.
Developments in, and compliance with, current and future environmental and climate change laws and regulations could impact our business, financial condition or results of operations.
Our business, operations, and product and service offerings are subject to and affected by many U.S. federal, state, local and foreign environmental laws and regulations, including those enacted in response to climate change concerns. In addition, we could be affected by future
Increasing public and governmental awareness and concern regarding the effects of climate change has led to significant legislative and regulatory efforts to limit greenhouse gas emissions and will likely result in further environmental and climate change laws orand regulations. Compliance with current and future environmentalexisting laws and regulations currently requires, and compliance with future laws is expected to continue to require, increasing research and development, operating and capital expenditures.
Developments such as the adoption of new environmental laws and regulations, stricter enforcement of existing laws and regulations, violations by us of such laws and regulations, discovery of previously unknown or more extensive contamination conditions, litigation involving environmental impacts, our inability to recover costs associated with any such developments, or financial insolvency of other responsible parties could in the future have a material adverse effect on our financial condition and results of operations.
We may not realize some or all the expected benefits and synergies from our proposed acquisition of Evoqua.
On January 23, 2023, we announced that we entered into a definitive merger agreement under which we will acquire Evoqua. While we and Evoqua will continue to operate independently until the completion of the acquisition, the success of the acquisition will depend, in part, on postretirement benefitour ability to realize the anticipated benefits from successfully combining our and Evoqua’s businesses. We plan assets, changeson devoting substantial management attention and resources to integrating our and Evoqua’s business practices and operations so that we can fully realize the anticipated benefits and synergies of the acquisition. Nonetheless, difficulties may arise during the integration process that could result in interest ratesthe failure to achieve the synergies that we anticipate, including the loss of key talent that may be difficult to replace, the disruption of each company’s ongoing business or inconsistencies in each company’s standards,
29
controls, procedures and other factorspolicies that adversely affect the combined company’s ability to maintain relationships with customers, partners, suppliers or creditors. As a result, the anticipated benefits of the acquisition may not be realized fully within the expected timeframe or at all, may take longer to realize, or may cost more than expected, which could materially and adversely affect our earnings and cash flows in future periods.
In addition, at times, the attention of certain members of each company’s management and each company’s resources may be materially affected by significant changes in key economic indicators, actuarial experience, financial market volatility, future legislation and other governmental regulatory actions.
Furthermore, we and Evoqua could potentially become targets of securities class actions or derivative lawsuits in connection with the acquisition, which could result in diversion of management’s attention and resources and substantial costs, and could delay or prevent the acquisition from being completed.
Failure to complete our control, including:
Our obligations and the obligations of Evoqua to hold us responsible for anycomplete the merger are subject to satisfaction or waiver of the liabilities that ITT or Exelis agreed to retain. Further, therea number of conditions. There can be no assurance that the indemnities from ITT and Exelisconditions to completion of the acquisition will be sufficient to protect us against the full amount of such liabilities,satisfied or waived or that ITT and Exelisthe acquisition will be able to fully satisfy their indemnification obligations. Moreover, even if we ultimately were to succeed in recovering from ITT and Exeliscompleted. If the acquisition is not consummated for any amounts for which we are held liable,reason, we may receive negative reactions from our shareholders, suppliers, customers, regulators and employees, including damage to our reputation. We may be temporarilysubjected to various material risks, including the possibility that the price of our common stock and other securities may decline to the extent that current market prices reflect a market assumption that the acquisition will be completed.
Also, in the event of a termination of the merger agreement under certain specified circumstances, we would be required to bearreimburse expenses of Evoqua or pay Evoqua a termination fee of up to $325 million. We could also be subject to litigation related to any failure to complete the merger or to specifically enforce our obligation to perform our obligations under the merger agreement. In addition, the merger agreement places certain restrictions on the conduct of our businesses prior to completion of the merger, and such restrictions, the waiver of which is subject to a written consent of Evoqua in advance, may prevent us from making certain acquisitions or taking certain other specified actions during the pendency of the merger that we would have made or taken if these losses ourselves. Eachrestrictions were not in place.
If any of these risks materialize, they may materially and adversely affect our business, reputation, results of operations, financial condition, ratings, stock prices and/or bond prices.
If our pending acquisition of Evoqua is consummated, our shareholders’ ownership percentage will be diluted, and the combined company’s earnings per share may decrease.
If the proposed acquisition is consummated, we will issue to Evoqua stockholders shares of our common stock. As a result of the issuance of these shares, our shareholders will own a smaller percentage of the combined company after the acquisition and will therefore have a reduced voting interest after the acquisition. In addition, the market value of the combined company’s common stock may also decrease due to the additional transaction and integration-related costs or other factors beyond our control. All of these factors could cause dilution of the combined company’s earnings per share, or decrease or delay the expected accretive effect of the acquisition, which could negatively affect the market price of our business, resultscommon stock.
The acquisition and integration of operations,Evoqua may result in additional costs and expenses.
We have incurred and expect to continue to incur a number of non-recurring costs, expenses and fees for professional services and other transaction-related costs in connection with the proposed acquisition and integration of Evoqua, whether or not the acquisition is completed. We may also incur unanticipated accounting and other costs in the integration of the businesses of Evoqua, which may lead to reserves in the future. Such costs could negatively impact our free cash flow, and financial condition.the net benefit from efficiencies and synergies related to the integration of the businesses may not be realized in the near term or at all.
ITEM 1B. UNRESOLVED STAFF COMMENTS.
None.
ITEM 2. PROPERTIES
We have approximately 380370 locations in more than 5550 countries. These properties total approximately 1213 million square feet, of which more than 340300 locations, or approximately 6.47 million square feet, are leased. We consider the offices, plants, warehouses and other properties that we own or lease to be in good condition and generally suitable for the purposes for which they are used. The following table shows our significant locations by segment:
| Location | State or Country | Principal Business Activity | Approx. Square Feet | Owned or Leased | ||||||||||||||||||||||
| Water Infrastructure | ||||||||||||||||||||||||||
| Emmaboda | Sweden | Administration and Manufacturing | 1,197,000 | Owned | ||||||||||||||||||||||
| Manufacturing and Research & Development | 366,000 | Leased | ||||||||||||||||||||||||
| Stockholm | Sweden | Administration and Research & Development | 182,000 | Leased | ||||||||||||||||||||||
| Bridgeport | NJ | Administration and Manufacturing | 136,000 | Leased | ||||||||||||||||||||||
| Shenyang | China | Manufacturing | 125,000 | Owned | ||||||||||||||||||||||
| Applied Water | ||||||||||||||||||||||||||
| Morton Grove | IL | Administration and Manufacturing | Owned | |||||||||||||||||||||||
| Administration and Manufacturing | Owned | |||||||||||||||||||||||||
| Owned | ||||||||||||||||||||||||||
| Manufacturing | Owned | |||||||||||||||||||||||||
| Manufacturing | ||||||||||||||||||||||||||
| Stockerau | Austria | 234,000 | Owned | |||||||||||||||||||||||
| Strzelin | Poland | Manufacturing | 185,000 | Owned | ||||||||||||||||||||||
| Cheektowaga | NY | Manufacturing | 147,000 | Owned | ||||||||||||||||||||||
| Measurement & Control Solutions | ||||||||||||||||||||||||||
| Ludwigshafen | Germany | Manufacturing | 318,000 | Owned | ||||||||||||||||||||||
| Texarkana | AR | Manufacturing | 254,000 | Owned | ||||||||||||||||||||||
| Uniontown | PA | Manufacturing | 240,000 | Leased | ||||||||||||||||||||||
| DuBois | PA | Manufacturing | 197,000 | Owned | ||||||||||||||||||||||
| Durham | NC | Administration and Research & Development | Leased | |||||||||||||||||||||||
| Manufacturing | Leased | |||||||||||||||||||||||||
| Dubois | PA | 137,000 | Leased | |||||||||||||||||||||||
| Regional Locations | ||||||||||||||||||||||||||
| Dubai | United Arab Emirates | Manufacturing | 144,000 | Owned | ||||||||||||||||||||||
| Nottinghamshire | United Kingdom | 139,000 | Leased | |||||||||||||||||||||||
| Nanterre | France | Sales & Service Office | 139,000 | Leased | ||||||||||||||||||||||
| Langenhagen | Germany | Sales & Service Office | 134,000 | |||||||||||||||||||||||
| Schaffhausen | Switzerland | 26,000 | Leased | |||||||||||||||||||||||
| Washington | DC | Administration | 18,000 | Leased | ||||||||||||||||||||||
31
ITEM 3. LEGAL PROCEEDINGS
From time to time, we are involved in legal and regulatory proceedings that are incidental to the operation of our businesses (or the business operations of previously-owned entities). These proceedings may seek remedies relating to matters including environmental, matters, tax, intellectual property, matters, acquisitions or divestitures, product liability, andproperty damage, personal injury, claims, privacy, employment, labor and pension, matters, government contract issues and commercial or contractual disputes. See Note 20,19, "Commitments and Contingencies", of the consolidated financial statements included in Item 8 of Part II of this 10-K for information regarding certain legal and regulatory proceedings we are involved in.
ITEM 4. MINE SAFETY DISCLOSURES
Not applicable.
INFORMATION ABOUT OUR EXECUTIVE OFFICERS
The following information is provided regarding the executive officers of Xylem as of February 6, 2020:7, 2023:
| NAME | AGE | CURRENT TITLE | OTHER BUSINESS EXPERIENCE DURING PAST 5 YEARS | |||||||||||||||||
| Patrick K. Decker | 58 | President and Chief Executive Officer (2014) | ||||||||||||||||||
| Senior VP and Chief Financial Officer | • | |||||||||||||||||||
| Senior VP, General Counsel (2022) | • Executive Vice President,Global General Counsel and Corporate Secretary, National Express Group (2015) | |||||||||||||||||||
| Franz Cerwinka | 53 | Senior VP and President, Emerging Markets | • Senior VP •Chief Executive Officer, Johnson Controls-Hitachi Air Conditioning (2015) | |||||||||||||||||
| Michael McGann | 52 | Senior VP and President, Americas and Measurement & Control Solutions (2023) | • VP, North America Utilities Commercial Team (2022) - • VP, Sensus Americas, Global Engineering and Assessment Services (2017) - • VP, Quality, Sensus USA Inc. (2013) | |||||||||||||||||
| Geri McShane | VP, Controller and Chief Accounting Officer (2019) | • Controller, Accounting and Reporting (2016) | ||||||||||||||||||
• Senior VP and President, • Senior VP and President, • President, Carrier Residential, United Technologies Corporations (2018) • VP and General Manager, Carrier Residential, United Technologies Corporations (2017) | ||||||||||||||||||||
| Claudia S. Toussaint | Senior VP, | • Senior VP, General Counsel and Corporate Secretary | ||||||||||||||||||
| Hayati Yarkadas | 54 | Senior VP and | • Senior Vice President and President, Performance Materials, Trinseo S.A. (2015) | |||||||||||||||||
Note: Date in parentheses indicates the year in which the position was assumed.
33
BOARD OF DIRECTORS
The following information is provided regarding the Board of Directors of Xylem as of February 6, 2020:7, 2023:
| NAME | TITLE | |||||||
| Robert F. Friel | Board Chair, Xylem Inc., Former Chairman, President and CEO, PerkinElmer, Inc. | |||||||
| Patrick K. Decker | President and Chief Executive Officer, Xylem Inc. | |||||||
| Victoria D. Harker | Executive Vice President and Chief Financial Officer, TEGNA, Inc. | |||||||
| Steven R. Loranger | Former Chairman, President and Chief Executive Officer, ITT Corporation | |||||||
| Mark D. Morelli | President and Chief Executive Officer, Vontier Corporation | |||||||
| Jerome A. Peribere | Former President and Chief Executive Officer, Sealed Air Corporation | |||||||
| Markos I. Tambakeras | ||||||||
34
PART II
ITEM 5. MARKET FOR THE REGISTRANT’S COMMON EQUITY, RELATED STOCKHOLDER MATTERS AND ISSUER PURCHASES OF EQUITY SECURITIES
Market Price and Dividends
Our common stock trades publicly on the New York Stock Exchange under the trading symbol “XYL”. As of January 31, 2020,2023, there were 10,0468,359 holders of record of our common stock.
Dividends are declared and paid on the common stock at the discretion of our Board of Directors and depend on our profitability, financial condition, capital needs, future prospects and other factors deemed relevant by our Board. Therefore, there can be no assurance as to what level of dividends, if any, will be paid in the future. In the first quarter of 2020,2023, we declared a dividend of $0.26$0.33 per share to be paid on March 26, 202022, 2023 for shareholders of record on February 27, 2020.22, 2023.
There were no unregistered offerings of our common stock during 2019.2022.
Fourth Quarter 20192022 Share Repurchase Activity
The following table summarizes our purchases of our common stock for the quarter ended December 31, 2019:
2022:
| (in millions, except per share amounts) | ||||||||||||||||||||||||||
| Period | Total Number of Shares Purchased | Average Price Paid per Share (a) | Total Number of Shares Purchased as Part of Publicly Announced Plans or Programs (b) | Approximate Dollar Value of Shares That May Yet Be Purchased Under the Plans or Programs (b) | ||||||||||||||||||||||
| 10/1/ | — | — | — | $ | ||||||||||||||||||||||
| 11/1/ | — | — | — | $ | ||||||||||||||||||||||
| 12/1/ | — | — | — | $ | ||||||||||||||||||||||
(a)Average price paid per share is calculated on a settlement basis. (b)On August 24, 2015, our Board of Directors authorized the repurchase of up to $500 million in shares with no expiration date. The program's objective is to deploy our capital in a manner that benefits our shareholders and maintains our focus on growth. There were no shares repurchased under this program during the three months ended December 31, 2022. There are up to $182 million in shares that may still be purchased under this plan as of December 31, 2022. 35 |
PERFORMANCE GRAPH
CUMULATIVE TOTAL RETURN
The following graph compares the relative performance of our common stock, the S&P 500 Index and the S&P 500 Industrials Index. This graph covers the period from December 31, 20142017 through December 31, 20192022 and assumes that $100 was invested on December 31, 20142017 in our common stock, the S&P 500 and the S&P 500 Industrials with the reinvestment of any dividends.
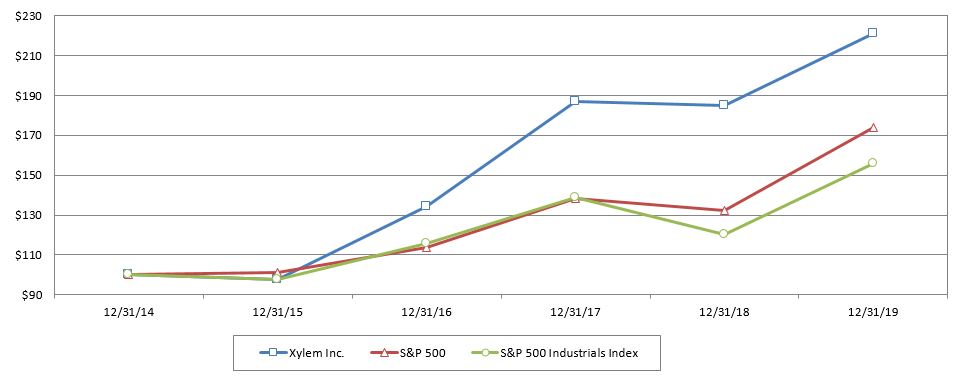
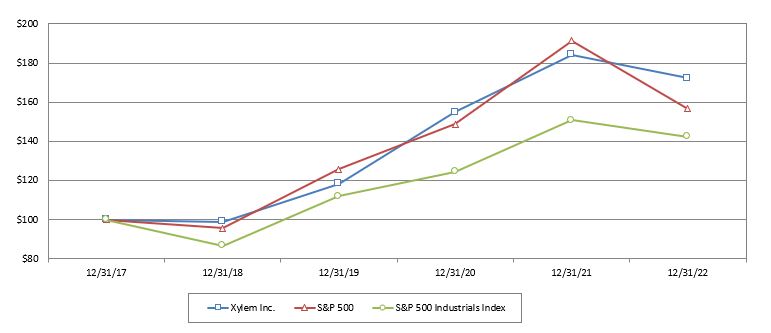
| XYL | S&P 500 | S&P 500 Industrials Index | |||||||||||||||||||||||
| XYL | S&P 500 | S&P 500 Industrials Index | |||||||||||||||||||||||
| December 31, 2014 | 100 | 100 | 100 | ||||||||||||||||||||||
| December 31, 2015 | 97 | 101 | 97 | ||||||||||||||||||||||
| December 31, 2016 | 134 | 113 | 116 | ||||||||||||||||||||||
| December 31, 2017 | 187 | 138 | 139 | December 31, 2017 | 100 | 100 | 100 | ||||||||||||||||||
| December 31, 2018 | 185 | 132 | 120 | December 31, 2018 | 99 | 96 | 87 | ||||||||||||||||||
| December 31, 2019 | 221 | 174 | 156 | December 31, 2019 | 118 | 126 | 112 | ||||||||||||||||||
| December 31, 2020 | December 31, 2020 | 155 | 149 | 124 | |||||||||||||||||||||
| December 31, 2021 | December 31, 2021 | 184 | 191 | 151 | |||||||||||||||||||||
| December 31, 2022 | December 31, 2022 | 172 | 157 | 142 | |||||||||||||||||||||
The graph is not, and is not intended to be, indicative of future performance of our common stock.
This performance graph shall not be deemed “filed” with the SEC or subject to the liabilities of Section 18 of the Securities Exchange Act of 1934, and should not be deemed incorporated by reference into any of our prior or subsequent filings under the Securities Act of 1933 or the Securities Exchange Act of 1934, except as shall be expressly set forth by specific reference in such filing.
36
ITEM 6. SELECTED FINANCIAL DATA[ Reserved ]
37
Year Ended December 31, | |||||||||||||||||||
| (in millions, except per share data) | 2019 (a) (b) | 2018 (b) | 2017 (c) | 2016 (c) | 2015 | ||||||||||||||
| Results of Operations Data: | |||||||||||||||||||
| Revenue | $ | 5,249 | $ | 5,207 | $ | 4,707 | $ | 3,771 | $ | 3,653 | |||||||||
| Gross profit | 2,046 | 2,026 | 1,847 | 1,462 | 1,407 | ||||||||||||||
| Gross margin | 39.0 | % | 38.9 | % | 39.2 | % | 38.8 | % | 38.5 | % | |||||||||
| Operating income | 486 | 654 | 552 | 408 | 454 | ||||||||||||||
| Operating margin | 9.3 | % | 12.6 | % | 11.7 | % | 10.8 | % | 12.4 | % | |||||||||
| Net income attributable to Xylem | 401 | 549 | 331 | 260 | 340 | ||||||||||||||
| Per Share Data: | |||||||||||||||||||
| Earnings per share: | |||||||||||||||||||
| Basic | $ | 2.23 | $ | 3.05 | $ | 1.84 | $ | 1.45 | $ | 1.88 | |||||||||
| Diluted | 2.21 | 3.03 | 1.83 | 1.45 | 1.87 | ||||||||||||||
| Basic shares outstanding | 180.0 | 179.8 | 179.6 | 179.1 | 180.9 | ||||||||||||||
| Diluted shares outstanding | 181.2 | 181.1 | 180.9 | 180.0 | 181.7 | ||||||||||||||
| Cash dividends per share | $ | 0.96 | $ | 0.84 | $ | 0.72 | $ | 0.62 | $ | 0.56 | |||||||||
| Balance Sheet Data (at period end): | |||||||||||||||||||
| Cash and cash equivalents | $ | 724 | $ | 296 | $ | 414 | $ | 308 | $ | 680 | |||||||||
| Working capital* | 919 | 988 | 873 | 878 | 810 | ||||||||||||||
| Total assets | 7,710 | 7,222 | 6,860 | 6,474 | 4,657 | ||||||||||||||
| Total debt | 2,316 | 2,308 | 2,200 | 2,368 | 1,274 | ||||||||||||||
ITEM 7. MANAGEMENT’S DISCUSSION AND ANALYSIS OF FINANCIAL CONDITION AND RESULTS OF OPERATIONS
The following discussion should be read in conjunction with our consolidated financial statements and the notes thereto. This discussion summarizes the significant factors affecting our results of operations and the financial condition of our business. Except as otherwise indicated or unless the context otherwise requires, “Xylem,” “we,” “us,” “our” and “the Company” refer to Xylem Inc. and its subsidiaries.
This section of this Form 10-K generally discusses 20192022 and 20182021 items and year-to-year comparisons between 20192022 and 2018.2021. Discussions of 20172020 items and year-to-year comparisons between 20182021 and 20172020 that are not included in this Form 10-K can be found in “Management’s Discussion and Analysis of Financial Condition and Results of Operations” in Part II, Item 7 of the Company’s Annual Report on Form 10-K for the fiscal year ended December 31, 2018.2021.
Overview
Xylem is a leading global water technology company. We design, manufacture and service highly engineered products and solutions ranging across a wide variety of critical applications in utility, industrial, residential and commercial building services settings. Our broad portfolio of solutions addresses customer needs across the water cycle, from the delivery, measurement and use of drinking water to the collection, test, treatment and analysis of wastewater to the return of water to the environment. Our product and service offerings are organized into three reportable segments that are aligned around the critical market applications they provide: Water Infrastructure, Applied Water and Measurement & Control Solutions.
•Water Infrastructure serves the water infrastructure sector with pump systems that transport water from aquifers, lakes, rivers and seas; with filtration, ultraviolet and ozone systems that provide treatment, making the water fit to use; and pumping solutions that move the wastewater and storm water to treatment facilities where our mixers, biological treatment, monitoring and control systems provide the primary functions in the treatment process. We also provide sales and rental of specialty dewatering pumps and related equipment and services. Additionally, our offerings use monitoring and control, smart and connected technologies to allow for remote monitoring of performance and enable products to self-optimize pump operations maximizing energy efficiency and minimizing unplanned downtime and maintenance for our customers. In the Water Infrastructure segment, we provide the majority of our sales directly to customers along with strong applications expertise, while the remaining amount is through distribution partners. |
•Applied Water serves the water usage applications sector with water pressure boosting systems for heating, ventilation and air conditioning, and for fire protection systems to the residential and commercial building services markets. In addition, our pumps, heat exchangers and controls provide cooling to power plants and manufacturing facilities, circulation for food and beverage processing, as well as boosting systems for agricultural irrigation. In the Applied Water segment, we provide the majority of our sales through long-standing relationships with many of the leading independent distributors in the markets we serve, with the remainder going directly to customers.
•Measurement & Control Solutions primarilyserves the utility infrastructure solutions and services sector by delivering communications, smart metering, measurement and control technologies and critical infrastructure technologies that allow customers to more effectively use their distribution networks for the delivery, monitoring and control of critical resources such as water, electricity and natural gas. We also provide analytical instrumentation used to measure and analyze water quality, flow and level in clean water, wastewater, and outdoor environments. Additionally, we offer software and services including cloud-based analytics, remote monitoring and data management, leak detection, condition assessment, asset management and pressure monitoring solutions. In the Measurement & Control Solutions segment, we generate our sales through a combination of long-standing relationships with leading distributors and dedicated channel partners as well as direct sales depending on the regional availability of distribution channels and the type of product.
38
COVID-19 Pandemic Update and Macroeconomic Conditions
The global spread of COVID-19 has curtailed the movement of people, goods and services worldwide, including in many of the regions where we sell our products and services and conduct operations.
This section summarizes the most significant impacts related to the ongoing COVID-19 pandemic that we have experienced to date, and we have included additional details as applicable throughout other sections of this Annual Report.
Given the magnitude and duration of the COVID-19 pandemic and its economic consequences, it has become more difficult to distinguish specific aspects of our operational and financial performance that are most directly related to the pandemic from those more broadly influenced by ongoing macroeconomic, market and industry dynamics that may be, to varying degrees, related to the pandemic and its consequences.
The COVID-19 pandemic, as well as broader global market supply and demand dynamics, have adversely affected, and are expected to continue to adversely affect, our supply chains. We have experienced, and expect to continue experiencing shortages in the supply of components, including electronics, particularly semiconductors ("chips"), parts and raw materials. To help mitigate the effects of these challenges and increase the resilience of our supply chain, we continue to enhance and augment our risk management activities, including supplier pulsing and redundancy. Additionally, we have and continue to take measures with respect to buffer stock, the use of alternative suppliers and redesign of certain products to mitigate the impacts of the ongoing supply chain, freight and logistics delays and bolster our access to electronics, parts and raw materials.
We have also experienced, and continue to experience, increased inflation, freight, logistics, labor and overhead costs. The Company has taken specific actions to mitigate these inflationary headwinds, including pricing actions to pass cost increases through to customers and productivity efforts, including selective chip allocation, product redesigns, alternate sourcing options, and global procurement efforts. We have also initiated and plan to continue to initiate restructuring actions in 2023 to further optimize our cost structure.
These supply chain issues have also impacted our delivery times to customers. To some extent, our mitigation strategies have alleviated these issues but our lead times continue to be impacted to varying degrees.
If these issues continue, they could have a negative impact on our results of operations.
Many of our offices globally remain in a substantially remote work from home or hybrid status, with no material disruption to operations, financial reporting systems, internal control over financial reporting or disclosure controls and procedures.
The severity, magnitude and duration of the COVID-19 pandemic and its economic consequences are uncertain, and the pandemic’s ongoing and future impacts on our business, financial condition, results of operations, and stock price remain uncertain and difficult to predict.
Risks related to the impacts of COVID-19 as well as our supply chain are described in further detail under "Item 1A. Risk Factors" in the Company's 2022 Annual Report.
Evoqua Acquisition
On January 23, 2023, Xylem entered into a definitive agreement under which Xylem will acquire Evoqua, a leader in mission-critical water treatment solutions and services, in an all-stock transaction that reflects an implied enterprise value of approximately $7.5 billion. The transaction, which is anticipated to close in mid-2023, is subject to approval by shareholders of Xylem and Evoqua, the receipt of required regulatory approvals and other customary closing conditions.
Evoqua, a leader in North America water treatment, complements Xylem’s distinctive portfolio of solutions with advanced water and wastewater treatment capabilities, a powerful and extensive network of service professionals and access to a number of attractive industrial markets with resilient, recurring revenue streams.
Key Performance Indicators and Non-GAAP Measures
Management reviews key performance indicators including revenue, gross margins, segment operating income and operating income margins, free cash flow, orders growth, working capital and backlog, among others. In addition, we consider certain non-GAAP (or "adjusted") measures to be useful to management and investors evaluating our operating performance for the periods presented, and to provide a tool for evaluating our ongoing operations, liquidity and management of assets. This information can assist investors in assessing our financial performance and measures our ability to generate capital for deployment among competing strategic alternatives and initiatives, including, but not limited to, dividends, acquisitions, share repurchases and debt repayment. Excluding revenue,
39
Xylem provides guidance only on a non-GAAP basis due to the inherent difficulty in forecasting certain amounts that would be included in GAAP earnings, such as discrete tax items, without unreasonable effort. These adjusted metrics are consistent with how management views our business and are used to make financial, operating and planning decisions. These metrics, however, are not measures of financial performance under GAAP and should not be considered a substitute for revenue, operating income, net income, earnings per share (basic and diluted) or net cash from operating activities as determined in accordance with GAAP. We consider the following itemsnon-GAAP measures to represent non-GAAP measuresbe key performance indicators, as well as the related reconciling items to the most directly comparable measure calculated and presented in accordance with GAAP. The non-GAAP measures may not be comparable to similarly titledsimilarly-titled measures reported by other companies, to be key performance indicators:companies.
•"organic revenue" and "organic orders" defined as revenue and orders, respectively, excluding the impact of fluctuations in foreign currency translation and contributions from acquisitions and divestitures. Divestitures include sales or discontinuance of insignificant portions of our business that did not meet the criteria for classification as a discontinued operation. The period-over-period change resulting from foreign currency translation impacts is determined by translating current period and prior period activity using the same currency conversion rate.
•"constant currency" defined as financial results adjusted for foreign currency translation impacts by translating current period and prior period activity using the same currency conversion rate. This approach is used for countries whose functional currency is not the U.S. dollar.Dollar.
•"adjusted net income" and "adjusted earnings per share" defined as net income and earnings per share, respectively, adjusted to exclude as applicable, restructuring and realignment costs, special charges, gain or loss from sale of businesses and tax-related special items, and gains and losses from the sale of a business.as applicable. A reconciliation of adjusted net income and adjusted earnings per share is provided below.
| (in millions, except per share data) | 2022 | 2021 | |||||||||||||||||||||
| Net income & Earnings per share | $ | 355 | $ | 1.96 | $ | 427 | $ | 2.35 | |||||||||||||||
| Restructuring and realignment | 34 | 0.19 | 22 | 0.12 | |||||||||||||||||||
| Special charges | 160 | (a) | 0.89 | 12 | 0.07 | ||||||||||||||||||
| (Gain) loss from sale of business | (1) | (0.01) | (2) | (0.01) | |||||||||||||||||||
| Tax effects of adjustments (b) | (32) | (c) | $ | (0.18) | $ | (7) | $ | (0.04) | |||||||||||||||
| Adjusted net income & Adjusted earnings per share | $ | 516 | $ | 2.85 | $ | 452 | $ | 2.49 | |||||||||||||||
| (in millions, except per share data) | 2019 | 2018 | ||||||||||||
| Net income & Earnings per share | $ | 401 | $ | 2.21 | $ | 549 | $ | 3.03 | ||||||
| Restructuring and realignment, net of tax of $19 and $12 | 63 | 0.35 | 36 | 0.20 | ||||||||||
| Special charges, net of tax of $6 and $1 | 172 | 0.95 | 12 | 0.07 | ||||||||||
| Tax-related special items | (88 | ) | (0.48 | ) | (75 | ) | (0.42 | ) | ||||||
| (Gain) loss from sale of business, net of tax benefit of $0 | (1 | ) | (0.01 | ) | — | — | ||||||||
| Adjusted net income & Adjusted earnings per share | $ | 547 | $ | 3.02 | $ | 522 | $ | 2.88 | ||||||
| asset impairment charges of $14 million recorded in the period. | |||
| the relevant taxing jurisdiction. | |||
▪"adjusted operating expenses" and "adjusted gross profit" defined as operating expenses and gross profit, respectively, adjusted to exclude restructuring and realignment costs and special charges.
▪"adjusted operating income" defined as operating income, adjusted to exclude restructuring and realignment costs and special charges, and "adjusted operating margin" defined as adjusted operating income divided by total revenue.
▪“EBITDA” defined as earnings before interest, taxes, depreciation and amortization expense, "EBITDA margin" defined as EBITDA divided by total revenue, "adjusted EBITDA" reflects the adjustment to EBITDA to exclude share-based compensation charges, restructuring and realignment costs, special charges and gain or loss from sale of businesses, and "adjusted EBITDA margin" defined as adjusted EBITDA divided by total revenue.
40
| (in millions) | 2019 | 2018 | ||||||
| Net cash provided by operating activities | $ | 839 | $ | 586 | ||||
| Capital expenditures | (226 | ) | (237 | ) | ||||
| Free cash flow | $ | 613 | $ | 349 | ||||
| Cash paid for Sensus acquisition related costs | — | 1 | ||||||
| Free cash flow, excluding Sensus acquisition related costs | $ | 613 | $ | 350 | ||||
| Net cash used in investing activities | $ | (231 | ) | $ | (643 | ) | ||
| Net cash used by financing activities | $ | (177 | ) | $ | (40 | ) | ||
▪“realignment costs” defined as costs not included in restructuring costs that are incurred as part of actions taken to reposition our business, including items such as professional fees, severance, relocation, travel, facility set-up and other costs.
| (in millions) | 2019 | 2018 | ||||||
| Net Income | $ | 401 | $ | 549 | ||||
| Income tax expense | 15 | 36 | ||||||
| Interest expense (Income), net | 62 | 78 | ||||||
| Depreciation | 117 | 117 | ||||||
| Amortization | 140 | 144 | ||||||
| EBITDA | $ | 735 | $ | 924 | ||||
| Share-based compensation | 29 | 30 | ||||||
| Restructuring and realignment | 82 | 47 | ||||||
| Special charges | 178 | 12 | ||||||
| (Gain) loss from sale of business | (1 | ) | — | |||||
| Adjusted EBITDA | $ | 1,023 | $ | 1,013 | ||||
▪"tax-related special items" defined as tax items, such as tax return versus tax provision adjustments, tax exam impacts, tax law change impacts, excess tax benefits/losses and other discrete tax adjustments.
▪"free cash flow" defined as net cash from operating activities, as reported in the Statement of Cash Flows, less capital expenditures. Our definition of "free cash flow" does not consider certain non-discretionary cash payments, such as debt. The following table provides a reconciliation of free cash flow.
| (in millions) | 2022 | 2021 | ||||||||||||||||||
| Net cash provided by operating activities | $ | 596 | $ | 538 | ||||||||||||||||
| Capital expenditures | (208) | (208) | ||||||||||||||||||
| Free cash flow | $ | 388 | $ | 330 | ||||||||||||||||
| Net cash used in investing activities | $ | (191) | $ | (183) | ||||||||||||||||
| Net cash provided (used) by financing activities | $ | (790) | $ | (855) | ||||||||||||||||
Executive Summary
Xylem reported revenue of $5,249$5,522 million for 2019,2022, an increase of $42$327 million, or 0.8%6.3%, from $5,207$5,195 million reported in 2018.2021. On a constant currency basis, revenue increased by $166$586 million, or 3.2%11.3%, primarily consisting ofduring the year. The increase at constant currency was driven by an increase in organic revenue growth of $188$595 million or 3.6%, driven byreflecting strong organic growth in all end markets andas well as across all segments. A net decrease in revenue related to acquisition and divestiture impacts of $22 million partially offset the organic revenue growth during the year.major geographic regions.
Operating income for 20192022 was $486$622 million, reflecting a decreasean increase of $168$37 million, or 25.7%6.3%, compared to $654$585 million in 2018.2021. Operating margin was 9.3%11.3% for 2019 versus 12.6%both 2022 and 2021. Operating income for 2018, a decrease of 330 basis points. Operating margin was negatively impacted by increased2022 included an increase in special charges of $147$12 million consisting entirely of non-cash impairment charges, and an unfavorable impact from increased restructuring and realignment costs of $34$12 million during the year.as compared to 2021. Excluding the impact of these items, adjusted operating income was $727$672 million, with an adjusted operating margin of 13.9%12.2% in 20192022 as compared to adjusted operating income of $714$611 million with an adjusted operating margin of 13.7%11.8% in 2018.2021, an increase of 40 basis points. The slight increase in adjusted operating margin was primarily due to cost reductions from our global procurementproductivity, restructuring and productivityother cost saving initiatives, including restructuring savings, improved price realization and favorable volume impacts.and price realization. These impacts were partially offset by cost inflation unfavorable mix,and increased spending on strategic investments and increased cost of quality.investments.
Additional financial highlights for 20192022 include the following:
•Net income attributable to Xylem of $401$355 million, or $2.21$1.96 per diluted share, down 16.6% ($547516 million or $3.02$2.85 per diluted share on an adjusted basis, up 4.8%14.5% from 2018)2021)
•Orders of $5,339$6,257 million, down 1.8%0.7% from $5,437$6,300 million in 20182021 (up 0.9%4.0% on an organic basis)
•Dividends paid to shareholders increased 14%7% in 2019.2022.
We anticipate total revenue growth in the range of approximately 1%3% to 5% in 2020,2023, with organic revenue growth anticipated to be in the range of 1%4% to 3%6%. The following is a summary of our 20192022 organic revenue performance and 2020the 2023 organic revenue outlook by end market.
•Utilities revenue increased by approximately 6%10% for 20192022 on an organic basis driven by strength in the United States, the emerging marketsU.S. and western Europe, partially offset by weakness in Canada.the emerging markets. For 2020,2023, we expect organic revenue growth in the low-single-digit range driven by healthyhigh-single-digits. On the clean water side, we expect improvements in chip supply through 2023 allowing for large deal deployments already secured in our backlog. Additionally, we can expect continued momentum for water quality products and increased demand for pipeline assessment services due to aging infrastructure. We expect wastewater spendingutilities to remain focused on mission-critical applications in the United States, smart meterwastewater. Long-term capital expenditure outlook is strong due to aging infrastructure and infrastructure analytics growth opportunities and steady low-single-digit growth in Europe. We also anticipate a healthy infrastructure investment focus in the emerging markets will continue in China, India and Africa.markets’ continued advancement.
41
•Industrial revenue increased by approximately 1%13% for 20192022 on an organic basis driven by strength in the United States, Europe and the Middle East and Africa, partially offset by weakness in Latin America and Canada.across all major geographic regions. For 2020,2023, we expect organic revenue growth in the low to remain relatively flatmid-single-digit range. We expect to see continued robust growth in our dewatering business, driven by softmining demand and strategic growth within the North America Dewatering business during the first half of the year, as oil and gas markets continue to be soft.investments. We anticipate mixed market conditions outside of the United States with modest strengthexpect sustained demand in Asia Pacific offset by softness in the Middle East due to geopolitical and economic uncertainty. We anticipate that Europe will remain relatively flat during the year.light industrial activity globally.
•In the commercial market, organic revenue in 2022 increased by approximately 12%, led by growth in the U.S and western Europe. For 2023, we expect organic revenue growth in the low-single-digit range. We expect sustained demand for energy efficient related projects, particularly in Europe, and continued commercial development in the emerging markets, partially offset by moderation in new construction.
•In the residential market, organic growth wasrevenue increased by approximately 3% for 201916% in 2022 driven primarily by strength in the U.S. as well as strength in the emerging markets and North America,markets. This market is primarily driven by replacement revenue serviced through our distribution network. For 2023, we expect a low-single-digit organic revenue decline due to normalizing demand in the U.S., partially offset by weakness in western Europe. For 2020, we expect organic growth in the low-single-digit range as we anticipate that soft overall market conditions will recover during the second half of the year driven by continued strength in the United States and solid market conditions in Europe. The emerging markets will also continue to drive organic growth, led by initiatives in the China and India building markets.
We will continue to strategically execute restructuring and realignment actions primarily to reposition our European and North American businesses in an effort to optimize our cost structure, and improve our operational efficiency and effectiveness.effectiveness, strengthen our competitive positioning and better serve our customers. During 2019,2022, we incurred $53$15 million and $29$19 million in restructuring and realignment costs, respectively. We realized approximately $6$3 million of net savings from our 2022 actions. As a result of our 2022 actions we expect to realize approximately $14 million of incremental net savings in 2019 from actions initiated in 2018, and an additional $16 million of net savings from our 2019 actions. As a result of our 2018 and 2019 actions we expect to realize approximately $25 million of incremental net savings in 20202023 and beyond. During 2020,2023, we currently expect to incur between $35$25 million and $45$35 million in restructuring and realignment costs.
We planare strongly positioned to continue to take actions and focus spending in 2020 on actions that allow us to make progressdeliver on our top strategic priorities. The priority of accelerating profitable growth encompasses2023 commitments with commercial and operational momentum. We expect resilient demand due to our initiatives to drive commercial leadership, growdifferentiated solutions addressing long-term secular trends in emerging markets and strengthen innovation and technology through creation of new centers of excellence, a streamlined approach to product development and strategic acquisitions. The priority of driving continuous improvement is an area where we will continue to work to create new opportunities to unlock savings by eliminating waste and increasing efficiencies, which isour largest end markets. Our 2023 commitments are supported by effortsbacklog execution, price realization, continued productivity actions to expandmore than offset the impact of persistent inflation and further deepenpotential headwinds from slowing demand in our talent pool. We planmost cyclical end markets. Beyond 2023, we remain on track to continue to deploy capital in smart, disciplined ways to developdeliver our longer-term strategic and acquire solutions to address our customers’ challenges. Finally, we continue to work to improve cash performance and generate capital to returnfinancial milestones. In addition to our shareholders.organic 2023 commitments, we expect to successfully integrate the planned merger of Xylem and Evoqua with a closing estimated by mid-2023.
42
Results of Operations
| (in millions) | 2019 | 2018 | 2019 v. 2018 | (in millions) | 2022 | 2021 | 2022 v. 2021 | ||||||||||||||||||||||||||||||||||||
| Revenue | $ | 5,249 | $ | 5,207 | 0.8 | % | Revenue | $ | 5,522 | $ | 5,195 | 6.3 | % | ||||||||||||||||||||||||||||||
| Gross profit | 2,046 | 2,026 | 1.0 | % | Gross profit | 2,084 | 1,975 | 5.5 | % | ||||||||||||||||||||||||||||||||||
| Gross margin | 39.0 | % | 38.9 | % | 10 | bp | Gross margin | 37.7 | % | 38.0 | % | (30) | bp | ||||||||||||||||||||||||||||||
| Restructuring and realignment costs | 5 | 5 | — | % | |||||||||||||||||||||||||||||||||||||||
| Realignment costs | Realignment costs | 4 | 4 | — | % | ||||||||||||||||||||||||||||||||||||||
| Adjusted gross profit | 2,051 | 2,031 | 1.0 | % | Adjusted gross profit | 2,088 | 1,979 | 5.5 | % | ||||||||||||||||||||||||||||||||||
| Adjusted gross margin | 39.1 | % | 39.0 | % | 10 | bp | Adjusted gross margin | 37.8 | % | 38.1 | % | (30) | bp | ||||||||||||||||||||||||||||||
| Total operating expenses | 1,560 | 1,372 | 13.7 | % | Total operating expenses | 1,462 | 1,390 | 5.2 | % | ||||||||||||||||||||||||||||||||||
| Expense to revenue ratio | 29.7 | % | 26.3 | % | 340 | bp | Expense to revenue ratio | 26.5 | % | 26.8 | % | (30) | bp | ||||||||||||||||||||||||||||||
| Restructuring and realignment costs | (77 | ) | (43 | ) | 79.1 | % | Restructuring and realignment costs | (30) | (18) | 66.7 | % | ||||||||||||||||||||||||||||||||
| Special charges | (159 | ) | (12 | ) | NM | Special charges | (16) | (4) | 300.0 | % | |||||||||||||||||||||||||||||||||
| Adjusted operating expenses | 1,324 | 1,317 | 0.5 | % | Adjusted operating expenses | 1,416 | 1,368 | 3.5 | % | ||||||||||||||||||||||||||||||||||
| Adjusted operating expenses to revenue ratio | 25.2 | % | 25.3 | % | (10 | )bp | Adjusted operating expenses to revenue ratio | 25.6 | % | 26.3 | % | (70) | bp | ||||||||||||||||||||||||||||||
| Operating income | 486 | 654 | (25.7 | )% | Operating income | 622 | 585 | 6.3 | % | ||||||||||||||||||||||||||||||||||
| Operating margin | 9.3 | % | 12.6 | % | (330 | )bp | Operating margin | 11.3 | % | 11.3 | % | — | bp | ||||||||||||||||||||||||||||||
| Interest and other non-operating expense (income), net | 71 | 69 | 2.9 | % | |||||||||||||||||||||||||||||||||||||||
| Gain (loss) from sale of business | 1 | — | NM | ||||||||||||||||||||||||||||||||||||||||
| U.K. pension settlement expense | U.K. pension settlement expense | 140 | — | NM | |||||||||||||||||||||||||||||||||||||||
| Interest and other non-operating expense, net | Interest and other non-operating expense, net | 43 | 76 | (43.4) | % | ||||||||||||||||||||||||||||||||||||||
| Gain from sale of business | Gain from sale of business | 1 | 2 | (50.0) | % | ||||||||||||||||||||||||||||||||||||||
| Income tax expense | 15 | 36 | (58.3 | )% | Income tax expense | 85 | 84 | 1.2 | % | ||||||||||||||||||||||||||||||||||
| Tax rate | 3.7 | % | 6.1 | % | (240 | )bp | Tax rate | 19.2 | % | 16.3 | % | 290 | bp | ||||||||||||||||||||||||||||||
| Net income | $ | 401 | $ | 549 | (27.0 | )% | Net income | $ | 355 | $ | 427 | (16.9) | % | ||||||||||||||||||||||||||||||
NM Not Meaningful
2022 versus 20182021
Revenue
Revenue generated for 20192022 was $5,249$5,522 million, an increase of $42$327 million, or 0.8%6.3%, compared to $5,207$5,195 million in 2018.2021. On a constant currency basis, revenue grew 3.2%11.3% during 2019. This2022. The increase in revenue at constant currency was primarily driven by an increase in organic revenue of $188$595 million, reflecting strong organic growth in the United States and the emergingall end markets with the exception of Latin America, partially offset by declines in Canada and western Europe. A net decrease in revenue related to acquisition and divestiture impacts of $22 million partially offset organic growth during the year.as well as across all major geographic regions.
The following table illustrates the impact from organic growth, recent acquisitions and divestitures, and foreign currency translation in relation to revenue during 2019:2022:
| Water Infrastructure | Applied Water | Measurement & Control Solutions | Total Xylem | ||||||||||||||||||||||||||||||||
| (in millions) | $ Change | % Change | $ Change | % Change | $ Change | % Change | $ Change | % Change | |||||||||||||||||||||||||||
| 2021 Revenue | $ | 2,247 | $ | 1,613 | $ | 1,335 | $ | 5,195 | |||||||||||||||||||||||||||
| Organic Impact | 266 | 11.8 | % | 220 | 13.6 | % | 109 | 8.2 | % | 595 | 11.5 | % | |||||||||||||||||||||||
| Acquisitions/(Divestitures) | — | — | % | — | — | % | (9) | (0.7) | % | (9) | (0.2) | % | |||||||||||||||||||||||
| Constant Currency | 266 | 11.8 | % | 220 | 13.6 | % | 100 | 7.5 | % | 586 | 11.3 | % | |||||||||||||||||||||||
| Foreign currency translation (a) | (149) | (6.6) | % | (66) | (4.1) | % | (44) | (3.3) | % | (259) | (5.0) | % | |||||||||||||||||||||||
| Total change in revenue | 117 | 5.2 | % | 154 | 9.5 | % | 56 | 4.2 | % | 327 | 6.3 | % | |||||||||||||||||||||||
| 2022 Revenue | $ | 2,364 | $ | 1,767 | $ | 1,391 | $ | 5,522 | |||||||||||||||||||||||||||
(a)Foreign currency translation impact for the year primarily due to the weakening in value of various currencies against the U.S. Dollar, the largest being the Euro, the British Pound, the Swedish Krona, the Canadian Dollar, the Australian Dollar and the Hungarian Forint.
43
| Water Infrastructure | Applied Water | Measurement & Control Solutions | Total Xylem | ||||||||||||||||||||
| (in millions) | $ Change | % Change | $ Change | % Change | $ Change | % Change | $ Change | % Change | |||||||||||||||
| 2018 Revenue | $ | 2,176 | $ | 1,534 | $ | 1,497 | $ | 5,207 | |||||||||||||||
| Organic Growth | 71 | 3.3 | % | 36 | 2.3 | % | 81 | 5.4 | % | 188 | 3.6 | % | |||||||||||
| Acquisitions/(Divestitures) | — | — | % | — | — | % | (22 | ) | (1.5 | )% | (22 | ) | (0.4 | )% | |||||||||
| Constant Currency | 71 | 3.3 | % | 36 | 2.3 | % | 59 | 3.9 | % | 166 | 3.2 | % | |||||||||||
| Foreign currency translation (a) | (70 | ) | (3.2 | )% | (29 | ) | (1.9 | )% | (25 | ) | (1.7 | )% | (124 | ) | (2.4 | )% | |||||||
| Total change in revenue | 1 | — | % | 7 | 0.5 | % | 34 | 2.3 | % | 42 | 0.8 | % | |||||||||||
| 2019 Revenue | $ | 2,177 | $ | 1,541 | $ | 1,531 | $ | 5,249 | |||||||||||||||
Water Infrastructure
Water Infrastructure revenue slightly increased $1$117 million, or 5.2%, to $2,177$2,364 million in 2019 (3.3%2022 (11.8% increase on a constant currency basis) compared to 2018.2021. Revenue was negatively impacted by $70$149 million of foreign currency translation, with the change at constant currency coming entirely from organic growth of $266 million. Organic growth for the year was driven by strength in both the utility and industrial end markets. The utilities end market experienced organic growth of $151 million led by strength in the U.S. driven by strong price realization, solid backlog execution, timing of projects as compared to prior year and continued strength in the construction sector. Western Europe also experienced strong organic growth due to good price realization, coupled with strong demand in utilities' capital spending. This increase was partially offset by weakness in the emerging markets, primarily due to the continued negative impacts from COVID lockdowns in China. The industrial end market had $115 million of organic growth across all major geographic regions, particularly in western Europe due to strong backlog execution and good price realization, and in the emerging markets, driven by mining projects and price realization in both Latin America and Africa.
From an application perspective, organic revenue growth was driven by our transport applications. Transport
experienced $247 million of revenue growth, almost half of which came from the dewatering application. All three of our major geographic regions contributed to the organic revenue growth in transport, led by the U.S. where we continued to experience strong price realization and had strong backlog coming into the year, followed by western Europe, which also experienced strong price realization coupled with strong demand from utility capital projects. We also experienced strong growth in the emerging markets driven by good price realization as well as robust mining demand in our dewatering business, particularity in Latin America and Africa, which more than offset declines in China due to COVID impacts. Organic revenue for the treatment application was $19 million for the year, as revenue growth from strong backlog execution in western Europe and the U.S. was partially offset by declines in emerging markets led by the continued negative COVID impacts on China.
Applied Water
Applied Water revenue increased $154 million, or 9.5%, in 2022 (13.6% increase on a constant currency basis) compared to 2021. Revenue was negatively impacted by $66 million of foreign currency translation, with the change at constant currency coming entirely from organic growth during the year of $71$220 million. Organic growth for the year was driven by strength in the utilityall three end market, particularly in the United States, where we benefited from healthy order intake and strong market conditions across both applications. The utility end market also saw growth in Asia Pacific and western Europe driven by strong project deployments during the year. The industrial end market has remained relatively flat during the year with organic growth in the emerging markets and the United States, where we benefited from solid order intake and a strong mining market over the first half of the year, which was partially offset by declines in western Europe due to the timing of project deployments in the prior year. Organic growth in both end markets also benefited from price realization during the year.
Measurement & Control Solutions
Measurement & Control Solutions revenue increased $34$56 million, or 2.3%4.2%, in 2019 (3.9%2022 (7.5% increase on a constant currency basis) compared to 2018.2021. Revenue was negatively impacted by $25$44 million of foreign currency translation during the year. Revenue growthyear, with the change at constant currency was made up ofdriven by an organic revenue growth of $81$109 million, or 5.4%8.2%, which was partially offset by $22and $9 million of reduced revenue related to the net acquisition and divestiture impacts during the year. OrganicWe experienced organic revenue growth across all three major geographic regions and in both of the segment's end markets for the year, was driven by strength$91 million of organic growth in the utility end market, primarily in the United StatesU.S. as a result of the easing of electronic component shortage and the Middle East, partially offsetstrong price realization, followed by declines$18 million in the United Kingdom.industrial end market driven by strong backlog execution in our test business.
From an application perspective, organic revenue from the water metrology application contributed the majority of the organic growth for the segment, with large project deployments in the United States, the Middle East and western Europe during the year. The energy application also contributed to the organic growth during the year as gas project deployments more than offset the timingconsisted entirely of a large electric project deploymentgrowth in the prior year in the United States . This organic growthwater application of $114 million, which was partiallyslightly offset by a decline in the softwareenergy applications of $5 million. Organic revenue growth in the water application was driven by strength in the U.S. as a service ("SaaS")result of easing of electronic component shortages and other application primarily duestrong price realization. Backlog execution in the emerging markets and strength in our test and pipeline assessment services businesses in western Europe also contributed to the timing of a large software salegrowth. Declines in the prior yearenergy applications were driven by impacts from electronic component shortages in the United Kingdom. The test application remained relatively flat as compared toU.S. during the priorfirst half of the year, more than offsetting modest growth in the second half of the year.
44
Orders/Backlog
An order represents a legally enforceable, written document that includes the scope of work or services to be performed or equipment to be supplied to a customer, the corresponding price and the expected delivery date for the applicable products or services to be provided. An order often takes the form of a customer purchase order (“P.O.”) or a signed quote from a Xylem business. Orders received during 20192022 decreased by $98$43 million, or 1.8%0.7%, to $5,339$6,257 million (0.6%(3.7% increase on a constant currency basis). Order intake during the year was negatively impacted by $129$279 million of foreign currency translation.translation and $18 million of reduced orders related to divestiture impacts. The order growthincrease on a constant currency basis primarily consisted of organic order growth of $48$254 million, or 0.9%4.0%, over the prior year. Net acquisition and divestiture activity of $17 million negatively impacted order growth during the year.
The following table illustrates the impact from organic growth, recent acquisitions and divestitures, and foreign currency translation in relation to orders during 2019:2022:
| Water Infrastructure | Applied Water | Measurement & Control Solutions | Total Xylem | ||||||||||||||||||||||||||||||||
| (in millions) | $ Change | % Change | $ Change | % Change | $ Change | % Change | $ Change | % Change | |||||||||||||||||||||||||||
| 2021 Orders | $ | 2,471 | $ | 1,860 | $ | 1,969 | $ | 6,300 | |||||||||||||||||||||||||||
| Organic Impact | 302 | 12.2 | % | 2 | 0.1 | % | (50) | (2.5) | % | 254 | 4.0 | % | |||||||||||||||||||||||
| Acquisitions/(Divestitures) | — | — | % | — | — | % | (18) | (0.9) | % | (18) | (0.3) | % | |||||||||||||||||||||||
| Constant Currency | 302 | 12.2 | % | 2 | 0.1 | % | (68) | (3.5) | % | 236 | 3.7 | % | |||||||||||||||||||||||
| Foreign currency translation (a) | (166) | (6.7) | % | (68) | (3.7) | % | (45) | (2.3) | % | (279) | (4.4) | % | |||||||||||||||||||||||
| Total change in orders | 136 | 5.5 | % | (66) | (3.5) | % | (113) | (5.7) | % | (43) | (0.7) | % | |||||||||||||||||||||||
| 2022 Orders | $ | 2,607 | $ | 1,794 | $ | 1,856 | $ | 6,257 | |||||||||||||||||||||||||||
| Water Infrastructure | Applied Water | Measurement & Control Solutions | Total Xylem | ||||||||||||||||||||
| (in millions) | $ Change | % Change | $ Change | % Change | $ Change | % Change | $ Change | % Change | |||||||||||||||
| 2018 Orders | $ | 2,255 | $ | 1,557 | $ | 1,625 | $ | 5,437 | |||||||||||||||
| Organic Growth | 53 | 2.4 | % | 28 | 1.8 | % | (33 | ) | (2.0 | )% | 48 | 0.9 | % | ||||||||||
| Acquisitions/(Divestitures) | — | — | % | — | — | % | (17 | ) | (1.0 | )% | (17 | ) | (0.3 | )% | |||||||||
| Constant Currency | 53 | 2.4 | % | 28 | 1.8 | % | (50 | ) | (3.1 | )% | 31 | 0.6 | % | ||||||||||
| Foreign currency translation (a) | (74 | ) | (3.3 | )% | (29 | ) | (1.9 | )% | (26 | ) | (1.6 | )% | (129 | ) | (2.4 | )% | |||||||
| Total change in orders | (21 | ) | (0.9 | )% | (1 | ) | (0.1 | )% | (76 | ) | (4.7 | )% | (98 | ) | (1.8 | )% | |||||||
| 2019 Orders | $ | 2,234 | $ | 1,556 | $ | 1,549 | $ | 5,339 | |||||||||||||||
Water Infrastructure
Water Infrastructure segment orders decreased $21increased $136 million, or 0.9%5.5%, to $2,234$2,607 million (2.4%(12.2% increase on a constant currency basis). Order intake during the year was negatively impacted by $74$166 million of foreign currency translation. Organic orders increased during the year as strength in the transport applications came primarily from the U.S. where we benefited from strong market demand in water utilities, price realization and timing of large infrastructure projects. Western Europe also contributed to order growth from increased demand in utility capital projects and healthy market conditions. The order increase ontreatment application saw a constant currency basis wasslight decrease in orders driven by organic orderthe emerging markets due to declines in China related to COVID impacts, which more than offset modest growth in the transport application. Transport organic order growth was primarily driven by a large smart city project order secured in India during the second half of the yearU.S. and strong market conditions, coupled with some price realization, in Europe, China and North America. Organic orders for the treatment application declined during the year, primarily driven by project timing in North America and India due to the timing of large project orders in the prior year, partially offset by strong order intake in the Middle East during the year.western Europe.
Applied Water
Applied Water segment orders slightly decreased $1$66 million, or 3.5%, to $1,556$1,794 million (1.8% increase(flat on a constant currency basis). Order intake during the year was negatively impacted by $29$68 million of foreign currency translation. The order increase on a constant currency basis was driven by strongtranslation, making organic order growth relatively flat. Weakness in the United States and China across both applications, which wereU.S. from lapping strong demand in the prior year was partially offset by a reduction of ordersstrength in the Middle East.emerging markets and western Europe as a result of strong project orders and stocking by channel partners.
Measurement & Control Solutions
Measurement & Control Solutions segment orders decreased $76$113 million, or 4.7%5.7%, to $1,549$1,856 million (3.1%(3.5% decrease on a constant currency basis). Order intakeweakness during the year was negatively impacted by $26$45 million of foreign currency translation.translation and reduced orders related to divestiture impacts of $18 million. The organic order decrease was $50 million, or (2.5)%. The order decrease on a constant currency basis was driven by an organic decline of $33 million, or 2.0%, which followed a difficult comparison todeclines during the prior year are lapping strong organic order growth of 18%, and $17 million of38% in the net acquisition and divestiture impacts on theprior year. The decrease in organic orders duringorder weakness for the year was driven by the energywater application decline in North America, which had a significant electric deploymentdue to the moderation of early orders to mitigate electronic component shortages and longer lead times that drove order in the prior year that did not repeat. Water application orders grew organically during the year driven by strong order intake within the AIA platform, partially offset by the lapping of large prior year orders for metrology projects, coupled with some softening market conditions, in North America and the Middle East. SaaS and other experienced modest organic growth during the year, driven by order strength in North America, largely offset by the lapping of a
45
Backlog
Backlog includes orders on hand as well as contractual customer agreements at the end of the period. Delivery schedules vary from customer to customer based on their requirements. Annual or multi-year contracts are subject to rescheduling and cancellation by customers due to the long-term nature of the contracts. As such, beginning total backlog, plus orders, minus revenues, will not equal ending total backlog due to contract adjustments, foreign currency fluctuations, and other factors. Typically, large projects require longer lead production cycles and deployment schedules and delays can occur from time to time. Total backlog was $1,801$3,605 million at December 31, 20192022 and $1,689$3,240 million at December 31, 2018,2021, an increase of 6.6%11.3%. We anticipate that approximately 60%55% of our total backlog at December 31, 20192022 will be recognized as revenue during 2020. This is down from prior years due to the changing profile of our backlog which includes a greater portion of large multi-year projects.2023.
Gross Margin
Gross margin as a percentage of consolidated revenue increased 10decreased 30 basis points to 39.0%37.7% in 20192022 as compared to 38.9%38.0% in 2018. The slight2021.The gross margin increase was primarilydecline for the year included 730 basis points of negative impacts, driven by 580 basis points of cost reductions from global procurementinflation, as well as increased spending on strategic investments of 60 basis points and productivity improvement initiatives and price realization, which40 basis points of inventory management costs. These negative impacts were partially offset by cost inflationfavorable impacts of 700 basis points, driven by 470 basis points of price realization and unfavorable mix.230 basis points of productivity savings.
Operating Expenses
| (in millions) | 2019 | 2018 | Change | (in millions) | 2022 | 2021 | Change | ||||||||||||||||||||
| Selling, general and administrative expenses ("SG&A") | $ | 1,158 | $ | 1,161 | (0.3 | )% | |||||||||||||||||||||
| Selling, general and administrative expenses | Selling, general and administrative expenses | $ | 1,227 | $ | 1,179 | 4.1 | % | ||||||||||||||||||||
| SG&A as a % of revenue | 22.1 | % | 22.3 | % | (20 | )bp | SG&A as a % of revenue | 22.2 | % | 22.7 | % | (50) | bp | ||||||||||||||
| Research and development expenses ("R&D") | 191 | 189 | 1.1 | % | |||||||||||||||||||||||
| Research and development expenses | Research and development expenses | 206 | 204 | 1.0 | % | ||||||||||||||||||||||
| R&D as a % of revenue | 3.6 | % | 3.6 | % | — | R&D as a % of revenue | 3.7 | % | 3.9 | % | (20) | bp | |||||||||||||||
| Restructuring and asset impairment charges | 63 | 22 | 186.4 | % | Restructuring and asset impairment charges | 29 | 7 | 314.3 | % | ||||||||||||||||||
| Operating expenses | $ | 1,412 | $ | 1,372 | 2.9 | % | Operating expenses | $ | 1,462 | $ | 1,390 | 5.2 | % | ||||||||||||||
| Expense to revenue ratio | 26.9 | % | 26.3 | % | 60 | bp | Expense to revenue ratio | 26.5 | % | 26.8 | % | (30) | bp | ||||||||||||||
Selling, General and Administrative ("SG&A") Expenses
SG&A expenses decreasedincreased by $3$48 million (decrease(increase of 0.3%4.1%) to 22.1%22.2% of revenue in 2019,2022, as compared to 22.3%22.7% of revenue in 2018. The improvement2021. Revenue growth was higher than SG&A increases resulting in a lower SG&A as a percentpercentage of revenue for the year was primarilysales. Cost increases were driven by cost reductions from global procurementincreased investments in strategic growth initiatives of $59 million and productivity improvement initiatives, including restructuring savings, which wereinflation of $38 million, partially offset by cost inflation and additional investment in strategic growth initiatives.$48 million of favorable currency impacts.
Research and Development ("R&D") Expenses
R&D expense was $191$206 million, or 3.6%3.7% of revenue, in 2019 as compared to $1892022 which was fairly consistent with the 2021 expense of $204 million, or 3.6%3.9% of revenue, in 2018. Additionally, we capitalized R&D on external sale software of $59 million in 2019 as compared to $60 million in 2018. Our increased spending on R&D is driven by development needs to drive new product growth.revenue.
Restructuring and Asset Impairment Charges
Restructuring
From time to time, the Company will incur costs related to restructuring actions in order to optimize our cost base and more strategically position itself. Restructuring charges were $15 million in 2022 as compared to $6 million in 2021.
During 2019,2022 we incurred restructuring costs of $20 million, $5 million and $28 million in our Water Infrastructure, Applied Water and Measurement & Control Solutions segments, respectively. We incurred these charges related to actions taken in 2019 primarily as a continuation of our efforts to reposition our European and North American businessesbusiness to optimize our cost structure and improve our operational efficiency and effectiveness. The charges primarily included the reduction of headcount across all segments.
In response to the changes in business and consolidationeconomic conditions arising as a result of facilities withinthe COVID-19 pandemic, on June 2, 2020 management committed to a restructuring plan that includes actions across our Measurement & Control Solutionsbusinesses and Water Infrastructure segments, as well as headcount reductions withinfunctions globally. The plan was designed to support our Applied Water segment.long-term financial resilience and simplify our operations, strengthen our competitive positioning and better serve our customers.
are included in the information presented below.
46
The following is a rollforwardroll-forward of employee position eliminations associated with restructuring activities for the years ended December 31, 20192022 and 2018:2021:
| 2019 | 2018 | 2022 | 2021 | |||||||||||||||||
| Planned reductions - January 1 | 69 | 47 | Planned reductions - January 1 | 60 | 319 | |||||||||||||||
| Additional planned reductions | 674 | 206 | Additional planned reductions | 203 | 83 | |||||||||||||||
| Actual reductions and reversals | (547 | ) | (184 | ) | Actual reductions and reversals | (161) | (342) | |||||||||||||
| Planned reductions - December 31 | 196 | 69 | Planned reductions - December 31 | 102 | 60 | |||||||||||||||
The following table presents the total costs expected to be incurred, the amount incurred in the period, and the cumulative costs incurred to date for our 2020, 2021 and 2022 restructuring spend:actions:
| (in millions) | Water Infrastructure | Applied Water | Measurement & Control Solutions | Corporate | Total | |||||||||||||||||||||||||||
| Actions Commenced in 2022: | ||||||||||||||||||||||||||||||||
| Total expected costs | $ | 6 | $ | 4 | $ | 4 | $ | — | $ | 14 | ||||||||||||||||||||||
| Costs incurred during 2022 | 6 | 4 | 4 | — | 14 | |||||||||||||||||||||||||||
| Total expected costs remaining | $ | — | $ | — | $ | — | $ | — | $ | — | ||||||||||||||||||||||
| Actions Commenced in 2021: | ||||||||||||||||||||||||||||||||
| Total expected costs | $ | 3 | $ | — | $ | — | $ | — | $ | 3 | ||||||||||||||||||||||
| Costs incurred during 2021 | 3 | — | — | — | 3 | |||||||||||||||||||||||||||
| Costs incurred during 2022 | — | — | — | — | — | |||||||||||||||||||||||||||
| Total expected costs remaining | $ | — | $ | — | $ | — | $ | — | $ | — | ||||||||||||||||||||||
| Actions Commenced in 2020: | ||||||||||||||||||||||||||||||||
| Total expected costs | $ | 23 | $ | 6 | $ | 30 | $ | — | $ | 59 | ||||||||||||||||||||||
| Costs incurred during 2020 | 19 | 4 | 30 | — | 53 | |||||||||||||||||||||||||||
| Costs incurred during 2021 | 4 | 2 | — | — | 6 | |||||||||||||||||||||||||||
| Costs incurred during 2022 | — | — | — | — | — | |||||||||||||||||||||||||||
| Total expected costs remaining | $ | — | $ | — | $ | — | $ | — | $ | — | ||||||||||||||||||||||
| (in millions) | Water Infrastructure | Applied Water | Measurement & Control Solutions | Corporate | Total | |||||||||||||||
| Actions Commenced in 2019: | ||||||||||||||||||||
| Total expected costs | $ | 19 | $ | 5 | $ | 28 | $ | — | $ | 52 | ||||||||||
| Costs incurred during 2019 | 18 | 5 | 27 | — | 50 | |||||||||||||||
| Total expected costs remaining | $ | 1 | $ | — | $ | 1 | $ | — | $ | 2 | ||||||||||
| Actions Commenced in 2018: | ||||||||||||||||||||
| Total expected costs | $ | 8 | $ | 1 | $ | 7 | $ | — | $ | 16 | ||||||||||
| Costs incurred during 2018 | 7 | 1 | 7 | — | 15 | |||||||||||||||
| Costs incurred during 2019 | 1 | — | — | — | 1 | |||||||||||||||
| Total expected costs remaining | $ | — | $ | — | $ | — | $ | — | $ | — | ||||||||||
| Actions Commenced in 2017: | ||||||||||||||||||||
| Total expected costs | $ | 12 | $ | 7 | $ | 4 | $ | — | $ | 23 | ||||||||||
| Costs incurred during 2017 | 5 | 4 | 2 | — | 11 | |||||||||||||||
| Costs incurred during 2018 | 2 | 1 | 1 | — | 4 | |||||||||||||||
| Costs incurred during 2019 | 1 | — | 1 | — | 2 | |||||||||||||||
| Total expected costs remaining | $ | 4 | $ | 2 | $ | — | $ | — | $ | 6 | ||||||||||
The Water Infrastructure, Applied Water and Measurement & Control Solutions actions commenced in 20192022 consist primarily of severance charges. The Applied Water actions commenced in 2022 are complete, thecomplete.
The Water Infrastructure actions are expected to continue through Q1 2020, and the Measurement & Control Solutions actions are expected to continue through the fourth quarter of 2020. The Water Infrastructure, Applied Water, and Measurement & Control Solutions actions commenced in 20182021 consist primarily of severance charges and are complete.charges. The Water Infrastructure, Applied Water, Measurement & Control Solutions and Corporate actions commenced in 2017 consist primarily of severance charges and2021 are expected to continue through 2021. complete.
As a result of the actions initiated in 2019,2022, we achieved savings of approximately $15$2 million in 20192022 and estimate annual future net savings beginning in 20202023 of approximately $39$14 million, resulting in $24$12 million of incremental savings from the 20192022 actions.
47
Asset Impairment
During the first and third quarter of 20192022, we determined that certain assets, primarily software and customer relationships, within our Measurement & Control Solutions segment, including customer relationships, internally developed software, proprietary technology, and plant property & equipment, were impaired. Accordingly we recognized an impairment charge of $10 million during the year. Refer to Note 12, "Goodwill and Other Intangible Assets," for additional information.
Operating Income and Adjusted EBITDA
Operating income was $486$622 million (operating margin of 9.3%11.3%) during 2019, a decrease2022, an increase of $168$37 million, or 25.7%6.3%, when compared to operating income of $654$585 million (operating margin of 12.6%11.3%) during the prior year. Operating margin for the year was negatively impacted by increasedincluded unfavorable impacts of 40 basis points from increases in special charges of $147 million, consisting entirely of non-cash impairment charges, and increased restructuring and realignment costs of $34 million as compared to the prior year. Additionally, operating margin included 1020 basis points of expansion from favorable operating impacts, driven by a 670 basis point increase from price realization, 280 basis points from productivity savings and 70 basis points from favorable volume. Margin expansion was offset by 980 basis points of unfavorable impacts driven by 660 basis points of inflation, 180 basis points of increased spending on strategic investments, 40 basis points of inventory management costs and 30 basis points of unfavorable mix. Excluding these special charges and restructuring and realignment costs, adjusted operating income was $727$672 million (adjusted operating margin of 13.9%12.2%) for 20192022 as compared to adjusted operating income of $714$611 million (adjusted operating margin of 13.7%11.8%) during the prior year.
Adjusted EBITDA was $940 million (adjusted EBITDA margin of 17.0%) during 2022, an increase of $50 million, or 5.6%, when compared to adjusted EBITDA of $890 million (adjusted EBITDA margin of 17.1%) during the prior year. The slight increasedecrease in adjusted operatingEBITDA margin was primarily due to cost reductionsthe same factors impacting adjusted operating margin noted above; however, adjusted EBITDA margin did not benefit from our global procurementa year over year reduction in depreciation and productivity initiatives, including restructuring savings, improved price realization and favorable volume impacts. These impacts were partially offset by cost inflation, unfavorable mix, increased spending on strategic investments and increased cost of quality.amortization expense.
48
The table below provides a reconciliation of total and each segment's operating income to adjusted operating income, and a calculation of the corresponding adjusted operating margin:
| (In millions) | 2019 | 2018 | Change | (In millions) | 2022 | 2021 | Change | ||||||||||||||||||||||||
| Water Infrastructure | Water Infrastructure | ||||||||||||||||||||||||||||||
| Operating income | $ | 365 | $ | 359 | 1.7 | % | Operating income | $ | 418 | $ | 387 | 8.0 | % | ||||||||||||||||||
| Operating margin | 16.8 | % | 16.5 | % | 30 | bp | Operating margin | 17.7 | % | 17.2 | % | 50 | bp | ||||||||||||||||||
| Restructuring and realignment costs | 31 | 20 | 55.0 | % | Restructuring and realignment costs | 11 | 12 | (8.3) | % | ||||||||||||||||||||||
| Special charges | — | 2 | NM | ||||||||||||||||||||||||||||
| Adjusted operating income | $ | 396 | $ | 381 | 3.9 | % | Adjusted operating income | $ | 429 | $ | 399 | 7.5 | % | ||||||||||||||||||
| Adjusted operating margin | 18.2 | % | 17.5 | % | 70 | bp | Adjusted operating margin | 18.1 | % | 17.8 | % | 30 | bp | ||||||||||||||||||
| Applied Water | Applied Water | ||||||||||||||||||||||||||||||
| Operating income | $ | 241 | $ | 236 | 2.1 | % | Operating income | $ | 258 | $ | 240 | 7.5 | % | ||||||||||||||||||
| Operating margin | 15.6 | % | 15.4 | % | 20 | bp | Operating margin | 14.6 | % | 14.9 | % | (30) | bp | ||||||||||||||||||
| Restructuring and realignment costs | 13 | 10 | 30.0 | % | Restructuring and realignment costs | 13 | 7 | 85.7 | % | ||||||||||||||||||||||
| Special charges | Special charges | — | 1 | (100.0) | % | ||||||||||||||||||||||||||
| Adjusted operating income | $ | 254 | $ | 246 | 3.3 | % | Adjusted operating income | $ | 271 | $ | 248 | 9.3 | % | ||||||||||||||||||
| Adjusted operating margin | 16.5 | % | 16.0 | % | 50 | bp | Adjusted operating margin | 15.3 | % | 15.4 | % | (10) | bp | ||||||||||||||||||
| Measurement & Control Solutions | Measurement & Control Solutions | ||||||||||||||||||||||||||||||
| Operating (loss) income | $ | (67 | ) | $ | 118 | (156.8 | ) | % | |||||||||||||||||||||||
| Operating income | Operating income | $ | 2 | $ | 12 | (83.3) | % | ||||||||||||||||||||||||
| Operating margin | (4.4 | )% | 7.9 | % | (1,230 | ) | bp | Operating margin | 0.1 | % | 0.9 | % | (80) | bp | |||||||||||||||||
| Restructuring and realignment costs | 38 | 18 | 111.1 | % | Restructuring and realignment costs | 10 | 3 | 233.3 | % | ||||||||||||||||||||||
| Special charges | 159 | 5 | NM | Special charges | 14 | — | NM | % | |||||||||||||||||||||||
| Adjusted operating income | $ | 130 | $ | 141 | (7.8 | ) | % | Adjusted operating income | $ | 26 | $ | 15 | 73.3 | % | |||||||||||||||||
| Adjusted operating margin | 8.5 | % | 9.4 | % | (90 | ) | bp | Adjusted operating margin | 1.9 | % | 1.1 | % | 80 | bp | |||||||||||||||||
| Corporate and other | Corporate and other | ||||||||||||||||||||||||||||||
| Operating loss | $ | (53 | ) | $ | (59 | ) | (10.2 | ) | % | Operating loss | $ | (56) | $ | (54) | 3.7 | % | |||||||||||||||
| Special charges | — | 5 | NM | % | Special charges | 2 | 3 | (33.3) | |||||||||||||||||||||||
| Adjusted operating loss | $ | (53 | ) | $ | (54 | ) | (1.9 | ) | % | Adjusted operating loss | $ | (54) | $ | (51) | 5.9 | % | |||||||||||||||
| Total Xylem | Total Xylem | ||||||||||||||||||||||||||||||
| Operating income | $ | 486 | $ | 654 | (25.7 | ) | % | Operating income | $ | 622 | $ | 585 | 6.3 | % | |||||||||||||||||
| Operating margin | 9.3 | % | 12.6 | % | (330 | ) | bp | Operating margin | 11.3 | % | 11.3 | % | — | bp | |||||||||||||||||
| Restructuring and realignment costs | 82 | 48 | 70.8 | % | Restructuring and realignment costs | 34 | 22 | 54.5 | % | ||||||||||||||||||||||
| Special charges | 159 | 12 | 1,225.0 | % | Special charges | 16 | 4 | 300.0 | % | ||||||||||||||||||||||
| Adjusted operating income | $ | 727 | $ | 714 | 1.8 | % | Adjusted operating income | $ | 672 | $ | 611 | 10.0 | % | ||||||||||||||||||
| Adjusted operating margin | 13.9 | % | 13.7 | % | 20 | bp | Adjusted operating margin | 12.2 | % | 11.8 | % | 40 | bp | ||||||||||||||||||
NM Not Meaningful
49
The table below provides a reconciliation of net income to consolidated EBITDA and adjusted EBITDA:
| (in millions) | Year Ended December 31, | |||||||||||||||||||
| 2022 | 2021 | Change | ||||||||||||||||||
| Net Income | $ | 355 | $ | 427 | (17) | % | ||||||||||||||
| Net Income margin | 6.4 | % | 8.2 | % | (180) | bp | ||||||||||||||
| Depreciation | 111 | 118 | (6) | % | ||||||||||||||||
| Amortization | 125 | 127 | (2) | % | ||||||||||||||||
| Interest expense, net | 34 | 69 | (51) | % | ||||||||||||||||
| Income tax expense | 85 | 84 | 1 | % | ||||||||||||||||
| EBITDA | $ | 710 | $ | 825 | (14) | % | ||||||||||||||
| Share-based compensation | 37 | 33 | 12 | % | ||||||||||||||||
| Restructuring & realignment | 34 | 22 | 55 | % | ||||||||||||||||
| U.K. pension settlement expense | 140 | — | 100 | % | ||||||||||||||||
| Special charges | 20 | 12 | 67 | % | ||||||||||||||||
| Gain from sale of business | (1) | (2) | (50) | % | ||||||||||||||||
| Adjusted EBITDA | $ | 940 | $ | 890 | 6 | % | ||||||||||||||
| Adjusted EBITDA margin | 17.0 | % | 17.1 | % | (10) | bp | ||||||||||||||
The tables below provide a reconciliation of each segment's operating income (loss) to EBITDA and adjusted EBITDA:
| Year Ended December 31, 2022 | ||||||||||||||||||||
| (in millions) | Water Infrastructure | Applied Water Systems | Measurement & Control Solutions | |||||||||||||||||
| Operating Income | $ | 418 | $ | 258 | $ | 2 | ||||||||||||||
| Gain from sale of business | — | — | 1 | |||||||||||||||||
| Depreciation | 44 | 17 | 33 | |||||||||||||||||
| Amortization | 9 | 2 | 104 | |||||||||||||||||
| Other non-operating expense | (4) | (2) | (2) | |||||||||||||||||
| EBITDA | $ | 467 | $ | 275 | $ | 138 | ||||||||||||||
| Share-based compensation | 2 | 4 | 6 | |||||||||||||||||
| Restructuring & realignment | 11 | 13 | 10 | |||||||||||||||||
| Special charges | — | — | 14 | |||||||||||||||||
| Gain from sale of business | — | — | (1) | |||||||||||||||||
| Adjusted EBITDA | $ | 480 | $ | 292 | $ | 167 | ||||||||||||||
| Adjusted EBITDA margin | 20.3 | % | 16.5 | % | 12.0 | % | ||||||||||||||
50
| Year Ended December 31, 2021 | ||||||||||||||||||||
| (in millions) | Water Infrastructure | Applied Water Systems | Measurement & Control Solutions | |||||||||||||||||
| Operating Income | $ | 387 | $ | 240 | $ | 12 | ||||||||||||||
| Gain from sale of business | — | 2 | — | |||||||||||||||||
| Depreciation | 43 | 20 | 38 | |||||||||||||||||
| Amortization | 8 | 2 | 107 | |||||||||||||||||
| Other non-operating expense | (5) | (3) | (2) | |||||||||||||||||
| EBITDA | $ | 433 | $ | 261 | $ | 155 | ||||||||||||||
| Share-based compensation | 2 | 4 | 6 | |||||||||||||||||
| Restructuring & realignment | 12 | 7 | 3 | |||||||||||||||||
| Special charges | — | 1 | — | |||||||||||||||||
| Gain from sale of business | — | (2) | — | |||||||||||||||||
| Adjusted EBITDA | $ | 447 | $ | 271 | $ | 164 | ||||||||||||||
| Adjusted EBITDA margin | 19.9 | % | 16.8 | % | 12.3 | % | ||||||||||||||
| 2022 versus 2021 | ||||||||||||||||||||
| (in millions) | Water Infrastructure | Applied Water Systems | Measurement & Control Solutions | |||||||||||||||||
| Operating Income (Loss) | $ | 31 | $ | 18 | $ | (10) | ||||||||||||||
| Gain from sale of business | — | (2) | 1 | |||||||||||||||||
| Depreciation | 1 | (3) | (5) | |||||||||||||||||
| Amortization | 1 | — | (3) | |||||||||||||||||
| Other non-operating expense | 1 | 1 | — | |||||||||||||||||
| EBITDA | $ | 34 | $ | 14 | $ | (17) | ||||||||||||||
| Share-based compensation | — | — | — | |||||||||||||||||
| Restructuring & realignment | (1) | 6 | 7 | |||||||||||||||||
| Special charges | — | (1) | 14 | |||||||||||||||||
| Gain from sale of business | — | 2 | (1) | |||||||||||||||||
| Adjusted EBITDA | $ | 33 | $ | 21 | $ | 3 | ||||||||||||||
| Adjusted EBITDA margin | 0.4 | % | (0.3) | % | (0.3) | % | ||||||||||||||
Water Infrastructure
Operating income was $418 million for our Water Infrastructure segment increased $6(operating margin of 17.7%) during 2022, an increase of $31 million, or 1.7%8.0%, when compared to operating income of $387 million (operating margin of 17.2%) during 2019the prior year, or a total increase of 50 basis points. Operating margin expansion included favorable impacts of 20 basis points from a decrease in restructuring and realignment costs as compared to the prior year, withyear. Additionally, operating margin also increasingexpansion included 940 basis points from 16.5% to 16.8%. Operating margin was negatively impacted year-over-yearfavorable operating impacts, driven by increased restructuring and realignment costs560 basis points of $11 million and positively impacted by special charges of $2 million incurred in 2018 that did not recur in 2019. Excluding these items, adjusted operating income increased $15 million, or 3.9%, with adjusted operating margin increasing from 17.5% to 18.2%. The increase in adjusted operating margin was primarily due to cost reductions from our global procurement and productivity initiatives, price realization, 270 basis points from productivity savings and 110 basis points of favorable volume, which were partiallyvolume. Margin expansion was offset by cost910 basis points of unfavorable impacts driven by 560 basis points of inflation, unfavorable mix, increased cost of quality and220 basis points due to increased spending on strategic investments.
Adjusted EBITDA was $480 million (adjusted EBITDA margin of 20.3%) during 2022, an increase of $33 million, or 3.3%7.4%, withwhen compared to adjusted operatingEBITDA of $447 million (adjusted EBITDA margin increasing from 16.0% to 16.5%.of 19.9%) during the prior year. The increase in adjusted operatingEBITDA margin was primarily due to cost reductionsthe same factors impacting the increase in adjusted operating margin.
51
Applied Water
Operating income was $258 million for our Applied Water segment (operating margin of 14.6%) during 2022, an increase of $18 million, or 7.5%, when compared to operating income of $240 million (operating margin of 14.9%) during the prior year, or a total decrease of 30 basis points. Operating margin declines included unfavorable impacts of 20 basis points from our global procurementan increase in restructuring and productivity initiativesrealignment costs and price realization, which were partially offsetspecial charges as compared to the prior year. Additionally, operating margin decline included 1290 basis points of unfavorable operating impacts, driven by cost880 basis points of inflation, including tariffs, increased cost110 basis points of quality, unfavorable mix, unfavorable volume and increased spending on strategic investments.investments, 120 basis points of increased inventory management costs and 40 basis points of unfavorable mix. Margin declines were offset by 1280 basis points from favorable operating impacts, which were driven by 930 basis points of price realization, 340 basis points from productivity savings and 10 basis points from favorable volume. Excluding special charges and restructuring and realignment costs, adjusted operating income was $271 million (adjusted operating margin of 15.3%) during 2022 as compared to adjusted operating income of $248 million (adjusted operating margin of 15.4%) during the prior year.
Adjusted EBITDA was $292 million (adjusted EBITDA margin of 16.5%) during 2022, an increase of $21 million, or 7.7%, when compared to adjusted EBITDA of $271 million (adjusted EBITDA margin of 16.8%) during the prior year. The decrease in adjusted EBITDA margin was primarily due to the same factors impacting the decrease in adjusted operating margin.
Measurement & Control Solutions
Operating income was $2 million for our Measurement & Control Solutions segment decreased $185(operating margin of 0.1%) during 2022, a decrease of $10 million, or 156.8%83.3%, when compared to operating income of $12 million (operating margin of 0.9%) during 2019the prior year, or a total decrease of 80 basis points. Operating margin declines included unfavorable impacts of 160 basis points from an increase in special charges (asset impairment) and restructuring and realignment costs as compared to the prior year, with operating margin also decreasing from 7.9% to (4.4)%.year. Operating margin was negatively impactedimpacts included 790 basis points from favorable operating impacts consisting of 450 basis points of price realization, 230 basis points from productivity savings and 70 basis points from favorable volume. Favorable impacts were offset by 710 basis points of unfavorable impacts driven by 520 basis points of inflation, 100 basis points of higher performance related incentive costs and 40 basis points of increased spending on strategic investments. Excluding special charges of $154 million, consisting entirely of non-cash impairment charges, and increased restructuring and realignment costs, of $20 million during the year. Excluding these items, adjusted operating income decreased $11was $26 million (adjusted operating margin of 1.9%) during 2022 as compared to adjusted operating income of $15 million (adjusted operating margin of 1.1%) during the prior year.
Adjusted EBITDA was $167 million (adjusted EBITDA margin of 12.0%) during 2022, an increase of $3 million, or 7.8%1.8%, withwhen compared to adjusted operatingEBITDA of $164 million (adjusted EBITDA margin decreasing from 9.4% to 8.5%.of 12.3%) during the prior year. The decrease in adjusted operatingEBITDA margin was primarily due to cost inflation, increased spending on strategic investmentsthe same factors as those impacting the increase in adjusted operating margin; however, adjusted EBITDA margin did not benefit from a year over year reduction in depreciation and unfavorable mix impacts. Purchase accounting impacts from acquisitions also negatively affected operating margin. These impacts were partially offset by cost reductions from our global procurement and productivity initiatives, favorable volume impacts and price realization.amortization expense.
Corporate and other
Operating loss for corporate and other decreased $6increased $2 million, or 10.2%, compared to the prior year, primarily due to $5 million of special charges incurred during 2018 that did not recur. Excluding these costs, adjusted operating expense decreased $1 million, or 1.9%3.7%, compared to the prior year. The increase in operating loss for the year was primarily due to higher performance related incentive costs.
Interest Expense
Interest expense was $67$50 million and $82$76 million for 20192022 and 2018,2021, respectively. The decrease in interest expense for the year iswas primarily driven by the impact of cross currency swaps during the year and, to a lesser extent, additional interest expense that was incurred during 20182021 related to debtour 4.875% Senior Notes due 2021 that were paid off in October 2021 and interest income related to fund our acquisition of Pure Technologies Ltd., which was repaidadditional net investment hedges executed in during 2019.2022. See Note 13, "Derivative Financial Instruments" of our consolidated financial statements for a description of our cross currency swaps. See Note 15,14, "Credit Facilities and Debt", of our consolidated financial statements for a description of our credit facilities and long-term debt and related interest.
U.K. Pension Settlement Expense
The Company initiated the process for a full buy-out of its largest defined benefit plan in the U.K. in 2019. During the first quarter of 2020, the Company purchased a bulk annuity policy as a plan asset to facilitate the termination and buy-out of the plan. The buy-out was completed in September 2022, at which point the remaining benefit obligations were transferred to the insurer and we were relieved of any further obligation. As a result, we recorded a pension settlement charge of £123 million (approximately $140 million) in the third quarter of 2022, primarily consisting of unrecognized actuarial losses. Refer to Note 15, "Post-retirement Benefit Plans", of our consolidated financial statements for additional information.
52
Income Tax Expense
The income tax provision for 20192022 was $15$85 million at an effective tax rate of 3.7%19.2% as compared to $36$84 million at an effective tax rate of 6.1%16.3% in 2018.2021. The 20192022 effective tax rate differs from that of 20182021 primarily due to the income tax benefit that resulted from changes in tax law in Switzerland partially offset by the tax impact of the goodwill impairment charge onhigher U.S. domestic pre-tax income before taxes in 2019.
Liquidity and Capital Resources
The following table summarizes our sources and uses of cash:
| Year Ended December 31, | Year Ended December 31, | |||||||||||||||||||||||||||
| (in millions) | 2019 | 2018 | Change | (in millions) | 2022 | 2021 | Change | |||||||||||||||||||||
| Operating activities | $ | 839 | $ | 586 | $ | 253 | Operating activities | $ | 596 | $ | 538 | $ | 58 | |||||||||||||||
| Investing activities | (231 | ) | (643 | ) | 412 | Investing activities | (191) | (183) | (8) | |||||||||||||||||||
| Financing activities | (177 | ) | (40 | ) | (137 | ) | Financing activities | (790) | (855) | 65 | ||||||||||||||||||
| Foreign exchange (a) | (3 | ) | (21 | ) | 18 | Foreign exchange (a) | (20) | (26) | 6 | |||||||||||||||||||
| Total | $ | 428 | $ | (118 | ) | $ | 546 | Total | $ | (405) | $ | (526) | $ | 121 | ||||||||||||||
(a)The decrease in negative impact of foreign exchange as compared to 2021 is primarily due to strengthening of the Euro partially offset by weakening of the Chinese Yuan.
Sources and Uses of Liquidity
Operating Activities
During 2019,2022, net cash provided by operating activities was $839$596 million, compared to $586$538 million in 2018.2021. The $253$58 million year-over-year increase was primarily driven by improvement inhigher customer prepayments, timing of employee benefit payments and lower interest payments. Higher working capital levels, due to the improved management of inventory and collection of receivables, increase in cash from earnings and decreased payments for post-retirement obligations during the period, which werereflecting increased sales, partially offset by an increase in cash tax payments.these items.
Investing Activities
Cash used in investing activities was $231$191 million in 2019,2022, compared to $643$183 million in 2018.2021. This decreaseincrease in cash used of $412$8 million was mainly driven by cash paid for investments, the $433 million spent on 2018 acquisitions, primarily the acquisitionsettlement of Pure Technologies Ltd., versus the $18 million spent for acquisition activity during the current yeara currency forward agreement and modestly lower spending on capital expenditures compared to the prior year. This decrease isreduced proceeds from sales of businesses. Cash received from cross-currency swaps and cash investments partially offset by $22 million of proceeds received for a divested business in 2018.the increased outflow.
Financing Activities
Cash used byin financing activities was $177$790 million in 2019,2022, compared to $40$855 million in 2018.2021. The increaseyear-over-year decrease in cash used during the year was primarily due to higher levelsmainly driven by lower debt repayments and reduced repurchases of short-term debt related to acquisition financing in 2018common stock. Higher dividend payments and an increase in dividends paid of $22 million during the period as compared to the prior year. These drivers arelower proceeds from employee stock options partially offset by the higher net repayment of $120 million of long-term debt in the prior year and a decrease in share repurchase activity of $19 million as compared to the prior year.these items.
Funding and Liquidity Strategy
Our ability to fund our capital needs depends on our ongoing ability to generate cash from operations and access to bank financing and the capital markets. We continually evaluate aspects of our spending, including capital expenditures, strategic investments and dividends.
Historically, we have generated operating cash flow sufficient to fund our primary cash needs centeredneeds. We currently do not expect any significant impact to our capital and financial resources from the COVID-19 pandemic, including our overall liquidity position based on operating activities, workingour available cash and cash equivalents and our access to credit facilities and the capital capital expenditures, strategic investments and dividends. markets, however we continue to monitor the ongoing impacts of the pandemic.
If our cash flows from operations are less than we expect, we may need to incur debt or issue equity. From time to time, we may need to access the long-term and short-term capital markets to obtain financing. Our access to, and the availability of, financing on acceptable terms and conditions in the future will be impacted by many factors, including: (i) our credit ratings or absence of a credit rating, (ii) the liquidity of the overall capital
markets, and (iii) the current state of the economy. There can be no assurance that such financing will be available to us on acceptable terms or that such financing will be available at all. Our securities are rated investment grade. A significant change in credit rating could impact our ability to borrow at favorable rates. See Note 14, "Credit Facilities and Debt", of our consolidated financial statements for a description of our credit facilities and long-term debt and a description of limitations on obtaining additional funding.
53
We monitor our global funding requirements and seek to meet our liquidity needs on a cost effectivecost-effective basis. Based on our current global cash positions, cash flows from operations and access to the commercial paper markets, we believe there is sufficient liquidity to meet our funding requirements. In addition, our existing committed credit facilities and access to the public debt markets would provide further liquidity if required.
Risk related to these items are described in our risk factor disclosures referenced under “Item 1A. Risk Factors".
In the fourth quarter of 2022, the Company entered into an agreement with Idrica, a leader in water data management and analytics, to distribute Idrica’s GoAigua technology globally and take a minority stake in Idrica. Subject to customary closing conditions and regulatory clearance, Xylem expects to fund the investment with cash on hand for approximately €100 million in the first half of 2023.
Contractual Obligations
Material contractual obligations arising in the normal course of business primarily consist of debt obligations and related interest payments, lease obligations and unconditional purchase obligations. Refer Note 14, “Credit Facilities and Debt” and Note 10, “Leases” of the consolidated financial statements for related to these matters.
The Company has future unconditional purchase commitments which are legally binding and that specify all significant terms including price and/or quantity. Total future commitments within the next twelve months.months for these obligations is $421 million, excluding contracts that can be canceled without penalty.
Credit Facilities & Long-Term Contractual Commitments
See Note 15,14, "Credit Facilities and Debt" of our consolidated financial statements for a description of our credit facilities and long-term debt.
Non-U.S. Operations
| (in millions) | 2020 | 2021 - 2022 | 2023 - 2024 | Thereafter | Total | ||||||||||||||
| Debt obligations (1) | $ | 276 | $ | 600 | $ | 557 | $ | 900 | $ | 2,333 | |||||||||
| Interest payments (1) (2) | 76 | 122 | 80 | 418 | 696 | ||||||||||||||
| Lease obligations (3) | 65 | 87 | 50 | 62 | 264 | ||||||||||||||
| Purchase obligations (4) | 95 | 7 | — | — | 102 | ||||||||||||||
| Other long-term obligations reflected on the balance sheet | 1 | 23 | 23 | 8 | 55 | ||||||||||||||
| Total commitments | $ | 513 | $ | 839 | $ | 710 | $ | 1,388 | $ | 3,450 | |||||||||
Critical Accounting Estimates
The preparation of financial statements in conformity with GAAP requires management to make estimates and assumptions that affect the reported amounts of assets, liabilities, revenue and expenses, and the disclosure of contingent liabilities. Management bases its estimates on historical experience and on various other assumptions that it believes to be reasonable under the circumstances, the results of which form the basis for making judgments about the carrying values of assets and liabilities that are not readily apparent from other sources.
54
Significant accounting policies used in the preparation of the Consolidated Financial Statementsconsolidated financial statements are discussed in Note 1, “Summary of Significant Accounting Policies,” of the consolidated financial statements. Accounting estimates and assumptions discussed in this section are those that we consider most critical to an understanding of our financial statements because they are inherently uncertain, involve significant judgments, include areas where different estimates reasonably could have been used, and changes in the estimateestimates that are reasonably possible could materially impact the financial statements. Management believes that the accounting estimates employed and the resulting balances are reasonable; however, actual results in these areas could differ from management’s estimates under different assumptions or conditions.
Revenue Recognition. Xylem adopted the new guidance on recognizing revenue from contracts with customers as of January 1, 2018. In accordance with this new guidance Xylem recognizes revenue in a manner that depicts the transfer of promised goods and services to customers in an amount that reflects the consideration to which it expects to be entitled to for providing those goods and services. For each arrangement with a customer, we identify the contract and the associated performance obligations within the contract, determine the transaction price of that contract, allocate the transaction price to each performance obligation and recognize revenue as each performance obligation is satisfied.
The satisfaction of performance obligations in a contract is based upon when the customer obtains control over the asset. Depending on the nature of the performance obligation, control transfers either at a particular point in time, or over time, which determines the recognition pattern of revenue.
For product sales, other than long-term construction-type contracts, we recognize revenue once control has passed at a point in time, which is generally when products are shipped. In instances where contractual terms include a provision for customer acceptance, revenue is recognized when either (i) we have previously demonstrated that the product meets the specified criteria based on either seller or customer specifiedcustomer-specified objective criteria or (ii) upon formal acceptance received from the customer where the product has not been previously demonstrated to meet customer specifiedcustomer-specified objective criteria. We recognize revenue on product sales to channel partners, including resellers, distributors or value-added solution providers, at the point in time when the risks and rewards, possession, and title have transferred to the customer, which usually occurs at the point of delivery.
Revenue from performance obligations related to services is primarily recognized over time, as the performance obligations are satisfied. In these instances, the customer consumes the benefit of the service as Xylem performs.
Certain businesses also enter into long-term construction-type sales contracts where revenue is recognized over time. In these instances, revenue is recognized using a measure of progress that applies an input method based on costs incurred in relation to total estimated costs. We also recognize revenue for certain of these arrangements using the output method and measure progress based on shipments of product where control has transferred to the customer.
For all contracts with customers, we determine the transaction price in the arrangement and allocate the transaction price to each performance obligation identified in the contract. Judgment is required to determine the appropriate unit of account, and we separate out the performance obligations if they are capable of being distinct and if they are distinct within the context of the contract. The transaction price is adjusted for our estimate of variable consideration, which may include a right of return, discounts, rebates, penalties and retainage. To estimate variable consideration, we apply the expected value or the most likely amount method, based on whichever method most appropriately predicts the amount of consideration we expect to be entitled to. The method applied is typically based on historical experience and known trends. We constrain the amounts of variable consideration that are included in the transaction price, to the extent that it is probable that a significant reversal in the amount of cumulative revenue recognized will not occur or when uncertainties around the variable consideration are resolved.
Income Taxes. Deferred tax assets and liabilities are determined based on temporary differences between the financial reporting and tax bases of assets and liabilities, applying enacted tax rates in effect for the year in which we expect the differences will reverse. Based on the evaluation of available evidence, we recognize future tax benefits, such as net operating loss carryforwards, to the extent that we believe it is more likely than not we will realize these benefits. We periodically assess the likelihood that we will be able to recover our deferred tax assets and reflect any changes to our estimate of the amount we are more likely than not to realize in the valuation allowance, with a corresponding adjustment to earnings or other comprehensive income, as appropriate.
In assessing the need for a valuation allowance, we look to the future reversal of existing taxable temporary differences, taxable income in carryback years and the feasibility of tax planning strategies and estimated future taxable income. The valuation allowance can be affected by changes to tax laws, changes to statutory tax rates and changes to future taxable income estimates.
55
We have recorded net foreign withholding taxes and state income taxes on earnings that are expected to be repatriated to the U.S. parent. We have not recorded any deferred taxes on the amounts that the Company currently does not intend to repatriate as therepatriate. The determination of any deferred taxes on this amount is not practicable.
The calculation of our tax liabilities involves dealing with uncertainties in the application of complex tax regulationslaws in a multitude of jurisdictions across our global operations. We recognize potential liabilities and record tax liabilities for anticipated tax audit issues in the U.S. and other tax jurisdictions based on our estimate of whether, and to the extent to which, additional taxes will be due. Furthermore, we recognize the tax benefit from an uncertain tax position only if based on the technical merits of the position it is more likely than not that the tax position will be sustained on examination by the taxing authorities or upon completion of the litigation process, based on the technical merits of the position.process. The tax benefits recognized in the financial statements from such a position are measured based on the largest benefit that has a greater than 50% likelihood of being realized upon ultimate resolution.
We adjust our liability for uncertain tax positions in light of changing facts and circumstances; however, due to the complexity of some of these uncertainties, the ultimate resolution may result in a payment that is materially different from our current estimate of the tax liabilities. If our estimate of tax liabilities proves to be less than the ultimate assessment, an additional tax expense would result. If a payment of these amounts ultimately proves to be less than the recorded amounts, the reversal of the liabilities would result in tax benefits being recognized in the period when we determine the liabilities are no longer necessary.
Business Combinations. We record acquisitions using the purchase method of accounting. All of the assets acquired, liabilities assumed, contractual contingencies and contingent consideration is recorded at fair value as of the acquisition date. The excess of the purchase price over the estimated fair values of the net tangible and intangible assets acquired is recorded as goodwill. The application of the purchase method of accounting for business combinations requires management to make significant estimates and assumptions in the determination of the fair value of assets acquired and liabilities assumed, in order to properly allocate purchase price consideration between assets that are depreciated and amortized from goodwill. These assumptions and estimates include a market participant’s use of the asset and the appropriate discount rates for a market participant. Our estimates are based on historical experience, information obtained from the management of the acquired companies and, when appropriate, includes assistance from independent third-party appraisal firms. Significant assumptions and estimates include, but are not limited to, the cash flows that an asset is expected to generate in the future, the cost to build/recreate certain technology, the appropriate weighted-average cost of capital, and the cost savings expected to be derived from acquiring an asset. These estimates are inherently uncertain and
unpredictable. In addition, unanticipated events and circumstances may occur which may affect the accuracy or validity of such estimates.
Goodwill and Intangible Assets. We review goodwill and indefinite-lived intangible assets for impairment annually and whenever events or changes in circumstances indicate the carrying value of an asset may not be recoverable. We also review the carrying value of our finite-lived intangible assets for potential impairment when impairment indicators arise. We conduct our annual impairment test as of the first day of the fourth quarter. For goodwill, the estimated fair value of each reporting unit is compared to the carrying value of the net assets assigned to that reporting unit. If the estimated fair value of the reporting unit exceeds its carrying value, goodwill is not impaired. If the carrying value of the reporting unit exceeds its estimated fair value, then an impairment charge is recognized for that excess up to the amount of recorded goodwill. We estimate the fair value of our reporting units using an income approach. We estimate the fair value of our intangible assets with indefinite lives using either the income approach or the market approach. Under the income approach, we calculate fair value based on the present value of estimated future cash flows. Under the market approach, we calculate fair value based on recent sales and selling prices of similar assets.
Determining the fair value of a reporting unit or an indefinite-lived intangible asset is judgmental in nature and involves the use of significant estimates and assumptions, particularly related to future operating results and cash flows. These estimates and assumptions include, but are not limited to, revenue growth rates and operating margins used to calculate projected future cash flows, risk-adjusted discount rates, assumed royalty rates, future economic and market conditions and identification of appropriate market comparable data. In addition, the identification of reporting units and the allocation of assets and liabilities to the reporting units when determining the carrying value of each reporting unit also require judgment. Goodwill is tested for impairment at either the operating segment identified in Note 22,21, “Segment and Geographic Data,” of the consolidated financial statements, or one level below. The fair value of our reporting units and indefinite-lived intangible assets is based on estimates and assumptions that are believed to be reasonable. Significant changes to these estimates and assumptions could adversely impact our conclusions. Actual future results may differ from those estimates.
56
During the fourth quarter of 2019,2022, we performed our annual impairment assessment and determined that the estimated fair values of our goodwill reporting units were substantially in excess of each of their carrying values. However, future goodwill impairment tests could result in a charge to earnings. We will continue to evaluate goodwill on an annual basis as of the beginning of our fourth quarter and whenever events and changes in circumstances require us to do so. We determined that no material impairment of the indefinite-lived intangibles existed as of the measurement date in 2019.2022. However, future indefinite-lived intangible impairment tests could result in a charge to earnings. We will continue to evaluate indefinite-lived intangibles on an annual basis as of the beginning of our fourth quarter and whenever events and changes in circumstances indicate there may be a potential impairment.
basis only to the extent they exceed 10% of the higher of the market-related value or projected benefit obligation, over the average remaining service period of active plan participants, or for plans with all or substantially all inactive participants, over the average remaining life expectancy.
Significant Assumptions
Management develops each assumption using relevant Company experience, in conjunction with market-related data for each individual country in which such plans exist. All assumptions are reviewed annually with third-party consultants and are adjusted as necessary. The table included below provides the weighted average assumptions used to estimate our defined benefit pension obligations and costs as of and for the years ended 20192022 and 2018.2021.
| 2022 | 2021 | ||||||||||||||||||||||
| U.S. | Int’l | U.S. | Int’l | ||||||||||||||||||||
| Benefit Obligation Assumptions | |||||||||||||||||||||||
| Discount rate | 5.25 | % | 4.13 | % | 3.00 | % | 1.55 | % | |||||||||||||||
| Rate of future compensation increase | NM | 2.79 | % | NM | 2.84 | % | |||||||||||||||||
| Net Periodic Benefit Cost Assumptions | |||||||||||||||||||||||
| Discount rate | 3.00 | % | 1.55 | % | 2.50 | % | 1.06 | % | |||||||||||||||
| Expected long-term return on plan assets | 5.50 | % | 2.79 | % | 6.50 | % | 2.60 | % | |||||||||||||||
| Rate of future compensation increase | NM | 2.84 | % | NM | 2.79 | % | |||||||||||||||||
| 2019 | 2018 | ||||||||||
| U.S. | Int’l | U.S. | Int’l | ||||||||
| Benefit Obligation Assumptions | |||||||||||
| Discount rate | 3.25 | % | 1.80 | % | 4.50 | % | 2.60 | % | |||
| Rate of future compensation increase | NM | 2.94 | % | NM | 2.92 | % | |||||
| Net Periodic Benefit Cost Assumptions | |||||||||||
| Discount rate | 4.50 | % | 2.60 | % | 3.75 | % | 2.43 | % | |||
| Expected long-term return on plan assets | 7.75 | % | 6.96 | % | 8.00 | % | 7.23 | % | |||
| Rate of future compensation increase | NM | 2.92 | % | NM | 2.93 | % | |||||
We determine the expected long-term rate of return on plan assets by evaluating both historical returns and estimates of future returns. Specifically, the Company analyzes the estimated future returns based on independent estimates of asset class returns and evaluates historical broad market returns over long-term timeframes based on the strategic asset allocation, which is detailed in Note 16, “Postretirement15, “Post-retirement Benefit Plans,” of the consolidated financial statements.
| 2019 | 2018 | ||||
| Expected long-term rate of return on plan assets | 7.09 | % | 7.34 | % | |
| Actual rate of return on plan assets | 12.59 | % | (3.85 | )% | |
For the recognition of net periodic pension cost, the calculation of the expected return on plan assets is generally derived by applying the expected long-term rate of return to the market-related value of plan assets. The market-related value of plan assets is based on average asset values at the measurement date over the last five years. The use of fair value, rather than a calculated value, could materially affect net periodic pension cost. The weighted average expected long-term rate of return for all of our plan assets to be used in determining net periodic benefit costs for 20202023 is estimated at 3.46%5.90%. We estimate that every 25 basis point change in the expected return on plan assets impacts the expense by less than $1 million.
The discount rate reflects our expectation of the present value of expected future cash payments for benefits at the measurement date. A decrease in the discount rate increases the present value of benefit obligations and increases pension expense. We base the discount rate assumption on current investment yields of high-quality fixed income investments during the retirement benefits maturity period. The pension discount rate was determined by considering an interest rate yield curve comprising AAA/AA bonds, with maturities between zero and 30 years, developed by the plan’s actuaries. Annual benefit payments are then discounted to present value using this yield
57
curve to develop a single-point discount rate matching the plan’s characteristics. Our weighted average discount rate for all pension plans effective January 1, 2020,2023, is 1.97%4.35%. We estimate that every 25 basis point change in the discount rate impacts the expense byby less than $1 million.
The rate of future compensation increase assumption reflects our long-term actual experience and future and near-term outlook. Effective January 1, 2020,2023, our expected rate of future compensation is 3.04%2.94% for all pension plans. The estimated impact of a 25 basis point change in the expected rate of future compensation is less than $1 million.
The assumed rateCompany initiated the process for a full buy-out of future increasesits largest defined benefit plan in the per capita costU.K. in 2019. During the first quarter of health care (the health care trend rate) is 6.53% for 2020, decreasing ratablythe Company purchased a bulk annuity policy as a plan asset to 4.50%facilitate the termination and buy-out of the plan. The buy-out was completed in 2028. An increase or decreaseSeptember 2022, at which point the remaining benefit obligations were transferred to the insurer and we were relieved of any further obligation. As a result, we recorded a pension settlement charge of £123 million (approximately $140 million), primarily consisting of unrecognized actuarial losses. The settlement also resulted in the health care trend rates by one percent
We currently anticipate making contributions to our pension and postretirementpost-retirement benefit plans in the range of $15$18 million to $25$26 million during 2020, of which2023. Approximately $5 million isof contributions are expected to be made in the first quarter.
Funded Status
Funded status is derived by subtracting the respective year-end values of the projected benefit obligations from the fair value of plan assets. We estimate that every 25 basis point change in the discount rate impacts the funded status by approximately $33$10 million.
Fair Value of Plan Assets
The plan assets of our pension plans comprise a broad range of investments, including domestic and foreign equity securities, interests in private equity and hedge funds, fixed income investments, insurance contracts, and cash and cash equivalents.
A portion of our pension benefit plan assets portfolio comprises investments in private equity and hedge funds. The private equity and hedge fund investmentsfunds which are generally measured at net asset value. However, in certain instances, the values reported by the asset managers were not current at the measurement date. Accordingly, we made estimate adjustments to the last reported value where necessary to measure the assets at fair value at the measurement date. These adjustments consider information received from the asset managers, as well as general market information. The adjustment recorded at December 31, 20192022 and 20182021 for these assets represented less than one percent1% of total plan assets in each respective year. Asset values for other positions were generally measured using market observable prices. We estimate that a 5% change in asset values will impact funded status by approximately $28$10 million.
New Accounting Pronouncements
See Note 2, “Recently Issued Accounting Pronouncements,” of the consolidated financial statements for a complete discussion of recent accounting pronouncements.
58
ITEM 7A.7A. QUANTITATIVE AND QUALITATIVE DISCLOSURES ABOUT MARKET RISK
We are exposed to market risk, primarily related to foreign currency exchange rates and interest rates. These exposures are actively monitored by management. Our exposure to foreign exchange rate risk is due to certain costs, revenue and borrowings being denominated in currencies other than one of our subsidiaries' functional currency. Similarly, we are exposed to market risk as thea result of changes in interest rates which may affect the cost of our financing. It is our policy and practice to use derivative financial instruments only to the extent necessary to manage exposures.
Foreign Currency Exchange Rate Risk
Our economic foreign currency risk primarily relates to receipts from customers, payments to suppliers and intercompany transactions denominated in foreign currencies. We may use derivative financial instruments to offset risk related to receipts from customers and payments to suppliers, when it is believed that the exposure will not be limited by our normal operating and financing activities. We enter into currency forward contracts periodically in order to manage the exchange rate fluctuation risk on certain intercompany transactions associated with third-party sales and purchases. These risks are also mitigated by natural hedges including the presence of manufacturing facilities outside the United States,U.S., global sourcing and other spending which occurs in foreign countries. Our principal foreign currency transaction exposures primarily relate to the Euro, Swedish Krona, Polish Zloty,British Pound, Canadian Dollar, British Pound,Australian Dollar, and Australian Dollar.Polish Zloty. We estimate that a hypothetical 10% movement in foreign currency exchange rates would not have a material economic impact to Xylem’s financial position and results of operations.
Additionally, we are subject to foreign exchange translation risk due to changes in the value of foreign currencies in relation to our reporting currency, the U.S. Dollar. The translation risk is primarily concentrated in the exchange rate between the U.S. Dollar and the Euro, Chinese Yuan, British Pound, Canadian Dollar, Australian Dollar, Swedish Krona and Australian Dollar.Indian Rupee. As the U.S. Dollar strengthens against other currencies in which we transact business, revenue and income will generally be negatively impacted, and if the U.S. Dollar weakens, revenue and income will generally be positively impacted. We expect to continue to generate significant revenue from non-U.S. operations and we expect our cash will be predominately held by our foreign subsidiaries. We expect to manage our worldwide cash requirements considering available funds among the many subsidiaries through which we conduct business and the cost effectiveness with which those funds can be accessed. We may transfer cash from certain international subsidiaries to the U.S. and other international subsidiaries when it is cost effective to do so, though we continually review our domestic and foreign cash profile, expected future cash generation and investment opportunities and reassess whether there is a need to repatriate funds held internationally to support our U.S. operations. We also hedge our investment in certain foreign subsidiaries via the use of cross currency swaps and the designation of our 2.25% Senior Notes of €500 million aggregate principal amount due March 2023 as a net investment hedge.cross-currency swaps. Accordingly, we estimate that a 10% movement of the U.S. Dollar to various foreign currency exchange rates we translate from, in aggregate would not have a material economic impact on our financial position and results of operations.
Interest Rate Risk
As of December 31, 2019,2022, our long-term debt portfolio is primarily comprised of four series of fixed-rate senior notes that total $2.1approximately $1.9 billion. The senior notes are not exposed to interest rate risk as the bonds are at a fixed rate until maturity. Based on the current interest rate market we do not anticipate material risk associated with our debt refinancing within the target time frame of maturity.
Commodity Price Exposures
For a discussion of risks relating to commodity prices, refer to “Item 1A. Risk Factors.”
59
ITEM 8. FINANCIAL STATEMENTS AND SUPPLEMENTARY DATA
INDEX TO CONSOLIDATED FINANCIAL STATEMENTS
| Page No. | |||||
| Audited Consolidated Financial Statements: | |||||
Report of Independent Registered Public Accounting Firm (PCAOB ID No. 34) | |||||
| Notes to Consolidated Financial Statements: | |||||
60
REPORT OF INDEPENDENT REGISTERED PUBLIC ACCOUNTING FIRM
To the Stockholders and the Board of Directors of
Xylem Inc.
Opinion on the Financial Statements
We have audited the accompanying consolidated balance sheets of Xylem Inc. and subsidiaries (the "Company") as of December 31, 20192022 and 2018,2021, the related consolidated statements of income, comprehensive income, stockholders’stockholders' equity, and cash flows, for each of the three years in the period ended December 31, 2019,2022, and the related notes (collectively referred to as the "financial statements"). In our opinion, the financial statements present fairly, in all material respects, the financial position of the Company as of December 31, 20192022 and 2018,2021, and the results of its operations and its cash flows for each of the three years in the period ended December 31, 2019,2022, in conformity with accounting principles generally accepted in the United States of America.
We have also audited, in accordance with the standards of the Public Company Accounting Oversight Board (United States) (PCAOB), the Company's internal control over financial reporting as of December 31, 2019,2022, based on criteria established in Internal Control -— Integrated Framework (2013) issued by the Committee of Sponsoring Organizations of the Treadway Commission and our report dated February 28, 2020,24, 2023, expressed an unqualified opinion on the Company's internal control over financial reporting.
Basis for Opinion
These financial statements are the responsibility of the Company's management. Our responsibility is to express an opinion on the Company's financial statements based on our audits. We are a public accounting firm registered with the PCAOB and are required to be independent with respect to the Company in accordance with the U.S. federal securities laws and the applicable rules and regulations of the Securities and Exchange Commission and the PCAOB.
We conducted our audits in accordance with the standards of the PCAOB. Those standards require that we plan and perform the audit to obtain reasonable assurance about whether the financial statements are free of material misstatement, whether due to error or fraud. Our audits included performing procedures to assess the risks of material misstatement of the financial statements, whether due to error or fraud, and performing procedures that respond to those risks. Such procedures included examining, on a test basis, evidence regarding the amounts and disclosures in the financial statements. Our audits also included evaluating the accounting principles used and significant estimates made by management, as well as evaluating the overall presentation of the financial statements. We believe that our audits provide a reasonable basis for our opinion.
Critical Audit Matter
The critical audit matter communicated below is a matter arising from the current-period audit of the financial statements that was communicated or required to be communicated to the audit committee and that (1) relates to accounts or disclosures that are material to the financial statements and (2) involved our especially challenging, subjective, or complex judgments. The communication of critical audit matters does not alter in any way our opinion on the financial statements, taken as a whole, and we are not, by communicating the critical audit matter below, providing a separate opinion on the critical audit matter or on the accounts or disclosures to which it relates.
Goodwill - Advanced Infrastructure AnalyticsM&CS Reporting UnitUnits - Refer to Note 1211 to the financial statements
Critical Audit Matter Description
61
To determine the fair value of the AIAM&CS reporting unit,units, the Company used the income approach. Under the income approach, the fair value of the AIAM&CS reporting unitunits was based on the discounted value of the estimated cash flows that the reporting unit is expected to generate. Cash flow projections were based on management’s estimates of
revenue growth rates and operating margins, taking into consideration industry and market conditions. The discount rate was based on the weighted average cost of capital appropriate for the AIAM&CS reporting unit.units.
Given the significant judgments made by management to estimate the fair value of AIA,the M&CS reporting units, performing audit procedures to evaluate the reasonableness of management’s estimates and assumptions related to the selection of the discount rate and forecasts of future revenue required a high degree of auditor judgment and an increased extent of effort, including the need to involve our fair value specialists
How the Critical Audit Matter Was Addressed in the Audit
Our audit procedures related to forecasts of future revenue and operating margin and selection of the discount rate for AIAthe M&CS reporting units included the following, among others:
•We tested the effectiveness of controls over management’s goodwill impairment evaluation, including those over the determination of the fair value of the AIAM&CS reporting unit and the measurement of the goodwill impairment,units, such as controls related to management’s forecasts of future revenue and the selection of the discount rate.
•We evaluated the reasonableness of management’s revenue forecasts by comparing the forecasts to:
–Historical revenues –Internal communications to management and |
–Information included in sales orders received to management’s forecasted growth in salesindustry reports and we tested the existence, accuracy and completeness of the underlying sales orders.certain peer company data.
•With the assistance of our fair value specialists, we evaluated the reasonableness of the (1) valuation methodology, (2) discount rate, and (3) long-term revenue growth rate, including testing the source information underlying the determination of the discount rate and long-term revenue growth rate, testing the mathematical accuracy of the calculation, and developing a range of independent estimates and comparing those to the discount rate and long-term revenue growth rate selected by management.
•Our fair value specialists also assisted in evaluating the reasonableness of the AIAM&CS reporting units fair value by considering comparable revenue valuationEBITDA multiples of peer companies.
/s/ Deloitte & Touche LLP
Stamford, Connecticut
February 28, 202024, 2023
We have served as the Company's auditor since 2010.
62
XYLEM INC. AND SUBSIDIARIES
CONSOLIDATED INCOME STATEMENTS
(In Millions, except per share data)
| Year Ended December 31, | 2022 | 2021 | 2020 | ||||||||||||||
| Revenue | $ | 5,522 | $ | 5,195 | $ | 4,876 | |||||||||||
| Cost of revenue | 3,438 | 3,220 | 3,046 | ||||||||||||||
| Gross profit | 2,084 | 1,975 | 1,830 | ||||||||||||||
| Selling, general and administrative expenses | 1,227 | 1,179 | 1,143 | ||||||||||||||
| Research and development expenses | 206 | 204 | 187 | ||||||||||||||
| Restructuring and asset impairment charges | 29 | 7 | 75 | ||||||||||||||
| Goodwill impairment charge | — | — | 58 | ||||||||||||||
| Operating income | 622 | 585 | 367 | ||||||||||||||
| Interest expense | 50 | 76 | 77 | ||||||||||||||
| U.K. pension settlement expense | 140 | — | — | ||||||||||||||
| Other non-operating income (expense), net | 7 | — | (5) | ||||||||||||||
| Gain on sale of businesses | 1 | 2 | — | ||||||||||||||
| Income before taxes | 440 | 511 | 285 | ||||||||||||||
| Income tax expense | 85 | 84 | 31 | ||||||||||||||
| Net income | $ | 355 | $ | 427 | $ | 254 | |||||||||||
| Earnings per share: | |||||||||||||||||
| Basic | $ | 1.97 | $ | 2.37 | $ | 1.41 | |||||||||||
| Diluted | $ | 1.96 | $ | 2.35 | $ | 1.40 | |||||||||||
| Weighted average number of shares: | |||||||||||||||||
| Basic | 180.2 | 180.2 | 180.1 | ||||||||||||||
| Diluted | 181.0 | 181.5 | 181.1 | ||||||||||||||
| Year Ended December 31, | 2019 | 2018 | 2017 | ||||||||
| Revenue | $ | 5,249 | $ | 5,207 | $ | 4,707 | |||||
| Cost of revenue | 3,203 | 3,181 | 2,860 | ||||||||
| Gross profit | 2,046 | 2,026 | 1,847 | ||||||||
| Selling, general and administrative expenses | 1,158 | 1,161 | 1,089 | ||||||||
| Research and development expenses | 191 | 189 | 181 | ||||||||
| Restructuring and asset impairment charges | 63 | 22 | 25 | ||||||||
| Goodwill impairment charge | 148 | — | — | ||||||||
| Operating income | 486 | 654 | 552 | ||||||||
| Interest expense | 67 | 82 | 82 | ||||||||
| Other non-operating (expense) income, net | (4 | ) | 13 | 6 | |||||||
| Gain (loss) on sale of businesses | 1 | — | (10 | ) | |||||||
| Income before taxes | 416 | 585 | 466 | ||||||||
| Income tax expense | 15 | 36 | 136 | ||||||||
| Net income | 401 | 549 | 330 | ||||||||
| Less: Net loss attributable to non-controlling interests | — | — | (1 | ) | |||||||
| Net income attributable to Xylem | $ | 401 | $ | 549 | $ | 331 | |||||
| Earnings per share: | |||||||||||
| Basic | $ | 2.23 | $ | 3.05 | $ | 1.84 | |||||
| Diluted | $ | 2.21 | $ | 3.03 | $ | 1.83 | |||||
| Weighted average number of shares: | |||||||||||
| Basic | 180.0 | 179.8 | 179.6 | ||||||||
| Diluted | 181.2 | 181.1 | 180.9 | ||||||||
See accompanying notes to consolidated financial statements.
63
XYLEM INC. AND SUBSIDIARIES
CONSOLIDATED STATEMENTS OF COMPREHENSIVE INCOME
(In Millions)
| Year Ended December 31, | 2022 | 2021 | 2020 | ||||||||||||||
| Net income | $ | 355 | $ | 427 | $ | 254 | |||||||||||
| Other comprehensive income (loss), before tax: | |||||||||||||||||
| Foreign currency translation adjustment | (53) | 20 | (23) | ||||||||||||||
| Net change in derivative hedge agreements: | |||||||||||||||||
| Unrealized gain (loss) | (24) | (10) | 9 | ||||||||||||||
| Amount of (gain) loss reclassified into net income | 21 | 4 | (3) | ||||||||||||||
| Net change in post-retirement benefit plans: | |||||||||||||||||
| Net gain (loss) | 101 | 51 | (78) | ||||||||||||||
| Prior service credit | — | — | 5 | ||||||||||||||
| Amortization of prior service credit cost | (2) | (3) | (3) | ||||||||||||||
| Amortization of net actuarial loss into net income | 12 | 23 | 19 | ||||||||||||||
| U.K. pension settlement | 137 | — | — | ||||||||||||||
| Foreign currency translation adjustment | 39 | 11 | (19) | ||||||||||||||
| Other comprehensive income (loss), before tax | 231 | 96 | (93) | ||||||||||||||
| Income tax (benefit) expense related to other comprehensive loss | 86 | 54 | (54) | ||||||||||||||
| Other comprehensive income (loss), net of tax | 145 | 42 | (39) | ||||||||||||||
| Comprehensive income | $ | 500 | $ | 469 | $ | 215 | |||||||||||
| Less: comprehensive (loss) gain attributable to noncontrolling interests | — | — | (1) | ||||||||||||||
| Comprehensive income attributable to Xylem | $ | 500 | $ | 469 | $ | 216 | |||||||||||
| Year Ended December 31, | 2019 | 2018 | 2017 | ||||||||
| Net income | $ | 401 | $ | 549 | $ | 330 | |||||
| Other comprehensive (loss) income, before tax: | |||||||||||
| Foreign currency translation adjustment | 28 | (85 | ) | 79 | |||||||
| Net change in derivative hedge agreements: | |||||||||||
| Unrealized (loss) gain | (14 | ) | (8 | ) | 9 | ||||||
| Amount of loss (gain) reclassified into net income | 12 | 4 | (5 | ) | |||||||
| Net change in postretirement benefit plans: | |||||||||||
| Net loss | (83 | ) | (37 | ) | (19 | ) | |||||
| Prior service credit | — | — | 1 | ||||||||
| Amortization of prior service credit cost | (4 | ) | (4 | ) | (3 | ) | |||||
| Amortization of net actuarial loss into net income | 12 | 13 | 13 | ||||||||
| Settlement | 9 | 1 | 1 | ||||||||
| Foreign currency translation adjustment | (3 | ) | 15 | (18 | ) | ||||||
| Other comprehensive (loss) income, before tax | (43 | ) | (101 | ) | 58 | ||||||
| Income tax (benefit) expense related to other comprehensive loss | (5 | ) | 10 | (50 | ) | ||||||
| Other comprehensive (loss) income, net of tax | (38 | ) | (111 | ) | 108 | ||||||
| Comprehensive income | $ | 363 | $ | 438 | $ | 438 | |||||
| Less: comprehensive gain (loss) attributable to noncontrolling interests | 1 | (2 | ) | — | |||||||
| Comprehensive income attributable to Xylem | $ | 362 | $ | 440 | $ | 438 | |||||
See accompanying notes to consolidated financial statements.
64
XYLEM INC. AND SUBSIDIARIES
CONSOLIDATED BALANCE SHEETS
(In Millions, except per share amounts)
| December 31, | 2022 | 2021 | |||||||||
| ASSETS | |||||||||||
| Current assets: | |||||||||||
| Cash and cash equivalents | $ | 944 | $ | 1,349 | |||||||
| Receivables, less allowances for discounts, returns and credit losses of $50 and $44 in 2022 and 2021, respectively | 1,096 | 953 | |||||||||
| Inventories | 799 | 700 | |||||||||
| Prepaid and other current assets | 173 | 158 | |||||||||
| Total current assets | 3,012 | 3,160 | |||||||||
| Property, plant and equipment, net | 630 | 644 | |||||||||
| Goodwill | 2,719 | 2,792 | |||||||||
| Other intangible assets, net | 930 | 1,016 | |||||||||
| Other non-current assets | 661 | 664 | |||||||||
| Total assets | $ | 7,952 | $ | 8,276 | |||||||
| LIABILITIES AND STOCKHOLDERS’ EQUITY | |||||||||||
| Current liabilities: | |||||||||||
| Accounts payable | $ | 723 | $ | 639 | |||||||
| Accrued and other current liabilities | 867 | 752 | |||||||||
| Total current liabilities | 1,590 | 1,391 | |||||||||
| Long-term debt, net | 1,880 | 2,440 | |||||||||
| Accrued post-retirement benefit obligations | 286 | 438 | |||||||||
| Deferred income tax liabilities | 222 | 287 | |||||||||
| Other non-current accrued liabilities | 471 | 494 | |||||||||
| Total liabilities | 4,449 | 5,050 | |||||||||
| Commitment and Contingencies (Note 19) | |||||||||||
| Stockholders’ equity: | |||||||||||
| Common stock — par value $0.01 per share: | |||||||||||
| Authorized 750.0 shares, issued 196.0 and 195.6 shares in 2022 and 2021, respectively | 2 | 2 | |||||||||
| Capital in excess of par value | 2,134 | 2,089 | |||||||||
| Retained earnings | 2,292 | 2,154 | |||||||||
| Treasury stock – at cost 15.8 shares and 15.2 shares in 2022 and 2021, respectively | (708) | (656) | |||||||||
| Accumulated other comprehensive loss | (226) | (371) | |||||||||
| Total stockholders’ equity | 3,494 | 3,218 | |||||||||
| Non-controlling interest | 9 | 8 | |||||||||
| Total equity | 3,503 | 3,226 | |||||||||
| Total liabilities and stockholders’ equity | $ | 7,952 | $ | 8,276 | |||||||
| December 31, | 2019 | 2018 | |||||
| ASSETS | |||||||
| Current assets: | |||||||
| Cash and cash equivalents | $ | 724 | $ | 296 | |||
| Receivables, less allowances for discounts, returns and doubtful accounts of $35 and $35 in 2019 and 2018, respectively | 1,036 | 1,031 | |||||
| Inventories | 539 | 595 | |||||
| Prepaid and other current assets | 151 | 172 | |||||
| Total current assets | 2,450 | 2,094 | |||||
| Property, plant and equipment, net | 658 | 656 | |||||
| Goodwill | 2,839 | 2,976 | |||||
| Other intangible assets, net | 1,174 | 1,232 | |||||
| Other non-current assets | 589 | 264 | |||||
| Total assets | $ | 7,710 | $ | 7,222 | |||
| LIABILITIES AND STOCKHOLDERS’ EQUITY | |||||||
| Current liabilities: | |||||||
| Accounts payable | $ | 597 | $ | 586 | |||
| Accrued and other current liabilities | 628 | 546 | |||||
| Short-term borrowings and current maturities of long-term debt | 276 | 257 | |||||
| Total current liabilities | 1,501 | 1,389 | |||||
| Long-term debt, net | 2,040 | 2,051 | |||||
| Accrued postretirement benefits | 445 | 400 | |||||
| Deferred income tax liabilities | 310 | 303 | |||||
| Other non-current accrued liabilities | 447 | 297 | |||||
| Total liabilities | 4,743 | 4,440 | |||||
| Commitment and Contingencies (Note 20) | |||||||
| Stockholders’ equity: | |||||||
| Common stock — par value $0.01 per share: | |||||||
| Authorized 750.0 shares, issued 193.9 and 192.9 shares in 2019 and 2018, respectively | 2 | 2 | |||||
| Capital in excess of par value | 1,991 | 1,950 | |||||
| Retained earnings | 1,866 | 1,639 | |||||
| Treasury stock – at cost 13.7 shares and 13.2 shares in 2019 and 2018, respectively | (527 | ) | (487 | ) | |||
| Accumulated other comprehensive loss | (375 | ) | (336 | ) | |||
| Total stockholders’ equity | 2,957 | 2,768 | |||||
| Non-controlling interest | 10 | 14 | |||||
| Total equity | 2,967 | 2,782 | |||||
| Total liabilities and stockholders’ equity | $ | 7,710 | $ | 7,222 | |||
See accompanying notes to consolidated financial statements.
65
XYLEM INC. AND SUBSIDIARIES
CONSOLIDATED STATEMENTS OF CASH FLOWS (In Millions)
| Year Ended December 31, | 2019 | 2018 | 2017 | Year Ended December 31, | 2022 | 2021 | 2020 | |||||||||||||||||||||
| Operating Activities | Operating Activities | |||||||||||||||||||||||||||
| Net income | $ | 401 | $ | 549 | $ | 330 | Net income | $ | 355 | $ | 427 | $ | 254 | |||||||||||||||
| Adjustments to reconcile net income to net cash provided by operating activities: | Adjustments to reconcile net income to net cash provided by operating activities: | |||||||||||||||||||||||||||
| Depreciation | 117 | 117 | 109 | Depreciation | 111 | 118 | 117 | |||||||||||||||||||||
| Amortization | 140 | 144 | 125 | Amortization | 125 | 127 | 134 | |||||||||||||||||||||
| Deferred income taxes | (77 | ) | (47 | ) | (33 | ) | Deferred income taxes | (64) | 10 | (31) | ||||||||||||||||||
| Share-based compensation | 29 | 30 | 21 | Share-based compensation | 37 | 33 | 26 | |||||||||||||||||||||
| Restructuring and asset impairment charges | 63 | 22 | 25 | Restructuring and asset impairment charges | 29 | 7 | 75 | |||||||||||||||||||||
| Goodwill impairment charge | 148 | — | — | Goodwill impairment charge | — | — | 58 | |||||||||||||||||||||
| (Gain)/loss from sale of businesses | (1 | ) | — | 10 | ||||||||||||||||||||||||
| U.K. pension settlement expense | U.K. pension settlement expense | 140 | — | — | ||||||||||||||||||||||||
| Gain from sale of businesses | Gain from sale of businesses | (1) | (2) | — | ||||||||||||||||||||||||
| Other, net | 9 | 9 | 19 | Other, net | (4) | 8 | 46 | |||||||||||||||||||||
| Payments for restructuring | (30 | ) | (21 | ) | (28 | ) | Payments for restructuring | (11) | (25) | (36) | ||||||||||||||||||
| Contributions to postretirement benefit plans | (19 | ) | (41 | ) | (33 | ) | ||||||||||||||||||||||
| Contributions to post-retirement benefit plans | Contributions to post-retirement benefit plans | (19) | (29) | (27) | ||||||||||||||||||||||||
| Changes in assets and liabilities (net of acquisitions): | Changes in assets and liabilities (net of acquisitions): | |||||||||||||||||||||||||||
| Changes in receivables | (23 | ) | (103 | ) | (79 | ) | Changes in receivables | (192) | (70) | 109 | ||||||||||||||||||
| Changes in inventories | 47 | (97 | ) | 27 | Changes in inventories | (147) | (167) | (5) | ||||||||||||||||||||
| Changes in accounts payable | 29 | 51 | 50 | Changes in accounts payable | 117 | 81 | (39) | |||||||||||||||||||||
| Changes in accrued liabilities | 15 | (6 | ) | 28 | Changes in accrued liabilities | 57 | 7 | 101 | ||||||||||||||||||||
| Changes in accrued taxes | (13 | ) | — | 104 | Changes in accrued taxes | 57 | (9) | 20 | ||||||||||||||||||||
| Net changes in other assets and liabilities | 4 | (21 | ) | 11 | Net changes in other assets and liabilities | 6 | 22 | 22 | ||||||||||||||||||||
| Net Cash — Operating activities | 839 | 586 | 686 | Net Cash — Operating activities | 596 | 538 | 824 | |||||||||||||||||||||
| Investing Activities | Investing Activities | |||||||||||||||||||||||||||
| Capital expenditures | (226 | ) | (237 | ) | (170 | ) | Capital expenditures | (208) | (208) | (183) | ||||||||||||||||||
| Proceeds from the sale of property, plant and equipment | — | — | 1 | |||||||||||||||||||||||||
| Acquisitions of businesses and assets, net of cash acquired | (18 | ) | (433 | ) | (33 | ) | ||||||||||||||||||||||
| Proceeds from sale of businesses | — | 22 | 16 | Proceeds from sale of businesses | 1 | 10 | — | |||||||||||||||||||||
| Cash received from investments | 11 | 11 | 10 | Cash received from investments | 8 | 3 | 200 | |||||||||||||||||||||
| Cash paid for investments | (7 | ) | (11 | ) | (11 | ) | Cash paid for investments | (11) | — | (200) | ||||||||||||||||||
| Cash received from cross currency swaps | 9 | — | — | |||||||||||||||||||||||||
| Cash received from cross-currency swaps | Cash received from cross-currency swaps | 28 | 14 | 12 | ||||||||||||||||||||||||
| Settlement of currency forward agreement | Settlement of currency forward agreement | (10) | — | — | ||||||||||||||||||||||||
| Other, net | — | 5 | 6 | Other, net | 1 | (2) | 2 | |||||||||||||||||||||
| Net Cash — Investing activities | (231 | ) | (643 | ) | (181 | ) | Net Cash — Investing activities | (191) | (183) | (169) | ||||||||||||||||||
| Financing Activities | Financing Activities | |||||||||||||||||||||||||||
| Short-term debt issued, net | 281 | 335 | — | Short-term debt issued, net | — | — | 359 | |||||||||||||||||||||
| Short-term debt repaid, net | (254 | ) | (52 | ) | (282 | ) | Short-term debt repaid, net | — | — | (640) | ||||||||||||||||||
| Long-term debt issued, net | — | 1 | — | Long-term debt issued, net | — | — | 985 | |||||||||||||||||||||
| Long-term debt repaid, net | — | (120 | ) | — | Long-term debt repaid, net | (527) | (600) | — | ||||||||||||||||||||
| Repurchase of common stock | (40 | ) | (59 | ) | (25 | ) | Repurchase of common stock | (52) | (68) | (61) | ||||||||||||||||||
| Proceeds from exercise of employee stock options | 13 | 7 | 16 | Proceeds from exercise of employee stock options | 8 | 19 | 20 | |||||||||||||||||||||
| Dividends paid | (174 | ) | (152 | ) | (130 | ) | Dividends paid | (217) | (203) | (188) | ||||||||||||||||||
| Other, net | (3 | ) | — | — | Other, net | (2) | (3) | (2) | ||||||||||||||||||||
| Net Cash — Financing activities | (177 | ) | (40 | ) | (421 | ) | Net Cash — Financing activities | (790) | (855) | 473 | ||||||||||||||||||
| Effect of exchange rate changes on cash | (3 | ) | (21 | ) | 22 | Effect of exchange rate changes on cash | (20) | (26) | 23 | |||||||||||||||||||
| Net change in cash and cash equivalents | 428 | (118 | ) | 106 | Net change in cash and cash equivalents | (405) | (526) | 1,151 | ||||||||||||||||||||
| Cash and cash equivalents at beginning of year | 296 | 414 | 308 | Cash and cash equivalents at beginning of year | 1,349 | 1,875 | 724 | |||||||||||||||||||||
| Cash and cash equivalents at end of year | $ | 724 | $ | 296 | $ | 414 | Cash and cash equivalents at end of year | $ | 944 | $ | 1,349 | $ | 1,875 | |||||||||||||||
| Supplemental disclosure of cash flow information: | Supplemental disclosure of cash flow information: | |||||||||||||||||||||||||||
| Cash paid during the year for: | Cash paid during the year for: | |||||||||||||||||||||||||||
| Interest | $ | 77 | $ | 78 | $ | 78 | Interest | $ | 76 | $ | 99 | $ | 77 | |||||||||||||||
| Income taxes (net of refunds received) | $ | 107 | $ | 75 | $ | 57 | Income taxes (net of refunds received) | $ | 91 | $ | 83 | $ | 41 | |||||||||||||||
See accompanying notes to consolidated financial statements.
66
XYLEM INC. AND SUBSIDIARIES
CONSOLIDATED STATEMENTS OF CHANGES IN STOCKHOLDERS’ EQUITY
(In Millions, except per share amounts)
| Common Stock | Capital in Excess of Par Value | Retained Earnings | Accumulated Other Comprehensive Income (Loss) | Treasury Stock | Non-Controlling Interest | Total | |||||||||||||||||||||||||||||||||||
| Balance at December 31, 2019 | $ | 2 | $ | 1,991 | $ | 1,866 | $ | (375) | $ | (527) | $ | 10 | $ | 2,967 | |||||||||||||||||||||||||||
| Cumulative effect of change in accounting principle | (2) | (2) | |||||||||||||||||||||||||||||||||||||||
| Net income | 254 | 254 | |||||||||||||||||||||||||||||||||||||||
| Other comprehensive loss, net | (38) | (1) | (39) | ||||||||||||||||||||||||||||||||||||||
| Distribution to minority shareholders | (1) | (1) | |||||||||||||||||||||||||||||||||||||||
| Dividends declared ($1.04 per share) | (188) | (188) | |||||||||||||||||||||||||||||||||||||||
| Stock incentive plan activity | 46 | (11) | 35�� | ||||||||||||||||||||||||||||||||||||||
| Repurchase of common stock | (50) | (50) | |||||||||||||||||||||||||||||||||||||||
| Acquisition activity | — | ||||||||||||||||||||||||||||||||||||||||
| Balance at December 31, 2020 | $ | 2 | $ | 2,037 | $ | 1,930 | $ | (413) | $ | (588) | $ | 8 | $ | 2,976 | |||||||||||||||||||||||||||
| Net Income | 427 | 427 | |||||||||||||||||||||||||||||||||||||||
| Other comprehensive income, net | 42 | 42 | |||||||||||||||||||||||||||||||||||||||
| Dividends declared ($1.12 per share) | (203) | (203) | |||||||||||||||||||||||||||||||||||||||
| Stock incentive plan activity | 52 | (8) | 44 | ||||||||||||||||||||||||||||||||||||||
| Repurchase of common stock | (60) | (60) | |||||||||||||||||||||||||||||||||||||||
| Balance at December 31, 2021 | $ | 2 | $ | 2,089 | $ | 2,154 | $ | (371) | $ | (656) | $ | 8 | $ | 3,226 | |||||||||||||||||||||||||||
| Net income | 355 | 355 | |||||||||||||||||||||||||||||||||||||||
| Other comprehensive income, net | 145 | — | 145 | ||||||||||||||||||||||||||||||||||||||
| Other activity | 1 | 1 | |||||||||||||||||||||||||||||||||||||||
| Dividends declared ($1.20 per share) | (217) | (217) | |||||||||||||||||||||||||||||||||||||||
| Stock incentive plan activity | 45 | (6) | 39 | ||||||||||||||||||||||||||||||||||||||
| Repurchase of common stock | (46) | (46) | |||||||||||||||||||||||||||||||||||||||
| Balance at December 31, 2022 | $ | 2 | $ | 2,134 | $ | 2,292 | $ | (226) | $ | (708) | $ | 9 | $ | 3,503 | |||||||||||||||||||||||||||
| Common Stock | Capital in Excess of Par Value | Retained Earnings | Accumulated Other Comprehensive Income (Loss) | Treasury Stock | Non-Controlling Interest | Total | |||||||||||||||||||||
| Balance at December 31, 2016 | $ | 2 | $ | 1,876 | $ | 1,033 | $ | (318 | ) | $ | (403 | ) | $ | 17 | $ | 2,207 | |||||||||||
| Cumulative effect of change in accounting principle | (7 | ) | (7 | ) | |||||||||||||||||||||||
| Net income | 331 | (1 | ) | 330 | |||||||||||||||||||||||
| Other comprehensive income, net | 108 | 108 | |||||||||||||||||||||||||
| Dividends declared ($.72 per share) | (130 | ) | (130 | ) | |||||||||||||||||||||||
| Stock incentive plan activity | 36 | (5 | ) | 31 | |||||||||||||||||||||||
| Repurchase of common stock | (20 | ) | (20 | ) | |||||||||||||||||||||||
| Balance at December 31, 2017 | $ | 2 | $ | 1,912 | $ | 1,227 | $ | (210 | ) | $ | (428 | ) | $ | 16 | $ | 2,519 | |||||||||||
| Cumulative effect of change in accounting principle | 14 | (17 | ) | (3 | ) | ||||||||||||||||||||||
| Net income | 549 | 549 | |||||||||||||||||||||||||
| Other comprehensive loss, net | (109 | ) | (2 | ) | (111 | ) | |||||||||||||||||||||
| Dividends declared ($.84 per share) | (151 | ) | (151 | ) | |||||||||||||||||||||||
| Stock incentive plan activity | 38 | (9 | ) | 29 | |||||||||||||||||||||||
| Repurchase of common stock | (50 | ) | (50 | ) | |||||||||||||||||||||||
| Balance at December 31, 2018 | $ | 2 | $ | 1,950 | $ | 1,639 | $ | (336 | ) | $ | (487 | ) | $ | 14 | $ | 2,782 | |||||||||||
| Sale of business | (2 | ) | (2 | ) | |||||||||||||||||||||||
| Net income | 401 | 401 | |||||||||||||||||||||||||
| Other comprehensive loss, net | (39 | ) | 1 | (38 | ) | ||||||||||||||||||||||
| Distribution to minority shareholders | (3 | ) | (3 | ) | |||||||||||||||||||||||
| Dividends declared ($.96 per share) | (174 | ) | (174 | ) | |||||||||||||||||||||||
| Stock incentive plan activity | 41 | (15 | ) | 26 | |||||||||||||||||||||||
| Repurchase of common stock | (25 | ) | (25 | ) | |||||||||||||||||||||||
| Balance at December 31, 2019 | $ | 2 | $ | 1,991 | $ | 1,866 | $ | (375 | ) | $ | (527 | ) | $ | 10 | $ | 2,967 | |||||||||||
See accompanying notes to consolidated financial statements.
67
XYLEM INC. AND SUBSIDIARIES
NOTES TO CONSOLIDATED FINANCIAL STATEMENTS
Note 1.1. Summary of Significant Accounting Policies
Xylem Inc. (“Xylem” or the “Company”) is a leading equipment and service provider for water and wastewater applications with a broad portfolio of products and services addressing the full cycle of water, from collection, distribution and use to the return of water to the environment.
Xylem operates in 3three segments, Water Infrastructure, Applied Water and Measurement & Control Solutions. See Note 22,21, "Segment and Geographic Data"Data," for further segment background information.
Hereinafter, except as otherwise indicated or unless the context otherwise requires, “Xylem,” “we,” “us,” “our” and “the Company” refer to Xylem Inc. and its subsidiaries. References in the notes to the consolidated financial statements to “ITT” or “ former parent” refers to ITT Corporation (now ITT LLC) and its consolidated subsidiaries (other than Xylem Inc.).
Basis of Presentation
The consolidated financial statements reflect our financial position and results of operations in conformity with accounting principles generally accepted in the United States of America (“GAAP”). All intercompany transactions between our businesses have been eliminated.
Use of Estimates
The preparation of financial statements in conformity with GAAP requires management to make estimates and assumptions that affect the reported amounts of assets and liabilities, the disclosure of contingent assets and liabilities at the date of the financial statements, and the reported amounts of revenue and expenses during the reporting period. Estimates are revised as additional information becomes available. Estimates and assumptions are used for, but not limited to, postretirementpost-retirement obligations and assets, revenue recognition, income tax contingency accruals and valuation allowances,taxes, valuation of intangible assets, goodwill and indefinite livedindefinite-lived intangible impairment testing and contingent liabilities. Actual results could differ from these estimates. The global outbreak of COVID-19 in March 2020, declared a pandemic by the World Health Organization, has created significant global volatility, uncertainty and economic disruption. The COVID-19 pandemic also has caused increased uncertainty in estimates and assumptions affecting the consolidated financial statements. Actual results could differ from these estimates.
Consolidation Principles
We consolidate companies in which we have a controlling financial interest or when Xylem is considered the primary beneficiary of a variable interest entity. We account for investments under the equity method in companies over which we have the ability to exercise significant influence but do not hold a controlling financial interest, under the equity method, and we record our proportionate share of income or losses in the Consolidated Income Statements. Equity method investments are reviewed for impairment when events or circumstances indicate the investment may be other than temporarily impaired. This requires significant judgment, including an assessment of the investee’s financial condition, the possibility of subsequent rounds of financing, and the investee’s historical and projected results of operations. If the actual results of operations for the investee are significantly different from projections, we may incur future charges for the impairment of these investments.
Foreign Currency Translation
The national currencies of our foreign companies are generally the functional currencies. Balance sheet accounts are translated at the exchange rate in effect at the end of each period; income statement accounts are translated at the average rates of exchange prevailing during the period. Gains and losses on foreign currency translations are reflected in the cumulative translation adjustments component of stockholders’ equity. Net gains or losses from foreign currency transactions are reported currently in selling, general and administrative expenses.
68
Revenue Recognition
providing those goods and services. For each arrangement with a customer, we identify the contract and the associated performance obligations within the contract, determine the transaction price of that contract, allocate the transaction price to each performance obligation and recognize revenue as each performance obligation is satisfied.
The satisfaction of performance obligations in a contract is based upon when the customer obtains control over the asset. Depending on the nature of the performance obligation, control transfers either at a particular point in time, or over time which determines the recognition pattern of revenue.
For product sales, other than long-term construction-type contracts, we recognize revenue once control has passed at a point in time, which is generally when products are shipped. In instances where contractual terms include a provision for customer acceptance, revenue is recognized when either (i) we have previously demonstrated that the product meets the specified criteria based on either seller or customer specifiedcustomer-specified objective criteria or (ii) upon formal acceptance received from the customer where the product has not been previously demonstrated to meet customer specifiedcustomer-specified objective criteria. We recognize revenue on product sales to channel partners, including resellers, distributors or value-added solution providers, at the point in time when control is transferred which is determined based on when the risks and rewards, possession, and title have transferred to the customer, which usually occurs at the point of delivery.
Revenue from performance obligations related to services is primarily recognized over time, as the performance obligations are satisfied. In these instances, the customer consumes the benefit of the service as Xylem performs.
Certain businesses also enter into long-term construction-type sales contracts where revenue is recognized over time. In these instances, revenue is recognized using a measure of progress that applies an input method based on costs incurred in relation to total estimated costs. We also recognize revenue for certain of these arrangements using the output method and measure progress based on shipments of product where control has transferred to the customer.
If shipping and handling activities are performed after a customer obtains control of a good, we account for the shipping and handling activities as activities to fulfill a promise to transfer a good. Shipping and handling related costs are accrued as revenue is recognized.
For all contracts with customers, we determine the transaction price in the arrangement and allocate the transaction price to each performance obligation identified in the contract. Judgment is required to determine the appropriate unit of account, and we separate out the performance obligations if they are capable of being distinct and if they are distinct within the context of the contract. We base our allocation of the transaction price to the performance obligations on the relative standalonestand-alone selling prices for the goods or services contained in a particular performance obligation. The standalonestand-alone selling prices are determined first by reference to observable prices. In the event observable prices are not available, we estimate the stand-alone selling price by maximizing observable inputs and applying an adjusted market assessment approach, expected cost plus margin approach, or a residual approach in limited situations. Revenue in these instances is recognized on individual performance obligations within the same contract as they are satisfied.
The transaction price is adjusted for our estimate of variable consideration which may include a right of return, discounts, rebates, penalties and retainage. To estimate variable consideration, we apply the expected value or the most likely amount method, based on whichever method most appropriately predicts the amount of consideration we expect to receive. The method applied is typically based on historical experience and known trends. We constrain the amounts of variable consideration that are included in the transaction price, to the extent that it is probable that a significant reversal in the amount of cumulative revenue recognized will not occur or when uncertainties around the variable consideration are resolved.
We exclude from the measurement of the transaction price all taxes assessed by a governmental authority that are both imposed on and concurrent with a specific revenue-producing transaction and collected from a customer, for example sales, use, value added and some excise taxes.
For all contracts with customers, payment received for our products and services may not necessarily follow the same pattern of revenue recognition to which it relates and are dictated by the terms and conditions of our contracts with customers. Payments received for product sales typically occur following delivery and the satisfaction of the performance obligationobligations based upon the terms outlined in the contracts. Payments received for services typically occur following the services being rendered. For long-term construction-type projects, payments are typically made throughout the contract as progress is made.
69
In limited situations, contracts with customers include financing components where payment terms exceed one year,year; however, we believe that the financing effects are not significant to Xylem. In addition, we apply a practical
expedient and do not adjust the promised amount of consideration in a contract for the effects of significant financing components when we expect payment terms to be one year or less from the time the goods or services are transferred until ultimate payment.
We offer standard warranties for our products to ensure that our products comply with agreed-upon specifications in our contracts. Standard warranties do not give rise to performance obligations and represent assurance-type warranties. In certain instances, product warranty terms are adjusted to account for the specific nature of the contract. In these instances, we assess the warranties to determine whether they represent service-type warranties, and should be accounted for as a separate performance obligation in the contract.
Costs to obtain a contract include incremental costs that the Company has incurred whichthat it expects to recover. Incremental costs only include costs that the Company would not have incurred had the contract not been obtained. Costs that would have been incurred regardless of whether or not the contract was obtained are expensed as incurred, unless they are explicitly chargeable to the customer whether or not the contract is obtained.
Costs to obtain contracts are capitalized when incurred. The costs to obtain contractsincurred, and are then amortized in a manner that is consistent with the pattern of transfer of the related goods or services provided in the contract. The Company elects to apply the practical expedient to expense costs to obtain contracts when the associated amortization period of those costs would be one year or less.
Shipping and Handling Costs
Shipping and handling costs are recorded as a component of cost of revenue.
Share-Based Compensation
Share-based awards issued to employees and members of the Board of Directors include non-qualified stock options, restricted stock unit awards and performance share unit awards. Share-based awards issued to members of the Board of Directors include restricted stock unit awards. Compensation costs resulting from share-based payment transactions are recognized primarily within selling, general and administrative expenses, at fair value over the requisite service period (typically three years) on a straight-line basis. The calculated compensation cost is adjusted based on an estimate of awards ultimately expected to vest. For performance awards, the calculated compensation cost is adjusted based on an estimate of awards ultimately expected to vest and our
Research and Development
We conduct research and development activities, which consist primarily of the development of new products, product applications, and manufacturing processes. To the extent these activities are related to developing software that is sold to our customers, we capitalize the applicable development costs. All other research and development costs are charged to expense as incurred.
Exit and Disposal Costs
We periodically initiate management-approved restructuring activities to achieve cost savings through reduced operational redundancies and to position ourselves strategically in the market in response to prevailing economic conditions and associated customer demand. Costs associated with restructuring actions can include severance, infrastructure charges to vacate facilities or consolidate operations, contract termination costs and other related charges. For involuntary separation plans, a liability is recognized when it is probable and reasonably estimable. For voluntary separation plans, a liability is recognized when the employee irrevocably accepts the voluntary termination. For one-time termination benefits, such as additional severance pay or benefit payouts and other exit costs, such as lease termination costs, the liability is measured and recognized initially at fair value in the period in which the liability is incurred, with subsequent changes to the liability recognized as adjustments in the period of change.
70
Deferred Financing Costs
Deferred financing costs represent costs incurred in conjunction with our debt financing activities and are capitalized in long-term debt and amortized over the life of the related financing arrangements. If the debt is retired early, the related unamortized deferred financing costs are written off in the period the debt is retired and are recorded inwithin the results of operations under the caption “interest expense.”expense” in the period the debt is retired.
Income Taxes
Income taxes are calculated using the asset and liability method. Deferred tax assets and liabilities are determined based on temporary differences between the financial reporting and tax bases of assets and liabilities, applying enacted tax rates in effect for the year in which we expect the differences will reverse.
We maintain valuation allowances when it is more likely than not that all or a portion of a deferred asset will not be realized. The valuation allowance is intended in part to provide for the uncertainty regarding the ultimate utilization of our U.S. capital loss carryforwards, U.S. foreign tax credit carryovers, and foreign net operating loss carryforwards. In determining whether a valuation allowance is warranted, we consider all positive and negative evidence and all sources of taxable income such as prior earnings history, expected future earnings, carryback and carryforward periods and tax strategies to estimate if sufficient future taxable income will be generated to realize the deferred tax asset. The assessment of the adequacy of our valuation allowance is based on our estimates of taxable income by jurisdiction in which we operate and the period over which our deferred tax assets will be recoverable. In the event thatIf actual results differ from these estimates, or we adjust these estimates in future periods for current trends or expected changes in our estimating assumptions, we may need to modify the level of valuation allowance that could materially impact our business, financial condition and results of operations.
Tax benefits are recognized for an uncertain tax position when, in management’s judgment,based on the technical merits of the position it is more likely than not that the position will be sustained upon examination by a taxing authority.authority or upon completion of the litigation process. For a tax position that meets the more-likely-than-not recognition threshold, the tax benefit is measured as the largest amount that is judged to have a
greater than 50% likelihood of being realized upon ultimate settlement with a taxing authority. The liability associated with unrecognized tax benefits is adjusted periodically due to changing circumstances and when new information becomes available. Such adjustments are recognized in the period in which they are identified. The effective tax rate includes the net impact of changes in the liability for unrecognized tax benefits and subsequent adjustments as considered appropriate by management. While it is often difficult to predict the final outcome or the timing of resolution of any particular tax matter, we believe our liability for unrecognized tax benefits is adequate. We classify interest relating to unrecognized tax benefits as a component of other non-operating (expense) income, net and tax penalties as a component of income tax expense in our Consolidated Income Statements.
Earnings Per Share
We present two calculations of earnings per share (“EPS”). “Basic” EPS equals net income divided by weighted average shares outstanding during the period. “Diluted” EPS equals net income divided by the sum of weighted average common shares outstanding during the period plus potentially dilutive shares. Potentially dilutive common shares that are anti-dilutive are excluded from diluted EPS.
Cash Equivalents
We consider all liquid investments purchased with an original maturity of three months or less to be cash equivalents.
Receivables and Allowance for Doubtful AccountsCredit Losses and Discounts
Receivables are primarily comprisecomprised of uncollected amounts owed to us from transactions with customers and are presented net of allowances for doubtful accounts,credit losses, returns and early payment discounts.
We determine our allowance for doubtful accountscredit losses using a combination of factors to reduce our trade receivable balances to their estimatedthe net realizable amount.amount expected to be collected. We maintain an allowance for doubtful accountscredit losses based on a variety of factors, including the length of time receivables arewere past due, macroeconomicmacro-economic trends and conditions, significant one-time events, historical experience, and the financial conditioncurrent and future expectations of customers.economic conditions. In addition, we record a specific reservean allowance for individual accounts when we become aware of specific customer circumstances, such as in the case of bankruptcy filings or deterioration in the customer’s operating results or financial position. The past due or delinquency status of a receivable is based on the contractual payment terms of the receivable. If circumstances
71
related to the specific customer change, we adjust estimates of the recoverability of receivables as appropriate. We determine our allowance for early payment discounts primarily based on historical experience with customers.
Credit risk with respect to accounts receivable is generally diversified due to the large number of entities comprising our customer base and their dispersion across many different geographical regions. We perform ongoing credit evaluations ofevaluate the financial condition of our third-party distributors, resellers and other customers and require collateral, such as letters of credit and bank guarantees, in certain circumstances. As of December 31, 20192022 and 20182021 we do not believe we have any significant concentrations of credit risk.
Inventories
Inventories, which include the costs of material, labor and overhead, are stated at the lower of cost or net realizable value. Estimated losses from obsolete and slow-moving inventories are recorded to reduce inventory values to their estimated net realizable value. Our manufacturing operations recognize costs of sales using standard costs with full overhead absorption, which generally approximates actual cost.
Property, Plant and Equipment
These assets are recorded at historical cost and are depreciated using the straight-line method of depreciation over the estimated useful lives as follows:
| Estimated Life | |||||
| Buildings and improvements | 5 to 40 years | ||||
| Machinery and equipment | 2 to 10 years | ||||
| Furniture and fixtures | 3 to 7 years | ||||
| Equipment held for lease or rental | 2 to 10 years | ||||
Leasehold improvements are depreciated over the shorter of their estimated useful life or the term of the lease. Costs related to maintenance and repairs that do not prolong the assets' useful lives are expensed as incurred.
Leases
Lease expense for lease payments is recognized on a straight-line basis over the lease term. Many of our leases are subject to payment adjustments to reflect annual changes in price indexes, such as the Consumer Price Index. While associated lease liabilities are not re-measured as a result of changes in the applicable price indexes, changes to required lease payments are treated as variable lease payments and recognized in the period in which the obligation for those payments was incurred.
Leases with a lease term of 12 months or less, including renewal options that are reasonably certain to be exercised, that also do not include an option to purchase the underlying asset that is reasonably certain of exercise, are not recorded on the balance sheet. Instead, lease payments for these leases are recognized as a lease cost on a straight-line basis over the lease term.
We elected the package of practical expedients, which among other things, does not require reassessment of lease classification. Additionally, we have made an accounting policy election whereby we chose not to separate non-lease components from lease components in agreements in all leases which we are the lessee.
72
Goodwill and Intangible Assets
Goodwill represents purchase consideration paid in a business combination that exceeds the values assigned to the net assets of acquired businesses. Intangible assets include customer relationships, proprietary technology, brands and trademarks, patents, software and other intangible assets. Intangible assets with a finite life are amortized on a straight-line basis over an estimated economic useful life which ranges from 1 to 25 years and is included in cost of revenue or selling, general and administrative expense.expenses. Certain of our intangible assets, namely certain brands and trademarks, as well as Federal Communications Commission ("FCC")FCC licenses, have an indefinite life and are not amortized.
Long-Lived Asset Impairment
Long-lived assets, including intangible assets with finite lives, are amortized and tested for impairment whenever events or changes in circumstances indicate their carrying value may not be recoverable. We assess the recoverability of long-lived assets based on the undiscounted future cash flow the assets are expected to generate and recognize an impairment loss when estimated undiscounted future cash flows expected to result from the use of the asset plus net proceeds expected from disposition of the asset, if any, are less than the carrying value of the asset. When an impairment is identified, we reduce the carrying amount of the asset to its estimated fair value based on a discounted cash flow approach or, when available and appropriate, to comparable market values.
Goodwill and indefinite-lived intangible assets are not amortized, but rather are tested for impairment annually (or more frequently if impairment indicators arise, such as changes to the reporting unit structure, significant adverse changes in the business or business climate or an adverse action or assessment by a regulator). We conduct our annual impairment testing onas of the first daybeginning of ourthe fourth quarter. For goodwill, the estimated fair value of each reporting unit is compared to the carrying value of the net assets assigned to that reporting unit. If the estimated fair value of the reporting unit exceeds its carrying value, goodwill is not impaired. If the carrying value of the reporting unit exceeds its estimated fair value, then an impairment charge is recognized for that excess up to the amount of recorded goodwill. We estimate the fair value of our reporting units using an income approach. We estimate the fair value of our intangible assets with indefinite lives using either the income approach or the market approach. Under the income approach, we calculate fair value based on the present value of estimated future cash flows. Under the market approach, we calculate fair value based on recent sales and selling prices of similar assets.
Product Warranties
For assurance-type warranties, we accrue for the estimated cost of product warranties at the time revenue is recognized and record it as a component of cost of revenue. Our product warranty liability reflects our best estimate of probable liability under the terms and conditions of our product warranties offered to customers. We estimate the liability based on our standard warranty terms, the historical frequency of claims and the cost to replace or repair our products under warranty. Factors that impact our warranty liability include the number of units sold, the length of warranty term, historical and anticipated rates of warranty claims and cost per claim. We also record a warranty liability for specific matters. We assess the adequacy of our recorded warranty liabilities quarterly and adjust amounts as necessary.
For service-type warranties (i.e. non-standard warranties) costs incurred to fulfill the extended or service warranty are recognized/recorded as the costs are incurred.
The determination of defined benefit pension and postretirementpost-retirement plan obligations and their associated costs requires the use of actuarial computations to estimate participant plan benefits to which the employees will be entitled. The significant assumptions primarily relate to discount rates, expected long-term rates of return on plan assets, rate of future compensation increases, mortality, years of service and other factors. We develop each assumption using relevant company experience in conjunction with market-related data for each individual country in which such plans exist. All actuarial assumptions are reviewed annually with third-party consultants and adjusted as necessary. For the recognition of net periodic postretirementpost-retirement cost, the calculation of the expected return on plan assets is generally derived by applying the expected long-term rate of return on the market-related value of plan assets. The market-related value of plan assets is based on average asset values at the measurement date over the last five years. Actual results that differ from our assumptions are accumulated and amortized on a straight-line basis only to the extent they exceed 10% of the higher of the market-related value or the projected benefit obligation, over the average remaining service period of active participants, or for plans with all or substantially all inactive participants, over the average remaining life expectancy. The fair value of plan assets is determined based on market prices or estimated fair value at the measurement date.
We consider changes to a plan’s benefit formula that eliminate the accrual for future service but continue to allow for future salary increases (i.e. “soft freeze”) to be a curtailment.
73
Business Combinations
We allocate the purchase price of acquisitions to the tangible and intangible assets acquired, liabilities assumed, and non-controlling interests in the acquiree based on their estimated fair value at the acquisition date. The excess of the acquisition price over those estimated fair values is recorded as goodwill. Changes to the acquisition date provisional fair values prior to the expiration of the measurement period, a period not to exceed 12 months from date of acquisition, are recorded as an adjustment to the associated goodwill. Acquisition-related expenses and restructuring costs, if any, are recognized separately from the business combination and are expensed as incurred.
Derivative Financial Instruments
We record all derivatives on the balance sheet at fair value. The accounting for changes in the fair value of derivatives depends on whether we have elected to designate a derivative in a hedging relationship and apply hedge accounting and whether the hedging relationship has satisfied the criteria necessary to apply hedge accounting. Derivatives designated and qualifying as a hedge of the exposure to changes in the fair value of an asset, liability, or firm commitment attributable to a particular risk are considered fair value hedges. Derivatives designated and qualifying as a hedge of the exposure to variability in expected future cash flows, including forecasted transactions, are considered cash flow hedges. Derivatives may also be designated as hedges of the foreign currency exposure of a net investment in a foreign operation. Hedge accounting generally provides for the matching of the timing of gain or loss recognition on the hedging instrument with the recognition of the changes in the fair value of the hedged asset or liability that are attributable to the hedged risk in a fair value hedge or the earnings effect of the hedged forecasted transactions in a cash flow hedge. We may enter into derivative contracts that are intended to hedge certain risks economically, even though hedge accounting does not apply or we elect not to apply hedge accounting.
Commitments and Contingencies
We record accruals for commitments and loss contingencies for those which are both probable and for which the amount can be reasonably estimated. In addition, legal fees are accrued for cases where a loss is probable and the related fees can be reasonably estimated. Significant judgment is required to determine both probability and the estimated amount of loss. We review these accruals quarterly and adjust the accruals to reflect the impact of negotiations, settlements, rulings, advice of legal counsel, and other current information.
Accruals for environmental matters are recorded on a site-by-site basis when it is probable that a liability has been incurred and the amount of the liability can be reasonably estimated, based on current law and existing technologies. Our estimated liability is reduced to reflect the anticipated participation of other potentially responsible parties in those instances where it is probable that such parties are legally responsible and financially capable of paying their respective shares of the relevant costs. These accruals are reviewed quarterly and are adjusted as assessment and remediation efforts progress or as additional technical or legal information becomes available. Actual costs to be incurred at identified sites in future periods may vary from the estimates, given inherent uncertainties in evaluating environmental exposures. Accruals for environmental liabilities are primarily included in other non-current liabilities at undiscounted amounts and exclude claims for recoveries from insurance companies or other third parties.amounts.
74
Concentrations of Credit Risk
Financial instruments that potentially subject us to significant concentrations of credit risk consist principally of cash and cash equivalents, derivative contracts and accounts receivable from trade customers. We maintain cash and cash equivalents and derivative contracts with various financial institutions. These financial institutions are located in many different geographical regions, and our policy is designed to limit exposure with any one institution. As part of our cash and risk management processes, we perform periodic evaluations of the relative credit standing of the financial institutions. We have not sustained any material credit losses during the previous three years from instruments held at financial institutions. We may utilize forward contracts to protect against the effects of foreign currency fluctuations. Such contracts involve the risk of non-performance by the counterparty. Credit risk with respect to accounts receivable is generally diversified due to the large number of entities comprising our customer base and their dispersion across many different industries and geographic regions. We perform ongoing credit evaluations of the financial condition of our third-party distributors, resellers and other customers and require collateral, such as letters of credit and bank guarantees, in certain circumstances.
Substantially all of the cash and cash equivalents, including foreign cash balances, at December 31, 20192022 and 20182021 were uninsured. Foreign cash balances at December 31, 20192022 and 20182021 were $510$813 million and $274$596 million, respectively.
Fair Value Measurements
We determine fair value as the price that would be received to sell an asset or paid to transfer a liability in an orderly transaction between market participants at the measurement date. We use a hierarchical structure to prioritize the inputs to valuation techniques used to measure fair value into three broad levels defined as follows:
•Level 1 inputs are quoted prices (unadjusted) in active markets for identical assets or liabilities.
•Level 2 inputs are other than quoted prices included within Level 1 that are observable for the asset or liability, either directly or indirectly. Level 2 inputs include quoted prices (in non-active markets or in active markets for similar assets or liabilities), inputs other than quoted prices that are observable, and inputs that are derived principally from or corroborated by observable market data by correlation or other means.
•Level 3 inputs are unobservable inputs for the assets or liabilities.
The fair value hierarchy is based on maximizing the use of observable inputs and minimizing the use of unobservable inputs when measuring fair value. Classification within the fair value hierarchy is based on the lowest level input that is significant to the fair value measurement.
Note 2.2. Recently Issued Accounting Pronouncements
Pronouncements Not Yet Adopted
In June 2016, the FASB issued guidance amending the accounting for the impairment of financial instruments, including trade receivables. Under current guidance, credit losses are recognized when the applicable losses have a probable likelihood of occurring and this assessment is based on past events and current conditions. The amended guidance eliminates the “probable” threshold and requires an entity to use a broader range of information, including forecast information when estimating expected credit losses. Generally, this should result in a more timely recognition of credit losses. This guidance is effective for interim and annual periods beginning after December 15, 2019 with early adoption permitted for interim and annual periods beginning after December 15, 2018. The requirements of the amended guidance should be applied using a modified retrospective approach except for debt securities, which require a prospective transition approach. The guidance will not have a material impact on our financial condition and results of operations.
In February 2016,October 2021, the FASB issued guidance amending the accountingASU No. 2021-08, “Business Combinations (Topic 805) - Accounting for leases. Specifically, the amendedContract Assets and Contract Liabilities from Contracts with Customers.” This guidance requires all lesseesan acquirer to record a lease liability at lease inception,apply the guidance in ASC 606, Revenue from Contracts with a corresponding right of use ("ROU") asset, except for short-term leases. Lessor accounting is not fundamentally changed. This amended guidance is effective for interimCustomers, to recognize and annual periods beginning after December 15, 2018 using a modified retrospective approach. Early adoption was permitted. We adopted this guidance as of January 1, 2019 using the modified retrospective approach whereby prior comparative periods were not retrospectively restated in the consolidated financial statements. The adoption of the standard resulted in the recognition of ROUmeasure contract assets and leasecontract liabilities of $267 million and $265 million, respectively, as well as deferred tax assets and deferred tax liabilities of $68 million, as of January 1, 2019, the date of initial application.in a business combination, rather than using fair value. The guidance did not have a material impact on our consolidated Income Statements and Statements of Cash Flow. See Note 11, "Leases" for further details.
75
| (in millions) | Amount | ||
| Cash | $ | 14 | |
| Receivables | 23 | ||
| Inventories | 4 | ||
| Prepaid and other current assets | 2 | ||
| Property, plant and equipment | 22 | ||
| Intangible assets | 149 | ||
| Other long-term assets | 1 | ||
| Accounts payable | (3 | ) | |
| Accrued and other current liabilities | (12 | ) | |
| Deferred income tax liabilities | (25 | ) | |
| Other non-current accrued liabilities | (2 | ) | |
| Total identifiable net assets | 173 | ||
| Goodwill | 261 | ||
| Total consideration | $ | 434 | |
| Category | Life | Amount (in millions) | ||||
| Customer Relationships | 17 - 18 years | $ | 84 | |||
| Technology | 3 - 10 years | 38 | ||||
| Tradenames | 20 years | 21 | ||||
| Internally Developed Software | 3 years | 6 | ||||
| Total | $ | 149 | ||||
| (in millions) | Year Ended December 31, | |
| 2018 | 2017 | |
| Revenue | $5,212 | $4,809 |
| Net income | $546 | $323 |
Note 4.3. Revenue
Disaggregation of Revenue
The following table illustrates the sources of revenue:
| Year Ended December 31, | |||||||||||||||||
| (in millions) | 2022 | 2021 | 2020 | ||||||||||||||
| Revenue from contracts with customers | $ | 5,294 | $ | 4,998 | $ | 4,681 | |||||||||||
| Lease Revenue | 228 | 197 | 195 | ||||||||||||||
| Total | $ | 5,522 | $ | 5,195 | $ | 4,876 | |||||||||||
| Year Ended December 31, | |||||||
| (in millions) | 2019 | 2018 | |||||
| Revenue from contracts with customers | $ | 5,002 | $ | 4,963 | |||
| Lease Revenue | 247 | 244 | |||||
| Total | $ | 5,249 | $ | 5,207 | |||
The following table reflects revenue from contracts with customers by application:
| Year Ended December 31, | |||||||||||||||||||||||
| (in millions) | 2022 | 2021 | 2020 | ||||||||||||||||||||
| Water Infrastructure | |||||||||||||||||||||||
| Transport | $ | 1,715 | $ | 1,619 | $ | 1,484 | |||||||||||||||||
| Treatment | 421 | 431 | 400 | ||||||||||||||||||||
| Applied Water | |||||||||||||||||||||||
| Commercial Building Services | 659 | 609 | 558 | ||||||||||||||||||||
| Residential Building Services | 306 | 268 | 238 | ||||||||||||||||||||
| Industrial Water | 802 | 736 | 638 | ||||||||||||||||||||
| Measurement and Control Solutions | |||||||||||||||||||||||
| Water | 1,126 | 1,055 | 1,039 | ||||||||||||||||||||
| Energy | 265 | 280 | 324 | ||||||||||||||||||||
| Total | $ | 5,294 | $ | 4,998 | $ | 4,681 | |||||||||||||||||
76
| Year Ended December 31, | |||||||
| (in millions) | 2019 | 2018 | |||||
| Water Infrastructure | |||||||
| Transport | $ | 1,533 | $ | 1,535 | |||
| Treatment | 397 | 397 | |||||
| Applied Water | |||||||
| Building Services | 848 | 828 | |||||
| Industrial Water | 693 | 706 | |||||
| Measurement and Control Solutions | |||||||
| Water | 768 | 692 | |||||
| Energy | 337 | 338 | |||||
| Software as a Service/Other | 99 | 123 | |||||
| Test | 327 | 344 | |||||
| Total | $ | 5,002 | $ | 4,963 | |||
The following table reflects revenue from contracts with customers by geographical region:
| Year Ended December 31, | |||||||||||||||||
| (in millions) | 2022 | 2021 | 2020 | ||||||||||||||
| Water Infrastructure | |||||||||||||||||
| United States | $ | 664 | $ | 556 | $ | 558 | |||||||||||
| Western Europe | 757 | 753 | 675 | ||||||||||||||
| Emerging Markets (a) | 495 | 537 | 468 | ||||||||||||||
| Other | 220 | 204 | 183 | ||||||||||||||
| Applied Water | |||||||||||||||||
| United States | 914 | 804 | 754 | ||||||||||||||
| Western Europe | 380 | 370 | 316 | ||||||||||||||
| Emerging Markets (a) | 349 | 324 | 260 | ||||||||||||||
| Other | 124 | 115 | 104 | ||||||||||||||
| Measurement and Control Solutions | |||||||||||||||||
| United States | 857 | 796 | 856 | ||||||||||||||
| Western Europe | 240 | 256 | 234 | ||||||||||||||
| Emerging Markets (a) | 198 | 189 | 177 | ||||||||||||||
| Other | 96 | 94 | 96 | ||||||||||||||
| Total | $ | 5,294 | $ | 4,998 | $ | 4,681 | |||||||||||
| Year Ended December 31, | |||||||
| (in millions) | 2019 | 2018 | |||||
| Water Infrastructure | |||||||
| United States | $ | 593 | $ | 539 | |||
| Europe | 729 | 758 | |||||
| Asia Pacific | 358 | 344 | |||||
| Other | 250 | 291 | |||||
| Applied Water | |||||||
| United States | 816 | 797 | |||||
| Europe | 362 | 386 | |||||
| Asia Pacific | 164 | 153 | |||||
| Other | 199 | 198 | |||||
| Measurement and Control Solutions | |||||||
| United States | 972 | 913 | |||||
| Europe | 257 | 273 | |||||
| Asia Pacific | 118 | 144 | |||||
| Other | 184 | 167 | |||||
| Total | $ | 5,002 | $ | 4,963 | |||
(a) Emerging Markets includes results from the following regions: Eastern Europe, the Middle East and Africa, Latin America and Asia Pacific (excluding Japan, Australia and New Zealand, which are presented in "Other")
77
Contract Balances
We receive payments from customers based on a billing schedule as established in our contracts. Contract assets relate to costs incurred to perform in advance of scheduled billings. Contract liabilities relate to payments received
in advance of performance under the contracts. ChangeChanges in contract assets and liabilities are due to our performance under the contract.
The table below provides contract assets, contract liabilities, and significant changes in contract assets and liabilities.liabilities:
| (in millions) | Contract Assets (a) | Contract Liabilities | ||||||||||||||||||
| Balance at 1/1/2021 | $ | 117 | $ | 166 | ||||||||||||||||
| Additions, net | 112 | 117 | ||||||||||||||||||
| Revenue recognized from opening balance | — | (117) | ||||||||||||||||||
| Billings transferred to accounts receivable | (103) | — | ||||||||||||||||||
| Other | (1) | (2) | ||||||||||||||||||
| Balance at 1/1/2022 | $ | 125 | $ | 164 | ||||||||||||||||
| Additions, net | 115 | 137 | ||||||||||||||||||
| Revenue recognized from opening balance | — | (109) | ||||||||||||||||||
| Billings transferred to accounts receivable | (82) | — | ||||||||||||||||||
| Other | (7) | (9) | ||||||||||||||||||
| Balance at 12/31/2022 | $ | 151 | $ | 183 | ||||||||||||||||
| (in millions) | Contract Assets (a) | Contract Liabilities | ||||
| Balance at 1/1/2018 | $ | 89 | $ | 107 | ||
| Additions, net | 87 | 101 | ||||
| Revenue recognized from opening balance | — | (89 | ) | |||
| Billings | (76 | ) | — | |||
| Other | (4 | ) | (6 | ) | ||
| Balance at 1/1/2019 | $ | 96 | $ | 113 | ||
| Additions, net | 81 | 114 | ||||
| Revenue recognized from opening balance | — | (91 | ) | |||
| Billings | (80 | ) | — | |||
| Other | 9 | (1 | ) | |||
| Balance at 12/31/2019 | $ | 106 | $ | 135 | ||
(a) Excludes receivable balances which are disclosed on the balance sheet
Performance obligations
Delivery schedules vary from customer to customer based upon their requirements. Typically, large projects require longer lead production cycles and delays can occur from time to time. As of December 31, 2019,2022, the aggregate amount of the transaction price allocated to performance obligations that are unsatisfied or partially unsatisfied for contracts with performance obligations, amount to $392$424 million. We expect to recognize the majority of revenue upon the completion of satisfying these performance obligations in the following 60 months. The Company elects to apply the practical expedient to exclude from this disclosure revenue related to performance obligations that are part of a contract whose original expected duration is less than one year.
Note 5.4. Restructuring and Asset Impairment Charges
From time to time, the Company will incur costs related to restructuring actions in order to optimize our cost base and more strategically position ourselves based on the economic environment and customer demand.itself. During 2019, 2018 and 2017, the costs2022 we incurred these charges primarily relate to an effortas a continuation of our efforts to reposition our European and North American businessesbusiness to optimize our cost structure and improve our operational efficiency and effectiveness. In 2019 and 2018 theThe charges primarily included the reduction of headcount across all segments.
In response to the changes in business and consolidationeconomic conditions arising as a result of facilitiesthe COVID-19 pandemic, on June 2, 2020 management committed to a restructuring plan that includes actions across our businesses and functions globally. The plan was designed to support our long-term financial resilience and simplify our operations, strengthen our competitive positioning and better serve our customers.
As a result of this action, during 2021, we recognized restructuring charges of $4 million and $2 million in our Water Infrastructure and Applied Water segments, respectively. These charges included reduction of headcount across both segments. Other, less significant, restructuring actions taken in 2021 resulted in $3 million of charges during 2021 and are included in the information presented below.
During 2020, we recognized restructuring costs of $19 million, $4 million and $30 million in our Water Infrastructure, Applied Water and Measurement & Control Solutions segments, respectively. These charges included reduction of headcount across all segments and asset impairments within our Measurement & Control Solutions and Water Infrastructure segments, as well as headcount reductions within our Applied Water segment. In 2017Immaterial restructuring charges from other actions incurred during the chargesfirst quarter of 2020 are included in the reduction of headcount and consolidation of facilities within our Applied Water, Water Infrastructure, and Measurement & Control Solutions segments.2020 plan information presented below.
78
The following table presents the components of restructuring expense and asset impairment charges incurred during each of the previous three years:
| Year Ended December 31, | ||||||||||||
| (in millions) | 2019 | 2018 | 2017 | |||||||||
| By component: | ||||||||||||
| Severance and other charges | $ | 51 | $ | 19 | $ | 20 | ||||||
| Lease related charges | 1 | 1 | — | |||||||||
| Other restructuring charges | 2 | 1 | 2 | |||||||||
| Reversal of restructuring accruals | (1 | ) | (1 | ) | (2 | ) | ||||||
| Total restructuring charges | 53 | 20 | 20 | |||||||||
| Asset impairment charges | 10 | 2 | 5 | |||||||||
| Total restructuring and asset impairment charges | $ | 63 | $ | 22 | $ | 25 | ||||||
| By segment: | ||||||||||||
| Water Infrastructure | $ | 20 | $ | 11 | $ | 7 | ||||||
| Applied Water | 5 | 2 | 13 | |||||||||
| Measurement & Control Solutions | 38 | 9 | 5 | |||||||||
| Corporate and other | — | — | — | |||||||||
| Year Ended December 31, | ||||||||||||||||||||
| (in millions) | 2022 | 2021 | 2020 | |||||||||||||||||
| By component: | ||||||||||||||||||||
| Severance and other charges | $ | 15 | $ | 10 | $ | 36 | ||||||||||||||
| Asset impairment | — | 1 | 18 | |||||||||||||||||
| Other restructuring charges | — | 1 | 1 | |||||||||||||||||
| Reversal of restructuring accruals | — | (6) | (1) | |||||||||||||||||
| Total restructuring costs | 15 | 6 | 54 | |||||||||||||||||
| Asset impairment charges | 14 | 1 | 21 | |||||||||||||||||
| Total restructuring and asset impairment charges | $ | 29 | $ | 7 | $ | 75 | ||||||||||||||
| By segment: | ||||||||||||||||||||
| Water Infrastructure | $ | 6 | $ | 8 | $ | 20 | ||||||||||||||
| Applied Water | 4 | 2 | 4 | |||||||||||||||||
| Measurement & Control Solutions | 19 | (3) | 51 | |||||||||||||||||
Restructuring
The following table displays a roll-forward of the restructuring accruals, presented on our Consolidated Balance Sheets within "accrued and other current liabilities" and "other non-current accrued liabilities," for the years ended December 31, 20192022 and 2018:2021:
| (in millions) | 2019 | 2018 | (in millions) | 2022 | 2021 | |||||||||||||||||
| Restructuring accruals - January 1 | $ | 5 | $ | 7 | Restructuring accruals - January 1 | $ | 7 | $ | 29 | |||||||||||||
| Restructuring charges | 53 | 20 | ||||||||||||||||||||
| Restructuring costs | Restructuring costs | 15 | 6 | |||||||||||||||||||
| Cash payments | (30 | ) | (21 | ) | Cash payments | (11) | (25) | |||||||||||||||
| Asset impairment | Asset impairment | — | (1) | |||||||||||||||||||
| Foreign currency and other | (1 | ) | (1 | ) | Foreign currency and other | (1) | (2) | |||||||||||||||
| Restructuring accruals - December 31 | $ | 27 | $ | 5 | Restructuring accruals - December 31 | $ | 10 | $ | 7 | |||||||||||||
| By segment: | By segment: | |||||||||||||||||||||
| Water Infrastructure | $ | 1 | $ | 1 | Water Infrastructure | $ | 1 | $ | 1 | |||||||||||||
| Applied Water | — | 1 | Applied Water | — | 1 | |||||||||||||||||
| Measurement & Control Solutions | 19 | 2 | Measurement & Control Solutions | 3 | 4 | |||||||||||||||||
| Regional selling locations (a) | 7 | 1 | Regional selling locations (a) | 4 | 1 | |||||||||||||||||
| Corporate and other | Corporate and other | 2 | — | |||||||||||||||||||
(a) Regional selling locations consist primarily of selling and marketing organizations that incurred restructuring expense which was allocated to the segments. The liabilities associated with restructuring expense were not allocated to the segments.
79
The following table presents the total costs expected to be incurred, the amount incurred in the period, and the cumulative costs incurred to date for our 2020, 2021 and 2022 restructuring spend:actions:
| (in millions) | Water Infrastructure | Applied Water | Measurement & Control Solutions | Corporate | Total | |||||||||||||||||||||||||||
| Actions Commenced in 2022: | ||||||||||||||||||||||||||||||||
| Total expected costs | $ | 6 | $ | 4 | $ | 4 | $ | — | $ | 14 | ||||||||||||||||||||||
| Costs incurred during 2022 | 6 | 4 | 4 | — | 14 | |||||||||||||||||||||||||||
| Total expected costs remaining | $ | — | $ | — | $ | — | $ | — | $ | — | ||||||||||||||||||||||
| Actions Commenced in 2021: | ||||||||||||||||||||||||||||||||
| Total expected costs | $ | 3 | $ | — | $ | — | $ | — | $ | 3 | ||||||||||||||||||||||
| Costs incurred during 2021 | 3 | — | — | — | 3 | |||||||||||||||||||||||||||
| Costs incurred during 2022 | — | — | — | — | — | |||||||||||||||||||||||||||
| Total expected costs remaining | $ | — | $ | — | $ | — | $ | — | $ | — | ||||||||||||||||||||||
| Actions Commenced in 2020: | ||||||||||||||||||||||||||||||||
| Total expected costs | $ | 23 | $ | 6 | $ | 30 | $ | — | $ | 59 | ||||||||||||||||||||||
| Costs incurred during 2020 | 19 | 4 | 30 | — | 53 | |||||||||||||||||||||||||||
| Costs incurred during 2021 | 4 | 2 | — | — | 6 | |||||||||||||||||||||||||||
| Costs incurred during 2022 | — | — | — | — | — | |||||||||||||||||||||||||||
| Total expected costs remaining | $ | — | $ | — | $ | — | $ | — | $ | — | ||||||||||||||||||||||
| (in millions) | Water Infrastructure | Applied Water | Measurement & Control Solutions | Corporate | Total | |||||||||||||||
| Actions Commenced in 2019: | ||||||||||||||||||||
| Total expected costs | $ | 19 | $ | 5 | $ | 28 | $ | — | $ | 52 | ||||||||||
| Costs incurred during 2019 | 18 | 5 | 27 | — | 50 | |||||||||||||||
| Total expected costs remaining | $ | 1 | $ | — | $ | 1 | $ | — | $ | 2 | ||||||||||
| Actions Commenced in 2018: | ||||||||||||||||||||
| Total expected costs | $ | 8 | $ | 1 | $ | 7 | $ | — | $ | 16 | ||||||||||
| Costs incurred during 2018 | 7 | 1 | 7 | — | 15 | |||||||||||||||
| Costs incurred during 2019 | 1 | — | — | — | 1 | |||||||||||||||
| Total expected costs remaining | $ | — | $ | — | $ | — | $ | — | $ | — | ||||||||||
| Actions Commenced in 2017: | ||||||||||||||||||||
| Total expected costs | $ | 12 | $ | 7 | $ | 4 | $ | — | $ | 23 | ||||||||||
| Costs incurred during 2017 | 5 | 4 | 2 | — | 11 | |||||||||||||||
| Costs incurred during 2018 | 2 | 1 | 1 | — | 4 | |||||||||||||||
| Costs incurred during 2019 | 1 | — | 1 | — | 2 | |||||||||||||||
| Total expected costs remaining | $ | 4 | $ | 2 | $ | — | $ | — | $ | 6 | ||||||||||
The Water Infrastructure, Applied Water and Measurement & Control Solutions actions commenced in 20192022 consist primarily of severance charges. The Applied Water actions commenced in 2022 are complete, thecomplete.
The Water Infrastructure actions are expected to continue through Q1 2020, and the Measurement & Control Solutions actions are expected to continue through the fourth quarter of 2020. The Water Infrastructure, Applied Water, and Measurement & Control Solutions actions commenced in 20182021 consist primarily of severance charges and are complete.charges. The Water Infrastructure, Applied Water, Measurement & Control Solutions and Corporate actions commenced in 2017 consist primarily of severance charges and2021 are expected to continue through 2021.complete.
Asset Impairment
During the first and third quarter of 20192022, we determined that certain assets including primarily software and customer relationships within our Measurement & Control Solutions segment including customer relationships, internally developed software, proprietary technology, and plant property & equipment, were impaired. Accordingly, we recognized an impairment charge of $10 million during the year.$14 million. Refer to Note 11,"Goodwill and Other Intangible Assets," for additional information.
During the fourththird quarter of 20182020, we determined that certain assets including software and proprietary technology within our Water InfrastructureMeasurement & Control Solutions segment including certain software, were impaired. Accordingly, we recognized an impairment charge of $2$11 million. Refer to Note 12,11, "Goodwill and Other Intangible Assets," for additional information.
During the second quarter of 2020, we determined that internally developed in-process software within our Measurement & Control Solutions segment was impaired as a result of actions taken to prioritize strategic investments. Accordingly, we recognized an impairment charge of $10 million. Refer to Note 11, "Goodwill and Other Intangible Assets," for additional information.
80
Note 6.5. Other Non-Operating (Expense) Income, Net
The components of other non-operating income, net are as follows:
| Year Ended December 31, | Year Ended December 31, | |||||||||||||||||||||||||||
| (in millions) | 2019 | 2018 | 2017 | (in millions) | 2022 | 2021 | 2020 | |||||||||||||||||||||
| Interest income | $ | 5 | $ | 4 | $ | 3 | Interest income | $ | 16 | $ | 7 | $ | 7 | |||||||||||||||
| Income from joint ventures | 3 | 5 | 3 | |||||||||||||||||||||||||
| Other (expense) income – net | (12 | ) | 4 | — | ||||||||||||||||||||||||
| Income from equity method investments | Income from equity method investments | — | 9 | 2 | ||||||||||||||||||||||||
| Other (expense) – net | Other (expense) – net | (9) | (16) | (14) | ||||||||||||||||||||||||
| Total other non-operating (expense) income, net | $ | (4 | ) | $ | 13 | $ | 6 | Total other non-operating (expense) income, net | $ | 7 | $ | — | $ | (5) | ||||||||||||||
Note 7.6. Income Taxes
The source of pre-tax income and the components of income tax expense are as follows:
| Year Ended December 31, | Year Ended December 31, | |||||||||||||||||||||||||||
| (in millions) | 2019 | 2018 | 2017 | (in millions) | 2022 | 2021 | 2020 | |||||||||||||||||||||
| Income components: | ||||||||||||||||||||||||||||
| Income (loss) components: | Income (loss) components: | |||||||||||||||||||||||||||
| Domestic | $ | 203 | $ | 208 | $ | 162 | Domestic | $ | 90 | $ | 45 | $ | (33) | |||||||||||||||
| Foreign | 213 | 377 | 304 | Foreign | 350 | 466 | 318 | |||||||||||||||||||||
| Total pre-tax income | $ | 416 | $ | 585 | $ | 466 | Total pre-tax income | $ | 440 | $ | 511 | $ | 285 | |||||||||||||||
| Income tax expense components: | Income tax expense components: | |||||||||||||||||||||||||||
| Current: | Current: | |||||||||||||||||||||||||||
| Domestic – federal | $ | 39 | $ | 9 | $ | 109 | Domestic – federal | $ | 77 | $ | 16 | $ | 24 | |||||||||||||||
| Domestic – state and local | 13 | 13 | 9 | Domestic – state and local | 16 | 5 | 5 | |||||||||||||||||||||
| Foreign | 40 | 61 | 51 | Foreign | 56 | 53 | 33 | |||||||||||||||||||||
| Total Current | 92 | 83 | 169 | Total Current | 149 | 74 | 62 | |||||||||||||||||||||
| Deferred: | Deferred: | |||||||||||||||||||||||||||
| Domestic – federal | $ | 7 | $ | 17 | $ | (29 | ) | Domestic – federal | $ | (43) | $ | (2) | $ | (21) | ||||||||||||||
| Domestic – state and local | (1 | ) | 5 | 10 | Domestic – state and local | (12) | — | (8) | ||||||||||||||||||||
| Foreign | (83 | ) | (69 | ) | (14 | ) | Foreign | (9) | 12 | (2) | ||||||||||||||||||
| Total Deferred | (77 | ) | (47 | ) | (33 | ) | Total Deferred | (64) | 10 | (31) | ||||||||||||||||||
| Total income tax provision | $ | 15 | $ | 36 | $ | 136 | Total income tax provision | $ | 85 | $ | 84 | $ | 31 | |||||||||||||||
| Effective income tax rate | 3.7 | % | 6.1 | % | 29.2 | % | Effective income tax rate | 19.2 | % | 16.3 | % | 10.9 | % | |||||||||||||||
81
Reconciliations between taxes at the U.S. federal income tax rate and taxes at our effective income tax rate on earnings before income taxes are as follows:
| Year Ended December 31, | ||||||||
| 2019 | 2018 | 2017 | ||||||
| Tax provision at U.S. statutory rate | 21.0 | % | 21.0 | % | 35.0 | % | ||
| Increase (decrease) in tax rate resulting from: | ||||||||
| State income taxes | 2.7 | 2.3 | 1.6 | |||||
| Uncertain tax positions | 0.4 | 2.6 | 1.6 | |||||
| Valuation allowance | 1.2 | (47.1 | ) | 3.3 | ||||
| Tax exempt interest | (3.0 | ) | (1.4 | ) | (10.6 | ) | ||
| Foreign tax rate differential | 0.7 | 2.9 | (6.7 | ) | ||||
| Impact of foreign earnings, net | 1.6 | (1.7 | ) | 37.0 | ||||
| Tax incentives | (9.6 | ) | (6.2 | ) | (6.6 | ) | ||
| Intercompany sale of assets | — | 35.5 | — | |||||
| Other – net | 1.7 | (0.3 | ) | (0.5 | ) | |||
| Rate change | (18.1 | ) | — | (22.9 | ) | |||
| Goodwill impairment | 7.8 | — | — | |||||
| Federal R&D tax credit | (1.2 | ) | (0.8 | ) | (1.0 | ) | ||
| Stock compensation | (1.5 | ) | (0.7 | ) | (1.0 | ) | ||
| Effective income tax rate | 3.7 | % | 6.1 | % | 29.2 | % | ||
| Year Ended December 31, | |||||||||||||||||
| 2022 | 2021 | 2020 | |||||||||||||||
| Tax provision at U.S. statutory rate | 21.0 | % | 21.0 | % | 21.0 | % | |||||||||||
| Increase (decrease) in tax rate resulting from: | |||||||||||||||||
| State income taxes | 1.2 | 0.8 | 0.7 | ||||||||||||||
| Uncertain tax positions | (1.2) | (0.1) | (3.9) | ||||||||||||||
| U.S. foreign derived intangible income tax benefit | (1.3) | (0.6) | (1.0) | ||||||||||||||
| Net interest deductions | (1.8) | (2.4) | (4.5) | ||||||||||||||
| Tax on Distribution of Foreign Earnings | 1.4 | (0.2) | (0.2) | ||||||||||||||
| U.S. tax on foreign earnings | 2.7 | 2.2 | 5.3 | ||||||||||||||
| Tax incentives | (4.4) | (5.5) | (7.4) | ||||||||||||||
| Rate change | (0.6) | 0.9 | (1.3) | ||||||||||||||
| Goodwill impairment | — | — | 2.9 | ||||||||||||||
| Federal R&D tax credit | (0.7) | (0.7) | (1.3) | ||||||||||||||
| Stock compensation | 0.1 | (0.6) | (2.4) | ||||||||||||||
| Other—net | 2.8 | 1.5 | 3.0 | ||||||||||||||
| Effective income tax rate | 19.2 | % | 16.3 | % | 10.9 | % | |||||||||||
Items in the prior year amounts included within the table of rate reconciliation above have been reclassified for consistency withto conform to the current year presentation. These reclassifications had no effect on the reported consolidated balance sheets, consolidated statementsConsolidated Balance Sheets, Consolidated Statements of income, comprehensive income, stockholders’ equity,Income, Comprehensive Income, Stockholders’ Equity, or cash flow. Additional line items have been included as of December 31, 2019 and for consistency the prior year balances have been adjusted to conform with the current year presentation.
Deferred tax assets and liabilities are determined based on temporary differences between the financial reporting and tax bases of assets and liabilities, applying enacted tax rates in effect for the year in which we expect the differences will reverse.
82
The following is a summary of the components of the net deferred tax assets and liabilities recognized in the Consolidated Balance Sheets:
| December 31, | |||||||
| (in millions) | 2019 | 2018 | |||||
| Deferred tax assets: | |||||||
| Employee benefits | $ | 106 | $ | 97 | |||
| Accrued expenses | 26 | 30 | |||||
| Loss and other tax credit carryforwards | 240 | 279 | |||||
| Inventory | 6 | 7 | |||||
| Lease Liabilities | 57 | — | |||||
| Other | 3 | 11 | |||||
| 438 | 424 | ||||||
| Valuation allowance | (191 | ) | (234 | ) | |||
| Net deferred tax asset | $ | 247 | $ | 190 | |||
| Deferred tax liabilities: | |||||||
| Intangibles | $ | 160 | $ | 247 | |||
| Investment in foreign subsidiaries | 7 | 8 | |||||
| Property, plant, and equipment | 78 | 69 | |||||
| Lease right-of-use assets | 57 | — | |||||
| Other | 29 | 29 | |||||
| Total deferred tax liabilities | $ | 331 | $ | 353 | |||
| December 31, | |||||||||||
| (in millions) | 2022 | 2021 | |||||||||
| Deferred tax assets: | |||||||||||
| Employee benefits | $ | 58 | $ | 111 | |||||||
| Accrued expenses | 36 | 35 | |||||||||
| Loss and other tax credit carryforwards | 245 | 250 | |||||||||
| R&D capitalization | 32 | — | |||||||||
| Inventory | 5 | 6 | |||||||||
| Lease Liabilities | 68 | 70 | |||||||||
| Other | 7 | 8 | |||||||||
| 451 | 480 | ||||||||||
| Valuation allowance | (204) | (201) | |||||||||
| Net deferred tax asset | $ | 247 | $ | 279 | |||||||
| Deferred tax liabilities: | |||||||||||
| Intangibles | $ | 155 | $ | 155 | |||||||
| Investment in foreign subsidiaries | 5 | 4 | |||||||||
| Property, plant and equipment | 65 | 77 | |||||||||
| Lease right-of-use assets | 67 | 69 | |||||||||
| Hedging Instruments | 20 | — | |||||||||
| Other | 11 | 35 | |||||||||
| Total deferred tax liabilities | $ | 323 | $ | 340 | |||||||